The challenge of quantifying national wellbeing: lessons from the Measures of Australia’s Progress...
48
The challenge of quantifying national wellbeing: lessons from the Measures of Australia’s Progress initiative Cosmo Howard and Amber Chambers, School of Government and International Relations, Griffith University Abstract In recent decades the use of gross domestic product (GDP) as a proxy for national wellbeing has been criticised on the grounds it excludes important social and ecological considerations. Several alternatives have been proposed that promise to generate more comprehensive and balanced quantitative measures of wellbeing, but all of these alternative indicators remain contested and controversial. This paper critically reviews Australia’s unique contribution to this effort: the Australian Bureau of Statistics’ Measures of Australia’s Progress initiative. Unlike other alternatives to GDP, the Australian initiative does not settle on one measure but uses public consultation to establish a suite of indicators. In so doing, this model makes explicit the serious challenges confronting efforts to coherently define and 1
Transcript of The challenge of quantifying national wellbeing: lessons from the Measures of Australia’s Progress...

The challenge of quantifying national wellbeing: lessonsfrom the Measures of Australia’s Progress initiative
Cosmo Howard and Amber Chambers, School of Government and
International Relations, Griffith University
Abstract
In recent decades the use of gross domestic product (GDP) as
a proxy for national wellbeing has been criticised on the
grounds it excludes important social and ecological
considerations. Several alternatives have been proposed that
promise to generate more comprehensive and balanced
quantitative measures of wellbeing, but all of these
alternative indicators remain contested and
controversial. This paper critically reviews Australia’s
unique contribution to this effort: the Australian Bureau of
Statistics’ Measures of Australia’s
Progress initiative. Unlike other alternatives to GDP, the
Australian initiative does not settle on one measure but
uses public consultation to establish a suite of indicators.
In so doing, this model makes explicit the serious
challenges confronting efforts to coherently define and
1

measure progress in late modernity. In its attempt to
integrate diverse views on national progress, the ABS has
created an ambiguous tool that is not being taken up in
public and political discourse.
1. Introduction
Measurement is an essential activity of the modern state. It
has become a highly visible element of governing in recent
decades. Influential neoliberal rationalities and new
public management principles stress the need to track,
audit, rate, rank and report “performance” across almost
every sphere of state activity. Increasingly, such
“calculative practices” (Miller, Kurunmaki, & O'Leary, 2010)
extend into civil society, where the intricacies of
individuals’ daily lives are observed and transmuted into
“headline indicators”, which in turn inform public debate,
policy decision-making and program implementation. Critical
scholars of quantification show that supposedly objective
measurement practices are not neutral but impose particular
epistemic frames onto heterogonous realities (Higgins &
2

Larner, 2010; Latour, 1993). Complex local experiences are
occluded by increasingly global categories of performance
measurement (ibid). These standardised statistical
typologies function as “classificatory grids” that claim to
impartially present reality in its “totality” (Anderson,
1983), yet they always reflect the priorities and interests
of the measurers (Slattery, 1986; Starr, 1987).
While some critical scholars of quantification stress
the ubiquity and hegemony of measurement in contemporary
governance, others highlight the socio-political fragility
of quantitative claims. This is especially evident in the
early stages of an attempt to establish an official measure,
when various political actors compete to determine what
should be measured, how the measuring should be undertaken,
who should do the measuring, and what can be concluded from
the measurements (cf. Haggerty, 2001; Porter, 1986).
Historical case studies of quantification reveal the
extensive power plays and discursive strategies involved in
institutionalising today’s “taken for granted” numbers, such
as national population censuses (Desrosières & Naish, 2002;
3

Gigerenzer & Swijtink, 1990; Hacking, 1990; Leibler, 2004),
gross domestic product (Galbraith & Crook, 1958) and
unemployment (Walters, 2000).
Official numbers are thus both powerful and vulnerable.
In this paper we seek to determine the political and
technical challenges associated with recent efforts to
establish new official measures. We are specifically
interested in the push for an alternative statistic to gross
domestic product (GDP) that better takes into account non-
economic dimensions of societal “wellbeing”, “development”
or “progress”. Efforts to find an alternative to GDP
accelerated in the 1990s as public and political support for
post-industrial and post-material values (favouring
individual rights, social equality, environmental
sustainability and “quality of life”) grew. Statisticians
and economists pondered how to incorporate a broader range
of dimensions into a new headline societal indicator. Their
efforts spawned numerous indicators, including the Human
Development Index (HDI), Genuine Progress Indicator (GPI)
and Happy Planet Index (HPI). Despite these efforts, none of
4

the rival contenders has achieved widespread acceptance
(Shergold, 2011), arguably because most of them necessarily
contain subjective valuations of non-market goods such as
sustainability and happiness, which invite contestation.
We review an unusual contribution to this international
work on post-GDP measures of wellbeing: the Australian
Bureau of Statistics’ (ABS’s) Measures of Australia’s
Progress (MAP) initiative. Whereas the other alternatives
to GDP have mostly attempted to replace GDP with a
substitute indicator, MAP follows a different path: it
includes a wide range of measures that could be associated
with “progress”, selected via public consultation processes.
Furthermore, instead of trying to distil these measures into
a single number, it presents a “dashboard” of figures and
leaves the user to draw their own conclusions about overall
trends.
Our paper presents a critical review of published MAP
material to assess the challenges the initiative faces. MAP
has received very little scholarly attention to date. The
key existing academic review of MAP criticises the ABS for
5

failing to commit to a definition of progress, accusing the
agency of timidity in the face of potential criticism
(Davidson & Wilson, 2011). We take a different approach and
ask: what does MAP tell us about the capacity of state
agencies to define and measure progress in “late modernity”?
We argue MAP is subject to the same constraints as all post-
GDP measurements of wellbeing: there is little public
consensus about what is required to improve wellbeing or
produce “progress”, and there are also large “data gaps”
where no suitable indicator exists to measure potentially
important aspects of progress. Unlike other alternative
measures however, MAP renders these problems explicit. By
faithfully representing fragmented public views on the
drivers of progress, MAP sheds light on just how difficult
it is to determine what societal progress is. MAP seeks to
acknowledge late modern disagreement about progress with an
inclusive definition, but in the process it teaches users
that national progress is impossible to define coherently
and impractical to measure.
6

This paper makes a contribution to existing critical
literature on the politics of quantification measurement by
extending knowledge on state measurement processes. It
affirms the argument that quantification is a contested and
fragile activity. States cannot arbitrarily impose
centralized classificatory grids onto their populations in
late modernity. At the same time, efforts to explicitly
acknowledge definitional disagreements and to involve the
public in measurement do not necessarily lead to greater
credibility for and acceptance of official numbers.
We begin the article with a brief historical analysis
of the idea of progress in the liberal democratic West. We
show that progress was once taken for granted, but the
notion is now deeply contested and distrusted. We then
explore recent attempts to measure progress through
alternatives to GDP, including criticisms of these efforts.
The article then explains our review methodology briefly,
followed by a discussion of the MAP case study findings. In
the discussion we reflect on what these findings say about
the politics of quantification in late modernity.
7
2. Defining progress
Efforts to measure progress imply that such a thing
exists. So what is progress? In everyday talk the word can
mean two things: movement towards a goal or destination
(e.g. “We have made good progress on our hike to the
campsite”), and/or improvement of a specific circumstance or
condition without a specified end point (e.g. “Your
knowledge of bread making techniques is progressing”). This
article is interested in a particular type of progress: that
associated with societies or nations. We therefore need to
know: what does it mean for a society or nation to progress?
In this section we suggest that the concept of social
or national progress has a long history in the western
world. Nisbett (1980, p. 4) suggests “no idea has been more
important to western thought for one thousand years than
progress”. We argue the definition of progress has moved
through three stages in western liberal democracies: the
classical liberal stage in which progress was assumed to be an
external force driving changes in human society (Arendt,
8

1953; Mannheim, 1936); a Keynesian phase in which progress
was assumed to require governmental management of the
macroeconomy (Girvetz, 1963; Jessop, 1999); and the current
late-modern phase, in which there is profound public
disagreement about what constitutes progress. Here we
briefly summarise each phase in turn, concluding that the
literature on progress sees little hope for securing
consensus on what progress means, for the foreseeable
future.
The idea that societies undergo a gradual process of
improvement is often attributed to the liberal political
thought that emerged during the European enlightenment,
beginning in the c17th (Mannheim, 1936). “Classical
liberals” saw progress as an inevitable historical force
leading to a definite outcome: the “emancipation of man”
from ignorance and despotism (Bauman, 2000; Beck, 1992;
Mannheim, 1936). Advances in scientific knowledge would
allow humans to control nature and turn it to their
purposes:
9
That the ‘old’ industrial society was obsessed with progress hasoften been emphasized . . . the latent faith in progress . . . thefaith in the method of trail and errors, the possibility of asystematic mastery of external and internal nature that was beinggradually constructed (Beck, 1992, p. 201).
These ideas of inevitable historical progress were of course
not confined to liberalism. They found expression, albeit
in modified form, in Marxist ideas about the inevitability
of a crisis of capitalism and its replacement with
communism, as well as Christian millenarian views about the
inevitability of future a period of blessedness (Mannheim,
1936). The point here is that these “early modern” views saw
progress as a driving force – an invisible, powerful,
unassailable cause of overwhelmingly positive changes in
human society (Bauman, 2000).
The late c19th represented the high water mark of faith
in progress as a benevolent driving force of history
(Spadafora, 1990). Events of the early c20th - two world
wars and a global economic depression – did much to
undermine the notion that increasing human knowledge,
expanding industrial production and accelerating
technological innovation would lead to a better life for
10

all. In its place was put a new view of progress: something
that was possible and desirable, but not inevitable.
Progress had to be secured via deliberate policy action.
Responsibility came to be laid in large part at the feet of
new systems of macroeconomic management, built upon the ideas
of John Maynard Keynes. He proposed that a free economy
contained instabilities, but that these could be prevented
from turning into depressions via careful use of corrective
fiscal policy to stimulate sluggish economies and slow down
overheating markets (Donaldson, 1992). Avoiding economic
stagnation became, in the words of President Eisenhower, a
“Great Crusade”, and just as important to the wellbeing of
the nation as military defence (Girvetz, 1963, p. 355). Thus
by the mid c20th the notion that there was some natural,
invisible driving force called progress that pushed
societies towards general advancement came to be rejected
(Galbraith & Crook, 1958; Giddens, 1991). Established in its
place was the view that progress was possible, but only by
conscious, deliberate, collective action. Progress in this
second era ceased to be an objective, autonomous casual
11

force and became a potential outcome of a properly managed,
rationally guided and carefully monitored (measured) free
market system.
Sociologists of “late modernity” (Bauman, 2000; Beck,
1992; Beck, Giddens, & Lash, 1994; Giddens, 1991) argue the
cultural assumptions and political interests that upheld the
Keynesian paradigm of managed economic progress began to
break down in the 1960s. Faith in the benefits of scientific
discovery came into question as the health and ecological
dangers of new chemical and nuclear technologies emerged
(cf. Giddens, 1991). The expansion of economic production
came to be associated with pollution, species extinction and
the destruction of natural amenities. The rise of green
political and cultural movements drew attention to this and
encouraged greater social appreciation for the natural
world. Faith in the benefits of industrial progress has been
partly replaced in advanced economies by a “post-
materialist” outlook that acknowledges and accepts trade-
offs between material wealth and quality of life (Inglehart,
1977). The prevailing paradigm of economic management came
12

under challenge not just from environmentalists, but also in
terms of its capacity to avoid stagnation. The credibility
of interventionist Keynesian macroeconomic management was
damaged by its seeming inability to address the chronic
“stagflation” of the 1970s, leading to the rise of new-right
anti-government thinking in the 1980s (Hall, 1993).
Subsequent neoliberal discourse encouraged a decoupling of
individual progress from national progress by suggesting
individuals are responsible for their own wellbeing (Bauman,
2000; Beck, 2002).
In late modernity, the meaning of societal progress is
thus unclear. Gone is the classical liberal faith in the
inevitability of progress. Gone also is the post-war
optimism that progress is possible so long as government
gets the “policy settings” right. The old “Fordist”
political cleavage between labour and capital has fractured
into a multitude of complex political stances and positions,
many of which have profoundly divergent views about what
progress is. Bauman (2000, p. 133) concludes “the foundation
of trust in progress is nowadays prominent mostly for its
13

cracks, fissures and chronic fissiparouness”. At best we can
say that there are now multiple, partly overlapping but
partly conflicting ideas about what constitutes progress,
and these ideas are based on different value sets and
political interests.
3. Measuring progress
This section reviews historical and contemporary
efforts to measure national or societal progress and
highlights problems encountered in the measurement process.
We suggest that the economic concept of gross domestic
product (GDP) has for three-quarters of a century been a
dominant (albeit de facto) measure of societal progress. In
recent decades critics have argued GDP is an inadequate
measure of national wellbeing, development or progress, and
have proposed a variety of modifications or replacements
claimed to better measure national progress. However, as we
shall see below, none of these “alterative” measures of
national progress have achieved broad elite or popular
acceptance.
14

The concept of gross domestic product was an outgrowth
of the Great Depression and World War 2. It formed a key
element of Keynesian/New Deal approaches to handling
stagnation, by focusing on monitoring the aggregate levels
of economic growth and implementing macroeconomic policies
to adjust these. Governments also used GDP to provide the
public with evidence that they could sustain and provide
adequate materials for fighting WWII whilst upholding
sufficient manufacture of consumer goods and services
(Marcuss & Kane, 2007). GDP as a global measure of economic
progress was strengthened in the 1940s. Following the war
GDP growth was seen as the key to “creating lasting world
peace” (Costanza, Hart, Talberth, & Posner, 2009, p. 5). As
a consequence, GDP came to be treated, implicitly, as a
measure of societal wellbeing and progress.
As we suggested in the previous section, critics have
questioned the validity of the connection between economic
growth and increased individual and societal wellbeing
(Talberth, Cobb, & Slattery, 2007, p. 1) (Schwartz, 2010).
15

GDP is criticised for leaving out aspects of life that are
not measured through the national accounts:
These include failure to account for changes in natural resourcesand intangible capital (including human capital), nonmarkethousehold production (with some exceptions), leisure, externalcosts and benefits associated with production and consumption,income distribution, economies of household size, social costs ofunemployment, threats to national security, democratic rights, andrestrictions on liberty. There are also problems associated withthe measurement of government services, such as education andhealth (Bates, 2009, p. 5).
Criticisms of the inadequacies and exclusions of GDP have
spurred attempts to find alternatives to GDP that better
account for the full range of factors that influence
wellbeing (Cobb, Halstead, & Rowe, 1995a, 1995b; Daly, 1996;
Daly, Cobb Jr, & Cobb, 1989; Lawn, 2003, 2005; Talberth et
al., 2007).
Alternatives to GDP fall into three categories:
adjustments, replacements, and supplements (Schepelmann,
Goossens, & Makipaa, 2009). GDP adjustments rely on GDP but
seek to add “a variety of economic, social or environmental
factors” so as to correct the GDP figure (Schepelmann et
al., 2009, p. 24). Examples include the Index of Sustainable
Economic Welfare (ISEW), Genuine Progress Indicator (GPI),
16
Green GDP and Genuine Savings. Adjustment measures consider
personal consumption, public non-defensive expenditures,
private defensive expenditures, capital formation, services
from domestic labour, the costs of the environment
degradation, and depreciation of natural capital (Lawn,
2003; van der Kerk & Manuel, 2010). Conversely, replacements
do not rely on GDP but seek alternative measures to
establish wellbeing (Schepelmann et al., 2009). Replacements
include the Human Development Index (HDI), Ecological
Footprint (EF), Happy Planet Index (HPI), Gross National
Happiness (GNH), and Environmental Sustainability Index
(ESI). Supplements, such as the National Accounting Matrix
Environmental Accounts (NAMEA) and German Environmental
Economic Accounting (GEEA), seek to provide additional data
to be viewed alongside conventional GDP (Schepelmann et al.,
2009).
All of these alternatives to GDP have been subject to
criticism. Adjustments, replacements and supplements have
been criticised on the grounds that it is difficult or
impossible to assign a monetary value to socially
17

constructed criteria such as environmental sustainability
(Schepelmann et al., 2009). Layard (2006) argues happiness
and satisfaction are unmeasurable qualities, and any
measurements must rely on (westernised) value judgements
(see Bates, 2009). Moreover, these alternative approaches to
GDP are criticised for relying on data that is difficult or
impossible to collect. Data reliability is a particular
challenge for many developing countries, as the required
data suffers from incomplete coverage, measurement errors
and biases (Bagolin, 2004).
Despite the extensive effort that has been poured into
developing alternatives to GDP, none has achieved the kind
of taken-for granted acceptance that GDP did in the past, or
even does at present. The very fact that there are so many
competing and overlapping efforts to develop such measures
illustrates the lack of consensus on a model for measuring
wellbeing or progress in late modernity.
18

4. Our study methodology
Our study involved a systematic, critical, qualitative
review of the documentation surrounding the Australian
Bureau of Statistics’ Measures of Australia’s Progress (MAP)
initiative. We chose this initiative for two reasons.
Firstly, it has not been the subject of significant critical
analysis to date (but see Davidson & Wilson, 2011; Saunders,
2002). Furthermore, it is unusual among alternatives to GDP
in that it does not present a formal (quantitative) a model
of progress or wellbeing, but leaves the precise definition
of progress open and relies on the user drawing their own
independent conclusion(s) about overall progress based on a
suite or “dashboard” of indicators. In other words, the MAP
initiative eschews the goal of capturing wellbeing in a
single number.
In terms of the materials used as data for our critical
textual analysis, we reviewed all of the major online and
printed documentation surrounding the MAP initiative. This
included biennial reports (Trewin, 2002, 2004, 2006), MAP
summary sheets (Australian Bureau of Statistics, 2013b,
19

2014a), MAP feature essays (Australian Bureau of Statistics,
2002, 2012, 2013a, 2013f), articles written by the ABS about
MAP (Trewin & Hall, 2005) and MAP media releases (Australian
Bureau of Statistics, 2004). Importantly, we systematically
reviewed the interactive online MAP “dashboard”, which
presents the findings and conclusions on progress across the
fourteen dashboard indicators. We also reviewed the small
number of scholarly articles about MAP (Davidson & Wilson,
2011; Saunders, 2002), including an ABS response to
critiques (Sutton, 2011).
Our review of these materials was guided by an effort
to understand the challenges MAP faces in measuring
progress. We sought in particular to see how MAP defines
progress and how it seeks to measure progress. We also aimed
to determine if MAP materials support the literature’s claim
that progress is hard to define due to disagreements over
the meaning of progress, and hard to measure because of
problems and limitations in the data.
20

5. Measures of Australia’s Progress
Measures of Australia’s Progress (MAP) is the ABS’s
attempt to create a tool to answer a deceptively simple
question: “is life in Australia getting better?” (Trewin,
2004). MAP has its origins in the mid-1990s, when ABS staff
began considering how the agency should respond to new
alternative measures of national wellbeing. The ABS felt
this was an extension of a long history of work measuring
progress:
Measuring progress - providing information about whether life isgetting better - is perhaps the most important task a nationalstatistical agency like the ABS undertakes. Measuring progress hasbeen the responsibility of the ABS since colonial times. Anational statistical agency like the ABS plays an important rolein providing the indicators that allow assessments of progress tobe made, by those who formulate and evaluate policy, byresearchers and by the Australian community (Australian Bureau ofStatistics, 2014b).
Following the 1997 “Measuring Progress: Is Life Getting
Better Conference?” (Eckersley, 1998), the ABS decided to
use a suite of indicators approach to create a “dashboard”
which would allow Australians to decipher whether or not
life in Australia was progressing (Trewin & Hall, 2005). A
screen shot of the most recent dashboard page at time of
21

publication is provided in Figure One. As the key at the
bottom of the figure shows, areas with tick/check marks have
progressed, areas with tildes have not changed, and areas
with crosses have regressed. Question marks designate
domains without suitable data – so called “data gaps”. The
ABS accepted that members of the public were likely to
define progress in divergent ways, such that a consensus was
unlikely. Hence, the aim of the dashboard was to be
transparent and offer a broad picture or overview to the
public, letting Australians decide how the country was doing
in multiple areas (Trewin & Hall, 2005).
[INSERT FIGURE 1 HERE]
Originally, MAP had three main focus domains: economy,
society, and environment. Fourteen aspects of the three
domains were chosen to reflect the overall themes. Headline
indicators measuring aspects of progress were chosen for
each. In later MAP releases headline indicators were coupled
22

with supplementary indicators in an attempt to present a
more rounded picture of progress.
The headline indicator data, along with supplementary
indicators and data taken from ABS reports, publications,
and online releases, was collated and simplified to make it
digestible for the general public. In 2002, 2004, 2006, and
2010, a release of MAP was published demonstrating where
progress or regress had occurred in the various domains.
Adjustments were made with each release and by 2013, MAP had
four main focus domains: economy, society, environment, and
the new addition, governance and democracy. MAP
publications have consistently emphasised the importance of
dialogue and adaptation in the design of the initiative.
The ABS accepts that MAP will change as public values
change, but also expects that over time greater clarity will
be achieved regarding the items to be measured (Sutton,
2011; Trewin, 2002; Trewin & Hall, 2005).
How does MAP define progress?
23

Going by the initiative’s title, MAP’s creators believe
progress exists and can be measured. So how did they move
from the vague notion of “life getting better” to a
measurable construct of progress? MAP does not define
progress concretely (Davidson & Wilson, 2011). The following
is a recent attempt at a definition:
The model seeks to show progress as the unambiguous movement ofsociety in a positive direction – that is, an improvement.Importantly, this idea of improvement implies there are aspirations(or end points) in mind that society is progressing towards, andthat these need to be defined in order to know whether progress isoccurring (Australian Bureau of Statistics, 2012, p. 13).
Unlike the GPI and other alternatives to GDP, which define
progress with a mathematical formula that weighs a specific
number of quantified variables chosen by the measurers, the
ABS’s MAP approach explicitly recognizes that progress can
be defined in multiple ways, and that different individuals
will have different views on what progress is. To this end
the ABS asked the public and experts what they thought
progress was. The ABS conducted consultations at which
attendees were asked to identity which factors within the
broad categories of economy, environment, society and
governance were important to them in terms of progress.
24

Following a process of “refining” these public views to
distil key themes (Australian Bureau of Statistics, 2012),
the ABS came up with a list of fourteen factors believed by
the public to contribute to progress. These include, in the
domain of society: health, the quality of close relationships,
learning and knowledge, and “enriched lives”; in the domain
of economy: jobs, prosperity, fairness, and international
economic management; in the environmental area: healthy
environment, appreciating the environment, sustainable
environment, and working together for a healthy environment;
and in the area of governance: trust, effective governance,
participation, informed public debate, and rights and
responsibilities.
Thus MAP does not provide a clear definition of what
progress is. It relies on the opinions of a selection of
members of the general public and experts about the factors
that might make life better, but does not explain how or
give precise details about what specifically has to happen
with each factor for life to get better. Davidson and Wilson
(2011, p. 47) argue the ABS’s motive in keeping the
25

definition vague was to “avoid a perception of cultural or
political bias”, and that as a result the ABS has limited
MAP’s usefulness. The implication of this is that the ABS is
being timid and should simply define and model progress
properly and wear the inevitable criticism. However, by
attempting to build a definition of progress via public
consultation, MAP actually illustrates just how difficult
defining and modelling societal progress is in late
modernity. The challenge of defining progress is not just
about avoiding controversy; it is also a fundamental
ontological issue of deciding what progress is. MAP goes
further in illustrating this point than other “alternatives
to GDP” precisely because it is so explicit about its
assumptions and because its creators set out to represent
the diversity of public views about progress.
How does MAP measure progress?
In addition to making the challenge of defining
progress explicit, MAP also highlights the difficulty of
measuring it. As we elaborate below, MAP shows that there
26

are many areas of progress where no data of sufficient
quality exists. Furthermore, where data does exist, its
relation to the construct supposedly being measured is often
highly problematic.
The challenges of finding measurements or statistics to
signify progress stand out in the area of missing data on
the MAP dashboard. Almost one third – 8 out of 26 – of the
headline indicators of the MAP dashboard are marked as “data
gaps”. MAP documentation suggests data gaps come in four
types:
1. The concept is not yet developed enough to measure; 2. The concept is important for progress but may not lend itself to
meaningful measurement; 3. There is no data of sufficient quality to inform on progress; or 4. There is only one data point so a progress assessment cannot be
made (Australian Bureau of Statistics, 2013c, p. 21).
For the most part, the ABS is optimistic that these data
gaps will close in the future. Statements such as “there is
currently no headline progress indicator” (Australian Bureau
of Statistics, 2014a emphasis added), “for which there are
no agrees statistical measures yet” (Trewin, 2002, p. 5
emphasis added) and “[w]e will continue to explore options
27
for a suitable indicator in the future” (Australian Bureau
of Statistics, 2013d, p. 12) suggest subtly and explicitly
that the ABS expects to plug many of the gaps in the
existing dashboard. The inclusion of items in the dashboard
before data exists to measure them might even be interpreted
as a way of supporting a claim for resources for new data
collections to fill the gaps. At the same time, their
inclusion is an explicit reminder that the ABS cannot find
numbers to measure many of the things the public would like
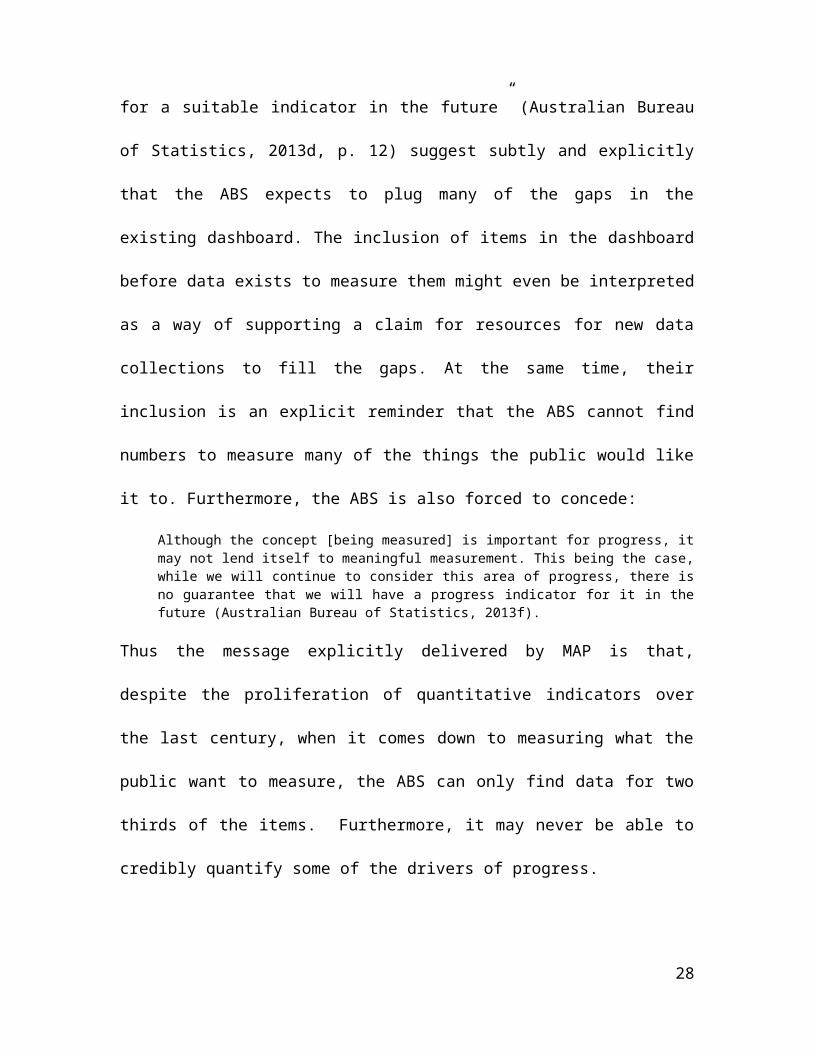
it to. Furthermore, the ABS is also forced to concede:
Although the concept [being measured] is important for progress, itmay not lend itself to meaningful measurement. This being the case,while we will continue to consider this area of progress, there isno guarantee that we will have a progress indicator for it in thefuture (Australian Bureau of Statistics, 2013f).
Thus the message explicitly delivered by MAP is that,
despite the proliferation of quantitative indicators over
the last century, when it comes down to measuring what the
public want to measure, the ABS can only find data for two
thirds of the items. Furthermore, it may never be able to
credibly quantify some of the drivers of progress.
28

The challenge of measurement is further reinforced in
areas that are not data gaps. A good example is the MAP
measure of “participation”, defined as: “Australians aspire
to have the opportunity to have a say in decisions that
affect their lives”. The dashboard begins with the
“headline indicator” for participation. This is the number
of Australians of voting age who are eligible to vote. The
ABS justifies its choice of measure without recourse to
references or research:
Voter enrolment is an important part of the aspiration forparticipation in decision making and governance processes . . . Theproportion of eligible Australians enrolled to vote is considered agood measure of progress for participation in decision making andgovernance processes because it is a measure of people'sparticipation in electing governments. When the proportion ofeligible Australians enrolled to vote is high, it indicates thatpeople in the community are engaged in determining the governmentsthat make decisions that affect them. Voter enrolment in Australiais also heavily influenced by compulsory voting laws which shouldbe accounted for when interpreting this indicator (AustralianBureau of Statistics, 2013e).
The ABS then concludes participation has progressed:
We have decided that the opportunity to participate in decisionmaking and governance processes in Australia has progressed in thelast three years because the proportion of eligible Australiansenrolled to vote (our headline progress indicator forparticipation) has increased. . . In 2013, 91% of eligibleAustralians were enrolled to vote. This is higher than the
29

proportion three years earlier in 2010 which was 90% (AustralianBureau of Statistics, 2013e).
Following this analysis, the dashboard reminds the reader
that this is “not the whole story” and references other
indicators of participation. These include voter turnout in
federal elections (this does not vary much in Australia
where voting is compulsory and backed by fines), membership
of civic and political groups (which happens not to have
changed between 2006 and 2010) and responsibility, measured
by the number of overseas born residents taking up
citizenship.
These measures show the oversimplification required to
measure complex constructs with numerical indicators. For
example, many political scientists and sociologists reject
the suggestion that voting enrolment is a good measure of
participation. Many citizens take part in elections but do
not wish to have any further involvement in political
processes (Hibbing & Theiss-Morse, 2002). Other citizens may
reject conventional channels of participation such as voting
while at the same time engaging in extensive “sub-political”
30

activity via social movements and online campaigns (Beck,
1992). Furthermore, the suggestion that an incredibly
complex and contested construct like “responsibility” is
captured by looking at applications for citizenship is also
deeply problematic. For one thing, what does it mean to
speak of “progress” in the context of responsibility? Does
it mean more people taking responsibility for their own
lives? The chosen measure is also narrow. Applicants for
citizenship make up a tiny proportion of Australian society.
They probably apply for citizenship for a wide variety of
reasons, and thus it is not at all clear why we should
interpret the number of applications as saying something
about the general state of responsibility in Australia.
The claim being made here is not that these are
incorrect measures. Nor are we proposing superior
alternatives. We accept that the ABS made a good faith
effort to select valid and useful data. Nevertheless, these
dashboard indicators draw the user’s attention to the
distance between complex social realities and existing
numerical measures.
31

We have suggested that the ABS has deliberately avoided
coming to overall conclusions about their measures of
progress. However, there are occasions when the agency has
tried to make general claims. Some examples of this are
heavily qualified, such as this 2009 reflection on overall
trends in the MAP findings:
The headline indicators presented in MAP suggest some progress inthe economic and social domains over the last decade. This articlehas illustrated some of the associated reinforcement betweeneconomic and social progress. While the environmental domain ismore difficult to measure comprehensively, some of the headlineindicators suggest that economic and social progress has comepartly at the cost of negative environmental impacts. Nevertheless,there is some evidence of relative decoupling in recent years thathas reduced the trade-off between economic growth and environmentaldegradation. Sustainability is important in this context, andinternational initiatives to develop indicators of sustainabilitycurrently underway may help inform the presentation of MAPindicators in the future (Australian Bureau of Statistics, 2009).
In other cases the ABS has been less restrained. For
example, one of the agency’s 2013 media releases,
confidently entitled: Is Australia progressing? The results are in, makes
a definitive argument about overall progress:
ABS Director, Fiona Dowsley said "The latest release of MAP showsus that overall, Australia is in pretty good shape with moreprogress or little movement, than regress, which is a greatresult. Progress was found in the areas of health, learning andknowledge, jobs, living standards and participation. We have onlyregressed in the areas of our economy's resilience and sustainingthe environment” said Ms Dowsley (Australian Bureau of Statistics,2013c).
32

The implication is that various headline indicators are of
equal weight, such that we can infer progress simply by
subtracting the number of indicators that have gone down
from those that have gone up. In effect, this media release
made a powerful value judgement; namely that a decline in
economic resilience and environmental sustainably is
outweighed in importance by employment growth, better health
and more learning. This is precisely what the ABS has tried
to avoid through MAP. It reminds us of statisticians’
powerful inclination towards making general, quantitative
conclusions about complex social phenomena. Furthermore,
the ABS appears to be operating with two inconsistent
notions of progress: the late modern notion that progress
is contested and cannot be summarised, and the Keynesian
idea that observations of national life can be tallied into
a single metric of social progress.
6. Discussion
This article addressed the challenges facing efforts to
supplant gross domestic product with statistics that better
33

reflect contemporary views on the meaning of social
wellbeing and progress. While most efforts try to replace
GDP with a new single-number indicator, Australia’s
statistical agency has taken a consultative, transparent
approach that explicitly communicates the divergence of
views on progress and the difficulties of quantifying many
components of national wellbeing. In this discussion we
reflect on the implications of our findings for theoretical
work on the politics of quantification.
MAP provides several important lessons for the
contemporary politics of numbers. Our case study shows that
consultative approaches to statistics can weaken their
impact and authority. Indeed, MAP has not had a substantial
impact on policy debate, despite Trewin and Hall (2005)
suggesting otherwise. A search of Australian Parliamentary
Hansard reveals Measures of Australia’s Progress has been mentioned
just three times in the House of Representatives and only
once in the Senate since 1997. If elected representatives do
not use MAP to promote, defend or challenge policies, MAP
cannot be said to have successfully engaged the public in a
34

discussion about how to measure progress. By way of
comparison, the Hansard search reveals the Human Development
Index (HDI) has received ten times as many mentions in
parliamentary debates during the same period.
Statistics allow us to grasp and discuss complex
phenomena spread across enormous populations. To do this,
they invariably ignore important details. For example,
Saudi Arabia was ranked 34th on the HDI in 2014, above
Croatia, Malta, Poland, Portugal and Slovakia. Yet,
according to another plausible measure of national wellbeing
- Freedom House’s Freedom Index
(freedomhouse.org/report/freedom-world/freedom-world-
2015#.VcAhPOc1Cwl) - Saudi Arabia is one of only eight
countries that currently attracts the “Worst of the Worst”
designation (others include North Korea and Syria) with the
lowest possible scores on “freedom”, “political rights” and
“civil liberties”. Should the ABS adopt HDI as a measure of
progress, given its greater currency in Australian and
international debate? The simplicity of HDI means it can be
quickly invoked to support or oppose political arguments,
35

but as a measure of wellbeing or progress it is also
vulnerable to criticisms like those we just levelled.
We conclude that efforts to measure progress face two
trade-offs. The first is between utilization on the one
hand, and acknowledgement of conceptual complexity and
diversity on the other. Headline statistics like GDP and HDI
are more likely to be used because they can be quickly
deployed in news bulletins, parliamentary questions and
doorstop interviews. They are conducive to attention-
grabbing headlines. The MAP dashboard cannot be deployed in
these ways. It generates contradictory findings, conveys
relationships between dimensions of progress using imprecise
narratives, and invariably presents an ambiguous answer to
the question “is life in Australia getting better?” Thus
statistical agencies must make a choice: if they want to
their measures to be widely used, they must engage in
simplification and exclusion in the process of definition
and measurement. We suggest the aspiration to create a new
consensus measure through public dialogue is noble but
36
unrealistic, because it underestimates the cultural and
political pluralism at the core of late modern life.
The second trade-off is between use and responsiveness
to national priorities. The ABS’s endeavor to integrate the
views of Australians is laudable, but it is also likely to
further limit usage of the findings. HDI and other single-
number indicators are arguably used more than MAP in part
because they allow discussion of other nations. Because HDI
uses internationally consistent (albeit problematic and
contested) measurement criteria, it allows observers to
compare the performance of multiple jurisdictions. In an age
of globalization this practice is ubiquitous. HDI and other
headline measures drive and are driven by the urge to rank
and compare across borders. By starting with what
Australians care about, MAP shuts off this crucial potential
use. There is thus a trade-off between tailoring measures to
local idiosyncrasies and producing figures that are taken up
in larger dialogues.
37

38

References
Anderson, B. (1983). Imagined communities: Reflections on the origin
and spread of nationalism. New York: Verso Books.
Arendt, H. (1953). The origins of totalitarianism: Houghton Mifflin
Harcourt.
Australian Bureau of Statistics. (2002). Is life in
Australia getting better? , 2015
Australian Bureau of Statistics. (2004). ABS releases
Measures of Australia's Progress. Retrieved July
17th, 2015, from
http://www.abs.gov.au/ausstats/[email protected]/mediareleasesby
topic/2BFA39220B7D32E1CA256E7C008253D4?OpenDocument
Australian Bureau of Statistics. (2009). Relationships
between domains of progress. Measures of Australia's Progress:
Summary Indicators, 2008. Retrieved 30th July, 2015, from
http://www.abs.gov.au/ausstats/[email protected]/3d68c56307742d8
fca257090002029cd/5fddd465aba670acca2574d30012f0f1!
OpenDocument
39

Australian Bureau of Statistics. (2012). Measures of
Australia's Progress Aspirations for our nation: A
conversation with Australians about progress. Canberra:
Australian Bureau of Statistics.
Australian Bureau of Statistics. (2013a). Further info for
close relationships. Retrieved 22nd July, 2015, from
http://www.abs.gov.au/ausstats/[email protected]/Lookup/by
%20Subject/1370.0~2013~Main%20Features~Further%20info
%20-%20Close%20relationships~47
Australian Bureau of Statistics. (2013b). Information Paper:
Measures of Australia's Progress Proposed Statistical
Indicators, 2013 Retrieved 10th July, 2015, from
http://www.abs.gov.au/ausstats/[email protected]/Lookup/1370.0.0
0.003main+features1122013
Australian Bureau of Statistics. (2013c). Is Australia
progressing? The result are in.: Commonwealth of
Australian.
Australian Bureau of Statistics. (2013d). Measures of
Australia's Progress 2013. Canberra.
40

Australian Bureau of Statistics. (2013e). Participation.
Measures of Australia's Progress. Retrieved 29th July, 2015,
from
http://www.abs.gov.au/ausstats/[email protected]/Lookup/1370.0ma
in+features442013
Australian Bureau of Statistics. (2013f). Safety. 2015, from
http://www.abs.gov.au/ausstats/[email protected]/Lookup/by
%20Subject/1370.0~2013~Main%20Features~Safety~28
Australian Bureau of Statistics. (2014a). Measures of
Australia's Progress, 2013. Retrieved 10th July,
2015, from
http://www.abs.gov.au/AUSSTATS/[email protected]/mf/1370.0
Australian Bureau of Statistics. (2014b). What is MAP?
Retrieved 6th July, 2015, from
http://www.abs.gov.au/ausstats/[email protected]/Lookup/1370.0ma
in+features672013
Bagolin, I. (2004). Human Development Index (HDI)-A poor
representation to human development approach. University
of Rio Grande do Sul, PUCRS, Brazil.
41

Bates, W. (2009). Gross national happiness. Asian‐Pacific
Economic Literature, 23(2), 1-16.
Bauman, Z. (2000). Liquid Modernity. Cambridge: Polity Press.
Beck, U. (1992). Risk society: Towards a new modernity (Vol. 17):
Sage.
Beck, U. (2002). Individualization: Institutionalized individualism and its
social and political consequences (Vol. 13): Sage.
Beck, U., Giddens, A., & Lash, S. (1994). Reflexive
modernization: Politics, tradition and aesthetics in the modern social
order: Stanford University Press.
Cobb, C., Halstead, T., & Rowe, J. (1995a). The genuine
progress indicator. San Francisco, CA: Redefining Progress.
Cobb, C., Halstead, T., & Rowe, J. (1995b). If the GDP is
up, why is America down? ATLANTIC-BOSTON-, 276, 59-79.
Costanza, R., Hart, M., Talberth, J., & Posner, S. (2009).
Beyond GDP: The need for new measures of progress.
Daly, H. E. (1996). Beyond growth: the economics of sustainable
development: Beacon Press.
42

Daly, H. E., Cobb Jr, J. B., & Cobb, C. W. (1989). For the
common good: redirecting the economy toward community
the environment and a sustainable future.
Davidson, K., & Wilson, L. (2011). Australia's Progress
Undefined: A Critical Review of Measures of Australia's
Progress (MAP). Australian Journal of Public Administration, 70(1),
47-57. doi: 10.1111/j.1467-8500.2011.00712.x
Desrosières, A., & Naish, C. (2002). The politics of large numbers:
A history of statistical reasoning. Massachusetts: Harvard
University Press.
Donaldson, P. (1992). Economics of the real world (3rd ed.):
Viking Pr.
Eckersley, R. (1998). Shaping the future to human needs.
Family Matters, 51(Spring/Summer), 6-12.
Galbraith, J. K., & Crook, A. (1958). The affluent society (Vol.
534): Houghton Mifflin Boston.
Giddens, A. (1991). Modernity and self-identity: Self and society in the late
modern age: Stanford University Press.
43

Gigerenzer, G., & Swijtink, Z. (1990). The empire of chance: How
probability changed science and everyday life (Vol. 12): Cambridge
University Press.
Girvetz, H. (1963). The Evolution of Liberalism: New York:
Collier Books.
Hacking, I. (1990). The taming of chance (Vol. 17). Cambridge:
Cambridge University Press.
Haggerty, K. D. (2001). Making crime count. Canada: University
of Toronto Press.
Hall, P. A. (1993). Policy paradigms, social learning, and
the state: the case of economic policymaking in
Britain. Comparative politics, 275-296.
Hibbing, J. R., & Theiss-Morse, E. (2002). Stealth democracy:
Americans' beliefs about how government should work. Cambridge:
Cambridge University Press.
Higgins, V., & Larner, W. (2010). Calculating the social: Standards
and the reconfiguration of governing: Palgrave Macmillan.
Inglehart, R. (1977). The silent revolution: Changing values and political
styles among Western publics. New Jersey: Princeton
University Press.
44

Jessop, B. (1999). The Changing Governance of Welfare:
Recent Trends in its Primary Functions, Scale, and
Modes of Coordination. Social Policy & Administration, 33(4),
348-359.
Latour, B. (1993). We Have Never Been Modern. Cambridge,
Massachusetts Harvard University Press.
Lawn, P. A. (2003). A theoretical foundation to support the
Index of Sustainable Economic Welfare (ISEW), Genuine
Progress Indicator (GPI), and other related indexes.
Ecological Economics, 44(1), 105-118.
Lawn, P. A. (2005). An assessment of the valuation methods
used to calculate the index of sustainable economic
welfare (ISEW), genuine progress indicator (GPI), and
sustainable net benefit index (SNBI). Environment,
Development and Sustainability, 7(2), 185-208.
Layard, R. (2006). Happiness and Public Policy: a Challenge
to the Profession*. The Economic Journal, 116(510), C24-C33.
doi: 10.1111/j.1468-0297.2006.01073.x
45

Leibler, A. (2004). Statisticians' Ambition:
Governmentality, Modernity and National Legibility.
israel studies, 9(2), 121-149.
Mannheim, K. (1936). Systematic sociology: an introduction to the study of
society (Vol. 8): Psychology Press.
Marcuss, R. D., & Kane, R. E. (2007). US National Income and
Product Statistics. Survey of Current Business, 87, 2-32.
Miller, P., Kurunmaki, L., & O'Leary, T. (2010). Calculating
hybrids. Basingstoke, UK: Macmillan.
Nisbett, R. (1980). History of the Idea of Progress:
Transaction publishers.
Porter, T. M. (1986). The rise of statistical thinking, 1820-1900. New
Jersey: Princeton University Press.
Saunders, P. (2002). Whose Progress? A response to the ABS
Report Measures of Australia’s Progress. Issue Analysis, 25,
1-15.
Schepelmann, P., Goossens, Y., & Makipaa, A. (2009). Towards
sustainable development: Alternatives to GDP for measuring progress:
Wuppertal Spezial, Wuppertal Institut für Klima, Umwelt
und Energie.
46

Schwartz, J. (2010, 30th Jan). Is GDP An Obsolete Measure of
Progress?, Time. Retrieved from
http://content.time.com/time/business/article/0,8599,19
57746,00.html
Shergold, P. (2011, November 30 ). Measuring wellbeing is
still in the too-hard basket, The Sydney Morning Herald.
Slattery, M. (1986). Official statistics. London: Taylor &
Francis.
Spadafora, D. (1990). The idea of progress in eighteenth-century Britain:
Yale University Press.
Starr, P. (1987). The sociology of official statistics. In
W. Alonso & P. Starr (Eds.), The politics of numbers (pp. 7-
57): Russell Sage Foundation.
Sutton, T. M. (2011). A Response to ‘Australia's Progress
Undefined: A Critical Review of Measures of Australia's
Progress (MAP)'. Australian Journal of Public Administration,
70(3), 327-331. doi: 10.1111/j.1467-8500.2011.00733.x
Talberth, J., Cobb, C., & Slattery, N. (2007). The Genuine
Progress Indicator 2006. Oakland, CA: Redefining Progress, 26.
47

Trewin, D. (2002). Measuring Australia's Progress. Canberra:
Australian Bureau of Statistics.
Trewin, D. (2004). Measures of Australia's Progress 2004.
Canberra: Australian Bureau of Statistics.
Trewin, D. (2006). Measures of Australia's Progress: Australian
Bureau of Statistics.
Trewin, D., & Hall, J. (2005). Measures of Australia's
Progress-A Case Study of a National Report Based on Key
Economic, Social and Environment Indicators. In OCED
(Ed.), Statistics, Knowledge and Policy: Key Indicators to Inform
Decision-Making (pp. 88-103). Paris: OCED Publishing.
van der Kerk, G., & Manuel, A. (2010). Short survey of
relevant indexes and sets of indicators concerning
development towards sustainability. Northern Alliance for
Sustainability, Brussel.
Walters, W. (2000). Unemployment and government: Genealogies of the
social. Cambridge: Cambridge University Press.
48