Tissue-dependent limited pleiotropy affects gene expression in barley
The CesA Gene Family of Barley. Quantitative Analysis ofTranscripts Reveals Two Groups of Co-Expressed Genes1
Rachel A. Burton, Neil J. Shirley, Brendon J. King, Andrew J. Harvey, and Geoffrey B. Fincher*
School of Agriculture and Wine, and the Australian Centre for Plant Functional Genomics, University ofAdelaide, Waite Campus, Glen Osmond, South Australia 5064, Australia
Sequence data from cDNA and genomic clones, coupled with analyses of expressed sequence tag databases, indicate that theCesA (cellulose synthase) gene family from barley (Hordeum vulgare) has at least eight members, which are distributed acrossthe genome. Quantitative polymerase chain reaction has been used to determine the relative abundance of mRNA transcriptsfor individual HvCesA genes in vegetative and floral tissues, at different stages of development. To ensure accurateexpression profiling, geometric averaging of multiple internal control gene transcripts has been applied for the normaliza-tion of transcript abundance. Total HvCesA mRNA levels are highest in coleoptiles, roots, and stems and much lower in floraltissues, early developing grain, and in the elongation zone of leaves. In most tissues, HvCesA1, HvCesA2, and HvCesA6predominate, and their relative abundance is very similar; these genes appear to be coordinately transcribed. A secondgroup, comprising HvCesA4, HvCesA7, and HvCesA8, also appears to be coordinately transcribed, most obviously inmaturing stem and root tissues. The HvCesA3 expression pattern does not fall into either of these two groups, and HvCesA5transcript levels are extremely low in all tissues. Thus, the HvCesA genes fall into two general groups of three genes withrespect to mRNA abundance, and the co-expression of the groups identifies their products as candidates for the rosettes thatare involved in cellulose biosynthesis at the plasma membrane. Phylogenetic analysis allows the two groups of genes to belinked with orthologous Arabidopsis CesA genes that have been implicated in primary and secondary wall synthesis.
Cellulose biosynthesis in vascular plants is effectedat the plasma membrane by a rosette terminal com-plex of proteins that contains catalytic cellulose syn-thase subunits (Roelofsen, 1958; Mueller and Brown,1980; Kimura et al., 1999) and, in all likelihood, an-cillary proteins or enzymes required for the extrusionof cellulosic chains and assembly of microfibrils(Doblin et al., 2002). In the single most convincingdemonstration of high-level in vitro cellulose biosyn-thesis by plant enzymes, the rosette complexes canbeen seen at the termini of cellulose microfibrilssynthesized in vitro by membrane extracts ofsuspension-cultured cells of Rubus fruticosus (Lai-Kee-Him et al., 2002). Although biochemical ap-proaches to the purification and characterization ofplant cellulose synthases have met with little success(Delmer, 1999), mutational genetics, gene silencing,and herbicide studies are now providing overwhelm-ing evidence that the catalytic subunits of rosettes areencoded by CesA (cellulose synthase) genes (Pear etal., 1996; Arioli et al., 1998; Burton et al., 2000;Scheible et al., 2001).
Genome sequencing programs and the generationof extensive expressed sequence tag (EST) databaseshave shown further that plant CesA genes are mem-
bers of multigene families. There are at least 10 CesAgenes in Arabidopsis, 12 in rice (Oryza sativa;Richmond and Somerville, 2000; http://cellwall.stanford.edu/), and at least nine in maize (Zea mays;Holland et al., 2000; Dhugga, 2001). In Arabidopsis,mutations in individual CesA genes have been linkedwith cellulose deficiencies in various tissues (Arioli etal., 1998; Taylor et al., 1999, 2000, 2003; Fagard et al.,2000; Scheible et al., 2001; Beeckman et al., 2002; Burnet al., 2002; Cano-Delgado et al., 2003; Gardiner et al.,2003) and with resistance to herbicides that targetcellulose biosynthesis (Scheible et al., 2001; Desprezet al., 2002). The individual CesA genes of Arabidop-sis appear to have evolved specialized functions,which require different genes for expression in dif-ferent tissues, in primary or secondary wall synthe-sis, or as multiple components of the cellulose-synthesizing rosettes. In the last case, it has beensuggested that several distinct CesA proteins mightbe necessary for the correct assembly of rosettes inArabidopsis (Doblin et al., 2002; Taylor et al., 2003).
Additional specialized roles for members of theCesA gene family might include the synthesis of wallpolysaccharides other than cellulose. Given that thebackbone structures of non-cellulosic wall compo-nents such as heteroxylans, xyloglucans, mannans,and (133,134)-�-d-glucans are chemically analogouswith cellulose (Fincher and Stone, 1993; Carpita, 1996),it is reasonable to predict that genes required for theirsynthesis could reside in the CesA gene family or inthe Csl (cellulose synthase-like) gene family (Dhugga,2001; Vergara and Carpita, 2001; Doblin et al., 2002).
1 This work was supported by the Australian Research Council(grant to G.B.F.) and by the Grains Research and DevelopmentCorporation (grant to G.B.F.).
* Corresponding author; e-mail [email protected];fax 61– 8 – 8303–7109.
Article, publication date, and citation information can be foundat www.plantphysiol.org/cgi/doi/10.1104/pp.103.032904.
224 Plant Physiology, January 2004, Vol. 134, pp. 224–236, www.plantphysiol.org © 2004 American Society of Plant Biologists www.plant.org on January 28, 2016 - Published by www.plantphysiol.orgDownloaded from Copyright © 2004 American Society of Plant Biologists. All rights reserved.

Here, the CesA gene family from barley (Hordeumvulgare) has been examined, through cloned cDNAs,EST sequence analysis, and genomic clones, and thelocations of the genes on high-density genetic mapshave been defined. Quantitative-PCR (Q-PCR; Finket al., 1998), normalized through multiple internalcontrol genes (Vandesompele et al., 2002), has beenused to monitor the abundance of individual HvCesAmRNAs in various tissues, with a view to comparingtranscript abundance with known differences in cellwall composition in different tissues and at differentstages of development. Transcript profiles of mem-bers of the barley CesA gene family are markedlydifferent from those of maize (Holland et al., 2000;Dhugga, 2001). Co-expression of two groups ofgenes, namely HvCesA1, HvCesA2, and HvCesA6 inone group and HvCesA4, HvCesA7, and HvCesA8 inthe other, is consistent with the participation of threeCesA subunits in rosettes during cellulose synthesisand with the participation of distinct groups of CesAgenes in primary and secondary wall assembly.
RESULTS
Cloning the HvCesA cDNAs and Genes
A PCR product was initially amplified from ayoung barley leaf cDNA preparation with degenerateprimers from conserved regions of plant CesA genes.This generated a cDNA, designated HvCesA1, whichwas used to screen a barley suspension-cultured cellcDNA library at low stringency, to yield correspond-ing fragments of the HvCesA2 and HvCesA3 genes.The HvCesA4 cDNA was first isolated from a 3-dcoleoptile library during EST sequencing carried outby Dr. Andreas Graner (Institute of Plant Geneticsand Crop Plant Research, Gatersleben, Germany).Contiguous sequences for HvCesA5 and HvCesA6were initially constructed from ESTs listed on thehttp://cellwall.stanford.edu/Web site, and HvCesA8was constructed by bridging two singletons listedon the same Web site. The sequences of HvCesA1,HvCesA2, and HvCesA3 were extended through ESTsequences from the web site. A 3�-untranslated re-gion (UTR) of HvCesA7, which is 96% identical withHvCesA5, was obtained during Q-PCR experiments.Barley bacterial artificial chromosome (BAC) clonescorresponding to most of the individual HvCesAswere also identified as follows: HvCesA1, 337H09;HvCesA2, 69M22; HvCesA3, 283N14; HvCesA4, 45J23;HvCesA5/7, 627G13; and HvCesA6, 453O07. Se-quences from the BAC clones were used to extend 5�sequences of the cDNAs. Once the sequences wereassembled, PCR was used to generate near full-length (3.6–3.9 kb) single cDNA fragments corre-sponding to each of the HvCesA1, HvCesA2, andHvCesA6 genes. The other cDNAs were truncated attheir 5� ends by between 30 bp and about 1.8 kbbecause the corresponding BAC clones did not con-tain the 5� regions of the genes.
The respective sizes of cDNAs for HvCesA1,HvCesA2, HvCesA3, HvCesA4, HvCesA5/7, HvCesA6,and HvCesA8 were 3,614, 3,910, 3,180, 1,814, 2,769,3,739, and 1,246 bp. All have open reading frames thatencode polypeptides of 1,000 to 1,100 amino acidresidues. Their sequences have been submitted tothe databases under accession numbers AY483150,AY483152, AY483151, AY483154, AY483153, AY483155,and AY483156, respectively.
EST Analyses
The sequences of the barley cDNAs are reconciledwith available EST sequences in Figure 1, where mostESTs in the public databases can be assigned to thegenes cloned here. On this basis, it is concluded thatthe barley CesA gene family has at least eight mem-bers. Several singleton EST sequences are currentlyunassigned, and, although sequence data for ESTsare not always accurate, it is possible that these couldrepresent additional HvCesA genes.
Map Locations of the Barley HvCesA Genes
The HvCesA genes were mapped using severalmapping populations and their positions in relationto DNA molecular markers are shown in Figure 2.The precise map positions of the barley genes havebeen lodged on the GrainGenes Web page under theCesA designation (http://wheat.pw.usda.gov/index.shtml). No polymorphisms for the partial HvCesA4cDNA were detected in any of the parental lines, sothis gene could not be mapped to a specific locus, andthe HvCesA8 gene has not yet been mapped. However,the HvCesA4 gene has been mapped to the long arm ofchromosome 1H, using wheat barley addition lines(Islam et al., 1981; data not shown). The other mem-bers of the HvCesA gene family are scattered acrossthe genome on chromosomes 2H, 3H, 5H, and 6H(Fig. 2). Two polymorphisms were detected andmapped using the HvCesA5 probe, and althoughthis is now attributable to close sequence similarityof the HvCesA5 and HvCesA7 genes, it is not possibleto distinguish between the HvCesA5 and HvCesA7map positions. No phenotypic or barley qualityquantitative trait loci obviously associated with cel-lulose biosynthesis were present in the vicinity of theHvCesA genes (data not shown).
Phylogenetic Relatedness of the BarleyGenes with other Plant CesA Genes
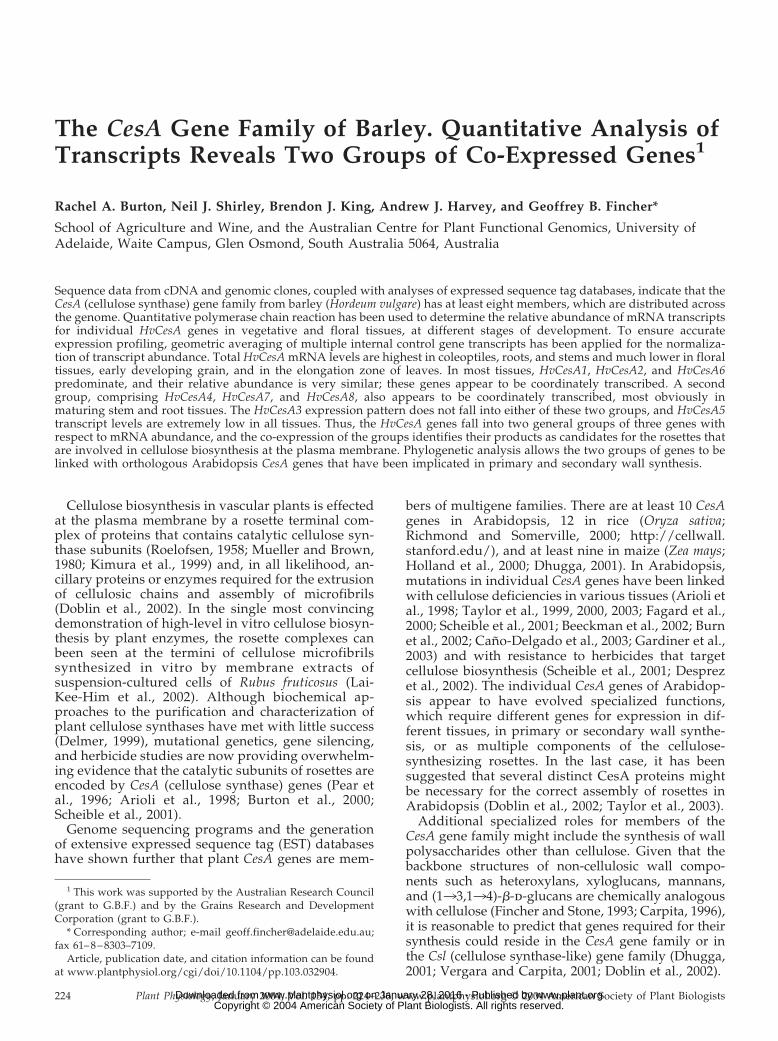
An unrooted, radial phylogenetic tree of the barleyHvCesA gene family was generated with the softwareprogram ClustalX (Thompson et al., 1997; Fig. 3),using amino acid sequences deduced from cDNAsequences that are currently available. A clusteringpattern similar to that seen in Figure 3 was alsoobserved if the phylogenetic tree was generated us-
The Barley CesA Gene Family
Plant Physiol. Vol. 134, 2004 225 www.plant.org on January 28, 2016 - Published by www.plantphysiol.orgDownloaded from Copyright © 2004 American Society of Plant Biologists. All rights reserved.
ing only the hypervariable regions of the genes (Ver-gara and Carpita, 2001; data not shown). As observedin the EST analysis, several pairs of CesA genes frommaize, rice, and barley were very closely related,including ZmCesA1/ZmCesA2, ZmCesA4/ZmCesA9,OsCesA6/OsCesA11, and HvCesA5/HvCesA7. Aminoacid sequence identities between the Arabidopsisand barley CesA proteins are shown in Table I.
Normalization Factors (NFs) for Q-PCR
The relative levels of individual HvCesA mRNAswere determined using real-time Q-PCR (Fink et al.,1998). To avoid confusion with reverse transcriptase(RT)-PCR, we have adopted here the term Q-PCR inpreference to “real-time” PCR. A key requirement forthe accuracy of expression profiling by Q-PCR is the
development of a rigorous normalization strategy(Vandesompele et al., 2002). In the experiments de-scribed here, mRNA levels for a series of four stablyexpressed genes, including glyceraldehyde-3-phosphate dehydrogenase (HvGAPDH), �-tubulin(HvTub), heat shock protein 70 (HvHSP70), and cy-clophilin (HvCycl), were evaluated as control genesfor the Q-PCR analyses and for the calculation ofreliable NFs used in comparisons between cDNAsfrom different tissues. For each control gene, gene-specific primers were used and individual geneswere selected on the basis of their high-level, stabletranscriptional activity in a range of barley tissues(our unpublished data; Haendler et al., 1987; Bustin,
Figure 1. Analysis of EST sequences and thebarley CesA gene family. More than 314,000barley ESTs were searched for CesA sequencesand reconciled against the HvCesA genes andcDNAs cloned here (current work) and theHvCesA genes listed on the Stanford Web page(http://cellwall.stanford.edu/). The database ESTsequences, with the amino acid positions inparentheses, are aligned with the cDNA se-quences. The numbers of ESTs recorded in thedatabases for each cDNA fragment are indicatedin the central column. The relatively longcDNAs cloned in the present work enabled theputative number of expressed barley HvCesAgenes in the databases to be reduced from 19 toabout eight.
Figure 2. Map locations for the HvCesA genes. Flanking DNA mark-ers for each of the genes are indicated. No polymorphisms weredetected for HvCesA4, which could only be mapped to the long armof chromosome 1H. Two map positions were determined using theHvCesA5/A7 probe, but it was not possible to define which corre-sponded to the HvCesA5 and HvCesA7 genes. The exact positions ofthe genes are available on the GrainGenes Web page(http://wheat.pw.usda.gov/index.html).
Figure 3. Phylogenetic relatedness of the barley cellulose synthase(HvCesA) genes and those from Arabidopsis (AtCesA), maize(ZmCesA), and rice (OsCesA). The phylogenetic tree was generatedwith the ClustalX program and is based on amino acid sequenceidentities. Where the function of the gene has been implicated in afunction relating to cellulose synthesis in Arabidopsis, the locusname is indicated (e.g. PRC1, IRX, IXR, and RSW).
Burton et al.
226 Plant Physiol. Vol. 134, 2004 www.plant.org on January 28, 2016 - Published by www.plantphysiol.orgDownloaded from Copyright © 2004 American Society of Plant Biologists. All rights reserved.
2000; Ozturk et al., 2002). One of the cellulose syn-thase (HvCesA1) transcripts also proved to be usefulin normalization.
The NF, derived from the geometric mean of ex-pression data for the most stably expressed controlgenes by the geNorm program (Vandesompele et al.,2002), was calculated from the five control genes.Average expression stability for individual genes iscalculated as an M value; a low M value is indicativeof more stable expression and, hence, increased suit-ability of a particular gene as a control gene (Vande-sompele et al., 2002). In a processive calculation, thegene with the highest M value is eliminated and theNF for the remaining genes recalculated until M val-ues are essentially constant.
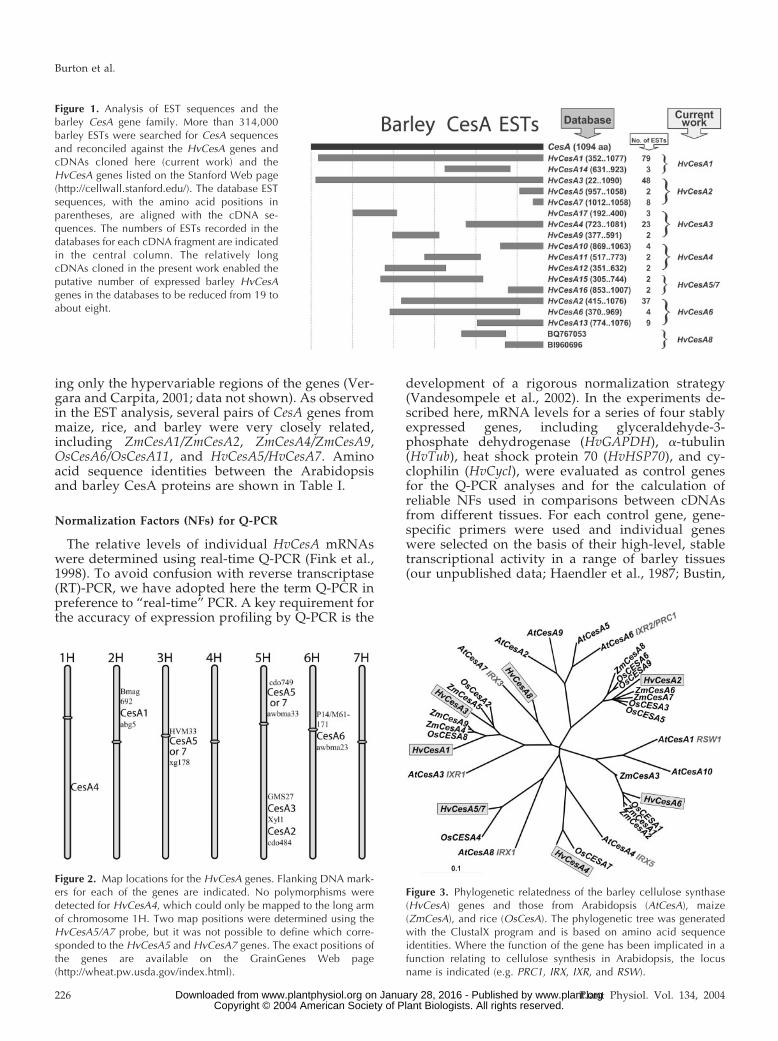
In the present work, NF values for most cDNAsamples remained relatively unchanged between fiveand two control genes, except that the NFs for the roottip sample decreased significantly between the use offive and two control genes (Fig. 4). The order of elim-
ination of control genes was HvCesA1, HvHSP70, andHvTub, leaving HvCycl and HvGAPDH. It can be seenin Figure 4 that the elimination of HvTub to leave justtwo control genes significantly decreased the NF valuefor the root tip cDNA. The addition of HvHSP70 mark-edly increased the root tip NF value and at the sametime introduced a gene with expression that variesmore widely across the tissue series, that is, it has ahigher M value than the best three control genes. Onthis basis, the NF values based on the control genesHvTub, HvCycl, and HvGAPDH were used for normal-ization of the expression data of the HvCesA genefamily (Table II). Normalized expression data from theHvCesA genes were calculated by dividing the rawdata by the NF value. sds were calculated from fourreplicate PCR experiments per cDNA sample.
Data from the tissue series were used to determinethe most appropriate genes for the tissue subseriescomprising seedling root, seedling leaf, coleoptile,and mature leaf. When the data were considered forthe pair of tissues from leaf or root, the order offitness of control genes was different from that cal-culated from all the tissues in the series. This is notsurprising because the tissues are metabolically quitedistinct (Vandesompele et al., 2002). The best of thebarley control genes for the various tissue cDNAs arelisted in Table III, together with the NF values thatwere subsequently used to calculate normalized ex-pression data and errors for the tissue subseries.
Table I. Amino acid sequence identities of barley (Hv) and Arabidopsis (At) CesA proteins
Identities are expressed as percentages, along the complete open reading frames of the encoded proteins. Underlined values indicateorthologous Arabidopsis and barley sequences.
GeneBarley HvCesA Sequences Arabidopsis AtCesA Sequences
Hv1 Hv2 Hv3 Hv4 Hv5/7 Hv6 Hv8 At1 At2 At3 At4 At5 At6 At7 At8 At9 At10
%
HvCesA1 100 – – – – – – 66 61 76 62 61 60 66 57 60 63HvCesA2 63 100 – – – – – 66 69 66 63 70 69 66 58 69 63HvCesA3 83 65 100 – – – – 69 63 77 63 63 61 67 58 62 67HvCesA4 69 69 69 100 – – – 71 67 70 79 67 67 71 68 66 68HvCesA5/7 67 65 68 70 100 – – 69 65 69 66 65 64 68 73 65 67HvCesA6 67 64 69 69 69 100 – 79 64 68 63 64 63 64 62 63 76HvCesA8 78 76 81 76 72 77 100 78 72 82 77 71 70 89 71 71 75
Figure 4. Q-PCR NFs calculated for the cDNAs of the 10 tissues,based on the five control genes and recalculated after the sequentialremoval of the most variable control gene, that is the gene with thehighest M value. Before the cDNA synthesis, total RNA was isolatedfrom the ten tissues under the conditions described in “Materials andMethods.” Tissues examined include the tip and base of the first leaf(leaf tip and leaf base), the root tip and the maturation zone of roots(root m/zone), flowers just before anthesis (floral early), flowers atanthesis (floral anthesis), developing grain 3 and 13 DPA (developinggrain 3 and developing grain 13), coleoptiles (3 d), and the stem ofmature plants just below the emerging ear (stem).
Table II. NFs calculated by geNorm for the tissue series of cDNAsbased on the combination of three control genes (HvGAPDH,HvCycl, and HvTub)
Tissue NF
First leaf tip 0.24First leaf base 1.55Root tip 2.66Root m/zone 0.49Floral early 1.79Floral anthesis 2.57Developing grain (3) 3.18Developing grain (13) 0.12Coleoptile 3 d 1.40Stem 0.84
The Barley CesA Gene Family
Plant Physiol. Vol. 134, 2004 227 www.plant.org on January 28, 2016 - Published by www.plantphysiol.orgDownloaded from Copyright © 2004 American Society of Plant Biologists. All rights reserved.
Transcript Profiling of mRNAs for HvCesA Genes inDifferent Tissues
Overall, HvCesA transcript levels were highest in3-d coleoptiles, stems taken from the fully extendedinternode below the spike before anthesis, and thematuration zone of roots (Fig. 5A). Levels were rela-tively low in developing grain and floral tissues.Closer scrutiny of the data in Figure 5A revealed twodistinct groups of apparently co-expressed genes.Group I consisted of HvCesA1, HvCesA2, andHvCesA6. Using the primer sets shown in Table IV,HvCesA1 levels in the majority of tissues were aboutthe same as HvCesA2, and both were consistently 2-to 3-fold higher than HvCesA6 (Fig. 5B). The secondgroup of apparently cotranscribed genes (Group II)consisted of HvCesA4, HvCesA7, and HvCesA8 (Fig.5C). Within Group II, HvCesA8 transcript levels areconsistently about 2-fold higher that HvCesA4mRNA, whereas HvCesA7 transcript levels are about10% to 15% of HvCesA8 levels (Fig. 5C). Transcriptsof HvCesA5 were of lowest abundance in all tissues,at 0.001% to 0.09% of HvCesA1 transcript levels (Fig.5A), and were detected mainly in mature stem and inthe maturation zone of roots. Transcripts of HvCesA3were generally low, except in leaf tips (Fig. 5A), andexpression patterns of this gene appeared to be inde-pendent of the two co-expressed groups.
Abundance of HvCesA Transcripts in Segments ofVegetative Tissues
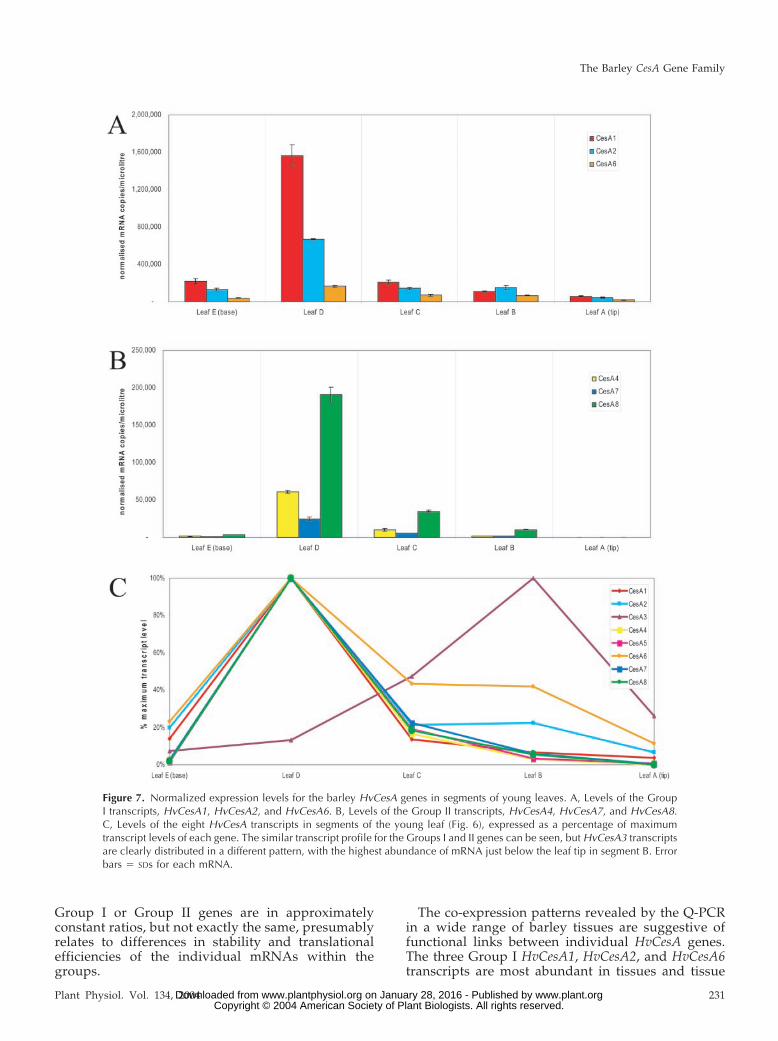
The abundance of individual HvCesA mRNAs invarious growth zones of vegetative tissues was ex-amined in segments of young seedling leaves (7 dold), young roots (5 d old) and coleoptiles (5 d old),as indicated in Figure 6, and in mature leaves (fifthleaf). In young seedling leaves, levels of mostmRNAs were highest in the cell elongation zoneabove the leaf base (Figs. 7, A and B). Again, levels of
the Group I mRNAs of HvCesA1, HvCesA2 and HvC-esA6 were highest and in approximately constantproportions along the seedling leaf (Fig. 7A). GroupII mRNAs (HvCesA4, HvCesA7, and HvCesA8) wereconsistently lower in abundance than the Group ImRNAs but also peaked in the seedling leaf elonga-tion zone (Fig. 7B). However, HvCesA3 levels showeda completely different distribution pattern, reachingmaximal levels in region B, just below the leaf tip(Fig. 7C).
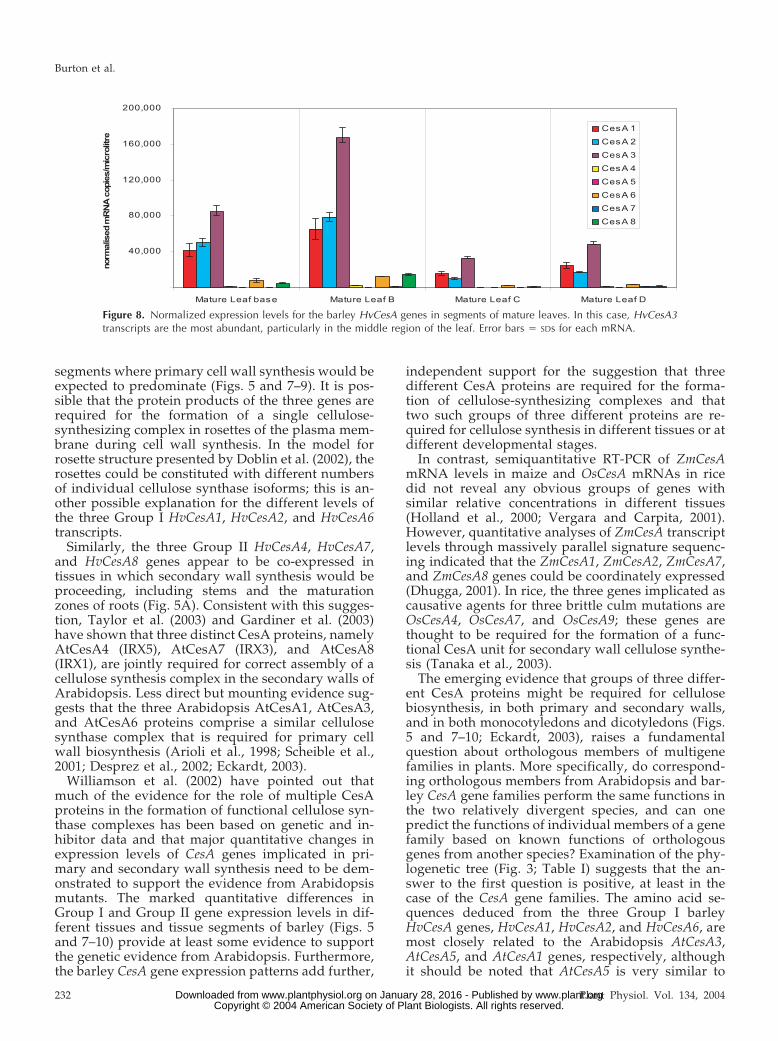
After the observation that HvCesA3 mRNA levelswere relatively abundant in young leaf tips (Figs. 5Aand 7C), transcript profiles were examined in seg-ments of mature leaves (Fig. 8). In mature leaves,HvCesA3 mRNAs were more abundant than those ofany other HvCesA and peaked in the middle region ofthe leaf (Fig. 8).
In root segments, two distinct distribution patternscan be seen (Figs. 9, A and B). The Group I HvCesA1,HvCesA2, and HvCesA6 transcripts were relativelyevenly distributed along the root (Fig. 9A), whereasthe Group II HvCesA4, HvCesA7, and HvCesA8 tran-scripts decreased in abundance toward the root tip(Fig. 9B). In these tissue segments, HvCesA3 tran-script levels followed the Group II pattern (data notshown).
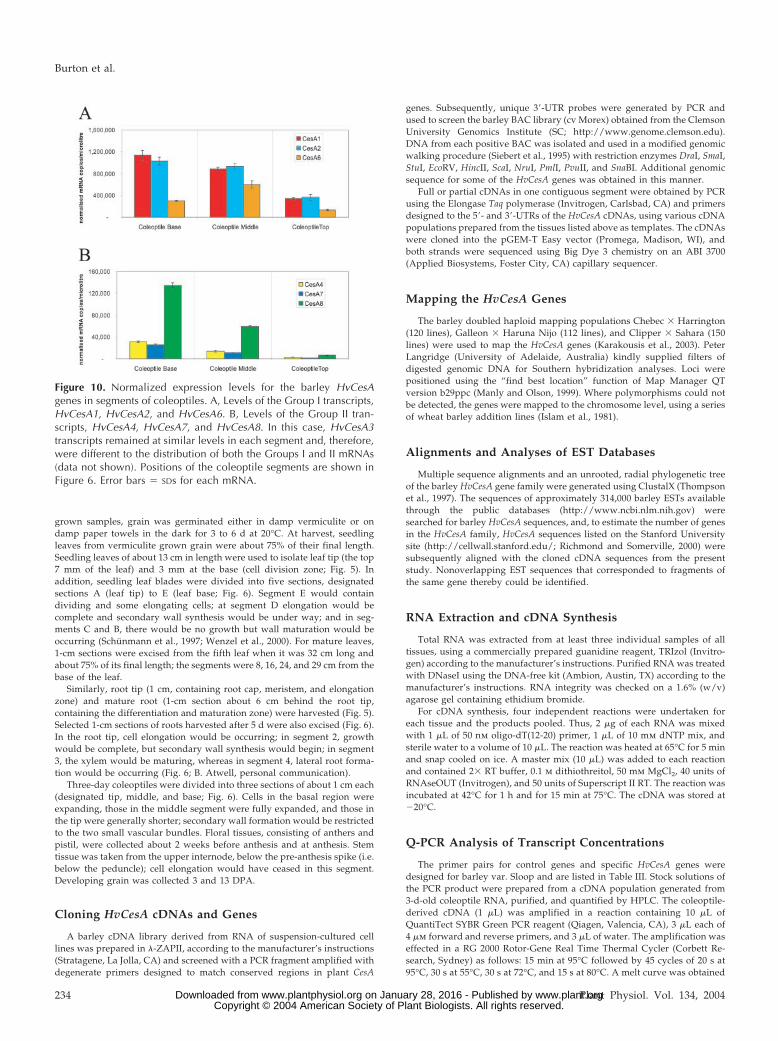
In coleoptiles, Group I and II transcripts appear todecrease from the base to the tip (Fig. 10, A and B),although the levels of the Group I transcripts (Fig.10A) are much higher than the Group II transcripts(Fig. 10B). In the coleoptile sections, HvCesA3 tran-script levels remained relatively high in all segments(data not shown), in contrast to both Groups I and II,which decreased from the base to the top of thecoleoptiles (Fig. 10).
DISCUSSION
Near full-length cDNAs for HvCesA1, HvCesA2,and HvCesA6 were obtained, together with truncatedcDNAs encoding several other HvCesA genes. It isconcluded at this stage that there are at least eightCesA genes in barley and that these are transcribed atlevels sufficient to detect through cDNA or EST li-brary screening (Fig. 1). In Arabidopsis, there are 10CesA genes, whereas in rice and maize, there are 12and at least nine, respectively (Holland et al., 2000;Richmond and Somerville, 2000; Dhugga, 2001). Thenumber of barley BAC clones screened in the presentwork was calculated to cover 90% of the barley ge-nome. Thus, it is possible that additional HvCesAgenes are present and that transcripts will be de-tected in specific tissues not examined here or willhave sequences so similar to others that it will not bepossible to differentiate between true genetic differ-ences, varietal differences, and sequencing errors. Allof the HvCesA genes that covered the putative cata-lytic region of the barley enzymes encode proteinswith a D,D,D,QVRRW motif; this is characteristic of
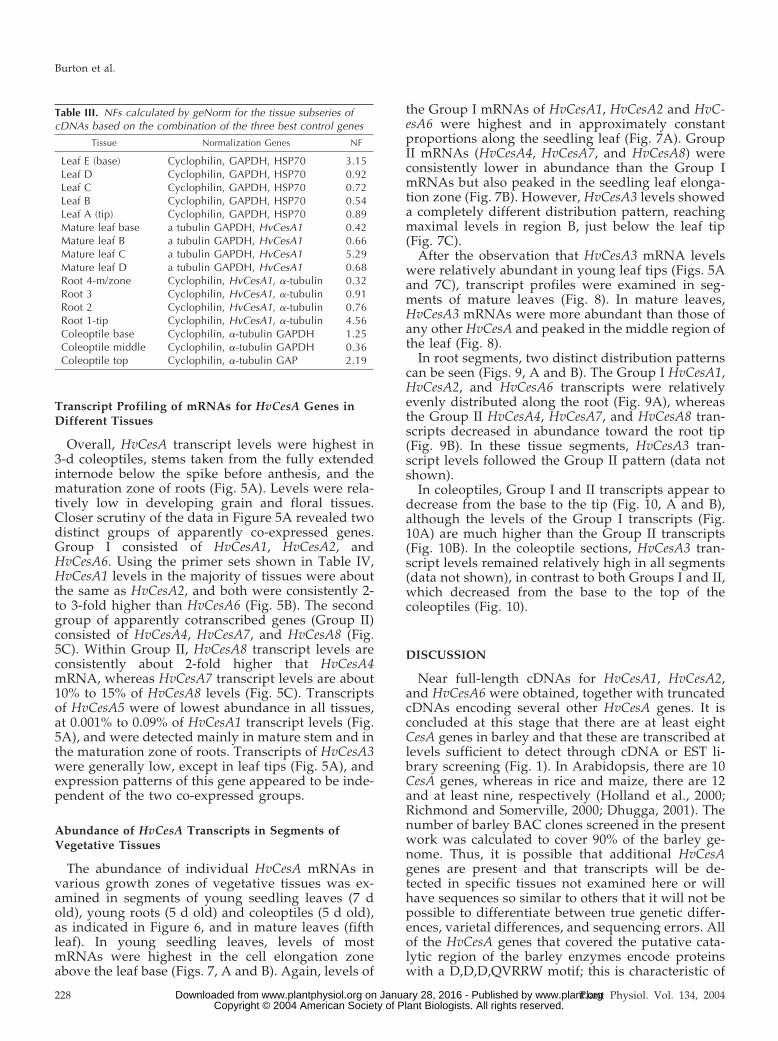
Table III. NFs calculated by geNorm for the tissue subseries ofcDNAs based on the combination of the three best control genes
Tissue Normalization Genes NF
Leaf E (base) Cyclophilin, GAPDH, HSP70 3.15Leaf D Cyclophilin, GAPDH, HSP70 0.92Leaf C Cyclophilin, GAPDH, HSP70 0.72Leaf B Cyclophilin, GAPDH, HSP70 0.54Leaf A (tip) Cyclophilin, GAPDH, HSP70 0.89Mature leaf base a tubulin GAPDH, HvCesA1 0.42Mature leaf B a tubulin GAPDH, HvCesA1 0.66Mature leaf C a tubulin GAPDH, HvCesA1 5.29Mature leaf D a tubulin GAPDH, HvCesA1 0.68Root 4-m/zone Cyclophilin, HvCesA1, �-tubulin 0.32Root 3 Cyclophilin, HvCesA1, �-tubulin 0.91Root 2 Cyclophilin, HvCesA1, �-tubulin 0.76Root 1-tip Cyclophilin, HvCesA1, �-tubulin 4.56Coleoptile base Cyclophilin, �-tubulin GAPDH 1.25Coleoptile middle Cyclophilin, �-tubulin GAPDH 0.36Coleoptile top Cyclophilin, �-tubulin GAP 2.19
Burton et al.
228 Plant Physiol. Vol. 134, 2004 www.plant.org on January 28, 2016 - Published by www.plantphysiol.orgDownloaded from Copyright © 2004 American Society of Plant Biologists. All rights reserved.

Figure 5. Normalized expression levels of the eight HvCesA genes in a range of tissues. Levels of mRNA are presented asnumber of copies per microliter after normalization. Tissues and their abbreviations are as detailed in the legend to Figure4. Error bars � SDs for each mRNA. A, Levels of the eight HvCesA mRNAs in the 10 different tissues. Very low levels ofHvCesA5 mRNA were detected in some tissues, but the amount could not be seen on the scale used here. B, Levels ofHvCesA1, HvCesA2, and HvCesA6 transcripts in the different tissues, showing the similar relative abundance of this groupof mRNAs (designated Group I). C, Levels of HvCesA4, HvCesA7, and HvCesA8 transcripts in the series of tissues, showingthe similar relative abundance of this group of transcripts (designated Group II).
The Barley CesA Gene Family
Plant Physiol. Vol. 134, 2004 229 www.plant.org on January 28, 2016 - Published by www.plantphysiol.orgDownloaded from Copyright © 2004 American Society of Plant Biologists. All rights reserved.
plant cellulose synthases (Pear et al., 1996). Molecularmapping studies showed that the HvCesA genes arescattered across the barley genome (Fig. 2), as ob-served for the Arabidopsis and maize CesA genes(Holland et al., 2000).
Q-PCR, in which geometric averaging of multipleinternal control gene transcripts is important for thenormalization of transcript abundance (Vandesom-pele et al., 2002), was used to quantitate mRNA levelsfor individual HvCesA genes in a range of tissues(Figs. 5 and 7–10). In most tissues and in segments ofgrowing coleoptiles, roots, and leaves, mRNAs forHvCesA1, HvCesA2, and HvCesA6, in that order, weremost abundant, and in approximately similar relativeconcentrations. These co-expression patterns sug-gested that the corresponding genes might be coor-dinately transcribed in the tissues examined here(Fig. 5). In accordance, we have designated thesethree genes as Group I members of the HvCesA genefamily. Additionally, transcripts of a second group ofgenes, designated Group II and comprising HvCesA4,HvCesA7, and HvCesA8, were also found in approx-imately equal relative abundance in a wide range oftissues and tissue segments (Figs. 5 and 7–10). Withinthis group, the relative abundance of mRNAs in-creased from HvCesA7 through HvCesA4 to HvCesA8.Transcription patterns of the Group I and Group IIHvCesA genes were dramatically different (Figs. 5and 7–9).
The other two members of the barley HvCesA genefamily did not follow Group I or Group II transcrip-tion patterns and, therefore, appeared to be indepen-dently regulated. Levels of HvCesA5 mRNA wereextremely low in all tissues examined. However,HvCesA3 mRNAs were more abundant, particularlytoward the tips of young and mature leaves, whereHvCesA3 was the most abundant CesA mRNA by far(Fig. 5). Thus, HvCesA3 may play a specific or spe-cialized role in cellulose synthesis in these regions ofbarley leaves or may be involved in the synthesis ofwall polysaccharides other than cellulose.
It can be concluded from these data that Q-PCR issufficiently sensitive and precise to confidently de-tect co-expression of groups of genes through con-stant relative proportions of their mRNAs (Figs. 5and 7–10), provided that transcript levels are care-fully normalized (Fig. 4; Vandesompele et al., 2002).The fact that transcript levels within the barley
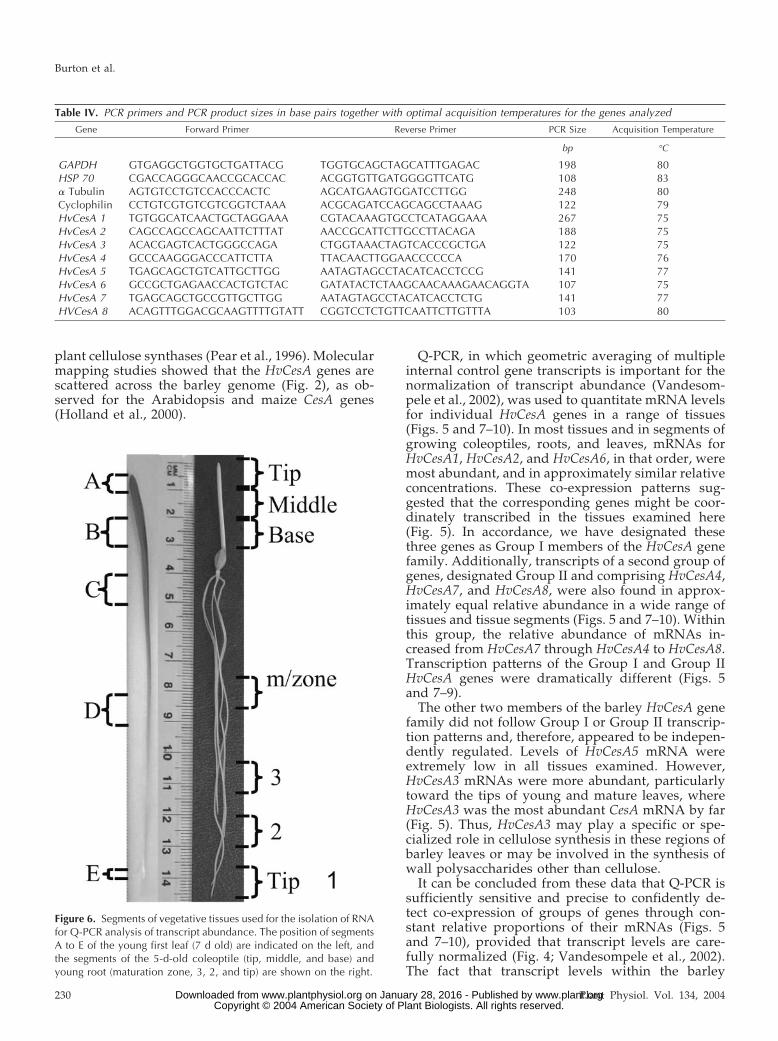
Figure 6. Segments of vegetative tissues used for the isolation of RNAfor Q-PCR analysis of transcript abundance. The position of segmentsA to E of the young first leaf (7 d old) are indicated on the left, andthe segments of the 5-d-old coleoptile (tip, middle, and base) andyoung root (maturation zone, 3, 2, and tip) are shown on the right.
Table IV. PCR primers and PCR product sizes in base pairs together with optimal acquisition temperatures for the genes analyzed
Gene Forward Primer Reverse Primer PCR Size Acquisition Temperature
bp °C
GAPDH GTGAGGCTGGTGCTGATTACG TGGTGCAGCTAGCATTTGAGAC 198 80HSP 70 CGACCAGGGCAACCGCACCAC ACGGTGTTGATGGGGTTCATG 108 83� Tubulin AGTGTCCTGTCCACCCACTC AGCATGAAGTGGATCCTTGG 248 80Cyclophilin CCTGTCGTGTCGTCGGTCTAAA ACGCAGATCCAGCAGCCTAAAG 122 79HvCesA 1 TGTGGCATCAACTGCTAGGAAA CGTACAAAGTGCCTCATAGGAAA 267 75HvCesA 2 CAGCCAGCCAGCAATTCTTTAT AACCGCATTCTTGCCTTACAGA 188 75HvCesA 3 ACACGAGTCACTGGGCCAGA CTGGTAAACTAGTCACCCGCTGA 122 75HvCesA 4 GCCCAAGGGACCCATTCTTA TTACAACTTGGAACCCCCCA 170 76HvCesA 5 TGAGCAGCTGTCATTGCTTGG AATAGTAGCCTACATCACCTCCG 141 77HvCesA 6 GCCGCTGAGAACCACTGTCTAC GATATACTCTAAGCAACAAAGAACAGGTA 107 75HvCesA 7 TGAGCAGCTGCCGTTGCTTGG AATAGTAGCCTACATCACCTCTG 141 77HVCesA 8 ACAGTTTGGACGCAAGTTTTGTATT CGGTCCTCTGTTCAATTCTTGTTTA 103 80
Burton et al.
230 Plant Physiol. Vol. 134, 2004 www.plant.org on January 28, 2016 - Published by www.plantphysiol.orgDownloaded from Copyright © 2004 American Society of Plant Biologists. All rights reserved.
Group I or Group II genes are in approximatelyconstant ratios, but not exactly the same, presumablyrelates to differences in stability and translationalefficiencies of the individual mRNAs within thegroups.
The co-expression patterns revealed by the Q-PCRin a wide range of barley tissues are suggestive offunctional links between individual HvCesA genes.The three Group I HvCesA1, HvCesA2, and HvCesA6transcripts are most abundant in tissues and tissue
Figure 7. Normalized expression levels for the barley HvCesA genes in segments of young leaves. A, Levels of the GroupI transcripts, HvCesA1, HvCesA2, and HvCesA6. B, Levels of the Group II transcripts, HvCesA4, HvCesA7, and HvCesA8.C, Levels of the eight HvCesA transcripts in segments of the young leaf (Fig. 6), expressed as a percentage of maximumtranscript levels of each gene. The similar transcript profile for the Groups I and II genes can be seen, but HvCesA3 transcriptsare clearly distributed in a different pattern, with the highest abundance of mRNA just below the leaf tip in segment B. Errorbars � SDs for each mRNA.
The Barley CesA Gene Family
Plant Physiol. Vol. 134, 2004 231 www.plant.org on January 28, 2016 - Published by www.plantphysiol.orgDownloaded from Copyright © 2004 American Society of Plant Biologists. All rights reserved.
segments where primary cell wall synthesis would beexpected to predominate (Figs. 5 and 7–9). It is pos-sible that the protein products of the three genes arerequired for the formation of a single cellulose-synthesizing complex in rosettes of the plasma mem-brane during cell wall synthesis. In the model forrosette structure presented by Doblin et al. (2002), therosettes could be constituted with different numbersof individual cellulose synthase isoforms; this is an-other possible explanation for the different levels ofthe three Group I HvCesA1, HvCesA2, and HvCesA6transcripts.
Similarly, the three Group II HvCesA4, HvCesA7,and HvCesA8 genes appear to be co-expressed intissues in which secondary wall synthesis would beproceeding, including stems and the maturationzones of roots (Fig. 5A). Consistent with this sugges-tion, Taylor et al. (2003) and Gardiner et al. (2003)have shown that three distinct CesA proteins, namelyAtCesA4 (IRX5), AtCesA7 (IRX3), and AtCesA8(IRX1), are jointly required for correct assembly of acellulose synthesis complex in the secondary walls ofArabidopsis. Less direct but mounting evidence sug-gests that the three Arabidopsis AtCesA1, AtCesA3,and AtCesA6 proteins comprise a similar cellulosesynthase complex that is required for primary cellwall biosynthesis (Arioli et al., 1998; Scheible et al.,2001; Desprez et al., 2002; Eckardt, 2003).
Williamson et al. (2002) have pointed out thatmuch of the evidence for the role of multiple CesAproteins in the formation of functional cellulose syn-thase complexes has been based on genetic and in-hibitor data and that major quantitative changes inexpression levels of CesA genes implicated in pri-mary and secondary wall synthesis need to be dem-onstrated to support the evidence from Arabidopsismutants. The marked quantitative differences inGroup I and Group II gene expression levels in dif-ferent tissues and tissue segments of barley (Figs. 5and 7–10) provide at least some evidence to supportthe genetic evidence from Arabidopsis. Furthermore,the barley CesA gene expression patterns add further,
independent support for the suggestion that threedifferent CesA proteins are required for the forma-tion of cellulose-synthesizing complexes and thattwo such groups of three different proteins are re-quired for cellulose synthesis in different tissues or atdifferent developmental stages.
In contrast, semiquantitative RT-PCR of ZmCesAmRNA levels in maize and OsCesA mRNAs in ricedid not reveal any obvious groups of genes withsimilar relative concentrations in different tissues(Holland et al., 2000; Vergara and Carpita, 2001).However, quantitative analyses of ZmCesA transcriptlevels through massively parallel signature sequenc-ing indicated that the ZmCesA1, ZmCesA2, ZmCesA7,and ZmCesA8 genes could be coordinately expressed(Dhugga, 2001). In rice, the three genes implicated ascausative agents for three brittle culm mutations areOsCesA4, OsCesA7, and OsCesA9; these genes arethought to be required for the formation of a func-tional CesA unit for secondary wall cellulose synthe-sis (Tanaka et al., 2003).
The emerging evidence that groups of three differ-ent CesA proteins might be required for cellulosebiosynthesis, in both primary and secondary walls,and in both monocotyledons and dicotyledons (Figs.5 and 7–10; Eckardt, 2003), raises a fundamentalquestion about orthologous members of multigenefamilies in plants. More specifically, do correspond-ing orthologous members from Arabidopsis and bar-ley CesA gene families perform the same functions inthe two relatively divergent species, and can onepredict the functions of individual members of a genefamily based on known functions of orthologousgenes from another species? Examination of the phy-logenetic tree (Fig. 3; Table I) suggests that the an-swer to the first question is positive, at least in thecase of the CesA gene families. The amino acid se-quences deduced from the three Group I barleyHvCesA genes, HvCesA1, HvCesA2, and HvCesA6, aremost closely related to the Arabidopsis AtCesA3,AtCesA5, and AtCesA1 genes, respectively, althoughit should be noted that AtCesA5 is very similar to
Figure 8. Normalized expression levels for the barley HvCesA genes in segments of mature leaves. In this case, HvCesA3transcripts are the most abundant, particularly in the middle region of the leaf. Error bars � SDs for each mRNA.
Burton et al.
232 Plant Physiol. Vol. 134, 2004 www.plant.org on January 28, 2016 - Published by www.plantphysiol.orgDownloaded from Copyright © 2004 American Society of Plant Biologists. All rights reserved.

AtCesA2, AtCesA6, and AtCesA9, all of which arelocated together in one branch of the phylogenetictree (Fig. 3; Table I). Current genetic evidence indi-cates that Arabidopsis AtCesA3, AtCesA6, and AtCesA1genes, which are orthologous to the barley Group Igenes, are required for cellulose synthase complexformation during primary wall synthesis (Figs. 5 and7–10; Eckardt, 2003). Similarly, the three Group IIbarley HvCesA4, HvCesA7, and HvCesA8 genes aremost similar to the Arabidopsis AtCesA4, AtCesA8,and AtCesA7 genes, respectively (Fig. 3; Table I). Thisgroup of three Arabidopsis genes has been impli-cated in secondary cell wall synthesis (Figs. 5 and7–10; Gardiner et al., 2003; Taylor et al., 2003). Thus,it can be concluded that the two groups of three CesAproteins in Arabidopsis that have been linked genet-ically to primary and secondary wall cellulose depo-sition are orthologous to the Group I and Group IIco-expressed barley genes, respectively.
Despite these similarities, it must be clearly statedat this stage that the roles of the barley Group I andGroup II CesA proteins in primary and/or secondary
wall synthesis remain to be demonstrated unequivo-cally. We have tried tissue printing and in situ PCRprocedures in attempts to correlate Group I andGroup II transcripts with primary and secondary wallformation (data not shown) but have been unable toconvincingly show that specific transcripts are moreabundant in cells synthesizing the two different walltypes. It is likely that higher resolution immunogoldlabeling of specific HvCesA proteins will be necessaryto define the precise cellular location of individualcellulose synthases in various tissues at differentstages of growth and development. In the absence ofwell-characterized barley mutant libraries, it also willbe necessary to analyze the functions of individualHvCesA genes through specific gene silencing, bothtransiently and in stably transformed plants.
MATERIALS AND METHODS
Plant Material
Barley (Hordeum vulgare L. cv Sloop) plants were grown in a greenhouseunder a day/night temperature regime of 23°C/15°C. For non-greenhouse-
Figure 9. Normalized expression levels for the barley HvCesA genes in segments of young roots. A, Levels of the Group Itranscripts, HvCesA1, HvCesA2, and HvCesA6. B, Levels of the Group II transcripts, HvCesA4, HvCesA7, and HvCesA8. Inthis case, HvCesA3 transcripts showed a distribution similar to that for the Group II mRNAs (data not shown). The positionsof the root segments are shown in Figure 6. Error bars � SDs for each mRNA.
The Barley CesA Gene Family
Plant Physiol. Vol. 134, 2004 233 www.plant.org on January 28, 2016 - Published by www.plantphysiol.orgDownloaded from Copyright © 2004 American Society of Plant Biologists. All rights reserved.
grown samples, grain was germinated either in damp vermiculite or ondamp paper towels in the dark for 3 to 6 d at 20°C. At harvest, seedlingleaves from vermiculite grown grain were about 75% of their final length.Seedling leaves of about 13 cm in length were used to isolate leaf tip (the top7 mm of the leaf) and 3 mm at the base (cell division zone; Fig. 5). Inaddition, seedling leaf blades were divided into five sections, designatedsections A (leaf tip) to E (leaf base; Fig. 6). Segment E would containdividing and some elongating cells; at segment D elongation would becomplete and secondary wall synthesis would be under way; and in seg-ments C and B, there would be no growth but wall maturation would beoccurring (Schunmann et al., 1997; Wenzel et al., 2000). For mature leaves,1-cm sections were excised from the fifth leaf when it was 32 cm long andabout 75% of its final length; the segments were 8, 16, 24, and 29 cm from thebase of the leaf.
Similarly, root tip (1 cm, containing root cap, meristem, and elongationzone) and mature root (1-cm section about 6 cm behind the root tip,containing the differentiation and maturation zone) were harvested (Fig. 5).Selected 1-cm sections of roots harvested after 5 d were also excised (Fig. 6).In the root tip, cell elongation would be occurring; in segment 2, growthwould be complete, but secondary wall synthesis would begin; in segment3, the xylem would be maturing, whereas in segment 4, lateral root forma-tion would be occurring (Fig. 6; B. Atwell, personal communication).
Three-day coleoptiles were divided into three sections of about 1 cm each(designated tip, middle, and base; Fig. 6). Cells in the basal region wereexpanding, those in the middle segment were fully expanded, and those inthe tip were generally shorter; secondary wall formation would be restrictedto the two small vascular bundles. Floral tissues, consisting of anthers andpistil, were collected about 2 weeks before anthesis and at anthesis. Stemtissue was taken from the upper internode, below the pre-anthesis spike (i.e.below the peduncle); cell elongation would have ceased in this segment.Developing grain was collected 3 and 13 DPA.
Cloning HvCesA cDNAs and Genes
A barley cDNA library derived from RNA of suspension-cultured celllines was prepared in �-ZAPII, according to the manufacturer’s instructions(Stratagene, La Jolla, CA) and screened with a PCR fragment amplified withdegenerate primers designed to match conserved regions in plant CesA
genes. Subsequently, unique 3�-UTR probes were generated by PCR andused to screen the barley BAC library (cv Morex) obtained from the ClemsonUniversity Genomics Institute (SC; http://www.genome.clemson.edu).DNA from each positive BAC was isolated and used in a modified genomicwalking procedure (Siebert et al., 1995) with restriction enzymes DraI, SmaI,StuI, EcoRV, HincII, ScaI, NruI, PmlI, PvuII, and SnaBI. Additional genomicsequence for some of the HvCesA genes was obtained in this manner.
Full or partial cDNAs in one contiguous segment were obtained by PCRusing the Elongase Taq polymerase (Invitrogen, Carlsbad, CA) and primersdesigned to the 5�- and 3�-UTRs of the HvCesA cDNAs, using various cDNApopulations prepared from the tissues listed above as templates. The cDNAswere cloned into the pGEM-T Easy vector (Promega, Madison, WI), andboth strands were sequenced using Big Dye 3 chemistry on an ABI 3700(Applied Biosystems, Foster City, CA) capillary sequencer.
Mapping the HvCesA Genes
The barley doubled haploid mapping populations Chebec � Harrington(120 lines), Galleon � Haruna Nijo (112 lines), and Clipper � Sahara (150lines) were used to map the HvCesA genes (Karakousis et al., 2003). PeterLangridge (University of Adelaide, Australia) kindly supplied filters ofdigested genomic DNA for Southern hybridization analyses. Loci werepositioned using the “find best location” function of Map Manager QTversion b29ppc (Manly and Olson, 1999). Where polymorphisms could notbe detected, the genes were mapped to the chromosome level, using a seriesof wheat barley addition lines (Islam et al., 1981).
Alignments and Analyses of EST Databases
Multiple sequence alignments and an unrooted, radial phylogenetic treeof the barley HvCesA gene family were generated using ClustalX (Thompsonet al., 1997). The sequences of approximately 314,000 barley ESTs availablethrough the public databases (http://www.ncbi.nlm.nih.gov) weresearched for barley HvCesA sequences, and, to estimate the number of genesin the HvCesA family, HvCesA sequences listed on the Stanford Universitysite (http://cellwall.stanford.edu/; Richmond and Somerville, 2000) weresubsequently aligned with the cloned cDNA sequences from the presentstudy. Nonoverlapping EST sequences that corresponded to fragments ofthe same gene thereby could be identified.
RNA Extraction and cDNA Synthesis
Total RNA was extracted from at least three individual samples of alltissues, using a commercially prepared guanidine reagent, TRIzol (Invitro-gen) according to the manufacturer’s instructions. Purified RNA was treatedwith DNaseI using the DNA-free kit (Ambion, Austin, TX) according to themanufacturer’s instructions. RNA integrity was checked on a 1.6% (w/v)agarose gel containing ethidium bromide.
For cDNA synthesis, four independent reactions were undertaken foreach tissue and the products pooled. Thus, 2 �g of each RNA was mixedwith 1 �L of 50 nm oligo-dT(12-20) primer, 1 �L of 10 mm dNTP mix, andsterile water to a volume of 10 �L. The reaction was heated at 65°C for 5 minand snap cooled on ice. A master mix (10 �L) was added to each reactionand contained 2� RT buffer, 0.1 m dithiothreitol, 50 mm MgCl2, 40 units ofRNAseOUT (Invitrogen), and 50 units of Superscript II RT. The reaction wasincubated at 42°C for 1 h and for 15 min at 75°C. The cDNA was stored at�20°C.
Q-PCR Analysis of Transcript Concentrations
The primer pairs for control genes and specific HvCesA genes weredesigned for barley var. Sloop and are listed in Table III. Stock solutions ofthe PCR product were prepared from a cDNA population generated from3-d-old coleoptile RNA, purified, and quantified by HPLC. The coleoptile-derived cDNA (1 �L) was amplified in a reaction containing 10 �L ofQuantiTect SYBR Green PCR reagent (Qiagen, Valencia, CA), 3 �L each of4 �m forward and reverse primers, and 3 �L of water. The amplification waseffected in a RG 2000 Rotor-Gene Real Time Thermal Cycler (Corbett Re-search, Sydney) as follows: 15 min at 95°C followed by 45 cycles of 20 s at95°C, 30 s at 55°C, 30 s at 72°C, and 15 s at 80°C. A melt curve was obtained
Figure 10. Normalized expression levels for the barley HvCesAgenes in segments of coleoptiles. A, Levels of the Group I transcripts,HvCesA1, HvCesA2, and HvCesA6. B, Levels of the Group II tran-scripts, HvCesA4, HvCesA7, and HvCesA8. In this case, HvCesA3transcripts remained at similar levels in each segment and, therefore,were different to the distribution of both the Groups I and II mRNAs(data not shown). Positions of the coleoptile segments are shown inFigure 6. Error bars � SDs for each mRNA.
Burton et al.
234 Plant Physiol. Vol. 134, 2004 www.plant.org on January 28, 2016 - Published by www.plantphysiol.orgDownloaded from Copyright © 2004 American Society of Plant Biologists. All rights reserved.

from the PCR product at the end of the amplification by heating from 70°Cto 99°C. During the amplification, fluorescence data was acquired at 72°Cand 80°C to gauge the abundance of the individual genes in the coleoptilecDNA preparation. From the melt curve, the optimal temperature for dataacquisition was determined (Table III).
Between four and six independent 20 �L PCR reaction mixes werecombined and purified by HPLC (Wong et al., 2000) on an Agilent EclipseDS DNA 2.1-mm � 15-cm 3.5-micron reverse phase column (Agilent Tech-nologies, Palo Alto, CA). Chromatography was performed using buffer A(100 mm triethylammonium acetate and 0.1 mm EDTA) and buffer B (100mm triethylammonium acetate, 0.1 mm EDTA, and 25% [w/v] acetonitrile).The gradient was applied at a flow rate of 0.2 mL min�1 at 40°C, as follows:0 to 30 min with 35% (w/v) buffer B, 30 to 31 min with 70% (w/v) buffer B,31 to 40 min with 35% (w/v) buffer B, and after 40 min, 35% (w/v) bufferB. The DNA was detected by A260. The purified PCR products were quan-tified by comparison of the peak area with the areas of three of the peaks ina pUC19/HpaII digest (Geneworks, Adelaide, Australia). In 2 �L of a 500 ng�L�1 digest, the peaks used for reference were 147 bp, representing 55 ng,190 bp (71 ng), and 242 bp (90 ng). From these data, an average value fornanograms per unit area of a peak was calculated. This value was used todetermine the mass of the purified PCR product. The value was determinedwith every batch of PCR products purified. The product was dried anddissolved in water to produce a 20 ng �L�1 stock solution. The size in basepairs and identity of PCR products was confirmed by sequencing. Analiquot of this solution was diluted to produce a stock solution containing109 copies of the PCR product per microliter.
A dilution series covering seven orders of magnitude was prepared fromthe 109 copies �L�1 stock solution to produce solutions covering 107 to 101
�L�1. Three replicates of each of the seven standard concentrations wereincluded with every Q-PCR experiment, together with a minimum of two“no template” controls. For all genes except HvCesA5, a 1:10 dilution of thecDNA was sufficient to produce expression data with an acceptable sd.Undiluted cDNA was required for the determination of HvCesA5 expressionlevels because of its low abundance. Four replicate PCRs for each of thecDNAs were included in each experiment.
For the Q-PCR experiments, 1 �L cDNA solution was used in a reactioncontaining 10 �L of QuantiTect SYBR Green PCR reagent, 3 �L each of theforward and reverse primers at 4 �m, 0.6 �L 10� SYBR Green in water(freshly diluted 10,000� in dimethyl sulfoxide), and 2.4 �L of water. Reac-tions were performed as follows: 15 min at 95°C followed by 45 cycles of 20 sat 95°C, 30 s at 55°C, 30 s at 72°C, and 15 s at the optimal acquisitiontemperature (Table III). A melt curve was obtained from the product at theend of the amplification by heating from 70°C to 99°C. PCR products wereseparated by electrophoresis in 2.5% (w/v) agarose-Tris-borate/EDTA-ethidium bromide gels. The Rotor-Gene V4.6 software (Corbett Research)was used to determine the optimal cycle threshold from the dilution series,and the mean expression level and sds for each set of four replicates for eachcDNA were calculated.
ACKNOWLEDGMENTS
We thank Margie Pallotta for undertaking the mapping experiments;Keith Gatford for help with the preparation of plant material; and BrianAtwell, Tony Bacic, Peter Chandler, and Ed Newbigin for valuable advice.
Received September 4, 2003; returned for revision September 22, 2003;accepted October 8, 2003.
LITERATURE CITED
Arioli T, Peng L, Betzner AS, Burn J, Wittke W, Herth W, Camilleri C,Hofte H, Plazinski J, Birch R et al. (1998) Molecular analysis of cellulosebiosynthesis in Arabidopsis. Science 279: 717–720
Beeckman T, Przemeck GHK, Stamatiou G, Lau R, Terryn N, de Rycke R,Inze D, Berleth T (2002) Genetic complexity of cellulose synthase A genefunction in Arabidopsis embryogenesis. Plant Physiol 130: 1883–1893
Burn JE, Hocart CH, Birch RJ, Cork AC, Williamson RE (2002) Functionalanalysis of the cellulose synthase genes CesA1, CesA2, and CesA3 inArabidopsis. Plant Physiol 129: 797–807
Burton RA, Gibeaut DM, Bacic A, Findlay K, Roberts K, Hamilton A,Baulcombe DC, Fincher GB (2000) Virus-induced silencing of a plantcellulose synthase gene. Plant Cell 12: 691–705
Bustin SA (2000) Absolute quantification of mRNA using real-time reversetranscription polymerase chain reaction assays. J Mol Endocrinol 25:169–193
Cano-Delgado A, Penfield S, Smith C, Catley M, Bevan M (2003) Reducedcellulose synthesis invokes lignification and defense responses in Arabi-dopsis thaliana. Plant J 34: 351–362
Carpita NC (1996) Structure and biogenesis of the cell walls of grasses.Annu Rev Plant Physiol Plant Mol Biol 47: 445–476
Delmer DP (1999) Cellulose synthesis: exciting times for a difficult field.Annu Rev Plant Physiol Plant Mol Biol 50: 245–276
Desprez T, Vernhettes S, Fagard M, Refregier G, Desnos T, Aletti E, Py N,Pelletier S, Hofte H (2002) Resistance against herbicide isoxaben andcellulose deficiency caused by distinct mutations in same cellulose syn-thase isoform CESA6. Plant Physiol 128: 482–490
Dhugga KS (2001) Building the wall: genes and enzyme complexes forpolysaccharide synthases. Curr Opin Plant Biol 4: 488–493
Doblin MS, Kurek I, Jacob-Wilk D, Delmer DP (2002) Cellulose biosyn-thesis in plants: from genes to rosettes. Plant Cell Physiol 43: 1407–1420
Eckardt NA (2003) Cellulose synthesis takes the CesA train. Plant Cell 15:1685–1688
Fagard M, Desnos T, Desprez T, Goubet F, Refregier G, Mouille G,McCann M, Rayon C, Vernhettes S, Hofte H (2000) PROCUSTE1 en-codes a cellulose synthase required for normal cell elongation specificallyin roots and dark-grown hypocotyls of Arabidopsis. Plant Cell12:2409–2423
Fincher GB, Stone BA (1993) The physiology and biochemistry of germi-nation in barley. In AW MacGregor, R Bhatty, S Barley, eds, Chemistryand Technology. American Association of Cereal Chemists, St. Paul, MNpp 247–295
Fink L, Seeger W, Ermert L, Hanze J, Stahl U, Grimminger F, Kummer W,Bohle RM (1998) Real-time quantitative RT-PCR after laser-assisted cellpicking. Nat Med 4: 1329–1333
Gardiner JC, Taylor NG, Turner SR (2003) Control of cellulose synthasecomplex localization in developing xylem. Plant Cell 15: 1740–1748
Haendler B, Hofer-Warbinek R, Hofer E (1987) Complementary DNA forhuman T-cell cyclophilin. EMBO J 6: 947–950
Holland N, Holland D, Helentjaris T, Dhugga KS, Xoconostle-Cazares B,Delmer DP (2000) A comparative analysis of the plant cellulose synthase(CesA) gene family. Plant Physiol 123: 1313–1323
Islam AKMB, Shepherd KW, Sparrow DHB (1981) Isolation and charac-terization of euplasmic wheat-barley addition lines. Heredity 46: 161–174
Karakousis A, Gustafson JP, Chalmers KJ, Barr AR, Langridge P (2003) Aconsensus map of barley integrating SSR, RFLP and AFLP markers. AustJ Ag Res (in press)
Kimura S, Laosinchai W, Itoh T, Cui X, Linder CR, Brown RM Jr (1999)Immunogold labeling of rosette terminal cellulose-synthesizing com-plexes in the vascular plant Vigna angularis. Plant Cell 11: 2075–2085
Lai-Kee-Him J, Chanzy H, Muller M, Putaux JL, Imai T, Bulone V (2002)In vitro versus in vivo cellulose microfibrils from plant primary wallsynthases: structural differences. J Biol Chem 277: 36931–36939
Manly KF, Olson JM (1999) Overview of QTL mapping software andintroduction to Map Manager QT. Mammalian Genome 10: 327–334
Mueller SC, Brown RM Jr (1980) Evidence for an intramembranous com-ponent associated with a cellulose microfibril synthesizing complex inhigher plants. J Cell Biol 84: 315–326
Ozturk ZN, Talame V, Deyholos M, Michalowski CB, Galbraith DW,Gozukirmizi N, Tuberosa R, Bohnert HJ (2002) Monitoring large-scalechanges in transcript abundance in drought- and salt-stressed barley.Plant Mol Biol 48: 551–573
Pear JR, Kawagoe Y, Schreckengost WE, Delmer DP, Stalker DM (1996)Higher plants contain homologs of the bacterial celA genes encoding thecatalytic subunit of cellulose synthase. Proc Natl Acad Sci USA 93:12637–12642
Richmond TA, Somerville CR (2000) The cellulose synthase superfamily.Plant Physiol 124: 495–498
Roelofsen A (1958) Cell wall structure as related to surface growth. Acta BotNeerl 7: 77–89
Scheible W-R, Eshed R, Richmond T, Delmer D, Somerville C (2001)Modifications of cellulose synthase confer resistance to isoxaben andthiazolidinone herbicides in Arabidopsis ixr1 mutants. Proc Natl Acad SciUSA 98: 10079–10084
The Barley CesA Gene Family
Plant Physiol. Vol. 134, 2004 235 www.plant.org on January 28, 2016 - Published by www.plantphysiol.orgDownloaded from Copyright © 2004 American Society of Plant Biologists. All rights reserved.

Schunmann PHD, Smith RC, Lång V, Matthews PR, Chandler PM (1997)Expression of XET-related genes and its relation to elongation in leaves ofbarley (Hordeum vulgare L.). Plant Cell Environ 20: 1439–1450
Siebert PD, Chenchik A, Kellog DE, Lukyanov KA, Lukyanov SA (1995)An improved PCR method for walking in uncloned genomic DNA.Nucleic Acids Res 23: 1087–1088
Tanaka K, Murata K, Yamazaki M, Onosato K, Miyao A, Hirochika H(2003) Three distinct rice cellulose synthase catalytic subunit genes re-quired for cellulose synthesis in the secondary wall. Plant Physiol 133:73–83
Taylor NG, Howells RM, Huttly AK, Vickers K, Turner SR (2003) Inter-actions among three distinct CesA proteins essential for cellulose syn-thesis. Proc Natl Acad Sci USA 100: 1450–1455
Taylor NG, Laurie S, Turner SR (2000) Multiple cellulose synthesis catalyticsubunits are required for cellulose synthesis in Arabidopsis. Plant Cell 12:2529–2539
Taylor NG, Scheible WR, Cutler S, Somerville CR, Turner SR (1999) Theirregular xylem3 locus of Arabidopsis encodes a cellulose synthase re-quired for secondary cell wall synthesis. Plant Cell 11: 769–780
Thompson JD, Gibson TJ, Plewniak F, Jeanmougin F, Higgins DG (1997)The ClustalX windows interface: flexible strategies for multiple sequence
alignment aided by quality analysis tools. Nucleic Acids Res 25:4876–4882
Vandesompele J, De Preter K, Pattyn F, Poppe B, Van Roy N, De Paepe A,Speleman F (2002) Accurate normalization of real-time quantitative RT-PCR data by geometric averaging of multiple internal control genes.Genome Biol 3: 1–11
Vergara CE, Carpita NC (2001) �-d-Glycan synthases and the CesA genefamily: lessons to be learned from the mixed-linkage (133),(134)�-d-glucan synthase. Plant Mol Biol 47: 145–160
Wenzel CL, Williamson RE, Wasteneys GO (2000) Gibberellin-inducedchanges in growth anisotropy precede gibberellin-dependent changes incortical microtubule orientation in developing epidermal cells of barleyleaves: kinematic and cytological studies of a gibberellin-responsivedwarf mutant, M489. Plant Physiol 124: 813–822
Williamson RE, Burn JE, Hocart CH (2002) Towards the mechanism ofcellulose synthesis. Trends Plant Sci 7: 461–467
Wong LY, Belonogoff V, Boyd VL, Hunkapiller NM, Casey PM, Liew S-N,Lazaruk KD, Baumhueter S (2000) General method for HPLC purifica-tion and sequencing of selected dsDNA gene fragments from complexPCRs generated during gene expression profiling. BioTechniques 28:776–783
Burton et al.
236 Plant Physiol. Vol. 134, 2004 www.plant.org on January 28, 2016 - Published by www.plantphysiol.orgDownloaded from Copyright © 2004 American Society of Plant Biologists. All rights reserved.
Copyright © 2022 FDOKUMEN