THE CASE OF CARBON FIBRE - Research Explorer
238
The University of Manchester Research International Competitiveness in the Advanced Materials Sector: the case of carbon fibre Link to publication record in Manchester Research Explorer Citation for published version (APA): Russell, C. (1996). International Competitiveness in the Advanced Materials Sector: the case of carbon fibre. University of Manchester. Citing this paper Please note that where the full-text provided on Manchester Research Explorer is the Author Accepted Manuscript or Proof version this may differ from the final Published version. If citing, it is advised that you check and use the publisher's definitive version. General rights Copyright and moral rights for the publications made accessible in the Research Explorer are retained by the authors and/or other copyright owners and it is a condition of accessing publications that users recognise and abide by the legal requirements associated with these rights. Takedown policy If you believe that this document breaches copyright please refer to the University of Manchester’s Takedown Procedures [http://man.ac.uk/04Y6Bo] or contact [email protected] providing relevant details, so we can investigate your claim. Download date:27. Jun. 2022
-
Upload
khangminh22 -
Category
Documents
-
view
3 -
download
0
Transcript of THE CASE OF CARBON FIBRE - Research Explorer

The University of Manchester Research
International Competitiveness in the Advanced MaterialsSector: the case of carbon fibre
Link to publication record in Manchester Research Explorer
Citation for published version (APA):Russell, C. (1996). International Competitiveness in the Advanced Materials Sector: the case of carbon fibre.University of Manchester.
Citing this paperPlease note that where the full-text provided on Manchester Research Explorer is the Author Accepted Manuscriptor Proof version this may differ from the final Published version. If citing, it is advised that you check and use thepublisher's definitive version.
General rightsCopyright and moral rights for the publications made accessible in the Research Explorer are retained by theauthors and/or other copyright owners and it is a condition of accessing publications that users recognise andabide by the legal requirements associated with these rights.
Takedown policyIf you believe that this document breaches copyright please refer to the University of Manchester’s TakedownProcedures [http://man.ac.uk/04Y6Bo] or contact [email protected] providingrelevant details, so we can investigate your claim.
Download date:27. Jun. 2022

INTERNATIONAL COMPETITIVENESS IN THE ADVANCED MATERIALS
SECTOR:
THE CASE OF CARBON FIBRE
A thesis submitted to the University of Manchester for the degree of Ph.D.
in the Faculty of Science
1996
CELIA A. RUSSELL
PREST
(Policy Research in Engineering, Science & Technology)

2
TABLE OF CONTENTS
ABSTRACT ........................................................................................................................................................... 4
COPYRIGHT AND CITATION INFORMATION ............................................................................................... 6
ACKNOWLEDGEMENTS .................................................................................................................................... 7
THE AUTHOR ....................................................................................................................................................... 7
CHAPTER ONE: METHODOLOGY AND CONTEXT ....................................................................................... 9
Introduction ........................................................................................................................................................ 9
Structure of the Thesis .................................................................................................................................. 11
Methodology ................................................................................................................................................. 12
Context ............................................................................................................................................................. 13
Defining New Materials ................................................................................................................................... 17
The New Materials Industry ............................................................................................................................. 20
Background ................................................................................................................................................... 20
Research & Development ............................................................................................................................. 21
Patenting ....................................................................................................................................................... 22
Economies of Scale ...................................................................................................................................... 22
Mergers and Acquisitions ............................................................................................................................. 22
Supply and Demand in the New Materials Industry ..................................................................................... 24
CHAPTER TWO: THE NATURE AND USE OF CARBON FIBRE ................................................................. 26
Introduction ...................................................................................................................................................... 26
Technical Characteristics. ................................................................................................................................. 27
Process Characteristics ..................................................................................................................................... 32
Fibre Production ........................................................................................................................................... 32
Matrix Resins ................................................................................................................................................ 35
Carbon-Carbon Composites .......................................................................................................................... 36
Production of the Composite ........................................................................................................................ 36
Applications ...................................................................................................................................................... 38
Aerospace ..................................................................................................................................................... 41
Defence Aviation .......................................................................................................................................... 43
Space Structures ........................................................................................................................................... 45
Civil Aerospace ............................................................................................................................................ 46
Sports and Leisure ........................................................................................................................................ 51
Industrial ....................................................................................................................................................... 51
Other ............................................................................................................................................................. 52
CHAPTER THREE: THE CORPORATE CONTEXT ........................................................................................ 58
Part One: Japan ................................................................................................................................................ 58
Background ................................................................................................................................................... 58
Pre-war origins ............................................................................................................................................. 59

3
Post-war Change ........................................................................................................................................... 61
The Role of Government .............................................................................................................................. 63
Corporate Governance .................................................................................................................................. 65
Keiretsu Economics ...................................................................................................................................... 71
Summary ....................................................................................................................................................... 75
Part Two: The United States ............................................................................................................................. 76
Origins .......................................................................................................................................................... 76
Concentration of Wealth ............................................................................................................................... 77
The Role of Regulation ................................................................................................................................. 78
Ownership and Control ................................................................................................................................. 79
Due Process .................................................................................................................................................. 83
Conclusions ...................................................................................................................................................... 86
CHAPTER FOUR: “A PARAGON AMONG STRUCTURAL MATERIALS”: THE DEVELOPMENT OF
THE INDUSTRY IN THE COLD WAR YEARS ............................................................................................ 116
Part One: The Growth and Development of the Industry ............................................................................... 116
Pitch based carbon fibre.............................................................................................................................. 131
Part Two: Carbon Fibre Markets 1970-1989 .................................................................................................. 133
An Aside on Related Industries ...................................................................................................................... 137
Summary and Conclusions ............................................................................................................................. 143
CHAPTER FIVE: PROBLEMS AND POSSIBILITIES IN THE 1990’s .......................................................... 162
The Carbon Fibre Industry 1990-1995 ........................................................................................................... 162
The DoD Directive and its Consequences .................................................................................................. 164
The Defence Base; its Collapse and Consequences ........................................................................................ 179
The Technology Reinvestment Project ........................................................................................................... 191
The Role of Corporate Strategy ...................................................................................................................... 197
Analysis .......................................................................................................................................................... 204
Summary and Conclusions ............................................................................................................................. 211
CHAPTER SIX: CARBON FIBRE AND THE CONDITIONS FOR SURVIVAL IN THE ADVANCED
MATERIALS SECTOR ..................................................................................................................................... 233
APPENDIX I Company Profiles ........................................................................................................................ 233
APPENDIX II Interviewees ............................................................................................................................... 233
APPENDIX III Keiretsu Status .......................................................................................................................... 233
APPENDIX IV The End of the Cold War: a chronology ................................................................................... 233
BIBLIOGRAPHY .............................................................................................................................................. 233

4
ABSTRACT
Carbon fibre is the most commercially significant of the advanced materials, and its
development has been driven by both civil and defence interests. With the end of the Cold War,
demand from the defence sector virtually collapsed. The data presented in this thesis reveal the
consequent global restructuring of the industry. Over the five year period 1990-1995, European
market share fell over twenty percentage points, while that of Japan increased markedly.
Meanwhile, US production levels faltered and then recovered following government
intervention to stabilise this dual-use technology. This thesis examines the subsequent
international shift in the location and ownership of carbon fibre production capacity and the
variation in corporate response over this turbulent time. It is found that the national business
systems in which this particular high technology sector operates have played a fundamental role
in shaping the eventual competitive structure of the industry.

5
DECLARATION
I declare that no portion of the work referred to in the thesis has been submitted in support of an
application for another degree or qualification of this or any other university or other institute of
learning.

6
COPYRIGHT AND CITATION INFORMATION
(1) Copyright in text of this rests with in Author. Copies (by any process) either in full, or of
extracts, may be made only in accordance with instructions given by the Author and lodged in
the John Rylands University Library of Manchester. Details may be obtained from the Librarian.
This page must form part of any such copies made. Further copies (by any process) of copies
made in accordance with such instructions may not be made without the permission (in writing)
of the Author.
(2) The ownership of any intellectual property rights which may be described in this thesis is
vested in the University of Manchester, subject to any prior agreement to the contrary, and may
not be made available for use by third parties without the written permission of the University,
which will prescribe the terms and conditions of any such agreement.
Further information on the conditions under which disclosures and exploitation may take place
is available from the Executive Director of PREST.
Please cite this thesis as:
Russell, C. (1996) International Competitiveness in the Advanced Materials Sector: the case
of carbon fibre. Ph.D. thesis, University of Manchester.

7
ACKNOWLEDGEMENTS
I am indebted to my supervisor Professor Philip Gummett for all his help and encouragement
throughout the somewhat rocky course of this thesis, and am very happy to have this opportunity
to thank him very much. I would also like to express my gratitude to Professor Yoshiteru Takei,
who acted as my supervisor at Shizuoka University.
This thesis would not have been possible without the kind help of all the interviewees. In
particular, I would like to thank Akitaka Kikuchi for sending updates on the industry, and
Charles Toyer for posting up all the business intelligence reports. Many thanks, too, to William
Forbes for his econometric advice, and to Charles Erin for his help in pulling the presentation
together.
Financial support was provided by the SERC, the Eramus Programme and The Japan
Foundation.
Celia Russell, October, 1996
THE AUTHOR
Celia Russell holds an honours degree in Physics from the University of Oxford and a Masters
Degree in Nuclear and Elementary Particle Physics from the University of London. She
subsequently worked at the National Physical Laboratory in the area of radiation science and,
concurrent with this, undertook a number of secondments in Whitehall working on R&D
management within the electronics industry. Following this experience, the author obtained a
Masters Degree in Technical Change and Industrial Strategy at the University of Manchester,
where she has continued to study for the degree of Doctor of Philosophy.

8
For
Robert Heanue, Elisabeth Cardew and Louis Collingwood

9
CHAPTER ONE:
METHODOLOGY AND CONTEXT
Introduction
For advanced nations, technological competitiveness is a key industrial objective and a
significant determinant of economic growth. This thesis examines some of the influences
that constrain and stimulate technological competitiveness at an international level, in
particular those relating to the ownership and location of a high technology sector. These
influences will be explored through a case study of a particular high technology sector,
namely, advanced materials, a global business in which international patterns of trade reflect
well the technological competencies of the individual nations.
Advanced materials are of particular interest to industrial strategists, economists and policy
makers, not least on account of their potential impact across a wide range of future industries
(as highlighted by Kodama)1 and the long time scales involved in their development. They
are perceived as an enabling or generic technology, i.e., one that underpins many other
manufacturing technology sectors, most particularly the defence, aerospace, electronics,
energy, construction, automotive, healthcare and machine tool industries. These sectors in
turn are all high ranking in terms of economic performance and, in the case of defence,
aerospace, electronics and energy, are also of considerable strategic interest.2
It is therefore not surprising that the new materials sector has spawned a wealth of
government initiatives and programmes. The OECD publication Advanced Materials:
Policies and Technological Challenges3 details the national advanced materials policies of
eighteen countries, who collectively spend well over a billion dollars in government funds
annually on support for the advanced material sector. Despite this enormous investment of
money and effort, and the suggestions in the literature of possible national production
capability trends, the data, if it exists at all, is extremely patchy. Consequently, there is a
striking absence of robust time series data on actual production capabilities. For example,
neither the OECD monograph cited above, nor the UK Collyear report4 contain such data,
while, astonishingly, even the US Department of Commerce report A Competitive Assessment
10
of Selected Reinforced Composite Fibres5 is only able to give concrete data for one country,
that of the US itself. The lack of quantitative information has been noted by the US DoD
which commented in 1996,
“The competitive standing of the US industry is difficult to pin down because
there is very little trade data available for carbon fibre.”6
Of the advanced materials, carbon fibre is by far the most commercially significant. The
purpose of this research therefore is to gather production capacity figures for all the major
carbon fibre producers outside the former Soviet Union (FSU). This is then organised by
geographical region and ownership over time, to test if national production capacity trends
actually exist. It may seem odd that this sort of fundamental data has not already undergone
collection but, as we see below, there are many barriers to accurate data acquisition in this
particular sector. Carbon fibre produced in the FSU has not, until very recently, been traded
on the world markets. Japan, the United States and Western Europe collectively account for
97% of global carbon fibre production (outside the FSU),7and are therefore the focus of this
research.
The primary data collected in this thesis reveal that there has been an international shift in the
global production of carbon fibre. Post 1990, the industry underwent a number of
expansions, closures and acquisitions, a restructuring precipitated by a sharp and unexpected
fall in demand from the defence sector. Production and consumption data were collected
from the individual producer firms and the other sources cited below. These are then
organised by geographical location and ownership to reveal a pattern of shifting control and
ownership. Japanese firms, it will be shown, took advantage of the difficult market
conditions to markedly increase their market share, largely, as we shall see, at the expense of
European producers. The market share of US firms first faltered over the period 1990-1993,
then recovered as Congress intervened to maintain national competitiveness in this strategic
material. Thus, the data collected does reveal significant cross regional variation. The
possible underlying causes for this then become the focus of the thesis. Industry respondents
questioned during the course of the research cited two explanatory factors as to the regional
variations in competitiveness, namely, corporate governance and defence-civil interactions.

11
There is an extensive literature on international competitiveness, dating back to the work of
Adam Smith and David Ricardo. Within the neo-classical economics paradigm,
competitiveness is driven by comparative advantage (in labour costs or the availability of
natural resources, for example) and macroeconomic variables such as levels of savings and
investment. Porter has refined these arguments in his study The Competitive Advantage of
Nations,8 uncovering additional contributing factors such as the presence or otherwise of
related industries. Porter’s work is essentially a very thorough reductionist analysis. By
contrast, Whitley9 and others argue that business systems are culturally specific and it is these
broader and more complex factors that most profoundly affect industrial development.
Carbon fibre is a dual use technology and the military has played a fundamental role in its
industrial development. Kaldor10
has, famously, argued that the complexity and cost of
weapon systems hinders diversification or creates similarly “baroque” civilian technologies in
which high performance is pursued at uncompetitive marginal costs. Authors such as Reppy
and Gummett11
stress the specific organisational features of the defence sector which act as
barriers to diffusion. All the arguments cited above are re-examined in the light of the data
gathered over the course of this research, including the micro-economic financial ratios for
the individual carbon fibre producing firms which are presented along with the production
capacities in Chapter Five.
Structure of the Thesis
The first part of the thesis is drawn from the current literature, Firstly, in this chapter we
examine the new materials industry as a whole, defining the technology and highlighting the
characteristics of the sector. In Chapter Two, we look at the technology characteristics of
carbon fibre itself, and its major applications. We will then set the scene for the second part
of the thesis by comparing the industrial and financial structures of the major carbon fibre
producing regions.
The second part of the thesis is largely based on the information gathered during the course of
this research. Before turning to the post-1990 activities of the industry, we first present in
Chapter Four a history of the development of the carbon fibre technology, production and
markets from its inception in the 1960’s, through to its early commercialisation, and finally
the period of explosive growth in the industry throughout the 1970’s and 80’s.

12
Chapter Five collates much of the individual company data concerning the period 1990-1995.
By organising the capacity figures by country, the Tables reveal international shifts in the
ownership of production. How and why these shifts occurred then becomes the focus of the
chapter. The corporate finance and accounting practices of the producing firms are explored
in some detail, as is the military context of the time. Finally, we draw these threads together
in the concluding chapter.
Methodology
It is appropriate here to make some brief comments on the methodology of the research and
the sources utilised. It is worth noting that there is very little published data regarding the
production, shipments, uses, imports and exports of carbon fibre, partly as it is a relatively
new industry, but largely due to the proprietary nature of its manufacture. Individual
company production, capacity and end use data are virtually non-existent as the companies
regard much of the data concerning carbon fibre as company confidential and figures are
often reported in basket categories such as speciality chemicals or performance materials.
Hence the bulk of the company information presented here was collected over an 18 month
field based study. Concurrently with this ran a secondary source search. Trade press and
business intelligence reports were used to identify the key players and build up a preliminary
picture of the development of the industry. The Japanese trade journal Kagaku Kogyo
Nippou publishes industry estimates on market conditions each June, and the English
language Japan Chemical Week reports the activities of the Japanese producers. The business
intelligence journal Performance Materials provides many snippets of information on the US
scene, whilst trade journals such as Chemical and Engineering News have occasional articles
surveying the composite and carbon fibre industry as a whole. Flight International, Aviation
Week and Space Technology and similar publications also provide information concerning
composites within the context of the aerospace and defence sectors.
Primary data was collected by contacting the firms directly. For those firms in the UK,
France and Japan, an interview was requested. Six months of the research time was spent in
Japan at Shizuoka University and three months in Paris, based at the Ecole des Mines.
Although it was not practicable to go to the US within the time limits and financial restraints

13
of the research, all the US carbon fibre producers were questioned in writing about their
carbon fibre operations. The interviews themselves were semi-structured and lasted around
one or two hours. Three of the firms, Toho Rayon, Asahi Kasei and Mitsubishi Rayon, also
permitted shopfloor access, enabling the manufacturing processes employed to be seen at first
hand. The interviewees were questioned on technical and commercial aspects of carbon fibre
production, market histories, end-uses and production forecasts.
In all, during the course of the research, around 20 people were interviewed. The majority of
the interviewees were managers and directors from industry. This information was further
supplemented by industry observers, academics, government officials and other
commentators including the trade associations SACMA (Suppliers of Advanced Composite
Materials Association) and the AIA (the Aerospace Industries Association), who were
particularly helpful in providing data concerning defence consumptions.
All the firms responded at least in part, with the exception of BASF, who replied that even
the most basic information requested concerning production capacities was “proprietary to
BASF and cannot be revealed”.12
Inevitably, then, there is some unevenness within the data
collected between companies and there are occasional discrepancies between sources
concerning production and consumption.
Context
The introduction of a new material is often considered a radical rather than an incremental
innovation in that it may involve the re-definition of the entire architecture of an existing
product, or even the creation of a whole new set of markets. The usage of an advanced
material will often rely on concepts based on new or relatively untried engineering and
scientific principles. These factors often act as barriers to the substitution of traditional
materials, barriers that are further reinforced by the traditional reluctance of producers to
invest in manufacturing capacity until a market is developed, and conversely, the reluctance
of potential users to adopt a new material until supplies are assured and economies of scale
reduce costs.13

14
Government support for new material development is widespread across the G7 countries.14
After the second oil shock and the subsequent increases in energy costs and the price of raw
materials, the economic downswing focused policy making on the issue of long term growth
and economic sustainability. Concurrently, a consensus emerged that technical innovation
per se was central to ensuring long term competitiveness, and technology policy gained an
increasing role in economic policy planning. Against this background, the G7 nations as a
whole were moving toward the development of an R&D intensive, higher value added
manufacturing sector, which in turn required constituent materials in possession of a greater
sophistication of content.
Governments generally cite a number of reasons to justify their support of advanced
materials. Often central to the argument is the role played by advanced materials in
stimulating innovation in downstream industries, or, conversely, the lack of an advanced
materials base as a possible obstacle to the development of future technological systems. The
considerable externalities of advanced materials are also highlighted. These may be direct,
when, for example, the introduction of a new material reduces energy consumption or
improve safety in automobiles, or indirect in that the wealth creation derived from new
materials is generated mainly in the value they add to other industrial sectors. As the UK
Foresight report noted,
"In the UK, as with all advanced industrial countries, new and improved
materials underpin the competitiveness of most industries, including automotive,
aerospace, construction, electronic, and health care because they are critical to
most manufacturing processes. Substantial, well targeted investment in materials
research and in its application ... will therefore leverage UK manufacturing to
compete successfully in the world markets of the future."15
The long time scales involved in bringing a material to market and the difficulties noted
above in the establishment of volume production have all contributed toward the rationale for
government intervention. There is typically a period of ten years or more between the
conception of a new material and its full exploitation in the marketplace. Hence considerable
sunk investment is required over a sustained period of time. By way of illustration, as the
1990 DTI High Level Mission to Japan noted, over 80% of new ventures involving new

15
materials technologies were actually unprofitable at the time of the visit.16
Often, it is
believed that progress in materials development would be too slow or even non-existent
without substantial government assistance. In particular, in countries without the impetus of
ambitious space or defence programmes (such as Germany), direct government support of
new materials programmes is seen as necessary to maintain overall manufacturing
competitiveness, particularly with respect to R&D.17
The Japanese government has demonstrated a sustained interest in advanced materials, not
least on account of the lack of indigenous mineral resources. Advanced materials were
identified as an industry of the future in the first guidelines issued by the Science and
Technology Agency, and along with biotechnology and electronics subsequently under a
programme of long term support through MITI's jisedai (Future Industries Programme).
Composite materials was one of the six major branches of this new materials research.18
Similarly the French materials mission report of 1983, precipitated the five year materials
mobilisation programme (IDMAT)19
and in 1986 the EC launched EURAM (European
research on Advanced Materials), a programme designed to generate a viable pan-European
new materials production capacity.20
In the UK, the Collyear Committee submitted its report of 1985 recommending a £180
million programme of support of advanced materials research and development in the UK.21
In the event, however, the findings of the report were largely ignored and government
expenditure on the technology areas recommended by Collyear barely totalled £20 million.22
New materials were again identified as a technology of 'crucial importance' by the UK
Technology Foresight initiative in 1995.23
The reports recommends considerable increases in
EPSRC (Engineering and Physical Sciences Research Council) funding for materials
research, which stood at £60 million at the time, and a review of the EPSRC portfolio, with
greater emphasis of the further development of existing materials and processes. The report
further suggests a system of Government supported partnership systems to be initiated by the
DTI, MoD and research councils to encourage R&D collaboration between the public and
private sectors, and that a new LINK/Foresight scheme be instigated, increasing UK gross
expenditure on research and development spending by 5% pa until the year 2000.24

16
Aside from economic concerns, military interests have been fundamental in the government
sponsorship of materials research, development and production. The implementation of
measures set up to ensure the necessary supply of key materials and to mobilise industry for
their production is not new. During the Second World War, the United States authorities
established a stockpile for strategic materials (those possessing a unique importance in the
manufacture of defence munitions) and critical materials (meaning those imported from
countries with potentially unstable regimes).25
Up until the start of the 1970’s, US materials
and mineral legislation was simply designed to ensure the physical existence of stockpiles of
vulnerable metals and minerals essential for munitions production. Advanced materials were
not recognised as such, nor any need for additional policies.
After the oil shocks, however, achieving self sufficiency with regard to strategic resources
became an increasingly important objective. By the time of the Reagan Administration, the
US was importing $1 billion worth of strategic materials each year,26
and gradually a new
debate emerged calling for a reduction in dependency on the import of raw materials through
improvements in the domestic production base and the development of new materials to
substitute for critical materials both in their military and non-defence applications. Examples
most commonly cited in the literature of the time include cobalt, which was essential for the
production of high temperature alloys for jet engines and gas turbines but for which the
predominant producer was Zaire, and chromium and manganese, both produced in South
Africa and both used in the production of stainless steel.27
It was strongly argued that it was neither necessary nor economically sound for the
government to increase the existing stockpiles. Instead, the argument ran, the Administration
should increase R&D on alternative materials that may both improve performance and lower
manufacturing costs.28
This debate culminated in the passing by Congress of the Stevenson-
Wydler Technology Diffusion Act and the National Critical Materials Act of 1984. The
former sought in part to improve the industrial manufacture of new materials through the
transfer of innovations to the private sector and the latter legislated the creation of an
umbrella organisation, the Critical Materials Council which co-ordinated the advanced
material R&D efforts of both defence and non-defence departments.29
Gradually, then, the
earlier concepts of stockpiling exclusively for military purposes were realigned into new
policies of maintaining defence capabilities through the promotion of materials

17
competitiveness as a whole, a policy change further accelerated by the end of the Cold War.
This notion was to be expressed explicitly by the introduction of the Technology
Reinvestment Project.
Before turning specifically to carbon fibre itself, we will now briefly survey the new
materials sector as a whole, first examining some of the characteristics of advanced materials,
then presenting a general survey of the industry.
Defining New Materials
There is no rigid definition of an advanced material. However, we can say that advanced
materials generally share the following characteristics:—
1. Advanced materials demonstrate an improved performance. Greater strength, or
increased operating temperature are typical examples.
2. Advanced materials are highly knowledge intensive. The number of employees
working in design related jobs is high compared to the numbers working in production. Due
to the inter-disciplinary nature of research in advanced materials and the extended time scale
involved (15 - 20 years), advanced materials R&D is often expensive. Furthermore, the
introduction of a new material may require specialised and expensive equipment and costly
testing and certification procedures.30
3. The design of advanced materials is largely concerned with the atomic structure. This
trend has been accelerated by the widespread use of electron microscopy and the rapid
growth in computing capacity. The reliance on microscopic characteristics has entailed the
development of many new manufacturing processes. Such processes include sol gel
chemistry in which a metal is mixed into an organic compound, allowing low temperature
processing to create atomic structures that could never have been produced using high
temperature methods. Molecular beam epitaxy and ion implantation are examples of
techniques that actually build materials atom by atom. To produce materials in bulk, methods
such as chemical vapour deposition and plasma deposition are employed. Advanced
materials require a great deal of purifying, characterisation and testing. This often adds
considerably to their cost. In the case of liquid crystals, for example, processing costs are the
major constituent cost of the final material. Unlike many traditional materials, processing is
central to the nature of the final product: for example, composites made from identical fibres

18
and matrices, but under different manufacturing conditions exhibit very different physical
properties.31
4. Advanced materials show an increased integration of parts and function, resulting
in a reduced number of parts in the final product. For instance, the use of carbon fibre
composite in the vertical fin of the Airbus A310-300 reduced the number of components
needed from over 2000 to 100, and eliminated all the rivets.32
Such use of composites often
results in a reduction of cost. The percentage structural weight of composites in the US
Navy's new F/A-18E/F fighter/attack aircraft will be twice that of the current F/A-18C/D.
This will allow Northorp to drop 20% of the frames used in the C/D version and cut the
number of fasteners required by 8000.33
5. Although there is an increasing body of knowledge regarding the relationships
between atomic structure and bulk capabilities, advanced materials are, more often than not,
developed experimentally. The theoretical understanding of the properties of the materials is
usually an ex post acquisition. Since the development is empirical rather than based on
scientific principles, the patenting of advanced materials is effective and the propensity to
patent is high when compared to other high technology areas such as biotechnology or
optoelectronics. First comers are further protected as a consequence of the close links
established between the producers and users of a advanced material.
6. The raw materials used to make advanced materials, which include silicon,
aluminium, oxygen and nitrogen, are usually cheap and widely available. At the same time,
they allow for the substitution of strategic materials.
7. The emergence of new constellations of producers and users is yet another feature
associated with many advanced materials. Whereas previously a new product was designed
according to the properties and behaviour of existing materials, it is now possible to design a
material according to the desired features of the final product. In other words, the material is
no longer an exogenous variable beyond the control of the user, but one that can be modified
according to their needs. Hence increasingly, the material, production and final product are
designed and optimised as a system. Moreover, advanced materials often entail a closer
integration of manufacturing processes. For example, injection moulding of reinforced
plastics involves the simultaneous production of both the final material and the part. Clearly,
for this to happen, a high level of co-operation between material supplier, equipment
producers and users must exist and often this results in the major players seeking to integrate
vertically.34

19
8. As it is now more possible to tailor each material for a specific application, the
advanced materials market is highly segmented. Whereas previously a single material was
utilised for many applications, now there exists an unprecedented variety of available
materials.
9. Finally, advanced materials share the characteristic of a rapid rate of technological
development and, although they possess relatively limited markets, they demonstrate a rapid
global market growth.35
Materials are classified into two types: functional (or primary) and structural (or
secondary).36
Functional materials are those that possess a physical phenomenon essential
for a product to operate and often constitute the active heart of the device. Examples might
include the piezoelectric ceramics used in pressure sensors, or liquid crystals, or the optically
active crystals found in optoelectronic devices. Functional materials are not easily
substituted, for without the material, there is usually no device. Conversely, the development
of a new functional material often leads to the creation of radical new products. Functional
materials generally command high prices, but only low volume markets.
Structural materials typically form the bulk of a product. They transmit forces, or act as
supports, or serve to contain the functional elements, protecting them from shock or
environmental attack. Usually, secondary materials are incorporated into existing products
after demonstrating an improved performance or lower cost. Rarely does their development
lead to the introduction of entirely new devices. Steam engines, for instance, were developed
before high strength steels, and aeroplanes predate aluminium alloys. In short, the product
typically precedes the material. There are many secondary materials capable of performing
similar functions, and they are considered to be readily interchangeable. Examples of
structural materials include wood, steel and cement.
Structural materials may be further categorised as either ceramics, metals or polymers.
Each of these classes has its own particular advantages and drawbacks. Ceramics are hard,
with high service temperatures, but can catastrophically fail under stress. Metals are strong
and tough, but also heavy and reactive. Polymers are light, but restricted to low temperature
operation. Ceramics, metals and polymers can be combined to form hybrid materials known
as composites. Often a composite can be designed to eliminate the undesirable properties of

20
its component materials and combine their advantages. Hence polymers reinforced with
ceramic or organic fibres are light, strong and reliable. The most common composites type
consists of short fibres of one material embedded in a matrix of a second. It is the matrix
phase that denotes the composite type; viz. metal matrix composites, ceramic matrix
composites and polymer matrix composites.
The New Materials Industry
Background
The production of new materials is a global business. Trade is shared on a more or less equal
basis between the three major economic blocs of Europe, the US and Japan. An international
division of labour does exist, however, in that each bloc is steadily developing markets and
expertise in specific areas of the industry.
Europe, despite being a net importer of new materials as a whole, is very competitive in
advanced plastics through its traditionally strong base of chemical and plastics companies.
Hoechst, Bayer and BASF all rank among the world's top five suppliers. Japan, on the other
hand, has a relatively weak chemicals industry and ranks third behind Europe in the
production of advanced plastics.37
Nevertheless, Japan has set the development of a new
materials industry as a principal industrial objective, not least due to Japan's almost total
reliance on imports for raw materials. Four particular areas have been highlighted: fine
ceramics, carbon fibres, engineering plastics and amorphous metals. The special emphasis on
ceramics reflects the general confidence in Japan that the technical problems associated with
these materials can be overcome. As a result, Japan has established a commanding lead in
the production of advanced ceramics. In the largest ceramic markets, IC packaging, Kyocera
alone fulfil 75% of world demand, and other Japanese companies serve most of the
remainder.38
The US is strong in virtually all areas of new materials production. According to STI,39
the
US is a major producer of both engineering plastics and ceramics. However, it is in the field
of advanced composites that the US predominates, largely as a result of its extensive defence
and aerospace activity. The US is particularly noted for its expertise in the design and
application of composites, and, through Du Pont, is the only significant producer of aramid
fibre.

21
The advanced materials industry is structured in a manner similar to other high technology
industries: a comparatively stable group of major companies predominate, although there is
room for a much larger number of specialised firms. In the case of advanced materials, the
major players are all large diversified companies. Considerable barriers to entry exist and,
although at present there is a high supplier-to-customer ratio in the sector, this situation is
expected to reverse as industrial applications are established.
The market share of the established actors is protected by the high costs of R&D, assembling
the necessary skill base and the high capital costs of new plant. The relatively high level of
user-manufacturer interaction in new materials provides yet another barrier to entry for late
entrants. Additionally, producers seek to protect their market share through scale economies,
patenting, mergers and acquisition. We now examine each of these elements in more detail
below.
Research & Development
Technological competitiveness is core strategy for growth and survival in the new materials
industry. Unlike many other innovative sectors, however, several years may pass from the
inception of a new material, through its design, early production and arrival in the market
place, until significant economic returns are gained. The long lead times and high technical
risk mean that despite the good innovation record of the small companies in the new
materials sector, the substantial majority of technical developments, whether measured in
terms of patenting, new process innovations or new products brought to the market, are
realised by the big firms.
Aside from the problem of actual R&D, the creation of a market for a new material is often a
lengthy and costly process. Major users are unwilling to adopt a new material until assured
supplies exist, whilst producers of new materials are understandably reluctant to invest in a
production capacity until a viable market has developed. Additionally, new materials are
essentially capital goods, sold to other industrial sectors, who must in turn risk investment in
their adoption. For instance, the incorporation of a new composite or ceramic component
into a car may require a radical reshaping of the automotive production line, as well as the
cost of retraining on the shop floor and acquiring a new design expertise. If the new material

22
is to be integrated into a large technological system (a telecommunications network, for
example) the lead time may be as long as ten to fifteen years. This is clearly well beyond the
time horizon of a small company.
Patenting
It follows that only large companies have the resources to undertake most new material R&D
and create a viable market share. Hence the development of new materials technology, by
and large, takes place in big firms. These companies then seek to protect their intellectual
property through patenting. Patenting is reasonably effective in that the development of a
new material is in general an empirical process. In the case of a structural material, however,
patenting rarely results in an effective monopoly, as there is such broad scope for substitution
by a material of similar properties. Furthermore, chemical companies have traditionally been
wary of publishing information concerning R&D in any form, even that required for a patent.
Often a company will patent only the chemical composition of a new compound, but not the
details of the temperature, pressure and other critical processing conditions under which it
was produced and which bestowed the unique properties for which the material is valued.40
Economies of Scale
Increasingly, volume production is the norm for most new materials. Large scale production
currently accounts for about 90% by volume of all new material manufacture. However,
some specialised technologies are produced only to individual orders (e.g. cermets, which are
very hard and extremely difficult to work). This specialised production is of comparatively
high value, accounting for 20-22% by value of the total market.
This continuing economic importance means that large firms will remain attracted to certain
areas of specialised production, in spite of the drop in volume. However, small innovative
companies with a specialist new skill or research expertise can flourish in certain niche
markets. In particular, ceramics and some areas of the composite industry are very
fragmented with many opportunities for smaller firms to break in.
Mergers and Acquisitions
Small firms that appear to be increasing market share, or hold valuable patents, often become
take-over targets for larger predators seeking access to a particular technology base. Farrands

23
has cited the specialised expertise of the workforce of a firm as one of the most effective
barriers to entry, arguing that,
“Knowledge of some of the more important technological innovations is often
unique ... associated with that particular combination of machinery, human skills,
design expertise, management and marketing which is distinctive to each
company.”41
Acquisition is also a method of accessing overseas markets. When BP acquired the US firm
Hitco, its composites sales increased tenfold.42
There was a rising stream of take-overs in the
new materials sector during the late 1980s. In advanced plastics, 16 cross frontier
acquisitions were recorded in Europe in 1988, and 23 in 1989. Similarly, even in the
ceramics industry where joint ventures are a popular strategy, there were 11 European take-
overs in 1987, 12 in 1988 and 17 in 1989.43
The steady rate at which take-overs have
occurred, despite the collapse of the stock market in 1987, suggests that although clearly
financial motives play a part, technological objectives remain a major determinant.
It is rare in manufacturing industries for a single company to be active in every processing
step from the manufacture of the basic material to the production of the finished part.
Traditional materials are bought 'off the shelf', affording the product manufacturers little
opportunity of influencing the design of the materials themselves. In the case of advanced
materials, however, both the material and the part may be produced in a single processing
step. Furthermore, there is enormous scope for product designers to specify exactly the
materials required. Often, a new product and material are developed simultaneously, with the
materials manufacturers and their customers working hand-in-glove. Hence the design and
manufacture of new materials is necessarily unified into a single integrated process. Joint
ventures are also undertaken to pool complementary skills, as is common with many
emergent technologies. There is an imperative, then, for collaborative ventures and, indeed,
the advanced materials industry has spawned a growing global network of co-operative
research agreements, mergers, licensing arrangements and other joint ventures.

24
Supply and Demand in the New Materials Industry
Growth rate estimates are dependent on several technical and external economic factors. An
unforeseen process innovation could cause the price of a particular new material to fall
dramatically. Changes in the fortunes of complementary or competing technologies will also
affect the growth rate. A rise in metal prices, for example, would accelerate the new material
demand. Similarly, a rise in oil prices would cause a switch from plastics and polymers to
advanced metals and composites, whilst a world recession would slow the adoption of new
materials as a whole.
New materials production suffers long lead times, and, like the chemicals industry as a
whole, follows cyclical patterns of growth and recession. Periods of rapid growth for the
industry are followed by crises of overcapacity. This in turn leads to price falls which then
accelerate substitution rates and regenerate the industry later in the business cycle.
Engineering plastics, especially thermoplastics, which are produced in large volume by major
chemical companies, are particularly vulnerable to protracted periods of overcapacity. The
ceramics industry, on the other hand, is far less concentrated and far more small scale. The
smaller ceramic firms would be unable to sustain losses over a prolonged period and would
leave quickly, or would be taken over, if surpluses develop. Hence, any overcapacity in this
sector, if it develops at all, would be only temporary. The composites industry is seeing
increasing scales of production. Composites are now considered a proven technology in
many areas of application and there are few technical barriers to bringing new plant on
stream. The late 1980’s saw a substantial surge in capacity in the polymer composites sector,
followed by severe surpluses in the early 1990’s as defence aerospace applications peaked in
demand. The consequent industry shakeout and the eventual resurgence of demand is the
central topic of this thesis.
References
1 Kodama, Fukio, Advances in New Materials are Crucial to Breakthroughs in other Technologies,
Japan Economic Journal, November 25th, 1989 2 Office of Science and Technology, Cabinet Office, Final Report of the Materials Panel, (Panel
Report 10 in a series of 15), The Technology Foresight Programme London, HMSO, 1995 3 OECD, Advanced Materials: Policies and Technological Change, OECD, Paris, 1990
4 A Programme for the Wider Application of New and Improved Materials and Processes (NIMP)
The Report of the Collyear Committee, HMSO, 1985

25
5 US Department of Commerce A Competitive Assessment of Selected Reinforced Composite Fibres,
September, 1985 6 US Department of Defense, Advanced Materials Technology and Industrial Base: An Analysis and
Assessment of Speciality Metals and Advanced Composites, January, 1996 7 ibid.
8 Porter, Michael, The Competitive Advantage of Nations, Macmillan, 1990
9 See, for example, Richard Whitley, Business Systems in East Asia, Sage, 1992
10 Kaldor, Mary The Baroque Arsenal André Deutsch, 1982
11 See, for example, The Relations between Defence and Civil Technologies, Edited by Philip Gummet
and Judith Reppy, Kluwer Academic, 1987 12
Letter from R.W. Murphy, General Manager, BASF Structural Materials, March 9th, 1993 13
Clark, Joel, P. And Flemings, Merton, C., Advanced Materials and the Economy, Scientific
American, October 1986 14
OECD, op.cit,3 15
Office of Science and Technology, op.cit, 2 16
Report by the High Level Mission on Advanced Materials Applications, Advanced. Materials: The
Japanese Strategy for the 1990’s, Department of Trade and Industry, London, 1990 17
See for example, OECD, Advanced Materials: Policies and Technological Challenges, OECD,
Paris, 1990. 18
Sigurdson, J and Anderson, Alun M., Science and Technology in Japan, Appendix IV, Second
edition, Longman, 1991 19
OECD, 1990, op.cit.,3 20
OECD, 1990, op. cit.,3 21
The Report of the Collyear Committee, op.cit,4 22
Office of Science and Technology, op.cit, 2 23
ibid. 24
ibid. 25
For a discussion of critical and strategic materials see Forester, Tom, Ed The Materials Revolution,
Blackwell, 1988 26
Clark, Joel, P, and Field, Frank R., ‘How Critical are Critical Materials?’ In Forester, Tom,
op.cit.25 27
ibid. 28
OECD, op.cit., 3 29
Advanced Materials By Design, US Office of Technology Assessment, Washington D.C. 1988 30
Office of Science and Technology, Cabinet Office, Final Report of the Materials Panel, (Panel
Report 10 in a series of 15), The Technology Foresight Programme London, HMSO, 1995 31
Eager, Thomas W., ‘The Real Challenge in Materials Engineering’ in Forester, Tom, Ed, op.cit.,25 32
Theulon, H., High Technology Materials, Recent Materials, STI Review, OECD December 1989 33
Aviation Week and Space Technology, May 24th 1993 34
Gregory, G. 'New Materials Technology in Japan' in Forester, T., Ed. op.cit.,25 35
Brendan Barker, note to author, 1990 36
Office of Science and Technology, op.cit.,2 37
Theulon, H., op.cit.,32 38
Gregory, G, op.cit.,34 39
Theulon, op.cit., 32 40
Farrands, C. New Materials in Manufacturing Industry The Economist Intelligence Unit, Special
Report 2026, 1990 41
ibid. 42
Cashing in on Composites, The Financial Times July 9 1987 43
Farrands, C., op.cit., 40

CHAPTER TWO:
THE NATURE AND USE OF CARBON FIBRE
Introduction
In this chapter we consider the technical aspects of carbon fibre, and examine the major
applications. A composite material, as we saw in Chapter One is made by combining two or
more materials to produce a new material with new capabilities. Generally, a composite
consists of a polymer matrix in which short or continuous fibres are embedded. The fibres
act to strengthen and stiffen the composite whilst the matrix serves to align the fibres, bond
them together and distribute the load.
Advanced composites are distinguished from reinforced plastics chiefly by their superior
mechanical properties (usually strength and stiffness) and high concentration of fibre (50-
60%). The potential use of carbon fibre reinforced composite (CFRC) as a structural material
has been recognised for more than thirty years. Originally developed for the military sector,
over 80% of all CFRCs are now used in civil applications. However, CFRCs are relatively
expensive and remain restricted to high value added applications in which the advantages of
high performance offset the high cost. Worldwide, aerospace applications account for about
fifth of the current market and sporting goods over half. Industrial applications account for
most of the remainder.1
Carbon fibre is commercially produced as either a continuous filament yarn, or tow, as a
woven fabric, or as a discontinuous mat or felt. It is then combined with a matrix, usually a
synthetic resin or polymer, to produce a composite. Carbon fibre acts as the reinforcer in the
composite, giving the required strength and stiffness. Carbon fibre is often traded as
prepreg, an intermediate form, usually a tape or woven mat that has been preimpregnated
with a thermoset resin and partially cured.
Carbon fibres are manufactured by the pyrolysis (chemical decomposition by heat) and
stretching of organic precursors, namely rayon, polyacrylonitrile (PAN) or pitch. The
resulting fibres are classified according to the original precursor. The earliest carbon fibres
were based on rayon, but PAN derived fibre was found to possess a far greater tensile
strength and has largely dominated the dramatic growth of the industry during the 1970’s and
27
1980’s. Currently, around 95% of carbon fibre structures are made from PAN based carbon
fibre.2 Pitch based fibres come in two grades. 'General purpose' pitch based fibre is
comparatively cheap and is used in applications such as packing and insulation. In contrast,
'high performance' pitch based fibre (a relatively recent product) is very expensive. This type
of fibre has demonstrated exceedingly high moduli and thermal conductivities and is
expected to be used extensively in spacecraft and critical military applications.
Technical Characteristics.
Chief among the advantages of carbon fibre is high tensile strength. Carbon fibre is also
light (with a density of around 1.5 grams per cubic centimetre), and the consequent high
strength to weight ratio has been central in its success as a major structural material in the
transport and aerospace industries.3
A third key characteristic is that of stiffness, which is measured in terms of the modulus (the
ratio of a given stress to the resultant strain) of a material. This combination of properties
make carbon fibre particularly suitable for the manufacture of sporting goods such as tennis
rackets, golf club shafts, rowing eight shells, ski poles and racing car bodies.
There is a linear relationship between the tensile strength and modulus of the carbon fibre and
those of the final composite. The improvement of tensile strength with time is shown in
Figure 2.1.
At present, the tensile strength of commercial fibre is about 7 Giga-Pascals (GPa), which is
only around 4% of the theoretical value. This is because carbon fibre is essentially a brittle
material and its strength is greatly affected by defects in the microstructure. Such defects can
be reduced by improving the quality of manufacture. It is expected then that tensile strength
will continue to increase steadily with time as processing techniques improve.4
Figure: 2.1 Improvement of tensile strength over time for R&D grade carbon fibre

28
2000
2500
3000
3500
4000
4500
5000
5500
6000
6500
7000
1970 1972 1975 1980 1983 1985 1990
Year
Ten
sil
e S
tren
gth
, M
Pa
Source: Odorico5
The modulus of carbon fibre, however, is already 60-80% of the theoretical limit of 750 GPa.
This is because the modulus is generally immune to defects (it depends mainly on the degree
of orientation) and has been comparatively easy to improve.6
High performance pitched based carbon fibre, which has the highest modulus of all,
possesses a negative coefficient of thermal expansion, i.e. unlike most materials, it shrinks
when heated. This means that when combined with an appropriate matrix, a material of
exceptional thermal stability is produced, an important property for spacecraft and sensitive
electronic systems in which thermal strain and distortion can be critical. Moreover, this sort
of fibre exhibits very high values of thermal and electrical conductivity (two to three times
that of copper)7 and oxidation resistance, all of which makes it a particularly appropriate
material to be used in demanding aerospace applications such as rocket nozzle throats,
missile nose tips and satellite structures.
Pitch based carbon fibre also comes in a so-called ‘general purpose’ grade. This is a cheap
form of carbon fibre of comparatively low modulus and strength (but of good flexibility,
ductility and wear resistance) which is used in bulk applications such as insulation for
furnaces and in the construction industry.

29
A further beneficial property of carbon fibre is its near transparency to X-rays. The
replacement of aluminium X-ray table tops and cassettes by carbon fibre can cut the patient
dose by a half.8 Moreover, its compatibility with living tissue has enabled carbon fibre to be
utilised in artificial bones and ligaments.
Finally, carbon fibre also possesses the properties of carbon itself: low friction, good wear,
high service temperature and chemical resistance. Electrical and thermal conductivities can
be modified over a wide range of values. Tables 2.1 and 2.2 overleaf compare the key
properties of carbon fibre and carbon fibre epoxy composite with those of competing
materials. It can be seen that high strength carbon fibre ranks among the highest tensile
strength fibres of any kind, and high modulus carbon fibre possesses moduli higher than that
of any competing material. Moreover, the density of carbon fibre is relatively low, making
the specific modulus and strength exceptionally competitive. Kevlar and its sister polymer
fibre, polyethylene, are also of low density, but their corresponding melting points are also
low, limiting their range of application. The ceramic fibres, SiO2, Al2O3 and SiC have
comparatively high densities, and suffer from the additional drawback of high cost. The main
mechanical problem of carbon fibre is its low ductility (strain at break) or how far the fibre
can stretch before fracture. The low ductility of the early forms of carbon fibre proved a
major barrier to their use in civil aerospace applications before the technical improvements of
the mid-1980’s.9

30
Table 2.1: Properties of Carbon Fibres and Competing Fibres and Whiskers
Density (g/cm3) Tensile
Strength
(Gpa)
Modulus
(Gpa)
Ductility (%) Melting
Temp (0C)
.
Specific
Modulus(106m
)
Specific
Strength(104m
)
S-glass 2.5 4.5 86.9 5.2 1725 3.56 18
Carbon
(high strength)
1.5 5.7 280 2.0 3700 18.8 19
Carbon
(high
modulus)
1.5 1.9 530 0.36 3700 36.3 13
Kevlar 1.44 4.5 120 3.8 500 8.81 25.7
SiO2 2.19 5.9 72.4 8.1 1728 3.38 27.4
Al2O3 3.95 2.1 380 0.55 2015 9.86 5.3
SiC 3.18 21 480 4.4 2700 15.4 66.5
Source: Chung10

31
Table 2.2: Properties of Carbon Fibre Composites and Competing Structural Materials
Densit
y
(g/cm3)
Modul
us
(GNm-
2)
Strengt
h
(MNm-
2)
Ductili
ty (%)
Thermal
Expansion (10-6
0C
-1)
Specific
Modulus
(GNm-2
)
Specific
Strength
(MNm-2
)
Heat Resistance
(0C)
Al alloy 2.8 72 503 11 24 25.7 180 350
Steel alloy 7.85 207 2050 12-28 11 26.4 270 800
Carbon fibre/
epoxy
1.62 220 1400 0.8 -0.2 135 865 260
Glass fibre/
resin
1.93 38 750 1.8 11 19.7 390 250
Data for composites are values parallel to fibre direction. Source:Hull11
32
Process Characteristics12
Fibre Production
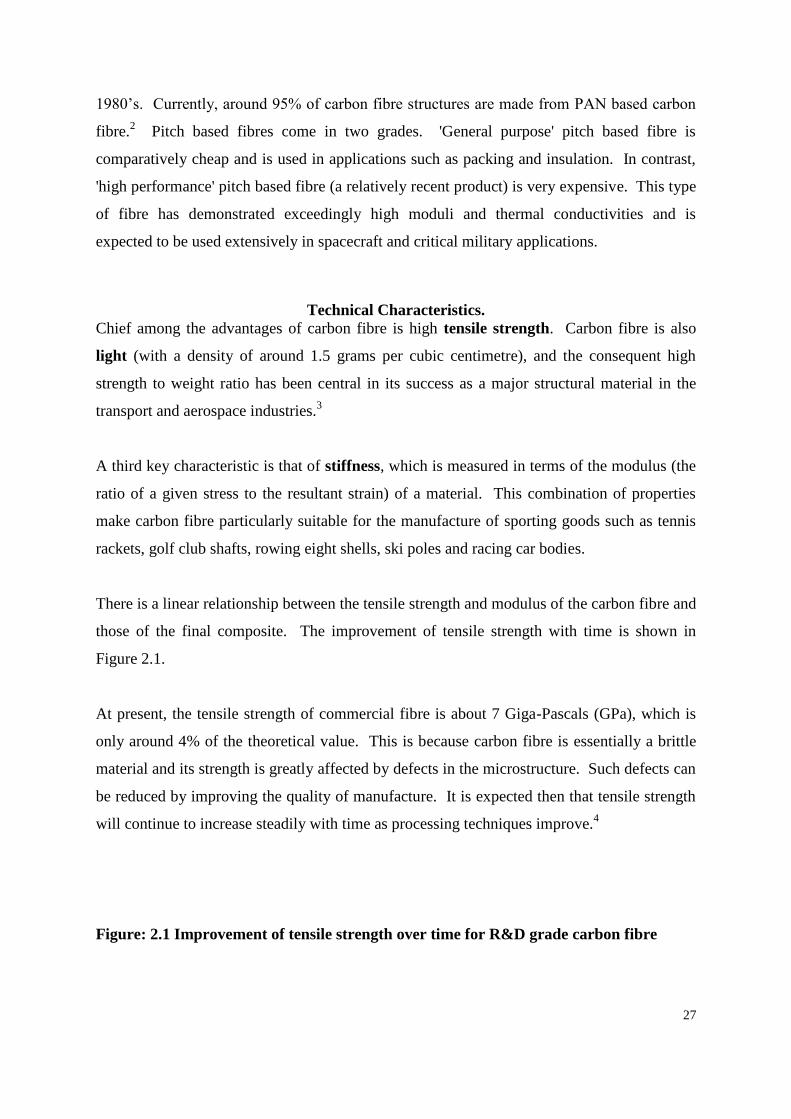
Currently, carbon fibre is produced from three organic precursors, polyacrlylonitrile (PAN),
rayon and pitch. These precursors all provide a high carbon yield and high degree of
molecular orientation, although virtually all commercially produced fibre derives from PAN.
Table 2.3 shows the conversion ratio or yield (i.e. the quantity of carbon fibre produced per
unit of precursor) derived from these precursors.
Table 2.3: Precursor Conversion Ratios
Precursor Yield
Pan 50%
Rayon 20%
Pitch 80-90%
Source:Toho Rayon13
It can be seen that in fact the use of pitch precursor produces the highest yield. However, in
order to make good quality, high performance carbon fibre from pitch, the pitch has to be first
refined, a process that greatly increases production costs and reduces the yield to 30%. Some
commentators, such as Aotoni, expect that the technical problems of processing pitch will in
due course be overcome and high performance carbon fibre from pitch is likely to become
cheaper than that based on PAN.14
Low performance pitch based fibre, such as that which is
used in packing and insulation, is indeed already the cheapest to manufacture.15
PAN-based
carbon fibre is both easier and cheaper to make than rayon derived fibre, largely as a result of
the higher conversion ratio.
1. Pan based Carbon Fibre As almost all high performance carbon fibre is derived from
PAN,16
hereafter ‘carbon fibre’ means PAN-based carbon fibre unless stated otherwise. A
breakdown of production costs for PAN based carbon fibre is shown in Table 2.4.
Table 2.4: PAN Carbon Fibre Breakdown of Production Costs

33
Precursor 36%
Marketing and Quality Control 17%
Depreciation 16%
Labour Costs 11%
Chemical Costs 11%
Carbonisation and Oxidation 9%
Source: Aotoni17
Two important features stand out from Table 2.4. Firstly, we should note that the precursor
accounts for a large percentage of the final cost, and secondly, we see that carbon fibre
production is a relatively capital intensive industry with depreciation costs accounting for
16% of the cost of the final product.
The PAN itself is manufactured by the polymerisation of mono-acrylonitrile, a process that
takes two or three hours in the presence of a catalyst. The properties of the final fibre are
closely related to the purity of the precursor itself. One possible way to reduce the final fibre
cost is thought to be the development of a technology to produce a higher quality precursor.18
The fibres themselves are then commercially produced in three major manufacturing stages;
namely; pre-treatment, carbonisation or graphisation, and finally, surface roughing.
The first step of pre-treatment is the wet spinning of the PAN polymer. During this process,
a solution of the polymer is squirted as a fine stream into a coagulating bath from which the
fibre precipitates. The fibre is then mechanically stretched to between four to eight times its
original length while being heated in air at a temperature of about 3000C. After a few hours,
the carbon turns black. This oxidation process stabilises the fibres and increases the
molecular orientation in preparation for the next stage of either carbonisation or
graphisation.
For carbonisation, the fibre is heated to between 1000-1500 oC in an inert atmosphere. This
yields a fibre with a carbon content of over 90%. The conditions under which carbonisation
takes place have a profound effect on the mechanical properties of the final fibre. The tensile
modulus of the fibre increases as the heat treatment temperature is raised. The tensile

34
strength, however, reaches a maximum at a temperature range between 1000-1500 oC, and
then falls. Hence, for high performance fibres there is an apparent trade off between strength
and modulus. Recent research (Matsuhisa et al., to be published) has demonstrated that ion
implantation into the fibre may improve both strength and modulus.19
If instead the fibre is heated to a very high temperature of between 2000-3000oC, a process
known a graphisation occurs, resulting in fibres of very high modulus but low tensile
strength. This type of fibre is used in the construction of space vehicles and premium sports
goods.
Following carbonisation or graphisation, the fibres are then surface treated to improve the
adhesion between the carbon fibre and matrix resin. This may be achieved chemically,
usually by oxidation, or physically by whiskerisation, whereby very thin whiskers are grown
onto single filaments, like hairs on a fox’s tail. Fibre-resin technology interface technology
remains the weakest area of carbon fibre technology.20
Carbon fibre is usually produced as a yarn or tow consisting of bundles of single filaments.
The diameter of a single filament is between five to ten microns. A bundle is classified by
the number of filaments it contains, usually 3000, 6000, or 12000. 12K tow is the standard
for the industry and is generally the cheapest. Some typical costs are:
Table 2.5: Typical Carbon Fibre Costs
3K tow $46-68/kg
6K tow $48/kg
12K tow $22-29/kg
Source, Toray21
2. Pitch-based Carbon Fibre Carbon fibre compounds can also be produced from petroleum
or coal pitch. This comes in two forms. The so-called ‘isotropic’ general purpose pitch
based fibres is used in cheap, bulk applications such as packing and construction. The fibres
are fragile and difficult to handle, and the resulting strength and modulus correspondingly
low.22

35
In an alternative and relatively recent process, the pitch is first heat treated at about 400oC in
an inert atmosphere to form an intermediate ‘mesophase’ structure. This is then melt spun
through a multihole spinneret to form the fibres. The fibres are then heat treated to 2000oC,
resulting in very high performance, high modulus carbon fibres. However, because of the
problems in refining the pitch, this type of fibre is extremely expensive, at around $3300/kg.
Matrix Resins
Carbon fibre reinforced composites are chiefly manufactured using epoxy matrix resins,
which possess reasonably good heat resistance, mechanical properties and environmental
durability. However, epoxy resins are limited to applications below 300oC and so lack the
heat resistance required in more specialised applications, such as break-pads in aircraft and in
certain types of engine. Some high temperature composites such as carbon-carbon systems
(see below) have already been commercialised. However, these are very expensive and the
development of improved resin systems and matrix resin interfaces is now crucial to the
future commercial success of carbon fibre reinforced composites. Future possibilities include
carbon fibres combined with cement, ceramics or metals.23
These will access major new
markets for carbon fibre, for example in the construction industry, or as parts in gas turbine
engines.
Matrix resins are generally categorised as either thermoset or thermoplastic. Thermoset
resins are cured slowly at low temperatures. This leads to high dimensional stability, strength
at high temperatures and good chemical stability. Thermoplastics are heated and cooled very
quickly and are cheaper to fabricate.24
At present thermoset resins are generally used as their performance characteristics are on the
whole superior. However, recent advances have improved the high temperature strength and
heat resistance of thermoplastics and they hold the greater promise for high volume
production ( as it is quicker to heat up and cool down a material than it is to cure it). It
seems likely that thermoplastic will become essential for the production of carbon fibre
composites for cost sensitive applications, such as in the automobile or construction sectors.
Moreover, thermoplastics resins are more ductile and so are preferred for applications
requiring flexibility, such as tennis rackets. Most companies expect epoxy resins to be
replaced by high performance thermoplastics such as PEEK from ICI in the production of

36
continuous fibre composites for high volume applications over the next few years. One
company, Asahi Kasei, started commercial production as early as 1991.25
Carbon-Carbon Composites
Carbon fibres may be embedded in graphite and, indeed, carbon itself is the material most
compatible with carbon fibre. Carbon is a low density material and the specific strength,
modulus and thermal conductivity of carbon-carbon composites are the highest of any
composite material.26
However, the high cost of fabrication limits its use to specific
aerospace applications, with re-entry thermal protection constituting 37% of the market,
rocket nozzles 31% and aircraft brakes 31%. Typically, carbon-carbon composites are used
in very high temperature applications, for example in the US National Aero-Space Plane, on
which surface temperatures may exceed 1,000o C. Most of the market for carbon-carbon
composites resides in the United States (79%), with Europe and the CIS accounting for a
further 20% and Japan the 1% remainder.27
China’s recent attempts to import carbon-carbon
manufacturing technology from the UK were blocked by COCOM.28
Small, thin walled, carbon-carbon composite parts, up to a few centimetres in size, are made
by vapour deposition from the gas phase. For larger structures, or higher density parts, the
fibre is impregnated with a suitable resin, which is then charred off at very high
temperatures.29
Production of the Composite
Many different processes may be used to produce a composite part from the component
carbon fibres and resin. However, four basic steps are generally involved: impregnation of
the fibre with the resin, forming the structure, curing and finishing. Some of the widely used
manufacturing proceses are:30
Pultrusion, a process used for the production of continuous, constant cross-section parts. In
pultrusion, the impregnation, forming and curing take place in a single manufacturing step.
Prepreg tape lay-up, in which a fibre tape or cloth that has been impregnated with resin and
partially cured (prepreg) is placed on the contoured surface that defines the shape of the
finished part. This is, at present, a labour intensive process, that is being increasingly
automated. Prepreg tape lay-up is expensive and slow and is most commonly used in the
manufacture of aerospace structures.

37
Compression and Injection Moulding are further techniques. Compression moulding, which
uses long lengths of filament or pieces of woven carbon fibre cloth, produces a much better
quality composite than injection moulding which uses short fibre lengths and yields a lower
fibre content. Injection moulding is commonly used in high volume applications producing
parts such as fan blades.
Filament winding involves the winding of the carbon fibre tow and resin simultaneously onto
a former. Filament wound parts can be of great size, rocket bodies being one example.
The properties of the composite depend not only on the nature of the fibre and the matrix, but
also on their relative proportions and geometry. Generally, better quality composites use
long lengths of fibre and have a high fibre content. The cheapest form of composite is one
produced from short, randomly orientated fibre strands. This can be manufactured relatively
inexpensively using technologies such as compression moulding. Sheet moulding compound
(SMC) is one such material widely used for making golf club heads.31
A stronger form of composite can be produced from continuous fibre reinforcements. This is
more expensive to make but is widely used in applications where high strength is critical, for
example, golf club shafts. However, continuous fibre composites are inherently anisotropic
in character; it is very strong along the direction of the fibres, but up to twenty times weaker
when stressed perpendicular to the bundle. In practice, most continuous fibre products use
bundles of fibres orientated in different directions in order to optimise the performance for a
particular application. The computer design of these sorts of composites is often critical and
requires finite element analysis and other complex stress analysis techniques.32
In contrast to metal parts, composites are usually produced by moulding rather than matching
methods. Composites also carry forward the integration of parts to a large degree, i.e.
whereas a metal part may be made from many separate components, its composite
counterpart often has few sub-assemblies. For example, in the CFRC ladder structure of the
Airbus A320 tail fin, the number of major parts was reduced by 70% (from 17,015 to 4,800)
and that for subparts reduced by nearly a half (from 660 to 335).33
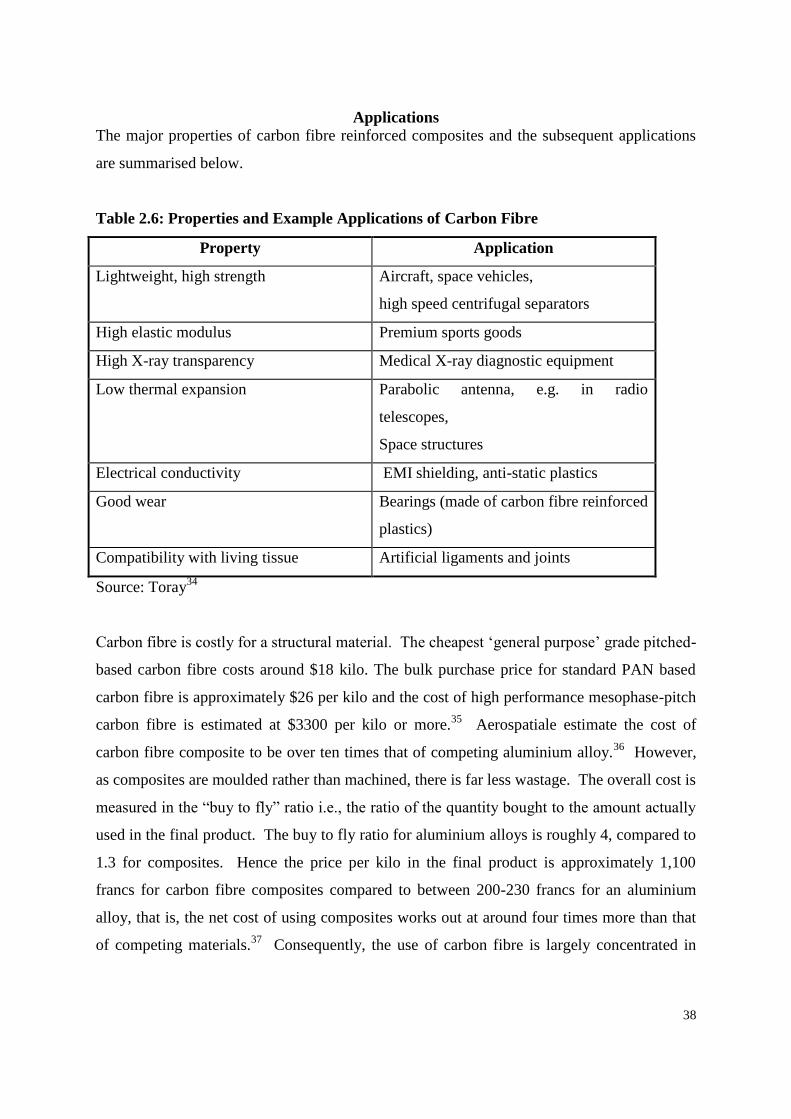
38
Applications
The major properties of carbon fibre reinforced composites and the subsequent applications
are summarised below.
Table 2.6: Properties and Example Applications of Carbon Fibre
Property Application
Lightweight, high strength Aircraft, space vehicles,
high speed centrifugal separators
High elastic modulus Premium sports goods
High X-ray transparency Medical X-ray diagnostic equipment
Low thermal expansion Parabolic antenna, e.g. in radio
telescopes,
Space structures
Electrical conductivity EMI shielding, anti-static plastics
Good wear Bearings (made of carbon fibre reinforced
plastics)
Compatibility with living tissue Artificial ligaments and joints
Source: Toray34
Carbon fibre is costly for a structural material. The cheapest ‘general purpose’ grade pitched-
based carbon fibre costs around $18 kilo. The bulk purchase price for standard PAN based
carbon fibre is approximately $26 per kilo and the cost of high performance mesophase-pitch
carbon fibre is estimated at $3300 per kilo or more.35
Aerospatiale estimate the cost of
carbon fibre composite to be over ten times that of competing aluminium alloy.36
However,
as composites are moulded rather than machined, there is far less wastage. The overall cost is
measured in the “buy to fly” ratio i.e., the ratio of the quantity bought to the amount actually
used in the final product. The buy to fly ratio for aluminium alloys is roughly 4, compared to
1.3 for composites. Hence the price per kilo in the final product is approximately 1,100
francs for carbon fibre composites compared to between 200-230 francs for an aluminium
alloy, that is, the net cost of using composites works out at around four times more than that
of competing materials.37
Consequently, the use of carbon fibre is largely concentrated in

39
those applications where performance takes preference over cost.1 As can be seen below
(Table 2.7), the actual cost of the fibre varies widely with the market size and quantity
required by specific applications.
Table 2.7: Variations in Carbon Fibre Cost
Application Approx. Cost (yen/gm)
Space Satellite 20,000
Space Shuttle 10,000
Fighter Plane 1,000
Fishing Rod 100-1,000
Industrial Robot 400
Camera 300
Golf Club 200
Civil Aircraft 150
Tennis Racket 50
Television 7
Automotive 2
Source, Toho Rayon38
The cheapest carbon fibre is at present around 5 yen per gram.39
It can be seen from the
Table 2.7 that this would need to fall further to access very large automotive markets.
Historically, the cost of fibre has declined dramatically as volume markets have been
increased. During the early 1970’s, the cost of standard quality carbon fibre was around $330
per kilo. This had fallen to around $44/kg by the mid 1980’s and now stands at about
$26/kg.40
Over the last few years the cost of carbon fibre fell again because of the difficult
market conditions,41
but the industry expects prices to remain more or less constant or even
recover in the foreseeable future.42
Carbon fibre production is a capital intensive industry
with significant scale economies, and the key to achieving dramatic cost reductions lies in
1 There is a range of currencies in this thesis as costs are given in the source currency. September 1996 Sterling
exchange rates are (Source: Financial Times, 27th September 1996):
US$ DM FFr Yen
£ Sterling 1.56 2.38 8.04 172

40
volume production. The most likely future high volume application is in drive shafts and
engine parts in the automotive sector. For these, the industry believes, high performance
thermoplastic resins first have to be developed.43
Table 2.8 shows how carbon fibre markets breakdown by region and end use. As there are no
official statistics on carbon fibre demand, the data was obtained from the largest producer,
Toray, (upper data) and the Japanese trade journal Kagaku Kogyo Nippou, which uses Toho
Rayon estimates for carbon fibre consumption (lower data). There are some discrepancies
between the two sources, but the overall pattern of usage remains the same.
Table 2.8:Carbon Fibre Consumption, 1994, tons
Aerospace Sports Industrial Total
USA 1165
780
925
850
1060
1200
3150
2830
Europe 530
435
330
355
460
505
1320
1295
Japan 30
55
910
1030
660
650
1600
1735
Taiwan/
Korea
5
0
1640
1550
5
20
1650
1570
Total 1730
1270
3805
3785
2185
2375
7720
7430
Sources: Toho Rayon (upper data),44
Toray (lower data)45
The US consumes well over a third of the total world carbon fibre production. Aerospace
remains a major market in the US, although consumption in this sector has fallen sharply over
the last five years, as we shall see later. The United States is also the main producer and
consumer of aerospace composites. World-wide, sports goods are the largest single end use,
and by far the largest national consumers in this sector are Taiwan and Korea, who between
them account for about 40% of the global sports goods total. This is not through any
extraordinary national athleticism on the part of these two nations, but rather due to the rapid
growth of subcontracted work; Taiwan has manufactured the tennis rackets for virtually all
the world’s major sports goods producers since 1982. Almost all the carbon fibre used in
Korea and Taiwan is imported from Japan. The largest market in Japan itself is for golf

41
clubs. The Japanese golf club market was blessed with, in Toray’s words, a kamikaze
(Divine Wind) when Gay Brewer won the Japanese Open with a carbon fibre club. This led
to enormously increased sales in Japan.46
The importance of this market is such that Toray
provided the author with an additional chart showing the growth of carbon fibre golf club
consumption in Japan and the US. Industrial uses account for around 25% of total carbon
fibre production. As Table 2.8 shows, the use of carbon fibre in industrial applications is
distributed fairly evenly between the US, Europe and Japan. We will now examine the more
important applications in more detail.
Aerospace
Aerospace, which accounted for 40% of total carbon fibre consumption throughout the late
1980’s, now constitutes a fifth of the carbon fibre market. Composites typically constitute
15-20% by weight of large civil aircraft and carriers, 30-40% for high speed fighter craft and
up to 80% of business planes and helicopters (Figure 2.2, see overleaf) The main advantage
of the use of composites in aerospace applications is the resultant weight reduction. Kelly
estimates that of 40% of an aluminium alloy structure is replaced by CFRC, a weight saving
of 12% is achievable.47
This weight saving may be used to reduce fuel consumption or
increase the payload, manoeuvrability and speed. Additional benefits include the superior
fatigue and corrosion resistance of composites and their vibration damping properties.

42
Source: Matsui48
The use of composites in aerospace applications is likely to be accelerated if their strength
continues to improve and their costs fall. The precursor PAN accounts for a high proportion
of the cost of the fibre (see Table 2.4) and some commentators (such as the Society of British
Aerospace Companies) believe that in mid-term techniques will be developed allowing lower
cost fibre to be produced from pitch.49
The development of high performance thermoplastic
matrices will also cut the cost of the final composite. Currently available matrices tend to
absorb moisture over time and break down at high temperatures. Again, it is thought that
these problems will be overcome with the development of improved resins.
One further barrier to substitution in the aerospace sector is need for any new material to first
be ‘qualified’, or certified safe, for aerospace use. Aviation authorities obviously have less
experience with composites than with traditional metals and alloys, and testing for
certification tends to be conservative, adding to the developmental costs. Safety certification
is expensive, anyway, involving the supply of historical data on production, visits from audit
teams and the production of fibre to make sample parts. It is also a lengthy process as
samples of the material have to be submitted for testing, and test flights carried out. Toray

43
estimates that these shop floor trials can cost as much as £5 million for a new composite type.
Qualification for commercial aerospace parts takes at least 9 to 12 months, and can take as
long as 24 to 36 months. For military aerospace applications, qualification may take several
years. Once a material has been qualified, further product and process innovations are not
permitted.50
Aside from being one of the largest single markets for CFRCs, aviation has been the test bed
for many of these materials. Many aerospace end-users such as Boeing, Aerospatiale, British
Aerospace and McDonnell Douglas are large, technology intensive companies with
correspondingly large research and development facilities. Aside from the benefits of weight
saving, carbon fibre composite materials possess radar invisibility, the strength, toughness
and fatigue resistance to withstand the rigours of high acceleration manoeuvres and other
qualities of interest to the defence sector. It is hardly surprising therefore that government
defence ministries have been major sponsors of the development of aerospace applications.
Defence Aviation
Carbon fibre was developed primarily in the aerospace laboratories of the 1960's. With its
critical weight saving advantages, it had been introduced into fighters such as the F-14 and F-
15 by the early 1970’s. Throughout the 1970’s and 1980’s, military programmes were
intensive users of carbon fibre. Figure 2.2 shows the degree of carbon fibre usage by
aerospace project. For military aircraft, advanced composite usage has increased from a few
percent in the F-14, F-15 and F-16 to 6% in the Mirage 2000 and over 40% in the Advanced
Tactical Fighter. Helicopter composite usage is particularly intense. In the tilt rotor V-22,
for example, advanced composites account for 70% of the total structural weight.
The US is by far the largest defence buyer in absolute terms ($252,358 million in 1994), with
a defence budget seven times that of the UK ($35,055 million) and over eight times that of
Japan ($29,877 million).51
The US can afford several different types of specialised aircraft,
whereas the European countries tend to develop a smaller number of multi-role aircraft.
Consequently, the Pentagon has been a major impetus behind new materials development.
For example, under the Strategic Defense Initiative there was a special programme for new

44
materials development, and Du Pont has made many advances in carbon fibre technology
through DoD funding. As a result, the US leads the world in military applications of carbon
fibre technology.52
With regard to Europe, the French fighter Rafale has composite structures and carbon fibre
surfaces throughout. The French airforce plans to buy a total of 235 Rafale aircraft and the
French navy 86.53
The first delivery (to the French navy) is scheduled for 1997, with the first
operational aircraft entering service in 2000.54
The service entry date to the French airforce
has been delayed to 2005. The Eurofighter has been described as “the embodiment of cold
war requirements that are no longer relevant to the needs of the major partners”55
and is
currently awaiting a series of government decisions on production levels. The present
workshares are UK, 35%, Italy, 21%, Spain 13% and Germany 33%, with first deliveries
scheduled for 2001-2.56
The aircraft incorporates carbon fibre composites developed in part
under the EUREKA programme. Roskill estimates that 82% of the Eurofighter surface will
be made from composite of which 70% will be carbon fibre.57
In addition, the foreplanes,
access panels and cockpit floor panels will all be carbon composite based.
The Japanese aerospace industry was virtually closed down by the Occupation forces after
the Second World War. At present, Japan either purchases military aircraft directly from the
US, or assembles US military components under licence. Mitsubishi Rayon, for example,
makes carbon fibre parts for the F-15.58
Helicopters are a special case in that the rotor blades suffer from forced vibrations at
particular frequencies and are subject to extreme twisting forces that place severe technical
constraints on their constituent materials. Although composites are very strong along a
defined plane, multi-directional tensile strength requires the complex deign of both the
material and the way it is laid up. As a result, helicopter manufacturers are at the forefront of
composite design. By way of illustration, Farrands writes,
“When United Technologies bought the UK [helicopter] company Westland ...
the main goal of the acquisition was to obtain Westland’s skilled staff and
research expertise in new materials together with some recent patents to pre-empt
their use by competitors.”59

45
The US holds the technical lead in the design and use of composites in helicopter
applications.60
According to Freedman, while Britain, France and West Germany have
between them 2,800 military helicopters, the United States has more than 10,000, largely
purchased in a protected market.61
Carbon fibre parts are also increasingly used in guided missiles, most commonly in motor
casings, which are filament wound on mandrels. It has been estimated that the use of carbon
composite rather than metal rocket motor parts can increase a missile range by about 600
miles.62
Carbon fibre trusses are also used in load bearing structures. The American
company Hercules specialises in the production of such parts. The US Trident D-5 missile,
for example uses Hercules intermediate modulus fibre in all three stages.63
Defence spending as a whole has fallen in the light of the improved relations between the
former superpowers and the dissolution of the Soviet Union. Moreover, most Western
airforces re-equipped during the military build-up of the 1980’s. Barring another major
upheaval in the Middle East, or further crises in Eastern Europe, Western arms spending is
expected to continue to decline.64
Similarly, so long as the Pacific region remains politically
secure, the Japanese military market is expected to remain level. In order to amortise their
original high investments, those producers and users of CFRCs in military applications are
seeking to transfer their technologies into non-defence applications, especially civil
aerospace. This will place them in much more direct competition with Japanese carbon fibre
producers.65
Space Structures
For those structures that are to be used in space, weight saving is particularly crucial and the
price of a material is not a primary factor in its selection. It is estimated that every additional
kilogram costs an extra $10,000 in a satellite launch, and a further $5,000 in the cheaper (re-
usable) US space shuttle.66
There is a current surge in satellite launches to satisfy the
demands of the telecommunications and broadcasting industries. It is estimated that there are
currently around 120 working satellites in geostationary orbit, the majority being for civil
applications. The Economist estimates 214 will be in use by the end of 2000.67
The cost of a
failed satellite launch is around $200 million and so the performance and reliability of

46
structural materials is critical.68
Even so-called ‘cold structures’ in satellite launchers can
reach temperatures of 250oC. Hence, although this is a small market segment, it is one in
which there is a high value element. Furthermore, this application is one at the forefront of
composite technology. Ultra high modulus pitch based carbon fibres, for example, were
developed by Du Pont through DoD funding partly for use in space structures and Hercules
has developed very high performance carbon-carbon composites for use in rocket nose
applications.69
Civil Aerospace
The commercial aerospace sector has been notably more cautious in the adoption of
composite materials than its military counterpart. This is due in part to the differences in
certification, liability and reimbursement procedures between the two arms of the industry.
The possible financial penalties brought about by equipment failure are far greater for the
civil sector, rendering the industry unsurprisingly more conservative in its selection of
materials.70
That said, new materials are expected to represent an increasingly significant
proportion of aircraft production. According to Farrands, new material sales for civil
aerospace applications during the 1990’s were expected to be between $12 billion and $16
billion, broadly averaging $1.5 billion per year,71
of which, the Society of British Aerospace
Companies estimated, CFRCs would constitute around 30%.72
Farrands forecasts, made at the start of the 1990s, included orders already placed and were
also based on the expectation that prospects for the civil aerospace industry would be strong
over the decade. He presumed that airlines would require new planes of all sizes and ranges
from airlines to replace ageing aircraft (the Boeing 767 had been launched fifteen years
previously). Moreover, Farrands expected passenger volumes in Europe to increase by 25%
as a result of industry deregulation.
However, the general economic recession of the early 1990’s, and the negative impact of the
Gulf War on air traffic precipitated a severe downturn in the civil aerospace sector. The
deregulation of the industry in the US also contributed to falls in airline profitability. This in
turn slowed the pace of investment within the industry as well as leading to the collapse or
acquisition of some of the major players. For example, the cutbacks in Northwest Airlines
resulted in the cancellation of $3.8 billion in orders for 50 new Airbus A320s and 24 Airbus

47
A340s. World airlines reported losses totalling $15.6 billion over the period 1990-1993.73
The problems of the civil aircraft producers have been compounded by the downturn in their
defence business. Military aircraft are manufactured almost exclusively by those companies
that also produce civilian planes, or, put another way, the top ten civil aerospace companies
all rank amongst the world’s top twenty producers of arms.74

48
Table 2.9: World Civil Jet Aircraft Orders and Deliveries 1981-1995
(aircraft number)
Orders Deliveries
1981 283 608
1982 260 472
1983 256 427
1984 363 362
1985 674 404
1986 639 466
1987 598 490
1988 1075 583
1989 1305 647
1990 1003 768
1991 446 950
1992 473 893
1993 391 727
1994 361 551
1995 691 499
Source: The European Aerospace Industry75
Table 2.9 shows aircraft orders and deliveries throughout the 1980’s and early 1990’s.
Although the period 1990-1993 was difficult for the industry, prospects are looking brighter
the for second half of the decade. The industry turned a profit in 1994 for the first time since
1990 and profits on international scheduled services are forecast by IATA at $6 billion this
year (1996). However, as the industry has stressed, despite the recent results, the total profit
for 1994-1996 represents only 85% of the losses made in the early 1990’s.76
Nevertheless, the
recovery looks set to continue, as the 1994 Aerospace Keynote report comments,
“The resumption of a 5% to 6% annual growth in revenue passenger miles since
the Gulf War supports confidence for the medium term. The return of passenger
traffic growth to long term trend levels supports expectations for a recovery in
aircraft orders, now generally anticipated for 1996.”77

49
Table 2.10 gives the world-wide aircraft requirement forecasts.
Table 2.10: Predicted World-wide New Aircraft Requirement, 1994-2013
(Number of Aircraft)
Aircraft
Size
(Seating
Capacity)
1994-1998 1999-2003 2004-2008 2009-2013 1994-2013
Total
70-90 194 184 227 180 785
91-120 419 500 414 443 1776
121-170 1112 974 852 1333 4271
171-240 559 445 684 1016 2704
241-350 298 291 295 366 1250
350+ 560 717 937 1054 3268
Total
Volume
3142 3111 3409 4392 14054
Source: Keynote Report78
Of the civil aeroplane manufacturers, Boeing has by far the largest market share at 77%.
Boeing is a fairly extensive user of new materials. Current Boeings have CFRCs in
secondary structures and the Boeing 777 incorporates CFRCs into the vertical fin and
horizontal stabilisers with a total composite weight of 3600 kg per plane. The Japanese
producer Toray has established a prepreg plant at Frederickston in Seattle in order to fulfil
Boeing’s carbon fibre requirement.79
Airbus Industrie is a European consortium in which British Aerospace has a 20% stake, Spain
4% and France and Germany around 38% apiece.80
It is generally acknowledged that, in
terms of new materials, Airbus Industrie makes the most innovative civil aircraft. The A320
was the first large civilian aircraft to incorporate CFRCs into primary structures as well as
control surfaces, in the undercarriage and in interior fixtures. Composites are used even more
extensively in the new, larger, longer distance A340. Although small compared to Boeing,

50
Airbus has a significant market share, which has resulted in substantial investment in
European carbon fibre production.81
The use of carbon fibres in civil aircraft is growing steadily and expected to continue to
increase incrementally in the foreseeable future. It is the belief of the industry that the civil
aerospace applications will become the largest market for carbon fibre in the mid-term.82
Finally in this section, we look briefly at carbon fibre applications in leisure and private
flying. Private business jets incorporate a very high proportion of carbon fibre and the use of
composites in primary (flight critical) structures is widespread. Indeed, the Beech
Corporation Starship and the Artek 400 are designed and built with airframes based almost
entirely on a carbon composite structure.83
Table 2.11: World Deliveries of Light and Business Aircraft
(number of aircraft)
Year 1986 1987 1988 1989 1990 1991 1992 1993 1994
Total 809 819 842 894 879 776 729 698 706
Source: The European Aerospace Industry84
Table 2.11 shows the number of number of business aircraft deliveries over the last ten years.
The economic affluence of the West during the 1980’s resulted in a large increase in private
plane ownership and there has been a corresponding decline in the recent recession. Sales of
microlights and hang-gliders also grew throughout the 1980’s, increasingly steadily at
between 8 and 15% per annum throughout the decade. Microlighting is largely concentrated
in the US whereas hang-gliding has a greater following in Europe. Both sports rely heavily
on small, local, private companies, often established by a leading figure in the sport and
continue to grow in popularity. Although small in terms of value, leisure and private flying
act as valuable technology demonstrators for the industry.85

51
Sports and Leisure
The sports market for CFRC was largely developed by Japanese companies, and is now the
biggest end sector of carbon fibre accounting for almost half of total global consumption.
Golf club heads were the first volume application of carbon fibre, and fishing rods, yacht
masts, tennis and badminton racquets swiftly followed. According to Asahi Shinbum, golf
clubs alone account for one quarter of global carbon fibre consumption.86
Sports goods made
from carbon fibre are comparatively expensive, but obviously users feel that the performance
justifies the price they pay. Examples include golf clubs at 50,000 yen, fishing rods at
150,000 and skis at 140,000 yen a pair.87
A carbon fibre ribbed umbrella can be bought for
around 20,000 yen. Needless to say, one of the largest markets for these kinds of goods is
Japan, where the high growth economy together with the equable distribution of income (the
most equable in the OECD) has ensured a very large domestic consumer market. Golf is a
prestigious sport in Japan and it is not uncommon for golfers to upgrade their entire set of
clubs each year. Yachting is another prestigious sport and the use of carbon fibre made by
Hercules and Mitsubishi Rayon in the America’s Cup race was given high profile in their
respective annual reports.88
Industrial
Industrial applications of carbon fibre account for just over 20% of consumption. These sorts
of applications include robot arms, centrifugal rotors, weaving machinery, printing rollers and
other high speed industrial machine parts that can exploit the low inertial mass of a
lightweight material. The use of CFRCs also offers other advantages such as the tailorable
and isotropic stiffness, high strength, dimensional stability, vibration damage and fatigue
resistance characteristics we have already seen employed in other applications. Carbon fibre
also has a low coefficient of friction, and so is often used in bearings. Robotic applications
look particularly fruitful as carbon fibre has a high stiffness to weight ratio, which means that
unlike metals, where endpoint accuracy can only be achieved at the cost of higher mass and
hence slower response time, a light weight yet accurate arm can be produced. The current
growth rate of the robotic sector is estimated at 6%. In line with general growth of the
advanced engineering industry in the Far East (and the corresponding decline in Europe and
the US), Japanese companies now dominate robotics production.89

52
It is difficult to predict the future growth of industrial applications of carbon fibre as the
sector is very fragmented both regionally and sectorally, and the use of new materials often
incurs additional re-tooling costs. However, the US Office of Technology Assessment
(OTA) forecast a ‘slow but steady’ increase in this market segment.90
If the price of carbon fibre falls further, the very high volume automotive sector will be
accessed. At present, CFRCs are used in car engines to a small degree. The US company
Hercules, for example, supply General Motors with carbon fibre composite for the
manufacture of drive shafts. The use of carbon fibre in car body parts would allow
manufacturers to reduce weight while increasing strength and stiffness. Additionally, carbon
fibre offers superior corrosion resistance over steel or galvanised steel, with the result that the
OTA estimate that a polymer matrix composite body might have twice the lifetime of current
steel models.91
However, aside from the cost, there is at present a lack of manufacturing
technologies that can compete with the high production rate of the metal stamping industry.
In order to compete with standard car parts, a CFRC moulding technology that can produce
complex and integrated structural parts quickly and reliably needs to be developed. Over the
last few years, a series of environmental and safety related regulations in the US has made the
production of carbon fibre natural gas tanks for use in public transport vehicles economically
viable. At present, the demand for such tanks is so high, that the market crises of the early
1990’s have completely reversed, with the result that most carbon fibre producers are
currently working to full capacity.92
Other
Although carbon fibre finds its largest markets in aerospace, sports and leisure, in which high
strength and modulus are required, other applications are being developed that exploit not
only the mechanical properties but also other characteristics such as low thermal expansion,
good electrical conductivity and high X-ray transmission. One example of an application
that uses a specific property of carbon fibre is the development of X-ray table tops and
cassettes, which has significantly reduced patient (and radiographer) dosage. The Swedish
firm Siemens pioneered the development of this application.93
As second example is the use of carbon fibre as a heat insulator in high temperature
furnaces. General purpose grade pitch based carbon fibre is used in this application, which

53
can withstand temperatures of 3000oC in an inert atmosphere or high vacuum furnaces. The
carbon fibre employed in this application is fairly expensive at around 40,000 yen per
kilogram. This compared favourable, however, with the cost of competing materials such a
molybdenum plate.94
Carbon fibre composites are bio-compatible (i.e. are not rejected by the body and have a
neutral effect on body chemistry) and are already in use as artificial ligaments and joint
replacements. Current implant devices are made from metal which can result in allergic
reactions to the metal ions, fatigue failure, degeneration due to a lack of mechanical loading
and poor matching of mechanical stiffness. CFRCs not only have the capability to overcome
these difficulties, but also offer additional benefits. A degradable composite system could be
designed to provide initial support to an injury and then be gradually absorbed by the body as
the natural tissue repairs. Medical implants is a small volume but high value added sector
(with an additional high societal value) in which the advantages of using carbon fibre often
outweigh the expense.
The total market world-wide for bio-compatible materials is worth around DM 7.5 billion
with the US accounting for 53% of sales, followed by Europe at 29% and Japan at 8%.95
The
current growth rates for implants is said to be between 15 and 20% per annum.96
This high
rate is partly due to the wider diffusion of technologies and partly as a result of the ageing
populations in industrialised nations. Market figures do not differentiate the sales of carbon
fibre in this sector from those of other materials. However the OTA believe that CFRCs will
constitute a ‘substantial portion’ of the market.97
This rapid growth rate will ensure a steady
investment in research and development and a continuing interest from large companies. Du
Pont holds key patents for prosthesis materials and in Europe Bayer is a leading producer of
bio-compatible materials.98
A potentially large volume application is the construction industry. Current applications
include actual buildings and bridge parts, such as cables and domes, and in the machinery
employed, for example cranes. Again, the benefits of using CFRCs in this sector include
high strength to weight ratios (with a density of between two thirds to a half that of
conventional concrete), a reduction in the number of subassemblies and corrosion resistance.
The ability of carbon fibre composite to withstand chemical attack makes it increasingly

54
relevant in applications where the working environment is particularly tough, such as off-
shore oil rigs. The carbon fibre used in construction applications is usually the lower cost
general grade fibre made from pitch.
Carbon fibre reinforced concrete curtain walls have a tensile strength and a flexural strength
two to five times higher than those of conventional concrete curtain walls.99
One of the first
major building projects to use carbon fibre reinforced concrete was the Al Shaheed
monument in Iraq. This consists of a pair of twin domes, each 40 metres high and 45 metres
across at the base. The domes were constructed with a galvanised steel skeleton covered in
beautiful porcelain tiles backed by carbon fibre reinforced concrete, selected as it is light
weight, able to withstand the weather extremes in Baghdad (it is dimensionally stable under
extremes of temperature) and strong.100
However, generally speaking, the cost of competing
materials is low and the companies themselves notoriously conservative. These are expected
to be major barriers to substitution in this sector. Any increase in the use of carbon fibre in
the construction industry is therefore expected to be slow.101
We have seen that carbon fibre is a high performance material, mainly limited in application
by its high costs. The very large volume automotive market remains a holy grail for carbon
fibre producers, and the use of carbon fibre in compressed natural gas tanks, if successful,
could prove a useful technology demonstrator that may access large market mainstream
automotive applications. For these applications, the manufacturing costs of carbon fibre
composites must be reduced, most likely through the improvement of either resin or precursor
technology. The cost of PAN accounts for a large percentage of the final cost of the fibre
and the development of new precursors, perhaps based on pitch could significantly lower
costs. Similarly, the higher performance thermoplastic resins would enable cheaper high
volume production of car parts.
In the foreseeable future, however, the use of carbon fibre composites will continue to
increase in civil aerospace and Toray believes this will become the largest market for carbon
fibre in the mid-term.102
This view is reinforced by the launch in 1995 of the Boeing 777, the
first Boeing civil aircraft to use carbon fibre in primary structures. With the demise of the
defence sector, it is now generally acknowledged that the health of the civil airline sector is
the main determinant in the growth of the carbon fibre industry in the mid-term.
55
References
1 David Nunn, Toray, in interview, October 1995
2 Hiramatsu, T. And Nishimura, T., Recent Technological Progress of PAN-Based Carbon Fibre,
Preprint, given to author, April 1992 3 For example, the Airbus A310 and A320 all composite vertical tail fin was nearly 25% lighter than
its aluminium predecessor (Materials Edge, September/October 1990) 4 Hiramatsu, T., and Nishimura, T., op. cit.2
5 Odorico, J., Aerospatiale Research Center, note to author, June 1991
6 Hiramatsu, T., and Nishimura, T., op. cit.2
7 Advanced Materials Technology and Industrial Base, US Department of Defense, Washington, D.C.,
1996. 8 Russell, J.G.B., The Use of Carbon Fibre Material in Table Tops, Cassette Fronts and Grid Covers:
magnitude of possible dose reduction, British Journal of Radiology, 59 (698), February 1986 9 Blumberg, H., Kohlenstoff- und Aramidfasern, Kunststoffe, 77, January, 1987
10 Chung, Deborah, Carbon Fibre Composites, Butterworth-Heinemann, 1994
11 Hull, Derek, An Introduction to Composite Materials, Cambridge University Press, 1981
12 Much of the information on the processing of carbon fibre came from technical data provided by the
firms, especially Toho Rayon and Mitsubishi Rayon 13
Kozo Tanaka, Toho Rayon, in interview, March 1992 14
Aotoni, Hiroshi Prospects for Carbon Fiber Reinforced Composites, TBR Intelligence, Vol 2, No1,
1989. 15
Sadao Shigihara, Kureha, in interview, April, 1992 16
Roskill, Carbon Fibre Market Update, Analysis and Outlook, Roskill Information Sevices, 1994 17
Aotoni, op. cit.14 18
The Society of British Aerospace Companies, Materials Development in the Aerospace Sector, A
Report Prepared for the materials and Structures Research Sub-Committee, 1991 19
Matsuhisa, Y., Structures and Mechanical Properties of Ion Implanted PAN and Pitched Based
Carbon Fibre, Toray Research Center Preprint 20
Matsui, J., Surface Properties of Carbon Fibre, Critical Reviews in Surface Chemistry, Volume 1,
Issue 2, 1990 21
Keisuke Ishii, Toray, in interview, April 1992 22
Matsui, op.cit.20 23
Chung, Deborah, op.cit.10 24
New Structural Materials Technologies: a Technical Memorandum, US Office of Technology
Assessment, Washington, D.C., 1986 25
Akitaka Kikuchi, Asahi Kasei in interview, May 1992 26
Chung, Deborah. op.cit.10 27
Chung, Deborah, op.cit.10 28
Roskill, The Economics of Carbon Fibre, Roskill Information Services, 1990 29
Chung, Deborah, op.cit.10 30
US Office of Technology Assessment, Advanced Materials By Design, Washington, D.C., 1988 31
Goro Tsunoda, Director ACM and Products Plant, Mitsubishi Rayon, in interview, March 1992 32
US Office of Technology Assessment New Structural Materials Technologies: a Technical
Memorandum, US Office of Technology Assessment, Washington, D.C., 1986 33
Hiramatsu, T., and Nishimura, T., Recent Technological Progress of PAN-based Carbon Fibre,
Preprint, given to author, April 1992 34
Compendium of Recent Advances in Torayca Technologies, Toray internal document, given to
author April 1992 35
David Nunn, Toray, in interview, October 1991 36
Odorico, J., Evolution des Materiaux sur les Structures d’Avion Civil et d’Helicopters,
Aerospatiale, internal memorandum, given to author April 1991 37
Odorico, op.cit.4

56
38
Kazuhisa Saito, Toho Rayon, in interview, March 1992 39
ibid. 40
Kozo Tanaka, Toho Rayon, in interview, March 1992 41
Asahi Shinbum, 19th January 1993 42
Sadao Shigihara, Kureha, in interview April 1992; Charles Toyer, Toray, in interview October 1995 43
Kozo Tanaka, Toho Rayon, in interview, March 1992 44
Quoted in Kagaku Kogyo Nippou, June 1995 45
David Nunn, Toray, note to author, 18th September 1995 46
Fellowship of Engineering Modern Materials in Manufacturing Industry , Fellowship of
Engineering, 1983 47
Kelly, A., Composites for the 1990’s, Philosophical Transactions of the Royal Society, London,
A322, 409-423, 1987 48
Matsui, op.cit.20 49
The Society of British Aerospace Companies, Materials Development in the Aerospace Sector, A
Report Prepared for the Materials and Structures Research Sub-Committee, 1991 50
Charles Toyer, Toray in interview October 1995 51
SIPRI Yearbook, 1995, Armaments, Disarmament and International Security, SIPRI, 1995 52
OECD, Advanced Materials:Policies and Technological Change, OECD, Paris 1990 53
SIPRI Yearbook, World Armaments and Disarmament, SIPRI 1993 54
1996 Farnborough Report, Aviation Week and Space Technology, September 9th, 1996 55
SIPRI Yearbook 1996, Armaments, Disarmament and International Security, SIPRI, 1996 56
1996 Farnborough Report Aviation Week and Space Technology, September 9th, 1996 57
Roskill, 1994, op. cit.16 58
Toa Kobayashi, Mitsubishi Rayon, in interview, March 1992 59
Farrands, Christopher, New Materials in Manufacturing Industry; an European Overview,
Economist Intelligence Unit, 1990 60
SIPRI 1993, op.cit.53 61
Freedman, Lawrence, The Case of Westland and the Bias to Europe, International Affairs, 1987 62
Steinburg, Morris, A., Materials for Aerospace Scientific American, September 1986 63
US Deparment of Defense, 1996, op. cit. 64
David Brinkman @ www.btg.com/Janes, June 1994 65
David Nunn, Toray, in interview, October 1991 66
Farrands, op. cit.59 67
The Economist, October 5th, 1996 68
Farrands, op. cit. 69
Hercules Annual Report, 1992 70
Roskill, 1994, op. cit.16 71
Farrands, op. cit.59 72
The Society of British Aerospace companies, op. cit.18 73
The Economist, 29th April, 1995 74
The 100 largest arms producers are listed in the Sipri Yearbook, 1995 Armaments, Disarmament
and Internaltional Security, Sipri, 1995, the top ten aerospace companies are listed in the Keynote
Airline Report, 10th Edition, Keynote 1994 75
The European Aerospace Industry, Trading Position and Figures, 1996 , European Commission,
DG III, May 1996 76
IATA Chief Warns on New Aircraft Orders, Financial Times, 23rd April 1996 77
Keynote Airline Report, op.cit 78
ibid. 79
Charles Toyer, Toray, in interview, October 1995 80
The European Aerospace Industry, op. cit. 81
Koshorst, M. Airbus Industrie, telephone interview, April 1991 82
Ishii, Keisuke, Toray, in interview April 1992 83
Farrands, op. cit.59

57
84
The European Aerospace Industry Trading Position and Figures, 1996, May 1996, European
commission, DGIII 85
Farrands, op. cit.59 86
Asahi Shinbum, 6th December 1995 87
Takashi Masaki, Mitsubishi Rayon, in interview, March 1992 88
See Hercules Annual Report, 1992 , and Mitsubishi Rayon Annual Report, 1991 89
Farrands, op.cit.59 90
US Office of Technology Assessment, Advanced Materials by Design, Washington, D.C., 1988 91
OTA, op.cit.90 92
Charles Toyer, Toray, in interview, October 1995 93
Matsui, op. cit.20 94
Kiyoshi Miyabe, Mitsubishi Rayon in interview, March 1992 95
Revue Hebdomadaire des Industries-Chimiques 2nd November 1995, 96
Farrands, op.cit.59 97
OTA, op. cit.90 98
OTA, op. cit.90 99
Sadao Shigihara, Kureha, in interview, April 1992 100
ibid. 101
ibid 102
Charles Toyer, Toray, in interview, October 1995

CHAPTER THREE:
THE CORPORATE CONTEXT
In this chapter we will seek to compare the business systems and industrial structures of those
countries in which carbon fibre is produced. The development of a high technology sector,
such as carbon fibre, takes place within a general national industrial and economic
environment which, as we shall see in Chapter Five, has had a profound influence on the
industry. Every country has its own distinct industrial structure, dependent, for example on
the type and mix of corporate governance, patterns of demand, means of finance, range of
governmental institutions and regulatory and tax regimes. We examine here those aspects of
Japanese industrial structure that have most influenced the development of carbon fibre
manufacturing, then, in the second part of this chapter, look at the development of the Anglo-
American corporate environment. Firstly, we will look at the major influences in the
historical development of Japanese industry from the Meiji restoration to the present day.
Part One: Japan
For People, Mitsui; For Organisation, Mitsubishi; For Unity, Sumitomo
Japanese Saying
Background
Prior to the restoration, Japanese society was typified by rigidly defined social classes based
on a system of vertical loyalties and reciprocal obligations. This system was made necessary
by the exigencies of rice culture and the pressures of living in an overcrowded land. Even
before the restoration took place, however, there was a steady growth in the power of a
centralised national government and a rising system of state protection. In 1853, with the
arrival of Perry's convoy from the United States and the subsequent threat of foreign invasion
and colonisation, all classes perceived the importance of national security and the idea of
some form of state cohesion gained massive popularity, culminating in the Meiji Restoration
of 1868.
The restoration reinforced the guiding ethos of reciprocal obligations, but these obligations
were transferred from specific social classes to the firm and state. Hence a form of

59
paternalism arose between labour and capital, receiving widespread support through its
identification with the overriding demands for a national security under the external threat.
In this way, despite the rapid political transition of the period, the social order was, by and
large, maintained. This stability enabled Japan to enter a period of rapid economic growth
and construct the industrial infrastructure necessary to build and sustain a military power.
The result was that Japan became the first non-western country to industrialise.1
Meanwhile, Japan's system of banking and finance was reorganised along fashionable
European lines rather than on the basis of the country's traditional feudal systems. A new
decimal currency, the yen, was introduced in 1871, shortly after which the Bank of Japan was
established as the country's central bank. The post office savings system was inaugurated in
1874 and the establishment of private savings banks soon followed. During World War II,
the Bank of Japan was reorganised to control currency, credit and finance in line with
government strategy. The Bank's powers were further strengthened in 1949 to include
responsibility in changes in the discount rate. The consequent interest rate regulations (most
notably the creation of a stable business environment) resulted in a high rate of industrial
indirect finance. This financial system, with the Bank of Japan at the apex of a structure
based on commercial and savings banks, and with the post office playing a major role,
remains more or less intact today. Similarly, indirect finance (by which companies obtain
funds by borrowing from financial institutions as opposed to selling securities) remains a
predominant feature of Japanese industry today.2
Pre-war origins
Before the war, Japanese industry had been dominated by the zaibatsu, semi- monopoly
groups of related business enterprises. The zaibatsu were run by family-owned holding
companies which maintained their control through majority share ownership. The Big Four
zaibatsu were:
1. Mitsui. Mitsui was one of the oldest of the zaibatsu groups with some of its business
enterprises dating back to the 17th century. Although it had mining and commodity trading
operations, its major business was money lending and by the middle of the 19th century was
in all but name acting as a private exchequer to the Japanese government. In 1871, however,
the government established its own central bank, the Bank of Japan. Mitsui temporarily
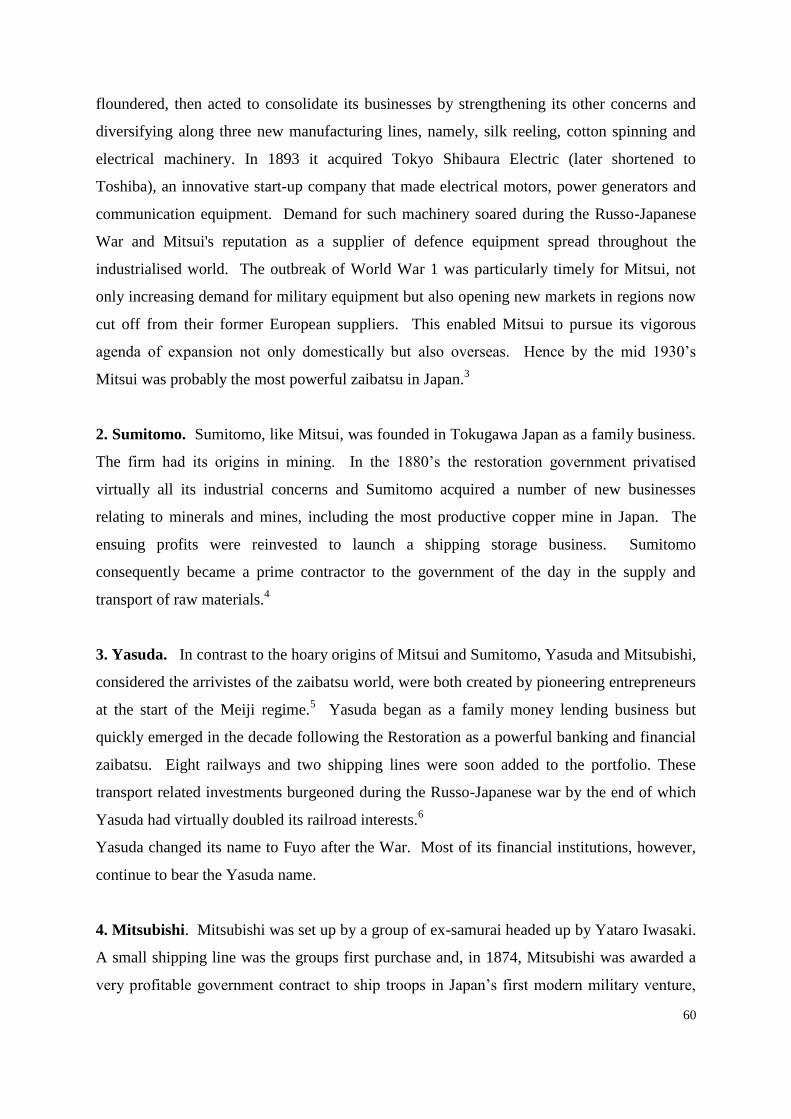
60
floundered, then acted to consolidate its businesses by strengthening its other concerns and
diversifying along three new manufacturing lines, namely, silk reeling, cotton spinning and
electrical machinery. In 1893 it acquired Tokyo Shibaura Electric (later shortened to
Toshiba), an innovative start-up company that made electrical motors, power generators and
communication equipment. Demand for such machinery soared during the Russo-Japanese
War and Mitsui's reputation as a supplier of defence equipment spread throughout the
industrialised world. The outbreak of World War 1 was particularly timely for Mitsui, not
only increasing demand for military equipment but also opening new markets in regions now
cut off from their former European suppliers. This enabled Mitsui to pursue its vigorous
agenda of expansion not only domestically but also overseas. Hence by the mid 1930’s
Mitsui was probably the most powerful zaibatsu in Japan.3
2. Sumitomo. Sumitomo, like Mitsui, was founded in Tokugawa Japan as a family business.
The firm had its origins in mining. In the 1880’s the restoration government privatised
virtually all its industrial concerns and Sumitomo acquired a number of new businesses
relating to minerals and mines, including the most productive copper mine in Japan. The
ensuing profits were reinvested to launch a shipping storage business. Sumitomo
consequently became a prime contractor to the government of the day in the supply and
transport of raw materials.4
3. Yasuda. In contrast to the hoary origins of Mitsui and Sumitomo, Yasuda and Mitsubishi,
considered the arrivistes of the zaibatsu world, were both created by pioneering entrepreneurs
at the start of the Meiji regime.5 Yasuda began as a family money lending business but
quickly emerged in the decade following the Restoration as a powerful banking and financial
zaibatsu. Eight railways and two shipping lines were soon added to the portfolio. These
transport related investments burgeoned during the Russo-Japanese war by the end of which
Yasuda had virtually doubled its railroad interests.6
Yasuda changed its name to Fuyo after the War. Most of its financial institutions, however,
continue to bear the Yasuda name.
4. Mitsubishi. Mitsubishi was set up by a group of ex-samurai headed up by Yataro Iwasaki.
A small shipping line was the groups first purchase and, in 1874, Mitsubishi was awarded a
very profitable government contract to ship troops in Japan’s first modern military venture,

61
the so-called Taiwan Expedition. The group quickly established its own network of domestic
and overseas shipping lines and acquired a number of mining interests through the Meiji
government privatisation. Mitsubishi grew and diversified into a fully fledged zaibatsu, with
interests in banking, brewing, chemicals and, most particularly, heavy industry. The group
acquired the Nagasaki shipyard and by the start of World War II, was a major producer of
battleships and aircraft (including the Zero fighter). In short, “Mitsubishi put the muscle into
Japan’s military advance”.7
Post-war Change
Not surprisingly, the zaibatsu were seen by the post-war occupation authority as the driving
force behind Japan's militarism; the US Ambassador, Edwin W. Pauley reported:
"Japan's zaibatsu (literally, financial cliques) are the comparatively small group
of persons, closely integrated both as families and in their corporate
organisations, who throughout the modern history of Japan have controlled not
only finance, industry and commerce, but also the government. They are the
greatest war potential of Japan. It was they who made possible all Japan's
conquests and aggressions." 8
Similarly, General MacArthur declared in his New Year Message of 1948:
"Economically, allied policy has required the breaking up of that system which in
the past has permitted the major part of the commerce and industry and natural
resources of your country to be owned and controlled by a minority of feudal
families and exploited for their exclusive benefit. The world has probably never
seen a counterpart to so abnormal an economic system ... The integration of these
few with government was complete and their influence upon government policies
inordinate, and set the course which ultimately led to war and destruction".9
Pauley and MacArthur both had great influence on American policy toward post war Japan.10
The dissolution of the zaibatsu became a central theme of the occupation reforms and legal
measures were quickly introduced to disband the 'abnormal economic system'. Banks were
prohibited from holding more than 5% of the stock of any single corporation. Executives

62
were fired, trademarks banned and the "excessive economic concentrations" broken up into
independent companies.
The occupation ended in 1951 and by April 1952, when the Peace Treaty came into effect,
Japan was formally an independent nation. The gyoku kosu or reverse course commenced.
Little by little, many of the restrictions of the 1947 Law for the Elimination of Excessive
Concentrations of Economic Power were removed (former trade names were resuscitated),
moderated (the upper limit of share holding by a financial institution was raised from 5 to
10%), revised or ignored.11
Mitsui, Sumitomo and Mitsubishi set about reassembling their
original zaibatsu partners, while the Fuji, Sanwa and DaiIchi banks picked up the stray firms
that had survived the successful occupation demolition of their (smaller) zaibatsu parents.
These six banks became the centre of the new big keiretsu.12
The new keiretsu differed from the pre-war zaibatsu in three important ways. Firstly,
whereas the zaibatsu were commercially specialised (under the ichi gyoushuu, issha taisei,
or one group, one sector principle) and competed through evolving inter-firm economies of
scale, the keiretsu grew through a policy of rapid expansion based on what became known as
the "one set" (i.e. one of everything) principle, the result being that each keiretsu built up a
diverse range of interests so as to include almost every major field of business endeavour.
Secondly, whereas the ownership of the zaibatsu was largely concentrated in the hands of a
single family, consequent to the occupation reforms, the stock of a keiretsu firm was
distributed fairly evenly across the keiretsu group. This second feature came about as a direct
result of the upper 10% limit on shareholder ownership. The old zaibatsu holding companies
were not revived. Instead each keiretsu member brought a small percentage, typically 2 or
3%, of stock in each of the other companies of the former zaibatsu. Although small, every
keiretsu member held such a stake in almost every other firm in the group. The cumulative
effect was that between 30 and 90% of the shares of each firm were tied up in these stable
crossholdings. This strategy was further pursued through an increase in market capitalisation.
Mitsubishi, for example, increased its capitalisation 400%, allocating the 20 million new
shares to firms within its keiretsu group. As a result the concentration of Mitsubishi share
ownership rose from 10.4 to 31.1%.13

63
Despite this, however, the group bank became the primary source of finance for keiretsu
firms. This is the third major difference between the pre-war zaibatsu and the keiretsu
groups. The zaibatsu were largely directly financed. During the pre-war period shares and
retained profits accounted for 80% of total industrial income, with bank loans accounting for
the remainder. This state of affairs was largely reversed for the keiretsu. In 1951 for
example, loans from banks accounted for 62.8% of keiretsu capital income, while the own
capital contribution shrank to 25.9%.14
Loans from related banks enabled keiretsu firms to
raise finance without losing corporate control by issuing large volumes of stock to outside
shareholders. Hence commercial banks became the main provider of funds for industry,
through a system of indirect finance that remains a central feature of Japanese business today.
In this way, the construction of the new keiretsu system began. The reconstitution of Mitsui,
for example, was more or less complete by 1956. Despite running counter to the original
Occupation ideals, the economic restructuring met with the tacit approval of the US as since
the fall of imperial China, Japan was perceived as a bulwark against the rise of communist
East Asia.15
The Role of Government
After its shattering defeat in World War II, Japan faced severe economic problems. Material
losses were estimated at a quarter of the total national wealth and two thirds of the nation's
capital stock were destroyed. Real GNP per capita had fallen to half the pre-war level.
Hence the first priority of the occupying forces had been emergency shipments of food and
raw materials. However, after 1948 the emphasis of US policy shifted toward economic self
reliance for Japan. In order to industrialise as fast as possible, extensive government
involvement was required, specifically in the form of industrial policy.16
In 1949 the Ministry of International Trade and Industry (MITI) was established. Under its
aegis, a Development Bank was created as a source of low interest funds for industrial
investment; tax reforms were introduced in the form of investment allowances; sectoral
priorities were established; infant industries protected; a system of foreign exchange
allocation was developed (which in practice gave officials the ability to direct raw materials
to selected companies); and technical co-operation agreements were made with foreign firms,
especially American ones. The policy of prohibiting direct foreign investment that had begun

64
under US Occupation continued throughout the next couple of decades. Direct foreign
investment was not encouraged and, as a result, the introduction of foreign technology was
achieved through technical co-operation agreements rather than turn key factories. Many
foreign companies were only too willing to sell their technology as the Japanese market was
considered too small to be worth developing. This had a direct impact on carbon fibre
manufacture as it encouraged foreign companies to license patents since direct manufacturing
in Japan had to ruled out. Furthermore, as Japan was a comparative latecomer to many
technologically based industries, it had the advantage of investing directly in more modern
facilities than foreign rivals.
Supervision was exercised by means of what was called gyosei shido (administrative
guidance) which enjoyed semi-legal status, and survived challenge under the antimonopoly
laws of 1952. MITI used these powers to improve the competitiveness of Japanese business
through actively sponsoring the formation of new keiretsu centred on the big banks, the
largest of which were closely related to the pre-war zaibatsu which, as we saw, had been
dissolved during the first phase of the occupation. With MITI assistance, however, the major
keiretsu such as Mitsubishi and Mitsui were back in full scale operation by 1955.17
Hence by the mid-1950s, American assistance and MITI policy had laid the foundations for
what was to be an exceptional surge of industrial development. Aside from direct
government support, Japanese industry benefited from several exogenous factors. The world
economy as a whole was undergoing a period of expansion. During the Korean War (1950-
1953), the United States set up a special procurement programme in Japan to buy supplies
and repair equipment. Currency earnings on this account were almost $600 million in 1951,
over $800 million in 1952 and again in 1953, making possible large new investment in plant
and equipment. This greatly aided Japan to achieve a balance of payments throughout an
otherwise difficult period. Meanwhile, domestic social changes such as land reform,
introduced in part by the Occupation, ensured that gains were widely spread (thus ensuring a
large domestic market), and the Japanese population's high propensity to save made capital
more readily available for investment.18
Although post-war Japan had low wage advantages and lower comparative costs of
production, the Japanese government adopted a strategy of concentrating on capital and

65
technology intensive industries. These involved much higher initial risks and costs but
offered many longer term advantages, of which the most important was the potential for high
income, rapid gains in technological advancement and the prospect of faster improvements in
labour productivity.
In short, government industrial policy was targeted primarily at rapid economic growth. And
indeed, the result has been a phenomenal increase in wealth; between the years 1950 and
1990, real income per head rose from $1230 (in 1990 prices) to $23,920, a growth rate
average of 7.7% per annum.19
This compares to just 1.9% in the United States. During its
period of fastest growth (1955-1970) the Japanese economy achieved a rate of average annual
growth of over 10%. Japan was hit badly by the oil crises of the early 1970’s and these,
combined with the Nixon shock2 of 1971, slowed the country's economic growth to around
4.5% per annum. (Still higher, however than any other major industrial power throughout the
decade.) In response to these crises, MITI's policy shifted away from industries that
depended heavily on imported raw materials and towards more technologically intensive,
energy efficient, value added sectors20
. This is reflected in the list of Japan's top fifty
industries (in terms of export market share), which uniquely includes no natural resource
intensive sectors. 21
Finally, we should also note that Japanese industry in general is relatively stable, not least of
account of the high level of co-operation between management and labour and the
comparatively constant political environment. Large firms are additionally stabilised by the
copious number of small companies. These bear the burden of adjustment during market
fluctuations so muting business cycles.
Corporate Governance
Following the developments described above, present day Japanese industry possesses
several distinguishing features. The three most important, for our purposes, are:
a high rate of savings and investment; 2 In August 1971, President Nixon suspended the gold convertibility of the dollar (thus ending the Bretton
Woods system of fixed exchange rates), and announced a 10% surcharge on imports into the US. Japan was
consequently forced to cut its fast export led growth.

66
a high rate of indirect financing; and
a high number of corporate alliances.
Since the 1950's, Japanese savings rates, according to every measure, have been the highest
in the world and have often exceeded those of other major industrial countries by a factor of
two or more. This especially held true in the very high growth years before the oil shock.
During the period 1970-1972, for example, Japanese households and unincorporated
businesses saved 13.5% of GNP. The corresponding figure for the United States was 5.3%.
The net savings of Japanese corporations was 5.8% of GNP compared to 1.5% in the States.
The Japanese government saved 7.3% net of GNP. The net savings of America's government
was 0.6%. Hence Japan's total net savings over the period was 26.6% compared to just 7.4%
in the United States.22
Household savings are the largest component of Japan's total savings and have been
approximately 75% higher than in the West over the last 25 years. Despite a gradual decline
in the propensity to save, the Japanese still manage to save at a level some 50-60% higher
than the OECD average. The high rate of private savings has been attributed to the
importance of educational expectations, high housing costs, a tradition of frugality, and the
uncertainty surrounding welfare provision. Probably the major factor, however, is state
incentives in the form of tax exemptions (50-60% of personal savings are tax exempt).
Japanese post office savings carry additional special privileges and now constitute the largest
single collection of retail deposits in the world.23
Whatever the reasons, the results have been that every component of Japan's savings has been
high by international standards. This exceptionally high savings rate, sustained over many
years, has spurred (and financed) a correspondingly high rate of capital investment through
indirect finance. This has been noted by many commentators. The OECD, for example,
reports that throughout the 1960's, 70's and 80's, the rate of fixed capital investment in Japan
was significantly higher than in other G7 countries. As individual Japanese savers have long
favoured low risk investments with easy access for withdrawals, bank and post office savings
take two thirds of individual deposits. The state has played a pivotal role in transferring these
savings into investment in both private and public sectors. The chief mechanism by which
this takes place is the state run Fiscal Investment and Loan Program (FILP).

67
The FILP is run by the Ministry of Finance and effectively acts as a bank within the
government. Since its establishment in 1953, the flow of funds through FILP has been
considerable. In the 1980s, for example, the FILP budget was equivalent to 30% of total
investment or 10% of GNP. BY 1987, FILP funds had reached over 27 billion yen, or half
the government's general budget for that year.24
Around 50% of FILP funds are private
savings collected by the state through the post office system. FILP then makes loans at lower
than market interest rates to a variety of public agencies. Aside from such bodies as local
government and public transport and communication enterprises, around a half of FILP
allocations are earmarked for public finance institutions, which in turn provide loans to
private companies. Hence, FILP provides a mechanism through which the accumulated
savings of households are channelled via a state institution into private sector industry.
Since savings have been in good supply, real interest rates have remained generally lower
than those of other major industrial economies. Moreover, since inflation, too, has been
relatively low, Japan's nominal interest rates have also been below those of other G7
countries.25
As we have seen, the bulk of private savings are deposited into banks and post
offices, which in turn lend to private industry. Companies are further encouraged to rely on
loans as, in contrast to dividends, loan interest is tax deductible. As a result, there is a
relatively high level of indirect finance and a consequent low rate of self capitalisation
amongst Japanese firms. Okimoto, for example, has demonstrated that, over a given period,
marketable securities, such as stocks and bonds, accounted for 35.9% of the total non-
monetary assets of US corporations compared to only 12.9% in Japan.26
Japanese companies
instead had a pronounced preference for raising finance through bank loans. In short, the
high level of investment in Japan is largely financed indirectly through the banks in contrast
to US companies who rely more heavily on internal funds.
The predominance of indirect financing is further strengthened, as we have seen above, by
the organisational structure of Japan's private sector, in particular the keiretsu system. We
should first briefly note that there are two basic keiretsu classifications. These are known as
yoko (horizontal) and tate (vertical). The vertical keiretsu have a pyramid structure with a
single large manufacturing company at the apex supported by hundreds of small sub-
contractors. Toyota is one example. Horizontal keiretsu are the enormous groups of loosely

68
affiliated companies held together through interlocking share holdings, mutual business
transactions and a common main bank. A horizontal keiretsu typically includes a big bank,
several large capital intensive manufacturing companies and a trading house. The big six
keiretsu are based on the Fuji, Sanwa, DaiIchi, Mitsui, Mitsubishi and Sumitomo Banks -
Toyota is a member of Mitsui. All the carbon fibre manufacturers are affiliated to horizontal
keiretsu to some degree and hence it is this type which are the focus of this discussion.
Although nominally independent companies, keiretsu companies are linked together through
reciprocal share holding, interlocking directorships, and intra-keiretsu trading and credit
relations. Increasingly, technological cross-licensing is an additional characteristic.
However, keiretsu groups do not act as single corporations and it is quite common for
financial corporations from other keiretsu to also hold stock and extend loans (but to a
smaller degree). Significant cross keiretsu ties exist through inter-keiretsu stockholdings and
business transactions. Within a keiretsu, firms will compete intensely to increase their own
market share even at the expense of rivals within the group. Moreover, it is not unusual for a
company to belong to more than one keiretsu. Nissho Iwai, for example, belongs to both
Sanwa and DaiIchi Kangyo. Hitachi, the keiretsu no chou (keiretsu butterfly), belongs to
three (Dai-Ichi Kangyo, Sanwa and Fuyo). Here we define a core firm of a keiretsu as one
that is an official member of the group's presidential council and an affiliated firm as one in
which core firms collectively hold a minimum 10% stake.
By way of example, Table 3.1 shows a breakdown of the Mitsubishi keiretsu:

69
Table 3.1: Structure of the Mitsubishi Keiretsu Group
Firm Percentage of firm owned by
keiretsu members
Mitsubishi Corporation 32%
Mitsubishi Bank 26%
Mitsubishi heavy Industries 20%
Mitsubishi Trust and Banking 28%
Tokio Marine & Fire Insurance 24%
Meiji Mutual Life Insurance 0%
Mitsubishi Motors 55%
Nikon Corporation 27%
Kirin Brewery 19%
Mitsubishi Oil 41%
Mitsubishi Electric 17%
Mitsubishi Plastics Industries 57%
Mitsubishi Petrochemical 37%
Mitsubishi Gas Chemical 24%
Mitsubishi Metal 21%
Mitsubishi Aluminium 100%
Mitsubishi Steel Manufacturing 38%
Asahi Glass 28%
Mitsubishi Construction 100%
Mitsubishi Cable Industries 48%
Mitsubishi Paper Mills 32%
Mitsubishi Rayon 26%
Mitsubishi Mining and Cement 37%
Mitsubishi Estate 25%
Mitsubishi Kasei 23%
Mitsubishi Warehouse and Transportation 40%
Mitsubishi Kakoki 37%
Nippon Yusen 25%
Source: Johnson27

70
The keiretsu is composed of 28 core firms which all hold mutual equity and which each have
at least one director from another Mitsubishi company. There are an additional 217 affiliated
firms i.e. those with 10% or more equity held by core keirestu members. These include the
Honda Motor Corporation and Nikko Securities (one of the big four brokers in Japan).
Together these firms generate annual sales of $360 billion dollars (fiscal 1990). The three
central firms are the Mitsubishi Corporation (a trading company), Mitsubishi Bank and
Mitsubishi Heavy Industries. Mitsubishi banks acts as the primary source of funding for the
industrial members of the group. Aside from the main bank, there are two insurance firms
and a trust company. There are over twenty manufacturing core firms covering a wide range
of industries. In almost every case, over 20% of the stock of each core company is held
within the keiretsu.
On almost every measure, the big six keiretsu banks are ranked the largest in the world and
collectively Japanese banks account for over a third of OECD total banking assets.28
Table
3.2 lists the world’s largest banks by assets and capital.
Table 3.2: World’s Biggest Banks, 1995
Bank Country Assets $bn Capital$mil
Tokyo Mitsubishi Japan 819.0 28,221
Sanwa Japan 582.2 19,577
Dai-Ichi Kangyo Japan 581.6 19,360
Fuji Japan 571.1 19,388
Sumitomo Japan 566.0 22,120
Sakura Japan 559.5 18,549
Deutsche Germany 503.4 -
Industrial Bank of Japan Japan 433.3 13,596
Norinchukin Japan 429.3 3,367
Long Term Credit Bank Of Japan Japan 371.6 -
Sources: Economist29

71
Keiretsu Economics
Under neo-classical economic theory, the objective of a financial corporate grouping is to
enhance the profitability of member firms. However, Nakatani, in his seminal examination of
the financial and corporate governance of keiretsu firms30
demonstrates that the rate of
business profits over total assets is negatively correlated with keiretsu membership. Hence
we must look for motivations other than profit maximisation in the formation of these
corporate financial groups.
Several authors have noted the comparative stability of the Japanese business environment.
In 1990, the Economic Planning Agency compared the sensitivity of Japanese and US stock
prices to their short term profit by measuring fluctuations in the price to earning ratio (stock
price/current profit after tax). American stock prices were found to follow variations in short
term profits very closely. Japanese stock prices, on the other hand, were little influenced by
changes in short term profit. As a result, the paper concludes,
"Japanese stock prices are less sensitive to fluctuations in short term profit and
that the shareholders' focus on the short term achievement of the corporation is
less pronounced in Japan." 31
Similarly, Nakatani has shown that, all else being equal, the variance over time of business
profits over total assets is considerably smaller for group firms. Moreover, even the variance
of the growth rates of keiretsu firms is significantly lower than that of independent
companies.32
This stability enables keiretsu members to more easily pursue new growth sectors. Finance
can be raised quickly for new ventures by distributing stock amongst the keiretsu members
through the central bank. This reduces the underwriting costs and uncertainties of new
issues. Ventures involving, for example, new technology or some other high risk element are
often jointly financed by the group. This spreads the risk and the burden of debt should the
project fail. It enables a broader range of manufacturing expertise to be exploited and in
some cases guarantees a market for the new product. For a business like carbon fibre, the
sunk costs are relatively high and production very capital intensive. These factors restrict the
possibilities of transferring the burden of adjustment to small subcontractors should the

72
project fail and so increases significantly the importance of the additional protection provided
by keirestu membership.
Group membership also has a profound effect on the corporate governance of keiretsu firms.
The dividends paid out by keiretsu firms are consistently lower than those of similar
companies. The system of interlocking shareholders not only cements relationships but
protects firms from the dictates of market imperatives. Unlike in the US, where the value of
stock may plummet if short term profits fall, hostile acquisition is relatively rare in Japan as
group stockholding reduces the availability of stock to outsiders. In 1992, The Economist
reported,
"The stockmarket value of no fewer than 234 of 2,045 publicly quoted
Japanese companies is less than their net book value, a measure of a firm's
assets minus its liabilities. At least theoretically, these firms should be worth
more broken up than as going concerns. As a result, many Japanese companies
now look seriously underpriced by the stock market. Over the past few
months, the market capitalisation of such well known manufacturers as
Nissan, JVC, Hitachi Maxell, Fuji Heavy Industries and Minebea has dropped
well below the level of their shareholders' equity.
Despite their low prices, many of these firms remain immune to take-
over, or at least of the unwelcome variety. The clubby atmosphere of
corporate Japan rules out hostile bids for big companies [as] 70% or more of
their shares are locked up safely with their banks, corporate cousins and other
friendly firms."33
Hence, Japanese companies do not feel the same compulsion to yield high dividends so long
as the real value of the stock appreciates. Indeed, during the 1980’s the rate of dividend of
Japanese manufacturing as a whole was only 11.3% compared to 19.6% in the US.34
Similarly, Nakatani finds that the rate of dividend over paid in capital is much smaller for
keiretsu companies compared to a set of matched independent firms.35
Low dividends give a
company the stability and flexibility to re-invest a higher proportion of profit into longer term
market share strategies. Large UK firms, for example, spend on average 2.29% of turnover
on R&D, compared to 5.9% for their counterparts in Japan.36

73
The low rate of dividend is brought about by several factors. Firstly, dividend payouts in
general are less important for long term shareholders as long as the capital value of the stock
appreciates. Moreover, intercorporate dividends are not tax exempt in Japan and so the
keirestu as a whole benefits if the dividends arising from reciprocal shareholdings are kept
low. Clearly low dividends do not benefit independent, individual shareholders. These
shareholders, however, have little say in Japanese corporate affairs. Nearly 90% of all
Japanese companies hold their annual meeting on the same day. Hence it is a physical
impossibility for a single shareholder to vote in more than a few meetings. This is largely
irrelevant anyhow as Japanese annual meetings are pro forma events that rarely last more
than half an hour.3 Indeed, it is not unknown for companies to compete to claim the shortest
meeting.37
Hence the real power base of the firm lies within the board, which, for those firms that fall
within a keirestu group, is influenced to an uncertain degree by the shacho-kai (presidential
council). Each of the big six keiretsu has a committee of core company presidents that meets
every month (or every three months in the case of Dai Ichi Kangyo). That is,
“every month the Sanwa Group must gather its most important 44 top executives
in a room; the Mitsubishi and Fuyo Groups must each call the roll for 29 CEOs;
Mitsui has 26 and Sumitomo 20. Even without the DKB Group ... that’s a total
of 148 of the top executives from the most important companies in Japan coming
together every four weeks.”38
The role of the presidential council is to examine group dealings with respect to other
keiretsu and the business community as a whole. It mediates intra-group conflicts and
discusses the group’s interests vis à vis government affairs. According to the Japanese
economist Yoshinari Maruyama, however, the council’s most important function is to plan
company strategies within the context of the group.39
As an example, in 1990, Ken-Ichi Imai
published a study of NEC in which he found that around a third of NEC’s huge investments
3 As a case in point, the 1996 Sumitomo annual meeting, the first following the revelation that the company had
lost $1.8 billion through unauthorised trading by a single employee, lasted just 40 minutes (Economist June
29th 1996).

74
in semiconductor technology had been funded by fellow firms within the Sumitomo keiretsu.
He concludes,
“Information exchange was the key for innovation and investment. ... This system
[of keiretsu grouping] has contributed considerably to innovative financing in
Japan.”40
Finally, membership of a keiretsu makes it easier for companies to borrow money. Banks
clearly have a vested interest in expanding those companies in which they themselves hold
stock and may offer preferential terms such as lower interest rates or flexible borrowing
limits. A high level of co-operation exists between keiretsu banks and affiliated companies,
rooted in their common interests. Companies benefit from the reduced levels of uncertainty
concerning their future plans. Banks benefit not only directly from their company customers
but also indirectly as company employees deposit their own personal savings with the bank
most closely associated with their firm. As keiretsu firms are perceived as low risk
borrowers, even banks outside the group will loan money at a discount rate.
Hence keiretsu membership provides a comparatively stable business environment and ease
of access to long term capital. The system of interlocking shareholders not only cements
relationships but also cushions the impact of market fluctuations, enabling keiretsu
companies to adopt longer time horizons when planning future strategies. Planning horizons
are clearly set out in Japanese annual reports. "Medium term" is typically defined as five to
ten years and "long term" ten years or more. These are approximately twice the
corresponding US time-scales.41
The stable business environment also enables keiretsu
members to more easily pursue new growth sectors. Finance can be raised quickly for new
ventures by distributing stock amongst keiretsu members through the central bank. Ventures
involving, for example, new technology or some other high risk element are often jointly
financed by the group. This spreads the risk and the burden of debt should the project fail.
The broad industrial base of each keiretsu results in wide range of accessible manufacturing
expertise and in some cases guarantees a market for the new product.

75
Summary
We have seen that tax exemptions have ensured a high level of personal savings in Japan.
These are for the most part deposited in banks and post office savings accounts rather than
invested directly in shares. The additional privileges afforded to post office savings and the
FILP mechanism allows the Japanese government to implement industrial policy by
channelling private savings into selected private sector industries. Companies, too, are
encouraged to raise money for investment through bank borrowing rather than equity issues.
The majority of those shares that are issued are held by related companies and banks through
the keiretsu system. As a consequence, Japanese firms are less vulnerable to fluctuations in
equity markets and under less pressure to produce profit in the short term.

76
Part Two: The United States
Sunshine and Due Process: the American Corporate Environment
We will now turn to the American corporate environment and, in the light of the above
discussion, will examine those characteristics of the American corporate context most
pertinent to the growth of a high technology sector. In particular, we will trace the
development of those aspects of the Anglo-American firm that have most influenced the
carbon fibre sector, i.e., corporate governance and the capital structure of firms.
Unlike the Japanese firm, the Anglo-American company operates as an “autonomous legal
and financial entity facing largely anonymous and impersonal market pressures”.42
There are
few interfirm collective commitments and the bank-firm relationship is conducted through
classical arm's length contractual relations. This has been brought about through three
structural arrangements:
a very large and dispersed base of share ownership;
a heavy reliance on legal formalities;
and the role of contract and the role of banks and state agencies.
Origins
The Anglo-American firm has its roots in the public stock exchanges of the late nineteenth
century. In order to justify its power and acquisitiveness, American business fostered a
pragmatic philosophy drawing selectively on religious, biological, and legal elements.
Wealth was viewed as a sign of divine favour and so the acquisition of wealth considered a
moral obligation. Darwinian notions of natural selection were applied with great enthusiasm
to the economic management of the nation. (“The growth of a large business is merely the
survival of the fittest” affirmed Rockefeller.43
) Finally, the libertarian view that those that
govern least govern best was vigorously promoted.44
The United States also developed a strong, perhaps unique, belief in the sanctity of property.
In 1866, the Joint Committee on Reconstruction drew up the Fourteenth Amendment to the
Constitution prohibiting any state from depriving 'any person of life, liberty or property
without the due process of law'. This was applied with great rigour by the legal system and
through a series of rulings it was decided that the word 'person' meant a corporation as well as

77
an individual citizen. In this way, American business came to be protected from state
regulation, and corporate holdings such as charters and franchises were accorded virtually the
same rights as personal belongings.45
In reality, however, state regulation was generally unrestrictive anyhow. A firm could chose
to incorporate in any State, irrespective of where it actually operated. States competed
directly for companies, the result being that those States with the least regulation attracted
the most firms. As Charkham observes,
“The competition between states is ‘not one of diligence but one of laxity’ or in
Professor L. Cary's words ‘a race for the bottom’. If proof of this was needed, the
example of New Jersey could be cited. In 1913 its legislature reintroduced a
restrictive approach to corporations. The law lasted only four years because by
that time most corporations had transferred to Delaware.”46
Concentration of Wealth
After the Civil War, business had started to concentrate into large pools, trusts, corporations
and holding companies. These concentrations of power not only stifled competition, but also
enabled economies of scale in manufacture, transportation, marketing and administration. In
1890, Congress enacted the Sherman Anti-Trust Act. However, in case after case, as the
legislature failed to amend the Act and the executive failed to enforce it, this particular piece
of trust-busting legislation was rendered largely ineffective. After the 1895 ruling in which
E.C. Knight and Company successfully contested that its control of 98% of the sugar refining
trade did not constitute a restraint of trade, the Act lost all remaining credibility.47
Not until
the Roosevelt administration was the Sherman Act successfully invoked to break up trusts.
And so big business continued to flourish. Although the stock exchanges had existed since
the late 1700's, up to the late 19th Century, they had been primarily used for trading
government securities and railway company shares. As corporations grew, the demand for
capital to finance the rapid industrialisation soared. Firms of all kinds entered the equity
market; between 1893 and 1897, the number of industrial companies issuing shares in
America increased from 30 to 170; in Britain the rise was from 60 in 1887 to almost 600 in
1907.48

78
In 1932, Adolf Berle and Gardiner Means published The Modern Corporation and Private
Property49
a highly influential text in which it was argued that the American corporation,
typified by strong managers and fragmented ownership had emerged as an inevitable winner
of a Darwinian struggle between the different forms of corporate governance. The American
firm was seen as both the driver and the outcome of healthy neo-classical economic activity.
In an echo of Adam Smith's invisible hand, Berle and Means concluded that 'self interest ... is
the best guarantee of economic efficiency'. This belief became the central tenet of Anglo-
American capitalism.
The Role of Regulation
More recent interpretations,50
however, have averred that the Berle-Means corporation owes
its existence to American politics, in particular a series of federal measures that broke up
large financial institutions and so forced corporate ownership to remain fragmented. The
National Banking Act of 1863 and the later McFadden Act had tied banks to one state. In
1933, the Glass Steagall Act was passed, dividing investment and commercial banks and
limiting the ability of both to hold shares. At the same time, the Federal Bank Deposit
Insurance Corporation was created to guarantee individual deposits up to $5000. Despite
being denounced by the American Bankers Association as "unsound, unscientific, unjust and
dangerous"51
the scheme stemmed the run from small banks and proved to be one of the most
effective legislative outcomes of the Roosevelt’s New Deal. As a result of these measures,
American banks have tended to towards the small and local, a point emphasised by Mark
Roe:
"Large American banks play a role in the American economy equal to only one
quarter of the role played by large banks in Germany and Japan ... America still
lacks a truly national banking system like that of other nations" (original
emphasis). 52
Other providers of finance were also regulated. In 1906, large life insurers had their
shareholding restricted and similarly the Investment Company Act of 1940 discouraged
mutual funds (unit trusts) from corporate governance and required them to hold diversified

79
portfolios. In this way, the big share holders were effectively ruled out and the Berle-Means
firm was left as the best available option.
Ownership and Control
And so the American pattern of share ownership emerged. In comparison with Japan and
Germany, share ownership is widespread and fragmented, as illustrated in Table3.3.
Table 3.3: Biggest Shareholders: percent of total shares
General Motors Toyota Daimler-
Benz
Mich. St. Treas. 1.42% Sakura Bank 4.9% Deutche
Bank
41.80%
Bernstein-
Stanford.
1.28% Sanwa Bank 4.9% Dresdner
Bank.
18.78%
Wells Fargo 1.20% Tokai Bank 4.9% Commerz-
bank
12.24%
CREF 0.96% Nippon Life 3.8% Sonst. Kredit 4.41%
Bankers Trust NY 0.88% LTCB 3.1% Bayerische L-
Bk.
1.16%
Totals 5.74% 21.6% 78.39%
Source: Roe53
The Table shows the five largest shareholders in three comparable car producers in Japan,
Germany and the US. We can see from the Table that US shareholders own relatively small
stakes: the top five institutional shareholders in General Motors own 5.74% of the stock.
Toyota's top five own 21.6% and for Daimler-Benz the figure is 78.39%. Moreover, as we
see below, over 50% of US shares are in the hands of individuals (Table 3.4), over twice the
percentage of Japan and Germany. By contrast, substantial percentages of German and
Japanese stock are held by banks and firms with business links to the company.

80
Table 3.4: Share Ownership in Germany, Japan, the UK and the US
Germany(%) Japan(%) UK(%) US(%)
Individuals 23 21 21 52.5
Banks 10.5 16
Pension Funds 35 17.5
Companies 42 28
Mutual funds
Insurance Unit
Trusts
3.5 14 23 21
Overseas/
Other
21 21 21 9
Source: Economist54
Widespread share ownership is underpinned in America by a liquid and vigorous stock
market. Whereas there are restrictions on the exchangeability of shares in Japan and
Germany, US stocks are freely traded. Central to the ideal of free trade is the notion of
disclosure - in an efficient market, the theory goes, the price of shares incorporates all
known information about a company. In the US, the Securities and Exchange Commission
(SEC) was established to ensure than no one shareholder had better access to information
than any other. Under the Sunshine Act, companies were obliged to disclose fairly
comprehensive financial data and the SEC empowered to prosecute insider traders.
Furthermore, if ten or more shareholders meet, all the other shareholders must be informed
and similarly if shareholders who possess 5% or more of a company's stock agree to act
together, disclosure is required by law. This is in sharp contrast to the regular Japanese
presidential council meetings where companies privately discuss the future of firms in which
collectively they may hold 70% or more of stock.
In short, the ownership and control of Anglo-American companies are separated to a high
degree. Unlike in Germany or Japan, where shareholders have both influence and a large
stake in corporate performance, US shareholders are generally uninvolved in the management
of the firm and have little incentive to take a long term view. As The Economist has
observed,

81
"To share holders in a typical public company in America or Britain ... a share is
little more than a betting slip. A title deed to a house tells an American or Britain
what he knows instinctively: that he owns the place and must care for it. A share
certificate tells him nothing more than he has the chance to make some cash."55
Any shareholder who wants to exercise ownership rights, for example to improve the long
term performance of a company, must undertake all the expense for only a pro rata share of
the gains. In short, although it may be in the best interest of the firm to be financed by stable
long term investors, it is in the best interest of the shareholder to sell at the first sign that a
stock may have reached a trading peak. Hence a wide share ownership has a tendency to
dissipate the individual responsibilities of the stockholders toward the long term health of the
firm.
The impersonal nature of dispersed share ownership, combined with an active market, gives
US managers a powerful incentive to worry about share price. We have seen in previous
sections that whereas Japanese share prices are relatively stable, US share prices closely
follow fluctuations in dividend. If share prices fall, the US firm is left vulnerable to a hostile
take-over, in which quite possibly the whole board may be replaced. Hence the Anglo-
American corporate board is under a strong compulsion to yield high rates of return and
indeed, dividend payouts ratios are much lower in both Japan and Germany. Mayer,56
for
example, has noted that the proportion of earnings paid out as dividends by UK firms were
around three times as high those of German firms over the period 1982 to 1989, even though,
if anything, retentions are discouraged by the German tax system. Table 3.5 below shows the
ratio of dividend payout to income for UK, US and Japanese non-financial corporations.

82
Table 3.5: A Comparision of Dividend Payout Ratios
Year UK(%) USA(%) Japan(%)
1974 24 17
1975 20 18
1976 20 17
1977 36 19 16
1978 37 20 15
1979 41 20 13
1980 45 23 14
1981 45 22 14
1982 49 25 15
1983 48 23 13
1984 45 21 12
1985 46 20 10
1986 34 22 12
1987 39 22 10
1988 42 21 10
1989 41 28
Source Charkham57
We can see from Table 3.5 that over the period 1974-1990, the ratio of dividend to income
has been consistently higher for the UK (at between 35 to 50%) and the US (20 to 30%) than
Japan (only 10 to 18%). Theoretically, dividends should simply reflect the balance between
residual earnings that are available for distribution and the internal requirements of the firm
for investment. However, according to Mayer,
“US dividends appear to be set according to conventions that include a strong
reluctance to cut dividends below those of previous years."58
rather than on the actual performance or health of the firm. Although beneficial for the
shareholder in the short term, high rates of dividend mean the that firm has lower retained
earnings available for future investment.
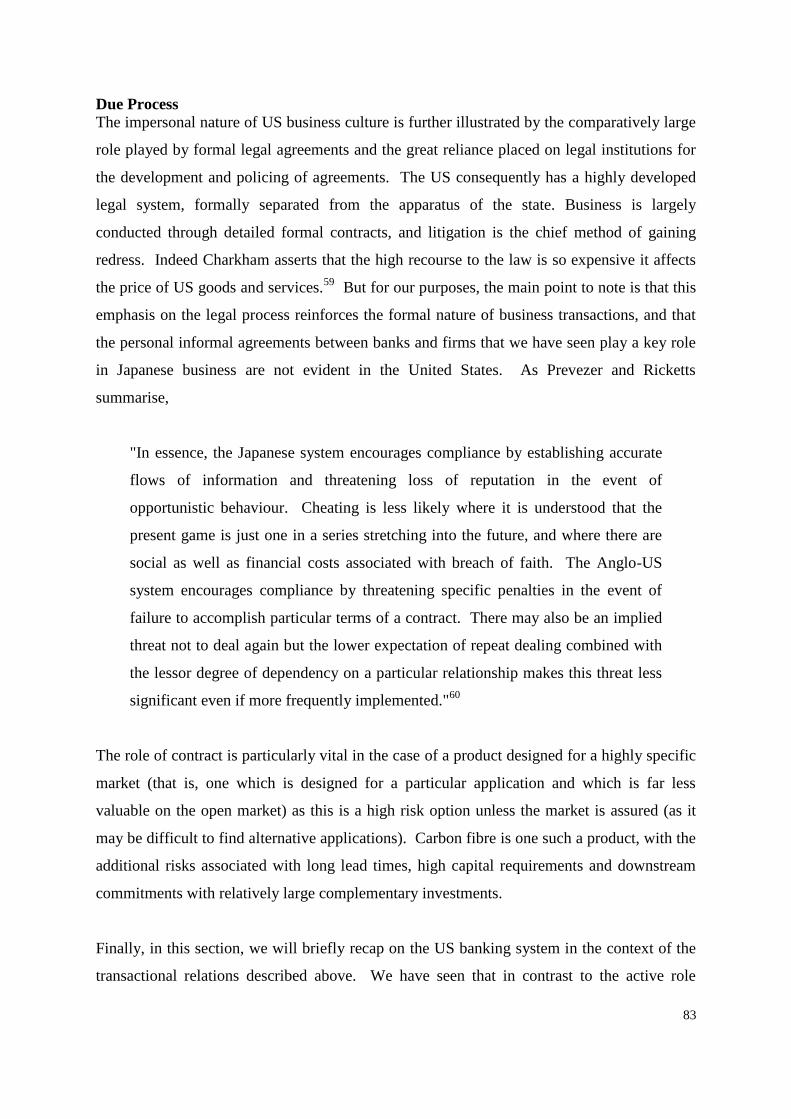
83
Due Process
The impersonal nature of US business culture is further illustrated by the comparatively large
role played by formal legal agreements and the great reliance placed on legal institutions for
the development and policing of agreements. The US consequently has a highly developed
legal system, formally separated from the apparatus of the state. Business is largely
conducted through detailed formal contracts, and litigation is the chief method of gaining
redress. Indeed Charkham asserts that the high recourse to the law is so expensive it affects
the price of US goods and services.59
But for our purposes, the main point to note is that this
emphasis on the legal process reinforces the formal nature of business transactions, and that
the personal informal agreements between banks and firms that we have seen play a key role
in Japanese business are not evident in the United States. As Prevezer and Ricketts
summarise,
"In essence, the Japanese system encourages compliance by establishing accurate
flows of information and threatening loss of reputation in the event of
opportunistic behaviour. Cheating is less likely where it is understood that the
present game is just one in a series stretching into the future, and where there are
social as well as financial costs associated with breach of faith. The Anglo-US
system encourages compliance by threatening specific penalties in the event of
failure to accomplish particular terms of a contract. There may also be an implied
threat not to deal again but the lower expectation of repeat dealing combined with
the lessor degree of dependency on a particular relationship makes this threat less
significant even if more frequently implemented."60
The role of contract is particularly vital in the case of a product designed for a highly specific
market (that is, one which is designed for a particular application and which is far less
valuable on the open market) as this is a high risk option unless the market is assured (as it
may be difficult to find alternative applications). Carbon fibre is one such a product, with the
additional risks associated with long lead times, high capital requirements and downstream
commitments with relatively large complementary investments.
Finally, in this section, we will briefly recap on the US banking system in the context of the
transactional relations described above. We have seen that in contrast to the active role
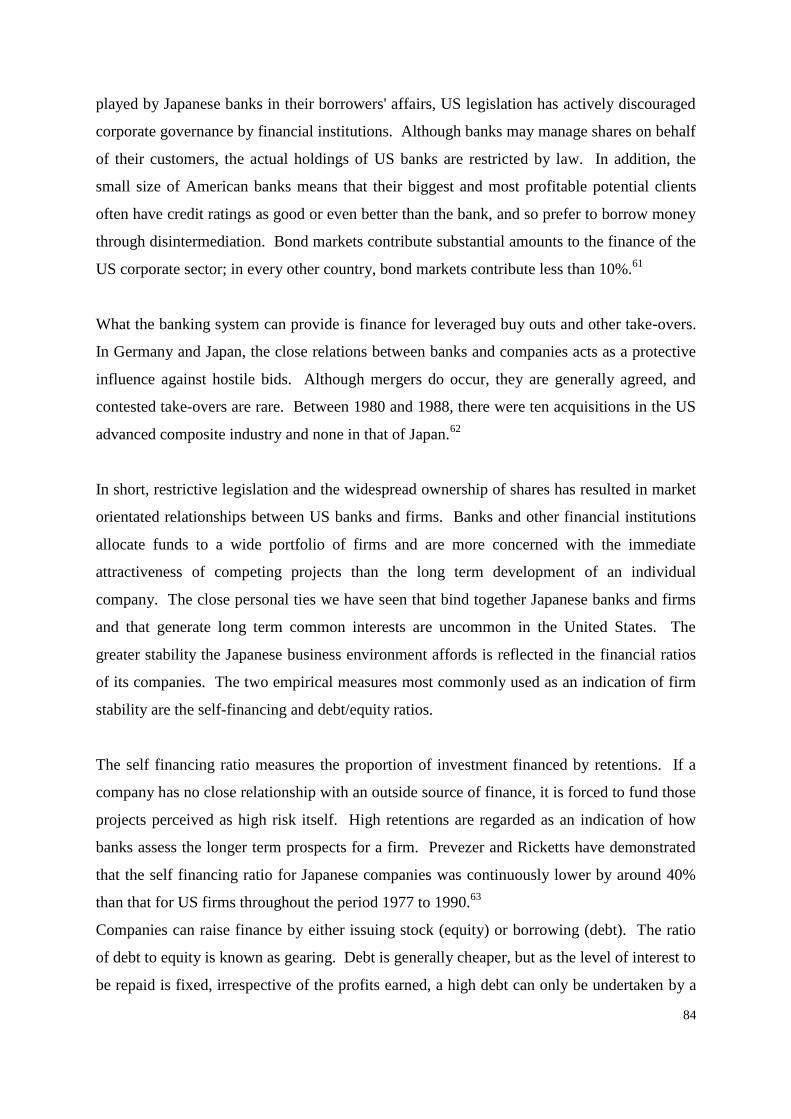
84
played by Japanese banks in their borrowers' affairs, US legislation has actively discouraged
corporate governance by financial institutions. Although banks may manage shares on behalf
of their customers, the actual holdings of US banks are restricted by law. In addition, the
small size of American banks means that their biggest and most profitable potential clients
often have credit ratings as good or even better than the bank, and so prefer to borrow money
through disintermediation. Bond markets contribute substantial amounts to the finance of the
US corporate sector; in every other country, bond markets contribute less than 10%.61
What the banking system can provide is finance for leveraged buy outs and other take-overs.
In Germany and Japan, the close relations between banks and companies acts as a protective
influence against hostile bids. Although mergers do occur, they are generally agreed, and
contested take-overs are rare. Between 1980 and 1988, there were ten acquisitions in the US
advanced composite industry and none in that of Japan.62
In short, restrictive legislation and the widespread ownership of shares has resulted in market
orientated relationships between US banks and firms. Banks and other financial institutions
allocate funds to a wide portfolio of firms and are more concerned with the immediate
attractiveness of competing projects than the long term development of an individual
company. The close personal ties we have seen that bind together Japanese banks and firms
and that generate long term common interests are uncommon in the United States. The
greater stability the Japanese business environment affords is reflected in the financial ratios
of its companies. The two empirical measures most commonly used as an indication of firm
stability are the self-financing and debt/equity ratios.
The self financing ratio measures the proportion of investment financed by retentions. If a
company has no close relationship with an outside source of finance, it is forced to fund those
projects perceived as high risk itself. High retentions are regarded as an indication of how
banks assess the longer term prospects for a firm. Prevezer and Ricketts have demonstrated
that the self financing ratio for Japanese companies was continuously lower by around 40%
than that for US firms throughout the period 1977 to 1990.63
Companies can raise finance by either issuing stock (equity) or borrowing (debt). The ratio
of debt to equity is known as gearing. Debt is generally cheaper, but as the level of interest to
be repaid is fixed, irrespective of the profits earned, a high debt can only be undertaken by a

85
firm confident that its prospects are secure. Equity can be more expensive if the firm does
well, but as the dividend is decided by the company, the risk is reduced. Hence a firm seeks
to strike a balance between the benefits of high gearing (lower cost) and the financial risk it
takes if gearing becomes to high. A stable firm can enjoy a higher gearing ratio, because it
can accommodate the associated risk. Hence debt/equity ratios are a common measure of
longer term stability of a firm.
Table 3.6: A Comparison of Debt Equity Ratios
Year Japan USA UK
1974 0.56
1975 5.6 0.52
1976 5.72 0.50
1977 5.49 0.51 1.06
1978 5.49 0.50 1.08
1979 5.49 0.49 1.06
1980 5.16 0.48 1.06
1981 5.04 0.47 12.10
1982 5.02 0.47 1.13
1983 4.84 0.50 1.10
1984 4.77 0.56 1.09
1985 4.40 0.61 1.04
1986 4.22 0.67 1.04
1987 4.36 0.71 1.03
1988 4.19 0.76 1.03
1989 0.82 1.14
Source Charkham64
Table 3.6 compares the debt/equity ratio averages in Japan, US and the UK . It can be seen
that the US and UK have a far lower gearing than Japan. Japanese firms have a distinct
preference for raising finance though debt rather than equity, and consequently demonstrate
much higher gearing ratios. This provides a very strong indication of the comparative
stability of Japanese over American firms.
86
Conclusions
To summarise, we have seen how through a combination of politics, law and economic
factors, American industry developed into an approximate free trade economy. We have
shown how together these influences have led to contractual, neo-classical bank-industry
relations and a system of shareholding that combine to forfeit the long term interests of the
American firm.
Japanese industry, in contrast, is characterised by high levels of investment and a system of
interlocking shareholding and close bank-industry ties that consolidate common interests and
stabilise the manufacturing sector, This stability enables companies to adopt longer time
horizons (typically six to ten years as opposed to two or three years in Europe and the US)
when planning future investment strategies, a particularly important criteria for the advanced
material industries where the time scales between initial investment and turning a profit are
particularly long. In short, Japanese companies are more able to perform robustly during
difficult trading conditions and ride out short term recessions. We shall now see that this has
had a profound influence on the development of the carbon fibre industry.
References
1 Goldsmith, Raymond, W. The Financial Development of Japan, 1986-1977, Yale University Press,
1983
2 Tatewaki, Kazuo. Banking and Finance in Japan: an introduction to the Tokyo market, Routledge,
1991
3 Fruin, Mark W. The Japanese Enterprise System: Competitive Strategies and Co-operative
Structures, Clarendon Press, Oxford, 1992
4 Fruin, Mark, W., op.cit.3
5 Goldsmith, Raymond, W., op. cit.1
6 Fruin, Mark W., op. cit.3
7 Miyashita and Russell, Keiretsu McGraw-Hill, 1994
8 Quoted in Tsuru, Shigeto Japan’s Capitalism: Creative Defeat and Beyond, Cambridge University
Press, Cambridge, 1993
9 Quoted in Tsuru, Shigeto, ibid.
10 ibid
11 ibid.
12 Aoki, Masahiko, ‘Aspects of the Japanese Firm’, in Aoki, Masahiko, Ed. The Economic Analysis
of the Japanese Firm, Elsevier Science Publishers, Amsterdam, 1984
13 Tsuru, Shigeto, ibid.
14 Tsuru, Shigeto, ibid.
15 Tsuru, Shigeto, ibid.
16 Beasley, W.G, The Rise of Modern Japan, Weidenfield and Nicolson, 1990
17 Johnson, Chambers, MITI and the Japanese Miracle, Stanford University Press, 1982
18 Eccleston, Bernard, State and Society in Post War Japan, Polity Press, 1989
19 The Japanese Economy, The Economist March 6th, 1993

87
20 Iwani, Toru, Japan in the International Financial System, MacMillan Press, 1995
21 Porter, Michael, The Competitive Advantage of Nations, Macmillan, 1990
22 Survey of the Japanese Economy, The Economist, March 6th, 1993
23 Tatewaki, Kazuo, op.cit.2
24 Tatewaki, Kazuo, op.cit.2
25 See The Economist, 23rd September 1995
26 Okimoto, Daniel Between MITI and the Market: Japanese Industrial Policy for High Technology,
Stanford University Press, Stanford, 1989
27 Johnson, Hazel, The Banking Keiretsu, Probus Publishing, 1994
28 A Complete Guide to the World in Figures, Economist Books, 1992
29 Asset data from Survey of International Banking, The Economist April 27th, 1996; Capital data
from The Economist April 1st, 1995
30 Nakatani, Iwao, The Economic Role of Financial Corporate Grouping, in Aoki, Masahiko
op.cit.12
31 Japanese Government, Economic Planning Agency Economic Survey of Japan, August 1990
32 Nakatani, Iwao, op.cit.30
33 The Economist, July 25th, 1992
34 Japanese Economic Planning Agency, op.cit.
35 Nakatani Iwao, op.cit.30. See also The Economist, June 4th 1994 for data on national differences
in the proportion of profit paid out as dividend
36 Fisher, Andrew A Key to the Pace of Recovery, The Financial Times, April 21st, 1993
37 Monks, Robert and Minows, Nell, Corporate Governance, Blackwell, 1995
38 Miyashita, Kenichi and Russell, David Keiretsu, McGraw-Hill,1994
39 Quoted in Miyashita and Russell, op.cit.7
40 Quoted in Miyashita and Russell, op. cit.7
41 Monk and Minows, op. cit.37
42 Whitley, Richard,. Business Systems in East Asia, Sage Publications, London, 1992
43 Quoted in Jones, Maldwyn, The Limits of Liberty, Oxford University Press, 1983
44 Morison, Samuel Eliot, Commager, Henry and Leuchtenburg, William, A Concise History of the
American Republic, Oxford University Press, 1982
45 Morison et al. op. cit.44
46 Quoted In Charkham, Jonathan P., Keeping Good Company: a study of Corporate Governance in
Five Countries, Oxford University Press, Oxford, 1994
47 Jones, op.cit.43
48 The Economist, Survey of Capitalism, May 5th 1990
49 Berle, Adolf, A., and Means, Gardiner, The Modern Corporation and Private Property,
Macmillan, 1932
50 See for example, John Pound, The Rise of the Political Model of Corporate Governance and
Corporate Control, New York University Law Review, Vol. 68:1001, November 1993
51 Morison et al., op. cit.44
52 Roe, Mark J., The Differences in Corporate Structure in Germany, Japan and the United States,
Yale law Journal, Vol. 102:1927. 1993
53 Roe, op.cit.52
54 The Economist, Survey of Corporate Finance, January 29th 1994
55 The Economist, Survey of Capitalism, May 5th 1990
56 Mayer, Colin, ‘Stock Markets, Financial Institutions and Corporate Performance’ in Dimsdale and
Prevezer (Eds) op.cit
57 Charkham, op.cit.46
58 Mayer, Colin, op.cit.56
59 Charkham, op. cit.46
60 Prevezer, Martha and Ricketts, Martin, Corporate Governance: the UK Compared with Germany
and Japan in Prevezer, Martha and Ricketts, Martin, eds, Capital Markets and Corporate
Governance, University of Oxford Press, Oxford, 1994

88
61 Mayer, Colin op.cit.56
62 Advanced Materials By Design, Office of Technology Assessment, Washington D.C., June 1988
63 Prevezer and Ricketts, op. cit.60
64 Charkham, op.cit.46

116
CHAPTER FOUR:
“A PARAGON AMONG STRUCTURAL MATERIALS”:1
THE DEVELOPMENT OF THE INDUSTRY
IN THE COLD WAR YEARS
In this chapter we first look at the historical development of the carbon fibre sector from its
inception in the 1960’s through to 1989. Over this period, carbon fibre markets grew
continuously. Carbon fibre production is a capital intensive industry with much scope for
scale economies and during this time was characterised by a virtuous circle of increasing
production, falling costs and prices and thus the opening of further markets.
The main aim of this chapter is to establish a context for Chapter Five, in which we examine
the industrial developments following the end of the Cold War. In Part One, we detail the
actions of the carbon fibre producers, and the role of government, in the establishment of the
industry. The changing demand side of the industry is examined in Part Two. As almost all
carbon fibre produced today is based on polyacrylonitrile (PAN), that is the main focus of
this discussion, although we also present a very brief discussion of the commercial
production of pitch based carbon fibre. Finally in this chapter, we review resin production
and the related downstream industries of prepreg and composite manufacture.
Part One: The Growth and Development of the Industry
The earliest commercial use of carbon fibre was as lamp filaments in the 1880's. Both Edison
and Swan patented the carbon filaments designed to exploit the uniformity of electrical
resistance carbon exhibits in a vacuum. Bamboo and cotton thread were used as precursors.
However, these filaments were quickly displaced as the tungsten drawing process improved,
and sixty years passed before any significant further carbon fibre development occurred.
Union Carbide began its own investigations of rayon based carbon fibre during the second
World War, and by 1958 carbon fibre, rendered chemically stable by the high temperature
process of graphitization, could be manufactured in a useful fabric form. No special
stretching was applied during the heat treatment and the mechanical properties of the fibre
were poorer than those of the rayon precursor. The fabric was submitted to the US air force
for trials and found immediate success as rocket nozzle exit cones and re-entry heat shields.

117
Commercial applications, however, remained limited by the low strength and modulus of the
available fibres.2
By the start of the 1960's, research into the possibility of high strength, high modulus carbon
was underway independently in Japan, Britain and the US. The earliest patented work (1960)
was that of R. Bacon, who succeeded in producing graphite whiskers (long single crystals) by
a process known as pressure arcing. Although not a commercially feasible method of
production Bacon's research demonstrated the possible mechanical properties of carbon fibre
and attracted considerable attention from the US airforce resulting in further R&D
programmes into rayon-based fibre at the Airforce Materials Laboratory in Columbia.3
In 1960, the Japanese Ministry for International Trade and Industry set up a collaborative
research project to explore the production and properties of carbon fibre made from PAN
(polyacrylonitrile) precursors. The participants included Toray, a traditional fibre company,
Nippon Carbon, a graphite electrode manufacturer with extensive experience in high
temperature materials, and the Government Industrial Research Institute in Osaka, headed up
by Akio Shindo. The consortium successfully produced the fibres and the results were
published by Shindo in December 1961. Despite demonstrating tensile strength and moduli
three times those of rayon based carbon fibres, the study was largely ignored by most western
workers. The two Japanese firms, Tokai Electrode Company and the Nippon Carbon
Company, licensed the processes and started pilot plant operations. The Japanese patent was
the first to suggest making carbon fibre from PAN,4 the material from which around 95% of
all high performance carbon fibre is made today.5 However, these early PAN based fibres
still lacked high strength and modulus.
At the same time, researchers at the Royal Aircraft Establishment (RAE) in the UK began
work on carbon fibre. RAE had had some experience with the new fibre through its earlier
development of impermeable graphite for the Dragon High Temperature Gas Cooled Reactor.
As a by-product of this research, it had became apparent that if a feasible method of
orientating the graphite crystals could be devised, a low density, high strength material ideal
for the aerospace sector would be the result. Accordingly, work started on the new material
in the autumn of 1963.6 The RAE team were at the time unaware of Shindo's work, which
was finally brought to their attention at the start of 1964, over two years after it was first
published. Knowledge of Shindo's results spurred on the group and the work was increased.

118
Within six months a process evolved using the same starting material, polyacrylonitrile, but
which gave strengths and moduli at least twice that obtained by Shindo.7
The RAE researchers had made a major advance in the discovery of a process innovation -
the stretching of the PAN polymer during the initial oxidation step - which produced a fibre
of much greater strength. This remains the vital step in the manufacture of high modulus,
high strength fibre. The research at RAE also clarified the role of heat treatment
temperatures and tensions on the resulting fibres. The importance of fibre-resin bonding was
recognised and a surface treatment of the fibres based on electrolytic oxidation was
consequently developed.8
Under the then Treasury rules, the Farnborough process was patented by the National
Research Development Corporation (NRDC), a government body formed under the 1948
Development of Inventions Act with the purpose of exploiting inventions made by publicly
supported institutions such as hospitals, universities and specialised research laboratories.
The NRDC then became responsible for the general industrial exploitation of the fibres and
licensed the technology under the Farnborough patents to three UK firms, Courtaulds,
Morgan Crucible and Rolls Royce. In accordance with NRDC policy no non-UK firms were
directly licensed. The Corporation later explained to the House of Commons Select
Committee that,
"There is not the remotest hope of excluding American firms in the long term
from the markets. We should have undoubtedly have been far better off
parochially at the NRDC if we had licensed American firms direct. We have
quite deliberately said we would not do this because we think it will be in the best
national interest to license British firms."9
All three British firms had in some way been involved earlier in the RAE research.
Courtaulds had been approached by RAE in 1963 and asked to supply polyacrylonitrile
(PAN) and other fibre samples suitable for conversion into carbon fibre. PAN had proved by
far the most suitable and Courtaulds and RAE consequently collaborated on the production of
a more specialised and suitably pure version of the precursor. Courtaulds continued to supply
RAE with PAN and by the end of the 1960’s, had built a precursor plant large enough to
supply themselves, the other licensees, RAE and Harwell and held 51 patents relating to

119
carbon fibre production.10
Courtaulds set up their own plant in Coventry to manufacture
carbon fibre itself under the brand name Grafil.
Courtaulds sub-licensed the RAE technology to the American explosives company Hercules
on the understanding that Hercules would market Grafil, with an option to manufacture at a
later date. Under the deal, Courtaulds was excluded from the US market until 1979. This
was, as a director of Courtaulds later observed, "a stupid error".11
Relations between
Hercules and Courtaulds broke down and Hercules
"went their own way, and we [Courtaulds] were out of the market in the US. The
others had a field day and we were excluded from the most important market."12
Meanwhile Morgan set up a joint venture with the US Whittaker Corporation (later Celanese)
to supply the US aerospace industry with carbon fibre under the brand name Modmor. In this
way, both Courtaulds and Morgan began pilot plant production of a few tons a year, with the
(largely American) aerospace sector envisaged as the primary market.
The carbon fibre facilities at RAE were of a research nature and production was limited to
100 grams a run. By the end of 1965, it had become clear that the demand for carbon fibres
for testing and development was far outstripping supply and the RAE team sought out the
assistance of other government establishments to help fulfil their own requirement. Harwell
was selected for the work as it already had a set of suitable furnaces and some expertise in
high temperature graphite technology from its work on graphite piles.13
Accordingly, through a formal requirement in the 1965 Science and Technology Act, the then
Ministry of Technology instructed Harwell to commence an R&D programme on carbon
fibre at a cost of £250,000 a year. A team of seventeen scientists and engineers was
assembled and within months production began based on a scaled up version of the
Farnborough process. As the importance of the Farnborough work became apparent, further
contracts followed and eventually a formal joint research and development programme was
established between Harwell, Farnborough, the Ministry of Technology and the NRDC. The
programme was controlled by the Ministry and the commercial exploitation became the
responsibility of the NRDC. At its peak, the Harwell project was producing 450 tons a
year.14

120
The Harwell project was supposedly to explore the technical problems in scaling up carbon
fibre production and not a commercial venture in itself. For several years, however, Harwell
was selling its fibre to Morgan who then directly sold the fibre on to the American company
Whittakers (later Celanese). Morgan later argued that their actions were in fact in the
national interest as they enabled Morgans to open up new markets and "maximise its
contribution to the dollar earnings of this country before the narrow lead we now hold is
eroded by US competition."15
In fact, the main result of this joint venture was to establish
Celanese as one of the major players in the US composite sector.
For many months Harwell also supplied Rolls Royce, who wanted to use the new material in
the forward compressor fan of their experimental high thrust engine, the RB211. Rolls Royce
had had a materials group researching high performance composites since the late 1950s.
They had been in informal contact with the RAE group and were sent a sample of the new
carbon fibre in August 1965. The Company Materials Engineer later recounted,
"We put them in plastic and we made a small beam which was three inches by an
eighth by an eighth and measured the Young’s modulus of that. When you did
this with it, it was obviously as strong as steel. It bent like steel; it resisted
bending like steel. This was then shown to the Engineering Director of the day,
Mr Lombard, and the excitement was then on ... we were going to go all out to
make carbon fibre reinforced blades."16
Rolls Royce first made trial sets of compressor blades that were subsequently fitted to VC10
aircraft and run as part of the normal passenger service in West Africa during 1968.17
These
performed well and encouraged by the results, the company decided to incorporate the carbon
fibre composite into the more ambitious RB211.
The design was completed in 1966 and Rolls Royce began to negotiate sales agreements with
several aircraft manufacturers, most notably Lockheed, who ordered over five hundred
engines for the L1011 Tristar. The fact that the RB211 had carbon fibre blades and was thus
300 lbs lighter than rival products was critical in its selection by Lockheed.18
In August
1966, Rolls Royce set up its own carbon fibre line. Unlike Courtaulds or Morgan, all the
carbon fibre produced by Rolls Royce was used captively within the firm. The importance

121
Rolls Royce was publicly attaching to carbon fibre greatly increased public interest and
confidence in the material and Harwell began designs to increase capacity to over 500 tons
per annum.
Between late 1968 and early 1969, the UK House of Commons Select Committee on Science
and Technology took evidence on the status and future of the carbon fibre industry.
Witnesses were called from the NRDC, the Ministry of Technology, RAE, Harwell and the
three licensed companies. These meetings took place at a time when the key carbon fibre
processing patents were held by the UK government and, moreover, when carbon fibre was
attracting world-wide attention, largely through the high profile RB211.
Meanwhile, the US had already made huge investments in its own composite research.
Union Carbide's low performance rayon based carbon fibre, Thornel, had already been used
in the F111. Epoxy matrix composite parts were made by the laying up of prepreg and
filament winding. This work was supported by the US Air Force (AFML) from 1965 to
1970. The company started commercial production in 1964 and the fibres were used in the
US, France and Germany for aerospace applications. Research and development focused on
the large scale manufacture of high strength and modulus fibres with the consequent
introduction of Thornel 40, 50 and 100.19
The mechanical properties of Thornel are given in
Table 4.1.
Table 4.1: Mechanical Properties of Rayon Based Carbon Fibre
Product designation Tensile modulus (GPa) Tensile strength (MPa)
Thornel 25 175 1250
Thornel 40 280 1750
Thornel 50 350 2000
Thornel 100 700 3500
Source: Matsui20
Like the other carbon fibres of its day, applications of Thornel were limited by its expense:
Thornel 40 cost $720 per kilo and Thornel 50, over $770 per kilo.21
It was already apparent
that the cost of carbon fibre would have to fall considerably before volume markets would be
accessed.

122
Throughout the 1960s, the Americans had sought to improve their composite performance
through a series of research programmes developing fibres from boron, silicon and even
sapphire.22
It had been known for many years that a small group of compounds containing
elements such as boron, silicon, carbon and other light atoms which formed strong inter-
atomic bonds had a spectacular intrinsic strength. (See Driver,23
for a discussion of the
chemistry of structurally useful elements.) The problem was to manufacture these into a
usable form, i.e. as a defect-free whisker or fibre.
RAE had chosen to explore carbon, partly because of its existing experience in graphite. The
Americans had focused on boron, largely because it was easily deposited by thermal
decomposition. By the time of the RAE breakthrough, there had been some success in the
production of boron fibres (they were the first high performance composite to be used in
military aircraft), but they remained prohibitively expensive to produce.24
Carbon fibre
showed a similar high performance but at a much reduced cost. The House of Commons
Committee recognised that carbon fibre would supplant boron in almost all applications, and
concern about how best Britain could maintain its competitive advantage was a central theme
of the Committee questioning.
The Select Committee perceived the US to be the major, indeed only, serious competitive
threat to British carbon fibre interests. Morgan submitted that
"The use of advanced fibres is receiving major impetus from the enormous
materials engineering effort generated by the American aerospace and defence
programmes ... there is no comparable scale of engineering effort or established
resources in the [UK] aerospace and defence area."25
The Director of Harwell, Dr Walter Marshall also sought to impress upon the committee the
US competitive position, and dismissed that from other countries:
“ [Ques] ‘Is there any serious rivalry from other nations that might be well
developed in this field?’ —
[Ans] ‘Not that I know of ... we have no knowledge of any significant
competition.’”26
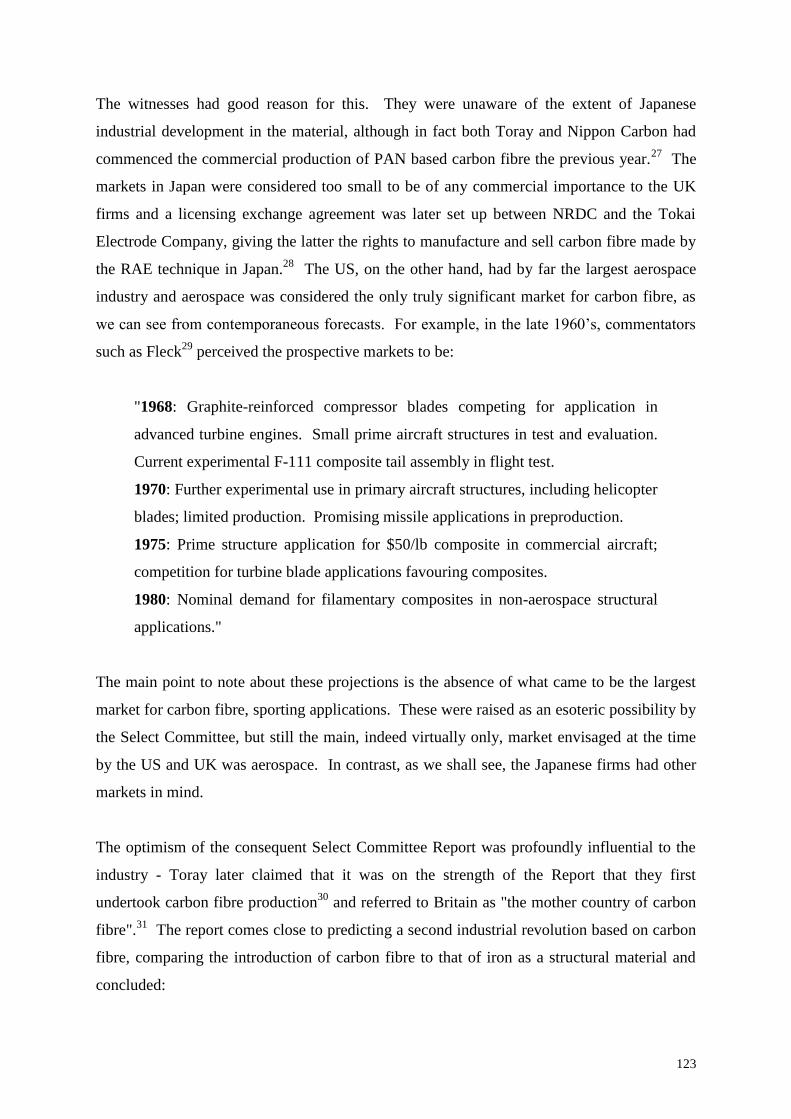
123
The witnesses had good reason for this. They were unaware of the extent of Japanese
industrial development in the material, although in fact both Toray and Nippon Carbon had
commenced the commercial production of PAN based carbon fibre the previous year.27
The
markets in Japan were considered too small to be of any commercial importance to the UK
firms and a licensing exchange agreement was later set up between NRDC and the Tokai
Electrode Company, giving the latter the rights to manufacture and sell carbon fibre made by
the RAE technique in Japan.28
The US, on the other hand, had by far the largest aerospace
industry and aerospace was considered the only truly significant market for carbon fibre, as
we can see from contemporaneous forecasts. For example, in the late 1960’s, commentators
such as Fleck29
perceived the prospective markets to be:
"1968: Graphite-reinforced compressor blades competing for application in
advanced turbine engines. Small prime aircraft structures in test and evaluation.
Current experimental F-111 composite tail assembly in flight test.
1970: Further experimental use in primary aircraft structures, including helicopter
blades; limited production. Promising missile applications in preproduction.
1975: Prime structure application for $50/lb composite in commercial aircraft;
competition for turbine blade applications favouring composites.
1980: Nominal demand for filamentary composites in non-aerospace structural
applications."
The main point to note about these projections is the absence of what came to be the largest
market for carbon fibre, sporting applications. These were raised as an esoteric possibility by
the Select Committee, but still the main, indeed virtually only, market envisaged at the time
by the US and UK was aerospace. In contrast, as we shall see, the Japanese firms had other
markets in mind.
The optimism of the consequent Select Committee Report was profoundly influential to the
industry - Toray later claimed that it was on the strength of the Report that they first
undertook carbon fibre production30
and referred to Britain as "the mother country of carbon
fibre".31
The report comes close to predicting a second industrial revolution based on carbon
fibre, comparing the introduction of carbon fibre to that of iron as a structural material and
concluded:

124
"Because of their unique combination of physical properties, carbon fibre
reinforced composites might well in time replace most conventional materials,
not only in aerospace applications, but in general engineering and indeed in
nearly all industrial activities, except those involving high temperature oxidising
conditions. This is the significance of carbon fibres ... it is of the utmost national
importance that a large scale plant for producing carbon fibre is built in this
country without delay."32
The central recommendation of the committee was that the UK industrial producers should
consider collaborating on a single, large scale plant. These conclusions, however, were
shortly to be overtaken by events. When the first RB211s were tested in the summer of 1969,
the carbon fibre blades failed catastrophically under bird strike. In particular, the root (where
the blade joined the hub) was unable to absorb the tremendous twisting force the impact of a
bird imposes. As a result, costs on the RB211 project began to escalate.33
The original
programme for the RB211-06 (on which the contracts with Lockheed had been negotiated)
committed Rolls Royce to expenditure amounting to 30% of its net worth at the time. The
RB211-22 increased this commitment to around 60%. The costs continued to rise and by
November 1970, it became clear that the company would not have sufficient funds to
complete the project.34
In addition to the direct costs of development, Rolls Royce was liable to compensate
Lockheed and its other customers through the penalty clauses written into its contracts.35
A
receiver was appointed and shortly afterwards Rolls Royce was nationalised. The RB211
eventually entered production with solid forged titanium compressor blades.36
As a result of
this very public failure, UK confidence in carbon fibre was severely curtailed. Harwell
abandoned its plans for scaling up production to 500 tons per annum and Morganite dropped
out of the business completely leaving Courtaulds as the only large UK producer. Rolls
Royce attempted to divest itself of its carbon fibre plant and in 1970 approached ICI as a
potential buyer. The offer was turned down on the grounds that "the development costs
would have been enormous and the market wasn't there".37
Rolls Royce itself had been the
primary user of carbon fibre in the UK and they themselves had just abandoned the business.
Alternative markets were not immediately clear and, moreover, carbon fibre production
involved technologies in which ICI had little experience. Production of Hyfil eventually
passed to Bristol Composite UK, who planned to sell the fibre on the open market.

125
Courtaulds, perceiving a rival, refused to supply the firm with precursor at an acceptable
price and Bristol Composites was forced to import the raw material from Toray in Japan. In
its day, the company supplied aerospace firms including Shorts and Fokker, but growth was
limited and in 1979, Bristol was acquired by BP.38
By this time, the markets for carbon fibre
were much more evident.
Once the key steps in the RAE process became known, the determinant factor in the
production of superior carbon fibre became the development of improved precursors. It was
in this endeavour that the Japanese company Toray excelled.39
In the late 1960’s, Toray used
the results of Shindo's research and the newly developed stretching process to produce carbon
fibre based on polyacrylonitrile (PAN). This proved far superior to rayon fibre in terms of
both mechanical performance and manufacturing cost. Despite a lack of demand from
potential end users, Toray persevered and set up research activities of their own to develop
not only carbon fibre and prepreg, but also possible end products and applications. In 1971,
the company introduced the 'Torayca' carbon fibre T300, which became the base line for the
first generation of composite structural materials.
The PAN based process was offered to Union Carbide under a technical exchange agreement
and the resultant fibre became the world best seller for the next dozen years.40
(Union
Carbide subsequently ceased production of the rayon derived Thornel series in 1974.41
) A
second Japanese company, Sumitomo, which also produced an excellent quality precursor,
went into partnership with Hercules to produce a series of fibres widely used in the US. In
1973, Toho Rayon began production. It was the development and commercialisation of these
PAN-derived, high strength, high modulus carbon fibres which led to the explosive growth of
the carbon fibre industry between the years 1970 to 1988. Throughout this period carbon
fibre industry was characterised by increases in production combined with developments in
process technologies, reducing costs and prices and thus opening further markets. Table 4.2
gives the data for carbon fibre market growth for this period.
In the early 1970’s, fuel costs accounted for 25% of airline direct operating costs, a figure
that rose to 50% after the oil crises.42
It had been estimated that a decrease of one pound in
weight would save 400 gallons of fuel over the lifetime of a civil airliner.43
Around the same
time, a technical advance in the production of matrix resins took place, vastly increasing
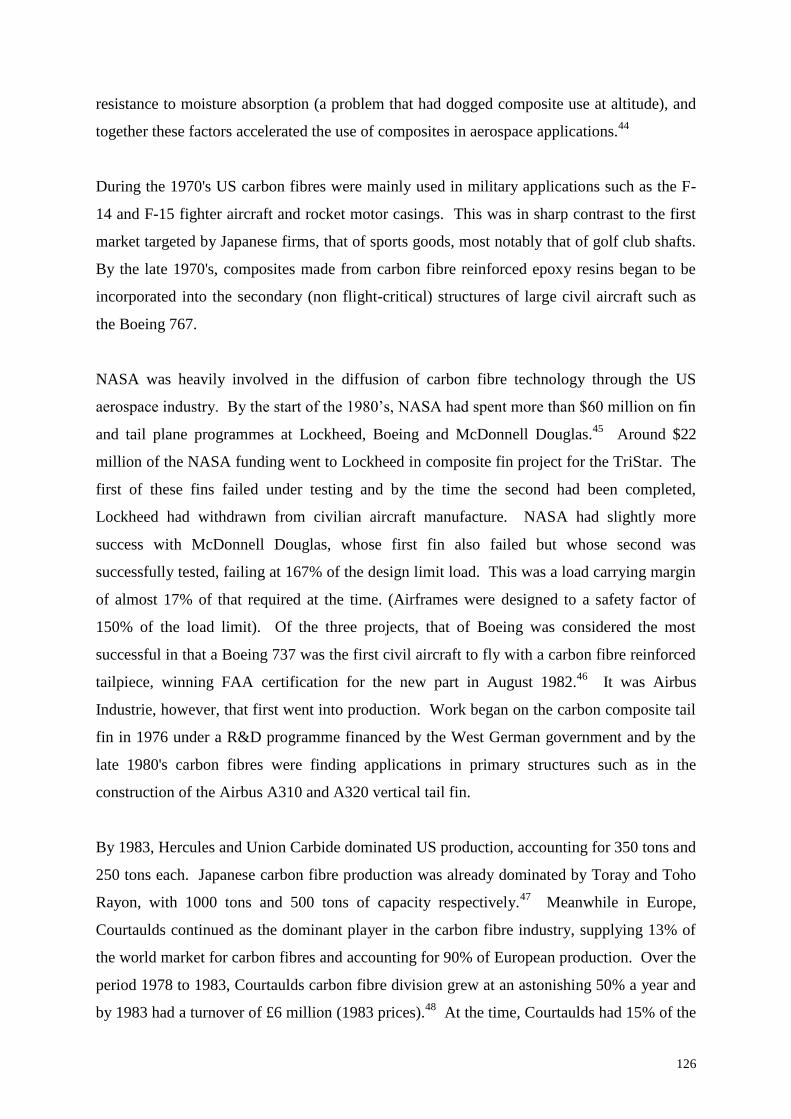
126
resistance to moisture absorption (a problem that had dogged composite use at altitude), and
together these factors accelerated the use of composites in aerospace applications.44
During the 1970's US carbon fibres were mainly used in military applications such as the F-
14 and F-15 fighter aircraft and rocket motor casings. This was in sharp contrast to the first
market targeted by Japanese firms, that of sports goods, most notably that of golf club shafts.
By the late 1970's, composites made from carbon fibre reinforced epoxy resins began to be
incorporated into the secondary (non flight-critical) structures of large civil aircraft such as
the Boeing 767.
NASA was heavily involved in the diffusion of carbon fibre technology through the US
aerospace industry. By the start of the 1980’s, NASA had spent more than $60 million on fin
and tail plane programmes at Lockheed, Boeing and McDonnell Douglas.45
Around $22
million of the NASA funding went to Lockheed in composite fin project for the TriStar. The
first of these fins failed under testing and by the time the second had been completed,
Lockheed had withdrawn from civilian aircraft manufacture. NASA had slightly more
success with McDonnell Douglas, whose first fin also failed but whose second was
successfully tested, failing at 167% of the design limit load. This was a load carrying margin
of almost 17% of that required at the time. (Airframes were designed to a safety factor of
150% of the load limit). Of the three projects, that of Boeing was considered the most
successful in that a Boeing 737 was the first civil aircraft to fly with a carbon fibre reinforced
tailpiece, winning FAA certification for the new part in August 1982.46
It was Airbus
Industrie, however, that first went into production. Work began on the carbon composite tail
fin in 1976 under a R&D programme financed by the West German government and by the
late 1980's carbon fibres were finding applications in primary structures such as in the
construction of the Airbus A310 and A320 vertical tail fin.
By 1983, Hercules and Union Carbide dominated US production, accounting for 350 tons and
250 tons each. Japanese carbon fibre production was already dominated by Toray and Toho
Rayon, with 1000 tons and 500 tons of capacity respectively.47
Meanwhile in Europe,
Courtaulds continued as the dominant player in the carbon fibre industry, supplying 13% of
the world market for carbon fibres and accounting for 90% of European production. Over the
period 1978 to 1983, Courtaulds carbon fibre division grew at an astonishing 50% a year and
by 1983 had a turnover of £6 million (1983 prices).48
At the time, Courtaulds had 15% of the
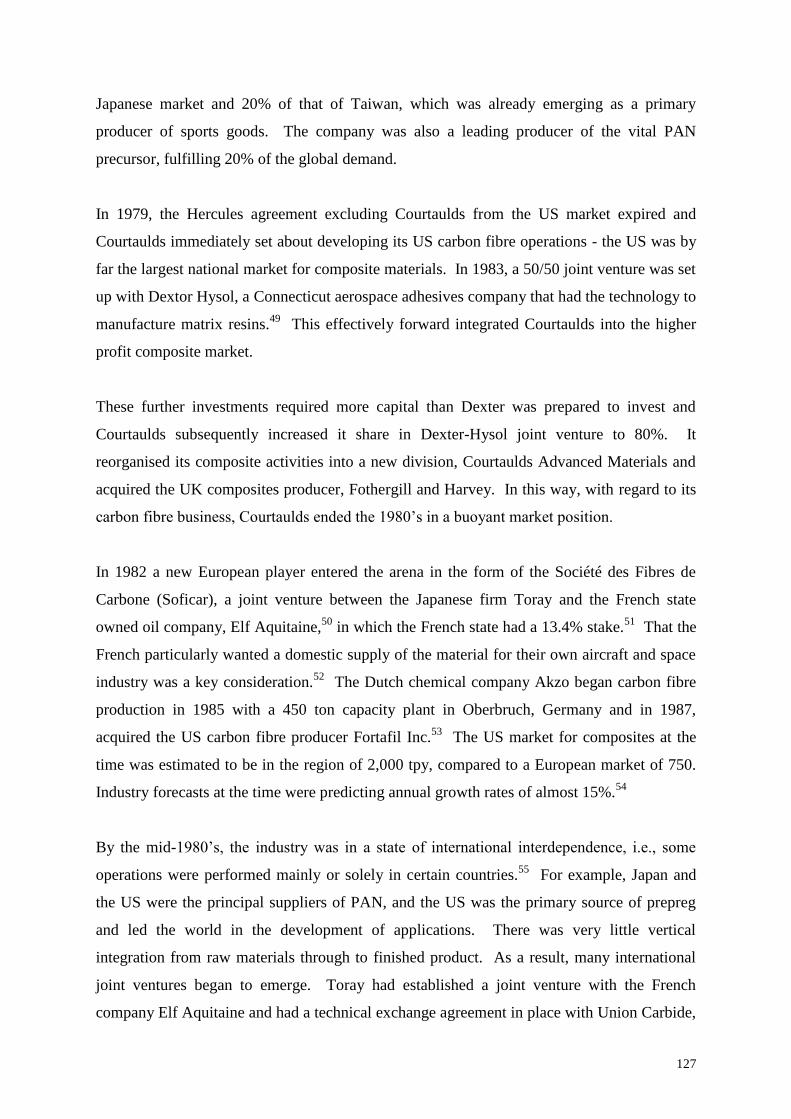
127
Japanese market and 20% of that of Taiwan, which was already emerging as a primary
producer of sports goods. The company was also a leading producer of the vital PAN
precursor, fulfilling 20% of the global demand.
In 1979, the Hercules agreement excluding Courtaulds from the US market expired and
Courtaulds immediately set about developing its US carbon fibre operations - the US was by
far the largest national market for composite materials. In 1983, a 50/50 joint venture was set
up with Dextor Hysol, a Connecticut aerospace adhesives company that had the technology to
manufacture matrix resins.49
This effectively forward integrated Courtaulds into the higher
profit composite market.
These further investments required more capital than Dexter was prepared to invest and
Courtaulds subsequently increased it share in Dexter-Hysol joint venture to 80%. It
reorganised its composite activities into a new division, Courtaulds Advanced Materials and
acquired the UK composites producer, Fothergill and Harvey. In this way, with regard to its
carbon fibre business, Courtaulds ended the 1980’s in a buoyant market position.
In 1982 a new European player entered the arena in the form of the Société des Fibres de
Carbone (Soficar), a joint venture between the Japanese firm Toray and the French state
owned oil company, Elf Aquitaine,50
in which the French state had a 13.4% stake.51
That the
French particularly wanted a domestic supply of the material for their own aircraft and space
industry was a key consideration.52
The Dutch chemical company Akzo began carbon fibre
production in 1985 with a 450 ton capacity plant in Oberbruch, Germany and in 1987,
acquired the US carbon fibre producer Fortafil Inc.53
The US market for composites at the
time was estimated to be in the region of 2,000 tpy, compared to a European market of 750.
Industry forecasts at the time were predicting annual growth rates of almost 15%.54
By the mid-1980’s, the industry was in a state of international interdependence, i.e., some
operations were performed mainly or solely in certain countries.55
For example, Japan and
the US were the principal suppliers of PAN, and the US was the primary source of prepreg
and led the world in the development of applications. There was very little vertical
integration from raw materials through to finished product. As a result, many international
joint ventures began to emerge. Toray had established a joint venture with the French
company Elf Aquitaine and had a technical exchange agreement in place with Union Carbide,

128
to whom it supplied precursor. Toho Rayon had a similar global stretch, with technical co-
operation agreements with Akzo in Germany and Celanese (later BASF) in the US. Other
key joint ventures were Sumitomo/Hercules (which single handedly fulfilled a third of the US
requirement) and Mitsubishi/Courtaulds.56
According to Gregory, such strategies were
designed to avert trade friction between partner firms and ease technical exchange.57
In
retrospect however, it seems more likely that as well as enabling fuller integration of
manufacture, these consortia allowed Japanese companies access to the large overseas
markets in Europe and the US. The US was by far the largest national market for composite
parts and Europe, too, had a substantial aerospace demand. Figure 4.1 (produced by author)
depicts the consequent structure of the industry at this time. It can be seen that most of the
marketing agreements involved the exchange of both materials and technology.

129

130
Throughout the 1980's, the composites market consistently grew ahead of GNP. Indeed a
growth rate that fell below 10% was seen as a recession. By the end of the 1980's, countries
other than Japan, Britain and the US had entered the field. The original patent position was
weak in both Japan and the UK: as with many advanced materials, patents relating to
particular processing innovations were difficult to enforce and relatively easy to
circumnavigate. Production had already begun in Germany and France (to supply
Aerospatiale), albeit on a much smaller scale and approval was granted to Israel to acquire
US technology (for military applications). Toward the end of the decade, then, carbon fibre
was being produced and traded world-wide. Courtaulds in the UK, for example, sold 75% of
its production to Taiwan and South Korea (for the production of sporting goods).
Competition, especially for the large aerospace markets, became severe as companies fought
to gain technological expertise and exploit the benefits of scale economies.58
In 1987, the US DoD brought in a stipulation that 50% of all the carbon fibre used in any
single system purchased by the Pentagon had to be produced domestically and similarly 50%
of all PAN precursor used in DoD projects had to be manufactured in the US. At the time,
the DoD accounted for half of the total world market for carbon fibre composites, and
Pentagon demand was forecast to rise to $500 billion by the mid 1990’s.59
Furthermore, this
stipulation was mandated at a time when the rising value of the yen was making it harder for
carbon fibre produced in Japan to compete in US markets.60
We discuss the impact of the
DoD directive and the consequent activities of the individual firms at this time in more detail
in Chapter Five. The net result, however, was a wave of investment in capacity, both by US
firms and, as any production on US soil was deemed ‘domestic’ regardless of ownership
nationality, by overseas players seeking to establish carbon fibre production sites within the
US. Courtaulds, for example, set up its own plant in Sacramento, California and the German
firm BASF acquired Celanese in a deal that also included Narmco, one of the biggest US
prepreggers. As the US Office of Technology Assessment commented,
"The past several years have seen a dramatic increase in the activity of European
firms in the United States. Courtaulds, BASF, ICI and Ciba Geigy, for instance,
now rank among the major participants in the US market as a result of joint
venture and acquisition activity. ... The US market is the largest such market in
the world, and is likely to grow rapidly, particularly on the military side. As
military use grows, so will the emphasis on US-based suppliers. Many of the

131
acquisitions of US firms by large European conglomerates are evidence of a faith
in the long term viability of the industry." 61
Hence in the late 1980’s, the industry underwent a transition period of consolidation and
acquisition, most notably in Europe and the United States. In general, the acquisitions were
made by large, diversified chemical and industrial firms, for whom long term investments
were relatively affordable. Although the primary motivation for these take-overs was to gain
access and distribution rights in the large US markets, there were additional benefits. Carbon
fibre production per se was not a particularly profitable sector and many of the acquisitions
were with a view to forward integration into prepregs and composite parts. For example,
when BASF bought Celion from Celanese and added Narmco and Quantum it enabled BASF
to move downstream into prepreg and shapes.62
As a result, though the foreign share of the
finished composite structure remained small, by the end of 1988, non-US owned firms
controlled 50% of the US prepreg market, 25% of that of resins (largely through the efforts of
Ciba-Geigy) and accounted for over 20% of US carbon fibre sales.63
At the same time, the larger American firms were expanding their range of operations
through increased integration. Du Pont, for instance, added pitch based carbon fibres from to
its portfolio of reinforced fibres, and other firms such as Amoco and Hercules integrated
vertically into the production of prepregs and parts. The general strategy of the time was to
integrate the whole process from the transformation of the raw materials to the production of
final products within each single company. All in all, the US share of world carbon fibre
production increased from around a quarter in 198164
to over a third by the end of the
decade.65
Pitch based carbon fibre
Finally in this section we will briefly describe the history of pitch based carbon fibre. Pitch
has a very high carbon content, higher than that of PAN, and for many years has been mooted
as a possible commercial precursor for carbon fibre. The problem with pitch is that although
cheap and easily available, it is extremely expensive to produce in a purified form, and as the
properties of the final fibre are closely related to those of the precursor almost all current
commercially produced pitch based carbon fibre is classified as low performance 'general
purpose grade'.

132
In the early 1960's, Ohtani of Gunma University in Japan developed a method of pyrolysing
pitch into carbon fibre. The technology was first exploited by Kureha, a large Japanese
chemical company that was producing pitch in large amounts as a by-product of cracking
crude oil.66
In 1970, commercial production of carbon fibre from pitch began.67
Most pitch
derived fibre has a comparatively low strength and modulus and is mainly used as packing,
heat insulation, and in the construction industry. The Alshaseed monument in Baghdad and
the Ark Hills building in Tokyo are two examples that have exploited this technology.68
Kureha remains by far the largest global producer of general grade pitch, with a current
capacity of around 900 tons.69
In the 1960’s, Union Carbide began a research programme, funded by the US Air Force
(AFML) and the US Navy (NSSC), to develop ultra high modulus fibres based on mesophase
pitch and, in 1975, started production of the Thornel P series, which were at the time the
highest modulus fibres available.70
In the late 1980s, Du Pont acquired Conoco,71
giving the
firm access to high grade pitch precursor and proceeded to produce a new range of very high
performance pitch fibres which had among their qualities a negative coefficient of thermal
expansion. This meant that combined with an appropriate matrix, the overall composite was
very dimensionally stable, a valuable property for space applications. Amoco and Ashland
Petroleum now manufacture the fibres on a small scale. However, the cost of refining the
pitch to a suitable degree remains expensive and high performance pitch derived fibres are
limited to very high value added applications such as space structures. Amoco is the
dominant supplier of this speciality market. The firm manufactures two fibres types: the
P120 which costs between $1800 and $2000 per kilo and the K1100, which sells for $3900
per kilo.72
Virtually all Amoco’s output is purchased by the US DoD which has also
“supported all aspects of the technology from the development of Amoco’s ultra
high thermal conductivity fiber to fabrication of demonstration components for
test and evaluation.”73
Research interest in commercial applications of pitch fibres remained and in the mid 1980s,
over twenty Japanese companies collaborated on a project to examine petroleum pitch and
coal tar pitch precursors. Unlike PAN based carbon fibre, where textile companies had been

133
the driving force, most of the firms in this venture were oil or steel companies hoping to
diversify their portfolios and use up a plentiful by-product.
At first, 'the cost of producing such fibres seemed prohibitive and offer[ed] no advantage over
PAN based fibres'.74
However, through a series of incremental process innovations, the
prospective price of the final fibre began to fall and one of the firms, Mitsubishi Kasei
[Chemical] built a 500 ton per annum capacity plant in 1988. Another project member,
Nippon Oil set up a 50 ton pilot plant in Yokohama. This was later scaled up to 120 tons and
in 1995 it was announced that the facility would be bodily moved to Hirohata and leased to
Nippon Steel in an equally owned joint venture between the two companies to be named the
Nippon Graphite Fiber Corporation.75
According to the Nikkei Weekly,76
the initial
capitalisation is Y500 million ($5.1 million). The venture aims to produce high modulus
fibre for premium sporting goods. It remains to be seen how the pitched based carbon fibre
variety will compete against PAN-based rivals, but its very existence is a sign that the fallow
years of carbon fibre production may be over.
Part Two: Carbon Fibre Markets 1970-1989
Carbon fibre was originally developed as a structural material for aerospace applications. As
we have seen, much of the early development took place under the auspices of UK
government research institutions and by the end of the 1960’s was seen essentially as a
technology in which Britain possessed the patents and the US the market. US companies
quickly accessed the technology by setting up licensing agreements with the UK firms
Courtaulds and Morgan Crucible. The NRDC licensed Japanese firms directly, largely
because the Japanese aerospace market was perceived (rightly) to be too small to be of
immediate commercial interest and non-aerospace applications were (wrongly) not
considered to be of commercial interest at all.
Sporting goods were the first market targeted by Japanese firms.77
In 1971, Toray produced
its first carbon fibre fishing rod, and golf club shafts quickly followed.78
Unlike the US and
UK firms, who produced the material to fulfil an existing demand, Toray essentially created a
new market for carbon fibre, performing the end product research and development in

134
house.79
Consumption of carbon fibre grew at a rapid rate throughout the 1970s, albeit from
a low base, as Table 4.2 shows:
Table 4.2: Carbon Fibre Consumption 1971 to 1988 (tons)
Year World U.S. Europe Japan Others
1971 2 — — — —
1972 10 — — — —
1973 100 — — — —
1974 150 — — — —
1975 180 — — — —
1976 210 — — — —
1977 260 120 60 80 0
1978 360 160 80 120 0
1979 560 260 110 190 0
1980 850 450 130 270 0
1981 1030 550 140 290 50
1982 1440 600 220 470 150
1983 1920 800 270 500 350
1984 2820 1200 450 560 560
1985 3230 1650 580 600 400
1986 3730 1920 690 620 500
1987 4380 2300 830 650 600
1988 5500 2650 900 950 1000
Source: Matsui80
,
Scale economies were difficult to achieve in the early 1970’s (capacities under around 150
tons are considered pilot plants) and prices remained high. Over the decade, however, as
production increased, costs and prices fell from £200 per kilogram in 1970 to around £20-80
per kilogram in 1980 (1980 prices).81
Carbon fibre costs were finally within the same league
as competing materials and by the start of the 1980’s, potential markets were much more
visible.
At the start of the 1980's, carbon fibre was produced by the following firms:

135
Table 4.3: Carbon Fibre Production 1981
Company Country Capacity (tons)
Toray Japan 480
Hercules U.S. 330
Toho Rayon Japan 250
Courtaulds U.K. 150
Celanese U.S. 150
Nippon Japan 40
Others 50
Total 1250
Source: Financial Times82
Other companies were poised to enter the field: within two years Union Carbide (whose
carbon fibre interests were later acquired by Amoco) had opened a 1000 ton capacity PAN
precursor plant and a 500 ton per year carbon fibre facility. Mitsubishi Rayon also began
manufacture, Soficar was established and Toray, Hercules and Toho Rayon had all
substantially increased capacity. Carbon fibre production and consumption began to grow at
an astonishing rate: 20% in 1981, 40% in 1982, 30% in 1983 and over 45% in 1984. In 1980,
the American aircraft industry had identified a need for carbon fibre with a high elongation at
break point. These fibres became available in 1982, and a major new market was accessed:
civilian aircraft. Production began on the new Boeing 757 and 767 models, which each used
over 680 kilos of carbon fibre composite per aircraft, saving 450 kilos of structural weight.83
By 1984, carbon fibre production was already dominated by Japanese firms, with Toray and
Toho Rayon possessing capacities of 1000 tons and 500 tons respectively. Throughout the
decade, with successive leaps in capacity, one or the other of these two firms led the world in
carbon fibre capacity. Hercules and Union Carbide dominated US production, accounting for
350 tons and 250 tons apiece.84
The Japanese companies quickly built up in-house capacity.
Between the years 1980 to 1982, Japanese PAN based carbon fibre capacity increased a
remarkable five fold and by 1984, Japanese production exceeded that of the US (Japanese
total production capacity stood at 2500 tons per annum, the US 1800 tons and the UK 500
tons). The largest market, however, remained the US which consumed over 50% of
production, 60% of which was for aerospace applications, as we can see from Table 4.4:

136
Table 4.4: Carbon Fibre Consumption, 1984, by Application, tons
Europe US Japan
Aerospace 330 1110 50
Sports 200 400 500
Industrial 180 300 350
Source: US Dept of Commerce85
European consumption was also largely concentrated on aerospace. Courtaulds was the only
carbon fibre producer of any significant size, but in 1984 Toray, in conjunction with the
French government set up a joint venture to produce fibre in Abidos (France alone accounted
for a third of European carbon fibre consumption).86
Production in the Federal Republic of
Germany began in 1986, when Akzo, under license from Toho Rayon, set up a carbon fibre
plant with a 360 ton capacity.
Toho Rayon increased capacity every year between 1979 and 1987. Toray doubled capacity
both in 1981 and 1983 and further increased production in 1985.87
By the mid-1980’s, Japan
was the primary producer of carbon fibre and the US the largest consumer. Virtually all US
produced carbon fibre was used within America. This was due in no small part to US
security restrictions. Carbon fibre, prepregs and composites were freely traded in Europe and
Asia but US companies shipping overseas had to apply for export licences both for the
technology and the product. According to the OTA,
"Export licensing requirements place US companies at a disadvantage in foreign
markets. A European aircraft manufacturer that buys carbon fiber prepreg
material from a U.S. company must get permission from the U.S. Government to
export the finished airplane. If the same European company buys from another
supplier in Europe or Japan, the paperwork and US restrictions can be avoided."88
In contrast, most Japanese firms exported the bulk of their carbon fibre production, as Table
4.5 shows:
Table 4.5: The Export of Japanese Carbon Fibre, %

137
Company Percent Exported Destination
Toray 55% Korea, Taiwan, US
Toho Rayon 70% Korea, Taiwan
Asahi Kasei 65% Korea, Taiwan
Source Pierrick Rollet89
Mitsubishi Rayon was the exception to the rule, with around 90% of its carbon fibre
production going to other Mitsubishi keiretsu members.90
Virtually, all the carbon fibre
exported by Japanese companies to Taiwan and Korea was used in the production of sporting
goods - Toray has a 70% share in the major Taiwanese sports producer, Taiwan Kawasaki.91
It is the downstream industries of prepreg and composite production that we will now briefly
survey in the final section of this chapter.
An Aside on Related Industries
The carbon fibre industry per se is closely interwoven with the related sectors of resin
production, prepreg manufacture, composite makers and end users. As we have seen, over
the late 1980's, there was a general trend toward greater consolidation and integration within
the industry with the result that most companies integrated over two or more processing steps
to some degree.
It is the manufacture of prepregs, end shapes and composites that produces the greatest
returns in the advanced composite sector and many carbon fibre producers have forward
integrated into these areas. For example, Amoco, a fibre and resin producer started
production of prepregs and BASF acquired Fiberlite partly as a way into downstream sectors
- at the time Fiberlite fulfilled a third of US prepreg consumption and was the largest
prepregger in the world. Fiberlite was later acquired by ICI when BASF abandoned its carbon
fibre interests. Narmco, too, was a major producer of shapes and end products when it was
acquired by ICI in 1985 and it was generally acknowledged by the industry that BP
purchased Hitco largely to acquire the prepreg activities of its subsidiary US Polymeric.92
All
the major Japanese companies, (except Mitsubishi Rayon, which has always been an end
shape producer) have forward integrated from fibre production. Hence we will now look
briefly at resin, prepreg and composite part production.
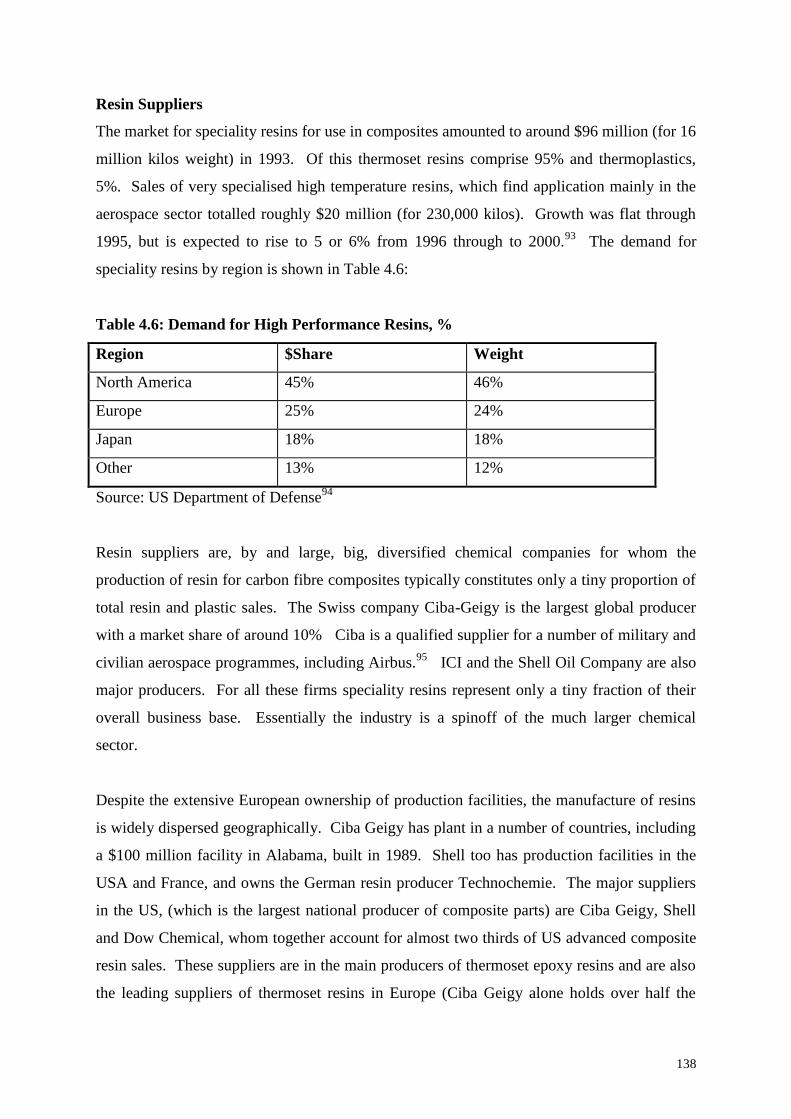
138
Resin Suppliers
The market for speciality resins for use in composites amounted to around $96 million (for 16
million kilos weight) in 1993. Of this thermoset resins comprise 95% and thermoplastics,
5%. Sales of very specialised high temperature resins, which find application mainly in the
aerospace sector totalled roughly $20 million (for 230,000 kilos). Growth was flat through
1995, but is expected to rise to 5 or 6% from 1996 through to 2000.93
The demand for
speciality resins by region is shown in Table 4.6:
Table 4.6: Demand for High Performance Resins, %
Region $Share Weight
North America 45% 46%
Europe 25% 24%
Japan 18% 18%
Other 13% 12%
Source: US Department of Defense94
Resin suppliers are, by and large, big, diversified chemical companies for whom the
production of resin for carbon fibre composites typically constitutes only a tiny proportion of
total resin and plastic sales. The Swiss company Ciba-Geigy is the largest global producer
with a market share of around 10% Ciba is a qualified supplier for a number of military and
civilian aerospace programmes, including Airbus.95
ICI and the Shell Oil Company are also
major producers. For all these firms speciality resins represent only a tiny fraction of their
overall business base. Essentially the industry is a spinoff of the much larger chemical
sector.
Despite the extensive European ownership of production facilities, the manufacture of resins
is widely dispersed geographically. Ciba Geigy has plant in a number of countries, including
a $100 million facility in Alabama, built in 1989. Shell too has production facilities in the
USA and France, and owns the German resin producer Technochemie. The major suppliers
in the US, (which is the largest national producer of composite parts) are Ciba Geigy, Shell
and Dow Chemical, whom together account for almost two thirds of US advanced composite
resin sales. These suppliers are in the main producers of thermoset epoxy resins and are also
the leading suppliers of thermoset resins in Europe (Ciba Geigy alone holds over half the

139
European resin market). The major US suppliers of thermoplastic resins include ICI (which
produces polyetheretherketone [PEEK], a high performance thermoplastic) Amoco and
Phillips. ICI (in the UK), Phillips (in Belgium), BASF (in West Germany) and Amoco (who
sell resin imported from the US) are the largest suppliers of thermoplastic resins in Europe.
In Japan, resin producers are again all large leading chemical companies. Yuka Shell Epoxy,
Mitsui Petroleum and Asahi Kasei together serve around 70% of the Japanese advanced
composite resin market. Nippon Steel Chemical and Sumitomo also supply the Japanese
market. Japanese interest in high temperature resins has been accelerated by their aerospace
programmes. A number of carbon fibre producers also manufacture their own resins, most
particularly Hercules, Mitsubishi Rayon and Toray, which makes the resin used in the Boeing
777 composite parts in-house.
Prepregs
Prepreg (short for preimpregnation) is a partially cured intermediate product made up of resin
and fibre, usually in the form of a tape of unidirectional fibre or woven like a textile. As a
rule of thumb, the value of prepreg is roughly twice that of its constituent materials and the
value of a composite ten times that of the prepreg (although the value of the composite can
vary widely depending on the process by which it is produced). Prepregs are the principle
starting material for the manufacture of composite parts (over 70% of all carbon fibre is
processed into prepreg) and the merchant market for prepregs is large. There was a steady
increase in prepreg shipments world-wide throughout the 1980’s as the following SACMA
data shows (Table 4.7):
Table 4.7: World-wide Carbon Fibre Prepreg Shipments (million kilos)
1985 1986 1987 1988 1989 1990
2.4 2.7 3.5 3.9 5.6 6.0
Source: SACMA96
Prepregs are produced and sold in many forms, of which the most common are woven
fabrics, unidirectional tapes and filament tows. Both prepregs and fabricated components
may be made and used captively for corporation into other products or sold on the merchant
market for other end users. Most carbon fibre producing firms have moved into prepreg

140
production through internal integration or the acquisition small firms. As a result the current
ranking of prepreg suppliers roughly corresponds to that of the carbon fibre producers
themselves.
In Europe, a number of aerospace companies produce their own prepreg in-house. These
include Aerospatiale (France), Airbus Industrie and British Aerospace.
Composites
At the end of the 1980’s, a large number of companies, known as fabricators or moulders,
specialised in making components from composites based on carbon fibre. These were
generally very small firms specialising in a particular product range, such as racing cars.
Some specialised in producing prepreg. In the UK, many of these companies were based in
the North-West of England as the manipulation of long carbon fibre filaments utilised the
traditional textile skills of knotting, weaving and braiding. Fiberforce is one example.
However, in the early 1990’s, a time of difficult trading conditions for the carbon fibre
industry as a whole, a restructuring of the industry occurred, with the larger corporations
tending toward increased integration, and many of these smaller companies were acquired or
gave up the business.
The production of the final composite is very much the value added part of the manufacturing
chain, especially for aerospace parts. The US Airforce has produced the following cost data
(Figure 4.2) for direct cost elements in the manufacture of composite materials: It can be
seen that in fact the cost of the fibre and resin amount to only 10% of the final cost. Ninety
percent of the total cost is due to processing, assembly and quality control, all functions of the
component fabricator.

141
Figure 4.2: A Breakdown of Final Composite Cost
Fabrication
23%
Assembly
19%
Tooling
24%
Materials
10%
Quality
11%
Other
13%
Fabrication
Assembly
Tooling
Materials
Quality
Other
Source: US Department of Defense97
Table 4.8 below shows the production of advanced composites by region.
Table 4.8: World Production of Advanced Composites (1992)
Region Quantity (tons) Value ($million)
Pacific Rim 2.7 817
North America 7.5 2,236
Western Europe 3.4 1,247
Total 13.7 4,300
Source: US Department of Defense98
The US remains the biggest producer (about 55% of the global total) and consumer of carbon
fibre composites in the world. This is largely as a result of its strong aerospace sector, which
accounts for over half of all composite consumption.99
For many aerospace parts, prepreg
lay-up is the preferred method of manufacture. Lay-up is still largely a labour intensive
(although increasingly automated) technique that is very expensive. Hence, aerospace is not
only the largest market for advanced composites in the US, but also has the highest added
value. Once again, this sector has historically shown a general trend toward increased
integration. Aerospace companies such as Boeing, Lockheed and McDonnell Douglas all
manufacture composite parts for commercial and military use in-house. The major military

142
companies in particular tend to manufacture composite parts captively: the defence orientated
company Hercules, for example, is fully integrated from the production of fibre through to
the manufacture of shapes and parts. Each prime contractor typically possesses a number of
autoclaves (the speciality ovens used for curing composites). The other manufacturing
processes for the production of composites such as compression moulding, pultrusion and
stamping are often subcontracted out. Since the start of the 1990’s there has been an excess
of fabrication facilities for composites in the US.100
European production of composite parts, although far smaller in scale, has a similar
orientation toward aerospace end-uses and defence applications. The industry is largely
concentrated in four countries, namely, France, the UK, Germany and Italy, of which France
alone, through its Grands Programmes in aerospace and energy production, accounts for
around 50% of the advanced composite business. The total UK market for carbon fibre is
around 100 tons of which about 80% are used in aerospace applications via the prepregger
Ciba-Geigy. (Almost all of Ciba-Geigy's European prepreg goes to Deutsche Airbus in
Germany to make horizontal stabilisers for Airbus Industrie in Toulouse.)101
As in the US,
many of the leading aerospace companies manufacture finished parts captively, including
British Aerospace, Airbus Industrie, Aerospatiale, Dassault and Aeritalia. Airbus, in
particular uses substantial amounts of carbon fibre composite parts in the Airbus 320 and
340.
Recreational markets have dominated Japanese domestic growth and remain the largest
consumers of carbon fibre in Japan, accounting for nearly 60% of total carbon fibre usage.
Many recreation products are manufactured by the Japanese carbon fibre companies
themselves. However, the manufacture of sports goods is fairly labour intensive, and the
majority of recreational products are manufactured in Taiwan or South Korea, both of which
are enjoying an increasing market share. Production in East Asia is expected to continue with
the opening of further labour markets in China.

143
Summary and Conclusions:
Carbon Fibre Production at the Turn of the Decade
By the start of the 1990’s the major producers of carbon fibre in Europe and the US were
generally large chemical companies. In contrast, the Japanese carbon fibre producers were
companies whose major business is the production of manmade fibres for use in textiles.
Indeed, Asahi Kasei, Mitsubishi Rayon, Toray and Toho Rayon all rank in the top five
producers of acrylic fibre in Japan (the acrylic monomer is the building block for PAN).102
All the Japanese producers began carbon fibre production partly as a way to use up spare
acrylic fibre capacity.103
Carbon fibre quality is very sensitive to the quality of the PAN
precursor. It is undisputed that the Japanese carbon fibre producers manufacture the best
quality precursor and, prior to the DoD directive, almost all the US producers imported PAN
from Japan.
As we have seen, it was the US companies that first began to manufacture carbon fibre on a
commercial scale in the 1950's. At that time carbon fibre was produced from rayon
precursor. Japanese companies and the UK firm Courtaulds started production in the early
1970's, investing directly in PAN precursor technology and so became the first major
producers to manufacture carbon fibre from PAN. Rayon based technology proved relatively
uncompetitive and gradually the US firms were forced to reinvest (although a very small
quantity of rayon based carbon fibre is still produced in the US as it was qualified as a
aerospace material in the 1950’s).
The production of carbon fibres is a capital intensive (many companies employ a 24 hour
shift system), labour extensive (at Toho Rayon, for example, 100 employees produce 2020
tonnes per annum) industry with much scope for scale economies.104
It is also a high
technology industry in which it is generally acknowledged that the large manufacturers hold
the best production facilities. The manufacturers of carbon fibre tend to be technology
intensive firms generally, ranking high in terms of R&D expenditure within their respective
sectors.105
Company profiles of the key players in the carbon fibre business are presented in
Appendix I.
By the end of the 1980’s, the US was the largest national consumer of PAN and Japan the
largest national producer. Four major firms supplied carbon fibre in Japan, of which the top
two, Toray and Toho Rayon together accounted for about 80% of Japanese production. For

144
both companies the percentage of export production was, and is, high. Toho Rayon, Toray
and Asahi Kasei all exported large quantities of carbon fibre to south East Asian countries
including Taiwan, Korea and Hong Kong for the manufacture of sporting goods. Toray in
addition exported significant amounts to the US, and has a particularly close relationship with
Boeing; before the construction of the Toray plant in Seattle, virtually all the prepreg
produced at Ehime was sold to Boeing.106
The third largest Japanese producer, Mitsubishi Rayon, marketed around 90% of its Japanese
carbon fibre production domestically. The company specialised in the production of 24
modulus fibre of which it claimed 70% of the world market.107
Finally, Asahi Kasei, a big
chemical company (and textile firm) specialised in producing many different kinds of resin
systems for its carbon fibre prepregs and composite parts. It was one of the few companies
that had started the commercial production of thermoplastic resins. About a quarter of Asahi
Kasei's carbon fibre production was used in-house, the majority being exported to South
Korea and Taiwan for the manufacture of sporting goods.108
Six companies supplied PAN based carbon fibre in the US, of which the top three, Hercules,
BASF and Amoco supplied almost 80% of the market. In contrast to the industry in Japan,
most US carbon fibre was sold on the domestic market, partly due to the large domestic
demand and partly due to export restrictions. Hercules was the largest supplier with a market
share of over a third, mostly in defence applications. Amoco, which acquired the carbon
fibre business of Union Carbide in 1986, was the second largest producer and prior to the
DoD directive, was the only US company capable of producing its own PAN precursor. The
third largest US supplier was BASF, a West German company that purchased the Celion
carbon fibre business from Celanese in 1985.
Carbon fibre production capacity in Europe totalled over 1000 tons. One of the major
European players was Courtaulds in the UK. Other important suppliers of carbon fibre in
Europe were Azko in Germany, and Soficar in France (a joint venture between Toray and Elf
Aquitaine).iv
iv For completeness we will also note that other countries with carbon fibre capacities include Israel (the Israeli
firm Afikim produces around 100 ton a year for military applications), Taiwan (Taiwan Plastic)and South Korea
(Korea Steel Chemical). The latter two countries concentrate on the production of inexpensive, lower
performance fibre for cost sensitive applications such as sports goods, construction automotive industries.
Production capacities in the former Soviet Union and China are unknown. Up until 1995 carbon fibre produced
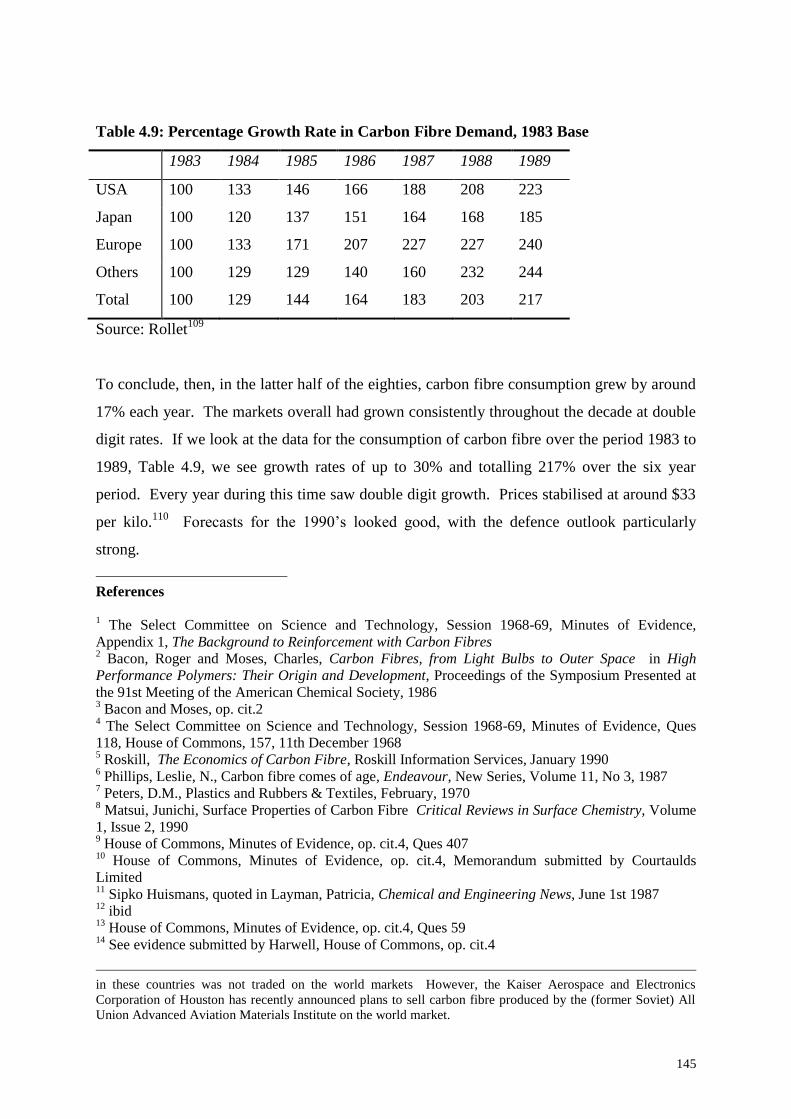
145
Table 4.9: Percentage Growth Rate in Carbon Fibre Demand, 1983 Base
1983 1984 1985 1986 1987 1988 1989
USA 100 133 146 166 188 208 223
Japan 100 120 137 151 164 168 185
Europe 100 133 171 207 227 227 240
Others 100 129 129 140 160 232 244
Total 100 129 144 164 183 203 217
Source: Rollet109
To conclude, then, in the latter half of the eighties, carbon fibre consumption grew by around
17% each year. The markets overall had grown consistently throughout the decade at double
digit rates. If we look at the data for the consumption of carbon fibre over the period 1983 to
1989, Table 4.9, we see growth rates of up to 30% and totalling 217% over the six year
period. Every year during this time saw double digit growth. Prices stabilised at around $33
per kilo.110
Forecasts for the 1990’s looked good, with the defence outlook particularly
strong.
References 1 The Select Committee on Science and Technology, Session 1968-69, Minutes of Evidence,
Appendix 1, The Background to Reinforcement with Carbon Fibres 2 Bacon, Roger and Moses, Charles, Carbon Fibres, from Light Bulbs to Outer Space in High
Performance Polymers: Their Origin and Development, Proceedings of the Symposium Presented at
the 91st Meeting of the American Chemical Society, 1986 3 Bacon and Moses, op. cit.2
4 The Select Committee on Science and Technology, Session 1968-69, Minutes of Evidence, Ques
118, House of Commons, 157, 11th December 1968 5 Roskill, The Economics of Carbon Fibre, Roskill Information Services, January 1990
6 Phillips, Leslie, N., Carbon fibre comes of age, Endeavour, New Series, Volume 11, No 3, 1987
7 Peters, D.M., Plastics and Rubbers & Textiles, February, 1970
8 Matsui, Junichi, Surface Properties of Carbon Fibre Critical Reviews in Surface Chemistry, Volume
1, Issue 2, 1990 9 House of Commons, Minutes of Evidence, op. cit.4, Ques 407
10 House of Commons, Minutes of Evidence, op. cit.4, Memorandum submitted by Courtaulds
Limited 11
Sipko Huismans, quoted in Layman, Patricia, Chemical and Engineering News, June 1st 1987 12
ibid 13
House of Commons, Minutes of Evidence, op. cit.4, Ques 59 14
See evidence submitted by Harwell, House of Commons, op. cit.4
in these countries was not traded on the world markets However, the Kaiser Aerospace and Electronics
Corporation of Houston has recently announced plans to sell carbon fibre produced by the (former Soviet) All
Union Advanced Aviation Materials Institute on the world market.

146
15
House of Commons, Minutes of Evidence, op.cit.4, Memorandum submitted by The Morgan
Crucible Company 16
House of Commons, Minutes of Evidence, op.cit.4, Ques 126 17
Turner, W.N., Johnson, J.W., and Hannah, C.G., Composite Materials in Development of Gas
Turbine Materials, Meetham, Ed, Applied Science Publishers, 1981 18
Rolls Royce Ltd: Investigations under section 165(a)(i) of the Companies Act, 1948, HMSO, May
1973 19
Bacon and Moses, op. cit.2 20
Matsui, op. cit.8 21
Moncrieff, R.W., Man-Made Fibres,1970 22
The Select Committee on Science and Technology, Session 1968-69, Minutes of Evidence,
Appendix 1, The Background to Reinforcement with Carbon Fibres 23
Driver, D., Developments in Aero Engine Materials Metals and Materials, June 1985 24
Bacon and Moses, op. cit.2 25
House of Commons, Minutes of Evidence, op.cit.4, Memorandum submitted by The Morgan
Crucible Company 26
House of Commons, Minutes of Evidence, op.cit.4 Ques 470 27
Yoshimura, Seiichiro, Rapid Changes in Japan’s Carbon Fiber Industry, Mitsui Trade News,
October 1985 28
Hansard Parliamentary Review, Volume 796, written answers no. 74 29
Fleck, J.N., Goldstein, M., Jablonowski, E.J., and Neiss, E., Battelle Technical Review, Volume 17,
No. 8, August 1968 30
Modern Materials in Manufacturing Industry, The Fellowship of Engineering, 1983 31
Matsui, Junichi, quoted in The Financial Times, 25th April, 1989 32
Report of the Select Committee on Science and Technology, Session 1968-69, Carbon Fibres ,
20th February 1969 33
Hayward, Keith, Government and British Civil Aerospace, Manchester University Press, 1983 34
ibid. 35
Dardak, Thomas, Ed, International Directory of Company Histories, Reference Publishers,
International, 1988 36
Driver, D., Developments in Aero Engine Materials, Metals and Materials, June 1985 37
ICI executive quoted in The Financial Times 15th August 1986 38
The Financial Times, 9th July 1987 39
Bacon and Moses, op. cit.2 40
Bacon and Moses, op. cit.2 41
Matsui, op. cit.8 42
Driver, D., Hall, D.W., and Meetham, G.W., The Gas Turbine Engine in The Development of Gas
Turbine Materials, G.W. Meetham, Ed, Applied Science Publishers, 1981 43
Simez, R.F., The Influence of Aerospace-performance Requirements on Development of Advanced
Structural Materials, Philosophical Transactions of the Royal Society of London, A322, 323-333
(1987) 44
ibid. 45
Flight International, 31st November, 1983 46
ibid 47
The Financial Times 19th April 1983 48
The Financial Times 19th April 1983 49
Layman, Patricia, op. cit.11 50
Yoshimura, op. cit.27 51
The Economist, 1st July 1995 52
J.L.Bourgeois, Ministere de la Recherche et de la Technology, in interview April 1991 53
Blumberg, Herbert, Status quo der Entwicklung von polymeren Faserverbundwekstoffen in der
Bundesrepublik Deutschland im internationalen Vergleich, Focus, February 1989 54
Materials Edge, September/October 1987

147
55
International Co-operation and Competition in Materials Science and Engineering, US
Department of Commerce, June 1989 56
Yoshimura, op. cit.27 57
Gregory, Gene, ‘New Materials Technology in Japan’, in Forester, Tom, Ed., The Materials
Revolution 58
Aotoni, Hiroshi, Prospects for Carbon Fiber Reinforced Composites, TBR Intelligence, 1989 59
The Financial Times 15th August 1986 60
OECD., STI Review, December 1989 61
Advanced Materials by Design, US Office of Technology Assessment, Washington D.C., 1988 62
Euro Composite Newsletter, September, 1988 63
Office of Technology Assessment, op. cit.61 64
The Financial Times, October 27th, 1982 65
Chemiefasern-Textilindustrie, No. 39, December 1991 66
Kiyoshi Miyabe, Mitsubishi Rayon, in interview, March 1992 67
Sadao Shigihara, Kureha, in interview, April 1992. 68
Sadao Shigihara, Kureha, in interview, April 1992 69
Sadao Shigihara, Kureha, in interview, April 1992 70
Bacon and Moses, op. cit.2 71
British Composites Newsletter, January 1989 72
Advanced Materials Technology and Industrial Base, US Department of Defense, 1996 73
US Department of Defense, 1996, op. cit.72 74
Euro Composite Newsletter, March 1989 75
American Metal Market, March 20th, 1995 76
Nikkei Weekly, 21st November 1994 77
Fellowship of Engineering, op. cit. 78
David Nunn, Toray, in interview, October 1991 79
Mike Rai, Toray, in interview, October 1991 80
Matsui, op. cit.8 81
The Financial Times, October 27th 1982 82
The Financial Times, October 27th, 1982 83
Poesch, J.G., (Former Materials Marketing Manager of Hercules) in The Modern Plastics
Encyclopedia, 1985 84
The Financial Times, 19th April 1983 85
A Competitive Assessment of Selected Reinforced Composite Fibers US Department of Commerce,
Washington, D.C., 1985 86
Modern Plastics November 1982 87
Blumberg, Herbert, Status quo der Entwicklung von polymeren Faserverbundwerkstoffen in der
Blunderepublik Deutschland im internationalen Vergleich, Focus, February 1989 88
Office of Technology Assessment, op. cit.61 89
Rollet, Pierrick, Le Marche Japonais de la Fibre de Carbone, a report by the French Embassy,
Tokyo, May 1991 90
Goro Tsunoda, Mitsubishi Rayon, in interview, March 1992 91
Kagaku Kogyo Nippou, June 1995 92
Blumberg, op. cit.87 93
Advanced Materials Technology and Industrial Base, US Department of Defense, Washington,
D.C., 1996 94
ibid. 95
ibid. 96
SACMA, personal communication, October 1991 97
US Department of Defense, 1996, op. cit.93 98
ibid 99
ibid. 100
ibid.. 101
Charles Toyer, Toray, in interview, October 1995

148
102
Nippon Kasen Kyokai, December 1989 103
Kazuhisa Saito, Toho Rayon, in interview, March 1992
Takashi Masaki, Mitsubishi Rayon, in interview, March 1992
Keisuke Ishii, Toray, in interview, April 1992
Akitaka Kikuchi, Asahi Kasei, in interview, May 1992 104
Kozo Tanaka, Toho Rayon, in interview, March 1992 105
See Technology:R&D Scoreboard The Financial Times 17th June 1994 106
Kagaku Kogyo Nippou, 16th June 1992 107
Kiyoshi Miyabe, Mitsubishi Rayon, in interview, March 1992 108
Akitaka Kikuchi, Asahi Kasei, in interview, May 1992 109
Rollet, Pierrick, Le Marche Japonais de la Fibre de Carbone , a report by the French Embassy,
Tokyo, May 1991 110
Matsui, op.cit. 8

162
CHAPTER FIVE:
PROBLEMS AND POSSIBILITIES IN
THE 1990’s
By 1990, it was becoming clear that the series of shock political changes in Eastern Europe
were likely to be sustained, and the Cold War was coming to an end. This realisation bought
with it profound changes to the defence outlook and, in turn, the carbon fibre industry. As we
saw in Chapter Four, in 1987 the US Department of Defense had mandated that 50% of all
carbon fibre used in future systems bought by the Pentagon was to be produced in the US.
Similarly the PAN precursor for making the fibre was to be sourced domestically. The net
result of these directives, in conjunction with the very optimistic forecasts of the late 1980’s
(the industry was expecting double digit growth throughout the 1990’s1), was a period of
massive investment with a consequent huge jump in capacity that came on line over the years
1989 to 1991. Unfortunately for the industry, the arrival of this new capacity almost exactly
coincided with the end of the Cold War and the start of the defence cuts. The consequent
shake out of the sector is the focus of this chapter. Most particularly, we present data
collected during the course of this research that reveal the regional patterns and variations in
the industry response to the new post Cold War environment.v
The main purpose of this chapter is to examine the disparate strategies of the carbon fibre
producing firms since 1990. Firstly, we chart the course of the industry 1990-1995. The
impact of the changing defence market is then detailed, as is the Technology Reinvestment
Project, which was to have a decisive influence on the US producers. Finally, we compare
and contrast the corporate and financial governance of the individual carbon fibre producers.
The Carbon Fibre Industry 1990-1995
There are no official statistics on the production and consumption of carbon fibre and as it is
a comparatively new industry, there is little published data. Carbon fibre is not classified as a
distinct product under the US Harmonic System of trade definitions, even under the most
detailed 10 digit level. Hence, most of the data presented below was obtained directly from
v A chronology of the political events leading up the the end of the Cold War is presented in Appendix IV

163
firms and industrial associations, such as the US based SACMA (Suppliers of Advanced
Composite Materials Association) the AIA (Aerospace Industries Association).
Carbon fibre sales worldwide total approximately 8000 tons per annum.2 With a median
price of between 70 to 80 DM per kilogram,3 we can estimate the total global market to be
between $380 million and $435 million (August 1995 exchange rates). The changing values
of advanced carbon fibre composite shipments worldwide, according to the industrial
association SACMA are given in Table 5.1 below:
Table 5.1: World-wide Carbon Fibre Shipments
Year kilograms U.S. Dollars
1991 51901179 $298,800,000
1992 58980755 $374,100,000
1993 66218995 $384,900,000
Midyear(Jan June)1994 3270988 $225,100,000
Source: SACMA4
SACMA draws its figures from member data and estimates that its statistics represent 90
percent of carbon fibre composite shipments within North America, Western Europe and the
Far East.5 According to the Japanese producer, Toho Rayon, the market worldwide for PAN
carbon fibre increased by 23% in 1988, 15% in 1989, 7% in 1990 and 7% in 1991.6
The modern history of the carbon fibre industry dates from the 1987 DoD requirement that
50% of PAN-based graphite fibre for US defence applications be made from domestic PAN
by 1992 and furthermore that 50% of the carbon fibre itself should be domestically sourced.
If we examine the carbon fibre market of the time, we find:
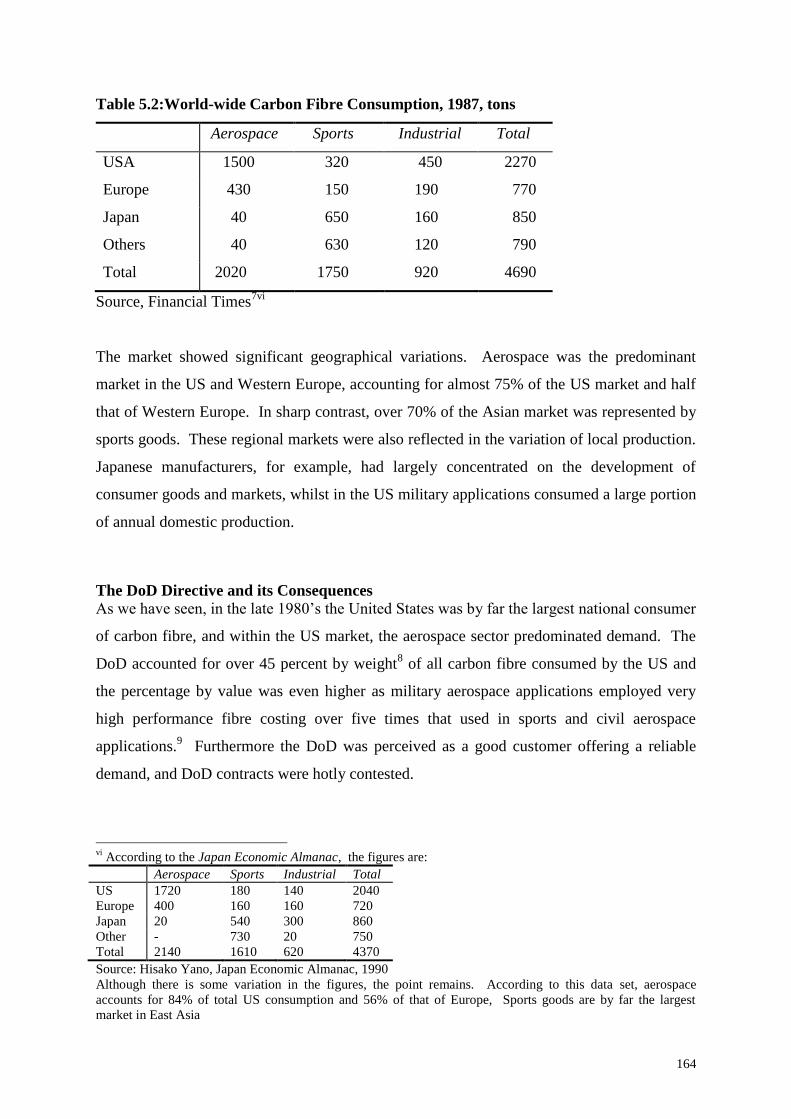
164
Table 5.2:World-wide Carbon Fibre Consumption, 1987, tons
Aerospace Sports Industrial Total
USA 1500 320 450 2270
Europe 430 150 190 770
Japan 40 650 160 850
Others 40 630 120 790
Total 2020 1750 920 4690
Source, Financial Times7vi
The market showed significant geographical variations. Aerospace was the predominant
market in the US and Western Europe, accounting for almost 75% of the US market and half
that of Western Europe. In sharp contrast, over 70% of the Asian market was represented by
sports goods. These regional markets were also reflected in the variation of local production.
Japanese manufacturers, for example, had largely concentrated on the development of
consumer goods and markets, whilst in the US military applications consumed a large portion
of annual domestic production.
The DoD Directive and its Consequences
As we have seen, in the late 1980’s the United States was by far the largest national consumer
of carbon fibre, and within the US market, the aerospace sector predominated demand. The
DoD accounted for over 45 percent by weight8 of all carbon fibre consumed by the US and
the percentage by value was even higher as military aerospace applications employed very
high performance fibre costing over five times that used in sports and civil aerospace
applications.9 Furthermore the DoD was perceived as a good customer offering a reliable
demand, and DoD contracts were hotly contested.
vi According to the Japan Economic Almanac, the figures are:
Aerospace Sports Industrial Total
US 1720 180 140 2040
Europe 400 160 160 720
Japan 20 540 300 860
Other - 730 20 750
Total 2140 1610 620 4370
Source: Hisako Yano, Japan Economic Almanac, 1990
Although there is some variation in the figures, the point remains. According to this data set, aerospace
accounts for 84% of total US consumption and 56% of that of Europe, Sports goods are by far the largest
market in East Asia

165
Despite the high level of DoD use, all the critical polyacrylonitrile (PAN) precursor qualified
for military use was imported from the UK and Japan. US defence companies were also
largely reliant on Japan for the carbon fibre itself. Figure 4.1 shows the tie-ups in place at the
time. By the mid 1980's, carbon fibre had been placed on the US Commodity Control List
(which prevents exports to proscribed countries) and military interest in the material was such
that over 70% of US federal composite R&D was funded by the DoD.10
Through the F-15
and F-16 programmes, carbon fibre had gained a reputation for high performance and
reliability and was rapidly becoming a baseline material for the military aerospace industry.
US concerns about the reliance on Japan for a material of such strategic importance began to
be voiced. The issue of the falling market share of US firms in the carbon fibre commodity
trade was first raised under the 1984 General Tariff Act. In 1985, the then Under Secretary
of Defense for Research and Engineering issued a statement proposing that a domestic source
of PAN precursor be assured and a policy directive to achieve this end was subsequently
developed. This was pursued further by Congress appropriation committees, with the result
that in the budget for the 1987 DoD appropriations, the US Congress mandated that PAN
production bases be established in the US. The directive timetables incremental increases in
the PAN production base: 15% of all PAN to be used in military systems was to be
domestically produced by 1989, 20% by 1990, 25% by 1991 and 50% by 1992.11
The cost of
putting in a PAN plant is almost the same as building the equivalent carbon fibre facility.12
Legislation governing the production of carbon fibre itself swiftly followed; the 1988 DoD
Appropriations Act "directs the Secretary [for Defense] to ensure that at least 50% of the
polyacrylonitrile carbon fibre requirement be procured from domestic sources by 1992”.13
The requirement was reiterated in the appropriations acts of 1989 (HR4781), 1990 (HR3072)
and 1991 (HR5803) and developed further in 1992 when the House of Representatives
directed "the Secretary [for Defense] to ensure that a minimum of 75% of the coal and
petroleum pitch carbon fiber requirement be procured from domestic sources by 1994".14
The industry had been expecting the DoD requirement and responded rapidly.15
Prior to the
establishment of the Congressional requirement, Amoco was the only firm producing PAN
precursor in the US. At the time, Amoco could fulfil only 15% of the US demand,16
and was
not qualified for use by the military. 100% of the PAN precursor used in the manufacture of
DoD systems was imported from Japan. In order to fulfil the directive, therefore, American-

166
based production facilities for both carbon fibre and its precursor, PAN, were expanded.
Amoco announced plans to expand its carbon fibre capacity by 600 tons by 1990.17
Hercules
began construction of a 1700 ton per year precursor plant in Decatur, Alabama and a year
later completed an expansion project to increase its carbon fibre capacity at its Magna plant
to 1400, with further increases planned for 1990.18
BASF started production of PAN
precursor in late 1987, the same year as the DoD directive, and announced plans to increase
precursor production further with a $30 million expansion project.19
The firm also announced
it would put in plant to increase its carbon fibre capacity threefold from 450 tons to 1350
tons. Courtaulds, too, was no exception, announcing it would build a precursor plant in the
US based on its UK manufacturing technology20
and BP’s Californian based subsidiary Hitco
increased its carbon fibre production from 25 to 250 tons. However, neither Toray, Toho
Rayon, Mitsubishi Rayon nor Asahi Kasei put in US-based plant during this period, the result
being that the Japanese firms became the only global producers of any significant size not to
respond to the DoD directive.
The net result of this wave of investment was a substantial increase both in carbon fibre and
carbon fibre precursor capacity in the US. Over $100 million dollars was invested in new
PAN precursor facilities. Table 5.3 below summarises the changes in PAN-precursor capacity
of the three big USA producers over this period.
Table 5.3: Changes in US PAN-precursor Supply, tons
Company Location Capacity On-stream
Amoco Greenville, S.C. 500 1982
500 1990
Hercules Decatur, Al 1700 1989
BASF Williamsburg 3000 1990
Source Roskill21
On top of that, as can be seen from capacity data shown later in Table 5.6, within three years
of the DoD directive, US carbon fibre capacity had increased by over 60% percent. In 1988,
the market research firm Business Communications Co had estimated that 1993 US
consumption of carbon fibre would total 5500 tons, of which aerospace would constitute 75%
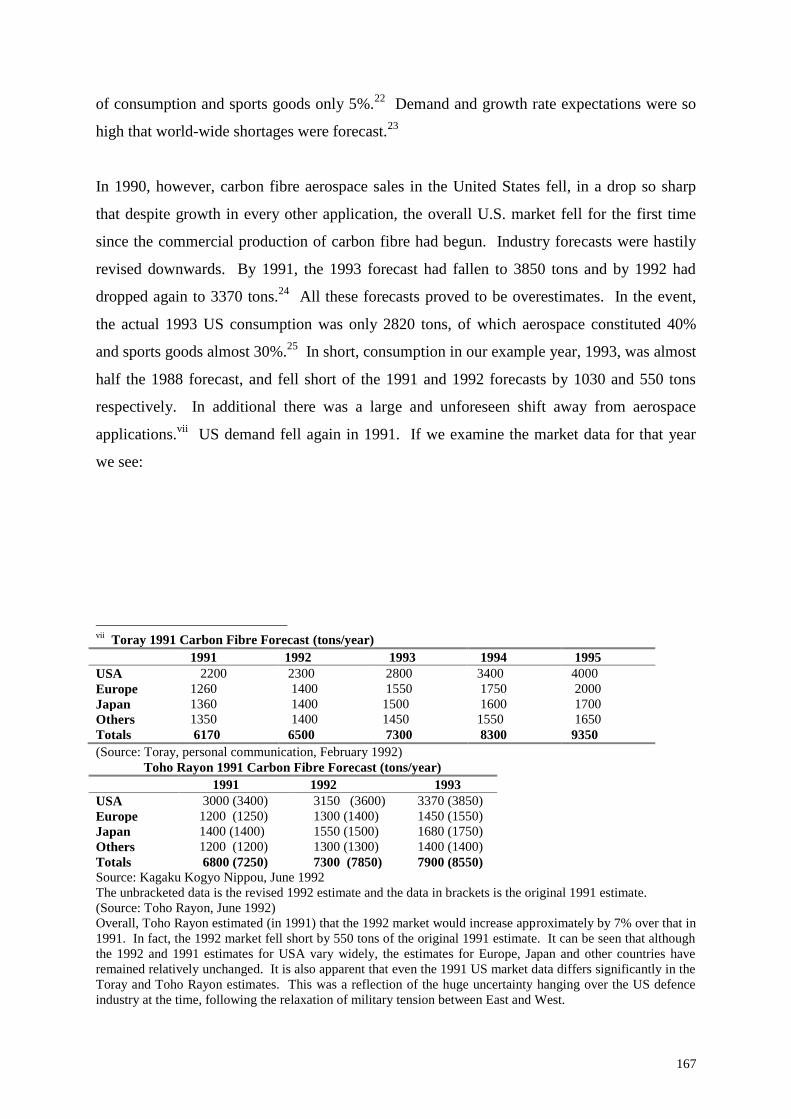
167
of consumption and sports goods only 5%.22
Demand and growth rate expectations were so
high that world-wide shortages were forecast.23
In 1990, however, carbon fibre aerospace sales in the United States fell, in a drop so sharp
that despite growth in every other application, the overall U.S. market fell for the first time
since the commercial production of carbon fibre had begun. Industry forecasts were hastily
revised downwards. By 1991, the 1993 forecast had fallen to 3850 tons and by 1992 had
dropped again to 3370 tons.24
All these forecasts proved to be overestimates. In the event,
the actual 1993 US consumption was only 2820 tons, of which aerospace constituted 40%
and sports goods almost 30%.25
In short, consumption in our example year, 1993, was almost
half the 1988 forecast, and fell short of the 1991 and 1992 forecasts by 1030 and 550 tons
respectively. In additional there was a large and unforeseen shift away from aerospace
applications.vii
US demand fell again in 1991. If we examine the market data for that year
we see:
vii
Toray 1991 Carbon Fibre Forecast (tons/year)
1991 1992 1993 1994 1995
USA 2200 2300 2800 3400 4000
Europe 1260 1400 1550 1750 2000
Japan 1360 1400 1500 1600 1700
Others 1350 1400 1450 1550 1650
Totals 6170 6500 7300 8300 9350
(Source: Toray, personal communication, February 1992)
Toho Rayon 1991 Carbon Fibre Forecast (tons/year)
1991 1992 1993
USA 3000 (3400) 3150 (3600) 3370 (3850)
Europe 1200 (1250) 1300 (1400) 1450 (1550)
Japan 1400 (1400) 1550 (1500) 1680 (1750)
Others 1200 (1200) 1300 (1300) 1400 (1400)
Totals 6800 (7250) 7300 (7850) 7900 (8550)
Source: Kagaku Kogyo Nippou, June 1992
The unbracketed data is the revised 1992 estimate and the data in brackets is the original 1991 estimate.
(Source: Toho Rayon, June 1992)
Overall, Toho Rayon estimated (in 1991) that the 1992 market would increase approximately by 7% over that in
1991. In fact, the 1992 market fell short by 550 tons of the original 1991 estimate. It can be seen that although
the 1992 and 1991 estimates for USA vary widely, the estimates for Europe, Japan and other countries have
remained relatively unchanged. It is also apparent that even the 1991 US market data differs significantly in the
Toray and Toho Rayon estimates. This was a reflection of the huge uncertainty hanging over the US defence
industry at the time, following the relaxation of military tension between East and West.

168
Table 5.4: World-wide Markets for PAN-based Carbon in 1991 (tons)
Aerospace Sports Industrial Total
USA 1080 530 590 2200
Europe 645 325 290 1260
Japan 60 810 490 1360
Korea/Taiwan 1350 1350
Total 1785 3015 1370 6170
Source, Toray26
A comparison of Table 5.2 with Table 5.4 reveals that one of the most significant changes
between 1987 and 1991 is the large drop in the demand from the US aerospace sector, a fall
so large that although world-wide carbon fibre demand rose significantly, US consumption
failed to increase at all. We shall see exactly why the US aerospace demand for carbon fibre
fell in this dramatic manner later in this chapter, but we shall first examine the impact this
market dislocation had on the industry.
By 1991, the previously overwhelming position of the US as the largest national consumer of
carbon fibre had faltered. Demand by the US aerospace sector fell in absolute terms by 500
tons. Moreover, this fall took place against a background of rapidly increasing capacity in
the US in particular as industry responded to the US DoD mandate.
The most immediate result for the industry was a period of overcapacity. In 1991, carbon
fibre nameplate capacity worldwide totalled around 11,500 tons, compared to a total
consumption of 6170 tons. viii
Because of the adverse market conditions, the cost of carbon
fibre began to fall. The price of 12K tow fibre (the standard for the industry), fell by
approximately 20% between the years 1989 to 1992 (with slight variations in price in the
different countries depending on local market conditions).27
Many carbon fibre
manufacturers were selling at cost.28
Indeed, it was alleged that Japanese firms were selling
viii
It should be noted that carbon fibre capacities are quoted in terms of their so-called nominal value or
"nameplate" capacity. This is the capacity based on the production of 12K tow fibre (the standard for the
industry) only. Most companies, however, manufacture a production mix of different tows which reduces the
actual output. Hence the real capacity is about three quarters of the nameplate capacities quoted by the
companies. In short, although the total world nameplate capacity is over 11,500 tons, the actual total global
capacity is only around 8,500 tons, but the point remains.

169
at dumping prices.29
In 1991, no US producer turned a profit from their carbon fibre
operations30
and a shakeout of the industry began.
Courtaulds was the first casualty. In June 1991, its plant in Sacramento, California was sold
to Mitsubishi Rayon and in November of the same year, Courtaulds abandoned carbon fibre
production at its UK plant in Coventry.31
Gordon Campbell, the Director responsible for
carbon fibre told the in-house paper, Courtaulds News,
"In the last 12 months, the world recession has significantly reduced demand for
sporting goods carbon fibre, which is our major market. Demand has also fallen
in the defence related industries. On top of this nearly 40 percent additional
capacity has come on line from other manufacturers. The combined effect has
been devastating."32
Sporting goods were indeed Courtaulds major market accounting for 60% of sales. However,
the market for sporting goods had in fact increased over the period 1990-1991, as it had
every year, showing growth in every geographical area:
Table 5.5: Sports Market for Carbon Fibre, tons
1990 1991
US 380 530
Europe 325 370
Japan 750 810
Taiwan/Korea 1200 1350
Total 3015 2700
Sources, Toray 33
Toray's UK office assert that Courtaulds was in fact adversely affected by the downturn in the
UK defence spending. The sector constituted only 7% of Grafil sales34
but the falling
defence demand did colour Courtaulds’ view of the future of the industry.35
Courtaulds’
immediate problems centred on several factors. The first was that they were unable to
produce fibre of a consistently high quality,36
a fact that rendered them uncompetitive when
the industry faltered. Secondly, it was generally believed throughout the industry that the
sector would recover through growth in non military sectors (world-wide, consumption had

170
continued to grow) but that real profitability would not return until the mid 1990’s.
Courtaulds operated a two to three year return on investment strategy37
and the projected time
scale for recovery was beyond the firm's planning horizon. The company had made its first
cutbacks within months of the downturn of the industry and in the summer of 1991, described
itself as "simply overwhelmed by external events" and not "able to live with any short term
problems."38
The unexpected nature of the crash is illustrated by Courtaulds in-house literature, which
printed positive forecasts as late as December 1990,
"[carbon fibre] demand will grow at around 10% per annum ... Grafil is well
placed to take advantage of this future growth with a strong international market
coverage and an efficient manufacturing operation strategically positioned in
Europe and the US ... Toray and Toho [Rayon] will always be tough competition
but we have built up a strong position in the Far East which we intend to keep."39
Twelve months later, the carbon fibre plant was closed, with 107 redundancies. The
company then commented,
"Carbon fibre is very capital intensive, very heavy on fixed costs, both in terms of
manufacturing and in terms of support from research, marketing, sales and so on.
A business with these characteristics is very exposed if capacity exceeds
demand."40
Mitsubishi Rayon had been eyeing the American market for some time. In the summer of
1990, the firm had acquired the Californian companies Newport Composites and Newport
Adhesives for $20 million.41
The two firms were consolidated into one, and used by
Mitsubishi Rayon to produce golf clubs from carbon fibre prepreg. With its acquisition of the
Courtaulds’ carbon fibre plant, the firm was able to establish a well integrated production
base in the States.
Another UK owned firm, Hitco, was the next to close. Hitco was a BP subsidiary based in
California and, since the DoD mandate, had been steadily increasing capacity. In August
1991, it was announced that Hitco would discontinue its carbon fibre line due to "over

171
crowding of the marketplace".42
Hitco was a comparatively small producer. As the Japanese
trade paper Kagaku Kogyo Nippou had observed two months earlier, the most vulnerable
firms were smaller companies with capacities under 1000 tons per year.43
The large US producers, however, were not left unscathed. By the spring of 1992, reports
concerning problems at BASF began to appear in the European press.44
The company had
expanded rapidly in the US and had only a year before opened a major new carbon fibre plant
in Rock Hill, South Carolina. By June of that year, the company had made it clear that its
carbon fibre operations were for sale. Its downstream structural materials operations were
sold to the European firm Hexcel. The sale included BASF's composites division which
supplied composite structures to the Eurofighter 2000. The US carbon fibre plant remained
unsold. The major Japanese producers were approached but were wary of the sale and there
was no attempt by the Japanese producers to take over the plant.45
BASF had been a major
supplier of fibre to the military and specialised in the aerospace sector46
and investment in
such a sensitive, high technology activity was seen as too risky by the Japanese,47
especially
as a particularly bloody trade war was raging between the two countries at the time.
Eventually, BASF abandoned the plant, idling 1360 tons of capacity.
Amoco and Hercules also floundered. Amoco announced a downsizing of its composites
operations48
and shut down carbon fibre production completely for ninety days49
at the end of
1991, just twelve months after the firm's new 540 ton capacity plant began production.
According to industry sources, by the spring of 1992 Amoco had withdrawn from carbon
fibre sporting goods production due the severe competition50
and was planning to decrease
capacity.51
Even Hercules, the largest supplier of carbon fibre to the military was caught
unawares. In 1990, the company had been forced to write off over three million dollars in
aerospace expenses and consequently sell off a number of businesses. It chose to retain only
the most profitable. Carbon fibre was described as one of "those with a future",52
and, despite
its financial difficulties, Hercules invested even further in the sector, setting up a 13.5 billion
lire joint venture to manufacture carbon fibre and composites in Italy.53
Just two years later,
however, by the spring of 1992, the company had begun approaching possible Japanese
buyers in a effort to sell off its carbon fibre interests.54
Meanwhile, the Japanese producers themselves were steadily expanding capacity. Toray,
Toho Rayon, Mitsubishi Rayon and Asahi Kasei all substantially increased domestic capacity

172
in 1991. Asahi Kasei again increased capacity in 1993. The domestic markets in Japan,
Taiwan and Korea all continued to grow at the rates predicted in earlier forecasts. However,
the expansion of the Japanese companies was not limited to Japan itself. Throughout the late
1980’s, as we have seen, Japanese carbon fibre activities in the US were largely confined to
licensing and technology agreements with American firms. Provisions within these
agreements limited direct participation by Japanese firms in US markets and no Japanese firm
had invested in US-based plant in response to the DoD mandate. As a result, the major
carbon fibre producers had only a limited role in the largest market for carbon fibre. The
crisis in the industry gave Japanese companies the opportunity for a more active role in US
markets. Mitsubishi Rayon acquired the Californian based company Courtaulds Grafil Inc. in
1991. Both Toray and Toho Rayon began selling carbon fibre directly in the US and, in
1992, Toray acquired the US firm Composite Horizon as well as announcing plans to
establish a subsidiary prepreg plant in Washington State.55
Aside from accessing new markets, these overseas investments offered Japanese firms
comparatively cheap land, utilities and labour. Production overseas was one way of avoiding
the extra costs incurred through the rising yen. From the viewpoint of the US firms, the
businesses were sold at a good price, especially considering the flat market. In yen terms,
however, they were relatively cheap. (The yen had been at an all time high since 198956
)
Europe, too, was seen as a opportunity. Toray completed a second line at Soficar, essentially
doubling production, and in April 1993 Toho Rayon increased its stake in Akzo's German
carbon fibre business (Tenax Fibers GmbH) to a controlling 51%57
and immediately
increased capacity to 700 tons.58
In January 1995, Toho once again raised its stockholding in
Tenax, this time to 90%.59
The result of this flurry of activity, along with the closure of
Courtaulds UK plant, was that by the mid 1990’s, no European based carbon fibre facility
remained under European control.
The first half of 1993 proved a low point for the US industry. After BASF decided to
withdraw from the business in March, surplus capacity tightened. In the autumn of the same
year, the first awards of the Technology Reinvestment Project (a Clinton Administration
initiative designed to aid stricken defence sector industries to develop dual use technologies -
see below) were announced. The TRP awards essentially secured the immediate future of
Hercules and Amoco's carbon fibre business for the following 18 months. Other firms,
however, continued to struggle. Finally, after accumulating losses of 1.2 billion yen ($11.5
173
million), Asahi Kasei announced it was closing down its carbon fibre operations.60
It is now
rumoured that the carbon fibre business will be sold to Mitsubishi Rayon.61
The industry remained in a state of over capacity throughout the early 1990’s, but as
consumption had continued to grow world-wide since 1990 (albeit at a lower rate than
expected), gradually the excess capacity was whittled away. "The early '90s slump is over ...
most carbon fiber producers are now operating at full capacity" reported the Chemical and
Engineering News in late 1994.62
Within a month, Amoco had announced plans to buy up
BASF's 2million pound idled line in Rock Hill63
and, by the spring of 1995, Toho Rayon,
Toray and Fortafil were all reportedly planning major capacity increases.64
In Tables 5.6 and 5.7, we group together carbon fibre capacities by company location and
ownership for the period 1988 to 1995. In Figure 5.1 we present the changing ownership of
the total global capacity of carbon fibre, grouped by geographical ownership (pre-1988 data
calculated from Blumberg,65
1988 onwards from the data calculations in Table 5.7), and in
Figure 5.2, the percentage change in capacity ownership. It can be seen that Japan has
remained the largest producer of capacity of carbon fibre throughout the period and that
collectively throughout the 1980’s, all the producers pursued similar strategies of rapid
growth with the result that up until 1987, the percentage ownership of capacity of the
respective regional groups stayed more or less constant. The ownership capacities of USA
and Western Europe are virtually identical over this period. The most striking feature of
Figure 5.1, however, is the divergence of strategy post 1990. Japanese firms rapidly increased
capacity domestically and overseas, largely at the expense of the European producers.
Meanwhile the volume of US-owned capacity levelled off up until the start of government
intervention in late 1993, then resumed growth. Hence, post 1990, we see a startling
dislocation in the pattern of market share.

174
Table 5.6 Carbon Fibre Capacities by Geographical Location [tons]
May-88 1989 Feb-90 Dec-91 Jun-92 Jun-93 Jun-94 Jun-95
JAPAN
Toray 1,500 1,500 1,500 2,250 2,250 2,250 2,250 2,550
Toho Rayon 1,420 1,420 1,420 2,020 2,020 2,020 2,020 2,600
Asahi Kasei 300 300 350 450 450 450 - -
Mitsubishi
Rayon
120 150 150 500 500 500 500 500
Total 3,340 3,370 3,420 5,220 5,220 5,220 4,770 5,650
PERCENT 46.0 43.5 41.6 48.0 45.8 52.0 48.3 46.6
USA
Hercules 1,050 1,400 1,400 1,715 1,715 1,715 1,715 1,715
BASF 450 450 450 1,350 1,350 - - -
Amoco 450 450 450 850 1,000 1,000 1,000 1,750
Fortafil 450 450 450 350 350 350 650 770
Courtaulds 400 400 450 - - - - -
BP 25 120 250 - - - - -
Mitsubishi
Rayon
- - - 450 450 450 450 700
Total 2,825 3,270 3,450 4,715 4,865 3,515 3,815 4,935
PERCENT 38.9 42.2 42.0 43.4 42.7 35.0 38.6 40.7
EUROPE
Courtaulds 350 350 450 - - - - -
Soficar 300 300 300 340 700 700 700 700
Akzo 350 350 500 500 500 500 500 740
Sigri 100 100 100 100 100 100 100 100
Total 1,100 1,100 1,350 940 1,300 1,300 1,300 1,540
PERCENT 15.1 14.2 16.4 8.6 11.4 13.0 13.2 12.7
GLOBAL
TOTAL
7,265
7,740
8,220
10,875
11,385
10,035
9,885
12,125
Sources: 1988, Hiramatsu and Nishimura;66
1989, Matsui;67
1990, Asahi Kasei;68
1991,
Toray;69
1992, Kagaku Kogyo Nippou;70
1993, Kagaku Kogyo Nippou;71
1994, Kagaku
Kogyo Nippou;72
1995, Kagaku Kyogo Nippou.73

175
Table 5.7: Carbon Fibre Capacities by Company Ownership [tons]
May-88 1989 Feb-90 Dec-91 Jun-92 Jun-93 Jun-94 Jun-95
JAPANESE OWNED
Toray 1,710 1,710 1,710 2,488 2,740 2,740 2,740 3040
Toho Rayon 1,420 1,420 1,420 2,020 2,020 2,020 2,270 3266
Asahi Kasei 300 300 350 450 450 450 - -
Mitsubishi
Rayon
120 150 150 950 950 950 950 1,200
Total 3,550 3,580 3,630 5,908 6,160 6,160 5,960 7,506
PERCENT 48.9 46.3 44.2 54.3 54.1 61.4 60.3 61.9
USA OWNED
Hercules 1,050 1,400 1,400 1,715 1,715 1,715 1,715 1,715
Amoco 450 450 450 850 1,000 1,000 1,000 1,750
Fortafil 450 450 450 350 350 350 650 770
Total 1,950 2,300 2,300 2,915 3,065 3,065 3,365 4,235
PERCENT 26.8 29.7 28.0 26.8 26.9 30.5 34.0 34.9
EUROPEAN OWNED
Courtaulds 350 350 450 Ceased - - - -
BASF 450 450 450 1,350 1,350 - - -
Courtaulds
(USA)
400 400 450 Sold - - - -
BP 25 120 250 Ceased - - - -
Soficar 90 90 90 102 210 210 210 210
Akzo 350 350 500 500 500 500 250 74
Sigri 100 100 100 100 100 100 100 100
Total 1,765 1,860 2,290 2,052 2,160 810 560 384
PERCENT 24.3 24.0 27.9 18.9 19.0 8.1 5.7 3.2
GLOBAL
TOTAL
7,265
7,740
8,220
10,875
11,385
10,035
9,885
12,125
Sources: derived from Table 5.6, with additional information from Toray,74
Europe Chemie,75
and Japan Chemical Week.76

176
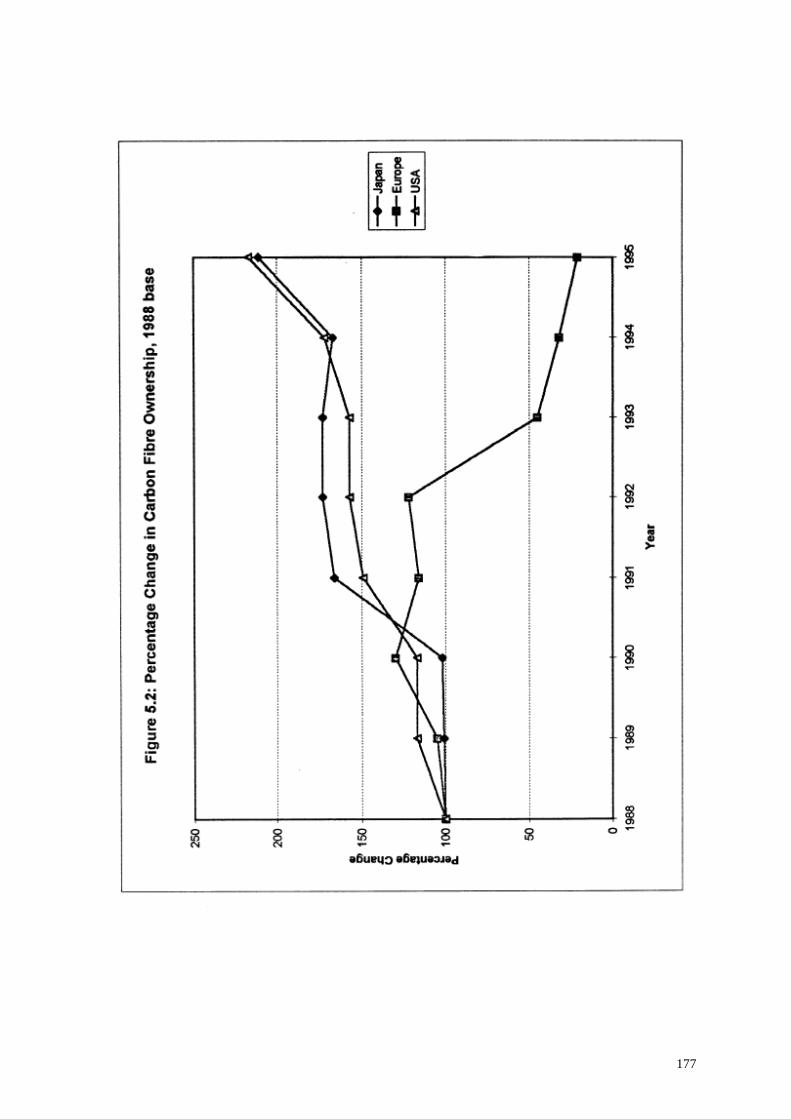
177
178
The period 1990-1993 had been a difficult time for the industry, due to the fall in the demand
from the US DoD in combination with the large jump in global capacity. European-owned
firms responded to the changing market conditions with a series of closures and sales of
stock, with the result that over the four year period 1990-1994, the total capacity within
European ownership tumbled from 2290 to 560 tons, at an average annual drop of almost
20%. Meanwhile, the total capacity of US-owned facilities remained flat, temporarily, with a
corresponding fall in market share as the Japanese producers increased capacity. US-owned
capacity begins to grow again post 1993, the year, as we shall see, that the US government
stepped into stabilise the industry. At the same time, the Japanese companies dramatically
increased capacity, despite the over-investment generally in the industry, and the excess
capacity worldwide. Overall, the capacity share of Japanese companies and their overseas
subsidiaries increased from approximately 44% of global production in 1990 to just over 60%
by the start of 1993 (see Table 5.7).
The data raise the question as to why firms of different countries demonstrated such radically
different responses to the same changing market conditions. It may be argued that these
different responses reflect differences in changes at a local level, in local markets. However,
trading in carbon fibre has always taken place on a global basis. Moreover the Japanese
firms have not only expanded capacity at home but also overseas. As we have seen, Soficar,
which is based in France but is 80% owned by Toray, doubled its capacity in 1992,
Mitsubishi Rayon acquired Courtaulds Grafil plant in Sacramento in 1991 and Toho Rayon
increased its carbon fibre activities in Germany. Toray plans to open a 100% owned
subsidiary prepreg plant in Seattle. These investments, moreover, occurred at a time when
Japanese investments overseas were falling overall.77
This would suggest that the differences in approach between Japanese and Western countries
are largely a result of corporate strategy factors and the market type (as opposed to location)
on which firms chose to focus. Indeed, all the managers questioned as to why Japanese
companies increased carbon fibre production at a time when other firms of G7 countries were
currently cutting capacity, cited the same two reasons. These were:
the over-reliance of US companies on defence markets, and
the ability of Japanese companies to operate with comparatively long time horizons.
In the following sections we will seek to explore these hypotheses.

179
The Defence Base; its Collapse and Consequences
We saw above that the changing market for carbon fibre elicited a quite different corporate
response from the Japanese produces compared to those in the United States. One of the key
explanations cited by the managers interviewed during the course of this research was the
relatively heavy reliance on defence markets in the United States. In this section we will
examine this claim in more detail.
US Department of Defense usage of carbon fibre had grown steadily throughout the second
half of the 1980’s. DoD consumption alone had accounted for 53% of the total US carbon
fibre market in 1985, and over the period 1985 to 1989 the volume of DoD demand rose by
almost 60%, increasing by 5% in 1986, 2.7% in 1987, 15% in 1988 and over 28% in 1989.78
Forecasts for military usage were also very strong. By the mid 1980’s, all the major carbon
fibre producers had developed intermediate modulus fibres to a commercial stage. This had
been a critical requirement for further aerospace applications. At the same time, the 'hot wet'
problem (that is, the absorption of moisture at ground level by matrix resins heated at high
altitude), was overcome. The problems of low modulus and moisture absorption had
previously limited the use of composites in supersonic military aircraft to small parts but
post-1985, as a result of these technological improvements in matrix resins and stiffer fibre,
large carbon fibre composite structures began to be rapidly incorporated into the
developmental programmes for military aircraft construction in the 1990’s.
In 1986, Mike Bowman, head of the advanced composites group at Du Pont listed the
potential carbon fibre projects at the time,
"The Advanced Tactical Fighter for the Airforce, and a version of that for the
Navy a couple of years later. Missiles - almost anything is a carbon fibre
opportunity. Helicopters - the LHX, the army's all composite lightweight to
replace the Black Hawk. On land, the Hummer series of vehicles - very light,
high speed troop and weapon carriers. The whole space industry - space stations,
Star Wars and so on. Ships - high speed patrol boats with above water ballistic
protection, usually composites. That all adds up to $500bn ... and its all available

180
in the mid-1990’s, and that’s what everyone is positioning to take advantage
of."79
And by way of illustration, when ICI bought the prepregger Fiberite in the mid-1980’s, the
Financial Times commented,
“It may be thought that $750 million is pretty steep for one small company. But
Fiberite has a major asset - the necessary security clearance for Pentagon work
..[and].. there are some colossal Pentagon contracts up for grabs.”80
Overall, then, the defence outlook was particularly promising. Predictions saw carbon fibre
use in military aircraft increasing to 50 or 60 percent of total aircraft weight and Japanese
sources began expressing concern over their possible exclusion from the lucrative military
contracts. There seemed few doubts about the "increasing demands of the military aviation
sector in the 1990s".81
The forecasts coincided with the Congressional mandate and further informal assurances
from the DoD. As David Forrest, the then president of BASF Structural Materials
commented at the time,
“everyone [has] been pressurised by the Department of Defense to increase
capacity."82
And as the Chemical and Engineering News observed,
“The pressures are on to do more ... The US Department of Defense is now
pressing for domestic sources of precursors, a strategic decision, to be
implemented by 1990. ‘So we will be doing that’ Huismans [a Courtaulds
director of the time] says.”83
In anticipation of the new markets, and as a result of consequent investments, carbon fibre
capacity in the United States increased by around 70% between 1988 and 1992, with the three
largest firms, Amoco, Hercules and BASF increasing capacity by 108% over the four year
period.84

181
As we saw in the above section, however, US carbon fibre markets actually fell below the
1989 level in 1990, 1991, and 1992. If we look at the market breakdown in more detail, we
see:
Table: 5.8 US Carbon Fibre Markets, (pounds weight, million)
198
5
198
6
198
7
198
8
198
9
199
0
199
1
199
2
199
3
199
4
199
5
Auto 0.15 0.17 0.20 0.30 0.40 0.34 0.26 0.33 0.54 0.65 0.78
Sports 0.27 0.30 0.50 0.77 0.92 1.08 1.16 1.23 1.29 1.34 1.40
Industr
y
0.43 0.51 0.60 0.70 0.85 1.13 1.03 1.17 1.38 1.82 2.18
Civil
aero
0.39 0.46 0.54 0.64 0.75 0.83 0.92 1.17 1.40 1.70 2.05
DoD 1.41 1.48 1.52 1.75 2.25 1.50 0.95 1.12 1.49 1.86 2.21
Total 2.65 2.95 3.36 4.16 5.17 4.88 4.32 5.02 6.10 7.37 8.62
Source, SACMA85
Table 5.8 reveals two main points. Firstly, it illustrates the comparatively heavy dependence
of the US carbon fibre market on US military agencies: throughout the period 1985 to 1989,
the DoD accounted for around half the total US demand.
The Table also shows that the three year slippage commencing in 1989 was entirely due to
the falls in the defence sector. Between the years 1989 and 1991, DoD usage of carbon fibre
fell nearly 60%. In 1990 alone the demand for carbon fibre from the DoD fell by over 30%.
The DoD market share of the total US carbon fibre market had fallen during 1987, 1988 and
1989. However this was a result of the vigorous growth in the use of carbon fibre in non-
military sectors. The demand from the defence sector had continued to increase over this
period. The 1989-1990 fall, in contrast, was so severe that despite growth in all other sectors,
the total US carbon fibre market also markedly decreased.
The fall in DoD carbon fibre demand came about through the overall cuts in defence
spending. The US defence budget had began an enforced, albeit slow, decline in FY1986 in

182
response to the $2 trillion budget deficit and the Reagan Administration Gramm-Rudmann
amendment, which mandated that Congress should start presenting balanced budgets. These
cuts were accelerated post 1990, as the perceived threat from the former Soviet Bloc
subsided, and the purpose and function of military capabilities became less clearly defined.
The new security environment, in conjunction with the huge US budget deficit, resulted in
military budgets being fixed on almost an ad hoc basis in which economic and short-term
political factors played the decisive role.
Procurement was one area of spending where the reduction of military expenditure was, and
is, particularly severe. The US military procurement budget authority average during the
cold war (1975 to 1990, in constant 1997 prices) was $95.9 billion. This figure is forecast to
fall to $63.1 by 1997, a 34.2% drop. Reflecting the demise of the USSR, the maximum cuts
are in strategic bombers and tactical wing fighters86
.ix
In 1992, General Colin Powell, the
former Chairman of the Joint Chiefs of Staff remarked,
"That F-15 of ours is good enough for a long time to come. We only go up to the
next family, the F-22, if the threat to justify it really exists at the time or if the F-
15s are falling out of the sky."87
Tables 5.9 and 5.10 show the US aerospace industry sales by product group in terms of
number and value in both real and constant dollars and further confirm the impact of the
defence cuts. Throughout the 1980’s, the US DoD was the largest customer for the entire US
aerospace industry. In 1991, 1992 and 1993, however, defence sales fell to such an extent
that civil sales outstripped military purchases for the first time in over a decade.
ix
In 1990, the US had 36 tactical fighter wings and 268 strategic bombers. The projected capabilities for 1997
are 26 and 180 respectively, representing percentage drops of 27.8% and 32.8% (Sipri Yearbook, 1993).
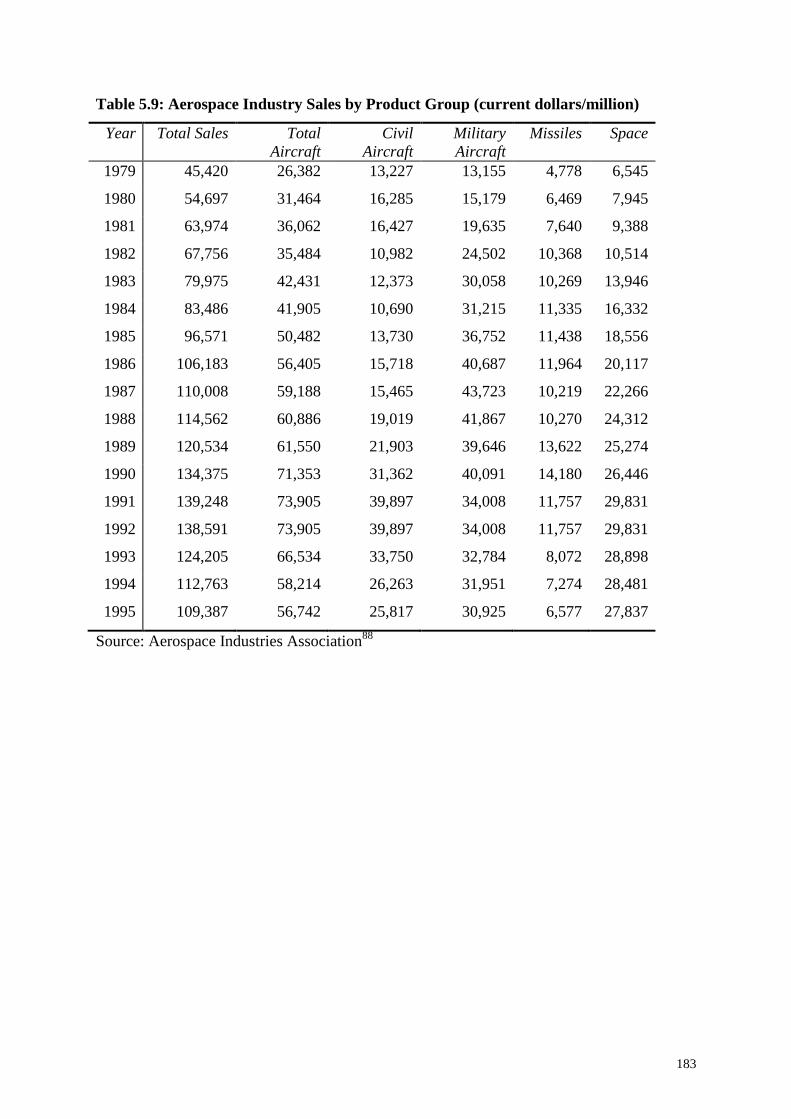
183
Table 5.9: Aerospace Industry Sales by Product Group (current dollars/million)
Year Total Sales Total
Aircraft
Civil
Aircraft
Military
Aircraft
Missiles Space
1979 45,420 26,382 13,227 13,155 4,778 6,545
1980 54,697 31,464 16,285 15,179 6,469 7,945
1981 63,974 36,062 16,427 19,635 7,640 9,388
1982 67,756 35,484 10,982 24,502 10,368 10,514
1983 79,975 42,431 12,373 30,058 10,269 13,946
1984 83,486 41,905 10,690 31,215 11,335 16,332
1985 96,571 50,482 13,730 36,752 11,438 18,556
1986 106,183 56,405 15,718 40,687 11,964 20,117
1987 110,008 59,188 15,465 43,723 10,219 22,266
1988 114,562 60,886 19,019 41,867 10,270 24,312
1989 120,534 61,550 21,903 39,646 13,622 25,274
1990 134,375 71,353 31,362 40,091 14,180 26,446
1991 139,248 73,905 39,897 34,008 11,757 29,831
1992 138,591 73,905 39,897 34,008 11,757 29,831
1993 124,205 66,534 33,750 32,784 8,072 28,898
1994 112,763 58,214 26,263 31,951 7,274 28,481
1995 109,387 56,742 25,817 30,925 6,577 27,837
Source: Aerospace Industries Association88

184
Table 5.10:Aerospace Industry Sales by Product Group (constant dollars/million)
Year Total Sales Total
Aircraft
Civil
Aircraft
Military
Aircraft
Missiles Space
1979 71,528 41,546 20,830 20,717 7,524 10,307
1980 77,475 44,567 23,067 21,500 9,163 11,254
1981 80,470 45,361 20,663 24,698 9,610 11,809
1982 77,083 40,369 12,494 27,875 11,795 11,961
1983 86,741 46,021 13,420 32,601 11,138 15,126
1984 83,653 41,989 10,711 31,278 11,358 16,365
1985 97,843 51,147 13,911 37,236 11,589 18,800
1986 106,396 56,518 15,749 40,769 11,988 20,157
1987 110,008 59,188 15,465 43,723 10,219 22,266
1988 112,426 59,751 18,664 41,086 10,079 23,859
1989 113,604 58,011 20,644 37,367 12,839 23,821
1990 121,606 64,573 28,382 36,281 12,833 23,821
1991 121,508 66,246 32,673 33,573 9,572 25,438
1992 118,050 62,951 33,984 28,968 10,014 25,410
1993 102,819 55,078 27,939 27,139 6,682 23,922
1994 92,353 47,677 21,509 26,168 5,957 23,326
1995 86,884 45,069 20,506 24,563 5,224 22,110
Source: Aerospace Industries Association89
.
Notes: Constant dollar data based on AIA’s composite price deflator (1987=100), 1994 data
preliminary, 1995 data estimated

185
Table 5.11: Military Aircraft Accepted By US Military Agencies (number)
Year Total Bomber/
Control/
Command/
control
Fighter/
attack
Transport/
Tanker
Trainer Helicopter
1979 734 17 529 16 - 158
1980 819 16 551 15 18 189
1981 918 19 649 17 60 158
1982 758 26 478 14 60 172
1983 836 34 421 22 120 233
1984 632 34 298 18 30 240
1985 777 34 409 25 - 306
1986 818 52 424 76 - 266
1987 858 74 483 36 - 265
1988 842 55 509 31 - 247
1989 706 24 408 21 - 253
1990 763 24 454 25 - 260
1991 650 17 395 23 - 215
1992 544 10 312 30 37 155
1993 528 11 293 25 56 143
Source: Aerospace Industries Association90

186
Table 5.12: Military Aircraft Accepted By US Military Agencies
(flyaway value, $million)
Year Total Bomber/
patrol/
command/
control
Fighter/
attack
Transport/
tanker
Trainer Helicopter
1979 5,470 442 4,660 136 - 219
1980 6,514 475 5,282 178 32 516
1981 8,446 526 6,518 509 32 825
1982 8,605 886 6,383 410 42 872
1983 9,640 1,259 6,708 575 79 1,009
1984 9,308 1,270 5,774 627 18 1,597
1985 14,122 3,640 7,923 838 - 1,715
1986 20,903 8,177 8,004 2,665 - 2,057
1987 21,459 8,569 8,900 2,218 - 1,772
1988 16,031 2,911 8,953 2,314 - 1,853
1989 11,968 1,423 7,735 743 - 2,067
1990 13,036 1,499 8,731 605 - 2,201
1991 11,754 1,023 8,517 437 - 1,777
1992 11,482 613 7,673 1,346 267 1,583
1993 11,277 1,530 6,360 1,332 565 1,490
Source: Aerospace Industries Association91
Fighter/attack procurement increased apace throughout the Cold War but fell in 1989,
increased slightly in 1990, the year of the Gulf War and has since fallen sharply from 454 in
to 293 in 19, a drop of over 35%. Over the five year period 1988-93, the total flyaway value
of fighter/attack aircraft accepted by military agencies fell from 8,953 million dollars to 6,360
million. Helicopter procurement shows a similar pattern: aside from a increase of 7 to 260 in
1990, helicopter procurement fell in 1991, 1992 and 1993 after steady growth since the start
of the AIA figures in 1979. Missile sales, according to the industry estimates, were most
severely affected. In 1994, missile sales dropped to the lowest level since 1980 and are
projected to fall a further 10% in 1995.92
Overall, in real (constant dollar) terms, the value of
aircraft sales to the military has fallen by 40% from an all times high in 1987.

187
Serious though these procurement cuts were, it was the cuts in the authorisation budget that
most profoundly affected the industry. The then current procurement aircraft had a relatively
low degree of carbon fibre usage. The proposed replacements, however, were very intensive
users of composite materials, with a substantially higher fraction of their structural weight
composed of carbon fibre. For example, as we see from Figure 2.2, carbon fibre constituted
only a few percent of the total structural weight of the F-15 and F-16. In contrast, the figure
for their replacement, the next generation F-22 (the Advanced Tactical Fighter, or ATF), is
close to 40%.
In 1987, essentially the year in which the industry's investment strategies following the DoD
mandate were decided upon by the US carbon fibre producers, the industrial association,
SACMA identified five very high intensity use projects. These were:
the V-22 Osprey (Bell/Boeing), a tilt rotor, medium lift aircraft, the first to be developed
from the outset for use by all four US armed forces.
the B-2 stealth bomber (Northrop), a high subsonic 'flying wing' with a carbon fibre radar
absorbent skin.
the ATF (Advanced Tactical Fighter), the replacement for the F-15. Two teams were
competing for the ATF contract at the time, McDonnell Douglas/Northrop and
Lockheed/Boeing/General Dynamics.
the A-12, (General Dynamics/McDonnell Douglas) a high subsonic, high payload attack
platform commissioned by the US Navy.
the LHX (two competing teams were awarded initial $158 million developmental
contracts - Boeing/Sikorsky and Bell/McDonnell). The LHX was to be a virtually all
composite helicopter originally envisaged to fulfil the Army's light helicopter requirement.
In terms of total estimated cost, the V-22, ATF, A-12 and LHX all ranked amongst the top six
conventional weapon systems under development at the time, and at an estimated total cost of
$69 billion the B-2 bomber was the single most expensive DoD weapon project, strategic or
conventional.93
In the late 1980’s, the projected carbon fibre usage for these five systems,
described by industry journals as "the major programmes that suppliers [are] counting on",94
had been:
Table 5.13: Carbon Fibre Usage Forecasts, 1987, by DoD project

188
(pounds weight, million)
1991 1992 1993 1994 1995 CUM
V-22 0.79 1.26 1.26 1.26 1.26 5.83
B-2 1.25 1.57 1.57 0.26 0.0 4.65
ATF 0.01 0.07 0.14 0.21 0.43 0.86
A-12 0.01 0.01 0.70 0.14 0.21 0.44
LHX 0.01 0.01 0.0 0.50 0.10 0.17
Total 2.07 2.92 3.04 1.92 2.00 11.95
Source: SACMA95
The forecast shows that collectively the total carbon fibre demand from these five projects
alone was expected to be close to 6000 tons, or about three times the total US consumption
both civil and military at the time, and over twice the then total US production capacity.
It is pertinent here to query here why the forecasts for future projects were so optimistic
despite the declining defence budgets of the time. As we have seen, the defence budget had
begun to decline in fiscal year 1986, two years before the fall of the Berlin Wall, in light of
the $2 trillion national debt. Up until 1989, the budget deficit had been the primary driver for
the defence cuts, and the military tensions of the Cold War security environment remained.
Throughout the period 1986 to 1989, the DoD, in its internal Future Years Defence
Programme (FYDP) continued to project increases in future defence spending. In every year
during this period, the FYDP assumed that the defence budget would start growing again the
following year and continue growing for the five years subsequent. "This optimistic outlook"
the Bulletin of Atomic Scientists comments, "allowed the Defense Department to continue to
research and develop more weapons than it could ever afford."96
Post-1990, however, with the collapse of the Berlin Wall and the start of the dissolution of
the Soviet Union, it was clear to even the most ardent hawk that the defence budgets of the
1990s would not only be lower but also qualitatively different from their predecessors. In the
last Cold War budget, (FY1990), 60% of spending, or roughly $200 billion, had been targeted
at the perceived Soviet-Warsaw Pact threat, a threat that, by 1991, had largely evaporated.
Within the year, the Office of Technology Assessment had recommended a cut in defence
spending of 50 percent as "a justifiable response to the end of the Cold War".97

189
Hence, the then Secretary of Defense, Dick Cheney, announced his intention of making a
series of far deeper cuts in defence spending in light of the changing security environment.
For the first time, defence authorisations for future projects were severely affected. The V-
22 tilt rotor helicopterx, the B-2 bomber
xi, the Advanced Tactical Fighter
xii and the LHX were
all markedly cut back. The A-12 became the largest programme ever cancelled outright by
the Pentagon.
By 1991, the 1987 DoD demand forecast we detailed above (Table 5.13) had radically
changed:
Table 5.14: Carbon Fibre Usage Forecasts, 1991 (1993)(pounds, million)
1991 1992 1993 1994 1995 CUM
V-22 0.00
(0.00)
0.00
(0.03)
0.00
(0.00)
0.00
(0.00)
0.00
(0.00) 0.00
(0.03)
B-2 0.11
(0.11)
0.22
(0.00)
0.38
(0.00)
0.38
(0.00)
0.59
(0.00) 1.68
(0.11)
ATF 0.00
(0.00)
0.02
(0.02)
0.04
(0.04)
0.04
().04)
0.04
(0.04) 0.14
(0.14)
A-12 0.00
(0.00)
0.00
(0.00)
0.00
(0.00)
0.00
(0.00)
0.00
(0.00) 0.00
(0.00)
LHX 0.00
(0.00)
0.01
(0.01)
0.01
(0.01)
0.00
(0.00)
0.00
(0.00) 0.02
(0.02)
Total 0.11 0.25 0.43 0.42 0.63 1.84
Sources, SACMA, Composite Market Reports98
Although the detail in the project cuts changes each year, the key point remains the same: by
the time the new capacity came on line, the original market had apparently
disappeared. DoD cuts occurred over the same two year period in which as all the major
carbon fibre producers had increased production and world capacity as a whole increased
almost 40%. If the 1987 US carbon fibre forecast for the early 1990’s is compared with the
x Low rate production scheduled to begin FY 1997. Decision on full rate production will be made in FY 2001.
Current plans are for the procurement of 523 aircraft through FY 2021, with initial operational capability
anticipated in FY 2001.(Source: Annual Report to the President and the Congress, William J. Perry, March
1996) xi
Current B-2 procurement plans: 1995, 7 aircraft; 1997, 13 aircraft; 1999, 17 aircraft; 2001, 20 aircraft.(Source:
Perry, ibid.)) xii
Production deliveries planned to begin in FY 2000, initial operational capability slated for FY2005. (Source,
Perry, ibid.)

190
actual consumption, the degree of error in the military demand outlook estimates is revealed
(Table 5.15):
Table 5.15: US DoD Carbon Fibre Consumption, (Pounds, million)
1991 1992 1993 1994 1995 Total
1987 Forecast 4.84 6.09 7.09 6.97 6.67 31.66
Actual Demand 0.95 1.10 1.30 1.64 1.86 6.85
Source, SACMA99
The table sums up the large overestimate in the 1987 DoD forecasts. The actual DoD carbon
fibre consumption is down 78% on the 1987 industry forecast. For such a capital intensive
industry, this is a very severe change in a major market segment. By 1992, military orders
had fallen to 15% of total consumption and 50% of US carbon fibre capacity was idle.
The industry was in crisis. The Clinton Administration, however, was keen to preserve those
industries considered vital to the defence interest. As a result, and, as part of its commitment
to the diversification of dual use technologies following the defence base collapse,
Technology Reinvestment Project (TRP) was established. TRP in effect secured the carbon
fibre capabilities of Amoco and Hercules, the two largest indigenous American producers,
and both key suppliers to the Department of Defense. We therefore offer here a brief
description of the TRP, particularly with respect to its impact on the survival of the US
carbon fibre sector.

191
The Technology Reinvestment Project
“The DoD has a clear role to play in the economic defense of the country”
Les Aspin, December 1993
Throughout the Cold War period, the need to maintain a military technology base was the
central justification for US public R&D investment. Post 1989, sharp cuts were made in
military procurement and research and development with a consequent downsizing in federal
military technology spending. This raised fears concerning not only the future of the military
technology base itself, but also, since defence R&D had previously been a mainstay of US
federal research, the potential erosion of the national technology base as a whole. In an
attempt to address these issues, and the additional problems of a shrinking defence industry,
in March 1993, the Clinton administration launched the Defense Reinvestment Conversion
Initiative.
The centrepiece of the new legislation was the Technology Reinvestment Project (TRP),
formed to execute the eight statutory programmes enacted by Congress in the Defense
Technology Conversion, Reinvestment and Transition Act of 1992. In its early days, TRP
was promoted as a sort of rescue package for the struggling defence industry, an enabling
device whereby defence companies and their workforce could diversify into new, commercial
markets:
“I've given it another name - Operation Restore Jobs” said President Clinton,100
although it was also made clear that,
“[TRP] is not a foaming of the runway for a crash landing of the Defense
Department.”101
With the advent of a Republican congress, however, the focus of the TRP was changed.
Funds were cut, programmes related to retraining and regional development were axed and
applicants urged to demonstrate their proposals “present a compelling Defense benefit.”102
TRP is a six agency technology investment effort, headed up by ARPA but including the
Army, Navy and Airforce as well as the Departments of Commerce, Energy and
Transportation, the National Science Foundation and the National Aeronautics and Space
Administration. Through the selective funding of dual-use technologies, TRP is designed to
leverage commercial technological progress for the benefit of the US military. TRP

192
proponents argue that the encouragement of dual use innovation would maintain a strong
defence base despite the constrained fiscal resources by several avenues.
Firstly, it recognises that “more and more of the best technology is being developed in the
commercial, not the defence, sector ... overall, R&D expenditures by business in the United
States are now more than double those by the DoD and continue to increase”. TRP aimed to
ensure that part of this research would be conducted with “a direct regard for military
need.”103
Secondly, it is argued, by developing cheaper, market driven but defence related
technologies, military and commercial components could be produced within the same
production facilities. The production of military parts from commercially derived military
upgrades could avoid the high unit costs of strictly military production and so substantially
increase the affordability of acquiring a weapon system. Finally, a strong civil technology
base would be more capable of responding to a surge in demand for military products should
the need arise.
All the TRP projects are based on cost sharing, with non-federal sources matching federal
funds on at least a dollar to dollar basis. Almost all are organised around teams in which
industrial firms form the bedrock but which may include Universities or, occasionally, other
organisations such as hospitals. As TRP is not a direct procurement programme (it is funded
through co-operative agreement or ARPA's 'other transactions' budget), TRP contracts are not
governed by Federal Acquisition Regulations (the restrictive government - only rules and
requirements concerning secrecy and intellectual property rights usually attendant on DoD
contracts). "These instruments" claims the TRP literature "give TRP more flexibility in
dealing with intellectual property rights, and this helps attract firms that might not otherwise
deal with government." Indeed, roughly 75% of the technology development projects
selected in the first round included both a commercial and a defence firm.104
The TRP itself was originally split into four programme elements. These were:
technology development projects, i.e. programmes of applied and early developmental
research designed to develop new products or manufacturing techniques that possess both
defence and commercial applications;

193
small business innovation and research, a specific programme to develop dual use
technologies within smaller companies;
technology deployment, an area which sought to improve the diffusion of technology
through organisational changes in defence serving sectors;
manufacturing education and training, the smallest programme area and one that sought to
"redress the classic US weaknesses in critical technical skills like product design and
manufacturing" by the establishment of vocational engineering courses in schools,
colleges and universities.105
The first TRP winning proposals were announced in the autumn of 1993. In total, $605
million was awarded to 212 projects involving 1,600 firms, universities and other
participating institutions. A further $15 million was later awarded in the small business
innovation research project competition area. The second round of awards, bringing the total
TRP spending to $820 million, was announced by President Clinton in autumn 1994.
"Today, commercial firms are the source of many of the advanced technologies
that are needed to keep our military the most powerful in the world," the
President said. "The winning projects I am announcing today link commercial
and defense needs, to keep America strong, militarily and economically."106
TRP literature describes composite materials as an "especially critical area"107
and argues
that,
"Defense's reduced demand for advanced materials and structural systems,
without some compensating growth in civilian demand, threatens the existence of
the U.S. advanced materials industries as they apply to the military. Through
several activities, the TRP is addressing this shortfall to ensure that advanced
materials are available for essential Defense uses, such as high-performance
aircraft and bridging equipment. If advanced materials for the military can be put
to civilian use, then the military will always be able to access these materials
through commercial producers ... the commercial market for such materials must
grow so that the much smaller Defense market can access a reliable source of
advanced materials as needed."108
194
Essentially the TRP sought to find ways of reducing manufacturing costs of advanced
materials and stimulate high volume commercial markets, in order to ensure a continued DoD
access to an advanced material production base. The Annual Report continues,
"The high cost of composite materials restricts their use, especially in the
commercial sector. And the production that does exist today, primarily in the
military sector, has been threatened by Defense downsizing, which has reduced
industry's capacity for competitive production."109
Two of the largest awards went to carbon fibre composite related projects, Advanced
Composites for Bridge Infrastructure Renewal (announced 22nd October 1993) and
Affordable Composites for Propulsion (announced the following spring on 23rd February
1994). Both these projects fell into the Technology Development competition area. We will
now look at each of these two projects in more detail.
Advanced Composites for Bridge Infrastructure Renewal, a continuation of an earlier
DARPA project, was awarded $21 million under the first round of TRP awards. At eighteen
months long, the project aimed to find a lighter weight but low cost alternative to the portable
bridges used by the US Army Corp of Engineers in combat situations or in the wake of
natural disasters. The consortium, including Amoco and Hercules, were awarded $21 million
in an 18 month programme to develop polymer composite materials for use in bridge
construction. "This technology" claimed the proposal, emphasising the dual use nature, "can
generate mobile, lightweight bridges for use by the US Army Corp of Engineers in combat
situations or after natural disasters"110
. The project members were:
University of California, San Diego, La Jolla, CA.
Amoco Performance Products, Inc., Alpharetta, GA.
Hercules, Inc., Magna, UT.
Muller International, Inc., San Diego, CA.
Trans-Science Corporation, La Jolla, CA.
University of Delaware, Newark, DE.

195
The project largely succeeded in demonstrating the use of composites in construction
applications. Ferrous bridges corrode, a particular problem in marine industrial environments
where there may be high levels of salt or carbon, nitrogen or sulphur dioxide. In autumn of
1995, Toray told the author of the new markets emerging through government research
programmes including TRP, and the smaller EU Euroconcrete programme and the DTI
Robust initiative in bridge infrastructure renewal. These applications (composite reinforced
columns, high strength fibre cables and composite wear surfaces) in bridge construction have
an "enormous potential ... there are 10,000 bridges in the UK requiring upgrading [to the new
European 44 tons weight standard]."111
)
Under Round 4 of the following year, a second large award was made to a composite related
proposal. Affordable Composites for Propulsion is a five year project aimed at developing
reliable, low cost manufacturing techniques to replacing metal engine parts with polymer
composites in advanced aircraft propulsion systems. The total project cost is estimated to be
$370 million, of which the US government will contribute $130 million.112
Hercules was
also a member of this consortium. Again the dual nature of the project was made clear. "This
project" reads the proposal "will enhance US competitiveness in aircraft production as well as
preserve a critical capability for DoD weapon systems". The consortium members are:
Pratt and Whitney, West Palm Beach, FL.
Boeing Commercial Airplane Group, Renton WA.
Dow—United Technologies Composite Products Inc., Wallinford, CT.
Du Pont, Wilmington, DE.
Hercules, Inc., Magna, UT.
Martin Marietta Technologies Inc. Baltimore MD.
Vought Aircraft, Dallas TX.
Collectively, the consortium represents half the aerospace composite component
manufacturing capacity in the United States.113
The project goal is the development of
automated techniques for the manufacture of composite parts on a large scale i.e., it is
directed at the low cost, high volume manufacture of high performance carbon fibre
composites. Automation, it is argued, will reduce costs and access markets in commercial
aerospace engines. The programme also has an immediate defence use as it is also directly
applicable to the new generation of engines, which increase the range of military aircraft by
196
up to 20%, extend the on-station time of Airborne Warning and Control Systems (AWACS)
by 2 hours and reduce the level of noise. These sorts of engines are a key feature of the
future Advanced Tactical Transport Aircraft and could also be used in the F-22.114
On April the 5th, 1995, the by then Republican Congress cut the 1995 TRP funding by $300
million in order "to help pay for recent military operations in the Persian Gulf, Somalia,
Rwanda and Haiti".115
Only those projects considered to possess an immediate or
considerable defence benefit were retained. The Manufacturing Education and Training
Competition was cancelled outright. Major reductions were made in the Technology
Deployment and Small Business Innovation Research. A number of Technology Focus areas
were eliminated from the Technology Development competitions, including those for
ceramic materials, cryogenic coolers and speciality metals. Composite programmes,
however, were left unscathed.
One of the largest project areas proposed by ARPA for TRP 1996 is the Affordable
Composite Primary Aircraft Structure, for which, according to Jon Devault of ARPA's
Defense Science Office "all the major airframe companies have formed teams and are busy
preparing proposals".116
Proposed funding totalled $160 million over the lifetime of the
project, with $30 million available for the first year. However, in the event, no submissions
were actually made by the deadline.117
Firms were reportedly nervous about the future
funding of the programme and the increasingly defence orientated nature of the project.
Funding for the 1996 TRP, for which President Clinton had requested $415 million, had at
one point been actually eliminated from the House Version of the Defense Authorisation bill
by the House National Security Committee.118
As the Composite Market Reports
commented,
"Originally in keeping with the ground rules set up for ARPA's Technology
Reinvestment Project this [the affordable composites primary aircraft structure
project] was to be a dual use (commercial and military) aircraft composite wing
program, but with strong and continued pressure from Congress, it subsequently
became clear that the primary emphasis would be on developing the technology
for future military rather than commercial-military use. This was probably the
main reason the Bell-Boeing team [previously considered the main contender]
decided to no-bid ... with Congress threatening to sharply cut or eliminate

197
ARPA's TRP funding, there is too much risk in starting a major program during a
period when all budget items are being so carefully scrutinised."119
Whatever the outcome, the carbon fibre industry will not be directly affected by TRP 1996.
By the summer of 1995, for the first time in five years, all the major carbon fibre producers
still in the business were working flat out.120
Order books had been filling up as the
incremental US legislation mandating that compressed natural gas tanks be made from carbon
fibre composites took shape. Hercules announced in the spring that it was "fully booked
through to September" and trying to find ways of increasing output from current facilities
without incurring the cost of building a whole new line.121
Amoco and Grafil were also
reportedly running close to capacity and Akzo was having a "great year".122
What the TRP
initiative succeeded in creating for the industry was a breathing space that enabled Hercules
and Amoco to ride out the difficult trading conditions of the early 1990’s, conditions that had
already driven out four non-TRP firms. The TRP had sought to "stabilise the U.S.
composites industry and ensure the DoD can access an affordable supplier base."123
By
acting as a temporary expedient or stopgap, the Project achieved these stated objectives.
The Role of Corporate Strategy
We have seen earlier in this chapter that the Japanese producers were insulated in part from
the full impact of the defence cut backs as they had focused in non-military markets. We
now examine the second strand of argument raised by those questioned i.e., the relative
stability of the Japanese carbon fibre producers.
At the start of the 1990’s, while the firms of the US and Europe were trimming capacity or
seeking to withdraw from the industry, the Japanese producers rapidly increased capacity
against the background of falling demand. At face value this is an astonishing move. The
industry is very capital intensive with high sunk costs. Furthermore, a carbon fibre line, once
built, cannot be easily converted for other uses. This type of strategic investment in over-
capacity was what is known in game theory literature as pre-commitment, or a credible
threat.124
The market had contracted to such an extent that a certain number of participants
would be forced to leave. By making a sizeable sunk investment the Japanese companies
were signalling that it would not be them.125
A precommitment strategy at this time was a
risky but a high reward option which, if successful would result in a very large market share,

198
control of price and trade and a strong manufacturing base overseas.126
This is an essentially
long term strategy, however, requiring the backing of patient capital as initial losses are high,
and may be sustained over several years. In Chapter Three we saw that for large firms,
especially those in keiretsu groups, the accounting practices in Japan, in conjunction with the
lower interest rates generally, allow for this type of investment. We now look at the evidence
for this type of financial governance in the case of the carbon fibre sector.
In Appendix III, we examine the keiretsu status of each of the Japanese carbon fibre
producers. A core keiretsu company is traditionally defined as one that has a seat on the
presidential council. All our companies fall within this definition. However if we look
closer, we find we can differentiate on the degree of their membership. Toray, Mitsubishi
Rayon and Toho Rayon possess all the key characteristics, namely interlocking
shareholdings, close creditor relations, interlocking directorships as well as seats on their
respective councils. In addition, Mitsubishi Rayon sells almost all its carbon fibre to related
Mitsubishi firms. It is interesting to note that this is the firm least affected by the recession in
the industry, and as a result has increased its market share in Japan by several percent at the
expense of the other players.127
Mitsubishi Rayon bought up plant in the US at a time when the yen was strong against the
dollar. However, it was primarily a strategic investment, made at a time when Japanese
investment overseas was falling as a whole, and resulting in Mitsubishi Rayon gaining full
integration in the carbon fibre composite industry in the US. Toray and Toho Rayon have
pursued similar strategies in Europe, both establishing a business base through joint ventures
with large European chemical companies and moving quickly in the shake out of the early
1990's to acquire majority stakes. Toray was hit hardest by the recession in the industry as the
(previously military) US suppliers sought to enter new markets in the civil sector, competing
directly with Toray's US civil aerospace interests. Toray responded aggressively by
continued investment in the sector, even in the face of heavy losses, establishing value added
downstream production facilities in the US. This strategy appears to be proving successful in
that competing firms left the industry, and new growth is now apparent in the civil sector.
Asahi Kasei was the one Japanese producer to cease carbon fibre production. Keiretsu
membership aside, the firm was perhaps slightly more predisposed than other Japanese
producers to close its carbon fibre business. Despite increasing its capacity to 600 tons the

199
previous year, the firm still lacked the economies of scale possessed by Toray and Toho
Rayon. Moreover, Asahi Kasei was the only Japanese producer to organise its carbon fibre
activities as a separate business. Toray, Toho Rayon and Mitsubishi Rayon all produce
carbon fibre from divisions within the firm. Asahi Kasei, however, produced from a wholly
owned subsidiary. This made it much harder for the firm to write off its carbon fibre losses
against more profitable operations. It also made it much easier to close down its carbon fibre
business with minimum financial repercussions for the main group.
However, the central distinction between Asahi Kasei and the other Japanese producer is its
minimal keiretsu standing. Of all the carbon fibre producers, Asahi Kasei is the least tied
either financially or informally to a keiretsu group. As we have seen, Asahi Kasei officially
sits on the presidential council of DaiIchi Kangyo. However, it has close financial ties with
Sumitomo, a different keiretsu group. DIK is the 'loosest' of the big keiretsu, with an average
cross shareholding of only 12%. The presidential council meets infrequently, just four times
a year, and the companies are relatively independent. The company stated in interview that it
was not a keiretsu member, unlike the other firms, and described this as a distinct
'disadvantage' in a high risk, high technology sector.128
In short, when compared to rival
producers in Japan, the Asahi Kasei’s relatively independent status left the firm exposed to a
far greater degree to the sharp downturn and consequent recession of the industry.
With the exception of Asahi Kasei, all the Japanese carbon fibre producer firms are classic
core keiretsu firms. Keiretsu membership is a sensitive, not to say confidential, topic
amongst the companies, as they are perceived as cartels in the West. Direct questions
relating to specific keiretsu mechanisms by the author resulted in either pleas of
confidentiality, or a conflicting response ("Toray are quite independent of Mitsui influence"
[Toray London office129
.], "Toray has a good relationship with Mitsui Corporation" [Toray
Tokyo Head Office130
] ).
We have shown, suggestively, that keiretsu membership and the ability of the Japanese
carbon fibre producers to maintain their operations in times of difficult trading appear to be
linked. To go further would require detailed information on financial transfers and orders
within each keiretsu. As this is not available, we will try an indirect approach to add weight
to the argument. This is based on a analysis of accounting practices of all the carbon fibre
producers for indications of variance in corporate governance. In particular, we will develop

200
the argument on the basis of a direct comparison of key financial ratios for all the major
carbon fibre producers. These are given in Tables 5.16 and 5.17. Any use of financial data
requires first the consideration of a number of caveats and some explanation is also needed of
the ratios themselves. We therefore turn to these preliminaries before considering the ratios
directly.
Firstly, in comparing ratios between firms, especially those of different countries of origin,
we must ensure as far as possible that the ratios have been prepared on a consistent basis.
Secondly, the data totals appearing in financial statements usually summarise a whole series
of transactions, the nature and mixture of which may vary from one year to the next. Thirdly,
a particular extraordinary item or other exceptional circumstances may distort the figures for
a particular accounting period.
In order to mitigate these effects as far as possible and ensure some consistency in
preparation and uniformity in accounting principles (such as in the definition of profit), we
have taken all our ratios from the same source, Datastream. Those definitions that vary from
country to country due to different accounting or tax regimes have been avoided. Secondly,
we have taken data from five consecutive years. This ensures that we have a spread of data
to average out any particular rogue year and will hopefully circumvent financial 'window
dressing' by the firms (wherein capital and profit positions are manipulated through the
acceleration or delay of transactions close to the end of the financial year). Thirdly, where
appropriate we present more than one measure in order that we may as far as possible
counteract any odd variation in any particular financial item. Finally, all the ratios presented
here are dimensionless and so independent of currency and exchange rate.
We will first consider data ratios relating to the capital structure of the firm, that is, the
borrowing, capital gearing and loan capital ratios. The borrowing ratio (also known as the
debt equity ratio) used here is defined as:
subordinated debt + total loan capital + short term borrowings
equity capital and reserves + deferred tax - total intangibles
and is a measure of the reliance of a firm on bank borrowings as opposed to raising funds
through equity. A similar measure is capital gearing, defined as:

201
preference capital + subordinated debt + total loan capital + short term borrowings
total capital employed + short term borrowings - total intangibles - future tax benefits
Capital gearing measures the fraction of the total capital employed by the firm that is raised
by bank borrowings and preference shares (which normally entitle the holder to a fixed rate
of dividend). For completeness, we will also examine the ratio of loan capital to equity and
reserves, calculated here as :
subordinated debt + total loan capital
equity capital and reserves + deferred tax - total intangibles
The loan capital to equity and reserves ratio, measures gearing while omitting short term
borrowing which in reality may be renewed each year. All three of these ratios are measures
of gearing, that is, the degree to which a company raises finance through borrowing rather
than equity.

202
Table 5.16: Measures of Gearing
Borrowing Ratio
1990 1991 1992 1993 1994 MEAN ST DEV
BASF 0.26 0.29 0.39 0.39 0.25 0.32 0.062
Hercules 0.42 0.32 0.29 0.32 0.35 0.34 0.044
Amoco 0.32 0.32 0.34 0.31 0.27 0.312 0.023
BP 0.71 0.84 1.12 0.91 0.65 0.846 0.165
Courtaulds 0.78 0.67 0.64 0.47 0.55 0.622 0.106
Toray 0.73 0.87 0.98 1 0.97 0.91 0.101
Toho Rayon 1.4 1.69 1.86 1.7 2.06 1.742 0.217
Asahi Kasei 1.1 1.08 1.01 1.07 1.05 1.062 0.0306
Mitsubishi
Rayon
1.53 1.63 1.6 1.5 1.49 1.55 0.0555
Capital Gearing
1990 1991 1992 1993 1994 MEAN ST DEV
BASF 13.15 14.97 18.45 19.11 13.66 15.87 2.46
Hercules 28.46 23.18 21.06 19.69 20.98 22.67 3.10
Amoco 22.81 22.76 22.66 21.06 18.89 21.64 1.520
BP 33.24 36.47 41.51 36.56 30.08 35.57 3.82
Courtaulds 41.28 38.1 37.13 29.31 32.19 35.6 4.29
Toray 39 43.08 45.46 45.87 45.13 43.7 2.54
Toho Rayon 55.42 60.21 63.21 60.88 64.88 60.9 3.21
Asahi Kasei 47.1 46.92 46.75 48.4 47.83 47.4 0.621
Mitsubishi
Rayon
56.45 58.1 57.72 56.06 55.78 56.8 0.921
Loan Capital/Equity and Reserves
1990 1991 1992 1993 1994 MEAN ST DEV
BASF 0.17 0.16 0.21 0.16 0.15 0.17 0.020
Hercules 0.29 0.23 0.23 0.21 0.22 0.236 0.028
Amoco 0.28 0.25 0.32 0.24 0.25 0.268 0.029
BP 0.54 0.67 0.85 0.78 0.55 0.678 0.123
Courtaulds 0.6 0.53 0.48 0.29 0.26 0.432 0.134
Toray 0.36 0.35 0.45 0.41 0.5 0.414 0.056
Toho Rayon 0.56 0.9 0.45 0.48 0.2 0.518 0.228
Asahi Kasei 0.7 0.6 0.66 0.62 0.68 0.652 0.0371
Mitsubishi
Rayon
1.03 1.06 1.08 0.79 0.85 0.962 0.119
N/A = data not available Ratio Source : Datastream

203
Table 5.17 Selected Financial Ratios
Working Capital Ratio
1990 1991 1992 1993 1994 MEAN ST DEV
Hercules 1.76 1.85 1.63 1.39 1.5 1.63 0.17
Amoco 1.21 0.97 1.16 1.14 1.32 1.16 0.11
BASF 1.88 1.71 1.64 1.39 1.61 1.64 0.19
BP 0.99 0.97 0.87 0.89 0.91 0.93 0.045
Courtaulds 1.16 1.15 1.2 1.14 1.07 1.14 0.042
Toray 1.33 1.28 1.28 1.18 1.29 1.27 0.049
Toho Rayon 1.22 1.45 1.06 1.08 1.84 1.33 0.29
Asahi Kasei 1.31 1.22 1.36 1.26 1.31 1.29 0.048
Mitsubishi
Rayon
1.47 1.41 1.42 1.24 1.37 1.38 0.078
Operating Profit Margin
1990 1991 1992 1993 1994 MEAN ST DEV
Hercules 7.36 9.01 9.98 12.97 15.25 10.91 2.83
Amoco 10.02 8.75 4.15 9.37 7.31 7.92 2.09
BASF 6.57 N/A N/A N/A N/A 6.57 N/A
BP 6.98 3.33 2.79 3.67 5.19 4.392 1.52
Courtaulds 9.8 10.63 10.04 8.84 7.83 9.428 0.986
Toray 8.55 8.83 7.82 6.92 4.64 7.352 1.51
Toho Rayon 2.7 3.21 0.24 -0.35 -0.71 1.02 1.62
Asahi Kasei 8.37 7.38 5.58 3.95 2.15 5.49 2.25
Mitsubishi
Rayon
6.1 5.47 5.12 3.61 2.08 4.48 1.45
Return on Shareholder
Equity
1990 1991 1992 1993 1994 MEAN ST DEV
BASF 10.25 N/A N/A N/A N/A 10.25 0
Hercules 6.68 8.27 9.75 11.55 18.69 10.99 4.17
Amoco 10.18 6.48 5.35 10.92 10.32 8.65 2.28
BP 17.24 4.25 4.73 9.16 14.75 10.03 5.23
Courtaulds 33.49 31 27.64 16.72 14.68 24.71 7.61
Toray 9.75 8.82 6.26 5.97 2.79 6.72 2.44
Toho Rayon 3.37 4.51 -1.06 -1.6 -25.04 -3.96 10.81
Asahi Kasei 12.24 11.22 7.29 4.29 2.09 7.43 3.90
Mitsubishi
Rayon
5.38 3.18 4.38 1.8 0.13 2.97 1.86

204
Table 5.17 (continued)
Tax Ratio
1990 1991 1992 1993 1994 MEAN ST DEV
Hercules 41.19 42.72 34.47 31.73 32.85 36.59 4.49
Amoco 43.9 42.36 15.25 27.4 28.18 31.49 10.62
BASF 59.56 49.95 50.53 28.01 44.57 46.52 10.43
BP 37.64 68.16 50.46 52.61 30.34 47.84 13.06
Courtaulds 21.31 22.99 21.33 27.88 23.49 23.4 2.404
Toray 47.66 45.34 50.68 46.72 58.94 49.89 4.863
Toho Rayon 46.36 36 -3.2 -70.72 -5.31 0.63 41.19
Asahi Kasei 50.14 47.99 47.51 49.6 43.95 47.84 2.17
Mitsubishi
Rayon
46.85 54.34 48.66 55.69 123.13 65.73 28.89
Return on Capital Employed
1991 1992 1993 1994 1995 MEAN STDEV
Hercules 9.58 10.78 12.37 12.75 18.47 12.80 3.06
Amoco 15.35 10.2 5.35 11.75 11.45 10.82 3.23
BASF 13.89 13.89 0
BP 16.49 8.6 7.26 9.66 12.4 10.88 3.27
Courtaulds 28.25 28.14 26.59 21.61 16.7 24.26 4.49
Toray 9.63 8.85 7.35 6.05 3.54 7.08 2.16
Toho Rayon 2.41 2.71 -0.89 -5.63 -4.07 -1.09 3.35
Asahi Kasei 11.39 10.43 6.94 4.31 1.88 7.00 3.59
Mitsubishi Rayon 4.37 3.72 1.99 0.63 1.55 2.45 1.39
N/A = data not available Ratio Source : Datastream
Analysis
Gearing (Table 5.16) is the single most important measure of the company's own perception
of risk and stability. A company raises finance partly from (comparatively long term) bank
loans and partly from shareholder equity. These two sources of finance possess different
characteristics in that the providers of bank loan require a fixed amount of interest to be paid
each year whereas the dividend repaid to equity holders is set by the residual profits won each
year. Debt is usually cheaper than equity but a high debt equity ratio increases the financial
risk of a company. If a company is otherwise financially stable, it will set its debt equity ratio
at a high level. Hence the debt equity measure is the basic financial measure used for the
long term stability of a firm. Table 5.16 illustrate that, averaged over the five year period, by
every measure, the gearing ratio is significantly lower for every non-Japanese carbon
fibre producer than that of any of the Japanese companies. In other words, the Japanese
carbon fibre manufacturers raise finance in a way that indicates a greater confidence in the
future stability of the firm.
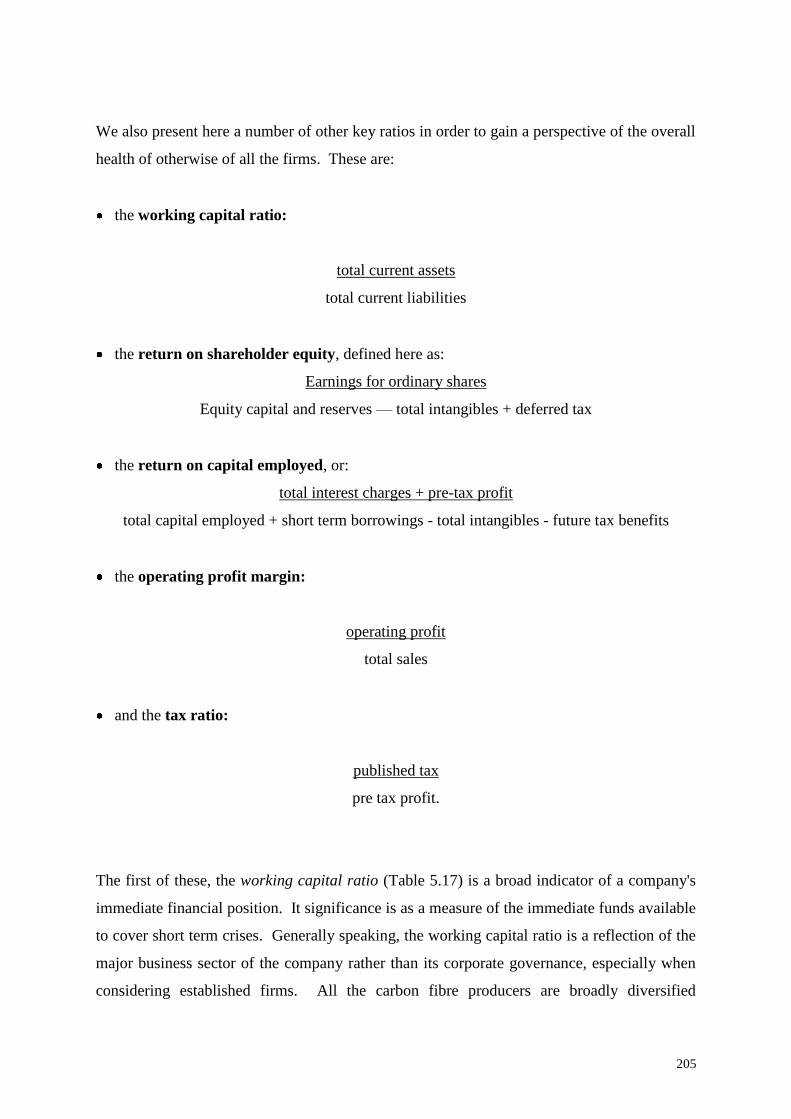
205
We also present here a number of other key ratios in order to gain a perspective of the overall
health of otherwise of all the firms. These are:
the working capital ratio:
total current assets
total current liabilities
the return on shareholder equity, defined here as:
Earnings for ordinary shares
Equity capital and reserves — total intangibles + deferred tax
the return on capital employed, or:
total interest charges + pre-tax profit
total capital employed + short term borrowings - total intangibles - future tax benefits
the operating profit margin:
operating profit
total sales
and the tax ratio:
published tax
pre tax profit.
The first of these, the working capital ratio (Table 5.17) is a broad indicator of a company's
immediate financial position. It significance is as a measure of the immediate funds available
to cover short term crises. Generally speaking, the working capital ratio is a reflection of the
major business sector of the company rather than its corporate governance, especially when
considering established firms. All the carbon fibre producers are broadly diversified

206
companies and, unsurprisingly, the working capital aggregate means for the Japanese and
non-Japanese firms are virtually identical, at value of 1.3.
The tax ratio (Table 5.17) is simply the total tax paid, including that paid overseas, as a
proportion of the pre-tax profit. We use it here to check there are no major differences in
levels of tax paid that may seriously affect other ratios. From the table we can deduce that
the aggregate mean for the Japanese and non-Japanese companies differ slightly at 37.1 and
32.8 respectively, but that both fall within the standard deviation of the overall group.
The rates of return and operating profit margin are all measures of firm profitability and
collectively they tell us that over the five year period, the Japanese firms were on the whole
less profitable, with Toho Rayon sustaining losses throughout 1993, 1994 and 1995. This is
consistent with Nakatani's assertion that keiretsu firms are not profit maximisers, but rather
sacrifice short term profit for long term stability. The return on capital employed (ROCE) is
probably the most important measure of profitability, being very sensitive to downturns in the
industry. Over the five year period 1991-1995, the Japanese firms have sustained a
significantly lower ROCE than their non-Japanese counterparts.
For all these firms, carbon fibre production represents only a tiny fraction of business,
typically only a few percent of turnover.xiii
Moreover, it is not a core business for any of the
companies. For these reasons, combined with commercial sensitivities, financial data for
carbon fibre operations is not published. However, according to industry sources, every
major producer made losses on its carbon fibre operations over the period 1990 to 1994.131
These losses are exacerbated by the high total capital employed by the sector. The fact that
for many major producers, carbon fibre is not a core product combined with the negative or
consistently low ROCE made carbon fibre a prime business for disposal throughout this
period. However, despite being less profitable over the period generally, Japanese
producers, with the exception of Asahi Kasei, chose to maintain or even expand their carbon
fibre operations. We shall seek to explain this by looking at in greater detail at a further
financial indicator, the price - earnings ratio.
xiii
For example, Toray’s carbon fibre sales are estimated to be around $180 million, out of total sales of $7.3
billion, or just over 2% (Source, Performance Materials, 17th May 1993)

207
The price earnings ratio (PER), Table 5.18, is calculated by dividing the market price of
ordinary shares by the earnings per share (the total amount of earnings available to ordinary
shareholder divided by the number of shares). By including the market price of the shares,
the PER contains a subjective element that reflects the expectations of the market concerning
the future earnings and viability of the company. All else being equal, a company with a high
ratio is one expected by investors to have good earning potential and/or good prospects for
capital appreciation. Table 5.18 presents the variation in price earnings ratio over time of all
the major carbon fibre producers. The data is shown figuratively in Figure 5.3, and in Figure
5.4 the data averages by geographical region are presented.
The first point to note is the relatively high level of PER for the Japanese firms, on average
almost four times that of the aggregate mean for their non-Japanese counterparts. This
indicates that despite the low level of dividend paid out by the firms, the price paid for their
shares is high, and has been consistently so over the five year period. In other words, the
shareholders of these firms are tolerant of low dividend and keep hold of the shares even in
times of low profit. In this way, so long as the capital value of the stock appreciates the share
prices is maintained regardless of the return on equity.

208

209

210

211
Secondly, if we examine the variance of PER over time for each firm we see the PER shows
significant less fluctuation in time for US and European corporations compared to those of
Japan. The variance of the PER is essentially a measure of the sensibility of stock prices to
short term profit, as reflected in the earnings per share. The low variance for the non-
Japanese producers indicates that in Europe and the US, short-term profit largely governs
stock price. The high variance for the Japanese firms suggests that for these firms, stock
prices are less sensitive to fluctuation in short term profit.
In short, we have seen from the gearing ratios and variance in PER that the non-Japanese
producers of carbon fibre have a significantly higher dependence on equity and a
compulsion to yield high dividends in order to maintain share price. For the Japanese
producer, the reverse holds true on both counts.
Summary and Conclusions
Overall, then, the period 1989 to 1995 has been one of transition and restructuring of the
carbon fibre industry, and one dominated by a surplus capacity world-wide. We have seen a
variety of industrial responses to the changing market conditions. US-based subsidiaries of
European firms were the most badly affected. Although carbon fibre produced in any US-
based plant technically counts as US production, the Pentagon had been reportedly
“unhappy” with the number of European takeovers in such a strategic industry132
and, when
times got tough and US government agencies acted to prevent key closures, no non-US firm
received government aid. Only the US-owned Hercules and Amoco were awarded the
critical DARPA and ARPA awards that enabled them to continue production, in a process the
trade press dubbed the ‘re-Americanisation’ of the industry.133
BASF, Courtaulds and the BP
subsidiary Hitco all ceased production despite the substantial investment each had undertaken
in response the 1987 DoD mandate.
In Europe itself, there was no direct government intervention to aid the industry and although
carbon fibre capacity increased from 1300 to 1500 tons over the period, Japanese inward
investment, along with the closure of Courtaulds UK plant, resulted in the percentage of
European capacity actually owned by European firms falling from 80% to 25%.134

212
Meanwhile, the Japanese firms themselves pursued longer term strategies design to increase
market share. Capacity was increased domestically, despite the losses incurred throughout
the period, and expansion took place in both Europe and the United States.
In this chapter, we have sought to explore how and why these disparate industry responses
occurred, through an examination of the forces that have driven and shaped the industry since
1990, most particularly the defence sector, the Technology Reinvestment Project and the
financial governance of the carbon fibre producing firms. We have seen that throughout the
1980’s, the US carbon fibre industry had had a high dependency on defence contracts, a
reliance that was expected to increase in the 1990’s. In conjunction with the DoD’s
encouraging 1987 mandate, the strong defence outlook prompted US and European producers
to increase capacity in the US to met a burgeoning demand. Over the two year period 1989-
1991, the three largest US-based producers, Hercules, BASF and Amoco all made substantial
capacity increases (of 25, 200 and 130% respectively). Total US capacity increased by
almost 50%. Over the same short period, changes in the defence environment radically
affected both demand and outlook. The defence cuts dealt the carbon fibre industry a double
blow with profound cuts both in immediate aircraft procurement and in future project
authorisation. Extensive cuts were made in the highest intensity users of carbon fibre, that is
aircraft, helicopters and missiles. More importantly, the future weapon systems for which the
new capacity had been put in place were cut back, deferred, or cancelled. In short, by the
time the investments of the late 1980’s came into operation, the military market for which
they were designed to fulfil had largely disappeared.
Keiretsu membership, as we have seen in earlier chapters, is characterised by reciprocal
shareholding and close lender borrower relationships. Although it has proved not possible to
uncover the exact keiretsu mechanisms, if any, employed in the carbon fibre sector, what we
can say is that the ratios represented above show that empirically the Japanese carbon fibre
producers possess greater long term stability and a certain immunity to market imperatives.
The firms of the US and Western Europe were far more vulnerable to the dictates of the
equity markets and left exposed when short term profits fell. For the carbon fibre industry,
and its recent period of sustained loss and uncertainty, these factors have proved decisive.
References

213
1 Toray, quoted in The Financial Times, 25th April, 1989. James J. Marion of the US Office of
Metals, Minerals and Commodities also forecast the industry to grow at 15 to 20% throughout the
1990’s. (US Industrial Outlook, August 1990) 2 Japan Chemical Week, 16th June 1994
3 Personal Communication, H. Dr. Neumann, Sigri Great Lakes Carbon, March 1993
4 SACMA, Personal communication, August 1995.
5 SACMA ibid.
6 See Fibres de Carbone: une croissance à un chiffre jusqu’en 1994, Informations Chimie, no. 333,
November 1991 7 The Financial Times, 25th April 1989
8 Tara Evans, SACMA, personal communication, April 1996
9 Personal Communication, Emiko Kashu, Mitsubishi Rayon, August 1992
10 Advanced Materials by Design, Office of Technology Assessment, Washington D.C., 1988
11 Office of Technology Assessment, op.cit.10
12 Charles Toyer, Toray, in interview, October 1995
13 Digest of Public Law 101-165, HR3072, 21st November 1989.
14 Digest of Public Law 102-172, HR 2521, 26th November, 1991
15 Taylor, Harold, A. Graphite, Bureau of Mines, US Department of the Interior, 1988
16 Advanced Materials Technology and Industrial Base, Department of Defense, Washington D.C.
January 1996 17
Amoco Annual Report, 1988 18
Hercules Annual Report, 1988 19
Irving, Robert, R. and Jones, Sam L., BASF Going Ahead With $30 million Expansion Project,
Metalworking News, April 9th, 1990 20
Taylor, op.cit.15 21
The Economics of Carbon Fibre, Roskill Information Services, 1990 22
Chemical and Engineering News, 28th November 1994 23
CPI Purchasing, May 1990 24
Toho Rayon, quoted in Kagaku Kogyo Nippou,, June 1992 25
Toho Rayon, quoted in Japan Chemical Week, 16th June 1994 26
Toray, personal communication, Feb 1992 27
Charles Toyer, Toray, in interview, October 1995 28
Charles Toyer, ibid. 29
Personal Communication, H.Dr.Neumann, March 1993 30
Kagaku Kogyo Nippou, June 1991 31
Courtaulds will cease making carbon fibre , The Financial Times, 21st June, 1991 32
Courtaulds News, July/August 1991 33
1990 data, Toray, p.c. Dec 1991; 1991 data, Toray p.c. Feb 1992. 34
Courtaulds News, November 1990 35
Courtaulds News, July/August 1991 36
Toa Kobayashi, Mitsubishi Rayon, in interview, March 1992 37
Modern Materials in Manufacturing Industry, Fellowship of Engineering, 1983 38
Grafil Chief Executive Geoff Marsh quoted in Courtaulds News July/Aug 1991 39
Courtaulds News, December 1990 40
Courtaulds News, July/August, 1991 41
Metalworking News, May 21st, 1990 42
Chemical Marketing Reporter, August 5th 1991 43
Kagaku Kogyo Nippou, June 19th 1991 44
See, for example Le Marche des Composites se Décompose L'usine Nouvelle 19th March 1992 45
Kagaku Kogyo Nippou, March 12th 1992 46
Kagaku Kogyo Nippou, June 16th 1992 47
Yoshiteru Takei, personal communication, July 1995 48
Chemical Marketing Reporter, September 2nd 1991

214
49
Keisuke Ishii, Toray, in interview, April 1992 50
Takashi Masaki, Mitsubishi Rayon, in interview, March 1992 51
Keisuke Ishii, Toray, in interview, April 1992 52
Chemical Marketing Reporter, February 19th, 1990 53
Sole-24 ore, February 11th, 1990 54
Keisuke Ishii, in interview, April 1992 55
Toray Press Release, May 25th 1992 56
Andrew Smith, KMPG personal communication, December 1995 57
Akzo Press Release, April 21st 1993 58
Dr H. Blumberg, Tenax Fibres, personal communication, 6th September 1993 59
Japan Chemical Week January 26th 1995 60
Nikkei Weekly, May 2nd 1994 61
Charles Toyer, in interview, October 1995 62
Chemical and Engineering News, November 1994 63
Japan Chemical Week, December 18th 1994 64
Japan Chemical Week May 1995 65
Blumberg. H., Status Quo der Entwicklung von polymeren Faserverbundwerkstoffen in der
Bundesrepublik Deutschland im internationalen Vergleich , Focus, February 1989 66
Hiramatsu, T., and Nishimura, T., Recent Technological Progress of PAN-based Carbon Fibre
Preprint, given to author, April 1992 67
Matsui, Junichi, Surface Properties of Carbon Fibre , Critical Reviews in Surface Chemistry,
Volume 1, Issue 2, 1990, 68
Asahi Kasei internal memo, given to author May 1992 69
Toray internal memo, given to author, April 1992 70
Kagaku Kogyo Nippou, June 1992 71
Kagaku Kogyo Nippou, June 1993 72
Kagaku Kogyo Nippou, June 1994 73
Kagaku Kogyo Nippou, June 1995 74
Charlers Toyer, in interview, October 1995 75
Europe Chemie, 1st July 1993 76
Japan Chemical Week, 26th January, 1995 77
Emmott, Bill Japan’s Global Reach, Century, 1992 78
SACMA data given to author, April 1992 79
The Financial Times, 15th August 1986 80
The Financial Times, 15th August 1986 81
Industrial Bank of Japan, Carbon Fibres:the Rush for Higher Performance IBJ Quarterly Survey,
no 68, 1986 82
Metal Working News, April 9th 1990 83
Layman, Patricia, Chemical and Engineering News, June 1st, 1987 84
Calculated from Table 5.6 85
SACMA data, given to author April 1992. 1985-1991 data actual, 1992-1995 data estimated 86
SIPRI Yearbook, 1993: World Armamants and Disarmament, SIPRI, Oxford University Press,
1993 87
Colin Powell, quoted in SIPRI Yearbook, 1993 World Armaments and Disarmament, SIPRI,
Oxford University Press, 1993 88
David Napier, AIA, personal communication ,April 1996 89
David Napier, AIA, personal communication, April 1996 90
David Napier, AIA, personal communication, April, 1996 91
David Napier, AIA personal communication, April 1996 92
David Napier, AIA, personal communication, April 1996 93
Bulletin of Atomic Scientists, October 1992 94
Aviation Week and Space Technology, April 15th, 1991 95
SACMA data, given to author October 1991 96
Bulletin of Atomic Scientists, October 1992

215
97
Quoted in Bulletin of Atomic Scientists, October 1992 98
1991 data, SACMA given to author April 1992; !993 data, Composite Market Reports, April 8th,
1993 99
Quoted in Composite Market Reports, Inc., April 8th, 1993 100
Quoted in Oden, Michael, Bischak, Greg and Evans-Klock, Chris, The Technology Reinvestment
Project: The Technical Economic and Political Limits of Dual Use Technology Policy, Work in
progress 101
Dr Lee Buchanan, TRP administrator, TRP briefing, New York, April 12th 1993 102
TRP Program Solicitation, Summer 1995 103
Technology Reinvestment Project Annual 1995 104
Technology Reinvestment Project Annual, 1995 105
Technology Reinvestment Project Booklet, 1993 106
White House Press Release, 25th October 1994 107
Technology Reinvestment Project Annual 1995 108
ibid. 109
ibid. 110
Technology Reinvestment Project Annual, 1995, Project proposal appendix 111
Charles Toyer, in interview, October 1995 112
Office of Assistant Secretary of Defense, Washington, D.C., Press Release, July 11th 1994. 113
Technology Reinvestment Annual, 1995 114
Technology Reinvestment Annual, 1995 115
Defense Weekly, 19th June 1995 116
Composite Market Reports, May 1995 117
Composite Market Reports July 1995 118
Defense Weekly, 19th July 1995 119
Composite Market Reports July, 1995 120
Charles Toyer, Toray, in interview, October 1995 121
Grafiber News, April 1995 122
Grafiber News, April 1995 123
Technology Reinvestment Project Annual 1995 124
With thanks to William Forbes for pointing this out 125
See Gardner, Roy, Game theory for Business and Economics John Wiley, 1995 126
For further discussion of precommitment investment strategies see Davies, Stephen and Lyons,
Bruce in Surveys of Economics, Longman, 1991 127
Nikkei Weekly, August 9th, 1993 128
Akitaki Kikuchi, Asahi Kasei, in interview, May 1992 129
David Nunn, Toray, personal communication 25th March, 1993 130
Keisuke Ishii, Toray, personal communication, March 16th 1993 131
Charles Toyer, Toray, in interview, October 1995 132
The Financial Times, 15th August 1986 133
See, For example, Performance Materials, 23rd August, 1993 134
Calculated from Tables 5.6 and 5.7

233
CHAPTER SIX:
CARBON FIBRE AND THE CONDITIONS FOR SURVIVAL IN THE ADVANCED
MATERIALS SECTOR
“Any invention or discovery is a great thing, but to put it to practical use is even
more important”
Masara Ibuka, founder of Sony.1
In the late 1970’s, as John Zysman has noted,2 economists discovered Japan. There has since
existed a growing body of comparative literature examining the distinct modes of capitalism
in Japan, Western Europe and the United States. Running parallel with this discussion has
been the increasing interest in the relations between defence and civil technologies. In this
thesis we have focussed on these themes though the lens of an advanced material, namely,
carbon fibre.
Advanced materials are a seedcorn technology, described by J. Michael Bowman, the Vice
President of Du Pont, as one that "feeds and enables all the large system integrators such as
aerospace, construction, automotive, electronics and defense ... these are multi-billion dollar
markets critical to our GNP and societal growth."3 Advanced materials are also a classic
generic dual-use technology, one whose development and fortunes have been driven by an
intricate compulsion of both civilian and military interests. Finally, advanced materials is a
capital-intensive industry involving long lead times, high investment requirements and
uniquely close customer-supplier relations that forcibly illuminate the industrial structures in
which it has evolved. Of the advanced materials, carbon fibre is by far the most
commercially significant and is traded more or less world-wide. It is the carbon fibre
industry, therefore, that has been the focus of this research.
Carbon fibre is a high technology sector that has undergone something of a convulsion over
the period 1990-1995, as the evidence collected during the course of this research has shown.
This convulsion was precipitated by a large drop in demand from the defence sector as the
Cold War cessated. We have seen that this shifting macroeconomic landscape brought about
marked differences in microeconomic response from the carbon fibre producers of Japan,
234
United States and Western Europe, and have attempted to elucidate the reasons underlying
these diverse corporate strategies.
In Chapters Two and Three of this thesis, we examined the technical characteristics of carbon
fibre and gave an overview of its applications and markets. We also discussed the secondary
literature, contrasting Anglo-American industrial structures with those of Japan. In Chapter 4,
we presented the historical development of the industry up to 1989, and then, in Chapter Five,
charted in some detail the turmoil of the industry over the period 1990-1995. During this
time a major restructuring of the industry took place, the result being an industrial shift of
carbon fibre manufacture, with capacity increases in Japan and growing Japanese control of
production facilities in Europe and the United States. In Chapter Five, we also sought out the
possible determinants that precipitated and shaped the consequent industrial shakeout and
examined the evidence and relative weight of each. In effect, Chapter Five bridges the gap
between the broader macroeconomic structures discussed earlier in the thesis and the micro-
economic performance of the carbon fibre producing firms themselves.
The managers questioned during the course of this research offered two explanations as to the
cross national variations in corporate response. These were the relatively high dependence of
the US producers on the defence sector and the higher stability generally of Japanese firms.
The empirical evidence collected during the course of this research and presented in Chapter
Five supports both these claims.
Throughout its history, as we saw in Chapter Four, the development of the carbon fibre
industry has been driven by a complex mixture of commercial and military interests. All the
carbon fibre manufacturers reported this as a major influence on the development of the
industry. At its inception, the two most significant advances in the actual creation of the new
material originated in government research laboratories. It was the Japanese Industrial
Research Institute that first developed fibre based on PAN, while in the UK, RAE discovered
the critical processing step for the production of high strength high modulus fibre. The
production technology for the manufacture of a commercial viable fibre was then pioneered
at Harwell. It is worth noting that none of these laboratories was either strictly civil or
strictly military in their operations.4 The Japanese research was a collaborative venture
conducted under the auspices of MITI, and the RAE already had a long tradition in civil
aerospace research. When the technology was first licensed to Rolls Royce, in the mid-

235
1960’s, UK defence spending was in a downturn while civil aerospace was booming, and
Rolls Royce was primarily a civil aviation contractor. Only in the United States was
development of aerospace applications almost entirely sponsored by government military
research establishments. The Air Force Materials Laboratory, for example, underwrote much
of Union Carbide's work on rayon, pitch and PAN based fibres.
Defence-sponsored R&D doubtless accelerated the development of applications in the US
and Western Europe, but the role of the defence sector as end user was of far greater value to
the industry. The defence sector was critical in nurturing and sustaining the infant
manufacturing base by undertaking the higher risks and costs as first major customer. This
was particularly apparent in the US, but in the UK, too, the Fellowship of Engineering
describes the role of the Ministry of Defence as crucial in the early support of a indigenous
carbon fibre industry,
“Courtaulds are the principal audited supplier of carbon fibres for British military
aircraft and this favoured position has certainly been of great benefit to them ...
without MoD orders, Courtaulds would certainly have given up."5
Although we have not gone into the French case in this thesis, the position there was in fact
similar. The Délégation Générale de L'Armement (the procurement arm of the Ministry for
Defence) and the Ministère de la Recherche et de la Technologie (MRT) centralised French
government new materials research under a joint programme. Largely through the
intervention of these ministries, the then nationalised firm ELF set up a joint venture with
Toray in the south of France to produce 300 tons a year, essentially granting the country self
sufficiency in carbon fibre production. It is a measure of the degree of proprietary knowledge
required in the management of new materials that when a national champion plant actually
came to be built, the expertise of an overseas firm, Toray, was still a prerequisite, despite a
decade of internal research by the French Government and aerospace sector. The MRT
claims that it was in France that the first major product to be conceived in terms of the
properties of carbon fibre (a helicopter rotor blade, in 1970) was developed and produced.6
The United States, with its uniquely large defence budget, has provided a first market for
many advanced goods and industries. In the early days of carbon fibre development, the US,
through its military aerospace interests, created a demand for carbon fibre far larger than that

236
of any other national market. There is little doubt that this demand was decisive in the
establishment of the US as the dominant player in the end-use advanced composite industry.
The demand factor for carbon fibre in the United States was so strong it overcame the fact
that the key processing patents for the technology were held by Japan and the United
Kingdom.
In the early days of the industry, Japan and the UK were actually in remarkable similar
positions. Each held a key patent; neither had a large immediate domestic market and for
both the only significant existing market at the time was in the US. In Britain, the US
aerospace industry was seen as the only serious market and there was little discussion of
alternative applications. Two of the three UK RAE licensees consequently set up joint
ventures with US firms (Courtaulds-Hercules and Morganite-Celanese). These tie-ups
benefited the US partners enormously and served to establish a strong production base in
America.
By contrast, the Japanese firms sought to create new markets for the material in sporting
goods. This was a longer term strategy that resulted in the companies carrying large losses
over a long period. Toray in particular was noted for its aggressive 'missionary marketing' of
the new material. The result of these disparate corporate strategies was a wide geographical
variation in the markets for carbon fibre that persisted throughout the history of the industry.
Sports goods became the dominant application for Japanese produced carbon fibre, for which
the military market was barely a few percent of total production. In Western Europe and the
United States, aerospace markets predominated, of which around 50 percent were in military
applications. In this way, the carbon fibre civil-military dichotomy was mirrored by distinct
geographical variations in production, or, put another way, there arose a civil-military
division of labour across the sector that served to differentiate not companies but continents.
The concentration on defence applications would have had a far from detrimental effect on
the strength of the industry in the United States had the Department of Defense expectations
of the late 1980’s come to fruition. In 1987, the DoD forecast that it alone would require
almost 3600 tons of carbon fibre a year by 1995.7 At the time, US companies had the
capacity to produce just half that amount. The same year, the DoD mandated that it would
preferentially buy systems built from domestically sourced fibre. Once the mandate was
established, Amoco, Hercules, Courtaulds and BASF all announced plans to expand or build

237
new PAN precursor plant and all, with the addition of BP, substantially expanded their
American carbon fibre production facilities. It is worth noting here that, despite the apparent
market opportunity, none of the Japanese firms invested in plant in the US as a result of the
Department of Defense mandate.
Hence the DoD mandate resulted in a flurry of investment and a huge jump in US-based
capacity that would have paid off had the Pentagon forecasts been fulfilled and would have
left the United States as not only the largest consumer but also the largest producer of carbon
fibre. In fact, peak DoD usage - just over 900 tons - was recorded in 1989. The actual usage
in 1995 now estimated to be just 450 tons:8 the DoD procured 408 aircraft in 1989 but only
155 in 1995, with similar drops occurring in ship, missile and helicopter numbers.9 The fact
that carbon fibre consumption had grown at an exponential rate throughout the 1980’s only
served to compound the shock when, in 1990, markets fell, and fell sharply, for the first time
in the history of the industry. Hence the very large excess production capacity of the early
1990’s was created through a combination of overestimation of market demand and a US
policy decision to create a national supplier base. The arrival on stream of the new plant
coincident with the end of the Cold War left the industry in a state of severe overcapacity.
Prices fell world-wide, but although the immediate outlook was bleak, midterm prospects
were promising. The civil aerospace industry, in a mid-cycle downturn at the time, was set to
pick up post-1995, the year in which the Boeing 777, with its high composite usage, was due
its first delivery. There was little question that if companies could weather the immediate
storm, there would, eventually, be a return to profit and the opportunity to amortise the recent
large investments.
In the short term, however, the problems were severe. Demand was so low that half of all US
plant was idled. Malaman has argued that,
"first comers are highly protected in the supply of advanced materials, because of
both technological factors and market structure. As a consequence, the shake out
processes following the creation of excessive production capacity does not
usually push the first-comer out of the market, because they are capable of
imitating incremental innovations originated by the followers. The first-comer’s
general culture and experience about the materials and the processes allows such

238
imitation phenomena, which was observed during the development of synthetic
materials".10
In fact, however, in the case of carbon fibre, the industrial structure factors described above,
along with the US government interventions described below, played the greater role, with
the result that Courtaulds, one of the pioneer firms in carbon fibre production, was the first to
abandon the industry.
Meanwhile, Japanese producers saw the troubles of the industry as an opportunity to pursue
market share strategies. Despite the flat market, the Japanese firms were able to access
capital for investment and thereby expand into both the US and Western Europe. Although
Courtaulds was not able to support the losses of its carbon fibre operations, Mitsubishi Rayon
could, allowing it to purchase the Courtaulds plant in US. The other Japanese producers also
continued to invest in their domestic plant, despite the downturn in the market. Meanwhile,
BP and BASF also withdrew from the industry. Courtaulds, BP and BASF all had production
facilities in the US, facilities which all three firms had substantially expanded following the
1987 DoD mandate.
By 1993, the industry had reached an all time low. Prices had fallen for the third year
running and no profit had been turned since 1989. “We’re in a fight for survival” remarked
Jim Burns of Hercules in 1993,11
and in the words of Charles Toyer of Toray, "Everyone had
their back to the wall ... everyone was watching to see who would go".12
The build up in
capacity in anticipation of Pentagon demands and the then evaporation of this market had left
the United States with a large volume of brand new and suddenly unwanted plant. The
unforeseen and rather dramatic end to the Cold War had resulted in a downsizing of the
defence sector that caught the entire industry off guard. Rumours began to circulate that even
Hercules, the biggest defence supplier, was seeking a partner for its carbon fibre operations.
The only likely candidates for partnership with Hercules were Japanese. It was at this point
that the US government acted to stabilise its domestic carbon fibre sector. The Technology
Reinvestment Project was the first measure to be announced, and the one that proved to have
the most immediate impact. As we saw in Chapter Five, TRP was an inter-agency
programme designed to aid conversion to commercial sectors for previously defence
orientated firms. Hercules and Amoco were the two most likely contenders for the big TRP

239
composite award. Both were US-owned, US-based companies; the Pentagon had been
reported earlier as unhappy over the volume of non-US owned carbon fibre production set up
in the US following its mandate and had made no move to prevent the closures of Courtaulds
and BP's carbon fibre operations in the United States. Hercules and Amoco did indeed win
the award, amidst much discussion on the 're-Americanization' of the industry. Shortly after
the award announcement, BASF abandoned the business, writing off of its new carbon fibre
plant. It had been the largest line in the world and represented a huge loss for the company.
With the departure of BASF, US carbon fibre supply tightened. In this way, TRP secured the
immediate future of Amoco and Hercules, the two largest US-owned carbon fibre producers.
The beating of swords into plough-shares has been a topic of much discussion, largely within
the literature on the interdiffusion of military and civil technologies and the debate on the
general economic benefits or otherwise of defence spending. These arguments have grown
particularly pertinent in the fiscal constraints and reduced threat of the early 1990’s military
environment. Chesnais has argued that a large defence demand, although central to the
establishment of an industry and the driver of early industrial growth can disadvantage firms
later in the product cycle. In general terms, he avers, military interest in a technology leads to
high levels of research investment but to short product cycles and high levels of technical and
financial risk.13
This may in fact be true, but in the case of carbon fibre the events that led up
to the sharp curtailing of the defence market far outweighed considerations of business cycles
and technical risk. Put another way, had the DoD expectations come to pass, the United
States would by now probably possess the largest and most vigorous carbon fibre industry in
the world.
Kaldor has argued that military emphasis on performance over cost inhibits technological
conversion from the military to the civil sector.14
These arguments, too, have limited
application in this particular case study, chiefly because carbon fibre is an upstream, generic
technology far removed from the final end product and in fact the technical changes required
to convert a plant producing carbon fibre ostensibly for military aircraft to one making carbon
fibre for tennis racquets is minimal. A carbon fibre line is, as we saw in Chapter Two, either
high tensile or high modulus. By far the largest percentage of carbon fibre production in
Europe and the United States is high tensile, including the US plants of Amoco, Hercules and
BASF.15
High tensile fibre is the type used in almost all the major applications, including
most sports goods and almost all military aircraft. In Chapter Two, we saw that the strength
240
and modulus of the final fibre are determined directly by the temperature at which the
precursor is processed (if the heat treatment step takes place at 1500oC, a high tensile fibre
results, while 2500OC degrees produces a high modulus fibre). Therefore, conversion
requires at most the alteration of furnace temperature, which takes around a month to
stabilise. High modulus fibre is used in space structures and high performance golf clubs. At
a cost of £500/kg, this fibre type is “too expensive for fighter aircraft”,16
which is the reverse
in fact of the Kaldor argument.
Alic, et al., have detailed the limits of the spin-off model as a basis for US technology policy,
arguing that although US defence R&D spending is high, the diffusion of military
technologies into the commercial sector has been less than the spin-off model would
suggest.17
Samuels, too, argues that the secrecy and specificity associated with military R&D
impedes the interchange of commercial and defence technology.18
Japan, in contrast to the
US, is not only a leader in the design and manufacture of dual use technologies but also fully
integrates civil and military industrial production. Samuels further argues that the Japanese
perception of technological capability as central to national security has driven Japan to a
programme of “commercial technonationalism”19
Similarly, according to Reppy, many
barriers to diversification from military into commercial markets are organisational rather
than technical have their origin in culture specific features of the defence sector.20
We find these arguments have a very strong relevance in the carbon fibre sector. For
example, the development of a civilian carbon fibre base in the United States has been
hampered by the many controls and restrictions placed on the industry. Carbon fibre is on
both the Commodity Control List of the Department of Commerce and the DoD’s critical
technology list. This makes it subject to a complex regime of export control legislation and
has limited the development of non-defence applications. As Thomas R. Goldberg observed
at an international advanced composite conference in 1991,
“Because much of the US investment in advanced materials is in military
research and hardware, export controls limit the availability of data to US firms
engaged in the development of commercial applications. By contrast, our allies
enjoy greater freedoms to market advanced products around the globe that in
some cases are comparable or superior to those developed in the US. The result

241
of these circumstances is one we are witnessing today - the loss of the US
technological-industrial lead in advanced materials.”21
As we saw in Chapter One, close producer-user relations are characteristic of new materials,
and carbon fibre is no exception. The first Boeing 777 rolled off the production line more or
less on schedule in the summer of 1995, Boeing having first started work with Toray on
carbon composites for the project five years ago in 1990. In order to work still closer with
Boeing, Toray built an entire new plant in Washington State to service the Boeing contract.
Such relationships, so characteristic of the advanced materials sector, can take years to
establish and can hinder the entry of new players into a sub-sector of the industry. It is these
types of organisational features, in conjunction with the general overcapacity of the industry,
that restricted the movement of the defence suppliers of carbon fibre into civilian markets.
The second strand of argument raised by the managers, that is, Japanese firms are more stable
generally, was examined in Chapter Three at a macroeconomic level, and in Chapter Five, at
the level of the firm. Early neo-classical discussions of economic growth and change
assumed that, economically speaking, nations shared fundamental similarities of market
structure. Differing market modes, it was argued, could not co-exist as eventually free
market efficiency would drive out less successful economic systems. International
competitiveness was discussed only in terms of comparative advantage, exchange rates and
basic cost and price indicators.
Porter argues that the competitive advantage of a nation is determined by four broadly based
attributes; namely factor conditions (such as the skill mix of the labour pool and available
existing natural resources), domestic demand conditions, the existence or otherwise of related
and support industries and firm strategy, structure and rivalry.22
Similarly the OECD
Technology-Economy programme attempts to bridge the gap between competitiveness at the
level of the firm and the macroeconomic competitiveness of national economies. Although
the OECD examines the failure of “classical” competitiveness theories concerning price,
costs and exchange rates and argues that “factors related to technology [such as national
systems of innovation and military R&D] ... are empirically found to have played more
important roles than cost or price”,23
it offers no further explanations other than those rooted
in Porter.

242
However, despite the globalisation of capital markets, national rates of saving and investment
and internal capital market structures continue to differ widely between nations and, as
technological competitiveness becomes the sine qua non of the industrial strategies of
advanced countries, notions of capital and labour costs are no longer capable of fully
explaining shifts in market share and the changing patterns of international trade.
Porter’s set of analytical techniques to describe and assess competitive ability (and similar
approaches such as that of Dicken24
) are thought by some (Toshiro Hirota, for example25
) to
be reductive to the extent that the more qualitative factors such as culture or ideology that
may also create or impede competitive advantage are overlooked. These factors are
especially pertinent to non Anglo-American corporate systems, such as that of Japan. In the
US and UK, legal institutions are formally separate from the official apparatus of the state
and the firm may be described as an autonomous legal and financial entity facing largely
anonymous and impersonal market pressures.26
In East Asia, however, these separations are
not evident (and never were historically). The result is that business transactions in these
countries are far more personal and the role of formal contract relatively unimportant.
East Asian nations commonly refer to themselves as post-Confucian economies27
and do
appear to possess a common set of basic business axioms. Strategy and planning, for
instance, forms one of the great departments of post-Confucian thought as is the notion of ‘ie’
or ‘the group’. We have seen these broader themes expressed explicitly in the case of carbon
fibre through the structured and committed policies adopted by the Japanese carbon fibre
producers and the influence of the keiretsu group.
Nishida28
and others argue that such concepts of ‘economic culture’ have had a profound
influence on the industrial development of nationsxiv
. Recent studies have revealed the routes
by which business strategies and systems follow country specific patterns, and suggest that
the structural characteristics of the domestic economy exert a profound influence on
corporate behaviour. In capital intensive and technologically advanced sectors in particular,
the extent and manner in which firms compete, and their strategic preferences, vary
considerably between national business systems.29
xiv
For example, in Japan the 1947 Law for the Elimination of Excessive Concentrations of Economic Power
was introduced by the Occupation as a sort of Japanese version of the Glass-Steagall Act, designed to trust-bust
the zaibatsu. In fact it had virtually the reverse effect in that it precipitated the formation of the keiretsu group
system.

243
Carbon fibre is a primary example of such a sector, and in many ways antithesis of the classic
free market product. Its production requires a high degree of proprietary knowledge, close
and long term user - producer co-operation. a large technological input, few natural
resources, long lead times and considerable sunk investment. There are high barriers to
entry, it is capital intensive and possesses great economies of scale. (The minimum size for a
commercially viable carbon fibre plant is 350 tons, and under 1000 tons is considered small.30
New plant takes around three years and several million dollars to construct.31
) Defence
interest in the sector is intense.
As we saw above, both Japan and the UK were strong in the early technical development of
carbon fibre. However, the subsequent implementation of this innovation followed quite
divergent paths. UK firms and, to an even greater extent those of the US, concentrated on
meeting military requirements. This became their key market. In contrast, Japanese firms
actively pursued and developed new market sectors and worked vigorously to maintain a
highly competitive technological edge. With the end of the Cold War, the defence market
contracted and the consequent industrial shift has been the focus of this thesis.
In Chapter Three, we outlined the differences in industrial structure at a macro-economic
level in Japan and the United States.32
One of the most striking contrasts is the variation in
rates of saving and investment. The US saving rate has rarely exceeded 10% of the Gross
National Product but may reach over 25% in Japan.33
Furthermore, would - be American
borrowers must compete for capital with an enormous government debt for capital. The US
budget deficit drives up interest rates for the private sector in the capital markets and
consequently US rates of investment had been consistently lower than those of Japan.
Japanese industrial structure was also closely contrasted with that of the United States at a
microeconomic level. In our examination of the financial structure of corporations, we saw
that Japanese firms have a relatively high debt-equity ratio, that is, they have a pronounced
preference for raising finance through borrowing rather than through the issuing of shares.
All else being equal, the more stable the firm, the higher the optimal debt-equity ratio. We
also saw that Japanese firms pay out far less of their profit in dividend, but despite this the
price-earnings ratio (which is the key measure of investor confidence in a firm) remains far
higher in Japan than virtually any other country. (In late 1995, the Japanese price-earnings

244
ratio average stood at around 120, compared to 20 in the United States and just 15 in the
UK.34
)
We have also seen how the line between bank and firm is often blurred in Japan and that,
through the keiretsu system, companies are locked into a complex lattice of cross-
shareholding and implicit agreements orchestrated by the main bank. Although there is a
negative correlation between keiretsu membership and profit, keiretsu firms show a lower
variance in profit fluctuation, that is, high profit is sacrificed in favour of company stability.
As Nakatani has observed the keiretsu system acts as a sort of mutual insurance scheme,
insulating firms from fluctuations in the exogenous environment.35
In the US, the financial markets are comparatively fluid. Theoretically, this increases the
efficient allocation of finance in that scarce available capital is distributed to those projects,
be they long or short term, that provide the highest return measured in terms of the present
discounted value.36
Porter,37
however, has argued that this argument is flawed as in practice a
'credibility' gap exists, creating pockets of underinvestment. An underinvested project
typically possesses high technological costs, a slow to mature return, illiquid investments,
and benefits that are diffuse or difficult to evaluate. Advanced materials fit Porter’s criteria
on every point.
In Chapter Five, we looked at the financial ratios and capital structure of all the major carbon
fibre producers to see how well they fitted the macroeconomic financial models presented
above. The Japanese firms all demonstrated significantly higher levels of gearing than the
other carbon fibre producers and slightly lower levels of profitability. The non-Japanese
producers also possess far lower price-earnings ratios; this means they are under a greater
compulsion to deliver short term profit in order to maintain share price. Finally, and perhaps
most significantly, the variation in price-earnings ratio was over three times greater for the
Japanese firms. If share price closely follows profit, the variation is low. This is the case for
the non-Japanese producers. For the Japanese producers, in contrast, profits have little
influence on share price, giving the firms a far greater flexibility to retain earnings for
investment and enables firms to plan long term even in times of financial distress.
Drawing on various sources, the keiretsu affiliation of the Japanese producers was examined
in Chapter Five and Appendix III. Mitsubishi Rayon, Toho Rayon and Toray were all found

245
to be core keiretsu firms, with seats on the presidential councils and very close financial ties
to their respective groups. Asahi Kasei proved to be more of a rogue element, with personal
ties to one keiretsu, DKB, but financial relations with another, Sumitomo. Dodwells, the
definitive English-language source on the subject, does not classify Asahi Kasei as a keiretsu
firm at all and Asahi Kasei itself specifically told the author that it had no keiretsu
affiliation.38
Keiretsu membership is a problematic subject in Japan and despite many discussions with the
companies, it was not possible to uncover the specific keiretsu mechanisms that came into
play during the upheavals in the carbon fibre industry. However, the data collected for each
firm indicate that all the Japanese firms possess financial ratios geared toward long term
stability rather than short term profit. It is not unlikely that the keiretsu standing of
Mitsubishi Rayon, Toray and Toho Rayon, in conjunction with the national financial
environment in Japan, did enable these firms to survive the turbulence of the early 1990's
and, indeed, by buying up plant when cheap, to turn the problems of the industry to their
advantage. Asahi Kasei was able stay with the industry through almost four years of losses
and world-wide overcapacity, outlasting the British firms BP and Courtaulds and the US-
based German producer BASF. However, in 1994, after the TRP awards had been
announced and it was clear that Amoco and Hercules would thus be able to continue
production, there were no other likely capacity reductions on the cards and Asahi Kasei
announced plans to withdraw. Despite the troubles of the sector, the industry still described
itself as 'a little surprised' at the Asahi decision.39
It is currently believed that Mitsubishi
Rayon plan to buy up the Asahi plant, which will thus remain under Japanese control.40
In
short, the core keiretsu producers were best able to ride out the trading conditions of the early
1990’s, and even the non-keiretsu Japanese firm, Asahi Kasei fared better than its European
counterparts.
Finally, while all the industry respondents put forward the two explanatory factors raised
above, none invoked a third factor which has become evident during the course of this thesis;
that is, the role of direct US government intervention in the preservation of a US-owned
composite industry. While the US government actively intervened to maintain an industrial
capacity in the US, there was no equivalent government intervention to benefit either
Japanese or European firms.

246
The Technology Reinvestment Project was a stop-gap measure that tided over the US-owned
firms while other steps could be brought into play. The Clinton Administration employed two
subsequent policy instruments to bring the new commercial carbon fibre sector into
equilibrium. On the same day as the TRP announcement, the President unveiled a second
programme that was to dramatically improve the fortunes of the sector in the mid-term.41
This was The Clean Car Initiative, a new inter-agency project led by the Environmental
Protection Agency and the Departments of Energy and Transportation. The Clean Car was to
be powered by compressed natural gas, contained in an aluminium lined container
overwrapped by one of three competing materials, steel, glass fibre or carbon fibre The
industry was at first bemused. "I don't know what the hell it means"42
said one carbon fibre
representative and business press, initially sceptical, charged that,
"The people in charge of developing this technology have no clue as to how to
design a product to use this technology." 43
However, the clean car was to develop into a surprisingly high volume market. The Los
Angeles South Coast Air Quality Management District, concerned about its smog, placed a
$16 million order and other US public transport systems quickly followed suit.44
In 1994,
however, after two rather unfortunate explosive failures of trial vehicles, the Highway Traffic
Safety Administration regulated that carbon fibre cylinders should fulfil additional safety
standards on the grounds that carbon fibre was an 'unproven technology'. Had this regulation
come into force, the increased cost would have effectively ruled out carbon fibre as a
contending material.45
The industry appealed the ruling which was overturned the following
December,46
and carbon fibre became the material of choice. There are currently 40,000
(mostly fleet) vehicles running on compressed natural gas in the US, and over a million
world-wide.47
The demand for carbon fibre for these cylinders is currently so high that every
carbon fibre producer is now working flat out and shortages have been reported world-wide
in almost every sub-sector of the industry. Forecasts also strong, with exponential growth
expected over the next few years (Table 6.1). Furthermore, in sharp contrast to the early
1990’s, forecasts are now revised upwards rather than down.xv
Virtually all this new growth
is to fulfil the emergent demand for carbon fibre from the manufacturers of natural gas.
xv
For example, in 1994, Toray estimated that total global consumption would be 7,815 in 1996, 8,640 in 1997,
and 9,510 in 1998. In 1995 the corresponding figures were increased to 9,780, 11,640 and 13,340 respectively.

247
Table 6.1: Pan-Based Carbon Fibre Consumption Forecast, 1995 (tons/year)
1995 1996 1997 1998
USA Total 3605 4180 5460 6590
Aerospace 970 100 1210 1220
Sports 880 910 930 950
Industrial 1755 2270 3320 4420
Europe Total 1440 1580 1730 1900
Aerospace 445 470 520 570
Sports 370 390 410 430
Industrial 625 720 800 900
Korea/ Total 1680 1800 1920 2060
Taiwan Aerospace 10 20 20 20
Sports 1630 1710 1800 1890
Industrial 40 70 100 150
Japan Total 1880 2220 2530 2790
Aerospace 70 100 120 130
Sports 1060 1090 1120 1150
Industrial 750 1030 1290 1510
Global Total 8605 9780 11640 13340
Aerospace 1495 1590 1870 1960
Sports 3940 4100 4260 4420
Industrial 3170 4090 5510 6980
Source: Toray48
The military-civil conversion of the industry was further aided by a third government
initiative. In summer of 1994, the Defense Secretary Bill Perry announced plans to overhaul
the DoD's 31,000 military specifications and standards. The Pentagon document, entitled
Blueprint for Change states, "The military specification and standards process is obsolete. It
was not structured to deal with technology cycles that are measured in months rather than
years or decades".49
The Department of Defense estimates that just 17 percent of US military
purchases are based on commercial standards. The administration now plans to reverse the
situation such that 17 percent of future contracts will be based upon military specifications.50
Formerly, a waiver was required for DoD to use commercial standards. Under the Perry plan,

248
a waiver will be required for military specifications to be employed. It is widely believed
that this measure will gradually but profoundly aid the establishment of a more robust
commercial carbon fibre sector in the US. As John Banisaukas of Amoco products
commented on the announcement,
"The lack of standardisation in the aerospace industry has been a major barrier to
the increased use of composites ... in some cases designers have actually foregone
the advantages of composites and continue to use other materials because of
qualifications difficulties."51
In these ways, US government policies of removing barriers to conversion and actively
creating new markets through the legislative process, have enabled the American carbon fibre
industry, at least, to survive more or less intact. Indeed, the DoD recently announced that
although,
“the [polymer matrix composite] industrial base is restructuring because of
declines in defense spending, ... increasing commercial applications will soon
offset military sales declines ...[and]... the technology industrial base is, as of now
[January 1996], adequate for future military requirements.”52
To conclude, over the period 1990-1995, the entire carbon fibre industry was running at a
loss. The coincidental arrival of new plant and onset of disappearing markets in 1990 had left
the entire industry in a rather precarious position. The earlier certainties of the military
markets had evaporated, and there was no hope of recovery in the short term. In the midterm,
however, prospects, though still uncertain, were fairly bright with civil aerospace looking set
for a upturn post 1995. In short, for those companies able to ride out the short-term
upheavals and five years of losses, the outlook was promising. The Japanese producers had
the stability and financial ratios to ride out the storm, and indeed, turn the troubles of the
industry to their advantage. The firms of the US were directly aided by intervention by a
government concerned about the stability of a strategic material industrial base. The
European producers, however, had neither the direct government support nor the industrial
environment to continue trading in the turbulent market conditions. Consequently, these
were the firms that lost market share.

249
This thesis demonstrates that both the Japanese and US firms succeeded in maintaining
market share throughout an unstable and volatile macroeconomic environment. However, a
close examination of the data has revealed that while the Japanese producers pursued
consistent, proactive, expansionist investment strategies throughout the period, those of the
US manufacturers were, in contrast, incremental, episodic and continuously reactive to
market dictates and government interventions. This is the central difference distinguishing
the investment decisions of the carbon fibre producers of Japan and the US.
References
1 Quoted in The Economist, February 9th, 1980
2 Quoted in Minabe, Shigeo, Japanese Competitiveness and Japanese Management, Science, 18th July
1986
3 Testimony of J. Michael Bowman before the Committee on Science, Space and Technology, US
House of Representatives, March 10th, 1994
4 Gummett, Philip and Bate, Iain, ‘Defence-Civil Relations in the Development of New Materials
Technology in Britain’ in Gummett, Philip and Reppy, Judith, The Relations between Defence and
Civil Technologies, Proceedings of the NATO Advanced Research Workshop on the Relations
between Defence and Civil Technologies, 1987
5 Modern Materials in Manufacturing Industry, The Fellowship of Engineering, 1983
6 French sources, M. Avinet, DGA, and Francois Chesnais, OECD, in interview, June 1991
7 Jon de Vault, Grafiber News, May 1995
8 Jon de Vault, Keynote Address, 40th International SAMPE Symposium, May 1995
9 1989 data from Table 5.11, 1995 data as follows: C17s, 6 procured; Civil Air Patrol Aircraft,, 27
procured; E-8A JSTARS, 2 procured; JPATS, 3 procured; T-1A Jayhawk, 35 procured; RC-12P, 1
procured; UH-60 Black Hawk, 60 procured; AH-1W Sea Cobra, 12 procured; AV-8BHarrier, 4
procured; E-2c Hawkeye, 4 procured; F/A-18, 24 procured, T-45 Goshawk, 12 procured. Source
David Napier, Aerospace Industries association, Personal communication, April, 1996
10 Malaman, Robert, Innovation in Advanced Materials: Technological Opportunities, Innovative
Processes, Effects on the Industrial Structure, Contributi Di Ricerca, Istituto per la Ricerca Sociale,
September 1988
11 Performance Materials, May 17th, 1993
12 Charles Toyer, Toray, in interview, October 1995
13 Francois Chesnais, in interview, June 1991
14 Kaldor, Mary, The Baroque Arsenal, André Deutsch, 1982
15 Charles Toyer, Toray, in interview, October 1995
16 Charles Toyer, Toray, in interview, October 1995
17 Alic, John A. et al., Beyond Spin-off: Military and Commercial Technologies in a Changing
World, Harvard Business School Press, Boston, 1992
18 Samuels, Richard, J., “Rich Nation, Strong Army” National Security and the Technological
Transformation of Japan, Cornell University Press, 1994
19 ibid.
20 Reppy, Judith Technology Flows Between the Military and Civilian Sectors: Theory and Evidence,
prepared for the Panel “Defense Spending as Technology Policy for the US” American Association
for the Advancement of Science, January 1989. See also Dual Use Technology: back to the future.
Paper presented to the Council on Foreign Relations Study Group on Consolidation, Downsizing and
Conversion in the US Military Industrial Base, March 1996
21 Quoted in Composite Market Report, November 22nd, 1991
22 Porter, Michael. The Competitive Advantage of Nations, MacMillan, 1990

250
23 OECD, Background Report Concluding the Technology/Economy Programme, OECD, 1991
24 Dicken, Peter, Global Shift, Harper and Row, 1986
25 Toshiro Hirota, in interview, Febrary 1995. See also work by Henry Mintsberg, Shigeto Tsuru or
Richard Whitley
26 Whitley, Richard Business Systems in East Asia, Sage Publications, 1992
27 See, for example Lee Kuan Yew’s comment on Singapore and Gu Mu’s quote on China, The
Economist 21st January 1995
28 Nishida, J.M. and Redding, S.G. Firm Development and Diversification Strategies as Products of
Economic Cultures: the Japanese and Hong Kong Textile Industries, Whitley, Richard (Ed) European
Business Systems, Sage 1992. See also work by Aoki.
29 See, for example, Whitley, Richard op.cit.26
30 Kagaku Kyogo Nippou, June 1994
31 Charles Toyer, in interview, October 1995
32 For a comparative discussion of European business structures, see Whitley, Richard European
Business Systems: Firms and Markets in their National Contexts, Sage Publications, 1992
33 Minabe, Shigeo, op. cit.2
34 September 1995 figures, The Economist,14th October 1995
35 Nakatani, Iwao, ‘The Economic Role of Financial Corporate Grouping’, in Aoki Masahiko (Ed)
The Economic Analysis of the Japanese Firm, Elsevier Science Publishers, 1984
36 Corporate Governance and Financial Markets, Report to the Competitiveness Policy Council,
Washington D.C., March 1993
37 Porter, Michael, Capital Choices: Changing the Way America Invests in Industry, Council on
Competitiveness, Washington D.C., 1992
38 Akitaka Kikuchi, Asahi Kasei, in interview, May 1992
39 Charles Toyer, in interview, October 1995
40 Charles Toyer, in interview, October 1995
41 Performance Materials, 1st November 1993
42 Performance Materials, 1st November 1993
43 ibid.
44 Performance Materials, 14th August 1995
45 Performance Materials, 17th October 1994
46 Performance Materials, 12th December 1994
47 Reuters Energy desk, telephone conversation, September 2nd, 1996
48 Toray internal document, given to author, September 1995
49 Performance Materials, July 11th, 1994
50 ibid.
51 Quoted in Performance Materials, ibid
52 Advanced Materials Technology and Industry Base, Department of Defense Assessment,
Washington D.C., January 1996
233
APPENDIX I
Company Profiles
We present in this appendix profiles of the major extant carbon fibre producers, plus BASF
and Asahi Kasei, who both abandoned production in 1994. For each firm, we will first
examine the development and current status of their respective carbon fibre activities. All the
firms are large, diversified companies and carbon fibre production typically represents just a
few percent of total sales. For this reason, although carbon fibre is perceived as a high
technology product, its production is not quantified in annual reports and scarcely merits
more than a sentence. Hence, most of the information in these sections was gathered through
visits to the carbon fibre divisions and subsequent correspondence. Further information
relating to the carbon fibre industry is derived from the trade press, including Japan
Chemical Week, Chemical Week, American Metal Markets, Plastics Industry News and the
Nikkei Weekly.

234
Hercules, USA
Background
Total Assets: 3653.2 million dollars
Net sales: 3091.7 million dollars
Sales composition: Chemicals 66.5% (paper, textiles, resins, food gums)
Aerospace 27.2% (solid propellant rocket motors,
electronic equipment, ordnance and powders)
Carbon fibre produced at Bacchus, Utah, under the brand name Magnamite
Source: Hercules Annual Report, 1993
In 1912, a Delaware judge ordered that E.I. du Pont de Nemours, a firm that controlled two
thirds of all explosives production in the United States, be broken up. Hercules was one of
the two new companies thus formed. The new business was set up complete with a number
of explosives factories and a $5 million government "loan" and turned a profit in its very first
year. Hercules grew quickly, its early years marred only by the loss of its Hazardville plant,
which exploded in its first month of operation. Between 1915 and 1917, Hercules exported
46 million pounds of powder to Britain and, by the Second World War, was the largest
producer of naval stores in the US, the third largest producer of explosives and managing six
ordnance plants for the US government.1
Although there was some diversification into petroleum products after World War II,
Hercules' defence interests were regenerated by the Korean War and the DoD Cold War
aerospace programme. Between 1955 and 1963, Hercules sales doubled, largely due to a
series of government contracts, and throughout the Vietnam War, the firm supplied the US
government with rocket fuels, anti-personnel devices, Agent Orange and napalm. These
products accounted for 25% of Hercules' profits at that time.2 All in all, the company
estimates it has sold over a million rocket motors for tactical missile systems, including
motors for the Minuteman, Honest John, Polaris and Trident3
Hercules expanded rapidly through both domestic and overseas acquisition throughout the
1960's, but its petro-chemical interests left it vulnerable to the oil shocks of the early 1970's.
The company subsequently reduced its dependence on commodity chemicals and became a
supplier of higher value added chemical products, such as films and other speciality plastics.
235
It maintained its defence interests and in 1984 was reorganised into three separate divisions,
the Hercules Speciality Chemicals Company, Hercules Aerospace and Hercules Engineered
Polymers.4
Carbon Fibre Activities
We now detail the key points in the development of Hercules' carbon fibre operations. In
1988, within a year of the new DoD regulations on the domestic sourcing of PAN (the
chemical precusor for carbon fibre), Hercules and the Japanese firm Sumitomo Chemical
began construction of a $70 million, 1700 ton per year PAN precursor plant in Decatur, AL.
to be named Hispan.5 Previously, Hercules had imported all its PAN from Sumika-Hercules,
a Hercules/Sumitomo joint venture in Japan. The company also completed an expansion
project to increase its carbon fibre capacity at Magna to 1400 tons a year and demonstrated a
prototype multi axis computer controlled fibre placement machine to NASA, DARPA and
other government bodies. Essentially, the machine automated the moulding of composites for
aerospace applications and cut (the very high) costs previously associated with the
manufacture of complex composites shapes. The new process cut the process time in half
and required only one operator to make a composite aircraft wing compared to the twenty
operators required previously. The demonstration project was a prototype military aircraft. It
was announced that the machines would be scaled up for the commercial production of
volume shapes.6
In 1990 Hercules wrote off $323 million in aerospace expenses, of which around $100
million was non-recoverable, after under-bidding a series of missile contracts. All in all, the
aerospace division reported a $256 million loss. The company decided to commit to a
number of core businesses and sell several others. Carbon fibre was one of those “with a
future” kept by the company. "The object now is to get business back to a 10% return," said
the CEO, David Hollings, predicting that Hercules would recover its historical 13 to 14%
return on equity by 1993.7 In June 1990, Hercules and Sumitomo Chemical opened the 50/50
joint venture Hispan, giving Hercules and Sumitomo a combined PAN precursor capacity of
5000 tons per year.8 In a bid to access EC markets, Hercules set up a joint venture in 1991 to
manufacture carbon fibre and composite materials in Southern Italy. The new firm,
Technologie d'Avanguardia e Materili Avanzati or TAEMA, was a collaboration of Hercules
(25%), the Italian engineering firm Bat (45%) and the Dutch holding company HNR
Investments (30%). The initial capitalisation was 13.5 billion lire.9

236
The same year, the company began to approach possible buyers, including Japanese carbon
fibre producers with a view to selling its US carbon fibre operations10
and in 1992 Hercules
officially announced it was seeking a partner for its carbon fibre business.11
In August 1992
the Chemical and Engineering News reported that Hercules had come close to finalising a
deal to sell part of its carbon fibre and composite business.12
However, in October 1993
Hercules was named as part of a consortium, funded by the Technology Reinvestment Project
to adapt advanced materials for use in bridge construction and rehabilitation.13
The same
year, America, a yacht manufactured from Hercules carbon fibre, and a high profile project
for the company, won the America's cup.
In November 1994, Hercules divested its structural materials business to Alliant Technology
Systems in Minnesota, but retained its carbon fibre production facilities in Utah. Group
director, Robert C. Eixenberger noted that 'Hercules is working on more non-aerospace
projects now [than a few years ago]'.14
By 1995 Hercules had completed the sale of its
Aerospace business to Alliant Technological Systems Incorporated for $300 million plus 3.86
million shares of newly issued Alliant stock. It still has partial control over the business
through its 30% stake in Alliant.15
In February 1995, the carbon fibre precursor joint venture
Sumika-Hercules that had “relied on US military business” was dissolved.16
Commentary
Hercules has had a long history in composite production. In the 1950’s it became something
of a pioneer in composite manufacture with the opening of its Youngs Development
Laboratories. This was a research centre which specialised in the manufacture of glass fibre
reinforced rocket case motors. Hercules was responsible for the first filament wound
composite cases for space booster use. These cases were also subsequently used in strategic
and some tactical missile systems such as Polaris. In 1969, the UK firm Courtaulds
announced an agreement whereby Hercules was guaranteed an exclusive right to sell
Courtaulds carbon fibre.17
(The two companies had previously collaborated on a joint
venture to manufacture cellulose acetate.) By the mid-1970’s, Hercules had its own small
plant manufacturing carbon fibre itself.

237
By the late 1980's Hercules' carbon fibre operations were very strongly orientated toward
defence. Historically, it had very close links with the DoD and at the time operated two US
government owned ammunitions plants. 100% of Hercules' aerospace carbon fibre needs
were supplied by the composite division, which also directly supplied NASA, the DoD and
prime contractors. Hercules' aerospace activities were themselves largely military. The table
below shows the breakdown of the division's sales:
Hercules Aerospace Sales By Market Segment
1989 1988 1987 1986
Defence 83% 84% 86% 83%
Civil 6% 7% 6% 6%
NASA 1% 1% 2% 2%
All Other 10% 8% 6% 9%
Source: Hercules Annual Report, 1989
In response the 1987 DoD directive, Hercules invested heavily in its carbon fibre operations,
building a new PAN precursor plant and considerably increasing its carbon fibre capacity. In
1989, the company commentated,
"Hercules has carefully evaluated its programs in light of the decreasing defence
budget environment, and believes that our programmes are well positioned and
that earnings growth will occur as the programs enter the productive stage."18
Things were looking bleaker by 1992. Material segment sales had been in decline for three
years. Hercules tried to sell its carbon fibre operations but the global overcapacity made it
impossible for the company to sell outright. The aerospace division reported a further $3
million dollar loss. Even the company report was struggling to find a positive tone,
"Composite products continues to feel the impact of cutbacks by the US DoD and
industry overcapacity ... Net sales [of the materials segment] decreased $21,079
in 1992, principally due to the termination of a carbon fiber supply contract in
April 1992 ... composites were adversely affected by DoD cutbacks [and]
continue to generate losses from operations. Net sales in 1991 were negatively

238
affected by the disposition or closure of several operations and DoD reductions
and stretch-outs."19
It was at this point that DARPA stepped in, creating a series of federally funded consortia
under the Technology Reinvestment Project to encourage dual use applications for advanced
composites. This interventionist measure safeguarded Hercules' composite operations over
the short term. In 1993, Hercules' second largest American rival, BASF closed its carbon
fibre operations, reducing the global overcapacity by 14% and US capacity by 30%.
Prospects began to look much brighter for Hercules. Although composite products was still
"under performing", the company declared that "in three to five years, carbon fiber is going to
be a major industry in the United States and on a global basis."20
The attempts to divest the
company of its carbon fibre operations ceased and the selloffs that had looked so likely the
previous year called off. Indeed, when Hercules eventually sold most of its Aerospace
division in 1995, its carbon fibre operations were actually retained.

239
Amoco, USA
Background
Total Assets: 28,486 million dollars
Total sales: 28,617 million dollars
Sales composition: Crude oil and oil and gas products 88%
Commodity Chemicals 8%
Speciality Chemicals 4%
Carbon fibre produced at Greenville, South Carolina under the brand name Thornel.
Amoco is a large US petroleum company, with over 80% of its revenues won from oil and
gas production. It is the largest private owner of North American natural gas reserves and the
leading North American natural gas producer. The remainder of Amoco's revenue comes
from its chemical activities, which are split into two divisions, commodity speciality
chemicals. Amoco is the world’s largest producer of purified terephthalic acid (PTA), the
polyester precursor and is also a major producer of polypropylene, paraxylene (the feedstock
for making PTA), polypropylene and olefins. These sorts of commodity chemicals are
closely tied to the general chemical business cycle and Amoco's chemical earnings have been
low since the beginning of the 1990’s. Amoco is a relative newcomer to carbon fibre
production. Carbon fibres are produced within the firm's speciality chemicals division.
Carbon Fibre Activities
In 1985 Amoco entered negotiations with Union Carbide to acquire their engineering
polymers and advanced composite business. The acquisition included Union Carbide's
carbon fibre plant in Greenville, South Carolina.21
The acquisition was completed in 1986 at
an approximate cost of $200 million22
and a new subsidiary established, Amoco Performance
Products Incorporated, to manage the company's engineering polymers, carbon fibres and
advanced composite business.
The following year, the company introduced two high strength, high modulus fibres of the
sort used in aerospace applications. Prior to the 1987 DoD directive, Amoco was the only US
company capable of manufacturing PAN precursor. However it was not at the time a
qualified military supplier (although it had started the process of gaining qualification).23
As

240
a result of the directive, in 1988, construction of a second carbon fibre plant began. The
company announced an increase of 13% in sales of carbon fibre and advanced composites.24
The same year, Amoco transferred its pitch-based carbon fibre production from a
developmental facility to a newly installed full scale commercial production plant. This type
of carbon fibre is extremely expensive and designed for use in very high value added military
aerospace applications.
In 1989, production capacity of high performance pitched based carbon fibre was further
expanded "to meet demand ... in aerospace and defence applications".25
Amoco's sales of
carbon fibre and composites increased a further 8%. Construction of the second PAN carbon
fibre plant was completed, increasing capacity by 540 tons.26
Production started at the new
plant in 1990. The company announced that the carbon fibre and composite "business is
expected to achieve substantial growth in the 1990s".27
In 1991 Amoco Performance Products was "realigned" to reflect the new, lower expectations
for military demand. The company reported
"The carbon fibre composites business was downsized ... we are continuing to
incur significant development costs."28
In addition to the downsizing, the company ceased production of carbon fibre entirely for
several months at the end of 1991. In 1992, Amoco described the defence industry as a,
"major customer for carbon fibres, but at significantly lower levels than
anticipated when we entered the field. Consequently, we are cutting costs and
seeking profits from civilian applications such as commercial aircraft."29
In its annual report of 1993 Amoco commented that is had,
"refocused this [carbon fibre] product line through cost cutting and divestment of
our advanced composite business"30

241
The business prospects of Amoco carbon fibre were hugely improved the same year through
the Technology Reinvestment Project and the decision by BASF, Amoco's second largest
rival to close its carbon fibre operations and in 1994 Amoco announced plans to purchase
BASF’s idled 900 ton a year carbon fibre line at Rock Hill, South Carolina by the end of the
year. The deal did not include the two other BASF fibre production lines. The Rock Hill line
"will be operated as a satellite facility at a relatively low cost".31
The company increased
PAN precursor production in Greenville and trucked the additional PAN to Rock Hill for
processing to maintain the high proportion of US produced PAN based fibres required by the
DoD guidelines.
Commentary
Amoco was the last of the big three American carbon fibre producers to start production and
the last to gain qualification from the military. As a result of the 1987 DoD mandate, and in
anticipation of the increased defence demand, Amoco built a second carbon fibre plant in
1988, which it expanded the following year. Amoco supplied the DoD with carbon fibre
brake pads for the F-16, the skin of the B-2 bomber and was in the process of being evaluated
as one of suppliers of carbon fibre for the primary airplane structure of the Advanced Tactical
Fighter. As we have seen earlier, by 1991 it was clear that this project would be cut back, a
decision that hit the primary supplier, BASF very hard. The B-2 bomber programme has
been limited to 20 operational craft and one test aircraft.32
BASF's decision to abandon the carbon fibre business effectively cut US capacity by almost a
third and Asahi Kasei's withdrawal from the industry further tightened the global
overcapacity. As we have seen, Amoco's carbon fibre operations were struggling during
1991, 1992 and 1993. However the TRP awards reawakened Amoco's interest in the sector.
There is a general belief in the industry that market for structural composite may start to
recovery with the new applications in the automotive sector. It would appear that with its
current investments in its domestic capacity of PAN precursor and its purchase of the BASF
line, Amoco shares that belief.

242
Toray, Japan
Background
Sales 599,160 million yen
Total Assets 821,814 million yen
Sales Composition: Polyester fibres 31%
Nylon 15%
Other Fibres 10%
Plastics 27%
Chemicals 6%
New operations 12%
Carbon fibre produced at Ehime, under the brand name Torayca
Toray was established as a rayon manufacturer in 1926 by Mitsui and Co. The company has
since grown into a large business conglomerate with a extensive scope of sales including
synthetic fibres, plastics, chemicals, electronics, medical products and pharmaceuticals. The
company remains one of Japan's largest synthetic fibre manufacturers, with fibres and textiles
accounting for just under half its total sales. The company began production of acrylic fibre
in 1964, and began carbon fibre production (which uses the same monomer) in 1971.33
Carbon Fibre Activities
Carbon fibre is produced at the company's Ehime plant under the brand name Torayca.
Commercial scale production of carbon fibre started at Ehime in 1971. In 1973, at the
inception of 'carbon boom' in sports applications, Toray began exporting carbon fibre, mainly
to the US and in 1977 Torayca carbon fibre became the first to be qualified by Boeing (for
use in secondary structures).
Capacity at Ehime increased to 1250 tons/year in 1982 and in 1984 Soficar was established in
the south of France, with an annual capacity of 300 tons. Toray assumed managerial control
of Soficar in 1988.34
In 1990 Boeing qualified a Toray prepreg for use in primary aircraft
structures35
and placed 80 billion yen worth of orders.36
The same year, Toray doubled
carbon fibre capacity in Japan to 2250 tons per annum.

243
In 1992 Toray transferred its Shiga operations to Ehime, thus consolidating its Japanese
prepreg activities in preparation for volume production.37
Toray also acquired Composite
Horizon, a carbon fibre end product manufacturer for $5.5 million.38
Later that year, a 360
ton second line was completed at Soficar. Production began the following January.39
Commentary
In 1979, Toray licensed its carbon fibre production technology to Union Carbide in the US.
Union Carbide subsequently sold its carbon fibre interests to Amoco to raise cash after
Bhopal. Toray also sought to gain a foothold in Europe by setting up a joint venture with Elf
Aquitaine, named Société des Fibres de Carbone (Soficar), to produce T300 in Abidos in the
south of France. In December 1988, Toray assumed managerial control with a 70% stake and
in 1992 completed a 7.5 billion yen production unit that essentially doubled Soficar's capacity
to 700 tons. The new line makes T800, a high strength fibre qualified for use in the EFA, the
ATR42 and ATR72.40
Other applications will include premium sporting goods such a golf
club shafts.
In April 1990, a Toray prepreg of T800 and 3900-2 was qualified by Boeing for use in
primary structural components. Toray increased its carbon fibre capacity at Ehime by 50%
the same year. However, Toray suffered badly from the world wide fall in carbon fibre prices
during 1991-92, losing over 6% of its market share.41
In 1993 the company's carbon fibre
sales slipped from 23 to 19 billion yen42
and fell again to 9 billion yen in 1994.43
In
November 1993, Soficar implemented 30,000 hours of temporary layoffs to avoid
redundancies.44
Nevertheless, the company continued to invest in its composite operations. In May 1992,
Toray announced that a 100% owned subsidiary - Toray Composites America Inc - would be
set up in Frederickson, Washington for the production and sales of prepreg, primarily for the
nearby Boeing Company Commercial Airplane Group.45
Toray already supplied carbon fibre
for use a secondary structures in the Boeing 737, 747, 757 and 767 and the in the Boeing 777
carbon fibre composites are used in the vertical fin and horizontal stabilisers, as well as the
floor beams, trailing edge flaps, rudder, nacelle and cowling, with a total composite weight of
8000 tons per plane.46
According to Boeing, around 120 777 are on order, including orders
from launch customer United Airlines (34 craft with an option on 34 more) All Nippon
Airways (which has placed orders totalling 25 of the aircraft).47

244
Toray originally supplied Boeing with prepreg from its Ehime plant. It is now expected that
almost all the prepreg now supplied to the US from Toray will be replaced with production
from the new plant. Toray's investment is expected to total 4.5 billion yen (US$35 million)
and projected sales are US$38 million by FY1996.48
Toray is currently the sole qualified
supplier, however the possibility that Boeing will consider second sourcing its prepreg
supply, although unlikely, cannot be ruled out.
Toray for many years was the world's largest producer of carbon fibre (its current capacity is
2250 tons a year) and the company's baseline product, T300, has become a standard for the
industry. Around 60% of Toray's carbon fibre output is exported (mainly to the US).49
However, the company is now seeking to expand its production of final carbon composite
products for sale in the Japanese domestic market. Toray is strong in the production of
composites for aerospace applications (although it is not a direct DoD supplier) and sees
aerospace as the major area of growth for carbon fibre composites.50
Toray’s main centre of
production of carbon fibre remains at the company's Ehime plant in Japan.

245
Toho Rayon, Japan
Background
Total Assets: 81,172 million yen
Total Sales: 75,500 million yen
Sales Composition: Acrylic Fibres 32%
Rayon 21%
Cotton Yarns 27%
Raw Silk 2%
Chemicals and others 17%
Carbon fibre produced at Mishima, under the brand name Besfight
Toho Rayon is a medium sized spinner of acrylic, rayon and cotton yarns.51
Like Toray,
carbon fibre activities began as a way of using excess acrylic fibre capacity. Carbon fibre is
produced under the brand name Besfight at Toho's Mishima plant which also produces
acrylic fibre, carbon fibre precursor, activated carbon fibre and carbon fibre composites.
Carbon Fibre Activities
Toho Rayon commenced carbon fibre production in the early 1970’s. In 1982 the firm’s
carbon fibre technology production technology was licensed to Akzo in the Netherlands and
in 1986 Akzo completed plant in Wuppertal, Germany to manufacture carbon fibre under
license from Toho. Toho Rayon also set up a licensing agreement with Celanese (US) (later
acquired by BASF) and in 1987 Toho Badische was established as a joint venture between
Toho and Narmco (US). (Narmco was also later acquired by BASF.)52
By 1990 Toho Rayon had a production capacity of 1420 tons/years and had announced plans
to increase this capacity by 600 tons. In 1993 the firm completed a $3.8 million plant for the
manufacture of carbon fibre reinforced composites. Resins are bought in from other
suppliers.53
The same year, Toho acquired a majority (51%) stake in Akzo's carbon fibre
business. The company was renamed Tenax Fibres (after the Akzo brand name) and the
capacity of the plant raised to 700 tons per year.54
The same year, a wholly owned carbon
fibre composite plant was completed at Toho's Tokushima site.55

246
In 1994 BASF withdrew from the carbon fibre industry. Toho Rayon's former US joint
venture with the company, Toho Badische was renamed Toho Cytec and reorganised as an
equally owned joint venture between Toho Rayon and Cytec Industries (US).56
Finally, in
1995, Toho announced it was increasing its stockholding in Tenax to 90%.57
Commentary
The company exports around 70% of its carbon fibre to South East Asian countries, most
notably Taiwan, Hong Kong and South Korea for the manufacture of sporting goods. Toho
Rayon current carbon fibre capacity stands at 2600 tons, ranking it the largest global
producer. Although, there is some forward integration into prepregs and shapes, and the
company produces a range of resins (20 or 30 quoted by the company), Toho's strength lies in
the range of carbon fibres it offers.
In 1982, the company licensed its carbon fibre production technology to Akzo, the Dutch
chemical firm, which then built a plant in Oberbruch and commenced carbon fibre production
in 1986. Concurrently, Akzo and Toho set up a number of joint ventures for the manufacture
of end shapes in Europe. Similarly in the States, Toho set up a licensing agreement with
Celanese (which was acquired in 1985 by BASF) and in 1987 formed a joint venture with
Narmco (also part of the BASF group). The joint venture, Toho Badische, quickly became
established as a prepreg and shapes company. Hence by the mid 1980’s, Toho had
established manufacturing agreements in its main export markets and had successfully
forward integrated into the more value added prepregs and composite operations.
Although not a direct military supplier, Toho was hit by the general overcapacity in the
global market as defence sales fell. The company lost around 10% of its carbon fibre
business in financial year 1992, dropping over a percentage point in terms of market share.58
In FY1993 Toho's Kaseihin [chemical division] which mainly handles the carbon fibre
business reported a loss of 100 million yen.59
The company announced that "due to a large
expansion in carbon fibre production capacity in 1990 and an abatement in demand from
space and aircraft markets, a worldwide recession has set in, making it necessary to
restructure the carbon fibre business".60
A three year plan was implemented, aiming to
restructure the firm's carbon fibre and textile operations and put them back in the black by
FY1996. In fact, Toho's carbon fibre business realised its set goal in FY 1995. As part of
this restructuring, Toho completed an agreement on Jan 1st 1993 to acquire a 51% majority

247
share in Akzo's carbon fibre business, Tenax fibres. In the summer of the same year, it was
announced that Tenax would increase its capacity from 500 to 700 tons per annum "in
expectation of an increase in demand for the fibres by the aeronautical industry from around
1995".61
Toho has since increased its stockholding in Tenax to 90%. Hence in a similar
manner to Toray, Toho has established a stable business network within the European Union.

248
Mitsubishi Rayon, Japan
Background
Total Assets 399,908 million yen
Total Sales 300,000 million yen
Sales Composition: Acrylic Fibres 18%
Acetate 14%
Polyester Filaments and others 14%
Plastics and Resins 44%
Other 10%
Carbon fibre produced at Otake and Toyohashi, under the brand name Pyrofil
Mitsubishi Rayon was established as a synthetic fibre producer in 1950. It continues to be a
leading manufacturer of acrylic fibres but is now better known for as one of the world’s
largest producers of moulding and coating resins, most notably MMA.
Carbon Fibre Activities
Research and development activities relating to carbon fibre and its composites began at
Mitsubishi Rayon's Central Research Laboratories in Otake in 1965. In 1976 the firm started
production of carbon fibre prepreg at the Toyohashi plant using carbon fibre imported from
Courtaulds in the UK and the following year, PAN precursor production started at Otake.62
The US firm Hitco licensed its carbon fibre production technology to Mitsubishi Rayon in
1981. Carbon fibre production started at the Otake pilot plant the following year and an
autoclave and filament winder installed at Toyohashi. Hitco and Mitsubishi Rayon
established the composites shapes producer Dai-Hitco Composites as a joint venture in
1983.63
In 1989 carbon fibre production started at Toyohashi on a commercial scale and in 1990,
Mitsubishi Rayon acquired Newport Adhesives and Newport Composites Inc., at a reported
cost of 6 billion yen. It consolidated the two companies under the new name Newport
Composite and Adhesives Inc and began the manufacture of prepreg in the US.64
Mitsubishi Rayon acquired the carbon fibre producer Grafil in the US from the British
company Courtaulds in 1991. By then, Mitsubishi Rayon had a 150 ton carbon fibre capacity
249
at Otake and a further 350 tons at Toyohashi. It was producing around 760 tons of prepreg
each year in Japan and had announced plans to expand its Advanced Composite Materials
plant further at Toyohashi.65
Commentary
Unlike Toray, Toho Rayon or Asahi Kasei, Mitsubishi Rayon first began its carbon fibre
interests through the production of prepreg and final products, integrating backwards to the
manufacture of carbon fibre itself. The company acquired its prepreg technology from
Courtaulds and began prepreg tape production at its Toyohashi plant in 1976, importing the
carbon fibre itself from Courtaulds. In 1982, Mitsubishi Rayon began the manufacture of its
own carbon fibre at its Otake plant, licensing the production technology from the American
firm Hitco (which was acquired by BP in 1986). Seven years later a second line was opened
at the Toyohashi plant, where an autoclave and filament winder had earlier been installed.
Mitsubishi Rayon is the only Japanese carbon fibre producer with a significant defence
interest; around 5% of its output is for Japanese F-15s.66
It is also qualified for the NASA
training plane the T-4 S-B and Japan’s next generation fighter, the FS-X.67
In 1983, Mitsubishi Rayon set up a joint venture, the Dia-Hitco Composite Company, with
Hitco in the US and further expanded its downstream American operations with the
acquisition of Newport Adhesives and Composites, a US prepregger in 1989. These
acquisitions resulted in Mitsubishi Rayon possessing a fully integrated production capacity
from carbon fibre production through to finished shapes in the US.
In 1991, the UK company Courtaulds decided to sell Grafil, a 400 ton capacity carbon fibre
plant in Sacramento, California it had set up in 1984. Mitsubishi Rayon purchased the entire
business. Grafil had a 8% market share in US carbon fibre and annual sales of around $15
million. The purchase price was variously reported as between $14.3 million68
and $22
million.69
Mitsubishi Rayon later announced plans to increasing Grafil's capacity to 600 tons.
Mitsubishi Rayon currently produces 500 tons of carbon fibre a year in Japan and 710 in the
US.70
Of all the Japanese firms, the company suffered the least during the early 1990's. Its
market share in Japan increased 3.4% to 26.1% in 1992, at the expense of both Toray and
Toho Rayon.71
Net sales of carbon fibre actually increased between 1992-93 from 10.7 to 12

250
billion yen, but slipped back slightly in 1994 to 11 billion yen.72
Mitsubishi Rayon sells
around 90% of its Japanese output to other members of the Mitsubishi group.

251
Asahi Kasei (Asahi Chemical), Japan
Background
Total Assets 975,677 million yen
Total Sales 1,000,000 million yen
Sales Composition: Acrylic Fibres 4%
Nylon 6%
Other Fibres 8%
Chemicals and Plastics 46%
Building Materials and Housing 33%
Others 3%
Carbon fibre was produced at Fuji, under the brand name Hi-Carbolon
Asahi Kasei is one of Japan's leading synthetic fibre producers. Its principal textile product is
acrylic fibre and it is largest producer of mono-acrylonitrile , which is used to make acrylic.
This is the monomer that is also used to make PAN, the precusor used in the manufacture of
carbon fibre. However, the company is essentially a large chemical firm producing plastics,
industrial chemicals and petrochemicals, synthetic rubber, pharmaceuticals and medical
equipment, electronics, housing materials and food products. (Asahi Kasei is the firm that
blessed us with the discovery of monosodium glutamate). The non textile divisions account
for nearly 80% of total sales.
Throughout the over 50 years since its founding as a synthetic fibre producer, Asahi Kasei
has expanded its operations by vertical integration from raw materials to finished product and
the full utilisation of by-products and derivatives. Full self-sufficiency in basic production
materials was established in the early 1970’s with the completion of the Mizushima
petrochemical complex in Okayama prefecture.73
Carbon Fibre Activities
In 1980 Asahi Kasei and Nippon Carbon established a joint venture for the manufacture of
carbon fibre. Production began a year later. In 1986, Asahi Kasei bought the company 100%
and changed the name to Asahi Kasei Carbon Fibre.74
Capacity was subsequently increased
from 360 to 450 tons in 1989 and Asahi Kasei Carbon Fibre and Asahi Kasei Composites
consolidated into a single company and re-named Shin [new] Asahi Kasei Carbon Fibre.75

252
1990 saw the development of the WIP prepreg, the first major commercial prepreg based on a
thermoplastic resin. WIP found its major market in the manufacture of tennis rackets and in
1992 the firm announced plans to increase capacity from 480 to 600 tons per year.76
Originally, the company had planned to increase production to 1000 tons per year and build a
new plant. However, these plans were dropped as the global over capacity became evident.
The increase in capacity to 600 tons was completed by 1994, (by increasing the composition
of feedstock to the line rather than introducing more production lines) and Asahi Kasei
became the world's sixth largest producer of carbon fibre.
In April 1994, however, Asahi reported accumulated losses of 1.2 billion yen on carbon fibre
operations. The company announced it would abandon the carbon fibre business.77
Asahi
Kasei posted extraordinary losses of 600 million yen for the financial year through to March
1995.
Commentary
Carbon fibre production at Asahi Kasei started relatively recently with the establishment of a
joint venture with Nippon Carbon. Toray, Toho Rayon and Hercules were the only major
producers at the time and carbon fibre markets were increasing at double figure rates,
sometimes exceeding over 20% a year. Asahi Kasei was already producing the PAN
monomer in huge quantities through its acrylic fibre operations. Nippon Carbon, a big
producer of electrodes for melting iron, provided the high temperature technology required
for carbonisation. In 1986 Asahi Kasei bought out Nippon Carbon and reorganised its carbon
fibre operations as a 100% owned subsidiary.
Asahi Kasei established itself as a producer of standard 12K modulus fibre. This was
produced mainly at the firm's Fuji plant, from where around a quarter was sent to Asahi's
Moriyama plant for the manufacture of prepreg. The Moriyama plant also brought higher
modulus fibre from Toray and Toho Rayon. The bulk of Asahi Kasei's carbon fibre
production was sold to Taiwan and South Korea for the manufacture of sporting goods.78
Asahi Kasei's main strength was its ability as a major chemical company to offer dozens of
different kinds of resin for the manufacture of composites. It was the first major producer to
manufacture thermoplastics resins (which possess the potential for fast, high volume
production) for carbon composites on a commercial basis. Its thermoplastic prepreg WIP was

253
submitted to Boeing as a possible contender for primary structure qualification. The carbon
fibre division did not forward integrate to a large degree, however, each resin division had its
own downstream activities.79
Asahi Kasei's carbon fibre operations were about a fifth the size of its major competitors
Toray and Toho Rayon and the company lost out to some degree on the benefits of scale
economies. It completed its plans to increase capacity to 600 tons a year, but by early 1994,
the subsidiary had accumulated losses of some 1.2 billion yen and in April the company
announced plans to cease carbon fibre activities.

254
BASF, Germany
Background
Total Assets: 39,859 million DM
Net Sales: 46,565 million DM
Sales Composition: Oil and Gas: 9%
Plastics and Fibers:26%
Chemicals: 15%
Dyestuffs and Finishing products: 19%
Other: 31%
Carbon fibre was produced at Rock Hill, South Carolina, under the brand name Celion.
BASF is one of the world's largest chemical companies and holds a significant fraction of the
international trade in gas, plastics, petroleum products, nitrogen compounds and dyes. All
considered, since its inception in 1865 as the Badische Analin und Soda Fabrik AG, BASF
has had a profound influence on the global chemical industry.
The roots of the company lie in the manufacture of artificial dyes following William Perkins’
discoveries at the end of the nineteenth century. The new dyes proved cheap, bright and,
(unlike their natural counterparts), reliable and by the beginning of the twentieth century,
journalists were referring to BASF as "The World's Greatest Chemical Works". 80
The firm's
profitability lay in part in the organisation of the German chemical industry into two major
cartels, one centred on Hoechst and the other on BASF and Bayer. Within the cartels, the
firms fixed prices, set quotas and even shared profits. In 1925 the cartels merged and
hundreds of smaller chemical companies formally incorporated to form the huge
conglomerate Interessen Gemeinschaft Fabenwerke, better known as I.G. Fabern.81
At its
peak during World War II, I.G. Fabern had a controlling interest in 379 German firms and
460 foreign companies. Primo Levi's autobiographical work, If This Is A Man gives a
personal account of I.G. Fabern's wartime activities.82
At the end of the war, the then director
of BASF was consequently tried for war crimes and I.G. Fabern was broken up by the Allies
into its three component large firms, Hoechst, Bayer and BASF, and nine smaller ones.
BASF grew steadily throughout the 1950’s and 60’s becoming the world's largest producer of
plastics and fulfilling over 10% of the international requirement for synthetic fibres. After

255
the oil shock, the growth of the company slowed and, in a bid to reverse the trend, the
company began an active expansion into foreign markets. The establishment of a US
manufacturing base became the cornerstone for BASF's strategy for growth; at the time, the
US consumed a third of the world's chemical products.83
Carbon Fibre Activities
In 1985 BASF began carbon fibre production with the acquisition of the Celion carbon fibre
business from the US firm Celanese84
and in December 1987, the same year as the DoD
directive, PAN precursor production started at Rock Hill. In 1989, BASF announced that it
would increase its carbon fibre capacity to 1500 tons a year. It was later announced in April
1990 that BASF would go ahead with a $30 million expansion project at its carbon fibre
precursor plant in Rock Hill, South Carolina.85
In 1991, the new carbon fibre plant at Rock Hill commenced operations. The Metal Working
News had reported that by the third quarter of 1991, when the expansion of the then 136,000
kilogram carbon fibre precursor plant would be complete, BASF had estimated that it would
be able to produce in excess of 900 tons annually of the US domestic PAN requirement.86
However, in March, the French journal L'usine Nouvelle reported a BASF spokesperson as
saying,
"BASF ne juge pas opportun de continuer à supporter les charges resultant de
cette activité", [BASF does not think it opportune to continue to bear the costs of
this area of business]
and in June reported that,
"BASF à clairement fait savoir que son unité de Rock Hill (Etats Unis) était à
vendre" [BASF has made it clearly known that its (carbon fibre) plant at Rock
Hill is for sale].
In September of the same year, the Rubber and Plastics Weekly reported that BASF would
sell its structural materials operations to the European firm Hexcel.87
The sale included
BASF’s composites division in Lugwigshaven, which was moved to Welkenraedt in
Belgium, and was completed in the fourth quarter of 1992. The carbon fibre plant at Rock

256
Hill was closed down at the end of 1992. (Hexcel now supplies composite systems to the
Eurofighter).88
BASF planned to sell its Rock Hill plant and the whole of its composites
division once a buyer was found. By 1993, BASF had shut down its carbon fibre plant, idling
1360 tons of capacity and by May 1994, BASF had made it clear it would abandoning carbon
fibre production.89
In November of the same year, Amoco signalled an interest in buying 900
tons of BASF’s idled carbon fibre capacity in Rock Hill.90
The two other BASF production
lines were not included in the deal.
Commentary
BASF entered carbon fibre production by the acquisition of Celanese's carbon fibre plant in
Rock Hill, South Carolina. Celanese itself had been manufacturing carbon fibre since 1982
under a technology licensing agreement with the Japanese firm Toho Rayon, from which it
was supplied with PAN precursor. At the same time, BASF built a prepreg factory in
Ludwigshafen, created a daughter firm (Hybrid Yarns) to specialise in the production of
thermoplastic composites and bought the Connecticut firm Quantum, which produced
aerospace composite parts. BASF’s US acquisitions took place at a time when investment in
the US was a central theme of the company's strategy for growth. Moreover, as
contemporaneous sources observed, it was believed at the time that the US military markets
were set for rapid growth and that the DoD would preferentially buy from domestic sources.91
Up until 1987, all BASF carbon fibre was produced from Japanese precursor manufactured
by Toho Rayon. After the 1987 DoD directives, which mandated that by 1992 at least 50%
of both the carbon fibre and its PAN precursor used by the military be produced domestically,
BASF rapidly increased its capacity for both. In 1987, it started up PAN precursor
production and increased its PAN capacity further in 1990. In 1989, BASF announced plans
to increase carbon fibre capacity by opening a new line in Rock Hill, which it did in 1991.
By this time, BASF had became the main supplier of composite prepreg for the US air force's
Advanced Tactical Fighter.92
However, it was soon clear that this project would be severely
cut back and within a year, BASF was trying to sell its composite businesses. “We are
discontinuing our line of advanced composites” said the company “The drop in demand from
the aerospace industry increased competition considerably and ... we were unable to attain
our original goals.”93
For two years, the carbon fibre plants remained idle. Eventually
Amoco bought the 900 ton capacity line in 1994. BASF remains the owner of the remaining
carbon fibre capacity, but has made it clear it has abandoned the business.94

257
References
1 Hercules Annual Report, 1987
2 Dardek, Thomas, Ed, International Directory of Company Histories, Reference Publishers, 1988
3 Hercules Annual Report, 1995
4 Hercules Annual Report, 1987
5 Japan Chemical Week, 7th June 1990
6 Hercules Annual Report, 1988
7 Chemical Marketing Reporter, February 19th 1990
8 Keisuki Ishii, Toray, in interview, April, 1992
9 Sole-24ore, February 11th 1990
10 Keisuke Ishii, Toray, in interview, April 1992
11 Reisch, Marc, Chemical and Engineering News, August 3rd 1992
12 ibid.
13 Hercules Annual Report, 1993
14 Reisch, Marc, Chemical and Engineering News, November 28th 1994
15 Hercules Annual Report, 1995
16 Japan Chemical Week, February 9th 1995
17 Courtaulds Press Release, 3rd February, 1969
18 Hercules Annual Report, 1989
19 Hercules Annual Report. 1992
20 Hercules Annual Report, 1993
21 Amoco Anuual Report, 1985
22 Amoco Anuual Report, 1986
23 Advanced Materials by Design, US Office of Technology Assessment, Washington D.C., 1988
24 Amoco Annual Report, 1988
25 Amoco Annual Report, 1989
26 Amoco Annual Report, 1989
27 Amoco Annual Report, 1990
28 Amoco Annual Report, 1991
29 Amoco Annual Report, 1992
30 Amoco Annual Report, 1993
31 Chemical and Engineering News, 28th November 1994
32 Perry, William J., Annual Report to the President and the Congress, US Department of Defense,
Washington D.C., March 1996 33
Miyuki Tanaka, British Embassy, Tokyo, in interview, Match 1992 34
M. C Abad, Soficar, letter to author, March 19th, 1993 35
Plastics News, November, 5th 1990 36
Japan Economic Journal, April 21st, 1990 37
Toray to Consolidate Manufacturing Units American Metal Market, February 26th 1992 38
Japan Chemical Week, February 6th, 1992 39
M. C. Abad, letter to author, March 19th, 1993 40
David Nunn, Toray, in interview, October, 1991 41
Nikkei Weekly, August 9th 1993 42
Japan Chemical Week, June 24th, 1993 43
Japan Chemical Week, July 7th 1994 44
Soficar Recourt au Chomage Partiel, Echos, November 30th 1993 45
Toray Press release, May 25th, 1992 46
Torayca Newsletter, No2, January 1991 47
Boeing Current Market Outlook, Boeing, 1995 48
Toray Press release, May 25th 1992

258
49
About 70% volume, 50% value exported, David Nunn, Toray, letter to author, March 1993 50
Keisuki Ishii, Toray, in interview, April, 1992 51
Miyuki Tanaka, in interview, March 1992 52
Office of Technology Assessment, op. cit.23 53
Japan Chemical Week, 1st June 1992 54
Akzo Press release, April 21st, 1993 55
Japan Chemical Week, June 3rd, 1993 56
Japan Chemical Week, January 6th, 1994 57
Japan Chemical Week, January 26th, 1995 58
Nikkei Weekly, August 9th, 1993 59
Japan Chemical Week, July 7th, 1994 60
American Metal Market, December 23rd, 1992 61
Chemical Week, June 30th, 1993 62
Emiko Kashu, Mitsubishi Rayon, in interview, March 1992 63
US Office of Technology Assessment, op. cit.23 64
Japan Economic Journal, 21st April 1990 65
Emiko Kashu, Mitsubishi Rayon, in interview, March 1992 66
Goro Tsunoda, Mitsubishi Rayon, in interview, March 1992 67
Goro Tsunoda, Mitsubishi Rayon, in interview, March 1992 68
American Metal Market, 3rd July 1991 69
Plastics News, 17th June 1991 70
David Nunn, Toray, note to author, 18th September 1995 71
Nikkei Weekly, August 9th, 1993 72
Japan Chemical Week, July 7th, 1994 73
Miyuki Tanaka, in interview, March 1992 74
Akitaka Kikuchi, Asahi Kasei, in interview, May 1992 75
Rollet, Pierrick, Le Marche Japonais de la Fibre de Carbone, French Embassy,Tokyo, May 1991 76
Akitaka Kikuchi, Asahi Kasei, in interview, May 1992 77
Japan Chemical Week, May 19th, 1994 78
Akitaka Kikuchi, in interview, May 1992 79
Akitaka Kikuchi, in interview, May 1992 80
Dardek, Thomas, op.cit.2 81
Hounshell, David and Smith, John Kenly, Science and Corporate Strategy Cambridge University
Press, 1988 82
Levi, Primo, If This is a Man, Penguin, 1979 83
Dardek, Thomas, op.cit.2 84
Advanced Materials by Design, US Office of Technology Assessment, Washington D.C., 1988 85
Modern Plastics, May 1990 86
Metalworking News, April 9th 1990 87
Plastics and Rubber Weekly, September 5th, 1992 88
ibid. 89
Chemical and Engineering News, 28th November, 1994 90
Chemical and Engineerring News, 28th November 1994 91
Office of Technology Assessment, op. cit.91 92
Modern Plastics, April 1992 93
BASF Annual Report, 1992 94
Oversupply Knocks Carbon Fibre, Chemical Week, May 11th 1994

233
APPENDIX II
Interviewees
Avinet, M., Chef de Section Materiaux, DGA, Ministère de la Défense, Paris, June 1991
Bourgeois, J.L., Ministère de la Recherche et de la Technologie, Paris, June 1991
Chesnais, Francois, OECD, Paris, June 1991
Ishii, Keisuke, Carbon Fibers Department, Toray, Tokyo, April 1992
Kikuchi, Akitaka, Carbon Fiber Technology Development, Asahi Kasei, Fuji, May 1992
Kobayashi, Toa, Director, Carbon Fiber Plant, Mitsubishi Rayon, Toyohashi, March 1992
Masaki, Takashi, Director, Carbon Fiber Plant, Mitsubishi Rayon, Toyohashi, March 1992
Miyabe, Kiyoshi, Director, Administrative Department, Mitsubishi Rayon, Toyohashi,
March 1992
Nunn, David, Toray, London, October 1991
Odorico, J., Chef du Laboratoire Central, Aerospatiale, Suresnes, Paris, June 1991
Passedeos, Christos, author of Recherche Militaire et Industrie Civile: éléments de méthode
et remarques sur le cas des matériaux composites en France, Paris, June 1991
Rai, Mike, Toray, London, October 1991
Saito, Kazuhisa, General Manager Mishima Plant, Toho Rayon, Mishima, March 1992
Shigihara, Sadao, Carbon Products Division, Kureha, Tokyo, April, 1992
Tanaka, Kozo, Manager Mishima Plant, Toho Rayon, Mishima, March 1992
Tanaka, Miyuki, Science and Technology Division, British Embassy, Tokyo, March 1992
Toyer, Charles, Toray, London, October 1995
Tsunoda, Goro, Director, ACM and Products Plant, Mitsubishi Rayon, Toyohashi, March
1992
Young, Robert, Manchester Materials Science Centre, Manchester, October 1992
Sample Interview Questions
Background
What range of carbon fibre composite materials do you use/produce?
How much do they cost?
What alternative materials do you make/consider?
What are you main products currently using carbon fibre?
What processes are used to produce them?

234
What manpower and costs are being invested in this technology? How does this compare
with your investment in competing technologies?
What are your future plans for investment?
What is the history of your carbon fibre operations, over, say, the last 20 years? How did you
get into carbon fibre and why? What R&D has been performed by the firm? What were the
major applications?
What are your current carbon fibre R&D programmes? What factors do you believe are most
likely to inhibit the development of the sector?
Markets
How big are the markets in which your carbon fibre products compete? What are the
products that they have displaced? How do carbon fibre products compare, in terms of cost
and performance, with competing technologies? How is this likely to change over the next 5
or 10 years? What are the likely market projections?
What are the major barriers to substitution?
What are the main national markets? How do these compare with overseas markets in terms
of scale, quality and level of civil/military demand?
Who are your main suppliers and customers? Who are your major competitors?
Civil/Military Interactions
How distinct are your civil and military activities? By what mechanisms, if any, does
civil/military conversion take place? What is the evidence for their success?
In ongoing programmes, what are the expectations for civil/military technology transfer?
Other Institutions
What institutions do you consider important in the generation of knowledge/expertise
underlying this technology?
What are your links with government and/or other companies?
Current Activities
The latest figure I have for your current carbon fibre capacity is XXX tons. Is this correct
and, if not, what is the correct figure?
Do your current plans for carbon fibre production capacity include any increase or decrease
in output? If so, by how much and over what period?
235
What are your total carbon fibre sales in terms of value?
What percentage does carbon fibre constitute of your total company sales?
What percentage by value and by weight is exported?
Are any of your carbon fibre products qualified and if so, by whom?
Approximately what percentage (by value and weight) of your carbon fibre output is used in
defence applications?
Has the downturn in defence expenditures affected your carbon fibre activities and, if so,
how?
From my research it would appear that over the last couple of years, Japanese owned carbon
fibre capacity has markedly increased, in contrast to that owned by US and European firms.
Given that carbon fibre is a commodity that is traded on world markets, why do you think this
is so?
Financial governance
How does the operating profit on your carbon fibre operations compare to that of the group as
a whole?
Who are your major stockholders and what percentage of the total stock holding do they each
hold?
Who are your major creditors and what percentage of your total borrowing do they each
extend?
Has membership of XX keiretsu affected your carbon fibre interests in any way (for example,
initial and subsequent investment, initial and subsequent markets)? What percentage of your
current fibre output is sold to other companies within the keiretsu?
Other
Company history
Synopsis of carbon fibre operations
Annual Reports

233
APPENDIX III
Keiretsu Status
We examine here the keiretsu status of each of the Japanese carbon fibre producers. As we
saw in Chapter Three, a keiretsu company will:
depend on same-group institutions for a high proportion of its borrowing;
collectively, this same group will hold a large number of shares in the firm;
have a seat on the influential presidential council and perhaps further councils of the same
group;
have one or more interlocking directorships with other same-group firms.
Measures of keiretsu affiliation of firms are listed in Dodwells, the English language
translation of Keiretsu no Kenkyu, a Tokyo based annual publication of individual company
data on company directorships, reciprocal shareholding and intra-group borrowings. The
companies themselves were also asked by the author to provide more detailed data on their
main debtors and creditors. Finally Professor Yoshiteru Takei of Shizuoka University
provided the author with much background data on the keiretsu groups. We will now
consider the keiretsu standing or otherwise of each of the Japanese carbon fibre producers in
the light of these criteria. Turning first to the largest producer Toray, we find the major
shareholders to be:
Dai Ichi Mutual Life Insurance 5.4%
Nippon Life Insurance 5.2%
Mitsui Mutual Life Insurance 4.6%
Mitsui Taiyo Kobe Bank 4.5%
Mitsui Trust and Banking 3.9%
Sumitomo Trust and Banking 2.4%
Toyo Trust and Banking 2.2%
Long Term Credit Bank of Japan 2.0%
Daiwa Bank 1.9%
Source: Dodwell1

234
Of the major shareholders, Mitsui related institutions hold 40% of Toray's stock. The Mitsui
Kobe Bank and Mitsui Trust and Banking are also Toray's major creditor banks and, as a
whole, Mitsui related financial institutions extend 25.7% of Toray's total borrowings, over
three times that of any other lender group. Hence Toray's major shareholders and lenders are
all members of a single keiretsu group (a central characteristic of a keiretsu firm).
Historically, Toray is a core firm of the Mitsui keiretsu. Toray sits on the Nimoku-kai (the
presidential council of the Mitsui Group) and the Getsuyo-kai (a group of 76 executive
directors of Mitsui firms).2 The Fellowship of Engineering assert that Toray was greatly
aided by its membership of the Mitsui keiretsu at the time Toray started up their carbon fibre
production. Keiretsu membership minimised the financial risk Toray took in laying down
plant before demand was evident as close contacts already existed with potential end users. It
also helped Toray weather the storm when their original targeted market (a uranium
enrichment centrifuge) fell through by quickly providing alternative applications such as golf
clubs and fishing rods.3
*
Turning next to Toho Rayon, we see the largest shareholders are:
Nisshinbo Industries 24.4%
Yasuda Trust and Banking 5.6%
Fuji Bank 4.9%
Toyo Trust and Banking 4.9%
Mitsui Trust and Banking 4.1%
Mitsubishi Trust and Banking 4.0%
Mitsubishi Bank 1.9%
Sumitomo Trust and Banking 1.9%
Yasuda Mutual Life Insurance 1.8%
Showa Denko 1.5%
xvi Source: Dodwell
4
Of the major shareholders, Fuyo related financial institutions hold 69.5% of Toho's stock.
Fuyo related financial institutions also extend 21.3% of Fuyo's loans, compared to 11.8%
from the next largest creditor group, Mitsubishi.
xvi
Nisshinbo Industries is the textile branch of the Fuyo keiretsu; Yasuda Trust and Banking and Yasuda Mutual
Life Insurance are financial institutions within the Fuyo keiretsu. With thanks to Professor Takei.
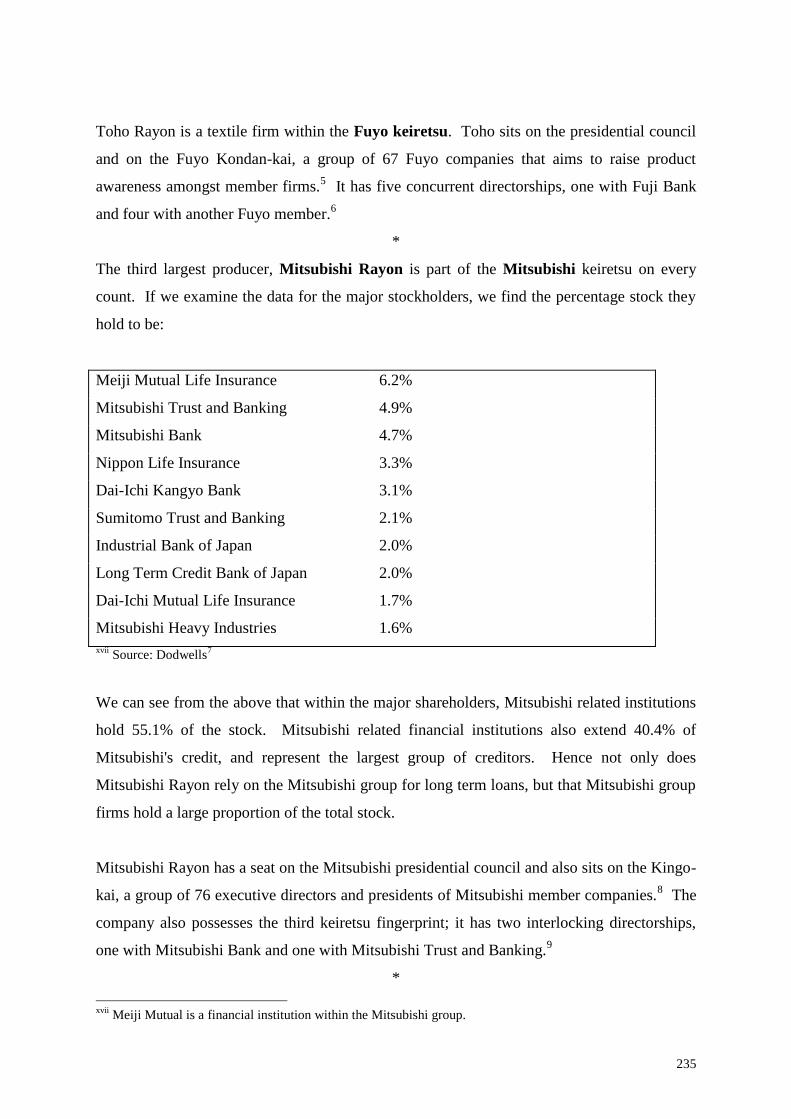
235
Toho Rayon is a textile firm within the Fuyo keiretsu. Toho sits on the presidential council
and on the Fuyo Kondan-kai, a group of 67 Fuyo companies that aims to raise product
awareness amongst member firms.5 It has five concurrent directorships, one with Fuji Bank
and four with another Fuyo member.6
*
The third largest producer, Mitsubishi Rayon is part of the Mitsubishi keiretsu on every
count. If we examine the data for the major stockholders, we find the percentage stock they
hold to be:
Meiji Mutual Life Insurance 6.2%
Mitsubishi Trust and Banking 4.9%
Mitsubishi Bank 4.7%
Nippon Life Insurance 3.3%
Dai-Ichi Kangyo Bank 3.1%
Sumitomo Trust and Banking 2.1%
Industrial Bank of Japan 2.0%
Long Term Credit Bank of Japan 2.0%
Dai-Ichi Mutual Life Insurance 1.7%
Mitsubishi Heavy Industries 1.6%
xvii Source: Dodwells
7
We can see from the above that within the major shareholders, Mitsubishi related institutions
hold 55.1% of the stock. Mitsubishi related financial institutions also extend 40.4% of
Mitsubishi's credit, and represent the largest group of creditors. Hence not only does
Mitsubishi Rayon rely on the Mitsubishi group for long term loans, but that Mitsubishi group
firms hold a large proportion of the total stock.
Mitsubishi Rayon has a seat on the Mitsubishi presidential council and also sits on the Kingo-
kai, a group of 76 executive directors and presidents of Mitsubishi member companies.8 The
company also possesses the third keiretsu fingerprint; it has two interlocking directorships,
one with Mitsubishi Bank and one with Mitsubishi Trust and Banking.9
*
xvii
Meiji Mutual is a financial institution within the Mitsubishi group.

236
Finally, if we examine the stock holding data for Asahi Kasei, we find the major
shareholders to be:
Nippon Life Insurance 4.5%
Sumitomo Bank 4.0%
Sumitomo Life Insurance 3.9%
Dai-Ichi Life Insurance 3.8%
Asahi Life Insurance 3.4%
Mitsui Life Insurance 3.3
Dai-Ichi Kangyo Bank 3.2%
Sumitomo Trust 2.8%
Meiji Life Insurance 2.3%
Tokyo Marine and Fire Insurance 2.2%
xviiiSource: Takei
10
Asahi Kasei does appear to have a close relationship with its primary creditor Sumitomo in
that Sumitomo related financial institutions hold 10.7% of Asahi Kasei stocks. However, and
as a most important difference from our other cases, Asahi Kasei sits on the presidential
council of another keiretsu group, Dai-chi Kangyo. The company does not see itself as part
of a keiretsu grouping and non-financial ties and support are minimal.11
References 1 Industrial Groupings in Japan, Dodwell Marketing Consultants, Tokyo. 1993
2 Miyashita Kenichi and Russell, David, Keiretsu, McGraw-Hill, 1994
3 Fellowship of Engineering, op. cit.
4 Dodwell, op. cit
5 Miyashita and Russell, op. cit
6 Dodwells, op. cit
7 Dodwells, op. cit
8 Miyashita and Russell, op. cit.
9 Dodwells, op. cit.
10 Professor Yoshiteru Takei, personal communication, May 1992
11 Akitaka Kikuchi, Asahi Kasei, in interview, May 1992
xviii
Nippon Life Insurance is a financial institution within the Sanwa keiretsu; Meiji Life Insurance and Tokyo
Marine and Fire Insurance are part of the Mitsubishi keiretsu.

233
APPENDIX IV
The End of the Cold War: a chronology
1970-1984
“The Soviet Union is the focus of evil in the Modern World”
Ronald Reagan, March 1983
Throughout the 1970’s and early 80’s, there is a steady increase in weapon numbers, although
the rate of increase is controlled though SALT (the Strategic Arms Limitation Talks). SALT
I and SALT II are signed in 1972 and 1978 respectively.
In 1980 Reagan comes to power. Relations with the Soviet Union, which have steadily
deteriorated over the last years of the Carter administration, grow still colder. Reagan
denounces the USSR as the ‘evil empire’ and defence expenditures are sharply increased.
The Strategic Arms Initiative further accelerates the arms race. The arms industry becomes
the leading growth industry in the United States and worldwide, military spending reaches
$550 billion.1
1985
Gorbachev comes to power and Reagan begins his second term of office. In November 1985,
Reagan and Gorbachev meet for the first time at the Geneva summit. No agreements are
reached.
1986
The US budget deficit reaches $221 billion and the national debt almost $3 trillion.2 In
response to the growing fiscal crisis in the US, the Gramm-Rudman-Hollings Act is passed,
mandating major deficit reductions over the following five years.
At the Reykjavik summit in Iceland, Gorbachev and Reagan meet each other for a second
time. Arms reductions are discussed but stall on the issue of the Strategic Defence Initiative.
1987

234
The INF (Intermediate Range Nuclear Force) Treaty eventually follows from the Iceland
Summit. The treaty calls for the dismantling and destruction of all short and medium range
missiles, with provisions for on-site inspection and verification.
The Soviet Union removes its SS-20 missiles from Eastern Europe and the USA removes
cruise and Pershing missiles from Germany, Italy and the UK.3
1988
Bush wins the US presidential elections
1989
Gorbachev reduces Soviet weapon spending by 20 percent. In Poland, the trade union
Solidarity wins a decisive victory over the communist party in the summer parliamentary
elections. Hungary opens its borders and thousands of East Germans pour into the country en
route for the West.
Following massive pro-democracy demonstrations in October, Czechoslovakia undergoes its
‘velvet revolution’. Violent revolutions oust the communist regime in Romania. Bulgaria
and Albania remain under communist control.
On the afternoon of November the 9th, the East German government, now completely unable
to stem the tide of exodus of its people through Hungary announces that it will open West
German crossing points. Within hours of the announcement, tens of thousands of East
Germans have crossed into West Berlin. The Berlin Wall itself is breached and subsequently
torn down.
1990
After the fall of the Berlin Wall, the East German government attempts independence, but
fails as populist demands for a united Germany grow. Kohl and Gorbachev negotiate and
agree a formula for re-unification. The East German army is completely erased and the West
German army reduced. Russia begins the withdrawal of its troops from Germany - a
manoeuvre that takes four years to complete. In October, East and West Germany are re-
unified.

235
The Paris Treaty is signed. The treaty is a bilateral agreement on conventional weapon
reduction, also known as CFE (conventional forces in Europe). This marks the end of 15
years of negotiations that had begun in Vienna under the banner MBFR (Mutual Balanced
Forces Reduction); negotiations that had borne no fruit until the fall of the Berlin Wall.
Progress is then accelerated by the settlement of the Paris Treaty. Under the CFE agreement,
reductions are made in tanks, aircraft, artillery, personnel transport and armed vehicles
throughout the European arena. For example, Germany is now limited to a total of 350,000
army, navy and airforce personnel.4 The Paris Treaty has been described as a “foundation for
military security in Europe ...[and] the most comprehensive arms control agreement in
history.”5
In August, Iraq invades Kuwait. The UN votes to authorise military action. On the 16th of
January 1991, the United States and allied forces begin a massive bombardment of Iraq,
which surrenders within 6 weeks. There are small increases in DoD aircraft procurement
during this period.6
1991
Following the collapse of communism in Central Europe, the Warsaw Pact disintegrates. In
August, a military coup by hard-line communists takes place in Moscow. The coup fails,
precipitating the collapse of communist power in the Soviet Union. In December, Gorbachev
is removed and forced to resign. Yeltsin comes to power and effectively outlaws the
communist party. Following the Moscow coup, the Soviet Union breaks up. By the end of
1991, led by the Baltic States, every republic has declared independence. On the 31st
December 1991, the Soviet Union formally ceases to exist.
1993
The START (Strategic Arms Limitation Talks) are signed by the USA and USSR/Russia (the
other nuclear powers did not take part). SALT and START are concerned with cuts in
nuclear forces, including ICBMs (intercontinental ballistic missiles) and SLBMs (submarine
launched missiles), and result in considerable cuts in these weapon systems.
1995

236
Problems arise with the Paris (CFE) treaty as Russia wishes to deploy greater numbers of
troops and weapons in Chechnya and the rest of the Caucas region. The CFE agreement was
concerned with total weapon and division numbers and where they could be stationed.
Russia decides to adjust its flank limits within the overall CFE ceiling in order to maintain
control of its southern regions.7
References 1 Ambrose, Stephen, E., Rise to Globalism: American Foreign Policy Since 1938, Penguin, 1991
2 Brinkley, Alan, The Unfinished Nation, McGraw Hill, 1993
3 Herman Kuiper, Eramus University, personal communication, November 1995
4 ibid
5 The Economist, November 18th, 1995
6 David Napier, Aerospace Industries Association, personal communication, April 1996
7 The Economist, op.cit

233
BIBLIOGRAPHY
Aerospatiale, Matériaux Composites (a history of composite usage), undated
Alic, John A. et al., Beyond Spin-off: Military and Commercial Technologies in a Changing
World, Harvard Business School Press, Boston, 1992
Ambrose, Stephen, E., Rise to Globalism: American Foreign Policy Since 1938, Penguin,
1991
Aoki, Masahiko, Information, Incentives, and Bargaining in the Japanese Economy,
Cambridge University Press, 1988
Aoki, Masahiko, Toward an Economic Model of the Japanese Firm, Journal of Economic
Literature, Volume XXVII, March 1990
Aoki, Masahiko and Dore, Ronald, The Japanese Firm, Oxford University Press, 1994
Aoki, Masahiko, Ed. The Economic Analysis of the Japanese Firm, Elsevier Science
Publishers, Amsterdam, 1984
Aotoni, Hiroshi, Prospects for Carbon Fiber Reinforced Composites, TBR Intelligence, Vol
2, No1, 1989.
Aviation Week and Space Technology, 1996 Farnborough Report, September 9th, 1996
Bacon, Roger and Moses, Charles, Carbon Fibres, from Light Bulbs to Outer Space in
High Performance Polymers: Their Origin and Development, Proceedings of the Symposium
Presented at the 91st Meeting of the American Chemical Society, 1986
Beasley, W.G, The Rise of Modern Japan, Weidenfield and Nicolson, 1990
Berglof, Erik and Perotti, Enrico, The governance structure of the Japanese financial
system, Journal of Financial Economics, 36 (1994) 259-284
Berle, Adolf, A., and Means, Gardiner, The Modern Corporation and Private Property,
Macmillan, 1932
Blumberg, Herbert., Kohlenstoff- und Aramidfasern, Kunststoffe, 77, January, 1987
Blumberg, Herbert, Status quo der Entwicklung von polymeren Faserverbundwerkstoffen in
der Bundesrepublik Deutschland im internationalen Vergleich, Focus, February 1989
Brinkley, Alan, The Unfinished Nation, McGraw Hill, 1993
British Chamber of Commerce in Japan, Seihin-ka: how Japan brings its R&D onto the
market, British Chamber of Commerce, 1988
Chandler, Alfred, Scale and Scope: the dynamics of industrial capitalism Belknap Press,
1990

234
Charkham, Jonathan P., Keeping Good Company: a study of Corporate Governance in
Five Countries, Oxford University Press, Oxford, 1994
Chung, Deborah, Carbon Fibre Composites, Butterworth-Heinemann, 1994
Clark, Joel, P. And Flemings, Merton, C., Advanced Materials and the Economy, Scientific
American, October 1986
Collyear Committee, A Programme for the Wider Application of New and Improved
Materials and Processes (NIMP) The Report of the Collyear Committee, HMSO, 1985
Dardak, Thomas, Ed, International Directory of Company Histories, Reference Publishers,
International, 1988
Davies, Stephen and Lyons, Bruce Economics of Industrial Organisations, Longman, 1991
de Vault, Jon, Keynote Address, 40th International SAMPE Symposium, May 1995
Department of Trade and Industry, Promat; Profit through Materials Technology, Papers
and Case Studies, National Engineering Laboratory, 1987
Department of Trade and Industry, Report by the High Level Mission on Advanced
Materials Applications, Advanced. Materials: the Japanese Strategy for the 1990’s,
Department of Trade and Industry, London, 1990
Department of Trade and Industry, Rolls Royce Ltd: Investigations under section 165(a)(i)
of the Companies Act, 1948, HMSO, May 1973
Dicken, Peter, Global Shift, Harper and Row, 1986
Dodwell Marketing Consultants, Industrial Groupings in Japan, Dodwell Marketing
Consultants, Tokyo. 1993
Eccleston, Bernard, State and Society in Post War Japan, Polity Press, 1989
Economist Survey of International Banking, The Economist April 27th, 1996
Economist, Survey of the Japanese Economy, , March 6th, 1993
Economist, American Technology Policy, July 25th 1992
Economist, Survey of Capitalism, May 5th 1990
Economist, Survey of Corporate Finance, January 29th 1994
Emmott, Bill, Japan’s Global Reach, Century, 1992
Farrands, C. New Materials in Manufacturing Industry The Economist Intelligence Unit,
Special Report 2026, 1990
Fellowship of Engineering Modern Materials in Manufacturing Industry , Fellowship of
Engineering, 1983
Financial Times Survey, Aerospace, Financial Times, September 2nd, 1994
235
Financial Times Survey, World Economy and Finance, Financial Times, September 27th
1996
Financial Times, Cashing in on Composites, Financial Times, July 9 1987
Financial Times, Technology: R&D Scoreboard, Financial Times,17th June 1994
Fisher, Andrew A Key to the Pace of Recovery, The Financial Times, April 21st, 1993
Fishlock, David, The Business of Science: the Risks and Rewards of Research and
Development, Associated Business Programmes, 1975
Flight International, Military Aircraft of the World, Flight International 15-21st August 1990
Forester, Tom, Ed., The Materials Revolution, Blackwell, 1988
Freedman, Lawrence, The Case of Westland and the Bias to Europe, International Affairs,
1987
Fruin, Mark W. The Japanese Enterprise System: Competitive Strategies and Co-operative
Structures, Clarendon Press, Oxford, 1992
Gardner, Roy, Game theory for Business and Economics, John Wiley, 1995
Gerlach, Michael L., Alliance Capitalism, University of California Press, 1992
Goldsmith, Raymond, W. The Financial Development of Japan, 1986-1977, Yale
University Press, 1983
Gummett, Philip and Reppy, Judith, The Relations between Defence and Civil
Technologies, Proceedings of the NATO Advanced Research Workshop on the Relations
between Defence and Civil Technologies, 1987
Hayward, Keith, Government and British Civil Aerospace, Manchester University Press,
1983
Hirschmeier, J. and Yui, T., The Development of Japanese Business, 1600-1980, Allen and
Unwin, 1981
Hondros, E.D. and Kelly, A., Technology in the 1990s: the promise of advanced materials,
Philosophical Transactions of the Royal Society of London A322, 1987
Hounshell, David and Smith, John Kenly, Science and Corporate Strategy Cambridge
University Press, 1988
Hull, Derek, An Introduction to Composite Materials, Cambridge University Press, 1981
Imai, Kenichi and Komiya, Ryutaro, Eds., Business Entreprise in Japan, MIT, 1994
Industrial Bank of Japan, Carbon Fibres:the Rush for Higher Performance, IBJ Quarterly
Survey, no 68, 1986
Informations Chimie, Fibres de Carbone: une croissance à un chiffre jusqu’en 1994, no. 333,
November 1991

236
Iwani, Toru, Japan in the International Financial System, MacMillan Press, 1995
Japanese Government, Economic Planning Agency Economic Survey of Japan, August
1990
Johnson, Chambers, MITI and the Japanese Miracle, Stanford University Press, 1982
Johnson, Hazel, The Banking Keiretsu, Probus Publishing, 1994
Jones, Maldwyn, The Limits of Liberty, Oxford University Press, 1983
Kaldor, Mary, The Baroque Arsenal, André Deutsch, 1982
Keynote Airline Report, 10th Edition, Keynote 1994
Kodama, Fukio, Advances in New Materials are Crucial to Breakthroughs in other
Technologies, Japan Economic Journal, November 25th, 1989
L'usine Nouvelle Le Marche des Composites se Décompose 19th March 1992
Layman, Patricia, Chemical and Engineering News, June 1st, 1987
Lundvall, Bengt-Åke, National Systems of Innovation, Pinter, 1992
Malaman, Robert, Innovation in Advanced Materials: Technological Opportunities,
Innovative Processes, Effects on the Industrial Structure, Contributi Di Ricerca, Istituto per
la Ricerca Sociale, September 1988
Marion, James, J., US Industrial Outlook, August 1990
Matsui, J., Surface Properties of Carbon Fibre, Critical Reviews in Surface Chemistry,
Volume 1, Issue 2, 1990
Meetham, G.W., Ed. The Development of Gas Turbine Materials, Applied Science
Publishers, 1981
Minabe, Shigeo, Japanese Competitiveness and Japanese Management, Science, 18th July
1986
Miyashita Kenichi and Russell, David, Keiretsu, McGraw-Hill, 1994
Monks, Robert and Minows, Nell, Corporate Governance, Blackwell, 1995
Morison, Samuel Eliot, Commager, Henry and Leuchtenburg, William, A Concise
History of the American Republic, Oxford University Press, 1982
Morris-Suzuki, T, The Technological Transformation of Japan, Cambridge University
Press, 1994
Morris-Suzuki, T., A History of Japanese Economic Thought, Routledge, 1989
Mowery, D.C., Science and Technology Policy in Inderdependent Economies, Kluwer, 1994
Oden, Michael, Bischak, Greg and Evans-Klock, Chris, The Technology Reinvestment
Project: The Technical Economic and Political Limits of Dual Use Technology Policy, Work
in progress

237
Odorico, J., Evolution des Materiaux sur les Structures d’Avion Civil et d’Helicopters,
Aerospatiale, internal memorandum
OECD, Advanced Materials: Policies and Technological Challenges, OECD, Paris, 1990.
OECD, Background Report Concluding the Technology/Economy Programme, OECD, 1991
OECD, High Technology Materials, Recent Materials, STI Review, OECD December 1989
Office of Science and Technology, Cabinet Office, Final Report of the Materials Panel,
(Panel Report 10 in a series of 15), The Technology Foresight Programme London, HMSO,
1995
Okimoto, Daniel Between MITI and the Market: Japanese Industrial Policy for High
Technology, Stanford University Press, Stanford, 1989
Oshima, Keichi, Technological innovation and industrial research in Japan, Research Policy
13, 1984
Perry, William J., Annual Report to the President and the Congress, US Department of
Defense, Washington D.C., March 1996
Peters, D.M., Plastics and Rubbers & Textiles, February, 1970
Phillips, Leslie, N., Carbon fibre comes of age, Endeavour, New Series, Volume 11, No 3,
1987
Porter, Michael, Capital Choices: Changing the Way America Invests in Industry, Council
on Competitiveness, Washington D.C., 1992
Porter, Michael, Capital Disadvantaged: America’s Failing Capital Investment System,
Harvard Business Review,Vol 70, No. 5, September/October 1991
Porter, Michael, The Competitive Advantage of Nations, Macmillan, 1990
Pound, John The Rise of the Political Model of Corporate Governance and Corporate
Control, New York University Law Review, Vol. 68:1001, November 1993
Prevezer, Martha and Ricketts, Martin, eds, Capital Markets and Corporate Governance,
University of Oxford Press, Oxford, 1994
Regan, Edward, Corporate Governance and Financial Markets, Report to the
Competitiveness Policy Council, Washington D.C., March 1993
Reisch, Marc, Demand for carbon Fibre Rebounds Despite Continued Aerospace Slump,
Chemical and Engineering News, November 28th 1994
Reppy, Judith Technology Flows Between the Military and Civilian Sectors: Theory and
Evidence, prepared for the Panel “Defense Spending as Technology Policy for the US”
American Association for the Advancement of Science, January 1989.

238
Reppy, Judith, Dual Use Technology: back to the future. Paper presented to the Council on
Foreign Relations Study Group on Consolidation, Downsizing and Conversion in the US
Military Industrial Base, March 1996
Roberts, John, B., Mitsui, three centuries of Japanese business, Weatherhill, 1973
Roe, Mark J., The Differences in Corporate Structure in Germany, Japan and the United
States, Yale law Journal, Vol. 102:1927. 1993
Rollet, Pierrick, Le Marche Japonais de la Fibre de Carbone , a report by the French
Embassy, Tokyo, May 1991
Roskill, The Economics of Carbon Fibre, Roskill Information Services, January 1990
Roskill, Carbon Fibre Market Update, Analysis and Outlook, Roskill Information Sevices,
1994
Samuels, Richard, J., “Rich Nation, Strong Army” National Security and the Technological
Transformation of Japan, Cornell University Press, 1994
Sigurdson, J and Anderson, Alun M., Science and Technology in Japan, Longman, 1991
SIPRI Yearbook, 1996, Armaments, Disarmament and International Security, SIPRI, 1996
SIPRI Yearbook, 1993: World Armaments and Disarmament, SIPRI, Oxford University
Press, 1993
SIPRI Yearbook, 1995, Armaments, Disarmament and International Security, SIPRI, 1995
Steinburg, Morris, A., Materials for Aerospace Scientific American, September 1986
Tatewaki, Kazuo. Banking and Finance in Japan: an introduction to the Tokyo market,
Routledge, 1991
Taylor, Harold, A. Graphite, Bureau of Mines, US Department of the Interior, 1988-1994
Technology Reinvestment Project Annual 1995
Technology Reinvestment Project Booklet, 1993
The European Aerospace Industry Trading Position and Figures, 1996, May 1996,
European commission, DGIII
The Select Committee on Science and Technology, Report of the Select Committee on
Science and Technology, Session 1968-69, Carbon Fibres , 20th February 1969
The Society of British Aerospace Companies, Materials Development in the Aerospace
Sector, A Report Prepared for the Materials and Structures Research Sub-Committee, 1991
Tsuru, Shigeto Japan’s Capitalism: Creative Defeat and Beyond, Cambridge University
Press, Cambridge, 1993
Turner, W.N., Johnson, J.W., and Hannah, C.G., Composite Materials in Development of
Gas Turbine Materials, Meetham, Ed, Applied Science Publishers, 1981

239
US Department of Commerce, A Competitive Assessment of Selected Reinforced
Composite Fibers US Department of Commerce, Washington, D.C., 1985
US Department of Commerce, International Co-operation and Competition in Materials
Science and Engineering, US Department of Commerce, June 1989
US Department of Defense, Advanced Materials Technology and Industrial Base: An
Analysis and Assessment of Speciality Metals and Advanced Composites, January, 1996
US House of Representatives, Testimony of J. Michael Bowman before the Committee on
Science, Space and Technology, US House of Representatives, March 10th, 1994
US Office of Technology Assessment, Advanced Materials By Design, Washington, D.C.,
1988
US Office of Technology Assessment, New Structural Materials Technologies: a Technical
Memoramdum, US Office of Technology Assessment, Washington, D.C., 1986
Whitley, Richard, European Business Systems: Firms and Markets in their National
Contexts, Sage Publications, 1992
Whitley, Richard, Business Systems in East Asia, Sage Publications, London, 1992
Wilks, S. and Wright, M., Eds, The Promotion and Regulation of Industry in Japan
MacMillan, 1991
Wilks, S. and Wright, M., Eds, Comparative Government and Industry Relatins: Western
Europe, United States and Japan, Clarendon Press, 1987
Woods, Christopher, The Bubble Economy, Sidgwick and Jackson, London, 1992
Yoshimura, Seiichiro, Rapid Changes in Japan’s Carbon Fiber Industry, Mitsui Trade News,
October 1985