The Case of Administrative Trade Data from the Philippines
15
Harnessing Big Data for Public Policy: The Case of Administrative Trade Data from the Philippines Annette O. Pelkmans-Balaoing, Karl Jandoc, Adrian R. Mendoza 14 th National Convention on Statistics October 3, 2019 Abstract This paper provides an overview of the long panel of merged trade transactions and establishment surveys built by the Philippine Statistics Authority (PSA) under the Escaping the Middle Income Trap (EMIT) Research Programme. Several empirical examples are shown to illustrate the potential applications of this rich firm-level data in economic research and policy analysis. Some recommendations are also presented for future updating and merging of this dataset with other public administrative records. Introduction Big data is increasingly used as a key input to decision-making processes in both private and public organizations. With the advent of modern technology, large amounts of information in various forms and frequencies are being collected from multiple sources to gather useful facts on demand trends, consumer satisfaction, logistics and supply chain constraints, market opportunities, and possible strategic actions. For businesses, strategies to improve product design and service delivery benefit from the digital trails in mobile applications, search engines, and social media platforms that provide insights on their target clients’ profiles, interests, and preferences. Real-time feedbacks and reviews shared on Facebook, popular posts on Instagram, and trending emojis and hashtags used on Twitter have also become ingenious sources of data on consumer behavior, public sentiments, and social interactions. Using powerful computer algorithms, this gold-mine of information is processed and analyzed to come up with well-targeted business solutions that can ultimately improve profitability and competitiveness. This means that more data lead to more opportunities for companies to assess their current performance and recalibrate their medium- and long-term business strategies. Figure 1. Importance of big data in the private sector
-
Upload
khangminh22 -
Category
Documents
-
view
0 -
download
0
Transcript of The Case of Administrative Trade Data from the Philippines

Harnessing Big Data for Public Policy: The Case of Administrative Trade Data from the Philippines
Annette O. Pelkmans-Balaoing, Karl Jandoc, Adrian R. Mendoza
14th National Convention on Statistics
October 3, 2019
Abstract
This paper provides an overview of the long panel of merged trade transactions and establishment surveys built by the Philippine Statistics Authority (PSA) under the Escaping the Middle Income Trap (EMIT) Research Programme. Several empirical examples are shown to illustrate the potential applications of this rich firm-level data in economic research and policy analysis. Some recommendations are also presented for future updating and merging of this dataset with other public administrative records.
Introduction
Big data is increasingly used as a key input to decision-making processes in both private and public organizations. With the advent of modern technology, large amounts of information in various forms and frequencies are being collected from multiple sources to gather useful facts on demand trends, consumer satisfaction, logistics and supply chain constraints, market opportunities, and possible strategic actions. For businesses, strategies to improve product design and service delivery benefit from the digital trails in mobile applications, search engines, and social media platforms that provide insights on their target clients’ profiles, interests, and preferences. Real-time feedbacks and reviews shared on Facebook, popular posts on Instagram, and trending emojis and hashtags used on Twitter have also become ingenious sources of data on consumer behavior, public sentiments, and social interactions. Using powerful computer algorithms, this gold-mine of information is processed and analyzed to come up with well-targeted business solutions that can ultimately improve profitability and competitiveness. This means that more data lead to more opportunities for companies to assess their current performance and recalibrate their medium- and long-term business strategies.
Figure 1. Importance of big data in the private sector

As illustrated in Figure 1, big data has become a top priority in terms of technology spending of establishments in various industries surveyed by Accenture in 2014.1 In fact, around 73 percent of the surveyed companies report that they have invested at least 20 percent of their overall technology budget on big data analytics (Accenture and GE, 2014). For these establishments, the uses of big data range from simple monitoring of internal operations, collection of data to gain insights for more informed decision making, and consolidation and analysis of data from various sources to be able to identify operational issues, optimize efficiency, and generate useful forecasts to inform business decisions. Notable examples include the widespread practice among airline companies and healthcare providers where detailed information on profiles and online behavior are fed into big data models to design customized and efficient service delivery.
The successful integration of big data analytics into strategic business planning provides important lessons and best practices that governments may adopt in designing responsive and effective public programs and policies. The World Bank (2017) identifies three major areas where there are vast opportunities for big data to revolutionize governments. First, big data analytics can be used to evaluate and enhance the quality and targeting of existing public services. In Shanghai for instance, sensors were installed along the city’s waterpipe network that allow authorities to easily identify the exact locations where there are leaks, infrastructure damages, and service disruptions. Emerging demands for additional public goods may also be detected using big data models. India and Kenya, GIS and mapping techniques are used to identify areas that lack access to electricity and educational resources, respectively (World Bank, 2017). Second, governments may use big data platforms such as social networking websites to learn about public sentiments and encourage civic participation in pressing policy and social debates. Similar to the experience of private companies, feedbacks, reactions, opinions, and suggestions posted online may serve as valuable inputs in measuring the impact of new policies or the desirability and usefulness of new projects. For example, questions on the effectiveness of a new tax system or new traffic rule and what the general public thinks about it can be easily answered using algorithms specifically designed for collect, process, and analyze relevant online activities. Lastly, and as a result of the first two, big data should usher a new era of smart and fact-based policy-making. Instead of relying solely on outdated information, higher-frequency and granular data collected using modern methods (e.g., machine learning and satellite imaging) should be increasingly used to compliment official statistics to better inform present and future policies.
Although big data is often associated with large, complex, and unstructured “found” data2 from the internet (e.g., Google searches and web browsing history, social media posts, and online commercial transactions), other large-scale found data can also be generated from records of various transactions in banks, supermarkets, hospitals, schools, trains, ports, and government offices, among others. Given the legally-sanctioned nature of their collection and storage, public administrative records may be regarded as a special class of big data that governments have direct control and ready access to. More formally, Hand (2018) describes public administrative data using the following OECD criteria:
a. The subject of the data and the agent that provides the data to the statistical authority are often different.
b. the purpose of the data collection was originally non‐statistical; c. data collection usually aims for a complete coverage of the target population; and
1 The respondents were from businesses operating China, France, Germany, India, South Africa, the UK and the United States. 2 In contrast to “made” data such as experiment and survey results, found data are usually a large and complex set information that are not primarily collected or generated for statistical purposes (Connelly et al., 2016).

d. the administrative unit controls the methods by which the data are collected and processed.
Examples of administrative data normally collected by government are tax records, SEC and business registries, and health and school records. These administrative type of information provide enormous and semi-systematic data based on sample sizes much larger than surveys (Connelly et al., 2016). In some cases, administrative data cover the entire population (i.e., n=all), allowing the collection of information on relatively less important groups or observations that would normally be excluded in social and economic surveys. This offers the unique advantage of performing aggregate analyses based on complete knowledge of the population and customizing policy narratives using very specific data. Rather than designing interventions based on the attributes of the “average” individual, comprehensive administrative data may be used to formulate tailor-made policies using knowledge on the heterogeneous characteristics and behavior of the individual observations. Administrative records collected over time may also be assembled into panel data that are useful in performing cohort and longitudinal analyses (e.g., Picot and Piraino (2012); Chetty et al. (2014)). There are also recent efforts to link information across multiple administrative and survey sources to produce richer and more detailed datasets.
However, the volume and relatively messy structure of administrative records (versus statistical surveys) also pose certain challenges for data users. For example, every question in official surveys has a particular statistical or research purpose while raw data from administrative records may less relevant. This requires further processing of administrative data in order to derive useful and meaningful indicators (Hand, 2018). Against this background, it is interesting to ask: How do we re-arrange or repurpose the information according to a particular analytical framework? What research and policy questions can be answered using the data? How do we process and analyze these data? Does it require novel statistical and computing methods? What potential quality issues may arise from using administrative data given that these are primarily collected by a non-statistical agency?
This paper explores the potential use of public administrative data as valuable inputs to decision-making processes in policy circles. In particular, we illustrate the case of big data developed from the universe of firm-level trade transactions in the Philippines from 1991 to 2012. We provide recently-concluded and ongoing studies that used this big dataset to develop new stylized facts that can inform trade and industrial policy. We also discuss some recommendations to improve the quality, coverage, and usefulness of this data moving forward.
The Long Panel of Trade Transactions Data from the Philippines
In the Philippines, a joint government and academic initiative, begun in 2013, produced a new and rich database that opens numerous possibilities to explore the dynamics of the economy at the most disaggregated level of the firm. The Philippine Statistics Authority (PSA), together with a consortium between the University of the Philippines and Erasmus University Rotterdam, undertook an extensive effort to match the universe of trade transactions of all Philippine firms from 1991 to 2012 with the Surveys of Establishments from 1996 till 2012. This makes the Philippine database one of the longest transactions database available. Panel data of this kind is especially rare in the developing world. It is also lengthy enough to cover the critical periods of the 1997 Asian financial crisis, the dotcom crisis of 2001, the global financial crisis of 2007, as well as the major events of ASEAN regional integration.
The database consists of the universe of the exports and imports of all Philippine firms over the period 1991 to 2012. Generated from administrative customs data, each transaction reports the product code, FOB value in US dollars, insurance and freight costs, and country of destination or origin. This is matched by the PSA with the firm surveys using firm identifier codes. The exercise is made difficult by the fact that the same firm is assigned different codes
in the customs data (7-digit IMP code) and in the firm survey data (12-digit-2-letter establishment code number or ECN). This entails linking firms through the firm name, address, or tax information number codes. For firms whose codes have changed over time, a common code is assigned so as to capture the historical trend for each firm. Integrating the transactions data is further hindered by the changing product classifications employed across the years. Trade data from 1991 to 2005 is based on the 7-digit Philippine Standard Commodity Classification (PSCC), which is harmonized with the 5-digit Standard International Trade Classification Revision. From 2006 onwards, the shift was made to the 10-digit PSCC (harmonized to the ASEAN Harmonized Tariff Nomenclature or AHTN), and this was then concorded to the 7-digit PSCC in the database. Analysis made using this database therefore provides the most disaggregated enquiry possible.
Table 1 provides some basic descriptions of the trade data. Throughout the 21-year period, a total of 65,115 (respectively 92,288) firms were reported to have exported (respectively imported).
Table 1. Basic description of trade data
Source: Author’s calculation based on data from the PSA
Additional firm information such as size, ownership, revenue, and cost structure is obtained by matching the firm survey data comprising nine Annual Survey of Establishments in 1996 (combined survey with 1997), 1998, 2001, 2003, 2005, 2008, 2009, 2010, and three rounds of the Census of Philippine Business and Industry in 2000, 2006, and 2012. Large firms with 200 or more employees (and from 2008 onwards, large firms with more than 100 employees) are in the certainty stratum, while the rest are sampled. Almost a third of all observations were generated in 1999-2000 census years.
In the next section, we summarize some recent and ongoing research activities that applied this long panel of trade transactions to generate new stylized facts and insights that have potential applications in policy making.

Applications of the Long Panel of Trade Transactions in Research and Policy Analysis
This section illustrates some uses of the long panel of firm-level trade transactions for research as well as for policy. It provides a more rigorous empirical support to known stylized facts and introduces new findings on the state of Philippine trade and manufacturing. New firm typologies are developed, as the behavior of every single exporting and importing firm could now be traced, not only in terms of the usual entry, exit, and survival, but also in terms of re-entry, permanent exit, and continuous or resilient survival.
A. Pelkmans-Balaoing (2017): Birth, death, survival, and re-entry of firms in export markets
Firm survival, or the duration of time of continued exporting by a firm, is not completely observable because of the time limitation of existing data. To preserve all the information contained in the PSA database, this paper employs an alternative method of tracking the behavior of every single exporting firm from 1991-2012, developing an algorithm programmed in Stata in order to sift through the various firm types according to their entry, survival, and exit patterns. Although the problem of right- and left- data censoring cannot be fully resolved, particularly in the estimation of permanent exit (i.e. this will be over-estimated for firms at the latter period of the data) or new entry (which will be over-estimated at the initial periods), the 22-year stretch of the data nevertheless provides a reasonable measure of relative entry, exit, and survival rates.
Given the long series and wealth of information contained in the PSA database, various typologies of firms can be identified. In this section, we track distinct types of entrants, survivors and exiters, using the following definitions:
a. New entrants: firms present in 𝑡 + 1, but not in 𝑡;
b. One-time entrants: entered in 𝑡, but permanently exited in 𝑡 + 1; c. Re-entrants: entered in 𝑡, but already previously entered and exited;
d. Surviving first entrants: new entrants in 𝑡, surviving in 𝑡 + 1; e. Permanent exiters: exited in 𝑡 , and did not re-enter till end of data series; f. Permanent exiters-plus: permanent exiters with three or more survival spells (years);
and g. Resilient exporters: new entrant in 𝑡 that survived till end of data series.
Table 2. Firm demographics of Philippine exporters, 1991-2012
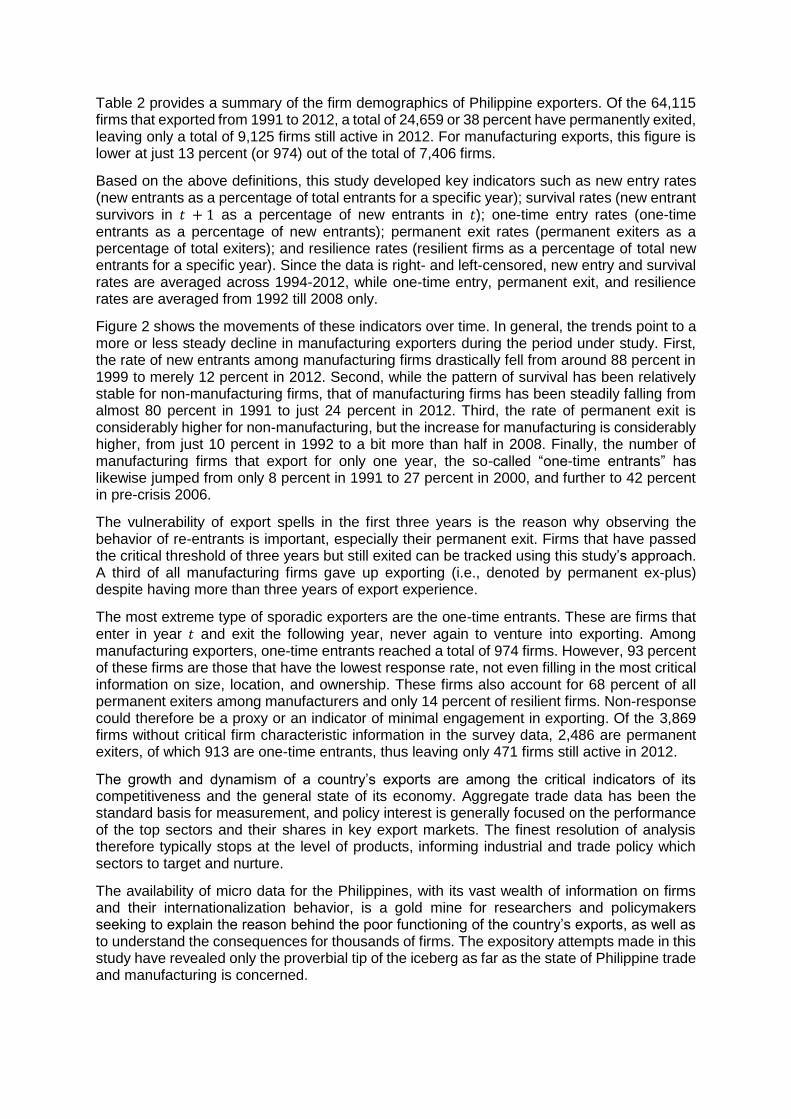
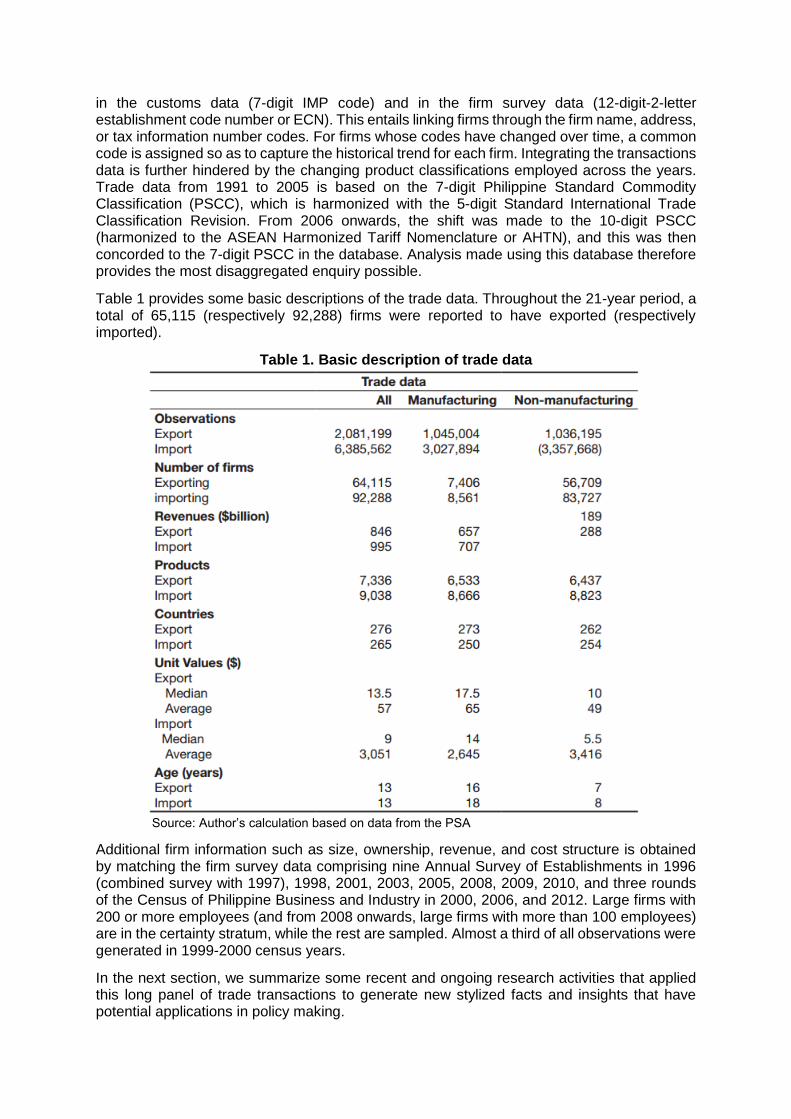
Table 2 provides a summary of the firm demographics of Philippine exporters. Of the 64,115 firms that exported from 1991 to 2012, a total of 24,659 or 38 percent have permanently exited, leaving only a total of 9,125 firms still active in 2012. For manufacturing exports, this figure is lower at just 13 percent (or 974) out of the total of 7,406 firms.
Based on the above definitions, this study developed key indicators such as new entry rates (new entrants as a percentage of total entrants for a specific year); survival rates (new entrant survivors in 𝑡 + 1 as a percentage of new entrants in 𝑡); one-time entry rates (one-time entrants as a percentage of new entrants); permanent exit rates (permanent exiters as a percentage of total exiters); and resilience rates (resilient firms as a percentage of total new entrants for a specific year). Since the data is right- and left-censored, new entry and survival rates are averaged across 1994-2012, while one-time entry, permanent exit, and resilience rates are averaged from 1992 till 2008 only.
Figure 2 shows the movements of these indicators over time. In general, the trends point to a more or less steady decline in manufacturing exporters during the period under study. First, the rate of new entrants among manufacturing firms drastically fell from around 88 percent in 1999 to merely 12 percent in 2012. Second, while the pattern of survival has been relatively stable for non-manufacturing firms, that of manufacturing firms has been steadily falling from almost 80 percent in 1991 to just 24 percent in 2012. Third, the rate of permanent exit is considerably higher for non-manufacturing, but the increase for manufacturing is considerably higher, from just 10 percent in 1992 to a bit more than half in 2008. Finally, the number of manufacturing firms that export for only one year, the so-called “one-time entrants” has likewise jumped from only 8 percent in 1991 to 27 percent in 2000, and further to 42 percent in pre-crisis 2006.
The vulnerability of export spells in the first three years is the reason why observing the behavior of re-entrants is important, especially their permanent exit. Firms that have passed the critical threshold of three years but still exited can be tracked using this study’s approach. A third of all manufacturing firms gave up exporting (i.e., denoted by permanent ex-plus) despite having more than three years of export experience.
The most extreme type of sporadic exporters are the one-time entrants. These are firms that enter in year 𝑡 and exit the following year, never again to venture into exporting. Among manufacturing exporters, one-time entrants reached a total of 974 firms. However, 93 percent of these firms are those that have the lowest response rate, not even filling in the most critical information on size, location, and ownership. These firms also account for 68 percent of all permanent exiters among manufacturers and only 14 percent of resilient firms. Non-response could therefore be a proxy or an indicator of minimal engagement in exporting. Of the 3,869 firms without critical firm characteristic information in the survey data, 2,486 are permanent exiters, of which 913 are one-time entrants, thus leaving only 471 firms still active in 2012.
The growth and dynamism of a country’s exports are among the critical indicators of its competitiveness and the general state of its economy. Aggregate trade data has been the standard basis for measurement, and policy interest is generally focused on the performance of the top sectors and their shares in key export markets. The finest resolution of analysis therefore typically stops at the level of products, informing industrial and trade policy which sectors to target and nurture.
The availability of micro data for the Philippines, with its vast wealth of information on firms and their internationalization behavior, is a gold mine for researchers and policymakers seeking to explain the reason behind the poor functioning of the country’s exports, as well as to understand the consequences for thousands of firms. The expository attempts made in this study have revealed only the proverbial tip of the iceberg as far as the state of Philippine trade and manufacturing is concerned.

Figure 2. Rates of new entry, survival, one-time entry, permanent exit and resilience, 1991-2012
The new Philippine database stimulates a rich agenda for academic and policy-oriented research. For instance, one can exploit the new typology of firms to further dissect the constraints and opportunities specific to different types of firms. The vast survey resources of government, for instance, can be put to the task of tracking one-time entrant firms, or even more important, firms that have permanently exited after initially experiencing success in entering new export markets. Since entrepreneurial capital is scarce in developing countries like the Philippines, it is crucial to understand how these types of firms can be sustained and prevented from losing the knowledge and skills built after years of exporting. The characteristics of resilient firms are likewise important to uncover in order to recognize the possible factors of success in keeping one’s competitiveness in highly demanding foreign markets.
B. Mendoza (2019): Participation of Philippine Manufacturers in Global Value Chains
The lack of consensus on how to identify GVC firms in the literature is manifested in the varying definitions used in existing studies. For instance, Veugelers, Barbiero, and Blanga-Gubbay (2013) implemented an elaborate two-stage identification process using the EFIGE dataset. First, firms whose total trade transaction, both absolute and relative to revenues, is above the 25th percentile in their sector are tagged as internationally-active establishments. These firms are then grouped based on the number of their foreign activities, i.e., any combination of exporting, importing, and foreign production through FDIs. The EBRD (2014) simply defined GVC participation based on two-way trade, i.e., firms that import at least 10 percent of their

inputs and export at least 10 percent of their output. Baldwin and Yan (2017) used a more inclusive approach by not imposing lower bounds on a firm’s imports of intermediate goods and exports of intermediate and final goods. Further, they argued that the exclusion of one-way traders increases the likelihood that producers classified as GVC firms perform specialized functions along the chain, rather than just a wholesaling role. Recent studies such as by Rigo (2017) also adopted this broad two-way trade definition while Manova and Yu (2016) further classified two-way traders in China based on different modes of operation (i.e., ordinary trade, processing trade, and assembly with import). Further, producers that only export intermediate goods or have “stable and significant relationships with a foreign firm” are also additionally classified by Brancati, Brancati, and Maresca (2017) as GVC participants.
The general sense emerging from these definitions is that GVC operations necessarily involve coordinated trade transactions that mostly take place within an established cross-border network of producers. Against this background, this study describes GVC operation as the production of a final good (or service) through fragmented stages performed by firms that are spatially-dispersed but connected by complementary backward and forward trade linkages.
Accordingly, producers involved in this process are referred to as GVC firms. This study proposes a simpler but more comprehensive way of identifying manufacturing firms based on nature of their trade transactions. More formally, firms are classified as Type 1 when they have purely domestic operations. Type 2 establishments import but not export; In contrast, Type 3 manufacturers export but not import. Type 4 firms are simultaneous exporters and importers located outside special economic areas3 while Type 5 manufacturers are two-way traders operating near or inside economic zones. Although almost all domestic manufacturers may be remotely connected to GVCs, the broad scope of international transactions captures many possible arrangements that may or may not be GVC-related. In this regard, we hypothesize that the ordering of firm types according to this typology broadly corresponds to the likelihood of each group’s GVC integration. This suggests that partially internationalized manufacturers (i.e., Types 2 and 3) have relatively weaker GVC linkages compared to the subset of firms that both export and import (i.e., Types 4 and 5). Accordingly, this study argues that the “true” participants in globally-fragmented production are most likely involved in Types 4 and 5 transactions. The emphasis on two-way trade as the key identifier of more intensive GVC participation follows directly from the concept of backward and forward linkages in the inter-country input-output literature. Given that production networks are designed to link the activities of geographically distant manufacturers, it is not unusual for a typical GVC supplier to produce and subsequently export final or semi-processed goods that embody many imported components.4 In the strictest sense, we can say that Type 5 establishments may be the “archetypal GVC firms” since producers located in SEZs normally import in order to export; that is, they mainly use imported materials to perform a particular stage of production then re-export the semi-finished output for further processing in a different country. Manufacturers in economic zones are also usually operating within production networks organized by large multinationals. In many cases, domestic suppliers use foreign inputs in compliance with the requirements of their multinational clients.
To operationalize this proposed typology, we utilize firm-level information on export revenues, import costs, and location. In particular, the SEZ indicator is developed from the PEZA’s list of manufacturing and agro-industrial economic zones as of July 2016.5 In terms of exports and
3 We include the SEZ criterion since many industrial parks are actually created to attract investments from multinationals and other export-oriented enterprises. We also broadened the scope to include the vicinity of SEZs to capture the possible agglomeration or clustering effect of industrial parks. 4 This closely resembles Hummels, Ishii, and Yi’s (2001) definition of vertical specialization based on three criteria: 1) the goods are produced through a sequence of multiple stages; 2) value adding along the production sequence takes place in two or more countries; and 3) at least one country must import inputs and export some of the resulting output. 5 For simplicity, the coverage of the PEZA list is assumed invariant throughout the sample, although we recognize that economic zones are actually established in different years. This is necessary to make
imports, we restrict our analysis to non-oil trade transactions (i.e., excluding PSCC 2004 divisions 32 to 34) to make sure that the goods being traded are used as actual components of the final products. We focus our GVC analysis on manufacturers (i.e., PSIC 2009 divisions 10 to 32) to make sure that the import transactions most probably involve raw materials, parts, and components instead of goods ready for resale in the domestic market. A major advantage of this study is that our GVC definition is derived from the actual trade transactions of firms based on customs data compiled by the PSA from 1991 to 2012. Nevertheless, we also considered the direct and indirect exports reported in various Annual Establishment Surveys and Censuses of Philippine Business and Industry conducted between 1996 and 2012 as supplemental identifiers of trading activities. Table 3 provides some examples of the common manufacturing activities in each firm type.
Table 3. Examples of Common Activities in Different Firm Types
Type 1
Manufacturer of locally-sold banana and cassava chips, manufacturer of purified tube ice, manufacturer of locally-sold fruit preserves and candies (e.g., mango, pineapple, and durian), manufacturer of locally-sold fruit and alcoholic beverages (e.g., calamansi juice and tubâ)
Type 2 Manufacturer of animal feeds, manufacturer of fertilizers, flour miller that sells to local bakeshops, manufacturer of locally-sold plastic kitchen wares, manufacturer of LPG, manufacturer of locally-sold plywood that used imported materials
Type 3 Exporter of coconut-based products, exporter of dried mangoes, exporter of processed seafood, exporter of semi-processed ores; export of rattan-based furniture
Type 4 Exporter of branded breads and snacks that used imported flour, exporter of garments and apparel that used imported textile, exporter of furniture that used imported wood and paint
Type 5
Manufacturer of printed circuit boards, manufacturer of wire harnesses, manufacturer of metal parts for electronics assembly, manufacturer of camera parts and components, manufacturer of hard disk drive, manufacturer of semiconductors
Sources: ASPBI and CPBI (various years)
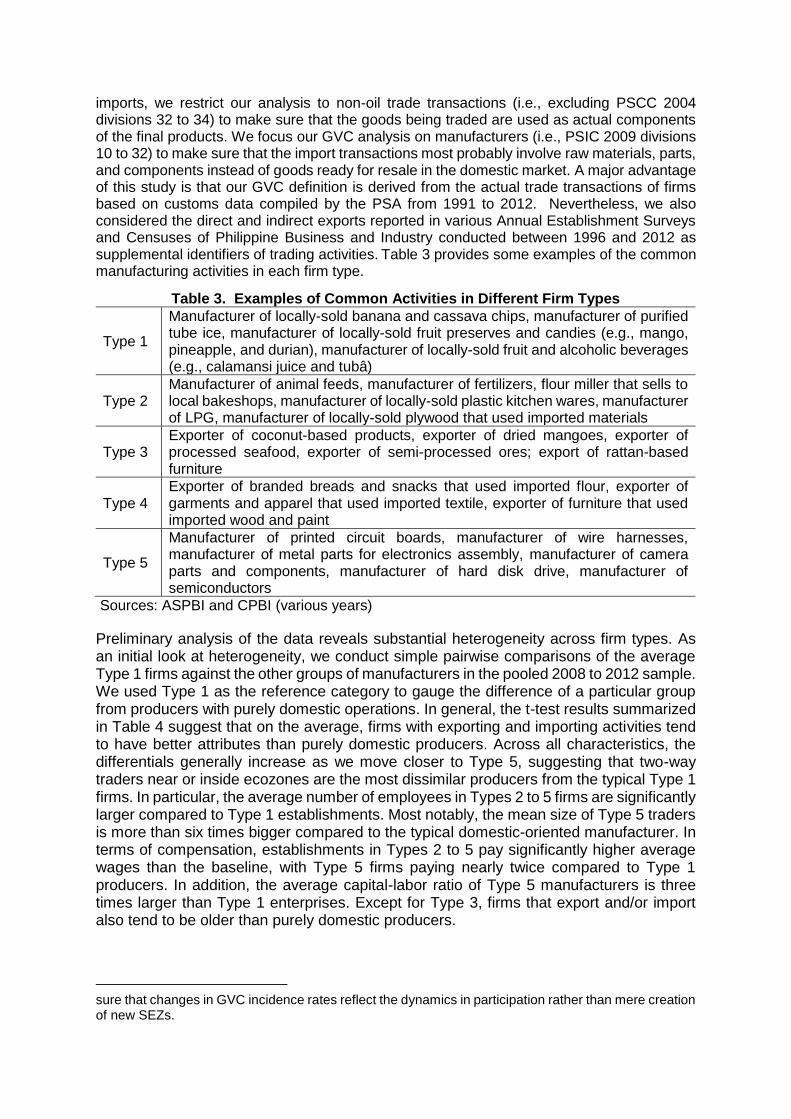
Preliminary analysis of the data reveals substantial heterogeneity across firm types. As an initial look at heterogeneity, we conduct simple pairwise comparisons of the average Type 1 firms against the other groups of manufacturers in the pooled 2008 to 2012 sample. We used Type 1 as the reference category to gauge the difference of a particular group from producers with purely domestic operations. In general, the t-test results summarized in Table 4 suggest that on the average, firms with exporting and importing activities tend to have better attributes than purely domestic producers. Across all characteristics, the differentials generally increase as we move closer to Type 5, suggesting that two-way traders near or inside ecozones are the most dissimilar producers from the typical Type 1 firms. In particular, the average number of employees in Types 2 to 5 firms are significantly larger compared to Type 1 establishments. Most notably, the mean size of Type 5 traders is more than six times bigger compared to the typical domestic-oriented manufacturer. In terms of compensation, establishments in Types 2 to 5 pay significantly higher average wages than the baseline, with Type 5 firms paying nearly twice compared to Type 1 producers. In addition, the average capital-labor ratio of Type 5 manufacturers is three times larger than Type 1 enterprises. Except for Type 3, firms that export and/or import also tend to be older than purely domestic producers.
sure that changes in GVC incidence rates reflect the dynamics in participation rather than mere creation of new SEZs.

Table 4. Test of Equality of Means: Type 1 vs. Types 2 to 5 Firms Characteristic Unit Type 1 Type 2 Type 3 Type 4 Type 5
Age (as of 2012) Years 16.71 26.80*** 16.38 27.11*** 18.21*** (-11.91) (0.51) (-11.47) (-2.38)
Employees Persons 72.85 112.84*** 235.17*** 253.16*** 484.20*** (-5.96) (-17.18) (-20.90) (-35.98) Wage ‘000/Person 66.80 94.97*** 90.87*** 124.36*** 131.67***
(-7.89) (-7.21) (-13.10) (-19.57) Capital-Labor Ratio ‘000/Person 254.17 367.66*** 389.56*** 489.66*** 780.98***
(-3.26) (-4.07) (-5.65) (-5.65) Revenues Million 108.09 215.60*** 591.95*** 1,164.90*** 1,232.49***
(-4.67) (-8.85) (-12.06) (-19.55) Labor Productivity ‘000/Person 373.56 542.80*** 1009.07*** 1055.26*** 1055.02***
(-4.91) (-4.61) (-12.77) (-17.87) TFP ln 4.99 5.31*** 5.30*** 5.48*** 5.56*** (-22.83) (-23.17) (-30.19) (-46.82)
Source: Author’s calculation based on data from the PSA *p<0.10, **p<0.05, *** p<0.01 Notes: All monetary amounts are in pesos and expressed in constant 2000 prices using the GDP deflator. Total factor productivity is estimated using the approach of Levinsohn and Petrin (2003). See Appendix 4.1. The null hypothesis for the left-tailed t-test is that the mean values for a particular firm type are greater than or equal to the mean values for the baseline category (i.e., Type 1). The figures in parentheses are t-statistics.
Indicators of firm performance and productivity also point to the superiority of firms with foreign transactions. For instance, the average revenues of Type 5 firms are 11.4 times bigger compared to domestic-oriented producers. In terms of TFP and labor productivity, we also observe statistically significant margins between Type 1 and Types 2 to 5 firms. In general, the picture emerging from the above findings is that GVC-oriented firms (i.e., Types 4 and 5) typically outperform domestic-oriented producers (i.e., Type 1) along many important dimensions. In addition, compared to Types 2 and 3 firms that are only partially internationalized, two-way traders perform better in key attributes such as size, capital intensity, revenues, and productivity. As noted by Vuegelers, Barbiero, and Blanga-Gubbay (2013), the advantage of GVC-integrated suppliers is not only rooted in their size or technological intensity but are also connected to the complex nature of their value chain participation. Therefore, firms engaged in GVC trade must have necessarily acquired the good qualities needed to perform elaborate backward and forward transactions in cross-border production networks.
In Figure 3, we plot the empirical cumulative distributions (ECDs) of important attributes where different firm types potentially vary. The graphs consistently show that the various firm categories systematically diverge across all characteristics, where firms with foreign transactions always lie to the right of Type 1 producers. This lends further support to the view that international activities, whether exporting or importing or both, often involve huge entry costs that only superior manufacturers can afford to pay (Seker, 2012; Kasahara and Lapham, 2013). This also suggests that between being connected to GVCs and not, the probability of the former is higher when we are looking at a big and extremely productive firm chosen at random. Another interesting pattern is that the ECDs of Types 2 and 3 firms often cross, suggesting that the stochastic ordering may not be conclusive for these groups. Further, Figure 4.1 also shows that Type 4 and 5 firms are normally ranked higher than other groups in all characteristics included in the analysis. This confirms that two-way traders are usually more prevalent in portions of the distribution associated with superior attributes. These findings are comparable with the results of related studies (e.g., Bernard, Jensen, and Schott (2009); Vogel and Wagner (2010); and Seker (2012)) showing that two-way traders have superior performance than firms that only import or only export.
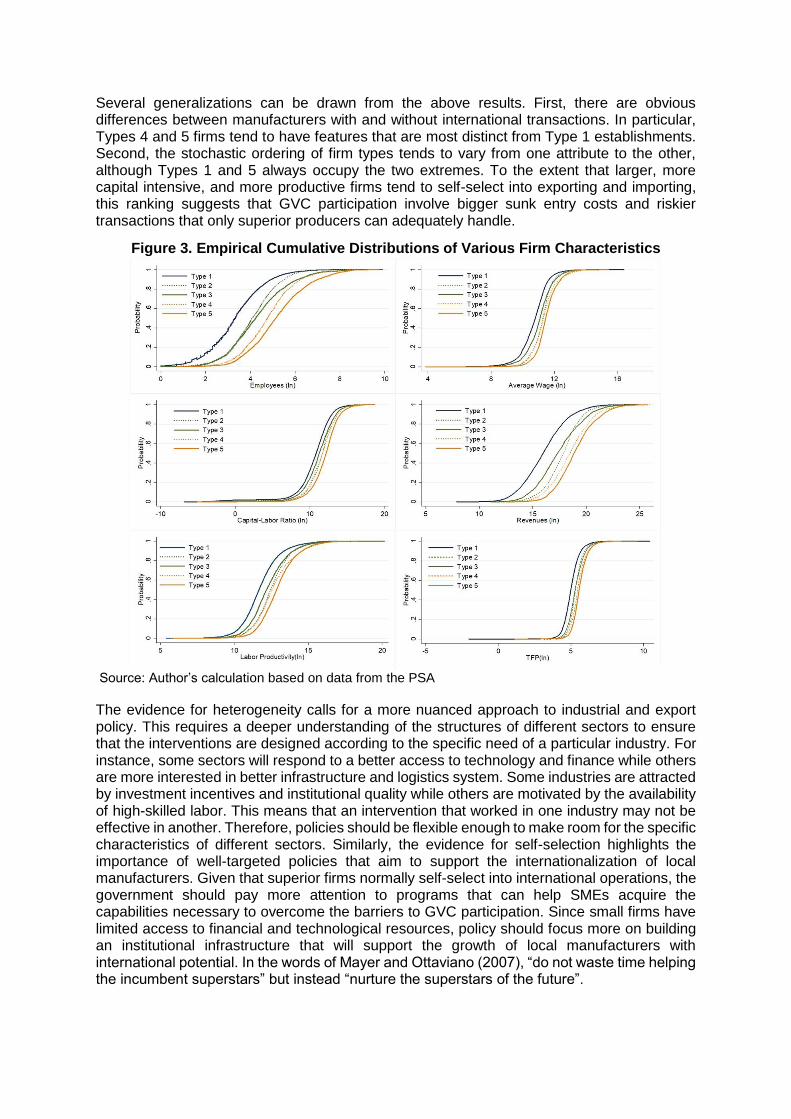
Several generalizations can be drawn from the above results. First, there are obvious differences between manufacturers with and without international transactions. In particular, Types 4 and 5 firms tend to have features that are most distinct from Type 1 establishments. Second, the stochastic ordering of firm types tends to vary from one attribute to the other, although Types 1 and 5 always occupy the two extremes. To the extent that larger, more capital intensive, and more productive firms tend to self-select into exporting and importing, this ranking suggests that GVC participation involve bigger sunk entry costs and riskier transactions that only superior producers can adequately handle.
Figure 3. Empirical Cumulative Distributions of Various Firm Characteristics
Source: Author’s calculation based on data from the PSA
The evidence for heterogeneity calls for a more nuanced approach to industrial and export policy. This requires a deeper understanding of the structures of different sectors to ensure that the interventions are designed according to the specific need of a particular industry. For instance, some sectors will respond to a better access to technology and finance while others are more interested in better infrastructure and logistics system. Some industries are attracted by investment incentives and institutional quality while others are motivated by the availability of high-skilled labor. This means that an intervention that worked in one industry may not be effective in another. Therefore, policies should be flexible enough to make room for the specific characteristics of different sectors. Similarly, the evidence for self-selection highlights the importance of well-targeted policies that aim to support the internationalization of local manufacturers. Given that superior firms normally self-select into international operations, the government should pay more attention to programs that can help SMEs acquire the capabilities necessary to overcome the barriers to GVC participation. Since small firms have limited access to financial and technological resources, policy should focus more on building an institutional infrastructure that will support the growth of local manufacturers with international potential. In the words of Mayer and Ottaviano (2007), “do not waste time helping the incumbent superstars” but instead “nurture the superstars of the future”.
C. Analysis of the Automotive Sector
One advantage that the merged transactions-firm survey dataset affords us is that we are able to zoom into more disaggregated industry and/or commodity classifications and examine features of the firms within those industries. We are then able to examine trends and track specific firm-level information that can only be made possible by the longitudinal nature of our dataset. In this section, we examine the specific case of the automotive sector to illustrate the value of our unique dataset especially to public policy.
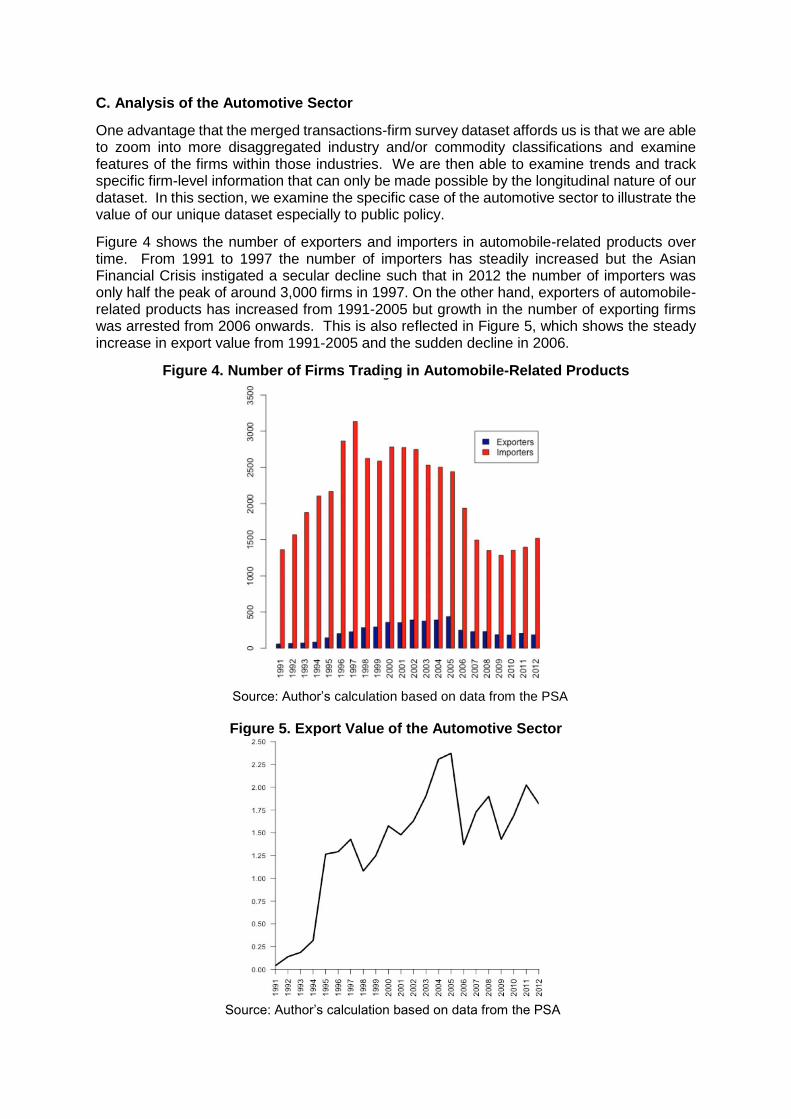
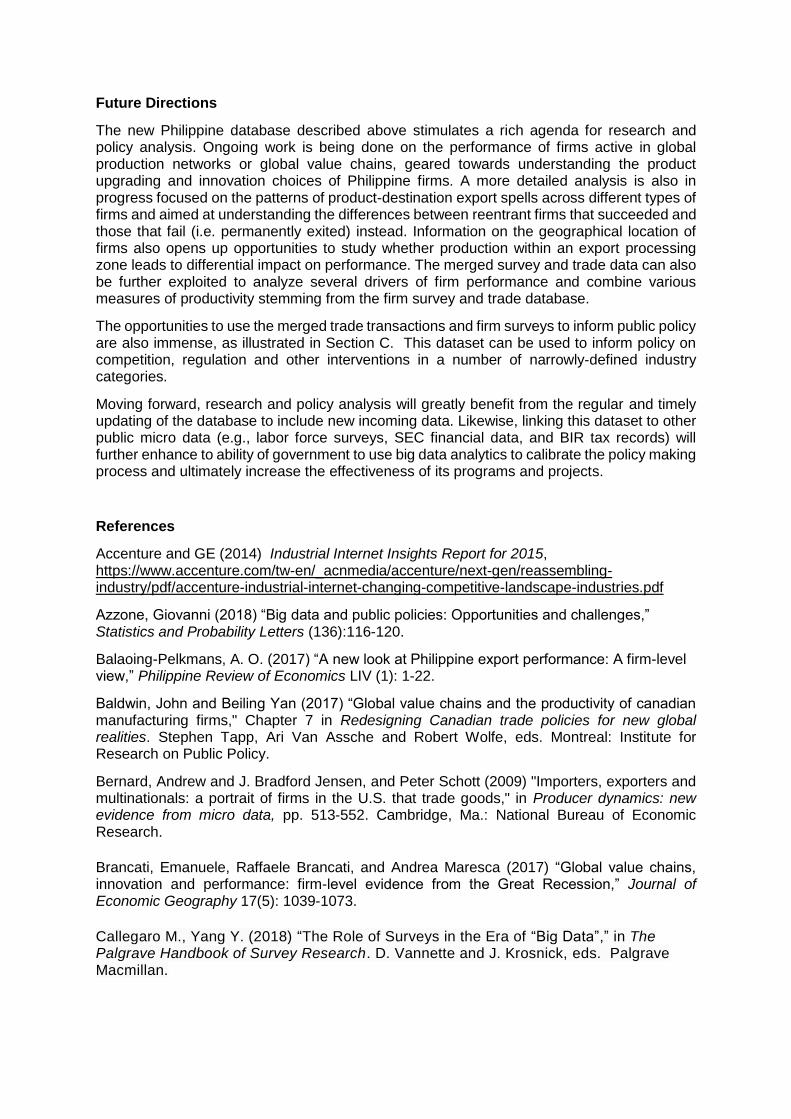
Figure 4 shows the number of exporters and importers in automobile-related products over time. From 1991 to 1997 the number of importers has steadily increased but the Asian Financial Crisis instigated a secular decline such that in 2012 the number of importers was only half the peak of around 3,000 firms in 1997. On the other hand, exporters of automobile-related products has increased from 1991-2005 but growth in the number of exporting firms was arrested from 2006 onwards. This is also reflected in Figure 5, which shows the steady increase in export value from 1991-2005 and the sudden decline in 2006.
Figure 4. Number of Firms Trading in Automobile-Related Products
Source: Author’s calculation based on data from the PSA
Figure 5. Export Value of the Automotive Sector
Source: Author’s calculation based on data from the PSA

Table 5 shows the top automobile-related products for export disaggregated at the PSIC7 level. Wiring harness (PSIC 77731301) earned the most export revenue and 637 firms were responsible for exporting these products. The most frequently transacted product however are other parts of motor vehicles (PSIC 7843919) where there are on average 4,012 transactions made by 1,059 firms per year.
Table 5. Top Automobile-Related Export Products
Source: Author’s calculation based on data from the PSA
Figure 6 shows the demographics of the automotive sector firms. Consistent with the drop in export value shown in 2006, this figure shows a sudden spike in the number of firms that exited permanently while the new entrants have dropped in the same time period. There is also a secular decline in the rate of entering firms after 2005. All these trends point to the need to examine closely the set of circumstances, as well as policies, related to the automotive industry during this period. In turn, the data can be used to monitor the effect of new policies or interventions to the performance of firms inside the automotive industry.
Figure 6. New Entrants, Survivors, Permanent Exiters and Resilient Firms in the Automotive Sector
Source: Author’s calculation based on data from the PSA
Future Directions
The new Philippine database described above stimulates a rich agenda for research and policy analysis. Ongoing work is being done on the performance of firms active in global production networks or global value chains, geared towards understanding the product upgrading and innovation choices of Philippine firms. A more detailed analysis is also in progress focused on the patterns of product-destination export spells across different types of firms and aimed at understanding the differences between reentrant firms that succeeded and those that fail (i.e. permanently exited) instead. Information on the geographical location of firms also opens up opportunities to study whether production within an export processing zone leads to differential impact on performance. The merged survey and trade data can also be further exploited to analyze several drivers of firm performance and combine various measures of productivity stemming from the firm survey and trade database.
The opportunities to use the merged trade transactions and firm surveys to inform public policy are also immense, as illustrated in Section C. This dataset can be used to inform policy on competition, regulation and other interventions in a number of narrowly-defined industry categories.
Moving forward, research and policy analysis will greatly benefit from the regular and timely updating of the database to include new incoming data. Likewise, linking this dataset to other public micro data (e.g., labor force surveys, SEC financial data, and BIR tax records) will further enhance to ability of government to use big data analytics to calibrate the policy making process and ultimately increase the effectiveness of its programs and projects.
References
Accenture and GE (2014) Industrial Internet Insights Report for 2015, https://www.accenture.com/tw-en/_acnmedia/accenture/next-gen/reassembling-industry/pdf/accenture-industrial-internet-changing-competitive-landscape-industries.pdf
Azzone, Giovanni (2018) “Big data and public policies: Opportunities and challenges,” Statistics and Probability Letters (136):116-120.
Balaoing-Pelkmans, A. O. (2017) “A new look at Philippine export performance: A firm-level view,” Philippine Review of Economics LIV (1): 1-22.
Baldwin, John and Beiling Yan (2017) “Global value chains and the productivity of canadian manufacturing firms," Chapter 7 in Redesigning Canadian trade policies for new global realities. Stephen Tapp, Ari Van Assche and Robert Wolfe, eds. Montreal: Institute for Research on Public Policy.
Bernard, Andrew and J. Bradford Jensen, and Peter Schott (2009) "Importers, exporters and multinationals: a portrait of firms in the U.S. that trade goods," in Producer dynamics: new evidence from micro data, pp. 513-552. Cambridge, Ma.: National Bureau of Economic Research.
Brancati, Emanuele, Raffaele Brancati, and Andrea Maresca (2017) “Global value chains, innovation and performance: firm-level evidence from the Great Recession,” Journal of Economic Geography 17(5): 1039-1073.
Callegaro M., Yang Y. (2018) “The Role of Surveys in the Era of “Big Data”,” in The Palgrave Handbook of Survey Research. D. Vannette and J. Krosnick, eds. Palgrave Macmillan.

Chetty, R., Hendren, N., Kline, P., Saez, E., Turner, N., 2014. “Is the United States still a land of opportunity? Recent trends intergenerational mobility,” American Economic Review 104: 141-147.
Connelly, R., Playford, C. J., Gayle, V., & Dibben, C. (2016) “The role of administrative data in the big data revolution in social science research,” Social Science Research 59: 1–12.
EBRD (European Bank for Reconstruction and Development) (2014) Transition report 2014.
Hand, David (2018) “Statistical challenges of administrative and transaction data,” Statistics and Society Series A 181(3): 555-605.
Hummels, David, Jun Ishii, and Kei-Mu Yi (2001) “The nature and growth of vertical specialization in world trade,” Journal of International Economics 54(1): 75-96.
Kasahara, Hiroyuki and Beverly Lapham (2013) "Productivity and the decision to import and export: theory and evidence," Journal of International Economics 89(2): 297-316.
Levinsohn, James and Amil Petrin (2003) “Estimating production functions using inputs to control for unobservables,” Review of Economic Studies 70 (2): 317-341.
Manova, Kalina and Zhihong Yu (2016) “How firms export: processing vs. ordinary trade with financial frictions," Journal of International Economics 100(C): 120-137.
Mayer, Thierry and Gianmarco Ottaviano (2007) The happy few: the internationalisation of European firms: new facts based on firm-level evidence. Brussels: Bruegel.
Mendoza A. (2019) “Philippine Firms in Global Value Chains: Innovation, Governance, and Upgrading,” Ph.D. Dissertation, University of the Philippines School of Economics, Diliman, Quezon City, Philippines.
Picot, G., Piraino, P., (2012) “Immigrant Earnings Growth: Selection Bias or Real Progress?” Statistics Canada Analytical Studies Branch Research Paper Series.
PSA (Philippine Statistics Authority) (2015) “Philippine standard commodity classification,”
http://nap.psa.gov.ph/csd/pscc1.asp Accessed 15 August 2015.
- (Various Years) Annual survey of Philippine business and industries.
- (Various Years) Census of Philippine business and industries.
- (Various Years) Trade Statistics.
Rigo, Davide (2017) “A Portrait of firms participating in global value chains,” CTEI Working Papers Series 01-2017, Centre for Trade and Economic Integration, The Graduate Institute, Geneva, Switzerland.
Seker, Murat (2012)"Importing, exporting and innovation in developing countries," Review of International Economics 20(2): 299-314.
World Bank (2017) Big Data in Action for Government: Big Data Innovation in Public Services, Policy and Engagement.
Veugelers, Reinhilde, Francesca Barbiero and Michael Blanga-Gubbay (2013) “Meeting the manufacturing firms involved in GVCs” in Manufacturing Europe’s future. Reinhilde Veugelers, ed. Brussels: BRUEGEL.
Vogel, Alexander and Joachim Wagner (2010) “High productivity in importing German
manufacturing firms: self-selection, learning from importing or both?,” Review of World
Economics, 145(4): 641-665.