The Business Benchmark on Farm Animal Welfare Report 2020
26
The Business Benchmark on Farm Animal Welfare Report 2020 Nicky Amos, Dr Rory Sullivan & Dr Nathan Rhys Williams MRCVS
-
Upload
khangminh22 -
Category
Documents
-
view
0 -
download
0
Transcript of The Business Benchmark on Farm Animal Welfare Report 2020

The Business Benchmark onFarm Animal Welfare Report2020Nicky Amos, Dr Rory Sullivan & Dr Nathan Rhys Williams MRCVS

The Business Benchmark on Farm Animal Welfare Report 2020
The Business Benchmark on Farm Animal Welfare The Business Benchmark on Farm Animal Welfare (BBFAW) is the leading global measure of farm animal welfare management, policy commitment, performance and disclosure in food companies. It enables investors, companies, NGOs and other stakeholders to understand corporate practice and performance on farm animal welfare, and it drives – directly and through the efforts of others – corporate improvements in the welfare of animals reared for food.
The BBFAW Secretariat maintains the Global Investor Statement on Farm Animal Welfare and convenes the Global Investor Collaboration on Farm Animal Welfare, a collaborative engagement between major institutional investors and food companies on the issue of farm animal welfare. In addition, the BBFAW Secretariat manages extensive engagement programmes with companies and with investors and provides practical guidance and tools for companies and for investors on key animal welfare issues.
The programme is governed and supported by the BBFAW’s founding partners, Compassion in World Farming and World Animal Protection, who provide technical expertise, guidance, funding and practical resources, alongside supporting the assessed food businesses with training, programmatic expertise and consultancy engagement.
More information on the programme can be found at www.bbfaw.com
Compassion in World FarmingCompassion in World Farming is the leading farm animal welfare charity advancing the wellbeing of farm animals and their integration into a more humane, sustainable food system, through advocacy, political lobbying and positive corporate engagement. The Food Business programme works in partnership with major food companies to raise baseline standards for animal welfare throughout their global supply, and to rebalance their animal footprint in a food system fit for the future. The team offers strategic advice and expert technical support for the development, implementation and communication of higher welfare policies and practices, and, increasingly, solutions and frameworks for a more resilient and sustainable food system.
Compassion engages directly with many of the companies evaluated in the BBFAW to highlight and support with policy development, welfare improvement and transparent reporting. The Food Business team uses the Benchmark alongside Compassion’s other tools such as the Supermarket Survey, its Awards programme, EggTrack, and its advisory services to help companies understand how they are performing relative to their peers, to identify areas and mechanisms for continuous improvement, and to highlight sources of risk and advantage.
More information on Compassion in World Farming can be found at: www.ciwf.org. More information on the work of the Food Business team at Compassion in World Farming can be found at: www.compassioninfoodbusiness.com
World Animal ProtectionWorld Animal Protection is a global NGO that works to end the cruelty and suffering of animals. With 14 offices across the world, World Animal Protection engages with companies, governments, and international bodies to put farmed and wild animals on the global agenda while inspiring individuals to take action to protect animals and further the cause of animal welfare.
Through its corporate engagement work, World Animal Protection works with leading food companies across the value chain to support their efforts to improve animal welfare. World Animal Protection offers specialist animal welfare expertise and provides resources that help companies achieve high animal welfare.
To learn more about World Animal Protection’s work, our news, successes, and how we can support you, please visit www.worldanimalprotection.org
3
ContentsForeword ........................................................................................................ 4
1 The 2020 Benchmark Highlights ........................................................ 5
2 The 2020 Benchmark Results in Detail ...........................................13
3 Accelerating Impact .............................................................................19
4 The 2020 Benchmark: Methodology and Scope .........................22
5 Appendices .............................................................................................24 • References • Acknowledgements

The Business Benchmark on Farm Animal Welfare Report 2020
4
ForewordMore than any other year, 2020 sharply and irrevocably highlighted the inextricable links between the health and wellbeing of people and animals. Like swine and avian flu before it, COVID-19 has reinforced this connection.
Shockingly, a 2020 UN report finds intensive farming responsible for more than half of all infectious diseases passing between animals and people since 1940. And the intensive farming links with antibiotic resistance and the emergence of superbugs are increasingly clear.
Food companies that fail to recognise the connections are taking a significant risk by ignoring their responsibilities to the animals at the hearts of their businesses, to their customers and the planet. It is critical that BBFAW continues to challenge such failures and encourage companies to demonstrate their commitment to the continuous improvement of farm animal welfare in their operations and supply chains.
BBFAW’s 2012 founding by World Animal Protection and Compassion in World Farming (CIWF) is a significant landmark in business accountability. Since its inception, an increasingly wide range of stakeholders – including institutional investors and consumers, and organisations – are expressing their concern about animal welfare and are calling for transparency. The annual BBFAW Benchmark and its accompanying investor and company engagement programmes have made a significant contribution to defining the core expectations for companies on farm animal welfare, to building investor and company consensus around these expectations, and to catalysing change within companies and in the investment community.
Today, BBFAW is the leading global measure in farm animal welfare management, policy commitment, performance and disclosure in food companies. It has driven changes in the practices and performance of many of the world’s largest food companies. For example, 79% of the 150 companies covered by the 2020 benchmark have formal overarching policies on farm animal welfare and have set welfare-related objectives and targets (compared to, respectively, 46% and 26% of the 68 companies originally assessed in 2012), and 82% of the companies continuously assessed by the BBFAW since 2012 have substantially improved their management and disclosure on farm animal welfare. The BBFAW has involved many of the world’s leading investors in the mission of encouraging food companies to take action on farm animal welfare.
The 2020 results highlight that companies are continuing to make progress in the Benchmark, with 23 companies moving up at least one tier, and the overall average score has continued to increase, indicating that animal welfare continues to receive management attention. Nearly two-thirds of companies globally – 91 of the 150 companies covered by the BBFAW – are now actively managing the business risks and opportunities associated with farm animal welfare, corresponding to being ranked in Tiers 1-4 of the Benchmark.
But farm animal welfare is not static. As BBFAW has delivered real changes in company governance and in management systems and processes, it – and we, World Animal Protection and Compassion in World Farming – have started to much more closely examine the relationship between these traditional measures of management quality and the outcomes being seen in the actual welfare of animals. The BBFAW is increasing its emphasis on welfare impact, and it has, since 2018, made it clear to companies that performance is the key focus. This change in emphasis mirrors the change we have seen in the investment community, where questions of performance and impact have become central to how investors assess the way in which they deliver on their social and environmental responsibilities. Even in the last year or two, I have been struck by how much progress BBFAW and its investor supporters have made in cracking one of the key challenges that the animal welfare community has faced, which is how we get companies to establish management systems and processes that deliver real improvements in the well-being of animals.
We have a long way to go but BBFAW has provided us with clear insights into the direction that we must travel, into the expectations that we need to have of companies, into the role that can be played by companies and investors, and into the role that we as NGOs must play – as partners and as campaigners – if we are to catalyse the changes that we want to see.
BBFAW has been one of the most powerful and inspiring programmes that I have worked on in my 30-year career working to improve the lives of animals. It has shown what can be achieved through working in partnership with companies, with investors and with civil society organisations. It has forced us to lift our game and to be crystal clear about what we want to achieve. It has shown the power of hard data and of what can be achieved when you establish a programme that has a clear sense of purpose and is underpinned by deep expertise both on animal welfare and on how companies and investors operate. It stands, I believe, as an exemplar of what a well-designed programme of work can be.
As we proudly hand over the baton to Four Paws International, we welcome the new partners into this important and exciting change programme. We recognise that improving the welfare of all animals farmed for food is a collective responsibility; a responsibility that extends to food companies and investors, and to civil society organisations that are committed to collaborating with both of these stakeholder groups. World Animal Protection will continue to take an active interest in the BBFAW as we embark on our new strategy (2021–2030) that will seek to overturn the entrenched systems that cause so much suffering and anguish to animals.
It has been a privilege for us to support the BBFAW and we know that Four Paws International and Compassion in World Farming will support and enthusiastically drive forward the BBFAW programme. I look forward to celebrating what I know will be the continued success of the BBFAW.
Steve McIvorCEO, World Animal Protection

The 2020 Benchmark highlights
5
Overall Results 1: Companies continue to make progress in the Benchmark, showing farm animal welfare remains a business priority In the 2020 Benchmark, 23 companies have moved up at least one tier and the overall average score has continued to increase, marginally, to 35% in 2020, from 34% in 2019, indicating that animal welfare has continued to receive sustained management attention. The incremental changes we are seeing this year are notable given the tightening of the benchmark methodology and assessment approach in 2020. They are also encouraging against a difficult backdrop of the COVID-19 pandemic, although we anticipate its effect on corporate reporting of farm animal welfare have yet to be fully realised.
2: Progress continues but welfare ‘impact’ remains under-reported Nearly two-thirds of companies globally, 91 of the 150 companies in the BBFAW, are now actively managing the business risks and opportunities associated with farm animal welfare, corresponding to being ranked in Tiers 1-4 of the Benchmark.
Whilst this is broadly similar to 2019, we have for the first time used an ‘Impact Rating’ to assess whether company efforts in managing farm animal welfare are actually translating into improved welfare impacts for animals. Poor performance in the baseline 2020 Impact Ratings shows that welfare impact remains under-reported. For example, whilst 61% of companies report on the proportion of laying hens free from cages, significantly fewer companies report on the proportion of laying hens free from routine beak trimming, or the proportion of pigs free from sow stalls or tail docking, or the proportion of dairy cattle free from tethering or routine tail docking. Companies are also failing to disclose what proportion of broiler chickens in their global supply chains is from slower growing breeds or is reared at lower stocking densities, or what proportion of animals in their global supply chains is pre-slaughter stunned or is transported in eight hours or less. Whilst 79% of companies have published formal improvement objectives for farm animal welfare (75% in 2019), there is a gap in companies’ disclosure on how these commitments are leading to improved welfare performance on the ground.
3: Producers and manufacturers are outpacing retailers and wholesalers, and restaurants and bars on farm animal welfare management and reportingFor the first time, food producers and manufacturers are the highest scoring sub-sector with the overall average score for food producers and manufacturers increasing from 35% to 38% compared to scores of 36% for retailers and wholesalers, and 31% for restaurants and bars.
Thirteen companies in the producers and manufacturers sub-sector improved their score by at least one tier between 2019 and 2020, compared to nine retailer and wholesaler companies, and just one company in the restaurants and bars sub-sector.
Food producers are also now the most represented sub-sector in Tiers 1 and 2 of the Benchmark, with twelve companies – Barilla, Cargill, Cranswick, Danish Crown, Groupe Danone, Fonterra, Hilton Food Group, Marfrig, Nestlé, Noble Foods, Premier Foods and Unilever – showing leadership on farm animal welfare. These companies represent all geographic regions (Asia Pacific, Europe, Latin America, North America and UK) covered by the Benchmark.
1. The 2020 Benchmark HighlightsThis is the ninth annual edition of the Business Benchmark on Farm Animal Welfare. It analyses the farm animal welfare policies, management systems, reporting and performance of 150 of the world’s largest food companies, across 37 distinct, objective criteria. As such, it is the most authoritative and comprehensive global account of corporate practice on farm animal welfare.
In addition to the key findings and analysis presented within this report, this year, we have also presented the data via an interactive online BBFAW data dashboard. You can access the dashboard here www.bbfaw.com/benchmark/

The Business Benchmark on Farm Animal Welfare Report 2020
6
The marked improvement by producers and manufacturers in 2020 has revealed a significant gap between sub-sectors. Whilst the overall average score for the other two sub-sectors has remained broadly static (36% for retailers and wholesalers and 31% for restaurants and bars versus 35% and 32% in 2019 respectively), food producers and manufacturers are outperforming the companies that they supply.
4: Momentum is building for food producers in Latin America and Asia Pacific: regions that include some of the biggest names in global meat production Our analysis of companies by geographic region reveals noteworthy changes in the overall average score for producer companies in Latin America, whose overall average score rose from 29% in 2019 to 40% in 2020. Most improvements were seen in in the scoring of companies (including Agro Super, BRF, Marfrig Global Foods and Minerva Foods) in the Management and Commitment and the Governance and Management sections of the Benchmark, indicating that producers in this region are providing more clarity on their management commitments and policies and are also describing their governance systems and processes for effectively implementing their commitments.
Notable increases in average scores were also seen in Asia Pacific, where producers in that region saw their year-on-year scores improve from 21% to 27% in the Management Commitment section and from 14% to 18% in the Governance and Management section. However, it is worth noting that this rise is from a very low base, and the average overall score for these companies increased from 12% to 16% in 2020.
Company Rankings and PerformanceAs in previous Benchmarks, we have grouped the assessed companies into one of six tiers, based on their overall percentage scores, as indicated in Table 1.1. Figure 1.1 presents a composite picture of company scores.
Table 1.1: BBFAW Tiers
Tier Percentage Score
1. The company has taken a leadership position on farm animal welfare
>80%
2. The company has made farm animal welfare an integral part of its business strategy
62 – 80%
3. The company has an established approach to a farm animal welfare but has more work to do to ensure it is effectively implemented
44 – 61%
4. The company is making progress on implementing its policies and commitments on farm animal welfare
27 – 43%
5. The company has identified farm animal welfare as a business issue but provides limited evidence that it is managing the issue effectively
11 – 26%
6. The company provides limited if any evidence that it recognises farm animal welfare as a business issue
<11%

The 2020 Benchmark highlights
7
The 2020 Benchmark highlights
Tier 1Leadership
4
Cranswick Marks & Spencer Noble Foods Waitrose
Tier 3Established butwork to be done
37
2 Sisters Food Group ALDI Nord ALDI Süd Arla Foods Auchan Holding BRF Carrefour Casino Charoen Pokphand Foods
Cheesecake Factory (The) Chipotle Mexican Grill Coles Group Compass Group Domino’s Pizza Group Elior Group Hormel Foods Corporation
IKEA (Inter IKEA Group) JBS JD Wetherspoon Jeronimo Martins KraftHeinz LDC Groupe Les Mousquetaires Lidl Stiftung & Co Maple Leaf Foods McDonald’s Corporation Migros Minerva Foods Mowi Perdue Farms REWE Group Royal FrieslandCampina
Schwarz Unternehmens Treuhand/Kaufland
Sodexo Tyson Foods Vion Food Group Yum! Brands
Tier 5On the business
agenda but limitedevidence of
implementation
34
Albertsons Amazon/Whole Foods Market
Bimbo BJ’s Wholesale Club Holdings
Chick-fil-A ConAgra Cooke Seafood Cracker Barrel Dunkin’ Brands Dairy Farmers of America
E.Leclerc Empire Company/Sobey’s
General Mills Inc Groupe Lactalis H E Butt Company Hershey Co Inspire Brands JAB Holding Company Kerry Group Loblaw Companies Limited
Mars Meiji Holdings Mercadona Mondelēz International Publix Super Markets Sanderson Farms Seaboard Corp SSP Group Starbucks Subway/Doctor’s Associates
Target Corporation Umoe Gruppen UNFI US Foods
Tier 2Integral to
business strategy
19
Barilla Cargill Coop Group (Switzerland)
Co-op UK Danish Crown Fonterra Greggs Groupe Danone Hilton Food Group J Sainsbury Marfrig Global Foods Mitchells & Butlers Nestlé Premier Foods Tesco Unilever Whitbread Wm Morrison Woolworths Group
Key
2020 Up at least 1 tier Down at least 1 tier Non-mover New company
Tier 4Making
progress onimplementation
31
Agro Super Ahold Delhaize Aramark Associated British Foods Campbell Soup Company
Camst Colruyt Coop Italia Cooperativa Centrale Aurora Alimentos
Coopérative U Enseigne
Cooperl Arc Atlantique Costco Cremonini Darden Restaurants Edeka Group Ferrero Gruppo Veronesi ICA Gruppen Kroger Company (The) Metro AG OSI Group Papa John’s Pizza Plukon Food Group Restaurant Brands International
Saputo Sysco Corporation Terrena Group Tönnies Group Walmart Inc/Asda Wendy’s Company WH Group
Tier 6No evidence
on thebusiness agenda
25
Aeon Group Autogrill Bloomin’ Brands C&S Wholesale Cencosud China Resources Vanguard
China Yurun Group Limited
Chuying Agro-Pastoral Group
CKE Restaurants CNHLS Conad Consorzio Nazionale
Couche-Tard Dico’s/Ting Hsin International Group
Gategroup Holding Habib’s Industrias Bachoco Lianhua Supermarket Holdings Co
Maruha Nichiro Müller Group New Hope Liuhe Co Nippon Ham Seven & i Holdings Wens Foodstuff Group Yonghui Superstores Co Zhongpin
Figure 1.1: Company Rankings
The Business Benchmark on Farm Animal Welfare Report 2020
8
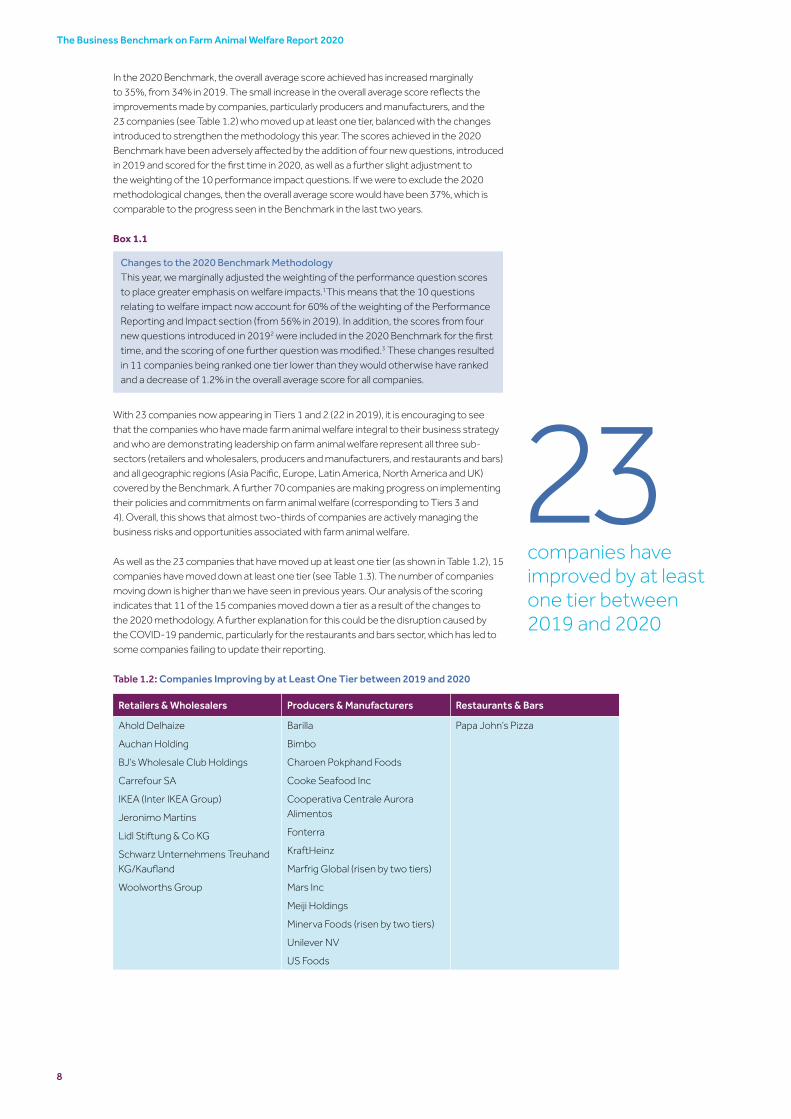
In the 2020 Benchmark, the overall average score achieved has increased marginally to 35%, from 34% in 2019. The small increase in the overall average score reflects the improvements made by companies, particularly producers and manufacturers, and the 23 companies (see Table 1.2) who moved up at least one tier, balanced with the changes introduced to strengthen the methodology this year. The scores achieved in the 2020 Benchmark have been adversely affected by the addition of four new questions, introduced in 2019 and scored for the first time in 2020, as well as a further slight adjustment to the weighting of the 10 performance impact questions. If we were to exclude the 2020 methodological changes, then the overall average score would have been 37%, which is comparable to the progress seen in the Benchmark in the last two years.
Box 1.1
Changes to the 2020 Benchmark Methodology This year, we marginally adjusted the weighting of the performance question scores to place greater emphasis on welfare impacts.1This means that the 10 questions relating to welfare impact now account for 60% of the weighting of the Performance Reporting and Impact section (from 56% in 2019). In addition, the scores from four new questions introduced in 20192 were included in the 2020 Benchmark for the first time, and the scoring of one further question was modified.3 These changes resulted in 11 companies being ranked one tier lower than they would otherwise have ranked and a decrease of 1.2% in the overall average score for all companies.
With 23 companies now appearing in Tiers 1 and 2 (22 in 2019), it is encouraging to see that the companies who have made farm animal welfare integral to their business strategy and who are demonstrating leadership on farm animal welfare represent all three sub-sectors (retailers and wholesalers, producers and manufacturers, and restaurants and bars) and all geographic regions (Asia Pacific, Europe, Latin America, North America and UK) covered by the Benchmark. A further 70 companies are making progress on implementing their policies and commitments on farm animal welfare (corresponding to Tiers 3 and 4). Overall, this shows that almost two-thirds of companies are actively managing the business risks and opportunities associated with farm animal welfare.
As well as the 23 companies that have moved up at least one tier (as shown in Table 1.2), 15 companies have moved down at least one tier (see Table 1.3). The number of companies moving down is higher than we have seen in previous years. Our analysis of the scoring indicates that 11 of the 15 companies moved down a tier as a result of the changes to the 2020 methodology. A further explanation for this could be the disruption caused by the COVID-19 pandemic, particularly for the restaurants and bars sector, which has led to some companies failing to update their reporting.
Table 1.2: Companies Improving by at Least One Tier between 2019 and 2020
23companies have improved by at least one tier between 2019 and 2020
Retailers & Wholesalers Producers & Manufacturers Restaurants & Bars
Ahold Delhaize
Auchan Holding
BJ’s Wholesale Club Holdings
Carrefour SA
IKEA (Inter IKEA Group)
Jeronimo Martins
Lidl Stiftung & Co KG
Schwarz Unternehmens Treuhand KG/Kaufland
Woolworths Group
Barilla
Bimbo
Charoen Pokphand Foods
Cooke Seafood Inc
Cooperativa Centrale Aurora Alimentos
Fonterra
KraftHeinz
Marfrig Global (risen by two tiers)
Mars Inc
Meiji Holdings
Minerva Foods (risen by two tiers)
Unilever NV
US Foods
Papa John’s Pizza

The 2020 Benchmark highlights
9
Table 1.3: Companies Falling by at Least One Tier between 2019 and 2020
Retailers & Wholesalers Producers & Manufacturers Restaurants & Bars
ALDI Süd
Coop Group (Switzerland)/Coop Genossenschaft
ICA Gruppen AB
Metro AG
Migros (fallen by two tiers)
Publix Super Markets Inc
UNFI
General Mills Inc
Perdue Farms
Terrena Group
Aramark Corporation
Chipotle Mexican Grill
CKE Restaurants
SSP Group
Subway/Doctor’s Associates Inc
Fifty-nine of the 150 companies appear in Tiers 5 and 6, indicating that these companies provide little or no information on their approach to farm animal welfare. Across these tiers, 28 companies (19%) still do not publish a farm animal welfare policy, highlighting that there is significant work to be done before the business risks associated with farm animal welfare are considered to be effectively managed by the food industry globally. Notably, there are 10 companies in Tiers 5 and 6 that have been continually assessed as part of the BBFAW since 2012, yet these companies significantly lag their industry peers in demonstrating their commitment to farm animal welfare. The companies are Autogrill, Gategroup, Groupe Lactalis, Mars, Mercadona, Müller Group, Subway, SSP Group, Starbucks and Umoe Gruppen.
Our analysis of the changes in company tier rankings between 2012 and 2020 (see Table 1.4) highlights the progress made by the 57 food companies that have been continuously assessed by the Benchmark since 2012. Acknowledging that some companies have moved up and down tiers since 2012, Table 1.4 provides the net impact of these movements across tiers. In total, 47 (82%) have moved up at least one tier since 2012 and, of these, 15 (26%) have moved up one tier, 21 (37%) have moved up two tiers and 11 (19%) moved up three tiers. These improvements are even more striking given the tightening of the Benchmark criteria and the increased emphasis on performance reporting and impact over time.
Table 1.4: Tier changes 2012 – 2020 (trend companies)
Down 1 Tier No Tier change Up 1 Tier Up 2 Tiers Up 3 Tiers
Subway/Doctor’s Associates Inc
AutogrillCo-op (UK)Gategroup HoldingGroupe LactalisICA GruppenMcDonald’s CorporationMüller GroupStarbucksUnilever
Arla FoodsCoop Group (Switzerland)Compass GroupJ SainsburyMarsMercadonaMetro AGNoble Foods*Royal FrieslandCampinaSSP GroupTerrena GroupTyson FoodsUmoe GruppenVion Food GroupWm Morrison
2 Sisters Food GroupALDI SüdAramarkAssociated British FoodsCamstCarrefourCremoniniDanish CrownGroupe DanoneJD WetherspoonLidl Stiftung & CoMarfrig Global FoodsMarks & Spencer*MigrosMitchells & ButlersREWE GroupSchwarz Unternehmens Treuhand KG/KauflandTescoWalmart Inc/AsdaWhitbreadYum! Brands
Auchan HoldingBarillaCargillCasinoCranswick*Elior GroupGreggsNestléPremier FoodsSodexo Waitrose*
1 9 15 21 11
*Tier 1 company in 2020
Although we have previously reported 55 trend companies, the actual number is 57.

The Business Benchmark on Farm Animal Welfare Report 2020
10
Sub-sector ComparisonThe marked improvement by producers and manufacturers in 2020 has revealed a significant gap between sub-sectors. Whilst the overall average score for the retailers and wholesalers sub-sector improved marginally from 35% to 36%, and the score for the restaurants and bars reduced from 32% to 31%, the overall average score for the producer and manufacturer sub-sector increased from 35% to 38%. As highlighted in Box 1.2 below, this improvement in scoring has been bolstered by significantly improved scoring for producers in the Latin America and Asia-Pacific regions.
Box 1.2
Sub-sector Focus: Producers and ManufacturersThe food producer and manufacturer sub-sector has for the first time become the highest scoring sub-sector in the Benchmark, with the overall average score for this sub-sector increasing from 35% in 2019, to 38% in 2020.
Food producers are also now the most represented sub-sector in Tiers 1 and 2 of the Benchmark, with twelve companies showing leadership on farm animal welfare (compared to eight retailers and wholesalers and three restaurants and bars). These twelve producers and manufacturers – Barilla, Cargill, Cranswick, Danish Crown, Fonterra, Groupe Danone, Hilton Food Group, Marfrig, Nestlé, Noble Foods, Premier Foods and Unilever – include representatives of all geographic regions (Asia Pacific, Europe, Latin America, North America and UK) covered by the Benchmark.
Looking at the companies that moved up at least one tier in 2020, it is interesting to note that more than half of the producers and manufacturers moving up were companies that we included in the Benchmark for the first time in 2017. These included Bimbo, Charoen Pokphand Foods, Cooke Seafood Inc, Cooperativa Centrale Aurora Alimentos, Meiji Holdings, Minerva Foods and US Foods, a majority of which are located in the Latin America and Asia Pacific regions.
Our analysis of companies by geographic region reveals substantial changes in the overall average score for producer companies domiciled in Latin America, whose overall average score rose to 40% in 2020 (from 29% in 2019). Although this finding is based on the performance of just eight companies, these companies include some of the largest meat producers globally (Agro Super, Cooperativa Centrale Aurora Alimentos, Industrias Bachoco, BRF, JBS, Marfrig Global Foods and Minerva Foods). This means that producers in Latin America are now outperforming producers and manufacturers in North America whose overall average score was 35% (up from 33% in 2019). Most improvements for Latin American producers and manufacturers were seen in the scores in the Management and Commitment and the Governance and Management sections, indicating that producers and manufacturers in this region are providing more clarity on their management commitments and policies and are also describing the systems and processes in place for implementing them. Increases in average scores were also seen in Asia Pacific, where producers and manufacturers in that region saw their year-on-year scores improve from 21% to 27% in the Management Commitment section and from 14% to 18% in the Governance and Management section. Notwithstanding these improvements, producers and manufacturers in the Asia Pacific region still lag behind their peers in other regions with an overall average score of 16% (12% in 2019), compared to producers and manufacturers in Europe who achieved an average score of 44% (43% in 2019) and those in the UK who achieved an average score of 61% (57% in 2019).
Reflecting on the improvements seen in companies that have only been assessed by the Benchmark since 2017, we generally anticipate that it will take three to five years for companies to be reporting performance data that enables assessment of the effectiveness of their management systems and, over time, the impact of these systems in terms of improved welfare outcomes for animals. It is therefore encouraging to see that these recently introduced companies are engaging with the Benchmark and making significant improvements in their management and reporting.

The 2020 Benchmark highlights
11
Global PerspectiveUK domiciled companies, with an average score of 64%, continue to outperform companies in other geographies. The strongest overall performance came from UK companies across all sub-sectors. Despite a decline in the overall average scores in some sections, UK retailers and wholesalers, achieved the highest average scores for Governance and Management at 88% (up from 87%) and for Performance Reporting and Impact (55%, compared with 61% in 2019), while UK restaurants and bars achieved the highest average score for Management Commitment and Policy at 85% (compared with 91% in 2019). UK restaurants and bars achieved a lower overall average score of 57% (60% in 2019), suggesting that companies in this sub-sector have either not updated their performance data or have failed to clarify the scope of their reporting.
The second highest-scoring region remains Europe (excluding the UK), which achieved an average score of 40%. Here, food retailers and food producers achieved broadly the same overall average scores (42% and 44% respectively), but were significantly ahead of restaurants and bars, whose average score was just 26%.
Although other geographic regions continue to lag, this year the average overall score for Latin American companies, at 32%, has now overtaken North American companies, at 29%. Asia-Pacific was the only other geographic region to see a rise in average overall score in 2020, increasing from 12% to 16%. However, it is worth noting that this rise is from a very low base.
Impact Rating For the first time this year, we have analysed company scores using an ‘Impact Rating’ for the ten Performance Impact questions.4 Eight of these questions assess companies on species-specific performance for the most numerously sourced animals (excluding fish) worldwide (namely laying hens, broiler chickens, dairy cows and pigs) with a focus on key welfare issues for each of these species (covering close confinement, routine mutilations and fast-growth rate breeds) and two questions focus on cross-species performance on pre-slaughter stunning and long-distance live transportation. Companies are only assessed on questions that are relevant to the species in their supply chains. The baseline scores are presented in a six-tier rating, labelled A-F, using the percentage boundaries presented in Table 1.5.
Despite the BBFAW introducing performance impact questions in 2016, company reporting on welfare impact remains immature. The BBFAW recognises that performance disclosure is essential to driving improvements in the welfare of animals managed by companies and their supply chains but that this can only be achieved and sustained once companies have established effective internal and supply chain processes for managing and governing farm animal welfare. The Impact Rating has been introduced to provide an additional level of granularity to help investors gauge the effectiveness of companies’ commitments to improving the lives of farms animals in their supply now and to help companies identify where they need to make significant improvements in the welfare of animals in their global supply chains.
Table 1.5 2020 Impact Ratings*
Impact Rating Number of companies
A >80% These companies are declaring improved welfare impacts for a reasonable proportion of farm animals in their operations and/or supply chains.
0
B 62-80% 4
C 44-61% These companies are declaring improved welfare impacts for at least some farm animals in their operations and/or supply chains.
3
D 27-43% 10
E 11-26% These companies have yet to demonstrate that they are delivering improved welfare impacts for farm animals in their operations and/or supply chains.
12
F <11% 121
*Impact ratings are based on companies’ scores for the 10 performance impact questions, namely Q28 to Q37.

The Business Benchmark on Farm Animal Welfare Report 2020
12
The 2020 baseline Impact Ratings (see Table 1.5) show there are few companies achieving Impact Ratings A-E. Companies from across Tiers 2 to 6 achieved an Impact Rating of F (albeit only two companies from Tier 2), suggesting that whilst some companies score well on their management systems and governance of farm animal welfare, these strategies have yet to deliver improved welfare impacts. Indeed, 39 companies (26%) scored points on only one Performance Impact question, whilst 51 companies (34%) scored 0%.
Since 2012, the BBFAW has played an important role in defining expectations for and encouraging disclosure on management and governance processes for farm animal welfare, a majority of food sector companies have responded to meeting these expectations. The challenge now is for the BBFAW to encourage increased delivery of welfare impacts for animals in their global supply chains. The BBFAW Secretariat and its partners will work with companies to drive improvements in the monitoring and disclosure of their welfare impacts, and the BBFAW plans to publish individual Impact Ratings for all companies on an annual basis from the 2021 Benchmark.

13
The 2020 Benchmark Results in detail
2. The 2020 Benchmark Results in Detail
Farm Animal Welfare PoliciesOne hundred and thirty-four (89%) of the 150 companies covered by the 2020 Benchmark now acknowledge farm animal welfare as a relevant business issue, and 119 companies (79%) have formal overarching policies on farm animal welfare. Nevertheless, 31 major food companies (21%) have still not published overarching policies on farm animal welfare, indicating that these companies have yet to formalise their management of farm animal welfare.
Two-thirds of farm animal welfare policies lack universal coverage with their scope being either poorly defined or limited to specified geographies, species and/or products (see Fig. 2.1). In practice, companies tend to prioritise those species and issues where they have the most significant impact, where they have the most influence and where there is the greatest level of public or consumer attention. Whilst 55% of policies apply to all species (54% in 2019), our view is that farmed fin fish continue to be frequently overlooked in companies’ farm animal welfare or associated policies.
Figure 2.1 Formal Animal Welfare Policies
1 in 5major food companies does not have a farm animal welfare policy
Farmed fin fish continue to be overlooked in many companies’ policies.
21%25%
54%
No Policy
Partial Policy
Universal Policy
Figure 2.2 shows the proportion of companies with management commitments addressing the eight key welfare topics assessed in the Benchmark.5 The top three welfare topics addressed by company commitments continue to be the avoidance of close confinement, the reduction or elimination of routine antibiotics and the avoidance of growth promoting substances, reflecting the attention these topics have received from the media and from NGO campaigns across multiple geographies.
This is the first year in which we have included the scores from a new policy question6 relating to the provision of species-specific environmental enrichment, which reflects increasing recognition of the importance of providing animals with stimulating and complex environments that enable species-specific behaviours. Such enrichment can include, for example, brushes for dairy cows, manipulable materials such as straw for pigs, pecking and dustbathing substrates and perches for chickens. Despite the fact that this question was recently introduced, it is notable that commitments to provide species-specific environmental enrichment are already the fourth most numerous out of the key welfare topics addressed in the Benchmark. However, of the 55% of companies making commitments to provide species-specific environmental enrichment, only 58% of these commitments are clearly defined (54%) or universal (4%) in scope. Indeed, of all the key welfare topics assessed in the Benchmark, environmental enrichment has the lowest proportion of companies with defined commitments, suggesting that management approach to this issue is relatively immature and that there is a lack of understanding of this topic.

The Business Benchmark on Farm Animal Welfare Report 2020
14
It continues to be the case that relatively few commitments are universal in scope. The key welfare topics with the greatest proportion of universal commitments are the avoidance of genetically-modified or cloned animals at (35%), the avoidance of animals that have not been stunned prior to slaughter (24%) and the avoidance of long-distance live transportation (24%), suggesting that these issues are better understood by companies and their supply chains.
Figure 2.2: Percentage of Companies with Specific Policies on Farm Animal Welfare Issues
Closeconfinement
GMOs
Environmental enrichment**
Growthpromotingsubstances
Prophylactic antibiotic use*
Routinemutilations
Pre-slaughterstunning
Long-distancetransport
0 10 20 30 40 50 60 70 80 90
0 10 20 30 40 50 60 70 80 90
0 10 20 30 40 50 60 70 80 90
202020192018201720162015201420132012
202020192018201720162015201420132012
2020201920182017201620152014
202020192018201720162015201420132012
20202019
202020192018201720162015201420132012
202020192018201720162015201420132012
202020192018201720162015201420132012
81% 77% 77% 79% 77% 72% 64% 66%49%
50% 46% 41% 45% 32% 30% 21% 27% 38%
51% 45% 41% 45% 33% 36% 23% 13%7%
53% 47% 41% 43% 37% 32% 34% 26% 13%
31% 27% 24% 27% 21% 19% 10%6%6%
67% 65% 55% 61% 47% 39%35%
59% 54% 51% 54% 45% 38% 34% 29%
55%51%
18%
Reported for the first time in *2014, **2019

15
The 2020 Benchmark Results in detail
Governance and Management We are seeing evidence of an increasing proportion of companies having established governance and management systems and processes for addressing the business risks associated with farm animal welfare in their supply chains, 51% of companies in 2020 having assigned senior management oversight of farm animal welfare and 79% having published formal objectives and targets for animal welfare. When compared with the first Benchmark in 2012, where just 22% of companies reported on senior management oversight of farm animal welfare and only 26% had published formal improvement objectives for farm animal welfare, it is clear to see the significant improvement that has been made in companies’ governance of farm animal welfare.
We continue to see year-on-year improvements in the way in which companies are strengthening their internal processes for ensuring the effective implementation of company policies. For instance, 49% of companies now describe their provision of employee training on animal welfare (42% in 2019), and 55% describe the actions taken in the event of non-compliance with their farm animal welfare policies (42% in 2019). This is encouraging given that performance in these areas has historically lagged other Governance and Management criteria.
The scores achieved within the Governance and Management section of the Benchmark reveal differing approaches between the company sub-sectors. Whereas 66% of restaurants and bars report that they include farm animal welfare in supplier contracts, only 26% report they provide support and/or education to suppliers on farm animal welfare. This contrasts with producers and manufacturers, of which 48% include farm animal welfare in supplier contracts and 57% provide associated support and/or education to suppliers. The equivalent percentages for retailers and wholesalers are 54% and 46% respectively. This suggests that producers and manufacturers appear to be providing most support to their suppliers on implementing their farm animal welfare commitments.
Key findings:
• 63% of companies (59% in 2019) report some information on management responsibilities for farm animal welfare, at either or both senior and operational levels.
• 79% of companies (75% in 2019) have now set farm animal welfare-related objectives and targets.
• 54% of companies (50% in 2019) report that they include farm animal welfare in supplier contracts.
• 67% of companies (63% in 2019) describe how they monitor and audit the implementation of their farm animal welfare policies.
• 49% of companies (43% in 2019) report on providing animal welfare training to their employees, and 55% (42% in 2019) report on having internal controls for managing non-compliance with their farm animal welfare policies.
Innovation and LeadershipAdvancing Farm Animal Welfare in the Food IndustryCompanies have an important role to play in supporting research and development programmes to improve farm animal welfare, helping ensure that these are focused on delivering results that can drive welfare impacts for animals in food industry supply chains. Collective involvement of companies and other stakeholders, such as governmental and industry organisations, NGOs and academia, in industry initiatives aimed at improving farm animal welfare are another powerful driver of change. Initiatives focused on developing the right policy frameworks, incentives, knowledge and understanding across the industry are important to ensure that improved practices are adopted across the industry.
Forty percent of the 150 companies covered by the Benchmark now describe their involvement in research and development programmes and 48% report that they are involved in industry initiatives directed at improving farm animal welfare. These figures represent an increase on the proportions of companies reporting on these activities in the 2019 Benchmark (37% and 43% respectively).
of global food companies have set farm animal welfare-related objectives and targets, we have yet to see this reflected in improved welfare impact disclosure for animals across their operations and supply chains
79%Whilst

The Business Benchmark on Farm Animal Welfare Report 2020
16
Whereas average scores in the Innovation and Leadership section of the Benchmark have remained relatively unchanged for companies in Europe, North America and the UK, the scores have increased significantly for companies in Latin America, from 25% in 2019 to 43%, and Asia Pacific, from 14% to 24%. This improvement has been driven predominantly by more companies reporting their involvement in research and development and industry initiatives, indicating that companies in these regions are recognising that farm animal welfare is a collective issue.
Consumer EngagementA further key role for companies within the food industry is the promotion of higher farm animal welfare standards to customers (both business customers and consumers). Provision of information on farm animal welfare is important at all levels of the food supply chain if companies are to play a role in driving greater awareness, demand and support for higher welfare products.
Overall, the 2020 Benchmark data suggest that the proportion of companies promoting higher farm animal welfare to customers has remained unchanged. This is perhaps not surprising given the significant and persistent disruption of the COVID-19 pandemic on food companies globally. Seventy-nine (53%) of the 150 companies assessed were found to provide information to their customers on farm animal welfare in 2020. However, the proportion of producers and manufacturers providing evidence in this area has increased markedly since the previous Benchmark, suggesting that farm animal welfare is growing into a significant issue for these companies and their customers (see Box 2.1)
Box 2.1
Focus on the Producers and Manufacturers Sub-sector Overall, and in line with the general trend we have seen elsewhere in the Benchmark, most progress is being seen by producers and manufacturers, whose average score for the Leadership and Innovation section increased from 45% in 2019 to 52% in 2020. In contrast, the average score for the other sub-sectors in this section increased slightly, from 48% to 49% for retailers and wholesalers, and from 17% to 18% for restaurants and bars.
We have seen notable rises in the proportion of producers and manufacturers reporting their involvement in innovation and leadership activities. Fifty-nine percent of producers and manufacturers now report involvement in industry initiatives directed at improving farm animal welfare, an increase from 46% in 2019, whereas reporting by the other sub-sectors on this issue has remained largely unchanged. In addition, the proportion of producers and manufacturers now providing evidence of promoting higher farm animal welfare standards to customers has also increased significantly, from 40% to 60%, compared to relatively unchanged performance on this issue in the other sub-sectors.
Farm Animal Welfare Performance Whilst companies are increasingly reporting animal welfare performance data, the average score achieved in the Performance Reporting and Impact section remains very low. With an average score of just 14% (11% in 2019), it is clear that company performance reporting is neither comprehensive (i.e. the scope of reporting is limited to specified geographies, species or products) nor clearly defined.
It is important to acknowledge the BBFAW’s strict interpretation of the criteria for the questions relating to performance impact, which require companies to report a single figure reflecting their impact on the issue in question across 100% of their global supply chain (N.B. for retailers and wholesalers some of these questions apply to own-brand products only7). Many companies fail to provide sufficient detail in their reported performance data to accurately determine the proportion of animals in their global supply chains that is impacted. For example, companies may report data for a particular country or a particular product line, but they do not provide any context for these data. In the absence of any clarity on what these data represent as a proportion of global supply, we are unable to award companies more than minimal points.

17
The 2020 Benchmark Results in detail
Performance DisclosureFigure 2.4 shows that an increasing proportion of companies are reporting performance data across the specific welfare topics covered by the Benchmark – the avoidance of close confinement, the provision of species-specific environmental enrichment, the avoidance of routine mutilations, the requirement for and the effectiveness of pre-slaughter stunning, long-distance live transportation and welfare outcome measures (WOMs).
There have been some increases in the proportion of companies reporting on the provision of species-specific environmental enrichment, from 13% of companies in 2019 to 22% in 2020, and on the proportion of animals subject to back-up or repeat pre-slaughter stunning, from 5% of companies in 2019 to 13% in 2020. Questions addressing these two issues were added to the Benchmark in 2019 and were scored for the first time in 2020.
Figure 2.4 Performance Reporting by Companies 2014-2020
0 10 20 30 40 50 60 70
0 10 20 30 40 50 60 70
0 10 20 30 40 50 60 70 80 90
% companies reporting welfare outcome measures% animals transported in <8 hours
% animals subject to back-up or repeat stunning% animals pre-slaughter stunned
% animals free from routine mutilations% animals provided with environmental enrichment
% animals free from close confinement
% animals free from close
confinement
% animals provided with environmental
enrichment
% animals free from routine
mutilations
% animals pre-slaughter
stunned
% animals subject to back-up or
repeat stunning
% animals transported in
<8 hours
% companies reporting welfare
outcome measures
2020
2019
2018
2017
2016
2015
2014
2020
2019
2018
2017
2016
2015
2014
2020
2019
2018
2017
2016
2015
2014
2020
2019
2018
2017
2016
2015
2014
2020
2019
2018
2017
2016
2020
2019
2020
2019
202020192018201720162015201420132012
65%
63%
51%
54%
33%
33%
18%
31%
24%
24%
19%
10%
11%
5%
29%
25%
20%
18%
8%
8%
3%
23%
16%
13%
11%
6%
2%
3%
22%
13%
13%
5%
31%
26%
24%
19%
5%
Note: Performance reporting questions have been introduced from 2014, with additional questions introduced in 2016, 2018 and 2019.

The Business Benchmark on Farm Animal Welfare Report 2020
18
Close confinement remains the highest reported area of performance, with 65% of companies reporting at least some data. However, the majority of performance reporting on this topic remains limited to specific countries, species or product lines, with only 5% of companies reporting across all relevant geographies, species and products.
Only 23% of companies report on farm animal welfare outcomes (for example, data on measures such as lameness rates in pigs; feather cover in laying hens; and sea lice infection rates in farmed fish). Despite the importance of welfare outcome measures for evaluating the performance of farm animal welfare systems and practices, company reporting on them remains limited.
Performance Impact Over the last two Benchmark cycles we have gradually increased the emphasis on welfare impact through increasing the weighting of the performance impact questions. In 2020, whilst keeping the overall weighting of the Performance Reporting and Impact section at 35%, the weighting on the 10 performance impact questions has been marginally adjusted from 56% to 60% of the available points in the Performance Reporting and Impact section. This is in line with the BBFAW objective to drive improved animal welfare standards in food industry supply chains.
Whilst 99 of the 150 companies covered by the Benchmark (66%) now score some points within the 10 performance impact questions, 39% of these score points on just one of the 10 questions. Most companies score points for reporting on the proportion of laying hens that is cage-free, which mirrors the proportion of companies with published commitments on the avoidance of cages for laying hens.
Key findings:
• Only one in eight companies reports on the proportion of laying hens free from beak trimming and on the proportion of broiler chickens from strains of birds with improved welfare outcomes and with a slower growth potential.
• Just four companies (3%) report that more than 25% of laying hens is free from beak trimming in their global supply chains.
• Only one company (<1%) reports that more than 25% of broiler chickens in its global supply chain is from strains of birds with improved welfare outcomes and with a slower growth potential.
Despite the generally poor performance in this section, there are some encouraging signs of improvement in the data. For example:
• Eighty-three companies (61%) report on the proportion of laying hens in their global supply chains that is free from close confinement (cage-free).
• Of these, 21 companies (26%) state that more than 50% of the laying hens in their global supply chains is free from close confinement.
• Although low, the proportion of companies that report on the proportion of broiler chickens from strains of birds with improved welfare outcomes and with a slower growth potential has increased to 13% from just 4% in 2019. This question was added to the Benchmark in 2019 and scored for the first time in 2020.
• Thirty-one percent of companies, compared to just 21% in 2019, report on the proportion of animals (including fin fish) in their global supply chains that is pre-slaughter stunned.
• Five percent of companies indicate that 100% of animals (including fin fish) in their global supply chains is pre-slaughter stunned.

19
Accelerating Impact
In addition to producing the annual Benchmark, the BBFAW programme works further to address the challenges and issues identified in this report, and to encourage the changes – in policies, in management systems, in reporting, in performance – that we think are needed to respond to these challenges.
3. Accelerating Impact
The Company and Investor PerspectiveCompany engagement is central to the Benchmark process. Each year, the BBFAW partners and the Secretariat engage directly with companies on their scores in the Benchmark (41% of the companies assessed provided comments on their draft assessments in 2020), on proposed changes to the Benchmark and on the role being played by the Benchmark in driving change in their farm animal welfare policies, practices and performance.
The Secretariat continues to have a high and active level of engagement with investors. The BBFAW Secretariat has worked closely with investors since 20119 to ensure that the Benchmark and associated tools remain relevant to investors, and to help the investment industry to catalyse change in the manner in which companies manage farm animal welfare through their investment decision-making and their engagement with companies.
Companies and investors agree that the Business Benchmark on Farm Animal Welfare has been a key driver for change. The main ways in which BBFAW has driven change have been:
• It provides companies with guidance and clear expectations on how to structure their management processes and reporting.
• It helps companies to understand the expectations and interests of key stakeholders (e.g. clients, customers, investors).
• It enables companies to benchmark themselves against their industry peers. This helps senior management understand the company’s overall performance and can support the internal case for action and for investment.
• It enables comparisons to be made between internal business units and product lines, enabling strengths and weaknesses to be identified.
• It is used by investors to assess the business risks and opportunities of farm animal welfare for individual companies, to provide insights into companies’ quality of management, to assess the suitability of companies for inclusion in screened (ethical) funds, and to identify potential investment opportunities in the food sector.
• It is used by investors in their company engagement, both to prioritise companies for engagement (e.g. to identify leaders and laggards) and to define their expectations of companies (e.g. expectations that companies will achieve a specific tier ranking within a particular period of time).
• It is now seen as the most authoritative global benchmark for the assessment of corporate farm animal welfare practice. Companies use their performance in the Benchmark as tangible evidence of their commitment to farm animal welfare; in fact, 26 of the 150 companies covered by the 2020 Benchmark have reported on their performance in the Benchmark in their corporate communications (e.g. on their websites, in their annual reports and sustainability reports, in media releases).

The Business Benchmark on Farm Animal Welfare Report 2020
20
Box 3.1
The Importance of Impact to InvestorsSince the first BBFAW Benchmark in 2012, the investor perception of farm animal welfare has changed dramatically, from perception as a niche investment issue, to one where there is now widespread awareness of the importance of assessing and managing the investment risks and opportunities related to farm animal welfare.
Through engagement with companies on their approach to farm animal welfare, investors are increasingly looking for evidence that the management processes companies are putting in place are leading to impact on farm animal welfare in supply chains. Such evidence enables investors to assess the effectiveness of the management processes companies have implemented, and therefore the resulting risk and opportunity associated with the company’s approach.
Disconnects between a company’s ability to disclose their management processes and their subsequent impact on farm animal welfare in supply chains, such as those we have found in the BBFAW 2020 data, raise important questions about the effectiveness of company approaches to managing the supply chain risks associated with farm animal welfare.
How Does BBFAW Aim to Accelerate Impact?Improving the welfare of all animals farmed for food is a collective responsibility; a responsibility that clearly extends to food companies and to their investors. This is why the work of the Business Benchmark on Farm Animal Welfare and the efforts of the investors that have signed the Global Investor Statement of Farm Animal Welfare and that participate in BBFAW’s International Investor Collaboration on Farm Animal Welfare is crucial. Investors have played a critical role in making sure that farm animal welfare is on the agenda for food companies, in ensuring that companies have effective systems and processes in place to manage the business risks and opportunities presented by farm animal welfare, and in encouraging these companies to improve the welfare of animals across their entire supply chains.
Over the nine iterations of the Benchmark, we have proactively engaged with the investment community, encouraging investors to use their influence to urge companies to take effective action on farm animal welfare. We have established the first ever Global Investor Statement on Farm Animal Welfare and the BBFAW Global Investor Collaboration on Farm Animal Welfare; these are now supported by 32 and 29 institutional investors respectively, with over £2.1 trillion in assets under management. Furthermore, the results of our ongoing engagements with investors suggest that – as a result of the annual Benchmark itself and the BBFAW Secretariat’s extensive dialogue and capacity-building efforts – investors are increasingly likely to engage with companies to encourage them to better manage the issue of farm animal welfare. This engagement is widely cited by companies as a key driver for them to take action on farm animal welfare.
In 2020, investors in the BBFAW Investor Collaboration wrote to the CEOs of all companies covered by the BBFAW to commend leading and improving companies on their performance in the Benchmark and to challenge poorer performers to improve. In total, 69 of the 150 companies formally responded to investors, which is our highest response rate to date and reflects the influential role of investors in ensuring that farm animal welfare remains on the business agenda.
A key focus of the BBFAW in the years ahead will be to support investor engagement with companies on driving impact disclosure. Impact reporting forms a critical part in enabling investors to assess the effectiveness of company approaches to managing the farm animal welfare risks in their supply chains.
21
Accelerating Impact
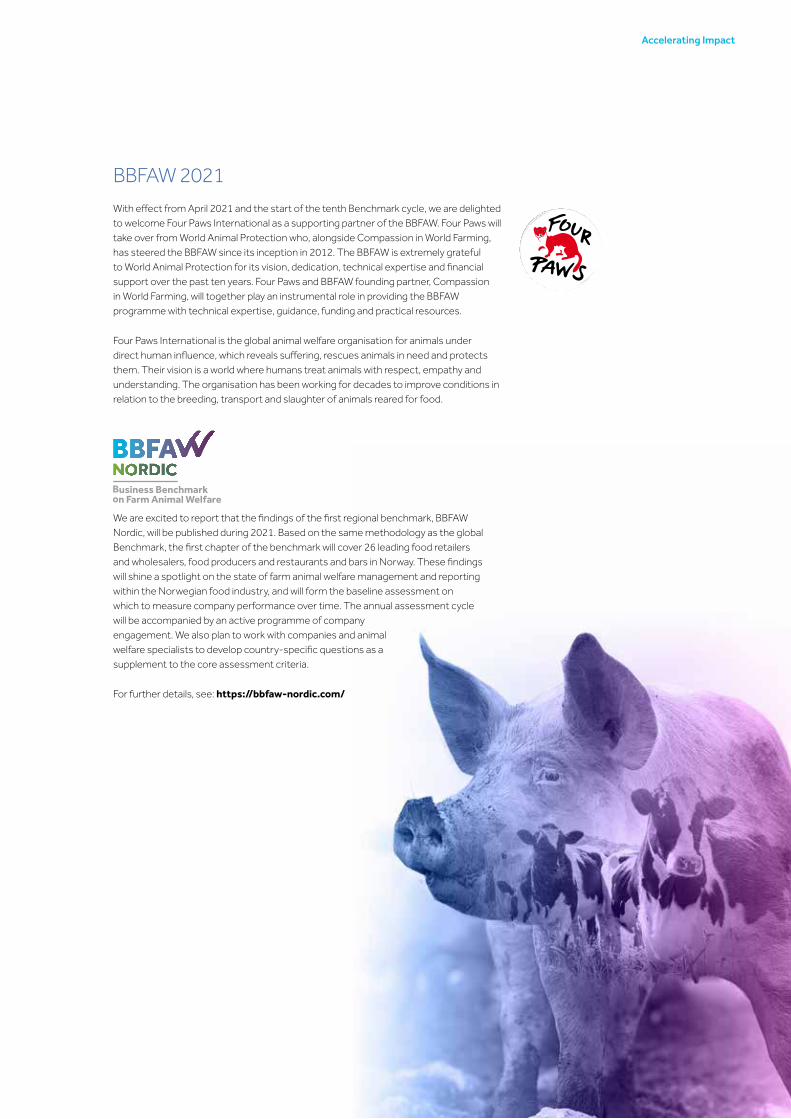
BBFAW 2021With effect from April 2021 and the start of the tenth Benchmark cycle, we are delighted to welcome Four Paws International as a supporting partner of the BBFAW. Four Paws will take over from World Animal Protection who, alongside Compassion in World Farming, has steered the BBFAW since its inception in 2012. The BBFAW is extremely grateful to World Animal Protection for its vision, dedication, technical expertise and financial support over the past ten years. Four Paws and BBFAW founding partner, Compassion in World Farming, will together play an instrumental role in providing the BBFAW programme with technical expertise, guidance, funding and practical resources.
Four Paws International is the global animal welfare organisation for animals under direct human influence, which reveals suffering, rescues animals in need and protects them. Their vision is a world where humans treat animals with respect, empathy and understanding. The organisation has been working for decades to improve conditions in relation to the breeding, transport and slaughter of animals reared for food.
We are excited to report that the findings of the first regional benchmark, BBFAW Nordic, will be published during 2021. Based on the same methodology as the global Benchmark, the first chapter of the benchmark will cover 26 leading food retailers and wholesalers, food producers and restaurants and bars in Norway. These findings will shine a spotlight on the state of farm animal welfare management and reporting within the Norwegian food industry, and will form the baseline assessment on which to measure company performance over time. The annual assessment cycle will be accompanied by an active programme of company engagement. We also plan to work with companies and animal welfare specialists to develop country-specific questions as a supplement to the core assessment criteria.
For further details, see: https://bbfaw-nordic.com/

The Business Benchmark on Farm Animal Welfare Report 2020
22
4. The 2020 Benchmark Methodology and ScopeA detailed description of the benchmark company research process and a full list of the companies covered by the 2020 Benchmark is available in the BBFAW 2020 Methodology Report which accompanies this report.
2020 Benchmark companiesThe 2020 Benchmark assessed 150 food companies. Some changes were made to the universe of companies as follows:
• Dairy Farmers of America (a cooperative) was assessed in place of Dean Foods following its acquisition of the majority of the assets of Dean Foods in the wake of its bankruptcy.
• Tulip Ltd, previously assessed as part of Danish Crown AmbA, was assessed as part of its new parent company, JBS SA, following its acquisition from Danish Crown AmbA.
• Chuying Agro-Pastoral Group delisted from the Shenzhen Stock Exchange, therefore its ownership category has changed from Public to Private.
As a result of these changes, the 2020 Benchmark covered:
• 92 public companies (94 in 2019)
• 39 private companies (38 in 2019)
• 15 cooperatives (14 in 2019)
• 4 joint stock/partnership owned companies.
The 2020 Benchmark companies comprise:
• 52 Retailers & Wholesalers
• 63 Producers & Manufacturers
• 35 Restaurants & Bars.
Global reachThe total number of countries of origin covered by the BBFAW in 2020 remained at 24. Thirty-four percent of the companies are based in Europe, 33% are based in North America, 13% in Asia Pacific, 13% in the UK, and 7% in Latin America.
Checks and balancesThe preliminary company assessments were reviewed and quality checked prior to a technical review conducted by Compassion in World Farming and by World Animal Protection in early December 2020. Following this, the BBFAW companies were invited to review their preliminary assessments to check the factual accuracy of the assessment and to ensure that all relevant information had been considered by the assessor.
Positioning for impactThis year’s methodology was updated to place a greater emphasis on welfare impacts within the performance question scores. It means that 10 welfare impact questions relating to animal quality of life now account for 60% of the weighting of the Performance Reporting and Impact section, compared to 56% in 2019. Overall, the Performance Reporting and Impact section continues to be weighted to represent 35% of the total assessment.
For further details of the BBFAW Methodology and the changes introduced in 2020, see: http://www.bbfaw.com/publications/.
23
The 2020 Benchmark Methodology and Scope
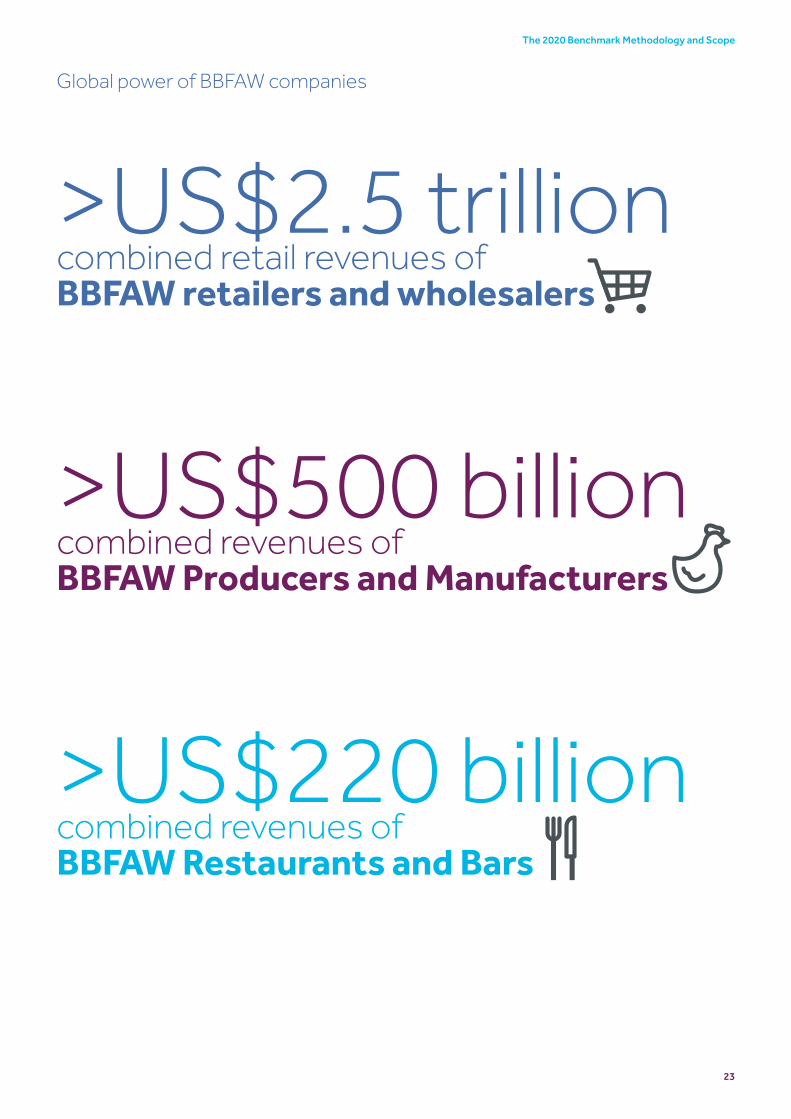
Global power of BBFAW companies
>US$2.5 trillioncombined retail revenues ofBBFAW retailers and wholesalers
>US$500 billion combined revenues ofBBFAW Producers and Manufacturers
>US$220 billion combined revenues of BBFAW Restaurants and Bars

The Business Benchmark on Farm Animal Welfare Report 2020
24
References1 These are:
• Q28. Proportion of laying hens that is cage-free.
• Q29. Proportion of pigs free from sow stalls/gestation crates.
• Q30. Proportion of dairy cows that is free from tethering.
• Q31. Proportion of broiler chickens at lower stocking densities.
• Q32. Proportion of laying hens free from beak trimming.
• Q33. Proportion of pigs free from tail docking.
• Q34. Proportion of dairy cattle free from tail docking.
• Q35. Proportion of broiler chickens from strains of birds with improved welfare outcomes and with a slower growth potential.
• Q36. Proportion of animals (excluding fin fish) pre-slaughter stunned.
• Q37. Proportion of animals (including fin fish) transported within specified maximum transport times.
2 The four new questions introduced in 2019 and scored for the first time in 2020 are:
• Q5. Commitment to provision of effective species-specific environmental enrichment.
• Q21. Reporting on provision of effective species-specific environmental enrichment.
• Q24. Reporting on ineffective pre-slaughter stunning.
• Q35. Proportion of broiler chickens of strains of birds with improved welfare outcomes and with a slower growth potential.
3 Q26. Reporting on welfare outcome measures. See the Summary of Responses to the Public Consultation on the 2020 Business Benchmark on Farm Animal Welfare for further detail. http://www.bbfaw.com/publications/.
4 These are Q28. - Q37.
5 These are: the avoidance of close confinement; the provision of effective species-specific environmental enrichment; the avoidance of products from animals subject to genetic engineering or cloning; the avoidance of growth promoting substances; the reduction or avoidance of antibiotics for prophylactic use; the avoidance of routine mutilations; the avoidance of meat from animals that have not been subjected to pre slaughter stunning; and the avoidance of long-distance live transportation.
6 This question was asked for the first time in 2019 and the scoring has been included in company scores for the first time this year. This is consistent with the way that the BBFAW has previously introduced new criteria.
7 These are:
• Q28. Proportion of laying hens that is cage-free.
• Q29. Proportion of pigs free from sow stalls/gestation crates.
• Q30. Proportion of dairy cows that is free from tethering.
• Q31. Proportion of broiler chickens at lower stocking densities.
• Q32. Proportion of laying hens free from beak trimming.
• Q33. Proportion of pigs free from tail docking.
• Q34. Proportion of dairy cattle free from tail docking.
• Q35. Proportion of broiler chickens of strains of birds with improved welfare outcomes and with a slower growth potential.
8 These are Q28. - Q37.
9 We estimate that we have engaged with over 300 institutional investment organisations in this time, and with many of these on multiple occasions.

25
Appendices
AcknowledgementsThis report has been prepared by the BBFAW Secretariat run by Chronos Sustainability Ltd. The lead authors were Nicky Amos, Dr Rory Sullivan and Dr Nathan Rhys Williams, with contributions from Elisabeth Tjärnström, Darren Vanstone, Dr Steve Webster, Dr Heleen van de Weerd, Lyndsey Hurley, Dr Jon Day, and Robert Black.
We would like to thank the following for their support of this project and their contribution to the design and development of the 2020 Benchmark:
• Philip Lymbery, Dr Tracey Jones, Louise Valducci and the Food Business team (Compassion in World Farming).
• Steve McIvor, Dr Sarah Ison, Rafel Servent, Dr Nancy Clarke and the Corporate Engagement team (World Animal Protection).
• The many companies, investors and other stakeholders who participated in meetings and teleconferences, who provided input to the 2020 Benchmark consultation process, and who provided feedback on the assessment process and methodology.
After ten years of supporting the BBFAW, World Animal Protection has indicated that it will no longer be a BBFAW partner beyond March 2021. The BBFAW is grateful to World Animal Protection for its leadership and dedication to the BBFAW programme. The success of the BBFAW can be attributed to its founding partners, Compassion in World Farming and World Animal Protection, who, since 2011, have provided the vision, technical expertise, guidance, funding and practical resources to the programme. These organisations acknowledged that the ability of any benchmark to drive change at corporate and industry levels could only be realised over the longer-term, and, as such, their commitment to supporting the BBFAW over nine iterations demonstrates exceptional commitment to the programme and to both organisations’ strategic aims of advancing animal welfare standards in the world largest food companies. The Technical Working Group wishes World Animal Protection continued success in protecting the lives of billions of animals around the world. The Group also looks forward to continuing its work on the BBFAW with Compassion in World Farming and their new BBFAW partner, Four Paws.
Photography creditsCover:Clara Bastian/istockphoto.comDavid Tadevosian/shutterstock.com
ContentsChokniti Khongchum/shutterstock.comDeyana Stefanova Robova/shutterstock.com
P6:jess311/istockphoto.comgalsand/shutterstock.com
P12:Ed Phillips/shutterstock.comABrowne/shutterstock.com
P21:ChristiLaLiberte/istockphoto.comClara Bastian/istockphoto.com

For further information please email [email protected]