For use with Happy Wanderer PRO TV & satellite signal finder
Upload
khangminh22Category
view
0download
0
MASSACHUSETTS INSTITUTE OF TECHNOLOGY
ARTIFICIAL INTELLIGENCE LABORATORY
Artificial Intelligence Memo Number 285
July 1971 Revised December 19 73
The 'Binford-Horn LINE-FINDER
Berthold K. P. Horn
ABSTRACT
This paper briefly describes the processing performed in the course of producing a line drawing from an image obtained through an image dissector camera. The edge-marking phase uses a non-linear parallel line-follower. Complicated statistical measures are not used. The line and vertex generating phases use a number of heuristics to guide the transition from edge-fragments to cleaned- up line-drawing. Higher-level understanding of the blocks-world is not used. Sample line-drawings produced by the program are i ncl uded.
Work reported herein was conducted at the Artificial Intelligence Laboratory, a Massachusetts Institute of Technology research program supported in part by the Advanced Research Projects Agency of the Department of Defense and monitored by the Office of Naval Research under Contract Number N00014-70-A-0362-0005.
Reproduction of this document, in whole or in part, is permitted for any purpose of the United States Government.
* This is a revised version of Vision Flash 16 (July 1971).

PAGE 4
1. THE LINE-FINDER. -
Programs able to produce line-drawings from images of single
convex polyhedra have existed for several years. It was thought
that it should be easy to generalize the methods used to deal with
more complex blocks-world scenes involving obscuration, shadows and
mutual illumination. Only recently, however, has it become
possible to reliably produce line-drawings of images of sets of
polyhedra. There are two main problems. Firstly, images of sets
of polyhedra are not as simple as one might expect. Secondly,
current scene-analysis programs demand a complete line-drawing with
well-defined vertices.
One might reasonably conjecture that the image of a set of
polyhedra ought to consist of polygonal areas of more or less
uniform intensity. These areas should be separated by step-like
transitions in intensity at the lines corresponding to the
projections of the edges of the objects. This is not the case
because of mutual illumination, shadowing, scattering of 1 ight,
surface smudges, translucency'and a number of defects in the
imaging device [Horn 19691. Usually in fact, the variation in
intensity within one region (corresponding to a face or the visible
portion of a face of an object) is often larger than the difference
between the intensity of adjacent regions. Furthermore, only the
most obvious edges. (such as those separating the scene from the
PAGE 5 .
back-ground) are associated with anything like a step-like
transition in intensity. Many transitions are instead roof-shaped
or flat except for a small peak right on the edge [Herskovits 6
Binford 19701.
The most obvious image degrading effect introduced by the
sensing device is noise. In our case this amounted to about 1. to
2% of the signal magnitude [Horn 19691. There is little point
trying to improve on this, since the surface visual noise is not
much smaller even for clean, evenly painted polyhedra. One of many
other device defects is internal scattering, which reduces the
contrast between adjacent regions by almost a factor of two and
produces annoying gradients within regions [Horn 19721.
2. CLASSIFICATION 01 LINE-FINDERS. -
Line-finders can be classified according to whether they are
region-oriented or edge-oriented. Region-oriented line-finders
attempt to find repions of more or less homogeneous intensity. The
areas not conglomerated in this fashion are then thinned out and
lines are fitted to them. Edge-oriented line-finders avoid the
problems of inhomogeneous regions and the blending together of
adjacent regions. They instead determine likely edge-points and
link these up into edge-fragments. The fragments are later
combined into 1 ines.

PAGE 5 .
back-ground) are associated with anything like a step-like
transition in intensity. Many transitions are instead roof-shaped
or flat except for a small peak right on the edge [Herskovits 6
Binford 19701.
The most obvious image degrading effect introduced by the
sensing device is noise. In our case this amounted to about 1, to
2% of the signal magnitude [Horn 19691. There is little point
trying to improve on this, since the surface visual noise is not
much smaller even for clean, evenly painted polyhedra. One of many
other device defects is internal scattering, which reduces the
contrast between adjacent regions by almost a factor of two and
produces annoying gradients within regions [Horn 19721.
2. CLASSIFICATION 02 LINE-FINDERS. -
Line-finders can be classified according to whether they are
region-oriented or edge-oriented. Region-oriented line-finders
attempt to find regions of more or less homogeneous intensity. The
areas not conglomerated in this fashion are then thinned out and
lines are fitted to them. Edge-oriented line-finders avoid the
problems of inhomogeneous regions and the blending together of
adjacent regions. They instead determine likely edge-points and
link these up into edge-fragments. The fragments are later
combined into 1 ines.
PAGE 6
Line-finders can also be classified according to whether or
not the filter function (also called the local predi'cate) applied
to the image is linear. If visual noise were spatially
independent, a case could be made for an optimal linear predicate.
This however is not the case, since smudges, for example, have a
distinctly non-random spatial distribution. Nan-linear methods,
while more complex, have a clear advantage on real images.
Line-finders can be further classified according to whether
they use a fixed raster scan or a search pattern which follows
lines. The first method is convenient from the point of view of
reading intensity values asynchronously ahead of time and also for
program simplicity. In some cases the imaging device forces the
use of a raster scan, par'ticularly if it is an Integrating device.
Line-followers on the other hand can be made to be more sensit'ive
and accurate at the price of program complexity.
3. EDGE-MARK I NG. -
Input is obtained from a random-access image-dissector camera
or a picture stored as a disk'file. The edge-marker is a non-
linear parallel line-follower. That is, several lines are followed
simultaneously, while the image is being scanned in a raster-1 ike
fashion, thus combining the good features of raster-scan with those
of line-following. The separation between scan-lines is larger
than the spacing of image points sampled along a line. Three scan-
PAGE 7 .
lines are considered at any one time. The intensities are
correlated with the three most common intensity tran'sitions, namely
the step, the roof and the peak. If any correlated value exceeds e
threshold (adjusted according to the known signal-to-noise ratio),
a check is made for a local maximum.
Once a likely edge-point .(also called feature-point or
inhomogeneous point) is discovered, a subroutine checks to see if
it could be the continuation of a line already being followed. The
test involves a check on proximity and angle as well as such
attributes as type, direction and size of intensity transition. If
the edge-point cannot form the continuation of an existing line,
yet is strong and not too close to any other line, it will be used
as the starting point of a new line. This new line will also be
followed on subsequent scans.
A line that cannot be continued in this manner is retained
only if its length exceeds some minimum. One pass over the scene
consisting of successive horizontal lines picks up all edges within
about fifty degrees of vertical. A second pass consisting of
vertical lines does the same ior edges within about fifty degrees
of horizontal. For a typical scene about a million intensity
values are read from the image, and the whole process takes a few
minutes.

PAGE 8
We end up with a number of lists of tentative edge-points.
Some of these lists will represent more than one edge (an L-joint
for example), while some edges will be represented by more than one.
list (a fragmented edge for example). These lists will often not
include points very close to vertices, except at L-joints. This is
because lines are prevented from encroaching too closely on each
other by the nature of the correlation process and some of the
tests described. Each list of tentative edge-points has associated
with it a number of attributes such as type, direction and size of
the intensity transition and how sure the program is that the edge-
fragments are not merely due to noise.
Up to this stage not very many heuristics have to be invoked
and consequently the possibility of corrupting the. data is small.
Numerous line-finders have been developed to this stage, few
however produce as clean a set of tentative edge-points as T.
Binford's program. Very few line-finders have proceeded beyond
this level to actually create the kind of useful cleaned-up line-
drawing required by current higher-level scene-analysis programs.
In part this is often due to inadequate edge-marking, but more
of ten it is because unexpected difficulties are met when dealing
with what at first sight seems a simple process: forcing the data
into the form of a line-drawing with well-defined vertices.

PAGE 9
4. GENERAT I NG LINES. -
Since some lists may contain feature points of more than one
edge, the lists have to be segmented. This is done recursively at
the point of maximum distance from the line connecting the end-
points of the list of edge-points. Segmentation proceeds until the
remaining edge-points fall within a tolerance band. Re-
segmentation is used to cope with portions that are parallel to the
1 ine joining the end-points. Once segmented, least-squares 1 ines
are fitted to the lists [Horn 19721 (The partial results of this
fit continue to be part of the data associated with the line, to
a1 low combining 1 ines later without loss of accuracy).
We next have to combine partial lines corresponding to the
same edge. Overlapping lines are the first to be considered in
this process. A number of tests are applied to avoid combining
unrelated 1 ines. These tests include checks on proximity, relative
orientation, perpendicular distance of the end-points from the
potential combined line and so an. Lines more or less co-linear
are combined in a similar manner provided the gap between them is
reiatively small. Any short iines remaining at this stage are
dl scarded.
The line-drawing is fairly recognizable at this stage, lacking
only vertices. The lines have been distorted very little in this
process, unless unrelated, lines happened to be combined despite the

PAGE 10
stringent tests. The less conservative and more difficult part is
yet to come. The data at this stage is quite compact already apd
might profitably be handed to a program with some understanding of
blocks-world scenes instead of the somewhat arbitrary heuristic
program described next.
5. GENERATING VERTICES. -
Some of the vertices are clearly indicated by the close
convergence of lines. A first estimate of the location of such a
vertex is made by considering the center of gravity of the end-
points of the lines (if there are only two lines, their
intersection is used instead). A search is then made for all lines
which end near this point and whose extension would pass very close
to it. The vertex is finally declared at the point of least-
squares perpendicular distance from these lines [Horn 19721. The
appropriate lines are then conntcted to the vertex.
Next, the program tries to establish T-joints. That is, it
searches for lines that have an end-point close to another line and
checks if it would we reasonable to extend the line to form a new
vertex. A K-joint is similarly made where a vertex is close to a
line. Finally, crossing lines give rise to X-joints. Numerous
heuristics inform this process; for example, lines already
connected at one end are treated preferentially to those still free
at both ends. Alllvertices have now been found and an attempt is

PAGE 11 -
made to extend unattached lines to nearby vertices. The extension
must be short and pass very close to the vertex to be accepted.
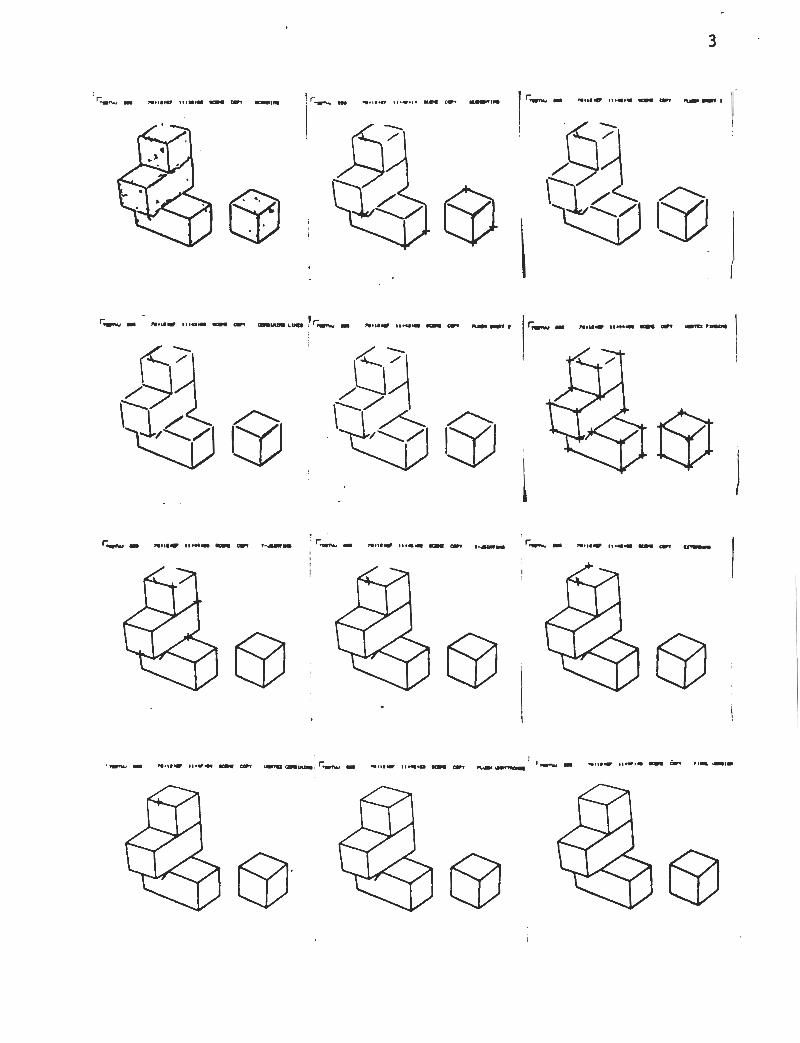
Following this, vertices which are close together are
conglomerated. Any lines not properly attached at this stage are
discarded. The progress of these steps in the processing can be
slowed down and viewed on a display, before the final product is
disgorged in a convenient LISP-readable format.
The heuristics, which developed empirically, depend on certain
tolerances which are initially calculated in terms of the line-scan
interval, the known resolution of the imaging device, and the
signal-to-noise ratio. These factors could be "tuned" to improve
performance and accuracy, but this is probably not worth the effort
(the time would be better spent on designing new ways of directing
the vertex creation phase). A large portion of this assembly
language program is concerned with debugging, displaying and
performing the required list-processing. The data-base is
maintained in two forms: As assertions about lines (and what
vertices they connect to) and as assertions about vertices (and
what lines impinge on them). These two forms are kept consistent
by demons invoked vhen assertions are added, removed or changed in
either data-base.
The line and vertex generating phases of the program
frequently need to settle questions of proximity for both points
and lines. A set of four.superimposed rectangular grids covering

PAGE 12
the image is used as a set of buckets for this purpose. This
method is sometimes referred to as multi-entry coding [Horn 19721.
Each point is entered into four buckets, and each line will appear
in many. This makes for high speed, despite the need for a number
of iterative applications of various heuristics to the whole data-
structure.
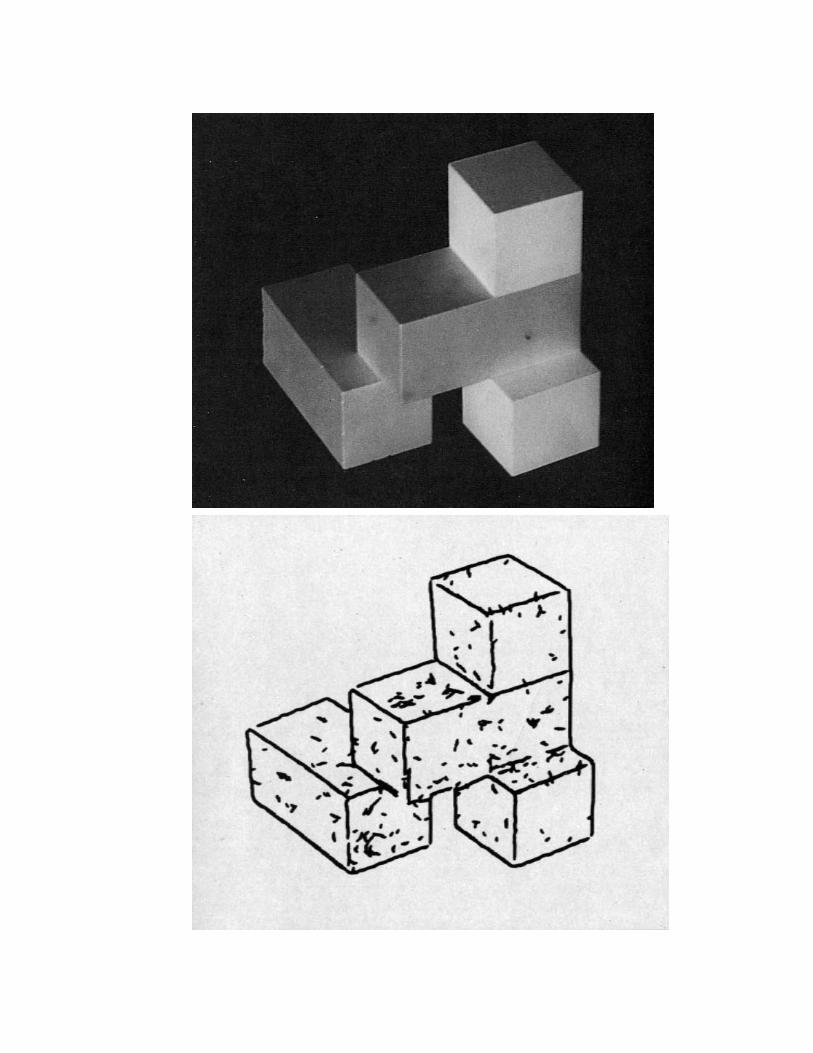
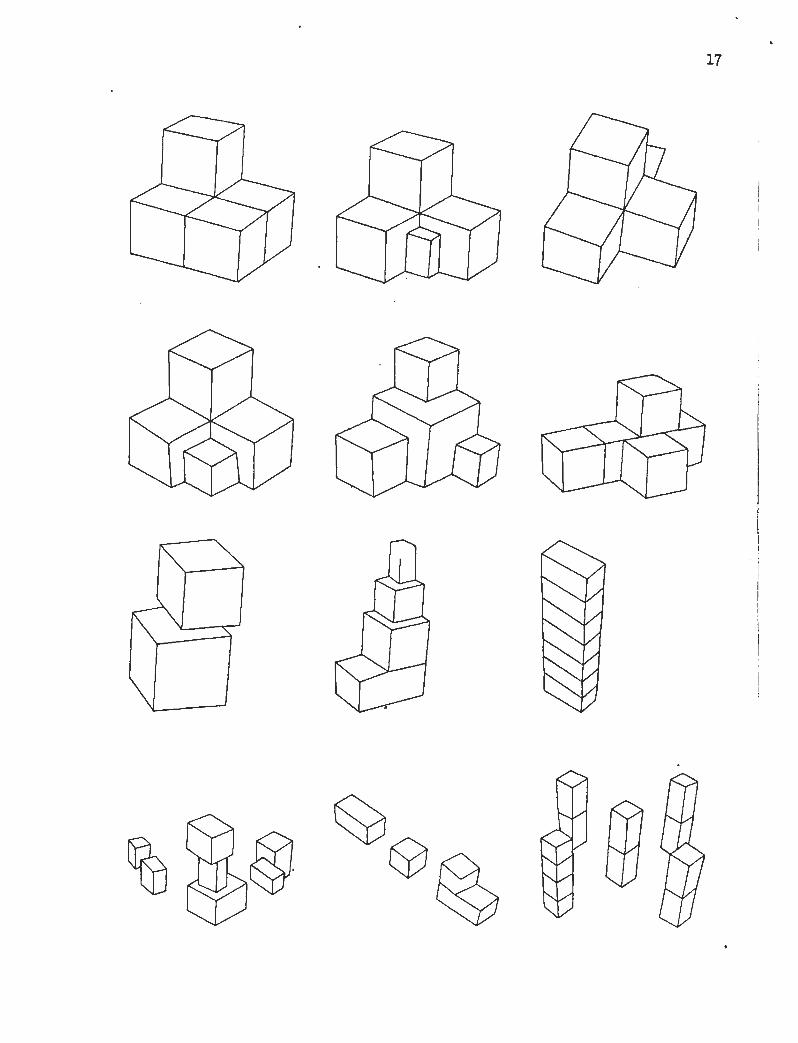
6 PERFORMANCE. -
An idea about how to produce line-drawings from images is of
little use until it has been demonstrated by a working program.
The program discussed here has processed over a hundred scenes and
produces excellent line-drawings of simple blocks-world scenes. In
more complicated cases, a number of shortcomings can be observed.
The simplest and easiest to deal with is the absence or
incompleteness of some of the lines, usually due to a lack of
contrast between adjacent faces of an object. At times extra lines
are introduced by shadows, smudges and noise. There is a trade-off
between these two effects, and since present scene-analysis
programs can handle missing lines better than extra lines, the
threshold is set to favour thd former.
Occasionally a section of a line-drawing will be garbled,
usually due to the combination of two unrelated vertices. This
causes some distortion of the lines and may make the line-drawing
locally uninterpretable. This last effect in particular is a

PAGE 13 -
function of the amount of detail and can be avoided by using a
finer resolution at the cost of an increase in scan and computation
time. This of course is only possible if the imaging device has
sufficient resolution.
7. COMMENTS ON THIS APPROACH. -
Some of the ways in which images of sets of polyhedra differ
from our intuitive model of equal intensity polygonal areas have
important implications in other areas. Mutual illumination for
example will prove to be a problem when one is developing a program
that exhibits color constancy. Further, it should be noted that
some of the edges missed by this program will also be missed by
line-verifiers: when f0110~in~ lines one can afford to be quite
sensitive. Fortunately the better line-proposers are very
conservative and hardly ever propose a line were there shouldn't be
one. One could perhaps accept their proposals without attempting
verification.
The only features that can be reliably determined from a
corrupted image are those with significant spatial extension.
Without such extension we cannot apply the integrative processes
necessary to collect evidence for the existence of the feature.
Vertices for this reason are perhaps not primitive elements of an
image, but exist only as the intersection of lines. Letting the
line-drawing program establish vertices introduces inaccuracies,

PAGE 14
because it may join unrelated lines.
8. HOW TO DO BETTER. - ---
This program has no idea what a reasonable line-drawing should
look like when it represents an image of polyhedra. Instead it is
very general and will find arbitrary line-drawings. Observing the
particular way in which things sometimes go wrong, one quickly
comes to the conclusion that higher-level understanding of the
scene being analysed could greatly improve the line and vertex
creating phase of this program. As things stand now this
understanding comes only after the line-finder has done its work.
It would be hard to embed this kind of knowledge into such a large
assembly language program. At the same time trying to implement
the wlow-levelw routines in a higher level language would cause
great inefficiencies.
9. HI STOR I CAL NOTE. -
The line-finder described here consists of an edge-marker due
to- T. Binford and a line-drawkr due to B. K. P. Horn. It was used as
part of the system of vision and manipulation programs developed
for the copy-demo by P.H. Winston, E. Freuder and B.K.P. Horn in
the fall of 1970 [Winston 1971 6 19721. It is also the
nhierarchicalw program referred to by Shirai [Shirai 19731.
PAGE 15 .
10. REFERENCES. -
Herskovits A. and Binford T. (1970) "On Boundary Detectionw A. I. Memo 183 (Cambridge, Mass.: A. I. Lab, M. I. T. 1
Horn B.K.P. (19691 "The Image Dissector 'Eyesm' A. I.Memo 178 (Cambridge, Mass.: A. I. Lab, M. I.T. )
Horn B. KO P. (1972) VISMEM: A bag of 'robotics' formulaew Vision Flash 34 (Cambridge, Mass.: A. I. Lab, M. I.T.)
Shirai Yo (1973) "A Context Sensitive Line Finder for Recognition of Polyhedra1' Artificial Intelligence, Vol 4, No 2.
Winston P. H. (1971, 1972) Vision Flashes 7, 8, 9, 15 and 30 (Cambridge, Mass. : . A. I. Lab, M. I. T.
Winston P.H. (1972) !'The M. I.T. Robot1', Machine Intelligence 7 (Edinburgh: Edinburgh University Press)


Copyright © 2022 FDOKUMEN