SOFIA: a flexible source finder for 3D spectral line data
8
MNRAS 448, 1922–1929 (2015) doi:10.1093/mnras/stv079 SOFIA: a flexible source finder for 3D spectral line data Paolo Serra, 1‹ Tobias Westmeier, 2 Nadine Giese, 3 Russell Jurek, 1 Lars Fl ¨ oer, 4 Attila Popping, 2 , 5 Benjamin Winkel, 6 Thijs van der Hulst, 3 Martin Meyer, 2 B¨ arbel S. Koribalski, 1 Lister Staveley-Smith 2 , 5 and H´ el` ene Courtois 7 1 CSIRO Astronomy and Space Science, Australia Telescope National Facility, PO Box 76, Epping, NSW 1710, Australia 2 ICRAR, M468, The University of Western Australia, 35 Stirling Highway, Crawley, WA 6009, Australia 3 University of Groningen, Kapteyn Astronomical Institute, Landleven 12, NL-9747 AD, Groningen, the Netherlands 4 Argelander-Institut f¨ ur Astronomie, Auf dem H¨ ugel 71, D-53121 Bonn, Germany 5 ARC Centre of Excellence for All-sky Astrophysics (CAASTRO), 44 Rosehill Street, Redfern, NSW 2016, Australia 6 Max-Planck-Institut f¨ ur Radioastronomie, Auf dem H¨ ugel 69, D-53121 Bonn, Germany 7 Universit´ e Lyon 1, CNRS/IN2P3, Institut de Physique Nucl´ eaire, Lyon, France Accepted 2014 December 30. Received 2014 December 22; in original form 2014 July 28 ABSTRACT We introduce SOFIA, a flexible software application for the detection and parametrization of sources in 3D spectral line data sets. SOFIA combines for the first time in a single piece of software a set of new source-finding and parametrization algorithms developed on the way to future H I surveys with ASKAP (WALLABY, DINGO) and APERTIF. It is designed to enable the general use of these new algorithms by the community on a broad range of data sets. The key advantages of SOFIA are the ability to: search for line emission on multiple scales to detect 3D sources in a complete and reliable way, taking into account noise level variations and the presence of artefacts in a data cube; estimate the reliability of individual detections; look for signal in arbitrarily large data cubes using a catalogue of 3D coordinates as a prior; provide a wide range of source parameters and output products which facilitate further analysis by the user. We highlight the modularity of SOFIA, which makes it a flexible package allowing users to select and apply only the algorithms useful for their data and science questions. This modularity makes it also possible to easily expand SOFIA in order to include additional methods as they become available. The full SOFIA distribution, including a dedicated graphical user interface, is publicly available for download. Key words: methods: data analysis. 1 INTRODUCTION The detection of astronomical signal above instrumental noise is a crucial aspect of all astronomy observations. The techniques em- ployed to detect and characterize this signal depend on the type of data being analysed (see Masias et al. 2012 for a review). Standard methods and tools have emerged in fields with a large community base such as 2D imaging (e.g. SEXTRACTOR; Bertin & Arnouts 1996) and 1D spectroscopy (e.g. GANDALF; Sarzi et al. 2006). In other fields with relatively fewer users, detection algorithms vary significantly between projects. This is the case for studies based on 3D spectral line data (for brevity, data cubes), where the flux of a spectral line is mapped as a function of position on the sky and line-of-sight velocity of the emitting matter. The diversity of source-finding methods for data cubes is at least partly due to the diversity of 3D structure of the sources being stud- E-mail: [email protected] ied. We illustrate this point in Fig. 1, where we show a data cube of the ATLAS 3D H I survey (Serra et al. 2012). In this figure, the cen- tral object is bright (and therefore easy to detect) but has a complex 3D structure, including a low surface brightness extension towards large RA. On the contrary, the top object is bright and relatively simple as emission is confined within a small range of RA and Dec. Finally, the bottom object is the typical case of a resolved, edge-on galaxy where the two peaks of the double-horn velocity profile are clearly visible, and detection of the faint emission between the two peaks is challenging. An ideal 3D source finder should be able to detect and parametrize all these different sources in a complete and reliable way. Radio single dishes and interferometers have traditionally been the most common telescopes used to construct data cubes (although optical integral-field spectrographs are now also generating large numbers of such cubes – e.g. Cappellari et al. 2011; Croom et al. 2012; S´ anchez et al. 2012). The upgrade and continuing operation of existing radio telescopes, as well as the construction of the Square Kilometre Array and its precursors, are leading to a rapid increase C 2015 The Authors Published by Oxford University Press on behalf of the Royal Astronomical Society Downloaded from https://academic.oup.com/mnras/article/448/2/1922/1058751 by guest on 14 January 2022
-
Upload
khangminh22 -
Category
Documents
-
view
2 -
download
0
Transcript of SOFIA: a flexible source finder for 3D spectral line data

MNRAS 448, 1922–1929 (2015) doi:10.1093/mnras/stv079
SOFIA: a flexible source finder for 3D spectral line data
Paolo Serra,1‹ Tobias Westmeier,2 Nadine Giese,3 Russell Jurek,1 Lars Floer,4
Attila Popping,2,5 Benjamin Winkel,6 Thijs van der Hulst,3 Martin Meyer,2
Barbel S. Koribalski,1 Lister Staveley-Smith2,5 and Helene Courtois7
1CSIRO Astronomy and Space Science, Australia Telescope National Facility, PO Box 76, Epping, NSW 1710, Australia2ICRAR, M468, The University of Western Australia, 35 Stirling Highway, Crawley, WA 6009, Australia3University of Groningen, Kapteyn Astronomical Institute, Landleven 12, NL-9747 AD, Groningen, the Netherlands4Argelander-Institut fur Astronomie, Auf dem Hugel 71, D-53121 Bonn, Germany5ARC Centre of Excellence for All-sky Astrophysics (CAASTRO), 44 Rosehill Street, Redfern, NSW 2016, Australia6Max-Planck-Institut fur Radioastronomie, Auf dem Hugel 69, D-53121 Bonn, Germany7Universite Lyon 1, CNRS/IN2P3, Institut de Physique Nucleaire, Lyon, France
Accepted 2014 December 30. Received 2014 December 22; in original form 2014 July 28
ABSTRACTWe introduce SOFIA, a flexible software application for the detection and parametrization ofsources in 3D spectral line data sets. SOFIA combines for the first time in a single piece ofsoftware a set of new source-finding and parametrization algorithms developed on the way tofuture H I surveys with ASKAP (WALLABY, DINGO) and APERTIF. It is designed to enablethe general use of these new algorithms by the community on a broad range of data sets. Thekey advantages of SOFIA are the ability to: search for line emission on multiple scales to detect3D sources in a complete and reliable way, taking into account noise level variations and thepresence of artefacts in a data cube; estimate the reliability of individual detections; look forsignal in arbitrarily large data cubes using a catalogue of 3D coordinates as a prior; providea wide range of source parameters and output products which facilitate further analysis bythe user. We highlight the modularity of SOFIA, which makes it a flexible package allowingusers to select and apply only the algorithms useful for their data and science questions.This modularity makes it also possible to easily expand SOFIA in order to include additionalmethods as they become available. The full SOFIA distribution, including a dedicated graphicaluser interface, is publicly available for download.
Key words: methods: data analysis.
1 IN T RO D U C T I O N
The detection of astronomical signal above instrumental noise is acrucial aspect of all astronomy observations. The techniques em-ployed to detect and characterize this signal depend on the type ofdata being analysed (see Masias et al. 2012 for a review). Standardmethods and tools have emerged in fields with a large communitybase such as 2D imaging (e.g. SEXTRACTOR; Bertin & Arnouts 1996)and 1D spectroscopy (e.g. GANDALF; Sarzi et al. 2006). In other fieldswith relatively fewer users, detection algorithms vary significantlybetween projects. This is the case for studies based on 3D spectralline data (for brevity, data cubes), where the flux of a spectral lineis mapped as a function of position on the sky and line-of-sightvelocity of the emitting matter.
The diversity of source-finding methods for data cubes is at leastpartly due to the diversity of 3D structure of the sources being stud-
� E-mail: [email protected]
ied. We illustrate this point in Fig. 1, where we show a data cube ofthe ATLAS3D H I survey (Serra et al. 2012). In this figure, the cen-tral object is bright (and therefore easy to detect) but has a complex3D structure, including a low surface brightness extension towardslarge RA. On the contrary, the top object is bright and relativelysimple as emission is confined within a small range of RA and Dec.Finally, the bottom object is the typical case of a resolved, edge-ongalaxy where the two peaks of the double-horn velocity profile areclearly visible, and detection of the faint emission between the twopeaks is challenging. An ideal 3D source finder should be able todetect and parametrize all these different sources in a complete andreliable way.
Radio single dishes and interferometers have traditionally beenthe most common telescopes used to construct data cubes (althoughoptical integral-field spectrographs are now also generating largenumbers of such cubes – e.g. Cappellari et al. 2011; Croom et al.2012; Sanchez et al. 2012). The upgrade and continuing operationof existing radio telescopes, as well as the construction of the SquareKilometre Array and its precursors, are leading to a rapid increase
C© 2015 The AuthorsPublished by Oxford University Press on behalf of the Royal Astronomical Society
Dow
nloaded from https://academ
ic.oup.com/m
nras/article/448/2/1922/1058751 by guest on 14 January 2022

SOFIA 3D source finder 1923
Figure 1. Volume rendering of an H I data cube showing that individualsources have a complex and diverse 3D structure. This makes their detectionand accurate parametrization challenging.
in the number and size of data cubes. Standard and sufficiently gen-eral source-finding tools will be necessary to analyse these data,and recent work has started addressing this need (see e.g. DUCHAMP
by Whiting 2012). In this paper we introduce SOFIA, a new, flex-ible Source-Finding Application for data cubes, which combinesdetection algorithms and techniques from several source finders.
SOFIA is designed to work on any data cube independent oftelescope or observed spectral line. However, its development ispart of preparatory work for a few specific, upcoming H I surveys:WALLABY, a blind H I survey of 3/4 of the entire sky out toz ∼ 0.25 to be carried out with the Australian Square KilometreArray Pathfinder (ASKAP; see Koribalski 2012a); DINGO, a deepH I survey out to z ∼ 0.4 (also to be carried out with ASKAP; seeMeyer 2009); and the H I surveys planned for APERTIF (Verheijenet al. 2008). This preparatory work has resulted in the developmentof a number of new source-finding algorithms, which are describedin a series of papers referred to in the next section (for a summary seeKoribalski 2012b). SOFIA puts these different algorithms togetherfor the first time in a coherent, flexible and publicly available pieceof software.
SOFIA can be obtained from https://github.com/SoFiA-Admin/SoFiA. On the same webpage we provide a list of require-ments, installation instructions and a user manual. The aim of thispaper is to describe how SOFIA operates on data cubes and therebyprovide a reference for current and future users.
2 D ESCRIPTION O F S OF IA
SOFIA is a modular application whose aim is to detect andparametrize sources in a data cube. The flowchart in Fig. 2 showsthe various modules that users can choose to use (or not to use) inthe order in which they are executed by SOFIA. Once an input datacube (or a sub-cube selected by the user) is loaded, these modulesallow users to:
Inputdatacube
Selectsub-cube
Flag badvoxels
Applyweights
Inputweightscube
2D-1DConvolution Noise nor-malization
FIL
TE
RS
S+C finderThresholdfinder
CNHIfinder
SOU
RC
EFIN
DE
RS
Mergedetectedvoxels
Inputmaskcube
Reject falsedetections
Optimizemask
Parame-terize
Filteroutput
Outputmaskcube
Sourcecatalogue
Momentmaps
Single-source
products
Figure 2. SOFIA flowchart. We highlight the ‘Filter output’ module with adashed box as this will become available in future releases of SOFIA.
(i) modify the input cube by applying flags, weights, or a set offilters;
(ii) detect the spectral line signal;(iii) identify sources by merging detected voxels together;(iv) reject false detections;(v) optimize the mask of individual sources;(vi) measure source parameters;
MNRAS 448, 1922–1929 (2015)
Dow
nloaded from https://academ
ic.oup.com/m
nras/article/448/2/1922/1058751 by guest on 14 January 2022
1924 P. Serra et al.
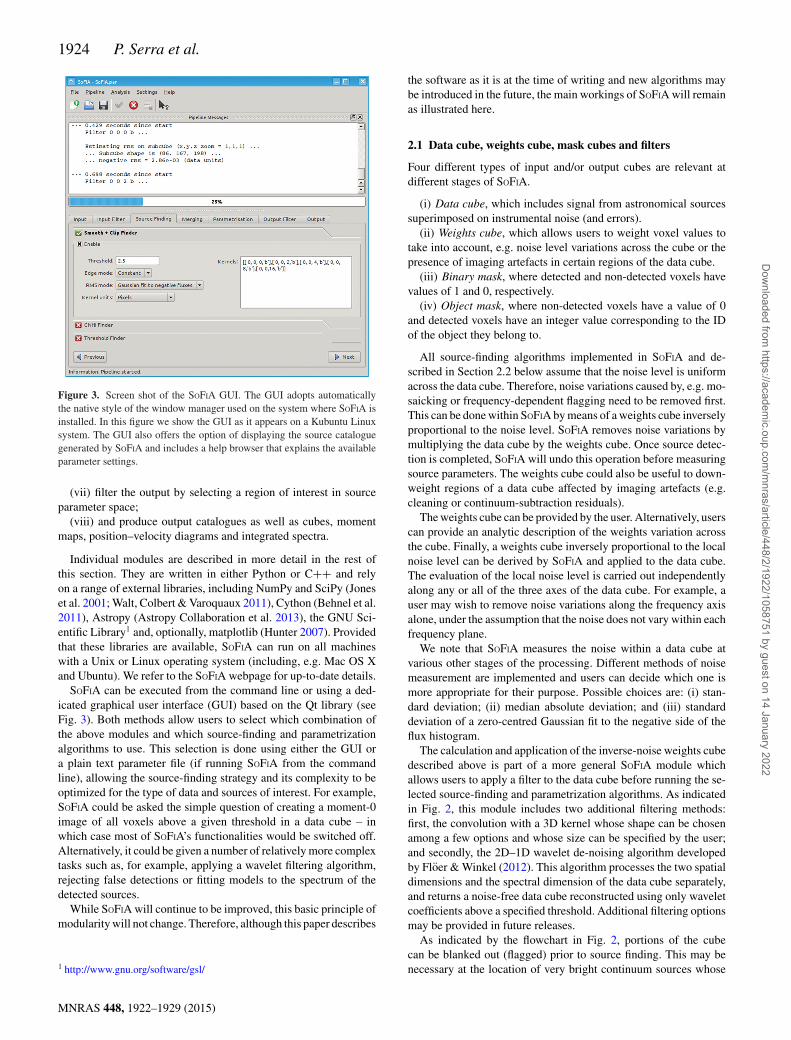
Figure 3. Screen shot of the SOFIA GUI. The GUI adopts automaticallythe native style of the window manager used on the system where SOFIA isinstalled. In this figure we show the GUI as it appears on a Kubuntu Linuxsystem. The GUI also offers the option of displaying the source cataloguegenerated by SOFIA and includes a help browser that explains the availableparameter settings.
(vii) filter the output by selecting a region of interest in sourceparameter space;
(viii) and produce output catalogues as well as cubes, momentmaps, position–velocity diagrams and integrated spectra.
Individual modules are described in more detail in the rest ofthis section. They are written in either Python or C++ and relyon a range of external libraries, including NumPy and SciPy (Joneset al. 2001; Walt, Colbert & Varoquaux 2011), Cython (Behnel et al.2011), Astropy (Astropy Collaboration et al. 2013), the GNU Sci-entific Library1 and, optionally, matplotlib (Hunter 2007). Providedthat these libraries are available, SOFIA can run on all machineswith a Unix or Linux operating system (including, e.g. Mac OS Xand Ubuntu). We refer to the SOFIA webpage for up-to-date details.
SOFIA can be executed from the command line or using a ded-icated graphical user interface (GUI) based on the Qt library (seeFig. 3). Both methods allow users to select which combination ofthe above modules and which source-finding and parametrizationalgorithms to use. This selection is done using either the GUI ora plain text parameter file (if running SOFIA from the commandline), allowing the source-finding strategy and its complexity to beoptimized for the type of data and sources of interest. For example,SOFIA could be asked the simple question of creating a moment-0image of all voxels above a given threshold in a data cube – inwhich case most of SOFIA’s functionalities would be switched off.Alternatively, it could be given a number of relatively more complextasks such as, for example, applying a wavelet filtering algorithm,rejecting false detections or fitting models to the spectrum of thedetected sources.
While SOFIA will continue to be improved, this basic principle ofmodularity will not change. Therefore, although this paper describes
1 http://www.gnu.org/software/gsl/
the software as it is at the time of writing and new algorithms maybe introduced in the future, the main workings of SOFIA will remainas illustrated here.
2.1 Data cube, weights cube, mask cubes and filters
Four different types of input and/or output cubes are relevant atdifferent stages of SOFIA.
(i) Data cube, which includes signal from astronomical sourcessuperimposed on instrumental noise (and errors).
(ii) Weights cube, which allows users to weight voxel values totake into account, e.g. noise level variations across the cube or thepresence of imaging artefacts in certain regions of the data cube.
(iii) Binary mask, where detected and non-detected voxels havevalues of 1 and 0, respectively.
(iv) Object mask, where non-detected voxels have a value of 0and detected voxels have an integer value corresponding to the IDof the object they belong to.
All source-finding algorithms implemented in SOFIA and de-scribed in Section 2.2 below assume that the noise level is uniformacross the data cube. Therefore, noise variations caused by, e.g. mo-saicking or frequency-dependent flagging need to be removed first.This can be done within SOFIA by means of a weights cube inverselyproportional to the noise level. SOFIA removes noise variations bymultiplying the data cube by the weights cube. Once source detec-tion is completed, SOFIA will undo this operation before measuringsource parameters. The weights cube could also be useful to down-weight regions of a data cube affected by imaging artefacts (e.g.cleaning or continuum-subtraction residuals).
The weights cube can be provided by the user. Alternatively, userscan provide an analytic description of the weights variation acrossthe cube. Finally, a weights cube inversely proportional to the localnoise level can be derived by SOFIA and applied to the data cube.The evaluation of the local noise level is carried out independentlyalong any or all of the three axes of the data cube. For example, auser may wish to remove noise variations along the frequency axisalone, under the assumption that the noise does not vary within eachfrequency plane.
We note that SOFIA measures the noise within a data cube atvarious other stages of the processing. Different methods of noisemeasurement are implemented and users can decide which one ismore appropriate for their purpose. Possible choices are: (i) stan-dard deviation; (ii) median absolute deviation; and (iii) standarddeviation of a zero-centred Gaussian fit to the negative side of theflux histogram.
The calculation and application of the inverse-noise weights cubedescribed above is part of a more general SOFIA module whichallows users to apply a filter to the data cube before running the se-lected source-finding and parametrization algorithms. As indicatedin Fig. 2, this module includes two additional filtering methods:first, the convolution with a 3D kernel whose shape can be chosenamong a few options and whose size can be specified by the user;and secondly, the 2D–1D wavelet de-noising algorithm developedby Floer & Winkel (2012). This algorithm processes the two spatialdimensions and the spectral dimension of the data cube separately,and returns a noise-free data cube reconstructed using only waveletcoefficients above a specified threshold. Additional filtering optionsmay be provided in future releases.
As indicated by the flowchart in Fig. 2, portions of the cubecan be blanked out (flagged) prior to source finding. This may benecessary at the location of very bright continuum sources whose
MNRAS 448, 1922–1929 (2015)
Dow
nloaded from https://academ
ic.oup.com/m
nras/article/448/2/1922/1058751 by guest on 14 January 2022

SOFIA 3D source finder 1925
spectrum was not subtracted properly from the data, or at channelsdominated by line emission from the Galaxy or affected by strongradio frequency interference.
Finally, mask cubes are generally calculated within SOFIA (seebelow) but can also be provided by the user. The latter could bedesirable if a user, following an initial source-finding run, wishesto look for additional sources with a different search algorithm orparameters. In this case the new sources are added to the initial,input mask. Alternatively, an input mask could be used if sourceshave already been identified and only subsequent parametrizationsteps are required.
2.2 Detection of spectral line signal
SOFIA is meant to offer a number of detection algorithms that userscan choose from. A common advantage of these algorithms is theability to look for emission on multiple scales, which is essentialto detect sources in 3D (see Fig. 1). An exception is the simplethreshold method (see below), unless used in combination withsome of the filtering methods described above (e.g. 2D–1D waveletdenoising). The following algorithms are implemented in SOFIA.
(i) Simple threshold. This is the simplest possible algorithm (andthe only one not operating on multiple scales): only voxels whoseabsolute value is above a specified threshold are detected. Users canspecify the threshold in flux units or relative to the noise level.
(ii) S+C. This is the smooth + clip algorithm developed by Serraet al. (2012) on the basis of techniques traditionally used within theH I community. It consists of searching for emission at multipleangular and velocity resolutions by smoothing the data cube with3D kernels specified by the user. At each resolution, voxels aredetected if their absolute value is above a threshold given by theuser (in noise units). The final mask is the union of the masksconstructed at the various resolutions.
(iii) CNHI. This algorithm was developed by Jurek (2012). In-dividual 1D spectra (or bundles of adjacent spectra) are extractedfrom the data cube. For each of them, the Kuiper test is used toidentify regions of the spectrum which are not consistent with con-taining only noise. In practice, users need to provide a probabilitythreshold above which a spectral region is considered detected andis added to the final binary mask.
The numerous possible combinations of these source-finding meth-ods together with the filtering algorithms described in Section 2.1allow users to design a number of different strategies to detect sig-nal in their data cube. For example, the CNHI finder could be runfollowing convolution with a 3D kernel appropriate for the type ofsources being searched. Alternatively, a simple threshold methodcould be used after the noise has been removed from the cube bythe 2D–1D wavelet filter.
Popping et al. (2012) discuss strengths and weaknesses of thesealgorithms and compare their performance. An important recom-mendation of that work is that all source finders should incorporatesome form of 3D smoothing in order to increase completeness. Inthis respect, the simple threshold algorithm is of limited use unlesscoupled with a filtering methods such as the 2D–1D wavelet de-noising. Popping et al. (2012) find this particular combination todeliver higher completeness and reliability than S+C and CNHI forsources unresolved on the sky, especially at narrow line widths. Incontrast, the S+C method is by construction well suited to findingsources on a variety of scales and Popping et al. (2012) deem it thebest choice for extended objects.
We note that many of the algorithms have been improved sincethe comparative study of Popping et al. (2012). Additional testingcan now be carried out within SOFIA and will be used to investigatehow to further improve their performance. Until then, we refer to theaforementioned papers for a complete discussion of these methods.
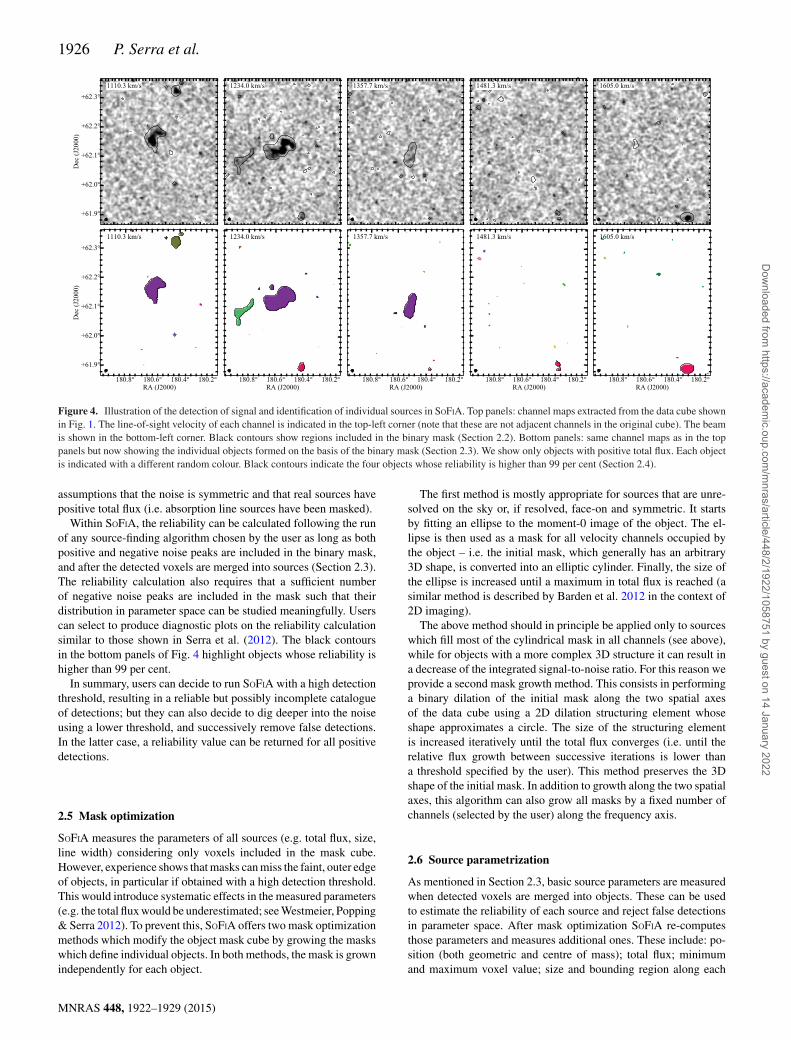
All the above algorithms return a binary mask of detected voxels(and any additional source-finding algorithm could be added toSOFIA as long as they satisfy this condition). As an example, thetop panels of Fig. 4 show five channels extracted from the datacube in Fig. 1 and, with black contours, the regions included in thebinary mask. In this case the S+C finder was employed using 12different smoothing kernels. The relatively low adopted threshold(3.5σ ) results in a number of noise peaks being included in themask. We come back to this point in Section 2.4.
2.3 Merging detected voxels into sources
The aforementioned binary mask is the basis for identifying indi-vidual sources or objects. In SOFIA, this computationally expensiveoperation is performed using the C++ implementation of the Lutz(1980) one-pass algorithm by Jurek (2012), combined with a sparserepresentation of 3D objects. We refer to Jurek (2012) for details onthis implementation. Here it is sufficient to say that this algorithmproduces the same result as a friends-of-friends method with linkingelement equal to an elliptic cylinder. Users can specify the cylindersize. This step of SOFIA also returns basic source parameters suchas total flux, peak flux (both normalized by the noise level) and size.
The bottom panels of Fig. 4 show the objects created from thebinary mask using a merging cylinder with a radius of 3 pixels anda height of 7 channels (we show only objects with positive totalflux). These panels show four real detections as well as a number ofpositive noise-peak objects. It is worth highlighting the successfuldetection of a faint, extended H I tail east of the brightest galaxy(second panel from the left). This detection is made possible by thefact that SOFIA looks for emission on multiple scales. Furthermore,SOFIA correctly identifies as a single source the resolved, edge-ongalaxy located in the southern part of the cube (visible in all panelsbut the first) despite the low level emission at channels close to thesystemic velocity.
2.4 Reliability and rejection of false detections
All detection algorithms listed above require users to specify adetection threshold. The closer this threshold is to the noise, themore noise peaks will be included in the resulting binary mask.Some of these noise peaks may be identified as separate objects ifthey are sufficiently far from a real object (see bottom panels ofFig. 4). SOFIA offers two ways of removing these false detectionsfrom the final output.
The first method is a simple size filter and is based on the factthat all real detections are at least as large as the data cube’s resolu-tion. In practice, users can specify the minimum acceptable sourcesize along each axis of the cube independently. The downside ofthis method is that it may potentially remove relatively bright butunresolved sources from the final object mask.
The second method is illustrated by Serra, Jurek & Floer (2012)and estimates the reliability of individual objects by comparingthe distribution of positive and negative sources (i.e. sources withpositive and negative total flux, respectively) in parameter space.The simple idea is that the distribution of positive and negative noisepeaks should be identical while positive, real detections should nothave a negative counterpart in parameter space. It is based on the
MNRAS 448, 1922–1929 (2015)
Dow
nloaded from https://academ
ic.oup.com/m
nras/article/448/2/1922/1058751 by guest on 14 January 2022
1926 P. Serra et al.
Figure 4. Illustration of the detection of signal and identification of individual sources in SOFIA. Top panels: channel maps extracted from the data cube shownin Fig. 1. The line-of-sight velocity of each channel is indicated in the top-left corner (note that these are not adjacent channels in the original cube). The beamis shown in the bottom-left corner. Black contours show regions included in the binary mask (Section 2.2). Bottom panels: same channel maps as in the toppanels but now showing the individual objects formed on the basis of the binary mask (Section 2.3). We show only objects with positive total flux. Each objectis indicated with a different random colour. Black contours indicate the four objects whose reliability is higher than 99 per cent (Section 2.4).
assumptions that the noise is symmetric and that real sources havepositive total flux (i.e. absorption line sources have been masked).
Within SOFIA, the reliability can be calculated following the runof any source-finding algorithm chosen by the user as long as bothpositive and negative noise peaks are included in the binary mask,and after the detected voxels are merged into sources (Section 2.3).The reliability calculation also requires that a sufficient numberof negative noise peaks are included in the mask such that theirdistribution in parameter space can be studied meaningfully. Userscan select to produce diagnostic plots on the reliability calculationsimilar to those shown in Serra et al. (2012). The black contoursin the bottom panels of Fig. 4 highlight objects whose reliability ishigher than 99 per cent.
In summary, users can decide to run SOFIA with a high detectionthreshold, resulting in a reliable but possibly incomplete catalogueof detections; but they can also decide to dig deeper into the noiseusing a lower threshold, and successively remove false detections.In the latter case, a reliability value can be returned for all positivedetections.
2.5 Mask optimization
SOFIA measures the parameters of all sources (e.g. total flux, size,line width) considering only voxels included in the mask cube.However, experience shows that masks can miss the faint, outer edgeof objects, in particular if obtained with a high detection threshold.This would introduce systematic effects in the measured parameters(e.g. the total flux would be underestimated; see Westmeier, Popping& Serra 2012). To prevent this, SOFIA offers two mask optimizationmethods which modify the object mask cube by growing the maskswhich define individual objects. In both methods, the mask is grownindependently for each object.
The first method is mostly appropriate for sources that are unre-solved on the sky or, if resolved, face-on and symmetric. It startsby fitting an ellipse to the moment-0 image of the object. The el-lipse is then used as a mask for all velocity channels occupied bythe object – i.e. the initial mask, which generally has an arbitrary3D shape, is converted into an elliptic cylinder. Finally, the size ofthe ellipse is increased until a maximum in total flux is reached (asimilar method is described by Barden et al. 2012 in the context of2D imaging).
The above method should in principle be applied only to sourceswhich fill most of the cylindrical mask in all channels (see above),while for objects with a more complex 3D structure it can result ina decrease of the integrated signal-to-noise ratio. For this reason weprovide a second mask growth method. This consists in performinga binary dilation of the initial mask along the two spatial axesof the data cube using a 2D dilation structuring element whoseshape approximates a circle. The size of the structuring elementis increased iteratively until the total flux converges (i.e. until therelative flux growth between successive iterations is lower thana threshold specified by the user). This method preserves the 3Dshape of the initial mask. In addition to growth along the two spatialaxes, this algorithm can also grow all masks by a fixed number ofchannels (selected by the user) along the frequency axis.
2.6 Source parametrization
As mentioned in Section 2.3, basic source parameters are measuredwhen detected voxels are merged into objects. These can be usedto estimate the reliability of each source and reject false detectionsin parameter space. After mask optimization SOFIA re-computesthose parameters and measures additional ones. These include: po-sition (both geometric and centre of mass); total flux; minimumand maximum voxel value; size and bounding region along each
MNRAS 448, 1922–1929 (2015)
Dow
nloaded from https://academ
ic.oup.com/m
nras/article/448/2/1922/1058751 by guest on 14 January 2022

SOFIA 3D source finder 1927
Figure 5. Data products for the brightest galaxy in the cube shown in Fig. 1. From left to right: moment-0 image; moment-1 velocity field; position–velocitydiagram along the morphological major axis (PA = 32◦); and integrated spectrum (filled circles) with the best-fitting busy function overlaid (solid line). In thelatter panel the dotted and dashed lines indicate the line widths W50 and W20 estimated at 50 and 20 per cent of the peak flux, respectively, on the basis of thebusy function fit.
axis; line width measured using different methods (including theone proposed by Courtois et al. 2009); results of an ellipse fit tothe moment-0 image; results of a busy function fit to the integratedspectrum (for a description of the busy function see Westmeier et al.2014). These parameters are provided both in a ‘raw’ format (i.e. co-ordinates in pixel units, fluxes in data units, line-width in channels)as well as converted into more useful units (e.g. WCS coordinatesand standard flux and velocity units). Some of these parametrizationsteps are optional and implementation of additional parameters isstraightforward within the code.
2.7 Output products
Users can decide what output SOFIA should produce. Availableoutput products include the following:
(i) Catalogue of objects and their parameters, both in ASCII andin VO-compliant XML format.
(ii) Final object mask.(iii) Moment 0 and 1 images of the sky area covered by the full
data cube determined from the data within the mask.(iv) Cut-out data cubes containing individual objects as well as
their corresponding mask, moment 0, 1 and 2 images, integratedspectrum and position–velocity diagram along the morphologicalmajor axis. An example of these products is shown in Fig. 5.
In future releases it will be possible to produce these products forjust a subset of the detections by selecting a region of interest insource parameter space.
This output is designed to not only give useful information aboutthe detected sources but also to enable further, higher-level analysisby the user. For example, the cut-out cubes of individual objectsand the corresponding masks could be used to measure additionalsource parameters not included in SOFIA or to produce Gauss–Hermite velocity fields to enable kinematical studies.
2.8 Performance of SOFIA
In the current implementation of SOFIA the entire input data cube(or the selected sub-cube; see Fig. 2) is loaded into memory andprocessed on a single core. Additional cubes will also need to bestored in memory at various stages of processing, such as the weightscube, the binary or object mask cube, and a smoothed version ofthe data cube if required by the source-finding algorithm being used(e.g. S+C), plus a potentially large array of source parameters.It is therefore interesting to discuss how the memory requirementand execution time of SOFIA vary with cube size. For this purpose
we make use of two cubes. The smaller cube is the one used forillustration purpose in this paper (Figs 1 and 4). It has 360 pixelsalong both spatial axes and 150 channels along the frequency axis,resulting in a file size of 78 MB. The second cube is the one used forthe source-finding tests of Serra et al. (2012) and Westmeier et al.(2012). It too has 360 pixels along both spatial axes but consistsof 1464 channels along the frequency axis. Therefore, its size is∼10 times that of the first cube.
We process the two cubes with identical settings employing arepresentative combination of the algorithms described in this pa-per: noise normalization along the frequency axis; S+C sourcefinding with 12 smoothing kernels; merging of detected voxelsinto sources; calculation of reliability and removal of unreliablesources; optimization of the mask of individual objects using thedilation method; source parametrization including busy function fit;creation of output products for the cubes as a whole and for the in-dividual detections; creation of ASCII and XML catalogues. Thetwo runs are carried out on a machine running Linux Mint 17 witha memory of 16 GB and a 2.9 GHz Intel Core processor.
Fig. 6 shows the memory usage of SOFIA as a function of time forthe two cubes. Both axes of the plot are normalized by the cube size.The time behaviour of the two curves appears very similar, indicat-ing that the execution time-scales approximately linearly with cubesize within the range explored here. The memory offset betweenthe two curves is due to the loading into memory of a number oflibraries used by SOFIA. These come with a memory overhead ofthe order of a few tens of megabytes, which is more noticeable inthe case of a smaller data cube. For data cubes much larger than thisoverhead the memory usage is between two and three times the sizeof the cube, with occasional peaks between three and four times thecube size.
Fig. 6 allows us to investigate the memory and processing timetaken by the various algorithms. In this case, most of the timeis taken by the S+C finder. The beginning and end of its exe-cution are marked by open and filled black circles for the smalland large data cube, respectively. The peaks in memory usage ofS+C correspond to the smoothing operations, while the plateausin between peaks correspond to the noise level calculation. Eachadditional filter would contribute another ∼0.05 s/MB to the ex-ecution time in this case. The noise calculation appears to beparticularly time consuming. In this case, it is carried out us-ing the aforementioned Gaussian fit to the negative side of fluxhistogram (Section 2.1). This calculation uses the full cube, andan obvious way to increase its speed would be to calculate thenoise level on a sub-cube. This option may become available in thefuture.
MNRAS 448, 1922–1929 (2015)
Dow
nloaded from https://academ
ic.oup.com/m
nras/article/448/2/1922/1058751 by guest on 14 January 2022

1928 P. Serra et al.
0.0 0.1 0.2 0.3 0.4 0.5 0.6time / sizecube (s/MB)
0
1
2
3
4
5
mem
ory
/si
zecu
be
sizecube = 79 MB
sizecube = 759 MB
Figure 6. Memory usage as a function of time for two runs of SOFIA on two cubes whose sizes differ by a factor of ∼10 (see legend). As explained in thetext, both runs include the use of the S+C source finder, and open and filled black circles indicate the beginning and the end of the S+C execution for the twocubes, respectively. See Section 2.8 for a more detailed discussion of the time taken by other algorithms during the two SOFIA runs.
The time before the beginning of the S+C finder in Fig. 6 istaken by the noise normalization along the frequency axis and byan initial measurement of the noise level in the normalized cube.The time after S+C is taken by all other algorithms listed above,and these are typically much faster. The memory peak right at theend of S+C corresponds to the merging of voxels into sources. Theheight of this peak depends on the number of sources detected. Thisis followed by the calculation of the reliability and the rejection ofunreliable sources, which are both relatively inexpensive in termsof memory but can be time consuming. The final memory peakscorrespond to the creation of moment images.
2.9 Source-finding based on a catalogue of 3D coordinates
The above discussion makes it clear that SOFIA is currently not ableto process arbitrarily large data cubes but is limited by the memoryof the system on which it is run. This problem is partially alleviatedby the fact that SOFIA is able to limit the processing to a sub-cubewhose boundaries are specified by the user. Therefore, users couldchoose to run SOFIA multiple times on sufficiently small portionsof a large input cube, obtaining individual output products for eachof them. They could then combine these products, creating, forexample, a single mask or catalogue. In the future we may be ableto offer such breaking up of a large input cube into sub-cubes – andthe creation of final data products for the full cube – as a processingmode fully integrated with the other modules of SOFIA.
In this context, a useful feature already available in SOFIA is thatit allows users to search for emission in any number of small sub-cubes centred at a set of 3D coordinates within an arbitrarily largedata cube. For example, in an era of large H I and optical redshiftsurveys, this mode could be used to look for emission in a large H I
cube at the location of galaxies included in an optical spectroscopiccatalogue.
This mode is fully integrated in SOFIA and interested users needto simply provide the input data cube and a catalogue of 3D coor-dinates. SOFIA will process the various positions sequentially, eachtime loading into memory only the sub-cube of interest. The 3Dsize of the sub-cubes can be set by the user and is the same for
all positions. Users can also request the creation of a single outputcatalogue of sources, which is generated by merging the cataloguesobtained at each position.
2.10 Comparison to other source finders
A number of established software packages for the reduction andanalysis of interferometric data allow some source finding to becarried out on data cubes (e.g. GIPSY, MIRIAD). However, this approachrequires users to develop custom codes which make use of (andare limited by) the tasks available within those general-purposepackages. In contrast, the more specialized SOFIA offers a widerange of ready-to-use source-finding algorithms, which are alreadyintegrated with one another and can be combined in a flexible wayto produce a variety of output products.
The other 3D application for spectral line data which shares someof these characteristics is DUCHAMP (Whiting 2012). This applicationdetects sources using a simple threshold method (similar to the onedescribed in Section 2.2) and then grows them using a secondarythreshold. This algorithm differs from those available in SOFIA and,in this respect, the two packages could be seen as complementary(Popping et al. 2012 show that DUCHAMP has the best performance forunresolved sources but does not reach the completeness of S+C forresolved sources.). With respect to memory requirements, DUCHAMP
is similar to SOFIA in that it loads and processes in one core the fullinput data cube. Therefore, it too is limited by the memory of thesystem on which it is run.
A significant advantage of SOFIA compared to DUCHAMP is thatit offers a larger number of algorithms for both source findingand parametrization. This includes the S+C and CNHI finders,the 2D-1D wavelet de-noising (denoising is available in DUCHAMP
but it uses isotropic wavelets, which are not ideal for spectral linesources whose size along the spectral axis is decoupled from thesize along the two spatial axes), the calculation of the reliabilityof individual detections, the mask optimization by binary dilation,the possibility of searching for signal on the basis of an input cat-alogue of 3D coordinates and the busy function fit. The creationof cubelets and PV diagrams for individual detections is also not
MNRAS 448, 1922–1929 (2015)
Dow
nloaded from https://academ
ic.oup.com/m
nras/article/448/2/1922/1058751 by guest on 14 January 2022
SOFIA 3D source finder 1929
included in DUCHAMP but is available in SELAVY, a source finder builtupon DUCHAMP for distributed processing of large cubes (Whiting &Humphreys 2012). While future development may reduce the differ-ence between DUCHAMP/SELAVY and our package, all above methodsare at the moment unique to SOFIA.
Finally, it is worth mentioning that SOFIA does not offer at themoment a full analysis of the sources’ morphology. For example,a group of nearby detected voxels is merged into a single sourceregardless of the size of the source and only based on the merg-ing element chosen by the user (Section 2.3). This means that noinformation is given about whether the source, which could be verylarge, is composed of distinct and easily recognisable components.Different and more specialized source finders are able to providesuch characterization (e.g. CLUMPFIND by Williams, de Geus & Blitz1994; BLOBCAT by Hales et al. 2012). We note, however, that theobject mask cube returned by SOFIA could be used as a startingpoint for further morphological analysis of the detections.
3 SU M M A RY
We provide a high-level description of SOFIA, a flexible sourcefinder for 3D spectral line data. SOFIA puts together for the first timein a single package a number of new source-finding and parametriza-tion algorithms developed in preparation of upcoming H I surveyswith ASKAP (WALLABY, DINGO) and APERTIF. It is, however,designed to enable the use of these new algorithms on any data cubeindependent of emission line or telescope used.
We describe the various methods and algorithms available inSOFIA as well as planned developments. One key advantage ofSOFIA is that it allows users to search for spectral line signal onmultiple scales on the sky and in frequency (using e.g. the S+Cfinder or the 2D–1D wavelet filter), which is crucial to detect andparametrize 3D sources in a complete and reliable way. Further-more, within SOFIA it is possible to take into account noise levelvariations across the cube and the presence of errors and artefacts.Moreover, SOFIA is able to estimate the reliability of individual de-tections, which should be particularly useful for surveys expectedto detect a large number of sources. It can also produce a varietyof output products, including moment images, cut-out cubes andimages, integrated spectra and catalogues of source parameters. Fi-nally, SOFIA is able to search for line emission in arbitrarily largedata cubes on the basis of a catalogue of 3D coordinates. Mostof these methods are not available in other source finders and arecurrently unique to SOFIA.
We provide a few visual examples of how SOFIA works includinga view of the dedicated GUI. We describe the available parametriza-tion and the wide range of output products, which include maskcubes, moment images, position–velocity diagrams and busy func-tion spectral fits of individual sources. This output is designed toboth provide a useful description of the sources as well as facilitatesubsequent analysis.
We highlight the modularity of SOFIA, which allows users to op-timize the source-finding and parametrization strategy for the dataand sources of interest. This modularity also enables future expan-sions of SOFIA to include new source-finding and parametrizationalgorithms.
SOFIA is publicly available at the website indicated in Section 1together with technical information on how to use the software.Software updates, improvements and bug fixes are posted regularlyat this webpage. SOFIA is registered at the Astrophysics SourceCode Library with code ascl:X.
AC K N OW L E D G E M E N T S
The authors acknowledge financial support from a Research Col-laboration Award of the University of Western Australia. TvdHand NG were supported by the European Research Council underthe European Union’s Seventh Framework Programme (FP/2007-2013)/ERC Grant Agreement nr. 291531. LF acknowledges supportby the Deutsche Forschungsgemeinschaft (DFG) under grant num-bers KE757/7-1, KE757/7-2, KE757/7-3 and KE757/9-1. LF is amember of the International Max Planck Research School (IM-PRS) for Astronomy and Astrophysics at the Universities of Bonnand Cologne.
R E F E R E N C E S
Astropy Collaboration et al., 2013, A&A, 558, A33Barden M., Haußler B., Peng C. Y., McIntosh D. H., Guo Y., 2012, MNRAS,
422, 449Behnel S., Bradshaw R., Citro C., Dalcin L., Seljebotn D. S., Smith K.,
2011, Comput Sci. Eng., 13, 31Bertin E., Arnouts S., 1996, A&AS, 117, 393Cappellari M. et al., 2011, MNRAS, 413, 813Courtois H. M., Tully R. B., Fisher J. R., Bonhomme N., Zavodny M.,
Barnes A., 2009, AJ, 138, 1938Croom S. M. et al., 2012, MNRAS, 421, 872Floer L., Winkel B., 2012, Publ. Astron. Soc. Aust., 29, 244Hales C. A., Murphy T., Curran J. R., Middelberg E., Gaensler B. M., Norris
R. P., 2012, MNRAS, 425, 979Hunter J. D., 2007, Comput. Sci. Eng., 9, 90Jones E. et al., 2001, SciPy: Open Source Scientific Tools for Python,
available at: http://scipy.org/citing.htmlJurek R., 2012, Publ. Astron. Soc. Aust., 29, 251Koribalski B. S., 2012a, Publ. Astron. Soc. Aust., 29, 359Koribalski B. S., 2012b, Publ. Astron. Soc. Aust., 29, 213Lutz R. K., 1980, Comput. J., 23, 262Masias M., Freixenet J., Llado X., Peracaula M., 2012, MNRAS, 422,
1674Meyer M., 2009, in Heald G., Serra P., eds, Proceedings of Panoramic
Radio Astronomy: Wide-field 1–2 GHz Research on Galaxy Evolution,available at: http://pos.sissa.it/cgi-bin/reader/conf.cgi?confid=89, id.15
Popping A., Jurek R., Westmeier T., Serra P., Floer L., Meyer M., KoribalskiB., 2012, Publ. Astron. Soc. Aust., 29, 318
Sanchez S. F. et al., 2012, A&A, 538, A8Sarzi M. et al., 2006, MNRAS, 366, 1151Serra P. et al., 2012, MNRAS, 422, 1835Serra P., Jurek R., Floer L., 2012, Publ. Astron. Soc. Aust., 29, 296Verheijen M. A. W., Oosterloo T. A., van Cappellen W. A., Bakker L.,
Ivashina M. V., van der Hulst J. M., 2008, in Minchin R., Momjian E.,eds, AIP Conf. Ser. Vol. 1035, The Evolution of Galaxies Through theNeutral Hydrogen Window. Am. Inst. Phys., New York, p. 265
Walt S. v. d., Colbert S. C., Varoquaux G., 2011, Comput. Sci. Eng., 13, 22Westmeier T., Popping A., Serra P., 2012, Publ. Astron. Soc. Aust., 29, 276Westmeier T., Jurek R., Obreschkow D., Koribalski B. S., Staveley-Smith
L., 2014, MNRAS, 438, 1176Whiting M. T., 2012, MNRAS, 421, 3242Whiting M., Humphreys B., 2012, Publ. Astron. Soc. Aust., 29, 371Williams J. P., de Geus E. J., Blitz L., 1994, ApJ, 428, 693
This paper has been typeset from a TEX/LATEX file prepared by the author.
MNRAS 448, 1922–1929 (2015)
Dow
nloaded from https://academ
ic.oup.com/m
nras/article/448/2/1922/1058751 by guest on 14 January 2022