Vibration Control in Cricket Bats using Piezoelectric ... - CORE
Upload
khangminh22Category
view
0download
0
Copyright is owned by the Author of the thesis. Permission is given for a copy to be downloaded by an individual for the purpose of research and private study only. The thesis may not be reproduced elsewhere without the permission of the Author.

The behaviour and ecology of long-tailed bats (Chalinolobus tuberculatus Gray)
in the central North Island.
Nicholas James Gillingham 1996
A thesis presented in partial fulfilment of the requirements for the degree of Master of Science at Massey University.
ll
Abstract
The morphology, breeding season, juvenile development, activity and
roosting behaviour of a North Island forest population of long-tailed bats (Chalinolobus tuberculatus Gray) was investigated intensively over spring and summer 1994- 95. The diet of a cave dwelling population was studied by analysing guano collected regularly over a one year period.
Most body measurements taken were consistent with reported individuals caught at similar latitudes in other studies, while discrepancies in tail length, body length and wingspan may be the result in differences in measuring techniques. Females were significantly larger than males in forearm length, body length, left hind-limb length and wingspan. A higher
proportion of adult females caught may reflect the higher activity and energy demands during pregnancy and lactation, but the higher proportion
of juvenile males caught cannot be explained. Most females gave birth in mid-November. Weight gain amongst
females was more consistent up to than after parturition. Parturition was earlier than in closely related Australian species at similar latitudes in
Australia. The onset of nipple enlargement coincided with parturition and did not reduce in size until volant juveniles were captured in early January. This suggests that lactation lasted approximately eight weeks, longer than in Australian Chalinolobus species. Most females captured during breeding (87.8%) showed signs of pregnancy or lactation. Cartilage bands and the lack of bulging in the metacarpal-pharangeal joint, body size and colour were all used to indicate bat age. Juvenile bats became volant from early January
onwards. The age when juveniles are capable of sustained flight is probably greater than in closely related species in Australia.
Bat echolocation was recorded with an automatic bat detector and compared with weather, light intensity and potential insect prey abundance. Combinations of environmental variables best explained variation in bat activity. The number of passes during the night, the number of passes per hour and the number of passes in the first hour after sunset were all highest during pregnancy with reduced activity during lactation. The time of the
first pass relative to sunset was earliest during September and February. Insect abundance was highest during lactation and when juveniles were volant. Diurnal bat activity generally followed a bimodal pattern with more
activity in the first and last hour of darkness, however there were seasonal differences in this pattern.

iii
Bats were tracked to roost sites using small transmitters (1.7 g) and
directional receivers. Female bats used communal roosts only during
lactation, but used combinations of communal and solitary roosts during pregnancy and when juveniles became independent. Communally roosting bats preferred mature trees or limbs of trees that were recently dead. These
trees provided cavities with small entrances (6 - 7 em) that were situated from 5 to 30 m above the ground. The number of bats observed emerging from communal roosts ranged from 5 to 208 (mean= 86). It ~s unlikely the same group of bats remained together every night. Individual bats changed
roosts every one to three days therefore they probably transported juvenile bats with them.
Insect prey taxa were identified from long-tailed bat guano collected from a limestone cave roost over one year. It was concluded that bats feed mainly on Diptera, Lepidoptera and Coleoptera, while other orders are taken in smaller numbers. Quantitative data could not be used as an indication of seasonal changes in prey taken. There was no evidence of terrestrial insects in the faeces as reported for Australian Chalinolobus
species. Estimated sizes of ingested prey items were smaller than the size
range of available prey insects. Larger insects may be culled of identifiable body parts before ingestion.

Abstract
List of Figures
List of Tables
Cbapter one:
General Introduction
Aims
Study sites
Chapter two:
Table of Contents
The morphometries and juvenile development of the New
Zealand long-tailed bat Chalinolobus tuberculatus Gray
(V espertilionidae ).
Cbapter three:
The breeding season of long-tailed bats, Chalinolobus tuberculatus
Gray (Vespertilionidae) in a North Island podocarp forest.
Cbapter four:
The foraging activity of long-tailed bats, Chalinolobus
tuberculatus Gray (Vespertilionidae) during spring and summer.
Chapter fiye:
The diet of long-tailed bats, Chalinolobus tuberculatus Gray
(Vespertilionidae) roosting in a limestone cave, Piopio.
Cbapter six:
The roosting behaviour of long-tailed bats, Chalinolobus tuberculatus
Gray (Vespertilionidae) in a North Island podocarp forest.
Cbapter seyen:
Conclusions
Management recommendations
Direction of future research
Acknowledgments
Appendices:
I. Report on work at Grand Canyon Cave
II. Report on work in the Taupo/Tongariro Conservancy
ill. Graphs and Statistics
ii
v
vii
1
7
25
35
60
73
87
91
92 102
108
iv
v
List of Figures
Figure Page
.CbaJ2te[ ~me: Figure 1 Balls Clearing Scenic Reserve. 5
.CbaJ2ie[ twQ; Figure 1 Measurements taken from C. tuberculatus. 9
Figure 2 Weight of juvenile bats in relation to date of capture. 12
Figure 3 Relationship between (a) mean forearm length and weight of juvenile bats, (b) body length and weight of juvenile
13
bats, (c) wingspan and body length in juvenile bats.
Figure4 Relationship between wingspan and body length in adult 14 male bats.
FigureS Relationship between weight and the number of cartilage 14 bands in the metacarpal-pharageal joints of juvenile bats.
Figure6 Relationships between wingspan, body length, individual 15 mean forearm length and the number of cartilage bands present in the metacarpal-pharangeal joints of juvenile bats .
.Chs12te[ three; Figure 1 Relationship between mean weight and date of capture of
(a) males, and (b) females. 27
Figure 2 Change in adult female nipple size. 28
Figure3 Breeding season of long-tailed bats at Balls Clearing. 28
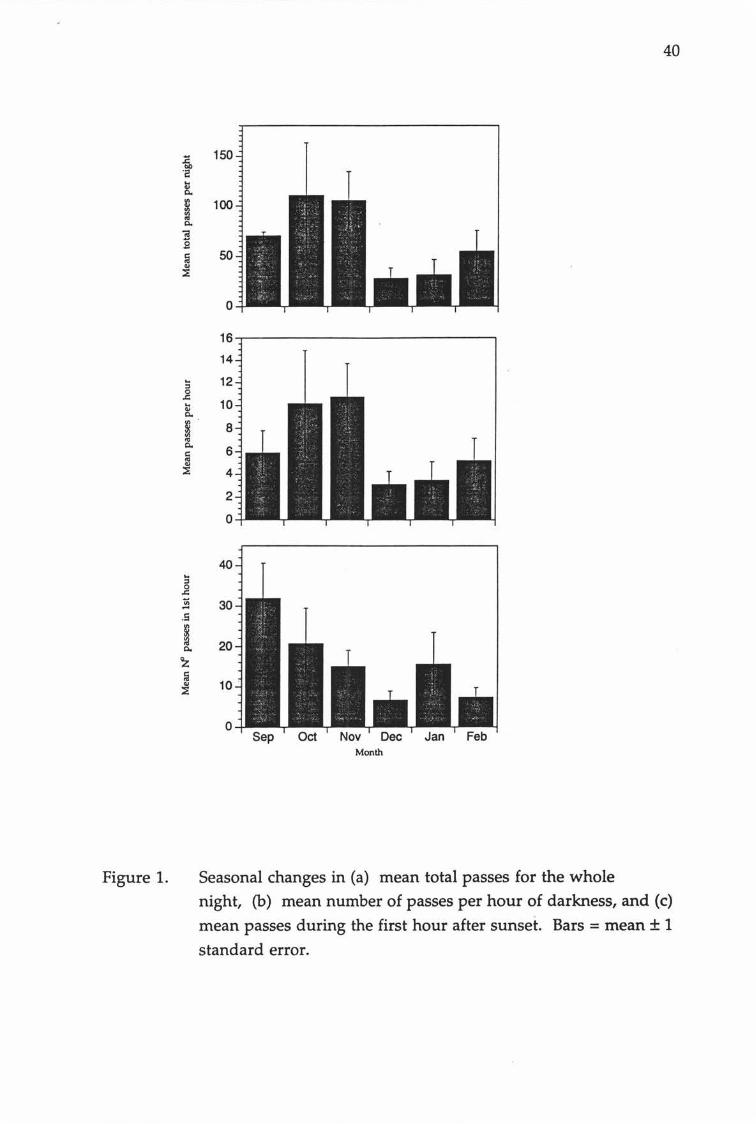
ChsJ2te[ fQ:u[: Figure 1 Seasonal changes in (a) mean total passes for the whole 40
night, (b) mean number of passes per hour of darkness, (c) mean passes during the first hour after sunset.
Figure 2 Seasonal change in (a) time of first pass and time of sunset, 41 and (b) time after sunset that first pass was recorded and astronomical twilight length.
Figure 3 The relationship between the time of the first recorded 44 pass and individual variables (a) maximum temperature at dusk, and (b) amount of sky cover.
Figure4 The relationship between the number of passes in the first 45 hour after sunset and (a) wind strength, and (b) the time that the moon is visible.
Figure 5 The total number of potential insect prey numbers caught 47 in each three day malaise trap sample.

Figure 6
Figure 7
Chapter fiye; Figure 1
Figure 2
Qlapter six: Figure 1
Figure 2
The mean number of passes in each equal segment of the night (all months included).
Physiological and environmental variables that are likely to affect the activity of insectivorous bats.
Proportions of insect fragments identified to different orders.
Change in percentage of invertebrate fragments identified from long-tailed bat guano collected from Grand Canyon Cave on different sample dates.
Use of roost tree species by solitary and communally roosting long-tailed bats at Balls Clearing, Puketitiri.
Variation in emergence behaviour of long-tailed bats at Balls Clearing, Puketitiri. (a) Seasonal variation in the number of bats observed emerging from roosts. (b) The relationship between the time of emergence and the number of bats observed emerging from roosts.
vi
48
53
63
66
78
81

Table
'hapter twO: Table 1
,Chapter four: Table 1
Table 2
'hapter five: Table 1
Table 2
'hapter sjx: Table 1
Table 2
List of Tables
Measurement data for adult and juvenile bats. (a) Adult females, (b) adult males, (c) juvenile females, (d) juvenile males.
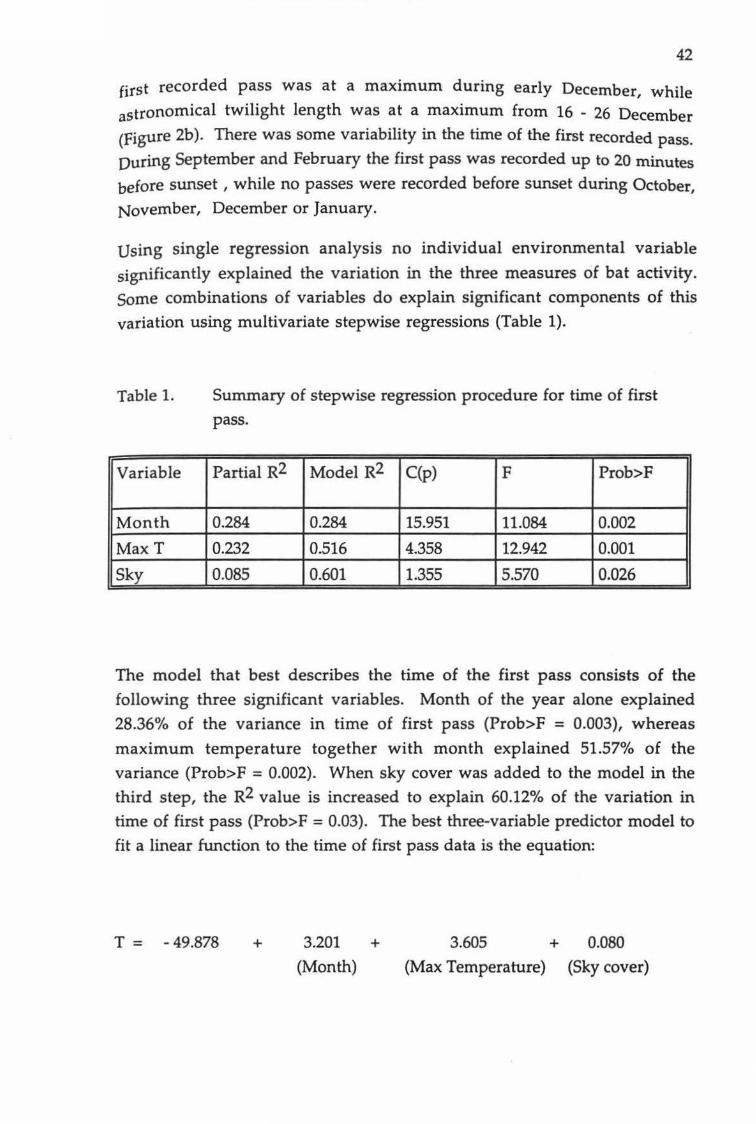
Summary of stepwise regression procedure for time of first pass.
Summary of stepwise regression procedure for number of passes in the first hour after sunset.
Fragments identified to family or better, with sample occurrences.
The size of measured fragments and estimations of body size based on reference specimens.
Descriptions of communal roosts.
Entrance details of communal roosts at Balls Clearing, Puketitiri.
vii
Page
10
42
43
64
67
77
79

Chapter 1
General Introduction
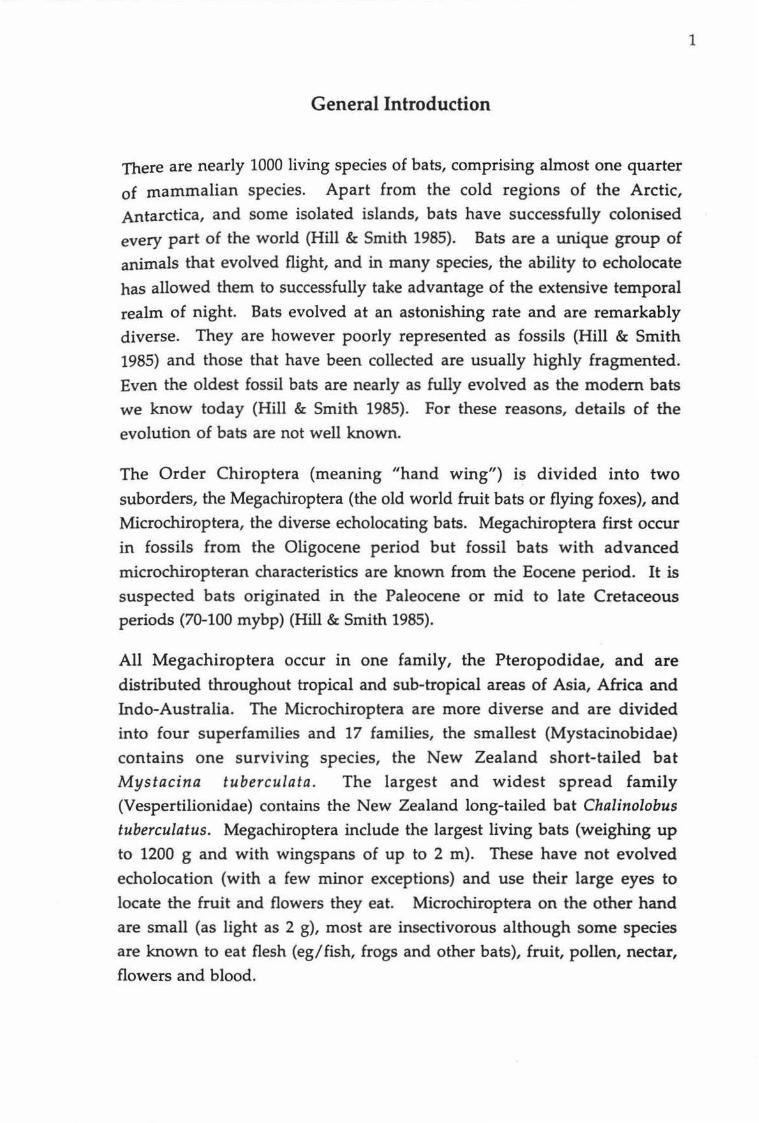
There are nearly 1000 living species of bats, comprising almost one quarter
of mammalian species. Apart from the cold regions of the Arctic, Antarctica, and some isolated islands, bats have successfully colonised every part of the world (Hill & Smith 1985). Bats are a unique group of animals that evolved flight, and in many species, the ability to echolocate
has allowed them to successfully take advantage of the extensive temporal realm of night. Bats evolved at an astonishing rate and are remarkably diverse. They are however poorly represented as fossils (Hill & Smith 1985) and those that have been collected are usually highly fragmented. Even the oldest fossil bats are nearly as fully evolved as the modern bats we know today (Hill & Smith 1985). For these reasons, details of the
evolution of bats are not well known.
The Order Chiroptera (meaning "hand wing") is divided into two
suborders, the Megachiroptera (the old world fruit bats or flying foxes), and Microchiroptera, the diverse echolocating bats. Megachiroptera first occur
in fossils from the Oligocene period but fossil bats with advanced microchiropteran characteristics are known from the Eocene period. It is suspected bats originated in the Paleocene or mid to late Cretaceous periods (70-100 mybp) (Hill & Smith 1985).
All Megachiroptera occur in one family, the Pteropodidae, and are distributed throughout tropical and sub-tropical areas of Asia, Africa and Indo-Australia. The Microchiroptera are more diverse and are divided into four superfamilies and 17 families, the smallest (Mystacinobidae) contains one surviving species, the New Zealand short-tailed bat Mystacina tuberculata. The largest and widest spread family (Vespertilionidae) contains the New Zealand long-tailed bat Chalinolobus
tuberculatus. Megachiroptera include the largest living bats (weighing up to 1200 g and with wingspans of up to 2 m). These have not evolved
echolocation (with a few minor exceptions) and use their large eyes to locate the fruit and flowers they eat. Microchiroptera on the other hand are small (as light as 2 g), most are insectivorous although some species are known to eat flesh (eg/fish, frogs and other bats), fruit, pollen, nectar, flowers and blood.
1
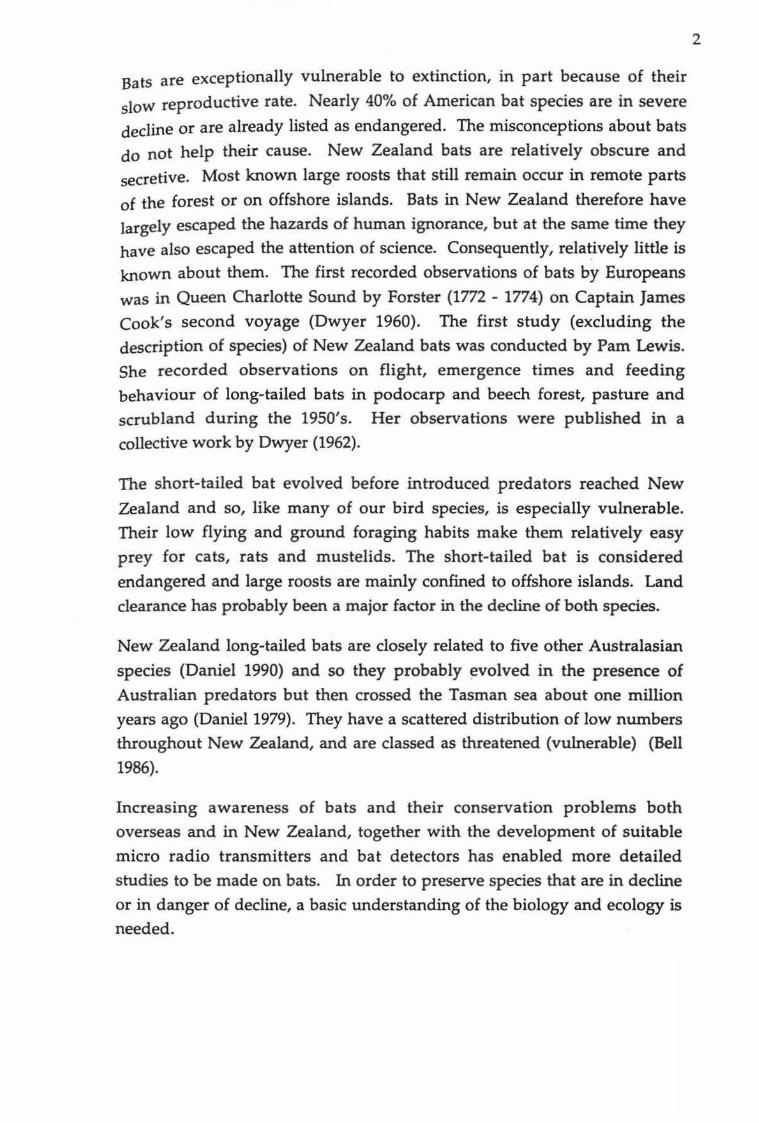
Bats are exceptionally vulnerable to extinction, in part because of their
slow reproductive rate. Nearly 40% of American bat species are in severe decline or are already listed as endangered. The misconceptions about bats
do not help their cause. New Zealand bats are relatively obscure and secretive. Most known large roosts that still remain occur in remote parts
of the forest or on offshore islands. Bats in New Zealand therefore have largely escaped the hazards of human ignorance, but at the same time they have also escaped the attention of science. Consequently, relatively little is known about them. The first recorded observations of bats by Europeans
was in Queen Charlotte Sound by Forster (1772- 1774) on Captain James Cook's second voyage (Dwyer 1960). The first study (excluding the description of species) of New Zealand bats was conducted by Pam Lewis. She recorded observations on flight, emergence times and feeding behaviour of long-tailed bats in podocarp and beech forest, pasture and scrubland during the 1950's. Her observations were published in a collective work by Dwyer (1962).
The short-tailed bat evolved before introduced predators reached New Zealand and so, like many of our bird species, is especially vulnerable. Their low flying and ground foraging habits make them relatively easy prey for cats, rats and mustelids. The short-tailed bat is considered
endangered and large roosts are mainly confined to offshore islands. Land clearance has probably been a major factor in the decline of both species.
New Zealand long-tailed bats are closely related to five other Australasian
species (Daniel 1990) and so they probably ~volved in the presence of Australian predators but then crossed the Tasman sea about one million years ago (Daniel 1979). They have a scattered distribution of low numbers throughout New Zealand, and are classed as threatened (vulnerable) (Bell
1986).
Increasing awareness of bats and their conservation problems both overseas and in New Zealand, together with the development of suitable
micro radio transmitters and bat detectors has enabled more detailed studies to be made on bats. In order to preserve species that are in decline or in danger of decline, a basic understanding of the biology and ecology is needed.
2

Aims
The bulk of my research on long-tailed bats was conducted at Balls
Clearing Scenic Reserve, Puketitiri, Hawkes Bay. This was done in
cooperation with Landcare Research, Havelock North. The major aim of
this study was to investigate the morphology and behaviour of long-tailed
bats during the breeding season which included spring and summer. The
five specific aims of the study were to: (1) monitor bat activity on a nightly
basis so that diurnal and seasonal patterns in activity could be compared
with changes in sunset, weather, moon phase and insect abundance; (2)
describe the timing and duration of parturition, lactation and the onset of
volant juveniles; (3) investigate the choice of roost trees and monitor
emergence behaviour and the numbers of bats using roosts; (4) describe the morphology of adult male and female bats in the area and provide
information about the development of juvenile bats; and (5) investigate
what prey taxa are taken by long-tailed bats.
The above aims of this study were modified from the originally proposed
study. My original aims were to conduct a comparative study of long
tailed bats that roosted in Grand Canyon Cave, Piopio and others that
presumably roosted in native trees in the Tongariro National Park area.
That study was intended to concentrate on the differences in roosting, foraging and breeding between the two populations. Much of it was to
focus on how roost type and location may affect other facets of bat activity.
Other aims were to determine prey insect taxa from faecal analysis, and
add to information known about the distribution of both short and long
tailed bats in the Taupo/Tongariro Conservancy. After preliminary visits and surveys of the areas it appeared that bats were quite abundant. I spent
three months surveying and attempting to catch bats in the area. However insufficient numbers of bats were caught to complete the
proposed study. A change in geographical and to a lesser extent, ecological
direction was decided upon. Reports on work conducted at Tongariro and
Grand Canyon Cave are included in Appendix I and II.
The main chapters in this thesis are presented in strict paper format.
3
Study sites
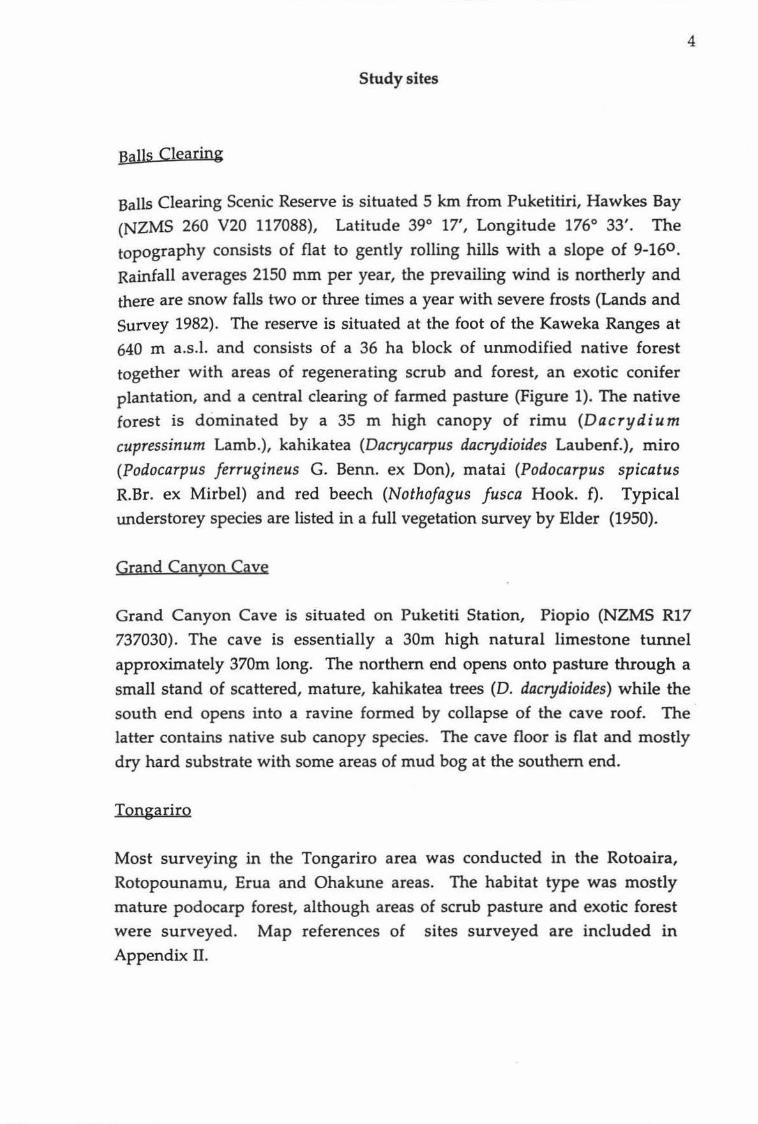
_Halls Clearing
Balls Clearing Scenic Reserve is situated 5 km from Puketitiri, Hawkes Bay
(NZMS 260 V20 117088), Latitude 39° 17', Longitude 176° 33'. The
topography consists of flat to gently rolling hills with a slope of 9-160.
Rainfall averages 2150 mm per year, the prevailing wind is northerly and
there are snow falls two or three times a year with severe frosts (Lands and
Survey 1982). The reserve is situated at the foot of the Kaweka Ranges at
640 m a.s.l. and consists of a 36 ha block of unmodified native forest
together with areas of regenerating scrub and forest, an exotic conifer
plantation, and a central clearing of farmed pasture (Figure 1). The native
forest is dominated by a 35 m high canopy of rimu (Dacrydium cupressinum Lamb.), kahikatea (Dacrycarpus dacrydioides Laubenf.), miro
(Podocarpus ferrugineus G. Benn. ex Don), matai (Podocarpus spicatus R.Br. ex Mirbel) and red beech (Nothofagus fusca Hook. f). Typical
understorey species are listed in a full vegetation survey by Elder (1950).
Grand Canyon Cave
4
Grand Canyon Cave is situated on Puketiti Station, Piopio (NZMS R17
737030). The cave is essentially a 30m high natural limestone tunnel
approximately 370m long. The northern end opens onto pasture through a
small stand of scattered, mature, kahikatea trees (D. dacrydioides) while the
south end opens into a ravine formed by collapse of the cave roof. The
latter contains native sub canopy species. The cave floor is flat and mostly
dry hard substrate with some areas of mud bog at the southern end.
Tongariro
Most surveying in the Tongariro area was conducted in the Rotoaira,
Rotopounamu, Erua and Ohakune areas. The habitat type was mostly
mature podocarp forest, although areas of scrub pasture and exotic forest
were surveyed. Map references of sites surveyed are included in
Appendix II.

-------------------
5
Figure 1. Balls Clearing Scenic Reserve.

References
Bell, B.D. (1986). The Conservation status of New Zealand Wildlife.
N.Z. Wildlife Service Occasional Publication No 12, Department of
Internal Affairs, Wellington.
Daniel, M. J. (1979). The New Zealand short-tailed bat, M_ystacina tuberculata: review of present knowledge. New Zealand Journal of Zoology. 6, 357-370.
Daniel, M. J. (1990). Bats: Order Chiroptera. In C. M. King (ed.), ~
Handbook of New Zealand Mammals. Auckland: Oxford University Press.
Dwyer, P. D. (1960). New Zealand Bats. Tuatara. 8, 61-71.
Dwyer, P. D. (1962). Studies on the two New Zealand bats. Zoological Publications from Victoria University Weilington. 28, 1-28.
Elder, N. L. (1950). Balls Clearing and Hutchinson Bush. Weilington Botanical Society Bulletin. 23, 2-8.
Forster, J. R. (1772- 1774). Animal description re-observed andre
edited by Lichenstein, H. Cited by Tornes, R.F. (1857). On the two
species of bats inhabiting New Zealand. Proceedings of the Zoological Society of London. Part XXV, 134-143.
Hill, J. E., & Smith, J.D. (1984). Bats a Natural History. British
Museum of Natural History. Henry Ling Ltd. London
Lands and Survey. (1982). Balls Clearing Scenic Reserve Management
Elm (S.R.66 ISSN 0111- 0381). Napier: Department of Lands and Survey.
6

Chapter2

The morphometries and juvenile development of the New Zealand long
tailed bat Chalinolobus tuberculatus Gray (Vespertilionidae).
Abstract
7
The morphometries and sexual dimorphism of adult and post-natal
development of juvenile long-tailed bats (Chalinolobus tube~culatus Gray)
is described using data collected from captured bats in a North Island forest
during the breeding season. Most measures are consistent with
measurements reported by other workers from long-tailed bats caught at
similar latitudes, while discrepancies in tail length, body length and
wingspan may reflect differences in measuring techniques. Some measures
(eg. forearm length) are easier to take and provide more reliable
information ·than others. A higher proportion of adult females than adult
males caught may reflect the higher energy demands during pregnancy and
lactation, but the higher proportion of juvenile males caught cannot be explained. Females were significantly larger than males in forearm length,
body length, left hind-limb length and wingspan. The longest juvenile
forearm was greater than the smallest recorded adult forearm. Adult or
juvenile bats cannot therefore be distinguished on the basis of forearm
length alone. Cartilage bands and the lack of bulging in the metacarpal
pharangeal joint, size and colour are all indicators of juvenility. The age when juveniles are capable of sustained flight is probably older than in
closely related species in Australia.
Key words: Bats, Vespertilionidae, Chalinolobus tuberculatus,
morphometries, sex ratio, sexual dimorphism, juvenile
development.
Introduction
Two bats survive in New Zealand, the lesser short-tailed bat Mystacina
tuberculata Gray, (Mystacinobidae), and the long-tailed bat Chalinolobus
tuberculatus Gray. The greater short-tailed bat Mystacina robusta Dwyer, is
thought to have been extinct since 1965 (Daniel 1990). The long-tailed bat belongs to the largest and worldwide family Vespertilionidae. It has five

8
conspecifics in Australia, Tasmania, Norfolk Island, New Caledonia and
New Guinea (Daniel1990)
Little is published on the morphometries of C. tuberculatus. The external
and internal morphology was described by Forster (1772- 1774), Gray (1843),
Tomes (1857), Peters (1866), Hutton (1872), Knox (1872), Buller (1875), Dwyer
(1960a, 1960b, 1962), Cody (1981) and Daniel (1990). These reports were based
on small samples and the data do not include sufficient information about age, sex, or geographic location to attempt to explain any causes of variation
amongst the specimens. Daniel (1990) extended the morphometric work on
long-tailed bats by comparing the forearm lengths of C. tuberculatus from
three geographical areas and found that this tended to increase with
latitude, however the conclusions are tentative.
Juvenile development of long-tailed bats has not been studied. The external anatomy of one 12 mm foetus was described by Dwyer (1960b), and detailed
studies of development in two closely related Australian species, C. morio Gray and C. gouldii Gray, were published by Kitchener & Coster (1981) and
Kitchener (1975) respectively.
The main aim of this paper was to obtain morphometric information from
a large sample of C. tuberculatus from a single population. These data are
used to investigate sex ratio, sexual dimorphism of size, the reliability of
different body measures and the post-natal development of juvenile bats. This information would also provide data for future studies on geographic
variation.
Methods
All bats were captured at Balls Clearing Scenic Reserve, Puketitiri, Hawkes
Bay (NZMS 260 V20 117088), Latitude 39° 17', Longitude 176° 33'. A review
of the vegetation (Elder 1950), climate and geography is given in Chapter 1.
All bats were caught with harp traps (1@ 2.4 x 1.8 = 4.2 m2 and 1@ 2.4 x 1.4 = 3.3 m2), (Tidemann & Woodside 1978) or mist nets (7 x 42 ft, with a mesh
size of 1 I 4 inch). These were placed over or near the main stream where it
exits to the north-eastern comer of the clearing through mature red beech
forest (Figure 1 in Chapter 1). Even on nights of low activity there were
usually some bats foraging under the canopy at this site. On nights when

9
tured bats were especially needed, a single mist net was set up across the cap stream with a harp trap below the bottom of the net, with the legs standing in the water. A third harp trap was used approximately 30m down stream.
Bats caught in mist nets were weighed and measured within ten minutes of capture whereas those bats caught in harp traps were usually left undisturbed until morning. The sex of captured bats was determined first, then bats were weighed using a 50 g spring scale attached to a small light cotton bag. Lengths of forearms, body (including head), tail and left hind tibia were measured with vernier callipers (Figure 1). Wingspan was
measured from extended wingtip to wingtip against a small tape measure extended along a wooden rail. All captured bats were inspected for
identifiable features such as scarring and these were recorded. Female nipples were inspected, and any enlargement was recorded. The
metacarpal- pharangeal joints were checked for the presence of cartilage bands, which can be used as an estimate of sub-adult age (Parnaby 1982).
Figure 1.
Wingspan
Body length
Measurements taken from C. tuberculatus. Ventral view, half actual size.
10
Sexual dimorphism was analysed using t-tests (MINITAB). Regression
analysis and Spearman rank correlations were used to test relationships
between juvenile morphometric variables (MINITAB). Sex ratios were
tested using normal approximation (Tang Strait 1989).
Result.s
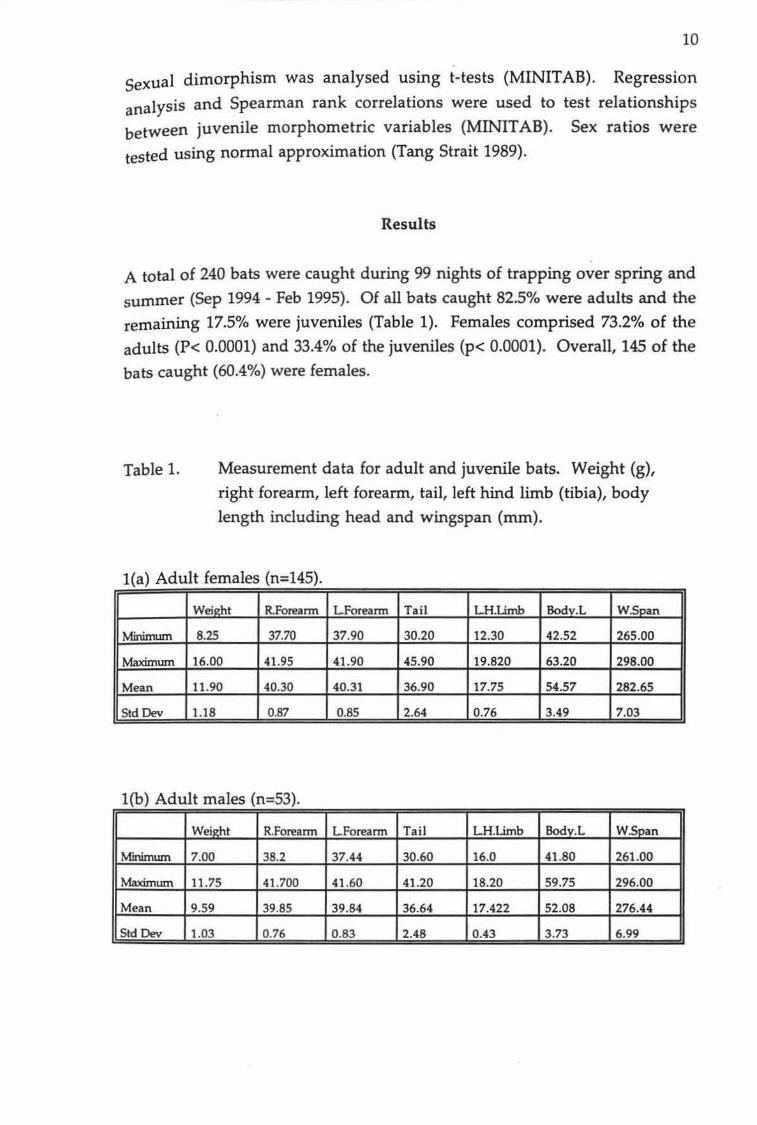
A total of 240 bats were caught during 99 nights of trapping over spring and
summer (Sep 1994- Feb 1995). Of all bats caught 82.5% were adults and the
remaining 17.5% were juveniles (Table 1). Females comprised 73.2% of the
adults (P< 0.0001) and 33.4% of the juveniles (p< 0.0001). Overall, 145 of the
bats caught (60.4%) were females.
Table 1. Measurement data for adult and juvenile bats. Weight (g),
right forearm, left forearm, tail, left hind limb (tibia), body
length including head and wingspan (mrn).
1(a) Adult females (n=145).
Weight R.Forearm L.Forearm Tail LH.Limb Bodv.L WSpan
Minimum 8.25 37.70 37.90 30.20 12.30 42.52 265.00
Maximwn 16.00 41.95 41.90 45.90 19.820 63.20 298.00
Mean 11.90 40.30 40.31 36.90 17.75 54.57 282.65
Std Dev 1.18 0.87 0.85 2.64 0.76 3.49 7.03
1(b) Adult males (n=53).
Weight R.Forearm L.Forearm Tail LH.Limb Bodv.L W.Span
Minimum 7.00 38.2 37.44 30.60 16.0 41.80 261.00
Maximum 11.75 41.700 41.60 41.20 18.20 59.75 296.00
Mean 9.59 39.85 39.84 36.64 17.422 52.08 276.44
Std Dev 1.03 0.76 0.83 2.48 0.43 3.73 6.99
11
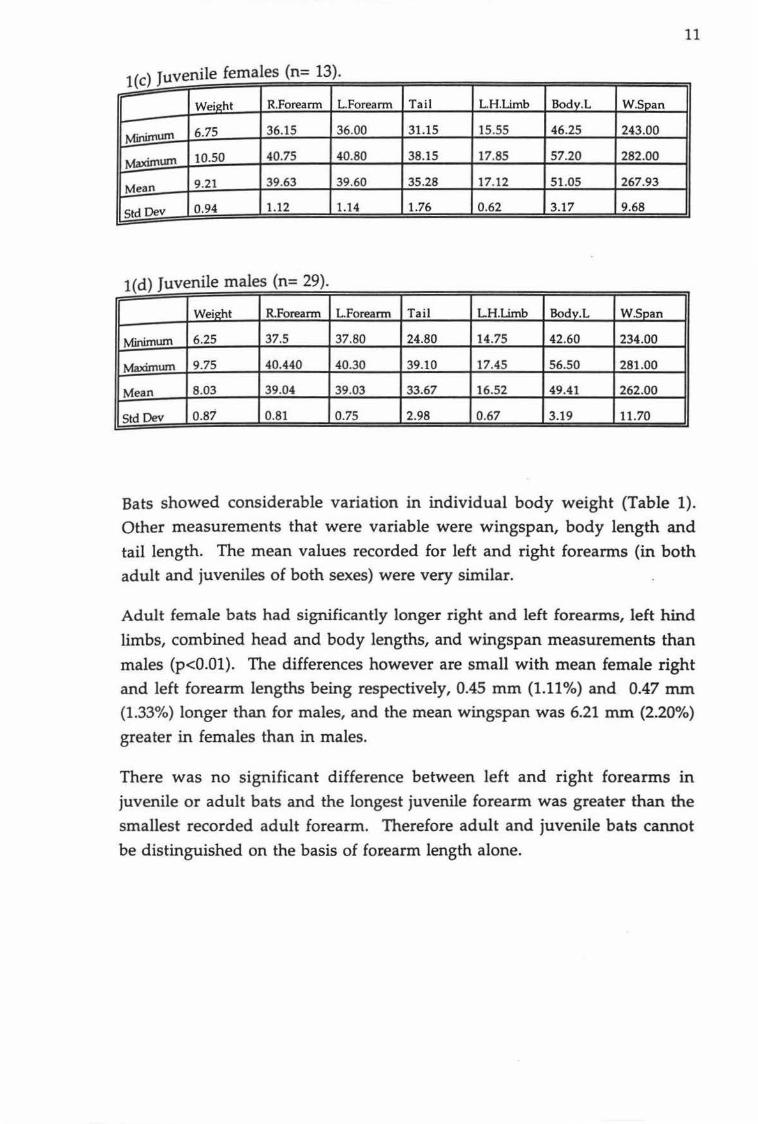
1( ) Juvenile females (n= 13). c - R.Forearm L.Foreann Ta il L.H.Umb Bod y.L W.Span Weight ~
36.15 36.00 31.15 15.55 46.25 243.00 Minif!!um 6.75 r-lvfax!!!!um 10.50 40.75 40.80 38.15 17.85 57.20 282.00 ~
Mean 9.21 39.63 39.60 35.28 17.12 51.05 267.93
Std Dev 0.94 1.12 1.14 1.76 0.62 3.17 9.68
l(d) Juvenile males (n= 29).
Weight R.Foreann L.Foreann Tail LH.Umb Body.L W.Span
Minimum 6.25 37.5 37.80 24.80 14.75 42.60 234.00
Maximum 9.75 40.440 40.30 39.10 17.45 56.50 281.00
Mean 8.03 39.04 39.03 33.67 16.52 49.41 262.00
Std Dev 0.87 0.81 0.75 2.98 0.67 3.19 11.70
Bats showed considerable variation in individual body weight (Table 1).
Other measurements that were variable were wingspan, body length and
tail length. The mean values recorded for left and right forearms (in both
adult and juveniles of both sexes) were very similar.
Adult female bats had significantly longer right and left forearms, left hind
limbs, combined head and body lengths, and wingspan measurements than
males (p<0.01). The differences however are small with mean female right
and left forearm lengths being respectively, 0.45 mm (1.11%) and 0.47 mm (1.33%) longer than for males, and the mean wingspan was 6.21 nun (2.20%)
greater in females than in males.
There was no significant difference between left and right forearms in
juvenile or adult bats and the longest juvenile forearm was greater than the
smallest recorded adult forearm. Therefore adult and juvenile bats cannot
be distinguished on the basis of forearm length alone.

12
12
11
§ 10 ;: . . c.o 'Qj 9 .. . . ~
.. .. . ~ 8
. ·a Ql :> =' 7
6
5 ~ ..... ..... ... ..,
Da~ (1995)
Figure 2. Weight of juvenile bats in relation to date of capture.
A total of 43 juveniles were caught during January and February 1995 (Figure 2}. Variations of up to 4.25 g (range 6.25- 10.50 g) occurred between
juveniles caught on a single night (22/1/95). There was no significant
relationship between juvenile weight and capture date (Spearman Rank
Correlation) or between the number of cartilage bands in metacarpal
pharangeal joints and capture date. Initial indicators that bats may be sub
adult were light weight and dark colour. Juveniles were confirmed by the
presence of (one or two) cartilage bands, or if no bands were evident, the absence of bulging in the metacarpal-pharangeal joint (Pamaby 1992). In
some juveniles it was not possible to determine whether one or two bands
were present, so these individuals were placed in the fourth category "one
or two" bands.
As there was no significant difference between left and right forearm length
in juveniles (R = 0.97}, mean forearm length was used in this juvenile
morphometric analysis instead of the individual left and right measures. As juvenile weight increased (Figure 3a and 3b) then so did forearm length
and body length. Juvenile wingspan increased isometrically with body
length (Figure 3c) as it does in adult males (Figure 4).

Figure 3.
13
(a) 41
I 40 . .. e .. ~
39 .2
i ii!
38 ., c: .. 3 37 ~ .. ::!!
36 6 7 8 9 10 11
Weight (g)
(b) 58
(c)
56
54
I .. 52
~ co c: ~
50
>. 48 ~
46
44
42 6 7 8 9 10 11
Weight (g)
290
280 ..
I 270
~ ~ 260 gj, .s ~ 250
240
230 42 44 46 48 50 52 54 56 58
Body length (mm)
Relationship between (a) mean forearm length and weight of juvenile bats (R=0.397), (b) body length and weight of juvenile bats (R=0.265), (c) wingspan and body length in juvenile bats (R=0.488).
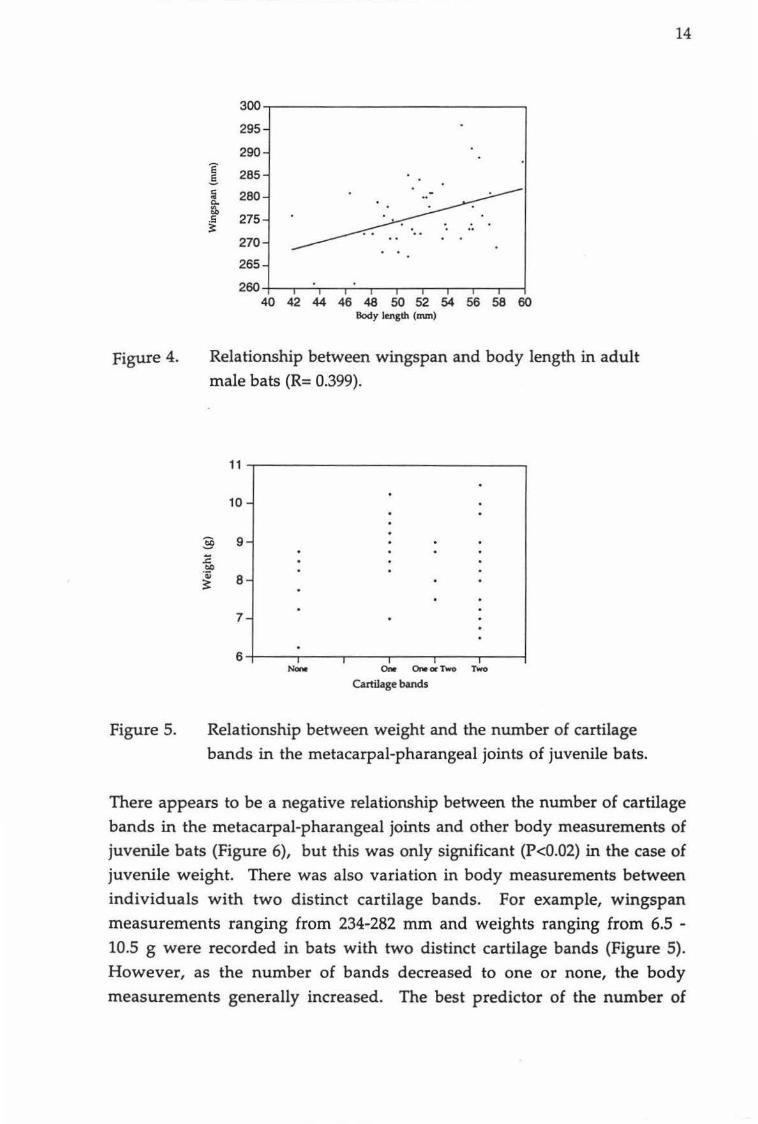
Figure 4.
Figure 5.
300
295
290
285
280
275
270
265
260 40 42 44 46 48 50 52 54 56 58 60
Body length (mm)
Relationship between wingspan and body length in adult
male bats (R= 0.399).
11 .---------------------------~
10 -
§ 9 ~ co ~ 8 -
7 -
6~--~,----.-,---,.---.,----.---~ Noow One One ar Two Two
Cartilage bands
Relationship between weight and the number of cartilage bands in the metacarpal-pharangeal joints of juvenile bats.
14
There appears to be a negative relationship between the number of cartilage
bands in the metacarpal-pharangeal joints and other body measurements of juvenile bats (Figure 6), but this was only significant (P<0.02) in the case of
juvenile weight. There was also variation in body measurements between
individuals with two distinct cartilage bands. For example, wingspan
measurements ranging from 234-282 mm and weights ranging from 6.5 -
10.5 g were recorded in bats with two distinct cartilage bands (Figure 5).
However, as the number of bands decreased to one or none, the body
measurements generally increased. The best predictor of the number of
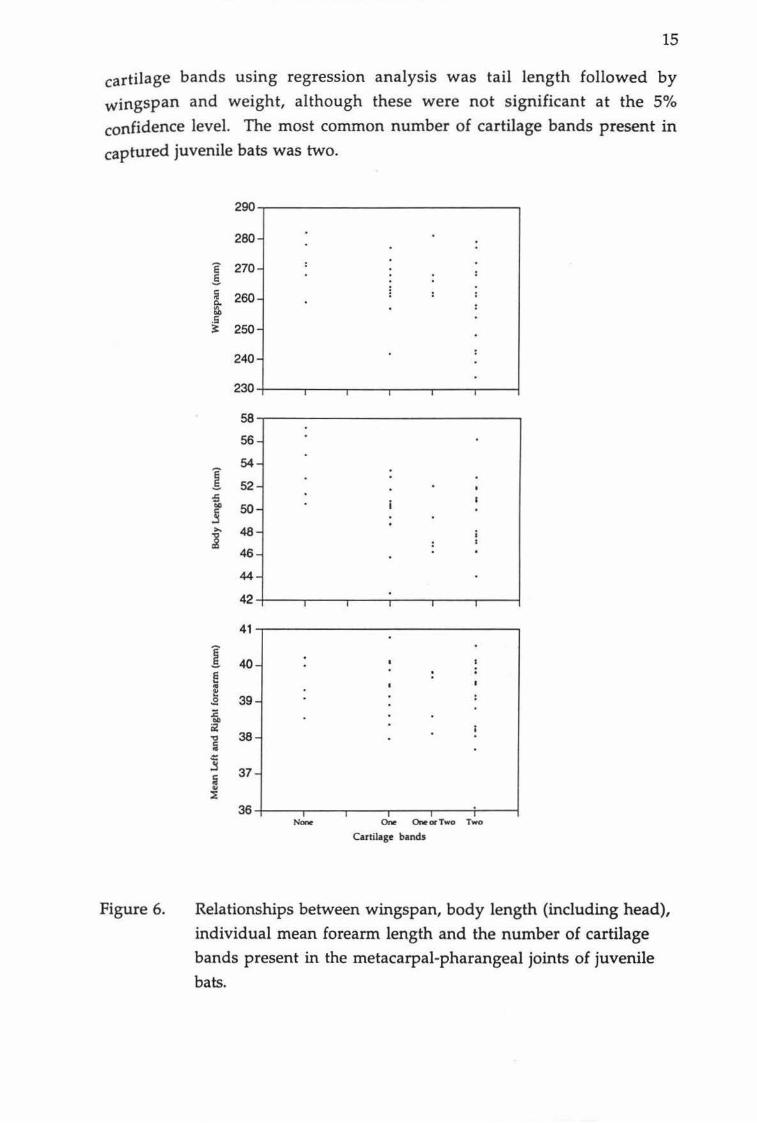
15
cartilage bands using regression analysis was tail length followed by
wingspan and weight, although these were not significant at the 5%
confidence level. The most common number of cartilage bands present in
captured juvenile bats was two.
Figure 6.
290-.------------------.
280
I 210
ii 260 ~ .s ~ 250
240
230~----~--~--r--.-~
~~------------~
56
54-
52-
50-
48-
46 -
44-
42~----~--~--r--,-~
41-.--------------~
40
39-
38-
37 -
36~--.-,-.---.--.-,-;,-~ None Orw Orw ot Two Two
Cartilage bands
Relationships between wingspan, body length (including head),
individual mean forearm length and the number of cartilage
bands present in the metacarpal-pharangeal joints of juvenile
bats.

16
Discussion
Measurements from long-tailed bats caught at Balls Clearing provided a significant data base to describe the morphometries, sex ratio, sexual
dimorphism, post-natal development, and an assessment of measurement reli~bility. In addition it should provide useful information for future
comparative work.
Morphometries
Morphometric data presented here is not entirely consistent with other reported measurements. Forearm data published by Daniel (1990) from 29
bats collected between Auckland and Oamaru have similar ranges and means to the Balls Clearing measurements. Body length and wingspan data have broader ranges than those reported by Daniel, while mean tail length measurements were considerably smaller than the minimum he reported. These discrepancies may be a consequence of different measuring
techniques. A north-south cline in C. tuberculatus size is suggested by (Daniel 1990) and is evident in closely related Australian species such as C. nigrogriseus Peters, C. morio, and C. gouldii (Van Deusen & Koopman 1971;
Hall 1970; Tidemann 1986). More morphological data collected from different populations of C. tuberculatus are needed to determine if a New Zealand north-south cline exists. More data will also help develop an understanding of how morphological differences vary with habitat type, climate type, geography and altitude.
Sex Ratio
No estimates could be made of the total number of long-tailed bats at Balls Clearing because few marked individuals were recaptured. Roost observations suggest that there are at least 208 bats in the reserve (Chapter 6).
The high ratio of adult female bats caught at Balls Clearing is not likely to reflect the true proportion of females in the population. Females have
higher energy demands during pregnancy and lactation (Millar 1977; Kunz 1987; Rydell 1993; Kurta et al. 1989; Kurta et al. 1990) so are probably more
17
active, and are more likely to be captured, than males. It is also possible that females are easier to catch during pregnancy if their manoeuvrability is reduced because of their extra weight (Aldridge & Brigham 1988). The sex ratio bias for the juvenile bats caught was the reverse of that for adults, with
more males being caught than females. The sample size of juvenile bats
caught was relatively small so the sex ratio of juveniles caught may not be a good indication of the sex ratio in the population or even of juveniles born that season. There is no obvious reason why a large proportion of captured juveniles were male. If assuming male and female juveniles have the same energy demands (ie: storing sufficient fat reserves for winter) then
they should have an equal chance of capture.
Measure Reliability
The reliability of morphometric data is likely to vary depending on which part of the body is measured because some body parts are more difficult to measure consistently than others. Bat forearms are basically a single fine bone, padded with skin at each end and so are relatively easy to measure. They are also readily accessible, and can be secured with the fore-finger and
thumb while an accurate measure is taken. The ease with which accurate forearm measurements can be gained is reflected in the lack of variation in mean left and right forearm lengths. The tail on the other hand is harder to measure consistently as some bats extend their tail allowing easy measurement while the tails of other bats need to be extended with the fingers. The measurement of body length (which includes the head length) is also likely to be variable depending on the degree of stretching or
compression of the neck and spine.
Sexual Dimorphism
Sexual dimorphism was exhibited in the size of long-tailed bats at Balls Clearing, with the tail being the only measurement that was not
significantly larger in females than in males. Larger females, however, is not a characteristic shared by all Chalinolobus species. No sexual dimorphism was found in C. gouldii forearm measurements (Dixon &
Huxley 1989), or in wing and skull dimensions (Tidemann 1986), while
sexual dimorphism where males are larger than females, was found in the

18
closely related species C. picatus Peters (Richards 1979). Sexual dimorphism
of size, therefore, appears to vary among Chalinolobus species. Most other
Vespertilionidae tend to be sexually dimorphic (Williams & Findley 1979). Several theories attempt to explain this but are beyond the scope of this
paper. Those concerning the occurrence of larger females than males are
reviewed by Williams & Findley (1979).
Juvenile Development
There is much variation in morphometries, weight and number of cartilage
bands between juveniles at the same apparent stage of development.
Juvenile C. tuberculatus with equally sized forearms and body lengths
varied greatly in weight (Figures 3a and 3b) so weight is not a good predictor
of juvenile age or stage of development. The relationship between juvenile
wingspan and body length (Figure 3c) is also highly variable. Although the
regression between juvenile wingspan and body length is strong, there is a
lot of scatter. It is unlikely that the pattern is a result of the development of
juvenile wings or bodies as there is just as much scatter with a weaker
regression when adult male wingspan is plotted against body length (Figure
4). Males were compared as pregnancy may affect female body length. More
reliable juvenile measures such as right forearm versus left hind limb
(Appendix ill 1) show it is unlikely that this scatter is caused by different juvenile parameters developing at different rates. It appears then that post
flight juvenile bats develop isometrically.
Although young bats are relatively large, size was a good initial indicator of
juvenility, with any bats with forearms less than 40 mm being checked for
other juvenile characters. Fur colour can also be used as an indicator of age.
Balls Clearing juvenile bats tended to have far darker, uniform colouring,
approaching black, while the fur of adults was chocolate brown. The presence of cartilage bands in the fourth metacarpal-pharangeal joints of the
finger was sufficient evidence to show that a bat was sub-adult. However
some juveniles had lost all visible sign of cartilage bands and yet were still
most likely to have been born in the current season because of their size,
colour, and lack of thickening in the metacarpal pharangeal joints.
In this study, the most striking thing about the number of cartilage bands
recorded in individuals was the amount of variation that existed in other

19
measurements within a cartilage band class. This suggests that the change
in the number of bands present is slow relative to the morphometric change
in body size.
The flying age of juvenile bats at Balls Clearing was estimated as approximately eight weeks (Chapter 3). This is approximately twice the age reported in Australian Chalinolobus species. C. gouldii juveniles were recorded flying soon after they reach one month of age (Lumsden &
Andrews 1988; Dixon & Huxley 1989), and C. dwyerii Peters flew three or
four weeks after birth (Hill & Smith 1984).
There was probably some variation in age between juvenile individuals
caught on the same night because there was a wide range of juvenile weights recorded on the first night juveniles were observed. It is possible that C. tuberculatus juveniles were able to fly earlier than our estimate, but females may have been waiting for favourable conditions before taking juveniles on their first flights. The onset of juvenile capture was very
sudden (Figure 2) and the weather patterns of the two proceeding nights
offer no clue to this pattern (Chapter 4). On these nights minimum and maximum temperatures were slightly lower than average, 1 em of rain fell, moonlight was low, and there was slightly below average prey abundance.
The night when the first set of juveniles were caught was relatively warm (9.5- 16.5°C), there was no rain, light wind, little sky cover and 32% of full moon. It was either a good night for juveniles to emerge, or a good night to
catch juvenile bats.
It is not known whether juveniles were attached to females when they were caught as there were no actual observations of juvenile capture. Juveniles may have been in close pursuit of their mothers, or were captured completely independently of females. All but one captured juvenile (19/1/95) were present in the trap with adult females, and all juvenile bats captured were capable of sustained flight, and flew independently when released. Repeated efforts to match juvenile bats with females captured at the same time were made. Combinations of juveniles and adult females
were left alone at release time, juveniles were held back or placed alone on tree perches, and on one occasion 18 females and 14 juveniles were released into a 2 m high shade cloth tent (approximately 3 x 2m) and observed for any sign of mother I offspring matching, but no behaviour of this kind was observed.

20
Morphometric data such as that collected at Balls Clearing provides valuable
information on the biology and development of long-tailed bats. Similar studies should be conducted in other parts of New Zealand to complement
and extend this work.
References
Aldridge, H.D.J.N & Brigham, R.M. (1988). Load carrying capacity and
manoeuvrability in an insectivorous bat: a test of The 5% "rule" of
radio telemetry. Journal of Mammalogy. 69, 379-382
21
Buller, W. C. (1875). A sighting of a large bat. Weliington Philosophical Society.
Cody, A. (1981). New Zealand Bats. New Zealand Speleological Bulletin. 6, 361-366.
Daniel, M. J. (1990). Bats: Order Chiroptera. In C. M. King (ed.), I.ill! Handbook of New Zealand Mammals. Oxford University Press, Auckland.
Dixon, J. M., & Huxley, L. (1989). Observations on a maternity colony of
Gould's bat Chalinolobus gouldii (Chiroptera : Vespertilionidae).
Mammalia. 53(3), 395-414.
Dwyer, P. D. (1960a). New Zealand bats. Tuatara. 8, 61-71.
Dwyer, P. D. (1960b). Studies on the New Zealand Chiroptera. M.Sc. thesis. Victoria, Wellington.
Dwyer, P. D. (1962b). Studies on the two New Zealand Bats. Zoological Publications from Victoria University Wellington. 28, 1-28.
Elder, N. L. (1950). Balls Clearing and Hutchinson Bush. Weiiington Botanical Society Buiietin. 23, 2-8.
Forster, J. R. (1772- 1774). Animal description re-observed and re
edited by Lichenstein, H. Cited by Tomes, R.F. (1857), Proceedings of the Zoological Society of London, Part XXV, 134-142.
Gray, J.E. (1843). Appendix to Dieffenbach's travels to New Zealand. Catalogue of the Mammalia of the British Museum. Citation by
Tomes (1857).

Halt L. S. (1970). A collection of the bat Chalinolobus morio (Gray),
from the Nullabor plain, Western Australia. Helicite. 8, 51-57.
Hill, J. E., & Smith, J. D. (eds). (1984). Bats a Natural History. British Museum of Natural History. Henry Ling Ltd, London.
Hutton, F. W. (1872). On the bats of New Zealand. Transactions and
Proceedings of the New Zealand Institute. 4, 186-188.
Kitchener, D. J. (1975). Reproduction in female Gould's wattle bat, Chalinolobus gouldii (Gray) (Vespertilionidae) in Western Australia. Australian Journal of Zoology. 23, 29-42.
Kitchener, D. J., & Coster, P. (1981). Reproduction in female
Chalinolobus morio (Gray) (Vespertilionidae) in South-Western Australia. Australian Journal of Zoology. 29, 305-320.
22
Knox, F. L. (1872). Observations on the New Zealand bats. Transactions and Proceedings of the New Zealand Institute. 4, 186-188.
Kunz, T. H. (1987). Post natal-growth and energetics of suckling bats. In
Fenton, M. B, Racey, P. A., and Rayner, J. M. V. (ed.). Recent advances in the study of bats. (pp. 395-420). Cambridge University press, Cambridge.
Kurta, A., Bell, G. P., Nagy, K. A., & Ktinz, T. H. (1989). Energetics of
pregnancy and lactation in free-ranging little brown bats (Myotis lucifugus). Physiological Zoology. 62(3), 804-818.
Kurta, A., Kunz, T. H., & Nagy, K. A. (1990). Energetics and water flux
of free-ranging big brown bats (Eptesicus fuscus) during pregnancy and lactation. Journal of Mammalogy. 71(1), 59-65.
Lands and Survey, (1982). Balls Clearing Scenic Reserve Management flm (S.R.66 ISSN 0111 - 0381). Napier: Department of Lands and Survey.

Lumsden, L. F. & Andrews, C. K. (1988). Observations on an assisted
parturition of a Gould's wattled bat, Chalinolobus gouldii.
Macroderma. 4, 66-69.
Millar, J. S. (1977). Adaptive features of mammalian reproduction.
Evolution. 31, 370-386.
23
Parnaby, H. {1992). An interim guide to identification of insectivorous
bats of South-eastern Australia. Technical reports of the Australian
Museum. 8
Peters. (1866). A re-description of the long-tailed bat cited by Daniels
(1990), Bats: Order Chiroptera. In C.M. King (Ed), The Handbook of
New Zealand Mammals. Oxford University Press. Auckland.
Richards, G. (1979). New information on the little pied bat
Chalinolobus picatus. Australian bat research news. 14, 7-8.
Rydell, J. {1993). Variation in foraging activity of an aerial
insectivorous bat during reproduction. Journal of Mammalogy, 74(2),
503-509.
Tang Strait, P. (1989). A first course in probability and statistics with
applications. (2nd edn.). Harcourt Bruce Jivanovich. San Diego. 599pp.
Tidemann, C. R. (1986). Morphological variation in Australian and
island populations of Gould's wattled bat, Chalinolobus gouldii, (Gray) (Chiroptera: Vespertilionidae). Australian Journal of Zoology. 34, 503-
514.
Tidemann, C. R., & Woodside, D.P. (1978). A collapsible bat-trap and a
comparison of results obtained with the trap and with mist-nets. Australian Wildlife Research. 5, 355-362.
Tomes, R. F. (1857). On the two species of bats inhabiting New Zealand.
Proceedings of the Zoological Society of London. Part XXV, 134-142.

24
VanDeusen, H. M., & Koopman, K. F. (1971). Results of the Archbold
expeditions. No 95. The genus Chalinolobus (Chiroptera:
Vespertilionidae). Taxonomic review of Chalinolobus picatus,
C.nigrogriseus and C.rogersi. American Museum Novitates. 2468.
Williams, D. F., & Findley, J. S. (1979). Sexual size dimorphism in
Vespertilionid bats. American Midland Naturalist. 102, 113-126.

Chapter3

The breeding season of long-tailed bats, Chalinolobus tuberculatus Gray (Vespertilionidae) in a North Island podocarp forest.
Abstract
25
The breeding season for long-tailed bats at Puketitiri, Hawkes Bay was determined by monitoring female weight, nipple size and the-occurrence of juvenile bats. Most females gave birth in mid-November. Weight gain amongst females was more consistent up to parturition than weight loss
after. Parturition was earlier than closely related species at similar latitudes in Australia. The onset of nipple enlargement coincided with parturition and nipples did not reduce in size until volant juveniles were captured in early January. This suggests that lactation lasted approximately eight weeks; up to four weeks longer than other Chalinolobus species in Australia. Almost all females (87.8%) captured during breeding showed signs of pregnancy or lactation.
Keywords: Bats, Vespertilionidae, Chalinolobus tuberculatus, breeding, parturition, lactation, juvenile.
Introduction
Two bats survive in New Zealand, the lesser short-tailed bat Mystacina tuberculata Gray, (Mystacinobidae), and the long-tailed bat Chalinolobus tuberculatus Gray (1843). The greater short-tailed bat Mystacina robusta Dwyer, is thought to have been extinct since 1965 (Daniel 1990). The longtailed bat belongs to the largest and worldwide family, Vespertilionidae. It
has five closely related species in Australia, Tasmania, Norfolk Island, New Caledonia and New Guinea (Daniel1990).
The breeding biology of the long-tailed bat is virtually unknown. Daniel (1990) suggested that mating probably occurs in autumn, ovulation and fertilisation probably occur in spring and parturition, at least in the North
Island, occurs in summer. Detailed studies of reproduction and development in two closely related Australian species, C. morio Gray and C. gouldii Gray, have been published (Kitchener 1975; Kitchener & Coster
1981, respectively). The timing of pregnancy, parturition and lactation have

26
been noted for C. gouldii and C. mario (Young 1979, 1980; Kitchener &
Coster 1981; Lumsden & Andrews 1988; Dixon & Huxley 1989) and appear to
vary with latitude as in many species (Racey 1982).
The main aim of this study was to determine the parturition times and the
length of the lactation period in long-tailed bats. We predict that regular measurements of female weight in one population through spring and summer will help determine the period when most females_ are pregnant and give birth. From descriptions of nipple size and the presence of volant juveniles, the length of the lactation period should be able to be determined.
Latitude and habitat types are likely to affect the timing of the breeding
season and this was tested by comparing our data with closely related species in Australia. Bat and prey activity levels from concurrent studies will be used to discuss the energy demands of long-tailed bats during reproduction.
Study site
Data on the breeding season of the bats was collected at Balls Clearing Scenic
Reserve, Puketitiri, Hawkes Bay. Vegetation types, climate and geography are described in Chapter 1.
Methods
Adult bats captured in harp traps {Tidemann & Woodside 1978) during
spring and summer were weighed to the nearest 0.25 g using 50 g spring scales. Mean male and mean female weights were calculated for each week that bats were captured. The nipples of adult females were examined for signs of lactation as described in (Parnaby 1992) and classified as having either no obvious nipples, evident but not enlarged nipples, enlarged nipples, or very enlarged nipples. Bats were confirmed as juveniles by the presence of cartilage bands or the lack of bulging in the metacarpalpharangeal joints (Kunz & Anthony 1982; Parnaby 1992), as well as the weight and colour of individuals (Chapter 2).
27
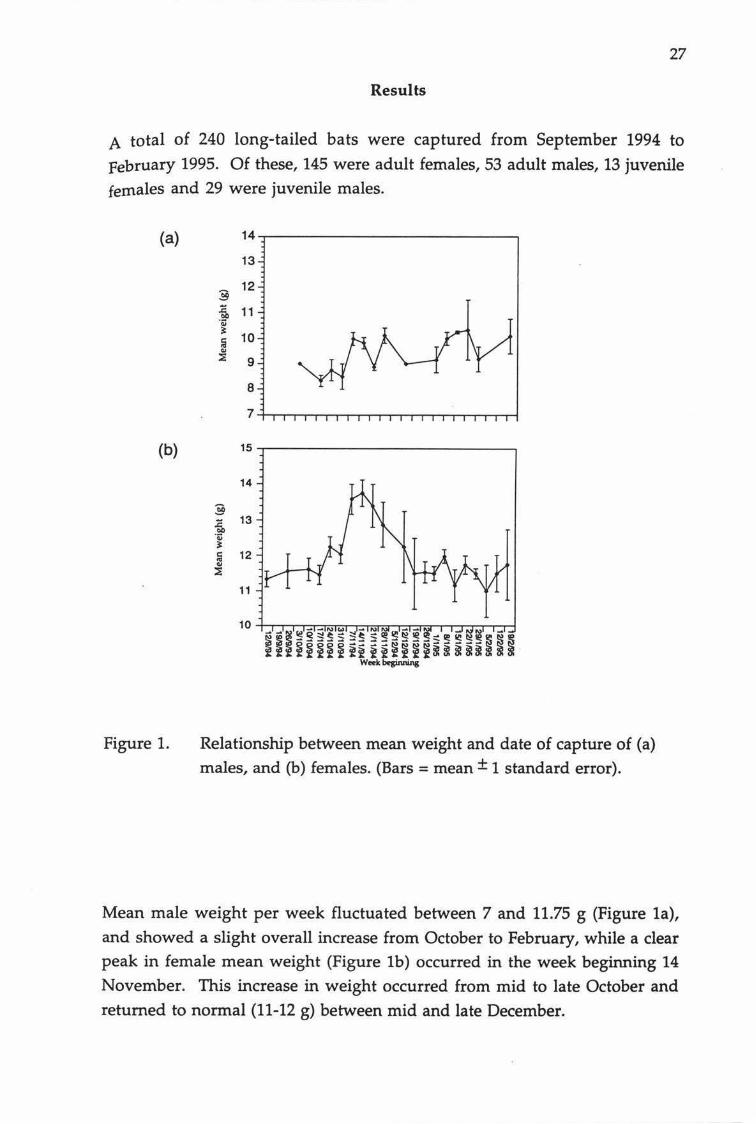
Results
A total of 240 long-tailed bats were captured from September 1994 to
February 1995. Of these, 145 were adult females, 53 adult males, 13 juvenile
females and 29 were juvenile males.
(a)
(b)
Figure 1.
14
13
:§ 12
.fo 11 ·o; ~
10 ~ ~
~ 9
8
7
15
14
:§ .fo 13
-~
~ 12 ~
11
Relationship between mean weight and date of capture of (a) males, and (b) females. (Bars= mean± 1 standard error).
Mean male weight per week fluctuated between 7 and 11.75 g (Figure 1a),
and showed a slight overall increase from October to February, while a clear peak in female mean weight (Figure lb) occurred in the week beginning 14
November. This increase in weight occurred from mid to late October and
returned to normal (11-12 g) between mid and late December.
28
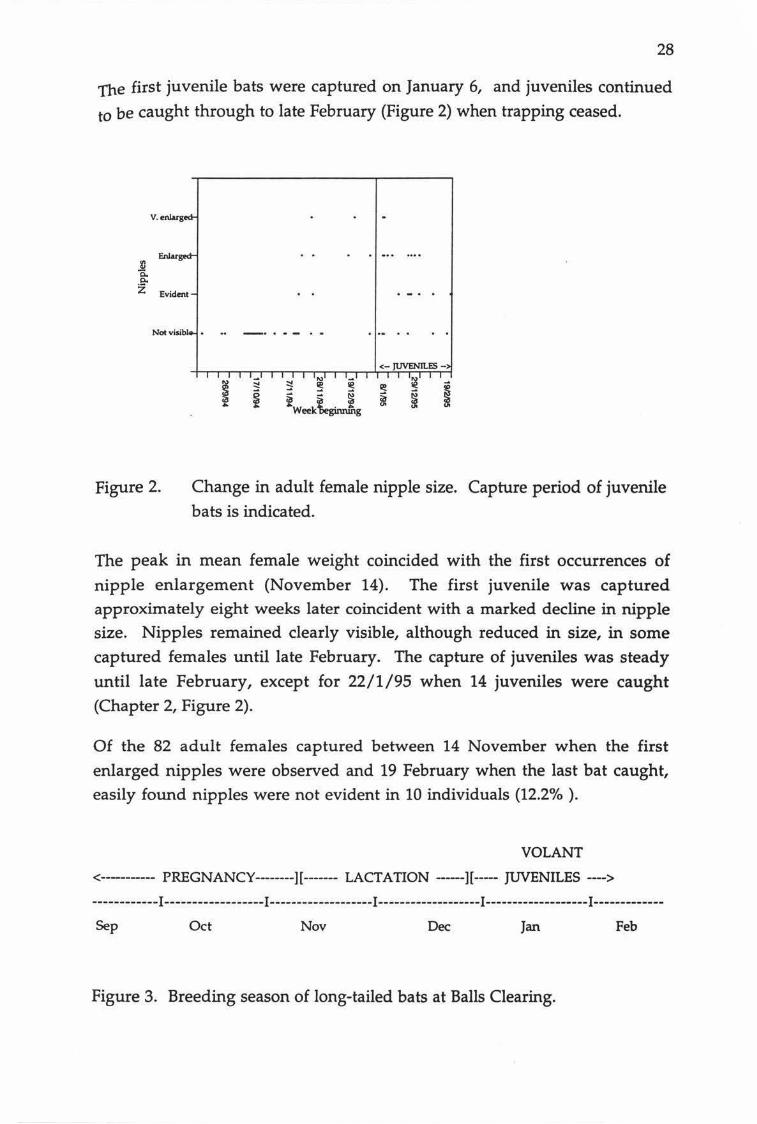
The first juvenile bats were captured on January 6, and juveniles continued
to be caught through to late February (Figure 2) when trapping ceased.
V. enlugtd-
1! EnW~
.e: Z Evident -
Not vis.ibl• • •• -· • • -
<- jUVENilES - >
Figure 2. Change in adult female nipple size. Capture period of juvenile
bats is indicated.
The peak in mean female weight coincided with the first occurrences of
nipple enlargement (November 14). The first juvenile was captured approximately eight weeks later coincident with a marked decline in nipple
size. Nipples remained clearly visible, although reduced in size, in some
captured females until late February. The capture of juveniles was steady
until late February, except for 22/1/95 when 14 juveniles were caught
(Chapter 2, Figure 2).
Of the 82 adult females captured between 14 November when the first
enlarged nipples were observed and 19 February when the last bat caught, easily found nipples were not evident in 10 individuals (12.2% ).
VOLANT
<-------- PREGNANCY-------][------- LACTATION ----][---- JUVENILES --->
------------I------------------I-------------------I-------------------1-------------------I-------------Sep Oct Nov Dec Jan Feb
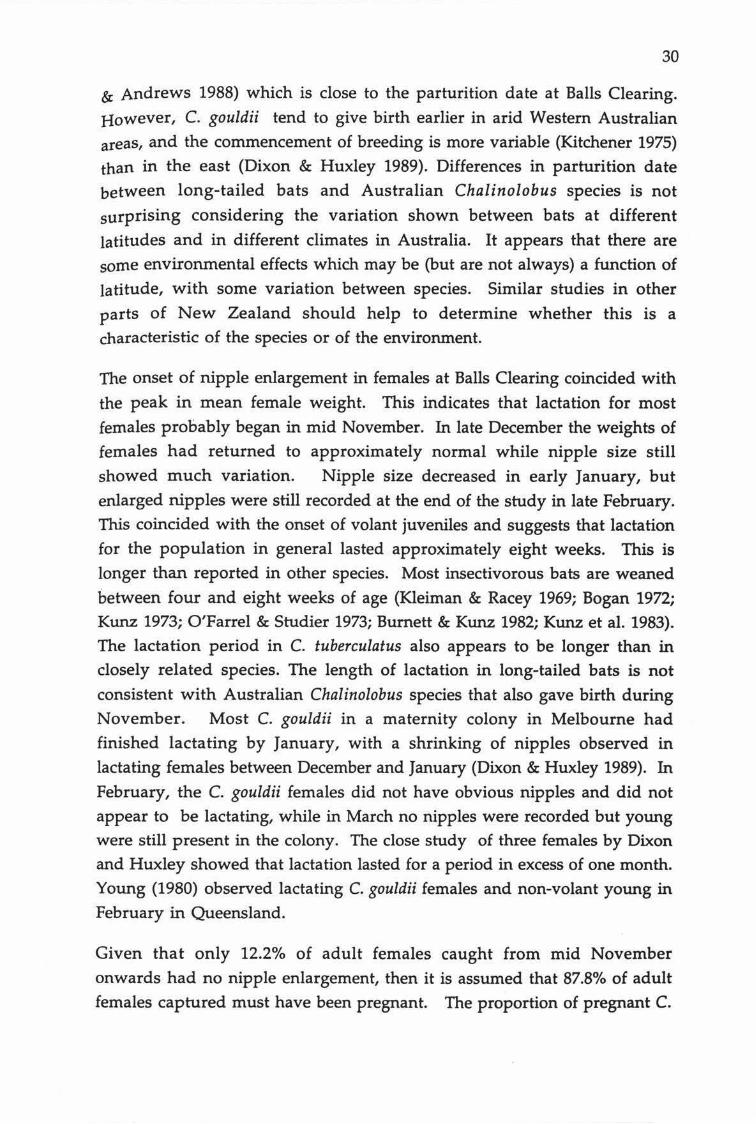
Figure 3. Breeding season of long-tailed bats at Balls Clearing.

29
Discussion
parturition dates and the length of the lactation period were identified for
long-tailed bats at Balls Clearing, Hawkes Bay. Mean male weights generally
increased from October through to February but were quite variable. This
increase in male weight through the season was probably the result of
increased fat reserves for winter. Female weights were more consistent, and
showed a distinct increase during November prior to giving birth, peaking
near the middle of the month. Weight varied less up to November than
after parturition suggesting that weight gain in females was more consistent among individuals than the post natal weight loss. It also took
longer for the mean weight to return to normal (approximately five weeks)
than it did to reach its peak (approximately three weeks). It is possible that
the onset of favourable environmental conditions resulted in this uniform weight increase while individual variability in foraging behaviour and
physiology during the weeks following birth may contribute to the large
variation in weight. Similar patterns have been observed in other
Vespertilionidae species. In Miniopterus schreibersii Bonaparte, embryo
implantation is thought to be synchronised in females and initiated by
increasing day-length (Bernard 1994), foetal growth was synchronous during
the first three months of post-implantation, then showed more variation in
foetal weight and foetal age in the last month of pregnancy. The timing of
breeding in many species reflects variations in food supply (Racey 1982).
Parturition in Eptesicus nilssonii Rafinesque coincided with the shortest
period of darkness around the summer solstice (Rydell1993). This does not occur in C. tuberculatus as the summer solstice occurred approximately four
weeks after the estimated parturition.
The timing of breeding of C. tuberculatus is different to closely related
Australian species. Bats at Balls Clearing gave birth earlier than
Chalinolobus gouldii at a similar latitude (Bass Straight) (Kitchener 1975), while the birth of C. mario in Queensland was observed as early as 20
October (Young 1979). Kitchener made detailed reproductive studies of
several Chalinolobus species in Australia and concluded that the birth
period varies with latitude; from late November to December in the south
west region, and earlier in northern areas. Latitude however must explain
only part of the variation in parturition dates of different species. The birth
of C. gouldii in Victoria however was observed on 10 November (Lumsden
30
& Andrews 1988) which is close to the parturition date at Balls Clearing. However, C. gouldii tend to give birth earlier in arid Western Australian
areas, and the commencement of breeding is more variable (Kitchener 1975) than in the east (Dixon & Huxley 1989). Differences in parturition date
between long-tailed bats and Australian Chalinolobus species is not
surprising considering the variation shown between bats at different latitudes and in different climates in Australia. It appears that there are some environmental effects which may be (but are not always) a function of latitude, with some variation between species. Similar studies in other
parts of New Zealand should help to determine whether this is a characteristic of the species or of the environment.
The onset of nipple enlargement in females at Balls Clearing coincided with
the peak in mean female weight. This indicates that lactation for most females probably began in mid November. In late December the weights of females had returned to approximately normal while nipple size still
showed much variation. Nipple size decreased in early January, but enlarged nipples were still recorded at the end of the study in late February. This coincided with the onset of volant juveniles and suggests that lactation for the population in general lasted approximately eight weeks. This is longer than reported in other species. Most insectivorous bats are weaned
between four and eight weeks of age (Kleiman & Racey 1969; Bogan 1972; Kunz 1973; O'Farrel & Studier 1973; Burnett & Kunz 1982; Kunz et al. 1983). The lactation period in C. tuberculatus also appears to be longer than in closely related species. The length of lactation in long-tailed bats is not
consistent with Australian Chalinolobus species that also gave birth during November. Most C. gouldii in a maternity colony in Melbourne had finished lactating by January, with a shrinking of nipples observed in
lactating females between December and January (Dixon & Huxley 1989). In
February, the C. gouldii females did not have obvious nipples and did not appear to be lactating, while in March no nipples were recorded but young were still present in the colony. The close study of three females by Dixon and Huxley showed that lactation lasted for a period in excess of one month. Young (1980) observed lactating C. gouldii females and non-volant young in February in Queensland.
Given that only 12.2% of adult females caught from mid November onwards had no nipple enlargement, then it is assumed that 87.8% of adult females captured must have been pregnant. The proportion of pregnant C.
31
tuberculatus females is high when compared to C. gouldii where only 40% (38 out of 95) of banded females were pregnant or lactating, with the
rnajority of them breeding only once in two seasons (Dixon & Huxley 1989). However pregnant females are generally more active than non-pregnant females, and also may have reduced manoeuvrability (Aldridge & Brigham 1988; Young 1980) so the chance of their capture are increased. The mortality rate of juveniles is not known so this cannot be extrapolated to
derive a measure of productivity. It could however be used as an indicator of changes in birth rate at this site as more data are obtained from future
seasons.
Long-tailed bats at Balls Clearing were most active during pregnancy, and the peak in activity corresponds with the mean parturition date of females
while there was a reduction in activity during lactation (Chapter 4).
Assuming that there was no mass migration of females and their young out of the area (which is unknown), this suggests that pregnancy (and
particularly the last stage of pregnancy) was the most energy demanding period. In general lactation is more energy demanding in insectivorous bats than pregnancy (Millar 1977; Kunz 1987; Rydell 1993; Kurta et al. 1989; Kurta et al. 1990). The reduction in activity during lactation in long-tailed bats may be a reflection of the time female bats require to suckle young.
32
References
Aldridge, H. D. J. N., & Brigham, R. M. (1988). Load carrying capacity
and manoeuvrability in an insectivorous bat: a test of the 5% "rule" of
radio telemetry. Journal of Mammalogy. 69, 379-382.
Bernard, R. T. F. (1994). Reproductive synchrony and annual variation
in foetal growth rate in the long-fingered bat (Miniopterus schreibersii). Journal of Zoology, London. 232, 485-490.
Bogan, M.A. (1972). Observations on parturition and development in
the hoary bat, Lasiurus cinereus. Journal of Mammalogy. 53, 611 - 614.
Burnett; C. D., & Kunz, T. H . (1982). Growth rates and age estimation in
Eptesicus fuscus and comparison with Myotis lucifugus. Journal of Mammalogy. 63, 758-766.
Daniel, M. J. (1990). Bats: Order Chiroptera. In C. M. King (ed.), The
Handbook of New Zealand Mammals. Oxford University Press,
Auckland.
Dixon, J. M., & Huxley, L. (1989). Observations on a maternity colony of
Gould's bat Chalinolobus gouldii (Chiroptera: Vespertilionidae).
Mammalia. 53(3), 395-414.
Gray, J. E. (1843). Appendix to Dieffenbach's travels to New Zealand.
Catalogue of the Mammalia of the British Museum. Citation by
Tomes, R. F. (1857). On the two species of bats inhabiting New
Zealand. Proceedings of the Zoological Society of London. Part XXV,
134-142.
Kitchener, D. J. (1975). Reproduction in female Gould's wattle bat,
Chalinolobus gouldii (Gray) (Vespertilionidae) in Western Australia.
Australian Journal of Zoology. 23, 29-42.
Kitchener, D. J., & Coster, P. (1981). Reproduction in female
Chalinolobus morio (Gray) (Vespertilionidae) in South-Western
Australia. Australian Journal of Zoology, 29, 305-320.

Kleiman, D. G., & Racey, P. A. (1969). Observations on Noctule bats
(Nyctalus noctula) breeding in captivity. Lynx. 65-77.
Kunz, T. H. (1973). Resource utilization: Temporal and spatial
components of bat activity in central Iowa. Journal of Mammalogy. 54(1) 1 14-32,
33
Kunz, T. H. (1987). Post natal-growth and energetics of suckling bats. In R. P. Fenton F B, Rayner J M V (Ed.), Recent advances in the study of
Q.rus.. (pp. 395-420). Cambridge University press. Cambridge.
Kunz, T. H., & Anthony, E. L. P. (1982). Age estimation and postnatal growth rates in the bat Myotis lucifugus. Journal of Mammalogy. 63,
23-32.
Kunz, T. H., Stack, M. H., & Jenness, R. (1983). A comparison of milk
composition in Myotis lucifugus and Eptesicus Juscus (Chiroptera: Vespertilionidae). Biology of Reproduction. 28, 229-234.
Kurta, A., Bell, G. P., Nagy, K. A., & Kunz, T. H. (1989). Energetics of pregnancy and lactation in free ranging little brown bats. Physiological Zoology. 62(3), 804-818.
Kurta, A., Kunz, T. H., & Nagy, K. A. (1990). Energetics and water flux
of free-ranging big brown bats (Eptesicus Juscus) during pregnancy and lactation. Journal of Mammalogy. 71(1), 59-65
Lumsden, L. F., & Andrews, C. K. (1988). Observations on an assisted
parturition of a Gould's wattled bat, Chalinolobus Gouldii. Macroderma. 4, 66-69.
Millar, J. S. (1977). Adaptive features of mammalian reproduction.
Evolution. 31, 370-386.
O'Farrel, M. J., & Studier, E. H. (1973). Reproduction, growth and
development in Myotis thysanodes and M. lucifugus (Chiroptera: Vespertilionidae). Ecology. 54, 18- 30.

34
Pamaby, H. (1992). An interim guide to identification of insectivorous
bats of South-eastern Australia. Technical reports of the Australian
Museum. 8.
Racey, P. A. (1982). Ecology of bat reproduction. InT. H. Kunz (ed.),
Ecology of Bats. Plenum Press. New York.
Rydell, J. (1993). Variation in foraging activity of an aerial insectivorous bat during reproduction. Journal of Mammalogy. 74(2),
503-509.
Tidemann, C. R., & Woodside, D.P. (1978). A collapsible bat-trap and a comparison of results obtained with the trap and with mist-nets.
Australian Wildlife Research. 5, 355-362.
Young, R. A. (1979). Observations on parturition, litter size, and foetal
development at birth in the chocolate wattled bat, Chalinolobus morio
(Vespertilionidae). Victorian Naturalist. 96, 90-91.
Young, R. A. (1980). Observations of the vulnerability of two species of wattle bats (Chalinolobus) to avian predators. Victorian Naturalist. 97,
258-262.

Chapter4
The foraging activity of long-tailed bats Chalinolobus tuberculatus Gray (Vespertilionidae) over spring and summer.
Abstract
35
Bat activity in Balls Clearing was monitored using an automatic bat detector
that records bat echolocation. The number of bat passes in . the first hour
after sunset, the number of passes per hour of darkness and the total number of passes during the night were analysed with respect to weather, light intensity and potential insect prey abundance. Combinations of month of the year, maximum temperature, sky cover, wind strength and
moonlight intensity best explained variation in bat activity. All three measures of bat activity were highest during pregnancy with reduced
activity during lactation. The time of the first pass relative to sunset was earliest during September and February. Lactation and juvenile volance
occurred during the two highest peaks in insect abundance. Diurnal bat activity generally followed a bimodal pattern with peaks of activity in the first and last hour of darkness, however there were seasonal differences in
this pattern.
Keywords: Bats, Chalinolobus tuberculatus, seasonal activity, diurnal activity, insect abundance, light intensity, weather.
Introduction
Most insectivorous bat species have evolved nightly activity patterns to minimise the time spent in flight (Kunz 1982). These can be affected by
prevailing external conditions such as weather, light intensity, potential changes in prey availability and length of the night (Laufens 1972; Erkert 1974; Kunz 1974; Fenton et al. 1977; Swift 1980; Kunz 1982).
The annual activity of Chalinolobus mario was studied in Tasmania with respect to insect prey abundance {Taylor & O'Neill 1988; Taylor & Savva 1990), and some seasonal aspects of activity were described for C. picatus and C. gouldii (Richards 1979). Seasonal capture rates and emergence of C.
gouldii are discussed by Dixon & Huxley (1989), but there are no published data describing the diurnal and seasonal changes in activity of New Zealand
36
bats, or the effects that environmental conditions have on their activity.
Little is known of the long-tailed bat's (C. tuberculatus Gray) activity
pattems other than the dates of long-tailed bat sightings (Daniel & Williams
1984). Most of these sightings were in January and February.
The major aim of this paper is to describe the activity of a forest population
of long-tailed bats. Seasonal changes in the time of the first pass, the
number of passes (over a fixed point) in the first hour after sunset, bat
activity through the night and how the bats use the hours of darkness are
described. Seasonal activity is analysed with respect to environmental
condition including weather, light intensity and prey abundance.
Methods
Bat activity
All data was collected at Balls Clearing Scenic reserve between 9/9/94 and
22/2/95. A review of the location, geography, habitat type and climate is
included in Chapter 1. Bat passes were automatically recorded using a
sound-activated tape recorder (Sony TCM 38V) and a Mini-2 Bat detector
(Ultra Sound, Birmingham). These were placed inside a three litre plastic container with the microphone of the detector pointed through a hole cut in
the plastic, while the speaker was orientated toward the tape recorder. The
tape recorder also recorded the time of each pass. The detector was powered
by 2 AA Alkaline batteries which lasted for two nights. This set-up suited long periods in the field without the need to recharge batteries. The unit
was tested in several sites during September until a suitable site was
selected. This site was then used for the remainder of the study. The site
(Chapter 1, Figure 1) was approximately 100m into dense mature podocarp
forest and was chosen for the following reasons. The number of passes per
night usually ranged within the recording capabilities of a C90 audio tape so
that the highest number of complete bat nights could be recorded. The site overlooked a slow moving tributary of the main Balls Clearing stream, and
was central with easy access. The bat recorder was always set at full volume
and the recording volume on the tape recorder was always set at 1/4 of full.
The detector was placed on the forest floor, 1.5 m above water level with the
microphone pointing towards the canopy at an approximate angle of 20°
from level. This position and direction was kept as constant as possible
37
throughout the study. Tapes were analysed and the time to the nearest
rninute of each pass was noted on the day following each night's recording.
seasonal changes in activity were investigated by analysing the total number
of bat passes per night, the number of passes per hour of darkness, the time
of the first pass and the number of passes in the first hour after sunset.
Patterns of diurnal activity were investigated by splitting each night into 20
equal segments. This gave a nightly activity value for each se?ment relative
to other periods during the night.
Insect abundance
Insects were sampled using a malaise trap. This provided an indication of
possible bat prey species abundance (Barclay 1985). The malaise trap site was
chosen so that it was adjacent to four habitat types used by the bats at the
reserve: mature podocarp forest; mature red beech forest; stream; and
pasture. The malaise trap was emptied during the last hour of sunlight
every three days, and the insects stored in 70% ethanol.
Insect taxa that were either known prey items (Daniel & Williams 1983;
Dwyer 1962; Colenso 1890; Roach & Turbott 1953; Lewis, pers. comm.11995; Chapter 5) or known to be nocturnal or crepuscular, and likely prey species, were identified and removed from the samples and sorted into three size
classes: small (< 4 mm in body length), large(> 20 mm body length), and
medium (4 mm- 19 nun). Insects in the small class were mostly Sciaridae,
Mycetophilidae and micro- Lepidoptera. Large insects included huhu
beetles and lemon tree borer (Cerambycidae), large green chafers and large
grass grub beetles (Scarabaeidae), large moths, and Tipulidae, while medium
sized insects included all remaining moths, Tipulidae, Tanyderidae,
Chironomidae, Culicidae, Plecoptera, Tricoptera and Neuroptera.
Alcohol was then evaporated from analysed samples by placing the
individual vials under 60 w light bulbs for two days. When only small
quantities of ethanol and water remained, the vials were placed in a drying oven at 60°C for five days. The dry weight of each sample was measured
1 c/o David Lewis, RD 4 Puketitiri, Hawkes Bay.

38
using electronic scales. Preliminary trials indicated that 7.78% to 34.11% of
the weight of insects were dissolved in the ethanol and remained on the surface of the vials as a fatty layer. Each sample was dried and weighed in its original vial and the mean weight (n=30) of new vials was subtracted so this
residue was included. The effect that potential prey abundance factors have on insect activity were tested separately from other environmental
variables.
Weather
Five meteorological characteristics were measured during this study. Maximum and minimum temperatures were taken from a thermometer
placed 1m above the bat detector. The thermometer was reset at dusk and the temperature was recorded every morning when the tape was collected. Rainfall was measured using a rain gauge placed in pasture adjacent to the
native forest. Wind strength was estimated as either still, light, moderate, strong or very strong. Numerical values (0 - 4) were later assigned to these estimates. Several measures of light intensity were calculated: the percentage of the full moon; the time in minutes that the moon was out;
and the percentage cloud cover of the sky (which took cloud thickness into consideration). The length of twilight, sunset and sunrise time, moon phase and the amount of time the moon was out per night were calculated from local data obtained from the Carter Observatory, Wellington. Originally the percentage of full moon and the time when the moon was out were combined to get a figure of moonlight intensity. The two variables are closely related such that when there is half moon, the moon is visible for half of the maximum in its cycle, and likewise with all intermediate phases from no moon to full ). Moon minutes were used because more
detailed data were available for intermediate phases.
Statistical analyses
The effects of individual environmental variables on the measures of bat activity were tested using single regression analysis in MINIT AB.
Multivariate analysis using a standard stepwise procedure was run using SAS (SAS 1985) on the seven environmental variables: month, minimum
temperature, maximum temperature, rain, % moon, moon duration, sky cover and wind. This stepwise procedure isolated extrinsic factors affecting
39
each measure of activity and allowed a model to be constructed that best
explains the variation in bat activity using combinations of relevant
individual variables.
Stepwise regression analysis was also used to test the effects of potential prey
species abundance on bat activity. Bat activity data was converted to three
day mean activity values when testing prey abundance effects because
malaise trap samples were emptied every three days. Variables used in
these models were: the total number of insects trapped every three days; the
total number of potential prey insects trapped; total potential Diptera prey;
total potential Lepidoptera prey; total potential Coleoptera prey; and the total
weight of potential prey individuals.
Results
Passes recorded from 78 full nights were used in the analysis. A further 67
nights of bat passes were not used for the following two reasons. First, there
was so much activity that the tape ended during the night. The inclusion of
this data would result in under-representation of the later part of the night.
Second, on some nights with heavy rain it was difficult to confirm which
recorded sounds were bat echolocation and which were rain drops falling onto leaf litter. The tape would usually run out before sunrise during
nights of heavy rain. The effect that rainfall has on bat activity is therefore
under-represented.
Bats were least active between December and February, with sharp declines from December in the number of passes in the first hour after sunset, the
number of passes per hour of darkness and the total number of passes
during the night (Figure 1). Mean passes in the first hour of darkness were
highest in September. Mean total passes per night were highest in October
while mean passes per hour of darkness were highest in November.
40
Figure 1. Seasonal changes in (a) mean total passes for the wholenight, (b) mean number of passes per hour of darkness, and (c)
mean passes during the first hour after sunset. Bars = mean t 1
standard error.
; 15000cor$ 100GA6o
550O
0
16
14
i"'";106.
fl8€
cOI
2
0
to6.5
n6o2a60

(a)
e & ::! "' c. E ;;:
0 41
E i=
(b)
~
"' ~ ;:l c: ]. .z: -eo c: ..!! .l: ~
~
Figure 2.
10. 0
9.30 0 0 ~
0 9.00 o ~0 <oo 0 0
~ 0 -·· 8.30 ol~~ 0 0 ....
8.00 ~ ... ,- 0 ,,
0
7.30 0 oo ~
~ 7.00
6.30
6.00
5.30
5.00 ~p Dec Jan
Date
130 - 100 . -- 80 120 . ~ . :;· ::l - 60 c: 3 - -~ . ~0 110 -. ...--- 40 if[ -. . ... -.. _ .. - "'~ 100 §::: . .. - 20 !1ft . 90 Sunset
. -20 80 ~p
Date
Seasonal change in (a) time of first pass (0) and time of sunset ( • ), and (b) time after sunset that first pass was
recorded (o) and astronomical twilight length (x).
Regression line of time of first pass also shown (R =
0.508). Data is corrected for day-light saving.
41
The mean time of the first recorded pass was 19.10 min after sunset. When the time of sunset is standardized, the time period between sunset and the
42
first recorded pass was at a maximum during early December, while astronomical twilight length was at a maximum from 16 - 26 December
(Figure 2b ). There was some variability in the time of the first recorded pass.
During September and February the first pass was recorded up to 20 minutes
before sunset, while no passes were recorded before sunset during October,
November, December or January.
Using single regression analysis no individual environmental variable
significantly explained the variation in the three measures of bat activity.
Some combinations of variables do explain significant components of this
variation using multivariate stepwise regressions (Table 1).
Table 1.
Variable
Month
MaxT
Sky
Summary of stepwise regression procedure for time of first
pass.
Partial R2 Model R2 C(p) F Prob>F
0.284 0.284 15.951 11.084 0.002
0.232 0.516 4.358 12.942 0.001
0.085 0.601 1.355 5.570 0.026
The model that best describes the time of the first pass consists of the
following three significant variables. Month of the year alone explained
28.36% of the variance in time of first pass (Prob>F = 0.003), whereas
maximum temperature together with month explained 51.57% of the
variance (Prob>F = 0.002). When sky cover was added to the model in the
third step, the R2 value is increased to explain 60.12% of the variation in
time of first pass (Prob>F = 0.03). The best three-variable predictor model to
fit a linear function to the time of first pass data is the equation:
T = -49.878 + 3.201 + 3.605 + 0.080
(Month) (Max Temperature) (Sky cover)

Table 2.
.... Variable
Wind
Moon min
Month
Summary of stepwise regression procedure for number of
passes in the first hour after sunset.
Partial R2 Model R2 C(p) F Prob>F
0.3115 0.3115 10.3845 15.3845 0.0004
0.1245 0.4360 4.6229 7.2860 0.0109
0.0548 0.4908 3.2599 3.4426 0.0728
43
The model that best describes the number of bat passes in the first hour after
sunset also consists of three significant variables. Month alone explained
31.15% of the variance in recorded passes (Prob>F = 0.0005). When the time
that the moon was out (which reflects both moon light intensity and
duration) is added to the model, the two variables together explain 43.60% of
the variance (Prob>F = 0.02). Wind strength was added to the model and
increased the R2 value so the complete three variable model explained
49.08% of the variation. The best predictor model to fit a linear function to
the number of passes recorded in the first hour after sunset is the equation:
p = -28.845 + 2.241 + 0.070 + 0.241 (Month) (Moon minutes) (Wind strength)
No model of environmental variables using the stepwise procedure
significantly explained the variation in the total number of passes recorded during the night (Appendix ill).
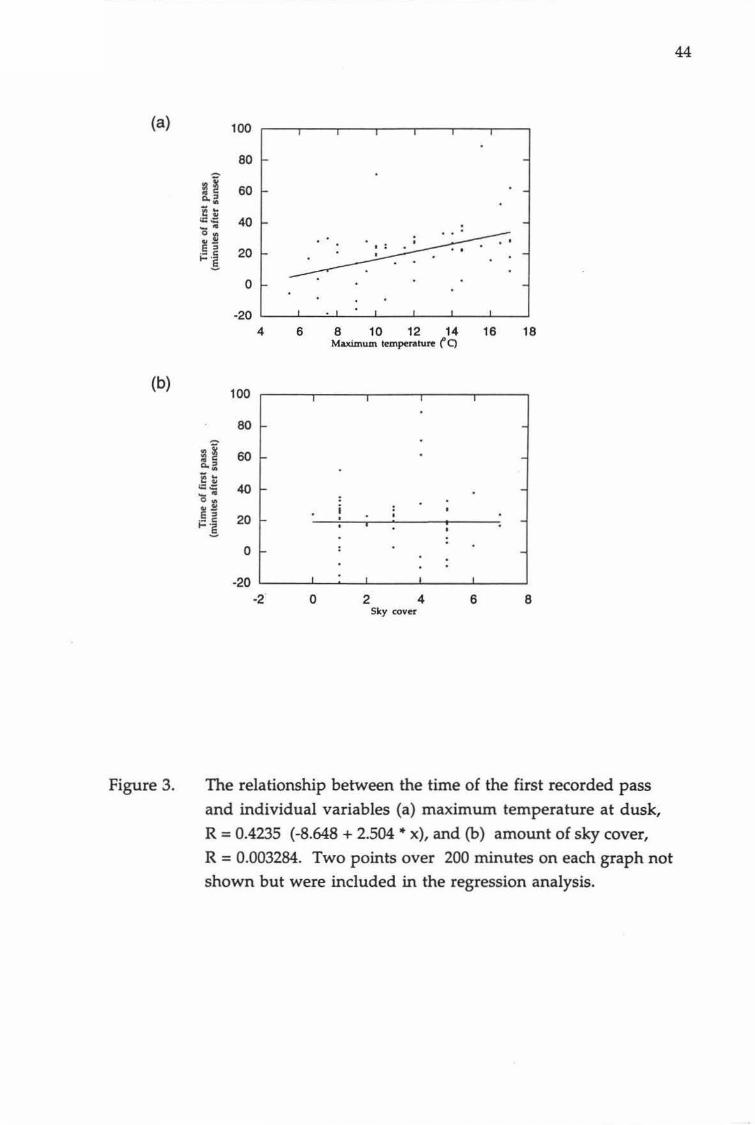
(a)
(b)
Figure 3.
100
80
~~ 60 a.:> .. ]~ 40 ..... o XI e;;
20 j:: ~
0
-20 4 6 8 10 12 14 16 18
Maximum temperature r 0
100
80
~w 60 a.:> ., i!~ f.:~ 40 ..... OXJ e;;
20 ·- c: ... :s 0
-20 -2· 0 2 4 6 8
Sky cover
The relationship between the time of the first recorded pass and individual variables (a) maximum temperature at dusk,
R = 0.4235 ( -8.648 + 2.504 • x), and (b) amount of sky cover,
R = 0.003284. Two points over 200 minutes on each graph not
shown but were included in the regression analysis.
44

(a)
(b)
Figure 4.
45
~ 120 §
100 "' ~ .::: <0 80 .. :I 0 :t 60 ~ -.5
40 ~ "' .. Q., 20 0 .. .! 0 § z -20
0 1 2 3 4 Wind strength
I 120
100 "' .. .!! -.. 80 .. :I 0 :t
60 -"' -.s 40
~ .. Q., 20 0 .. . .! 0 . . .· .. § z
0 100 200 300 400 500 600 Tune that the moon is out (minutes)
The relationship between the number of passes in the first
hour after snnset and (a) wind strength, R2 = 0.3836 (9.0981 + 7.4793 .. x), and (b) the time that the moon is visible, R2 = 0.3049
(2.1824 + 0.042233 .. x).
The relationships between bat activity and the environmental variables that
were significant in the multivariate models are shown in Figures 3 and 4.
These environmental factors do not significantly explain variation in bat
activity by themselves. However they do show that the first pass was
recorded later as temperature increased and that there was much variation
in sky cover and how it may affect the time of the first pass. In addition, the

46
number of passes recorded in the first hour also increased as wind strength
increased and the moon intensity and duration increased.
The five nights that the most passes per hour of darkness were recorded
provide no real pattern except that there was very little rain, usually some
sky cover and little or no wind. Moonlight was variable with one night
near the minimum, another at the maximum, and the other three nights at
intermediate levels.
The least passes recorded per hour of darkness occurred during nights when
there was usually some rain and temperature was not especially low. Wind
strength, sky cover and moon light were not especially high.
The nine earliest recorded passes relative to time of sunset all occurred on
nights when moonlight intensity was lower than 15% of maximum.
On the nights when the first recorded pass occurred the latest, temperatures
and moonlight intensity were higher than the mean. There was usually some sky cover (mean= 38%).
On nights when the most passes in the first hour after sunset were recorded,
maximum temperature, moon light, sky cover, wind strength and rainfall
all showed considerable variation.
The 14 nights when no passes were recorded in the first hour after sunset
were usually wet, however bat activity was observed during rain on other
nights. Only 4 out of 14 nights had no rain, with up to 29 mm of rain falling
over the preceding 24 hours. Moonlight was variable with approximately
37% mean moonlight. Minimum temperature, sky cover and wind
strength were not high.
Insect prey abundance
The Malaise trapping provided samples of terrestrial and aquatic flying
insects from the modified and native habitats in which the bats forage.

Q)
0.. e 10 II)
.s ... Q)
..0 e :s z
Figure 5.
300
250
200
150
100
50
0
3 days ending
The total number of potential insect prey numbers caught in
each three day malaise trap sample.
47
Prey weight and the total number of potential prey insects trapped showed
some correlation with bat activity in the first hour after sunset (Appendix Ill 2c). The combination of these two variables explain 23% of the variation in
the number of passes during the first hour after sunset. However, the
model was significant only at Prob> F = 0.2, and potential prey abundance
did not significantly affect the total number of bat passes and the time of the
first pass. Maximum potential prey abundance occurred between late
November to early December and in mid-February (Figure 5). The
abundance of Diptera (Appendix ill, 2b) follows peaks in the total potential prey, both being greatest during February. Lepidoptera were most abundant
from late November to mid-December, while Coleoptera were most
abundant between mid-December and mid-January (Appendix ill 2b).

J2iurnal activity
Figure 6.
14
12
10 .,
8 Cl ., ., Cll 6 a.
4
2
0 0 2 4 6 8 10 12 14 16 18 20
SUNSET interval
SUNRISE
The mean number of passes in each equal segment of the
night (all months included). Bars= mean± 1 standard error.
48
A bimodal pattern of flight activity is clearly evident when data for every
full night of activity are grouped. The first peak (mean = 10.46 passes per
segment) and the second peak (mean = 5.35 passes per segment) are
separated by a lull in activity. The bimodal pattern was most clear during
December and January. There was considerable variation around this
bimodal pattern when data for individual months are considered (Appendix
ill, 2a).
Discussion
Activity patterns in long-tailed bats are hard to predict. They change
seasonally and appear to be mainly affected by combinations of
environmental conditions. Combinations of variables are probably more
important as no single variable significantly explained variation in the three
measures of bat activity. In contrast, other species of bats may be affected by

49
the extremes of some individual variables like minimum temperature,
heavy rain and wind (Stebbings 1968; O'Farrell & Bradley 1970; Erkert 1982),
although extreme conditions have not prevented bat activity in heavily
pregnant and lactating Myotis Iucifugus Kaup that were observed foraging
through severe thunderstorms (Stebbings 1968). Long-tailed bat activity was
both recorded and observed during periods of heavy rainfall at Balls
Clearing. It appears that rain may prevent foraging during the first hour of
activity on some nights but could not really be tested because of the bias
discussed above. Under normal circumstances a night that is favourable for
bat foraging probably requires several variables to be favourable.
Time of first pass
The significant effect that month had on the time of the first pass is probably
due to the related sunset time and twilight length (Figure 2b) that have set
patterns through time. The timing of flight is correlated with sunset in
several insectivorous bats (Erkert 1978).
The maximum night-time temperature in this study was generally at dusk (when the maximum and minimum thermometer was reset), and
temperature rarely increased above this level during the night. Minimum
temperature data was excluded from this multiple regression because it
usually occurred in early morning and thus was considered irrelevant to bat
activity at dusk. The delaying of the first pass with increased temperature is
not consistent with other studies (Laufens 1973; O'Shea & Vaughan 1977;
Funakoshi & Uchida 1978), as prey abundance also generally increases with
temperature (Wellington 1945).
Sky cover could contribute to the time of first pass in two ways. Firstly by
reducing heat loss from the earth's surface so that the beginning of the night
is warmer. Secondly, increased sky cover also reduces light intensity during
twilight which is an important factor in the timing of emergence in other
species (Laufens 1972; Gould 1961; Voute et al. 1974; Erkert 1978). The
earliest C. tuberculatus passes were on nights with little moonlight and the
latest recorded first passes were on nights with above average moonlight.
The mean time of the first pass was latest during December (Figure 2) but due to the scatter, was not apparently different to adjacent months and
would not explain the large drop in activity for December (Figure lb and lc).
50
Activity in the first hour after sunset
There were far more passes recorded during the first hour after sunset in
September than there were in other months. Apart from the possible effects
that the breeding season has on this activity (Chapter 3), date may have been
an important variable because of its relationship with sunset, moon phase
and twilight length that follow set patterns through time.
Bat activity in the first hour after sunset increased as moonlight intensity
and duration increased. Moonlight generally reduces activity in
insectivorous species (Erkert 1974) and this is thought to be a response to reduce predation by nocturnal avian predators (Erkert 1982, 1969; Morrison
1978). Kunz (1982) and Morrison (1978) report that when the moon is full, activity is often concentrated in the first and last part of the night, hence a
bimodal pattern is accentuated. It appears that long-tailed bats may restrict
their foraging periods to times when other variables are most favourable.
Total activity through the night
The results from the stepwise regression analysis show that it is difficult to
predict the environmental factors that affect the variation in the total
number of passes recorded in a night. Temperature, which is an important
factor to some species, did not significantly explain variation in bat activity at Balls Clearing. Taylor & Savva (1990) found that C. morio are more active
during winter than other Tasmanian bats suggesting that temperature is less
important in this species, while temperature does not seem to affect activity
in some studies of Eptesicus nilssonii Rafinesque (Rydell 1993) and Myotis lucifugus (Fenton 1970). The reduction in long-tailed bat activity during
December is similar to a large reduction in capture rates of C. morio recorded in Tasmania during January (Taylor & Savva 1990). High rainfall
was the suggested cause in Tasmania, but rainfall was not especially high
during this time at Balls Clearing.
The mean total activity (Figure la) follows the pattern of mean total passes
per hour of darkness (Figure 1b). This suggests that the total number of
passes is relatively independent of hours of darkness. Essential activity
periods for C. tuberculatus may be completed regardless of length of night.
Total bat activity is more likely to be governed by the need to gain essential
energy, and limited by stomach size (Diamond et al. 1986; Flemming 1988)
51
and extreme environmental conditions. I suggest that the number of passes
in the first hour after sunset is the most accurate measure of bat activity
relative to the environment and a more efficient way to gain a seasonal
index of activity.
Effects of Breeding
The highest number of passes per hour of darkness (mid-November) is
coincident with the peak in mean female weight so C. tuberculatus were
most active during pregnancy. The bats were less active during lactation with the mean number of passes per hour and the number of passes in the
first hour after sunset decreasing in December. The reduction in activity
during lactation in long-tailed bats could be a reflection of (1) the time
female bats · require to suckle young, or (2) a result of increased prey
availability during this period (Figure 5) allowing more profitable foraging.
Regardless of prey abundance, reproduction probably places certain
limitations on activity (Aldridge & Brigham 1988; Morrison 1978).
Seasonal prey abundance vs bat activity
Seasonal prey abundance does not significantly explain variation in bat
activity. However there was more activity during periods of low insect
abundance. The first peak in insect abundance (late November to early
December) occurred at approximately the same time as the reduction in bat
activity, while the second occurred in February. The seasonal lull in prey
abundance corresponds with the peak in bat activity in November, while
the second low was during January.
There is evidence that closely related species C. picatus and C. gouldii
(Richards 1979) and other insectivorous species (Racey & Swift 1985; Rydell 1989) will not forage in unproductive areas. It appears that long-tailed bats
may increase activity in response to low insect numbers rather than migrate
to other foraging areas.

52
!]se of night
In long-tailed bats, the considerable variation around a bimodal activity
pattern in different months indicates a seasonal change in how bats used the
night. Just what seasonal factors contribute to this variation is unclear.
Studying the seasonal changes in how bats use the night is difficult because
comparisons are needed between nights of different lengths. For this reason
each night of activity was divided into 20 equal segments from sunset to
sunrise. As night length changes, then so do the length of ·the segments.
This method was used to describe the diurnal abundance of insects
(Williams 1935).
The main activity peak is at the beginning of the activity phase and the
second activity peak is usually towards the end, for almost all insectivorous
bats studied in the field (Erkert 1982). This was interpreted as a response to
the time of maximum food availability (Erkert 1982; Swift 1980; Funakoshi & Uchida 1978) and the overall pattern observed in this study is consistent
with this.
The initial maximum activity peak in Figure 6 was largely a reflection of the
activity during the first hour of the night during September. The second
was probably due to an increase in activity recorded at the end of the night
during November. The first three months (September, October and November) had more activity than the later three months. This is also shown in Figure 1. The only individual months that showed bimodal
activity patterns were November, December and January, however these
were not particularly pronounced.
Insectivorous bat species are more unlikely to exhibit a clear-cut bimodal
activity pattern when prey density is low (Erkert 1982). Individual variation
from a bimodal pattern was demonstrated in Noctilionid bats (Fenton et al.
1993), while variation in bimodal patterns according to sex, age and
reproduction were reported in other insectivorous bats (Herreid & Davis 1966; Fenton 1970; Swift 1980; Anthony et al. 1981). Herreid & Davis (1966)
found that Myotis californicus Kaup and Pipistrellus hesperus Kaup show
a bimodal pattern only if temperatures are above tsoc. Insect prey sampling
offered no clues to the variation in bimodal patterns for long-tailed bats.
This was also reported in seven Tasmanian bats, including C. morio where
bat activity was not significantly correlated with insect activity (Taylor &
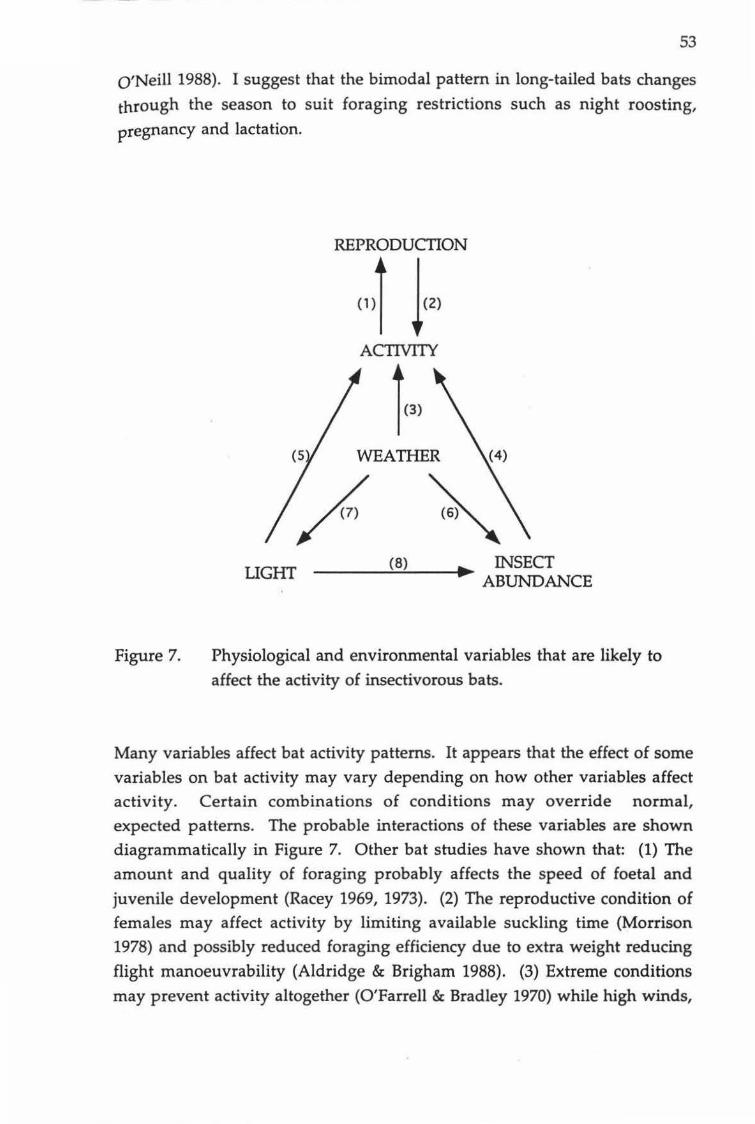
53
O'Neill 1988). I suggest that the bimodal pattern in long-tailed bats changes
through the season to suit foraging restrictions such as night roosting,
pregnancy and lactation.
Figure 7.
REPRODUCTION
(l)i 1(2)
ACTIVITY
l3) WEATHER
LIGHT (8) INSECT
• ABUNDANCE
Physiological and environmental variables that are likely to
affect the activity of insectivorous bats.
Many variables affect bat activity patterns. It appears that the effect of some variables on bat activity may vary depending on how other variables affect activity. Certain combinations of conditions may override normal, expected patterns. The probable interactions of these variables are shown diagrammatically in Figure 7. Other bat studies have shown that: (1) The
amount and quality of foraging probably affects the speed of foetal and juvenile development (Racey 1969, 1973). (2) The reproductive condition of females may affect activity by limiting available suckling time (Morrison 1978) and possibly reduced foraging efficiency due to extra weight reducing flight manoeuvrability (Aldridge & Brigham 1988). (3) Extreme conditions
may prevent activity altogether (O'Farrell & Bradley 1970) while high winds,

54
cool temperatures and rain probably adversely affect activity to varying degrees (Stebbings 1968; Erkert 1982). (4) The abundance of potential insect
prey is likely to influence the foraging efficiency of bats (Rydell 1989). (5) Light intensity governs emergence time. It also directly influences bat activity by increasing predation pressure (Morrison 1978) and (8) indirectly
by affecting the abundance of insects (Anthony et al. 1981; Fenton et al. 1977). (6) Weather is known to affect prey abundance (Wellington 1945) and this will also change light intensity (7) through cloud cover, mist, fog and rain.
The interactions between the physiological and environmental variables discussed above suggest that explaining microchiropteran patterns of activity is extremely complex. The continued collection of accurate environmental data with recorded bat echolocation will help explain these
interactions.

55
References
Aldridge, H. D. J. N., & Brigham, R. M. (1988). Load carrying capacity
and manoeuvrability in an insectivorous bat: a test of the 5% "rule" of
radio telemetry. Journal of Mammalogy. 69, 379-382.
Anthony, E. L. P., Stack, M. H., & Kunz, T. H . (1981). Night roosting
and the nocturnal time budget of the little brown bat Myotis lucifugus. Effects of reproductive status, prey density and
environmental conditions. Oecologia. 51, 151-156.
Barclay, R. M. R. (1985). Long versus short range foraging
strategies of hoary (Lasiurus cinereus) and silver-haired
(Lasionycteris noctivagans) bats and the consequences for prey
selection. Canadian Journal of Zoology. 63, 2507-2515.
Colenso, W. (1890). Transactions and Proceedings of the new Zealand Institute. 23, 477-491.
Daniel, M. J., & Williams, G. R. (1983). Observations of a cave colony
of the long-tailed bat (Chalinolobus tuberculatus) in North Island
New Zealand. Mammalia. 47(1), 71-80.
Daniel, M. J., & Williams, G. R. (1984). A survey of the distribution,
seasonal activity and roost sites of New Zealand bats. New Zealand Journal of Ecology. 7, 9 -25.
Diamond, J. M., Karasov, W. H., Phan, D., & Carpenter, F. L. (1986).
Digestive physiology is a determinant of foraging bout frequency in
hummingbirds. Nature. 320, 62-63.
Dixon, J. M., & Huxley, L. (1989). Observations on a maternity colony
of Gould's bat Chalinolobus gouldii (Chiroptera: Vespertilionidae).
Mammalia. 53(3), 395-414.
Dwyer, P. D. (1962). Studies on the two New Zealand bats.
Zoological Publications from Victoria University Wellington. 28, 1-28.
Erkert, H. G. (1969). Der Bedeutung des Lichtsinnes fur Aktivitat
und Raumorientierung der Schletiere (Tyto alba guttata Brehm).
Citation: Erkert 1982. Z. Vergl. Physiol. 64, 37 - 70.
Erkert, H. G. (1974). Der Einfluss des mondlichtes auf de
Aktivitatsperiodik nachtaktiver Saugetiere. Oecologia. 14, 269-
287.
Erkert, H. G. (1978). Sunset related timing of flight activity in
Neotropical bats. Oecologia. 37, 59-67.
Erkert, H. G. (1982). Ecological aspects of bat activity rhythms, In
T.H. Kunz (ed), Ecology of bats. Plenum Press. New York.
Fenton, M. B., Boyle, N. G. H., & Harrison, T. M. (1977). Activity
patterns, habitat use and prey selection by some African
insectivorous bats. Biotropica. 9, 73-85.
Fenton, M. B. (1970). A technique for monitoring bat activity with
results obtained from different environments in Southern Ontario.
Canadian Journal of Zoology. 48, 847-851.
Fenton, M. B., Audet, D., Dunning, D. C., Long, J., Merriman, C.
B., Pearl, D., Syme, D. M., Adkins, B., Pedersen, S., & Wohlgenant, T.
(1993). Activity patterns and roost selection by Noctilio albicentris (Chiroptera: Noctilionidae) in Costa Rica. Journal of Mammalogy. 74(3), 607-613.
Flemming, T. H. (1988). The short-tailed fruit bat a study in plant
animal interactions. University of Chicago press. Chicago.
56
Funakoshi, K., & Uchida, T. A. (1978). Studies on the physiological
and ecological adaptation of temperate insectivorous bats III. Annual
activity of the Japanese house dwelling bats Pipistrellus abramus. Journal of the Faculty of Agriculture, Kyushu University. 23, 95-115.
Gould, P. J. (1961). Emergence time of Tadarida in relation to light
intensity. Journal of Mammalogy. 42, 405-407.
Herreid, C. F., & Davis, R. B. (1966). Flight patterns of bats.
Journal of Mammalogy. 47, 78-86.
Kunz, T. H. {1974). Feeding ecology of a temperate insectivorous bat (Myotis velifer). Ecology. 55(4), 693-711.
Kunz, T. H. (1982). Roosting Ecology. InT. H. Kunz (ed.), Ecology
of Bats. Plenum Press. New York.
57
Laufens, G. (1972). Freilanduntersuchungen zur aktivitatsperiodik dunkelaktiver Sauger. Unpublished dissertation, University of Koln, Koln.
Laufens, G. (1973). Einfluss der Aussentemeraturen auf die aktivitatsperiodik der fransen und bechsteinfledermause (Myotis nattereri and Myotis bechsteini). Period Bioi. 75, 145 - 152.
Citation: Erkert, H. G. (1982). Ecological aspects of bat activity rhythms,
In T.H. Kunz (ed), Ecology of Bats. Plenum Press. New York.
Morrison, D. W. (1978). Lunar phobia in a nee-tropical bat
Artibus jamaicensis (Chiroptera: Phyllostomidae). Animal Behaviour. 26, 852-855.
O'Farrell, M. J., & Bradley, W. G. (1970). Activity patterns of bats
over a desert spring. Journal of Mammalogy. 51, 18-26.
O'Shea, T. J., & Vaughan, T. A. (1977). Nocturnal and seasonal activities of the pallid bat, Antrozous pallidus. Journal of Mammalogy. 58(3), 269-284.
Racey, P. A. (1969). Diagnosis of pregnancy and experimental extension of gestation in the pipistrelle bat, Pipistrellus pipistrellus. Journal of Reproduction and Fertility. 19, 465-474.
Racey, P. A. (1973). Environmental factors affecting the length of gestation in heterothermic bats. Journal of Reproduction and Fertility. 19, 175-189.

Racey, P. A., & Swift, S.M. (1985). Feeding ecology of Pipistrellus
pipistrellus (Chiroptera: Vespertilonidae) during pregnancy and
lactation. I. Foraging behaviour. Journal of Animal Ecology. 54,
205-215.
Richards, G. (1979). New information on the little pied bat
Chalinolobus picatus. Australian bat research news. 14, 7-8.
Roach, R. W., & Turbott, E. G. (1953). Notes on a long-tailed bat
(Chalinolobus morio). New Zealand Science Review. 11, 161.
Rydell, J. (1989). Feeding activity of the Northern bat Eptesicus
nilssoni during pregnancy and lactation. Oecologia. 80, 562-565.
Rydell, J. (1993). Variation in foraging activity of an aerial
insectivorous bat during reproduction. Journal of Mammalogy. 74(2), 503-509.
SAS, I. (1985). SAS Users Guide: Statistics 1995 edition. Cary, North
Carolina.
58
Stebbings, R. E. (1968). Measurements, composition and behaviour of
a large colony of the bat Pipistrellus pipistrellus. Journal of Zoology. 156, 14-33.
Swift, S. M. (1980). Activity pattern of pipistrelle bats (Pipistrellus pipistrellus) in north-eastern Scotland. Journal of Zoology. 190, 285-
295.
Taylor, R. J., & O'Neill, M.G. (1988). Summer activity patterns of
insectivorous bats and their prey in Tasmania. Australian Wildlife Research. 15, 533-539.
Taylor, R. J., & Savva, N. M. (1990). Annual activity and weight
cycles of bats in South-Eastern Tasmania. Australian Wildlife Research. 17, 181-188.

Voute, A . M.]., Sluiter, J. W., & Grim, M.P. (1974). The influence of
the natural light-dark cycle on the activity rhythm on pond bats (Myotis dasycneme, Bore 1825) during summer. Oecologia. 17, 221-
243.
Wellington, W. C. (1945). Conditions governing the distribution of insects in the free atmosphere. Canadian Entomology. 77, 7-14 21-28 44-49.
Williams, C. D. (1935). The times of activity of certain nocturnal insects, chiefly Lepidoptera, as indicated by a light trap. Trans. Royal Ent. Soc. London. 83, 523-555.
59

Chapter 5

The diet of long-tailed bats, Chalinolobus tuberculatus Gray
(Vespertilionidae) roosting in a limestone cave, Piopio.
Abstract
60
Insect taxa were identified from long-tailed bat guano collected from a
limestone cave roost near Piopio, King Country, . over one year. Of
identified fragments Diptera made up the largest proportion of the diet with
29.11%, Coleoptera made up 25.04%, while Lepidoptera fragments accounted
for 17.46%. One fragment was identified as Ephemeroptera, one as
Tricoptera and three as Acarina. Of the 1065 fragments mounted on slides
for identification, 276 (25.9%) could not be identified. Quantitative data
could not be used as an indication of seasonal changes in prey taken because
of bias resulting from some types of insects being more easily identified than
others. Estimates of the size of ingested prey items were smaller than the
available prey insects. Larger insects may be culled of identifiable body parts
before ingestion. There was no evidence of terrestrial insects in the faeces as
reported for Australian Chalinolobus species.
Keywords: Bats, Chalinolobus tuberculatus, faecal-analysis, prey, diet.
Introduction
Long-tailed bats belong to the worldwide family of insectivorous bats
Vespertilionidae. They are thought to be solely insectivorous like their Australian conspecifics. Like most insectivorous bats (Barclay 1985) long- ·
tailed bats are aerial feeders (Dwyer 1962; Daniel1976; Daniel1979; Daniel &
Williams 1983). There is no published evidence that C. tuberculatus glean
or forage terrestrially or that they feed on nectar, pollen or fruit as reported
for short-tailed bats (McCartney 1994; Arkins, pers. comrn.l ).
Previous reports give a general indication of the orders of insects most
frequently taken by long-tailed bats. Large numbers of small Lepidoptera
1 Alina Arkins, Department of Biological Sciences, Auckland University.
61
and Diptera were identified from guano samples analysed by B. May, M.J
Meads and M.J. Daniel (Daniel & Williams 1983), and moths, mosquitoes,
and midges are all recorded as food items by bat observers (Dwyer 1962).
Acceptance of small flies (Colenso 1890), meal worms (Tenebrionidae),
praying mantis (Roach & Turbett 1953), and grass grub beetles Costelytra zealandica (Lewis, pers. comm.2) by captive and partially tame long-tailed
bats has been reported. Liver fragments and milk were also accepted by a
captive long-tailed bat (Roach & Turbett 1953).
This paper reports on the abundance and size of prey fragments identified
from C. tuberculatus faeces collected at Grand Canyon Cave, Piopio and
compare the diet of resident long-tailed bats with those of closely related
Australian species.
Study area
Grand Canyon Cave is situated on Puketiti Station, Piopio (NZMS R17
737030). The cave is essentially a 30m high, 370 m long, natural limestone
tunnel approximately 370m long. The northern end opens onto pasture
through a small stand of scattered mature kahikatea (Dacrycarpus dacrydioides) while the south end opens into a ravine formed by collapse of
the cave roof. The latter contains native subcanopy species. The cave floor
is flat and generally dry hard substrate with some areas of mud bog at the
southern end.
Methods
Fresh faecal pellets were collected from recent concentrations of guano on
the floor of Grand Canyon Cave, Piopio, during eight visits to the cave
between June 1993 and August 1994. Five individual pellets were randomly
selected from each sample, and stored in vials containing water and dish
washing detergent for up to 11 months until they had broken up into their
components.
2 c/o David Lewis, RD 4, Puketitiri, Hawkes Bay.
62
Each of the eight samples was spread over a large petrie dish with a grid
marked on the bottom. Potentially identifiable insect fragments were
located systematically using a dissecting microscope. All fragments that
appeared distinct enough or large enough to be identified were transferred
to a vial of 70% ethanol. Such fragments commonly included large pieces of
exoskeleton, heavy sclerotin such as joints and claws, parts of eyes, tarsi,
antenna, pieces of wing, parts of legs, eggs and halteres. These were
subsequently mounted on cavity slides with DPX for identification with
dissecting and compound microscopes. They were then compared with insects in a large insect reference collection as well as with insects sampled
from the site using a light trap. Identification usually entailed matching
specific pieces, systematically eliminating likely taxa. This process often
resulted in fragments (such as fly wings) being identified to a small group of
families or to a single superfamily. Some fragments were only identified to
order, while others were identified to genus level. Proportions of pieces
assigned to different orders and those unidentified were expressed as a percentage frequency of those mounted for identification (Kunz 1974;
Belwood & Fenton 1976; Anthony & Kunz 1977; MeAney et al. 1991).
Fragments were measured using a calibrated eyepiece in a dissecting microscope. Leg fragment diameter was recorded from all fragments that
appeared to originate from different insects. All complete tarsi and haltere length, eggs width and length, and micro insect body length, wing length
and legs were measured.
Results
The separated contents of long-tailed bat guano comprises a soup of tiny
exoskeleton fragments and moth scales together with less frequent larger
pieces of exoskeleton, insect eggs, eyes and wing fragments. Most fragments
were flat and non-descriptive, or sections of insect appendages that were too
small to identify.

Figure 1.
0.47% ~---~~~ Other
Proportions of insect fragments identified to different orders.
Other = Ephemeroptera, Tricoptera and Acarina.
63
In all, 1065 insect fragments were mounted on slides and 789 were
identifiable, representing an average of 27 identifiable insect fragments per
faecal pellet. Diptera, Lepidoptera and Coleoptera comprised 784 of the 789
identifiable fragments. Dipteran fragments made up the largest proportion (29.11%). These were mainly eggs, halteres, wing fragments, tarsi, feet and
legs. Beetles (25.04%) were identified by the heavy scleritization and colour
of tarsi, claws, antenna! segments, whole legs and elytra. Lepidopteran
fragments (17.46%) were generally identified by the presence of scales still
attached to body parts or the pattern left on the soft body parts where scales
were removed during digestion. The fragments were usually thin-walled
and often transparent. Tarsi, claws and antenna! segments were also used to
identify moths. One fragment was identified as Ephemeroptera, one as
Tricoptera and three as Acarina. The mayfly and caddisfly were identified
from antennae. 276 fragments (25.9%) remained unidentified, and of the
successfully identified fragments, 63.84% were identified to order, 33.84% to
family, 0.68% to a superfamily (or a small group of families) and 1.64% to
genus level of classification.

64
Table 1. Fragments identified to family or better, with sample occurrences. • M t rk 1 t = OS 1 ety ax a.
Fragment Taxon Notes Sample occurrence
Black eggs Tipulidae abundant 1,2,3,4,5,6,8
Halteres Tipulidae 1,2,3,4,6,8
Wing Pieces Tipulidae 7 pieces, 1 whole 1
Mycetophilidae 5 nearly whole 1,8
Muscoidea 1 piece 4
Culicidae 2/3ofwing 7
Psychodidae whole wing + pieces 7,8
Head capsule M ycetophilidae whole 7
Whole insect Psychodidae 1 2
Acarina 1 1
Cuticle Calliphoridae• probably abdomen 4
Hemiptera• 4
Antennae Tricoptera 1
Coleoptera Staphylinidae or
Tenebrionidae• 1,3,4,7,8
Lepidoptera Noctuidae or
Geometridae• 1,7,8
Ephemeroptera 7
Tarsi and claws Coleoptera whole+ bits 1,3,4,5,7,8
Diptera whole+ bits 1,2,4,8
Lepidoptera whole+ bits 1,2,3,4,5,6,7,8
Leg fragments Coleoptera some Anthricidae• 1,2,3,4,5,6,7,8
Diptera 1,2,3,4,5,6,7,8
Lepidoptera 1,2,3,4,5,6,7,8
Acarina + tarsi and claws 1,2
Elytra Scarabaeidae c. zealandica 3,5
Heavy scleritin Coleoptera brown and black 1,2,3,4,5,6,7,8
Eggs Tipulidae black, some whole 1,2,3,4,5,6,7,8
Lepidoptera white 4,5,7
other 1,2,3,4,6
Eye fragments Diptera• 1,2,3,4,5,6,7
other 7
Tree fern Cyathea• scales and spores 8

65
More dipteran fragments were identifiable to family than for Coleoptera and
Lepidoptera. Beetle antenna! segments (probably from Tenebrionidae or Staphylinidae) occurred in half of the samples, while only one type of fragment was identified to a single lepidopteran family.
Tipulidae fragments occurred in more samples than any other identified
Family, seven out of eight samples contained tipulid halteres and five out of eight contained tipulid eggs (MeAney et al. 1991). These eggs were sometimes whole, but usually tom open. The tipulid wing fragment was probably from a small individual.
The metallic green fragments closely matched calliphorids of the genus
Lucilia and were probably from the thorax or abdomen as they were large, uniform and flat. The undersides were pale black and had several bristle
holes. Calliphorids are crepuscular and have been collected in light traps (Colless & McAlpine 1991) so are potential prey for long-tailed bats, especially in pasture habitats as exist at Grand Canyon Cave. Another
unidentified set of green fragments which was more pale and far less scleritized was found in the same sample. The colour and texture of the pieces (probably abdominal) were most like that of pale green stonefly adults or some soft bodied green Hemiptera but they could not be identified.
The distinct colour and pattern of grass grub beetle (Costelytra zealandica) elytra allowed relatively easy identification. Nearly all fragments of this type could be assigned to the genus, and all were definitely Coleoptera.
It is not known what species the mites belong to, or whether they are parasites of the bats or parasites of the bat prey. Either way it is most likely they were consumed accidentally.
Two wings presumably culled from a larger tipulid were found 78 m into the cave amongst guano collected on 29/1/94. A single wing measured 18 mm, so the estimated wingspan including a 3 mm wide body was 35 mm. A pair of culled Lepidoptera hind wings were also found at the same location. One wing measured 12 mm in length and was identified (Dugdale, pers. comm.3) as Noctuidae (Trifinae), Graphania ustistriga Walker .
3 John Dugdale, Landcare Research, Mt Albert, Auckland.
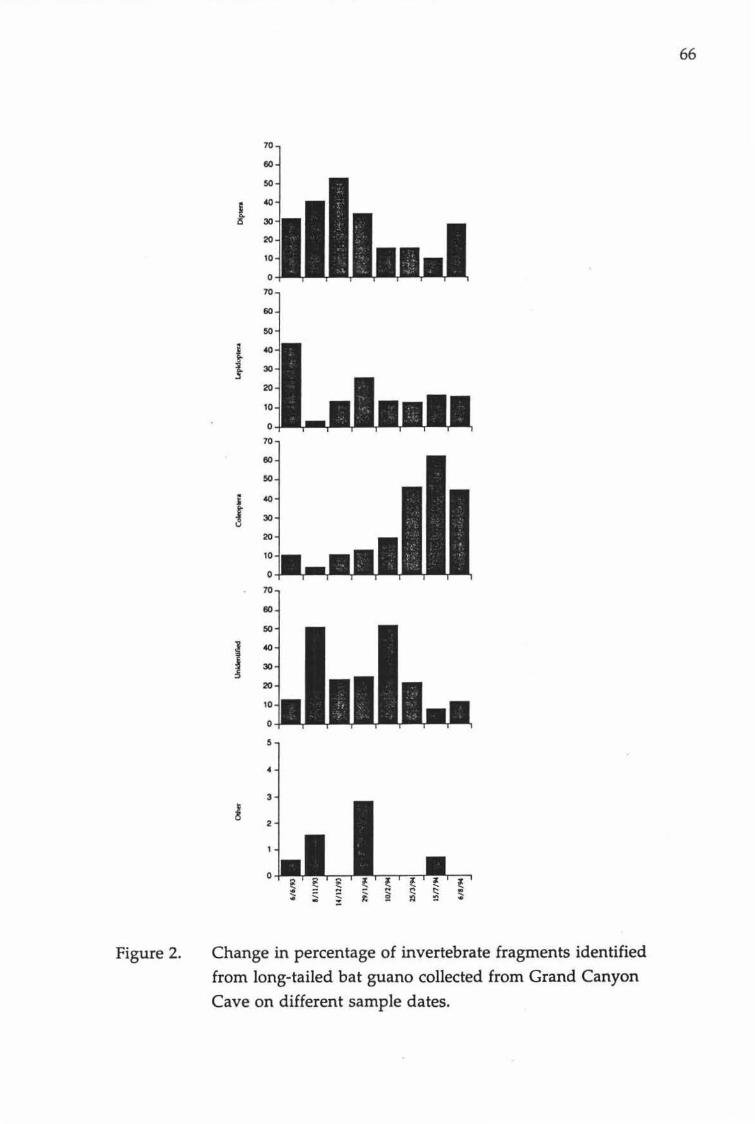
Figure 2.
70
60
50
i 4()
~ 30
20
10
0
70
60
50
i 4()
30
20
10
0
70
60
50
i 4()
! 30
20
10
0
70
60
I 5
4
3
2
0
Change in percentage of invertebrate fragments identified from long-tailed bat guano collected from Grand Canyon
Cave on different sample dates.
66

67
Spores and scales of tree ferns were identified as probably Cyathea species (Large, pers. comm. 4). The percentage frequency of Diptera (Figure 2) was at a maximum (52.98%) in December (summer) and at a minimum (9.93%) in July (winter). Coleoptera show the opposite pattern with larger proportions occurring in winter (62.25 % of the July 1994 sample) and the lowest proportion in November (3.91 %). No clear pattern was evident in the proportion of Lepidoptera in samples. The highest proportion of Lepidoptera occurred in the June 1994 sample (43.56%). The proportion of samples that could not be identified showed no seasonal pattern. Approximately SO% of the November 1993 and February 1994 samples could not be identified. The lowest frequencies of unidentified fragments occurred in June 1993, July 1994 and August 1994.
Table 2. The size of measured fragments (mm) and estimations (•) of body
SlZe b d £ ase on re erence specrmens.
Fragment Range(mm) •Insect •Probable •Probable Body
wingspan length
Leg width
(Fly) 0.05-0.40 Culicidae < 9.6 <6.2
Chironomidae <11 <6
Mycetophilidae < 5.4 < 2.6
Tipulidae 16-47 4.5-14
Leg width
(Beetle) 0.11-0.50 Grass grub < 14
Huhu <40
Leg width
(Moth) 0.10- 0.45 Noctuidae < 35 < 14
Leg width
(Other ) Tricoptera <23 < 12.5
Ephemeroptera < 24 <8
Tipulidae eggs 0.40-0.93
White eggs 0.23-0.43
4 Mark Large, Department of Plant Biology, Massey University.

68
The width of insect legs was the only measure where a reasonable number of data could be collected. They are not large samples but rather are selected
specimens with which to compare fragment size.
Discussion
Faecal content
Long-tailed bats (Chalinolobus tuberculatus) at Grand Canyon Cave feed mainly on flies, moths and beetles, while other orders are taken in small numbers. The proportions of these orders of insects give an overall indication of which prey taxa are taken, but this cannot be used as a
quantitative measure of diet due to bias resulting from some types of insects being more easily identified than others. Almost all fragments that originated from beetles could be assigned to order, while fewer fly and moth
fragments could confidently be identified. Flies and moths therefore are probably under-represented in these results.
Although beetle fragments were readily identifiable to order, the similarity
of certain fragments (antenna and tarsi) between distantly related families meant assigning fragments to superfamily or even suborder was difficult. While fly fragments overall were difficult to identify, some were easily recognisable to family or superfamily so more detailed and reliable
information could be gathered. The presence of Lepidoptera in the sample was easy to determine from scales, but isolating families and estimating the proportion of Lepidoptera in the sample was difficult.
In two congeneric species of Australian bats (C. gouldii and C. nigrogriseus)
studied by Vestjens & Hall (1977), stomach contents analysis showed Lepidoptera to be the most abundant order present in both species with Diptera clearly the next abundant order in C. gouldii. This is not consistent with the results in this study, although faecal analysis generally
underestimates lepidopteran fragments because of the difficulty with identification. Cockroaches (Blattodea), crickets (Gryllidae), a number of Hemiptera (Cicadidae, Pentatomidae and Notonectidae), and six coleopteran families were also evident in the Australian study. The analysis also
showed the remains of one spider, one praying mantis, an earwig and numerous ants. There was no evidence of terrestrial insects in the faecal

69
samples from Grand Canyon Cave. A tree-fern spore and scale identified in
this study were most likely attached to insect prey items.
Seasonal
The seasonal variation in percentage frequency in this study (Figure 2) is not
likely to be a reliable indicator of changes in the bat diet thrqugh the year.
There are two obvious reasons to question the quantitative results. There
are large differences in the proportion of flies and moths in samples 1
{6/6/93) and 7 (15/7 /94). If the sample size of five pellets collected per sample was large enough, some similarity would be expected between
samples collected in the same season over different years. Secondly, grass
grub beetles which were a large proportion of identified beetle fragments are predominantly a summer species, yet beetles were poorly represented in
summer samples while the apparent (and clear) peak in coleopteran
fragments occurred in winter.
Only limited information could be obtained from the measurements of insect fragments. It is difficult to measure a leg and estimate potential
wingspan or body length because variation in accuracy of a leg width
measurement can mean a huge difference in estimated body length. There
is also vast variation in size of insects in the same family and even
subfamily. Table 2 gives some indication of the thickness of insect legs and
their corresponding wingspan and body size. Those appendages that
remained whole during digestion were usually from Psychodidae or
Acarina. There is some question as to whether they are targeted prey
species, because only the exoskeleton remained. They had probably been
digested so it is unlikely that they were collected incidentally during
sampling. It is most likely that bats consumed them while grooming or in
pursuit of other prey. From comparing digested fragments with
measurements taken from insects in the reference collection, there is no evidence that long-tailed bats eat insects in the size range of huhu beetles
(Prionoplus reticularis). The largest leg width measured in the samples was
more than three times smaller than the huhu beetle measured. Likewise,
there was no evidence that the bats eat large hepialid moths. Even the
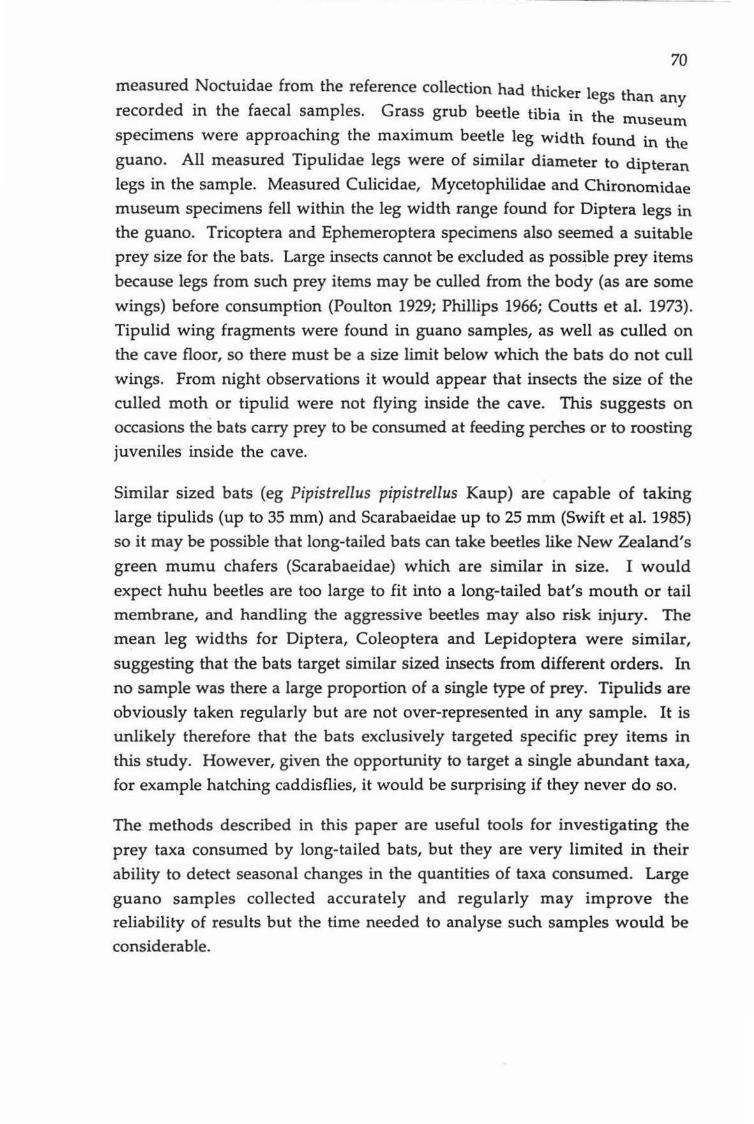
70
measured Noctuidae from the reference collection had thicker 1 th egs an any recorded in the faecal samples. Grass grub beetle tibia in the museum specimens were approaching the maximum beetle leg width found in the
guano. All measured Tipulidae legs were of similar diameter to dipteran legs in the sample. Measured Culicidae, Mycetophilidae and Chironomidae
museum specimens fell within the leg width range found for Diptera legs in
the guano. Tricoptera and Ephemeroptera specimens also seemed a suitable
prey size for the bats. Large insects cannot be excluded as poss~ble prey items
because legs from such prey items may be culled from the body (as are some
wings) before consumption (Poulton 1929; Phillips 1966; Coutts et al. 1973).
Tipulid wing fragments were found in guano samples, as well as culled on
the cave floor, so there must be a size limit below which the bats do not cull
wings. From night observations it would appear that insects the size of the culled moth or tipulid were not flying inside the cave. This suggests on
occasions the bats carry prey to be consumed at feeding perches or to roosting
juveniles inside the cave.
Similar sized bats (eg Pipistrellus pipistrellus Kaup) are capable of taking
large tipulids (up to 35 mm) and Scarabaeidae up to 25 mm (Swift et al. 1985)
so it may be possible that long-tailed bats can take beetles like New Zealand's
green mumu chafers (Scarabaeidae) which are similar in size. I would
expect huhu beetles are too large to fit into a long-tailed bat's mouth or tail membrane, and handling the aggressive beetles may also risk injury. The
mean leg widths for Diptera, Coleoptera and Lepidoptera were similar,
suggesting that the bats target similar sized insects from different orders. In no sample was there a large proportion of a single type of prey. Tipulids are
obviously taken regularly but are not over-represented in any sample. It is
unlikely therefore that the bats exclusively targeted specific prey items in
this study. However, given the opportunity to target a single abundant taxa,
for example hatching caddisflies, it would be surprising if they never do so.
The methods described in this paper are useful tools for investigating the
prey taxa consumed by long-tailed bats, but they are very limited in their
ability to detect seasonal changes in the quantities of taxa consumed. Large
guano samples collected accurately and regularly may improve the reliability of results but the time needed to analyse such samples would be
considerable.
References
Anthony, E., L P, & Kunz, T. H. (1977). Feeding strategies of the little brown bat, Myotis lucifgus in Southern New Hampshire. Ecology. 58, 775-786.
Barclay, R. M. R. (1985). Long versus short range foraging
strategies of hoary (Lasiurus cinereus) and silver-haired (Lasionycteris noctivagans) bats and the consequences for prey selection. Canadian Journal of Zoology. 63, 2507-2515.
Belwood, J. J., & Fenton, M. B. (1976). Variation in the diet of Myotis lucifugus (Chiroptera: Vespertilionidae). Canadian Journal of Zoology. 54, 1674- 1678.
Colenso, W. (1890). Bush notes. Transactions and Proceedings of the New Zealand Institute. 23 (477-491).
Colless, D. H, & McAlpine, D. K. (1991). Diptera. C.S.I.R.O,
Division of Entomology, Australia (ed.), The Insects of Australia. Melbourne University Press, Melbourne.
71
Coutts, C. N., Fenton, M. B., & Glen, E. (1973). Food intake by captive Myotis lucifugus and Eptesicus fuscus (Chiroptera: Vespertilionidae). Journal of Mammalogy. 54, 985-990.
Daniel, M. J. (1976). Feeding by the short-tailed bat (Mystacina tuberculata) on fruit and possibly nectar. New Zealand Journal of Zoology. 3, 391-370.
Daniel, M. J. (1979). The New Zealand short-tailed bat, Mystacina
tuberculata: review of present knowledge. New Zealand Journal of Zoology. 6, 357-370.
Daniel, M. J., & Williams, G. R. (1983). Observations of a cave colony of the long-tailed bat (Chalinolobus tuberculatus) in North Island
New Zealand. Mammalia. 47(1), 71-80.
Dwyer, P. D. (1962). Studies on the two New Zealand bats.
Zoological Publications from Victoria University Wellington.
28, 1-28.
Kunz, T. H. (1974). Feeding ecology of a temperate insectivorous bat (Myotis velifer). Ecology. 55(4), 693-711.
MeAney, C., Shiel, C., Sullivan, C., & Fairley, J. (1991). 'fl:le
Analysis of Bat Droppings. An occasional publication of the
Mammal Society, London. 14, 1-48.
McCartney, J. (1994). Feeding activity in a captive population of New Zealand Southern short-tailed bats (Mystacina tuberculata
tuberculata). Honors Thesis, Department of Ecology, Massey University, Palmerston North, New Zealand.
Phillips, G. L. (1966). Ecology of the big brown bat (Chiroptera: Vespertilionidae) in North-eastern Kansas. American Midland
Naturalist. 75, 168-198.
Poulton, E. B. (1929). British insectivorous bats and their prey. Proceedings of the Zoological Society of London. 19, 277-302.
Roach, R. W., & Turbott, E. G. (1953). Notes on a long-tailed bat (Chalinolobus morio). New Zealand Science Review. 11, 161.
Swift, S.M., Ravey, P. A., & Avery, M. I. (1985). Feeding ecology of Pipistrellus pipistrellus (Chiroptera: Vespertilionidae) during pregnancy and lactation II. Diet. Journal of Animal Ecology. 54, 217-
225.
Vestjens, W. J. M., & Hall, L. S. (1977). Stomach contents of forty-two
species of bats from the Australasian region. Australian Wildlife
Research. 4 , 25-35.
72

Chapter6
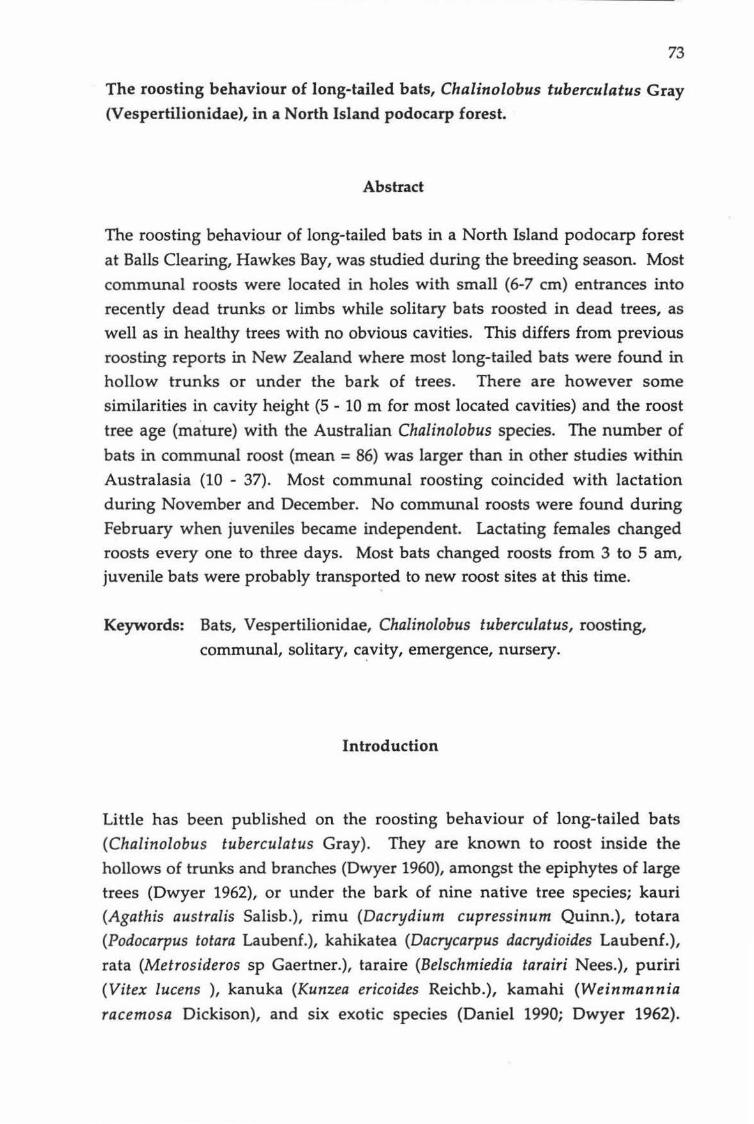
73
The roosting behaviour of long-tailed bats, Chalinolobus tuberculatus Gray
(Vespertilionidae), in a North Island podocarp forest.
Abstract
The roosting behaviour of long-tailed bats in a North Island podocarp forest
at Balls Clearing, Hawkes Bay, was studied during the breeding season. Most
communal roosts were located in holes with small (6-7 em) entrances into
recently dead trunks or limbs while solitary bats roosted in dead trees, as
well as in healthy trees with no obvious cavities. This differs from previous
roosting reports in New Zealand where most long-tailed bats were found in
hollow trunks or under the bark of trees. There are however some
similarities in cavity height (5- 10m for most located cavities) and the roost
tree age (mature) with the Australian Chalinolobus species. The number of
bats in communal roost (mean= 86) was larger than in other studies within
Australasia (10 - 37). Most communal roosting coincided with lactation
during November and December. No communal roosts were found during
February when juveniles became independent. Lactating females changed
roosts every one to three days. Most bats changed roosts from 3 to 5 am, juvenile bats were probably transported to new roost sites at this time.
Keywords: Bats, Vespertilionidae, Chalinolobus tuberculatus, roosting,
communal, solitary, c~vity, emergence, nursery.
Introduction
Little has been published on the roosting behaviour of long-tailed bats
(Chalinolobus tuberculatus Gray). They are known to roost inside the
hollows of trunks and branches (Dwyer 1960), amongst the epiphytes of large
trees (Dwyer 1962), or under the bark of nine native tree species; kauri
(Agathis australis Salish.), rimu (Dacrydium cupressinum Quinn.), totara
(Podocarpus totara Laubenf.), kahikatea (Dacrycarpus dacrydioides Laubenf.),
rata (Metrosideros sp Gaertner.), taraire (Belschmiedia tarairi Nees.), puriri
(Vitex lucens ), kanuka (Kunzea ericoides Reichb.), kamahi (Weinmannia
racemosa Dickison), and six exotic species (Daniel 1990; Dwyer 1962).

74
Limestone caves (Dwyer 1962; Daniel & Williams 1983; Appendix II),
limestone cliffs (Griffiths, pers. comm.1 ), and man made structures such as
bridges and farm buildings have also been used as roost sites for long-tailed
bats (Dwyer 1960, 1962; Daniel and Williams 1981).
Few colonies of long-tailed bats have been studied in detail and relatively
few large roosts were reported in the last 30 years (Daniel1990). The number
of bats in roosts vary. There are reports of "thousand.s" of bats inside felled
trees last century (Buller 1893, Cheeseman 1894), but the majority of recently
reported roosts range from one 1 to SO bats, with a mean of 10 (Daniel 1990).
Up to 300 bats were counted in Grand Canyon Cave (Daniel & Williams
1983; Appendix II). The only report of a long-tailed bat nursery colony
(Daniel 1981) contained 20 bats and was located in a pine forest during
January 1976 .
Few details are published about emergence behaviour. Daily emergence
time from roosts has been reported as 10 - 30 minutes after sunset (Daniel
1990). The preferred tree species, tree age, tree location, tree size, cavity
location and internal temperature for long-tailed bat roost sites is unknown.
There are several publications on the roosting behaviour of Australian
Chalinolobus species. These have dealt mainly with the breeding of bats in
cave or house roosts (Dixon & Huxley 1989; Simpson 1962; Dwyer 1965;
Richards 1979). Data on roost tree location, roost cavity attributes,
seasonality, roost size, roost tree species, occupants and predation on
Australian Chalinolobus species that roost in trees has been reported by
Lunney et al. (1985), Tidemann & Flavel (1987) and Hall {1970).
It is important to understand the roosting behaviour of New Zealand bats so
habitat with suitable roosting sites can be preserved, potential roost predation can be identified, and if necessary, suitable predator exclusion
techniques developed. A better knowledge of roosting behaviour would
also increase the understanding of the breeding activities of the bats, and aid
in developing indicators of breeding status, recruitment, population size
and population health of bats.
There were two main aims in this study: (1) to investigate the roost trees
1 Richard Griffiths, Entomology and Animal Ecology Department, Lincoln
University.

75
used by long-tailed bats in a North Island podocarp forest, with special
emphasis on the roost location, favoured tree species and the roost cavity;
(2) and to study the roosting behaviour of bats during the breeding season to
gain information on their emergence behaviour, the number of occupants
using roosts and roost site fidelity.
Methods
All data were collected from Balls Clearing Scenic Reserve, Puketitiri,
Hawkes Bay. The reserve is dominated by mature podocarp species with
areas of mature red beech (Nothofagus fusca). A detailed description of the
study site is presented in Chapter 1.
Bats were captured in harp traps and mist nets (see Chapter 2). Short-life
transmitters (up to 20 days) weighing 1.7 g were attached to the backs of 17
adult females, one adult male and one juvenile male between October 1994
and February 1995. Transmitters were attached by first trimming the fur
between the shoulder blades with a small pair of scissors. A contact
adhesive (Ados F2) was spread sparingly onto both the transmitter and the
skin of the bat and allowed to dry for three to five minutes. The transmitter
was then placed on to the bat and allowed a further five minutes to dry before the bat was released.
Radio-tagged bats were tracked to day roosts using directional receivers.
Initial searches for radio-tagged bats were made within the reserve. If these
were unsuccessful, then all likely locations within 5 km of the reserve were
searched. The exact location of every day roost was recorded and the roost
trees were numbered with identification pegs, and marked on an aerial
photograph. The health of roost trees was classed as one of the following: (1) healthy with no visible cavities; (2) live with visible cavities; (3) recently
dead with visible cavities and with branches and branchlets still attached;
and ( 4) decaying with large cavities and with only large limbs remaining. These classes were also assigned to specific branches whenever there was a
dead limb on an otherwise healthy tree. The height, location of the
entrance, and circumference of communal roost trees were recorded. Cavity
descriptions of two accessible communal roosts were made using a penlight
and fibre optic equipment.

76
Roost trees were observed with the unaided eye before dusk and with night
vision equipment after dusk. The location, height and orientation of the
roost cavity was confirmed by observing bats leaving the roost. The number
of bats using the roost, the time of emergence, and whether bats were
entering or leaving the roost were noted using a hand-held counter and a
voice-activated tape recorder.
Results
Two bats with transmitters were not located again after their release while
17 transmitters provided roosting data for periods of up to 17 days (mean=
6.88 days). One transmitter was recovered beneath a roost tree and had been
chewed. The remaining transmitters were either left inside roost cavities
that were not accessible, or could no longer be located within the study area.
Roost location
A total of 43 roosts were investigated in this study. Four were in red beech
forest, while the remaining 39 were in podocarp forest. Of the roosts, 30 (70%) were solitary, the remainder, 13 (30%) contained more than five bats
(Table 2). All roosts that were located in this study were within the mature
native forest at Balls Clearing Reserve (Chapter 1). Roost sites varied from
10 m to 280 m from the bush edge. The greatest and shortest distances
between consecutive, communal roosts were 770 m and 110m respectively (mean: 360 m). There was no clear pattern in the choice of either
individual or communal roost sites, although individual roosts were rarely
closer than 100 m from the previously used roost, and were often on the
opposite side of the reserve. One solitary juvenile male however roosted in
three similar miro trees on three consecutive days. The trees were approximately 20m from each other.
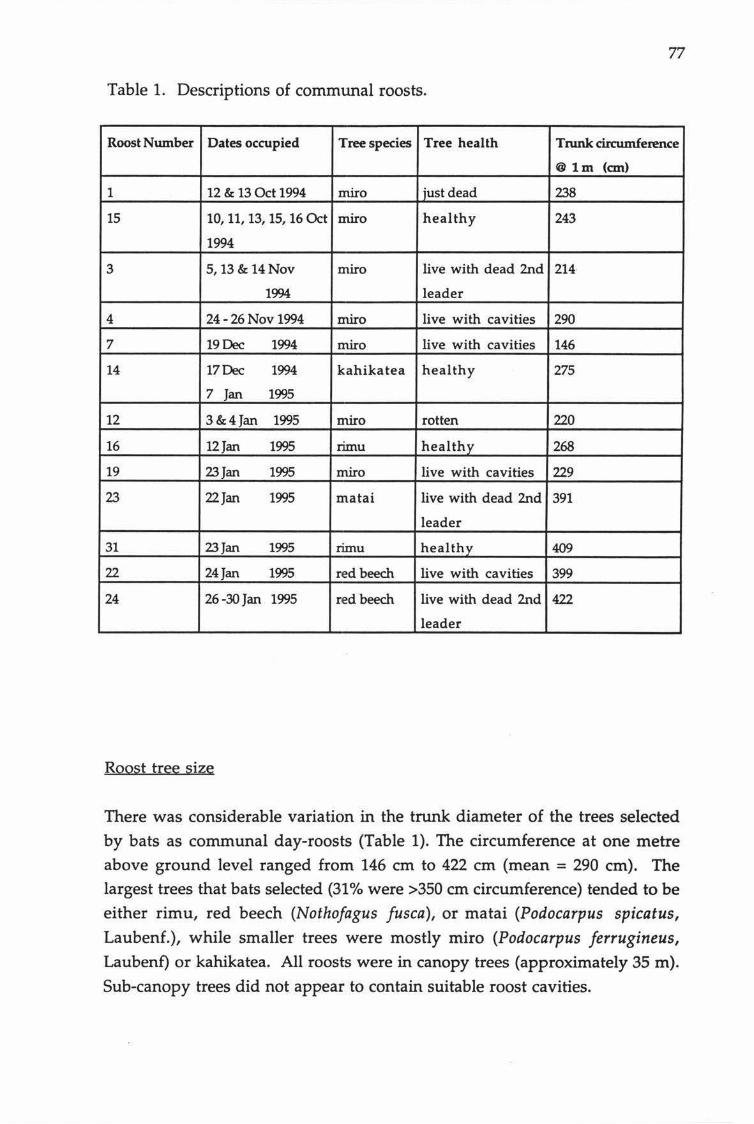
77
Table 1. Descriptions of communal roosts.
Roost Number Dates occupied Tree species Tree health Trunk circumference
@1m (an)
1 12 & 13 Oct 1994 miro just dead 238
15 10, 11, 13, 15, 16 Oct miro healthy 243
1994
3 5,13 & 14Nov miro live with dead 2nd 214
1994 leader
4 24-26 Nov 1994 miro live with cavities 290
7 19Dec 1994 miro live with cavities 146
14 17Dec 1994 kahikatea healthy 275
7 Jan 1995
12 3&4Jan 1995 miro rotten 220
16 12Jan 1995 rimu healthy 268
19 23Jan 1995 miro live with cavities 229
23 22Jan 1995 matai live with dead 2nd 391
leader
31 23Jan 1995 rimu healthy 409
22 24Jan 1995 red beech live with cavities 399
24 26 -30 Jan 1995 red beech live with dead 2nd 422
leader
Roost tree size
There was considerable variation in the trunk diameter of the trees selected
by bats as communal day-roosts (Table 1). The circumference at one metre
above ground level ranged from 146 em to 422 em (mean = 290 em). The largest trees that bats selected (31% were >350 em circumference) tended to be
either rimu, red beech (Nothofagus fusca), or matai (Podocarpus spicatus,
Laubenf.), while smaller trees were mostly miro (Podocarpus ferrugineus, Laubenf) or kahikatea. All roosts were in canopy trees (approximately 35 m).
Sub-canopy trees did not appear to contain suitable roost cavities.
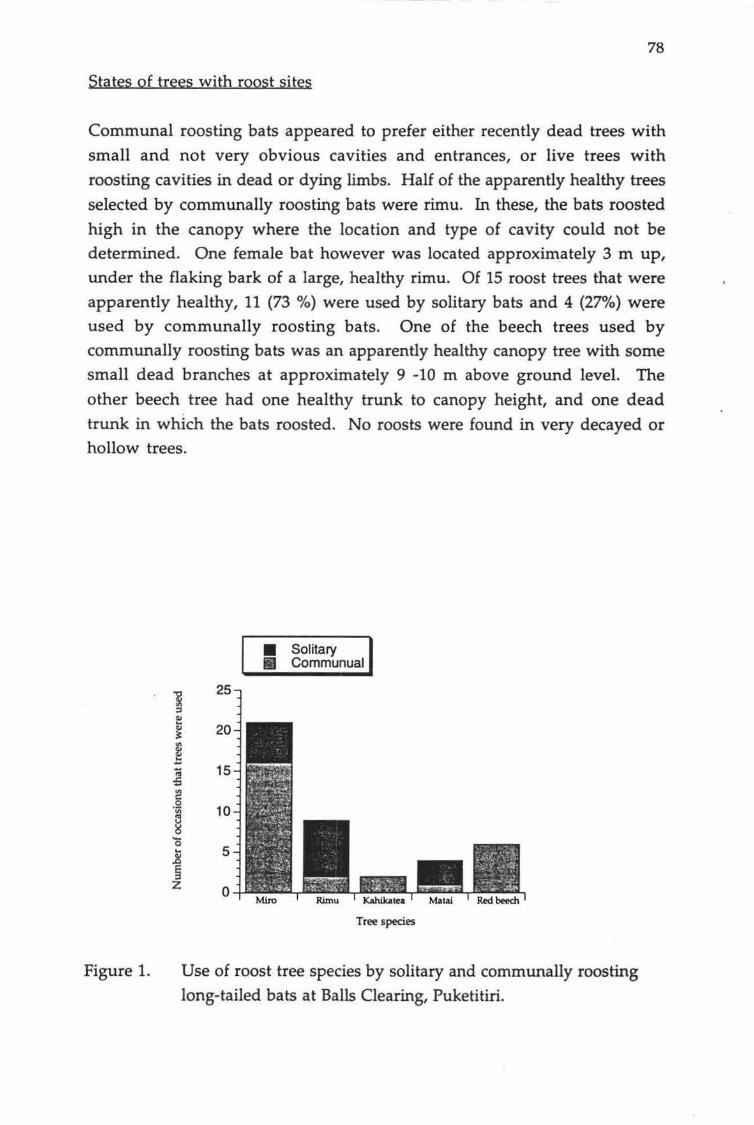
78
States of trees with roost sites
Communal roosting bats appeared to prefer either recently dead trees with
small and not very obvious cavities and entrances, or live trees with roosting cavities in dead or dying limbs. Half of the apparently healthy trees
selected by communally roosting bats were rimu. In these, the bats roosted
high in the canopy where the location and type of cavity could not be determined. One female bat however was located approxi~ately 3 m up, under the flaking bark of a large, healthy rimu. Of 15 roost trees that were
apparently healthy, 11 (73 %) were used by solitary bats and 4 (27%) were used by communally roosting bats. One of the beech trees used by communally roosting bats was an apparently healthy canopy tree with some small dead branches at approximately 9 -10 m above ground level. The
other beech tree had one healthy trunk to canopy height, and one dead trunk in which the bats roosted. No roosts were found in very decayed or hollow trees.
Figure 1.
• Solitary II Communual
] ='
25
cu .. 20 cu
~
~ ;;; -5
15
t! 0 'iii e ~
10
..... 0
5 .. ..8 § z 0
Tree species
Use of roost tree species by solitary and communally roosting long-tailed bats at Balls Clearing, Puketitiri.

79
Table 2. Entrance details of communal roosts at Balls Clearing, Puketitiri.
Roast number Entrance type Entrance height Entrance Number of bats
orientation
1 single small hole Sm east 79+
15 single small hole 9m south 61-208
3 open gash Sm west 137+
4 3 small holes 6m west 68-148+
7 5 holes, some large 5-Sm south & south east 108+
14 not determined 30mapprox not determined 16+
12 single small hole 7m west 31-60+
16 not determined 30mapprox not determined not determined
19 not determined 30mapprox north 31 +
23 not determined 30mapprox not determined 29+
31 not determined 30mapprox not determined not determined
22 single small hole 9m south 11
24 not determined 30mapprox not determined 5-61+
Roost cavities
The entrances to the roost cavities were not located for single bat roosts because the departure of one bat is difficult to observe. In communal roosts
the height of the entrance ranged from 5 m to canopy (35 m) height in trunk
and branch cavities. The overall mean height of communal roosts was 15.9m while the mean height of non-canopy communal roosts (n = 7) was
7.2 m. The entrance was usually singular, small (6 -7 em) and round,
although three roosts had two or three larger entrances or one larger gash
opening.
Two roost cavities that were in trees that were climbed were investigated. One, in a healthy red beech tree (Roost 22), was 9 m up, near the first branch.
The entrance was approximately 6 em in diameter and the cavity was
essentially a tunnel of the same diameter that snaked into the trunk. The
optic probe (approximately 50 em) did not reach the end and no bats were
visible within the cavity. The other roost (Number 7) was a vertical internal
cavity with five openings 5 to 8 m above the ground. There was no clear
pattern in the orientation of the opening of roost cavities selected by the bats
in this study (Table 2).
80
Roost occupants
Large communal roosts were recorded from 13/10/94 to 26/1/95. All radio tagged bats roosted with other bats during the seven week period from early
November (Figure 2a). No communal roosts were found during February. The number of bats counted on 19 occasions when they emerged from 13
different communal roost sites ranged from 5 to 208 (mean = 86), however bats were usually still emerging from these roosts when t_hey could no longer be counted because of low light. Therefore, the numbers of bats counted during emergence are a minimum estimate of the actual number of occupants. The emergence time relative to sunset of the first bat tended to be earlier as the number of bats in the roost increased (Figure 2b).
Communally roosting bats also emerged earlier than solitary roosting bats. Solitary bats emerged between 2 and 40 minutes after sunset (Figure 2b)
whereas the first bats that emerged from communal roosts were as early as 16 minutes before sunset. The emergence of bats from communal tree roosts was sporadic and tended to occur in groups. Occasionally bats were seen crawling as far as 1 m down the tree trunk before flying but most
seemed to fly from the entrance itself. Although only one bat flew from each roost entrance at a time, groups of up to thirty bats tended to leave immediately one after another. These were interspersed with periods of up to five minutes where no bats emerged or when only occasional individual bats emerged. Emerging bats usually continued this behaviour for up to one hour depending on the number of bats in the roost. The number of bats emerging in each group decreased with time, with most bats emerging within 30 minutes after the first bat.
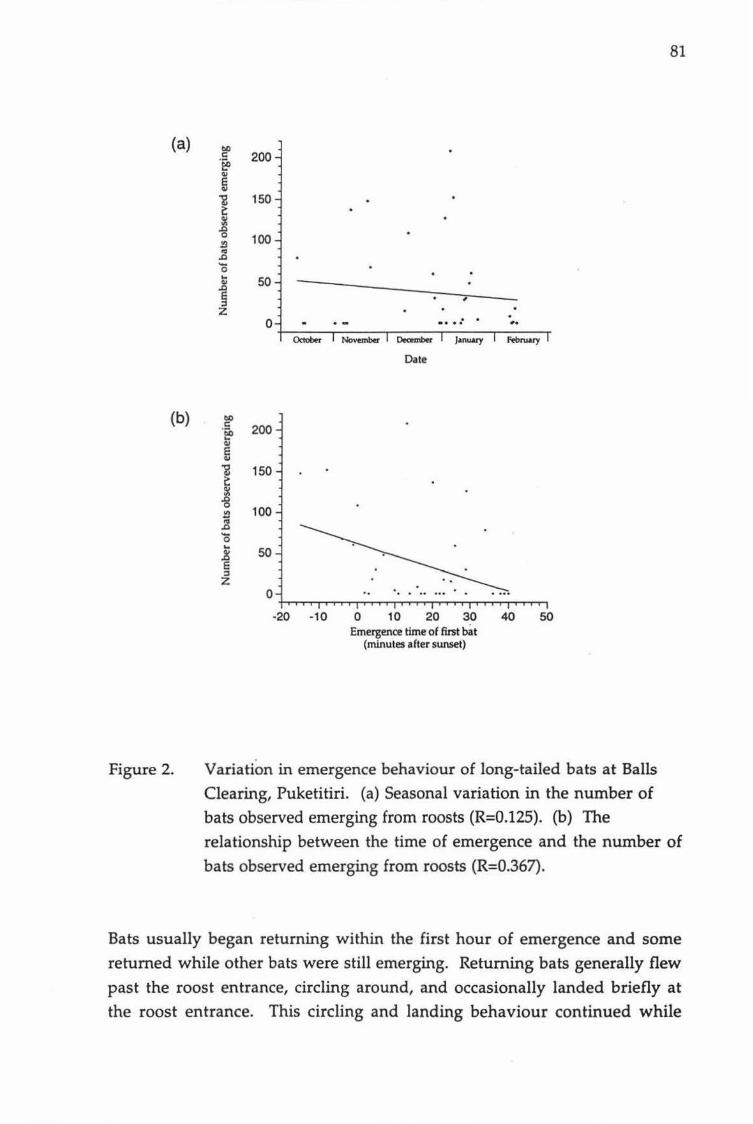
(a)
(b)
Figure 2.
81
bO c;
·~ Ql
200
~ "2 c:
150
5: ~ 0 100 .!1 ., ~
0 ... 50 ..8 e ;l
, z .
0 . .... . <#o
October
Date
bO .s 200 bO ... Ql
~ 1l 150 c: ~
100 "' -; ~ -0 ... ..8 50 e ;l
z 0
·20 ·10 0 10 20 30 40 50 Emergence time of first J>at
(minutes after sunset)
Variation in emergence behaviour of long-tailed bats at Balls Clearing, Puketitiri. (a) Seasonal variation in the number of bats observed emerging from roosts (R=0.125). (b) The relationship between the time of emergence and the number of bats observed emerging from roosts (R=0.367).
Bats usually began returning within the first hour of emergence and some returned while other bats were still emerging. Returning bats generally flew past the roost entrance, circling around, and occasionally landed briefly at the roost entrance. This circling and landing behaviour continued while
82
other bats flew into the roost. The frequency of circling decreased as more
bats entered the roost. The last bat generally returned to the roost
approximately two hours after the first bat emerged. Most bats that returned
to roosts did not emerge again until early morning (usually between 3 and 5
am). However there was a continuous, steady but low rate of emergence
and return activity during the night.
Radio-tagged bats rarely returned to the same day roost for more than two
consecutive days. Of 43 occasions when bats were tracked to day-roosts, 28 of
the roosts were used for only one day, 11 were used for two days, and 4 were
used for three consecutive days. Communal roosts were used by other bats
for up to three days after radio-tagged individuals had moved on suggesting that roosts have a changing occupancy by different bats.
Possible pr~dation by morepork (Ninox novaeseelandiae) was observed on
two occasions (14/11/94 & 13/1/95). On both occasions a single morepork
flew up to the entrance of the roost cavity while bats were emerging. The
bird landed for approximately one second before flying off. It was not
confirmed whether the moreporks had taken any bats.
. Discussion
Long-tailed bats appeared to use two types of roost trees at Balls Clearing.
Recently dead trees or dead limbs on otherwise healthy trees were used by
both solitary and communally roosting bats. The entrances of these roosts
were usually small and at least 5 m up. Healthy trees are used by solitary
bats more than by communally roosting bats. Bats generally roosted in the
canopy of healthy trees. No bats were found in the hollows or cavities of
rotten trees where only the trunks and large limbs remained. The types of
roost tree selected by long-tailed bats at Balls Clearing differs from those
reported in other studies (Daniel 1981; Daniel & Williams 1984) where most bats were found in hollow trees or under bark. The cavity size of native tree
roosts at Balls Clearing is similar to a roost described in Pinus radiata by
Daniel (1981) and for roosts of Chalinolobus morio in Australia (Tidemann
& Flavel 1987). The roosts of long-tailed bats have other similarities with those occupied by Australian Chalinolobus species. Roost sites of the latter
tend to be found in old, large trees (Lunney et al. 1985; Tidemann & Flavel
1987), and the mean height of roost cavities selected by C. morio (10.5 m)

83
was similar to that of communal roosts found at Balls Clearing. The
orientation of the cavity entrance may be important in some Australian
species for heat maintenance {Tidemann & Flavel 1987) but this did not
appear to be the case for the long-tailed bats at Balls Clearing.
The fact that healthy trees were used more by solitary long-tailed bats than
by communal bats probably relates to the cavity space that roosting bats
require because such cavities tended to be found in aging trees. In contrast,
the space necessary for a single bat may be found in both healthy trees as
well as dead or dying trunks and limbs. Single roosting bats may rely more
on being widely dispersed and less likely to be found by predators, while a
large and more conspicuous group may require a restricted cavity entrance for protection.
The number of bats (mean = 86) that roosted in communal roosts during
summer at Balls Clearing was much larger than those reported elsewhere.
Daniel (1990) found that most roosts contain between 1 and 50 bats (mean=
10). The Balls Clearing roosts have more occupants than Australian
Chalinolobus roosts during summer. Tidemann & Flavel (1987) found mean roost sizes of 37.6 bats for C. mario and 8-11 bats for Chalinolobus
gouldii, while Lunney et al. (1985) found 15 female C. mario plus juveniles
in a large tree roost in New South Wales. The number of bats observed at
roosts in Balls Clearing was almost certainly less than the actual number
using each roost. Roost counts were only made when there was sufficient
light to allow reliable observations with night vision equipment. Therefore
the number of bats recorded at roosts (Table 2) are conservative, minimum
figures.
The sex ratio of bats at communal roosts is not known. Trapping of
emerging bats was not attempted, but one radio-tagged male was located in a
roost with radio-tagged females during December 1995. It is likely that most
communal roosts were nurseries as heavily pregnant females continued to
roost with others (both male and female) during the lactation period (see
Chapter 3). The seven week period where all bats with transmitters used
communal roosts coincided with the lactation period described in Chapter 3.
Nursery roosts probably disbanded from February onwards because no
communal roosts were found and a radio-tagged juvenile male was roosting
alone after this period.
84
The lack of roost fidelity displayed by long-tailed bats at Balls Clearing suggests that lactating females transported non-volant juveniles from roost
to roost every one to three days. Bats generally changed roosts between 3
and 5 am, after the females initial feeding activity during dusk and after their subsequent return for night roosting when presumably juveniles were suckling. How individual bats select where they will roost on any particular night or why they change roosts so frequently is unknown. There are
several reasons given to explain low roost site fidelity in bats: the abundance
of roost sites, the proximity of food resources, predation pressure, and human disturbance (Kunz 1982). There appears to be an abundance of suitable roost sites at Balls Clearing so bats may take advantage of this by
changing roosts regularly to escape predation or mite infestation which was observed by Heath et al. (1987) in the short-tailed bat (Mystacina tuberculata
Gray). The members in each group are likely to change as often as the bats change sites·because untagged bats were still using one roost (Number 15)
after a radio-tagged individual had moved on to roost with other bats. I could never watch two roosts at a time so could not confirm the use of many communal roosts simultaneously, however from preliminary results
of a large survey conducted at Balls Clearing during December 1995 it appears this is the case. The circling and landing behaviour shown by returning bats may be an investigation of the roost cavities. Individual bats
may therefore check a number of roosts until they locate one in use. Individuals probably move between many communal roosts rather than
staying faithful to one group.

85
References
Buller, W. C. (1892). Notes on the bats of New Zealand. Transactions and Proceedings of the New Zealand Institute. 25, 50-52.
Cheeseman, T. F. (1893). Notes on New Zealand bats. Transactions
and Proceedings of the New Zealand Institute. 26, 218-222.
Daniel, M. J. (1981). First record of a colony of long-tailed bats in a
Pinus radiata forest. New Zealand Journal of Forestry. 26, 108-111.
Daniel, M. J. & Williams, G. R. (1981). Long-tailed bats (Chalinolobus tuberculatus) hibernating in farm buildings near Geraldine, South
Canterbury. New Zealand Journal of Zoology. 8, 425-430.
Daniel, M. J. & Williams, G. R. (1983). Observations of a cave colony
of the long-tailed bat (Chalinolobus tuberculatus) in North Island
New Zealand. Mammalia. 47(1) 71-80.
Daniel, M. J. & Williams, G. R. (1984). A survey of the distribution,
seasonal activity and roost sites of New Zealand bats. New Zealand Journal of Ecology. 7, 9-25.
Daniel, M. J. (1990). Bats: Order Chiroptera. In C. M. King (ed.) .Til.e_
Handbook of New Zealand Mammals. Auckland: Oxford University
Press.
Dixon, J. M. & Huxley, L. (1989). Observations on a maternity colony of Gould's bat Chalinolobus gouldii (Chiroptera : Vespertilionidae).
Mammalia . 53 (3), 395-414.
Dwyer, P. D. (1960a). New Zealand bats. Tuatara. 8, 61-71.
Dwyer, P. D. {1962b). Studies on the two New Zealand bats.
Zoological Publications from Victoria University, Weiiington. 28, 1-28.
86
Dwyer, P. D. & Hamilton-Smith, E. (1965). Breeding caves and maternity colonies of the bent-winged bat in South-Eastern Australia. Helictite. 4, 3-21.
Hall, L. S. (1970). A collection of the bat Chalinolobus morio (Gray),
from the Nullabor plain, Western Australia. Helictite. 8, 51-57.
Heath, A. C. G; Julian, A. F; Daniel, M. J; Bishop, D. M. (1987). Mite infestation {Acari: Laelapidae) of New Zealand short-tailed bats,
Mystacina tuberculata, in captivity. Journal of the Royal Society of New Zealand, 17 (1), 44-47.
Kunz, T. H. (1982). Roosting Ecology. In T.H. Kunz (ed.), The Ecology
of Bats. Plenum Press. New York.
Lunney, D. ,Barker, J. & Priddel, D. (1985). Movements and day roosts of the chocolate wattled bat Chalinolobus morio (Gray) (Microchiroptera: Vespertilionidae) in a logged forest. Australian Mammal. 8 (3-4), 313-317.
Richards, G. (1979). New information on the little pied bat Chalinolobus picatus. Australian Bat Research News. 14, 7-8.
Simpson, K. G. (1962). A rooftop breeding colony of Gould's wattled bat. Victorian Naturalist. 78, 325-327.
Tidemann, C. R. & Flavel, S.C. (1987). Factors affecting choice of diurnal roost site by tree-hole bats (Microchiroptera) in South-Eastern
Australia. Australian Wildlife Research. 14, 459-473.

Chapter7

87
Conclusions and Recommendations
Overview
The general aim of this study was to investigate the morphology and
behaviour of the New Zealand long-tailed bat. The combination of (1) the
opportunities that Balls Clearing Scenic Reserve provided as a. study site; (2)
concentrated field work over spring and summer; and (3) supplementary
sites (particularly Grand Canyon Cave) that complemented the work
conducted at Balls Clearing, allowed me to detail five areas of research
within this broad aim. (1) The morphology of adult male and female bats
in the area was described and information about the development of
juvenile bats was collected; (2) the timing and duration of parturition,
lactation and the onset of volant juveniles \-VaS described; (3) the diurnal
and seasonal patterns in long-tailed bat activity was described, along with an
analysis of how bat activity is affected by changes in sunset, weather, moon
phase and insect abundance; (4) the choice of roost trees, the emergence
behaviour and the numbers of bats using roosts was described; and (5) prey taxa and prey size preferred by long-tailed bats was investigated.
The compilation of these separate areas gives a detailed overview of the changes in the morphology and behaviour of long-tailed bats during the
breeding season at Balls Clearing. Analysis of bat guano from Grand Canyon
Cave was completed during the winter before the data from Balls Clearing
was collected. This provided information on which of the trapped insects
should be used as an index of prey abundance and which method of
trapping these insects was most suitable. Concurrent studies of the breeding
season, roosting behaviour and the activity of the bats complemented each
other:
This work has provided three major contributions to the understanding of
the New Zealand long-tailed bat. There is a clear description of when
parturition, lactation and juvenile volance occurred, with details on the
post-natal development of juveniles. Variation in bat activity on a diurnal
and seasonal basis was described, with information on how this relates to
breeding and the environment. Roosting behaviour in podocarp forest was
described with details about roost trees and cavity types that are preferred by
long-tailed bats as well as detail of the occupancy of these roosts.
88
The morphological study of captured bats provided a base of data for future
research at Balls Clearing and as foundation for comparative studies
elsewhere. A higher sex ratio of captured adult female bats is probably a
reflection of higher energy demands during pregnancy and lactation. The
higher sex ratio of juvenile males and the sexual dimorphism of size
exhibited in the population cannot be explained. The continued capture of
bats through the season and the morphological data that were collected also
provided valuable information on the breeding season of the ~ats.
Most females showed signs of pregnancy (ie. weight gains and more obvious
nipples) during October and November. Weights amongst individual
female bats were more consistent during the period of weight gain than during the period of weight loss. Therefore it is likely that fertilisation is
initiated by extrinsic factors such as day length or environment rather than
internal physiological triggers such as the accumulation of sufficient fat
reserves. Bat activity was highest during the pregnancy period than later in
the season, with more recorded bat passes per hour during the night and
dusk periods . This may be a result of higher energy requirements during
pregnancy, but is more likely to be a compensation for low prey insect
abundance. Most female bats gave birth in mid-November when mean female weight was greatest and a marked increase in nipple size was
evident. Insect abundance increased at this time so female bats may synchronise lactation with periods of high prey abundance. Bat activity
levels decreased immediately following parturition and during lactation
which probably reflects time spent suckling new born bats. The increase in
prey during lactation probably allows more productive foraging during this
period. The lactation period of the population (the period between mean
parturition date and the capture of the first volant juvenile) lasted
approximately eight weeks, but individual bats may have lactated for shorter
periods. This could be confirmed by intense surveillance at a suitable
permanent roost. All females that were tracked with radio transmitters
used communal roosts during the lactation period, however pregnant
females occasionally used solitary roosts during pregnancy and after juveniles became volant. Communal roosts may therefore have a more
suitable roost temperature and provide more protection from predators
while females are feeding. The end of the lactation period and the onset of
volant juvenile capture occurred in early January when bat activity in the first hour increased. Total passes during the night, total passes per hour of
darkness and prey insect abundance all showed marked increases during
89
February which is most likely a period when all bats are increasing fat
reserves for the coming winter.
Explaining activity beyond the restraints of pregnancy and lactation is difficult. Combinations of variables best explained variation in bat activity
patterns. The environmental variables that explained most variation were
maximum temperature, sky cover, moonlight and wind strength, but there
were no clear rules of thumb that could predict bat activity under any given
conditions. It is difficult to isolate individual environmental factors that
affect bat activity, while diurnal patterns of activity appear to vary under
different conditions.
Long-tailed bats preferred tree cavities with small entrances which are found
in recently dead, mature podocarp trees. Bats also changed roost sites every
one to thre~ days. Roost sites therefore may be a limiting factor in the
distribution of long-tailed bats. In areas where limestone cliffs and caves are
not available the habitat may need to contain mature trees with suitable
roosting cavities for solitary and communal roosts. Balls Clearing has a
small area of mature forest (36 ha), therefore the size of the area may not be
as important for bats as the availability of suitable roosting sites.
Recommendations and the direction of future research
The diurnal and seasonal variation in bat activity must be taken into consideration when surveying bat activity. I suggest that sampling for bats is
most productive during the first hour after sunset. During this time, bat
encounters are most likely, so more detailed comparisons are possible between nights and sites. Also, direct observations of bats around dusk may
also help in the identification of species. Weather details and an index of
moonlight should be recorded and sampling methods should be
standardised to allow comparisons to be made between sites. The stage of
the breeding season should be considered at sites where human presence
may unduly disturb the bats. Grand Canyon Cave is one colony that seems
to have reduced in size over the course of my visits. There are reports of
many visitors observing bats without permits (including a bus load of
people on an organised field trip). Efforts should be made to tighten
restrictions on cave visitors, perhaps allowing only essential visits be made
from November through to February while bats are giving birth and
90
suckling their new born. Suitable alternative maternity sites may not be
available near by and so disturbance during this period may affect
recruitment. The features and the species of the roost trees that long-tailed
bats prefer should be considered when sampling and attempting to capture
long-tailed bats in similar habitat elsewhere. These factors should also be
considered when protecting suitable long-tailed bat habitat.
As we understand more about the basic biology and ecology of New Zealand
bats, the avenues for both conservation-orientated research and
management will expand. Most work on long-tailed bats at present is
concentrating on understanding the basic biology and ecology of the bats.
The status of most long-tailed bat populations is unknown, mainly because
a standard method of bat sampling has yet to be developed. The
identification of species by echolocation alone is difficult, as is the capture of
long-tailed bats at most sites. These areas will need to be researched so
efficient population estimates can be made. Understanding the breeding
biology and population recruitment of bats is essential if in the future we
find there is a need for active management of the species. Further details of
roosting ecology, particularly habitat type and roost cavity preferences in
other areas, will provide information on which habitat types need
protection as well as the potential to supply supplementary roost sites and
develop predator exclusion techniques.

91
Acknowledgments
My supervisors Ian Stringer and Murray Potter, thanks heaps for all you
have done for me in the last couple of years, I have learnt lots; Harry Keys
and Cam Speedy for starting the ball rolling, and their continued support, it
is much appreciated; John McLennan and Tony McCann for sharing nicely
with all their toys, expertise and study sites; Rob Whittle for his continued
help with bat surveys and monitoring, knowledge, jokes and sweet black tea;
Eileen Whittle for lunches, company and fresh farm eggs; Pat and Rob
Magill for the best caravan park in the land; No 1 field assistant Caroline
Gill for travelling far and wide, feeding me, clothing me and playing nicely;
Carter observatory for astronomical data; Brian Lloyd for sharing field
techniques, equipment and co-operation at Ohakune; David Lewis for local
history, the telephone and for valuable rainfall data; Pam Lewis for sharing
her knowledge on the Puketitiri bats, help in the field and saving my duck;
Tom Davies for giving me an excellent start with Hawkes Bay insect
identification; Sue Moore for her interest, help, regular survey work and
guano collection; Mal Lightband for his help, interest, Puketitiri home brew
and strawberries; Ma and Pa Gillingham for all your support, comments
and for public ridicule when asked what your son does for a living; Raye
and Chris Gill for much appreciated support in many ways; Claire Veltman for statistical queries; Ed Minot for computer queries; Ray Scrimgeor for his
co-operation and for Te Kuiti brews; Phil Mohi for his co-operation ,
equipment and lawn mowing; John Luff for his "know where" on bat sites and the capri; Errol Cudby for excellent accommodation and my first fly rod,
Puketiti Station manager Johnny for always saying "good as gold" when
ever I needed accommodation or a 4 wheeler; The Siemoniks from Erua and
Kim Turner in Puketitiri for farm access; Colin O'Donnel for the lend of the
harp trap; Jens for his help making the kiwi made harp trap; Mark Large for identifying fern scales and spores; Michael Schneider for his help in the
field, and trips to town; Raewyn MacKenzie for late night blah blah's; Jay McCartney and Kim Carter for comments, bringing wine and enthusiasm to
many sites; Emma Barraclough for finally finishing a thesis; Fra and Scotty
for their help with fieldwork and for cooking only once; Suzanne Bassett for
her help in the field and for being TVL camp mum; Liz Domett for
assistance at the cave; and to everyone else who helped.

Appendix I
Report on work at Grand Canyon Cave

Report on research conducted on the long-tailed bat (Chalinolobus
tuberculatus Gray) at Grand Canyon Cave, Piopio.
INTRODUCTION
92
A study of the long-tailed bats at Grand Canyon Cave was to be conducted as part of a Masters project in cooperation with the Taupo/Tongariro and Hamilton Conservancies of the Department of Conservation. The intention of the study was to investigate roosting locations (inside and outside the
cave), foraging flight distances, and prey species selection by bats as part of a comparative study on bats in a cave population with those in a forest
population. Regular monitoring of emergence behaviour from the cave was to be conducted as part of the Department of Conservation's monitoring program.
Long-tailed bats proved to be extremely difficult to catch in the Tongariro
area and so the original comparative study planned had to be modified into a concentrated study of long-tailed bat morphology, breeding and behaviour
at Puketitiri, Hawkes Bay. The cave part of the study was continued with less intensity, and concentrated mainly on collecting data on day and night roosting behaviour, emergence surveys, and the collection of guano for analysis later.
METHODS
My initial research on the long-tailed bat population began in June 1993.
The purpose of this first visit was to confirm that the population still existed in the cave and to assess the site's suitability as part of my study. Between June 1993 and April 1995, eight further visits were made to the cave. These usually involved a survey through the cave during the day, locating and recording where bats were roosting and where old and new guano deposits were. Population estimates were made at night by counting all bats leaving
and entering the cave. Fresh guano samples were collected for faecal analyses (Chapter 5) and light trapping was conducted to gain an estimate of
insect food availability. Data from bat surveys using bat detectors both near the cave and at local forest areas was also collected. In January 1994 a dusk till dawn cave entrance survey was conducted so that activity levels of the bats through the night could be investigated. From 9/3/94 more intense

93
work began in the cave and continued to 26/3/94. During this period daily
surveys were made through the cave which gave consecutive day-roosting
data. On one night (10/3/94) mist nets were set up at the south entrance and
four bats were caught. Details including sex, weight and other morphometric data were collected. A radio transmitter was attached to one
bat and all bats were released. Daily and nightly tracking of this bat
continued until 26/3/94. Night surveys of the cave were also made during
this visit. Summary reports of the early visits to the cave as well as all
emergence and roosting data was reported to Department of Conservation,
Te Kuiti, Waikato Conservancy.
Table 1. Details of visits to Grand Canyon Cave.
Date Purpose of visit
6/6/93 Assess suitability of study site
Cave survey
Entrance COWlt
7-8/11/93 Cave survey
Entrance COWlt
13- 14/12/93 Cave survey
Entrance COWlt
Survey likely feeding sites
29-30/1/94 Cave survey
Dusk till dawn entrance cotmt
Roosting bat group observations
9-26/3/94 Day surveys
Entrance cotmts
23 visits made Night-roosting surveys
Mist net bats at Sth entrance
Radio track tagged bat
Survey sites within 5 km of cave
14-15/7/94 Cave survey
Entrance COWlt
6/8/94 Cave survey
Entrance COWlt
1-2/4/95 Day survey
Harp trap bats at Sth entrance
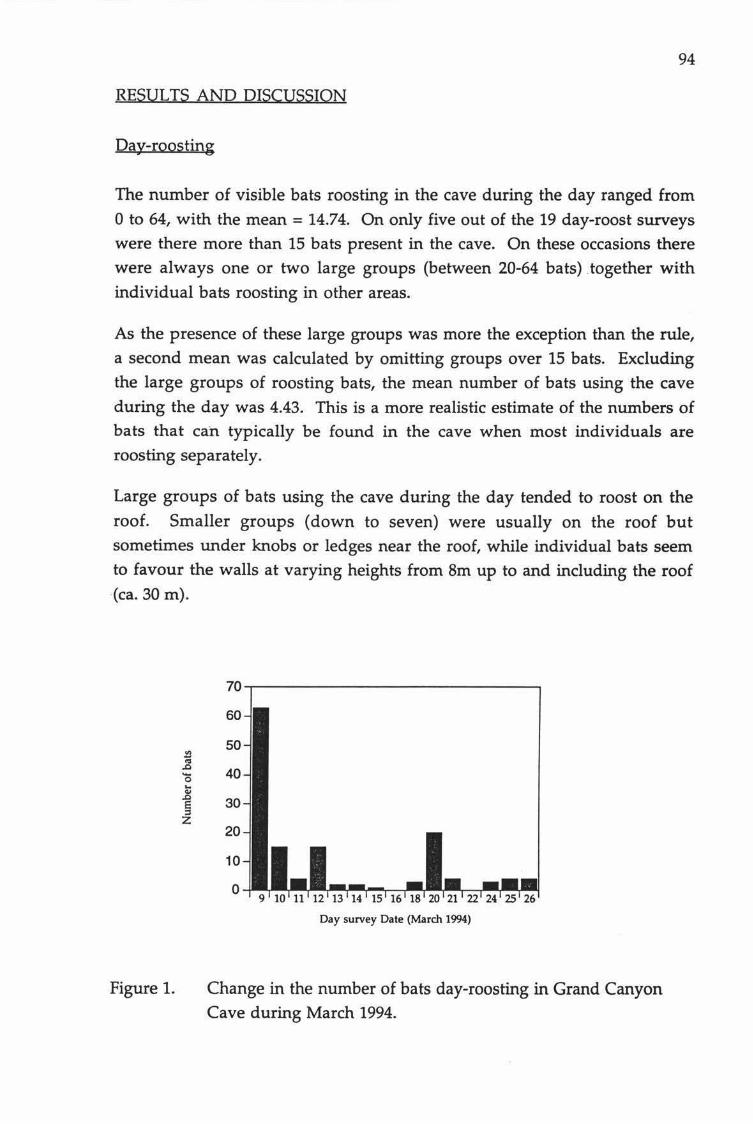
94
RESULTS AND DISCUSSION
Day-roosting
The number of visible bats roosting in the cave during the day ranged from
0 to 64, with the mean= 14.74. On only five out of the 19 day-roost surveys
were there more than 15 bats present in the cave. On these occasions there
were always one or two large groups (between 20-64 bats) .together with
individual bats roosting in other areas.
As the presence of these large groups was more the exception than the rule,
a second mean was calculated by omitting groups over 15 bats. Excluding
the large groups of roosting bats, the mean number of bats using the cave
during the day was 4.43. This is a more realistic estimate of the numbers of bats that can typically be found in the cave when most individuals are
roosting separately.
Large groups of bats using the cave during the day tended to roost on the
roof. Smaller groups (down to seven) were usually on the roof but
sometimes under knobs or ledges near the roof, while individual bats seem
to favour the walls at varying heights from 8m up to and including the roof (ca. 30m).
.1!3 "' .0 .... 0 .. ~ e ::l z
Figure 1.
70
60
50
40
30
20
10
0
Day survey Date (March 1994)
Change in the number of bats day-roosting in Grand Canyon Cave during March 1994.

95
There is no clear seasonal pattern explaining the variation in the number of
bats using the cave as a day-roost during March 1994, although the largest numbers of bats observed during the day were during summer (64 bats on 13/12/93 and 63 bats on 9/3/94). Day-roosting data collected from 15
consecutive surveys (Figure 1) shows a decline in numbers with time. Even
though these surveys were conducted by myself only and disturbance was kept to an absolute minimum it is still possible that torches and human
presence caused some of the bats to roost elsewhere.
There are some areas in the roof that are hidden from view and so cannot be surveyed. It is possible that bats were roosting in such areas. Little Canyon cave was surveyed twice during this period. No bats were located.
For 13 consecutive days (during March 1994), one bat did not seem to move
(day or night) from its individual roost (13 m up on the east wall, 256 m into the cave). There was no sign of movement when spotlighted for long periods. The bat was still in the same location during a later cave visit 12
months later (4/1/95) so it is most likely dead, mummified in the roosting position.
Night-roosting
During five night surveys, during March 1994, the cave was used as a nightroost by a large number of bats. The bats entered the cave at approximately
8.45 pm and formed an unsettled group on the cave ceiling. These groups were located between 85 m and 230 m from the North entrance and audible squeaks were usually heard before groups were sighted. Night-roosting groups would sometimes congregate on brown stained limestone while on
other nights they did not. There was no evidence that the bats preferred these areas or that the stains resulted from regular use of these sites. On two
consecutive nights (22 and 23/3/94) the group roosted in the same location on the roof (126 m from North entrance). The size of these large, nightroosting groups ranged from approximately 150 to 300 bats (determined by
counting a portion of the group with binoculars then estimating total group size).
Approximately 150 bats were observed night-roosting together on 15/7/94. There were no large groups spotted during a day survey, but at 7.40 pm, the bats were observed roosting on the roof of the cave 88 m from the North
entrance. The bats were still there at 10.35 pm. The bats in these groups

96
were easily disturbed and could be observed with a torch for only about ten
seconds at a time.
As night roosting in this manner was recorded during both during summer
and winter it is not likely to be related to a seasonal or breeding behaviour.
Bat captures
On 10/3/94 a mist net was set up at the south entrance. Four bats were
caught between 8.45 pm and 9.30 pm.
Table 2. Measurements of the radio-tagged bat (nun), and weight only of
three other bats.
Sex Weight L. forearm R.forearm Tail Skull Body Wingspan
F 1l.Og 42.8 42.7 38.4 12.95 32.85 28.25
F 1l.Og
F 11.5g
M lO.Sg
The first bat was measured, and tagged with a short-life radio transmitter.
The other three bats were sexed and weighed before release. The female
fitted with the transmitter joined a large night-roost within the cave when
released but was not located inside the cave the following morning. This
may show that a large number of bats do actually leave the cave rather than
roosting in areas not visible to observers. The tagged bat was located later in
the day, roosting in Waitoru Bush (3.8 km from Grand Canyon Cave), the
actual roost tree could not be located. The bush is dominated by rewarewa
(Knightia excelsa), tawa (Beilschmiedia tawa), kahikatea (Dacrycarpus dacrydioides), with some totara (Podocarpus totara), hinau (Elaeocarpus
dentatus), rimu (Dacrydium cupressinum), matai (Podocarpus spicatus) and
miro (Podocarpus ferrugineus). Waitoru Bush is grazed by domestic stock.
Extensive searches were made for the next 16 days, both during the day and
at night around local farm and forest areas up to 10 km from the Cave. The
tagged female was not located again.

97
Dusk till dawn activicy monitoring
Bat passes were monitored and recorded at the North and South entrance of
the cave from 8.00 pm on the 29 I 1/94 to 7.00 am the following morning. At the North entrance, passes in and out of the cave were detected with a bat box and were recorded at five minute intervals. Passes were recorded as
either in, out, or circle (out then in). Temperatures were recorded sporadically at the North entrance. The South entrance was monitored using a bat detector and a sound activated tape recorder. The direction of
passes at either entrance was difficult to determine. Trial echolocation
(when the direction of the bat was observed) were taped and used as a reference, but as the nature of the cave results in a lot of echoes, I could still not be absolutely certain about the direction of most passes.
120
100
80
~ 60 ci!
40
20
0
-
-
-
-
-
g a:i
I North entrance South entrance
~ 111
g g o) c) -
:J ~ 0 ~ .... -
j ~ ~ J n 8 ~ C>i .,... ....
~ B I
g g C>i (")
pm 1/2 hour interval
[;1 i'J l 9 ~ I .. 8 8 cO .....:
am
Figure 2. Total number of passes recorded at North and South entrances of
Grand Canyon Cave from dusk on 28/1/94 till dawn on 29/1/94.
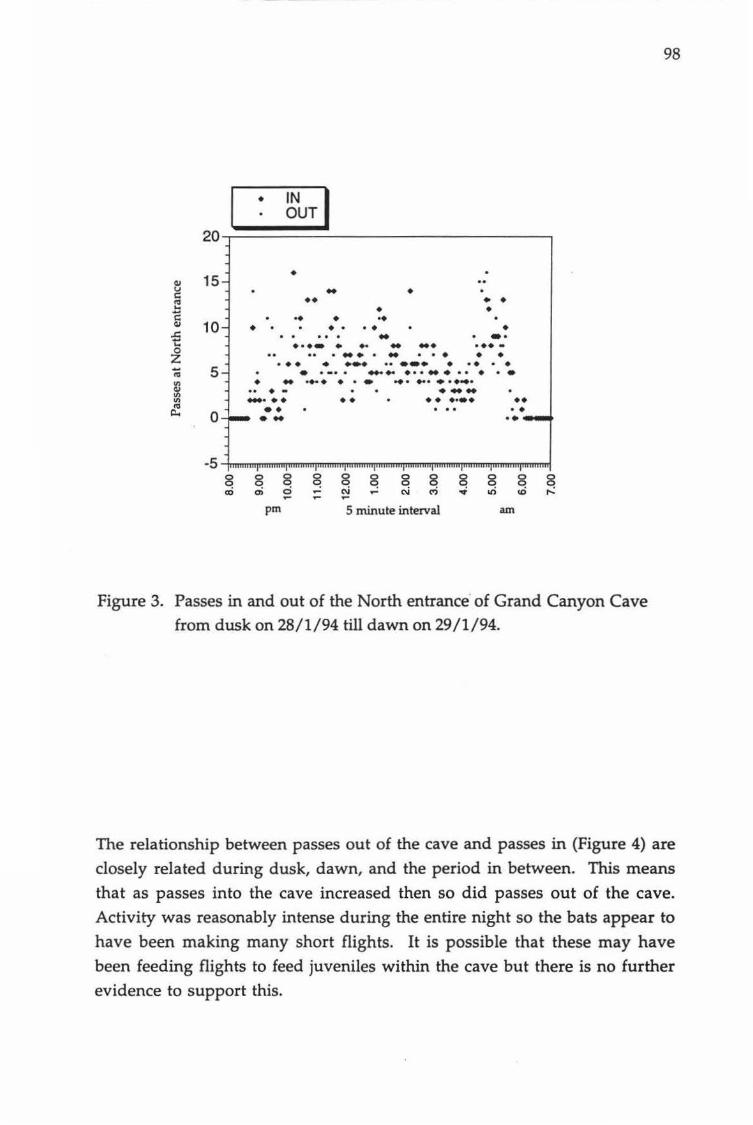
20
• ~UTI
• Q) 15 u .. • c:: •• • • "' ... • • i: •• • •• Q) 10 • • •• • -= .. . •• ... ···- • •• .. ... . .. -0 .. . ... . .. . • • • • z ••• • -· .. ·-· • •• . • ... 5 • . -· . ..... . ....... • • • "' ., .. .... • • • ............ ~ ·- .. ., •• •• •••• • • "' •• 0.. 0
-5 8 8 8 ~ 8 ~
0 8 8 8 0 ~ 0 C! ex) a; 0 - C\i - C\i t? ..... ori <0 ,... - - -pm 5 minute interval am
Figure 3. Passes in and out of the North entrance· of Grand Canyon Cave from dusk on 28/1/94 till dawn on 29/1/94.
98
The relationship between passes out of the cave and passes in (Figure 4) are closely related during dusk, dawn, and the period in between. This means that as passes into the cave increased then so did passes out of the cave.
Activity was reasonably intense during the entire night so the bats appear to have been making many short flights. It is possible that these may have been feeding flights to feed juveniles within the cave but there is no further evidence to support this.

99
(a) 15 8.30
10
~ 0
~ "'
5
"' c..
0
0 5 10 15 20 Passes In
(b) 12 10.30 m to 4.00 am
10
8 ~ 0
~ "'
6
"' c.. 4
2
0 0 5 10 15
Passes In
(c) 20 4.00 am· 6.00 am
15
~ 0
10
~ "' c.. 5
0
0 2 4 6 8 10 12 14 Passes In
Figure 4. Relationship between passes in and out of the North entrance of
Grand Canyon Cave (29 /1/95) at (a) dusk (R = 0.593), (b) during the night (R= 0.399), and (c) dawn (R= 0.729).

100
Observations of a group
On 29/1/94 a group of what looked like 26 bats (counted with binoculars and
a low powered torch) were located roosting in a crevice 8 m up on the west
wall, 39 m into the cave from the North entrance. A cotton sheet was spread beneath the group, and the emergence behaviour was observed continuously from 8.30 pm until 9.43 pm with further checks at 10.00 pm,
10.25 pm and the following morning.
7.30 pm 8.30 pm
8.40 pm 8.45 pm
8.47pm
8.50 pm
8.56 pm
9.03 pm
9.06 pm 9.22 pm 9.28 pm 9.30 pm
9.43 pm 10.00 pm
10.25 pm
Three droppings on sheet since 2.30 pm. Audible squeaks heard from group, bats making restless movements. Most bats still restless. One bat flies, other bats become more settled.
Individuals near the edge of the group are more restless
with forearms out moving, bats in the middle of the group are less restless with wings close to body.
As a bat leaves the remainder become more settled. More squeaking, bats leaving group steadily one by one
towards North entrance (out of cave) and South entrance. Much activity outside, bats that are farthest into crevice still settled. Squeaking.
Bats on outer edge are all active while bats further into the
crevice are slowly coming out. Two smaller groups now. One group far less active. Eleven bats remain. All remaining bats now active. Five bats remain. One bat on wall 4 m below roost. Four bats remain.
Droppings on sheet. Some droppings are large (10 mm long) while others are small (2 mm long and thinner). Remaining bats along the inside of crevice As above
All bats gone. Next morning six bats roosting in same crevice.

101
Some conclusions can be drawn from these observations. Bats on the outside of the group become active earlier than bats in the centre of the
group. Although bats in the centre have periods of activity, they generally
remain still until surrounding bats have departed. It took approximately
two hours for all the bats to depart, but I cannot discount that my presence may have influenced this. The dull torch used to observe bats was turned
on for quick observations with binoculars approximately every two minutes, depending on how active the bats were. There was no evidence of
early departure which I would expect if the bats were disturbed.
The sex and the age of the individuals could not be determined.
Faeces collection
The main purpose of guano collection was so that the diet of the bats could be investigated but an effort was also made to determine when roosting bats defecate. This was done by spreading a large cotton sheet (2m x 8 m) on the
floor of the cave at several locations.
Bats in the cave very rarely returned to the same location so it was difficult to monitor defecation over a 24 hour period. The quantitative component of the study would be difficult to design as the number of bats in any particular group could not be determined precisely and usually changes during observation periods.
The only faecal data that were collected from a known number of bats was
from the group that was observed (above). Although the number of bats in
this group changed through time, making quantitative collection impossible, very few droppings were collected in the five hours up to 7.30
pm compared to the two hours from 7.30 to 9.30 pm when the bats became active.

Appendix II
Report on work in the Taupoffongariro Conservancy
102
Long-tailed bat survey.
Client: Department of Conservation, Taupo/Tongariro.
INTRODUCTION
Basic ecological research on the long-tailed bat (Chalinolobus tuberculatus)
is essential in order to design appropriate population estimation methods
and to provide valuable information for monitoring and protecting this
species.
My initial investigations on the long-tailed bats began in early June 1993,
and continued through to late November 1993. This consisted of a
literature search, corresponding with other scientists and three field trips. The first two trips were to Grand Canyon Cave with stop-overs ·in the Taupo/ Tongariro Conservancy. The main aims of these trips were to
confirm the existence of long-tailed bat populations both in Grand Canyon Cave and in Erua State Forest (Tongariro) and to discuss the possibility of research with the respective conservancies. The Grand Canyon Cave population was still resident in the cave and long-tailed bats were found in
a number of sites in the Taupo/Tongariro Conservancy. A third field trip was made in 1993 to visit John McLennan and Tony McCann (Landcare Research) and a long-tailed bat research site at Balls Clearing in Hawkes Bay where mist-netting and bat handling techniques were learnt. Field research began in the Tongariro area on the 8th December 1993.
The main aim of this study was to attempt to trap bats using mist nets at
suitable sites. Radio transmitters were then attached to adult female bats so that their movements could be tracked with directional receivers. Roost site
selection and the breeding ecology was to be investigated as part of a comparative study of forest and cave dwelling populations. The occurrences of bats in both areas in which they were known to exist and areas from which they had not previously been recorded were recorded to obtain a more detailed picture of bat distribution in the Tongariro area.
Weather conditions were recorded in order to assess under what conditions bats were most active, and hence which nights were best for mist-netting.
103
METHODS
1. Sites where bats were reported in Department of Conservation records were surveyed to determine locations where previous bat activity was
highest, and where successful mist-netting would be more likely. Sites
were also sought in areas where bats had not previously been reported. Potential mist-netting sites would also require appropriate vegetation or
natural topography to increase chance of capture. Bat detectors were used manually and with sound-activated tape recorders to confirm the presence
of bats.
2. Meteorological data was collected by direct observation and estimation of
variables such as cloud cover, wind direction and rainfall. More accurate
measures were obtained from thermometers, an anemometer and the
meteorological service.
3. Prey species availability was sampled using a 12 volt black light trap. The light trap was set up at both mist-netting sites and other sites where bats were present. Insect sampling was to be compared with results from analysis of guano from local roosts.
4. Approximately every second night was spent mist-netting at sites where bat activity was highest, while every other night was spent surveying new, potential mist-netting areas.
5. A harp trap was used both on the ground and hoisted up large trees on
four nights while in the Ohakune area.
RESULTS AND DISCUSSION
No long-tailed bats were captured in the Tongariro area. 137 hours were spent sampling sites and attending mist nets in the Tongariro area between 5/6/93 and 6/4/94. Most of this time was spent around dusk from December
1992 to February 1993. Surveying during dusk and in the first hour after dusk was considered more productive for two main reasons; this seemed to be when the bats were most active (30-60 minutes after first appearing the bats would leave the foraging area), and at this time bats could be seen silhouetted against the sky even if they were out of range of the bat detector.

104
In open clearings, the flight path of individual bats could be followed for distances of up to about 70 m.
52 evenings were spent surveying for bats in the Taupo/ Tongariro area and bats were seen or heard on 19 occasions. A number of new long-tailed bat
sites were located in the Tongariro area and some sites seemed to have visits from bats on a regular basis. At one site (NZMS T19 429398) near Lake
Rotoaira, up to seven long-tailed bats were seen regularly flying above the
canopy and clearing. On five nights at this site bats were first" sighted at the same time (8.57 pm) of day. Assuming that greater flight distances would produce more varied arrival times it is likely that the bats roost close by. However, systematic searches with a bat detector through the forest during emergence time did not result in the location of any roosts. Catching bats in
these open areas was difficult because the bats did not appear to use the
nearby stream as a flight path. Instead the bats flew at or above canopy height, foraging mainly above a large clearing.
The most promising site for netting bats was on a bluff (Siemonik's farm) in Erua (NZMS 520 082155). Two long-tailed bats regularly appeared at this site but were never caught. They were observed flying over, around and under the mist net while pursuing insect prey. Being a bluff there was often wind present so the net was constantly moving, this movement was
probably detected allowing the bats to avoid the net. The net was also silhouetted against the sky during dusk. Most bats were seen or heard with the bat detector between 9.00 pm and 9.30 pm during summer (up until about thirty minutes after dark) at forest sites and up to 10.15 pm in more open areas (eg. the bluff site). The significance of this is not clear but it may be related to the distance between foraging sites and the roost. Regardless of site, more bats were detected within the first hour of darkness than later in the night.
At Pekapeka clearing ( NZMS T19 429398) most bats were observed early and usually when there was some cloud cover. Air temperature at dusk, on nights when bats were most abundant, was also higher (18.1 to 22.90C).
There was less bat activity on nights that started with clear weather then clouded over, than on nights that were already overcast, even though the
temperatures at 9.30 pm were often similar. Bats were observed foraging on
warm wet nights but less bat activity was observed on cooler misty, or cooler wet nights. Long-tailed bats were observed flying in relatively strong wind

105
(7.4 m / s). An unidentified bat (probably short-tailed) was heard on the bat
box at 1160 m above sea level at the new Blythe track footbridge, Ohakune.
Four short-tailed bats were caught in the Ohakune area but no long-tailed
bats, which I was targeting, were either seen or heard. Continued intensive
trapping and netting in the area (Brian Lloyd, pers. comm.1) has resulted in
the capture of only a single one long-tailed bat. This gives some indication
of the general difficulty of catching long-tailed bats.
CONCLUSIONS
Bats fly in a · wide range of environmental conditions. No bats were caught
in the Taupo/Tongariro area and so no information is available on flight
distances and roosting behaviour. Insect light trapping was done in most
areas but as no guano could be collected from local roosts it is not possible to
draw any conclusions about the insect prey taken by the bats. Mist-netting
should obviously be attempted in sites where bats occur regularly.
However, in addition to having bats, the site needs to have the type of
topography or vegetation where bats are forced low enough to be caught in
nets, eg. stream flight paths or narrow, natural or man made corridors.
1 Brian Lloyd, Department of Conservation, Science and Research division.
Tory St, Wellington.

106
Table 1. Sites surveyed in the Tongariro, Erua, and Ohakune areas.
NZMS Map Reference Location Notes
TI9476458 Omoho Stream Nothing 483458 "+ 1 kmwest Nothing 433492 Powerstation lookout Nothing 486438 Tupatomatua Stream Nothing 475403 Hinemihi's Track Passes 484417 Papanetu stream Passes, nets up 480416
, , Passes
473403 Te Pongana Saddle Rd Passes 467396 Lake Rotopounamu Nothing 467392
, , Nothing 467387
, , Noth ing
465382 , , Nothing 468379
, , Nothing 456388 Opotaka Nothing 430397 Pekapeka Clearing Passes 428399 Pekapeka Stream Passes, nets up 429403
, Nothing 425400 West of " Passes 422400 Passes 422402 Nothing 414400 Otara Stream Nothing 411404 Otara Stream Nothing 436419 Maungakatote Passes, nets up 435422
, Passes
434427 ,
Nothing 437475 Kahuarua Nothing 308368 Outdoor Pursuits Nothing 309360 Ford Nothing 307356 Dam Nothing 495503 Poutu Canal Nothing 490337 OhungaRd Nothing 482337 Nothing 537378 Shag Pool Nothing 536385 Admirals Pool Nothing 693385 I<ikio Rd end Nothing 696385 " Nothing 699385
, Nothing 520155170 W aimarino Stream Nothing
150172 ,
+500mwest Nothing 145170 CuffRd Nothing 140160 EruaRd Nothing 136152
, Passes
129146 " Nothing 124135
, Passes
115136 ,
Nothing 105142 Airstrip Passes 103146
, Passes
097150 EruaRd Passes 082155 Trig Passes, nets up

107
073155 EruaRd Nothin_g_ 249034 Blythe footbrid__g_e Passes 231<Y2.3 II C'!!E_ark Passes, hatp-trap up 230023 Passes, nets u__2_ 253054 New Blythe footbrid__g_e Passes, nets u__2_ 197092 CampRdend Nothin__g_ 193984 Cam_p_ Rd brid_g_e Nothin__g_ 213008 Noth~ 224014 Passes 224013 Passes, nets u~ 221943 Rangatau ford Nothin_g_ 269937 Lake Rotokura Passes, harp-tr~ "!£. 269937 II Passes 270942 II Passes 267937 II Passes 271945 II Passes, nets up 269934 II Passes 224943 Rangatau swam_E_ Passes 233932 Karioi Railway Rd Nothin_g_ 243926 II Nothing 243924 II Nothin__g_ 250962 W aiharuru Stream Nothin_& nets 1.!2_
254962 II Noth in__g_ 255955 Nothin__g_ 260952 Nothin__g_ 255935 Nothing
S19172265 Makaretu Stream Nothing

Appendix III
Graphs and Statistics

108
1. Morphology
19
18
.D
] 17 ,:, c: :z
.:::: 16 j
15
14 36 37 38 39 40 41
Right forearm
Juvenile forearm length vs left hind limb length. (R= 0.74119)
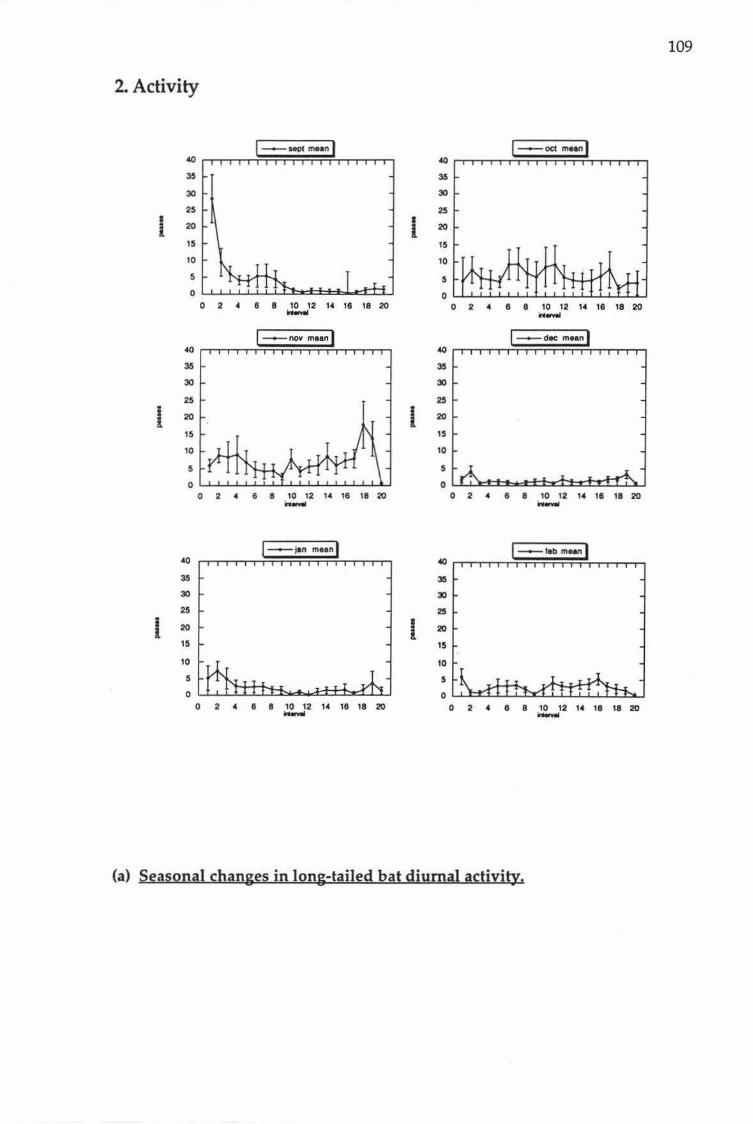
109
2. Activity
40 I ~sept me•nl
40 j-oct m.anl
35 35
30 30
25 25
I 20 I 20
15 15
10 10
s 5
0 0 0 2 4 8 8 10 12 14 18 18 20 0 2 4 IS 8 10 12 14 11! 18 20 - .........
40 I _...._.nov mean I
40 I _._.dee mean I
35 35
30 30
25 25
l 20 I 20
15 15
10 10
5 $
0 2 4 6 8 10 12 14 16 18 20 0 2 4 8 8 10 12 14 18 18 20 - -
40 1-Jan meanl
40 1-t.t~ maan l
35 3$
30 30
25 25
I 20 l 20
15 15
10 10
5 5
0 2 4 6 8 10 12 14 18 18 20 - 0 2 4 II 8 10 12 - 14 18 18 20
(a) Seasonal changes in long-tailed bat diurnal activity.

- -() 0" - ........
Number in sample Number in sample ..... ..... ..... 0 ..... 1\) w 1\) .,.,. 0) Q) 0 1\) .,.,. .,.,. <.n 0) -....! 0 0 0 0 0 0 0 0
w1 0.1
0 <.n 0
Number in sample ..... ..... 0 0
<.n 0
~ 1Q'1Ulll1!iiii :: 19/1219~ :I Q. s·
:JQ
-Q) -1\) 1\)
8 <.n 0
'O-cT Iii ---() 0 l' 0 (I) ..... -"'0 '1j (I) .... -0 0. (I)
"'0 0 .., -"'0 Qj
(I) -.., (I) Qj "1
Qj
-0" -
._,a ....,. . 0

111
(c) Multivariate statistics.
(1) Total passes in night vs external variables.
(No variable met the 0.5000 significance level for entry into a stepwise
procedure model).
Summary of forward selection procedure.
Variable Number Partial Model
In R.,.2 R..,.2 C(p) F Prob>F
MinT 1 0.0387 0.0387 -0.4404 1.1685 0.2886
Rain 2 0.0241 0.0629 0.8932 0.7207 0.4031
Wind 3 0.0686 0.1315 0.9975 2.1328 0.1557
(2) Number of passes in first hour after sunset vs external variables.
Stepwise procedure.
Step 1 Variable (wind) entered R-square = 0.31152500 C (p) = 10.26726723
DF
Regression 1
Error 34
Total 35
Parameter Variable estimate
sum of squares
5787.99599930
12791.55955625
18579.55555556
Standard error
Intercept 16.51421098 3.28894577
Wind 0.15442270 0.03937035
bounds on condition number 1
Mean square
5787.99599930
376.22233989
Type II
Sum of squares
9485.20699290
5787.99599930
1
F Prob>F
15.38 0.0004
F Prob>F
25.21 0.0001 15.38 0.0004
Step 2 Variable (moon minutes) entered R-square = 0.43604099 c (p) =
4.62290709
DF
Regression 2
Error 33
Total 35
sum of squares
8101.44785885
10478.10769671
18579.55555556
Mean square
4050.72392942
317.51841505
F Prob>F 12.76 0.0001

112
Parameter Type II
Variable estimate Standard error Sum of squares F Prob>F
Intercept 1.5910891 6.29775386 20.47168722 0.06 0.8011
Moon min 0.04848910 0.01796381 2313.45185954 7.29 0.0109
Wind 0.18471311 0.03786942 7554.17335480 23.79 0.0001
bounds on condition number 1.096262 4.385049
Step 3 Variable (month) entered R-square = 0.49081980 c (p) = 3.25989401
DF sum of squares Mean square F Prob>F
Regression 3 9119.21373252 3079.73791084 10.28 0.0001
Error 32 9460.34182304 295.63568197
Total 35 18579.55555556
Parameter Type II
Variable estimate Standard error Sum of squares F Prob>F
Intercept -28.84495945 17.49721841 803.44969495 2.72 0.1090
Month 2.24105034 1.20783078 1017.76587367 3.44 0.0728
Moon min 0.07024351 0.02092671 3330.94393271 11.27 0.0020
Wind 0.24104034 0.04750648 7610.80589637 25.74 0.0001
Summary.
Variable Number Partial Model
In R..,.2 R..,.2 C(p) F Prob>F
Wind 1 0.3115 0.3115 10.2673 15.3845 0.0004
Moon min 2 0.1245 0.4360 4.6229 7.2860 0.0109
Month 3 0.0548 0.4908 3.2599 3.4426 0.0728

113
(3) Time of first pass vs external variables.
Step 1 Variable (Month) entered R-square = 0.28360123 C(p) = 15.95090754
DF
Regression 1
Error
Total
Variable
Intercept
Month
28
29
Parameter
estimate
-15.07735849
'4.08490566
sum of squares
4716.70440252
Mean square
4716.70440252
11914.76226415 425.52722372
16631.46666667
Type II Standard error Sum of squares
13.22602807 552.99218221
1.22694862 4716.70440252
bounds on condition number 1 1
F Prob>F
11.08 0.0024
F Prob>F
1.30 0.2640
11.08 0.0024
Step 2 Variable (Max T) entered R-square = 0.51573299 C(p) = 4.35772677
OF
Regression 2
Error
Total
Variable
Intercept
Month
MaxT
27
29
Parameter
estimate
-59.45401495
4.21694168
3.67103422
sum of squares
8577.39602416
Mean square
4288.69801208
8054.07064250 298.29891269
16631.46666667
Type II
Standard error Sum of squares
16.57662520 3837.26515610
1.02793471 5020.13963611
1.02042646 3860.69162165
bounds on condition number 1.001276 4.005106
F Prob>F
14.38 0.0001
F Prob>F
12.86 0.0013
16.83 0.0003
12.94 0.0013
Step 3 Variable (Sky) entered R-square = 0.60117157 C(p) = 1.35461088
DF
Regression 3
Error 26
Total 29
sum of squares
9998.36495850
6633.10170816
16631.46666667
Mean square
3332.78831950
255.11929647
F Prob>F
13.06 0.0001
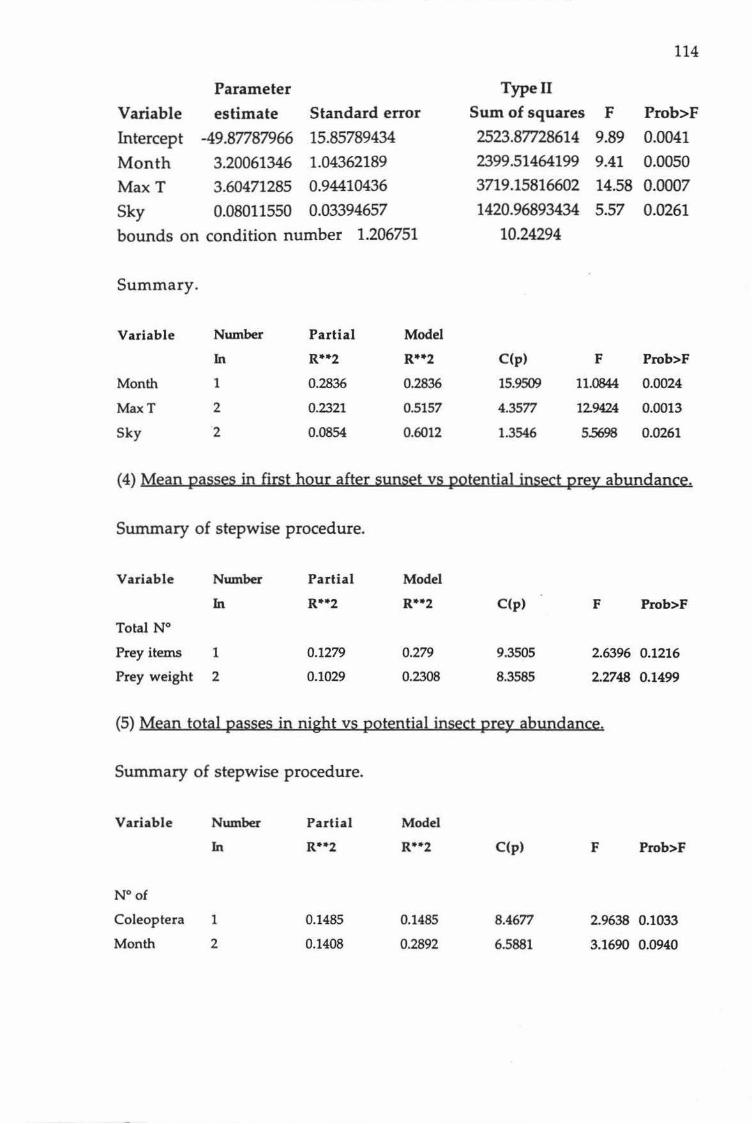
114
Parameter Type II
Variable estimate Standard error Sum of squares F Prob>F
Intercept -49.87787966 15.85789434 2523.87728614 9.89 0.0041
Month 3.20061346 1.04362189 2399.51464199 9.41 0.0050
MaxT 3.60471285 0.94410436 3719.15816602 14.58 0.0007
Sky 0.08011550 0.03394657 1420.96893434 5.57 0.0261
bounds on condition number 1.206751 10.24294
Summary.
Variable Number Partial Model
In R••2 R..,.2 C(p) F Prob>F
Month 1 0.2836 0.2836 15.9509 11.0844 0.0024
MaxT 2 0.2321 0.5157 4.3577 129424 0.0013
Sky 2 0.0854 0.6012 1.3546 5.5698 0.0261
(4) Mean passes in first hour after sunset vs potential insect prey abundance.
Summary of stepwise procedure.
Variable Number Partial Model
In R••2 R••2 C(p) F Prob>F
Total N°
Prey items 1 0.1279 0.279 9.3505 2.6396 0.1216
Prey weight 2 0.1029 0.2308 8.3585 2.2748 0.1499
(5) Mean total passes in night vs potential insect prey abundance.
Summary of stepwise procedure.
Variable Number
In
N° of
Coleoptera 1
Month 2
Partial Model
0.1485
0.1408
0.1485
0.2892
C(p)
8.4677
6.5881
F Prob>F
2.9638 0.1033
3.1690 0.0940
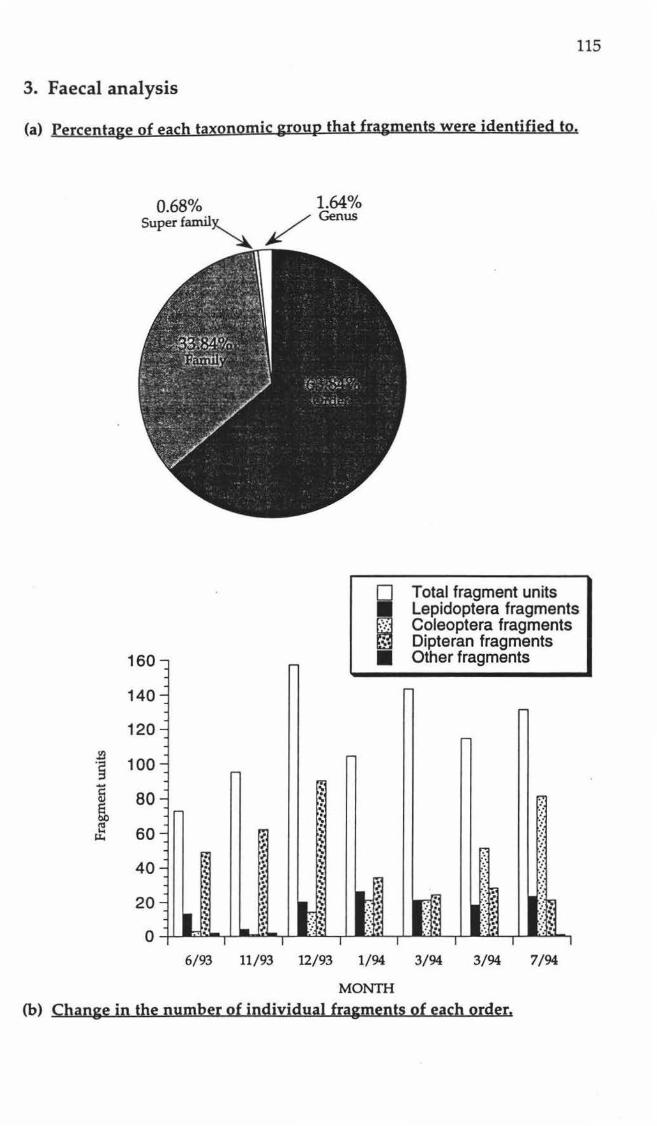
115
3. Faecal analysis
(a) Percentage of each taxonomic group that fragments were identified to.
0.68%
160 -
140 -
120 -ll
100 '§ -..... ~ a 80 -
IU ... 1.1.. 60 -
r.'
40 - .. ' ' ' 20
0
- ' L~ I
6/93
1.64% /Genus
~
' ' ' r; ' ;. ' ;. ' ' ;. ;. ' ' ;.
' ;.
t~ ;. ;. ~ .. ;. .. .
I I
~ . . . •
~ , ;. ;. ;. ;.
11/93 12/93 1/94
MONTH
I
Total fragment units Lepidoptera fragments Coleoptera fragments Dipteran fragments Other fragments
r:; •' .. ·.: ·.: .. ,• .. ..
~
I I ··n , .. ;. : ... ;. .::· ~ .
I I l
3/94 3/94 7/94
(b) Change in the number of individual fragments of each order.
Copyright © 2022 FDOKUMEN