
Intercalation Kinetics of Long Polymers in 2 nm Confinements
The basic electroanalytical behavior of practicalgraphite±lithium intercalation electrodes
Boris Markovsky, Mikhail D. Levi and Doron Aurbach*
Department of Chemistry, Bar-Ilan University, Ramat Gan, 52900, Israel
(Received 7 August 1997; in revised form 1 December 1997)
AbstractÐThe electrochemical behavior of practical carbon electrodes comprising arti®cial graphite par-ticles of di�erent sizes and PVDF binder in EC-DMC Li salt solutions was studied using simultaneouslyslow scan rate cyclic voltammetry (CV), electrochemical impedance spectroscopy (EIS) and potentiostaticintermittent titration (PITT). The theme of this work was to study the e�ect of the particle size of thegraphite on the electroanalytical response of these electrodes during intercalation with lithium. At slowenough scan rates, the CV of these electrodes probe mostly the accumulation Ð consumption of lithiumand phase transition between intercalation stages, perturbed by slow kinetics and solid state di�usion.Impedance spectra of these electrodes re¯ect clearly a separation among di�erent time constants whichrelate to migration of Li through surface ®lms, charge transfer, solid state di�usion, and ®nally Ð accumu-lation of Li in the bulk. The di�usion coe�cient of Li in graphite was found to be a peak shaped functionof the potential and the intercalation level. The peaks of ÿlog D vs E, X (X Li in LiXC6) correspond to theCV peaks (which re¯ect phase transitions). The particle size and the solution composition in¯uence verystrongly the resolution of all the above electroanalytical tools in the separation of the various processeswhich occur during intercalation of lithium into graphite. The e�ect of the particle size and the solutioncomposition on the electroanalytical response of these electrodes is discussed. # 1998 Elsevier Science Ltd.All rights reserved
INTRODUCTION
Graphite electrodes are now widely used as anodes
for Li ion (``Rocking Chair'' type) rechargeable bat-teries. The basic function of these electrodes in
these battery systems is their reversible intercala-tion±deintercalation with lithium [1±5]. Major pro-
blems in the use of these electrodes in rechargeablebatteries are their limited stability due to exfoliation
of the weakly-bound graphene planes upon cyclingand relatively low rate of the intercalation process
which limit the current density that graphite anodes
can deliver [6, 7]. It is possible, however, to stabilizegraphite Ð Li anodes by attenuating the surface
chemistry which is developed on them, choosing theappropriate electrolyte solutions [8, 9]. When graph-
ite is polarized to low potentials in polar aprotic Li-salt solutions, it reduces solution species, and sur-
face ®lms which comprise insoluble Li salts are thusprecipitated on the anode surface. In solutions con-
taining ethylene carbonate (EC) or CO2, these sur-
face ®lms are highly passivating and protecting,
allowing smooth migration of Li ions through
them, to the intercalation sites, while screening out
solvent molecules and avoiding undesirable inter-
action between the electrode's active material and
solution species [10, 11].
The overall insertion process of lithium into
graphite is complicated. It includes di�usion of Li
ions in solution phase, their migration through the
surface ®lms covering the graphite particles (which
are ionically conducting and electrically insulating),
solid state di�usion, accumulation Ð consumption
of Li in the bulk (accompanied by a ¯ux of elec-
trons which counterbalance the charge), and ®nally
Ð phase transition among intercalation stages. The
latter two steps (which are basically related to the
thermodynamic behavior of these systems) may be
also perturbed by slow charge transfer kinetics.
Several relaxation techniques have been proposed
for the evaluation of D, among them the potentio-
static and galvanostatic intermittent titration (PITT
and GITT, respectively), and electrochemical impe-
dance spectroscopy (EIS). Using these techniques,
Electrochimica Acta, Vol. 43, Nos 16±17, pp. 2287±2304, 1998# 1998 Elsevier Science Ltd. All rights reserved
Printed in Great Britain0013±4686/98 $19.00+0.00PII: S0013-4686(97)10172-4
*Author to whom correspondence should be addressed.E-mail: [email protected]
2287
the plots of the di�usion coe�cient of lithium ionsvs their intercalation level X (0RXR1) have been
obtained for graphite and other carbonaceousmaterials [12±16]. However, the values of D for thesame materials, reported by di�erent research
groups, may di�er by several orders of magnitude.One of the common di�culties in comparing Dvalues obtained by di�erent groups or with di�erent
samples is the uncertainty in the true cross-sectionalsurface area for the insertion process, which how-ever, should in¯uence the absolute value of D, but
should not signi®cantly distort the D vs X relation-ship. However, it is expected that when di�erenttechniques are applied for studying the di�usionprocess in the same system, their D values would be
similar, although this is not always the case in prac-tice. Thus, it seems that there are problems in thecorrect interpretation of the equations for the deter-
mination of D. In a recent work we studied rigor-ously the Li-graphite intercalation process usingvery thin (0.1±10 mm thick) graphite electrodes in
which the graphite particles were highly oriented(all their basal planes were oriented parallel to thecurrent collector), applying simultaneously slow
scan rate cyclic voltammetry (CV), potentiostaticintermittent titration (PITT) and electrochemicalimpedance spectroscopy (EIS). In these studies wewere able to probe separately several of the major
time constants of the entire intercalation process(e.g. migration of Li ions through surface ®lms,solid state di�usion, accumulation Ð consumption
of Li in the bulk graphite and phasetransition) [17, 18].The coe�cient for solid state di�usion (D) was
found to be a non-monotonous function of E (po-tential) and X (intercalation level, X in LiXC6) witha peak shaped behavior [14]. Interestingly, D vs (E,X) was found to be a function with minima close to
the potentials of the peaks appearing in the slowscan rate cyclic voltammograms.An important consequence of these studies was
that the resolution of the above techniques in theseparation of the time constants of the various pro-cesses that occur in series during the intercalation
process (as explained above), depends very stronglyon the electrode's morphology (in terms of particleorientation and electrode thickness). In the present
work, we extended the same approach to the studyof practical graphite electrodes (about 150 mmthick) of di�erent particle size. The goal of this wasto obtain the electroanalytical ®ngerprint of graph-
ite electrodes in terms of the dependence of theirelectrochemical response (e.g. separation of pro-cesses by CV or EIS, the values of D and its depen-
dence on E and X) on the particle size.
EXPERIMENTAL
Graphite electrodes were prepared as alreadydescribed [8, 9] using a copper grid (Exmet) current
collector, graphite powders from Lonza (the KS
series, 6, 25 and 44 mm average particle size) andpolyvinylidenedi¯uoride (PVDF) binder (10% byweight). The electrodes' thickness was about
150 mm which corresponds to about 12 mg graphiteper cm2. We also prepared graphite particles of ap-proximately 2 mm average size by milling KS-75
graphite particles for 8 h in a ball mill (stainlesssteel). The surface area of these materials as
measured by B.E.T. (Micromeritics, Gemini 2375Instruments) was 10, 13, 18±20 and 42 m2/g for KS-44, KS-25, KS-6 and 2 mm particles, respectively.
The behavior of these electrodes was comparedwith that of thin and ultrathin electrodes (10, 0.1±0.5 mm thick, respectively) comprised of KS-6 par-
ticles which were highly oriented and compactlypacked on the current collector. Their preparationwas described in Refs. [10±12]. In brief, the graphite
particles were very thin ¯akes which were spreadonto the current collector (Cu foil) with the appro-
priate binder (PVDF), followed by polishing with®lter paper. Since the particles were naturally laidout on the current collector with their wide dimen-
sion (the basal planes) parallel to the current collec-tor, the active mass was very soft and the electrodescould be easily polished. Thus, the graphite coating
could become very thin and uniform, as demon-strated by SEM measurements [17].
All the studies of the Li-graphite intercalation±deintercalation processes were performed using amixture of high purity dimethyl carbonate and eth-
ylene carbonate (DMC-EC 3:1 or 1:1 by volume,Tomiyama or Merck) and LiAsF6 or LiPF6 (1 M)as the electrolyte. The amount of water contami-
nation was usually 20 ppm. This solvent mixturewas chosen because as the graphite electrodes are
polarized to low potential in EC-DMC mixture,they become covered by a combination of insoluble(CH2OCO2Li)2 and some Li2CO3 formed by solvent
reduction and LiF from salt reduction, whichtogether form highly stable and passivating surface®lms. These protective layers prevent detrimental in-
teractions between the graphite particles and sol-ution species and thus enable prolonged, reversible
cycling of the Li Ð graphite electrodes. Hence, theintrinsic behavior of the intercalation process couldbe studied without interference by destructive pro-
cesses, which change the graphite structure duringLi±C intercalation.The performance of the electrochemical measure-
ments: slow scan rate CV, PITT and EIS for thesestudies, the relevant electrochemical cells and the
basic data analysis and treatments by the appropri-ate simulation programs, as well as the SEMmeasurements, were all described in previous
publications [17±19]. In brief, potentiostat model273 from EG&G driven by the 270 software (486PC) and the Solartron model 1286 electrochemical
interface and model 1255 frequency response analy-zer driven by the Zplot and Zsim software from
B. Markovsky et al.2288
Scribner Assoc., have been used. All the measure-ments were performed at 25820.58C in thermo-
stats.
RESULTS AND DISCUSSION
The morphology of the electrodes studied and the
cross sectional area of the electrochemical processes
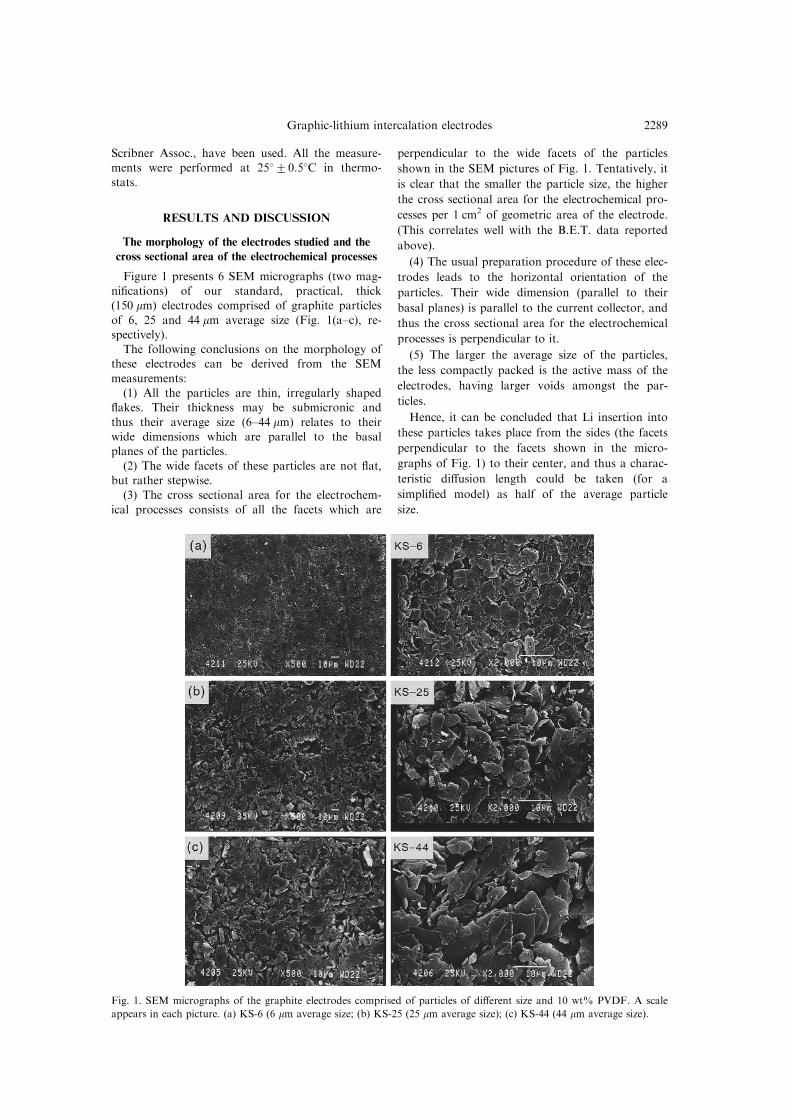
Figure 1 presents 6 SEM micrographs (two mag-ni®cations) of our standard, practical, thick(150 mm) electrodes comprised of graphite particles
of 6, 25 and 44 mm average size (Fig. 1(a±c), re-spectively).The following conclusions on the morphology of
these electrodes can be derived from the SEM
measurements:(1) All the particles are thin, irregularly shaped
¯akes. Their thickness may be submicronic and
thus their average size (6±44 mm) relates to theirwide dimensions which are parallel to the basalplanes of the particles.
(2) The wide facets of these particles are not ¯at,but rather stepwise.(3) The cross sectional area for the electrochem-
ical processes consists of all the facets which are
perpendicular to the wide facets of the particles
shown in the SEM pictures of Fig. 1. Tentatively, it
is clear that the smaller the particle size, the higher
the cross sectional area for the electrochemical pro-
cesses per 1 cm2 of geometric area of the electrode.
(This correlates well with the B.E.T. data reported
above).
(4) The usual preparation procedure of these elec-
trodes leads to the horizontal orientation of the
particles. Their wide dimension (parallel to their
basal planes) is parallel to the current collector, and
thus the cross sectional area for the electrochemical
processes is perpendicular to it.
(5) The larger the average size of the particles,
the less compactly packed is the active mass of the
electrodes, having larger voids amongst the par-
ticles.
Hence, it can be concluded that Li insertion into
these particles takes place from the sides (the facets
perpendicular to the facets shown in the micro-
graphs of Fig. 1) to their center, and thus a charac-
teristic di�usion length could be taken (for a
simpli®ed model) as half of the average particle
size.
Fig. 1. SEM micrographs of the graphite electrodes comprised of particles of di�erent size and 10 wt% PVDF. A scale
appears in each picture. (a) KS-6 (6 mm average size; (b) KS-25 (25 mm average size); (c) KS-44 (44 mm average size).
Graphic-lithium intercalation electrodes 2289
Slow scan CV and impedance spectroscopy
All the data presented below relate to electrodes
which were cycled several times before the actual
measurement. (Completed intercalation±deintercala-
tion cycles within the potential limits 2±0 V vs Li/
Li+). Hence, the protective surface ®lms formed on
these electrodes at the low potentials are fully devel-
oped and reach their steady state stability.
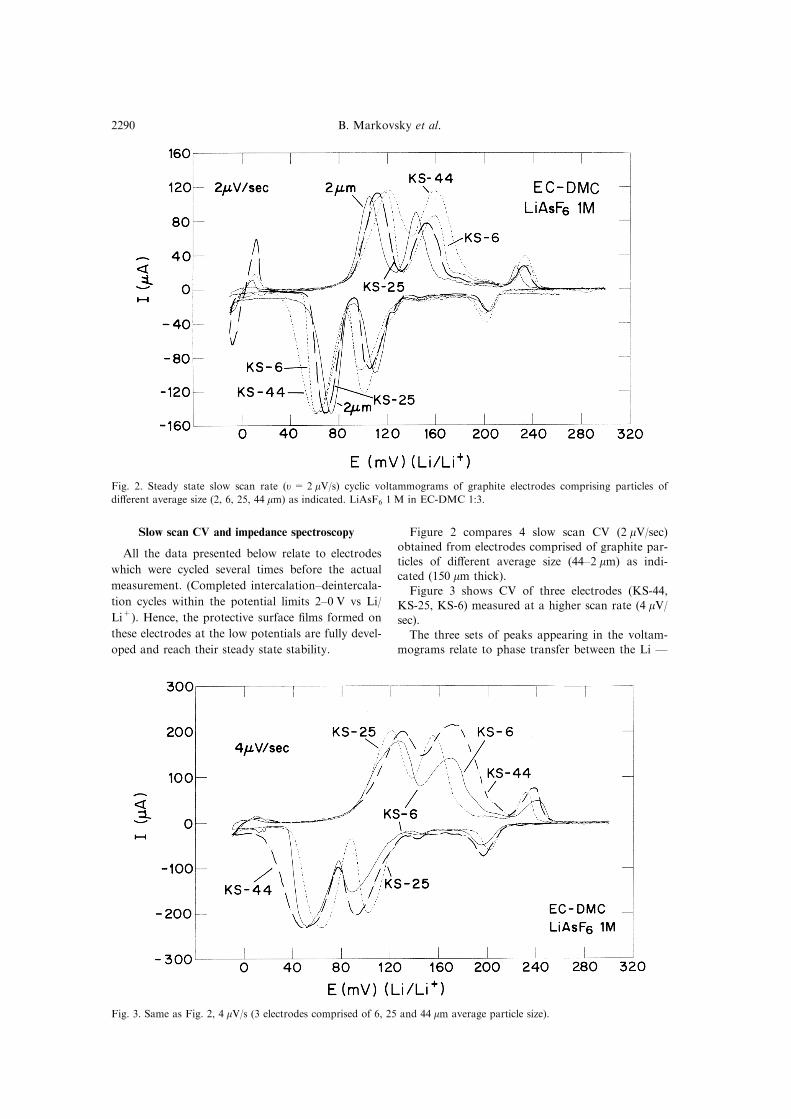
Figure 2 compares 4 slow scan CV (2 mV/sec)obtained from electrodes comprised of graphite par-
ticles of di�erent average size (44±2 mm) as indi-
cated (150 mm thick).
Figure 3 shows CV of three electrodes (KS-44,
KS-25, KS-6) measured at a higher scan rate (4 mV/sec).
The three sets of peaks appearing in the voltam-
mograms relate to phase transfer between the Li Ð
Fig. 2. Steady state slow scan rate (u = 2 mV/s) cyclic voltammograms of graphite electrodes comprising particles of
di�erent average size (2, 6, 25, 44 mm) as indicated. LiAsF6 1 M in EC-DMC 1:3.
Fig. 3. Same as Fig. 2, 4 mV/s (3 electrodes comprised of 6, 25 and 44 mm average particle size).
B. Markovsky et al.2290

graphite intercalation stages, as was documented
and reported earlier [20, 21]. In brief, the cathodic
peaks around 200, 110 and 60±70 mV vs Li/Li+
correspond to diluted stage I4 stage IV, stage
III4 stage II and stage II 4 stage I transitions, re-
spectively (Li insertion), whereas the anodic peaksaround 240, 160 and 120 mV vs Li/Li+ are their
corresponding reverse transitions, respectively (Li
deintercalation) [1, 17±22].
Both the particle size and the scan rate have a
strong e�ect on the shape and the potential separ-ation between the corresponding peaks. In general,
the smaller the particle size and the slower the scan
rate (at constant thickness of the electrodes), thesharper and narrower are the peaks, and the hyster-
esis Ð i.e. the potential di�erence between the cor-
responding intercalation±deintercalation peaks is
smaller.
As already discussed [22], for a typical, thin(10 mm) graphite electrode, a linear dependence of
the CV peak currents (Ip) on the scan rate (u) is
expected, whereas for di�usion controlled processes,Ip should depend linearly on
���up
.
For all the electrodes and the scan rates used(r2 mV/sec), and for all the three sets of peaks
appearing in the voltammograms (Figs 2 and 3),
plotting Ip vs���up
provided a better linear corre-lation (with Ip40 at u4 0) than plots of Ip vs u. Atypical example is demonstrated in Fig. 4 (150 mmthick electrodes). Usually, the correlation coe�cient
for linear ®tting of Ip vs���up
plots for these electro-des ranged around 0.97±0.99, while the same coe�-
cient for Ip vs u plots was scattered in the 0.83±0.93
range.
It should be noted that thinner graphite electro-des (e.g., KS-6, <10 mm thick) behave di�erently
from the practical, thick electrodes in the following
aspects:
(1) The CV peaks measured with the thin electro-
des are narrower, sharper and better resolved for allscan rates than those related to the practical thick
electrodes.
(2) Up to scan rates of about 15±20 mV/s, Ip vs ufor the thin electrodes is a linear function of u.Only at u>15±20 mV/s, Ip becomes linear with
���up
.Typical data from the thin electrodes are presented
elsewhere [22]. Hence, it can be concluded that
when thin electrodes are used, the cyclic voltammo-grams at slow enough scan rates probe intercalation
processes which are nearly thermodynamically con-
trolled, whereas the CV of the practical thick elec-
trodes, probe processes which are basically di�usionand/or kinetically controlled, no matter how slow
the scan rate is.
Figure 5 shows three families of typical Nyquist
plots obtained from KS-44, KS-25 and KS-6 elec-trodes during the course of the intercalation process
at di�erent potentials, as indicated. It should be
emphasized that all the measurements relate to
equilibrium potentials (under an OCV condition)after the electrodes are cycled galvanostatically 4
times, showing fully reversible behavior. Hence, the
spectra in this ®gure are highly reproducible andrepresentative of the impedance behavior of these
electrodes.
Figures 6 and 7 compare impedance spectra
measured from KS-6, KS-25 and KS-44 electrodes
(indicated) at potentials 0.2 and 0.04 V vs Li/Li+
during intercalation (Figs 6 and 7, respectively). In
addition, Figs 6 and 7 show typical impedance spec-
tra measured using the same solution, from thin(10 mm thick) and ultrathin (0.5±0.1 mm thick) KS-6
Fig. 4. Typical plots of Ip vs u (upper X axis) and Ip vs���up
(lower X axis) for the slow scan rate CV peak currents related
to the Li voltammetric peak of the stage II4 stage I transition (around 50±80 mV vs Li/Li+). Data for electrodes
150 mm thick of 3 di�erent particle sizes (6, 25, 44 mm) are compared as indicated.
Graphic-lithium intercalation electrodes 2291
electrodes at close potentials. The original impe-dance values (Z', Z0) measured with the thin elec-
trodes are much higher than those related to the
thick electrodes (of the same geometric area)
because of their much smaller cross sectional areafor the electrochemical processes (as compared with
the practical, thick electrodes). Hence, in order to
compare the spectra of the thin electrodes with
those of the thick ones, and thus then display them
on a similar scale, it was necessary to normalize thespectra of the thin and ultrathin electrodes in
respect to the thick ones.
As discussed in previous papers [17, 18], the scal-
ing factor for the impedance of electrodes of di�er-
ent active mass should be inversely proportional to
the total cross sectional area of the electrochemicalprocesses. As explained in the previous section, the
cross sectional area for the electrochemical pro-
cesses of these electrodes is directly proportional to
their mass. Therefore, the scaling factor for the
impedance spectra measured for the above di�erentelectrodes is simply their mass ratio. Hence, the Z',
Z0 values related to the ultrathin and thin electro-des which contain a small amount of active mass
were multiplied by the mthin (or ultrathin)mthick factor.
Thus, all the impedance spectra of Figs 5±7 are
compared properly on the same scale.
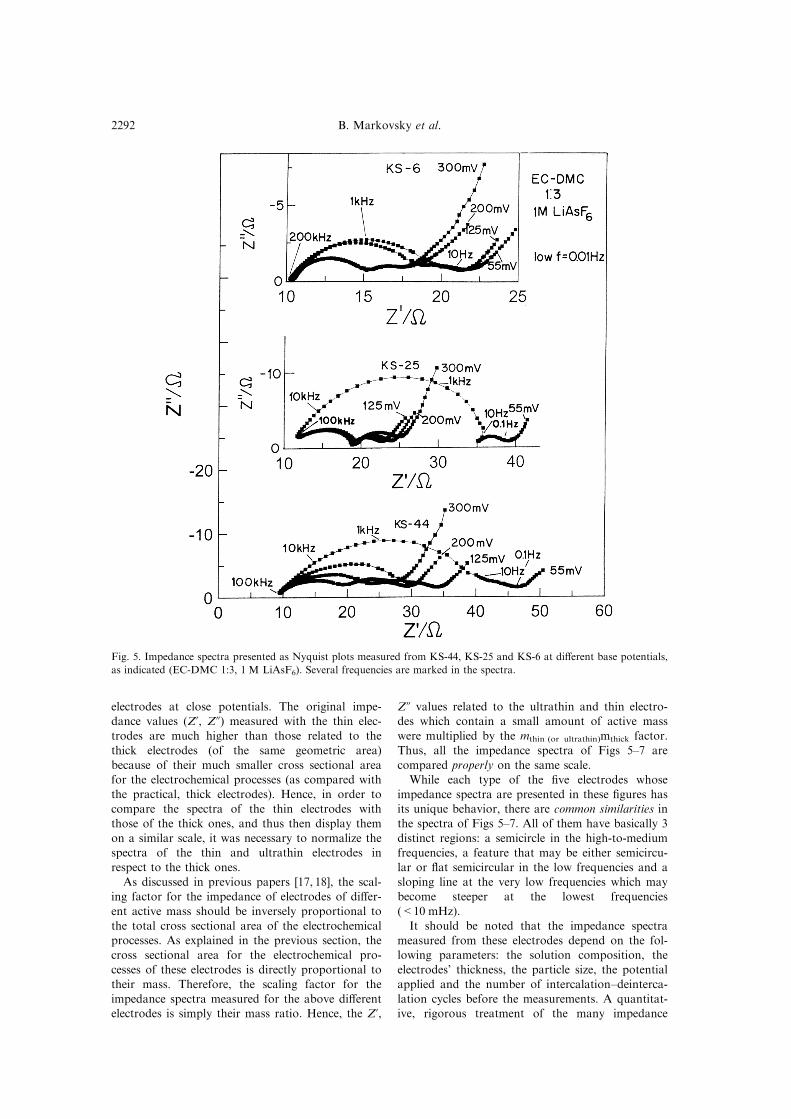
While each type of the ®ve electrodes whose
impedance spectra are presented in these ®gures hasits unique behavior, there are common similarities in
the spectra of Figs 5±7. All of them have basically 3
distinct regions: a semicircle in the high-to-medium
frequencies, a feature that may be either semicircu-lar or ¯at semicircular in the low frequencies and a
sloping line at the very low frequencies which may
become steeper at the lowest frequencies
(<10 mHz).
It should be noted that the impedance spectra
measured from these electrodes depend on the fol-lowing parameters: the solution composition, the
electrodes' thickness, the particle size, the potential
applied and the number of intercalation±deinterca-
lation cycles before the measurements. A quantitat-ive, rigorous treatment of the many impedance
Fig. 5. Impedance spectra presented as Nyquist plots measured from KS-44, KS-25 and KS-6 at di�erent base potentials,
as indicated (EC-DMC 1:3, 1 M LiAsF6). Several frequencies are marked in the spectra.
B. Markovsky et al.2292
spectra measured from the electrodes within theframework of this study is thus very complicated
and beyond the scope of this work. However, sinceall of these spectra have the above features, com-
parison of spectra measured from electrodes ofdi�erent structure (thickness, particle size and mor-phology) may lead to several qualitative and im-
portant conclusions, as discussed below. Typical,common behavior to all these electrodes is a pro-
nounced increase in the size of the high frequencysemicircle, as the electrodes reach the low intercala-
tion potentials which correspond to the stageII4 stage I transition. The behavior shown in
Fig. 5, however, is fully reversible, and upon dein-tercalation, as the potential increases, the electrode's
impedance changes accordingly. (Hence, the diam-eter of this semicircle decreases at higher poten-
tials). The explanation for the increase in theelectrodes' impedance at the low potentials mayrelate to complicated interfacial phenomena of the
graphite-surface ®lm interphase, and is beyond thescope of this work. At the moment, we can specu-
late that it is connected with an increase in the Liion concentration in the graphite side which slows
down the rate of Li ion migration through the sur-face ®lms because of a decrease in the potentialdrop across the graphite/®lm/solution interfaces.
As demonstrated in Figs 5±7, both the imaginary
and the real components of the electrode's impe-dance (Z', Z0, respectively), are the largest for theKS-44 and the smallest for the KS-6 electrodes,
while the values for the KS-25 electrodes are in-between.
As already discussed [17, 18], since the intercala-tion process takes place between the basal planes of
the graphite particles, the cross sectional area forall the processes relevant to each particle (including
Li+ migration through the surface ®lms, solid statedi�usion and accumulation of Li in the bulk of the
active mass) is an envelope of facets perpendicularto the basal planes. Hence, the smaller the particle
size, the higher the ratio between the surface areaand the volume (and mass) of each particle. Thus,for electrodes of the same mass, the smaller the par-
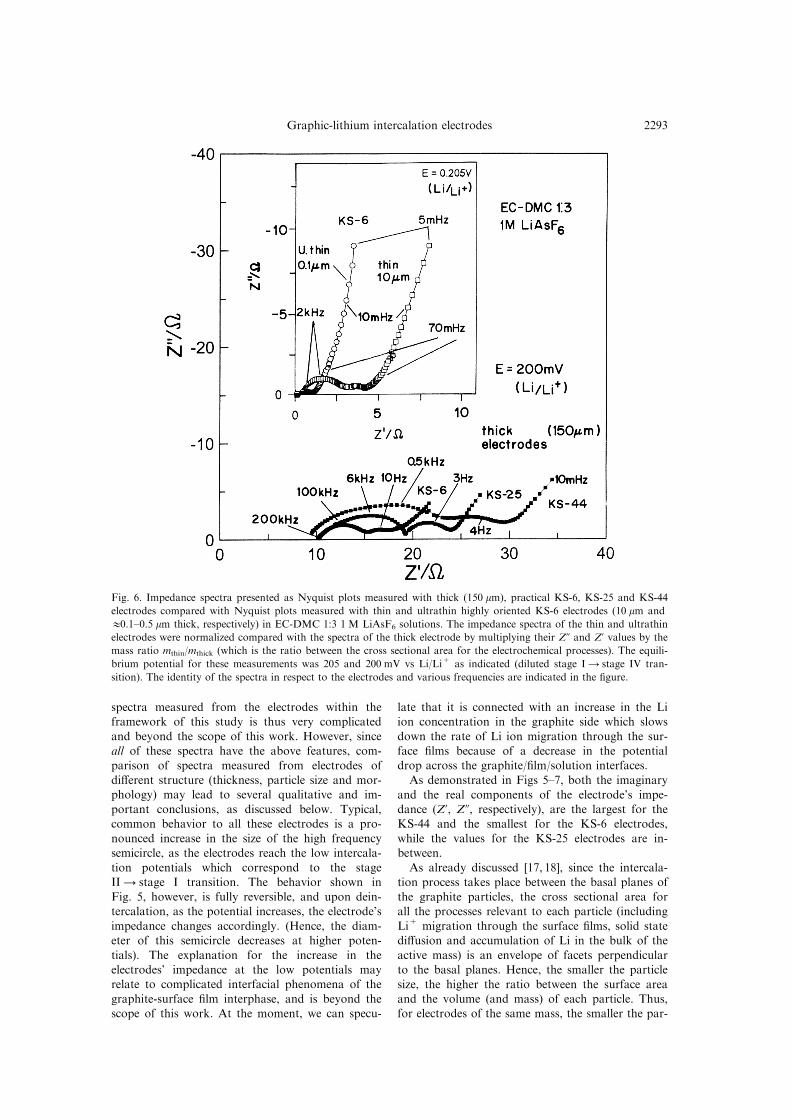
Fig. 6. Impedance spectra presented as Nyquist plots measured with thick (150 mm), practical KS-6, KS-25 and KS-44
electrodes compared with Nyquist plots measured with thin and ultrathin highly oriented KS-6 electrodes (10 mm and
10.1±0.5 mm thick, respectively) in EC-DMC 1:3 1 M LiAsF6 solutions. The impedance spectra of the thin and ultrathin
electrodes were normalized compared with the spectra of the thick electrode by multiplying their Z0 and Z' values by the
mass ratio mthin/mthick (which is the ratio between the cross sectional area for the electrochemical processes). The equili-
brium potential for these measurements was 205 and 200 mV vs Li/Li+ as indicated (diluted stage I4 stage IV tran-
sition). The identity of the spectra in respect to the electrodes and various frequencies are indicated in the ®gure.
Graphic-lithium intercalation electrodes 2293
ticle size, the higher the total cross sectional area of
the electrode (per unit geometric area).
Since the total electrode's resistance for each pro-cess is inversely proportional to its cross sectional
area, the smaller the particle size, the smaller the
electrode's impedance, as indeed demonstrated in
Figs 5±7. However, the impedance of the KS-44,KS-25 and KS-6 electrodes do not di�er only by
their magnitude, but also by their shape.
For most of the potentials, the proportional size
of the low frequency semicircles appearing in theNyquist plots (as compared with the other features
in each spectrum) is in the order KS-44>KS-
25>KS-6 (Fig. 5).
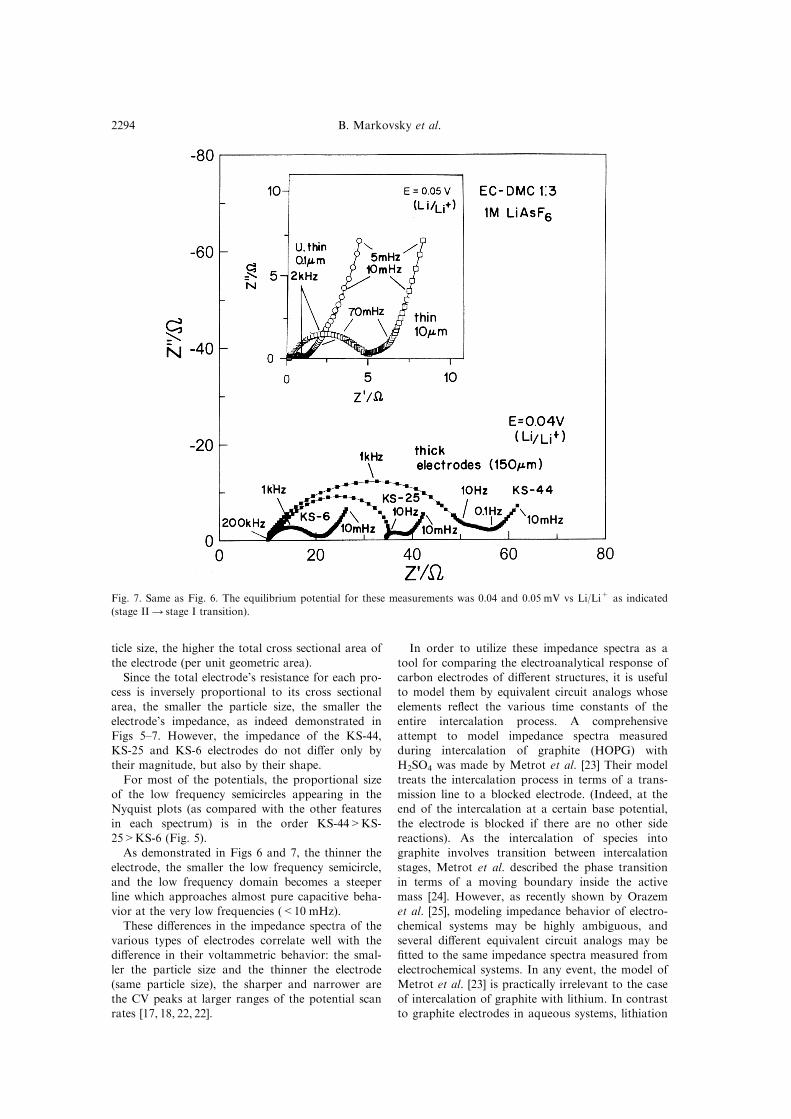
As demonstrated in Figs 6 and 7, the thinner the
electrode, the smaller the low frequency semicircle,and the low frequency domain becomes a steeper
line which approaches almost pure capacitive beha-
vior at the very low frequencies (<10 mHz).
These di�erences in the impedance spectra of the
various types of electrodes correlate well with thedi�erence in their voltammetric behavior: the smal-
ler the particle size and the thinner the electrode
(same particle size), the sharper and narrower are
the CV peaks at larger ranges of the potential scanrates [17, 18, 22, 22].
In order to utilize these impedance spectra as a
tool for comparing the electroanalytical response ofcarbon electrodes of di�erent structures, it is useful
to model them by equivalent circuit analogs whose
elements re¯ect the various time constants of the
entire intercalation process. A comprehensive
attempt to model impedance spectra measuredduring intercalation of graphite (HOPG) with
H2SO4 was made by Metrot et al. [23] Their model
treats the intercalation process in terms of a trans-
mission line to a blocked electrode. (Indeed, at theend of the intercalation at a certain base potential,
the electrode is blocked if there are no other side
reactions). As the intercalation of species into
graphite involves transition between intercalation
stages, Metrot et al. described the phase transitionin terms of a moving boundary inside the active
mass [24]. However, as recently shown by Orazem
et al. [25], modeling impedance behavior of electro-
chemical systems may be highly ambiguous, and
several di�erent equivalent circuit analogs may be®tted to the same impedance spectra measured from
electrochemical systems. In any event, the model of
Metrot et al. [23] is practically irrelevant to the case
of intercalation of graphite with lithium. In contrastto graphite electrodes in aqueous systems, lithiation
Fig. 7. Same as Fig. 6. The equilibrium potential for these measurements was 0.04 and 0.05 mV vs Li/Li+ as indicated
(stage II4 stage I transition).
B. Markovsky et al.2294
of graphite in aprotic systems involves the for-
mation of surface ®lms which contribute to the elec-trode impedance pronounced resistive elements,
which relate to the Li+ ion migration through the
surface layers and to the electrical contact amongstthe graphite particles.
In a recent paper we discussed models for
blocked, intercalation/redox electrodes and selecteda model for the lithiated graphite electrodes [17].
Since all the various processes of these electrodes
in the course of the entire intercalation process aresequential, a reasonable equivalent circuit analog
which can simulate the electrochemical behavior of
these electrodes should include various elements inseries.
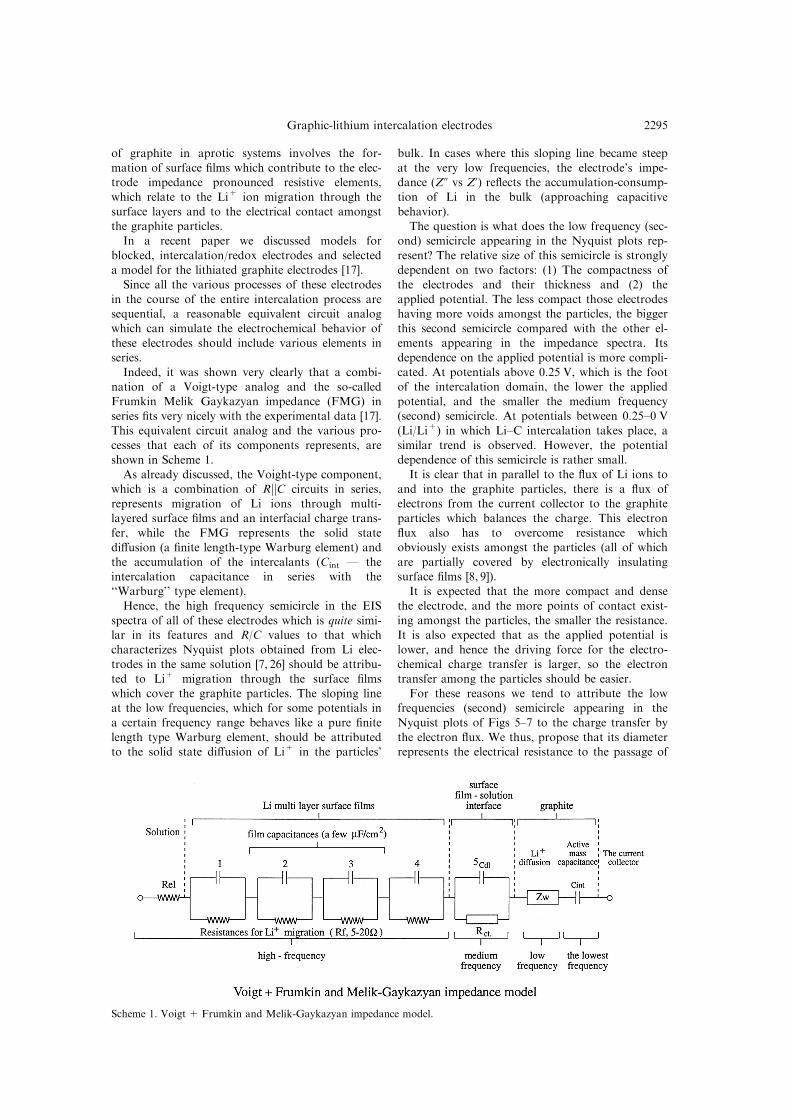
Indeed, it was shown very clearly that a combi-
nation of a Voigt-type analog and the so-calledFrumkin Melik Gaykazyan impedance (FMG) in
series ®ts very nicely with the experimental data [17].This equivalent circuit analog and the various pro-
cesses that each of its components represents, are
shown in Scheme 1.
As already discussed, the Voight-type component,which is a combination of R6C circuits in series,
represents migration of Li ions through multi-layered surface ®lms and an interfacial charge trans-
fer, while the FMG represents the solid state
di�usion (a ®nite length-type Warburg element) andthe accumulation of the intercalants (Cint Ð the
intercalation capacitance in series with the``Warburg'' type element).
Hence, the high frequency semicircle in the EIS
spectra of all of these electrodes which is quite simi-lar in its features and R/C values to that which
characterizes Nyquist plots obtained from Li elec-
trodes in the same solution [7, 26] should be attribu-ted to Li+ migration through the surface ®lms
which cover the graphite particles. The sloping lineat the low frequencies, which for some potentials in
a certain frequency range behaves like a pure ®nite
length type Warburg element, should be attributedto the solid state di�usion of Li+ in the particles'
bulk. In cases where this sloping line became steep
at the very low frequencies, the electrode's impe-dance (Z0 vs Z') re¯ects the accumulation-consump-
tion of Li in the bulk (approaching capacitive
behavior).
The question is what does the low frequency (sec-ond) semicircle appearing in the Nyquist plots rep-
resent? The relative size of this semicircle is stronglydependent on two factors: (1) The compactness of
the electrodes and their thickness and (2) the
applied potential. The less compact those electrodeshaving more voids amongst the particles, the bigger
this second semicircle compared with the other el-ements appearing in the impedance spectra. Its
dependence on the applied potential is more compli-
cated. At potentials above 0.25 V, which is the footof the intercalation domain, the lower the applied
potential, and the smaller the medium frequency(second) semicircle. At potentials between 0.25±0 V
(Li/Li+) in which Li±C intercalation takes place, a
similar trend is observed. However, the potentialdependence of this semicircle is rather small.
It is clear that in parallel to the ¯ux of Li ions to
and into the graphite particles, there is a ¯ux ofelectrons from the current collector to the graphite
particles which balances the charge. This electron
¯ux also has to overcome resistance whichobviously exists amongst the particles (all of which
are partially covered by electronically insulatingsurface ®lms [8, 9]).
It is expected that the more compact and dense
the electrode, and the more points of contact exist-ing amongst the particles, the smaller the resistance.
It is also expected that as the applied potential is
lower, and hence the driving force for the electro-chemical charge transfer is larger, so the electron
transfer among the particles should be easier.
For these reasons we tend to attribute the lowfrequencies (second) semicircle appearing in the
Nyquist plots of Figs 5±7 to the charge transfer by
the electron ¯ux. We thus, propose that its diameterrepresents the electrical resistance to the passage of
Scheme 1. Voigt + Frumkin and Melik-Gaykazyan impedance model.
Graphic-lithium intercalation electrodes 2295
electrons to the active mass (graphite particles).
Indeed, for the thinnest and the most compact
ultrathin electrodes, this semicircle scarcely exists.
As the electrodes are thicker, and thus less com-pact, their electronic resistance is expected to be
more pronounced. Hence, this second semicircle is
expected to be bigger, as is indeed clearly demon-strated in Figs 5±7.
The same arguments can be put forward when
comparing the electrochemical behavior of the KS-
6, KS-25 and KS-44 electrodes. It is expected thatfor the smaller particle size, the electrical contacts
among the particles should be better (see also the
di�erence in the compactness of these electrodes asshown in Fig. 1).
Based on this understanding, it is possible to
explain the di�erence in the impedance spectra of
the various electrodes in the low frequency domain.As the electrodes are better packed, more compact,
and thus contain less voids, it is expected that the
surface ®lms precipitating on the electrode's surfaceand amongst the particles should also be more com-
pact and provide better passivation. Hence, the
possible continuous reduction of solution species inparallel to the intercalation process should be less
important. The less pronounced these parasitic reac-
tions, the more distinctive and clear the low fre-
quency capacitive behavior of the electrode.
As demonstrated in Figs 5±7, for the ultrathinand thin electrodes whose particles are highly
oriented [17, 18] and compactly packed, the low fre-
quency impedance is indeed nearly capacitive, whilefor the thick, practical electrodes, the Z0 vs Z'
curves slope even at the lowest frequencies due to
the fact that the accumulation±consumption (®nal)
step of the intercalation is perturbed by some paral-lel faradaic processes. Thereby, the thick lithiated
graphite electrodes can not be regarded as blocked
electrodes and they deserve modeling which relatemore to Li electrodes [26] rather than to blocked
electrodes [23].
The above picture which emerges from the EIS
studies correlates very well with that obtained from
the slow scan CV of these electrodes. The peaks inFigs 2 and 3 belong to the ®nal step of the interca-
lation and thus re¯ect mostly the Li accumulation
and the phase transition. Hence, when the scanrates are su�ciently slow, the more purely capaci-
tive the low frequency behavior of the electrode's
impedance, the sharper, narrower and better separ-ated are the CV peaks Ð at a wider range of poten-
tial scan rates (as indeed shown in Figs 2 and 3 and
Refs. [10±12, 14]).
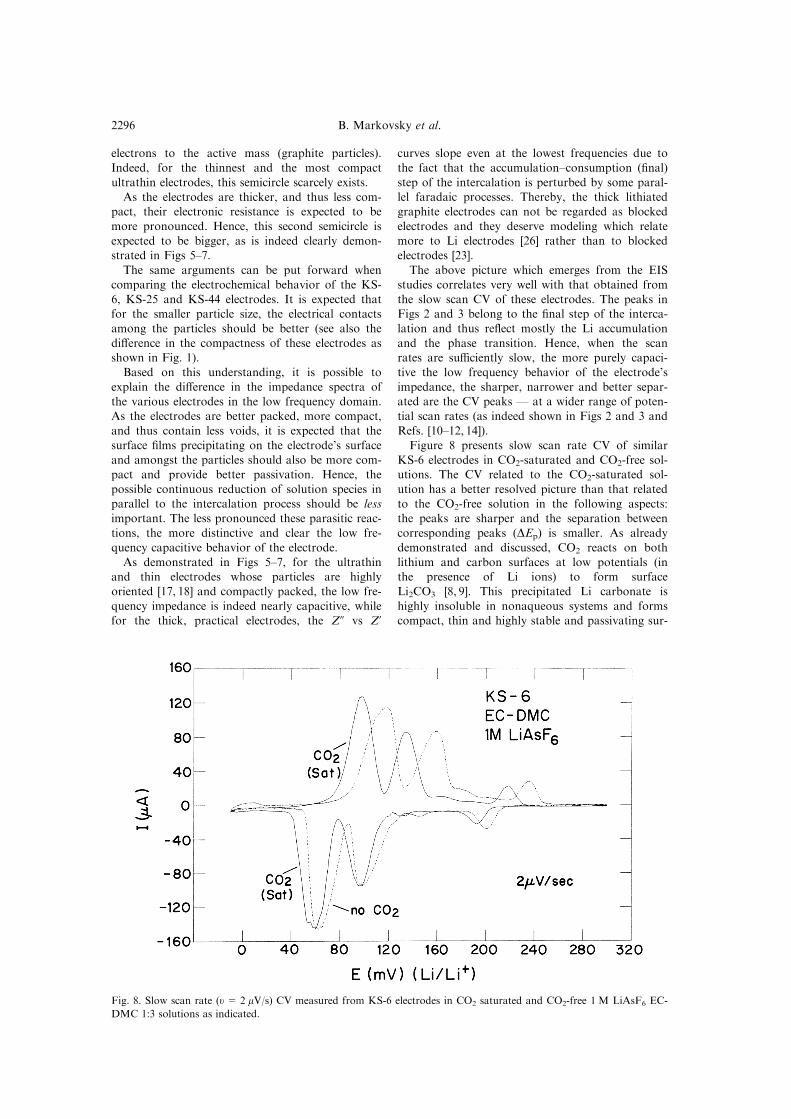
Figure 8 presents slow scan rate CV of similar
KS-6 electrodes in CO2-saturated and CO2-free sol-utions. The CV related to the CO2-saturated sol-
ution has a better resolved picture than that related
to the CO2-free solution in the following aspects:the peaks are sharper and the separation between
corresponding peaks (DEp) is smaller. As already
demonstrated and discussed, CO2 reacts on both
lithium and carbon surfaces at low potentials (inthe presence of Li ions) to form surface
Li2CO3 [8, 9]. This precipitated Li carbonate is
highly insoluble in nonaqueous systems and formscompact, thin and highly stable and passivating sur-
Fig. 8. Slow scan rate (u= 2 mV/s) CV measured from KS-6 electrodes in CO2 saturated and CO2-free 1 M LiAsF6 EC-
DMC 1:3 solutions as indicated.
B. Markovsky et al.2296
face ®lms which are also very good Li ion
conductors [10, 11].
Indeed, the high frequency semicircles in theNyquist plots obtained from graphite and Li elec-
trodes in CO2 containing solution (which re¯ectsthe Li+ migration through the surface ®lms as dis-
cussed above), is relatively small (low interfacial re-
sistance).The e�cient passivation by Li2CO3 in the CO2-
saturated solutions prevents side faradaic reactions
and thereby the slow scan rate cyclic voltammo-grams measured from these electrodes (Fig. 8)
re¯ect mostly the accumulation±consumption stepof the intercalation without any pronounced pertur-
bation by side reactions.
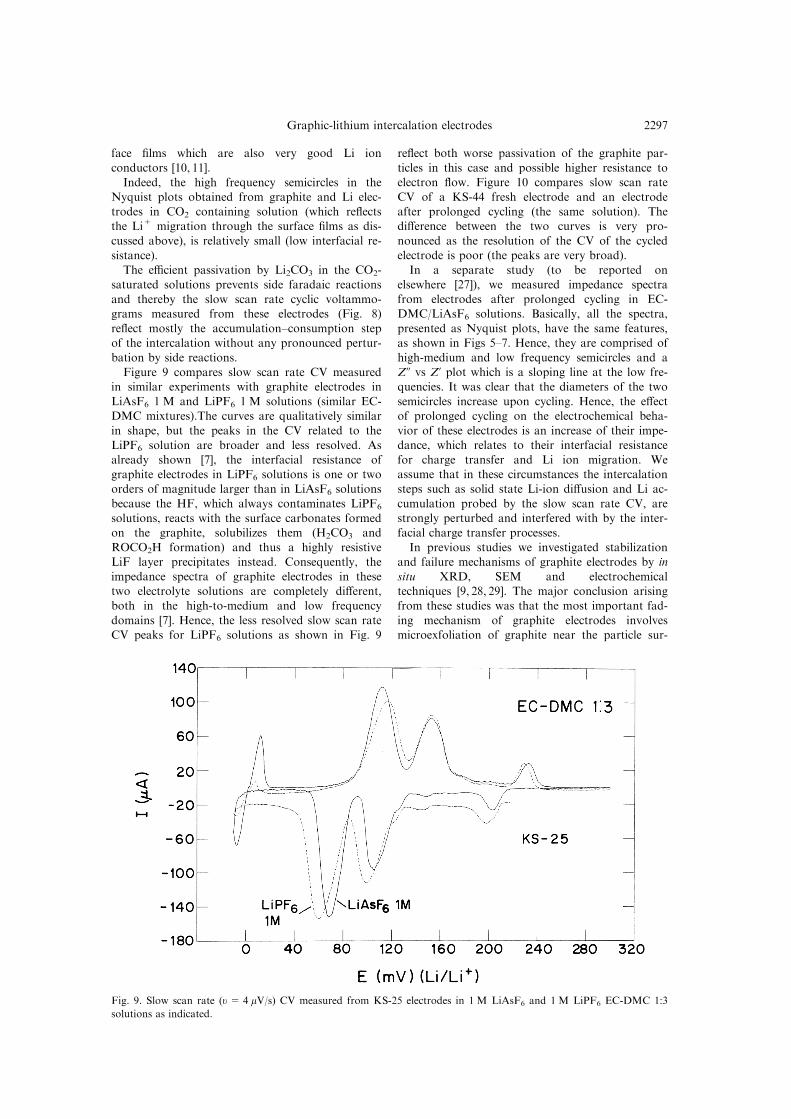
Figure 9 compares slow scan rate CV measuredin similar experiments with graphite electrodes in
LiAsF6 1 M and LiPF6 1 M solutions (similar EC-DMC mixtures).The curves are qualitatively similar
in shape, but the peaks in the CV related to the
LiPF6 solution are broader and less resolved. Asalready shown [7], the interfacial resistance of
graphite electrodes in LiPF6 solutions is one or twoorders of magnitude larger than in LiAsF6 solutions
because the HF, which always contaminates LiPF6
solutions, reacts with the surface carbonates formedon the graphite, solubilizes them (H2CO3 and
ROCO2H formation) and thus a highly resistiveLiF layer precipitates instead. Consequently, the
impedance spectra of graphite electrodes in thesetwo electrolyte solutions are completely di�erent,
both in the high-to-medium and low frequency
domains [7]. Hence, the less resolved slow scan rateCV peaks for LiPF6 solutions as shown in Fig. 9
re¯ect both worse passivation of the graphite par-
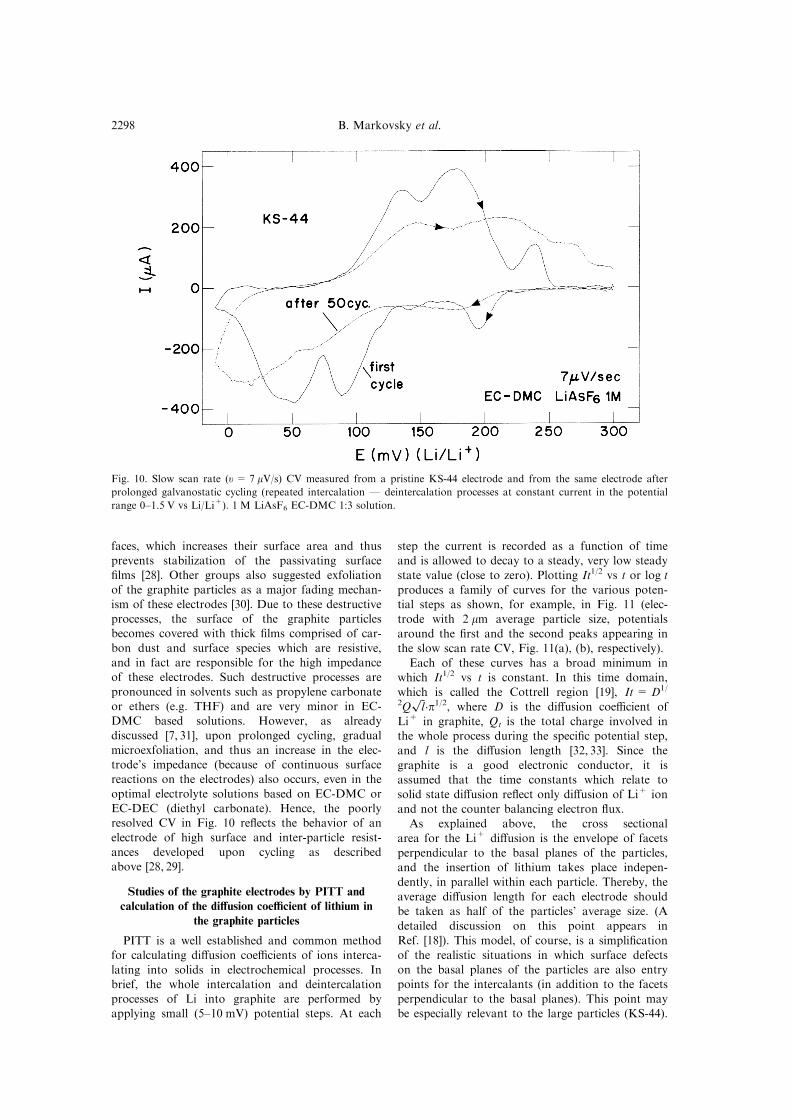
ticles in this case and possible higher resistance toelectron ¯ow. Figure 10 compares slow scan rate
CV of a KS-44 fresh electrode and an electrode
after prolonged cycling (the same solution). Thedi�erence between the two curves is very pro-
nounced as the resolution of the CV of the cycledelectrode is poor (the peaks are very broad).
In a separate study (to be reported on
elsewhere [27]), we measured impedance spectrafrom electrodes after prolonged cycling in EC-
DMC/LiAsF6 solutions. Basically, all the spectra,
presented as Nyquist plots, have the same features,as shown in Figs 5±7. Hence, they are comprised of
high-medium and low frequency semicircles and aZ0 vs Z' plot which is a sloping line at the low fre-
quencies. It was clear that the diameters of the two
semicircles increase upon cycling. Hence, the e�ectof prolonged cycling on the electrochemical beha-
vior of these electrodes is an increase of their impe-dance, which relates to their interfacial resistance
for charge transfer and Li ion migration. Weassume that in these circumstances the intercalation
steps such as solid state Li-ion di�usion and Li ac-
cumulation probed by the slow scan rate CV, arestrongly perturbed and interfered with by the inter-
facial charge transfer processes.
In previous studies we investigated stabilizationand failure mechanisms of graphite electrodes by in
situ XRD, SEM and electrochemicaltechniques [9, 28, 29]. The major conclusion arising
from these studies was that the most important fad-
ing mechanism of graphite electrodes involvesmicroexfoliation of graphite near the particle sur-
Fig. 9. Slow scan rate (u = 4 mV/s) CV measured from KS-25 electrodes in 1 M LiAsF6 and 1 M LiPF6 EC-DMC 1:3
solutions as indicated.
Graphic-lithium intercalation electrodes 2297
faces, which increases their surface area and thusprevents stabilization of the passivating surface®lms [28]. Other groups also suggested exfoliationof the graphite particles as a major fading mechan-
ism of these electrodes [30]. Due to these destructiveprocesses, the surface of the graphite particlesbecomes covered with thick ®lms comprised of car-
bon dust and surface species which are resistive,and in fact are responsible for the high impedanceof these electrodes. Such destructive processes are
pronounced in solvents such as propylene carbonateor ethers (e.g. THF) and are very minor in EC-DMC based solutions. However, as already
discussed [7, 31], upon prolonged cycling, gradualmicroexfoliation, and thus an increase in the elec-trode's impedance (because of continuous surfacereactions on the electrodes) also occurs, even in the
optimal electrolyte solutions based on EC-DMC orEC-DEC (diethyl carbonate). Hence, the poorlyresolved CV in Fig. 10 re¯ects the behavior of an
electrode of high surface and inter-particle resist-ances developed upon cycling as describedabove [28, 29].
Studies of the graphite electrodes by PITT and
calculation of the di�usion coe�cient of lithium in
the graphite particles
PITT is a well established and common methodfor calculating di�usion coe�cients of ions interca-
lating into solids in electrochemical processes. Inbrief, the whole intercalation and deintercalationprocesses of Li into graphite are performed byapplying small (5±10 mV) potential steps. At each
step the current is recorded as a function of timeand is allowed to decay to a steady, very low steady
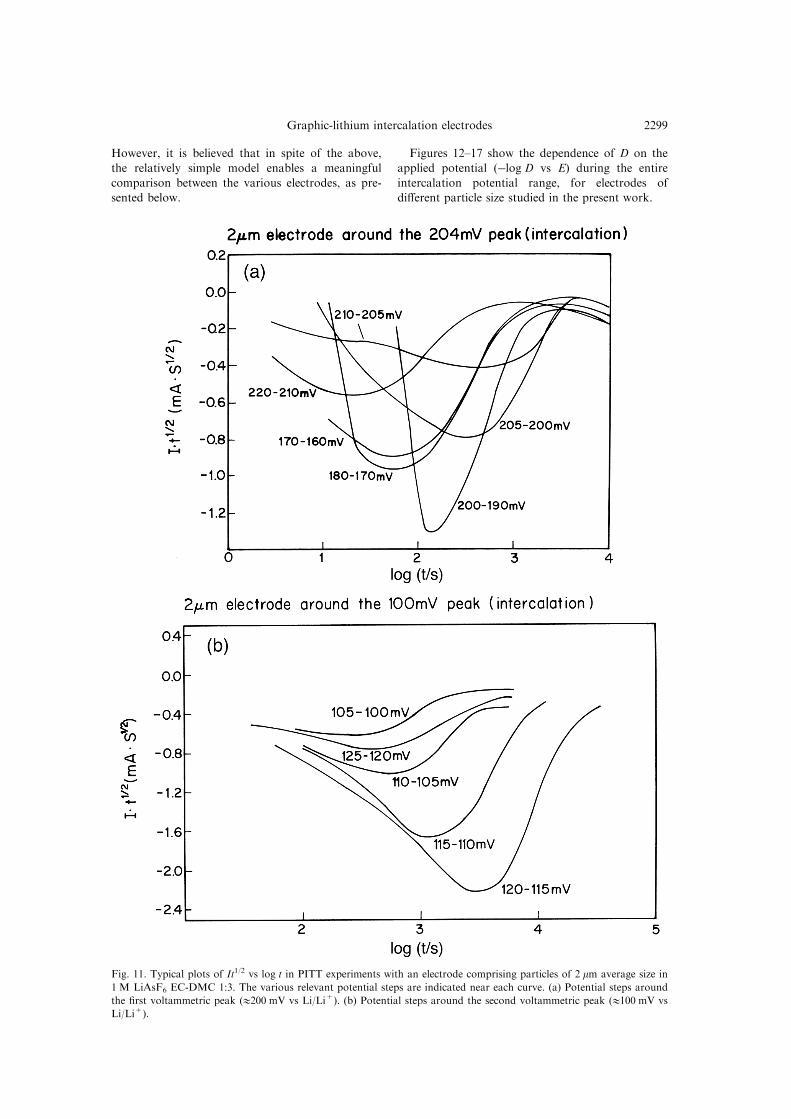
state value (close to zero). Plotting It1/2 vs t or log t
produces a family of curves for the various poten-tial steps as shown, for example, in Fig. 11 (elec-
trode with 2 mm average particle size, potentials
around the ®rst and the second peaks appearing in
the slow scan rate CV, Fig. 11(a), (b), respectively).
Each of these curves has a broad minimum inwhich It1/2 vs t is constant. In this time domain,
which is called the Cottrell region [19], It= D1/
2Q��lp �p1/2, where D is the di�usion coe�cient of
Li+ in graphite, Qt is the total charge involved inthe whole process during the speci®c potential step,
and l is the di�usion length [32, 33]. Since the
graphite is a good electronic conductor, it isassumed that the time constants which relate to
solid state di�usion re¯ect only di�usion of Li+ ion
and not the counter balancing electron ¯ux.
As explained above, the cross sectional
area for the Li+ di�usion is the envelope of facets
perpendicular to the basal planes of the particles,and the insertion of lithium takes place indepen-
dently, in parallel within each particle. Thereby, the
average di�usion length for each electrode shouldbe taken as half of the particles' average size. (A
detailed discussion on this point appears in
Ref. [18]). This model, of course, is a simpli®cation
of the realistic situations in which surface defectson the basal planes of the particles are also entry
points for the intercalants (in addition to the facets
perpendicular to the basal planes). This point maybe especially relevant to the large particles (KS-44).
Fig. 10. Slow scan rate (u= 7 mV/s) CV measured from a pristine KS-44 electrode and from the same electrode after
prolonged galvanostatic cycling (repeated intercalation Ð deintercalation processes at constant current in the potential
range 0±1.5 V vs Li/Li+). 1 M LiAsF6 EC-DMC 1:3 solution.
B. Markovsky et al.2298
However, it is believed that in spite of the above,
the relatively simple model enables a meaningful
comparison between the various electrodes, as pre-
sented below.
Figures 12±17 show the dependence of D on the
applied potential (ÿlog D vs E) during the entire
intercalation potential range, for electrodes of
di�erent particle size studied in the present work.
Fig. 11. Typical plots of It1/2 vs log t in PITT experiments with an electrode comprising particles of 2 mm average size in
1 M LiAsF6 EC-DMC 1:3. The various relevant potential steps are indicated near each curve. (a) Potential steps around
the ®rst voltammetric peak (1200 mV vs Li/Li+). (b) Potential steps around the second voltammetric peak (1100 mV vs
Li/Li+).
Graphic-lithium intercalation electrodes 2299
Figures 12 and 13, relating to electrodes of 2 and
44 mm particle size (respectively), present ÿlog D vs
E for both the intercalation and deintercalationprocesses.
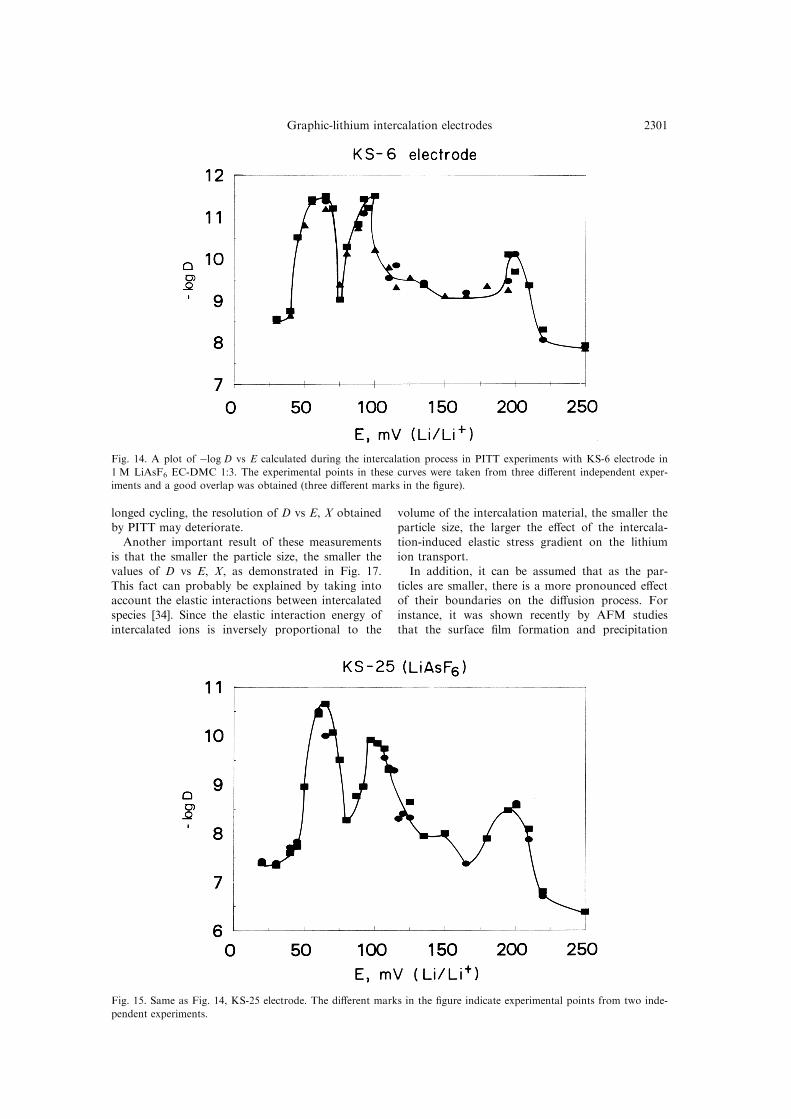
Figure 14 presents ÿlog D vs E obtained in three
di�erent independent sets of measurements for the
KS-6 electrode.
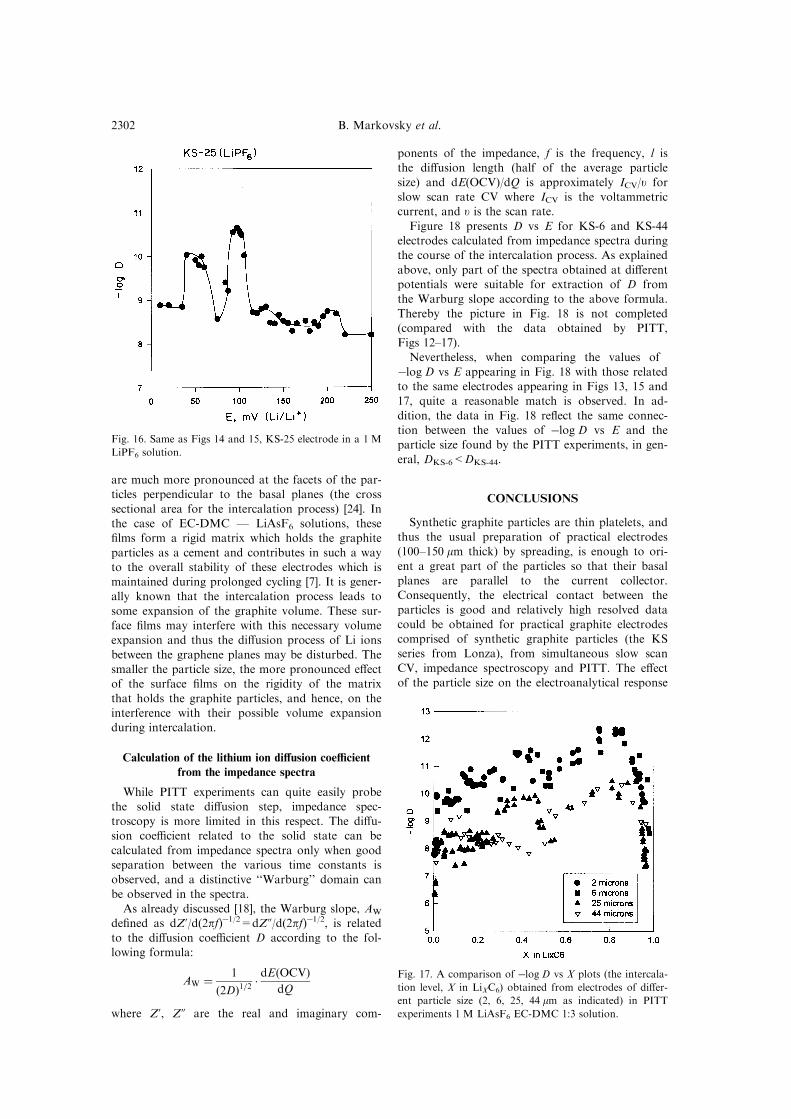
Figures 15 and 16, relating to KS-25 electrodes,
compare ÿlog D vs E for LiAsF6 and LiPF6 sol-utions in EC-DMC (respectively). Finally, Fig. 17
compares plots in the same chart ÿlog D vs X (the
intercalation level, X in LiXC6) for the four types ofelectrodes (particle size ranges from 2 to 44 mm as
indicated) calculated during the entire intercalation
process (0 < 1) of Li into graphite in LiAsF6 1 Msolutions. The data presented in Figs 12±17 may be
summarized as follows:
ÿLog D vs X and E is a non-monotonous func-
tion. It has minima at potentials and intercalation
level (x in LiXC6) close to the peak potentials of theCV. This is true for both intercalation and deinter-
calation processes, and for all the systems studied
in terms of particle size and solution composition.
Hence, at the same potentials where the intercala-tion capacity is maximal as expressed by maxima in
the CV current (Figs 2 and 3), the di�usion coe�-
cient has a minimum value.
Such a dependence of ÿlog D vs E, X for the Li-
graphite intercalation±deintercalation process wasfound recently for graphite electrodes where the
particles were highly oriented [18, 19]. As already
discussed [18], such a dependence of D on E, Xre¯ects an intercalation process which involves
phase transition, and there are attractive inter-
actions amongst the intercalation sites. Theseattractive interactions should retard the di�usional
motion of the intercalating species. As already
explained [17], we assume that the new phase which
is formed by the continuous intercalation appearsas droplets within the initial phase. At the CV peak
potential these attractive interactions are maximal,
leading to a maximum in the intercalation capacity(Ip in the slow scan CV) and also maximum retar-
dation of the di�usion of Li+ through the active
mass. It should be noted, however, that there areother models for intercalation processes such as
viewing the phase transition between intercalation
stages as moving boundaries [23]. Our argument forthe droplet mechanism is discussed in our previous
publications [17, 18].
At ®rst glance, it might be surprising that the
PITT experiments provided such well resolvedbehavior of D vs E, X for the practical thick elec-
trodes, as was found for the highly oriented thin
electrodes [11, 12]. However, as con®rmed by theSEM measurements (Fig. 1), the practical, thick
electrodes are also comprised of graphite particles
which are highly oriented due to their preparationprocedure, as explained above. In addition, the
thick electrodes are porous, hence the solution per-
colates through the pores and all the particles aresimilarly in contact with the solution phase. Hence,
each particle may behave like a minielectrode, and
thus the intercalation processes in the particles arecoherent, leading to the relatively high resolved D
vs E, X dependence. This, of course, is correct forelectrodes at the beginning of their cycle life (with
which the above measurements were carried out).
After prolonged cycling, inter particle pores may be®lled with solution reduction products, and thus the
inner particles, unlike the outer ones, may not be in
contact with the solution. Therefore, after pro-
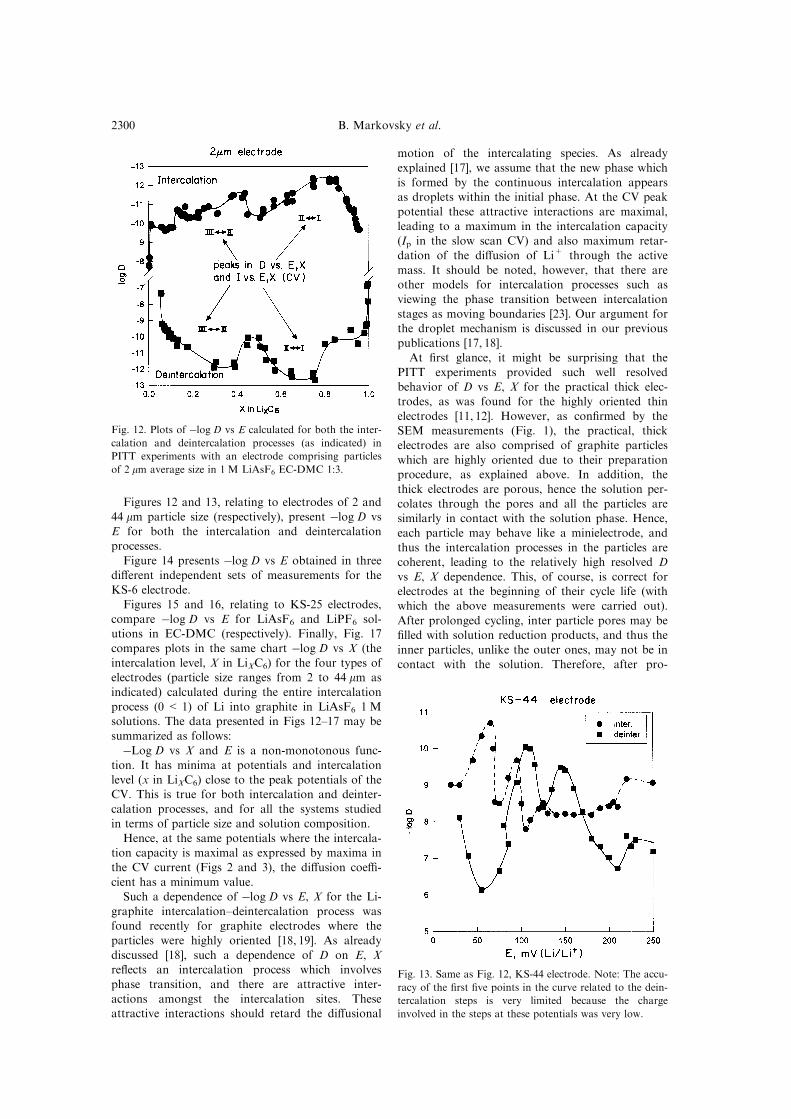
Fig. 12. Plots of ÿlog D vs E calculated for both the inter-
calation and deintercalation processes (as indicated) in
PITT experiments with an electrode comprising particles
of 2 mm average size in 1 M LiAsF6 EC-DMC 1:3.
Fig. 13. Same as Fig. 12, KS-44 electrode. Note: The accu-
racy of the ®rst ®ve points in the curve related to the dein-
tercalation steps is very limited because the charge
involved in the steps at these potentials was very low.
B. Markovsky et al.2300
longed cycling, the resolution of D vs E, X obtainedby PITT may deteriorate.
Another important result of these measurements
is that the smaller the particle size, the smaller thevalues of D vs E, X, as demonstrated in Fig. 17.
This fact can probably be explained by taking intoaccount the elastic interactions between intercalated
species [34]. Since the elastic interaction energy ofintercalated ions is inversely proportional to the
volume of the intercalation material, the smaller theparticle size, the larger the e�ect of the intercala-
tion-induced elastic stress gradient on the lithiumion transport.
In addition, it can be assumed that as the par-
ticles are smaller, there is a more pronounced e�ectof their boundaries on the di�usion process. For
instance, it was shown recently by AFM studiesthat the surface ®lm formation and precipitation
Fig. 14. A plot of ÿlog D vs E calculated during the intercalation process in PITT experiments with KS-6 electrode in
1 M LiAsF6 EC-DMC 1:3. The experimental points in these curves were taken from three di�erent independent exper-
iments and a good overlap was obtained (three di�erent marks in the ®gure).
Fig. 15. Same as Fig. 14, KS-25 electrode. The di�erent marks in the ®gure indicate experimental points from two inde-
pendent experiments.
Graphic-lithium intercalation electrodes 2301
are much more pronounced at the facets of the par-ticles perpendicular to the basal planes (the cross
sectional area for the intercalation process) [24]. Inthe case of EC-DMC Ð LiAsF6 solutions, these®lms form a rigid matrix which holds the graphite
particles as a cement and contributes in such a wayto the overall stability of these electrodes which ismaintained during prolonged cycling [7]. It is gener-ally known that the intercalation process leads to
some expansion of the graphite volume. These sur-face ®lms may interfere with this necessary volumeexpansion and thus the di�usion process of Li ions
between the graphene planes may be disturbed. Thesmaller the particle size, the more pronounced e�ectof the surface ®lms on the rigidity of the matrix
that holds the graphite particles, and hence, on theinterference with their possible volume expansionduring intercalation.
Calculation of the lithium ion di�usion coe�cient
from the impedance spectra
While PITT experiments can quite easily probethe solid state di�usion step, impedance spec-troscopy is more limited in this respect. The di�u-sion coe�cient related to the solid state can be
calculated from impedance spectra only when goodseparation between the various time constants isobserved, and a distinctive ``Warburg'' domain can
be observed in the spectra.As already discussed [18], the Warburg slope, AW
de®ned as dZ'/d(2pf)ÿ1/2=dZ0/d(2pf)ÿ1/2, is related
to the di�usion coe�cient D according to the fol-lowing formula:
AW � 1
�2D�1=2 �dE�OCV�
dQ
where Z', Z0 are the real and imaginary com-
ponents of the impedance, f is the frequency, l isthe di�usion length (half of the average particle
size) and dE(OCV)/dQ is approximately ICV/u forslow scan rate CV where ICV is the voltammetriccurrent, and u is the scan rate.
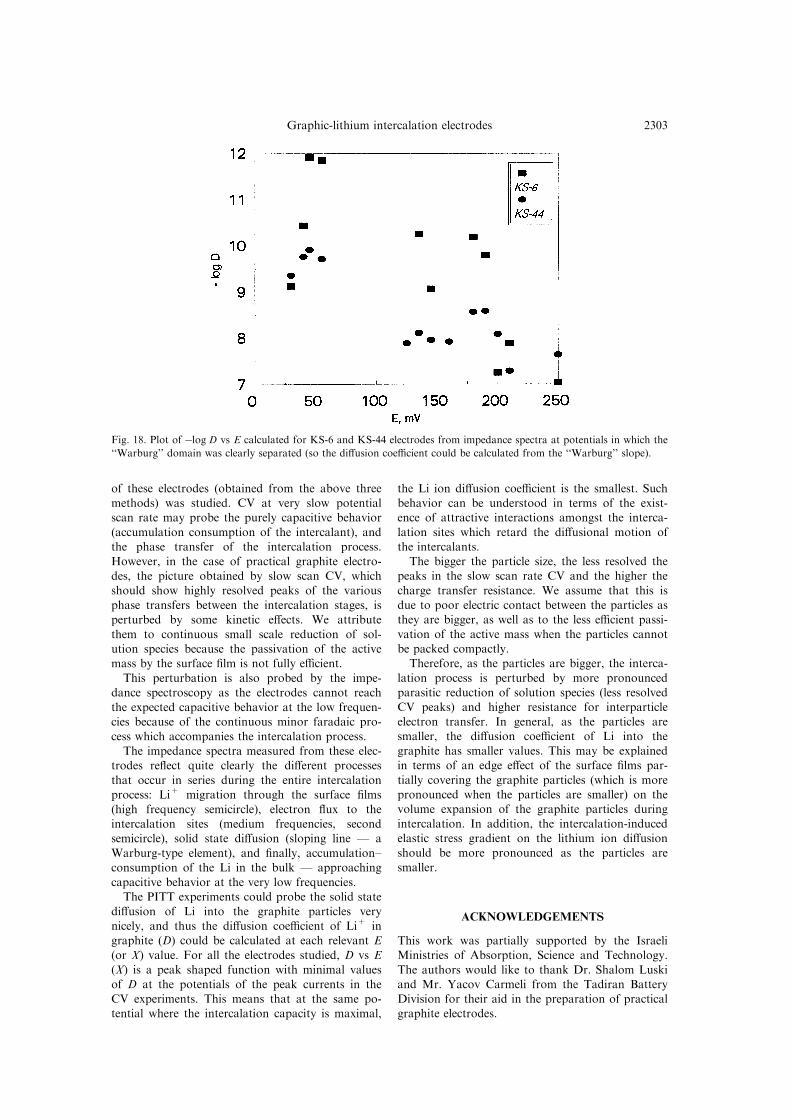
Figure 18 presents D vs E for KS-6 and KS-44electrodes calculated from impedance spectra duringthe course of the intercalation process. As explained
above, only part of the spectra obtained at di�erentpotentials were suitable for extraction of D fromthe Warburg slope according to the above formula.
Thereby the picture in Fig. 18 is not completed(compared with the data obtained by PITT,Figs 12±17).Nevertheless, when comparing the values of
ÿlog D vs E appearing in Fig. 18 with those relatedto the same electrodes appearing in Figs 13, 15 and17, quite a reasonable match is observed. In ad-
dition, the data in Fig. 18 re¯ect the same connec-tion between the values of ÿlog D vs E and theparticle size found by the PITT experiments, in gen-
eral, DKS-6<DKS-44.
CONCLUSIONS
Synthetic graphite particles are thin platelets, andthus the usual preparation of practical electrodes(100±150 mm thick) by spreading, is enough to ori-
ent a great part of the particles so that their basalplanes are parallel to the current collector.Consequently, the electrical contact between theparticles is good and relatively high resolved data
could be obtained for practical graphite electrodescomprised of synthetic graphite particles (the KSseries from Lonza), from simultaneous slow scan
CV, impedance spectroscopy and PITT. The e�ectof the particle size on the electroanalytical response
Fig. 16. Same as Figs 14 and 15, KS-25 electrode in a 1 M
LiPF6 solution.
Fig. 17. A comparison of ÿlog D vs X plots (the intercala-
tion level, X in LiXC6) obtained from electrodes of di�er-
ent particle size (2, 6, 25, 44 mm as indicated) in PITT
experiments 1 M LiAsF6 EC-DMC 1:3 solution.
B. Markovsky et al.2302
of these electrodes (obtained from the above threemethods) was studied. CV at very slow potentialscan rate may probe the purely capacitive behavior
(accumulation consumption of the intercalant), andthe phase transfer of the intercalation process.
However, in the case of practical graphite electro-des, the picture obtained by slow scan CV, whichshould show highly resolved peaks of the various
phase transfers between the intercalation stages, isperturbed by some kinetic e�ects. We attribute
them to continuous small scale reduction of sol-ution species because the passivation of the activemass by the surface ®lm is not fully e�cient.
This perturbation is also probed by the impe-dance spectroscopy as the electrodes cannot reach
the expected capacitive behavior at the low frequen-cies because of the continuous minor faradaic pro-
cess which accompanies the intercalation process.The impedance spectra measured from these elec-
trodes re¯ect quite clearly the di�erent processes
that occur in series during the entire intercalationprocess: Li+ migration through the surface ®lms
(high frequency semicircle), electron ¯ux to theintercalation sites (medium frequencies, secondsemicircle), solid state di�usion (sloping line Ð a
Warburg-type element), and ®nally, accumulation±consumption of the Li in the bulk Ð approaching
capacitive behavior at the very low frequencies.The PITT experiments could probe the solid state
di�usion of Li into the graphite particles verynicely, and thus the di�usion coe�cient of Li+ ingraphite (D) could be calculated at each relevant E
(or X) value. For all the electrodes studied, D vs E(X) is a peak shaped function with minimal values
of D at the potentials of the peak currents in theCV experiments. This means that at the same po-tential where the intercalation capacity is maximal,
the Li ion di�usion coe�cient is the smallest. Suchbehavior can be understood in terms of the exist-ence of attractive interactions amongst the interca-
lation sites which retard the di�usional motion ofthe intercalants.The bigger the particle size, the less resolved the
peaks in the slow scan rate CV and the higher the
charge transfer resistance. We assume that this isdue to poor electric contact between the particles asthey are bigger, as well as to the less e�cient passi-
vation of the active mass when the particles cannotbe packed compactly.Therefore, as the particles are bigger, the interca-
lation process is perturbed by more pronouncedparasitic reduction of solution species (less resolvedCV peaks) and higher resistance for interparticle
electron transfer. In general, as the particles aresmaller, the di�usion coe�cient of Li into thegraphite has smaller values. This may be explainedin terms of an edge e�ect of the surface ®lms par-
tially covering the graphite particles (which is morepronounced when the particles are smaller) on thevolume expansion of the graphite particles during
intercalation. In addition, the intercalation-inducedelastic stress gradient on the lithium ion di�usionshould be more pronounced as the particles are
smaller.
ACKNOWLEDGEMENTS
This work was partially supported by the IsraeliMinistries of Absorption, Science and Technology.
The authors would like to thank Dr. Shalom Luskiand Mr. Yacov Carmeli from the Tadiran BatteryDivision for their aid in the preparation of practicalgraphite electrodes.
Fig. 18. Plot of ÿlog D vs E calculated for KS-6 and KS-44 electrodes from impedance spectra at potentials in which the
``Warburg'' domain was clearly separated (so the di�usion coe�cient could be calculated from the ``Warburg'' slope).
Graphic-lithium intercalation electrodes 2303
REFERENCES
1. J. R. Dahn, A. K. Sleigh, H. Shi, B. M. Way, W. J.Weydanz, J. N. Reimers, Q. Zhong, and U. vonSacken, in Lithium Batteries Ð New Materials,Developments and Perspectives, ed. G. Pistoia,Elsevier, Amsterdam, London, New York and Tokyo,1994, 1±47, and references therein.
2. R. Yazami, in Lithium Batteries Ð New Materials,Developments and Perspectives, ed. G. Pistoia,Elsevier, Amsterdam, London, New York and Tokyo,1994, Ch. 2, pp. 49±91, and references therein.
3. D. Fauteux and R. Koksbang, J. Appl. Electrochem.23, 1and references therein (1993).
4. D. Billaud, F. X. Henry and P. Willman, Mater. Res.Bull., 28, 477 (1993).
5. D. Billaud, F. X. Henry, M. Lelaurain and P.Willman, J. Phys. Chem. Solids 57, 775 (1996).
6. T. D. Tran, J. H. Feikert, R. W. Pekala and K.Kinoshita, J. Appl. Electrochem. 26, 1161 (1996).
7. D. Aurbach, B. Markovsky, A. Schechter, Y. Ein-Eliand H. Cohen, J. Electrochem. Soc. 143, 3809 (1996).
8. D. Aurbach, O. Youngman Chusid, Y. Carmeli, M.Babai and Y. Ein-Eli, J. Power Sources 43, 47 (1993).
9. D. Aurbach, Y. Ein-Eli, O. Chusid, M. Babai, Y.Carmeli and H. Yamin, J. Electrochem. Soc. 141,603 (1994).
10. D. Aurbach, Y. Ein-Eli, B. Markovsky, Y. Carmeli,H. Yamin and S. Luski, Electrochim. Acta 39,2559 (1994).
11. H. Gan and E. S. Takeuchi, J. Power Sources, 1996,45.
12. M. Morita, N. Nishimura and Y. Matsuda,Electrochim. Acta 38, 1721 (1993).
13. T. Uchida, Y. Morikawa, H. Ikuta and M. Wakihara,J. Electrochem. Soc. 143, 2606 (1996).
14. N. Takami, A. Satoh, M. Hara and T. Ohsaki, J.Electrochem. Soc. 142, 371 (1995).
15. D. Guyomard and J. M. Tarascon, J. Electrochem.Soc. 139, 937 (1992).
16. K. Zaghib, K. Tatsumi, H. Abe, T. Ohsaki, Y.Sawada and S. Higuchi, in Rechargeable Lithium and
Lithium-Ion Batteries, ed. S. Megahed, B. M. Barnett,L. Xie, Battery Division, The Electrochemical Society,Pennington, NJ, 1995, p. 121.
17. D. Aurbach and M. D. Levi, J. Phys. Chem. B 101,4630 (1997).
18. D. Aurbach and M. D. Levi, J. Phys. Chem. B. 101,4641 (1997).
19. M. D. Levi, E. Levi and D. Aurbach, J. Electroanal.Chem. 421, 89 (1997).
20. J. R. Dahn, R. Fong and M. J. Spoon, Phys. Rev. B.42, 6424 (1990).
21. J. R. Dahn, R. Fong and M. J. Spoon, Phys. Rev. B.44, 9170 (1991).
22. M. D. Levi and D. Aurbach, J. Electroanal. Chem.421, 79 (1997).
23. A. Metrot and A. Harrach, Electrochim. Acta 38,2005 (1993).
24. A. C. Chu, J. Y. Josefowicz, J. E. Fischer and G. C.Farrington, The Fall Meeting of the ElectrochemicalSociety, San Antonio, Texas, October 1996. ExtendedAbstracts, Vol. II, 1996, Abstract 862, pp. 1062±1063.
25. A. E. Orazem, P. Agarwal and L. H. Garcia Rubio, J.Electroanal. Chem. 378, 51 (1994).
26. D. Aurbach, A. Zaban and E. Zinigrad, J. Phys.Chem. 100, 3098 (1996).
27. D. Aurbach and B. Markovsky, Aging processes of Li-graphite electrodes, in preparation.
28. D. Aurbach, M. D. Levi, E. Levi and A. Schechter, J.Phys. Chem. B 101, 2195 (1997).
29. D. Aurbach and Y. Ein-Eli, J. Electrochem. Soc. 142,1746 (1995).
30. R. Fong, U. von Sacken and J. R. Dahn, J.Electrochem. Soc. 137, 2009 (1990).
31. D. Aurbach, Y. Ein-Eli, B. Markovsky and A. Zaban,J. Electrochem. Soc. 142, 2882 (1995).
32. W. Weppner and R. A. Huggins, Ann. Rev. Mater.Sci., 8, 269 (1978).
33. C. Ho, I. D. Raistrick and R. A. Huggins, J.Electrochem. Soc. 127, 343 (1980).
34. W. R. McKinnon and R. R., Haering, in ModernAspects of Electrochemistry, ed. R. E. White, J. O.Bockris, B. E. Conway, 1983, pp. 235±305.
B. Markovsky et al.2304
Copyright © 2022 FDOKUMEN