The basaltic to trachydacitic upper Diliman Tuff in Manila: Petrogenesis and comparison with...
16
This article was originally published in a journal published by Elsevier, and the attached copy is provided by Elsevier for the author’s benefit and for the benefit of the author’s institution, for non-commercial research and educational use including without limitation use in instruction at your institution, sending it to specific colleagues that you know, and providing a copy to your institution’s administrator. All other uses, reproduction and distribution, including without limitation commercial reprints, selling or licensing copies or access, or posting on open internet sites, your personal or institution’s website or repository, are prohibited. For exceptions, permission may be sought for such use through Elsevier’s permissions site at: http://www.elsevier.com/locate/permissionusematerial
-
Upload
independent -
Category
Documents
-
view
0 -
download
0
Transcript of The basaltic to trachydacitic upper Diliman Tuff in Manila: Petrogenesis and comparison with...

This article was originally published in a journal published by Elsevier, and the attached copy is provided by Elsevier for the
author’s benefit and for the benefit of the author’s institution, for non-commercial research and educational use including without
limitation use in instruction at your institution, sending it to specific colleagues that you know, and providing a copy to your institution’s
administrator.
All other uses, reproduction and distribution, including without limitation commercial reprints, selling or licensing copies or access,
or posting on open internet sites, your personal or institution’s website or repository, are prohibited. For exceptions, permission
may be sought for such use through Elsevier’s permissions site at:
http://www.elsevier.com/locate/permissionusematerial

Author's Personal Copy
Journal of Volcanology and Geothermal Research 177 (2008) 1020–1034
Contents lists available at ScienceDirect
Journal of Volcanology and Geothermal Research
j ourna l homepage: www.e lsev ie r.com/ locate / jvo lgeores
The basaltic to trachydacitic upper Diliman Tuff in Manila: Petrogenesis andcomparison with deposits from Taal and Laguna Calderas
Maria Carmencita B. Arpa a,b,⁎, Lina C. Patino a, Thomas A. Vogel a
a Department of Geological Sciences, Michigan State University, East Lansing, MI 48824-1115, USAb Philippine Institute of Volcanology and Seismology, UP Campus, Diliman, Quezon City 1101, Philippines
⁎ Corresponding author. Philippine Institute of VolCampus, Diliman, Quezon City 1101, Philippines. Tel.9298366.
E-mail address: [email protected] (M.C.B. Arpa).
0377-0273/$ – see front matter © 2008 Elsevier B.V. Aldoi:10.1016/j.jvolgeores.2008.07.024
a b s t r a c t
a r t i c l e i n f oArticle history:
The basaltic to trachydacitic Received 21 December 2007Accepted 31 July 2008Available online 20 August 2008Keywords:pyroclastic flowDiliman TuffTaalLaguna Calderamagma mixing
(50–65 wt.% SiO2) upper Diliman Tuff is the youngest deposit of a sequence oftuffaceous deposits in Metro Manila. The deposit is located north of Taal Caldera and northwest of LagunaCaldera, which are both within the Southwest Luzon Volcanic Field. Chemical variations in the pumicefragments within the upper Diliman Tuff include medium-K basalt to basaltic andesite, high-K basalticandesite to andesite and trachyandesite to trachydacite. Magma mixing/mingling is ubiquitous and isshown by banding textures in some pumice fragments, considerable range in groundmass glass composition(54 to 65 wt.% SiO2) in a single pumice fragment, and zoning in plagioclase phenocrysts. Simple binarymixing modeling and polytopic vector analysis were used to further evaluate magma mixing. Trace-elementvariations are inconsistent with the medium-K and high-K magmas being related by crystal fractionation.The medium-K basalts represent hotter intrusions, which induced small degrees of partial melting in oldercrystallized medium-K basaltic material within the crust to produce the high-K magmas. All melts likelydifferentiated in the crust but the emplaced and new basaltic intrusions originated from the mantle wedgeand were generated by subduction zone processes. The volcanic source vent for the upper Diliman Tuff hasnot been identified. In comparisons with the deposits from adjacent Taal and Laguna Calderas it is chemicallydistinct with respect to both major- and trace-element concentrations.
© 2008 Elsevier B.V. All rights reserved.
1. Introduction
The Diliman Tuff refers to primary and reworked volcaniclasticdeposits of uncertain origin that underlie the Metropolitan Manilaarea. This deposit is 10 km north of the Southwest Luzon VolcanicField (Fig. 1A), which is a 7 km2 region consisting of strato-volcanoes,monogenetic centers and calderas (Oles et al., 1995). Southwest LuzonVolcanic Field is related to the eastward subduction in the ManilaTrench and extension in the Macolod Corridor (Knittel et al., 1988;Defant et al., 1988; Forster et al., 1990) (Fig. 1A). The uncertainties withregards to the volcanic source of the Diliman Tuff are due to factorssuch as: proximity to several possible source centers; complicatedvolcano-tectonic setting and modification of landscape from urbandevelopment. This study will focus on the petrology and geochemistryof one unit, the upper Diliman Tuff, the youngest pyroclastic flowdeposit in the volcaniclastic sequence. The chemical variations withinthis unit will be compared to those exhibited by similar pyroclasticdeposits from Taal (60 km south) and Laguna (40 km southeast)
canology and Seismology, UP: +63 2 9207058; fax: +63 2
l rights reserved.
calderas (Fig. 1B) to constrain the source of the unit and determinepossible hazard implications on Metro Manila. Geologic mapping ofMetro Manila was reviewed from 1997 to 1999 as part of the study onLaguna Caldera (Catane and Arpa, 1998; Arpa et al., 1999). In 2002, as acomponent for the seismic hazard study of Metro Manila, welldistributed core samples were collected to better constrain thestratigraphy of the area. These previous projects provided backgrounddata to study the petrology of the Diliman Tuff with the objective ofdetermining its origin.
This study also evaluates the chemical variations within the upperDiliman Tuff unit in terms of magma differentiation processes that canproduce compositions that range from basalt to trachydacite. Severalmodels can explain the compositional variation, particularly produc-tion of silicic magmas, in island arcs. For example, processes such asmelting of underplated subduction related magmas was proposed toexplain felsic volcanism in the Kermadec Arc (Smith et al., 2003) andthe Costa Rican Arc (Hannah et al., 2002; Vogel et al., 2006a,b). In thismodel, partial melting of the crust is caused by heat transfer from thecrystallizing basaltic intrusions, causing the production of a widerange of melt compositions simultaneously (Annen and Sparks, 2002;Vogel et al., 2004). In subduction settings, the basaltic magma iswidely believed to result from partial melting of the mantle wedgefluxed by fluids dehydrated from subducting crust and sediments ordown-dragged hydrated mantle peridotite (Tatsumi, 1989; Peacock,

Author's Personal Copy
Fig. 1. A.) Map of the west-facing volcanic arc (Bataan Arc), the location of the Macolod corridor, Southwest Luzon Volcanic Field (SWLVF) and Manila and Philippine trenches. Thesymbols (triangles) represent volcanoes. B.) Map of Taal and Laguna Calderas and the enclosed area covering the extent of the surface geologic map of Metro Manila (revised afterPHIVOLCS–NDCC geologic map of Metro Manila). Sample location sites and labels are indicated. Dashed and solid lines are active faults (inactive faults are not shown) (PHIVOLCS2000 edition active faults map).
1021M.C.B. Arpa et al. / Journal of Volcanology and Geothermal Research 177 (2008) 1020–1034
1990; Giggenbach, 1992; Grove et al., 2003). Particularly for volcanoesin Luzon, related to the subduction in the Manila Trench, the sourcematerials have been enriched in large ion lithophile elements (LILE)and radiogenic Sr as a result of dehydration of the subducted crust andterrigenous sediments from Eurasia (Knittel et al., 1988; Defant et al.,1988; Mukasa et al., 1994; Castillo and Newhall, 2004). These modelswill be considered in our analyses of the volcanic setting and sourcemagma differentiation for the upper Diliman Tuff unit.
2. Geologic setting of Southwest Luzon
The Philippines is bounded by subduction zones to the east andwest. Subduction on the west margin, of Luzon, is along the ManilaTrench (Fig.1A). Themain volcanic arc associated with this subductionoccurs at about 100 km above theWadati-Benioff zone (Cardwell et al.,1980) and is termed the Bataan Arc. There are many volcanoes insouthwest Luzon located east of the Bataan Arc andmore than 100 km

Author's Personal Copy
1022 M.C.B. Arpa et al. / Journal of Volcanology and Geothermal Research 177 (2008) 1020–1034
above a subducted slab. These volcanoes, dated 6 Ma to present(Oles et al., 1995), and their associated structural features define theMacolod Corridor (Fig. 1A), a northeast–southwest trending rift zoneacross southwest Luzon (Defant et al., 1988; Forster et al., 1990). Taaland Laguna Calderas are the two major structural features in theMacolod Corridor (Fig. 2B). Taal Caldera, although included in theMacolod Corridor, is only about 10 km east of the Bataan Arc and thuslies 200 km above the subducted slab (Cardwell et al., 1980). Presentvolcanism in southwest Luzon or the past activities of Laguna or TaalCalderas may not be related to the subduction on the east side of thePhilippines. The west-facing subduction in the Philippine Trench is ayounger feature and the slab does not reach below southwest Luzon(Cardwell et al., 1980).
2.1. Taal Caldera
There were at least 4 phases of caldera-forming eruptions thatproduced the present configuration of Taal Caldera some 140,000 to5380 years ago (Listanco, 1993). The first 3 phases produced calc-alkaline andesitic to dacitic ignimbrites (Listanco, 1993) while theyoungest calderagenic eruption was basaltic andesite and occurredaround 5000 years B.P. (Martinez, 1997). Compositions of Taal magmaare significantly influenced by subducted terrigenous sediments of theSouth China Sea basin as shown from Sr and Pb isotopic data (Mikliuset al., 1991; Castillo and Newhall, 2004). Based on geochemicalmodeling, it has been proposed that the chemical variation of the Taalvolcanics was due tomixing of melts from separately evolving systems
Fig. 2. Stratigraphic logs of the sample sites—borehole and outcrop. Samples, number of sampshown. Photos of the upper Diliman Tuff unit: Borehole-07 (note heterogenous pumice clasts
and that these melts originated from a heterogenous mantle source(Miklius et al., 1991).
2.2. Laguna Caldera
Laguna Caldera is located around 30 km east of Taal. The calderaoutline proposed by Wolfe and Self (1983) coincides with the middlelobeof LagunadeBay lake, a 3 lobed lake (Fig.1B), produced fromnormalfaulting and modified by volcanism. The Laguna Tuffs include severalunits of pyroclastic deposits (Corby, 1951). Welded ignimbrites areextensive around the caldera margin and are included in the 3 distinctpyroclastic flow units found in the area. The episode of magmatismattributed to Laguna Caldera occurred between 2.3 to 0.9 Ma. based onK–Ar dates in andesitic and rhyolitic lava and tuff deposits (Oles et al.,1995).However, radiocarbondatingof charcoalwithin a pyroclasticflowdeposit gave a younger age of around 47,000 B.P. (Catane and Arpa,1998). Ignimbrite deposits from Laguna contain pumice fragments withcompositions between 53 to 69wt.% SiO2 (Flood et al., 2004; Vogel et al.,2006a,b). Vogel et al. (2006a,b) suggested that thehigh-silicamagmasofLaguna were generated by partial melting or assimilation of previouslyemplaced calc-alkaline material in the crust.
2.3. Pyroclastic deposits in Metro Manila and stratigraphy
The pyroclastic deposits found in Metro Manila belong to theGuadalupe Tuff formation (Teves and Gonzales, 1950; Corby, 1951).The Guadalupe Tuff is divided into the Diliman Tuff member, which
les and labeling are indicated. Correlation of the upper Diliman Tuff unit (shaded gray) is) and an excavation in Metro Manila showing a 10 m thick pyroclastic flow (PF) deposit.
Author's Personal Copy
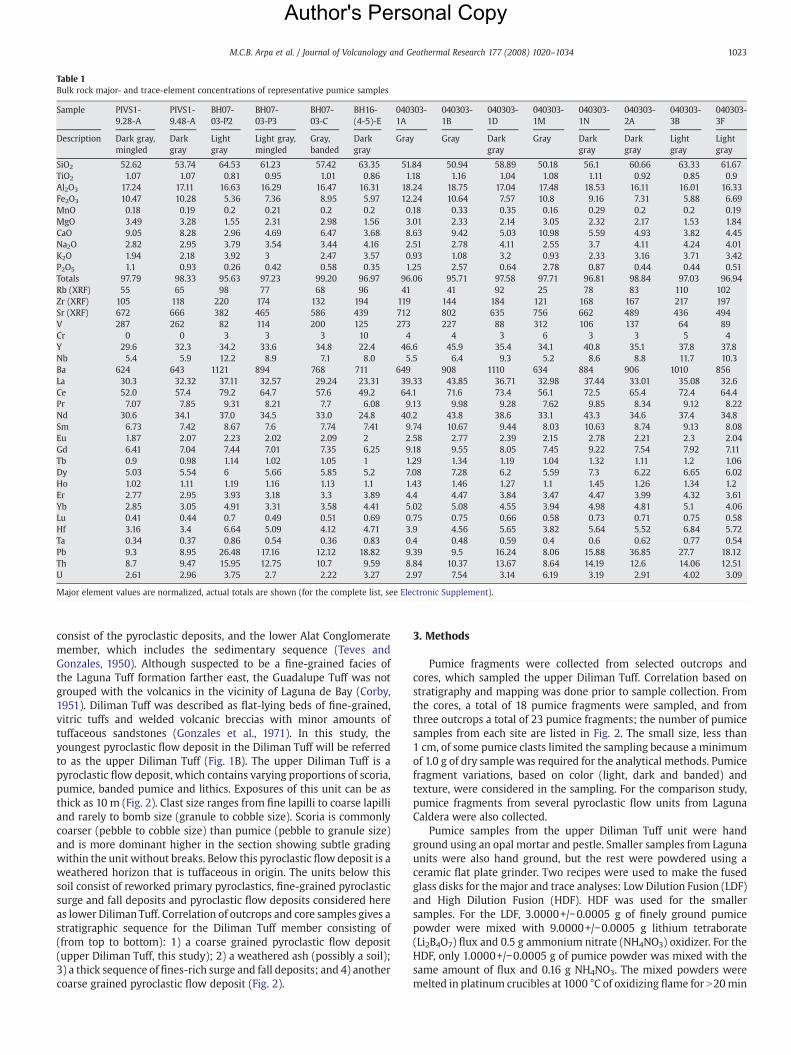
Table 1Bulk rock major- and trace-element concentrations of representative pumice samples
Sample PIVS1-9.28-A
PIVS1-9.48-A
BH07-03-P2
BH07-03-P3
BH07-03-C
BH16-(4-5)-E
040303-1A
040303-1B
040303-1D
040303-1M
040303-1N
040303-2A
040303-3B
040303-3F
Description Dark gray,mingled
Darkgray
Lightgray
Light gray,mingled
Gray,banded
Darkgray
Gray Gray Darkgray
Gray Darkgray
Darkgray
Lightgray
Lightgray
SiO2 52.62 53.74 64.53 61.23 57.42 63.35 51.84 50.94 58.89 50.18 56.1 60.66 63.33 61.67TiO2 1.07 1.07 0.81 0.95 1.01 0.86 1.18 1.16 1.04 1.08 1.11 0.92 0.85 0.9Al2O3 17.24 17.11 16.63 16.29 16.47 16.31 18.24 18.75 17.04 17.48 18.53 16.11 16.01 16.33Fe2O3 10.47 10.28 5.36 7.36 8.95 5.97 12.24 10.64 7.57 10.8 9.16 7.31 5.88 6.69MnO 0.18 0.19 0.2 0.21 0.2 0.2 0.18 0.33 0.35 0.16 0.29 0.2 0.2 0.19MgO 3.49 3.28 1.55 2.31 2.98 1.56 3.01 2.33 2.14 3.05 2.32 2.17 1.53 1.84CaO 9.05 8.28 2.96 4.69 6.47 3.68 8.63 9.42 5.03 10.98 5.59 4.93 3.82 4.45Na2O 2.82 2.95 3.79 3.54 3.44 4.16 2.51 2.78 4.11 2.55 3.7 4.11 4.24 4.01K2O 1.94 2.18 3.92 3 2.47 3.57 0.93 1.08 3.2 0.93 2.33 3.16 3.71 3.42P2O5 1.1 0.93 0.26 0.42 0.58 0.35 1.25 2.57 0.64 2.78 0.87 0.44 0.44 0.51Totals 97.79 98.33 95.63 97.23 99.20 96.97 96.06 95.71 97.58 97.71 96.81 98.84 97.03 96.94Rb (XRF) 55 65 98 77 68 96 41 41 92 25 78 83 110 102Zr (XRF) 105 118 220 174 132 194 119 144 184 121 168 167 217 197Sr (XRF) 672 666 382 465 586 439 712 802 635 756 662 489 436 494V 287 262 82 114 200 125 273 227 88 312 106 137 64 89Cr 0 0 3 3 3 10 4 4 3 6 3 3 5 4Y 29.6 32.3 34.2 33.6 34.8 22.4 46.6 45.9 35.4 34.1 40.8 35.1 37.8 37.8Nb 5.4 5.9 12.2 8.9 7.1 8.0 5.5 6.4 9.3 5.2 8.6 8.8 11.7 10.3Ba 624 643 1121 894 768 711 649 908 1110 634 884 906 1010 856La 30.3 32.32 37.11 32.57 29.24 23.31 39.33 43.85 36.71 32.98 37.44 33.01 35.08 32.6Ce 52.0 57.4 79.2 64.7 57.6 49.2 64.1 71.6 73.4 56.1 72.5 65.4 72.4 64.4Pr 7.07 7.85 9.31 8.21 7.7 6.08 9.13 9.98 9.28 7.62 9.85 8.34 9.12 8.22Nd 30.6 34.1 37.0 34.5 33.0 24.8 40.2 43.8 38.6 33.1 43.3 34.6 37.4 34.8Sm 6.73 7.42 8.67 7.6 7.74 7.41 9.74 10.67 9.44 8.03 10.63 8.74 9.13 8.08Eu 1.87 2.07 2.23 2.02 2.09 2 2.58 2.77 2.39 2.15 2.78 2.21 2.3 2.04Gd 6.41 7.04 7.44 7.01 7.35 6.25 9.18 9.55 8.05 7.45 9.22 7.54 7.92 7.11Tb 0.9 0.98 1.14 1.02 1.05 1 1.29 1.34 1.19 1.04 1.32 1.11 1.2 1.06Dy 5.03 5.54 6 5.66 5.85 5.2 7.08 7.28 6.2 5.59 7.3 6.22 6.65 6.02Ho 1.02 1.11 1.19 1.16 1.13 1.1 1.43 1.46 1.27 1.1 1.45 1.26 1.34 1.2Er 2.77 2.95 3.93 3.18 3.3 3.89 4.4 4.47 3.84 3.47 4.47 3.99 4.32 3.61Yb 2.85 3.05 4.91 3.31 3.58 4.41 5.02 5.08 4.55 3.94 4.98 4.81 5.1 4.06Lu 0.41 0.44 0.7 0.49 0.51 0.69 0.75 0.75 0.66 0.58 0.73 0.71 0.75 0.58Hf 3.16 3.4 6.64 5.09 4.12 4.71 3.9 4.56 5.65 3.82 5.64 5.52 6.84 5.72Ta 0.34 0.37 0.86 0.54 0.36 0.83 0.4 0.48 0.59 0.4 0.6 0.62 0.77 0.54Pb 9.3 8.95 26.48 17.16 12.12 18.82 9.39 9.5 16.24 8.06 15.88 36.85 27.7 18.12Th 8.7 9.47 15.95 12.75 10.7 9.59 8.84 10.37 13.67 8.64 14.19 12.6 14.06 12.51U 2.61 2.96 3.75 2.7 2.22 3.27 2.97 7.54 3.14 6.19 3.19 2.91 4.02 3.09
Major element values are normalized, actual totals are shown (for the complete list, see Electronic Supplement).
1023M.C.B. Arpa et al. / Journal of Volcanology and Geothermal Research 177 (2008) 1020–1034
consist of the pyroclastic deposits, and the lower Alat Conglomeratemember, which includes the sedimentary sequence (Teves andGonzales, 1950). Although suspected to be a fine-grained facies ofthe Laguna Tuff formation farther east, the Guadalupe Tuff was notgrouped with the volcanics in the vicinity of Laguna de Bay (Corby,1951). Diliman Tuff was described as flat-lying beds of fine-grained,vitric tuffs and welded volcanic breccias with minor amounts oftuffaceous sandstones (Gonzales et al., 1971). In this study, theyoungest pyroclastic flow deposit in the Diliman Tuff will be referredto as the upper Diliman Tuff (Fig. 1B). The upper Diliman Tuff is apyroclastic flow deposit, which contains varying proportions of scoria,pumice, banded pumice and lithics. Exposures of this unit can be asthick as 10 m (Fig. 2). Clast size ranges from fine lapilli to coarse lapilliand rarely to bomb size (granule to cobble size). Scoria is commonlycoarser (pebble to cobble size) than pumice (pebble to granule size)and is more dominant higher in the section showing subtle gradingwithin the unit without breaks. Below this pyroclastic flow deposit is aweathered horizon that is tuffaceous in origin. The units below thissoil consist of reworked primary pyroclastics, fine-grained pyroclasticsurge and fall deposits and pyroclastic flow deposits considered hereas lower Diliman Tuff. Correlation of outcrops and core samples gives astratigraphic sequence for the Diliman Tuff member consisting of(from top to bottom): 1) a coarse grained pyroclastic flow deposit(upper Diliman Tuff, this study); 2) a weathered ash (possibly a soil);3) a thick sequence of fines-rich surge and fall deposits; and 4) anothercoarse grained pyroclastic flow deposit (Fig. 2).
3. Methods
Pumice fragments were collected from selected outcrops andcores, which sampled the upper Diliman Tuff. Correlation based onstratigraphy and mapping was done prior to sample collection. Fromthe cores, a total of 18 pumice fragments were sampled, and fromthree outcrops a total of 23 pumice fragments; the number of pumicesamples from each site are listed in Fig. 2. The small size, less than1 cm, of some pumice clasts limited the sampling because a minimumof 1.0 g of dry sample was required for the analytical methods. Pumicefragment variations, based on color (light, dark and banded) andtexture, were considered in the sampling. For the comparison study,pumice fragments from several pyroclastic flow units from LagunaCaldera were also collected.
Pumice samples from the upper Diliman Tuff unit were handground using an opal mortar and pestle. Smaller samples from Lagunaunits were also hand ground, but the rest were powdered using aceramic flat plate grinder. Two recipes were used to make the fusedglass disks for the major and trace analyses: LowDilution Fusion (LDF)and High Dilution Fusion (HDF). HDF was used for the smallersamples. For the LDF, 3.0000+/−0.0005 g of finely ground pumicepowder were mixed with 9.0000+/−0.0005 g lithium tetraborate(Li2B4O7) flux and 0.5 g ammonium nitrate (NH4NO3) oxidizer. For theHDF, only 1.0000+/−0.0005 g of pumice powder was mixed with thesame amount of flux and 0.16 g NH4NO3. The mixed powders weremelted in platinum crucibles at 1000 °C of oxidizing flame for N20min

Author's Personal Copy
Fig. 3. A.) Photograph of pumice 040303-1C groundmass in plane polarized light showingvesiculation, mingling (dark and light glass) and points with analysis. B.) Photograph ofenclave 1 inPIVS1-9.28A incrossedpolars showingplagioclase glomerocryst andmicroliticgroundmass ofmostly plagioclase. C.) Photograph of enclave 3 in PIVS1-9.28Aunder planepolarized light showing zoned plagioclase and clinopyroxene phenocrysts set in fine-grained groundmass.
1024 M.C.B. Arpa et al. / Journal of Volcanology and Geothermal Research 177 (2008) 1020–1034
while being stirred with an orbital mixing stage. Platinummolds wereused tomake the glass disks. Fifteen HDF disksweremade and the restof the samples were fused into LDF disks.
Major and trace elementswere analyzed using a Rigaku S/Max X-rayFluorescence Spectrometry (XRF) and additional trace element includ-ing rare-earth element (REE) analyses were done by Laser AblationInductively CoupledPlasmaMass Spectrometer (LA ICP-MS) atMichiganState University.Major element data from theXRFwere calculated usingfundamental parameters (Criss fundamental parameters) and traceelements were calculated from linear regressions using a minimum oftenwell-known standards. For LA ICP-MS analyses, the Sr concentrationdetermined by XRF was used as an internal standard. The same glassdisks were used for both XRF and LA ICP-MS.
Electron microprobe analysis was done at the Department ofGeological Sciences, University of Michigan using an SX 100 CAMICAmicroprobe. For mineral analyses an accelerating potential of 15 kV, afocused beamwith a 5 µm spot size, counting time of ~3 min/ mineral,and a 10 nA beam current was used, while for glass analyses thesettings were 15 kV, a 15 μm beam spot size and 5 nA. Plagioclase andpyroxene compositions were analyzed in seven pumice clasts, andgroundmass glass compositions were determined in nine pumicefragments.
4. Results
4.1. Petrology
The upper Diliman Tuff contains mafic, felsic and banded pumicefragments (Table 1 and Electronic Supplement) that show a variety oftexture. Generally, the pumices are glassy and finely vesiculated butcoarser vesiculation and non-vesiculated bands were observed. Thephenocrysts, which sometimes occur as glomerocrysts make up only1 to 3% of the bulk. Coarse phenocrysts are around 1 to 2.5 mm for thelongest side but usually the crystals are smaller. The mineral phasesare plagioclase, clinopyroxene, orthopyroxene and magnetite. Amphi-bole and biotite are found in trace amount only in the most silicicsamples. Trace phases are apatite and zircon. Mingling of meltswas observed as banding in hand samples to banding and mottledappearance of groundmass glass under the microscope (Fig. 3A). Somepumice fragments contain enclaves (Fig. 3B–C).
Mafic pumice samples have brown to dark brown groundmass glasswhile clear glass was found in the groundmass of higher silica pumicefragments. The dark color can also be due to oxide crystallites in theglass, but the oxide specks aremost common in themafic pumice clasts.Groundmass glass compositions range from 54 to 66 wt.% SiO2 for the 9pumice samples analyzed (Table 2 and Electronic Supplement). Nearlythe complete range in glass compositionwas seen in sample BH07-03-C(54.3 to 65.3 wt.% SiO2), which is a banded pumice and the highestgroundmass glass SiO2 composition (64.55 to 66.04wt.%)was found in abasaltic pumice (PIVS1-9.28A).
Plagioclase crystals are the most abundant phase and are typicallyeuhedral to subhedral. The coarsest plagioclase lath is 1.7 mm2. Sievedtexture and glass inclusions are present and for some, occurring onlyat concentric zones or at the core. Zoned crystals can show distinctzones or irregular boundaries and exhibiting normal, reverse andoscillatory zoning. Plagioclase compositions in the 7 selected pumicesamples range from An36 to An90 (Table 2 and Electronic Supplement).The largest variation found for a single pumice fragment (PIVS1-9.28A) is An68 to An90 or 22% An. The maximum difference observedbetween core and rim is 12% An.
Two types of pyroxenes were found in the 7 selected pumicesamples: clinopyroxene (Wo38En46Fs15 to Wo45En41Fs14) and ortho-pyroxene (Wo3En66Fs30 to Wo4En70Fs26) (Table 2 and ElectronicSupplement). Both clinopyroxene and orthopyroxene were found inthe pumice samples with bulk SiO2N60 wt.%; only clinopyroxene wasfound in the lower silica pumice samples.
Enclaves are present in samples PIVS1-9.28A and BH07-01-S1.Based on texture there are three kinds of enclaves found in PIVS1-9.28A. The first (enclave1) is microlitic with plagioclase (An52 to An68)glomerocrysts and clinopyroxene (Wo39En42Fs19 to Wo40En42Fs18)
Author's Personal Copy
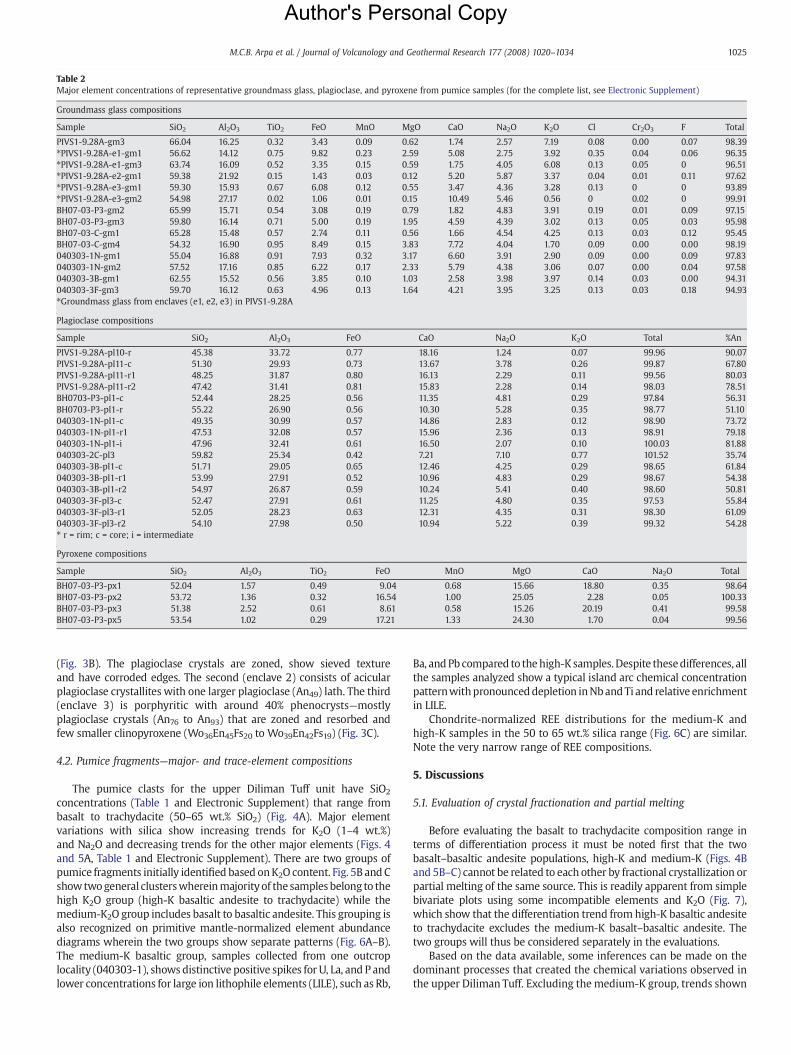
Table 2Major element concentrations of representative groundmass glass, plagioclase, and pyroxene from pumice samples (for the complete list, see Electronic Supplement)
Groundmass glass compositions
Sample SiO2 Al2O3 TiO2 FeO MnO MgO CaO Na2O K2O Cl Cr2O3 F Total
PIVS1-9.28A-gm3 66.04 16.25 0.32 3.43 0.09 0.62 1.74 2.57 7.19 0.08 0.00 0.07 98.39⁎PIVS1-9.28A-e1-gm1 56.62 14.12 0.75 9.82 0.23 2.59 5.08 2.75 3.92 0.35 0.04 0.06 96.35⁎PIVS1-9.28A-e1-gm3 63.74 16.09 0.52 3.35 0.15 0.59 1.75 4.05 6.08 0.13 0.05 0 96.51⁎PIVS1-9.28A-e2-gm1 59.38 21.92 0.15 1.43 0.03 0.12 5.20 5.87 3.37 0.04 0.01 0.11 97.62⁎PIVS1-9.28A-e3-gm1 59.30 15.93 0.67 6.08 0.12 0.55 3.47 4.36 3.28 0.13 0 0 93.89⁎PIVS1-9.28A-e3-gm2 54.98 27.17 0.02 1.06 0.01 0.15 10.49 5.46 0.56 0 0.02 0 99.91BH07-03-P3-gm2 65.99 15.71 0.54 3.08 0.19 0.79 1.82 4.83 3.91 0.19 0.01 0.09 97.15BH07-03-P3-gm3 59.80 16.14 0.71 5.00 0.19 1.95 4.59 4.39 3.02 0.13 0.05 0.03 95.98BH07-03-C-gm1 65.28 15.48 0.57 2.74 0.11 0.56 1.66 4.54 4.25 0.13 0.03 0.12 95.45BH07-03-C-gm4 54.32 16.90 0.95 8.49 0.15 3.83 7.72 4.04 1.70 0.09 0.00 0.00 98.19040303-1N-gm1 55.04 16.88 0.91 7.93 0.32 3.17 6.60 3.91 2.90 0.09 0.00 0.09 97.83040303-1N-gm2 57.52 17.16 0.85 6.22 0.17 2.33 5.79 4.38 3.06 0.07 0.00 0.04 97.58040303-3B-gm1 62.55 15.52 0.56 3.85 0.10 1.03 2.58 3.98 3.97 0.14 0.03 0.00 94.31040303-3F-gm3 59.70 16.12 0.63 4.96 0.13 1.64 4.21 3.95 3.25 0.13 0.03 0.18 94.93⁎Groundmass glass from enclaves (e1, e2, e3) in PIVS1-9.28A
Plagioclase compositions
Sample SiO2 Al2O3 FeO CaO Na2O K2O Total %An
PIVS1-9.28A-pl10-r 45.38 33.72 0.77 18.16 1.24 0.07 99.96 90.07PIVS1-9.28A-pl11-c 51.30 29.93 0.73 13.67 3.78 0.26 99.87 67.80PIVS1-9.28A-pl11-r1 48.25 31.87 0.80 16.13 2.29 0.11 99.56 80.03PIVS1-9.28A-pl11-r2 47.42 31.41 0.81 15.83 2.28 0.14 98.03 78.51BH0703-P3-pl1-c 52.44 28.25 0.56 11.35 4.81 0.29 97.84 56.31BH0703-P3-pl1-r 55.22 26.90 0.56 10.30 5.28 0.35 98.77 51.10040303-1N-pl1-c 49.35 30.99 0.57 14.86 2.83 0.12 98.90 73.72040303-1N-pl1-r1 47.53 32.08 0.57 15.96 2.36 0.13 98.91 79.18040303-1N-pl1-i 47.96 32.41 0.61 16.50 2.07 0.10 100.03 81.88040303-2C-pl3 59.82 25.34 0.42 7.21 7.10 0.77 101.52 35.74040303-3B-pl1-c 51.71 29.05 0.65 12.46 4.25 0.29 98.65 61.84040303-3B-pl1-r1 53.99 27.91 0.52 10.96 4.83 0.29 98.67 54.38040303-3B-pl1-r2 54.97 26.87 0.59 10.24 5.41 0.40 98.60 50.81040303-3F-pl3-c 52.47 27.91 0.61 11.25 4.80 0.35 97.53 55.84040303-3F-pl3-r1 52.05 28.23 0.63 12.31 4.35 0.31 98.30 61.09040303-3F-pl3-r2 54.10 27.98 0.50 10.94 5.22 0.39 99.32 54.28⁎ r = rim; c = core; i = intermediate
Pyroxene compositions
Sample SiO2 Al2O3 TiO2 FeO MnO MgO CaO Na2O Total
BH07-03-P3-px1 52.04 1.57 0.49 9.04 0.68 15.66 18.80 0.35 98.64BH07-03-P3-px2 53.72 1.36 0.32 16.54 1.00 25.05 2.28 0.05 100.33BH07-03-P3-px3 51.38 2.52 0.61 8.61 0.58 15.26 20.19 0.41 99.58BH07-03-P3-px5 53.54 1.02 0.29 17.21 1.33 24.30 1.70 0.04 99.56
1025M.C.B. Arpa et al. / Journal of Volcanology and Geothermal Research 177 (2008) 1020–1034
(Fig. 3B). The plagioclase crystals are zoned, show sieved textureand have corroded edges. The second (enclave 2) consists of acicularplagioclase crystallites with one larger plagioclase (An49) lath. The third(enclave 3) is porphyritic with around 40% phenocrysts—mostlyplagioclase crystals (An76 to An93) that are zoned and resorbed andfew smaller clinopyroxene (Wo36En45Fs20 to Wo39En42Fs19) (Fig. 3C).
4.2. Pumice fragments—major- and trace-element compositions
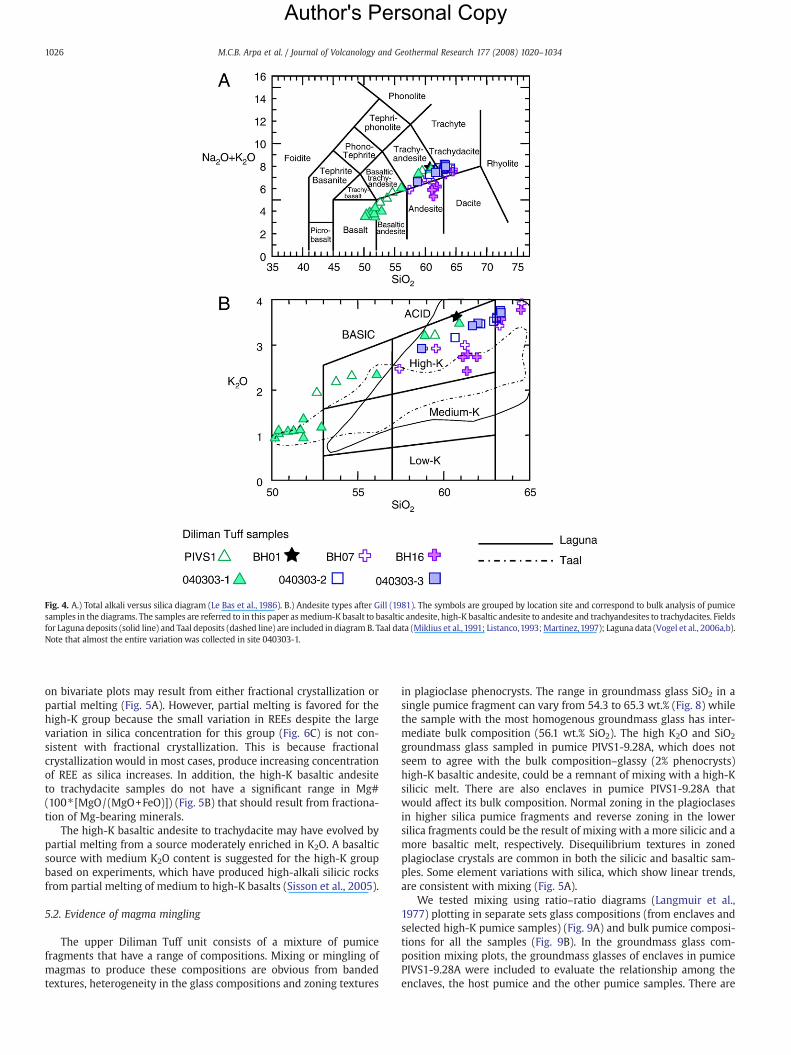
The pumice clasts for the upper Diliman Tuff unit have SiO2
concentrations (Table 1 and Electronic Supplement) that range frombasalt to trachydacite (50–65 wt.% SiO2) (Fig. 4A). Major elementvariations with silica show increasing trends for K2O (1–4 wt.%)and Na2O and decreasing trends for the other major elements (Figs. 4and 5A, Table 1 and Electronic Supplement). There are two groups ofpumice fragments initially identified based onK2O content. Fig. 5B andCshowtwogeneral clusterswhereinmajority of the samples belong to thehigh K2O group (high-K basaltic andesite to trachydacite) while themedium-K2O group includes basalt to basaltic andesite. This grouping isalso recognized on primitive mantle-normalized element abundancediagrams wherein the two groups show separate patterns (Fig. 6A–B).The medium-K basaltic group, samples collected from one outcroplocality (040303-1), shows distinctive positive spikes for U, La, and P andlower concentrations for large ion lithophile elements (LILE), such as Rb,
Ba, andPb compared to thehigh-K samples.Despite thesedifferences, allthe samples analyzed show a typical island arc chemical concentrationpatternwithpronounceddepletion inNbandTi and relative enrichmentin LILE.
Chondrite-normalized REE distributions for the medium-K andhigh-K samples in the 50 to 65 wt.% silica range (Fig. 6C) are similar.Note the very narrow range of REE compositions.
5. Discussions
5.1. Evaluation of crystal fractionation and partial melting
Before evaluating the basalt to trachydacite composition range interms of differentiation process it must be noted first that the twobasalt–basaltic andesite populations, high-K and medium-K (Figs. 4Band 5B–C) cannot be related to each other by fractional crystallization orpartial melting of the same source. This is readily apparent from simplebivariate plots using some incompatible elements and K2O (Fig. 7),which show that the differentiation trend from high-K basaltic andesiteto trachydacite excludes the medium-K basalt–basaltic andesite. Thetwo groups will thus be considered separately in the evaluations.
Based on the data available, some inferences can be made on thedominant processes that created the chemical variations observed inthe upper Diliman Tuff. Excluding the medium-K group, trends shown
Author's Personal Copy
Fig. 4. A.) Total alkali versus silica diagram (Le Bas et al., 1986). B.) Andesite types after Gill (1981). The symbols are grouped by location site and correspond to bulk analysis of pumicesamples in the diagrams. The samples are referred to in this paper asmedium-K basalt to basaltic andesite, high-K basaltic andesite to andesite and trachyandesites to trachydacites. Fieldsfor Laguna deposits (solid line) and Taal deposits (dashed line) are included in diagram B. Taal data (Miklius et al.,1991; Listanco,1993;Martinez,1997); Laguna data (Vogel et al., 2006a,b).Note that almost the entire variation was collected in site 040303-1.
1026 M.C.B. Arpa et al. / Journal of Volcanology and Geothermal Research 177 (2008) 1020–1034
on bivariate plots may result from either fractional crystallization orpartial melting (Fig. 5A). However, partial melting is favored for thehigh-K group because the small variation in REEs despite the largevariation in silica concentration for this group (Fig. 6C) is not con-sistent with fractional crystallization. This is because fractionalcrystallization would in most cases, produce increasing concentrationof REE as silica increases. In addition, the high-K basaltic andesiteto trachydacite samples do not have a significant range in Mg#(100⁎ [MgO/(MgO+FeO)]) (Fig. 5B) that should result from fractiona-tion of Mg-bearing minerals.
The high-K basaltic andesite to trachydacite may have evolved bypartial melting from a source moderately enriched in K2O. A basalticsource with medium K2O content is suggested for the high-K groupbased on experiments, which have produced high-alkali silicic rocksfrom partial melting of medium to high-K basalts (Sisson et al., 2005).
5.2. Evidence of magma mingling
The upper Diliman Tuff unit consists of a mixture of pumicefragments that have a range of compositions. Mixing or mingling ofmagmas to produce these compositions are obvious from bandedtextures, heterogeneity in the glass compositions and zoning textures
in plagioclase phenocrysts. The range in groundmass glass SiO2 in asingle pumice fragment can vary from 54.3 to 65.3 wt.% (Fig. 8) whilethe sample with the most homogenous groundmass glass has inter-mediate bulk composition (56.1 wt.% SiO2). The high K2O and SiO2
groundmass glass sampled in pumice PIVS1-9.28A, which does notseem to agree with the bulk composition–glassy (2% phenocrysts)high-K basaltic andesite, could be a remnant of mixing with a high-Ksilicic melt. There are also enclaves in pumice PIVS1-9.28A thatwould affect its bulk composition. Normal zoning in the plagioclasesin higher silica pumice fragments and reverse zoning in the lowersilica fragments could be the result of mixing with a more silicic and amore basaltic melt, respectively. Disequilibrium textures in zonedplagioclase crystals are common in both the silicic and basaltic sam-ples. Some element variations with silica, which show linear trends,are consistent with mixing (Fig. 5A).
We tested mixing using ratio–ratio diagrams (Langmuir et al.,1977) plotting in separate sets glass compositions (from enclaves andselected high-K pumice samples) (Fig. 9A) and bulk pumice composi-tions for all the samples (Fig. 9B). In the groundmass glass com-position mixing plots, the groundmass glasses of enclaves in pumicePIVS1-9.28A were included to evaluate the relationship among theenclaves, the host pumice and the other pumice samples. There are

Author's Personal Copy
Fig. 5. A.) Selectedmajor-element and trace-element variationwith silica that illustrate similarities and differences between upper Diliman Tuff (symbols), Laguna (solid line) and Taal (dashed line) deposits. Note a distinct field for Taal depositsin the Sr plot and for Laguna deposits in the Zr plot. Fields for the 3 data sets in FeO, MgO and TiO2 plots are more distinct for low-silica samples while they overlap for high-silica samples. B.) Mg# is higher for the upper Diliman Tuff comparedto Laguna deposits for the same amount of total alkalis. C.) In K2O/Na2O–Zr/Nb diagram—most of the high-K samples plot with Laguna deposits while the medium-K samples plot with Taal deposits. In diagrams B and C, two general clusters arerecognized in the upper Diliman Tuff samples; one group consists of medium-K basalt to basaltic andesite (encircled). Data fromMt. Mariveles and Mt. Natib (labeled, dashed line) are included to represent volcanoes from the Bataan Arc. Taaldata (Miklius et al., 1991; Listanco, 1993; Martinez, 1997); Laguna data (Vogel et al., 2006a,b); Mariveles and Natib data (Defant et al., 1991).
1027M.C.B.A
rpaet
al./Journal
ofVolcanology
andGeotherm
alResearch
177(2008)
1020–1034

Author's Personal Copy
Fig. 6. Primitivemantle-normalized trace-element diagrams. A.) for themedium-K low-silica group (50–53 wt.% SiO2). B.) high-K high-silica (shown here: 57–65 wt.% SiO2)group. Although both show a typical island-arc pattern with Nb and Ti depletion, thereare differences in pattern for the two groups particularly for Rb, Ba, K, Pb and P. Pumicesamples from Laguna with the same silica range are plotted for comparison. Comparedto upper Diliman, a distinct pattern is seen for the low-silica samples (A). C.) Chondrite-normalized REE diagrams for the upper Diliman Tuff high-K group. Note a tight patterndespite the range in silica (53–65 wt.%). Only the high-K samples in the specified SiO2
limit are plotted for purposes of interpretation and comparison however, the narrowrange in REE is maintained even when all the samples are plotted (50–65 wt.% SiO2). Incomparison, the Laguna samples show awider range in REE wherein in general, there isincreasing REE concentrations with increasing SiO2 values. Laguna data (Vogel et al.,2006a,b).
1028 M.C.B. Arpa et al. / Journal of Volcanology and Geothermal Research 177 (2008) 1020–1034
two mixing curves shown for the groundmass glass (Fig. 9A). The firstis mixing among most of the groundmass from pumice samples.The second ismixing among pumice sample PIVS1-9.28A and enclaves1 and 3. In the plots using K2O, all groundmass glass analyses forthe pumice fragments occur along the mixing line that has as endmembers the highest and the lowest groundmass glass silica found ina single pumice fragment (BH07-03-C-gm1 and BH07-03-C-gm4; 54.3to 65.3 wt.% SiO2) except for pumice PIVS1-9.28A groundmass glass.This composition (PIVS1-9.28A groundmass glass) occurs along themixing trend with enclave 1 and enclave 3 groundmass glass com-positions. This shows that residual melts in enclave 1, which are highin K2O and SiO2, mingled with the host pumice. Using MgO as aparameter, all groundmass glass analyses for the pumice fragmentsnow correlate with the first mixing line and enclave 1 occurs with therest of the pumice samples while the other enclave analyses correlatewith the second mixing line. MgO values are low for enclaves 2 and 3groundmass glass indicating that these melts have not mixed withhigher MgO melts from the other pumice samples. The plotting ofenclaves 2 and 3 with the pumice glass in the K2O diagrams is notinterpreted as mixing but rather as similar K values for the sources ofthe magmas.
The mixing models for the bulk pumice compositions includecalculated bulk enclave 1 composition (Table 3). We used as one endmember calculated bulk composition for enclave 1 and for the otherend member, the most evolved pumice composition. The bulkcomposition of enclave 1 was calculated from the average of themicroprobe analysis of the components (minerals and groundmassglass) and abundance of components estimated from petrography.Enclave 1 is too small for the analytical method used here to get bulkcompositions. Calculating for the bulk composition has large errorshowever, an estimate of enclave bulk composition is importantbecause enclaves could represent source materials. All pumicebulk compositions can be correlated with the mixing line havingbulk enclave 1 as an end member (Fig. 9B). In the plot using MgOhowever, some from the medium-K basaltic group fall off the trendwith the outliers mimicking the trend for enclave 3 groundmass inthe similar plot for groundmass glass. The mixing models show thata certain degree of mixing occurred for all pumice fragments in thedata set.
In order to further evaluate this mixing model, polytopic vectoranalyses was used. The application of polytopic vector analysis(PVA) to petrologic problems was recently discussed by Vogel et al.(2008) and the following discussion is taken from this paper.Polytopic vector analysis is a type of principal component procedurethat can be used to evaluate mixing or unmixing (fractional crystal-lization) in geologic systems using the entire major and traceelements simultaneously. It differs from other principal componenttechniques in that it not only determines the number of endmembers and their compositions, but also partitions the relativeproportions of the end members into each sample. It is theproportions of end members that can be used as input in othermultivariate analyses in order to evaluate magmatic processes(e.g. Fig. 10A). PVA is used to determine three essential parametersin a mixing system: 1) the minimum number of end members, 2)the compositions of the end members (Table 4), and 3) the relativeproportions of each source in all samples (Table 5). In PVA a veryuseful parameter is the coefficient of determination, whichevaluates the predicted concentration versus the actual concentra-tion of an analyte in a sample. This allows the researcher to evaluateand eliminate samples that may have poor analyses or are altered.Data screening involves removal of extreme outlier samples thatmay reflect secondary alteration, sample contamination, analyticaldetection, or simply samples that are geochemically distinctfrom the bulk of the dataset. In the present study three sampleswere removed because they were outliers on plots of predictedversus actual concentrations. The proportion of end members in the

Author's Personal Copy
Fig. 7. Selected incompatible element variation diagrams with K2O show distinct trends for the medium-K basalt–basaltic andesite group.
1029M.C.B. Arpa et al. / Journal of Volcanology and Geothermal Research 177 (2008) 1020–1034
samples (Table 5) is a way to evaluate all of the chemical variationin a sample simultaneously. Fig. 10A is a triangular diagram inwhich the samples with respect to the proportion of end membersare plotted. It can be seen that the medium-K basalts to basalticandesites form their own group, near end member 2 (EM2—41% SiO2).The other samples form a broad band parallel to the more silicicend members (EM1 and EM3). An example of the compositions of theend members, compared to the samples, is shown in Fig. 10B. Thecompositions of the end members are shown in Table 4. PVA
Fig. 8. Significant variation in glass silica for pumice samples with probe analysissupports mingling.
always calculates end members that are more extreme than the actualsamples (Vogel et al., 2008)—the end member compositions must falloutside of the actual data array.
PVA analyses are consistent with themodelling shown in Fig. 9 andthe textural observations. However, themixingmodel present in Fig. 9is based entirely on major element compositions of bulk and glassmatrix of pumice, whereas the PVA results are based on all of thechemical data for all samples—a much more robust data set. Thedominant mixing is among the high-K samples that form the broadtrend parallel to the EM1 and EM3 samples. However, most sampleshavemixed with the basaltic endmember (EM2). All of the medium-Kbasalt and basaltic andesite samples have mixed with magmas thatrepresent mixtures of EM1 and EM3 magmas. The composition ofthe end members with respect to composition of the samples areillustrated in Fig. 10B and C.
5.3. Source comparison with Taal and Laguna Caldera
Correlation of the upper Diliman Tuff unit to a known volcaniccenter is an important part of the volcanic hazard assessment forMetroManila. Studies of pyroclastic flow deposits of the Diliman Tuff havesuggested that the volcanic source of the deposits is Laguna Caldera(Zanoria,1988; Catane and Arpa,1998). Another possible source centerfor the pyroclastic deposits is Taal Caldera, an active system to thesouth. The inactive Laguna Caldera volcanic system (PHIVOLCS Catalogof PhilippineVolcanoes, 2007) has a lowerhazard probability onMetroManila compared with the active Taal Caldera. Based on stratigraphy,the DilimanTuff is older than the youngest calderagenic deposit of TaalCaldera but does not necessarily discount a Taal Caldera source vent.

Author's Personal Copy
Fig. 9. A.) Test for mixing on ratio–ratio plots using groundmass glass compositions. The groundmass glass plots include groundmass glass analysis from 9 pumice samples and analysis from enclaves in pumice PIVS1-9.28A. Groundmass glassin pumice BH07-03-C (cross symbol) has the largest chemical variation and using as end members groundmass glass from this pumice (BH07-03-C gm1 and gm4) produces a mixing line which runs through all the pumice groundmass glassanalyses (solid line area) except groundmass glass from pumice PIVS1-9.28A (triangle symbol) in the plots having K2O as a parameter. The second mixing line uses as end members groundmass glass from enclave 3 (star symbol) and hostpumice PIVS1-9.28A. B.) Bulk pumice compositions plotted separately on the same set of diagrams using the same parameters. Calculated bulk composition of enclave 1 (Table 3) is included in the diagrams.
1030M.C.B.A
rpaet
al./Journal
ofVolcanology
andGeotherm
alResearch
177(2008)
1020–1034

Author's Personal Copy
Table 3Calculated bulk composition for enclave 1 in pumice PIVS1-9.28A using average component compositions (plagioclase, pyroxene, magnetite and groundmass glass). Componentpercentage was estimated based on petrography
Calculated bulk enclave 1 composition
SiO2 Al2O3 TiO2 FeO MnO MgO CaO Na2O K2O Total % Component
e1 pl (average) 52.67 28.72 0.56 12.11 4.48 0.35 98.89 0.60e1 px (average) 51.86 2.08 0.30 11.57 0.50 14.71 19.14 0.31 100.48 0.21e1 ox (average) 0.18 4.33 7.43 78.88 0.44 3.04 0.17 94.46 0.15e1gm (average) 59.06 14.87 0.63 7.63 0.18 1.90 3.94 3.30 4.61 96.12 0.04Bulk e1 44.88 18.91 1.20 14.91 0.18 3.62 11.47 2.88 0.39 98.45
1031M.C.B. Arpa et al. / Journal of Volcanology and Geothermal Research 177 (2008) 1020–1034
The chemical composition of large-volume pyroclastic depositsfrom vents in nearby Taal Caldera (Miklius et al., 1991; Listanco, 1993;Martinez,1997) and LagunaCaldera (Vogel et al., 2006a,b)were plottedwith the samples from this study for comparison (Figs. 4B, 5, 6). Thesamples fromTaal Caldera include deposits from the caldera formationphases (Listanco, 1993; Martinez, 1997) and resurgent volcanism(Volcano Island) (Miklius et al., 1991) whereas samples from LagunaCaldera were taken from several pyroclastic flow deposits comprisingof at least 3 units. Overlaps and separate fields are apparent for the 3data groups as seen from bivariate plots (Figs. 4B and 5A). The separatefields (for K2O, MgO, TiO2 and Sr) are more distinct on the low-silicaend while samples appear to converge on the high-silica end, whichproduces a unique differentiation trend (field and slope) for each dataset. Only the high-silica samples of the upper Diliman Tuff and LagunaCaldera are similar (Fig. 6A and B). The low-silica samples also showdifferent patterns in the Chondrite-normalized REE distributiondiagram (Fig. 6C) particularly distinct are the lower concentrationsand a positive Eu anomaly for Laguna.
The difference between the Laguna Caldera deposits and theupper Diliman Tuff can be seen more clearly from TiO2, MgO and Zr
Fig. 10. Test for mixing using polytopic vector analyses. A.) Sample compositions expressed aare shown by SiO2 %, which are in brackets. Note that there are two mixing trends: one paralandesite samples. B.) Composition of end members plotted on a Zr–K2O diagram. See text f
concentrations (Fig. 5A). Particularly, the Laguna samples show a morenegative slope in the TiO2–SiO2 plot, which may indicate fractionation ofTi–Fe oxides. In contrast, the almost constant slope for the upper DilimanTuff in this plot is consistent with the absence of ilmenite in the low-silicapumice samples. In comparing samples with the same range of SiO2
and total alkalis, the upper Diliman Tuff samples have higher Mg# andthus, aremoreprimitive than the Laguna samples (Fig. 5B). These chemicaldifferences are inconsistent with the source of these pyroclastic depositsbeing the Laguna Caldera vent.
The field for Taal deposits is most distinct in terms of Sr with lowerSr concentrations and a different slope compared to upper DilimanTuff (Fig. 5A). Based simply on Sr and the lower alkali values, themagmatic source of the upper DilimanTuff is different from the sourceof the deposits from Taal Caldera.
No definite conclusions can be made on the location of the sourcevent for the upper Diliman Tuff. However, high LILE concentrations inthe high-K group are similarwith Laguna Caldera deposits and indicatethat the source vent is not along the Bataan Arc, but further towardsthe backarc (Fig. 1). There are differences between rocks from BataanArc volcanoes andMacolodCorridor volcanoes based on LILE, LREE and
s a proportion of end members calculated with PVA (composition of end members (EM)lel to the EM1–EM3 composition and another with the medium K2O basalt and basalticor discussion. C.) Composition of end members plotted on a Na2O+K2O–SiO2 diagram.
Author's Personal Copy
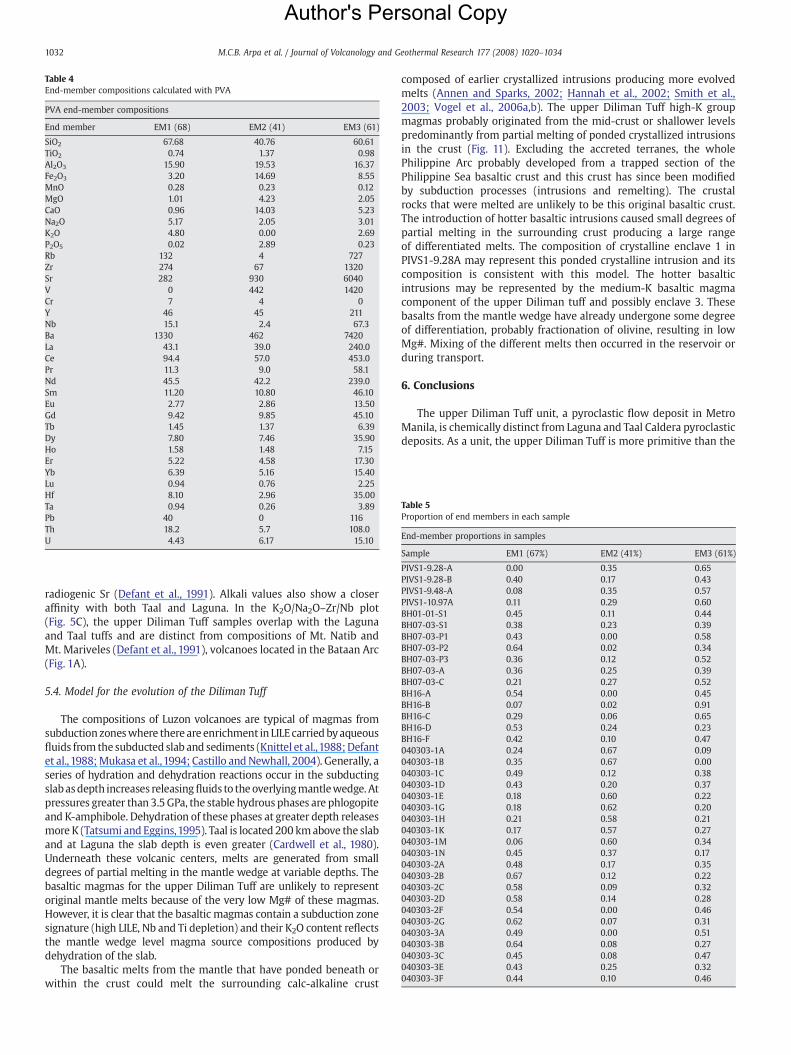
Table 4End-member compositions calculated with PVA
PVA end-member compositions
End member EM1 (68) EM2 (41) EM3 (61)
SiO2 67.68 40.76 60.61TiO2 0.74 1.37 0.98Al2O3 15.90 19.53 16.37Fe2O3 3.20 14.69 8.55MnO 0.28 0.23 0.12MgO 1.01 4.23 2.05CaO 0.96 14.03 5.23Na2O 5.17 2.05 3.01K2O 4.80 0.00 2.69P2O5 0.02 2.89 0.23Rb 132 4 727Zr 274 67 1320Sr 282 930 6040V 0 442 1420Cr 7 4 0Y 46 45 211Nb 15.1 2.4 67.3Ba 1330 462 7420La 43.1 39.0 240.0Ce 94.4 57.0 453.0Pr 11.3 9.0 58.1Nd 45.5 42.2 239.0Sm 11.20 10.80 46.10Eu 2.77 2.86 13.50Gd 9.42 9.85 45.10Tb 1.45 1.37 6.39Dy 7.80 7.46 35.90Ho 1.58 1.48 7.15Er 5.22 4.58 17.30Yb 6.39 5.16 15.40Lu 0.94 0.76 2.25Hf 8.10 2.96 35.00Ta 0.94 0.26 3.89Pb 40 0 116Th 18.2 5.7 108.0U 4.43 6.17 15.10
Table 5Proportion of end members in each sample
End-member proportions in samples
Sample EM1 (67%) EM2 (41%) EM3 (61%)
PIVS1-9.28-A 0.00 0.35 0.65PIVS1-9.28-B 0.40 0.17 0.43PIVS1-9.48-A 0.08 0.35 0.57PIVS1-10.97A 0.11 0.29 0.60BH01-01-S1 0.45 0.11 0.44BH07-03-S1 0.38 0.23 0.39BH07-03-P1 0.43 0.00 0.58BH07-03-P2 0.64 0.02 0.34BH07-03-P3 0.36 0.12 0.52BH07-03-A 0.36 0.25 0.39BH07-03-C 0.21 0.27 0.52BH16-A 0.54 0.00 0.45BH16-B 0.07 0.02 0.91BH16-C 0.29 0.06 0.65BH16-D 0.53 0.24 0.23BH16-F 0.42 0.10 0.47040303-1A 0.24 0.67 0.09040303-1B 0.35 0.67 0.00040303-1C 0.49 0.12 0.38040303-1D 0.43 0.20 0.37040303-1E 0.18 0.60 0.22040303-1G 0.18 0.62 0.20040303-1H 0.21 0.58 0.21040303-1K 0.17 0.57 0.27040303-1M 0.06 0.60 0.34040303-1N 0.45 0.37 0.17040303-2A 0.48 0.17 0.35040303-2B 0.67 0.12 0.22040303-2C 0.58 0.09 0.32040303-2D 0.58 0.14 0.28040303-2F 0.54 0.00 0.46040303-2G 0.62 0.07 0.31040303-3A 0.49 0.00 0.51040303-3B 0.64 0.08 0.27040303-3C 0.45 0.08 0.47040303-3E 0.43 0.25 0.32040303-3F 0.44 0.10 0.46
1032 M.C.B. Arpa et al. / Journal of Volcanology and Geothermal Research 177 (2008) 1020–1034
radiogenic Sr (Defant et al., 1991). Alkali values also show a closeraffinity with both Taal and Laguna. In the K2O/Na2O–Zr/Nb plot(Fig. 5C), the upper Diliman Tuff samples overlap with the Lagunaand Taal tuffs and are distinct from compositions of Mt. Natib andMt. Mariveles (Defant et al., 1991), volcanoes located in the Bataan Arc(Fig. 1A).
5.4. Model for the evolution of the Diliman Tuff
The compositions of Luzon volcanoes are typical of magmas fromsubductionzoneswhere there are enrichment in LILEcarriedbyaqueousfluids from the subducted slab and sediments (Knittel et al.,1988;Defantet al.,1988;Mukasa et al.,1994; Castillo andNewhall, 2004). Generally, aseries of hydration and dehydration reactions occur in the subductingslabasdepth increases releasingfluids to the overlyingmantlewedge. Atpressures greater than 3.5GPa, the stable hydrous phases are phlogopiteand K-amphibole. Dehydration of these phases at greater depth releasesmore K (Tatsumi and Eggins,1995). Taal is located 200 kmabove the slaband at Laguna the slab depth is even greater (Cardwell et al., 1980).Underneath these volcanic centers, melts are generated from smalldegrees of partial melting in the mantle wedge at variable depths. Thebasaltic magmas for the upper Diliman Tuff are unlikely to representoriginal mantle melts because of the very low Mg# of these magmas.However, it is clear that the basaltic magmas contain a subduction zonesignature (high LILE, Nb and Ti depletion) and their K2O content reflectsthe mantle wedge level magma source compositions produced bydehydration of the slab.
The basaltic melts from the mantle that have ponded beneath orwithin the crust could melt the surrounding calc-alkaline crust
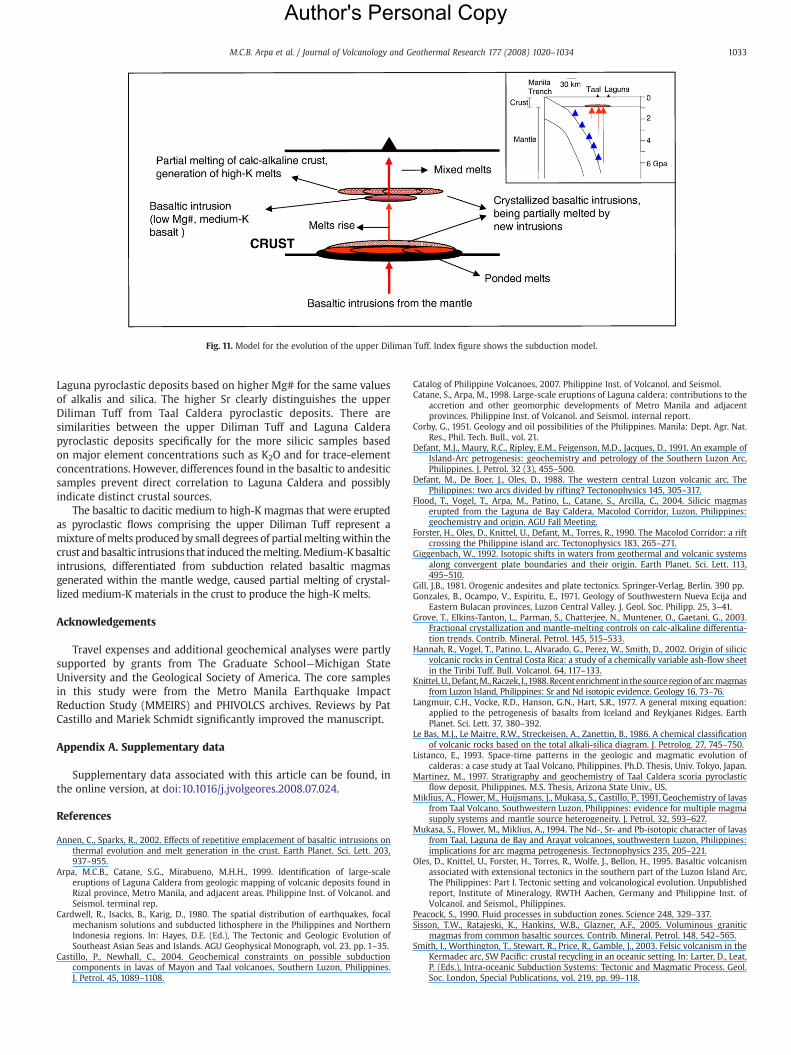
composed of earlier crystallized intrusions producing more evolvedmelts (Annen and Sparks, 2002; Hannah et al., 2002; Smith et al.,2003; Vogel et al., 2006a,b). The upper Diliman Tuff high-K groupmagmas probably originated from the mid-crust or shallower levelspredominantly from partial melting of ponded crystallized intrusionsin the crust (Fig. 11). Excluding the accreted terranes, the wholePhilippine Arc probably developed from a trapped section of thePhilippine Sea basaltic crust and this crust has since been modifiedby subduction processes (intrusions and remelting). The crustalrocks that were melted are unlikely to be this original basaltic crust.The introduction of hotter basaltic intrusions caused small degrees ofpartial melting in the surrounding crust producing a large rangeof differentiated melts. The composition of crystalline enclave 1 inPIVS1-9.28A may represent this ponded crystalline intrusion and itscomposition is consistent with this model. The hotter basalticintrusions may be represented by the medium-K basaltic magmacomponent of the upper Diliman tuff and possibly enclave 3. Thesebasalts from the mantle wedge have already undergone some degreeof differentiation, probably fractionation of olivine, resulting in lowMg#. Mixing of the different melts then occurred in the reservoir orduring transport.
6. Conclusions
The upper Diliman Tuff unit, a pyroclastic flow deposit in MetroManila, is chemically distinct from Laguna and Taal Caldera pyroclasticdeposits. As a unit, the upper Diliman Tuff is more primitive than the
Author's Personal Copy
Fig. 11. Model for the evolution of the upper Diliman Tuff. Index figure shows the subduction model.
1033M.C.B. Arpa et al. / Journal of Volcanology and Geothermal Research 177 (2008) 1020–1034
Laguna pyroclastic deposits based on higher Mg# for the same valuesof alkalis and silica. The higher Sr clearly distinguishes the upperDiliman Tuff from Taal Caldera pyroclastic deposits. There aresimilarities between the upper Diliman Tuff and Laguna Calderapyroclastic deposits specifically for the more silicic samples basedon major element concentrations such as K2O and for trace-elementconcentrations. However, differences found in the basaltic to andesiticsamples prevent direct correlation to Laguna Caldera and possiblyindicate distinct crustal sources.
The basaltic to dacitic medium to high-K magmas that were eruptedas pyroclastic flows comprising the upper Diliman Tuff represent amixture ofmelts produced by small degrees of partialmeltingwithin thecrust andbasaltic intrusions that induced themelting.Medium-Kbasalticintrusions, differentiated from subduction related basaltic magmasgenerated within the mantle wedge, caused partial melting of crystal-lized medium-K materials in the crust to produce the high-K melts.
Acknowledgements
Travel expenses and additional geochemical analyses were partlysupported by grants from The Graduate School—Michigan StateUniversity and the Geological Society of America. The core samplesin this study were from the Metro Manila Earthquake ImpactReduction Study (MMEIRS) and PHIVOLCS archives. Reviews by PatCastillo and Mariek Schmidt significantly improved the manuscript.
Appendix A. Supplementary data
Supplementary data associated with this article can be found, inthe online version, at doi:10.1016/j.jvolgeores.2008.07.024.
References
Annen, C., Sparks, R., 2002. Effects of repetitive emplacement of basaltic intrusions onthermal evolution and melt generation in the crust. Earth Planet. Sci. Lett. 203,937–955.
Arpa, M.C.B., Catane, S.G., Mirabueno, M.H.H., 1999. Identification of large-scaleeruptions of Laguna Caldera from geologic mapping of volcanic deposits found inRizal province, Metro Manila, and adjacent areas. Philippine Inst. of Volcanol. andSeismol. terminal rep.
Cardwell, R., Isacks, B., Karig, D., 1980. The spatial distribution of earthquakes, focalmechanism solutions and subducted lithosphere in the Philippines and NorthernIndonesia regions. In: Hayes, D.E. (Ed.), The Tectonic and Geologic Evolution ofSoutheast Asian Seas and Islands. AGU Geophysical Monograph, vol. 23, pp. 1–35.
Castillo, P., Newhall, C., 2004. Geochemical constraints on possible subductioncomponents in lavas of Mayon and Taal volcanoes, Southern Luzon, Philippines.J. Petrol. 45, 1089–1108.
Catalog of Philippine Volcanoes, 2007. Philippine Inst. of Volcanol. and Seismol.Catane, S., Arpa, M., 1998. Large-scale eruptions of Laguna caldera: contributions to the
accretion and other geomorphic developments of Metro Manila and adjacentprovinces. Philippine Inst. of Volcanol. and Seismol. internal report.
Corby, G., 1951. Geology and oil possibilities of the Philippines. Manila: Dept. Agr. Nat.Res., Phil. Tech. Bull., vol. 21.
Defant, M.J., Maury, R.C., Ripley, E.M., Feigenson, M.D., Jacques, D., 1991. An example ofIsland-Arc petrogenesis: geochemistry and petrology of the Southern Luzon Arc,Philippines. J. Petrol. 32 (3), 455–500.
Defant, M., De Boer, J., Oles, D., 1988. The western central Luzon volcanic arc, ThePhilippines: two arcs divided by rifting? Tectonophysics 145, 305–317.
Flood, T., Vogel, T., Arpa, M., Patino, L., Catane, S., Arcilla, C., 2004. Silicic magmaserupted from the Laguna de Bay Caldera, Macolod Corridor, Luzon, Philippines:geochemistry and origin. AGU Fall Meeting.
Forster, H., Oles, D., Knittel, U., Defant, M., Torres, R., 1990. The Macolod Corridor: a riftcrossing the Philippine island arc. Tectonophysics 183, 265–271.
Giggenbach, W., 1992. Isotopic shifts in waters from geothermal and volcanic systemsalong convergent plate boundaries and their origin. Earth Planet. Sci. Lett. 113,495–510.
Gill, J.B., 1981. Orogenic andesites and plate tectonics. Springer-Verlag, Berlin. 390 pp.Gonzales, B., Ocampo, V., Espiritu, E., 1971. Geology of Southwestern Nueva Ecija and
Eastern Bulacan provinces, Luzon Central Valley. J. Geol. Soc. Philipp. 25, 3–41.Grove, T., Elkins-Tanton, L., Parman, S., Chatterjee, N., Muntener, O., Gaetani, G., 2003.
Fractional crystallization and mantle-melting controls on calc-alkaline differentia-tion trends. Contrib. Mineral. Petrol. 145, 515–533.
Hannah, R., Vogel, T., Patino, L., Alvarado, G., Perez, W., Smith, D., 2002. Origin of silicicvolcanic rocks in Central Costa Rica: a study of a chemically variable ash-flow sheetin the Tiribi Tuff. Bull. Volcanol. 64, 117–133.
Knittel,U., Defant,M.,Raczek, I.,1988. Recentenrichment in thesourceregionof arcmagmasfrom Luzon Island, Philippines: Sr and Nd isotopic evidence. Geology 16, 73–76.
Langmuir, C.H., Vocke, R.D., Hanson, G.N., Hart, S.R., 1977. A general mixing equation:applied to the petrogenesis of basalts from Iceland and Reykjanes Ridges. EarthPlanet. Sci. Lett. 37, 380–392.
Le Bas, M.J., Le Maitre, R.W., Streckeisen, A., Zanettin, B., 1986. A chemical classificationof volcanic rocks based on the total alkali-silica diagram. J. Petrolog. 27, 745–750.
Listanco, E., 1993. Space-time patterns in the geologic and magmatic evolution ofcalderas: a case study at Taal Volcano, Philippines. Ph.D. Thesis, Univ. Tokyo, Japan.
Martinez, M., 1997. Stratigraphy and geochemistry of Taal Caldera scoria pyroclasticflow deposit, Philippines. M.S. Thesis, Arizona State Univ., US.
Miklius, A., Flower, M., Huijsmans, J., Mukasa, S., Castillo, P., 1991. Geochemistry of lavasfrom Taal Volcano, Southwestern Luzon, Philippines: evidence for multiple magmasupply systems and mantle source heterogeneity. J. Petrol. 32, 593–627.
Mukasa, S., Flower, M., Miklius, A., 1994. The Nd-, Sr- and Pb-isotopic character of lavasfrom Taal, Laguna de Bay and Arayat volcanoes, southwestern Luzon, Philippines:implications for arc magma petrogenesis. Tectonophysics 235, 205–221.
Oles, D., Knittel, U., Forster, H., Torres, R., Wolfe, J., Bellon, H., 1995. Basaltic volcanismassociated with extensional tectonics in the southern part of the Luzon Island Arc,The Philippines: Part I. Tectonic setting and volcanological evolution. Unpublishedreport, Institute of Mineralogy, RWTH Aachen, Germany and Philippine Inst. ofVolcanol. and Seismol., Philippines.
Peacock, S., 1990. Fluid processes in subduction zones. Science 248, 329–337.Sisson, T.W., Ratajeski, K., Hankins, W.B., Glazner, A.F., 2005. Voluminous granitic
magmas from common basaltic sources. Contrib. Mineral. Petrol. 148, 542–565.Smith, I., Worthington, T., Stewart, R., Price, R., Gamble, J., 2003. Felsic volcanism in the
Kermadec arc, SW Pacific: crustal recycling in an oceanic setting. In: Larter, D., Leat,P. (Eds.), Intra-oceanic Subduction Systems: Tectonic and Magmatic Process. Geol.Soc. London, Special Publications, vol. 219, pp. 99–118.

Author's Personal Copy
1034 M.C.B. Arpa et al. / Journal of Volcanology and Geothermal Research 177 (2008) 1020–1034
Tatsumi, Y., 1989. Migration of fluid phases and genesis of basalt magmas in subductionzones. J. Geophys. Res. 94, 4697–4707.
Tatsumi, Y., Eggins, S., 1995. Subduction ZoneMagmatism. Blackwell Sci., Malden, Mass.,p. 109.
Teves, J., Gonzales, M., 1950. The geology of the university site — Balara area, QuezonCity. Philipp. Geol. 4, 1–10.
Vogel, T., Patino, L., Alvarado, G., Gans, P., 2004. Silicic ignimbrites within the Costa Ricanvolcanic front: evidence for the formation of continental crust. Earth Planet. Sci.Lett. 226, 149–159.
Vogel, T.A., Flood, T.P., Patino, L.C., Wilmot, M.S., Maximo, R.P.R., Arpa, C.B., Arcilla, C.,Stimac, J.A., 2006a. Geochemistry of silicic magmas in the Macolod Corridor, SWLuzon, Philippines: evidence of distinct, mantle-derived, crustal sources for silicicmagmas. Contrib. Mineral. Petrol. 151, 267–281.
Vogel, T.A., Patino, L.C., Eaton, J.K., Valley, J.W., Rose, W.I., Alvarado, G.E., Viray, E.L.,2006b. Origin of silicic magmas along the Central American volcanic front: geneticrelationship to mafic melts. J. Volcanol. Geotherm. Res. 156, 206–228.
Vogel, T.A., Hidalgo, P.J., Patino, L.C., Tefend, K.S., Ehrlich, R., 2008. Evaluation of magmamixing and fractional crystallization using whole-rock chemical analyses: polytopicvector analyses. Geochem. Geophys. Geosyst. 9, Q04020. doi:10.1029/2007GC001790.
Wolfe, J., Self, S., 1983. Structural lineaments and Neogene volcanism in southwesternLuzon. In: Hayes, D.E. (Ed.), The Tectonic and Geologic Evolution of Southeast AsianSeas and Islands, Part 2. Am. Geophys. Union Geophys.Monogr., vol. 27, pp.157–172.
Zanoria, E., 1988. The depositional and volcanological origin of the Dilimanvolcaniclastic formation, Southwestern Luzon, Philippines. Thesis. Univ. Illinois,Chicago.