The Balanced Scorecard as performance measurement and personal development tool in a steel...
140
The Balanced Scorecard as performance measurement and personal development tool in a steel organisation Andre van Staden Student number 10468625 B Engineering (Electrical and Electronic) Mini Dissertation in partial Fulfillment of the Requirements for the Degree MASTER IN BUSINESS ADMINISTRATION in the FACULTY OF ECONOMICS AND MANAGEMENT SCIENCE at the NORTH WEST UNIVERSITY, VANDERBIJLPARK CAMPUS Study leader: Prof. Anet Smit Vanderbijlpark 2009
-
Upload
independent -
Category
Documents
-
view
1 -
download
0
Transcript of The Balanced Scorecard as performance measurement and personal development tool in a steel...
The Balanced Scorecard as performance measurement
and personal development tool in a steel organisation
Andre van Staden
Student number 10468625
B Engineering (Electrical and Electronic)
Mini Dissertation in partial Fulfillment of the Requirements
for the Degree
MASTER IN BUSINESS ADMINISTRATION
in the
FACULTY OF ECONOMICS AND MANAGEMENT SCIENCE
at the
NORTH WEST UNIVERSITY, VANDERBIJLPARK CAMPUS
Study leader: Prof. Anet Smit
Vanderbijlpark
2009

ACKNOWLEDGEMENTS
The following deserve my sincere gratitude.
• My Lord , who have blessed me with such grace.
• My wife Bernadene, my sons Jonathan and Daryll who have been so patient and
supportive during my study years.
• The people working in my own department within ArcelorMittal who did my work
during times when I had to take study leave or write exams.
• My fellow MBA study group members (Jenny, Nanette, Peter, Nic and Clinton)
who have throughout the 3 years been a strength of support, trust and
encouragement.
• Professor Anet Smit for her leadership, support and guidance.
• The Management at ArcelorMittal , Vanderbijlpark Works, for allowing me to do
my MBA and to do this research within the company.
• The HR department in ArcelorMittal , Vanderbijlpark Works, for assisting with the
field work to collect the research data.
• The various unions and fellow workers at ArcelorMittal, Vanderbijlpark Works, for
their assistance and motivation in the completion of the questionnaire.
• Everybody at the North West University who contributed towards my education
during the past 3 years.
• Dr JC Huebsch for the professional editing and proofreading of this manuscript.

ABSTRACT
The Balanced Scorecard (BSC) is a strategic management tool that provides the
manager with a clear and concise picture of the business's health and progress in
reaching the goals of the business (Norton & Kaplan , 1992: 71-79). The BSC is a set
of financial and non-financial measures relating to a company's critical success
factors. Of late the BSC was also used as a personal development tool - measuring
the individual's performance towards set personal growth targets.
The BSC process has been part of ArcelorMittal , Vanderbijlpark Works for many
years. This process can add great value to a company if managed effectively- the
question is thus: is the BSC effectively implemented in ArcelorMittal, Vanderbijlpark
Works?
It was decided to conduct a study to determine the status of the BSC with one main
objective and two secondary objectives, namely to -
• establish whether ArcelorMittal , Vanderbijlpark Works is effectively using the
BSC tool as a performance measurement, and a personal development tool (main
objective);
• determine if there is a difference between the effective implementation of the
BSC as a performance management and personal development tool within the
different business units within ArcelorMittal, Vanderbijlpark Works. These units are
Iron Making, Steel Making, Roll ing, Engineering and Staff (Secondary objective 1 );
and
• determine if there is a difference between the effective implementation of the
BSC as a performance management and personal development tool between
different role gradings (these roles are defined as E, F and G roles) in ArcelorMittal ,
Vanderbijlpark Works (Secondary objective 2).
An empirical study was conducted in ArcelorMittal , Vanderbijlpark Works. A
questionnaire was used as the measuring instrument and was issued via the HR
Department to a target group of 724 employees. The questionnaires consisted of 25

questions divided into 2 sections to test both the effectiveness of the BSC as a
performance management tool and a personal development tool.
To analyse the data, descriptive statistics and frequency distributions were used and
calculated in Microsoft PHStat. From these results the following conclusions were
drawn.
• The BSC process is well entrenched in ArcelorMittal , Vanderbijlpark Works, but
lacks overall effectiveness;
• The BSC does encourage people to self-develop, but development plans are
lacking , not enough time for training is given and managers must show a real
intent to develop their people.
From the study and the conclusions drawn, the following recommendations were
made.
• Address the issue of mistrust between the employees and their supervisory
management.
• Managers should make allowance for individuals to make mistakes.
• Encourage innovation in the organisation.
• More effort should be applied to translate the company strategic objectives into
workable (and measurable) KPI 's at the lower levels of the organisation.
• ArcelorMittal should make a concerned effort to allow more time for training and
self-development during normal working hours.
• Revisit all KPI's for weight allocation. All the departments and all the levels in the
organisation see this as a drawback of the BSC system.
• Test the applicability of the KPis. Ensure that the KPis on the BSC are clear and
that these reflect the effort the company requires form the individual.
• Allow more participation of the individual during the compilation of the BSC (this
will improve buy-in).
• The E-role level communicates very well downwards to the lower levels in the
organisation. Take key learning aspects from this group, and skill the F-role and
G-role levels to the same extent.

ABBREVIATIONS
BSC - Balanced Scorecard
BU - Business Unit
SAP - Systems Applications Products
HR- Human Resources
KPI- Key Performance Indicator
SHERQ- Safety, Health, Environment, Risk, Quality
IT- Information Technology
IM - Information Management

TABLE OF CONTENT
CHAPTER 1: NATURE AND SCOPE OF STUDY 1
1.1 INTRODUCTION 1
1.2 PROBLEM STATEMENT 2
1.3 OBJECTIVES OF THE STUDY 2
1.3.1 Primary objectives 3
1.3.2 Secondary objectives 3
1.4 SCOPE OF THE STUDY 3
1.5 RESEARCH METHOD 4
1.5.1 Phase1 : Literature review 4
1.5.2 Phase 2: Empirical study 5
1.5.2.1 Research design 5
1.5.2.2 Participants 6
1.5.2.3 Measuring instrument 6
1.5.2.4 Statistical analysis 6
1.6 LIMITATIONS AND ANTICIPATED PROBLEMS 6
1.7 LAYOUT OF THE STUDY 7
1.8 CHAPTER SUMMARY 7
CHAPTER 2: LITERATURE STUDY 9
2.1 INTRODUCTION 9
2.2 ORIGIN OF THE BALANCED SCORECARD 9
2.3 DEFINTIONS OF THE BALANCED SCORECARD 10
2.4 THE NEED FOR A BALANCED SCORECARD 12
2.5 THE BENEFITS OF A BALANCED SCORECARD 13
2.6 THE COMPONENTS OF A BALANCED SCORECARD 14
2.6.1 Financial perspective 15
2.6.2 Customer perspective 16
2.6.3 Internal-business-process perspective 17
2.6.4 Learning and growth perspective 18
2.7 POSSIBLE REASONS FOR FAILURE OR PROBLEMS WITH
THE BALANCED SCORECARD 19
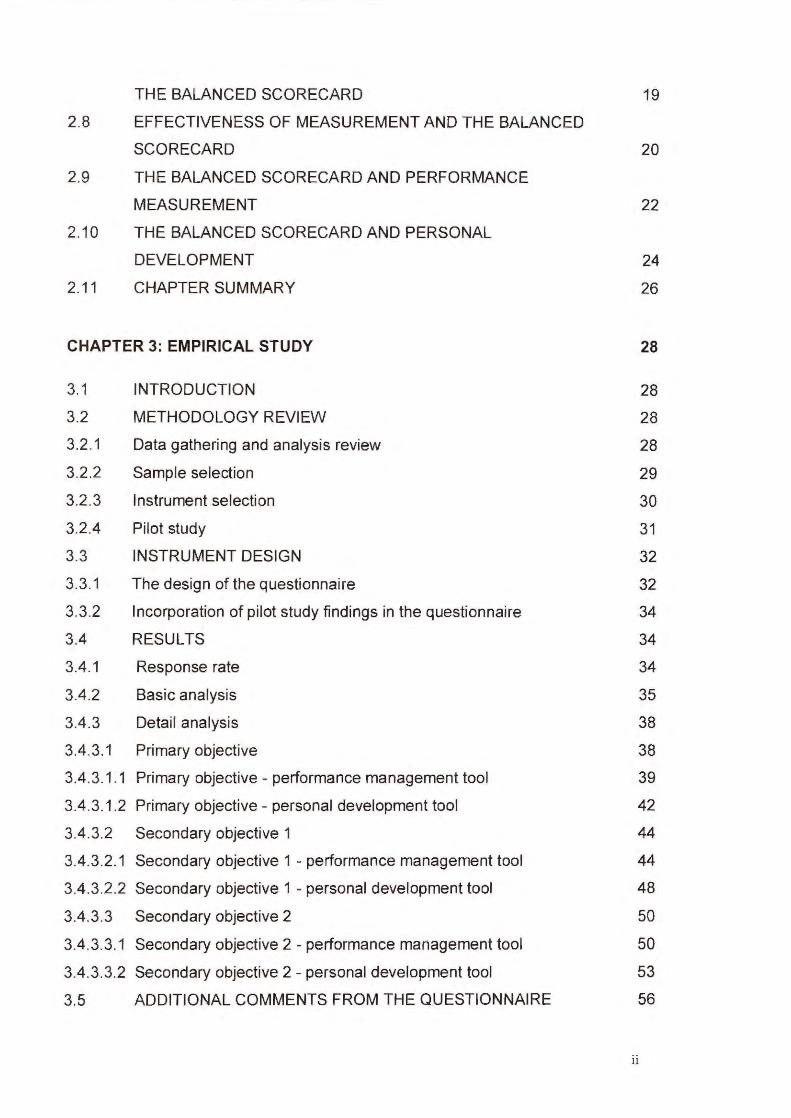
2.8 EFFECTIVENESS OF MEASUREMENT AND THE BALANCED
SCORECARD 20
2.9 THE BALANCED SCORECARD AND PERFORMANCE
MEASUREMENT 22
2.10 THE BALANCED SCORECARD AND PERSONAL
DEVELOPMENT 24
2.11 CHAPTER SUMMARY 26
CHAPTER 3: EMPIRICAL STUDY 28
3.1 INTRODUCTION 28
3.2 METHODOLOGY REVIEW 28
3.2.1 Data gathering and analysis review 28
3.2.2 Sample selection 29
3.2.3 Instrument selection 30
3.2.4 Pilot study 31
3.3 INSTRUMENT DESIGN 32
3.3.1 The design of the questionnaire 32
3.3.2 Incorporation of pilot study findings in the questionnaire 34
3.4 RESULTS 34
3.4.1 Response rate 34
3.4.2 Basic analysis 35
3.4.3 Detail analysis 38
3.4.3.1 Primary objective 38
3.4.3.1.1 Primary objective- performance management tool 39
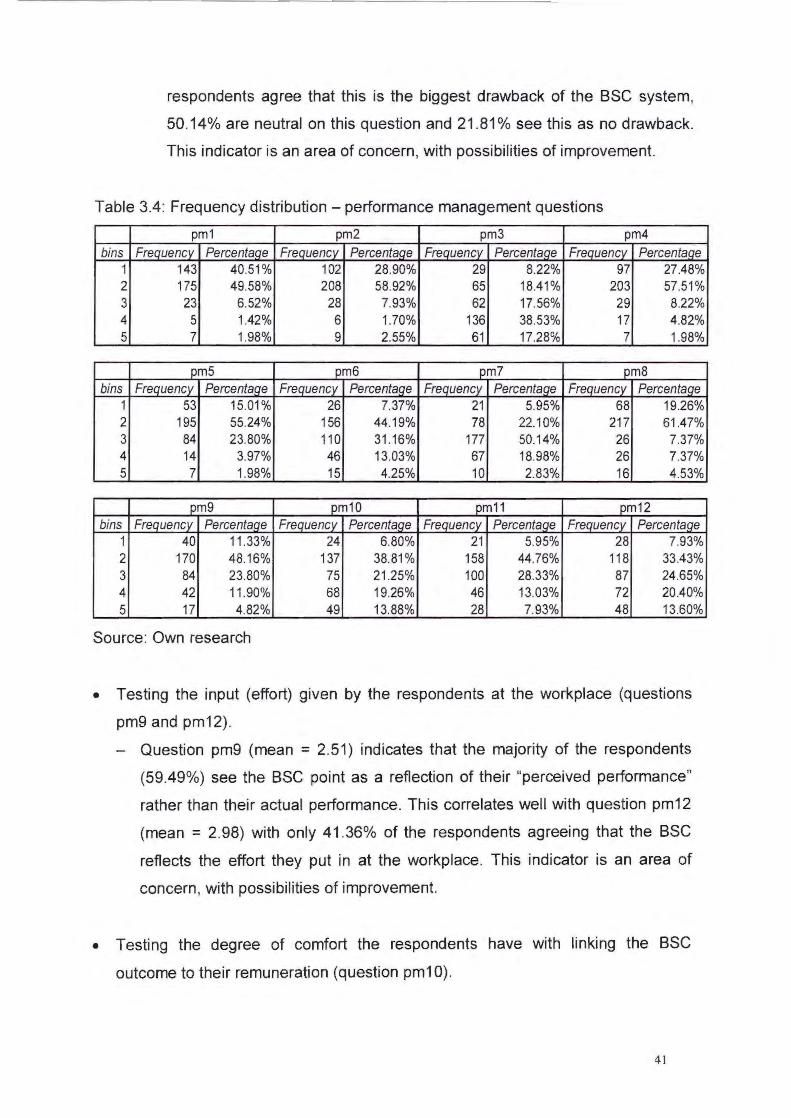
3.4.3.1.2 Primary objective- personal development tool 42
3.4.3.2 Secondary objective 1 44
3.4.3.2.1 Secondary objective 1 - performance management tool 44
3.4.3.2.2 Secondary objective 1 -personal development tool 48
3.4.3.3 Secondary objective 2 50
3.4.3.3.1 Secondary objective 2- performance management tool 50
3.4.3.3.2 Secondary objective 2- personal development tool 53
3.5 ADDITIONAL COMMENTS FROM THE QUESTIONNAIRE 56
11
3.6 CHAPTER SUMMARY
CHAPTER 4: CONCLUSIONS AND RECOMMENDATIONS
4.1 INTRODUCTION
4.2 CONCLUSIONS
4.2.1 Conclusions on the demographics of the sample group
4.2.2 Conclusions on the primary objective
4.2.2.1 Performance measurement
4.2.2.2 Personal development
4.2.3 Conclusions on secondary objective 1
4.2.3.1 Performance measurement
4.2.3.2 Personal development
4.2.4 Conclusions on secondary objective 2
4.2.4.1 Performance measurement
4.2.4.2 Personal development
4.3 RECOMMENDATIONS
4.4 ACHIEVEMENT OF THE STUDY'S OBJECTIVES
4.5 RECOMMENDATIONS FOR FUTURE RESEARCH
4.6 CHAPTER SUMMARY
REFERENCES
ANNEXURES
Annexure A: Questionnaire
Annexure 8: Data -All
Annexure C: Engineering
Annexure D: Iron Making
Annexure E: Steel Making
Annexure F: Rolling
Annexure G: Staff
Annexure H: E- roles
Annexure 1: F- roles
Annexure J: G- roles
59
61
61
61
61
62
62
63
63
64
65
65
66
67
67
69
69
69
71
73
76
88
93
98
102
107
112
117
123
Ill
LIST OF TABLES
Table 3.1: Number of people per department per grading (E, F and G role) 29
Table 3.2: Selection matrix for method to issue questionnaire 31
Table 3.3: Summary of questionnaires received 35
Table 3.4: Frequency distribution- performance management questions 41
Table 3.5: Frequency distribution- personal development questions 43
LIST OF FIGURES
Figure 2.1: The Balanced Scorecard Framework 12
Figure 2.2: The components of a BSC 15
Figure 2.3: The Balanced Scorecard as a link in the management
of a company's strategy 22
Figure 2.4: The performance management cycle in effective organisations 23
Figure 3.1: Response per department 35
Figure 3.2: Age distribution of respondents 36
Figure 3.3: Gender distribution of respondents 36
Figure 3.4: E, F and G role response 37
Figure 3.5: Performance Management - average response rate per question 37
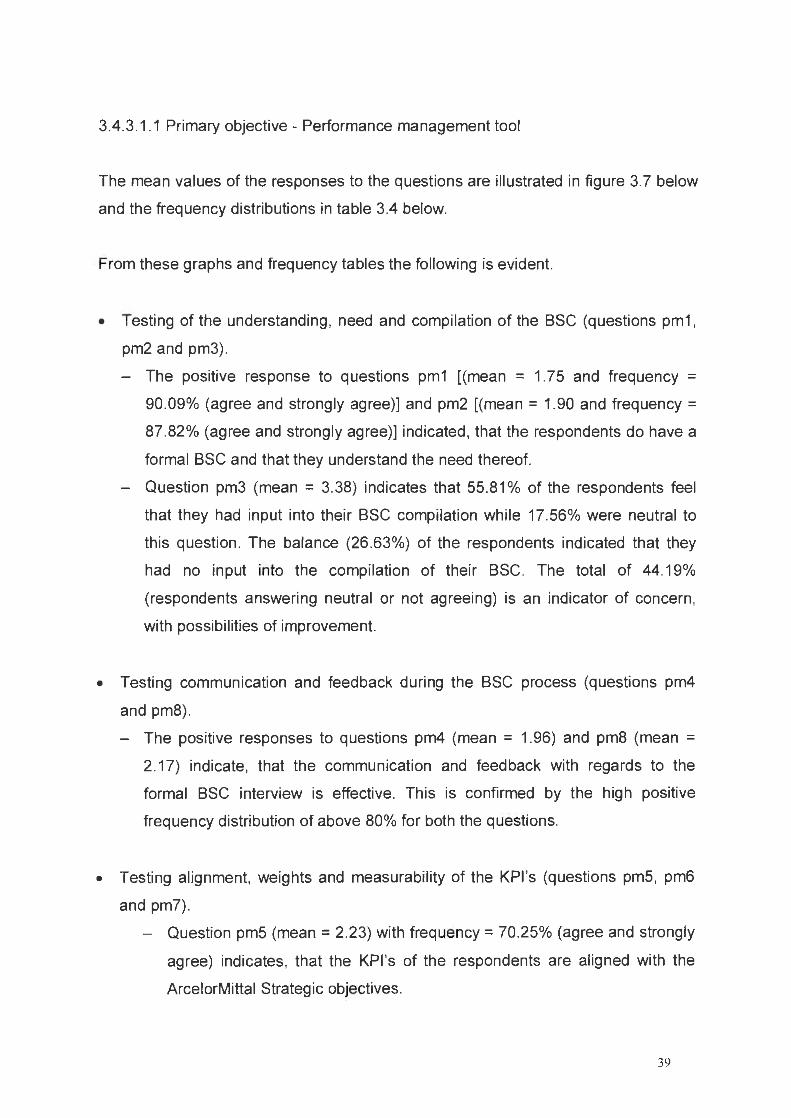
Figure 3.6: Personal Development- average response rate per question 38
Figure 3.7: Response to questions testing the effectiveness of the BSC as
performance management tool 40
Figure 3.8: Responses to questions testing the effectiveness of the BSC
as personal development tool 43
Figure 3.9: Response to questions testing the effectiveness of the
BSC as performance management tool 45
Figure 3.10: Responses to questions testing the effectiveness of the BSC
as personal development tool 49
Figure 3.11 : Response to questions testing the effectiveness of the
BSC as performance management tool 51
Figure 3.12: Responses to questions testing the effectiveness
of the BSC as personal development tool 55
iv

CHAPTER 1
NATURE AND SCOPE OF THE STUDY
1.1 INTRODUCTION
The Balanced Scorecard (BSC) mechanism of measuring performance has since the
initial development by Robert Kaplan and David Norton in the early 1990's grown in
popularity. Kaplan and Norton's aim was to develop a more balanced system of
measuring performance than simply using short-term financial results. The BSC
helps to make strategy operational by translating strategy into performance and
measurement targets (Kaplan and Norton, 1999: 135).
The effectiveness of a performance measurement system is dependent on the type
of mechanism used to measure performance. Old appraisal systems which mainly
focused on measuring financial performance (short term focused) are no longer
sufficient and relevant to the present (continuously changing) global environment.
Emphasis has shifted away from only evaluating and reporting on past results to a
focus of future capabilities to serve the company's customers, retain and develop
internal resources and maintain growth.
It was, however found that within ArcelorMittal , Vanderbijlpark Works, people are
often very negative about the BSC. Comments often made were the following .
• The BSC does not reflect the effort I put in .
• The BSC is not a fair measurement of performance.
• The Key Performance Indicators (KPI's) on the BSC are not relevant to my job.
• My supervisor does not discuss my BSC with me.
• Show me how you will measure me and I will show you how I will perform.
• The BSC is a worthless paper exercise.
The purpose of this study is to research how effectively the BSC process is used to
measure performance and to encourage personal development of individuals within
ArcelorMittal , Vanderbijlpark Works.

1.2 PROBLEM STATEMENT
The SSe tool has always been a hot point of debate. Traditionally the sse within
ArclelorMittal was used only to measure performance. During the last 2 years,
however, the company has developed the sse to accommodate a portion aimed at
encouraging the employee to self-develop in terms of training and career
development.
Because the outcome of this tool is linked to remuneration - it is even more
important to ensure that the sse meets the required criteria. It is the target of
ArclelorMittal , Vanderbijlpark Works, to (by end 2009) be in a position to input the
outcome of the sse discussion into Systems Applications Product software (SAP),
whereafter everything will be electronically calculated up to the point of printing the
payslips of the employees. This means no further "manual" intervention by line
managers.
The SSe interviews are held bi-annually. These figures are then combined to get to
an annual value. This value is normalised throughout the Works and used during
reward allocation. The problem is, that managers still manually adjust some of these
figures due to the results, not reflecting the perceived performance of the employee.
The question is why? The consistent application and effectiveness of the SSe
principles across the different business units in the Vanderbijlpark Works are also
questionable.
The objective of this research is to establish whether ArcelorMittal , Vanderbijlpark
Works has successfully developed and implemented the sse tool as:
• a performance measurement tool , and
• a personal development tool.
1.3 OBJECTIVES OF THE STUDY
The objectives of the study are divided into primary and secondary objectives.
2

1.3.1 Primary objective
The primary objective of the research is to establish whether ArcelorMittal ,
Vanderbijlpark Works is effectively using the BSC tool as:
• A performance measurement, and
• A personal development tool.
1.3.2 Secondary objectives
The secondary objectives of this research are as follows:
• To determine if there is a difference between the effective implementation of the
BSC as a performance management and personal development tool within the
different business units within ArcelorMittal , Vanderbijlpark Works. These units are
Iron Making, Steel Making, Rolling, Engineering and Staff (Secondary objective 1).
• To determine if there is a difference between the effective implementation of the
BSC as a performance management and personal development tool between
different role gradings (these roles are defined as E, F and G roles) in ArcelorMittal ,
Vanderbijlpark Works (Secondary objective 2).
1.4 SCOPE OF THE STUDY
ArcelorMittal South Africa Limited is the largest steel producer on the African
continent, producing 6.4 million tonnes of liquid steel per annum. ArcelorMittal South
Africa is part of the world's largest steel producer, ArcelorMittal . The company is the
world's number one steel company, with 310 000 employees worldwide. ArcelorMittal
has an industrial presence in 27 countries across Europe, the Americas, Asia and
Africa. ArcelorMittal is the leader in all major global markets, including automotive,
construction, household appliances and packaging, with leading Research and
Development (R&D) and technology, as well as sizeable captive supplies of raw
materials and outstanding distribution networks.
3
Vanderbijlpark Works is one of the 4 steel operations in South Africa (also the largest
producer of Flat Steel Products), with the other being in Vereeniging, Newcastle and
Saldanha.
This research study was done in the Vanderbijlpark Works which has ±4300 full-time
employees. Of these employees ±800 (18.6%), are subjected to annual performance
reviews based on KPis identified in BSCs. Included in this number, is a group of 724
people consisting of middle management, supervisors, technical people, and
administrative support (staff functions including Safety, Health, Environment and
Risk (SHERQ), Information Technology (IT), Information Management (IM) , Finance,
Human Resources (HR) and Commercial). These employees function in 4 main
business units within the Company (Engineering, Iron Making, Rolling , and Steel
Making) and was the sample used during the research . For ease of reporting the
research find ings the balance of the sample has been combined as a Staff function
grouping.
The 2008 calendar year was used as the base date to gather data from the empirical
study.
1.5 RESEARCH METHOD
The research method will comprise both a literature review and an empirical study.
1.5.1 Phase 1: Literature review
In the literature review an in-depth study was done with regards to the Balanced
Scorecard tool as a measurement instrument. Specific research was done to
determine the following :
• Why is the BSC used as a tool to measure performance?
• How is the BSC used as a measuring tool?
• What are the possible pitfalls when using the BSC?
• Can the BSC be used to encourage Personal (Self) Development?
4
• When is a BSC effective?
The sources that were consulted , included the following .
• Literature and published articles by Kaplan and Norton, and other known authors
on this topic.
• Other research done in this field of study.
• Related articles on the world-wide web.
• Internal published documents related to ArcelorMittal , Vanderbijlpark Works.
1.5.2 Phase 2: Empirical study
1.5.2.1 Research design
A quantitative research approach was followed but due to the explanatory nature of
the research study, no hypothesis was formulated .
Information for the research on this subject was obtained from both secondary and
primary sources. Secondary resources included sources such as scientific journals,
textbooks, previous studies and the internet.
The primary source of data was gathered by means of an empirical study (self
administered questionnaires). Respondents were requested to complete an
anonymous questionnaire and submit it via hard copy to a central point of receipt.
Control of this process was centralised within the HR department of the Company.
Permission was obtained from both Management and the Unions to issue these
questionnaires to the selected target group. The employees were assured that the
information would be treated as confidential and that the results would be used only
for research purposes.
An initial pilot study was done by selecting a small sample of respondents from the
target group to complete a draft questionnaire. This sample indicated any problems
respondents could have with the instructions or the items on the questionnaire. The
5

questionnaire comprised of an opening section requesting demographical data from
the respondents, followed by 2 additional sections testing the effectiveness of both
the BSC as performance management tool and personal development tool. These
sections were comprised of a number of scaled-response questions measured on a
five point Likert-type Scale and allowing for additional comments at the end of the
questionnaire. The Likert-type Scale used, consisted of the following choices: SA
Strongly Agree, A- Agree, N- Neutral , D- Disagree and SO- Strongly Disagree.
1.5.2.2 Participants
Employees within the E-, F- and G-role band in ArcelorMittal , Vanderbijlpark Works ,
were chosen to participate. A convenience sampling method purely based on
availabil ity was chosen. This group is easily accessible (all located at the same
premises in Vanderbijlpark) and sufficiently homogeneous.
1.5.2.3 Measuring instrument
The main measuring instrument that was used, was a questionnaire. This
questionnaire was issued to the sample group.
1.5.2.4 Statistical analysis
Descriptive statistics and frequency distributions were used to analyse basel ine data.
1.6 LIMITATIONS AND ANTICIPATED PROBLEMS
This study was limited to ArcelorMittal , Vanderbijlpark Works and findings can
therefore not be generalised to the rest of the Group in South Africa.
At present ArcelorMittal , Vanderbijlpark Works is facing tough economical pressures.
It was, therefore, anticipated that (due to the voluntary nature of the request) a large
number of the sample would not complete and return the questionnaire.
6
People being very negative about the BSC, might not have responded at all and
some of the participants might not have been able to understand how this research
could add any value to their future growth.
1.7 LAYOUT OF THE STUDY
The chapters in this mini-dissertation are presented as follows.
Chapter 1: Nature and scope of study.
Chapter 1 provided information on the background to the selection of the research
topic, the problem statement and summary of the proposed research method.
Chapter 2: Literature study.
Chapter 2 summarised the overview of the literature study that was done on the
proposed research topic.
Chapter 3: Empirical study.
Chapter 3 gives the detail on the empirical study that was done, summarised data on
the questionnaire returns and results and discussions.
Chapter 4: Conclusions and Recommendations.
Chapter 4 concluded the findings made in Chapter 3 and made recommendations to
ArcelorMittal , Vanderbijlpark Works, on the way forward .
1.8 CHAPTER SUMMARY
The Balanced Scorecard is classified as a performance management tool.
ArcelorMittal , Vanderbijlpark Works has been using this tool for a number of years
and comments often made by employees question the degree of success of this tool.
7

Of late the company introduced an additional section to encourage employees to
self-develop.
The question arising, is thus: has this tool been effectively implemented as a
performance measurement tool and a tool that encourages people to self-develop?
In this chapter an overview was given on the approach followed to try to answer the
problem statement. In the following chapter an in-depth literature review, discussing
the ability to match the results generated during the empirical study, was done.
8

CHAPTER 2
LITERATURE STUDY
2.1 INTRODUCTION
Global competitiveness forces companies to focus on advantages of sustaining and
gaining market share. For this reason developed strategies need to be implemented
and tracked . Mistakes in the market place can be very costly and, therefore,
managers spend a lot of time and effort to stay ahead of competitors.
The ability of a company to mobilize and exploit its intangible assets has become far
more decisive than investing and managing its physical assets (Kaplan and Norton,
1996:3). To be able to improve a company's performance, one needs to control it; to
be able to control it, one needs to understand it, and to understand it, one needs to
measure it. The BSC is a tool that has been developed to assist managers to
measure the performance of individuals and groups towards attaining set goals
aligned with the company strategy.
In the past financial measures were the only parameters used to determine a
company's success - this, however, has changed significantly as companies
realised the importance of measurements of customer needs, internal business
process performances and innovation and learning.
This chapter will deal with the origin of the BSC, the definitions of the BSC, the need,
benefits and components of a BSC, possible problems with the BSC and the BSC as
both performance management and personal development tools.
2.2 ORIGIN OF THE BALANCED SCORECARD
During 1990 the Nolan Norton Institute started a multicompany study defined as:
'Measuring Performance in the Organisation of the Future'. This study was motivated
by a believe that existing performance measurement approaches, primarily relying
on financial accounting measures, were becoming obsolete (Kaplan and Norton,
9
1996:i) . Norton (at that stage the CEO of the company) was the study leader,
assisted by Kaplan as the academic consultant.
During the early stages of the project Kaplan contacted the CEO (Art Schneiderman)
of a company, Analog Devices, to ask permission to investigate their corporate
scorecard . Kaplan realised that this multidimensional scorecard was far more useful
for measurement of strategic initiatives. Many group discussions were held which led
to the formulation of the now known Balanced Scorecard. This BSC was organised
around four distinct perspectives: financial , customer, internal, and innovation and
learning.
The Balanced Score Card name reflects the balance provided between short-term
and long-term objectives, between financial and non-financial measures, between
lagging and leading indicators, and between external and internal performance
perspectives (Kaplan and Norton, 1996:viii). The findings of th is study group were
documented in an article The Balanced Scorecard - Measures That Drives
Performance in 1992. After this a number of executives were contacted to implement
the BSC in their organisations and this again led to another round of developments
with specific focus on strategic measurements. These findings were published in a
second article in 1993: Putting the Balanced Scorecard to Work.
Following up to 1996, an even larger number of developments were introduced and
these findings were summarised in an article Using the Balanced Scorecard as a
Strategic Management System. Kaplan and Norton summarised the concept and the
learning up to this point (1996) in their book The Balanced Scorecard.
2.3 DEFINITIONS OF THE BALANCED SCORECARD
The BSC is a strategic management tool that provides the manager with a clear and
concise picture of the business's health and progress in reaching the goals of the
business (Norton & Kaplan , 1992: 71-79). The BSC is a set of financial and non
financial measures relating to a company's critical success factors.
Kaplan and Norton describe the innovation of the Balanced Scorecard as follows.
10

'The Balanced Scorecard retains traditional financial measures. But financial
measures tell the story of past events, an adequate story for industrial age
companies for which investments in long-term capabilities and customer
relationships were not critical for success. These financial measures are inadequate,
however, for guiding and evaluating the journey that information age companies
must make to create future value through investment in customers, suppliers,
employees, processes, technology, and innovation."
The BSC provides executives with a comprehensive framework that translates a
company's vision and strategy into a coherent set of performance measures (Kaplan
and Norton, 1996: 24). The BSC includes not only historical (lagging) performance
measures (such as financial targets) but also leading indicators such as customer
satisfaction and expectations, and learning and growth opportunities.
Kaplan and Norton (1996: 7) define the BSC as a "collision between the irresistible
force to build long-range competitive capabilities and the immovable object of the
historical-cost financial accounting model". This definition implies that the BSC
complements financial measurements of past performance with measures of the
drivers of future performance (Kaplan and Norton, 1996: 8) .
Kreitner and Kinicki (2007: 270) define performance management as "the continuous
cycle of improving job performance with goal setting, feedback and coaching , and
rewards and positive reinforcement".
Niven (2002: 12) describes the BSC as a carefully selected set of measures derived
from an organisation's strategy. The measures selected for the BSC, represent a tool
for leaders to use in communication to employees and external stakeholders, the
outcomes and performance drivers by which the organisation will achieve its mission
and strategic objectives. Niven sees the BSC simply as a measurement system, a
strategic management system, and a communication tool.
The Balanced Scorecard Institute of South Africa defines the BSC as a management
system that enables organisations to clarify their vision and strategy and translate
these into action. It provides feedback around both the internal business processes
I I
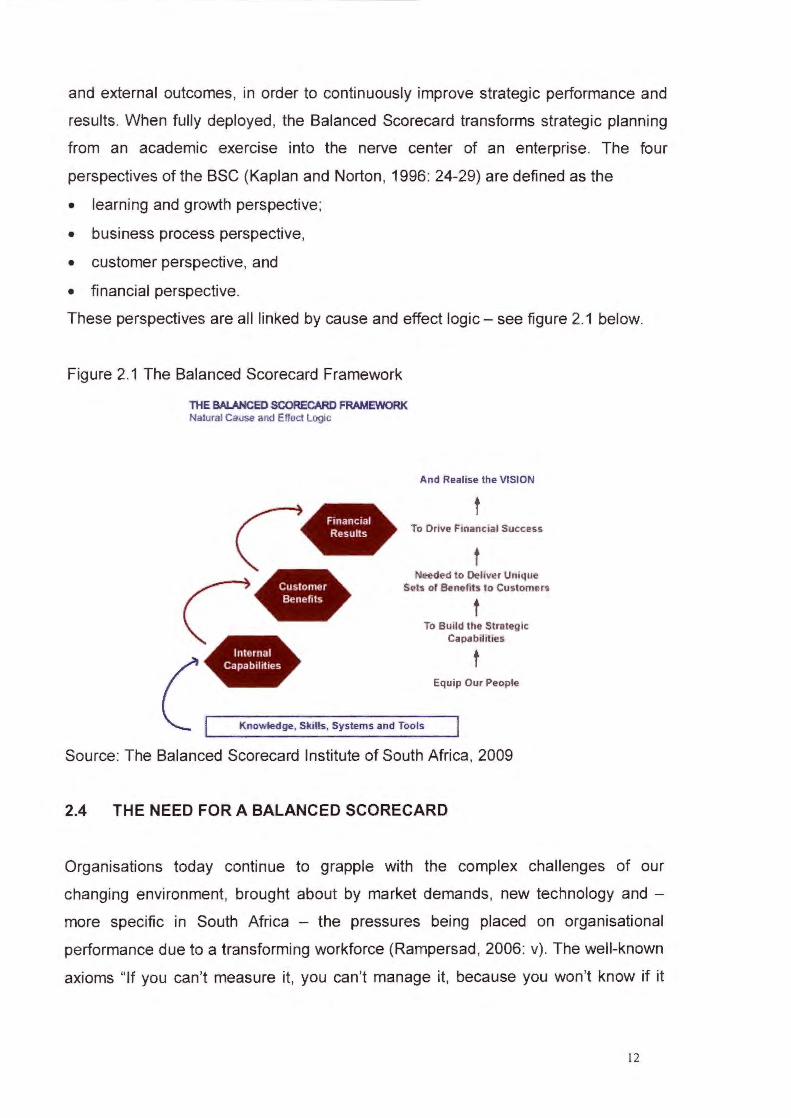
and external outcomes, in order to continuously improve strategic performance and
results. When fully deployed, the Balanced Scorecard transforms strategic planning
from an academic exercise into the nerve center of an enterprise. The four
perspectives of the BSC (Kaplan and Norton, 1996: 24-29) are defined as the
• learning and growth perspective;
• business process perspective,
• customer perspective, and
• financial perspective.
These perspectives are all linked by cause and effect logic- see figure 2.1 below.
Figure 2.1 The Balanced Scorecard Framework
THE BALANCED SCORECARD FRAMEWORK Natural Cause and Efloc:t Logic
And Reahse the VISION
t To Orlve Financaal Success
t c c- Needed to Deliver Umque Sets of Benefits to Customers
t To Build the Strntegic
Capabtlities
t Equip Our People c•
J Knowledge, Skills, Systems and Tools
Source: The Balanced Scorecard Institute of South Africa, 2009
2.4 THE NEED FOR A BALANCED SCORECARD
Organisations today continue to grapple with the complex challenges of our
changing environment, brought about by market demands, new technology and -
more specific in South Africa - the pressures being placed on organisational
performance due to a transforming workforce (Rampersad, 2006: v). The well-known
axioms "If you can't measure it, you can't manage it, because you won't know if it
12
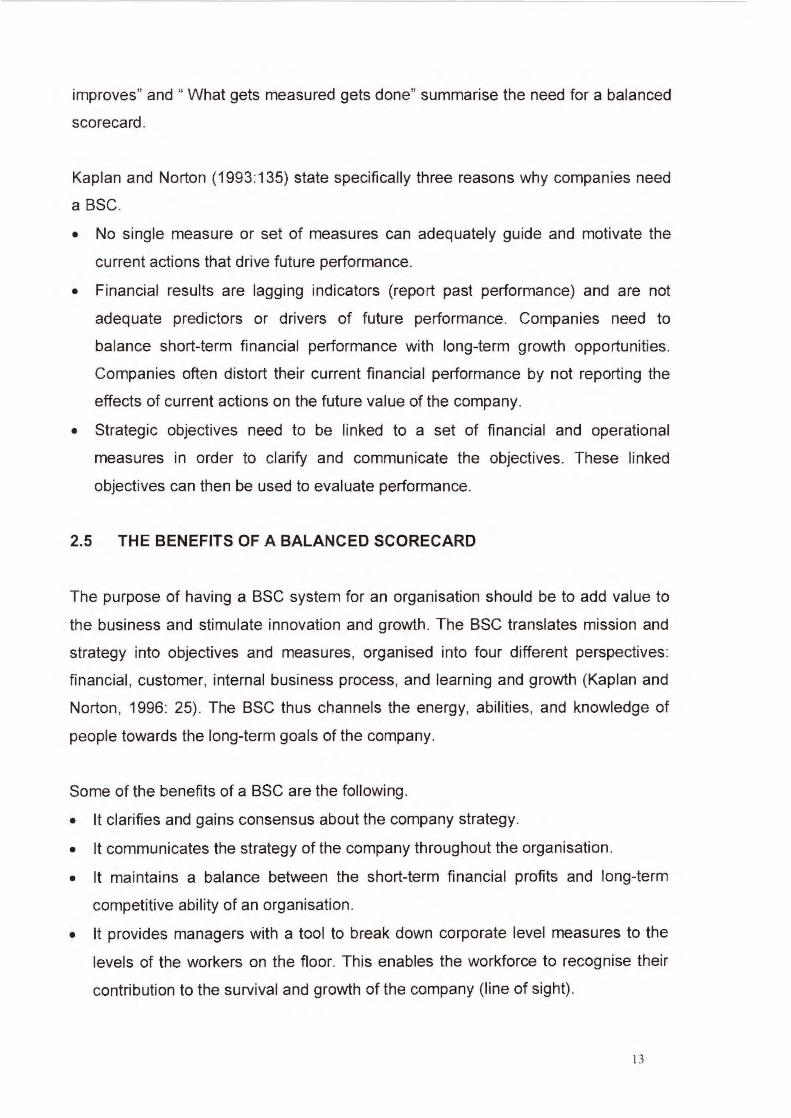
improves" and " What gets measured gets done" summarise the need for a balanced
scorecard.
Kaplan and Norton (1993:135) state specifically three reasons why compan ies need
a BSC.
• No single measure or set of measures can adequately guide and motivate the
current actions that drive future performance.
• Financial results are lagging indicators (report past performance) and are not
adequate predictors or drivers of future performance. Companies need to
balance short-term financial performance with long-term growth opportunities.
Companies often distort their current financial performance by not reporting the
effects of current actions on the future value of the company.
• Strategic objectives need to be linked to a set of financial and operational
measures in order to clarify and communicate the objectives. These linked
objectives can then be used to evaluate performance.
2.5 THE BENEFITS OF A BALANCED SCORECARD
The purpose of having a BSC system for an organisation should be to add value to
the business and stimulate innovation and growth. The BSC translates mission and
strategy into objectives and measures, organised into four different perspectives:
financial , customer, internal business process, and learning and growth (Kaplan and
Norton, 1996: 25). The BSC thus channels the energy, abilities, and knowledge of
people towards the long-term goals of the company.
Some of the benefits of a BSC are the following .
• It clarifies and gains consensus about the company strategy.
• It communicates the strategy of the company throughout the organisation.
• It maintains a balance between the short-term financial profits and long-term
competitive ability of an organisation.
• It provides managers with a tool to break down corporate level measures to the
levels of the workers on the floor. This enables the workforce to recognise their
contribution to the survival and growth of the company (line of sight).
13

• It serves as a focal point for the company's efforts, defining and communicating
priorities to managers, employees, investors and customers.
• It helps the organisation to focus on breakthrough performance.
• It encourages the process of innovation, learning and growth.
Research outcomes of studies of the Corporate Leadership Council reveal the
following.
• Companies with performance management programs (BSC) have higher profits,
better cash flows, stronger stock market performance, and a greater stock value
than companies without performance management.
• Productivity in firms without performance management programs (BSC) is
significantly below the industry average, while productivity in firms with
performance management programs (BSC) is on par with the industry average.
• Companies with performance management programs (BSC) significantly
improved their financial performance and productivity after implementing
performance management programs (BSCs).
2.6 THE COMPONENTS OF A BALANCED SCORECARD
Managers recognise the impact that measures have on performance in today's
global competitive environment. Companies need to have a measurement system
which drives actions that will ultimately lead to creating value for its shareholders,
while also encouraging employees to be innovative and to grow through the process
of learning and experiencing.
The BSC gives a balanced view of the four main perspectives (as developed by
Kaplan and Norton): financial , customer, internal business process, and learning and
growth. Every measure selected for the BSC, should be part of a link of cause-and
effect relationship, ending in financial objectives, that represent a strategic theme for
the business unit (Kaplan and Norton, 1996: 62). When used this way, the BSC is
not a group of isolated (unconnected) or conflicting objectives. These components
are illustrated in figure 2.2 below.
14
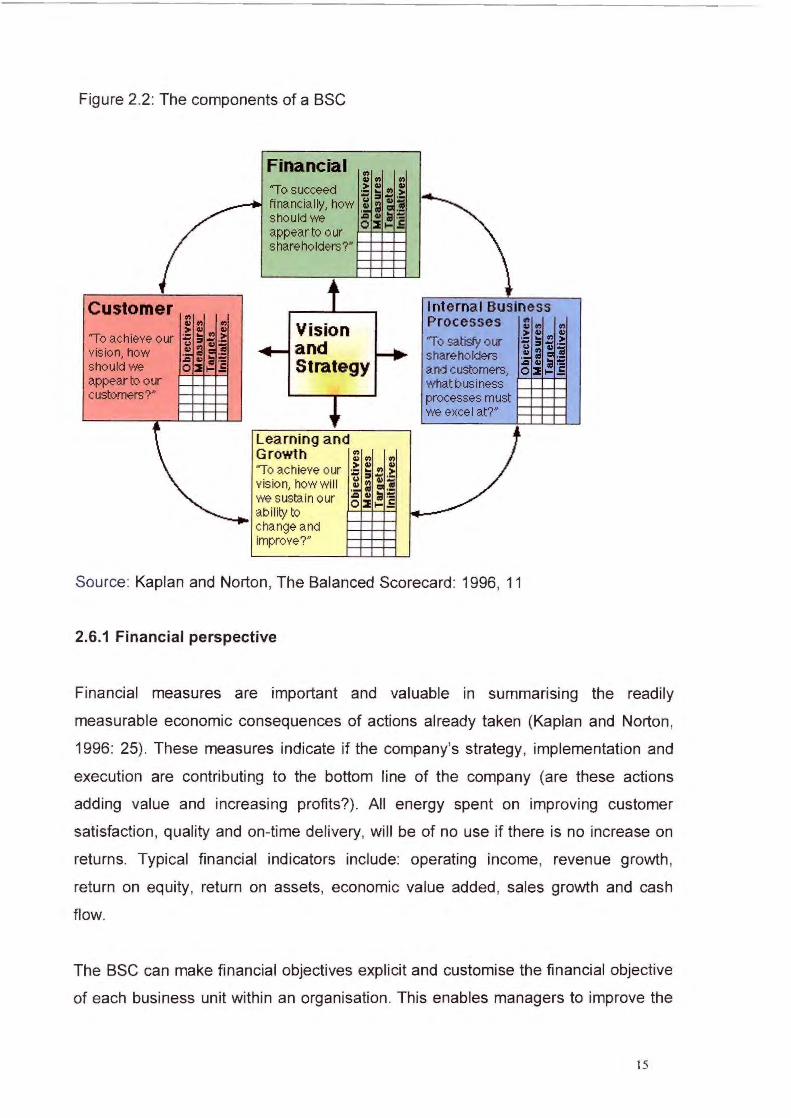
Figure 2.2: The components of a BSC
Financial
. Customer Internal Business
Vision Processes "To achieve our
and "To satisfy our vision, how shareholders should we Strategy and customers, appear to our what business customers?N ~
processes must we excel at?N
Learning and Growth .,
G) 0') 0')
"To achieve our > G) ., ~ ·- ... - ~ ~i vision, howwill .; ~
we sustain our ,1:1 01) :e:= 0 2 I- .E . ability to
change and improve?N
Source: Kaplan and Norton, The Balanced Scorecard: 1996, 11
2.6.1 Financial perspective
Financial measures are important and valuable in summarising the readily
measurable economic consequences of actions already taken (Kaplan and Norton,
1996: 25). These measures indicate if the company's strategy, implementation and
execution are contributing to the bottom line of the company (are these actions
adding value and increasing profits?). All energy spent on improving customer
satisfaction, qual ity and on-time delivery, will be of no use if there is no increase on
returns. Typical financial indicators include: operating income, revenue growth,
return on equity, return on assets, economic value added, sales growth and cash
flow.
The BSC can make financial objectives explicit and customise the financial objective
of each business unit within an organisation. This enables managers to improve the
15
line of sight of their unit responsibility towards to ultimate goal: to provide superior
returns (to stakeholders) on invested capital. The BSC enables the manager to
specify the metric by which the long-term success of the business unit is measured,
and the variables considered most important to create and to drive the long-term
outcome objectives (Kaplan and Norton, 1999: 61 ).
In simplicity, financial goals are to survive, succeed and prosper. Survival is
measured by cash flow, success by growth in sales and operating income and
prosperity by an increased market share and return on equity and capital employed.
2.6.2 Customer perspective
To be able to formulate this perspective, managers should know their targeted
customer and market segment. This market segment will represent the source that
will deliver the revenue component of the company's financial objectives. According
to Niven (2002: 15) an organisation must answer the following two questions.
• Who are our target customers?
• What is our value proposition in serving them?
Core outcome measurements in this perspective are: share of market, retention ,
acquisition, partnerships, loyalty, satisfaction and profitability. These, however, again
are lagging indicators. To develop leading indicators, Kaplan and Norton (1996: 85)
suggest that companies strive to select objectives and measures from the following
three classes of attributes.
• Product or service attributes (this include price, quality, speed (time) of service,
functionality (fit for purpose)),
• Customer relationship (quality of purchasing experience, personal relationships),
• Image and reputation (brand awareness and strength).
The BSC demands that management must translate their general mission statement
on customer service into specific measures that reflect the factors that really matter
to the customers. Customers are normally concerned with lead-time, quality of
16

products and services, the company's performance with regard to service and the
cost-effectiveness of the product or service.
2.6.3 Internal-business-process perspective
To determine the internal-business-process perspective measurements companies
must decide on what processes and competencies they must excel at and
specifically measure each of them. Internal measures for the BSC should be derived
from the business processes that have the greatest impact on customer satisfaction
(factors that affect cycle time, quality, skill of the employees and productivity). To
satisfy customers and shareholders' expectations, a company may need to identify
entirely new internal processes rather than to focus efforts on the incremental
improvements of existing activities (Niven, 2002: 16).
Recent development incorporates the innovation process as a vital component of
this perspective. Innovation highlights the importance of identifying the
characteristics of the market segment a company wants to satisfy with new products
and then also how to design and develop these products. The BSC must thus allow
for considerable weight and measures to encourage research, design and
development work.
Kaplan and Norton (1996: 96) suggest that a company's internal-business-process
perspective can be developed by following a generic value-chain model which
encompasses the following three principal business processes.
• Innovation (research the emerging or latent needs of customers and create
products or services that will meet the requirements or needs of the customers).
• Operations (producing and delivery of existing products and services to
customers); and
• Post-sale service (service to customer after the original sale or delivery of the
product or service).
17
The internal perspective examines areas such as operations management, customer
management, customer relationships, innovation, product development, delivery,
manufacturing, after-sale service, regulatory and social processes.
2.6.4 Learning and growth perspective
A company's ability to innovate, improve and learn, correlate directly with the value
of the company. A culture of innovation and continuous learning can bring about
efficiency in the operating domain of a business. This ensures cost reduction and
product differentiation so as to meet the varied requirements of the customers. As a
result, it strengthens the financial ability through earning higher profits and retaining
a larger share of earnings to finance the forthcoming expansion of future projects of
the company under consideration.
According to Kaplan and Norton (1996: 146) the enablers for learning and growth
come primarily from three sources: employees, systems and organisational
alignment. They state that strategies to ensure superior performance will generally
require significant investment in people, systems and processes that build
organisational capabilities. Niven (2002: 16) sees this perspective as the foundation
of the BSC. This perspective could contain both leading and lagging indicators.
The learning and growth perspective is itemised by-
• human capital (competencies, skill , knowledge, and experience of employees) ,
• information capital (accuracy, availability, networks, infrastructure); and
• organisation capital (leadership, alignment, culture) .
Indicators can be employee turnover, employee retention and attraction, employee
skill levels, employee satisfaction, amount of training hours, availability of
information, continuous improvement initiatives, career opportunities, promotions
within the company, personal alignment, team alignment and organisational
alignment.
18

2.7 POSSIBLE REASONS FOR FAILURE OR PROBLEMS WITH THE
BALANCED SCORECARD
Many executives have commented that the BSC is not as simple as it seems.
Managers in both manufacturing and service organisations have encountered some
problems with the development, implementation and sustaining of the BSC. Kaplan
and Norton (1996: 284) suggest that these failures can be categorised in 2 main
categories:
• Structural defects (choice of measures), and
• organisational defects (process of developing and implementing the BSC).
Structural defects come about when managers try to supplement already existing
financial measures with non-financial measures like market share and customer
satisfaction. These non-financial measures however, already contain defects of
traditional financial measures - they are generic, lagging and report on how well the
company's strategy has worked in the past. Managers need to balance leading
indicators with the lagging indicators to achieve excellent long-run financial
performance (Kaplan and Norton, 1996: 285) .
Organisational defects come about due to inadequate development and
implementation of the BSC. The BSC development should be led by senior
executives and should not be based on general measures used by other industrial
leading companies, but be derived for breakthrough performance. The
implementation of the BSC can sometimes be delayed as managers try to perfect
the measurements. This can lead to a loss in momentum and enthusiasm. The BSC
is a dynamic process and should be reviewed continuously - rather start the process
and keep on learning how to manage with a balanced set of performance drivers and
outcome measures (Kaplan and Norton, 1996: 286).
Schneiderman (1999: 6) identifies six main reasons for failures of the BSC.
1. The non-financial variables are incorrectly identified as primary drivers of future
stakeholder satisfaction .
2. The metrics are poorly defined.
19

3. Improvement goals are negotiated. These goals should be built on stakeholder
requirements, fundamental process limits, and improvement process capabilities.
4. There is no deployment system that breaks down high-level goals to the level
where actual improvement activities reside (loss of line of sight).
5. No state-of-the-art improvement system.
6. There is no (and cannot be) quantitative linkage between the non-financial and
anticipated (expected) financial results.
From the above it is evident, that the BSC can be successfully developed,
implemented and maintained when managers keep to the basics by not confusing
the employees with too many measures. Measures should be aligned with the
strategic goals of the company, by defining the metrics well and by breaking the
measures down to floor level where people can understand what is required of them.
2.8 EFFECTWENESS OF MEASUREMENT AND THE BALANCED
SCORECARD
To determine when a BSC is effective, we have to understand the definition of
effectiveness. Coetsee (2003: 42) defines effectiveness as "doing the right things
right' . Coetsee (2003: 43) also correlates effectiveness with the 80/20 theory (Pareto
Principle). This principle implies that when you are effective it means that 20% of
your effort leads to 80% of your results, 20% of time spent should lead to 80%
positive outcomes (effectiveness) and the use of 20% of resources should achieve
80% of results.
Coetsee (2003: 43) defines organisational effectiveness as a company's ability to:
• adapt to present and future internal and external demands, expectations and
constraints,
• inspire action and create outcomes which satisfy stakeholders (clients,
shareholder, owners, employees),
• realise the vision ; and
• survive.
20

Kaplan and Norton (1996) stress the importance of adhering to the following three
principles in order to develop a BSC that is more than a group of isolated and
eventually conflicting strategies and measures.
• Build in cause-and-effect relationships.
• Include sufficient performance drivers; and
• Provide a linkage to financial measures.
They also state that if data do not exist to support a measure, the management
process for a key strategic objective is likely to be inadequate or nonexistent.
The Corporate Leadership Council research suggests that one should clearly define
performance standards, and thereafter, ensuring employee understanding of their
objectives, is the single most effective driver of performance. Additional keys to
overall performance management success include encouraging a culture of risk
taking, having managers provide employees with good formal and informal feedback,
and providing employees with the appropriate job development opportunities.
Covey (1999: 52) states, that his seven habits are being effective because they are
based on principles and therefore, they bring the maximum long-term beneficial
results possible. These habits become the basis of a person's character, creating an
empowering center of correct maps from which an individual can effectively solve
problems, maximise opportunities, and continually learn and integrate other
principles in an upward spiral of growth.
Boyett and Conn (1996: 75) give the following four guidelines for performance
measurement.
• All measures should be accomplishment-based.
• Measures should be group- or team-orientated , not measures of individual
employee performance.
• When developing measures, seek a level of precision sufficient for the purpose of
the measurement, and use a family of measures rather that try to force one
measure to serve as a ultimate indicator; and
• Measures should be reviewed and changed , if necessary, when strategies
change.
21

2.9 THE BALANCED SCORECARD AND PERFORMANCE MEASUREMENT
Traditional financial performance measurements give an excellent view of what
happened in the past (lagging indicator) but are inadequate in addressing the real
value-creating mechanisms in today's organisations. These value-creating
mechanisms include intangible assets such as knowledge and networks of
relationships (Niven, 2002: 13). The BSC complements the lagging indicators with
leading indicators (drivers of future economic performance). The great advantage of
the BSC lies in the translating of a company's mission into action plans and aligning
employees with these actions.
The BSC describe the key elements in achieving the company's strategy and is the
cornerstone of a company's current and future success. Figure 2.3 below indicates
that the BSC is a critical link (performance measures - light green block) in the
closed loop (continuous) process of formulating strategy through to final evaluation
and assessment. From this it is evident that the BSC should be a dynamic process
which should be changed as the need for a change in the strategy arises.
Figure 2.3: The Balanced Scorecard as a link in the management of a company's
strategy.
Source: The Balanced Scorecard Institute of South Africa, 2009
22
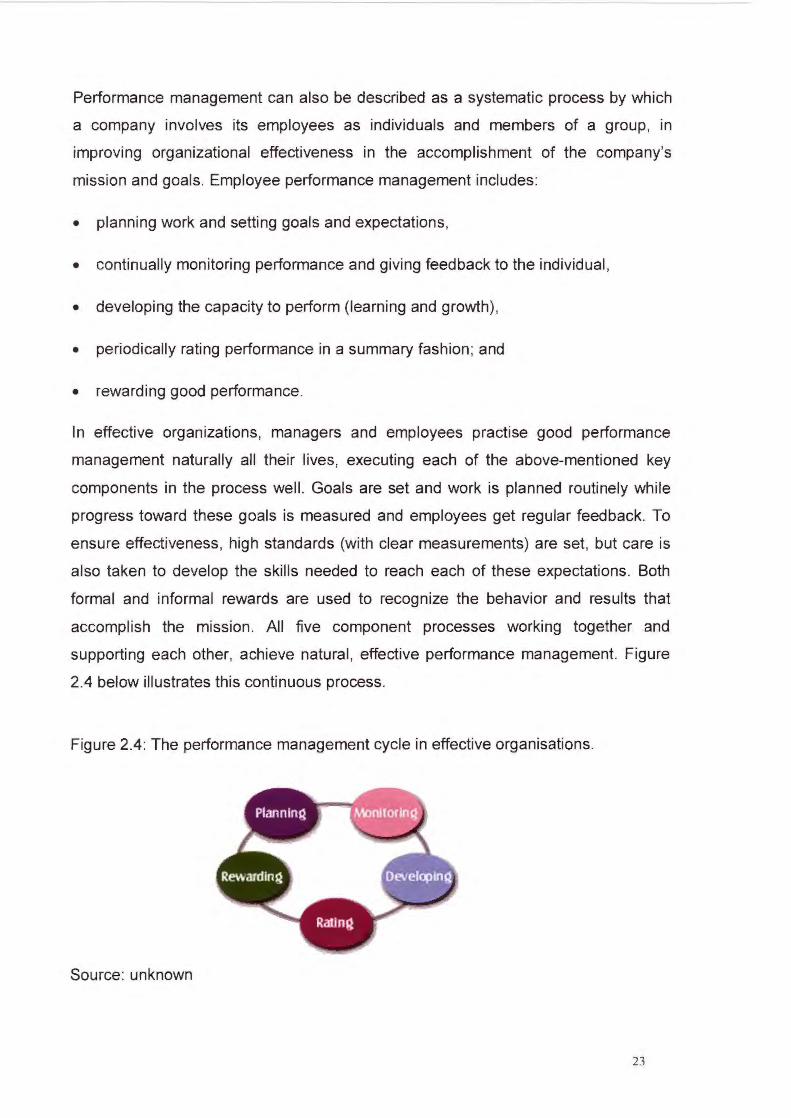
Performance management can also be described as a systematic process by which
a company involves its employees as individuals and members of a group, in
improving organizational effectiveness in the accomplishment of the company's
mission and goals. Employee performance management includes:
• planning work and setting goals and expectations,
• continually monitoring performance and giving feedback to the individual ,
• developing the capacity to perform (learning and growth) ,
• periodically rating performance in a summary fashion ; and
• rewarding good performance.
In effective organizations, managers and employees practise good performance
management naturally all their lives, executing each of the above-mentioned key
components in the process well . Goals are set and work is planned routinely while
progress toward these goals is measured and employees get regular feedback. To
ensure effectiveness, high standards (with clear measurements) are set, but care is
also taken to develop the skills needed to reach each of these expectations. Both
formal and informal rewards are used to recognize the behavior and results that
accomplish the mission. All five component processes working together and
supporting each other, achieve natural, effective performance management. Figure
2.4 below illustrates this continuous process.
Figure 2.4: The performance management cycle in effective organisations.
Source: unknown
23

For the BSC to be a successful performance measurement tool the following needs
to be done.
• The strategy need to be clear, agreed upon and well communicated.
• Departmental and personal goals need to be aligned with the strategy.
• Measurement metrics need to be accurate.
• The strategic objectives need to be linked to financial results and long-term
targets.
• Periodic strategic reviews need to be conducted ; and
• Lessons learnt need to be built into future measurements (continuous
improvement).
2.10 THE BALANCED SCORECARD AND PERSONAL DEVELOPMENT
The BSC allows for a mix of factors to be included to measure organisational and
individual performance. These include strategic intent, well-defined values, strategy
aligned structure, sound processes, courageous leadership, skilled people and
importantly, a high performance and learning culture. The learning and growth
perspective of a BSC is the glue that holds it all together and differentiates the
organisation from its competitors (Rampersad, 2006: v) .
The objective of the learning and growth perspective is to provide the infrastructure
to enable ambitious objectives in the other three perspectives to be achieved
(Kaplan and Norton, 1996: 126).
The BSC stresses the importance of investing in the future. These investments
include people, systems and procedures. According to Kaplan and Norton (1996:
127) the following three principle categories for the learning and growth perspective
apply.
• Employee capabilities.
• Information system capabilities; and
• Motivation, empowerment and alignment.
24

It is thus evident that this perspective is important in the self-development process of
an individual. Dr Hubert Rampersad (2006: 15-16) notes that both individuals and
managers can greatly benefit from a well-structured personal balanced scorecard .
These benefits include the following .
For the individual.
• Greater understanding of the self and increased self-esteem.
• Self-actualisation.
• Greater enjoyment and inner involvement in the work (happiness is enhanced at
the work by reducing the gap between company life and normal life).
• Working smarter instead of harder (we become more creative as we grow, we
become good time-managers).
• Greater usage of individuals' mental capacity and productivity; and
• Increased personal responsibi lity (more competent people become more
confident to take on more complex work).
For the manager.
• Higher employee engagement.
• Greater customer satisfaction (employees delivering quality work on time).
• Improved employee performance.
• Intrinsically motivated employees.
• Less absenteeism and grievances for the organisation (stress and burnout are
reduced).
• Individual and team empowerment (individuals start to trust fellow workers and
share personal ambition and knowledge).
• Increased innovation.
• Effective talent management (taking up challenges and developing of related
skills).
• Effective diversity management; and
• Sustainable organisational effectiveness.
25

It is evident that this portion of the BSC translates personal vision into concrete
personal targets and actions for improvement, providing the basis for balancing
personal aspirations with personal behaviour (Rampersad , 2006: 17).
2.11 CHAPTER SUMMARY
The BSC is a tool that measures performance of a company in four perspectives:
financial , customer, internal-business-process and learning and growth. In this
chapter a literature study was done to analyse the background on the BSC,
research different definitions of the BSC, understand the four perspectives of the
BSC, determine when a BSC is effective, and investigate the BSC as personal
development tool.
It was concluded , that for the BSC to be effective the following are prerequisites.
• Employees need to have participated in the compilation of their BSC.
• Employees must get feedback on their performance.
• KPis need to be clearly link to the business strategy.
• KPis must be measurable and have direct line of sight (the employee must be
clear on what he has to do to contribute to the bottom line).
• KPis must be linked to financial gains.
• KPis must inspire action and create outcomes which satisfy stakeholders (fair,
achievable); and
• Some KPis must measure team performance (not only individual).
Personal development forms a very important part of the BSC and this learning and
growth perspective form the base to successfully manage the other three
perspectives.
From the literature review, the following is clear.
• The BSC should include a personal development KPI as part of the learning and
growth perspective.
• This KPI should encourage self-development.
• This KPI should encourage innovation .
26
• Allow opportunities for growth through learning (and making mistakes); and
• Allow the individual to develop this KPI.
The next chapter reflects the finding of the field study done in order to determine if
the BSC is effectively implemented in ArcelorMittal , Vaderbijlpark Works as a
performance measurement tool , and a personal development tool.
27
CHAPTER 3
EMPIRICAL STUDY
3.1 INTRODUCTION
An empirical study was conducted in ArcelorMittal , Vanderbijlpark Works. A
questionnaire was used as the measuring instrument and was issued via the HR
Department to a target group of 724 employees. The questionnaires consisted of 25
questions devided into 2 sections to test both the effectiveness of the BSC as a
performance management tool and as a personal development tool.
This chapter discusses the method of:
• data gathering and data analysis;
• sample selection ;
• measuring instrument selection, and
• measurement instrument design.
The chapter closes with the analysis of the results which were calculated in Microsoft
PHStat and displayed in graphical and table formats.
3.2 METHODOLOGY REVIEW
3.2.1 Data gathering and analysis review
According to Struwig and Stead (2004:86) there are two basic primary data collection
methods:
• Observations; and
• Asking questions.
For the purpose of this study, questions needed to be asked. The methods for
collecting data by means of a questionnaire study can broadly be categorised as
follows (Struwig and Stead, 2004: 86-88) .
• Personal interviews.
28
• Telephone surveys; and
• Mail surveys (alternatively hard copy surveys).
The selection of the appropriate instrument for the survey is discussed in paragraph
3.2.3 in this chapter.
The data-gathering and analysis review of th is study has the following objectives.
• Gather data to be able to analyse the effectiveness of the BSC as performance
management tool and personal development tool in ArcelorMittal, Vanderbijlpark
Works.
• Gather data to be able to analyse data with regards to the effectiveness of the
BSC as performance management tool and personal development tool within the
different BU's in ArcelorMittal , Vanderbijlpark Works.
• Gather data to be able to able to analyse the effectiveness of the BSC as
performance management tool and personal development tool between the
different role gradings (E, F, G roles) in ArcelorMittal , Vanderbijlpark Works; and
• Use statistical methods to analyse the data and determine relationships.
3.2.2 Sample selection
A sample of 724 workers (all the E, F and G roles within ArcelorMittal , Vanderbijlpark
Works) was drawn (see table 3.1). This sample was drawn from the 4 major
business units (BUs) within ArcelorMittal , Vanderbijlpark Works (Engineering, Iron
Making, Steel Making, and Rolling) and the balance of the sample was combined as
a Staff function grouping.
The rationale behind the selection of this sample, is that this is the biggest group of
people that fall with in the category of the management review process as governed
by the BSC process implemented within ArcelorMittal , Vanderbijlpark Works. The
sample covers a broad spectrum of race, gender and age participants at different
levels within the organisation.
This sample was selected because of its ease of accessibility (within ArcelorMittal ,
Vanderbijlpark Works), low cost requirement and limited fieldwork time (the HR
department within the company assisted with the fieldwork).
29
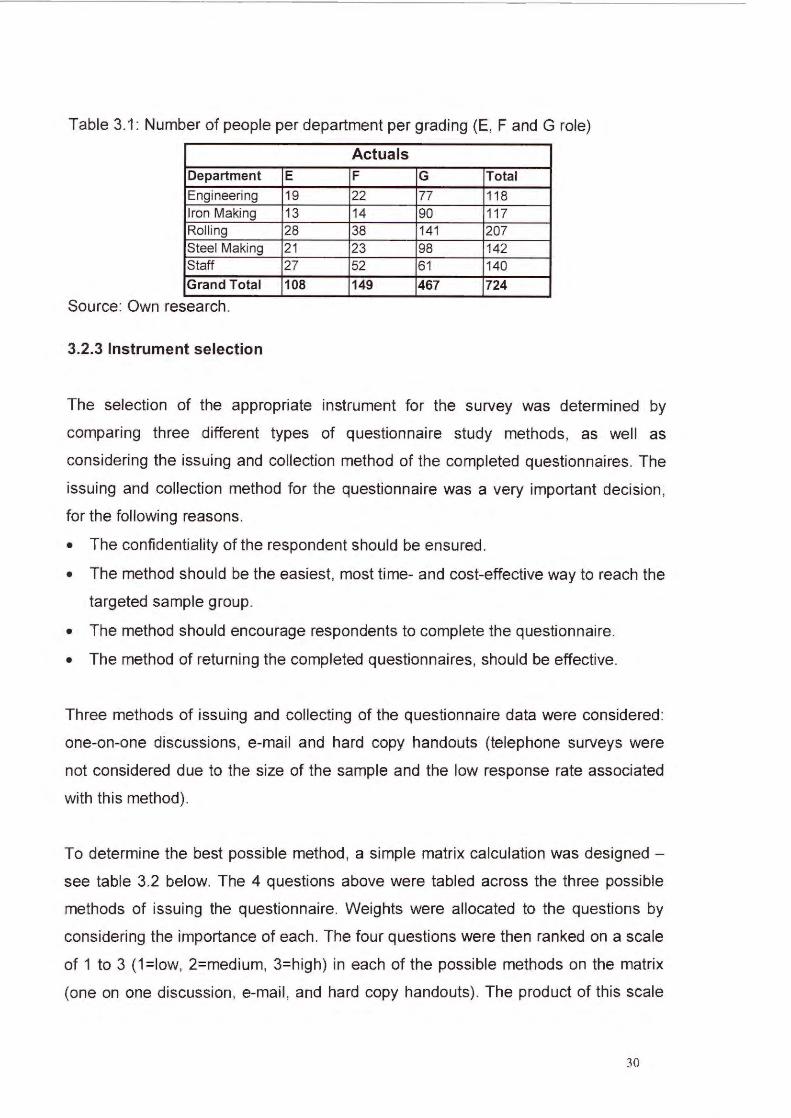
Table 3.1: Number of people per department per grading (E, F and G role)
Actuals Department E F G Total
Engineering 19 22 77 118 Iron Making 13 14 90 117 Rolling 28 38 141 207 Steel Making 21 23 98 142 Staff 27 52 61 140 Grand Total 108 149 467 724
Source: Own research.
3.2.3 Instrument selection
The selection of the appropriate instrument for the survey was determined by
comparing three different types of questionnaire study methods, as well as
considering the issuing and collection method of the completed questionnaires. The
issuing and collection method for the questionnaire was a very important decision,
for the following reasons.
• The confidentiality of the respondent should be ensured.
• The method should be the easiest, most time- and cost-effective way to reach the
targeted sample group.
• The method should encourage respondents to complete the questionnaire.
• The method of returning the completed questionnaires, should be effective.
Three methods of issuing and collecting of the questionnaire data were considered:
one-on-one discussions, e-mail and hard copy handouts (telephone surveys were
not considered due to the size of the sample and the low response rate associated
with this method).
To determine the best possible method, a simple matrix calculation was designed -
see table 3.2 below. The 4 questions above were tabled across the three possible
methods of issuing the questionnaire. Weights were allocated to the questions by
considering the importance of each. The four questions were then ranked on a scale
of 1 to 3 (1 =low, 2=medium, 3=high) in each of the possible methods on the matrix
(one on one discussion, e-mail , and hard copy handouts) . The product of this scale
30
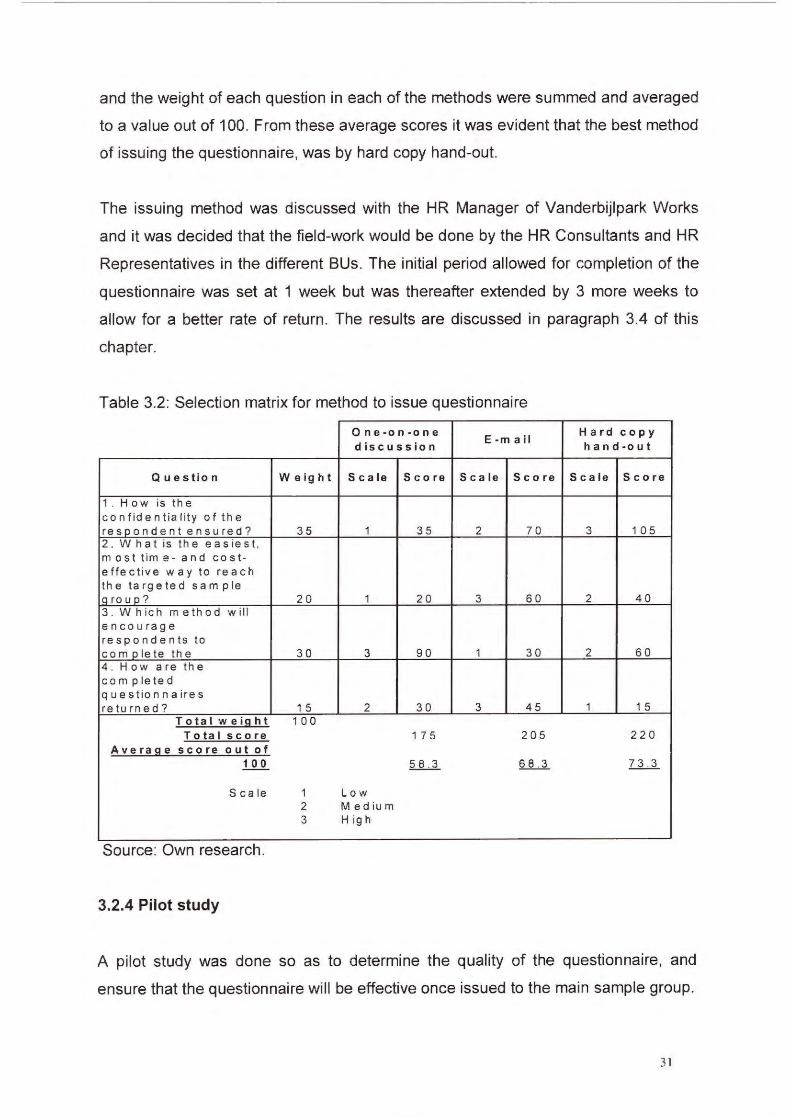
and the weight of each question in each of the methods were summed and averaged
to a value out of 100. From these average scores it was evident that the best method
of issuing the questionnaire, was by hard copy hand-out.
The issuing method was discussed with the HR Manager of Vanderbijlpark Works
and it was decided that the field-work would be done by the HR Consultants and HR
Representatives in the different BUs. The initial period allowed for completion of the
questionnaire was set at 1 week but was thereafter extended by 3 more weeks to
allow for a better rate of return. The results are discussed in paragraph 3.4 of th is
chapter.
Table 3.2: Selection matrix for method to issue questionnaire
One-on-one E-m a i l
Hard copy discussion hand-out
Question Weight 5 ca le 5 core 5 ca le 5 core 5 c ale 5 core
1 . How is th e confidentiality of the res p ondent ensured? 35 1 35 2 70 3 1 0 5 2 . What is the easiest , most time - and cost-effective way to reach the ta rg e te d sam p le g roup? 20 1 20 3 60 2 40 3 . Which method will encourage respondents to com o lete the 30 3 90 1 30 2 60 4 . H ow are the completed questionnaires returned? 1 5 2 30 3 45 1 1 5
Total weight 100 Total score 1 7 5 205 220
Average score out of 100 58 .3 6 8 .3 7 3.3
Scale 1 Low 2 M ed iu m 3 H igh
Source: Own research .
3.2.4 Pilot study
A pilot study was done so as to determine the quality of the questionnaire, and
ensure that the questionnaire will be effective once issued to the main sample group.
31
The main objectives of the pilot study were to ensure the following .
• The covering page was well-constructed and the target group would clearly
understand the purpose of the questionnaire.
• All questions are clear, with no ambiguity.
• The geographical data required do not intimidate the respondent not to complete
the questionnaire.
• The time needed to complete the questionnaire was not too long.
Proposed improvements to the questionnaire determined from the pilot study would
then be implemented before the issuing of the questionnaire to the main sample
group.
3.3 INSTRUMENT DESIGN
3.3.1 The design of the questionnaire
The questionnaire was designed with a cover page, followed by pages containing the
questions. The cover page included the following .
1. The title of the research topic.
2. Demographic information required for the study (department, gender, age,
grading) .
3. An information block indicating the purpose and confidentiality of the
questionnaire.
4. An instruction paragraph on how to complete the questionnaire and where to
deliver the completed document.
The questionnaire was comprised of 2 sections with questions to test responses to
the two main areas of research.
• Performance management (questions 1 to 12).
• Personal development (questions 1 to 8) .
A five point Likert-type Scale was used to measure response. The Likert-type Scale
used, consisted of the following choices: SA - Strongly Agree, A - Agree, N -
32

Neutral, D - Disagree and SO - Strongly Disagree. The questionnaire also made
allowance for additional comments.
This questionnaire tested the effectiveness of the BSC as performance management
tool and personal development tool by addressing the following key issues.
• Is the BSC aligned with the Business strategy?
• Does it reflect the employee's contribution towards the Business strategy?
• Are the KPis relevant to the employee's job?
• Does the employee see this as a fair measure towards his I her performance?
• Does the BSC allow the employee to make mistakes and learn from it?
• Does the BSC encourage innovation?
• Does the BSC encourage teamwork and team performance?
• Does the BSC encourage the employee to self-develop?
The questionnaire was structured in such a way that the questions could be grouped
to test different aspects of the BSC. These groupings can be described as follow.
Questions 1 to 12- Performance Management Tool
• Questions 1, 2 and 3 test effectiveness in terms of the understanding, need for
and compilation of the BSC of the employee.
• Questions 4 and 8 test the effectiveness of communication and feedback with
regards to the formal BSC performance interview.
• Questions 5, 6 and 7 test the effectiveness with regards to the alignment,
weighing and measurability of the KPis on the BSC of the employee.
• Questions 9 and 12 test to see if the employee sees the BSC as a fair
measurement of his or her input.
• Question 10 tests the trust of the employee with regards to the BSC process to
such an extent, that annual remuneration can be linked to it.
• Question 11 specifically tests allowance for innovation within the BSC.
33

Question 1 to 8- Personal Development Tool
• Questions 1, 4 and 6 test the effectiveness of the BSC to encourage employees
to self-develop.
• Question 2 tests the effectiveness of the BSC process with regards to addressing
shortcomings in a development plan.
• Question 3 tests the effectiveness of the BSC to allow for mistakes to be made as
part of the employee's learning process.
• Questions 5, 7 and 8 test the employee's willingness to take ownership of his I
her development.
The questionnaire is attached in Annexure A.
3.3.2 Incorporation of pilot study findings in the questionnaire
An initial questionnaire was designed and tested during a pilot study. From the pilot
study the following 3 main changes were made.
1. Three of the questions were eliminated as this was seen as a duplication of
existing questions.
2. The format of the front page was changed to emphasise the fact that the
questionnaire was based on the performance evaluation which was done during
the year ending 2008.
3. The text font was changed to allow the total questionnaire to be printed on 2
pages (one single double-sided page). This not only reduced costs by 33% but
also ensured that all feedback would be limited to one single document.
3.4 RESULTS
3.4.1 Response rate
The field-work was done during a period of four weeks. Questionnaires were issued
by hand via the HR Department of ArcelorMitta l and collected at a central point. A
34
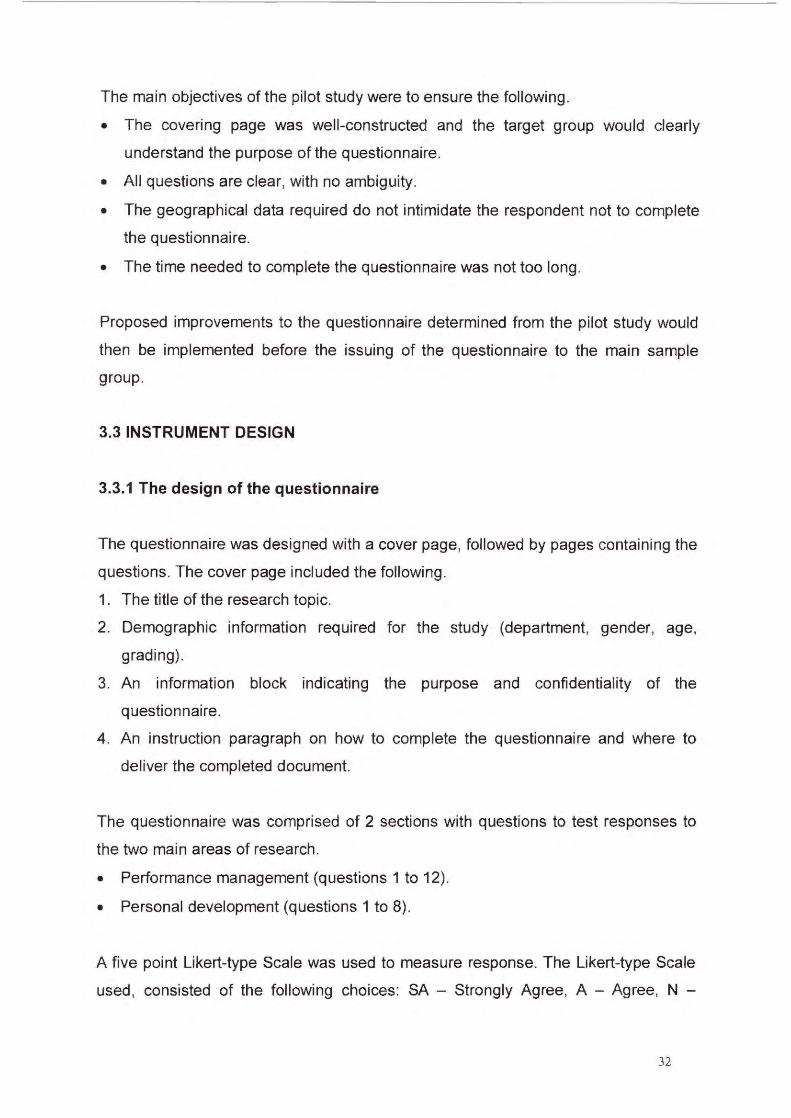
total number of 724 questionnaires were issued and 353 (49%) were received back.
The detail per department is shown in figure 3.1 below.
Figure 3. 1: Response per department
Number of completed questionnaires
2
86
oEngineering • Iron Making D Rei ling O Steel Making • Staff
Source: Own research
The detail of the responses per department (per grading) is shown in table 3.3
below.
Table 3.3: Summary of questionnaires received .
Received Department E F G Total Total %
Engineering 18 15 37 70 59% Iron Making 13 8 51 72 62% Rolling 11 21 54 86 42% Steel Making 10 6 24 40 28% Staff 20 39 26 85 61 % Grand Total 72 89 192 353 49%
--
Source: Own research
3.4.2 Basic analysis
Descriptive statistics and frequency distributions were used and calculated in
Microsoft PHStat. All the data were captured in Microsoft Excel and to enable
analysis of the data the responses on the 5-point Likert-Scale were coded according
to the following :
• Strongly agree= 1,
35
• Agree= 2,
• Neutral = 3,
• Disagree = 4,
• Strongly disagree = 5.
It is important to note that with this coding method, high values will indicate
negative responses while low values will indicate positive responses.
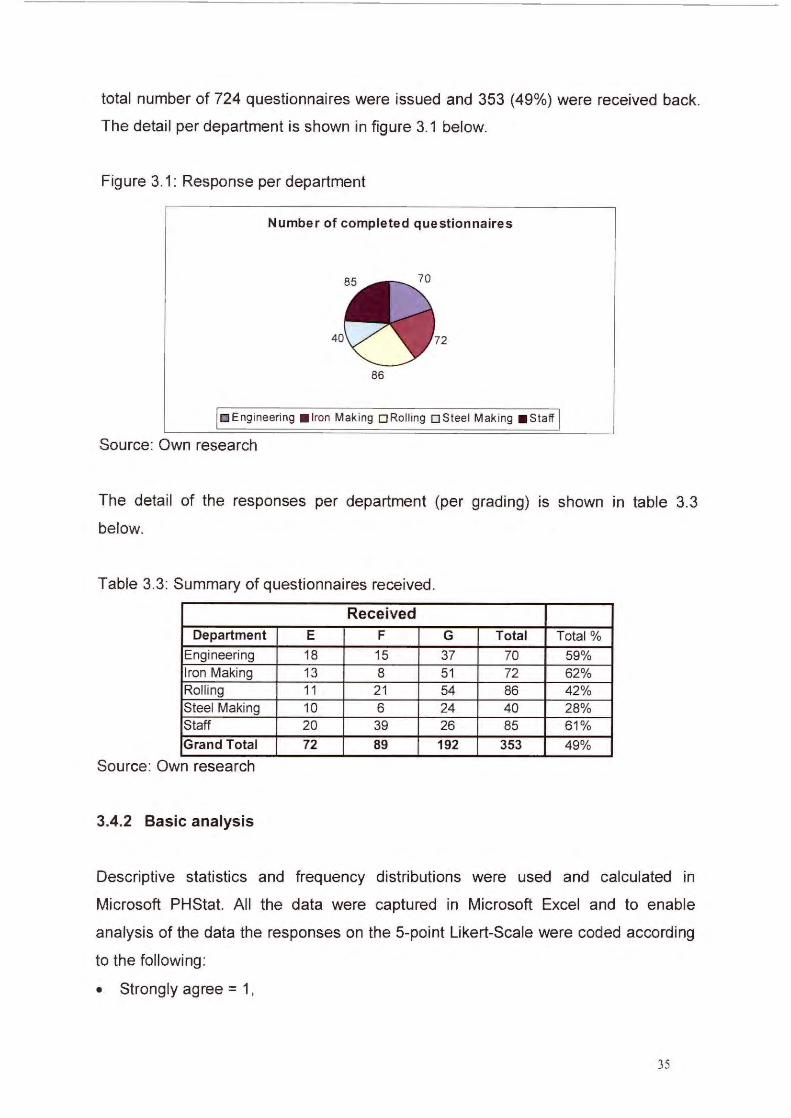
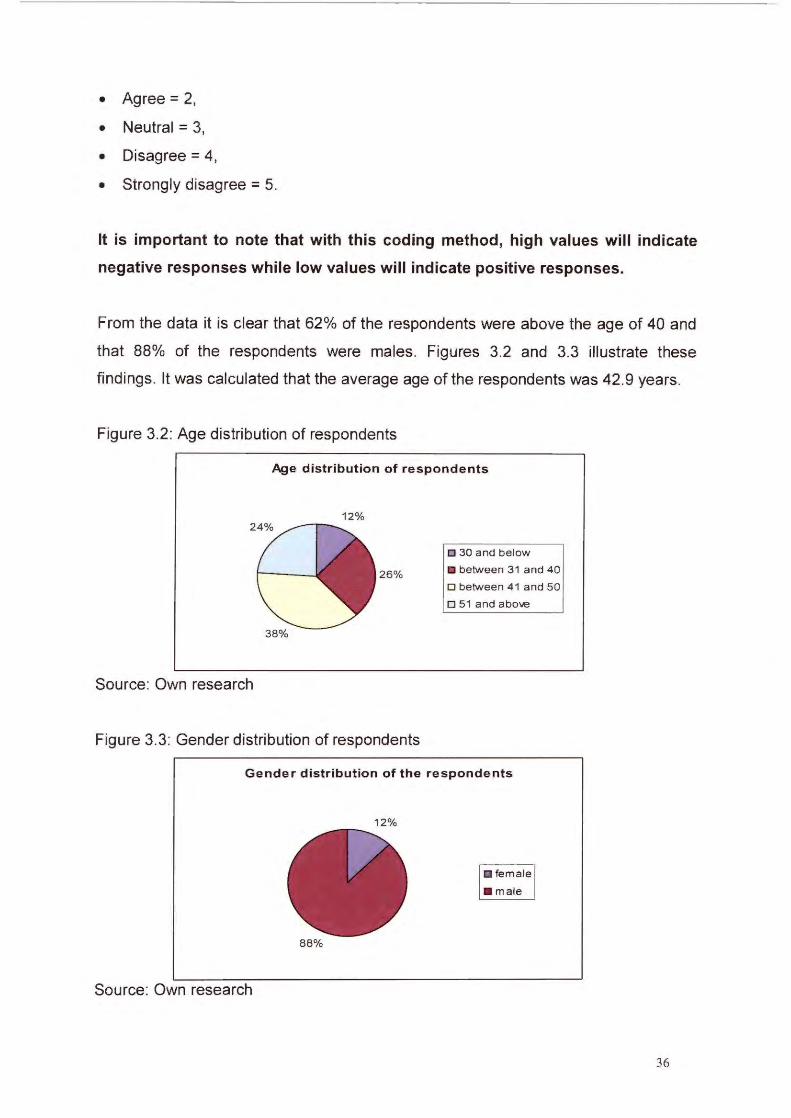
From the data it is clear that 62% of the respondents were above the age of 40 and
that 88% of the respondents were males. Figures 3.2 and 3.3 illustrate these
findings. It was calculated that the average age of the respondents was 42.9 years.
Figure 3.2: Age distribution of respondents
Age distribution of respondents
12%
26%
38%
Source: Own research
Figure 3.3: Gender distribution of respondents
0 30 a nd below
• between 31 and 40
o between 4 1 and 50
0 51 and above
Gender distribution of the respondents
12%
88%
Source: Own research
36
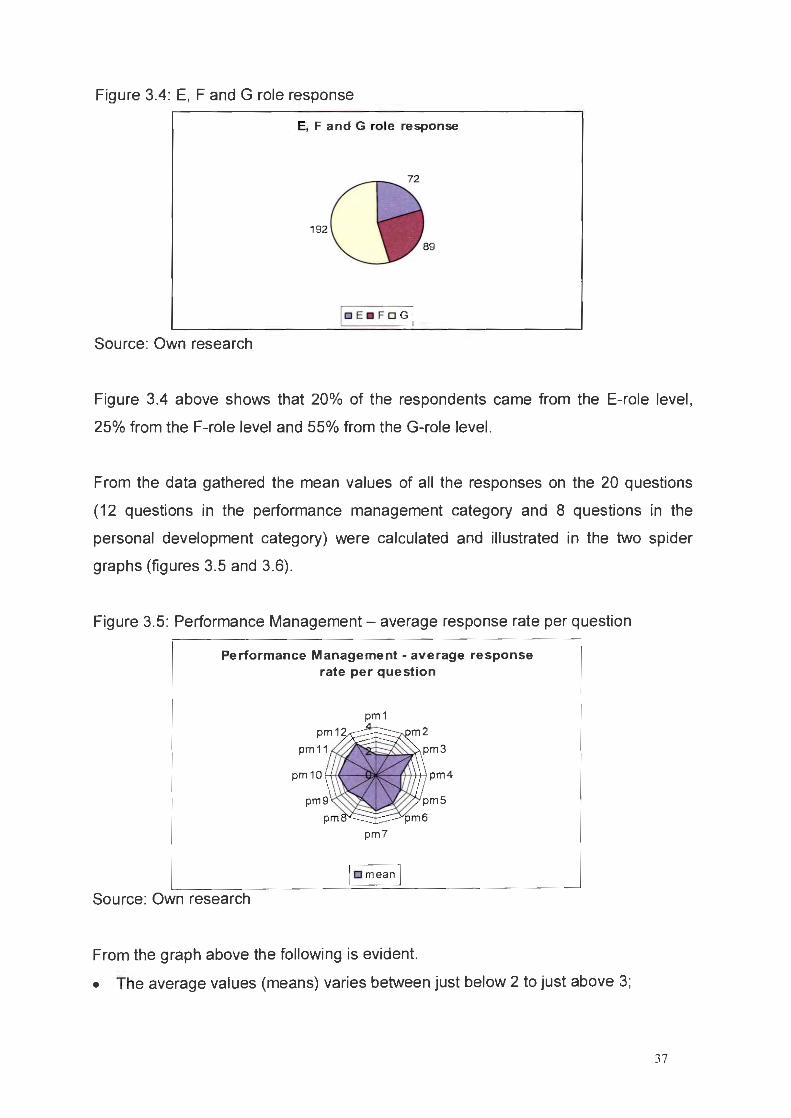
Figure 3.4: E, F and G role response
E, F and G role response
192
icE•F oGj Source: Own research
Figure 3.4 above shows that 20% of the respondents came from the E-role level ,
25% from the F-role level and 55% from the G-role level.
From the data gathered the mean values of all the responses on the 20 questions
(12 questions in the performance management category and 8 questions in the
personal development category) were calculated and illustrated in the two spider
graphs (figures 3.5 and 3.6) .
Figure 3.5: Performance Management- average response rate per question
Performance Management- average response rate per question
pm10 (((( J11C A)))) pm4
pm7
l o mean j
Source: Own research
From the graph above the following is evident.
• The average values (means) varies between just below 2 to just above 3;
37
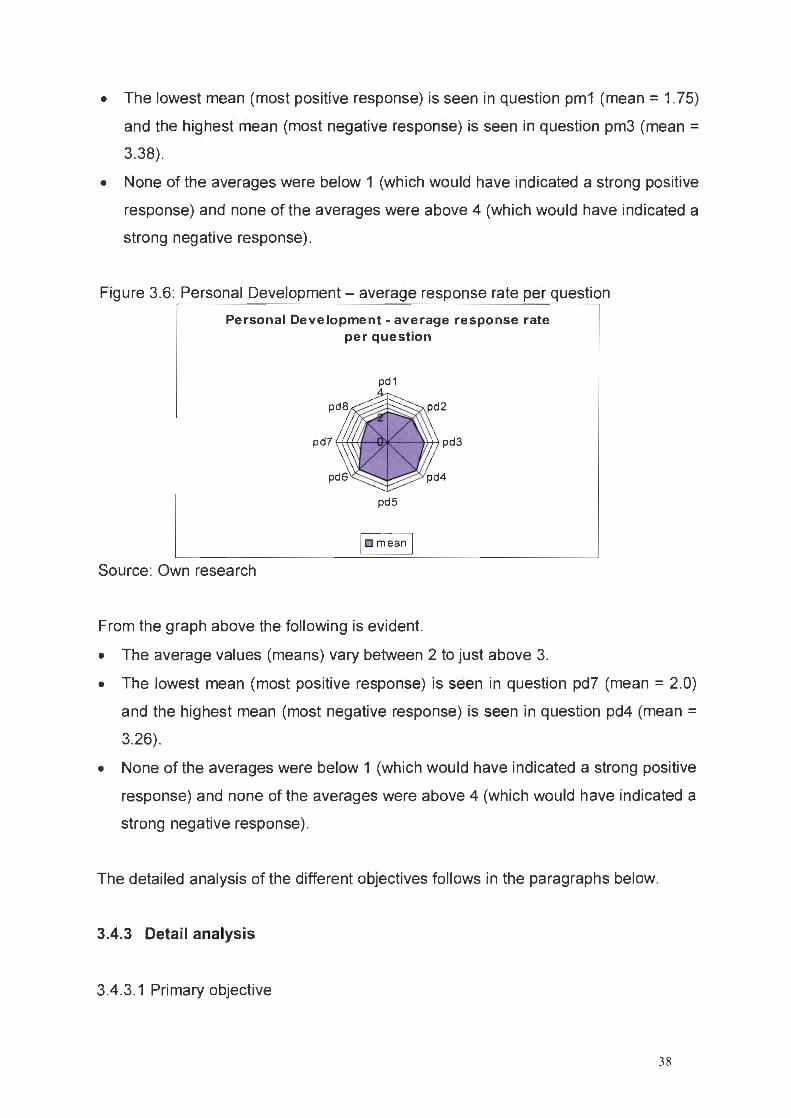
• The lowest mean (most positive response) is seen in question pm1 (mean= 1.75)
and the highest mean (most negative response) is seen in question pm3 (mean =
3.38).
• None of the averages were below 1 (which would have indicated a strong positive
response) and none of the averages were above 4 (which would have indicated a
strong negative response).
Figure 3.6: Personal Development- average response rate per question
Personal Development- average response rate per question
pd1
pd7 (((( fl .. . ))) ) pd3
pd5
lcmean l Source: Own research
From the graph above the following is evident.
• The average values (means) vary between 2 to just above 3.
• The lowest mean (most positive response) is seen in question pd? (mean = 2.0)
and the highest mean (most negative response) is seen in question pd4 (mean =
3.26).
• None of the averages were below 1 (which would have indicated a strong positive
response) and none of the averages were above 4 (which would have indicated a
strong negative response).
The detailed analysis of the different objectives follows in the paragraphs below.
3.4.3 Detail analysis
3.4.3.1 Primary objective
38
3.4.3.1.1 Primary objective- Performance management tool
The mean values of the responses to the questions are illustrated in figure 3.7 below
and the frequency distributions in table 3.4 below.
From these graphs and frequency tables the following is evident.
• Testing of the understanding, need and compilation of the BSC (questions pm1 ,
pm2 and pm3).
- The positive response to questions pm1 [(mean = 1.75 and frequency =
90.09% (agree and strongly agree)] and pm2 [(mean = 1.90 and frequency =
87.82% (agree and strongly agree)] indicated, that the respondents do have a
formal BSC and that they understand the need thereof.
- Question pm3 (mean = 3.38) indicates that 55.81 % of the respondents feel
that they had input into their BSC compilation while 17.56% were neutral to
this question. The balance (26.63%) of the respondents indicated that they
had no input into the compilation of their BSC. The total of 44.19%
(respondents answering neutral or not agreeing) is an indicator of concern ,
with possibilities of improvement.
• Testing communication and feedback during the BSC process (questions pm4
and pm8).
- The positive responses to questions pm4 (mean = 1.96) and pm8 (mean =
2.17) indicate, that the communication and feedback with regards to the
formal BSC interview is effective. This is confirmed by the high positive
frequency distribution of above 80% for both the questions.
• Testing alignment, weights and measurability of the KPI's (questions pm5, pm6
and pm7).
- Question pm5 (mean = 2.23) with frequency= 70.25% (agree and strongly
agree) indicates, that the KPI 's of the respondents are aligned with the
ArcelorMittal Strategic objectives.
39
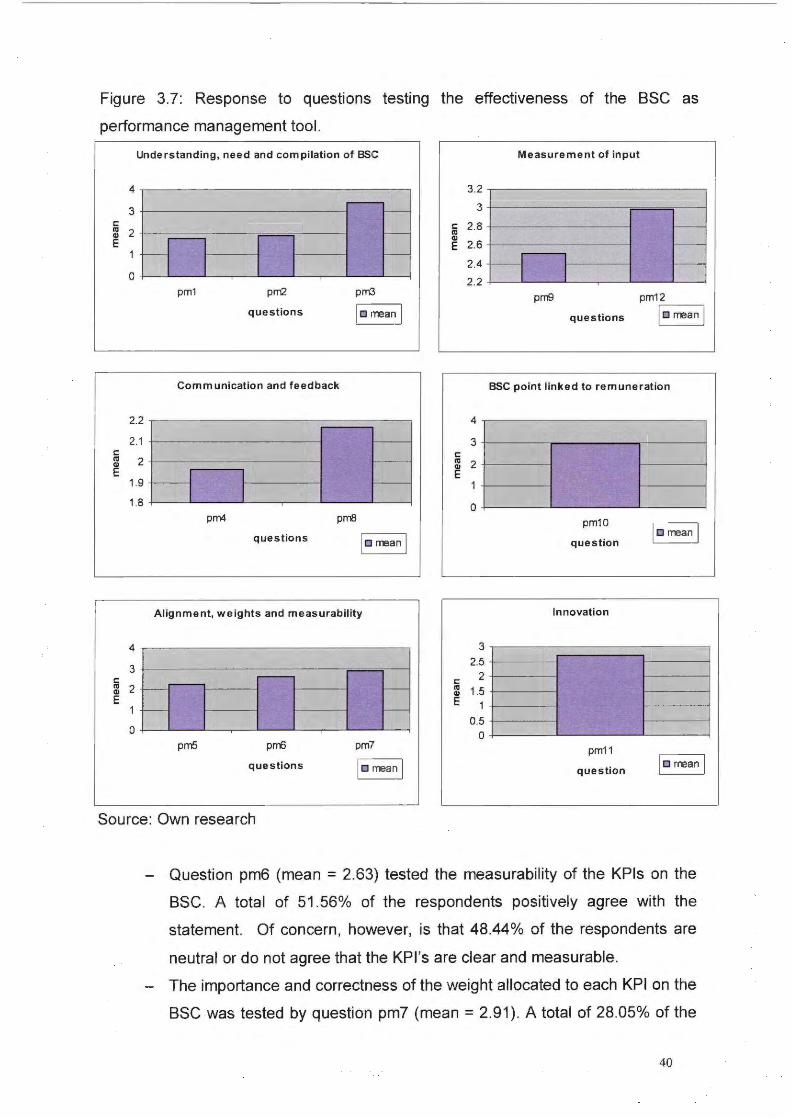
Figure 3.7: Response to questions testing the effectiveness of the SSe as
performance management tool .
Understanding, need and compilation of BSC
:1 r===cJ c ~ 2 +-------------------------------~ E
0+-~----L-~--~---L--~~~--~~
c
2.2
2.1
~ 2 E
1.9
1.8
pm1 pm2 pm3
questions !c mean I
Communication and feedback
I I ~--------1 pm4 pm8
questions !c mean I
Alignment, weights and measurability
c
4
3
~ 2 E
0 ~ n n;
pm5 prr6 pm7
questions ic mean I
Source: Own research
3.2
3
~ 2.8 Q)
E 2.6
2.4
2.2
Measurement of input
pm9 pm12 .----
questions ic mean I
BSC point linked to remuneration
4,.....---------------, 3+-----------..-----1
c ~ 2 +----------j E
0+----~--------~~--~
pm10 !c mean I question
Innovation
3 2.5
c 2 nl 1.5 Q)
E 1
0.5 0
pm11
question lc mean I
Question pm6 (mean = 2.63) tested the measurability of the KPis on the
sse. A total of 51 .56% of the respondents positively agree with the
statement. Of concern , however, is that 48.44% of the respondents are
neutral or do not agree that the KPI 's are clear and measurable.
The importance and correctness of the weight allocated to each KPI on the
SSe was tested by question pm7 (mean= 2.91 ). A total of 28.05% of the
40
respondents agree that this is the biggest drawback of the BSC system,
50.14% are neutral on this question and 21 .81% see this as no drawback.
This indicator is an area of concern, with possibilities of improvement.
Table 3.4: Frequency distribution- performance management questions
pm1 pm2 pm3 pm4 bins Frequency Percentaqe Frequency Percentaqe Frequency Percentaqe Frequency Percentaqe
1 143 40.51 % 102 28.90% 29 8.22% 97 27.48% 2 175 49.58% 208 58.92% 65 18.41% 203 57.51 % 3 23 6.52% 28 7.93% 62 17.56% 29 8.22% 4 5 1.42% 6 1.70% 136 38.53% 17 4.82% 5 7 1.98% 9 2.55% 61 17.28% 7 1.98%
gmS pm6 pm7 pm8 bins Frequency Percentage Frequency Percentage Frequency Percentage Frequency Percentage
1 53 15.01 % 26 7.37% 21 5.95% 68 19.26% 2 195 55.24% 156 44.19% 78 22.10% 217 61.47% 3 84 23.80% 110 31 .16% 177 50.14% 26 7.37% 4 14 3.97% 46 13.03% 67 18.98% 26 7.37% 5 7 1.98% 15 4.25% 10 2.83% 16 4.53%
pm9 pm10 pm11 pm12 bins Frequency Percentaqe Frequency Percentaqe Frequency Percentaqe Frequency Percentaqe
1 40 11.33% 24 6.80% 21 5.95% 28 7.93% 2 170 48.16% 137 38.81 % 158 44.76% 118 33.43% 3 84 23.80% 75 21 .25% 100 28.33% 87 24.65% 4 42 11.90% 68 19.26% 46 13.03% 72 20.40% 5 17 4.82% 49 13.88% 28 7.93% 48 13.60%
Source: Own research
• Testing the input (effort) given by the respondents at the workplace (questions
pm9 and pm12).
- Question pm9 (mean = 2.51) indicates that the majority of the respondents
(59.49%) see the BSC point as a reflection of their "perceived performance"
rather than their actual performance. This correlates well with question pm12
(mean = 2.98) with only 41 .36% of the respondents agreeing that the BSC
reflects the effort they put in at the workplace. This indicator is an area of
concern , with possibilities of improvement.
• Testing the degree of comfort the respondents have with linking the BSC
outcome to their remuneration (question pm1 0) .
4 1
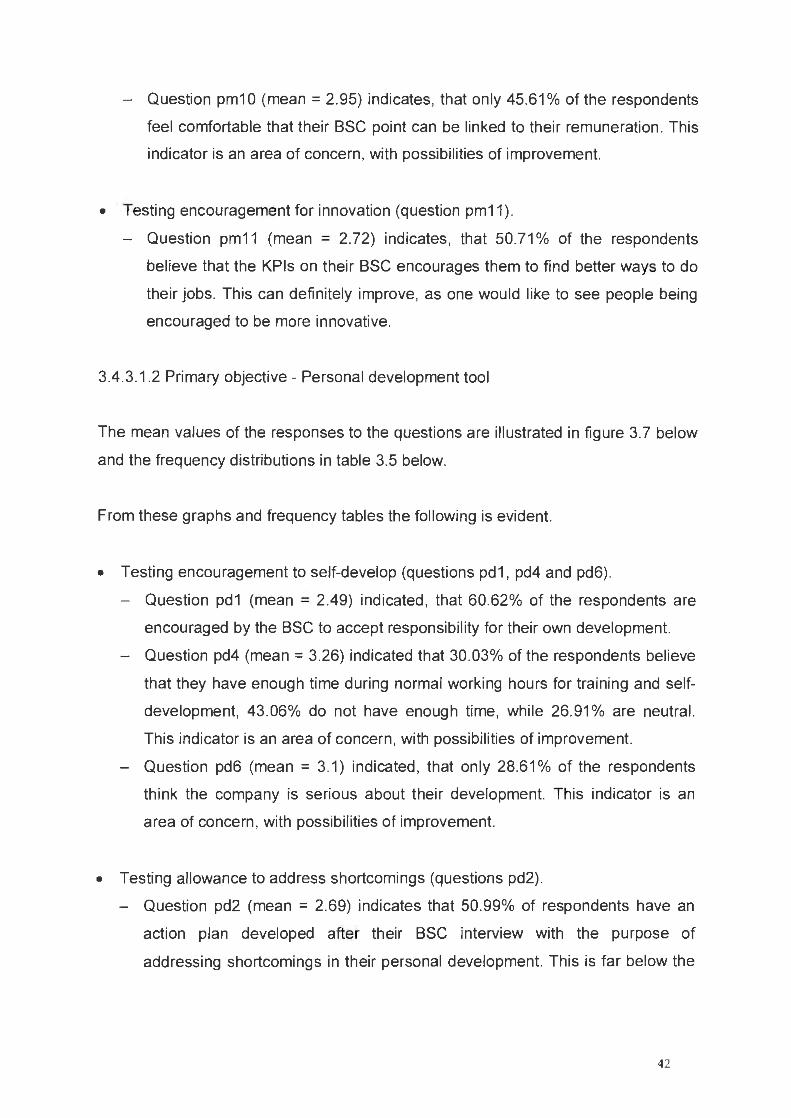
- Question pm1 0 (mean = 2.95) indicates, that only 45.61% of the respondents
feel comfortable that their BSC point can be linked to their remuneration . This
indicator is an area of concern , with possibilities of improvement.
• Testing encouragement for innovation (question pm11 ).
- Question pm11 (mean = 2.72) indicates, that 50.71 % of the respondents
believe that the KPis on their BSC encourages them to find better ways to do
their jobs. This can definitely improve, as one would like to see people being
encouraged to be more innovative.
3.4.3.1.2 Primary objective- Personal development tool
The mean values of the responses to the questions are illustrated in figure 3. 7 below
and the frequency distributions in table 3.5 below.
From these graphs and frequency tables the following is evident.
• Testing encouragement to self-develop (questions pd1 , pd4 and pd6).
- Question pd1 (mean = 2.49) indicated, that 60.62% of the respondents are
encouraged by the BSC to accept responsibility for their own development.
- Question pd4 (mean = 3.26) indicated that 30.03% of the respondents believe
that they have enough time during normal working hours for training and self
development, 43.06% do not have enough time, while 26.91 % are neutral.
This indicator is an area of concern , with possibilities of improvement.
- Question pd6 (mean = 3.1) indicated, that only 28.61 % of the respondents
think the company is serious about their development. This indicator is an
area of concern , with possibilities of improvement.
• Testing allowance to address shortcomings (questions pd2).
- Question pd2 (mean = 2.69) indicates that 50.99% of respondents have an
action plan developed after their BSC interview with the purpose of
addressing shortcomings in their personal development. This is far below the
42
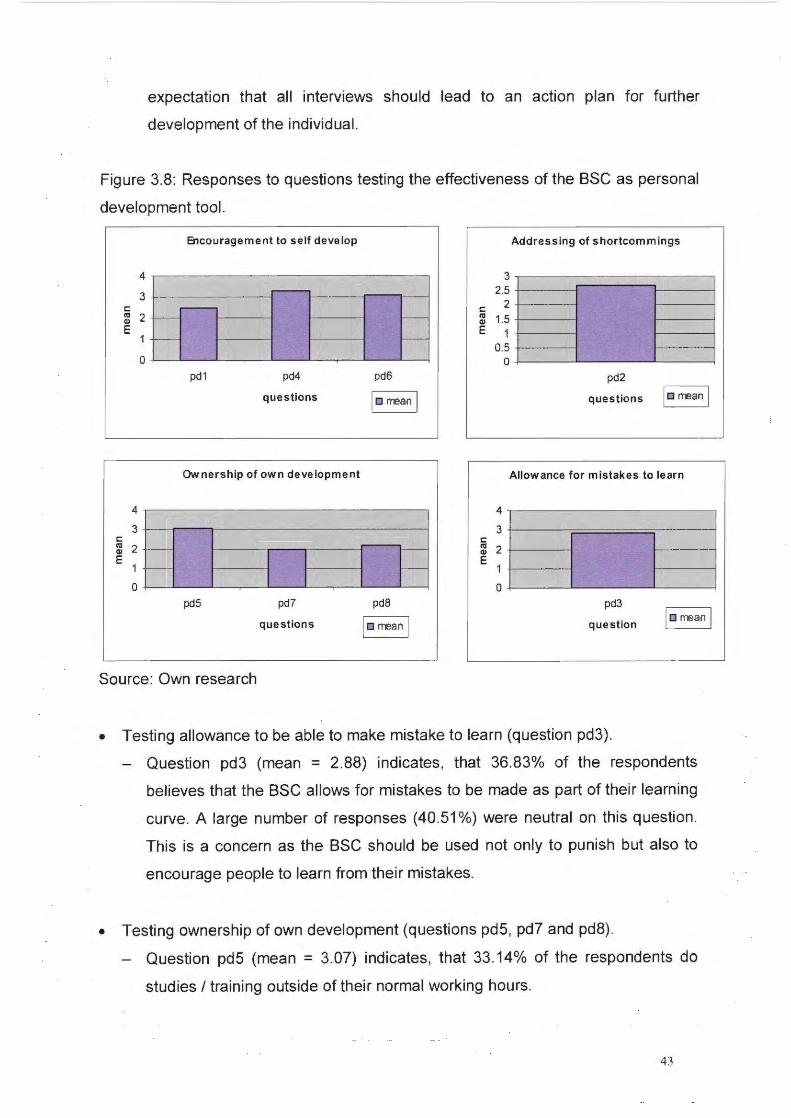
expectation that all interviews should lead to an action plan for further
development of the individual.
Figure 3.8: Responses to questions testing the effectiveness of the BSC as personal
development tool.
c:
4
3
::: 2 E
0
f---
-
Encouragement to self develop
-
---
pd1 pd4
questions
Ownership of own development
1---
1---
'-------
pd6
I c rrean I
Addressing of shortcommings
3 2.5
c: 2 co 1.5 Ql
E 1 0.5
0 pd2
questions lc rrean I
Allowance for mistakes to learn
c:
4
3
::: 2 E 1
0 ~ I I I FF 4 ~----------------------~
3+-----~~~~~----~ c: ::: 2 E r----_j
0+-------~--------~----~
pd7 pd8
I c rrean I pd5
questions
pd3 I c rrean I question
Source: Own research
• Testing allowance to be able to make mistake to learn (question pd3).
Question pd3 (mean = 2.88) indicates, that 36.83% of the respondents
believes that the BSC allows for mistakes to be made as part of their learning
curve. A large number of responses (40.51 %) were neutral on this question.
This is a concern as the BSC should be used not only to punish but also to
encourage people to learn from their mistakes.
• Testing ownership of own development (questions pd5, pd7 and pd8).
Question pd5 (mean = 3.07) indicates, that 33.14% of the respondents do
studies I training outside of their normal working hours.
43
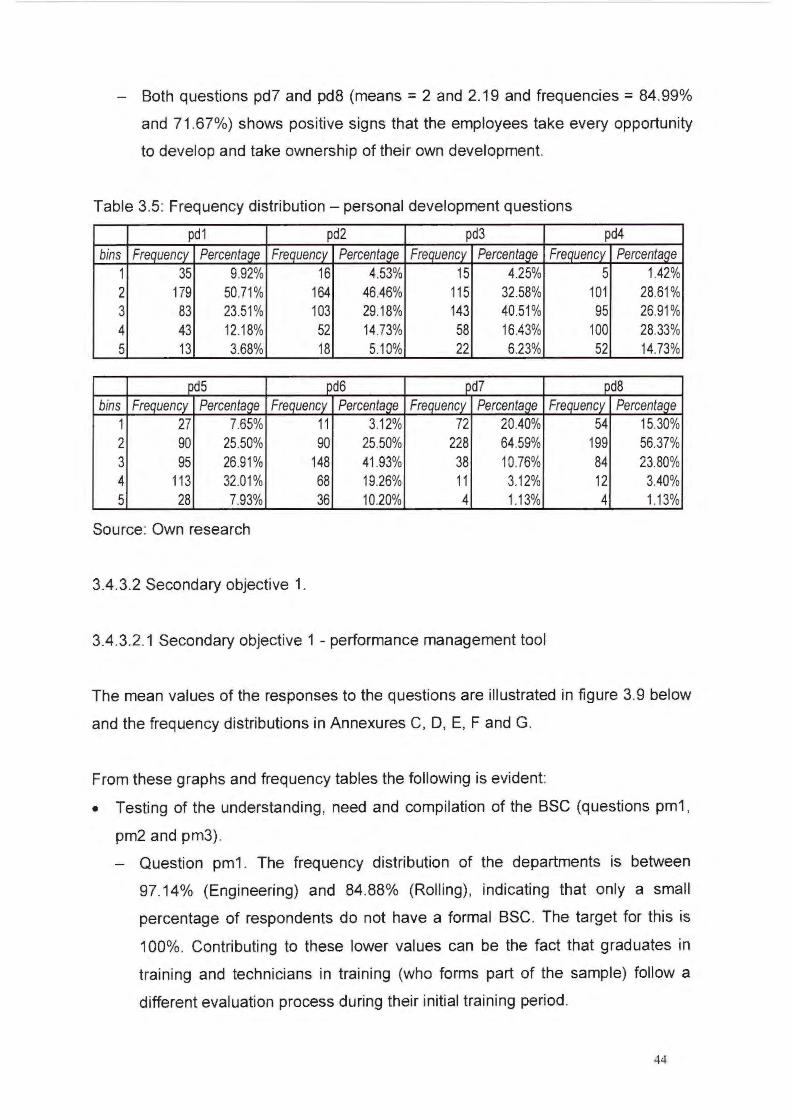
- Both questions pd7 and pd8 (means = 2 and 2.19 and frequencies = 84.99%
and 71.67%) shows positive signs that the employees take every opportunity
to develop and take ownership of their own development.
Table 3.5: Frequency distribution- personal development questions
pd1 pd2 pd3 pd4 bins Frequency Percentage Frequency Percentage Frequency Percentage Frequency Percentage
1 35 9.92% 16 4.53% 15 4.25% 5 1.42% 2 179 50.71 % 164 46.46% 115 32.58% 101 28.61 % 3 83 23.51 % 103 29.18% 143 40.51% 95 26.91 % 4 43 12.18% 52 14.73% 58 16.43% 100 28.33% 5 13 3.68% 18 5.10% 22 6.23% 52 14.73%
pd5 pd6 _pd7 pd8 bins Frequency Percentage Frequency Percentage Frequency Percentage Frequency Percentage
1 27 7.65% 11 3.12% 72 20.40% 54 15.30% 2 90 25.50% 90 25.50% 228 64.59% 199 56.37% 3 95 26.91% 148 41 .93% 38 10.76% 84 23.80% 4 113 32.01 % 68 19.26% 11 3.12% 12 3.40% 5 28 7.93% . ~ 10.20% 4 1.13% 4 1.13%
-
Source: Own research
3.4.3.2 Secondary objective 1.
3.4.3.2.1 Secondary objective 1 -performance management tool
The mean values of the responses to the questions are illustrated in figure 3.9 below
and the frequency distributions in Annexures C, D, E, F and G.
From these graphs and frequency tables the following is evident:
• Testing of the understanding, need and compilation of the BSC (questions pm1 ,
pm2 and pm3) .
- Question pm1 . The frequency distribution of the departments is between
97.14% (Engineering) and 84.88% (Rolling) , indicating that only a small
percentage of respondents do not have a formal BSC. The target for this is
100%. Contributing to these lower values can be the fact that graduates in
training and technicians in training (who forms part of the sample) follow a
different evaluation process during their initial training period.
44

Figure 3.9: Response to questions testing the effectiveness of the BSC as
performance management tool.
Understanding, need and compilation of BSC
4
3.5 3
c: 2.5 2 "' Ql
E 1.5
1
0.5 0
pm1 pm2 pm3
quest ions
c Engineering • t-on Making o Steel Making o Rolfing • Staff
Communication and feedback
2.5
2
c: 1.5
"' Ql
E
0.5
0
prn4 prrB
que stions
o Engineering • t-on Making o Steel Making o Rolling • Staff
Alignment, w eights and m easurability
3.5
3
2.5 c: 2 "' e 1.5
0.5
0
pmS prr6 pm7
questions
c Engineering • Iron Making o Steel Making o Rolling • Staff
Source: Own research
Measurement of input
3.5
3
2.5
c: 2 "' e 1.5
1
0.5
0
prre pm12
questions
c Engineering • t-on Making o Steel Making o Rolling • Staff
BSC point linked to remuneration
3.2 ..,----------------,
3 c: :g 2.8 E
2.6
2.4 +----'----'
3 ~9
c: 2.8 :g 2.7 E ~6
2.5 2.4
pm10
que stion
c Engineering • ron Making o Steel Making
o RoUing • Staff
Innovation
pm11
quest ion
o Engineering • t-on Making 0 Steel Making
o Rolling • Staff
45
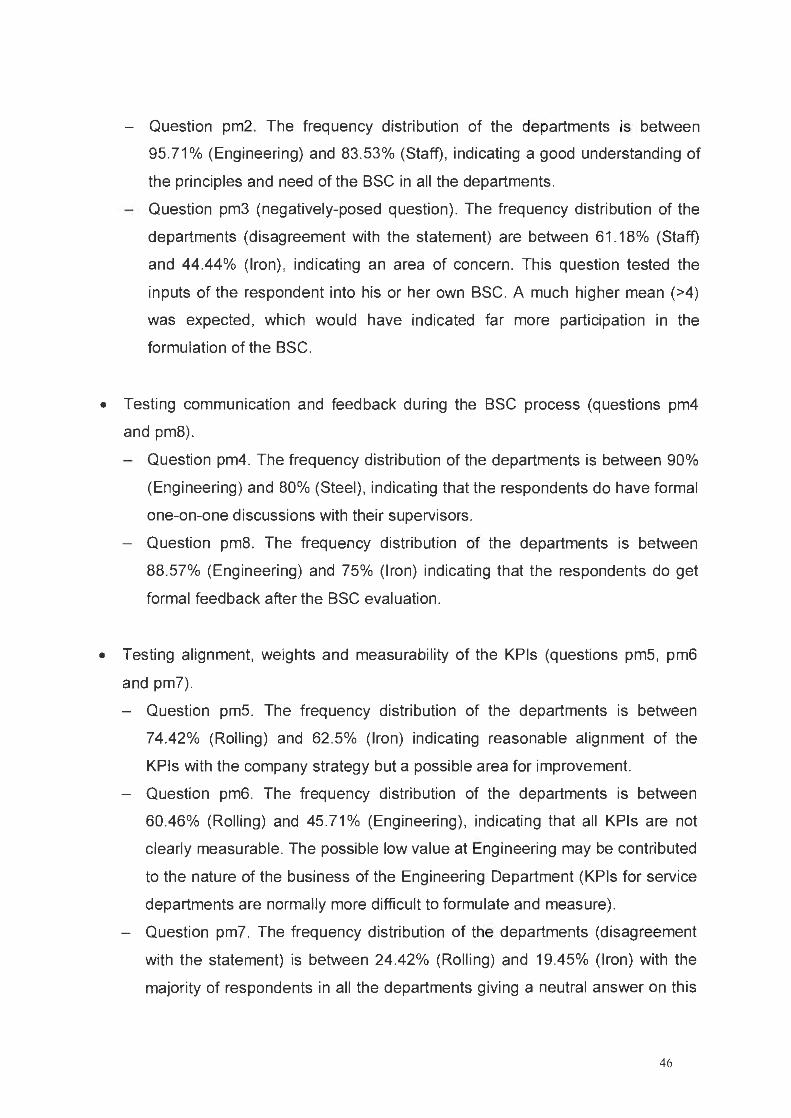
- Question pm2. The frequency distribution of the departments is between
95.71 % (Engineering) and 83.53% (Staff), indicating a good understanding of
the principles and need of the BSC in all the departments.
- Question pm3 (negatively-posed question). The frequency distribution of the
departments (disagreement with the statement) are between 61 .18% (Staff)
and 44.44% (Iron), indicating an area of concern. This question tested the
inputs of the respondent into his or her own BSC. A much higher mean (>4)
was expected, which would have indicated far more participation in the
formulation of the BSC.
• Testing communication and feedback during the BSC process (questions pm4
and pm8).
- Question pm4. The frequency distribution of the departments is between 90%
(Engineering) and 80% (Steel), indicating that the respondents do have formal
one-on-one discussions with their supervisors.
- Question pm8. The frequency distribution of the departments is between
88.57% (Engineering) and 75% (Iron) indicating that the respondents do get
formal feedback after the BSC evaluation.
• Testing alignment, weights and measurability of the KPis (questions pm5, pm6
and pm7) .
- Question pm5. The frequency distribution of the departments is between
74.42% (Rolling) and 62.5% (Iron) indicating reasonable alignment of the
KPis with the company strategy but a possible area for improvement.
- Question pm6. The frequency distribution of the departments is between
60.46% (Rolling) and 45.71 % (Engineering), indicating that all KPis are not
clearly measurable. The possible low value at Engineering may be contributed
to the nature of the business of the Engineering Department (KPis for service
departments are normally more difficult to formulate and measure).
- Question pm7. The frequency distribution of the departments (disagreement
with the statement) is between 24.42% (Rolling) and 19.45% (Iron) with the
majority of respondents in all the departments giving a neutral answer on th is
46

question. This indicates that all the departments see the weights allocated to
the KPis as a possible drawback of the SSe system.
• Testing the input (effort) given by the respondents at the workplace (questions
pm9 and pm12).
- Question pm9. The frequency distribution of the departments is 70% (Steel),
66.28% (Rolling) , 56.94% (Iron) 55.29% (Staff) and 52.86% (Engineering)
indicating that more than 50% of all respondents believe that the sse points
is a reflection of what the supervisor "thinks" of their performance. The big gap
between the Engineering, Iron and Staff departments compared to the Steel
and Rolling departments indicates a serious concern.
- Question pm12. The frequency distribution of the departments is between
50% (Rolling) and 34.73% (Iron), indicating more than 50% of all respondents
do not believe that the sse reflects the effort they put in at the workplace.
This correlates well with the responses in question pm9 and indicates an area
of serious concern.
• Testing the degree of comfort, the respondents have with linking the sse
outcome to their remuneration (question pm1 0) .
- Question pm1 0. The frequency distribution of the departments is between
57.63% (Staff) and 37.14% (Engineering) indicating less than 60% of all
respondents are comfortable that their annual remuneration reward can be
linked to their SSe point. The very high mean values calculated in the
Engineering, Iron and Steel departments (all > 3) indicate a real concern in
this area.
• Testing encouragement for innovation (question pm11 ).
- Question pm11 . The frequency distribution of the departments is between
56.97% (Rolling) and 42.85% (Engineering) indicating a less than expected
opportunity for innovation. This result is of specific concern in the Engineering
department that should be focused on innovative solutions to improve the
business.
47
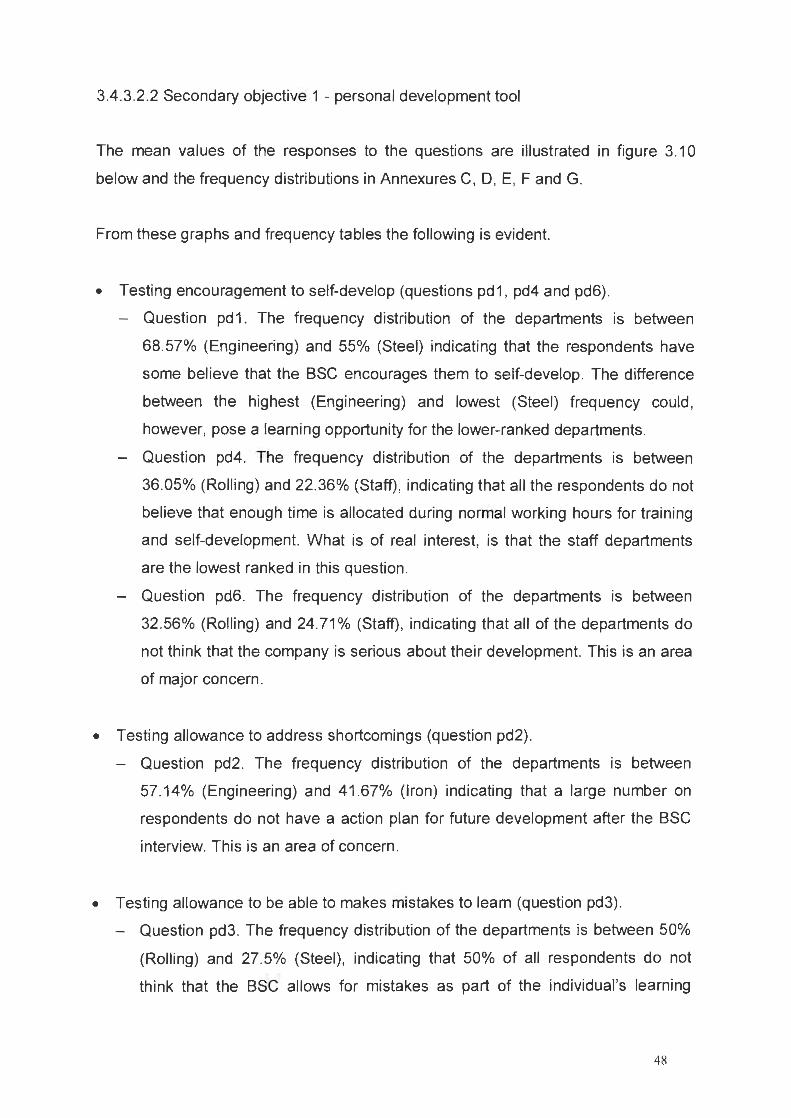
3.4.3.2 .2 Secondary objective 1 - personal development tool
The mean values of the responses to the questions are illustrated in figure 3.10
below and the frequency distributions in Annexures C, D, E, F and G.
From these graphs and frequency tables the following is evident.
• Testing encouragement to self-develop (questions pd1 , pd4 and pd6).
- Question pd1 . The frequency distribution of the departments is between
68.57% (Engineering) and 55% (Steel) indicating that the respondents have
some believe that the BSC encourages them to self-develop. The difference
between the highest (Engineering) and lowest (Steel) frequency could ,
however, pose a learning opportunity for the lower-ranked departments.
- Question pd4. The frequency distribution of the departments is between
36.05% (Rolling) and 22.36% (Staff) , indicating that all the respondents do not
believe that enough time is allocated during normal working hours for training
and self-development. What is of real interest, is that the staff departments
are the lowest ranked in this question.
- Question pd6. The frequency distribution of the departments is between
32.56% (Rolling) and 24.71 % (Staff), indicating that all of the departments do
not think that the company is serious about their development. This is an area
of major concern .
• Testing allowance to address shortcomings (question pd2) .
Question pd2. The frequency distribution of the departments is between
57.14% (Engineering) and 41 .67% (Iron) indicating that a large number on
respondents do not have a action plan for future development after the BSC
interview. This is an area of concern .
• Testing allowance to be able to makes mistakes to learn (question pd3).
- Question pd3. The frequency distribution of the departments is between 50%
(Rolling) and 27.5% (Steel), indicating that 50% of all respondents do not
think that the BSC allows for mistakes as part of the individual 's learning
48
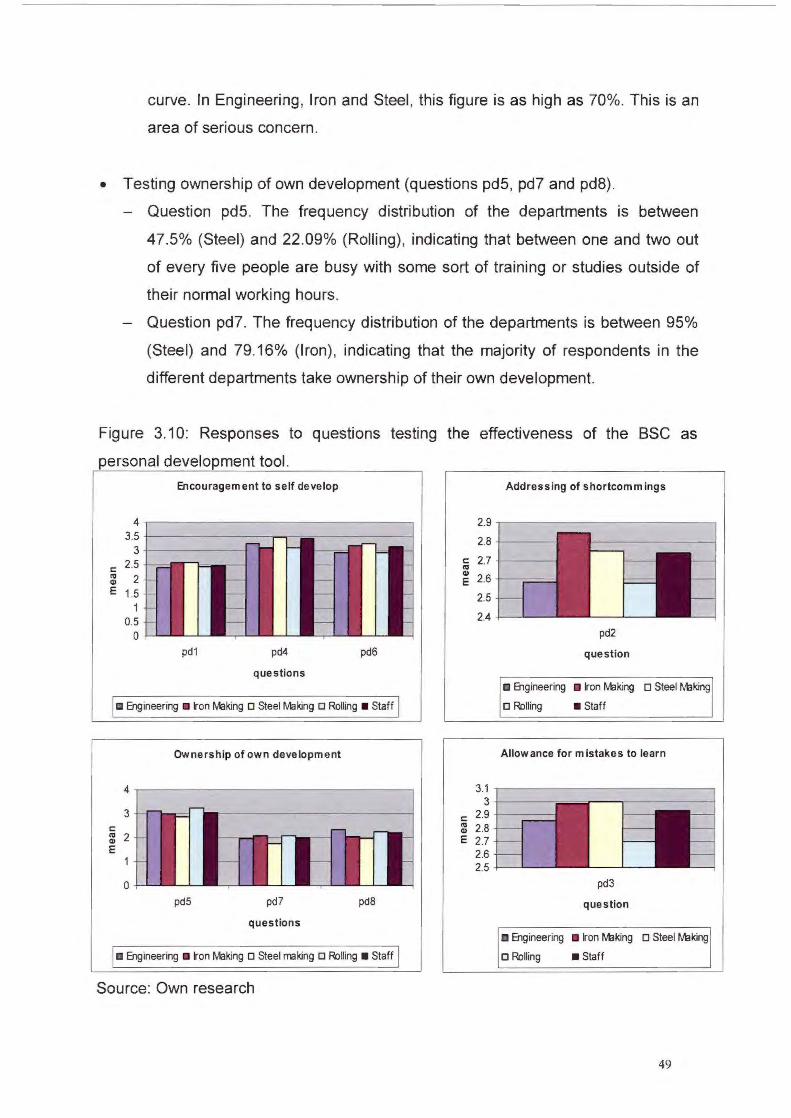
curve. In Engineering, Iron and Steel , this figure is as high as 70%. This is an
area of serious concern.
• Testing ownership of own development (questions pd5, pd7 and pd8) .
Question pd5. The frequency distribution of the departments is between
47.5% (Steel) and 22.09% (Rolling), indicating that between one and two out
of every five people are busy with some sort of training or studies outside of
their normal working hours.
Question pd7. The frequency distribution of the departments is between 95%
(Steel) and 79.16% (Iron), indicating that the majority of respondents in the
different departments take ownership of their own development.
Figure 3.10: Responses to questions testing the effectiveness of the BSC as
personal development tool.
Encouragement to self develop
4 3.5
3 1:: 2.5
"' 2 <I>
E 1.5 1
0.5 0
pd1 pd4 pd6
questions
c Engineering • ~on Making o Steel Making o Rolling • Staff
Ownership of own development
4 r---------------------------------~
3 1::
~ 2 E
0 pd5 pd7 pd8
questions
c Engineering • ~on Making o Steel making o Rolling • Staff
Source: Own research
Addressing of shortcom m ings
2.9 fl --= ------2.8 - I
:; 2.7
e 2.6
2.5
2.4 +-__._ _ _.
pd2
question
c 8lgineering • ~on Making o Steel Making
o Rolling • Staff
Allow a nee form istakes to learn
1:: ::~ f I I J ~ 2.8 E 2.7
2.6 2.5 +-__._ __
pd3
question
c Engineering • ~on Making o Steel Making
o Rolling • Staff
49
- Question pd8. The frequency distribution of the departments is between
82.5% (Steel) and 62.86% (Engineering), indicating that many of the
respondents in the different departments use every possible opportunity to
self-develop. The lower frequency value in the Engineering and Staff
departments could indicate an opportunity for improvement.
3.4.3.3 Secondary objective 2.
3.4.3.3.1 Secondary objective 2- performance management tool
The mean values of the responses to the questions are illustrated in figure 3.11
below and the frequency distributions in Annexures H, I and J.
From these graphs and frequency tables the following is evident.
• Testing of the understanding, need and compilation of the BSC (questions pm1 ,
pm2 and pm3).
- Question pm1. Mean values of below 2 for E, F, and G roles indicate a very
strong positive response to this question. The frequency distribution of the
gradings is: 98.59% E roles, 92.22% F roles and 85.94% G roles indicating
that the majority of respondents do have formal BSC's. A possible contributor
to the lower value on the G-role level, is the fact that the majority of engineers
in training and technicians in training are appointed on G-role level and follow
a structured training programme with a performance management system
different to the standard BSC process.
- Question pm2. The frequency distribution of the gradings is: 84.51 % E-roles,
93.33% F-roles and 85.94% G-roles, indicating a high level of communication
effectiveness with regards to the principles and need of a BSC. The higher
frequency value on the F-role level (and lower mean value indicating a strong
positive response) indicates a very strong level of communication downwards
from the E-role level.
- Question pm3 (negatively-posed question). The frequency distribution of the
gradings (disagreement with the statement) is: 63.38% E-roles, 61.11% F
roles and 50.52% G-roles. This indicates that almost 31 .77% of all G-role
50
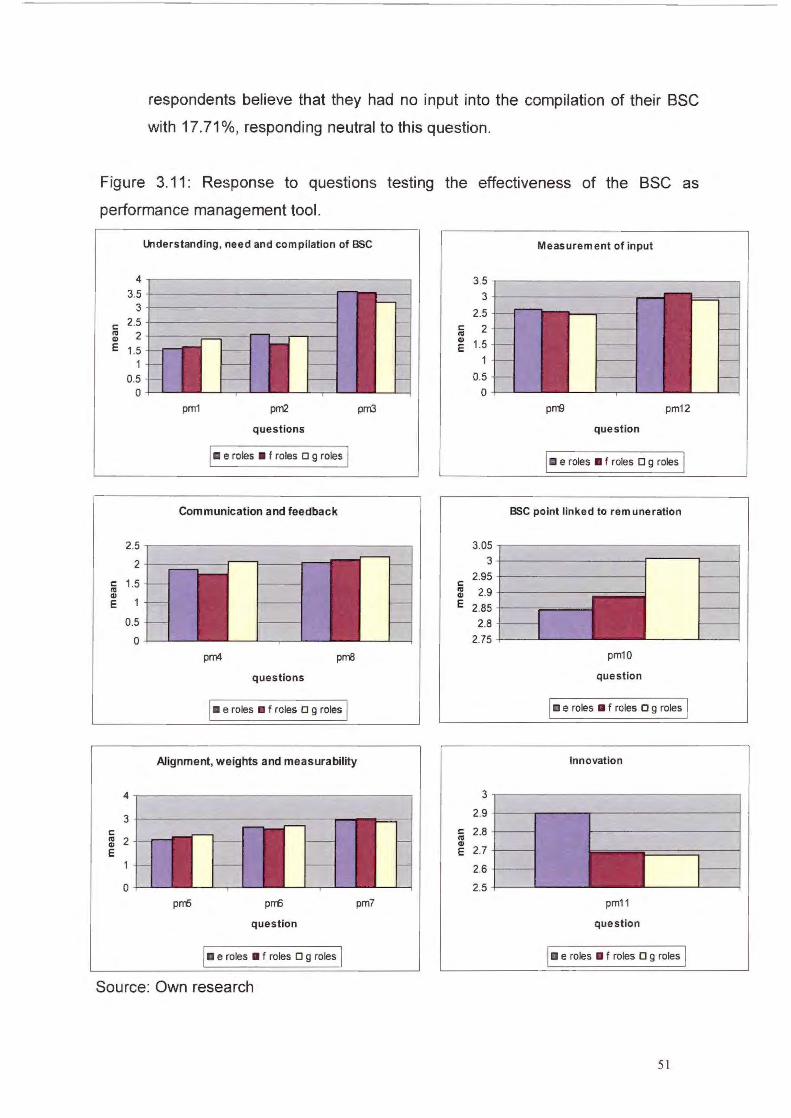
respondents believe that they had no input into the compilation of their BSC
with 17.71 %, responding neutral to this question.
Figure 3.11 : Response to questions testing the effectiveness of the BSC as
performance management tool .
lklders tand in9, need and compilation of BSC
4 r-------------------------------~ 3.5 +-------------------------rl
3 c: 2.5 ~ 21--=-E 1.5
1
0.5 0
pm1 pm2
questions
I C e roles • f roles o 9 roles I
Communication and feedback
pm3
2.5 ..-------------== 1 2
~ 1.5 Cll E
0.5
0 +---'----pm4 pm8
questions
I c e roles • f roles o 9 roles I
Alignment, weights and measurability
4 r---------------------------------~
3 c: ~ 2 E
0
pm5 prr6
question
I c e roles • f roles o 9 roles I Source: Own research
pm7
Meas urem ent of input
3.~ F=====-------2.5
; 2 e 1.5 1
0.5 o I __..____j
prr9 pm12
question
I C e roles • f roles 0 9 roles I
BSC point linked to remuneration
3.05 ...-------------------, 3+---------------r----,~~
2.95 +------------------l
~-pm10
question
I c e roles • f roles o 9 roles I
Innovation
3
2.9 l ~ 2.s I l Cll E 2.7
2.6
2.5 pm11
question
I C e roles • f roles 0 9 roles I
51
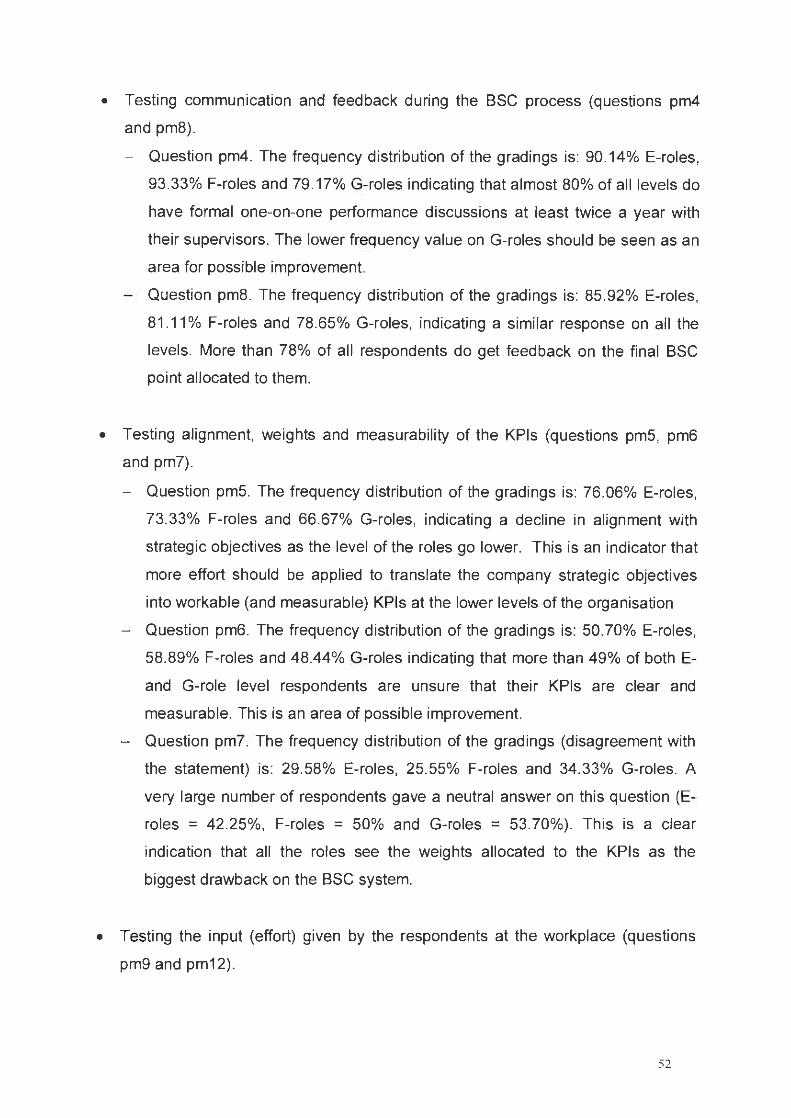
• Testing communication and feedback during the BSC process (questions pm4
and pm8).
- Question pm4. The frequency distribution of the gradings is: 90.1 4% E-roles,
93.33% F-roles and 79.17% G-roles indicating that almost 80% of all levels do
have formal one-on-one performance discussions at least twice a year with
their supervisors. The lower frequency value on G-roles should be seen as an
area for possible improvement.
- Question pm8. The frequency distribution of the gradings is: 85.92% E-roles,
81 .11 % F-roles and 78.65% G-roles, indicating a similar response on all the
levels. More than 78% of all respondents do get feedback on the final BSC
point allocated to them.
• Testing alignment, weights and measurabil ity of the KPis (questions pm5, pm6
and pm7).
- Question pm5. The frequency distribution of the gradings is: 76.06% E-roles,
73.33% F-roles and 66.67% G-roles, indicating a decline in alignment with
strategic objectives as the level of the roles go lower. This is an indicator that
more effort should be applied to translate the company strategic objectives
into workable (and measurable) KPis at the lower levels of the organisation
- Question pm6. The frequency distribution of the gradings is: 50.70% E-roles,
58.89% F-roles and 48.44% G-roles indicating that more than 49% of both E
and G-role level respondents are unsure that their KPis are clear and
measurable. This is an area of possible improvement.
- Question pm7. The frequency distribution of the gradings (disagreement with
the statement) is: 29.58% E-roles, 25.55% F-roles and 34.33% G-roles. A
very large number of respondents gave a neutral answer on th is question (E
roles = 42.25%, F-roles = 50% and G-roles = 53.70%). This is a clear
indication that all the roles see the weights allocated to the KPis as the
biggest drawback on the BSC system.
• Testing the input (effort) given by the respondents at the workplace (questions
pm9 and pm12).
52

- Question pm9. The frequency distribution of the gradings is: 57.75% E-roles,
60% F-roles and 59.90% G-roles, indicating that all the roles believe that the
BSC point is a reflection of how the supervisor perceives the performance of
the respondent. This is a major area of concern.
- Question pm12. The frequency distribution of the gradings is: 39.44% E-roles,
32.22% F-roles and 46.35% G-roles, correlating wel l with the frequency
distributions, as seen in question pm9. This is again an area of concern and
more worrying is the very low frequency from the F-role level (the technical
backbone of the company).
• Testing the degree of comfort the respondents have with linking the BSC
outcome to their remuneration (question pm1 0).
- Question pm1 0. The frequency distribution of the gradings is: 45.07% E-roles,
50% F-roles and 43.75% G-roles, indicating that more than 50% of all the
roles are not comfortable that the BSC point can be linked to their annual
salary adjustment. From the mean values it is evident, that this sense of
unease increases as the grading levels go lower down in the organisation.
• Testing encouragement for innovation (question pm11 ).
- Question pm11. The frequency distribution of the gradings is: 39.44% E-roles,
48.89% F-roles and 55.73% G-roles. This shows that the lower the level in the
organisation goes, the more is the belief that the KPis on the BSC encourage
the respondents to find new and better ways to do their job. This is contrary to
the thinking that the E- and F-role levels people (engineers and technicians)
are more involved in plant optimisation and improvements than are the G-role
level people. Both the frequency distributions and the mean values however
indicate a huge opportunity for improvement.
3.4.3.3.2 Secondary objective 2- personal development tool
The mean values of the responses to the questions are illustrated in figure 3.12
below and the frequency distributions in Annexures H, I and J.
53
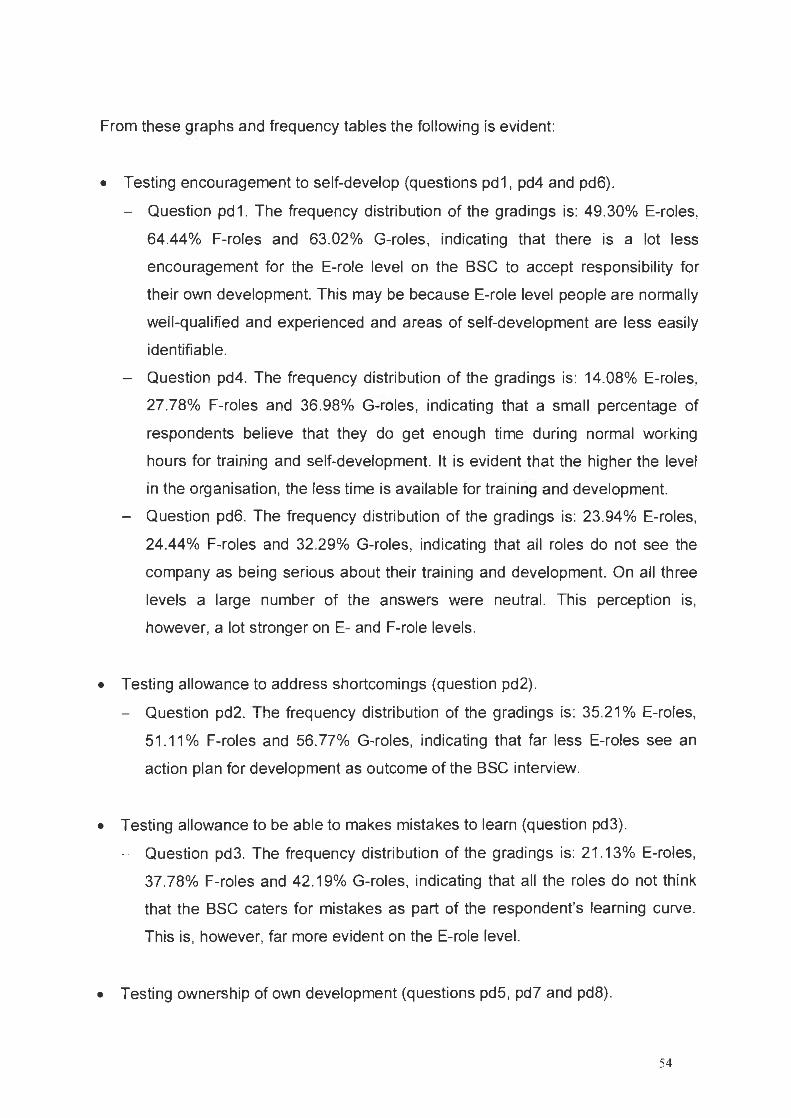
From these graphs and frequency tables the following is evident:
• Testing encouragement to self-develop (questions pd1 , pd4 and pd6).
- Question pd1 . The frequency distribution of the gradings is: 49.30% E-roles,
64.44% F-roles and 63.02% G-roles, indicating that there is a lot less
encouragement for the E-role level on the BSC to accept responsibility for
their own development. This may be because E-role level people are normally
well-qualified and experienced and areas of self-development are less easily
identifiable.
- Question pd4. The frequency distribution of the gradings is: 14.08% E-roles,
27.78% F-roles and 36.98% G-roles, indicating that a small percentage of
respondents believe that they do get enough time during normal working
hours for training and self-development. It is evident that the higher the level
in the organisation, the less time is available for training and development.
- Question pd6. The frequency distribution of the gradings is: 23.94% E-roles,
24.44% F-roles and 32.29% G-roles, indicating that all roles do not see the
company as being serious about their training and development. On all three
levels a large number of the answers were neutral. This perception 1s,
however, a lot stronger on E- and F-role levels.
• Testing allowance to address shortcomings (question pd2).
- Question pd2. The frequency distribution of the gradings is: 35.21 % E-roles,
51 .11 % F-roles and 56.77% G-roles, indicating that far less E-roles see an
action plan for development as outcome of the BSC interview.
• Testing allowance to be able to makes mistakes to learn (question pd3).
- Question pd3. The frequency distribution of the gradings is: 21.13% E-roles,
37.78% F-roles and 42.19% G-roles, indicating that all the roles do not think
that the BSC caters for mistakes as part of the respondent's learning curve.
This is, however, far more evident on the E-role level.
• Testing ownership of own development (questions pd5, pd7 and pd8) .
54
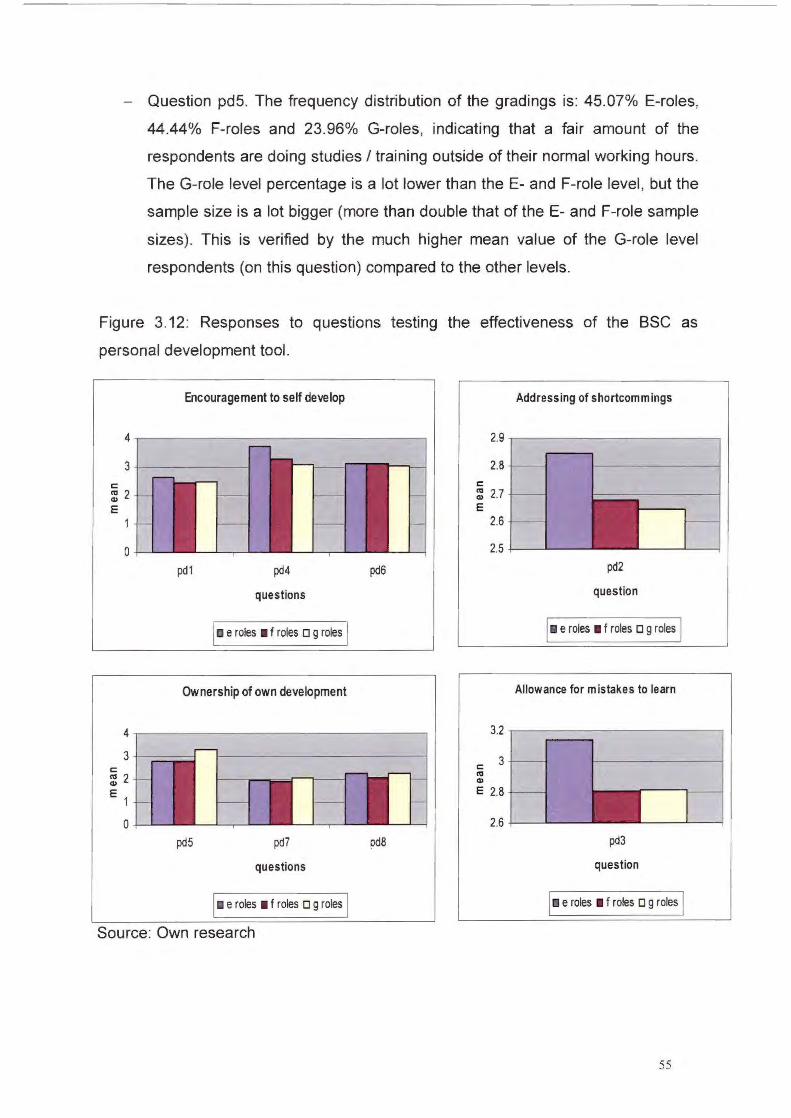
- Question pd5. The frequency distribution of the gradings is: 45.07% E-roles,
44.44% F-roles and 23.96% G-roles, indicating that a fair amount of the
respondents are doing studies I training outside of their normal working hours.
The G-role level percentage is a lot lower than the E- and F-role level , but the
sample size is a lot bigger (more than double that of the E- and F-role sample
sizes). This is verified by the much higher mean value of the G-role level
respondents (on this question) compared to the other levels.
Figure 3.12: Responses to questions testing the effectiveness of the BSC as
personal development tool.
Encouragement to self develop
4 ~----------------------------~
3-t-----c : 2 E
0
pd1 pd4
questions
I c e roles • f roles o g roles I
Ownership of own development
pd6
:I 11 I c : 2 E 1
0
pd5 pd7 pd8
questions
c e roles • f roles o g roles
Source: Own research
Addressing of shortcomm ings
2.9 ,.------------.
2.8~
c : 2.7~ E
2.6 + --I 2.5 +--1....--.....J
pd2
question
I c e roles • f roles o g roles I
Allowance for mistakes to learn
3.2 ,.-------------.
c 3 1-----1
"' c» E 2.81-----1
2.6 +--......__ __
pd3
question
I C e roles • f roles 0 g roles I
55

- Question pd7. The frequency distribution of the gradings is: 83.10% E-roles,
90% F-roles and 83.33% G-roles, indicating that all the role levels take
ownership of their own development.
- Question pd8. The frequency distribution of the gradings is: 71 .83% E-roles,
80% F-roles and 67.71 % G-roles, indicating that all the role levels do take
opportunities to develop. The higher value in the F-role level does correlate
with the fact that these respondents are mainly technical people who often are
exposed to opportunities on the plant to learn and develop.
3.5 ADDITIONAL COMMENTS FROM THE QUESTIONNAIRE
The questionnaire allowed the respondents to add additional comments. These
comments were categorised in positive and negative responses toward the BSC
process.
Positive responses.
• If handled in the right way it will motivate the person, otherwise it will stem to
negative behaviour.
• Learn from others.
• I think my manager must have a one-on-one discussion with me (on my
performance) every month.
• The success of the BSC is strongly related to the involvement of the manager in
the process.
• Exposure to managerial work is crucial to the development of individuals.
• The BSC is a useful tool for upcoming young employees, but not for established
employees.
Negative responses.
• Many adhoc time-consuming tasks , that have to be done, are not on my BSC.
• My supervisor changes the goalposts and makes things vague and unclear.
have numerous fights to prove that I take my self-development serious. I am
completely dissatisfied with how my BSC is managed, and believe that my
56

development is being prevented. I am rushed and forced to sign my BSC that I
am completely dissatisfied with.
• The ratification process appears to be a black box favouring certain people and
penalising others. This makes the whole BSC process not fully reliable.
• The BSC is a waste of time if your BSC score can be overruled behind your back.
• The BSC as a personal development tool focuses mainly on the development of
line people and not across all functions (including staff).
• Management ratification makes the BSC a very subjective process. The 360-
degree tool adds more value to the process and should be re-introduced . Safety
KPis should apply only to people who can contribute towards the target. The
"people" part of the BSC should carry more weight.
• Due to the current economic condition the focus on train ing and development has
somewhat diminished.
• The normalisation of scores is regarded as unfair and has a demoralising effect.
Sometimes it is felt that the BSC only is a paper exercise and that not much is
coming from it.
• The BSC is a joke and don't work.
• The forced ranking of people makes this tool non-effective.
• There are so many people who have the power to change the BSC points, which
makes the BSC system a theoretical exercise in which few people believe.
• The BSC is not in line with down-stream and up-stream KPis.
• I think the way that my year-end rating was determined, is a big circus.
• I had different experiences with regard to the BSC when working for different
supervisors.
• What is the point of having a BSC when management decides to "normalise" the
scores? Due to this too many people are achieving too high scores.
• I would like to see the manager use a pen to write the final value of the BSC, and
not a pencil. He can change the value after you have signed the BSC and left.
• We are wasting our time as top management decides on our increase and rob
Peter to pay Paul.
• BSC points keep on getting downgraded by higher management. This happened
several times in the past.
57

• The BSC system is not effectively applied in ArcelorMittal as in the end, the
results are manipulated to achieve management's own targets.
• What is the point of doing this questionnaire; all the comments will be ignored
anyway.
• There should be strict guidelines as to what scores should be given to
subordinates. Scores should never be adjusted by top management after being
discussed with people.
• The BSC is useless if you start normalising.
• The BSC is generally a rushed paper exercise. There appears to be no real effort
at improving performance, or pushing out non-performers.
• Targets and expectations are unclear.
• My BSC did reflect the effort I put in at my workplace until management changed
it.
• Some of the KPis on my BSC are beyond my control (e.g. machine breakdown
for production personnel).
• Clear goals and targets need to be identified before the BSC compi lation and
interview.
• The superintendent's BSC rating is a disaster - no input from managers.
Announced results are changed without notification.
• Due to the severe staff shortage and additional workload of my supervisor, he
was not available to discuss matters of importance in detail.
• Salary adjustments are definitely not linked to BSC points - everybody cannot be
average.
• According to my manager, the BSC has no effect on my salary adjustment.
• The BSC is an admin exercise- salary adjustments are thumb-sucked .
• It would help if someone does not get penal ised for something over which he I
she has no control.
• The BSC is a paper exercise to ensure that all documents are in place for
auditing purposes.
• No scope or motivation in current post for future development.
58

3.6 CHAPTER SUMMARY
An empirical study was conducted by issuing 724 questionnaires to departments
within ArcelorMittal , Vanderbijlpark Works. Of these issued questionnaires, 49%
(353) were received back, and analysed. The study showed that 88% of the
respondents were male, 62% of the respondents were above the age of 40 years
and that the average age of the respondents was 42.9 years.
The analyses on the primary objective as performance management tool showed
positives responses in respect of the-
• understanding, need and compilation of the BSC; and
• communication and feedback during the BSC process.
The analyses on the primary objective as performance measurement tool showed
negative responses in respect of-
• alignment, weights and measurability of the KPis on the BSC,
• the reflection of the effort of the respondent at the workplace on the BSC,
• the linkage of the BSC outcome to the annual remuneration process; and
• the degree of encouragement of innovation in the BSC process.
The analyses on the primary objective as personal development tool , showed
positives responses in respect of-
• people taking ownership of their own development,
• the number of people doing training or self-development outside of their normal
working hours; and
• people taking every possible opportunity to self-develop.
The analyses on the primary objective as personal development tool showed
negative responses in respect of the -
• amount of time available during normal hours for development;
• view of the respondent about the company being serious about their training I
development; and
59

• allowance of mistakes in the BSC process as part of the individual's learning
curve.
Similar trends were found during the analyses of the 2 secondary objectives. Smaller
variations were found within the different departments and different role gradings
within ArcelorMittal , Vanderbijlpark Works. These findings were discussed in chapter
3 and summarised in chapter 4.
In the next chapter final conclusions were drawn from the findings in chapter 3, and
recommendations were made as to the possible improvement of the effective use of
the BSC process.
60
CHAPTER 4
CONCLUSIONS AND RECOMMENDATIONS
4.11NTRODUCTION
In this chapter the insight gained from the literature study in Chapter 2, the research
done, and results obtained form the empirical study (documented in chapter 3) will
be combined to conclude whether the BSC is effectively implemented (in
ArcelorMittal , Vanderbijlpark Works) as a:
• performance measurement tool, and a
• personal development tool.
Conclusions will be categorised to cover the analyses from the demographics of the
sample group, the primary objective, the two secondary objectives and the
comments received from the questionnaire.
The chapter ends with recommendations, verification that the study's objectives were
met and recommendations for future study.
4.2 CONCLUSIONS
4.2.1 Conclusions on the demographics of the sample group
The sample group included all E-, F- and G-roles within ArcelorMittal , Vanderbijlpark
Works. These roles include the categories of first-line management, technical
support (technicians and engineers) and support functions (HR, SHERQ, Finance,
Quality, Planning, IT, IM, Commercial).
From the analyses in chapter 3, the following can be concluded .
• A large number of this sample group are male (88%).
• The average age of this sample group is high (42.9 years).
• A large percentage of the sample group is already above the age of 50 (38%).
61
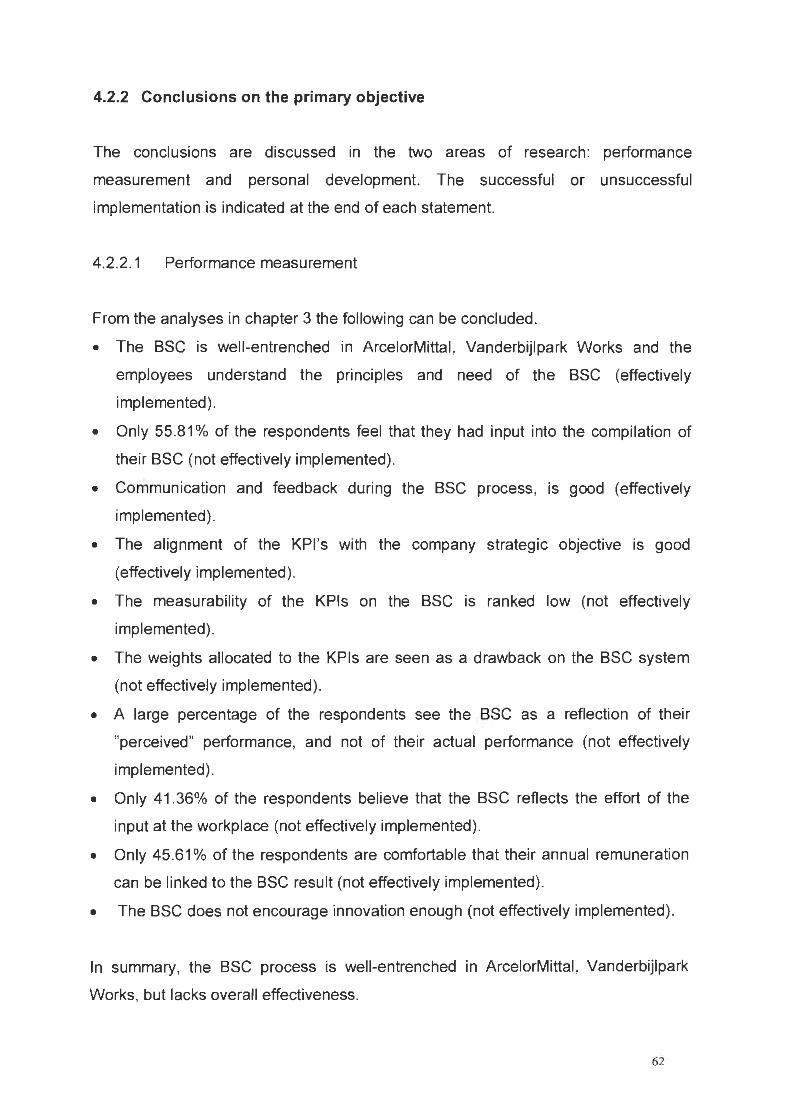
4.2.2 Conclusions on the primary objective
The conclusions are discussed in the two areas of research: performance
measurement and personal development. The successful or unsuccessful
implementation is indicated at the end of each statement.
4.2.2.1 Performance measurement
From the analyses in chapter 3 the following can be concluded.
• The BSC is well-entrenched in ArcelorMittal , Vanderbijlpark Works and the
employees understand the principles and need of the BSC (effectively
implemented).
• Only 55.81 % of the respondents feel that they had input into the compilation of
their BSC (not effectively implemented).
• Communication and feedback during the BSC process, is good (effectively
implemented).
• The al ignment of the KPI 's with the company strategic objective is good
(effectively implemented).
• The measurability of the KPis on the BSC is ranked low (not effectively
implemented).
• The weights allocated to the KPis are seen as a drawback on the BSC system
(not effectively implemented).
• A large percentage of the respondents see the BSC as a reflection of their
"perceived" performance, and not of their actual performance (not effectively
implemented).
• Only 41 .36% of the respondents believe that the BSC reflects the effort of the
input at the workplace (not effectively implemented).
• Only 45.61 % of the respondents are comfortable that their annual remuneration
can be linked to the BSC result (not effectively implemented).
• The BSC does not encourage innovation enough (not effectively implemented).
In summary, the BSC process is well-entrenched in ArcelorMittal, Vanderbijlpark
Works, but lacks overall effectiveness.
62

4.2.2.2 Personal development
• The majority of the respondents agree that the BSC encourages them to self
develop (effectively implemented).
• Not enough time is available during normal working hours for training and self
development (not effectively implemented).
• The respondents do not believe that the company is serious about their
development (not effectively implemented).
• Not enough action plans for the future development of the individual are derived
after the BSC interview (not effectively implemented) .
• The BSC does not allow for mistakes as part of the learning curve of the
individual (not effectively implemented).
• A fair number of people (33.14%) are busy with studies I training outside of their
normal working hours (effectively implemented).
• The respondents do take ownership of their own development (effectively
implemented).
• The respondents do take every possible opportunity to learn I self-develop
(effectively implemented).
The BSC encourages people to self-develop, but development plans are lacking; not
enough time for training is given, and managers must show an intent to develop their
people.
4.2.3 Conclusions on secondary objective 1
The conclusions are discussed in the two areas of research: performance
measurement and personal development.
63

4.2.3.1 Performance measurement
• All the departments demonstrate a good understanding of the principles and
need of the BSC. The Engineering department showed the highest percentage of
understanding.
• More people in the Iron Making department (±1 0% more than the other
departments) indicated, that they had no input into the compilation of their BSC.
• One-on-one discussions in all the departments are at an acceptable level with
Engineering at the highest percentage (90%).
• Formal feedback in the departments varies at levels between 88.57%
(Engineering) and 75% (Iron).
• The alignment of the KPis with the company strategic objectives is below
expectation in the Iron Making Department (62.5%). All the other departments are
between 70% and 75%.
• The measurability of the KPis in all the departments is relatively low with specific
concerns in the Engineering, Iron Making and Staff departments (all frequencies
below49%).
• A large number of respondents in all the departments answered neutrally on the
question of weights allocated to the KPis on the BSC. All departments see this as
a possible drawback of the BSC system.
• Compared to the other departments far more people in the Steel Making and
Rolling departments believe that their BSC point is a reflection of their "perceived"
performance.
• Less than 50% of all departments do not believe that the BSC reflects the effort
they put in at the workplace. This is far more evident in the very low frequency
distributions in the Iron Making and Staff departments (both below 38%).
• The Engineering, Iron Making and Steel Making departments are far more
uncomfortable than the Rolling and Staff departments with the linkage of the BSC
result to their annual remuneration adjustment.
• The Engineering department shows the least encouragement for innovation on
the BSC.
64
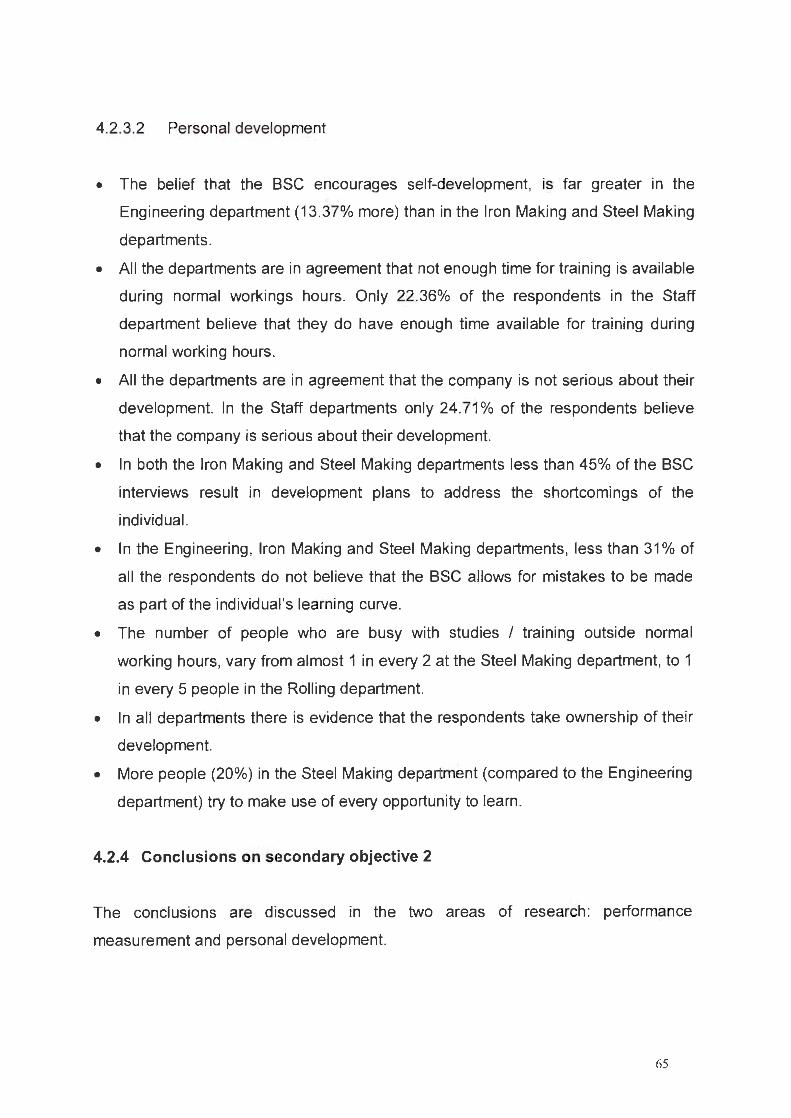
4.2.3.2 Personal development
• The belief that the BSC encourages self-development, is far greater in the
Engineering department (13.37% more) than in the Iron Making and Steel Making
departments.
• All the departments are in agreement that not enough time for training is available
during normal workings hours. Only 22.36% of the respondents in the Staff
department believe that they do have enough time available for training during
normal working hours.
• All the departments are in agreement that the company is not serious about their
development. In the Staff departments only 24.71 % of the respondents believe
that the company is serious about their development.
• In both the Iron Making and Steel Making departments less than 45% of the BSC
interviews result in development plans to address the shortcomings of the
individual.
• In the Engineering , Iron Making and Steel Making departments, less than 31 % of
all the respondents do not believe that the BSC allows for mistakes to be made
as part of the individual 's learning curve.
• The number of people who are busy with studies I training outside normal
working hours, vary from almost 1 in every 2 at the Steel Making department, to 1
in every 5 people in the Rolling department.
• In all departments there is evidence that the respondents take ownership of their
development.
• More people (20%) in the Steel Making department (compared to the Engineering
department) try to make use of every opportunity to learn.
4.2.4 Conclusions on secondary objective 2
The conclusions are discussed in the two areas of research: performance
measurement and personal development.
65
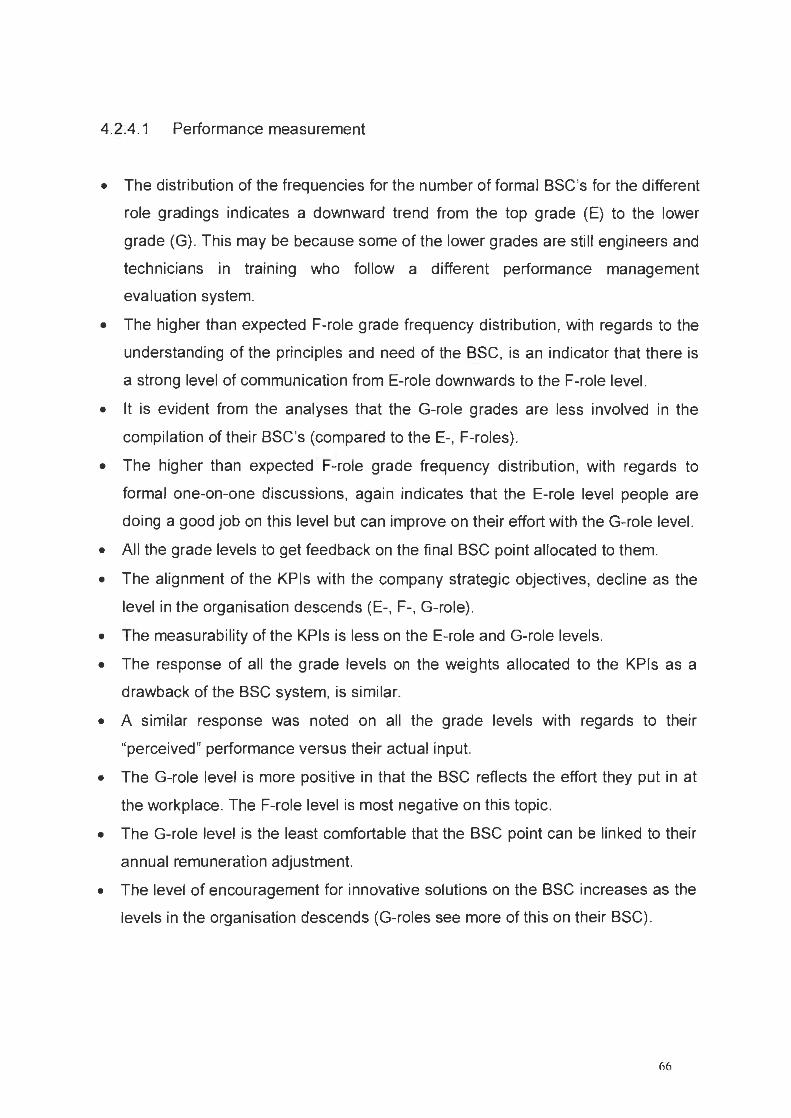
4.2.4.1 Performance measurement
• The distribution of the frequencies for the number of formal BSC's for the different
role gradings indicates a downward trend from the top grade (E) to the lower
grade (G). This may be because some of the lower grades are still engineers and
technicians in training who follow a different performance management
evaluation system.
• The higher than expected F-role grade frequency distribution, with regards to the
understanding of the principles and need of the BSC, is an indicator that there is
a strong level of communication from E-role downwards to the F-role level.
• It is evident from the analyses that the G-role grades are less involved in the
compilation of their BSC's (compared to the E-. F-roles).
• The higher than expected F-role grade frequency distribution, with regards to
formal one-on-one discussions, again indicates that the E-role level people are
doing a good job on this level but can improve on their effort with the G-role level.
• All the grade levels to get feedback on the final BSC point allocated to them.
• The alignment of the KPis with the company strategic objectives, decline as the
level in the organisation descends (E-. F-. G-role).
• The measurability of the KPis is less on the E-role and G-role levels.
• The response of all the grade levels on the weights allocated to the KPis as a
drawback of the BSC system, is similar.
• A similar response was noted on all the grade levels with regards to their
"perceived" performance versus their actual input.
• The G-role level is more positive in that the BSC reflects the effort they put in at
the workplace. The F-role level is most negative on this topic.
• The G-role level is the least comfortable that the BSC point can be linked to their
annual remuneration adjustment.
• The level of encouragement for innovative solutions on the BSC increases as the
levels in the organisation descends (G-roles see more of this on their BSC).
66

4.2.4.2 Personal development
• The encouragement on the BSC, for personal development, is far less on the E
role level.
• The time available for training I self-development during normal working hours,
decreases as the levels in the organisation ascends (the higher levels have less
time).
• The perception that the company is serious about their development increases as
the levels in the organisation descends (less people on the higher E-role levels
think that the company is serious about their development) .
• Far less of the respondents on the E-role level see the outcome of their BSC
interviews resulting in a development plan to address shortcomings.
• The allowance for mistakes to be made as part of the individual 's learning curve
descends as the level in the organisation ascends (least at the higher E-role
level).
• The percentage of respondents doing training outside normal working hours is
less on the G-role levels.
• All the grade levels do take ownership of their own development.
• The respondents on the F-role level take more action on any opportunity to self
develop.
4.3 RECOMMENDATIONS
From the study and the conclusions drawn, the following recommendations are
made.
• Address the issue of mistrust between the employees and their supervisory
management. This mistrust is evident from the general comments as noted in
chapter 3 (paragraph 3.5). This stems from the newly implemented "ratification
(normalisation)" process, which force ranks employees after the BSC process.
Employees do not understand how this process works and how this ties in with
the current BSC process. All the good work done on the BSC process, is
destroyed because of this deemed unfair procedure.
67

• Managers should make allowance for individuals to make mistakes- this is part
of the learning curve. The BSC is evidently more used to punish mistakes made,
rather than to encourage innovation.
• Encourage innovation in the organisation. The encouragement for innovative
solutions in the Engineering department is below par and is seen as a huge
opportunity for improvement. Focus should also be on the E-, and F-role levels in
the organisation.
• More effort should be applied to translate the company strategic objectives into
workable (and measurable) KPis at the lower levels of the organisation. The
alignment of the KPis in the Iron Making department should be checked . The
measurability of the KPis in the Engineering, Iron Making and Staff departments
should be checked . Focus should be onE- and G-role levels.
• ArcelorMittal should make a concerned effort to allow more time for training and
self-development during normal working hours. This, however, should go hand in
hand with managers' developing training plans to address the shortcomings of
their subordinates. Managers should take time to help the employees to manage
their development plans, have regular follow-up discussions to address stumbling
blocks, and provide support and resources. Focus should be put on the
development of action plans in the Iron Making and Steel Making department. An
overall check should be done on the development plan on the E-role level in the
organisation.
• Revisit all KPis for weight allocation. All the departments and all the levels in the
organisation see this as a drawback of the BSC system.
• Test the applicability of the KPis. Ensure that the KPis on the BSC are clear and
that it reflects the effort the company requires form the individual. Specific
attention is needed in the Iron Making and Staff departments. Focus should also
be on the F-role level in the organisation.
• Allow more participation of the individual during the compilation of the BSC (this
will improve buy-in).
• The E-role level communicates very well downwards to the lower levels in the
organisation. Take key learning aspects from this group, and skill the F- and G
role levels to the same extent.
• Allow for more KPis to encourage and measure group performance.
68

4.4 ACHIEVEMENT OF THE STUDY'S OBJECTIVES
The study had one primary objective: to determine the effective use of the BSC as
performance measurement and personal development tool within ArcelorMittal ,
Vanderbijlpark Works. This objective was met when results from the empirical study
(which was linked to the literature study) proved that, although some aspects of the
BSC process are well entrenched , the BSC is not effectively implemented.
Both the secondary objectives were also met when the researched showed that the
effective implementation of the BSC do show variances within the different
departments and different role gradings in ArcelorMittal , Vanderbijlpark Work.
4.5 RECOMMENDATIONS FOR FUTURE RESEARCH
This research was done within one of the four main centres of operation of
ArcelorMittal , South Africa. Future research should be done in the other three
centres (Newcastle, Vereeniging and Saldanha) in order to determine the overall
status of the BSC implementation and to compare results. Possible centres of
excellence may be duplicated in the centres as to improve the effectiveness of the
BSC process in a very short period of time.
Further research could also be done within the ArcelorMittal Group (internationally)
to determine best practises.
At present ArcelorMittal South Africa has implemented changes to the existing BSC
process. Future research should be done in order to determine if these changes did
improve the effectiveness of the BSC when compared to the previous system.
4.6 CHAPTER SUMMARY
This chapter summarised the findings as discussed in chapter 3. From this the
following are evident.
• The BSC process is well-entrenched within ArcelorMittal , Vanderbijlpark Works.
69

• Communication with regards to the BSC process is good.
• Concerns are evident with regard to certain aspects of the BSC (alignment of
KPis, measurability of KPis, weights allocated to KPis, trust in the system to give
a fair reflection of the effort put in at the workplace) .
• People do take ownership of their own development.
• Concerns are evident with regards to time available for training during normal
working hours and management's attitude towards training.
The chapter ends with recommendations for improvement on the current system as
well as suggestions on future research on the same topic.
70
REFERENCES
BLACKBEARD, B. D. 2005. The application of the Balanced Scorecard as a means
of measurement of business activities. Unpublished master's thesis, North West
University.
BOYETT, J. H. & CONN, H. P. 1996. Maximum Performance Management. 2nd ed .
Capstone. 275 p.
COETSEE, L.D. 2003. Peak performance and productivity: A practical guide for the
creation of a motivating climate. 2nd Print. 212 p.
COVEY, S. R. 1999. The 7 Habits of Highly Effective People, Simon & Schuster.
358p.
CUMMINGS, T.G. & WORLEY, C.G. 2005. Organisational Development & Change.
81h ed. Ohio: South-Western USA. 694 p.
KAPLAN , R. S. & NORTON, D. P. 1992. The Balanced Scorecard- Measures That
Drive Performance. Harvard Business Review 70(1):71-70, Jan-Feb.
KAPLAN, R. S. & NORTON, D. P. 1993. Putting the Balanced Scorecard to work.
Harvard Business Review71 (5):134-137, Sep-Oct.
KAPLAN, R. S. & NORTON, D. P. 2001 . The Strategy-Focused Organisation. How
Balanced Scorecard Companies Thrive in the New Business Environment. Boston,
Mass: Harvard Business School Press. 400 p.
KREITNER, R. & KINICKI , A. 2007. Organizational Behavior. McGraw-Hill/Irwin.
N.Y. 614 p.
NIVEN, P. R. 2002. Balanced Scorecard. Step- By- Step: Maximising
Performance and Maintaining Results. John Wiley & Sons, London. 334 p.
71

NIVEN, P. R. 2005. Balanced Scorecard Diagnostics. Maintaining Maximum
Performance. 1st ed, John Wiley & Sons, Inc. London.
RAMPERSAD, H. K. 2006. Personal Balanced Scorecard. Knowres. 252 p.
SCHNEIDERMAN, A M. 1999. Why Balanced Scorecards Fail. Journal of strategic
Management Performance, 1-11 , Jan.
STRUWIG, F.W. & STEAD, G.B. 2004. Planning, designing and reporting research .
3rd ed. Cape Town: Pearson Education, South Africa. 279 p.
The Balanced Scorecard Institute of South Africa
http://www.balancedscorecardsa.co.zalint score.html
[Date of access, 23 May 2009].
Corporate Leadership Council
www.corporateleadershipcouncil .com
[Date of access, 23 May 2009].
72

£L
3~1'VNNOilS3nO
"t/ 3~nX3NN'V

'"' ArcelorMittal
QUESTIONNAIRE TO DETERMINE THE EFFECTIVENESS OF THE BSC AS A PERFORMANCE
MANAGEMENT AND A PERSONAL DEVELOPMENT TOOL, IN ARCELORMITT AL,
VANDERBIJLPARK WORKS
JOB TITLE
DEPARTMENT : ________ __
(Rolling, Steel , Iron, Engineering, Staff)
GENDER
JOB GRADE
AGE
DATE
Thank you for taking a moment to fill in this questionnaire. Your honest and
complete response is valued highly as this will enable us to improve the
effectiveness of our people management policies, strategies and practices.
Please utilise this opportunity to reflect on your experiences and perceptions
with regards to the BSC which was followed during the year ending 2008.
This questionnaire is anonymous and all information gathered from this questionnaire will be
kept confidential. It will be analysed and consolidated with all other responses gathered
during this survey and will be used only for research purposes to be able to make conclusions
and recommendations on the above mentioned topic.
Please indicate your response with an X to each statement below. Where requested, please
add any additional comments in text format. Please hand in the completed questionnaire at
your HR consultant.
BSC = Balanced Scorecard
KPI 's = Key Performance Indicators
74

SA: Strongly Agree A: Agree N: Neutral or D: Disagree SD: Strong ly Disagree
uncertain
Performance Management Tool SA A N D so
1. I do have an approved SSC.
2. My supervisor discussed the principles and need of a SSC with me.
3. I had no input into the compilation of my sse - it was given to me.
4. I do have a formal one-on-one performance discussion with my supervisor at
least twice a year.
5. All the KPis on my sse are aligned with the ArcelorMittal Strategic objectives.
6. All the KPis on my sse are clear and measurable.
7. The weight allocated to the different KPis on my SSC is the biggest drawback
of the system.
8. I do get feedback on the final SSC point allocated to me.
9. My SSC point is a reflection of what my supervisor "thinks" of my performance.
10. I am comfortable that my salary adjustment can be linked to my sse point.
11 . The KPI's on my sse encourages me to find new and better ways to do my
job.
12. My sse reflects the effort I put in at my workplace. I
Personal Development Tool SA A N D so
1. The personal development portion of the SSC encourages me to accept the
responsibility to self-develop.
2. The SSC interview results in an action plan to address shortcomings in my
personal development.
3. My sse caters for mistakes which may be part of my learning curve I
experience.
4. I get enough time for training and self-development during my normal working
hours.
5. I do studies I training outside of my normal working hours.
6. I think the company is serious about my development.
7. I do take ownership of my own development.
8. I use every possible opportunity to self-develop. -
Comments
75

9L
LB-6L
BL
LL
11v -v 1. va 8 3~nX3NNV
BlBO
SO!lS!lBlS 8A!ld!JOS8Q
UO!lnq!JlS!P AOUanbaJ.::J
xapu1
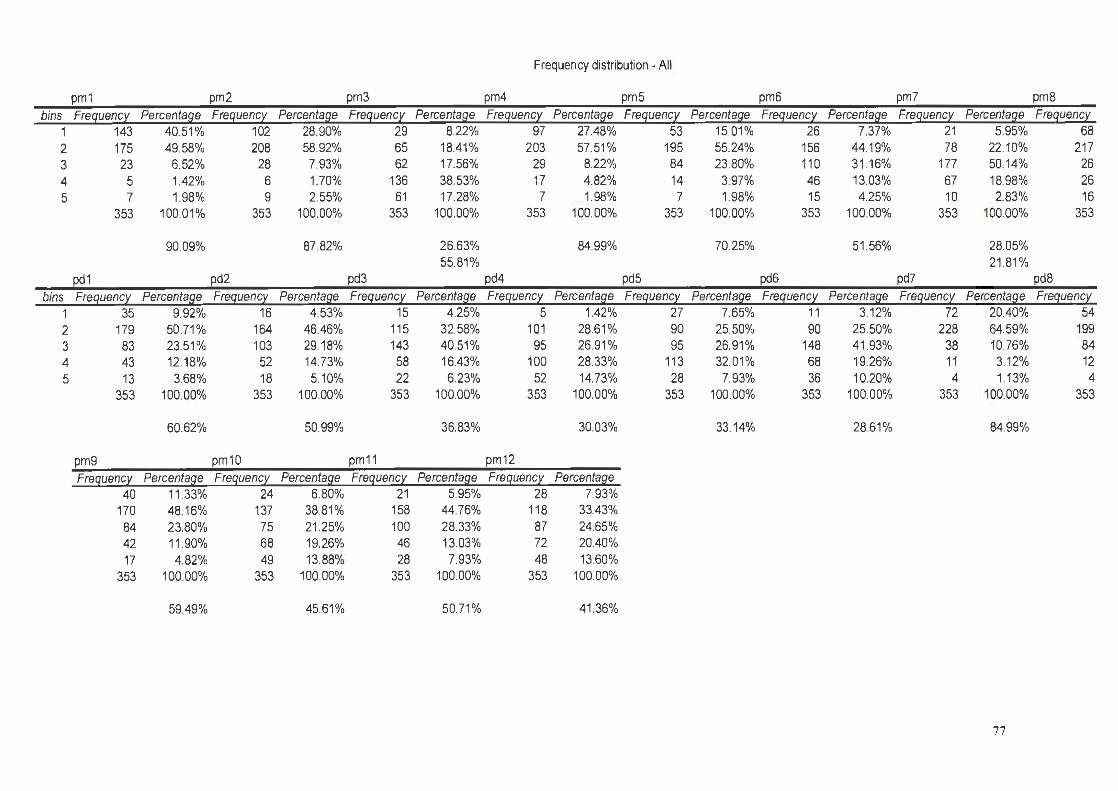
Frequency distribution - All
pm1 pm2 pm3 pm4 pm5 pm6 pm7 pm8
bins Frequency Percentage Frequency Percentage Frequency Percentage Frequency Percentage Frequency Percentage Frequency Percentage Frequency Percentage Frequency 1 143 40.51% 102 28.90% 29 8.22% 97 27.48% 53 15.01% 26 7.37% 21 5.95% 68 2 175 49.58% 208 58.92% 65 18.41% 203 57.51 % 195 55.24% 156 44.19% 78 22.10% 217 3 23 6.52% 28 7.93% 62 17.56% 29 8.22% 84 23.80% 110 31.16% 177 50.14% 26 4 5 1.42% 6 1.70% 136 38.53% 17 4.82% 14 3.97% 46 13.03% 67 18.98% 26 5 7 1.98% 9 2.55% 61 17.28% 7 1.98% 7 1.98% 15 4.25% 10 2.83% 16
353 100.01% 353 100.00% 353 100.00% 353 100.00% 353 100.00% 353 100.00% 353 100.00% 353
90.09% 87.82% 26.63% 84.99% 70.25% 51 .56% 28.05% 55.81% 21.81 %
pd1 pd2 pd3 pd4 pd5 pd6 pd7 pd8
bins Frequency Percentage Frequency Percentage Frequency Percentage Frequency Percentage Frequency Percentage Frequency Percentage Frequency Percentage Frequency 1 35 9.92% 16 4.53% 15 4.25% 5 1.42% 27 7.65% 11 3.12% 72 20.40% 54 2 179 50.71 % 164 46.46% 115 32.58% 101 28.61% 90 25.50% 90 25.50% 228 64.59% 199 3 83 23.51 % 103 29.18% 143 40.51% 95 26.91% 95 26.91% 148 41.93% 38 10.76% 84 4 43 12.18% 52 14.73% 58 16.43% 100 28.33% 113 32.01% 68 19.26% 11 3.12% 12 5 13 3.68% 18 5.10% 22 6.23% 52 14.73% 28 7.93% 36 10.20% 4 1.13% 4
353 100.00% 353 100.00% 353 100.00% 353 100.00% 353 100.00% 353 100.00% 353 100.00% 353
60.62% 50.99% 36.83% 30.03% 33.14% 28.61% 84.99%
pm9 pm10 pm11 pm12
Frequency Percentage Frequency Percentage Frequency Percentage Frequency Percentage 40 11.33% 24 6.80% 21 5.95% 28 7.93%
170 48.16% 137 38.81% 158 44.76% 118 33.43% 84 23.80% 75 21.25% 100 28.33% 87 24.65% 42 11 .90% 68 19.26% 46 13.03% 72 20.40% 17 4.82% 49 13.88% 28 7.93% 48 13.60%
353 100.00% 353 100.00% 353 100.00% 353 100.00%
59.49% 45.61% 50.71 % 41 .36%
77
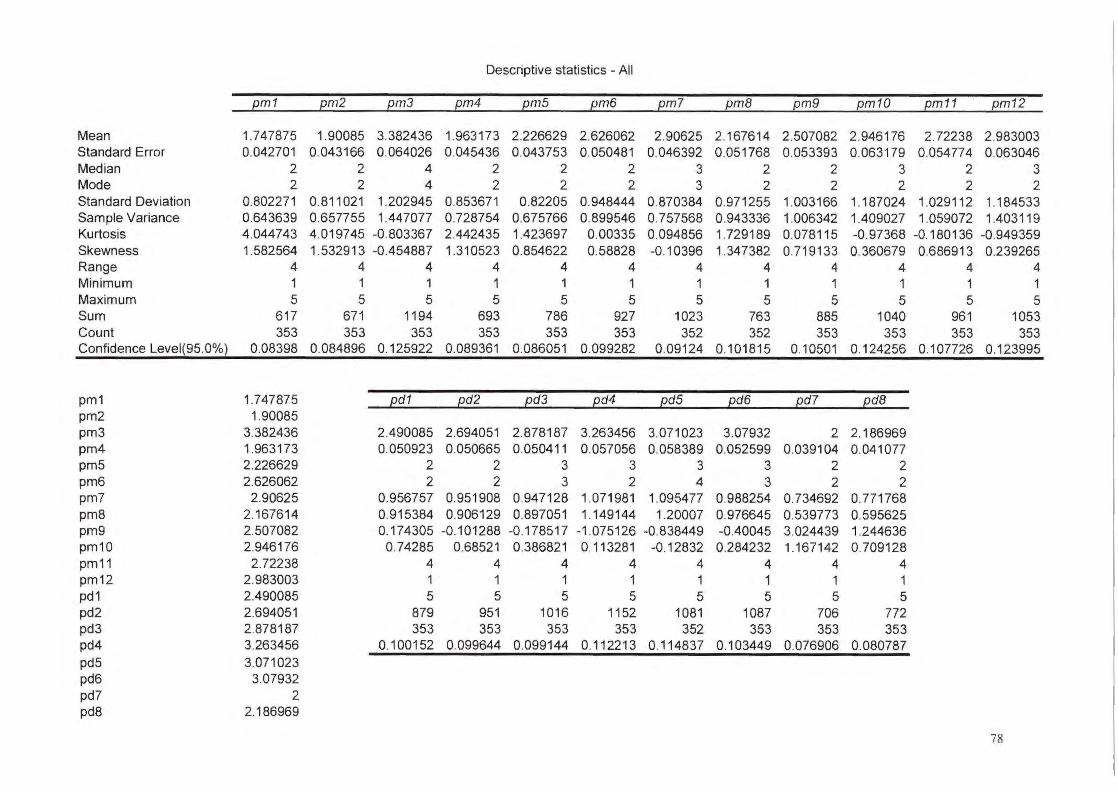
Descriptive statistics- All
pm1 pm2 pm3 pm4 pm5 pm6 pm7 pmB pm9 pm10 pm11 pm12
Mean 1.747875 1.90085 3.382436 1.963173 2.226629 2.626062 2.90625 2.167614 2.507082 2.946176 2.72238 2.983003 Standard Error 0.042701 0.043166 0.064026 0.045436 0.043753 0.050481 0.046392 0.051768 0.053393 0.063179 0.054774 0.063046 Median 2 2 4 2 2 2 3 2 2 3 2 3 Mode 2 2 4 2 2 2 3 2 2 2 2 2 Standard Deviation 0.802271 0.811021 1.202945 0.853671 0.82205 0.948444 0.870384 0.971255 1.003166 1.187024 1.029112 1.184533 Sample Variance 0.643639 0.657755 1.447077 0.728754 0.675766 0.899546 0.757568 0.943336 1.006342 1.409027 1.059072 1.403119 Kurtosis 4.044743 4.019745 -0.803367 2.442435 1.423697 0.00335 0.094856 1.729189 0.078115 -0.97368 -0.180136 -0.949359 Skewness 1.582564 1.532913 -0.454887 1.310523 0.854622 0.58828 -0.10396 1.347382 0.719133 0.360679 0.686913 0.239265 Range 4 4 4 4 4 4 4 4 4 4 4 4 Minimum 1 1 1 1 1 1 1 1 1 1 1 1 Maximum 5 5 5 5 5 5 5 5 5 5 5 5 Sum 617 671 1194 693 786 927 1023 763 885 1040 961 1053 Count 353 353 353 353 353 353 352 352 353 353 353 353 Confidence Level(95.0%) 0.08398 0.084896 0.125922 0.089361 0.086051 0.099282 0.09124 0.101815 0.10501 0.124256 0.107726 0.123995
pm1 1.747875 pd1 pd2 pd3 pd4 pd5 pd6 pd7 pd8 pm2 1.90085 pm3 3.382436 2.490085 2.694051 2.878187 3.263456 3.071023 3.07932 2 2.186969 pm4 1.963173 0.050923 0.050665 0.050411 0.057056 0.058389 0.052599 0.039104 0.041077 pm5 2.226629 2 2 3 3 3 3 2 2 pm6 2.626062 2 2 3 2 4 3 2 2 pm7 2.90625 0.956757 0.951908 0.947128 1.071981 1.095477 0.988254 0.734692 0.771768 pm8 2.167614 0.915384 0.906129 0.897051 1.149144 1.20007 0.976645 0.539773 0.595625 pm9 2.507082 0.174305 -0.101288 -0.17851 7 -1.075126 -0.838449 -0.40045 3.024439 1.244636 pm10 2.946176 0. 74285 0.68521 0.386821 0.113281 -0.12832 0.284232 1.167142 0.709128 pm11 2.72238 4 4 4 4 4 4 4 4 pm12 2.983003 1 1 1 1 1 1 1 1 pd1 2.490085 5 5 5 5 5 5 5 5 pd2 2.694051 879 951 1016 1152 1081 1087 706 772 pd3 2.878187 353 353 353 353 352 353 353 353 pd4 3.263456 0.100152 0.099644 0.099144 0.112213 0.114837 0.103449 0.076906 0.080787 pd5 3.071023 pd6 3.07932 pd7 2 pd8 2.186969
78
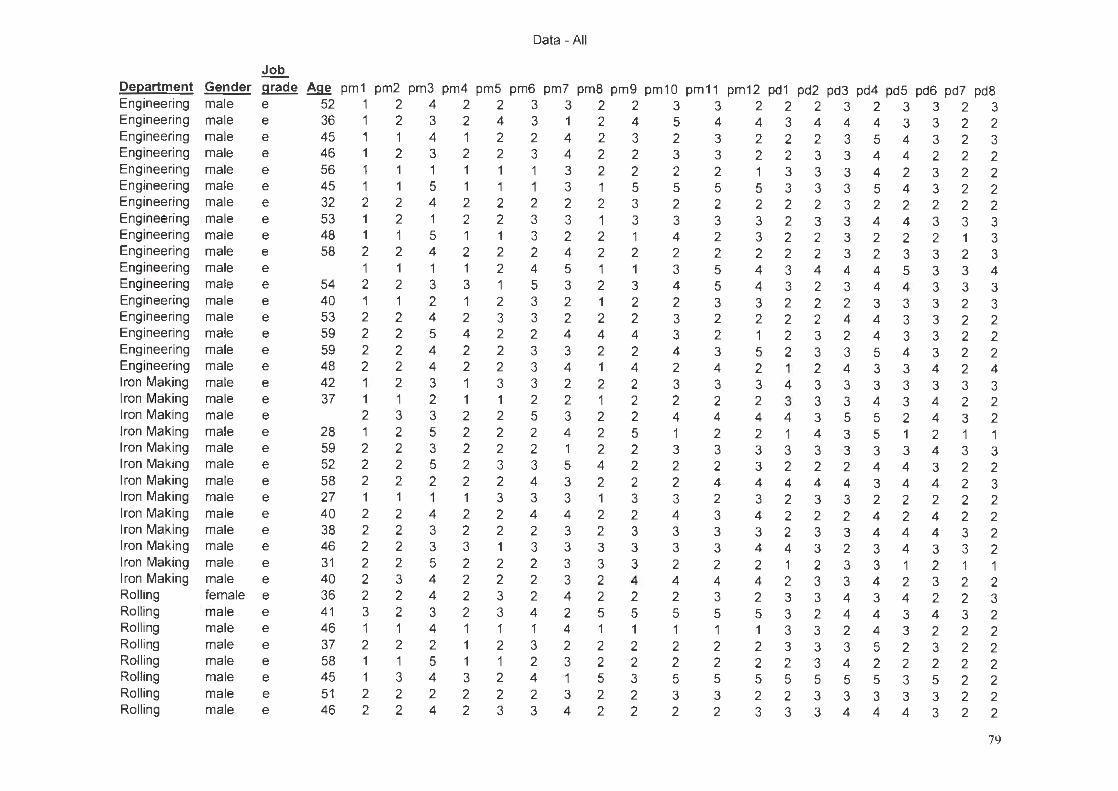
Data- All
Job
Department Gender grade Age pm1 pm2 pm3 pm4 pm5 pm6 pm7 pm8 pm9 pm10 pm11 pm12 pd1 pd2 pd3 pd4 pd5 pd6 pd7 pd8 Engineering male e 52 1 2 4 2 2 3 3 2 2 3 3 2 2 2 3 2 3 3 2 3 Engineering male e 36 1 2 3 2 4 3 1 2 4 5 4 4 3 4 4 4 3 3 2 2 Engineering male e 45 1 1 4 1 2 2 4 2 3 2 3 2 2 2 3 5 4 3 2 3 Engineering male e 46 1 2 3 2 2 3 4 2 2 3 3 2 2 3 3 4 4 2 2 2 Engineering male e 56 1 1 1 1 1 1 3 2 2 2 2 1 3 3 3 4 2 3 2 2 Engineering male e 45 1 1 5 1 1 1 3 1 5 5 5 5 3 3 3 5 4 3 2 2 Engineering male e 32 2 2 4 2 2 2 2 2 3 2 2 2 2 2 3 2 2 2 2 2 Engineering male e 53 1 2 1 2 2 3 3 1 3 3 3 3 2 3 3 4 4 3 3 3 Engineering male e 48 1 1 5 1 1 3 2 2 1 4 2 3 2 2 3 2 2 2 1 3 Engineering male e 58 2 2 4 2 2 2 4 2 2 2 2 2 2 2 3 2 3 3 2 3 Engineering male e 1 1 1 1 2 4 5 1 1 3 5 4 3 4 4 4 5 3 3 4 Engineering male e 54 2 2 3 3 1 5 3 2 3 4 5 4 3 2 3 4 4 3 3 3 Engineering male e 40 1 1 2 1 2 3 2 1 2 2 3 3 2 2 2 3 3 3 2 3 Engineering male e 53 2 2 4 2 3 3 2 2 2 3 2 2 2 2 4 4 3 3 2 2 Engineering male e 59 2 2 5 4 2 2 4 4 4 3 2 1 2 3 2 4 3 3 2 2 Engineering male e 59 2 2 4 2 2 3 3 2 2 4 3 5 2 3 3 5 4 3 2 2 Engineering male e 48 2 2 4 2 2 3 4 1 4 2 4 2 1 2 4 3 3 4 2 4 Iron Making male e 42 1 2 3 1 3 3 2 2 2 3 3 3 4 3 3 3 3 3 3 3 Iron Making male e 37 1 1 2 1 1 2 2 1 2 2 2 2 3 3 3 4 3 4 2 2 Iron Making male e 2 3 3 2 2 5 3 2 2 4 4 4 4 3 5 5 2 4 3 2 Iron Making male e 28 1 2 5 2 2 2 4 2 5 1 2 2 1 4 3 5 1 2 1 1 Iron Making male e 59 2 2 3 2 2 2 1 2 2 3 3 3 3 3 3 3 3 4 3 3 Iron Making male e 52 2 2 5 2 3 3 5 4 2 2 2 3 2 2 2 4 4 3 2 2 Iron Making male e 58 2 2 2 2 2 4 3 2 2 2 4 4 4 4 4 3 4 4 2 3 Iron Making male e 27 1 1 1 1 3 3 3 1 3 3 2 3 2 3 3 2 2 2 2 2 Iron Making male e 40 2 2 4 2 2 4 4 2 2 4 3 4 2 2 2 4 2 4 2 2 Iron Making male e 38 2 2 3 2 2 2 3 2 3 3 3 3 2 3 3 4 4 4 3 2 Iron Making male e 46 2 2 3 3 1 3 3 3 3 3 3 4 4 3 2 3 4 3 3 2 Iron Making male e 31 2 2 5 2 2 2 3 3 3 2 2 2 1 2 3 3 1 2 1 1 Iron Making male e 40 2 3 4 2 2 2 3 2 4 4 4 4 2 3 3 4 2 3 2 2 Rolling female e 36 2 2 4 2 3 2 4 2 2 2 3 2 3 3 4 3 4 2 2 3 Rolling male e 41 3 2 3 2 3 4 2 5 5 5 5 5 3 2 4 4 3 4 3 2 Rolling male e 46 1 1 4 1 1 1 4 1 1 1 1 1 3 3 2 4 3 2 2 2 Rolling male e 37 2 2 2 1 2 3 2 2 2 2 2 2 3 3 3 5 2 3 2 2 Rolling male e 58 1 1 5 1 1 2 3 2 2 2 2 2 2 3 4 2 2 2 2 2 Rolling male e 45 1 3 4 3 2 4 1 5 3 5 5 5 5 5 5 5 3 5 2 2 Rolling male e 51 2 2 2 2 2 2 3 2 2 3 3 2 2 3 3 3 3 3 2 2 Rolling male e 46 2 2 4 2 3 3 4 2 2 2 2 3 3 3 4 4 4 3 2 2
79
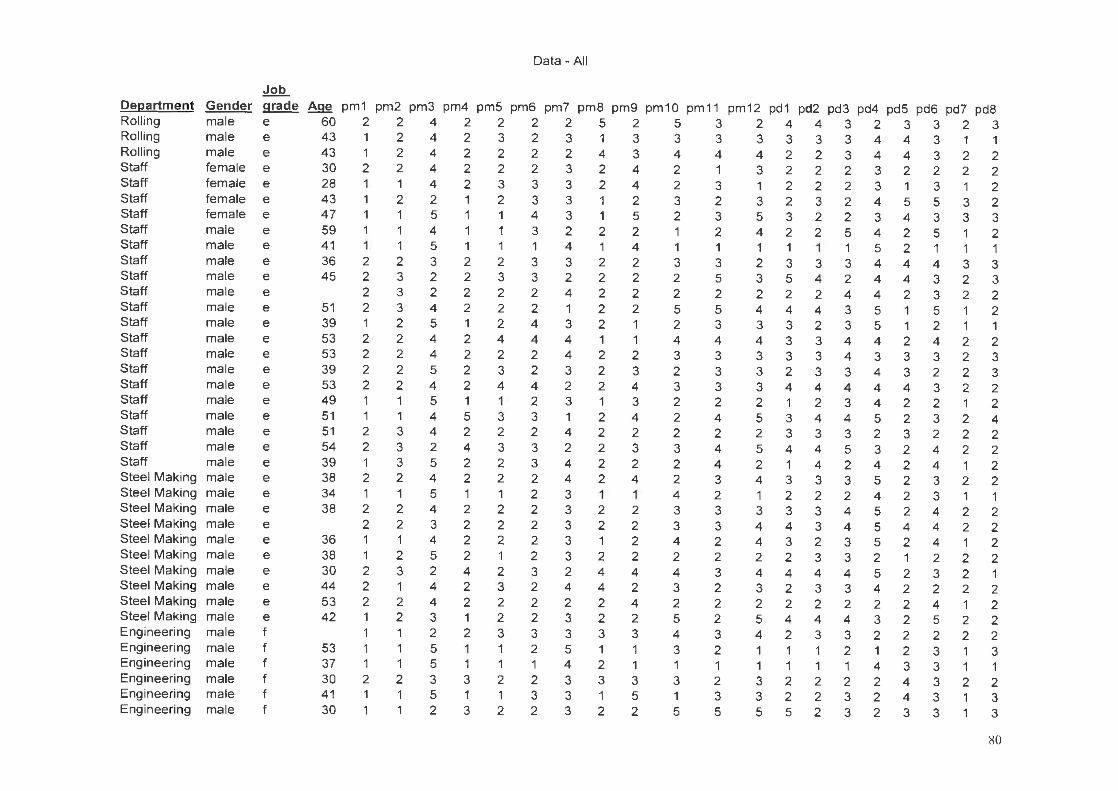
Department Rolling Rolling Rolling Staff Staff Staff Staff Staff Staff Staff Staff Staff Staff Staff Staff Staff Staff Staff Staff Staff Staff Staff Staff Steel Making Steel Making Steel Making Steel Making Steel Making Steel Making Steel Making Steel Making Steel Making Steel Making Engineering Engineering Engineering Engineering Engineering Engineering
Job Gender grade male e male e male e female e female e female e female e male e male e male e male e male e male e male e male e male e male e male e male e male e male e male e male e male e male e male e male e male e male e male e male e male e male e male f male f male f male f male f male f
Data- All
Age pm1 pm2 pm3 pm4 pm5 pm6 pm7 pm8 pm9 pm10 pm11 pm12 pd1 pd2 pd3 pd4 pd5 pd6 pd7 pd8 60 2 2 4 2 2 2 2 5 2 5 3 2 4 4 3 2 3 3 2 3 43 1 2 4 2 3 2 3 1 3 3 3 3 3 3 3 4 4 3 1 1 43 1 2 4 2 2 2 2 4 3 4 4 4 2 2 3 4 4 3 2 2 30 2 2 4 2 2 2 3 2 4 2 1 3 2 2 2 3 2 2 2 2 28 1 1 4 2 3 3 3 2 4 2 3 1 2 2 2 3 1 3 1 2 43 1 2 2 1 2 3 3 1 2 3 2 3 2 3 2 4 5 5 3 2 47 1 1 5 1 1 4 3 1 5 2 3 5 3 2 2 3 4 3 3 3 59 1 1 4 1 1 3 2 2 2 1 2 4 2 2 5 4 2 5 1 2 41 1 1 5 1 1 1 4 1 4 1 1 1 1 1 1 5 2 1 1 1 36 2 2 3 2 2 3 3 2 2 3 3 2 3 3 3 4 4 4 3 3 45 2 3 2 2 3 3 2 2 2 2 5 3 5 4 2 4 4 3 2 3
2 3 2 2 2 2 4 2 2 2 2 2 2 2 4 4 2 3 2 2 51 2 3 4 2 2 2 1 2 2 5 5 4 4 4 3 5 1 5 1 2 39 1 2 5 1 2 4 3 2 1 2 3 3 3 2 3 5 1 2 1 1 53 2 2 4 2 4 4 4 1 1 4 4 4 3 3 4 4 2 4 2 2 53 2 2 4 2 2 2 4 2 2 3 3 3 3 3 4 3 3 3 2 3 39 2 2 5 2 3 2 3 2 3 2 3 3 2 3 3 4 3 2 2 3 53 2 2 4 2 4 4 2 2 4 3 3 3 4 4 4 4 4 3 2 2 49 1 1 5 1 1 2 3 1 3 2 2 2 1 2 3 4 2 2 1 2 51 1 1 4 5 3 3 1 2 4 2 4 5 3 4 4 5 2 3 2 4 51 2 3 4 2 2 2 4 2 2 2 2 2 3 3 3 2 3 2 2 2 54 2 3 2 4 3 3 2 2 3 3 4 5 4 4 5 3 2 4 2 2 39 1 3 5 2 2 3 4 2 2 2 4 2 1 4 2 4 2 4 1 2 38 2 2 4 2 2 2 4 2 4 2 3 4 3 3 3 5 2 3 2 2 34 1 1 5 1 1 2 3 1 1 4 2 1 2 2 2 4 2 3 1 1 38 2 2 4 2 2 2 3 2 2 3 3 3 3 3 4 5 2 4 2 2
2 2 3 2 2 2 3 2 2 3 3 4 4 3 4 54 4 2 2 36 1 1 4 2 2 2 3 1 2 4 2 4 3 2 3 5 2 4 1 2 38 1 2 5 2 1 2 3 2 2 2 2 2 2 3 3 2 1 2 2 2 30 2 3 2 4 2 3 2 4 4 4 3 4 4 4 4 5 2 3 2 1 44 2 1 4 2 3 2 4 4 2 3 2 3 2 3 3 4 2 2 2 2 53 2 2 4 2 2 2 2 2 4 2 2 2 2 2 2 2 2 4 1 2 42 1 2 3 1 2 2 3 2 2 5 2 5 4 4 4 3 2 5 2 2
112 2 3 3 3 3 3 4 3 4 2 3 3 2 2 2 2 2 53 1 1 5 1 1 2 5 1 1 3 2 1 1 1 2 1 2 3 1 3 37 1 1 5 1 1 1 4 2 1 1 1 1 1 1 1 4 3 3 1 1 30 2 2 3 3 2 2 3 3 3 3 2 3 2 2 2 2 4 3 2 2 41 1 1 5 1 1 3 3 1 5 1 3 3 2 2 3 2 4 3 1 3 30 1 1 2 3 2 2 3 2 2 5 5 5 5 2 3 2 3 3 1 3
80
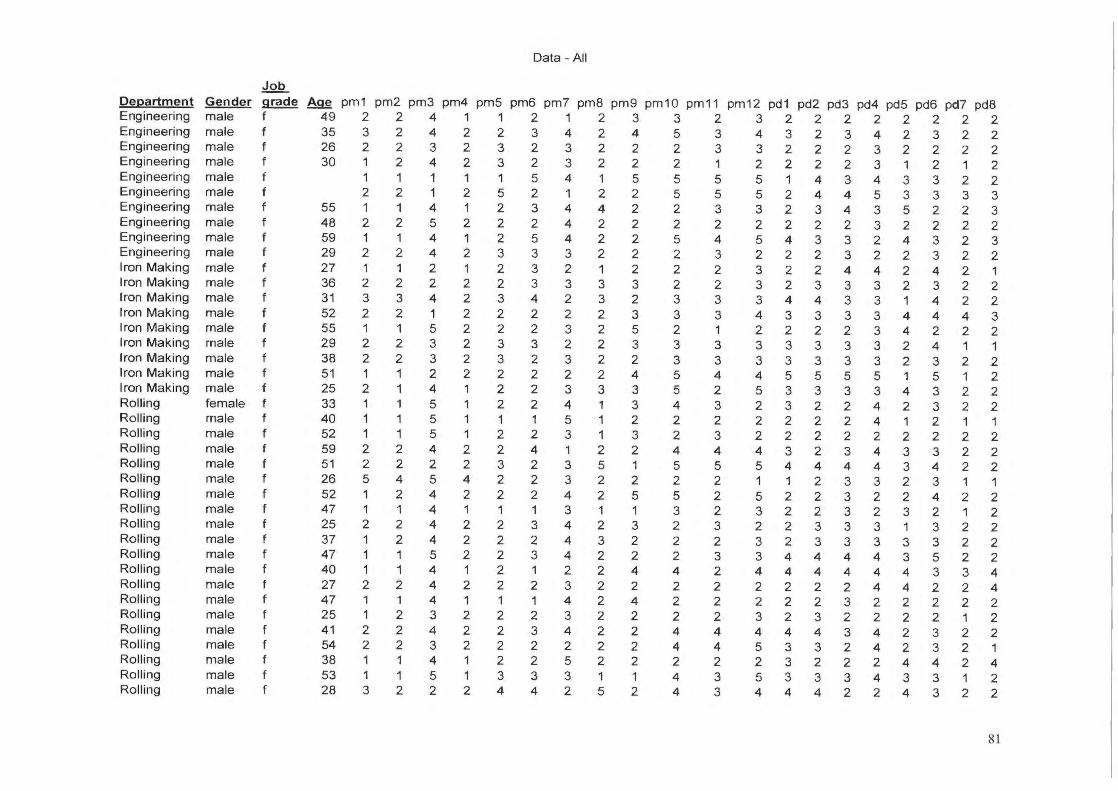
Department Engineering Engineering Engineering Engineering Engineering Engineering Engineering Engineering Engineering Engineering Iron Making Iron Making Iron Making Iron Making Iron Making Iron Making Iron Making Iron Making Iron Making Rolling Rolling Rolling Rolling Rolling Rolling Rolling Rolling Rolling Rolling Rolling Roll ing Rolling Roll ing Roll ing Rolling Rolling Rolling Rolling Rolling
Gender male male male male male male male male male male male male male male male male male male male female male male male male male male male male male male male male male male male male male male male
Job grade f f f f f f f f f f f f f f f f f f f f f f f f f f f f f f f f f f f f f f f
Data - All
Age pm1 pm2 pm3 pm4 pm5 pm6 pm7 pm8 pm9 pm10 pm11 pm12 pd1 pd2 pd3 pd4 pd5 pd6 pd7 pd8 49 35 26 30
55 48 59 29 27 36 31 52 55 29 38 51 25 33 40 52 59 51 26 52 47 25 37 47 40 27 47 25 41 54 38 53 28
2 3 2 1 1 2 1 2 1 2 1 2 3 2 1 2 2 1 2 1 1 1 2 2 5
1 2 1
1 2 1 1 2 2 1 1 3
2 2 2 2 1 2 1 2 1 2 1 2 3 2 1 2 2
1 1 1 1 2 2 4 2 1 2 2 1 1 2 1 2 2 2 1 1 2
4 4 3 4 1 1 4 5 4 4 2 2 4 1 5 3 3 2 4 5 5 5 4 2 5 4 4 4 4 5 4 4 4 3 4 3 4 5 2
1 2 2 2 1 2 1 2 1 2 1 2 2 2 2 2 2 2 1 1 1 1 2 2 4 2 1 2 2 2 1 2 1 2 2 2 1 1 2
1 2 3 3 1 5 2 2 2 3 2 2 3 2 2 3 3 2 2 2 1 2 2 3 2 2 1 2 2 2 2 2 1 2 2 2 2 3 4
2 3 2 2 5 2 3 2 5 3 3 3 4 2 2 3 2 2 2 2 1 2 4 2 2 2 1 3 2 3 1 2 1 2 3 2 2 3 4
4 3 3 4
4 4 4 3 2 3 2 2 3 2 3 2 3 4 5 3 1 3 3 4 3 4 4 4 2 3 4 3 4 2 5 3 2
2 2 2 2 1 2 4 2 2 2 1 3 3 2 2 2 2 2 3
1 2 5 2 2 1 2 3 2 2 2 2 2 2 2 2 1 5
3 4 2 2 5 2 2 2 2 2 2 3 2 3 5 3 2 4 3 3 2 3 2 1 2 5 1 3 2 2 4 2 4 2 2 2 2 1 2
3 5 2 2 5 5 2 2 5 2 2 2 3 3 2 3 3 5 5 4 2 2 4 5 2 5 3 2 2 2 4 2 2 2 4 4 2 4 4
2 3 3
5 5 3 2 4 3 2 2 3 3 1 3 3 4 2 3 2 3 4 5 2 2 2 3 2 3 2 2 2 2 4 4 2 3 3
3 4 3 2 5 5 3 2 5 2 3 3 3 4 2 3 3 4 5 2 2 2 4 5 1 5 3 2 3 3 4 2 2 3 4 5 2 5 4
2 2 2 3 2 3 2 2 2 2 2 2
4 3 2 4 4 2 3 4 2 2 2 4 3 3 2 2 3 2 2 4 2 3 3 4 4 3 3 3 3 2 2 2 3 3 3 3 3 3 5 5 5 3 3 3 3 2 2 2 2 2 2 2 2 3 2 3 4 4 4 1 2 3 2 2 3 2 2 3 2 3 3 2 3 3 4 4 4 4 4 4 2 2 2 2 2 3 2 3 2 4 4 3 3 3 2 3 2 2 3 3 3 4 4 2
2 2 4 2 3 2 3 1 4 3 5 3 3 5 3 2 2 4 2 2 4 2 3 2 3 1 3 4 3 4 3 2 3 2 5 1 3 4 4 2 4 1 2 2 4 3 4 3 3 2 2 2 2 3 3 1 3 3 4 3 4 4 4 4 2 2 2 2 4 2 4 2 2 4 4 3 2 4
2 3 2 2 3 3 2 2 3 3 4 3 4 4 2 4 3 5 3 3 2 2 3 4 3 4 2 3 3 5 3 2 2 2 3 3 4 3 3
2 2 2 2 2 2 1 2 2 2 3 3 2 3 2 2 2 3 2 2 2 1 2 2 2 2 4 3 2 2 1 1 2 2 1 2 2 2 2 2 1 1 2 2 2 2 2 2 1 1 2 2 1 2 2 2 2 2 2 2 3 4 2 4 2 2 1 2 2 2 2 1 2 4 1 2 2 2
81
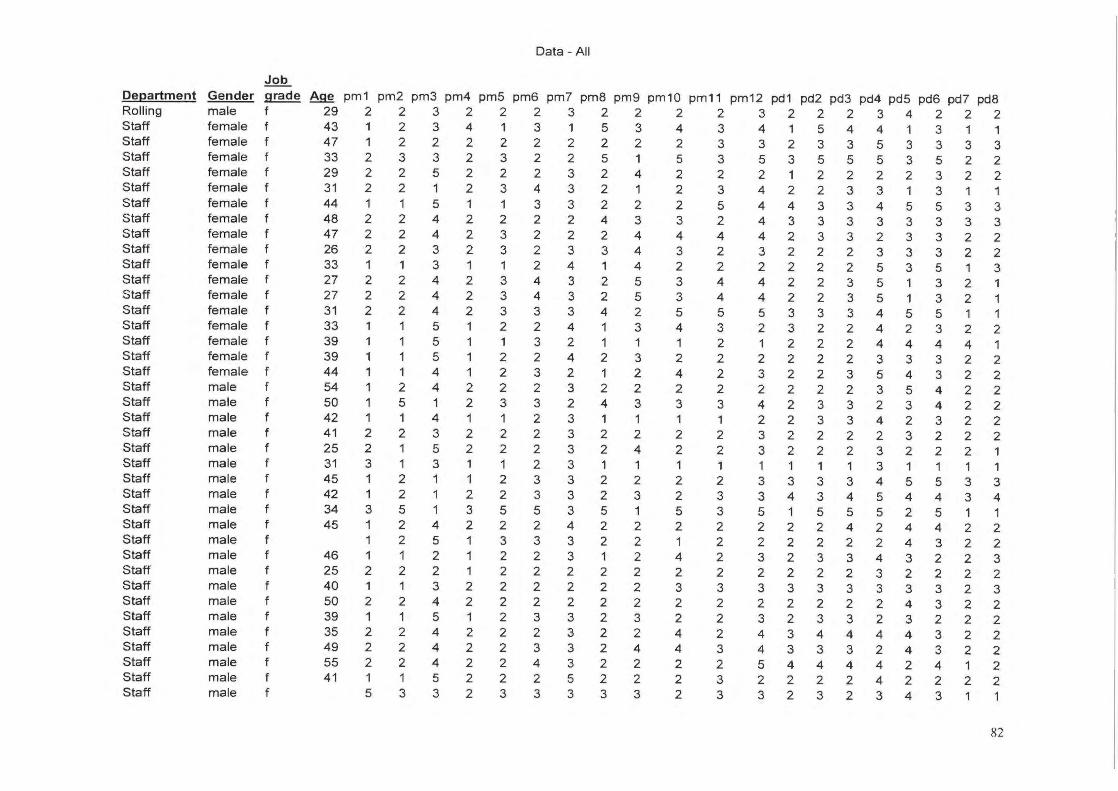
Department Gender Rolling male Staff female Staff female Staff female Staff female Staff female Staff female Staff female Staff female Staff female Staff female Staff female Staff female Staff female Staff female Staff female Staff female Staff female Staff male Staff male Staff male Staff male Staff male Staff male Staff male Staff male Staff male Staff mate Staff mate Staff mate Staff mate Staff mate Staff mate Staff mate Staff mate Staff mate Staff mate Staff mate Staff mate
Job grade f f f f f f f f f f f f f f f f f f f f f f f f f f f f f f f f f f f f f f f
Data- All
Age pm1 pm2 pm3 pm4 pm5 pm6 pm7 pm8 pm9 pm10 pm11 pm12 pd1 pd2 pd3 pd4 pd5 pd6 pd7 pd8 29 2 2 3 2 2 2 3 2 2 2 2 3 2 2 2 3 4 2 2 2 43 1 2 3 4 1 3 1 5 3 4 3 4 1 5 4 4 1 3 1 1 47 1 2 2 2 2 2 2 2 2 2 3 3 2 3 3 5 3 3 3 3 33 2 3 3 2 3 2 2 5 1 5 3 5 3 5 5 5 3 5 2 2 29 2 2 5 2 2 2 3 2 4 2 2 2 1 2 2 2 2 3 2 2 31 2 2 1 2 3 4 3 2 1 2 3 4 2 2 3 3 1 3 1 1 44 1 1 5 1 1 3 3 2 2 2 5 4 4 3 3 4 5 5 3 3 48 2 2 4 2 2 2 2 4 3 3 2 4 3 3 3 3 3 3 3 3 47 2 2 4 2 3 2 2 2 4 4 4 4 2 3 3 2 3 3 2 2 26 2 2 3 2 3 2 3 3 4 3 2 3 2 2 2 3 3 3 2 2 33 1 1 3 1 1 2 4 1 4 2 2 2 2 2 2 5 3 5 1 3 27 2 2 4 2 3 4 3 2 5 3 4 4 2 2 3 5 1 3 2 1 27 2 2 4 2 3 4 3 2 5 3 4 4 2 2 3 5 1 3 2 1 31 2 2 4 2 3 3 3 4 2 5 5 5 3 3 3 4 5 5 1 1 33 1 1 5 1 2 2 4 1 3 4 3 2 3 2 2 4 2 3 2 2 39 1 1 5 1 1 3 2 1 1 1 2 1 2 2 2 4 4 4 4 1 39 1 1 5 1 2 2 4 2 3 2 2 2 2 2 2 3 3 3 2 2 44 1 1 4 1 2 3 2 1 2 4 2 3 2 2 3 5 4 3 2 2 54 1 2 4 2 2 2 3 2 2 2 2 2 2 2 2 3 5 4 2 2 50 1 5 1 2 3 3 2 4 3 3 3 4 2 3 3 2 3 4 2 2 42 1 1 4 1 1 2 3 1 1 1 1 2 2 3 3 4 2 3 2 2 41 2 2 3 2 2 2 3 2 2 2 2 3 2 2 2 2 3 2 2 2 25 2 1 5 2 2 2 3 2 4 2 2 3 2 2 2 3 2 2 2 1 31 3 1 3 1 1 2 3 1 1 1 1 1 1 1 1 3 1 1 1 1 45 1 2 1 1 2 3 3 2 2 2 2 3 3 3 3 4 5 5 3 3 42 1 2 1 2 2 3 3 2 3 2 3 3 4 3 4 5 4 4 3 4 34 3 5 1 3 5 5 3 5 1 5 3 5 1 5 5 5 2 5 1 1 45 1 2 4 2 2 2 4 2 2 2 2 2 2 2 4 2 4 4 2 2
2 513 3 3 2 2 1 2 2 2 2 2 2 4 3 2 2 46 1 1 2 1 2 2 3 1 2 4 2 3 2 3 3 4 3 2 2 3 25 2 2 2 1 2 2 2 2 2 2 2 2 2 2 2 3 2 2 2 2 40 1 1 3 2 2 2 2 2 2 3 3 3 3 3 3 3 3 3 2 3 50 2 2 4 2 2 2 2 2 2 2 2 2 2 2 2 2 4 3 2 2 39 1 1 5 1 2 3 3 2 3 2 2 3 2 3 3 2 3 2 2 2 35 2 2 4 2 2 2 3 2 2 4 2 4 3 4 4 4 4 3 2 2 49 2 2 4 2 2 3 3 2 4 4 3 4 3 3 3 2 4 3 2 2 55 2 2 4 2 2 4 3 2 2 2 2 5 4 4 4 4 2 4 1 2 4 1 1 1 5 2 2 2 5 2 2 2 3 2 2 2 2 4 2 2 2 2
53 3 2 3 3 3 3 3 2 3 3 2 3 2 3 4 3
82
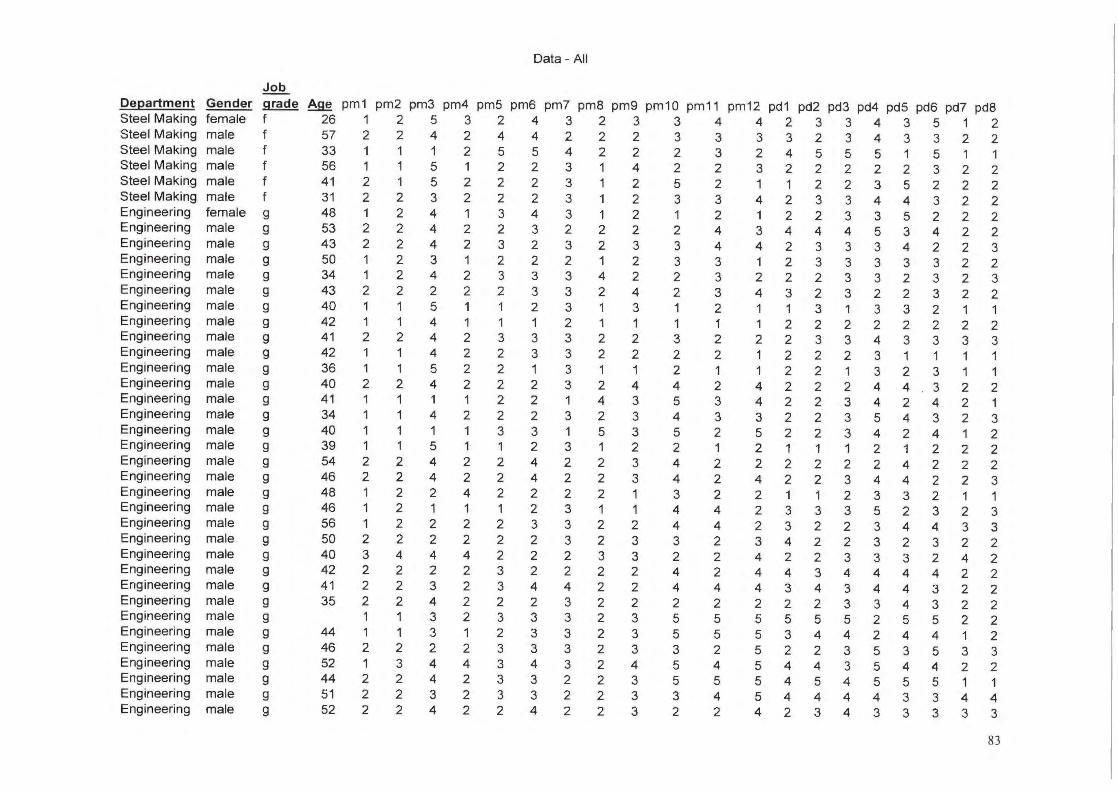
Data- All
Job
Department Gender grade Age pm1 pm2 pm3 pm4 pm5 pm6 pm7 pm8 pm9 pm10 pm11 pm12 pd1 pd2 pd3 pd4 pd5 pd6 pd7 pd8 Steel Making female f 26 1 2 5 3 2 4 3 2 3 3 4 4 2 3 3 4 3 5 1 2 Steel Making male f 57 2 2 4 2 4 4 2 2 2 3 3 3 3 2 3 4 3 3 2 2 Steel Making male f 33 1 1 1 2 5 5 4 2 2 2 3 2 4 5 5 5 1 5 1 1 Steel Making male f 56 1 1 5 1 2 2 3 1 4 2 2 3 2 2 2 2 2 3 2 2 Steel Making male f 41 2 1 5 2 2 2 3 1 2 5 2 1 1 2 2 3 5 2 2 2 Steel Making male f 31 2 2 3 2 2 2 3 1 2 3 3 4 2 3 3 4 4 3 2 2 Engineering female g 48 1 2 4 1 3 4 3 1 2 1 2 1 2 2 3 3 5 2 2 2 Engineering male g 53 2 2 4 2 2 3 2 2 2 2 4 3 4 4 4 5 3 4 2 2 Engineering male g 43 2 2 4 2 3 2 3 2 3 3 4 4 2 3 3 3 4 2 2 3 Engineering male g 50 1 2 3 1 2 2 2 1 2 3 3 1 2 3 3 3 3 3 2 2 Engineering male g 34 1 2 4 2 3 3 3 4 2 2 3 2 2 2 3 3 2 3 2 3 Engineering male g 43 2 2 2 2 2 3 3 2 4 2 3 4 3 2 3 2 2 3 2 2 Engineering male g 40 1 1 5 1 1 2 3 1 3 1 2 1 1 3 1 3 3 2 1 Engineering male g 42 1 1 4 1 1 1 2 1 1 1 1 1 2 2 2 2 2 2 2 2 Engineering male g 41 2 2 4 2 3 3 3 2 2 3 2 2 2 3 3 4 3 3 3 3 Engineering male g 42 1 1 4 2 2 3 3 2 2 2 2 1 2 2 2 3 1 1 1 1 Engineering male g 36 1 1 5 2 2 1 3 1 1 2 1 1 2 2 1 3 2 3 1 1 Engineering male g 40 2 2 4 2 2 2 3 2 4 4 2 4 2 2 2 4 4 3 2 2 Engineering male g 41 1 1 1 1 2 2 1 4 3 5 3 4 2 2 3 4 2 4 2 1 Engineering male g 34 1 1 4 2 2 2 3 2 3 4 3 3 2 2 3 5 4 3 2 3 Engineering male g 40 1 1 1 1 3 3 1 5 3 5 2 5 2 2 3 4 2 4 1 2 Engineering male g 39 1 1 5 1 1 2 3 1 2 2 1 2 1 1 1 2 1 2 2 2 Engineering male g 54 2 2 4 2 2 4 2 2 3 4 2 2 2 2 2 2 4 2 2 2 Engineering male g 46 2 2 4 2 2 4 2 2 3 4 2 4 2 2 3 4 4 2 2 3 Engineering male g 48 1 2 2 4 2 2 2 2 1 3 2 2 1 1 2 3 3 2 1 1 Engineering male g 46 1 2 1 1 1 2 3 1 1 4 4 2 3 3 3 5 2 3 2 3 Engineering male g 56 1 2 2 2 2 3 3 2 2 4 4 2 3 2 2 3 4 4 3 3 Engineering male g 50 2 2 2 2 2 2 3 2 3 3 2 3 4 2 2 3 2 3 2 2 Engineering male g 40 3 4 4 4 2 2 2 3 3 2 2 4 2 2 3 3 3 2 4 2 Engineering male g 42 2 2 2 2 3 2 2 2 2 4 2 4 4 3 4 4 4 4 2 2 Engineering male g 41 2 2 3 2 3 4 4 2 2 4 4 4 3 4 3 4 4 3 2 2 Engineering male g 35 2 2 4 2 2 2 3 2 2 2 2 2 2 2 3 3 4 3 2 2 Engineering male g 1 1 3 2 3 3 3 2 3 5 5 5 5 5 5 2 5 5 2 2 Engineering male g 44 1 1 3 1 2 3 3 2 3 5 5 5 3 4 4 2 4 4 1 2 Engineering male g 46 2 2 2 2 3 3 3 2 3 3 2 5 2 2 3 5 3 5 3 3 Engineering male g 52 1 3 4 4 3 4 3 2 4 5 4 5 4 4 3 5 4 4 2 2 Engineering male g 44 2 2 4 2 3 3 2 2 3 5 5 5 4 5 4 5 5 5 1 1 Engineering male g 51 2 2 3 2 3 3 2 2 3 3 4 5 4 4 4 4 3 3 4 4 Engineering male g 52 2 2 4 2 2 4 2 2 3 2 2 4 2 3 4 3 3 3 3 3
83
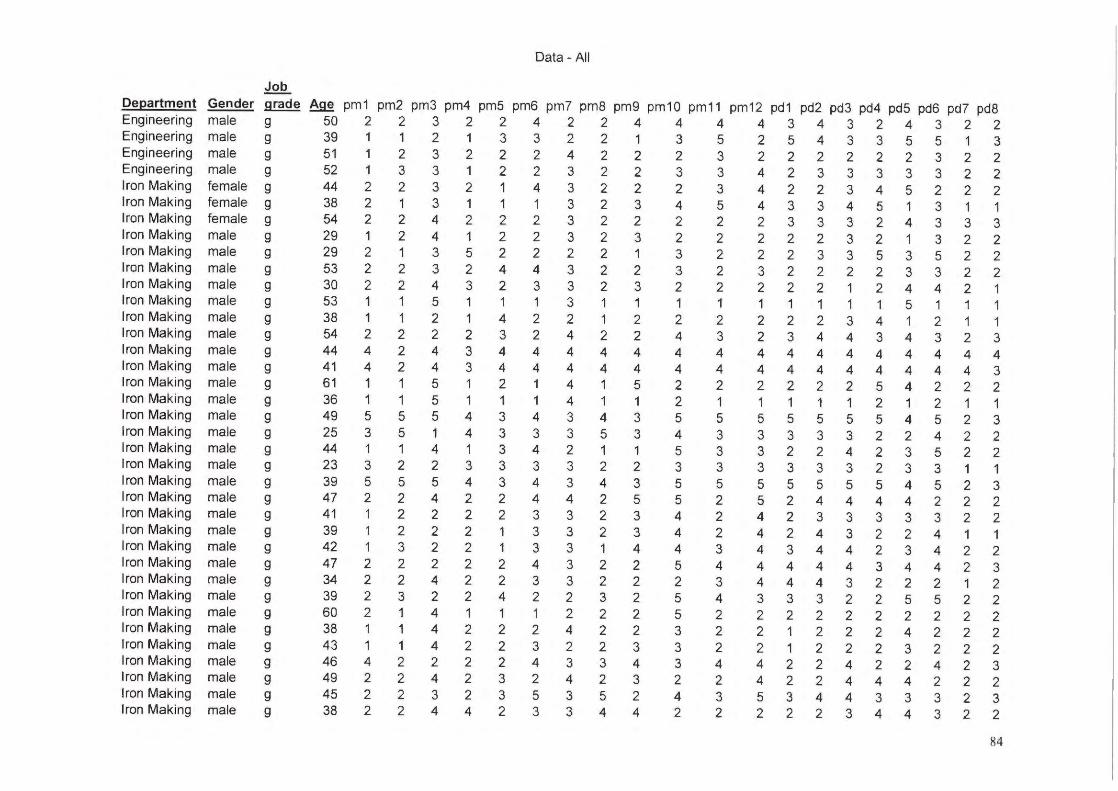
Data- All
Job
Department Gender grade Age pm1 pm2 pm3 pm4 pm5 pm6 pm7 pm8 pm9 pm1 0 pm11 pm12 pd1 pd2 pd3 pd4 pd5 pd6 pd7 pd8 Engineering male 50 2 g 2 3 2 2 4 2 2 4 4 4 4 3 4 3 2 4 3 2 2 Engineering male g 39 1 1 2 1 3 3 2 2 1 3 5 2 5 4 3 3 5 5 1 3 Engineering male g 51 1 2 3 2 2 2 4 2 2 2 3 2 2 2 2 2 2 3 2 2 Engineering male g 52 1 3 3 1 2 2 3 2 2 3 3 4 2 3 3 3 3 3 2 2 Iron Making female g 44 2 2 3 2 1 4 3 2 2 2 3 4 2 2 3 4 5 2 2 2 Iron Making female g 38 2 1 3 1 1 1 3 2 3 4 5 4 3 3 4 5 1 3 1 1 Iron Making female g 54 2 2 4 2 2 2 3 2 2 2 2 2 3 3 3 2 4 3 3 3 Iron Making male g 29 1 2 4 1 2 2 3 2 3 2 2 2 2 2 3 2 1 3 2 2 Iron Making male g 29 2 1 3 5 2 2 2 2 1 3 2 2 2 3 3 5 3 5 2 2 Iron Making male g 53 2 2 3 2 4 4 3 2 2 3 2 3 2 2 2 2 3 3 2 2 Iron Making male g 30 2 2 4 3 2 3 3 2 3 2 2 2 2 2 1 2 4 4 2 1 Iron Making male g 53 1 1 5 1 1 1 3 1 1 1 1 1 1 1 1 1 5 1 1 1 Iron Making male g 38 1 1 2 1 4 2 2 1 2 2 2 2 2 2 3 4 1 2 1 1 Iron Making male g 54 2 2 2 2 3 2 4 2 2 4 3 2 3 4 4 3 4 3 2 3 Iron Making male g 44 4 2 4 3 4 4 4 4 4 4 4 4 4 4 4 4 4 4 4 4 Iron Making male g 41 4 2 4 3 4 4 4 4 4 4 4 4 4 4 4 4 4 4 4 3 Iron Making male g 61 1 1 5 1 2 1 4 1 5 2 2 2 2 2 2 5 4 2 2 2 Iron Making male g 36 1 1 5 1 1 1 4 1 1 2 1 1 1 1 1 2 1 2 1 1 Iron Making male g 49 5 5 5 4 3 4 3 4 3 5 5 5 5 5 5 5 4 5 2 3 Iron Making male g 25 3 5 1 4 3 3 3 5 3 4 3 3 3 3 3 2 2 4 2 2 Iron Making male g 44 1 1 4 1 3 4 2 1 1 5 3 3 2 2 4 2 3 5 2 2 Iron Making male g 23 3 2 2 3 3 3 3 2 2 3 3 3 3 3 3 2 3 3 1 1 Iron Making male g 39 5 5 5 4 3 4 3 4 3 5 5 5 5 5 5 5 4 5 2 3 Iron Making male g 47 2 2 4 2 2 4 4 2 5 5 2 5 2 4 4 4 4 2 2 2 Iron Making male g 41 1 2 2 2 2 3 3 2 3 4 2 4 2 3 3 3 3 3 2 2 Iron Making male g 39 1 2 2 2 1 3 3 2 3 4 2 4 2 4 3 2 2 4 1 1 Iron Making male g 42 1 3 2 2 1 3 3 1 4 4 3 4 3 4 4 2 3 4 2 2 Iron Making male g 47 2 2 2 2 2 4 3 2 2 5 4 4 4 4 4 3 4 4 2 3 Iron Making male g 34 2 2 4 2 2 3 3 2 2 2 3 4 4 4 3 2 2 2 1 2 Iron Making male g 39 2 3 2 2 4 2 2 3 2 5 4 3 3 3 2 2 5 5 2 2 Iron Making male g 60 2 1 4 1 1 1 2 2 2 5 2 2 2 2 2 2 2 2 2 2 Iron Making male g 38 1 1 4 2 2 2 4 2 2 3 2 2 1 2 2 2 4 2 2 2 Iron Making male g 43 1 1 4 2 2 3 2 2 3 3 2 2 1 2 2 2 3 2 2 2 Iron Making male g 46 4 2 2 2 2 4 3 3 4 3 4 4 2 2 4 2 2 4 2 3 Iron Making male g 49 2 2 4 2 3 2 4 2 3 2 2 4 2 2 4 4 4 2 2 2 Iron Making male g 45 2 2 3 2 3 5 3 5 2 4 3 5 3 4 4 3 3 3 2 3 Iron Making male g 38 2 2 4 4 2 3 3 4 4 2 2 2 2 2 3 4 4 3 2 2
84
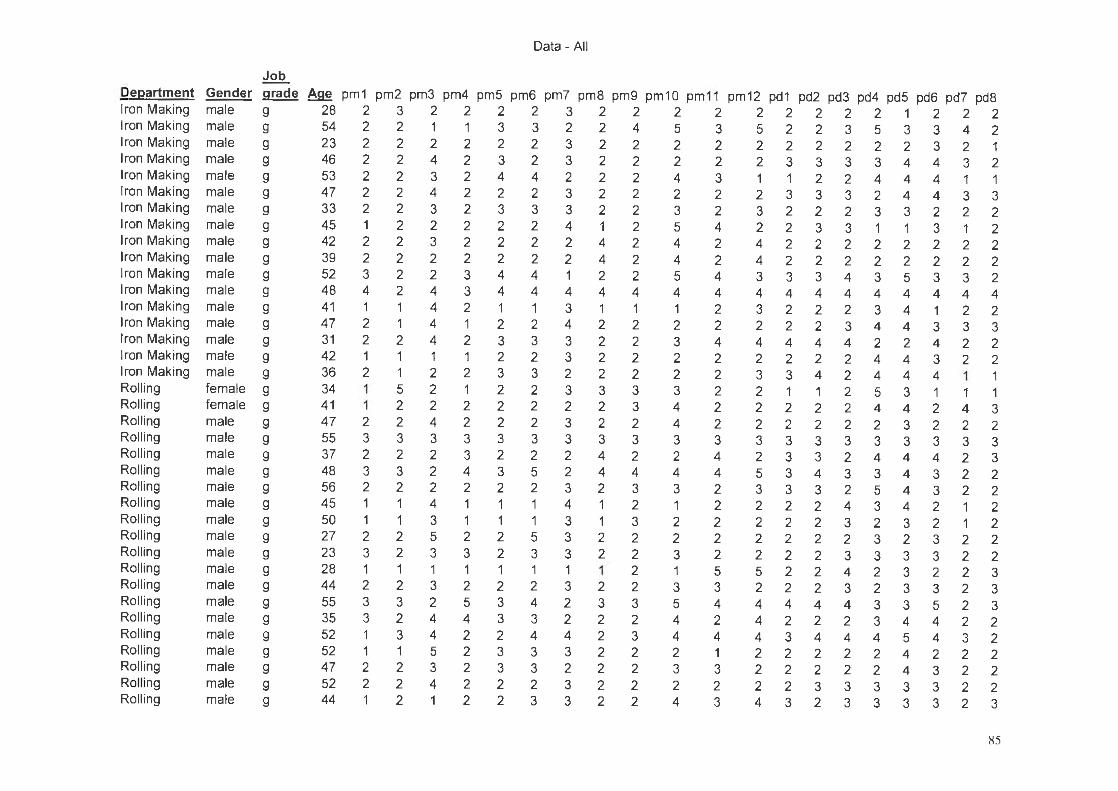
Data- All
Job
Department Gender grade Age pm1 pm2 pm3 pm4 pm5 pm6 pm7 pm8 pm9 pm10 pm11 pm12 pd1 pd2 pd3 pd4 pd5 pd6 pd7 pd8 Iron Making male g 28 2 3 2 2 2 2 3 2 2 2 2 2 2 2 2 2 1 2 2 2 Iron Making male g 54 2 2 1 1 3 3 2 2 4 5 3 5 2 2 3 5 3 3 4 2 Iron Making male g 23 2 2 2 2 2 2 3 2 2 2 2 2 2 2 2 2 2 3 2 1 Iron Making male g 46 2 2 4 2 3 2 3 2 2 2 2 2 3 3 3 3 4 4 3 2 Iron Making male g 53 2 2 3 2 4 4 2 2 2 4 3 1 1 2 2 4 4 4 1 1 Iron Making male g 47 2 2 4 2 2 2 3 2 2 2 2 2 3 3 3 2 4 4 3 3 Iron Making male g 33 2 2 3 2 3 3 3 2 2 3 2 3 2 2 2 3 3 2 2 2 Iron Making male g 45 1 2 2 2 2 2 4 1 2 5 4 2 2 3 3 1 1 3 1 2 Iron Making male g 42 2 2 3 2 2 2 2 4 2 4 2 4 2 2 2 2 2 2 2 2 Iron Making male g 39 2 2 2 2 2 2 2 4 2 4 2 4 2 2 2 2 2 2 2 2 Iron Making male g 52 3 2 2 3 4 4 1 2 2 5 4 3 3 3 4 3 5 3 3 2 Iron Making male g 48 4 2 4 3 4 4 4 4 4 4 4 4 4 4 4 4 4 4 4 4 Iron Making male g 41 1 1 4 2 1 1 3 1 1 1 2 3 2 2 2 3 4 1 2 2 Iron Making male g 47 2 1 4 1 2 2 4 2 2 2 2 2 2 2 3 4 4 3 3 3 Iron Making male g 31 2 2 4 2 3 3 3 2 2 3 4 4 4 4 4 2 2 4 2 2 Iron Making male g 42 1 1 1 1 2 2 3 2 2 2 2 2 2 2 2 4 4 3 2 2 Iron Making male g 36 2 1 2 2 3 3 2 2 2 2 2 3 3 4 2 4 4 4 1 1 Rolling female g 34 1 5 2 1 2 2 3 3 3 3 2 2 1 1 2 5 3 1 1 1 Rolling female g 41 1 2 2 2 2 2 2 2 3 4 2 2 2 2 2 4 4 2 4 3 Rolling male g 47 2 2 4 2 2 2 3 2 2 4 2 2 2 2 2 2 3 2 2 2 Rolling male g 55 3 3 3 3 3 3 3 3 3 3 3 3 3 3 3 3 3 3 3 3 Rolling male g 37 2 2 2 3 2 2 2 4 2 2 4 2 3 3 2 4 4 4 2 3 Rolling male g 48 3 3 2 4 3 5 2 4 4 4 4 5 3 4 3 3 4 3 2 2 Rolling male g 56 2 2 2 2 2 2 3 2 3 3 2 3 3 3 2 5 4 3 2 2 Rolling male g 45 1 1 4 1 1 1 4 1 2 1 2 2 2 2 4 3 4 2 1 2 Rolling male g 50 1 1 3 1 1 1 3 1 3 2 2 2 2 2 3 2 3 2 1 2 Rolling male g 27 2 2 5 2 2 5 3 2 2 2 2 2 2 2 2 3 2 3 2 2 Rolling male g 23 3 2 3 3 2 3 3 2 2 3 2 2 2 2 3 3 3 3 2 2 Rolling male g 28 1 1 1 1 1 1 1 1 2 1 5 5 2 2 4 2 3 2 2 3 Rolling male g 44 2 2 3 2 2 2 3 2 2 3 3 2 2 2 3 2 3 3 2 3 Rolling male g 55 3 3 2 5 3 4 2 3 3 5 4 4 4 4 4 3 3 5 2 3 Rolling male g 35 3 2 4 4 3 3 2 2 2 4 2 4 2 2 2 3 4 4 2 2 Rolling male g 52 1 3 4 2 2 4 4 2 3 4 4 4 3 4 4 4 5 4 3 2 Rolling male g 52 1 1 5 2 3 3 3 2 2 2 1 2 2 2 2 2 4 2 2 2 Rolling male g 47 2 2 3 2 3 3 2 2 2 3 3 2 2 2 2 2 4 3 2 2 Rolling male g 52 2 2 4 2 2 2 3 2 2 2 2 2 2 3 3 3 3 3 2 2 Rolling male g 44 1 2 1 2 2 3 3 2 2 4 3 4 3 2 3 3 3 3 2 3
85
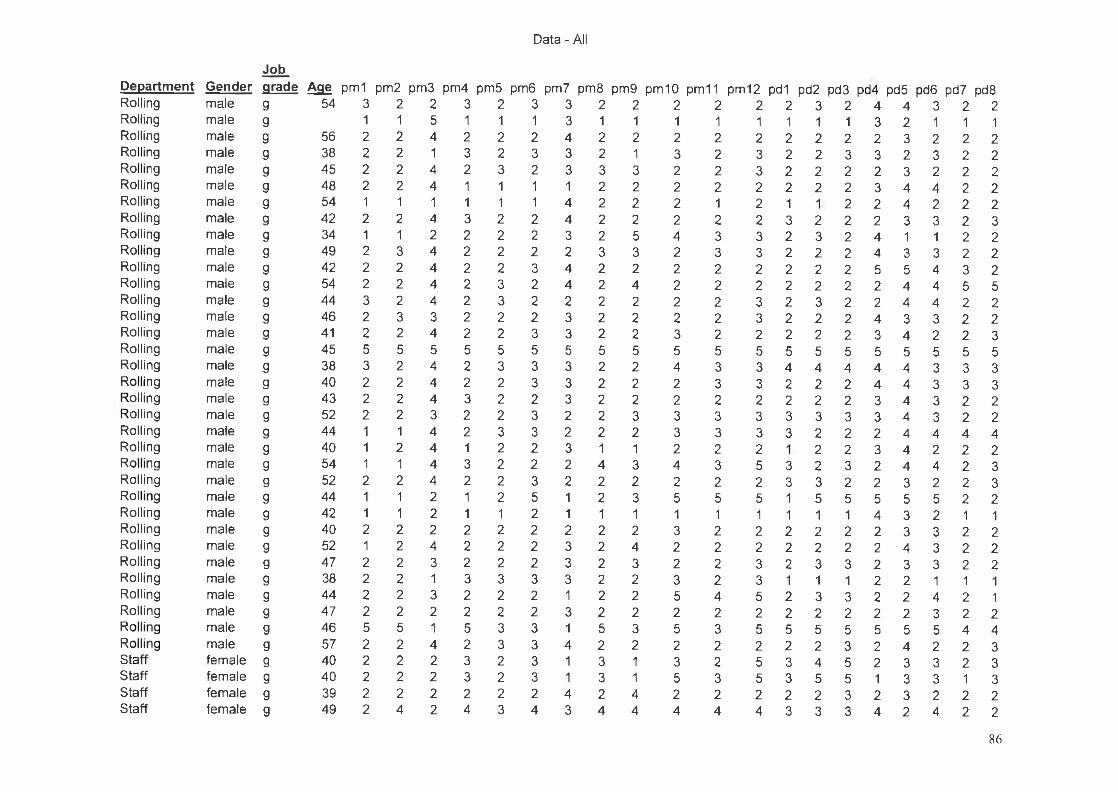
Data- All
Job
Department Gender grade Age pm1 pm2 pm3 pm4 pm5 pm6 pm7 pm8 pm9 pm10 pm11 pm12 pd1 pd2 pd3 pd4 pd5 pd6 pd7 pd8 Rolling male g 54 3 2 2 3 2 3 3 2 2 2 2 2 2 3 2 4 4 3 2 2 Rolling male g 1 1 5 1 1 1 3 1 1 1 1 1 1 1 1 3 2 1 1 1 Rolling male g 56 2 2 4 2 2 2 4 2 2 2 2 2 2 2 2 2 3 2 2 2 Rolling male g 38 2 2 1 3 2 3 3 2 1 3 2 3 2 2 3 3 2 3 2 2 Rolling male g 45 2 2 4 2 3 2 3 3 3 2 2 3 2 2 2 2 3 2 2 2 Rolling male g 48 2 2 4 1 1 1 1 2 2 2 2 2 2 2 2 3 4 4 2 2 Rolling male g 54 1 1 1 1 1 1 4 2 2 2 1 2 1 1 2 2 4 2 2 2 Roll ing male g 42 2 2 4 3 2 2 4 2 2 2 2 2 3 2 2 2 3 3 2 3 Rolling male g 34 1 1 2 2 2 2 3 2 5 4 3 3 2 3 2 4 1 1 2 2 Rolling male g 49 2 3 4 2 2 2 2 3 3 2 3 3 2 2 2 4 3 3 2 2 Roll ing male g 42 2 2 4 2 2 3 4 2 2 2 2 2 2 2 2 5 5 4 3 2 Roll ing male g 54 2 2 4 2 3 2 4 2 4 2 2 2 2 2 2 2 4 4 5 5 Rolling male g 44 3 2 4 2 3 2 2 2 2 2 2 3 2 3 2 2 4 4 2 2 Rolling male g 46 2 3 3 2 2 2 3 2 2 2 2 3 2 2 2 4 3 3 2 2 Roll ing male g 41 2 2 4 2 2 3 3 2 2 3 2 2 2 2 2 3 4 2 2 3 Rolling male g 45 5 5 5 5 5 5 5 5 5 5 5 5 5 5 5 5 5 5 5 5 Rolling male g 38 3 2 4 2 3 3 3 2 2 4 3 3 4 4 4 4 4 3 3 3 Rolling male g 40 2 2 4 2 2 3 3 2 2 2 3 3 2 2 2 4 4 3 3 3 Roll ing male g 43 2 2 4 3 2 2 3 2 2 2 2 2 2 2 2 3 4 3 2 2 Rolling male g 52 2 2 3 2 2 3 2 2 3 3 3 3 3 3 3 3 4 3 2 2 Rolling male g 44 1 1 4 2 3 3 2 2 2 3 3 3 3 2 2 2 4 4 4 4 Roll ing male g 40 1 2 4 1 2 2 3 1 1 2 2 2 1 2 2 3 4 2 2 2 Roll ing male g 54 1 1 4 3 2 2 2 4 3 4 3 5 3 2 3 2 4 4 2 3 Roll ing male g 52 2 2 4 2 2 3 2 2 2 2 2 2 3 3 2 2 3 2 2 3 Rolling male g 44 1 1 2 1 2 5 1 2 3 5 5 5 1 5 5 5 5 5 2 2 Roll ing male g 42 1 1 2 1 1 2 1 1 1 1 1 1 1 1 1 4 3 2 1 1 Roll ing male g 40 2 2 2 2 2 2 2 2 2 3 2 2 2 2 2 2 3 3 2 2 Rolling male g 52 1 2 4 2 2 2 3 2 4 2 2 2 2 2 2 2 4 3 2 2 Rolling male g 47 2 2 3 2 2 2 3 2 3 2 2 3 2 3 3 2 3 3 2 2 Rolling male g 38 2 2 1 3 3 3 3 2 2 3 2 3 1 1 1 2 2 1 1 1 Rolling male g 44 2 2 3 2 2 2 1 2 2 5 4 5 2 3 3 2 2 4 2 1 Rolling male g 47 2 2 2 2 2 2 3 2 2 2 2 2 2 2 2 2 2 3 2 2 Rolling male g 46 5 5 1 5 3 3 1 5 3 5 3 5 5 5 5 5 5 5 4 4 Rolling male g 57 2 2 4 2 3 3 4 2 2 2 2 2 2 2 3 2 4 2 2 3 Staff female g 40 2 2 2 3 2 3 1 3 1 3 2 5 3 4 5 2 3 3 2 3 Staff female g 40 2 2 2 3 2 3 1 3 1 5 3 5 3 5 5 1 3 3 1 3 Staff female g 39 2 2 2 2 2 2 4 2 4 2 2 2 2 2 3 2 3 2 2 2 Staff female g 49 2 4 2 4 3 4 3 4 4 4 4 4 3 3 3 4 2 4 2 2
86
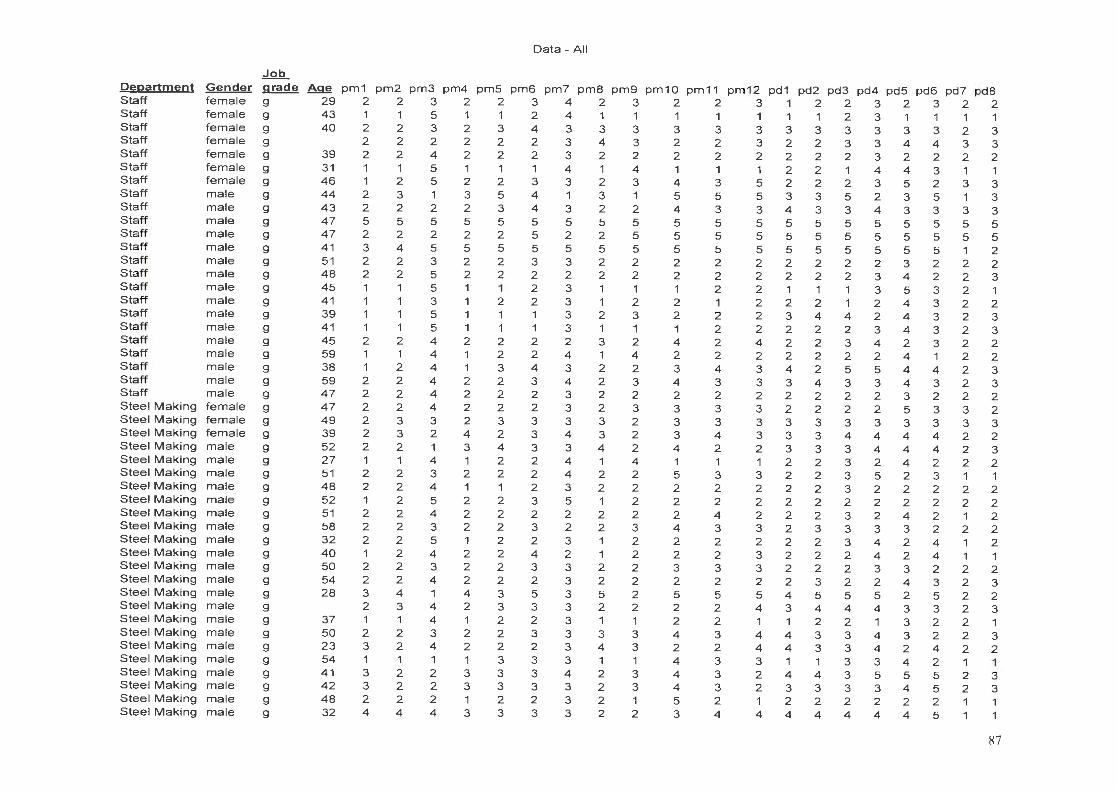
Department Staff Staff Staff Staff Staff Staff Staff Staff Staff Staff Staff Staff Staff S taff Staff S taff S ta ff S taff S taff S taff Staff Staff Staff Steel Making Steel Making Steel Making Steel Making Steel Making Steel Making Steel Making Steel M aking S teel Making S teel M aking S teel M aking S teel M aking S teel M aking S teel M aking S teel M aking S teel M aking S teel M aking Steel M aking Steel M aking Steel M aking Steel Making S teel Making S teel M aking Steel Making
Gender female female female female female female female male male male male male male male male male male male male male male male male female female female male male male male male male male male male male male male male male male male male male male male male
Job grade g g g g g g g g g g g g g g g g g g g g g g g g g g g g g g g g g g g g g g g g g g g g g g g
Data- All
Age pm1 pm2 pm3 pm4 pm5 pm6 pm7 pm8 pm9 pm10 pm11 pm12 pd1 29 2 2 3 2 2 3 4 2 3 2 2 3 1
pd2 pd3 pd4 pd5 pd6 pd7 pd8 2 2 3 2 3 2 2
43 1 1 5 1 1 2 4 1 1 1 1 1 1 12 3 1 111 40 2 2 3 2 3 4 3 3 3 3 3 3 3 3 3 3 3 3 2 3
2 2 2 2 2 2 3 4 3 2 2 3 2 2 3 3 4 4 3 3 39 2 2 4 2 2 2 3 2 2 2 2 2 2 2 2 3 2 2 2 2 31 1 1 5 1 1 1 4 1 4 1 1 1 2 2 1 4 4 3 1 1 46 1 2 5 2 2 3 3 2 3 4 3 5 2 2 2 3 5 2 3 3 44 2 3 1 3 5 4 1 3 1 5 5 5 3 3 5 2 3 5 1 3 43 2 2 2 2 3 4 3 2 2 4 3 3 4 3 3 4 3 3 3 3 47 5 5 5 5 5 5 5 5 5 5 5 5 5 5 5 5 5 5 5 5 47 2 2 2 2 2 5 2 2 5 5 5 5 5 5 5 5 5 5 5 5 41 3 4 5 5 5 5 5 5 5 5 5 5 5 5 5 5 5 5 1 2 51 2 2 3 2 2 3 3 2 2 2 2 2 2 2 2 2 3 2 2 2 48 2 2 5 2 2 2 2 2 2 2 2 2 2 2 2 3 4 2 2 3 4 5 1 1 5 1 1 2 3 1 1 1 2 2 1 1 1 3 5 3 2 1 41 1 1 3 1 2 2 3 1 2 2 1 2 2 2 1 2 4 3 2 2 39 1 1 5 1 1 1 3 2 3 2 2 2 3 4 4 2 4 3 2 3 41 1 1 5 1 1 1 3 1 1 1 2 2 2 2 2 3 4 3 2 3 45 2 2 4 2 2 2 2 3 2 4 2 4 2 2 3 4 2 3 2 2 59 1 1 4 1 2 2 4 1 4 2 2 2 2 2 2 2 4 1 2 2 38 1 2 4 1 3 4 3 2 2 3 4 3 4 2 5 5 4 4 2 3 59 2 2 4 2 2 3 4 2 3 4 3 3 3 4 3 3 4 3 2 3 47 2 2 4 2 2 2 3 2 2 2 2 2 2 2 2 2 3 2 2 2 47 2 2 4 2 2 2 3 2 3 3 3 3 2 2 2 2 5 3 3 2 49 2 3 3 2 3 3 3 3 2 3 3 3 3 3 3 3 3 3 3 3 39 2 3 2 4 2 3 4 3 2 3 4 3 3 3 4 4 4 4 2 2 52 2 2 1 3 4 3 3 4 2 4 2 2 3 3 3 4 4 4 2 3 27 1 1 4 1 2 2 4 1 4 1 1 1 2 2 3 2 4 2 2 2 51 2 2 3 2 2 2 4 2 2 5 3 3 2 2 3 5 2 3 1 1 48 2 2 4 1 1 2 3 2 2 2 2 2 2 2 3 2 2 2 2 2 52 1 2 5 2 2 3 5 1 2 2 2 2 2 2 2 2 2 2 2 2 51 2 2 4 2 2 2 2 2 2 2 4 2 2 2 3 2 4 2 1 2 58 2 2 3 2 2 3 2 2 3 4 3 3 2 3 3 3 3 2 2 2 32 2 2 5 1 2 2 3 1 2 2 2 2 2 2 3 4 2 4 1 2 40 1 2 4 2 2 4 2 1 2 2 2 3 2 2 2 4 2 4 1 1 50 2 2 3 2 2 3 3 2 2 3 3 3 2 2 2 3 3 2 2 2 54 2 2 4 2 2 2 3 2 2 2 2 2 2 3 2 2 4 3 2 3 28 3 4 1 4 3 5 3 5 2 5 5 5 4 5 5 5 2 5 2 2
2 3 4 2 3 3 3 2 2 2 2 4 3 4 4 4 3 3 2 3 37 1 1 4 1 2 2 3 1 1 2 2 1 1 2 2 1 3 2 2 1 50 2 2 3 2 2 3 3 3 3 4 3 4 4 3 3 4 3 2 2 3 23 3 2 4 2 2 2 3 4 3 2 2 4 4 3 3 4 2 4 2 2 54 1 1 1 1 3 3 3 1 1 4 3 3 1 3 3 4 2 1 1 41 3 2 2 3 3 3 4 2 3 4 3 2 4 4 3 5 5 5 2 3 42 3 2 2 3 3 3 3 2 3 4 3 2 3 3 3 3 4 5 2 3 48 2 2 2 1 2 2 3 2 1 5 2 1 2 2 2 2 2 2 1 1 32 4 4 4 3 3 3 3 2 2 3 4 4 4 4 4 4 4 5 1 1
87
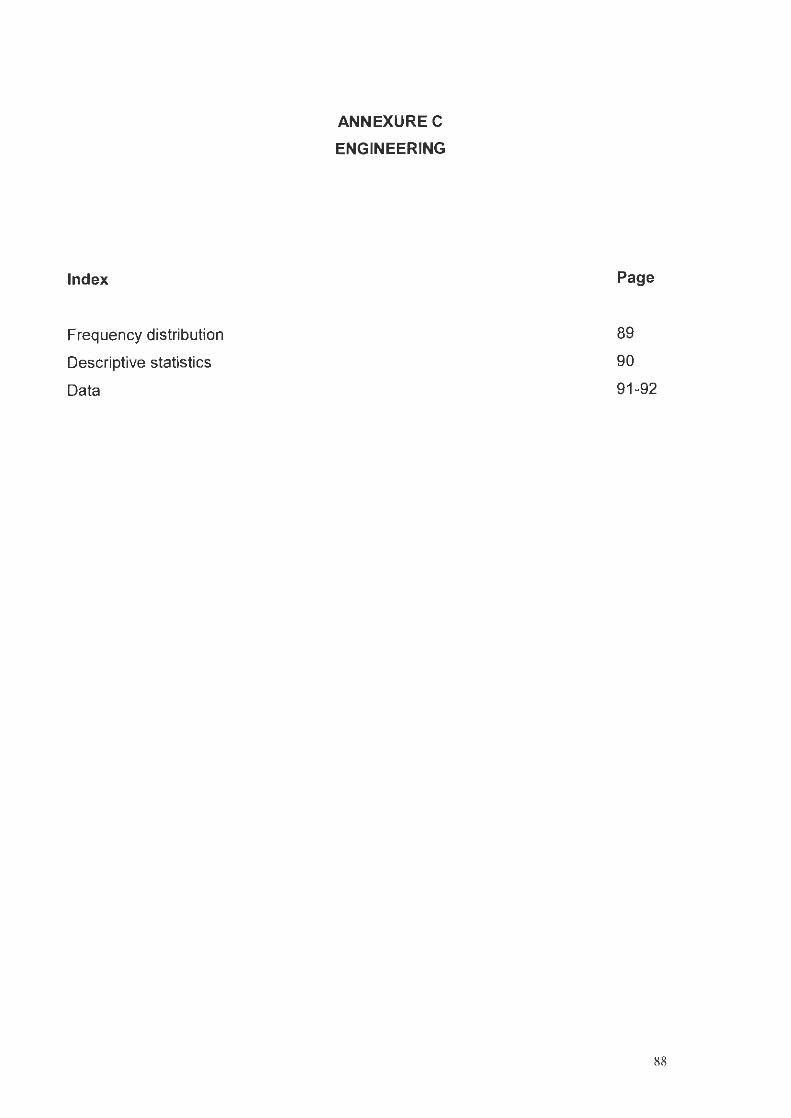
Index
Frequency distribution
Descriptive statistics
Data
ANNEXURE C
ENGINEERING
Page
89
90
91-92
88
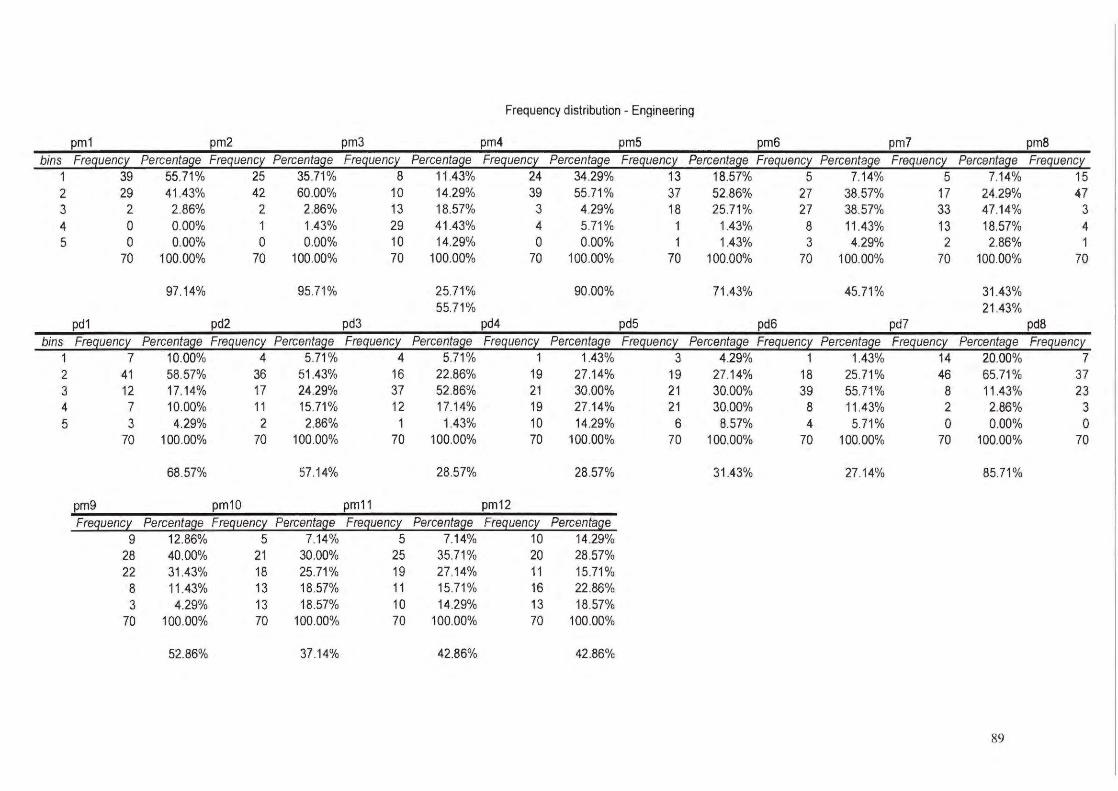
Frequency distribution -Engineering
pm1 pm2 pm3 pm4 pm5 pm6 pm7 pm8 bins Frequency Percentage Frequency Percentage Frequency Percentage Frequency Percentage Frequency Percentage Frequency Percentage Frequency Percentage Frequency
1 39 55.71 % 25 35.71 % 8 11.43% 24 34.29% 13 18.57% 5 7.14% 5 7.14% 15 2 29 41.43% 42 60.00% 10 14.29% 39 55.71 % 37 52.86% 27 38.57% 17 24.29% 47 3 2 2.86% 2 2.86% 13 18.57% 3 4.29% 18 25.71% 27 38.57% 33 47.14% 3 4 0 0.00% 1 1.43% 29 41.43% 4 5.71 % 1 1.43% 8 11.43% 13 18.57% 4 5 0 0.00% 0 0.00% 10 14.29% 0 0.00% 1 1.43% 3 4.29% 2 2.86% 1
pd1
70 100.00% 70 100.00% 70 100.00% 70 100.00% 70 100.00% 70 100.00% 70 100.00% 70
97.14% 95.71 %
pd2 pd3
25.71% 55.71 %
pd4
90.00% 71.43% 45.71 %
pd5 pd6 pd7
31.43% 21.43%
pd8
bins Frequencr, Percenta~e Frequencr, Percenta~e Frequencr, Percenta~e Frequencr, Percenta~e Frequencr, Percenta~e Frequencr, Percenta~e Frequencr, Percenta~e Frequencr, 1 7 10.00% 4 5.71 % 4 5.71 % 1 1.43% 3 4.29% 1 1.43% 14 20.00% 7 2 41 58.57% 36 51.43% 16 22.86% 19 27.14% 19 27.14% 18 25.71 % 46 65.71 % 37 3 12 17.14% 17 24.29% 37 52.86% 21 30.00% 21 30.00% 39 55.71 % 8 11.43% 23 4 7 10.00% 11 15.71 % 12 17.14% 19 27.14% 21 30.00% 8 11.43% 2 2.86% 3 5 3 4.29% 2 2.86% 1 1.43% 10 14.29% 6 8.57% 4 5.71 % 0 0.00% 0
70 100.00% 70 100.00% 70 100.00% 70 100.00% 70 100.00% 70 100.00% 70 100.00% 70
68.57% 57.14% 28.57% 28.57% 31.43% 27.14% 85.71 %
pm9 pm10 pm11 pm12
Frequency Percentage Frequency Percentage Frequencr, Percentage Frequency Percentage 9 12.86% 5 7.14% 5 7.14% 10 14.29%
28 40.00% 21 30.00% 25 35.71 % 20 28.57% 22 31.43% 18 25.71 % 19 27.14% 11 15.71 %
8 11.43% 13 18.57% 11 15.71 % 16 22.86% 3 4.29% 13 18.57% 10 14.29% 13 18.57%
70 100.00% 70 100.00% 70 100.00% 70 100.00%
52.86% 37 .14% 42.86% 42.86%
89
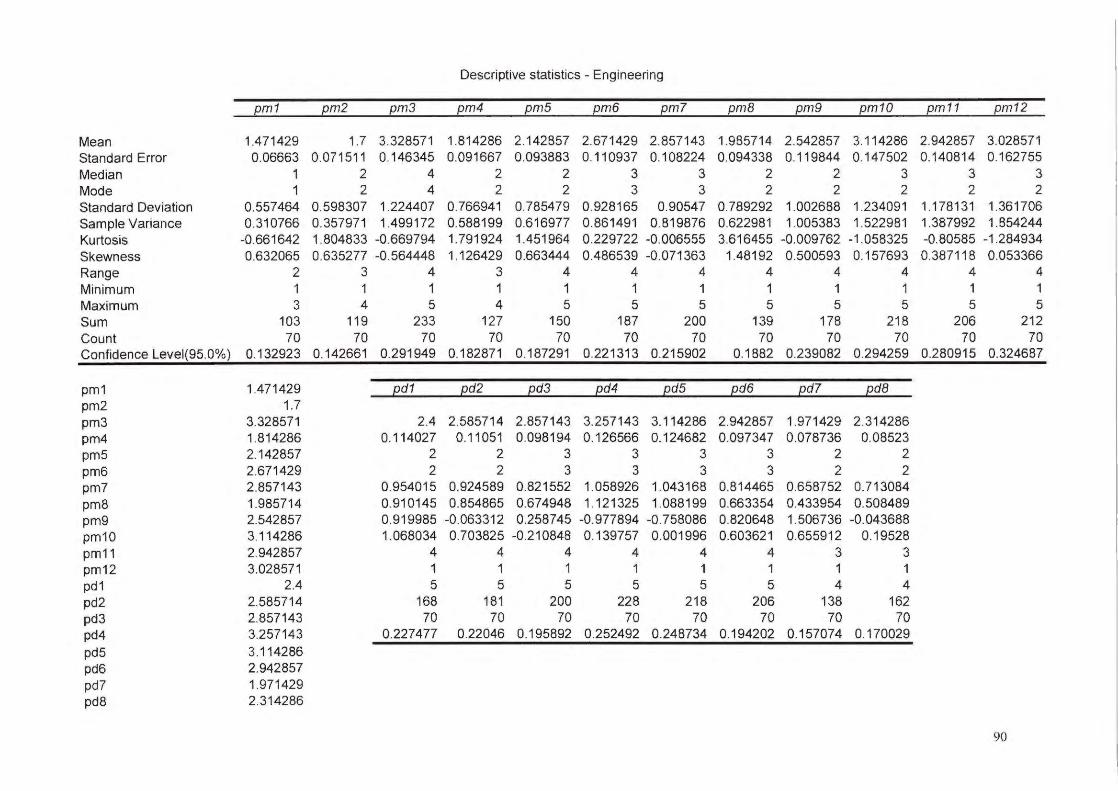
Descriptive statistics - Engineering
pm1 pm2 pm3 pm4 pm5 pm6 pml pmB pm9 pm10 pm11 pm12
Mean 1.471429 1.7 3.328571 1.814286 2.142857 2.671429 2.857143 1.985714 2.542857 3.114286 2.942857 3.028571 Standard Error 0.06663 0.071511 0.146345 0.091667 0.093883 0.110937 0.108224 0.094338 0.119844 0.147502 0.140814 0.162755 Median 1 2 4 2 2 3 3 2 2 3 3 3 Mode 1 2 4 2 2 3 3 2 2 2 2 2 Standard Deviation 0.557464 0.598307 1.224407 0.766941 0.785479 0.928165 0.90547 0.789292 1.002688 1.234091 1.178131 1.361706 Sample Variance 0.310766 0.357971 1.499172 0.588199 0.616977 0.861491 0.819876 0.622981 1.005383 1.522981 1.387992 1.854244 Kurtosis -0.661642 1.804833 -0 .669794 1.791924 1.451964 0.229722 -0.006555 3.616455 -0 .009762 -1.058325 -0.80585 -1 .284934 Skewness 0.632065 0.635277 -0.564448 1.126429 0.663444 0.486539 -0.071363 1.48192 0.500593 0.157693 0.387118 0.053366 Range 2 3 4 3 4 4 4 4 4 4 4 4 Minimum 1 1 1 1 1 1 1 1 1 1 1 1 Maximum 3 4 5 4 5 5 5 5 5 5 5 5 Sum 103 119 233 127 150 187 200 139 178 218 206 212 Count 70 70 70 70 70 70 70 70 70 70 70 70 Confidence Level(95.0%) 0.132923 0.142661 0.291949 0.182871 0.187291 0.221313 0.215902 0.1882 0.239082 0.294259 0.280915 0.324687
pm1 1.471429 pd1 pd2 pd3 pd4 pd5 pd6 pd7 pdB pm2 1.7 pm3 3.328571 2.4 2.585714 2.857143 3.257143 3.114286 2.942857 1.971429 2.314286 pm4 1.814286 0.114027 0.11051 0.098194 0.126566 0.124682 0.097347 0.078736 0.08523 pm5 2.142857 2 2 3 3 3 3 2 2 pm6 2.671429 2 2 3 3 3 3 2 2 pm7 2.857143 0.954015 0.924589 0.821552 1.058926 1.043168 0.814465 0.658752 0.713084 pm8 1.985714 0.910145 0.854865 0.674948 1.121325 1.088199 0.663354 0.433954 0.508489 pm9 2.542857 0.919985 -0.063312 0.258745 -0.977894 -0 .758086 0.820648 1.506736 -0.043688 pm10 3.114286 1.068034 0.703825 -0.210848 0.139757 0.001996 0.603621 0.655912 0.19528 pm11 2.942857 4 4 4 4 4 4 3 3 pm12 3.028571 1 1 1 1 1 1 1 1 pd1 2.4 5 5 5 5 5 5 4 4 pd2 2.585714 168 181 200 228 218 206 138 162 pd3 2.857143 70 70 70 70 70 70 70 70 pd4 3.257143 0.227477 0.22046 0.195892 0.252492 0.248734 0.194202 0.157074 0.170029
pd5 3.114286 pd6 2.942857 pd7 1.971429 pd8 2.314286
90

Data - Engineering
Job Department Gender grade Age pm 1 pm2 pm3 pm4 pm5 pm6 pm 7 pm8 pm9 pm 1 0 pm 11 pm 12 pd 1 pd2 pd3 pd4 pd5 pd6 pd7 pd8 Engineering male e 52 1 2 4 2 2 3 3 2 2 3 3 2 2 2 3 2 3 3 2 3 Engineering male e 36 1 2 3 2 4 3 1 2 4 5 4 4 3 4 4 4 3 3 2 2 Engineering male e 45 1 1 4 1 2 2 4 2 3 2 3 2 2 2 3 5 4 3 2 3 Engineering male e 46 1 2 3 2 2 3 4 2 2 3 3 2 2 3 3 4 4 2 2 2 Engineering male e 56 1 1 1 1 1 1 3 2 2 2 2 1 3 3 3 4 2 3 2 2 Engineering male e 45 1 1 5 1 1 1 3 1 5 5 5 5 3 3 3 5 4 3 2 2 Engineering male e 32 2 2 4 2 2 2 2 2 3 2 2 2 2 2 3 2 2 2 2 2 Engineering male e 53 1 2 1 2 2 3 3 1 3 3 3 3 2 3 3 4 4 3 3 3 Engineering male e 48 1 1 5 1 1 3 2 2 1 4 2 3 2 2 3 2 2 2 1 3 Engineering male e 58 2 2 4 2 2 2 4 2 2 2 2 2 2 2 3 2 3 3 2 3 Engineering male e 1 1 1 1 2 4 5 1 1 3 5 4 3 4 4 4 5 3 3 4 Engineering male e 54 2 2 3 3 1 5 3 2 3 4 5 4 3 2 3 4 4 3 3 3 Engineering male e 40 1 1 2 1 2 3 2 1 2 2 3 3 2 2 2 3 3 3 2 3 Engineering male e 53 2 2 4 2 3 3 2 2 2 3 2 2 2 2 4 4 3 3 2 2 Engineering male e 59 2 2 5 4 2 2 4 4 4 3 2 1 2 3 2 4 3 3 2 2 Engineering male e 59 2 2 4 2 2 3 3 2 2 4 3 5 2 3 3 5 4 3 2 2 Engineering male e 48 2 2 4 2 2 3 4 1 4 2 4 2 1 2 4 3 3 4 2 4 Engineering male f 1 1 2 2 3 3 3 3 3 4 3 4 2 3 3 2 2 2 2 2 Engineering male f 53 1 1 5 1 1 2 5 1 1 3 2 1 1 1 2 1 2 3 1 3 Engineering male f 37 1 1 5 1 1 1 4 2 1 1 1 1 1 1 1 4 3 3 1 1 Engineering male f 30 2 2 3 3 2 2 3 3 3 3 2 3 2 2 2 2 4 3 2 2 Engineering male f 41 1 1 5 1 1 3 3 1 5 1 3 3 2 2 3 2 4 3 1 3 Engineering male f 30 1 1 2 3 2 2 3 2 2 5 5 5 5 2 3 2 3 3 1 3 Engineering male f 49 2 2 4 1 1 2 1 2 3 3 2 3 2 2 2 2 2 2 2 2 Engineering male f 35 3 2 4 2 2 3 4 2 4 5 3 4 3 2 3 4 2 3 2 2 Engineering male f 26 2 2 3 2 3 2 3 2 2 2 3 3 2 2 2 3 2 2 2 2 Engineering male f 30 1 2 4 2 3 2 3 2 2 2 1 2 2 2 2 3 1 2 1 2 Engineering male f 1 1 1 1 1 5 4 1 5 5 5 5 1 4 3 4 3 3 2 2 Engineering male f 2 2 1 2 5 2 1 2 2 5 5 5 2 4 4 5 3 3 3 3 Engineering male f 55 1 1 4 1 2 3 4 4 2 2 3 3 2 3 4 3 5 2 2 3 Engineering male f 48 2 2 5 2 2 2 4 2 2 2 2 2 2 2 2 3 2 2 2 2 Engineering male f 59 1 1 4 1 2 5 4 2 2 5 4 5 4 3 3 2 4 3 2 3 Engineering male f 29 2 2 4 2 3 3 3 2 2 2 3 2 2 2 3 2 2 3 2 2
91

Data - Engineering
Job Department Gender grade Age pm1 pm2 pm3 pm4 pm5 pm6 pm7 pm8 pm9 pm10 pm11 pm12 pd1 pd2 pd3 pd4 pd5 pd6 pd7 pd8 Engineering male g 53 2 2 4 2 2 3 2 2 2 2 4 3 4 4 4 5 3 4 2 2 Engineering male g 43 2 2 4 2 3 2 3 2 3 3 4 4 2 3 3 3 4 2 2 3 Engineering male g 50 1 2 3 1 2 2 2 1 2 3 3 1 2 3 3 3 3 3 2 2 Engineering male g 34 1 2 4 2 3 3 3 4 2 2 3 2 2 2 3 3 2 3 2 3 Engineering male g 43 2 2 2 2 2 3 3 2 4 2 3 4 3 2 3 2 2 3 2 2 Engineering male g 40 1 1 5 1 1 2 3 1 3 1 2 1 1 3 1 3 3 2 1 1 Engineering male g 42 1 1 4 1 1 1 2 1 1 1 1 1 2 2 2 2 2 2 2 2 Engineering male g 41 2 2 4 2 3 3 3 2 2 3 2 2 2 3 3 4 3 3 3 3 Engineering female g 48 1 2 4 1 3 4 3 1 2 1 2 1 2 2 3 3 5 2 2 2 Engineering male g 42 1 1 4 2 2 3 3 2 2 2 2 1 2 2 2 3 1 1 1 1 Engineering male g 36 1 1 5 2 2 1 3 1 1 2 1 1 2 2 1 3 2 3 1 1 Engineering male g 40 2 2 4 2 2 2 3 2 4 4 2 4 2 2 2 4 4 3 2 2 Engineering male g 41 1 1 1 1 2 2 1 4 3 5 3 4 2 2 3 4 2 4 2 1 Engineering male g 34 1 1 4 2 2 2 3 2 3 4 3 3 2 2 3 5 4 3 2 3 Engineering male g 40 1 1 1 1 3 3 1 5 3 5 2 5 2 2 3 4 2 4 1 2 Engineering male g 39 1 1 5 1 1 2 3 1 2 2 1 2 1 1 1 2 1 2 2 2 Engineering male g 54 2 2 4 2 2 4 2 2 3 4 2 2 2 2 2 2 4 2 2 2 Engineering male g 46 2 2 4 2 2 4 2 2 3 4 2 4 2 2 3 4 4 2 2 3 Engineering male g 48 1 2 2 4 2 2 2 2 1 3 2 2 1 1 2 3 3 2 1 1 Engineering male g 46 1 2 1 1 1 2 3 1 1 4 4 2 3 3 3 5 2 3 2 3 Engineering male g 56 1 2 2 2 2 3 3 2 2 4 4 2 3 2 2 3 4 4 3 3 Engineering male g 50 2 2 2 2 2 2 3 2 3 3 2 3 4 2 2 3 2 3 2 2 Engineering male g 40 3 4 4 4 2 2 2 3 3 2 2 4 2 2 3 3 3 2 4 2 Engineering male g 42 2 2 2 2 3 2 2 2 2 4 2 4 4 3 4 4 4 4 2 2 Engineering male g 41 2 2 3 2 3 4 4 2 2 4 4 4 3 4 3 4 4 3 2 2 Engineering male g 35 2 2 4 2 2 2 3 2 2 2 2 2 2 2 3 3 4 3 2 2 Engineering male g 1 1 3 2 3 3 3 2 3 5 5 5 5 5 5 2 5 5 2 2 Engineering male g 44 1 1 3 1 2 3 3 2 3 5 5 5 3 4 4 2 4 4 1 2 Engineering male g 46 2 2 2 2 3 3 3 2 3 3 2 5 2 2 3 5 3 5 3 3 Engineering male g 52 1 3 4 4 3 4 3 2 4 5 4 5 4 4 3 5 4 4 2 2 Engineering male g 44 2 2 4 2 3 3 2 2 3 5 5 5 4 5 4 5 5 5 1 1 Engineering male g 51 2 2 3 2 3 3 2 2 3 3 4 5 4 4 4 4 3 3 4 4 Engineering male g 52 2 2 4 2 2 4 2 2 3 2 2 4 2 3 4 3 3 3 3 3 Engineering male g 50 2 2 3 2 2 4 2 2 4 4 4 4 3 4 3 2 4 3 2 2 Engineering male g 39 1 1 2 1 3 3 2 2 1 3 5 2 5 4 3 3 5 5 1 3 Engineering male g 51 1 2 3 2 2 2 4 2 2 2 3 2 2 2 2 2 2 3 2 2 Engineering male g 52 1 3 3 1 2 2 3 2 2 3 3 4 2 3 3 3 3 3 2 2
92

£6
~NI>f'VW NO~I
a 3~nX3NN\f
eleo
S:::J!lS!lels aA!ldp::~sao
UO!lnqplS!P ,buanbaJ.:J
xapu1
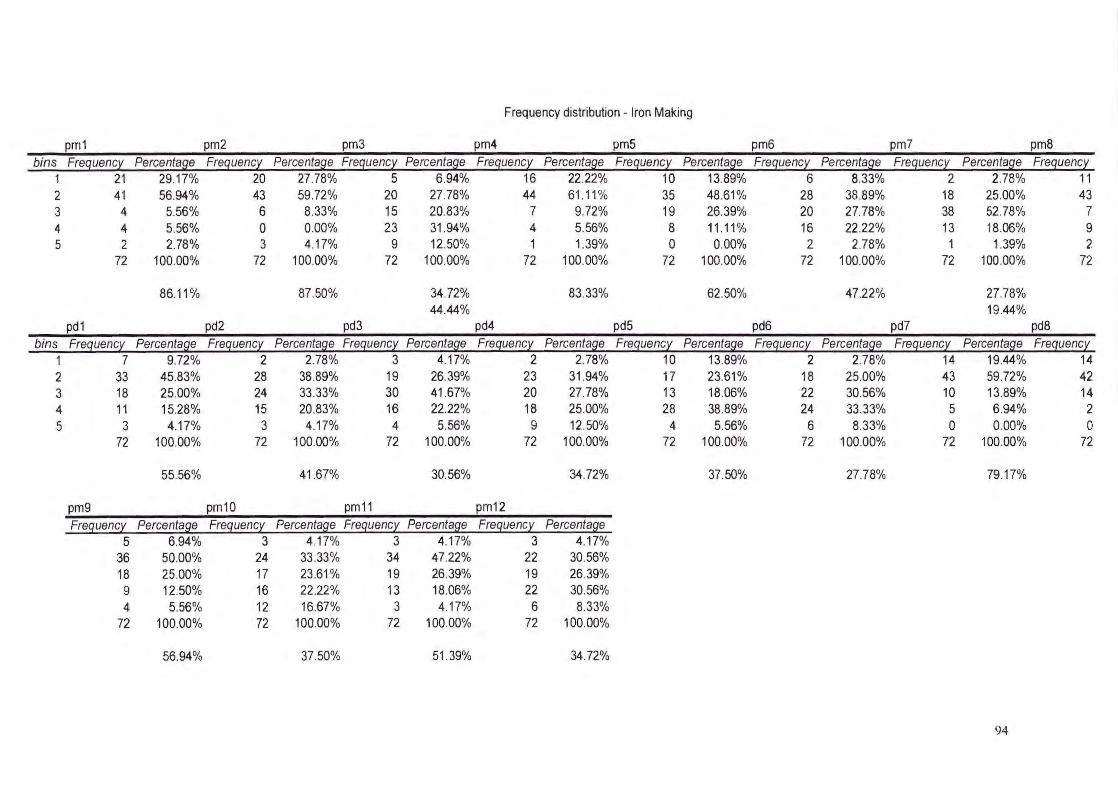
Frequency distribution- Iron Making
pm1 pm2 pm3 pm4 pm5 pm6 pm7 pm8
bins Frequency Percentage Frequency Percentage Frequency Percentage Frequency Percentage Frequency Percentage Frequency Percentage Frequency Percentage Frequency 1 21 29.17% 20 27.78% 5 6.94% 16 22.22% 10 13.89% 6 8.33% 2 2.78% 11 2 41 56.94% 43 59.72% 20 27.78% 44 61 .11% 35 48.61 % 28 38.89% 18 25.00% 43 3 4 5.56% 6 8.33% 15 20.83% 7 9.72% 19 26.39% 20 27.78% 38 52.78% 7 4 4 5.56% 0 0.00% 23 31.94% 4 5.56% 8 11 .11% 16 22.22% 13 18.06% 9 5 2 2.78% 3 4.17% 9 12.50% 1 1.39% 0 0.00% 2 2.78% 1 1.39% 2
pd1
72 100.00% 72 100.00% 72 100.00% 72 100.00% 72 100.00% 72 100.00% 72 100.00% 72
86.11 % 87.50%
pd2 pd3
34.72% 44.44%
pd4
83.33% 62.50% 47.22%
pd5 pd6 pd7
27 .78% 19.44%
pd8
bins Frequency Percentage Frequency Percentage Frequency Percentage Frequency Percentage Frequency Percentage Frequency Percentage Frequency Percentage Frequency 1 7 9.72% 2 2.78% 3 4.17% 2 2.78% 10 13.89% 2 2.78% 14 19.44% 14 2 33 45.83% 28 38.89% 19 26.39% 23 31.94% 17 23.61% 18 25.00% 43 59.72% 42 3 18 25.00% 24 33.33% 30 41 .67% 20 27.78% 13 18.06% 22 30.56% 10 13.89% 14 4 11 15.28% 15 20.83% 16 22.22% 18 25.00% 28 38.89% 24 33.33% 5 6.94% 2 5 3 4.17% 3 4.17% 4 5.56% 9 12.50% 4 5.56% 6 8.33% 0 0.00% 0
72 100.00% 72 100.00% 72 100.00% 72 100.00% 72 100.00% 72 100.00% 72 100.00% 72
55.56% 41 .67% 30.56% 34.72% 37.50% 27.78% 79.17%
pm9 pm10 pm1 1 pm12
Frequency Percentage Frequency Percentage Frequency Percentage Frequency Percentage 5 6.94% 3 4.17% 3 4.17% 3 4.17%
36 50.00% 24 33.33% 34 47.22% 22 30.56% 18 25.00% 17 23.61 % 19 26.39% 19 26.39% 9 12.50% 16 22.22% 13 18.06% 22 30.56% 4 5.56% 12 16.67% 3 4.17% 6 8.33%
72 100.00% 72 100.00% 72 100.00% 72 100.00%
56.94% 37.50% 51 .39% 34.72%
94
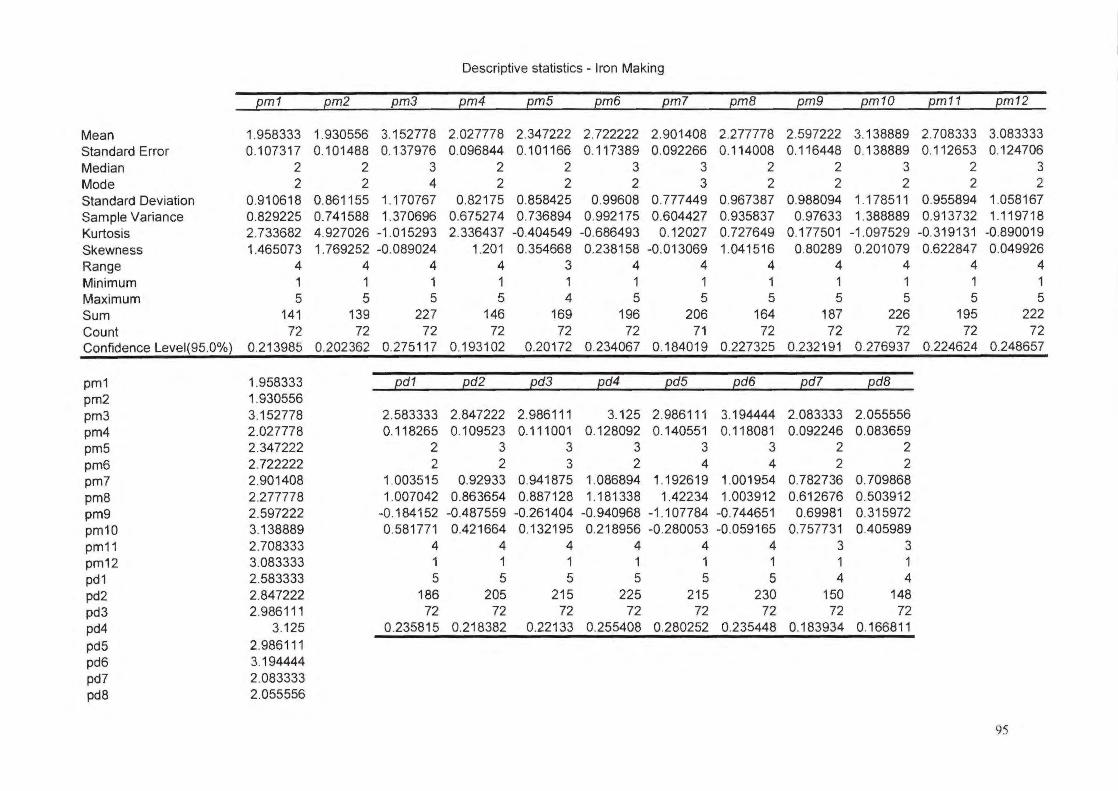
Descriptive statistics - Iron Making
pm1 pm2 pm3 pm4 pm5 pm6 pm7 pmB pm9 pm10 pm11 pm12
Mean 1.958333 1.930556 3.152778 2.027778 2.347222 2.722222 2.901408 2.277778 2.597222 3.138889 2.708333 3.083333 Standard Error 0.10731 7 0.101488 0.137976 0.096844 0.101166 0.117389 0.092266 0.114008 0.116448 0.138889 0.112653 0.124706 Median 2 2 3 2 2 3 3 2 2 3 2 3 Mode 2 2 4 2 2 2 3 2 2 2 2 2 Standard Deviation 0.910618 0.861155 1.170767 0.82175 0.858425 0.99608 0.777449 0.967387 0.988094 1.178511 0.955894 1.058167 Sample Variance 0.829225 0.741588 1.370696 0.675274 0.736894 0.992175 0.604427 0.935837 0.97633 1.388889 0.913732 1.119718 Kurtosis 2.733682 4.927026 -1.015293 2.336437 -0.404549 -0.686493 0.12027 0.727649 0.177501 -1 .097529 -0.319131 -0.890019 Skewness 1.465073 1. 769252 -0.089024 1.201 0.354668 0.238158 -0.013069 1.041516 0.80289 0.201079 0.622847 0.049926 Range 4 4 4 4 3 4 4 4 4 4 4 4 Minimum 1 1 1 1 1 1 1 1 1 1 1 1 Maximum 5 5 5 5 4 5 5 5 5 5 5 5 Sum 141 139 227 146 169 196 206 164 187 226 195 222 Count 72 72 72 72 72 72 71 72 72 72 72 72 Confidence Level(95.0%) 0.213985 0.202362 0.275117 0.193102 0.20172 0.234067 0.184019 0.227325 0.232191 0.276937 0.224624 0.248657
pm1 1.958333 pd1 pd2 pd3 pd4 pd5 pd6 pd7 pdB pm2 1.930556 pm3 3.152778 2.583333 2.847222 2.9861 11 3.125 2.986111 3. 194444 2.083333 2.055556 pm4 2.027778 0.118265 0.109523 0.111001 0.128092 0.140551 0.118081 0.092246 0.083659 pm5 2.347222 2 3 3 3 3 3 2 2 pm6 2.722222 2 2 3 2 4 4 2 2 pm7 2.901408 1.003515 0.92933 0.941875 1.086894 1.192619 1.001954 0. 782736 0. 709868 pm8 2.277778 1.007042 0.863654 0.887128 1.181338 1.42234 1.003912 0.612676 0.503912 pm9 2.597222 -0.184152 -0.487559 -0.261404 -0.940968 -1 .107784 -0.744651 0.69981 0.315972 pm10 3.138889 0.581771 0.421664 0.132195 0.218956 -0.280053 -0.059165 0.757731 0.405989 pm11 2.708333 4 4 4 4 4 4 3 3 pm12 3.083333 1 1 1 1 1 1 1 1 pd1 2.583333 5 5 5 5 5 5 4 4 pd2 2.847222 186 205 215 225 215 230 150 148 pd3 2.986111 72 72 72 72 72 72 72 72 pd4 3.125 0.235815 0.218382 0.22133 0.255408 0.280252 0.235448 0.183934 0.166811
pd5 2.986111 pd6 3.194444 pd7 2.083333 pd8 2.055556
95
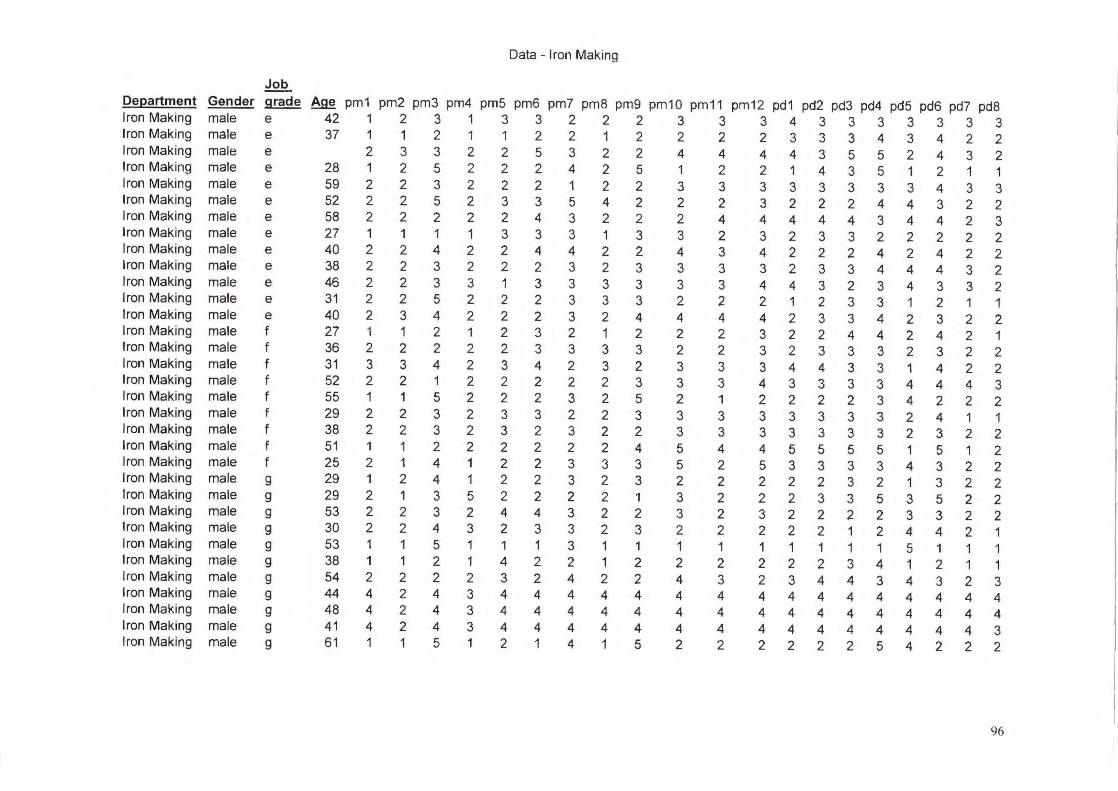
Data- Iron Making
Job
Department Gender grade Age pm1 pm2 pm3 pm4 pm5 pm6 pm7 pm8 pm9 pm10 pm11 pm12 pd1 pd2 pd3 pd4 pd5 pd6 pd7 pd8 Iron Making male 42 1 2 3 e 1 3 3 2 2 2 3 3 3 4 3 3 3 3 3 3 3 Iron Making male e 37 1 1 2 1 1 2 2 1 2 2 2 2 3 3 3 4 3 4 2 2 Iron Making male e 2 3 3 2 2 5 3 2 2 4 4 4 4 3 5 5 2 4 3 2 Iron Making male e 28 1 2 5 2 2 2 4 2 5 1 2 2 1 4 3 5 1 2 1 1 Iron Making male e 59 2 2 3 2 2 2 1 2 2 3 3 3 3 3 3 3 3 4 3 3 Iron Making male e 52 2 2 5 2 3 3 5 4 2 2 2 3 2 2 2 4 4 3 2 2 Iron Making male e 58 2 2 2 2 2 4 3 2 2 2 4 4 4 4 4 3 4 4 2 3 Iron Making male e 27 1 1 1 1 3 3 3 1 3 3 2 3 2 3 3 2 2 2 2 2 Iron Making male e 40 2 2 4 2 2 4 4 2 2 4 3 4 2 2 2 4 2 4 2 2 Iron Making male e 38 2 2 3 2 2 2 3 2 3 3 3 3 2 3 3 4 4 4 3 2 Iron Making male e 46 2 2 3 3 1 3 3 3 3 3 3 4 4 3 2 3 4 3 3 2 Iron Making male e 31 2 2 5 2 2 2 3 3 3 2 2 2 1 2 3 3 1 2 1 1 Iron Making male e 40 2 3 4 2 2 2 3 2 4 4 4 4 2 3 3 4 2 3 2 2 Iron Making male f 27 1 1 2 1 2 3 2 1 2 2 2 3 2 2 4 4 2 4 2 1 Iron Making male f 36 2 2 2 2 2 3 3 3 3 2 2 3 2 3 3 3 2 3 2 2 Iron Making male f 31 3 3 4 2 3 4 2 3 2 3 3 3 4 4 3 3 1 4 2 2 Iron Making male f 52 2 2 1 2 2 2 2 2 3 3 3 4 3 3 3 3 4 4 4 3 Iron Making male f 55 1 1 5 2 2 2 3 2 5 2 1 2 2 2 2 3 4 2 2 2 Iron Making male f 29 2 2 3 2 3 3 2 2 3 3 3 3 3 3 3 3 2 4 1 1 Iron Making male f 38 2 2 3 2 3 2 3 2 2 3 3 3 3 3 3 3 2 3 2 2 Iron Making male f 51 1 1 2 2 2 2 2 2 4 5 4 4 5 5 5 5 1 5 1 2 Iron Making male f 25 2 1 4 1 2 2 3 3 3 5 2 5 3 3 3 3 4 3 2 2 Iron Making male g 29 1 2 4 1 2 2 3 2 3 2 2 2 2 2 3 2 1 3 2 2 Iron Making male g 29 2 1 3 5 2 2 2 2 1 3 2 2 2 3 3 5 3 5 2 2 Iron Making male g 53 2 2 3 2 4 4 3 2 2 3 2 3 2 2 2 2 3 3 2 2 Iron Making male g 30 2 2 4 3 2 3 3 2 3 2 2 2 2 2 1 2 4 4 2 1 Iron Making male g 53 1 1 5 1 1 1 3 1 1 1 1 1 1 1 1 1 5 1 1 1 Iron Making male g 38 1 1 2 1 4 2 2 1 2 2 2 2 2 2 3 4 1 2 1 1 Iron Making male g 54 2 2 2 2 3 2 4 2 2 4 3 2 3 4 4 3 4 3 2 3 Iron Making male g 44 4 2 4 3 4 4 4 4 4 4 4 4 4 4 4 4 4 4 4 4 Iron Making male g 48 4 2 4 3 4 4 4 4 4 4 4 4 4 4 4 4 4 4 4 4 Iron Making male g 41 4 2 4 3 4 4 4 4 4 4 4 4 4 4 4 4 4 4 4 3 Iron Making male g 61 1 1 5 1 2 1 4 1 5 2 2 2 2 2 2 5 4 2 2 2
96
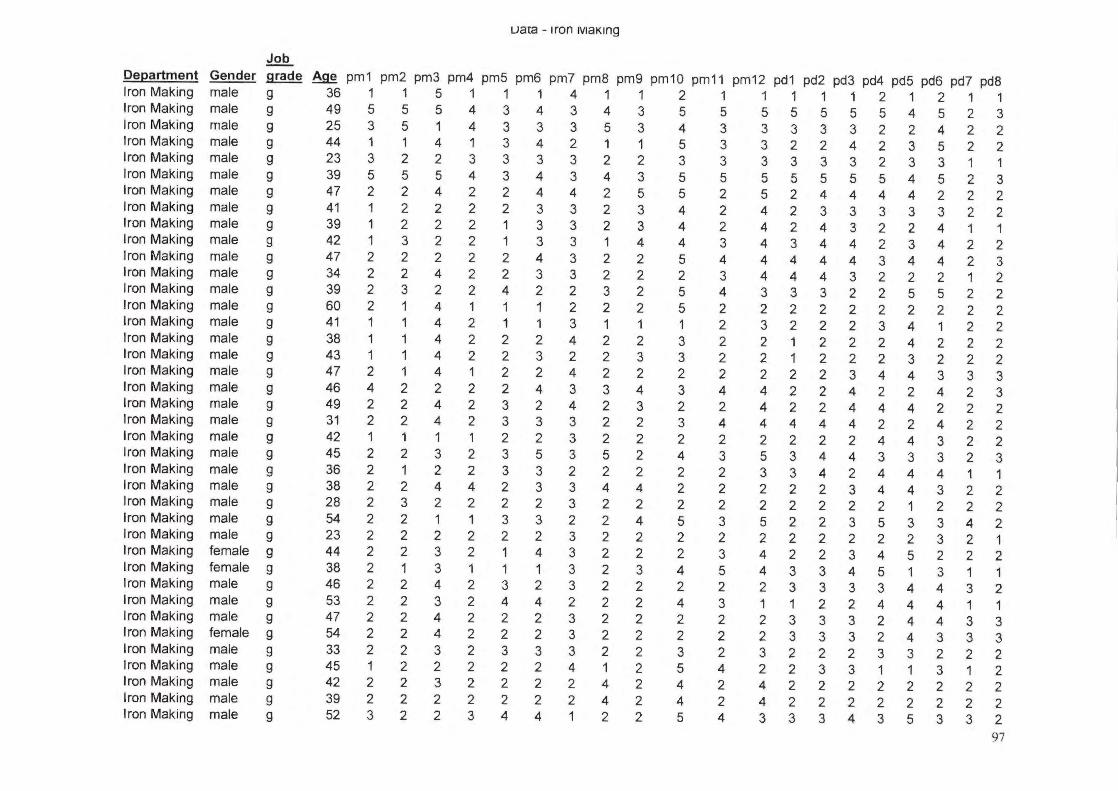
uata - 1ron IVIaKing
Job
Department Gender grade Age pm1 pm2 pm3 pm4 pm5 pm6 pm7 pm8 pm9 pm10 pm11 pm12 pd1 pd2 pd3 pd4 pd5 pd6 pd7 pd8 Iron Making male 36 1 1 5 1 g 1 1 4 1 1 2 1 1 1 1 1 2 1 2 1 1 Iron Making male g 49 5 5 5 4 3 4 3 4 3 5 5 5 5 5 5 5 4 5 2 3 Iron Making male g 25 3 5 1 4 3 3 3 5 3 4 3 3 3 3 3 2 2 4 2 2 Iron Making male g 44 1 1 4 1 3 4 2 1 1 5 3 3 2 2 4 2 3 5 2 2 Iron Making male g 23 3 2 2 3 3 3 3 2 2 3 3 3 3 3 3 2 3 3 1 1 Iron Making male g 39 5 5 5 4 3 4 3 4 3 5 5 5 5 5 5 5 4 5 2 3 Iron Making male g 47 2 2 4 2 2 4 4 2 5 5 2 5 2 4 4 4 4 2 2 2 Iron Making male g 41 1 2 2 2 2 3 3 2 3 4 2 4 2 3 3 3 3 3 2 2 Iron Making male g 39 1 2 2 2 1 3 3 2 3 4 2 4 2 4 3 2 2 4 1 1 Iron Making male g 42 1 3 2 2 1 3 3 1 4 4 3 4 3 4 4 2 3 4 2 2 Iron Making male g 47 2 2 2 2 2 4 3 2 2 5 4 4 4 4 4 3 4 4 2 3 Iron Making male g 34 2 2 4 2 2 3 3 2 2 2 3 4 4 4 3 2 2 2 1 2 Iron Making male g 39 2 3 2 2 4 2 2 3 2 5 4 3 3 3 2 2 5 5 2 2 Iron Making male g 60 2 1 4 1 1 1 2 2 2 5 2 2 2 2 2 2 2 2 2 2 Iron Making male g 41 1 1 4 2 1 1 3 1 1 1 2 3 2 2 2 3 4 1 2 2 Iron Making male g 38 1 1 4 2 2 2 4 2 2 3 2 2 1 2 2 2 4 2 2 2 Iron Making male g 43 1 1 4 2 2 3 2 2 3 3 2 2 1 2 2 2 3 2 2 2 Iron Making male g 47 2 1 4 1 2 2 4 2 2 2 2 2 2 2 3 4 4 3 3 3 Iron Making male g 46 4 2 2 2 2 4 3 3 4 3 4 4 2 2 4 2 2 4 2 3 Iron Making male g 49 2 2 4 2 3 2 4 2 3 2 2 4 2 2 4 4 4 2 2 2 Iron Making male g 31 2 2 4 2 3 3 3 2 2 3 4 4 4 4 4 2 2 4 2 2 Iron Making male g 42 1 1 1 1 2 2 3 2 2 2 2 2 2 2 2 4 4 3 2 2 Iron Making male g 45 2 2 3 2 3 5 3 5 2 4 3 5 3 4 4 3 3 3 2 3 Iron Making male g 36 2 1 2 2 3 3 2 2 2 2 2 3 3 4 2 4 4 4 1 1 Iron Making male g 38 2 2 4 4 2 3 3 4 4 2 2 2 2 2 3 4 4 3 2 2 Iron Making male g 28 2 3 2 2 2 2 3 2 2 2 2 2 2 2 2 2 1 2 2 2 Iron Making male g 54 2 2 1 1 3 3 2 2 4 5 3 5 2 2 3 5 3 3 4 2 Iron Making male g 23 2 2 2 2 2 2 3 2 2 2 2 2 2 2 2 2 2 3 2 1 Iron Making female g 44 2 2 3 2 1 4 3 2 2 2 3 4 2 2 3 4 5 2 2 2 Iron Making female g 38 2 1 3 1 1 1 3 2 3 4 5 4 3 3 4 5 1 3 1 1 Iron Making male g 46 2 2 4 2 3 2 3 2 2 2 2 2 3 3 3 3 4 4 3 2 Iron Making male g 53 2 2 3 2 4 4 2 2 2 4 3 1 1 2 2 4 4 4 1 1 Iron Making male g 47 2 2 4 2 2 2 3 2 2 2 2 2 3 3 3 2 4 4 3 3 Iron Making female g 54 2 2 4 2 2 2 3 2 2 2 2 2 3 3 3 2 4 3 3 3 Iron Making male g 33 2 2 3 2 3 3 3 2 2 3 2 3 2 2 2 3 3 2 2 2 Iron Making male g 45 1 2 2 2 2 2 4 1 2 5 4 2 2 3 3 1 1 3 1 2 Iron Making male g 42 2 2 3 2 2 2 2 4 2 4 2 4 2 2 2 2 2 2 2 2 Iron Making male g 39 2 2 2 2 2 2 2 4 2 4 2 4 2 2 2 2 2 2 2 2 Iron Making male g 52 3 2 2 3 4 4 1 2 2 5 4 3 3 3 4 3 5 3 3 2
97

86
w~
00~
66
~NI>t'vW 133.1S
3 3~nX3NN~
eleo
s::ms!lels aA!ld!J~sao
UO!lnq!JlS!P A~uanbaJ.::l
xapuJ

Frequency distribution- Steel Making
pm1 pm2 pm3 pm4 pm5 pm6 pm7 pm8 bins Frequency Percentage Frequency Percentage Frequency Percentage Frequency Percentage Frequency Percentage Frequency Percentage Frequency Percentage Frequency
1 12 30.00% 9 22.50% 4 10.00% 9 22.50% 3 7.50% 0 0.00% 0 0.00% 11 2 23 57.50% 25 62.50% 5 12.50% 23 57.50% 26 65.00% 22 55.00% 6 15.00% 21 3 4 10.00% 4 10.00% 8 20.00% 5 12.50% 8 20.00% 13 32.50% 26 65.00% 3 4 1 2.50% 2 5.00% 16 40.00% 3 7.50% 2 5.00% 3 7.50% 7 17.50% 4 5 0 0.00% 0 0.00% 7 17.50% 0 0.00% 1 2.50% 2 5.00% 1 2.50% 1
pd1
40 100.00% 40 100.00% 40 100.00% 40 100.00% 40 100.00% 40 100.00% 40 100.00% 40
87.50% 85.00%
pd2 pd3
22 .50% 57.50%
pd4
80.00% 72.50% 55.00%
pd5 pd6 pd7
15.00% 20.00%
pd8
bins Frequency Percenta~e Frequency Percenta~e Frequency Percenta~e Frequency Percenta~e Frequency Percenta~e Frequency Percenta~e Frequency Percenta~e Frequency 1 3 7.50% 1 2.50% 0 0.00% 1 2.50% 2 5.00% 0 0.00% 12 30.00% 9 2 19 47.50% 17 42.50% 11 27.50% 10 25.00% 17 42.50% 13 32.50% 26 65.00% 24 3 9 22.50% 15 37.50% 20 50.00% 7 17.50% 8 20.00% 11 27.50% 2 5.00% 7 4 9 22.50% 5 12.50% 7 17.50% 13 32.50% 10 25.00% 9 22.50% 0 0.00% 0
5 0 0.00% 2 5.00% 2 5.00% 9 22.50% 3 7.50% 7 17.50% 0 0.00% 0 40 100.00% 40 100.00% 40 100.00% 40 100.00% 40 100.00% 40 100.00% 40 100.00% 40
55.00% 45.00% 27.50% 27.50% 47.50% 32.50% 95.00%
pm9 pm10 pm11 pm12
Frequency Percentage Frequency Percentage Frequency Percentage Frequency Percentage 4 10.00% 1 2.50% 1 2.50% 5 12.50%
24 60.00% 14 35.00% 18 45.00% 11 27.50% 7 17.50% 11 27.50% 16 40.00% 12 30.00% 5 12.50% 9 22.50% 4 10.00% 10 25.00% 0 0.00% 5 12.50% 1 2.50% 2 5.00%
40 100.00% 40 100.00% 40 100.00% 40 100.00%
70.00% 37.50% 47.50% 40.00%
99
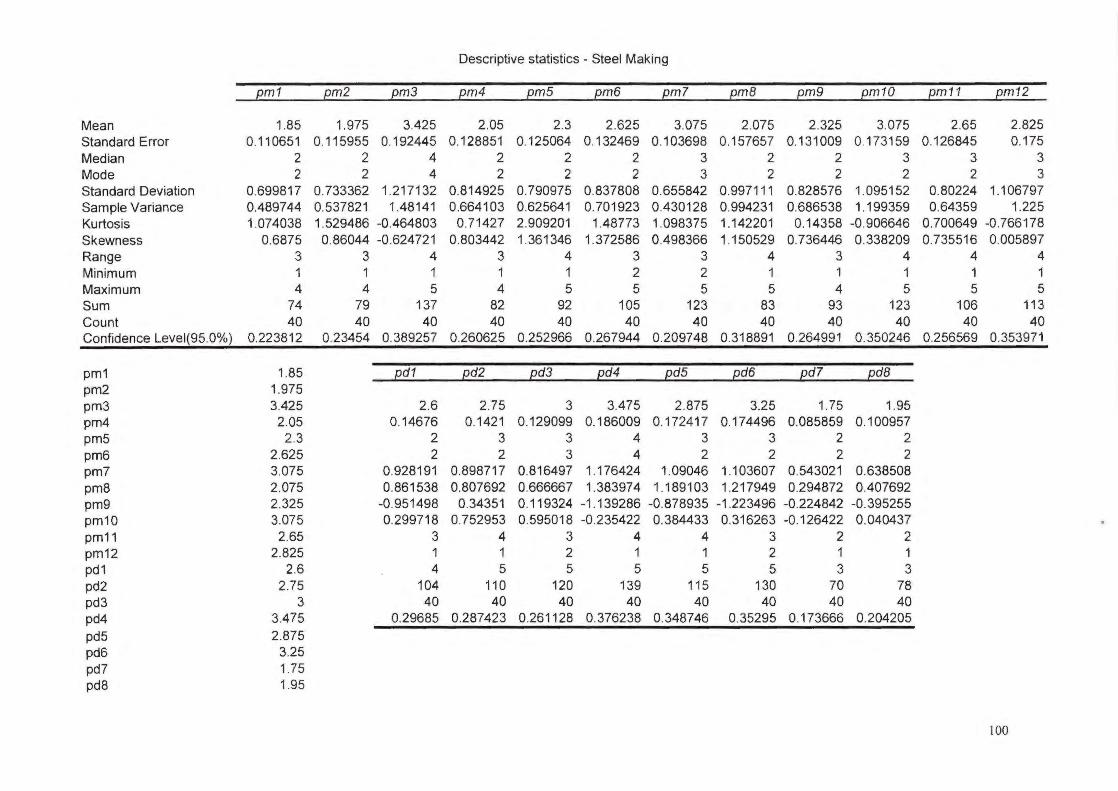
Descriptive statistics- Steel Making
pm1 pm2 pm3 pm4 pm5 pm6 pm7 pmB pm9 pm10 pm11 pm12
Mean 1.85 1.975 3.425 2.05 2.3 2.625 3.075 2.075 2.325 3.075 2.65 2.825 Standard Error 0.110651 0.115955 0.192445 0.128851 0.125064 0.132469 0.103698 0.157657 0.131009 0.173159 0.126845 0.175 Median 2 2 4 2 2 2 3 2 2 3 3 3 Mode 2 2 4 2 2 2 3 2 2 2 2 3 Standard Deviation 0.699817 0.733362 1.217132 0.814925 0.790975 0.837808 0.655842 0.997111 0.828576 1.095152 0.80224 1.106797 Sample Variance 0.489744 0.537821 1.48141 0.664103 0.625641 0.701923 0.430128 0.994231 0.686538 1.199359 0.64359 1.225 Kurtosis 1.074038 1.529486 -0.464803 0.71427 2.909201 1.48773 1.098375 1.142201 0.14358 -0.906646 0.700649 -0.766178 Skewness 0.6875 0.86044 -0 .624721 0.803442 1.361346 1.372586 0.498366 1.150529 0.736446 0.338209 0.735516 0.005897 Range 3 3 4 3 4 3 3 4 3 4 4 4 Minimum 1 1 1 1 1 2 2 1 1 1 1 1 Maximum 4 4 5 4 5 5 5 5 4 5 5 5 Sum 74 79 137 82 92 105 123 83 93 123 106 113 Count 40 40 40 40 40 40 40 40 40 40 40 40 Confidence Level(95.0%) 0.223812 0.23454 0.389257 0.260625 0.252966 0.267944 0.209748 0.318891 0.264991 0.350246 0.256569 0.353971
pm1 1.85 pd1 pd2 pd3 pd4 pd5 pd6 pd7 pdB pm2 1.975 pm3 3.425 2.6 2.75 3 3.475 2.875 3.25 1.75 1.95 pm4 2.05 0.14676 0.1421 0.129099 0.186009 0.172417 0.174496 0.085859 0.100957 pm5 2.3 2 3 3 4 3 3 2 2 pm6 2.625 2 2 3 4 2 2 2 2 pm7 3.075 0.928191 0.898717 0.816497 1.176424 1.09046 1.103607 0.543021 0.638508 pm8 2.075 0.861538 0.807692 0.666667 1.383974 1.189103 1.217949 0.294872 0.407692 pm9 2.325 -0.951498 0.34351 0.119324 -1.139286 -0.878935 -1 .223496 -0.224842 -0.395255 pm10 3.075 0.299718 0.752953 0.595018 -0.235422 0.384433 0.316263 -0.126422 0.040437 pm11 2.65 3 4 3 4 4 3 2 2 pm12 2.825 1 1 2 1 1 2 1 1 pd1 2.6 4 5 5 5 5 5 3 3 pd2 2.75 104 110 120 139 115 130 70 78 pd3 3 40 40 40 40 40 40 40 40 pd4 3.475 0.29685 0.287423 0.261128 0.376238 0.348746 0.35295 0.173666 0.204205
pd5 2.875 pd6 3.25 pd7 1.75 pd8 1.95
100
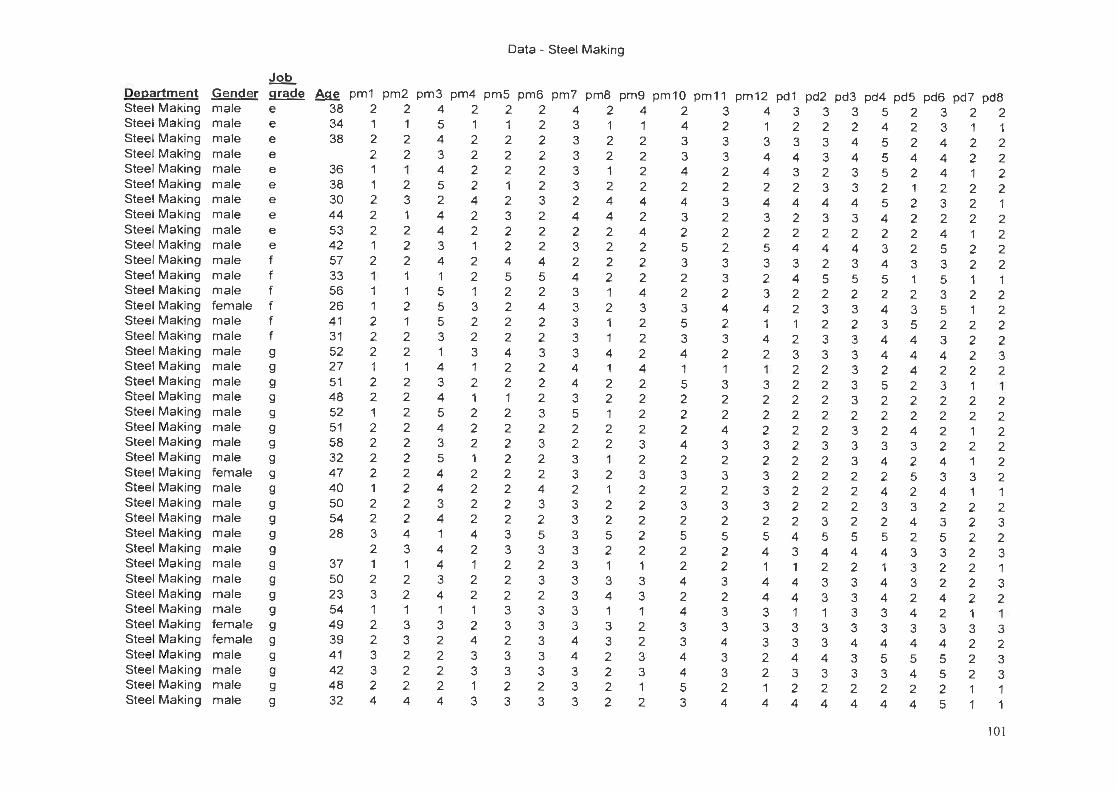
Department Steel Making Steel Making Steel Making Steel Making Steel Making Steel Making Steel Making Steel Making Steel Making Steel Making Steel Making Steel Making Steel Making Steel Making Steel Making Steel Making Steel Making Steel Making Steel Making Steel Making Steel Making Steel Making Steel Making Steel Making Steel Making Steel Making Steel Making Steel Making Steel Making Steel Making Steel Making Steel Making Steel Making Steel Making Steel Making Steel Making Steel Making Steel Making Steel Making Steel Making
Data - Steel Making
Job
Gender grade Age pm1 pm2 pm3 pm4 pm5 pm6 pm7 pm8 pm9 pm1 0 pm11 pm12 pd1 pd2 pd3 pd4 pd5 pd6 pd7 pd8 male e 38
34 38
male e male e male e male e ma le e male e male e ma le e male e male f male f male f female f male f male f male g male g male g male g male g male g male g male g female g m ale g male g male g male g male g male g m ale g male g male g female g female g male g m ale g male g male g
36 38 30 44 53 42 57 33 56 26 41 31 52 27 51 48 52 51 58 32 47 40 50 54 28
37 50 23 54 49 39 41 42 48 32
2 1 2 2 1 1 2 2 2 1 2
1 2 2 2 1 2 2 1 2 2 2 2 1 2 2 3 2 1 2 3 1 2 2 3 3 2 4
2
2 2 1 2 3 1 2 2 2 1 1 2 1 2 2 1 2 2 2 2 2 2 2 2 2 2 4 3 1 2 2 1 3 3 2 2 2 4
4 5 4 3 4 5 2 4 4 3 4 1 5 5 5 3 1 4 3 4 5 4 3 5 4 4 3 4 1 4 4 3 4 1 3 2 2 2 2 4
2 1 2 2 2 2 4 2 2 1 2 2
3 2 2 3 1 2 1 2 2 2
2 2 2 2 4 2 1 2 2 1 2 4 3 3 1 3
2 1 2 2 2 1 2 3 2 2 4 5 2 2 2 2 4 2 2 1 2 2 2 2 2 2 2 2 3 3 2 2 2 3 3 2 3 3 2 3
2 2 2 2 2 2 3 2 2 2 4 5 2 4 2 2 3 2 2 2 3 2 3 2 2 4 3 2 5 3 2 3 2 3 3 3 3 3 2 3
4 3 3 3 3 3 2 4 2 3 2 4 3 3 3 3 3 4 4 3 5 2 2 3 3 2 3 3 3 3 3 3 3 3 3 4 4 3 3 3
2 1 2 2
2 4 4 2 2 2 2 1 2 1 1 4 1 2 2 1 2 2 1 2 1 2 2 5 2 1 3 4 1 3 3 2 2 2 2
4 1 2 2 2 2 4 2 4 2 2 2 4 3 2 2 2 4 2 2 2 2 3 2 3 2 2 2 2 2 1 3 3
2 2 3 3 1 2
2 4 3 3 4 2 4 3 2 5 3 2 2 3 5 3 4 1 5 2 2 2 4 2 3 2 3 2 5 2 2 4 2 4 3 3 4 4 5 3
3 2 3 3 2 2 3 2 2 2 3 3 2 4 2 3 2 1 3 2 2 4 3 2 3 2 3 2 5 2 2 3 2 3 3 4 3 3 2 4
4 1 3 4 4 2 4 3 2 5 3 2 3 4 1 4 2 1 3 2 2 2 3 2 3 3 3 2 5 4 1 4 4 3 3 3 2 2 1 4
3 2 3 4 3 2 4 2 2 4 3 4 2 2 1 2 3 2 2 2 2 2 2 2 2 2 2 2 4 3
4 4 1 3 3 4 3 2 4
3 3 2 2 3 4 3 4 2 3 3 3 4 4 3 3 2 2 4 4 2 3 5 5 2 2 3 3 2 2 3 3 3 3 2 3 2 3 2 3 2 2 2 3 3 3 2 3 2 2 2 2 2 2 3 2 5 5 4 4 2 2 3 3 3 3 1 3 3 3 3 4 4 3 3 3 2 2 4 4
5 2 3 2 4 2 3 1 5 2 4 2 5 4 4 2 5 2 4 1 2 1 2 2 5 2 3 2 4 2 2 2 2 2 4 1 3 2 5 2 4 3 3 2 5 1 5 1 2 2 3 2 4 3 5 1 3 5 2 2 4 4 3 2 4 4 4 2 2 4 2 2 5 2 3 1 2 2 2 2 2 2 2 2 2 4 2 1 3 3 2 2 4 2 4 1 2 5 3 3 4 2 4 1 3 3 2 2 2 4 3 2 5 2 5 2 4 3 3 2 1 3 2 2 4 3 2 2 4 2 4 2 3 4 2 1 3 3 3 3 4 4 4 2 5 5 5 2 3 4 5 2 2 2 2 1 4 4 5 1
2
2 2 2 2
2 2 2 2 1 2 2 2 2 3 2 1 2 2 2 2 2 2 1 2 3 2 3 1 3 2 1 3 2 3 3 1
101
Index
Frequency distribution
Descriptive statistics
Data
ANNEXURE F
ROLLING
Page
103
104
105-106
102
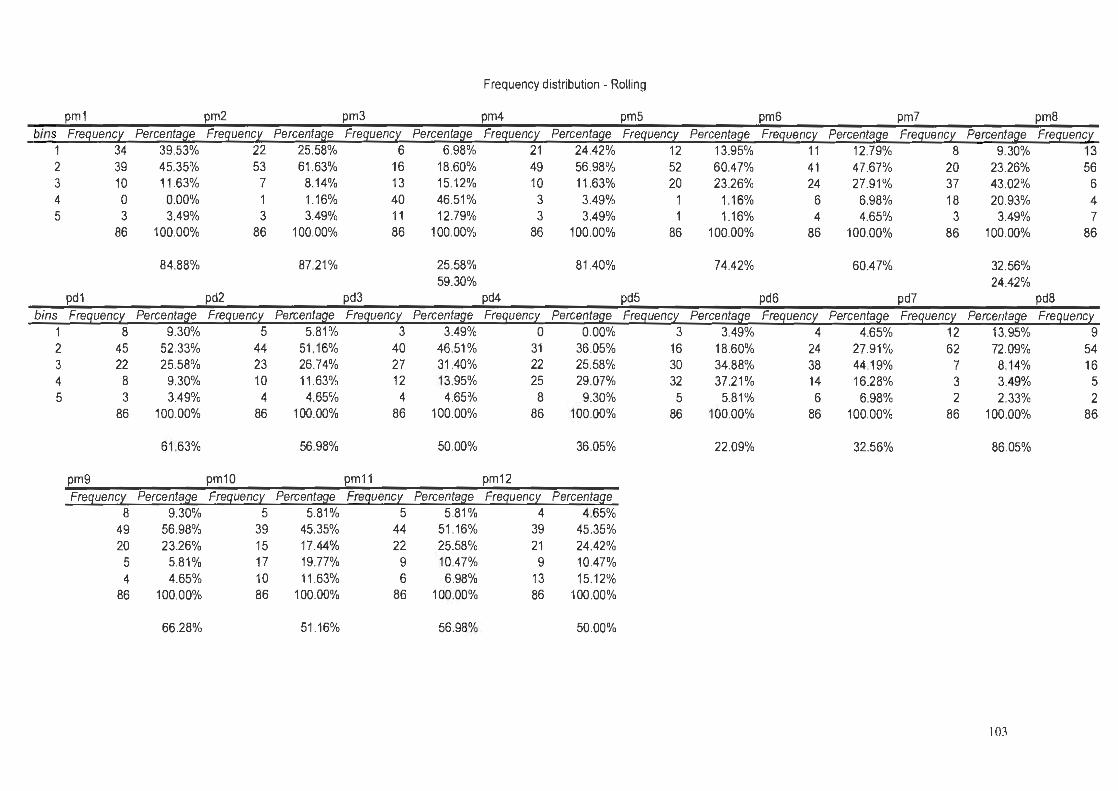
Frequency distribution - Rolling
pm1 pm2 pm3 pm4 pm5 pm6 pm7 pm8
bins Frequency Percentage Frequency Percentage Frequency Percentage Frequency Percentage Frequency Percentage Frequency Percentage Frequency Percentage Frequency 1 34 39.53% 22 25.58% 6 6.98% 21 24.42% 12 13.95% 11 12.79% 8 9.30% 13 2 39 45.35% 53 61 .63% 16 18.60% 49 56.98% 52 60.47% 41 47.67% 20 23.26% 56 3 10 11 .63% 7 8.14% 13 15.12% 10 11 .63% 20 23.26% 24 27.91% 37 43.02% 6 4 0 0.00% 1 1.16% 40 46.51 % 3 3.49% 1 1.16% 6 6.98% 18 20.93% 4 5 3 3.49% 3 3.49% 11 12.79% 3 3.49% 1 1.16% 4 4.65% 3 3.49% 7
pd1
86 100.00% 86 100.00% 86 100.00% 86 100.00% 86 100.00% 86 100.00% 86 100.00% 86
84.88% 87.21%
pd2 pd3
25.58% 59.30%
pd4
81.40% 74.42% 60.47%
pd5 pd6 pd7
32.56% 24.42%
pd8 bins Frequency Percentafl.e Frequency Percentafl.e Frequency Percentafl.e Frequency Percentafl.e Frequency Percentafl.e Frequency Percentafl.e Frequency Percentafl.e Frequency
1 8 9.30% 5 5.81% 3 3.49% 0 0.00% 3 3.49% 4 4.65% 12 13.95% 9 2 45 52.33% 44 51 .16% 40 46.51% 31 36.05% 16 18.60% 24 27.91% 62 72.09% 54 3 22 25.58% 23 26.74% 27 31.40% 22 25.58% 30 34.88% 38 44.19% 7 8.1 4% 16 4 8 9.30% 10 11.63% 12 13.95% 25 29.07% 32 37.21% 14 16.28% 3 3.49% 5 5 3 3.49% 4 4.65% 4 4.65% 8 9.30% 5 5.81% 6 6.98% 2 2.33% 2
86 100.00% 86 100.00% 86 100.00% 86 100.00% 86 100.00% 86 100.00% 86 100.00% 86
61 .63% 56.98% 50.00% 36.05% 22.09% 32.56% 86.05%
pm9 pm10 pm11 pm12
Frequency PercenfarJ.e Frequency PercenfarJ.e Frequency Percentafl.e Frequency Percentafl.e 8 9.30% 5 5.81% 5 5.81% 4 4.65%
49 56.98% 39 45.35% 44 51 .16% 39 45.35% 20 23.26% 15 17.44% 22 25.58% 21 24.42% 5 5.81% 17 19.77% 9 10.47% 9 10.47% 4 4.65% 10 11 .63% 6 6.98% 13 15.12%
86 100.00% 86 100.00% 86 100.00% 86 100.00%
66.28% 51 .16% 56.98% 50.00%
103
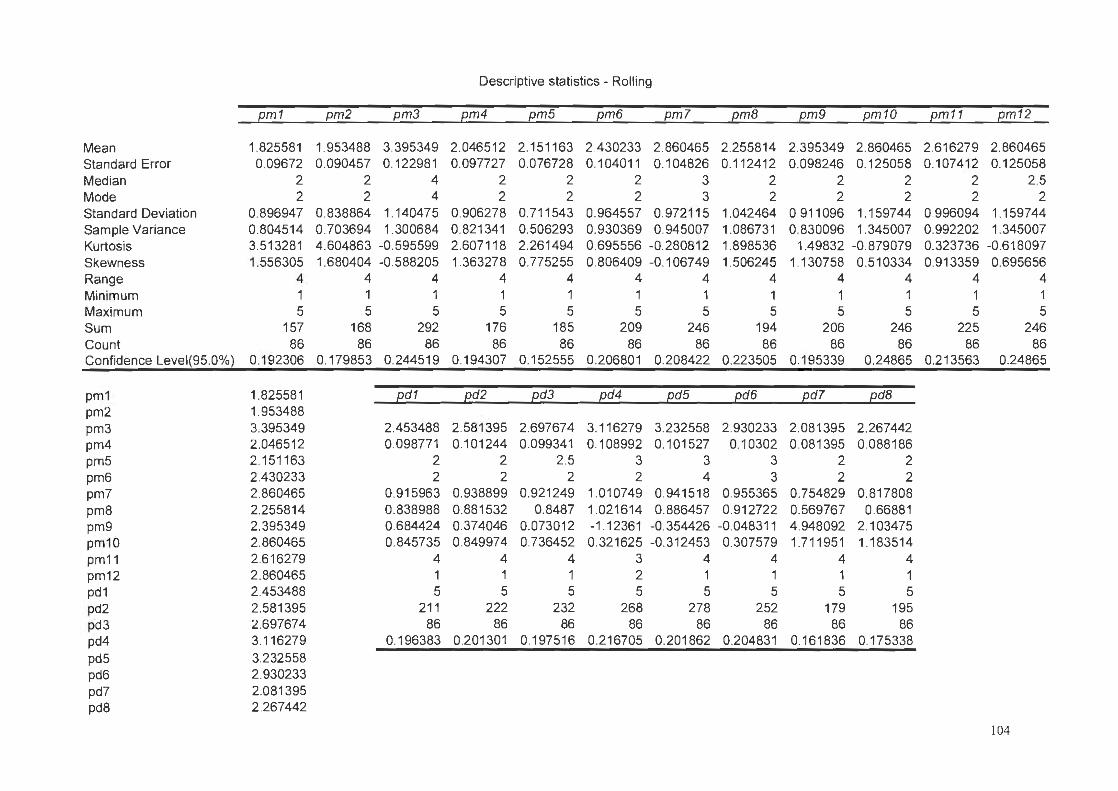
Descriptive statistics - Rolling
pm1 pm2 pm3 pm4 pm5 pm6 pm7 pmB pm9 pm10 pm11 pm12
Mean 1.825581 1.953488 3.395349 2.046512 2.151163 2.430233 2.860465 2.255814 2.395349 2.860465 2.616279 2.860465 Standard Error 0.09672 0.090457 0.122981 0.097727 0.076728 0.104011 0.104826 0.112412 0.098246 0.125058 0.107 412 0.125058 Median 2 2 4 2 2 2 3 2 2 2 2 2.5 Mode 2 2 4 2 2 2 3 2 2 2 2 2 Standard Deviation 0.896947 0.838864 1.140475 0.906278 0.711543 0.964557 0.972115 1.042464 0.911096 1.159744 0.996094 1.159744 Sample Variance 0.804514 0.703694 1.300684 0.821341 0.506293 0.930369 0.945007 1.086731 0.830096 1.345007 0.992202 1.345007 Kurtosis 3.513281 4.604863 -0.595599 2.607118 2.261494 0.695556 -0.280812 1.898536 1.49832 -0 .879079 0.323736 -0.618097 Skewness 1.556305 1.680404 -0.588205 1.363278 0.775255 0.806409 -0.106749 1.506245 1.130758 0.510334 0.913359 0.695656 Range 4 4 4 4 4 4 4 4 4 4 4 4 Minimum 1 1 1 1 1 1 1 1 1 1 1 1 Maximum 5 5 5 5 5 5 5 5 5 5 5 5 Sum 157 168 292 176 185 209 246 194 206 246 225 246 Count 86 86 86 86 86 86 86 86 86 86 86 86 Confidence Level(95.0%) 0.192306 0.179853 0.244519 0.194307 0.152555 0.206801 0.208422 0.223505 0.195339 0.24865 0.213563 0.24865
pm1 1.825581 pd1 pd2 pd3 pd4 pd5 pd6 pd7 pdB pm2 1.953488 pm3 3.395349 2.453488 2.581395 2.697674 3.116279 3.232558 2.930233 2.081395 2.267442 pm4 2.046512 0.098771 0.101244 0.099341 0.108992 0.101527 0.10302 0.081395 0.088186 pm5 2.151163 2 2 2.5 3 3 3 2 2 pm6 2.430233 2 2 2 2 4 3 2 2 pm7 2.860465 0.915963 0.938899 0.921249 1.010749 0.941518 0.955365 0.754829 0.817808 pm8 2.255814 0.838988 0.881532 0.8487 1.021614 0.886457 0.912722 0.569767 0.66881 pm9 2.395349 0.684424 0.374046 0.073012 -1.12361 -0.354426 -0.048311 4.948092 2.103475 pm10 2.860465 0.845735 0.849974 0.736452 0.321625 -0.312453 0.307579 1.711951 1.183514 pm11 2.616279 4 4 4 3 4 4 4 4 pm12 2.860465 1 1 1 2 1 1 1 1 pd1 2.453488 5 5 5 5 5 5 5 5 pd2 2.581395 211 222 232 268 278 252 179 195 pd3 2.697674 86 86 86 86 86 86 86 86 pd4 3.116279 0.196383 0.201301 0.197516 0.216705 0.201862 0.204831 0.1 61836 0.175338 pd5 3.232558 pd6 2.930233 pd7 2.081395 pd8 2.267442
104
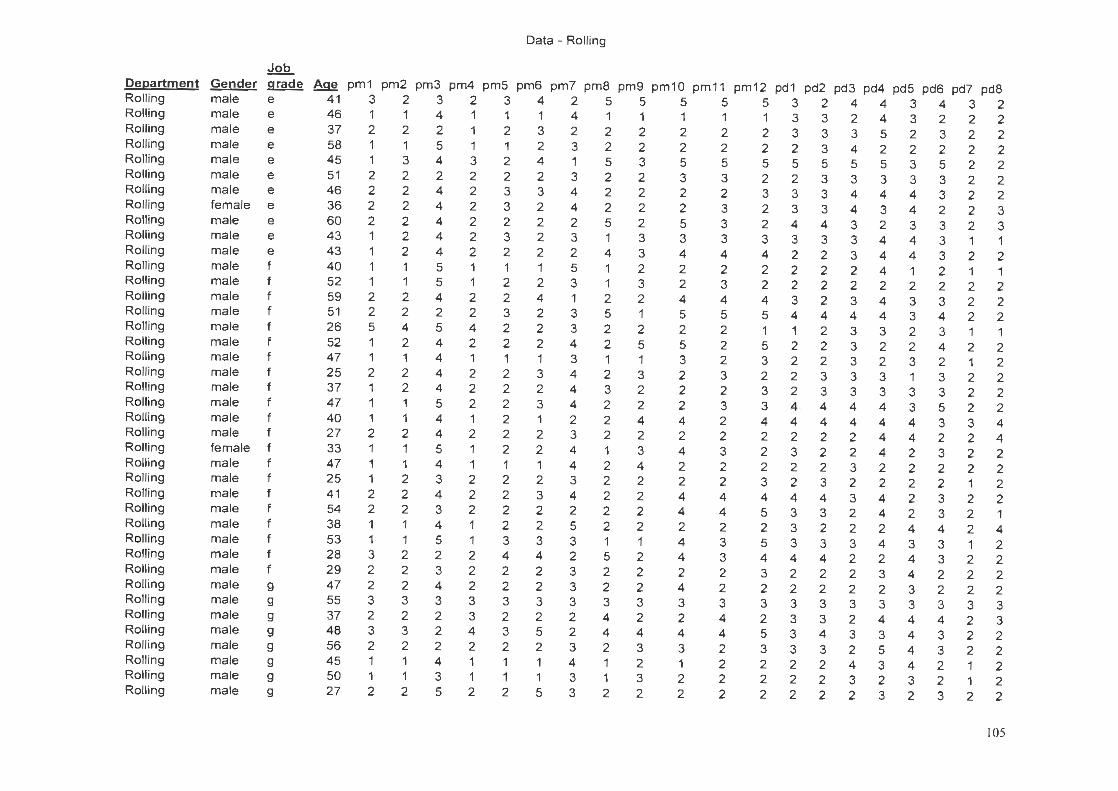
Department Rolling Rolling Rolling Rolling Rolling Rolling Rolling Rolling Rolling Rolling Rolling Rolling Rolling Rolling Rolling Rolling Rolling Rolling Rolling Rolling Rolling Rolling Rolling Rolling Rolling Rolling Rolling Rolling Rolling Rolling Rolling Rolling Rolling Rolling Rolling Rolling Rolling Rolling Rolling Rolling
Job Gender grade male e male e male e male e male e male e male e female e male e male e male e male f male f male f male f male f male f male f male f male f male f male f male f female f male f male f male f male f male f male f male f male f male g male g male g male g male g male g male g male g
Data - Rolling
Age pm1 pm2 pm3 pm4 pm5 pm6 pm7 pm8 pm9 pm10 pm11 pm12 pd1 pd2 pd3 pd4 pd5 pd6 pd7 pd8 41 3 2 3 2 3 4 2 5 5 5 5 5 3 2 4 4 3 4 3 2 46 1 1 4 1 1 1 4 1 1 1 1 1 3 3 2 4 3 2 2 2 37 2 2 2 1 2 3 2 2 2 2 2 2 3 3 3 5 2 3 2 2 58 1 1 5 1 1 2 3 2 2 2 2 2 2 3 4 2 2 2 2 2 45 1 3 4 3 2 4 1 5 3 5 5 5 5 5 5 5 3 5 2 2 51 2 2 2 2 2 2 3 2 2 3 3 2 2 3 3 3 3 3 2 2 46 2 2 4 2 3 3 4 2 2 2 2 3 3 3 4 4 4 3 2 2 36 2 2 4 2 3 2 4 2 2 2 3 2 3 3 4 3 4 2 2 3 60 2 2 4 2 2 2 2 5 2 5 3 2 4 4 3 2 3 3 2 3 43 1 2 4 2 3 2 3 1 3 3 3 3 3 3 3 4 4 3 1 1 43 1 2 4 2 2 2 2 4 3 4 4 4 2 2 3 4 4 3 2 2 40 1 1 5 1 1 1 5 1 2 2 2 2 2 2 2 4 1 2 1 1 52 1 1 5 1 2 2 3 1 3 2 3 2 2 2 2 2 2 2 2 2 59 2 2 4 2 2 4 1 2 2 4 4 4 3 2 3 4 3 3 2 2 51 2 2 2 2 3 2 3 5 1 5 5 5 4 4 4 4 3 4 2 2 26 5 4 5 4 2 2 3 2 2 2 2 1 1 2 3 3 2 3 1 1 52 1 2 4 2 2 2 4 2 5 5 2 5 2 2 3 2 2 4 2 2 47 1 1 4 1 1 1 3 1 1 3 2 3 2 2 3 2 3 2 1 2 25 2 2 4 2 2 3 4 2 3 2 3 2 2 3 3 3 1 3 2 2 37 1 2 4 2 2 2 4 3 2 2 2 3 2 3 3 3 3 3 2 2 47 1 1 5 2 2 3 4 2 2 2 3 3 4 4 4 4 3 5 2 2 40 1 1 4 1 2 1 2 2 4 4 2 4 4 4 4 4 4 3 3 4 27 2 2 4 2 2 2 3 2 2 2 2 2 2 2 2 4 4 2 2 4 33 1 1 5 1 2 2 4 1 3 4 3 2 3 2 2 4 2 3 2 2 47 1 1 4 1 1 1 4 2 4 2 2 2 2 2 3 2 2 2 2 2 25 1 2 3 2 2 2 3 2 2 2 2 3 2 3 2 2 2 2 1 2 41 2 2 4 2 2 3 4 2 2 4 4 4 4 4 3 4 2 3 2 2 54 2 2 3 2 2 2 2 2 2 4 4 5 3 3 2 4 2 3 2 1 38 1 1 4 1 2 2 5 2 2 2 2 2 3 2 2 2 4 4 2 4 53 1 1 5 1 3 3 3 1 1 4 3 5 3 3 3 4 3 3 1 2 28 3 2 2 2 4 4 2 5 2 4 3 4 4 4 2 2 4 3 2 2 29 2 2 3 2 2 2 3 2 2 2 2 3 2 2 2 3 4 2 2 2 47 2 2 4 2 2 2 3 2 2 4 2 2 2 2 2 2 3 2 2 2 55 3 3 3 3 3 3 3 3 3 3 3 3 3 3 3 3 3 3 3 3 37 2 2 2 3 2 2 2 4 2 2 4 2 3 3 2 4 4 4 2 3 48 3 3 2 4 3 5 2 4 4 4 4 5 3 4 3 3 4 3 2 2 56 2 2 2 2 2 2 3 2 3 3 2 3 3 3 2 5 4 3 2 2 45 1 1 4 1 1 1 4 1 2 1 2 2 2 2 4 3 4 2 1 2 50 1 1 3 1 1 1 3 1 3 2 2 2 2 2 3 2 3 2 1 2 27 2 2 5 2 2 5 3 2 2 2 2 2 2 2 2 3 2 3 2 2
105
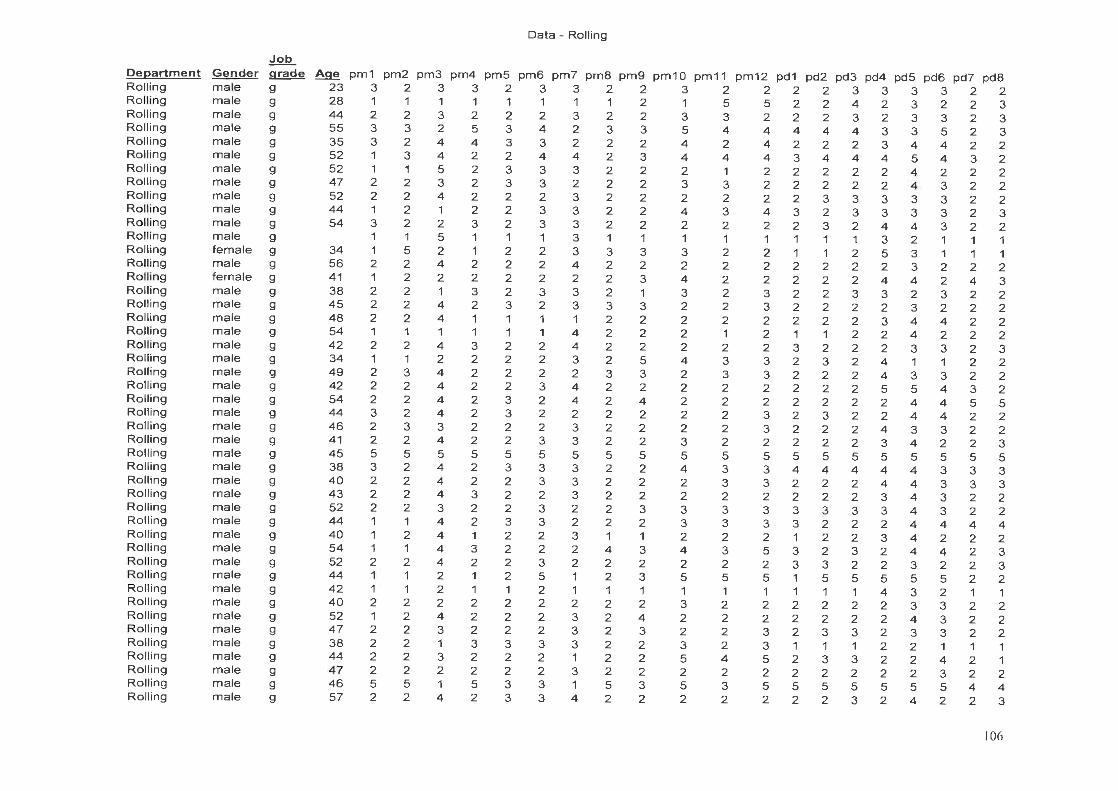
Data - Rolling
Job Deeartment Gender grade Age p m1 p m 2 pm3 pm4 pm5 pm6 pm7 pm8 pm9 pm1 0 p m 11 pm12 pd1 pd2 pd3 pd4 pd5 pd6 pd7 pd8 Rolling male g 23 3 2 3 3 2 3 3 2 2 3 2 2 2 2 3 3 3 3 2 2 R o lling m a le g 28 1 1 1 1 1 1 1 1 2 1 5 5 2 2 4 2 3 2 2 3 Ro lling m a le g 44 2 2 3 2 2 2 3 2 2 3 3 2 2 2 3 2 3 3 2 3 Rolling m a le g 55 3 3 2 5 3 4 2 3 3 5 4 4 4 4 4 3 3 5 2 3 Rolling m a le g 35 3 2 4 4 3 3 2 2 2 4 2 4 2 2 2 3 4 4 2 2 Ro lling male g 52 1 3 4 2 2 4 4 2 3 4 4 4 3 4 4 4 5 4 3 2 Rolling m a le g 52 1 1 5 2 3 3 3 2 2 2 1 2 2 2 2 2 4 2 2 2 Rolling m a le g 47 2 2 3 2 3 3 2 2 2 3 3 2 2 2 2 2 4 3 2 2 Ro lling m a le g 52 2 2 4 2 2 2 3 2 2 2 2 2 2 3 3 3 3 3 2 2 Ro lling m ale g 44 1 2 1 2 2 3 3 2 2 4 3 4 3 2 3 3 3 3 2 3 Ro lling m a le g 54 3 2 2 3 2 3 3 2 2 2 2 2 2 3 2 4 4 3 2 2 Ro ll ing m a le g 1 1 5 1 1 1 3 1 1 1 1 1 1 1 1 3 2 1 1 1 Ro ll ing female g 34 1 5 2 1 2 2 3 3 3 3 2 2 1 1 2 5 3 1 1 1 Ro lling male g 56 2 2 4 2 2 2 4 2 2 2 2 2 2 2 2 2 3 2 2 2 Ro lling female g 41 1 2 2 2 2 2 2 2 3 4 2 2 2 2 2 4 4 2 4 3 Ro ll ing m a le g 38 2 2 1 3 2 3 3 2 1 3 2 3 2 2 3 3 2 3 2 2 Ro lling m a le g 4 5 2 2 4 2 3 2 3 3 3 2 2 3 2 2 2 2 3 2 2 2 Rolling m a le g 4 8 2 2 4 1 1 1 1 2 2 2 2 2 2 2 2 3 4 4 2 2 Roll ing m a le g 54 1 1 1 1 1 1 4 2 2 2 1 2 1 1 2 2 4 2 2 2 Rolling m a le g 4 2 2 2 4 3 2 2 4 2 2 2 2 2 3 2 2 2 3 3 2 3 Rolling m a le g 34 1 1 2 2 2 2 3 2 5 4 3 3 2 3 2 4 1 1 2 2 Rolling m a le g 4 9 2 3 4 2 2 2 2 3 3 2 3 3 2 2 2 4 3 3 2 2 Rolling m a le g 4 2 2 2 4 2 2 3 4 2 2 2 2 2 2 2 2 5 5 4 3 2 Rolling m a le g 54 2 2 4 2 3 2 4 2 4 2 2 2 2 2 2 2 4 4 5 5 Rolling m a le g 44 3 2 4 2 3 2 2 2 2 2 2 3 2 3 2 2 4 4 2 2 Rolling m a le g 46 2 3 3 2 2 2 3 2 2 2 2 3 2 2 2 4 3 3 2 2 Rolling m a le g 41 2 2 4 2 2 3 3 2 2 3 2 2 2 2 2 3 4 2 2 3 Rolling m a le g 4 5 5 5 5 5 5 5 5 5 5 5 5 5 5 5 5 5 5 5 5 5 Rolling m a le g 38 3 2 4 2 3 3 3 2 2 4 3 3 4 4 4 4 4 3 3 3 Rolling m a le g 4 0 2 2 4 2 2 3 3 2 2 2 3 3 2 2 2 4 4 3 3 3 Ro lling m a le g 43 2 2 4 3 2 2 3 2 2 2 2 2 2 2 2 3 4 3 2 2 Ro lling m a le g 52 2 2 3 2 2 3 2 2 3 3 3 3 3 3 3 3 4 3 2 2 Ro lling m a le g 44 1 1 4 2 3 3 2 2 2 3 3 3 3 2 2 2 4 4 4 4 Ro lling m a le g 40 1 2 4 1 2 2 3 1 1 2 2 2 1 2 2 3 4 2 2 2 Ro lling m a le g 54 1 1 4 3 2 2 2 4 3 4 3 5 3 2 3 2 4 4 2 3 Ro ll ing m a le g 52 2 2 4 2 2 3 2 2 2 2 2 2 3 3 2 2 3 2 2 3 Ro lling m a le g 44 1 1 2 1 2 5 1 2 3 5 5 5 1 5 5 5 5 5 2 2 Ro lling m a le g 4 2 1 1 2 1 1 2 1 1 1 1 1 1 1 1 1 4 3 2 1 1 Ro lling m a le g 40 2 2 2 2 2 2 2 2 2 3 2 2 2 2 2 2 3 3 2 2 Ro lling m a le g 52 1 2 4 2 2 2 3 2 4 2 2 2 2 2 2 2 4 3 2 2 Rolling male g 4 7 2 2 3 2 2 2 3 2 3 2 2 3 2 3 3 2 3 3 2 2 R o lling m a le g 38 2 2 1 3 3 3 3 2 2 3 2 3 1 1 1 2 2 1 1 1 R o lling m a le g 44 2 2 3 2 2 2 1 2 2 5 4 5 2 3 3 2 2 4 2 1 R o lling m a le g 47 2 2 2 2 2 2 3 2 2 2 2 2 2 2 2 2 2 3 2 2 R o lling m a le g 46 5 5 1 5 3 3 1 5 3 5 3 5 5 5 5 5 5 5 4 4 R o lling m a le g 57 2 2 4 2 3 3 4 2 2 2 2 2 2 2 3 2 4 2 2 3
106

Index
Frequency distribution
Descriptive statistics
Data
ANNEXURE G
STAFF
Page
109
109
110-111
107

Frequency distribution - Staff
pm1 pm2 pm3 pm4 pm5 pm6 pm7 pm8
bins Frequency Percentage Frequency Percentage Frequency Percentage Frequency Percentage Frequency Percentage Frequency Percentage Frequency Percentage Frequency 1 37 43.53% 26 30.59% 6 7.06% 27 31 .76% 15 17.65% 4 4.71 % 6 7.06% 18 2 43 50.59% 45 52.94% 14 16.47% 48 56.47% 45 52.94% 38 44.71 % 17 20.00% 50 3 3 3.53% 9 10.59% 13 15.29% 4 4.71 % 19 22.35% 26 30.59% 43 50.59% 7 4 0 0.00% 2 2.35% 28 32.94% 3 3.53% 2 2.35% 13 15.29% 16 18.82% 5 5 2 2.35% 3 3.53% 24 28.24% 3 3.53% 4 4.71% 4 4.71% 3 3.53% 5
pd1
85 100.00% 85 100.00% 85 100.00% 85 100.00% 85 100.00% 85 100.00% 85 100.00% 85
94.12% 83.53%
pd2 pd3
23.53% 61 .18%
pd4
88.24% 70.59% 49.41 %
pd5 pd6 pd7
27.06% 22.35%
pd8
bins Frequency Percentarze Frequency Percentarze Frequency Percentarze Frequency Percentarze Frequency Percentarze Frequency Percentarze Frequency Percentarze Frequency 1 10 11 .76% 4 4.71 % 5 5.88% 1 1.18% 9 10.59% 4 4.71 % 20 23.53% 15 2 41 48.24% 39 45.88% 29 34.12% 18 21 .18% 21 24.71 % 17 20.00% 51 60.00% 42 3 22 25.88% 24 28.24% 29 34.12% 25 29.41 % 23 27.06% 38 44.71% 11 12.94% 24 4 8 9.41% 11 12.94% 11 12.94% 25 29.41% 22 25.88% 13 15.29% 1 1.18% 2 5 4 4.71 % 7 8.24% 11 12.94% 16 18.82% 10 11 .76% 13 15.29% 2 2.35% 2
85 100.00% 85 100.00% 85 100.00% 85 100.00% 85 100.00% 85 100.00% 85 100.00% 85
60.00% 50.59% 40.00% 22.35% 35.29% 24.71% 83.53%
pm9 pm10 pm11 pm12
Frequency Percentarze Frequency Percentarze Frequency Percentarze Frequency Percentarze 14 16.47% 10 11.76% 7 8.24% 6 7.06% 33 38.82% 39 45.88% 37 43.53% 26 30.59% 17 20.00% 14 16.47% 24 28.24% 24 28 .24% 15 17.65% 13 15.29% 9 10.59% 15 17.65% 6 7.06% 9 10.59% 8 9.41 % 14 16.47%
85 100.00% 85 100.00% 85 100.00% 85 100.00%
55.29% 57 .65% 51 .76% 37.65%
108
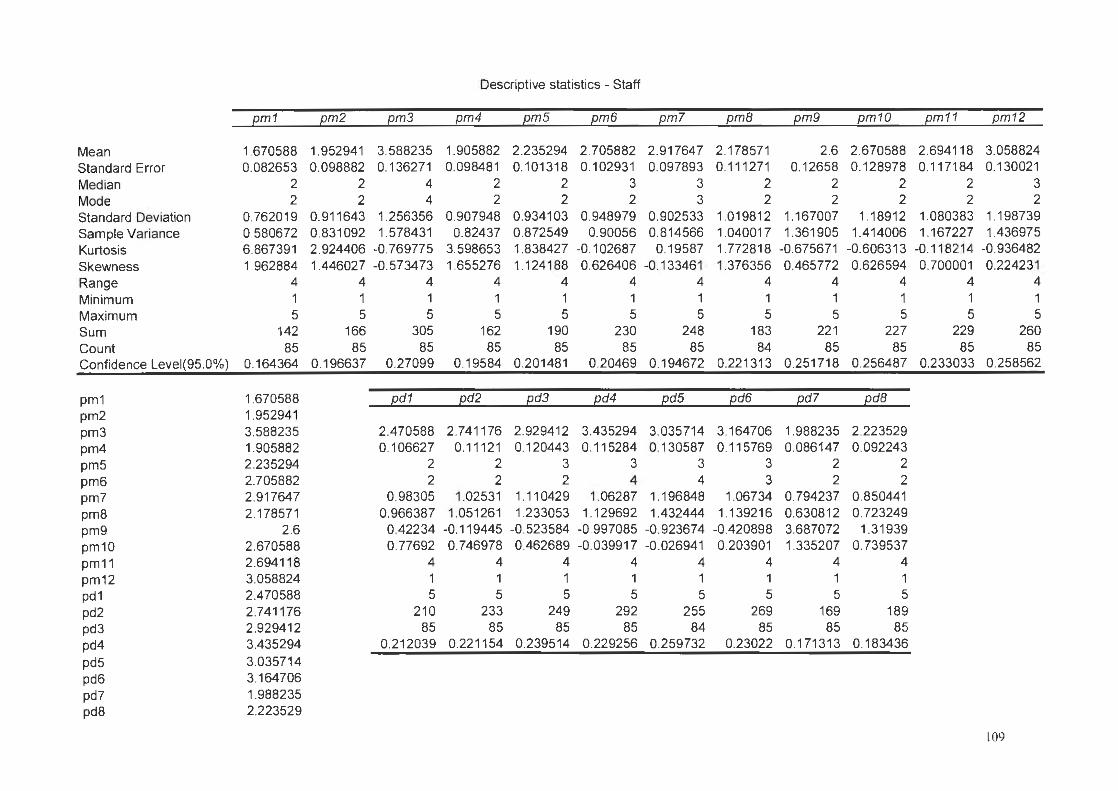
Descriptive statistics - Staff
pm1 pm2 pm3 pm4 pm5 pm6 pm7 pmB pm9 pm10 pm11 pm12
Mean 1.670588 1.952941 3.588235 1.905882 2.235294 2.705882 2.917647 2.178571 2.6 2.670588 2.694118 3.058824 Standard Error 0.082653 0.098882 0.136271 0.098481 0.101318 0.102931 0.097893 0.1 11271 0.12658 0.128978 0.117184 0.130021 Median 2 2 4 2 2 3 3 2 2 2 2 3 Mode 2 2 4 2 2 2 3 2 2 2 2 2 Standard Deviation 0.762019 0.911643 1.256356 0.907948 0.934103 0.948979 0.902533 1.019812 1.167007 1.18912 1.080383 1.198739 Sample Variance 0.580672 0.831092 1.578431 0.82437 0.872549 0.90056 0.814566 1.040017 1.361905 1.414006 1.167227 1.436975 Kurtosis 6.867391 2.924406 -0.769775 3.598653 1.838427 -0.102687 0.19587 1.772818 -0 .675671 -0.606313 -0.118214 -0.936482 Skewness 1.962884 1.446027 -0.573473 1.655276 1.124188 0.626406 -0.133461 1.376356 0.465772 0.626594 0.700001 0.224231 Range 4 4 4 4 4 4 4 4 4 4 4 4 Minimum 1 1 1 1 1 1 1 1 1 1 1 1 Maximum 5 5 5 5 5 5 5 5 5 5 5 5 Sum 142 166 305 162 190 230 248 183 221 227 229 260 Count 85 85 85 85 85 85 85 84 85 85 85 85 Confidence Level(95.0%) 0.164364 0.196637 0.27099 0.19584 0.201481 0.20469 0.194672 0.221313 0.251718 0.256487 0.233033 0.258562
pm1 1.670588 pd1 pd2 pd3 pd4 pd5 pd6 pd7 pdB pm2 1.952941 pm3 3.588235 2.470588 2.741176 2.929412 3.435294 3.035714 3.164706 1.988235 2.223529 pm4 1.905882 0.106627 0.11121 0.120443 0.115284 0.130587 0.115769 0.086147 0.092243 pm5 2.235294 2 2 3 3 3 3 2 2 pm6 2.705882 2 2 2 4 4 3 2 2 pm7 2.917647 0.98305 1.02531 1.110429 1.06287 1.196848 1.06734 0.794237 0.850441 pm8 2.178571 0.966387 1.051261 1.233053 1.129692 1.432444 1.139216 0.630812 0.723249 pm9 2.6 0.42234 -0.119445 -0.523584 -0.997085 -0.923674 -0.420898 3.687072 1.31939 pm10 2.670588 0.77692 0.746978 0.462689 -0.039917 -0.026941 0.203901 1.335207 0. 739537 pm11 2.694118 4 4 4 4 4 4 4 4 pm12 3.058824 1 1 1 1 1 1 1 1 pd1 2.470588 5 5 5 5 5 5 5 5 pd2 2.741 176 210 233 249 292 255 269 169 189 pd3 2.929412 85 85 85 85 84 85 85 85 pd4 3.435294 0.212039 0.221154 0.239514 0.229256 0.259732 0.23022 0.171313 0.183436
pd5 3.035714 pd6 3.164706 pd7 1.988235 pd8 2.223529
109
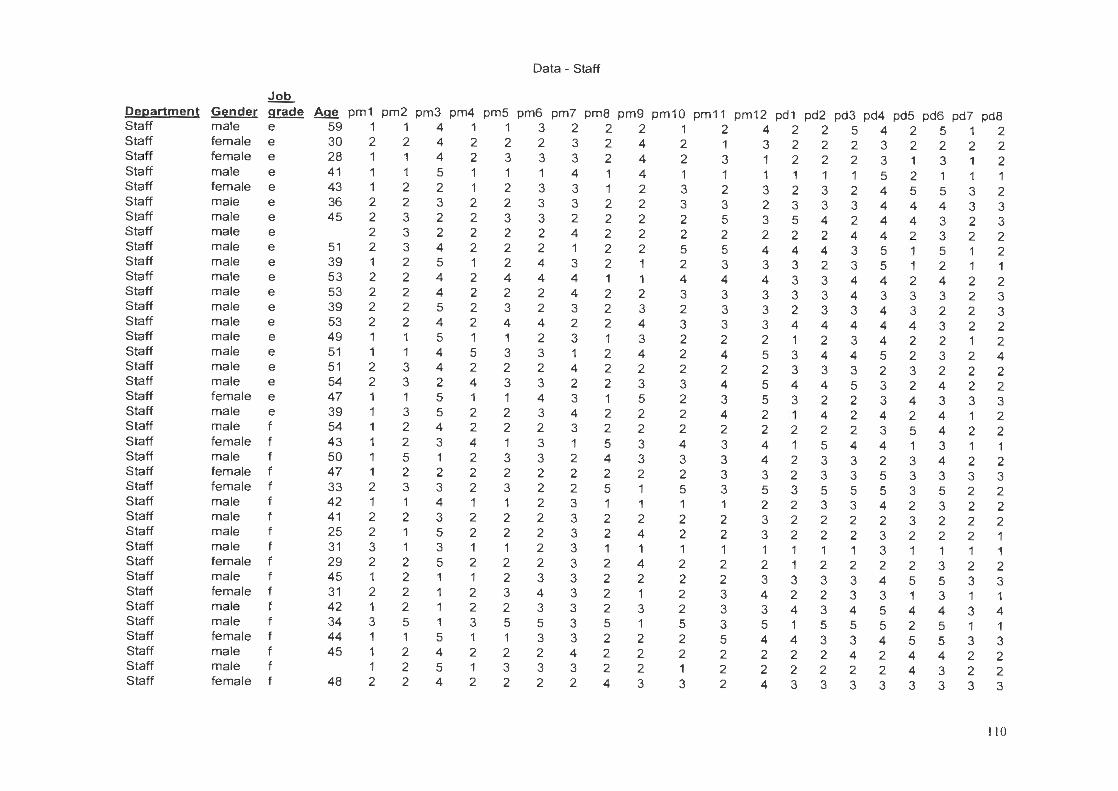
Data - Staff
Job De[!artment Gender g rade Age pm1 pm2 pm3 pm4 pm5 pm6 pm7 pm8 pm9 pm10 pm11 pm12 pd1 pd2 pd3 pd4 pd5 pd6 pd7 pd8 Staff male e 59 1 1 4 1 1 3 2 2 2 1 2 4 2 2 5 4 2 5 1 2 Staff female e 30 2 2 4 2 2 2 3 2 4 2 1 3 2 2 2 3 2 2 2 2 Staff female e 28 1 1 4 2 3 3 3 2 4 2 3 1 2 2 2 3 1 3 1 2 Staff male e 41 1 1 5 1 1 1 4 1 4 1 1 1 1 1 1 5 2 1 1 1 Staff female e 43 1 2 2 1 2 3 3 1 2 3 2 3 2 3 2 4 5 5 3 2 Staff male e 36 2 2 3 2 2 3 3 2 2 3 3 2 3 3 3 4 4 4 3 3 Staff male e 45 2 3 2 2 3 3 2 2 2 2 5 3 5 4 2 4 4 3 2 3 Staff male e 2 3 2 2 2 2 4 2 2 2 2 2 2 2 4 4 2 3 2 2 Staff male e 51 2 3 4 2 2 2 1 2 2 5 5 4 4 4 3 5 1 5 1 2 Staff male e 39 1 2 5 1 2 4 3 2 1 2 3 3 3 2 3 5 1 2 1 1 Staff male e 53 2 2 4 2 4 4 4 1 1 4 4 4 3 3 4 4 2 4 2 2 Staff male e 53 2 2 4 2 2 2 4 2 2 3 3 3 3 3 4 3 3 3 2 3 Staff male e 39 2 2 5 2 3 2 3 2 3 2 3 3 2 3 3 4 3 2 2 3 Staff male e 53 2 2 4 2 4 4 2 2 4 3 3 3 4 4 4 4 4 3 2 2 Staff male e 49 1 1 5 1 1 2 3 1 3 2 2 2 1 2 3 4 2 2 1 2 Staff male e 51 1 1 4 5 3 3 1 2 4 2 4 5 3 4 4 5 2 3 2 4 Staff male e 51 2 3 4 2 2 2 4 2 2 2 2 2 3 3 3 2 3 2 2 2 Staff male e 54 2 3 2 4 3 3 2 2 3 3 4 5 4 4 5 3 2 4 2 2 Staff female e 47 1 1 5 1 1 4 3 1 5 2 3 5 3 2 2 3 4 3 3 3 Staff male e 39 1 3 5 2 2 3 4 2 2 2 4 2 1 4 2 4 2 4 1 2 Staff male f 54 1 2 4 2 2 2 3 2 2 2 2 2 2 2 2 3 5 4 2 2 Staff female f 43 1 2 3 4 1 3 1 5 3 4 3 4 1 5 4 4 1 3 1 1 Staff male f 50 1 5 1 2 3 3 2 4 3 3 3 4 2 3 3 2 3 4 2 2 Staff female f 47 1 2 2 2 2 2 2 2 2 2 3 3 2 3 3 5 3 3 3 3 Staff female f 33 2 3 3 2 3 2 2 5 1 5 3 5 3 5 5 5 3 5 2 2 Staff male f 42 1 1 4 1 1 2 3 1 1 1 1 2 2 3 3 4 2 3 2 2 Staff male f 41 2 2 3 2 2 2 3 2 2 2 2 3 2 2 2 2 3 2 2 2 Staff male f 25 2 1 5 2 2 2 3 2 4 2 2 3 2 2 2 3 2 2 2 1 Staff male f 31 3 1 3 1 1 2 3 1 1 1 1 1 1 1 1 3 1 1 1 1 Staff female f 29 2 2 5 2 2 2 3 2 4 2 2 2 1 2 2 2 2 3 2 2 Staff male f 45 1 2 1 1 2 3 3 2 2 2 2 3 3 3 3 4 5 5 3 3 Staff female f 31 2 2 1 2 3 4 3 2 1 2 3 4 2 2 3 3 1 3 1 1 Staff male f 42 1 2 1 2 2 3 3 2 3 2 3 3 4 3 4 5 4 4 3 4 Staff male f 34 3 5 1 3 5 5 3 5 1 5 3 5 1 5 5 5 2 5 1 1 Staff female f 44 1 1 5 1 1 3 3 2 2 2 5 4 4 3 3 4 5 5 3 3 Staff male f 45 1 2 4 2 2 2 4 2 2 2 2 2 2 2 4 2 4 4 2 2 Staff male f 1 2 5 1 3 3 3 2 2 1 2 2 2 2 2 2 4 3 2 2 Staff female f 48 2 2 4 2 2 2 2 4 3 3 2 4 3 3 3 3 3 3 3 3
110
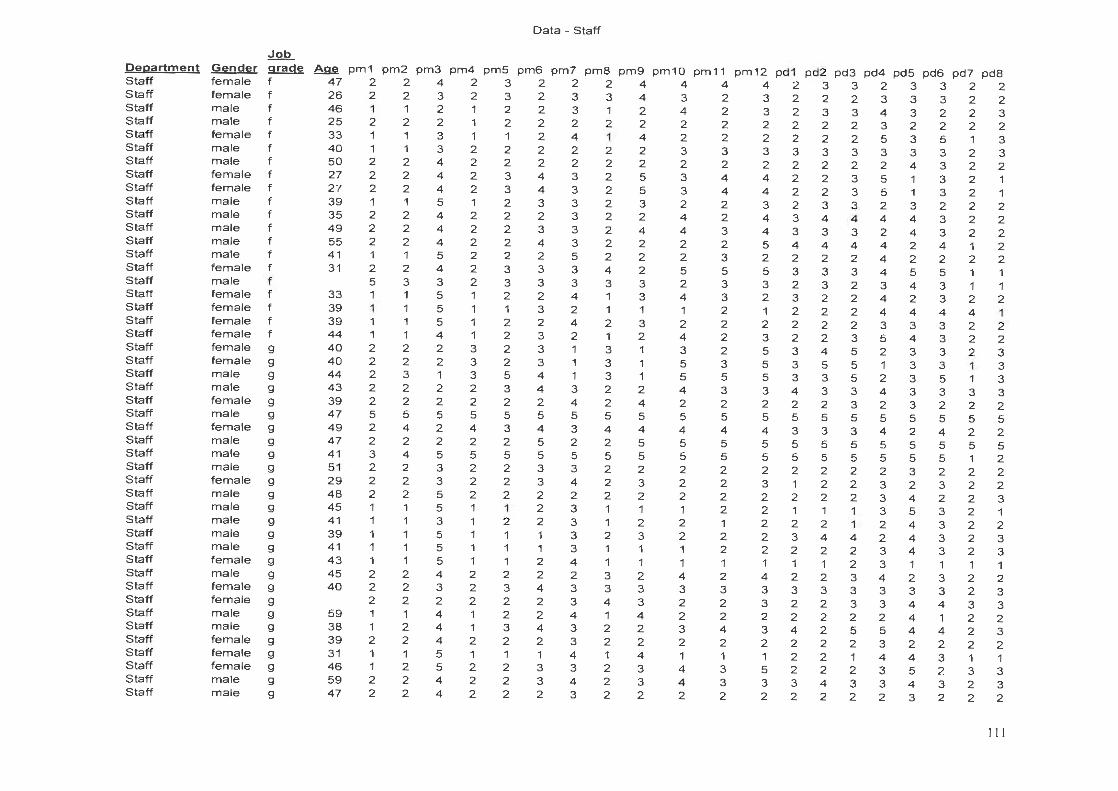
De p a rtme n t G ende r Staff female S~ff
S~ff
S~ff S~ff S~ff S~ff
S~ff
S~ff
S~ff
S~ff
S~ff
S~ff
S~ff S~ff
S~ff S~ff
S~ff
S~ff
S~ff
S~ff
S~ff
S~ff
S~ff
s~
S~ff
S~ff
S~ff
S~ff S~ff S~ff S~ff
S~ff
S~ff
S~ff
S~ff
S~ff
s~
s~ s~ s~
S~ff
S~ff
S~ff
S~ff
s~ S~ff
female m a le male female male male female female male male male male male fem a le male female female female fem a le female female male male female male fem ale male male m a le female male male male male male fem a le male female fem a le male m a le female female female male male
Job g rad e f f f f f f f f f f f f f f f f f f f f g g g g g g g g g g g g g g g g g g g g g g g g g g g
Data- Staff
~ pm1 pm2 pm3 pm4 pm5 pm6 p m 7 pm8 pm9 pm 10 pm11 pm12 pd1 pd2 pd3 pd4 pd5 pd6 pd7 pd8 47 2 2 4 2 3 2 2 2 4 4 4 4 2 3 3 2 3 3 2 2 26 2 2 3 2 3 2 3 3 4 3 2 3 2 2 2 3 3 3 2 2 46 1 1 2 1 2 2 3 1 2 4 2 3 2 3 3 4 3 2 2 3 25 2 2 2 1 2 2 2 2 2 2 2 2 2 2 2 3 2 2 2 2 33 1 1 3 1 1 2 4 1 4 2 2 2 2 2 2 5 3 5 1 3 40 1 1 3 2 2 2 2 2 2 3 3 3 3 3 3 3 3 3 2 3 50 2 2 4 2 2 2 2 2 2 2 2 2 2 2 2 2 4 3 2 2 2 7 2 2 4 2 3 4 3 2 5 3 4 4 2 2 3 5 1 3 2 27 2 2 4 2 3 4 3 2 5 3 4 4 2 2 3 5 1 3 2 1 39 1 1 5 1 2 3 3 2 3 2 2 3 2 3 3 2 3 2 2 2 35 2 2 4 2 2 2 3 2 2 4 2 4 3 4 4 4 4 3 2 2 49 2 2 4 2 2 3 3 2 4 4 3 4 3 3 3 2 4 3 2 2 55 2 2 4 2 2 4 3 2 2 2 2 5 4 4 4 4 2 4 1 2 41 1 1 5 2 2 2 5 2 2 2 3 2 2 2 2 4 2 2 2 2 31 2 2 4 2 3 3 3 4 2 5 5 5 3 3 3 4 5 5 1 1
53 3 2 3 3 3 3 3 2 3 3 2 3 2 3 4 311 33 1 1 5 1 2 2 4 1 3 4 3 2 3 2 2 4 2 3 2 2 39 1 1 5 1 1 3 2 1 1 1 2 1 2 2 2 4 4 4 4 39 1 1 5 1 2 2 4 2 3 2 2 2 2 2 2 3 3 3 2 2 4 4 1 1 4 1 2 3 2 1 2 4 2 3 2 2 3 5 4 3 2 2 40 2 2 2 3 2 3 1 3 1 3 2 5 3 4 5 2 3 3 2 3 40 2 2 2 3 2 3 1 3 1 5 3 5 3 5 5 1 3 3 1 3 44 2 3 1 3 5 4 1 3 1 5 5 5 3 3 5 2 3 5 1 3 43 2 2 2 2 3 4 3 2 2 4 3 3 4 3 3 4 3 3 3 3 39 2 2 2 2 2 2 4 2 4 2 2 2 2 2 3 2 3 2 2 2 47 5 5 5 5 5 5 5 5 5 5 5 5 5 5 5 5 5 5 5 5 49 2 4 2 4 3 4 3 4 4 4 4 4 3 3 3 4 2 4 2 2 47 2 2 2 2 2 5 2 2 5 5 5 5 5 5 5 5 5 5 5 5 41 3 4 5 5 5 5 5 5 5 5 5 5 5 5 5 5 5 5 1 2 51 2 2 3 2 2 3 3 2 2 2 2 2 2 2 2 2 3 2 2 2 29 2 2 3 2 2 3 4 2 3 2 2 3 1 2 2 3 2 3 2 2 48 2 2 5 2 2 2 2 2 2 2 2 2 2 2 2 3 4 2 2 3 45 1 1 5 1 1 2 3 1 1 1 2 2 1 1 1 3 5 3 2 1 41 1 1 3 1 2 2 3 1 2 2 1 2 2 2 1 2 4 3 2 2 39 1 1 5 1 1 1 3 2 3 2 2 2 3 4 4 2 4 3 2 3 41 1 1 5 1 1 1 3 1 1 1 2 2 2 2 2 3 4 3 2 3 43 1 1 5 1 1 2 4 1 1 1 1 1 1 1 2 3 1 1 1 1 45 2 2 4 2 2 2 2 3 2 4 2 4 2 2 3 4 2 3 2 2 4 0 2 2 3 2 3 4 3 3 3 3 3 3 3 3 3 3 3 3 2 3
2 2 2 2 2 2 3 4 3 2 2 3 2 2 3 3 4 4 3 3 59 1 1 4 1 2 2 4 1 4 2 2 2 2 2 2 2 4 1 2 2 38 1 2 4 1 3 4 3 2 2 3 4 3 4 2 5 5 4 4 2 3 39 2 2 4 2 2 2 3 2 2 2 2 2 2 2 2 3 2 2 2 2 31 1 1 5 1 1 1 4 1 4 1 1 1 2 2 1 4 4 3 1 1 46 1 2 5 2 2 3 3 2 3 4 3 5 2 2 2 3 5 2 3 3 59 2 2 4 2 2 3 4 2 3 4 3 3 3 4 3 3 4 3 2 3 47 2 2 4 2 2 2 3 2 2 2 2 2 2 2 2 2 3 2 2 2
I II
Index
Frequency distribution
Descriptive statistics
Data
ANNEXURE H
E ROLES
Page
113
114
115-116
112
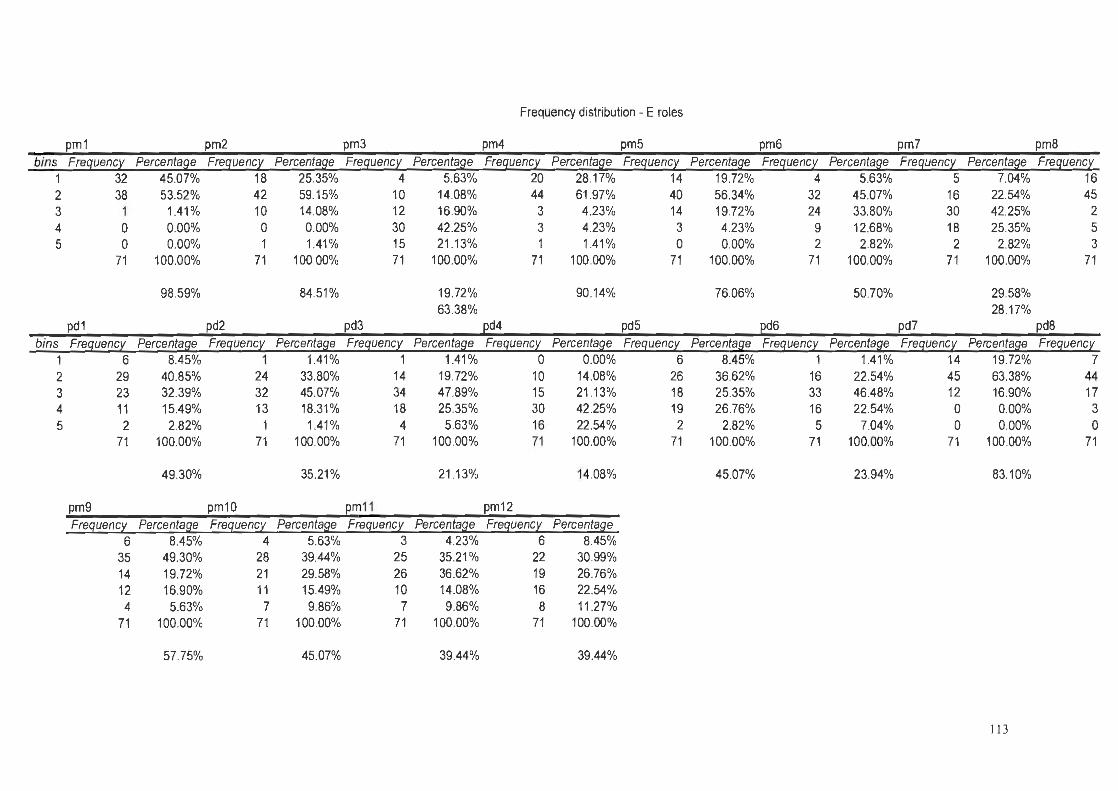
Frequency distribution- E roles
pm1 pm2 pm3 pm4 pm5 pm6 pm7 pm8
bins Frequency Percentage Frequency Percentage Frequency Percentage Frequency Percentage Frequency Percentage Frequency Percentage Frequency Percentage Frequency 1 32 45.07% 18 25.35% 4 5.63% 20 28.17% 14 19.72% 4 5.63% 5 7.04% 16 2 38 53.52% 42 59.15% 10 14.08% 44 61.97% 40 56.34% 32 45.07% 16 22.54% 45 3 1 1.41% 10 14.08% 12 16.90% 3 4.23% 14 19.72% 24 33.80% 30 42.25% 2 4 0 0.00% 0 0.00% 30 42.25% 3 4.23% 3 4.23% 9 12.68% 18 25.35% 5 5 0 0.00% 1 1.41 % 15 21 .13% 1 1.41 % 0 0.00% 2 2.82% 2 2.82% 3
pd1
71 100.00% 71 100.00% 71 100.00% 71 100.00% 71 100.00% 71 100.00% 71 100.00% 71
98.59% 84.51 %
pd2 pd3
19.72% 63.38%
pd4
90.14% 76.06% 50.70%
pd5 pd6 pd7
29.58% 28.17%
pd8
bins Frequency Percentag_e Frequency Percentag_e Frequency Percentag_e Frequency Percentag_e Frequency Percentag_e Frequency Percentag_e Frequency Percentag_e Frequency 1 6 8.45% 1 1.41% 1 1.41 % 0 0.00% 6 8.45% 1 1.41 % 14 19.72% 7 2 29 40.85% 24 33.80% 14 19.72% 10 14.08% 26 36.62% 16 22.54% 45 63.38% 44 3 23 32.39% 32 45.07% 34 47.89% 15 21 .13% 18 25.35% 33 46.48% 12 16.90% 17 4 11 15.49% 13 18.31% 18 25.35% 30 42.25% 19 26.76% 16 22.54% 0 0.00% 3 5 2 2.82% 1 1.41% 4 5.63% 16 22.54% 2 2.82% 5 7.04% 0 0.00% 0
71 100.00% 71 100.00% 71 100.00% 71 100.00% 71 100.00% 71 100.00% 71 100.00% 71
49.30% 35.21% 21 .13% 14.08% 45.07% 23.94% 83.10%
pm9 pm10 pm11 pm1 2
Frequency Percentage Frequency Percentage Frequency Percentage Frequency Percentage 6 8.45% 4 5.63% 3 4.23% 6 8.45%
35 49.30% 28 39.44% 25 35.21 % 22 30.99% 14 19.72% 21 29.58% 26 36.62% 19 26.76% 12 16.90% 11 15.49% 10 14.08% 16 22.54% 4 5.63% 7 9.86% 7 9.86% 8 11.27%
71 100.00% 71 100.00% 71 100.00% 71 100.00%
57.75% 45.07% 39.44% 39.44%
11 3
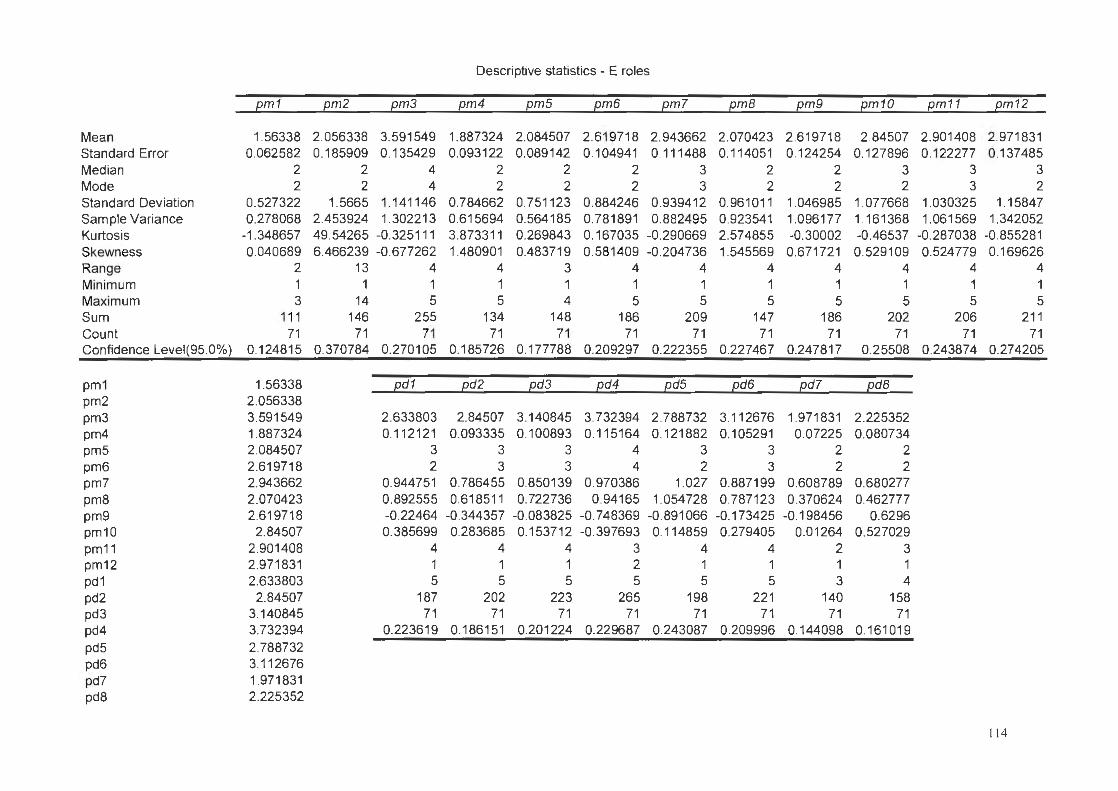
Descriptive statistics - E roles
pm1 pm2 pm3 pm4 pm5 pm6 pml pmB pm9 pm10 pm11 pm12
Mean 1.56338 2.056338 3.591549 1.887324 2.084507 2.619718 2.943662 2.070423 2.619718 2.84507 2.901408 2.971831 Standard Error 0.062582 0.185909 0.135429 0.093122 0.089142 0.104941 0.111488 0.114051 0.124254 0.127896 0.122277 0.137 485 Median 2 2 4 2 2 2 3 2 2 3 3 3 Mode 2 2 4 2 2 2 3 2 2 2 3 2 Standard Deviation 0.527322 1.5665 1.141146 0.784662 0.751123 0.884246 0.939412 0.961011 1.046985 1.077668 1.030325 1.15847 Sample Variance 0.278068 2.453924 1.302213 0.615694 0.564185 0.781891 0.882495 0.923541 1.096177 1.161368 1.061569 1.342052 Kurtosis -1.348657 49 .54265 -0.32511 1 3.873311 0.269843 0.167035 -0.290669 2.574855 -0.30002 -0.46537 -0.287038 -0.855281 Skewness 0.040689 6.466239 -0.677262 1.480901 0.483719 0.581409 -0.204736 1.545569 0.671721 0.529109 0.524779 0.169626 Range 2 13 4 4 3 4 4 4 4 4 4 4 Minimum 1 1 1 1 1 1 1 1 1 1 1 1 Maximum 3 14 5 5 4 5 5 5 5 5 5 5 Sum 111 146 255 134 148 186 209 147 186 202 206 211 Count 71 71 71 71 71 71 71 71 71 71 71 71 Confidence Level(95.0%) 0.124815 0.370784 0.270105 0.185726 0.177788 0.209297 0.222355 0.227467 0.247817 0.25508 0.243874 0.274205
pm1 1.56338 pd1 pd2 pd3 pd4 pd5 pd6 pdl pdB pm2 2.056338 pm3 3.591549 2.633803 2.84507 3.140845 3.732394 2.788732 3.112676 1.971831 2.225352 pm4 1.887324 0.112121 0.093335 0.100893 0.115164 0.121882 0.105291 0.07225 0.080734 pm5 2.084507 3 3 3 4 3 3 2 2 pm6 2.619718 2 3 3 4 2 3 2 2 pm7 2.943662 0.944751 0.786455 0.850139 0.970386 1.027 0.887199 0.608789 0.680277 pm8 2.070423 0.892555 0.618511 0.722736 0.94165 1.054728 0.787123 0.370624 0.462777 pm9 2.619718 -0.22464 -0.344357 -0.083825 -0.748369 -0.891066 -0.173425 -0.198456 0.6296 pm10 2.84507 0.385699 0.283685 0.153712 -0.397693 0.114859 0.279405 0.01264 0.527029 pm11 2.901408 4 4 4 3 4 4 2 3 pm12 2.971831 1 1 1 2 1 1 1 1 pd1 2.633803 5 5 5 5 5 5 3 4 pd2 2.84507 187 202 223 265 198 221 140 158 pd3 3.140845 71 71 71 71 71 71 71 71 pd4 3.732394 0.223619 0.186151 0.201224 0.229687 0.243087 0.209996 0.144098 0.161019 pd5 2.788732 pd6 3. 112676 pd7 1.971831 pd8 2.225352
114
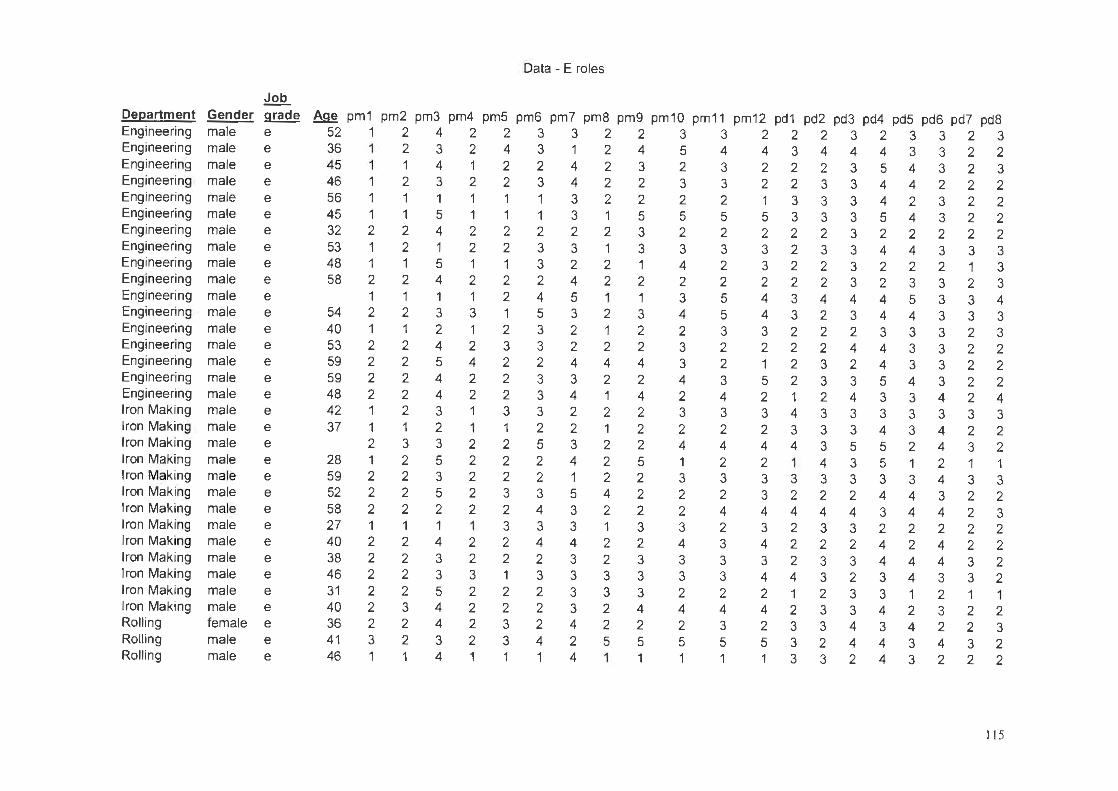
Data - E roles
Job
Department Gender grade Age pm1 pm2 pm3 pm4 pm5 pm6 pm7 pm8 pm9 pm10 pm11 pm12 pd1 pd2 pd3 pd4 pd5 pd6 pd7 pd8 Engineering male e 52 1 2 4 2 2 3 3 2 2 3 3 2 2 2 3 2 3 3 2 3 Engineering male e 36 1 2 3 2 4 3 1 2 4 5 4 4 3 4 4 4 3 3 2 2 Engineering male e 45 1 1 4 1 2 2 4 2 3 2 3 2 2 2 3 5 4 3 2 3 Engineering male e 46 1 2 3 2 2 3 4 2 2 3 3 2 2 3 3 4 4 2 2 2 Engineering male e 56 1 1 1 1 1 1 3 2 2 2 2 1 3 3 3 4 2 3 2 2 Engineering male e 45 1 1 5 1 1 1 3 1 5 5 5 5 3 3 3 5 4 3 2 2 Engineering male e 32 2 2 4 2 2 2 2 2 3 2 2 2 2 2 3 2 2 2 2 2 Engineering male e 53 1 2 1 2 2 3 3 1 3 3 3 3 2 3 3 4 4 3 3 3 Engineering male e 48 1 1 5 1 1 3 2 2 1 4 2 3 2 2 3 2 2 2 1 3 Engineering male e 58 2 2 4 2 2 2 4 2 2 2 2 2 2 2 3 2 3 3 2 3 Engineering male e 1 1 1 1 2 4 5 1 1 3 5 4 3 4 4 4 5 3 3 4 Engineering male e 54 2 2 3 3 1 5 3 2 3 4 5 4 3 2 3 4 4 3 3 3 Engineering male e 40 1 1 2 1 2 3 2 1 2 2 3 3 2 2 2 3 3 3 2 3 Engineering male e 53 2 2 4 2 3 3 2 2 2 3 2 2 2 2 4 4 3 3 2 2 Engineering male e 59 2 2 5 4 2 2 4 4 4 3 2 1 2 3 2 4 3 3 2 2 Engineering male e 59 2 2 4 2 2 3 3 2 2 4 3 5 2 3 3 5 4 3 2 2 Engineering male e 48 2 2 4 2 2 3 4 1 4 2 4 2 1 2 4 3 3 4 2 4 Iron Making male e 42 1 2 3 1 3 3 2 2 2 3 3 3 4 3 3 3 3 3 3 3 Iron Making male e 37 1 1 2 1 1 2 2 1 2 2 2 2 3 3 3 4 3 4 2 2 Iron Making male e 2 3 3 2 2 5 3 2 2 4 4 4 4 3 5 5 2 4 3 2 Iron Making male e 28 1 2 5 2 2 2 4 2 5 1 2 2 1 4 3 5 1 2 1 1 Iron Making male e 59 2 2 3 2 2 2 1 2 2 3 3 3 3 3 3 3 3 4 3 3 Iron Making male e 52 2 2 5 2 3 3 5 4 2 2 2 3 2 2 2 4 4 3 2 2 Iron Making male e 58 2 2 2 2 2 4 3 2 2 2 4 4 4 4 4 3 4 4 2 3 Iron Making male e 27 1 1 1 1 3 3 3 1 3 3 2 3 2 3 3 2 2 2 2 2 Iron Making male e 40 2 2 4 2 2 4 4 2 2 4 3 4 2 2 2 4 2 4 2 2 Iron Making male e 38 2 2 3 2 2 2 3 2 3 3 3 3 2 3 3 4 4 4 3 2 Iron Making male e 46 2 2 3 3 1 3 3 3 3 3 3 4 4 3 2 3 4 3 3 2 Iron Making male e 31 2 2 5 2 2 2 3 3 3 2 2 2 1 2 3 3 1 2 1 1 Iron Making male e 40 2 3 4 2 2 2 3 2 4 4 4 4 2 3 3 4 2 3 2 2 Rolling female e 36 2 2 4 2 3 2 4 2 2 2 3 2 3 3 4 3 4 2 2 3 Rolling male e 41 3 2 3 2 3 4 2 5 5 5 5 5 3 2 4 4 3 4 3 2 Rolling male e 46 1 1 4 1 1 1 4 1 1 1 1 1 3 3 2 4 3 2 2 2
115
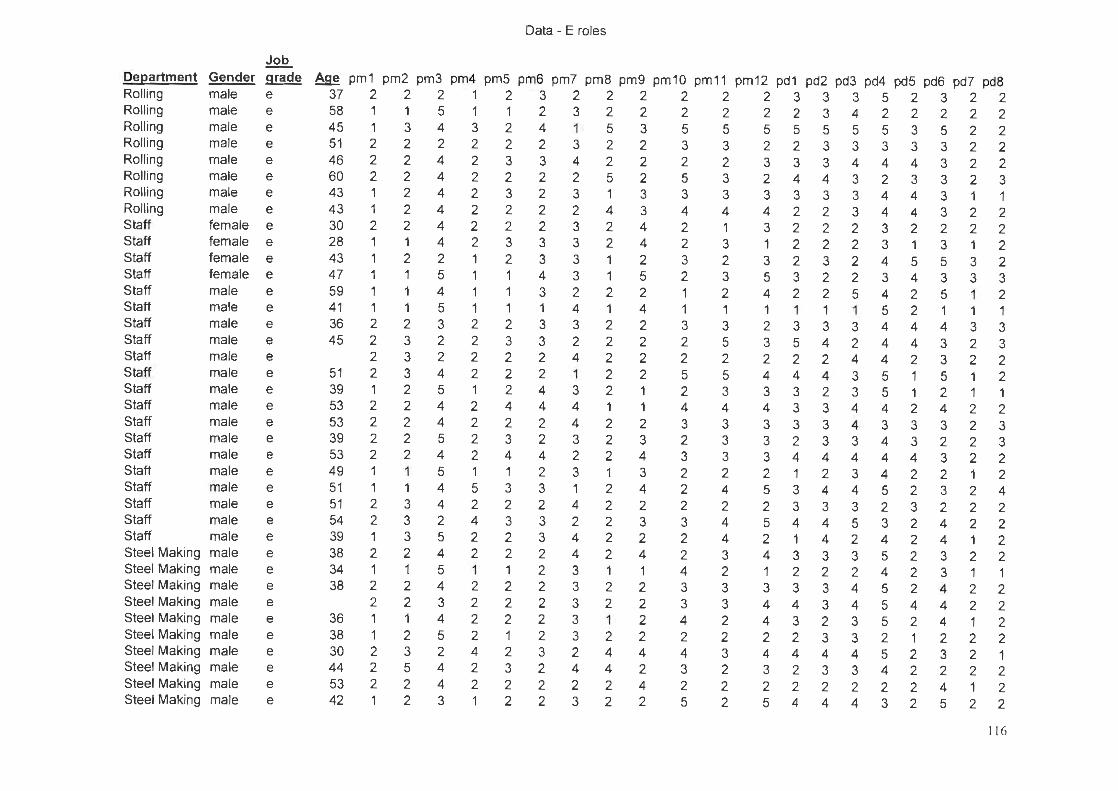
Data - E roles
Job
Department Gender grade Age pm1 pm2 pm3 pm4 pm5 pm6 pm7 pm8 pm9 pm10 pm11 pm12 pd1 pd2 pd3 pd4 pd5 pd6 pd7 pd8 Rolling male e 37 2 2 2 1 2 3 2 2 2 2 2 2 3 3 3 5 2 3 2 2 Rolling male e 58 1 1 5 1 1 2 3 2 2 2 2 2 2 3 4 2 2 2 2 2 Rolling male e 45 1 3 4 3 2 4 1 5 3 5 5 5 5 5 5 5 3 5 2 2 Rolling male e 51 2 2 2 2 2 2 3 2 2 3 3 2 2 3 3 3 3 3 2 2 Rolling male e 46 2 2 4 2 3 3 4 2 2 2 2 3 3 3 4 4 4 3 2 2 Rolling male e 60 2 2 4 2 2 2 2 5 2 5 3 2 4 4 3 2 3 3 2 3 Rolling male e 43 1 2 4 2 3 2 3 1 3 3 3 3 3 3 3 4 4 3 1 1 Rolling male e 43 1 2 4 2 2 2 2 4 3 4 4 4 2 2 3 4 4 3 2 2 Staff female e 30 2 2 4 2 2 2 3 2 4 2 1 3 2 2 2 3 2 2 2 2 Staff female e 28 1 1 4 2 3 3 3 2 4 2 3 1 2 2 2 3 1 3 1 2 Staff female e 43 1 2 2 1 2 3 3 1 2 3 2 3 2 3 2 4 5 5 3 2 Staff female e 47 1 1 5 1 1 4 3 1 5 2 3 5 3 2 2 3 4 3 3 3 Staff male e 59 1 1 4 1 1 3 2 2 2 1 2 4 2 2 5 4 2 5 1 2 Staff male e 41 1 1 5 1 1 1 4 1 4 1 1 1 1 1 1 5 2 1 1 1 Staff male e 36 2 2 3 2 2 3 3 2 2 3 3 2 3 3 3 4 4 4 3 3 Staff male e 45 2 3 2 2 3 3 2 2 2 2 5 3 5 4 2 4 4 3 2 3 Staff male e 2 3 2 2 2 2 4 2 2 2 2 2 2 2 4 4 2 3 2 2 Staff male e 51 2 3 4 2 2 2 1 2 2 5 5 4 4 4 3 5 1 5 1 2 Staff male e 39 1 2 5 1 2 4 3 2 1 2 3 3 3 2 3 5 1 2 1 1 Staff male e 53 2 2 4 2 4 4 4 1 1 4 4 4 3 3 4 4 2 4 2 2 Staff male e 53 2 2 4 2 2 2 4 2 2 3 3 3 3 3 4 3 3 3 2 3 Staff male e 39 2 2 5 2 3 2 3 2 3 2 3 3 2 3 3 4 3 2 2 3 Staff male e 53 2 2 4 2 4 4 2 2 4 3 3 3 4 4 4 4 4 3 2 2 Staff male e 49 1 1 5 1 1 2 3 1 3 2 2 2 1 2 3 4 2 2 1 2 Staff male e 51 1 1 4 5 3 3 1 2 4 2 4 5 3 4 4 5 2 3 2 4 Staff male e 51 2 3 4 2 2 2 4 2 2 2 2 2 3 3 3 2 3 2 2 2 Staff male e 54 2 3 2 4 3 3 2 2 3 3 4 5 4 4 5 3 2 4 2 2 Staff male e 39 1 3 5 2 2 3 4 2 2 2 4 2 1 4 2 4 2 4 1 2 Steel Making male e 38 2 2 4 2 2 2 4 2 4 2 3 4 3 3 3 5 2 3 2 2 Steel Making male e 34 1 1 5 1 1 2 3 1 1 4 2 1 2 2 2 4 2 3 1 1 Steel Making male e 38 2 2 4 2 2 2 3 2 2 3 3 3 3 3 4 5 2 4 2 2 Steel Making male e 2 2 3 2 2 2 3 2 2 3 3 4 4 3 4 5 4 4 2 2 Steel Making male e 36 1 1 4 2 2 2 3 1 2 4 2 4 3 2 3 5 2 4 1 2 Steel Making male e 38 1 2 5 2 1 2 3 2 2 2 2 2 2 3 3 2 1 2 2 2 Steel Making male e 30 2 3 2 4 2 3 2 4 4 4 3 4 4 4 4 5 2 3 2 1 Steel Making male e 44 2 5 4 2 3 2 4 4 2 3 2 3 2 3 3 4 2 2 2 2 Steel Making male e 53 2 2 4 2 2 2 2 2 4 2 2 2 2 2 2 2 2 4 1 2 Steel Making male e 42 1 2 3 1 2 2 3 2 2 5 2 5 4 4 4 3 2 5 2 2
11 6
Index
Frequency distribution
Descriptive statistics
Data
ANNEXURE I
F ROLES
Page
118
119
120-122
11 7
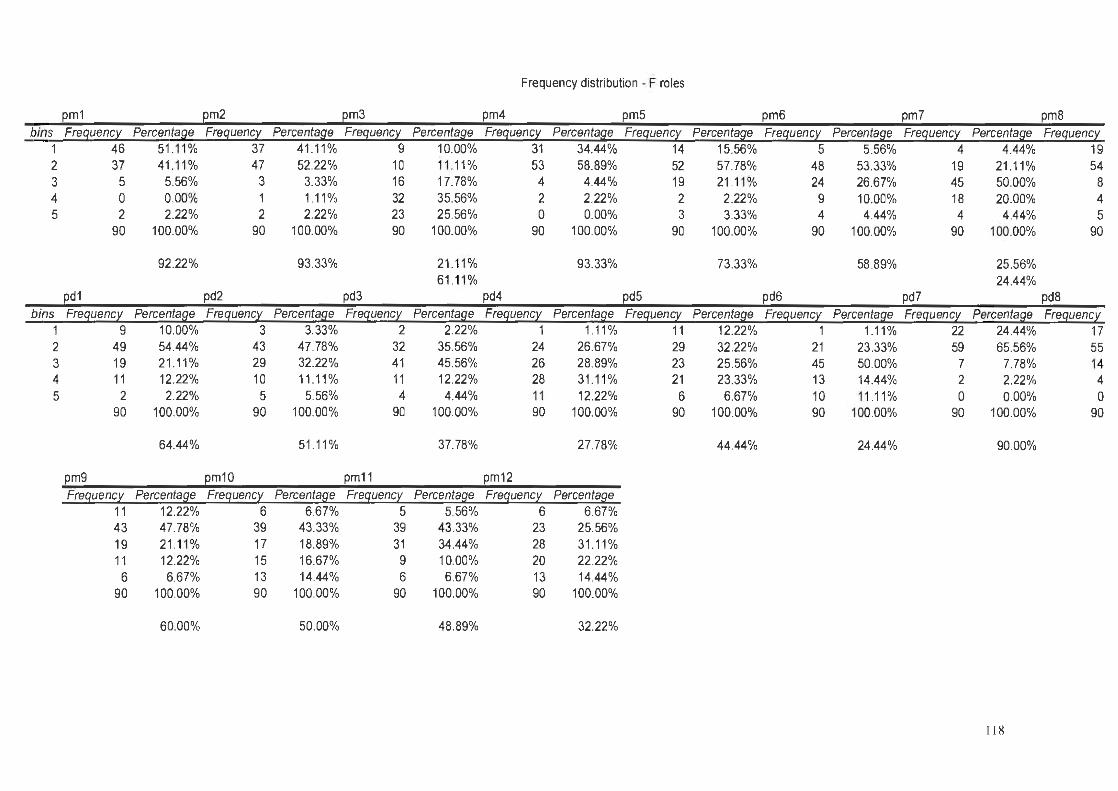
Frequency distribution- F roles
pm1 pm2 pm3 pm4 pm5 pm6 pm7 pm8 bins Freguenc~ Percentaae Freguenc~ Percentaae Freguenc~ Percentaae Freguenc~ Percentaae Freguenc~ Percentaae Freguenc~ Percentaae Freguenc~ Percentaae Freguenc~
1 46 51 .11% 37 2 37 41 .11% 47 3 5 5.56% 3 4 0 0.00% 1 5 2 2.22% 2
90 100.00% 90
92.22%
pd1 pd2
41 .11 % 9 52.22% 10 3.33% 16 1.11% 32 2.22% 23
100.00% 90
93.33%
pd3
10.00% 11 .11 % 17.78% 35.56% 25.56%
100.00%
21 .11 % 61 .11 %
31 53 4 2 0
90
pd4
34.44% 14 15.56% 5 58.89% 52 57.78% 48 4.44% 19 21 .11% 24 2.22% 2 2.22% 9 0.00% 3 3.33% 4
100.00% 90 100.00% 90
93.33% 73.33%
pd5 pd6
5.56% 4 53.33% 19 26.67% 45 10.00% 18 4.44% 4
100.00% 90
58.89%
pd7
4.44% 21 .11% 50.00% 20.00% 4.44%
100.00%
25.56% 24.44%
19 54 8 4 5
90
pd8 bins Freguenc~ Percentaae Freguenc~ Percentaae Freguenc~ Percentaae Freguenc~ Percentaae Freguenc~ Percentaae Freguenc~ Percentaae Freguenc~ Percentaae Freguenc~
1 9 10.00% 3 3.33% 2 2.22% 1 1.11 % 11 12.22% 1 1.11 % 22 24.44% 17 2 49 54.44% 43 47.78% 32 35.56% 24 26.67% 29 32.22% 21 23.33% 59 65.56% 55 3 19 21.11 % 29 32.22% 41 45.56% 26 28.89% 23 25.56% 45 50.00% 7 7.78% 14 4 11 12.22% 10 11 .11% 11 12.22% 28 31 .11 % 21 23.33% 13 14.44% 2 2.22% 4 5 2 2.22% 5 5.56% 4 4.44% 11 12.22% 6 6.67% 10 11 .11 % 0 0.00% 0
90 100.00% 90 100.00% 90 100.00% 90 100.00% 90 100.00% 90 100.00% 90 100.00% 90
64.44% 51.11 % 37.78% 27.78% 44.44% 24.44% 90.00%
pm9 pm10 pm11 pm12 Freguency Percentaae Freguency Percentaae Frequency Percentaae Freguency Percentaae
11 12.22% 6 6.67% 5 5.56% 6 6.67% 43 47.78% 39 43.33% 39 43.33% 23 25.56% 19 21.11% 17 18.89% 31 34.44% 28 31.11 % 11 12.22% 15 16.67% 9 10.00% 20 22.22% 6 6.67% 13 14.44% 6 6.67% 13 14.44%
90 100.00% 90 100.00% 90 100.00% 90 100.00%
60.00% 50.00% 48.89% 32.22%
118
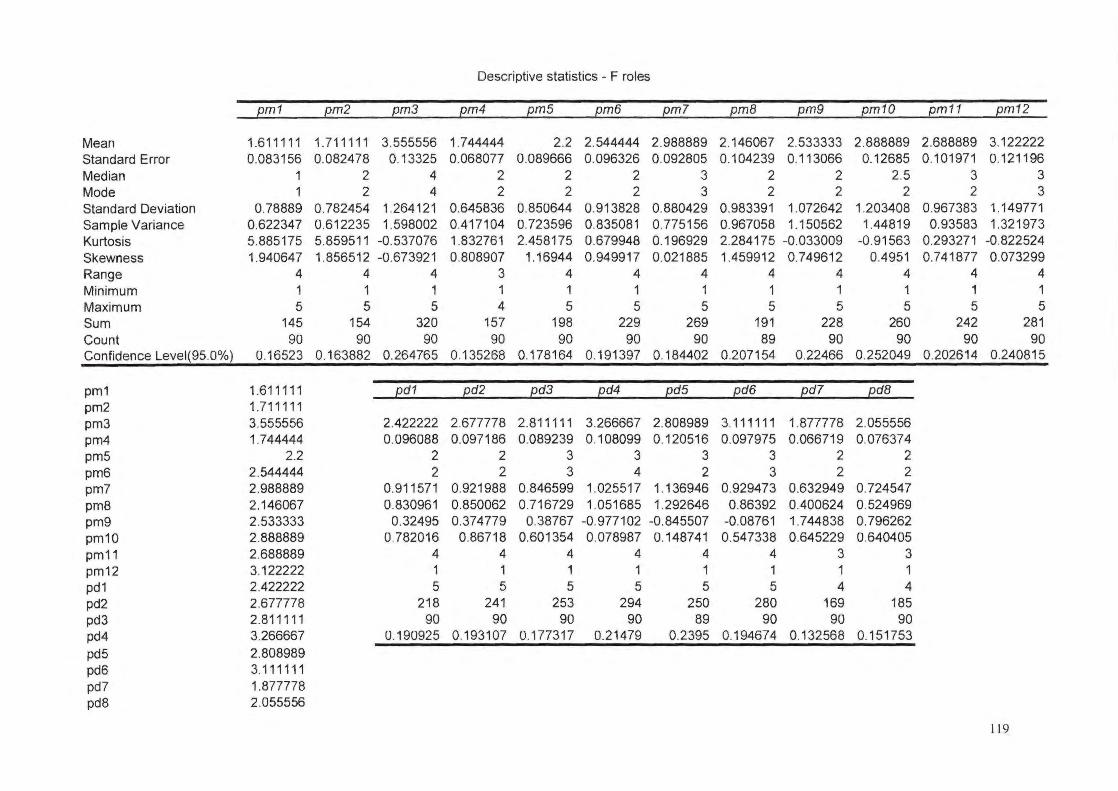
Descriptive statistics- F roles
pm1 pm2 pm3 pm4 pm5 pm6 pml pm8 pm9 pm10 pm11 pm12
Mean 1.611111 1.711111 3.555556 1.744444 2.2 2.544444 2.988889 2.146067 2.533333 2.888889 2.688889 3.122222 Standard Error 0.083156 0.082478 0.13325 0.068077 0.089666 0.096326 0.092805 0.104239 0.113066 0.12685 0.101971 0.121196 Median 1 2 4 2 2 2 3 2 2 2.5 3 3 Mode 1 2 4 2 2 2 3 2 2 2 2 3 Standard Deviation 0.78889 0.782454 1.264121 0.645836 0.850644 0.913828 0.880429 0.983391 1.072642 1.203408 0.967383 1.149771 Sample Variance 0.622347 0.612235 1.598002 0.417104 0.723596 0.835081 0. 775156 0.967058 1.150562 1.44819 0.93583 1.321973 Kurtosis 5.885175 5.859511 -0.537076 1.832761 2.458175 0.679948 0.196929 2.284175 -0.033009 -0.91563 0.293271 -0.822524 Skewness 1.940647 1.856512 -0.673921 0.808907 1.16944 0.949917 0.021885 1.459912 0.749612 0.4951 0.741877 0.073299 Range 4 4 4 3 4 4 4 4 4 4 4 4 Minimum 1 1 1 1 1 1 1 1 1 1 1 1 Maximum 5 5 5 4 5 5 5 5 5 5 5 5 Sum 145 154 320 157 198 229 269 191 228 260 242 281 Count 90 90 90 90 90 90 90 89 90 90 90 90 Confidence Level(95.0%) 0.16523 0.163882 0.264765 0.135268 0.178164 0.191397 0.184402 0.207154 0.22466 0.252049 0.202614 0.240815
pm1 1.611111 pd1 pd2 pd3 pd4 pd5 pd6 pdl pd8 pm2 1.711111 pm3 3.555556 2.422222 2.677778 2.811111 3.266667 2.808989 3.111111 1.877778 2.055556 pm4 1.744444 0.096088 0.097186 0.089239 0.108099 0.120516 0.097975 0.066719 0.076374 pm5 2.2 2 2 3 3 3 3 2 2 pm6 2.544444 2 2 3 4 2 3 2 2 pm7 2.988889 0.911571 0.921988 0.846599 1.025517 1.136946 0.9294 73 0.632949 0. 72454 7 pm8 2.146067 0.830961 0.850062 0.716729 1.051685 1.292646 0.86392 0.400624 0.524969 pm9 2.533333 0.32495 0.374779 0.38767 -0.977102 -0.845507 -0.08761 1. 7 44838 0. 796262 pm10 2.888889 0.782016 0.86718 0.601354 0.078987 0.148741 0.547338 0.645229 0.640405 pm11 2.688889 4 4 4 4 4 4 3 3 pm12 3.122222 1 1 1 1 1 1 1 1 pd1 2.422222 5 5 5 5 5 5 4 4 pd2 2.677778 218 241 253 294 250 280 169 185 pd3 2.811111 90 90 90 90 89 90 90 90 pd4 3.266667 0.190925 0.193107 0.177317 0.21479 0.2395 0.194674 0.132568 0.151753
pd5 2.808989 pd6 3.111111 pd7 1.877778 pd8 2.055556
119
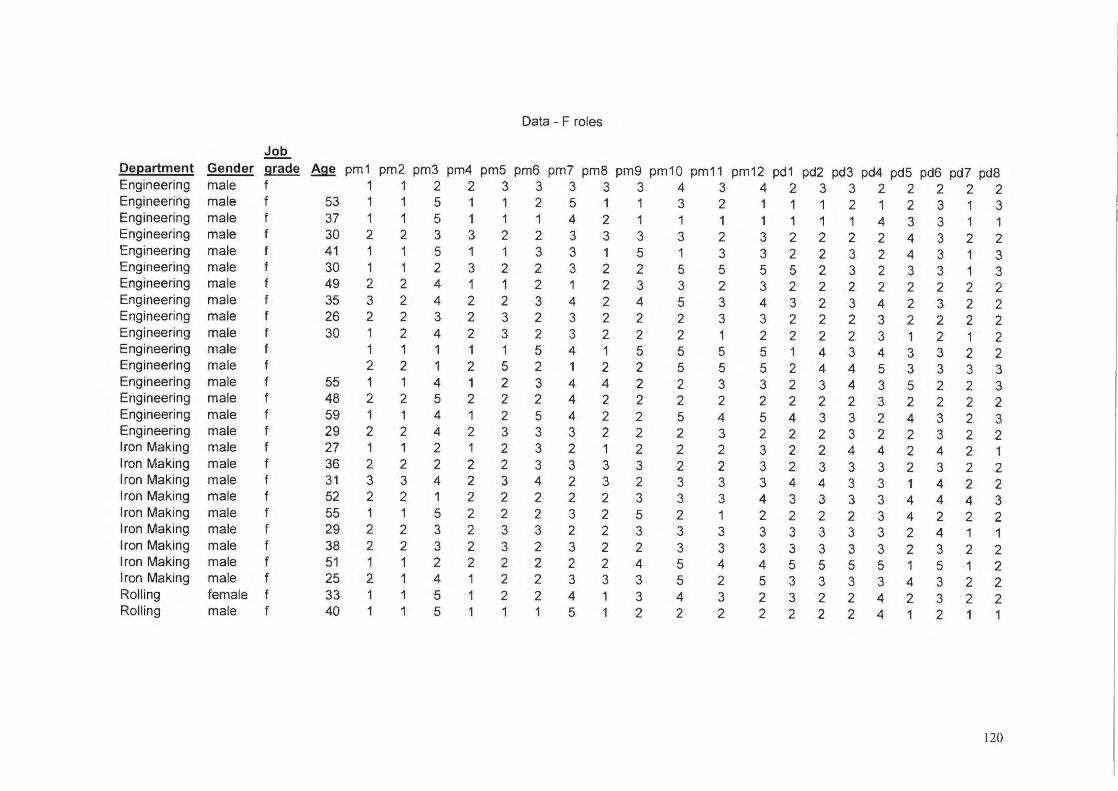
Data - F roles
Job De(;!artment Gender grade Age pm1 pm2 pm3 pm4 pm5 pm6 pm7 pm8 pm9 pm10 pm1 1 pm12 pd 1 pd2 pd3 pd4 pd5 pd6 pd7 pd8 Engineering male f 1 1 2 2 3 3 3 3 3 4 3 4 2 3 3 2 2 2 2 2 Engineering male f 53 1 1 5 1 1 2 5 1 1 3 2 1 1 1 2 1 2 3 1 3 Engineering male f 37 1 1 5 1 1 1 4 2 1 1 1 1 1 1 1 4 3 3 1 1 Engineering male f 30 2 2 3 3 2 2 3 3 3 3 2 3 2 2 2 2 4 3 2 2 Engineering male f 41 1 1 5 1 1 3 3 1 5 1 3 3 2 2 3 2 4 3 1 3 Engineering male f 30 1 1 2 3 2 2 3 2 2 5 5 5 5 2 3 2 3 3 1 3 Engineering male f 49 2 2 4 1 1 2 1 2 3 3 2 3 2 2 2 2 2 2 2 2 Engineering male f 35 3 2 4 2 2 3 4 2 4 5 3 4 3 2 3 4 2 3 2 2 Engineering male f 26 2 2 3 2 3 2 3 2 2 2 3 3 2 2 2 3 2 2 2 2 Engineering male f 30 1 2 4 2 3 2 3 2 2 2 1 2 2 2 2 3 1 2 1 2 Engineering male f 1 1 1 1 1 5 4 1 5 5 5 5 1 4 3 4 3 3 2 2 Engineering male f 2 2 1 2 5 2 1 2 2 5 5 5 2 4 4 5 3 3 3 3 Engineering male f 55 1 1 4 1 2 3 4 4 2 2 3 3 2 3 4 3 5 2 2 3 Engineering male f 48 2 2 5 2 2 2 4 2 2 2 2 2 2 2 2 3 2 2 2 2 Engineering male f 59 1 1 4 1 2 5 4 2 2 5 4 5 4 3 3 2 4 3 2 3 Engineering male f 29 2 2 4 2 3 3 3 2 2 2 3 2 2 2 3 2 2 3 2 2 Iron Making male f 27 1 1 2 1 2 3 2 1 2 2 2 3 2 2 4 4 2 4 2 1 Iron Making male f 36 2 2 2 2 2 3 3 3 3 2 2 3 2 3 3 3 2 3 2 2 Iron Making male f 31 3 3 4 2 3 4 2 3 2 3 3 3 4 4 3 3 1 4 2 2 Iron Making male f 52 2 2 1 2 2 2 2 2 3 3 3 4 3 3 3 3 4 4 4 3 Iron Making male f 55 1 1 5 2 2 2 3 2 5 2 1 2 2 2 2 3 4 2 2 2 Iron Making male f 29 2 2 3 2 3 3 2 2 3 3 3 3 3 3 3 3 2 4 1 1 Iron Making male f 38 2 2 3 2 3 2 3 2 2 3 3 3 3 3 3 3 2 3 2 2 Iron Making male f 51 1 1 2 2 2 2 2 2 4 5 4 4 5 5 5 5 1 5 1 2 Iron Making male f 25 2 1 4 1 2 2 3 3 3 5 2 5 3 3 3 3 4 3 2 2 Rolling female f 33 1 1 5 1 2 2 4 1 3 4 3 2 3 2 2 4 2 3 2 2 Rolling male f 40 1 1 5 1 1 1 5 1 2 2 2 2 2 2 2 4 1 2 1 1
120
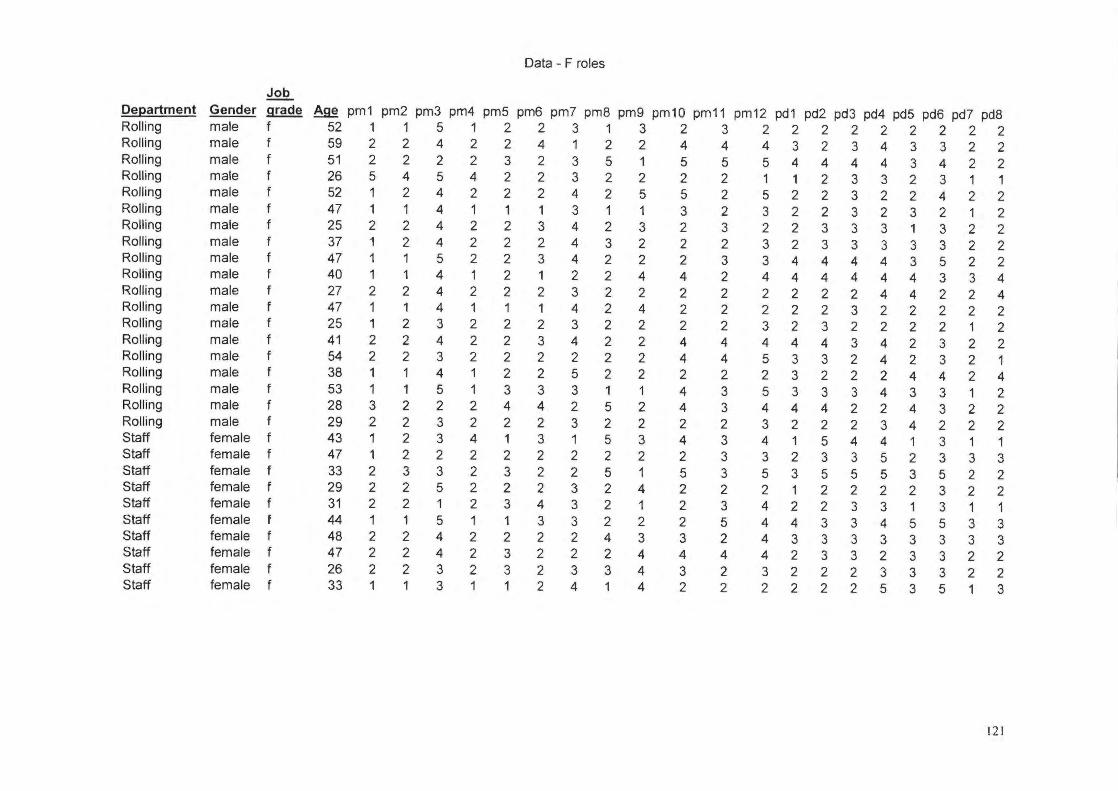
Data - F roles
Job De~artment Gender grade Age pm1 pm2 pm3 pm4 pm5 pm6 pm7 pm8 pm9 pm10 pm11 pm12 pd1 pd2 pd3 pd4 pd5 pd6 pd7 pd8 Rolling male f 52 1 1 5 1 2 2 3 1 3 2 3 2 2 2 2 2 2 2 2 2 Rolling male f 59 2 2 4 2 2 4 1 2 2 4 4 4 3 2 3 4 3 3 2 2 Rolling male f 51 2 2 2 2 3 2 3 5 1 5 5 5 4 4 4 4 3 4 2 2 Rolling male f 26 5 4 5 4 2 2 3 2 2 2 2 1 1 2 3 3 2 3 1 1 Rolling male f 52 1 2 4 2 2 2 4 2 5 5 2 5 2 2 3 2 2 4 2 2 Rolling male f 47 1 1 4 1 1 1 3 1 1 3 2 3 2 2 3 2 3 2 1 2 Rolling male f 25 2 2 4 2 2 3 4 2 3 2 3 2 2 3 3 3 1 3 2 2 Rolling male f 37 1 2 4 2 2 2 4 3 2 2 2 3 2 3 3 3 3 3 2 2 Rolling male f 47 1 1 5 2 2 3 4 2 2 2 3 3 4 4 4 4 3 5 2 2 Rolling male f 40 1 1 4 1 2 1 2 2 4 4 2 4 4 4 4 4 4 3 3 4 Rolling male f 27 2 2 4 2 2 2 3 2 2 2 2 2 2 2 2 4 4 2 2 4 Rolling male f 47 1 1 4 1 1 1 4 2 4 2 2 2 2 2 3 2 2 2 2 2 Rolling male f 25 1 2 3 2 2 2 3 2 2 2 2 3 2 3 2 2 2 2 1 2 Rolling male f 41 2 2 4 2 2 3 4 2 2 4 4 4 4 4 3 4 2 3 2 2 Rolling male f 54 2 2 3 2 2 2 2 2 2 4 4 5 3 3 2 4 2 3 2 1 Rolling male f 38 1 1 4 1 2 2 5 2 2 2 2 2 3 2 2 2 4 4 2 4 Rolling male f 53 1 1 5 1 3 3 3 1 1 4 3 5 3 3 3 4 3 3 1 2 Roll ing male f 28 3 2 2 2 4 4 2 5 2 4 3 4 4 4 2 2 4 3 2 2 Rolling male f 29 2 2 3 2 2 2 3 2 2 2 2 3 2 2 2 3 4 2 2 2 Staff female f 43 1 2 3 4 1 3 1 5 3 4 3 4 1 5 4 4 1 3 1 1 Staff female f 47 1 2 2 2 2 2 2 2 2 2 3 3 2 3 3 5 2 3 3 3 Staff female f 33 2 3 3 2 3 2 2 5 1 5 3 5 3 5 5 5 3 5 2 2 Staff female f 29 2 2 5 2 2 2 3 2 4 2 2 2 1 2 2 2 2 3 2 2 Staff female f 31 2 2 1 2 3 4 3 2 1 2 3 4 2 2 3 3 1 3 1 1 Staff female f 44 1 1 5 1 1 3 3 2 2 2 5 4 4 3 3 4 5 5 3 3 Staff female f 48 2 2 4 2 2 2 2 4 3 3 2 4 3 3 3 3 3 3 3 3 Staff female f 47 2 2 4 2 3 2 2 2 4 4 4 4 2 3 3 2 3 3 2 2 Staff female f 26 2 2 3 2 3 2 3 3 4 3 2 3 2 2 2 3 3 3 2 2 Staff female f 33 1 1 3 1 1 2 4 1 4 2 2 2 2 2 2 5 3 5 1 3
121
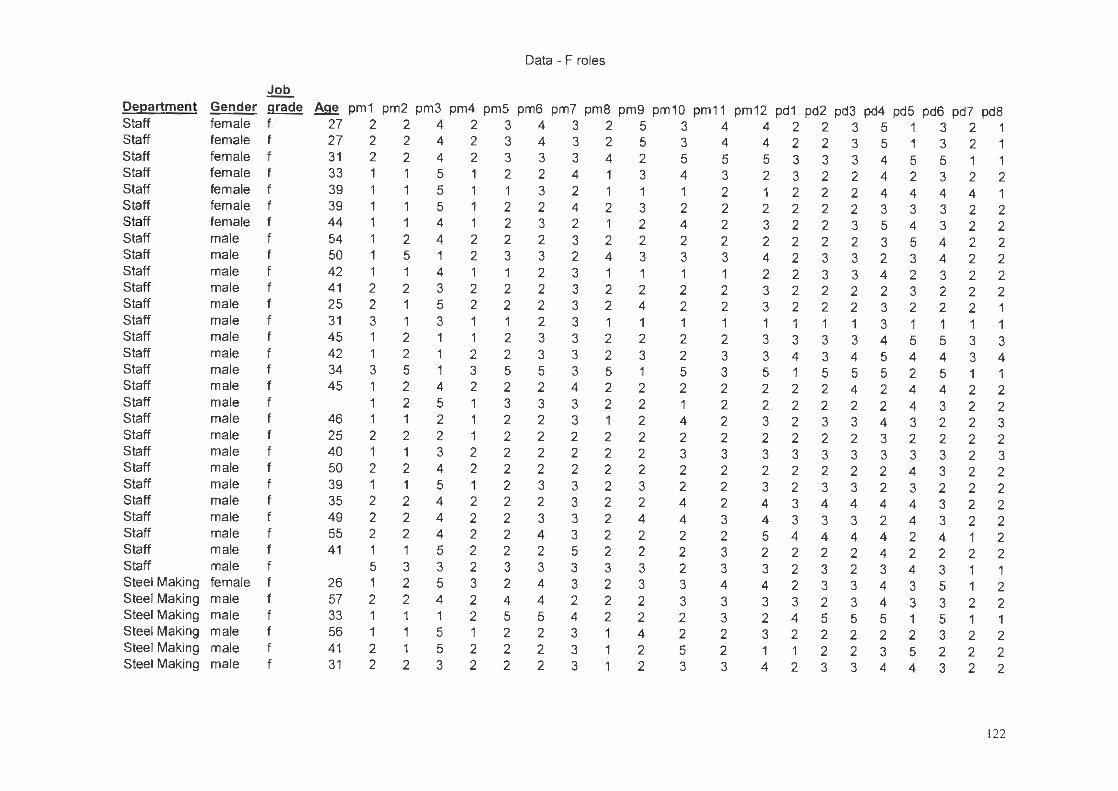
Data - F ro les
Job
Department Gender grade Age pm1 pm2 pm3 pm4 pm5 pm6 pm7 pm8 pm9 pm10 pm11 pm12 pd1 pd2 pd3 pd4 pd5 pd6 pd7 pd8 Staff female f 27 2 2 4 2 3 4 3 2 5 3 4 4 2 2 3 5 1 3 2 1 Staff female f 27 2 2 4 2 3 4 3 2 5 3 4 4 2 2 3 5 1 3 2 1 Staff female f 31 2 2 4 2 3 3 3 4 2 5 5 5 3 3 3 4 5 5 1 1 Staff female f 33 1 1 5 1 2 2 4 1 3 4 3 2 3 2 2 4 2 3 2 2 Staff female f 39 1 1 5 1 1 3 2 1 1 1 2 1 2 2 2 4 4 4 4 1 Staff female f 39 1 1 5 1 2 2 4 2 3 2 2 2 2 2 2 3 3 3 2 2 Staff female f 44 1 1 4 1 2 3 2 1 2 4 2 3 2 2 3 5 4 3 2 2 Staff male f 54 1 2 4 2 2 2 3 2 2 2 2 2 2 2 2 3 5 4 2 2 Staff male f 50 1 5 1 2 3 3 2 4 3 3 3 4 2 3 3 2 3 4 2 2 Staff male f 42 1 1 4 1 1 2 3 1 1 1 1 2 2 3 3 4 2 3 2 2 Staff male f 41 2 2 3 2 2 2 3 2 2 2 2 3 2 2 2 2 3 2 2 2 Staff male f 25 2 1 5 2 2 2 3 2 4 2 2 3 2 2 2 3 2 2 2 1 Staff male f 31 3 1 3 1 1 2 3 1 1 1 1 1 1 1 1 3 1 1 1 1 Staff male f 45 1 2 1 1 2 3 3 2 2 2 2 3 3 3 3 4 5 5 3 3 Staff male f 42 1 2 1 2 2 3 3 2 3 2 3 3 4 3 4 5 4 4 3 4 Staff male f 34 3 5 1 3 5 5 3 5 1 5 3 5 1 5 5 5 2 5 1 1 Staff male f 45 1 2 4 2 2 2 4 2 2 2 2 2 2 2 4 2 4 4 2 2 Staff male f 1 2 5 1 3 3 3 2 2 1 2 2 2 2 2 2 4 3 2 2 Staff male f 46 1 1 2 1 2 2 3 1 2 4 2 3 2 3 3 4 3 2 2 3 Staff male f 25 2 2 2 1 2 2 2 2 2 2 2 2 2 2 2 3 2 2 2 2 Staff male f 40 1 1 3 2 2 2 2 2 2 3 3 3 3 3 3 3 3 3 2 3 Staff male f 50 2 2 4 2 2 2 2 2 2 2 2 2 2 2 2 2 4 3 2 2 Staff male f 39 1 1 5 1 2 3 3 2 3 2 2 3 2 3 3 2 3 2 2 2 Staff male f 35 2 2 4 2 2 2 3 2 2 4 2 4 3 4 4 4 4 3 2 2 Staff male f 49 2 2 4 2 2 3 3 2 4 4 3 4 3 3 3 2 4 3 2 2 Staff male f 55 2 2 4 2 2 4 3 2 2 2 2 5 4 4 4 4 2 4 1 2 Staff male f 41 1 1 5 2 2 2 5 2 2 2 3 2 2 2 2 4 2 2 2 2 Staff male f 5 3 3 2 3 3 3 3 3 2 3 3 2 3 2 3 4 3 1 1 Steel Making female f 26 1 2 5 3 2 4 3 2 3 3 4 4 2 3 3 4 3 5 1 2 Steel Making male f 57 2 2 4 2 4 4 2 2 2 3 3 3 3 2 3 4 3 3 2 2 Steel Making male f 33 1 1 1 2 5 5 4 2 2 2 3 2 4 5 5 5 1 5 1 1 Steel Making male f 56 1 1 5 1 2 2 3 1 4 2 2 3 2 2 2 2 2 3 2 2 Steel Making male f 41 2 1 5 2 2 2 3 1 2 5 2 1 1 2 2 3 5 2 2 2 Steel Making male f 31 2 2 3 2 2 2 3 1 2 3 3 4 2 3 3 4 4 3 2 2
122
Index
Frequency distribution
Descriptive statistics
Data
ANNEXURE J
G ROLES
Page
124
125
126-130
123
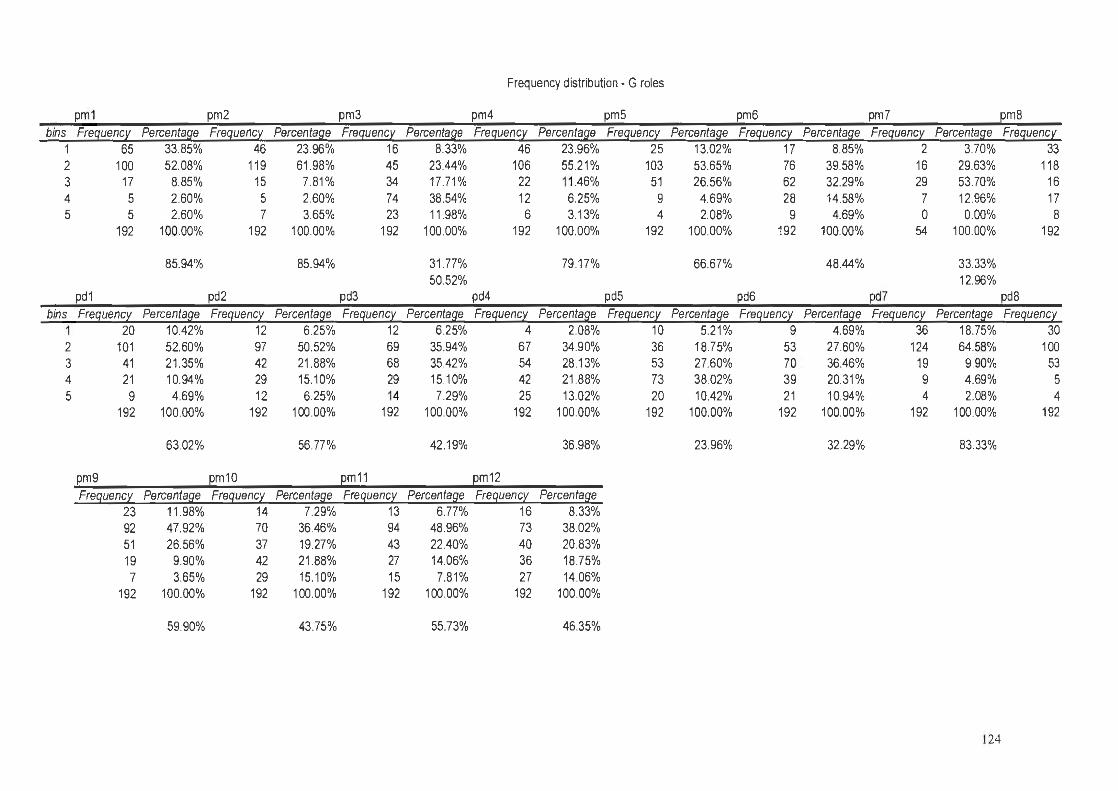
Frequency distribution- G roles
pm1 pm2 pm3 pm4 pm5 pm6 pm7 pm8 bins Frequency Percentage Frequency Percentage Frequency Percentage Frequency Percentage Frequency Percentage Frequency Percentage Frequency Percentage Frequency
1 65 33.85% 46 23.96% 16 8.33% 46 23.96% 25 13.02% 17 8.85% 2 3.70% 33 2 100 52.08% 119 61 .98% 45 23.44% 106 55.21 % 103 53.65% 76 39.58% 16 29.63% 118 3 17 8.85% 15 7.81% 34 17.71% 22 11.46% 51 26.56% 62 32.29% 29 53.70% 16 4 5 2.60% 5 2.60% 74 38.54% 12 6.25% 9 4.69% 28 14.58% 7 12.96% 17 5 5 2.60% 7 3.65% 23 11 .98% 6 3.13% 4 2.08% 9 4.69% 0 0.00% 8
pd1
192 100.00% 192 100.00% 192 100.00% 192 100.00% 192 100.00% 192 100.00% 54 100.00% 192
85.94% 85.94%
pd2 pd3
31.77% 50.52%
pd4
79.17% 66.67% 48.44%
pd5 pd6 pd7
33.33% 12.96%
pd8 bins Frequency Percentafl.e Frequency Percentafl.e Frequency PercentafJ.e Frequency PercentafJ.e Frequency PercentafJ.e Frequency Percentafl.e Frequency PercentafJ.e Frequency
1 20 10.42% 12 6.25% 12 6.25% 4 2.08% 10 5.21% 9 4.69% 36 18.75% 30 2 101 52.60% 97 50.52% 69 35.94% 67 34.90% 36 18.75% 53 27.60% 124 64.58% 100 3 41 21.35% 42 21 .88% 68 35.42% 54 28.13% 53 27.60% 70 36.46% 19 9.90% 53 4 21 10.94% 29 15.10% 29 15.10% 42 21 .88% 73 38.02% 39 20.31% 9 4.69% 5 5 9 4.69% 12 6.25% 14 7.29% 25 13.02% 20 10.42% 21 10.94% 4 2.08% 4
192 100.00% 192 100.00% 192 100.00% 192 100.00% 192 100.00% 192 100.00% 192 100.00% 192
63.02% 56.77% 42.19% 36.98% 23.96% 32.29% 83.33%
pm9 pm10 pm1 1 pm12 Frequency Percentage Frequency Percentage Frequency Percentage Frequency Percentage
23 11.98% 14 7.29% 13 6.77% 16 8.33% 92 47.92% 70 36.46% 94 48.96% 73 38.02% 51 26.56% 37 19.27% 43 22.40% 40 20.83% 19 9.90% 42 21 .88% 27 14.06% 36 18.75% 7 3.65% 29 15.10% 15 7.81% 27 14.06%
192 100.00% 192 100.00% 192 100.00% 192 100.00%
59.90% 43.75% 55.73% 46.35%
124
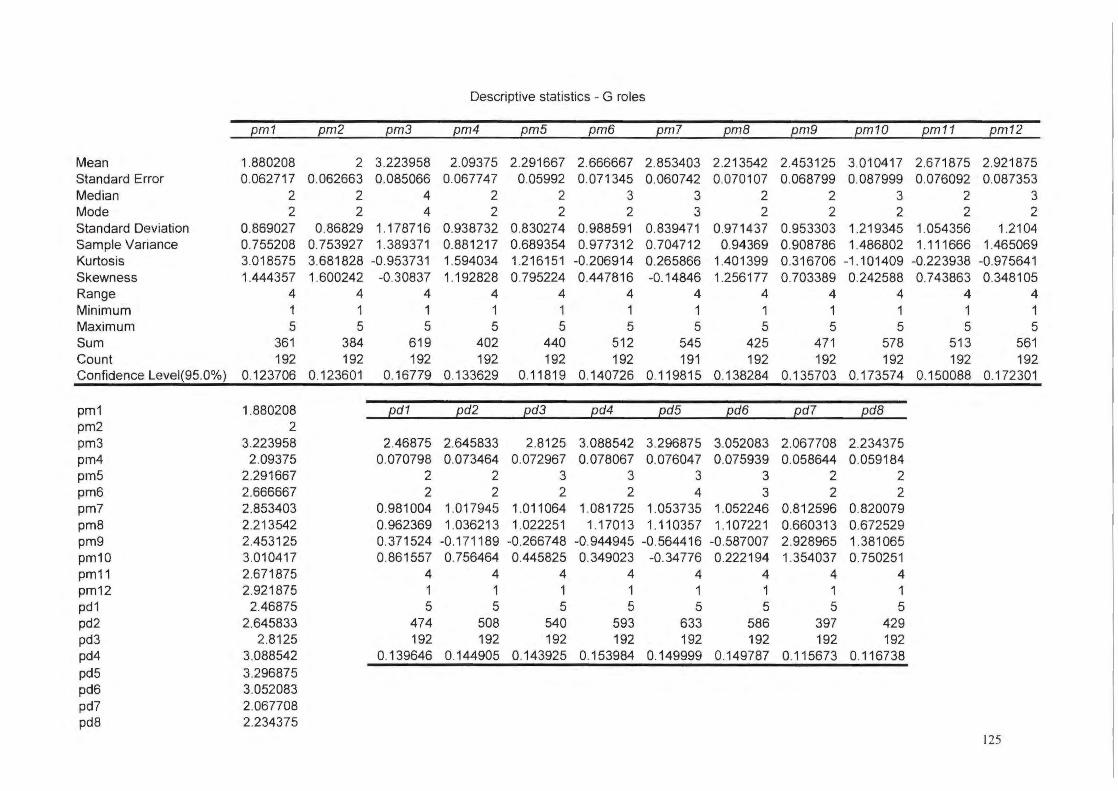
Descriptive statistics - G roles
pm1 pm2 pm3 pm4 pm5 pm6 pml pmB pm9 pm10 pm11 pm12
Mean 1.880208 2 3.223958 2.09375 2.291667 2.666667 2.853403 2.213542 2.453125 3.010417 2.671875 2.921875 Standard Error 0.062717 0.062663 0.085066 0.067747 0.05992 0.071345 0.060742 0.070107 0.068799 0.087999 0.076092 0.087353 Median 2 2 4 2 2 3 3 2 2 3 2 3 Mode 2 2 4 2 2 2 3 2 2 2 2 2 Standard Deviation 0.869027 0.86829 1.178716 0.938732 0.830274 0.988591 0.839471 0.971437 0.953303 1.219345 1.054356 1.2104 Sample Variance 0.755208 0.753927 1.389371 0.881217 0.689354 0.977312 0.704712 0.94369 0.908786 1.486802 1.111666 1.465069 Kurtosis 3.018575 3.681828 -0.953731 1.594034 1.216151 -0.206914 0.265866 1.401399 0.316706 -1. 101409 -0.223938 -0.975641 Skewness 1.444357 1.600242 -0.30837 1.192828 0.795224 0.447816 -0.14846 1.256177 0.703389 0.242588 0.743863 0.348105 Range 4 4 4 4 4 4 4 4 4 4 4 4 Minimum 1 1 1 1 1 1 1 1 1 1 1 1 Maximum 5 5 5 5 5 5 5 5 5 5 5 5 Sum 361 384 619 402 440 512 545 425 471 578 513 561 Count 192 192 192 192 192 192 191 192 192 192 192 192 Confidence Level(95.0%) 0.123706 0.123601 0.16779 0.133629 0.11819 0.140726 0.119815 0.138284 0.135703 0.173574 0.150088 0.172301
pm1 1.880208 pd1 pd2 pd3 pd4 pd5 pd6 pdl pdB pm2 2 pm3 3.223958 2.46875 2.645833 2.8125 3.088542 3.296875 3.052083 2.067708 2.234375 pm4 2.09375 0.070798 0.073464 0.072967 0.078067 0.076047 0.075939 0.058644 0.059184 pm5 2.291667 2 2 3 3 3 3 2 2 pm6 2.666667 2 2 2 2 4 3 2 2 pm7 2.853403 0.981004 1.017945 1.011064 1.081725 1.053735 1.052246 0.812596 0.820079 pm8 2.213542 0.962369 1.036213 1.022251 1.17013 1.110357 1.107221 0.660313 0.672529 pm9 2.453125 0.371524 -0.171189 -0.266748 -0.944945 -0.564416 -0.587007 2.928965 1.381065 pm10 3.010417 0.861557 0.756464 0.445825 0.349023 -0.34776 0.222194 1.354037 0.750251 pm11 2.671875 4 4 4 4 4 4 4 4 pm12 2.921875 1 1 1 1 1 1 1 1 pd1 2.46875 5 5 5 5 5 5 5 5 pd2 2.645833 474 508 540 593 633 586 397 429 pd3 2.8125 192 192 192 192 192 192 192 192 pd4 3.088542 0.139646 0.144905 0.143925 0.153984 0.149999 0.149787 0.115673 0.116738 pd5 3.296875 pd6 3.052083 pd7 2.067708 pd8 2.234375
125
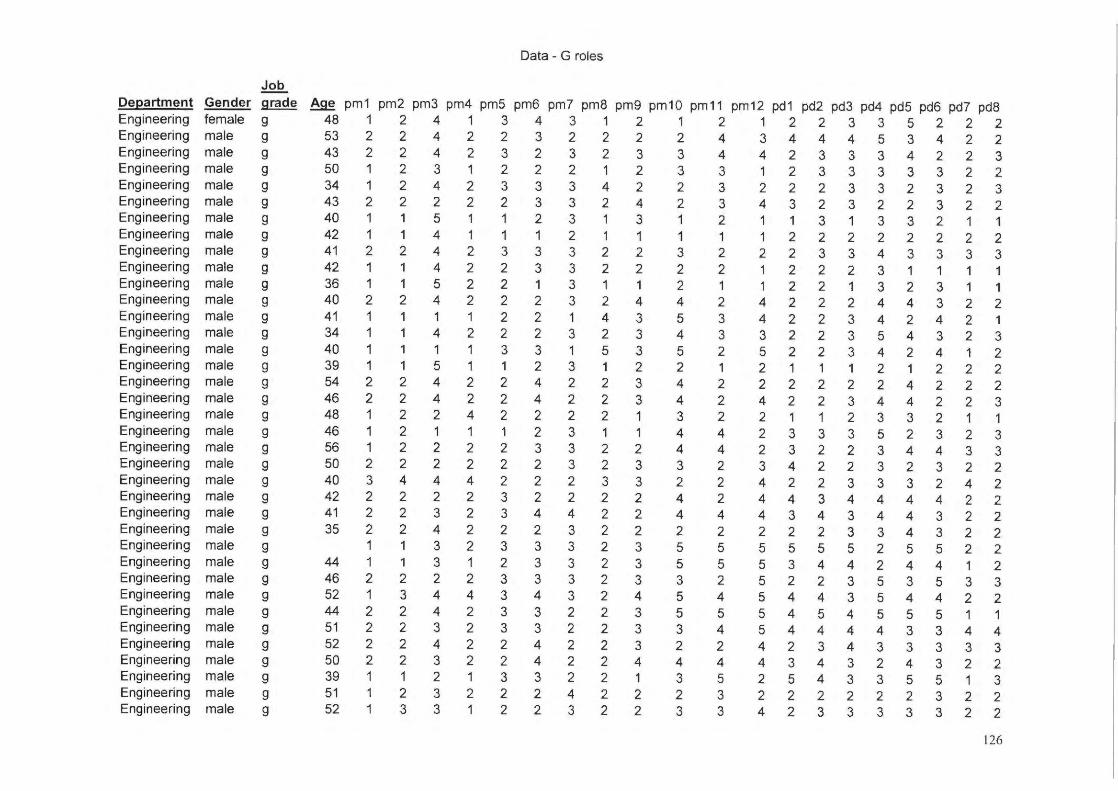
Data - G roles
Job
Department Gender grade Age pm1 pm2 pm3 pm4 pm5 pm6 pm7 pm8 pm9 pm10 pm11 pm12 pd1 pd2 pd3 pd4 pd5 pd6 pd7 pd8 Engineering female g 48 1 2 4 1 3 4 3 1 2 1 2 1 2 2 3 3 5 2 2 2 Engineering male g 53 2 2 4 2 2 3 2 2 2 2 4 3 4 4 4 5 3 4 2 2 Engineering male g 43 2 2 4 2 3 2 3 2 3 3 4 4 2 3 3 3 4 2 2 3 Engineering male g 50 1 2 3 1 2 2 2 1 2 3 3 1 2 3 3 3 3 3 2 2 Engineering male g 34 1 2 4 2 3 3 3 4 2 2 3 2 2 2 3 3 2 3 2 3 Engineering male g 43 2 2 2 2 2 3 3 2 4 2 3 4 3 2 3 2 2 3 2 2 Engineering male g 40 1 1 5 1 1 2 3 1 3 1 2 1 1 3 1 3 3 2 1 1 Engineering male g 42 1 1 4 1 1 1 2 1 1 1 1 1 2 2 2 2 2 2 2 2 Engineering male g 41 2 2 4 2 3 3 3 2 2 3 2 2 2 3 3 4 3 3 3 3 Engineering male g 42 1 1 4 2 2 3 3 2 2 2 2 1 2 2 2 3 1 1 1 1 Engineering male g 36 1 1 5 2 2 1 3 1 1 2 1 1 2 2 1 3 2 3 1 1 Engineering male g 40 2 2 4 2 2 2 3 2 4 4 2 4 2 2 2 4 4 3 2 2 Engineering male g 41 1 1 1 1 2 2 1 4 3 5 3 4 2 2 3 4 2 4 2 1 Engineering male g 34 1 1 4 2 2 2 3 2 3 4 3 3 2 2 3 5 4 3 2 3 Engineering male g 40 1 1 1 1 3 3 1 5 3 5 2 5 2 2 3 4 2 4 1 2 Engineering male g 39 1 1 5 1 1 2 3 1 2 2 1 2 1 1 1 2 1 2 2 2 Engineering male g 54 2 2 4 2 2 4 2 2 3 4 2 2 2 2 2 2 4 2 2 2 Engineering male g 46 2 2 4 2 2 4 2 2 3 4 2 4 2 2 3 4 4 2 2 3 Engineering male g 48 1 2 2 4 2 2 2 2 1 3 2 2 1 1 2 3 3 2 1 1 Engineering male g 46 1 2 1 1 1 2 3 1 1 4 4 2 3 3 3 5 2 3 2 3 Engineering male g 56 1 2 2 2 2 3 3 2 2 4 4 2 3 2 2 3 4 4 3 3 Engineering male g 50 2 2 2 2 2 2 3 2 3 3 2 3 4 2 2 3 2 3 2 2 Engineering male g 40 3 4 4 4 2 2 2 3 3 2 2 4 2 2 3 3 3 2 4 2 Engineering male g 42 2 2 2 2 3 2 2 2 2 4 2 4 4 3 4 4 4 4 2 2 Engineering male g 41 2 2 3 2 3 4 4 2 2 4 4 4 3 4 3 4 4 3 2 2 Engineering male g 35 2 2 4 2 2 2 3 2 2 2 2 2 2 2 3 3 4 3 2 2 Engineering male g 1 1 3 2 3 3 3 2 3 5 5 5 5 5 5 2 5 5 2 2 Engineering male g 44 1 1 3 1 2 3 3 2 3 5 5 5 3 4 4 2 4 4 1 2 Engineering male g 46 2 2 2 2 3 3 3 2 3 3 2 5 2 2 3 5 3 5 3 3 Engineering male g 52 1 3 4 4 3 4 3 2 4 5 4 5 4 4 3 5 4 4 2 2 Engineering male g 44 2 2 4 2 3 3 2 2 3 5 5 5 4 5 4 5 5 5 1 1 Engineering male g 51 2 2 3 2 3 3 2 2 3 3 4 5 4 4 4 4 3 3 4 4 Engineering male g 52 2 2 4 2 2 4 2 2 3 2 2 4 2 3 4 3 3 3 3 3 Engineering male g 50 2 2 3 2 2 4 2 2 4 4 4 4 3 4 3 2 4 3 2 2 Engineering male g 39 1 1 2 1 3 3 2 2 1 3 5 2 5 4 3 3 5 5 1 3 Engineering male g 51 1 2 3 2 2 2 4 2 2 2 3 2 2 2 2 2 2 3 2 2 Engineering male g 52 1 3 3 1 2 2 3 2 2 3 3 4 2 3 3 3 3 3 2 2
126
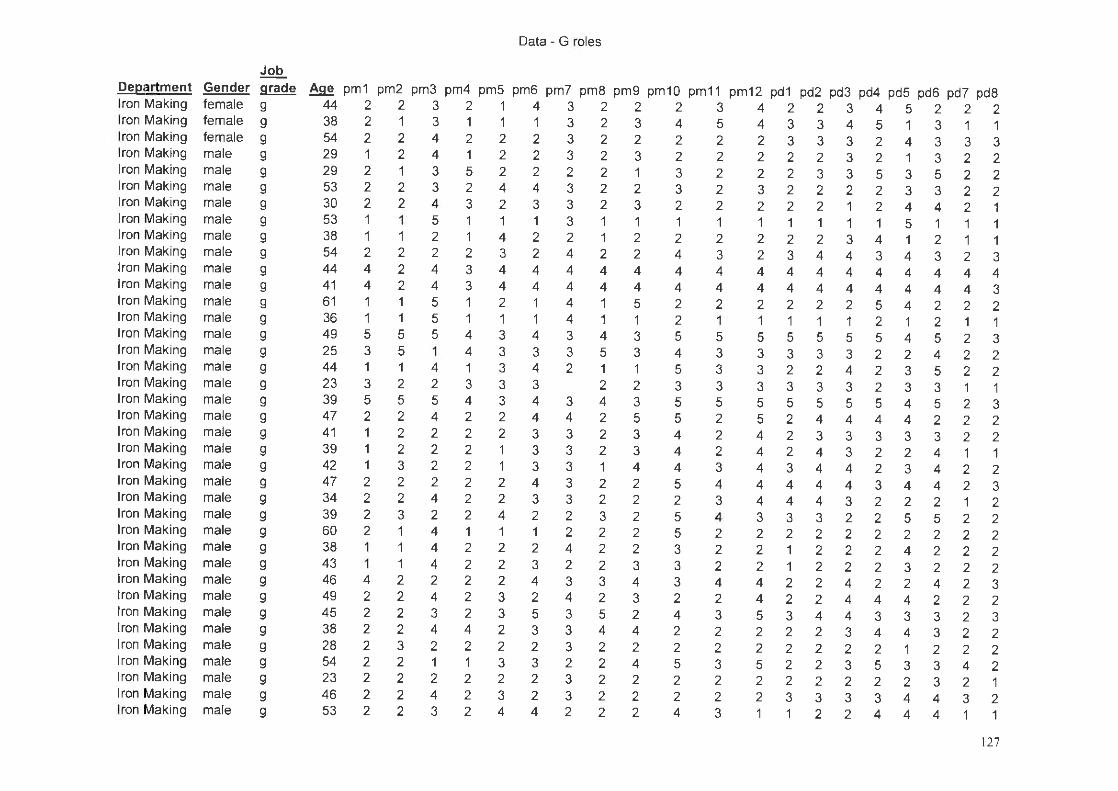
Data - G roles
Job
Department Gender grade Age pm1 pm2 pm3 pm4 pm5 pm6 pm7 pm8 pm9 pm10 pm11 pm12 pd1 pd2 pd3 pd4 pd5 pd6 pd7 pd8 Iron Making female 44 2 g 2 3 2 1 4 3 2 2 2 3 4 2 2 3 4 5 2 2 2 Iron Making female g 38 2 1 3 1 1 1 3 2 3 4 5 4 3 3 4 5 1 3 1 1 Iron Making female g 54 2 2 4 2 2 2 3 2 2 2 2 2 3 3 3 2 4 3 3 3 Iron Making male g 29 1 2 4 1 2 2 3 2 3 2 2 2 2 2 3 2 1 3 2 2 Iron Making male g 29 2 1 3 5 2 2 2 2 1 3 2 2 2 3 3 5 3 5 2 2 Iron Making male g 53 2 2 3 2 4 4 3 2 2 3 2 3 2 2 2 2 3 3 2 2 Iron Making male g 30 2 2 4 3 2 3 3 2 3 2 2 2 2 2 1 2 4 4 2 1 Iron Making male g 53 1 1 5 1 1 1 3 1 1 1 1 1 1 1 1 1 5 1 1 1 Iron Making male g 38 1 1 2 1 4 2 2 1 2 2 2 2 2 2 3 4 1 2 1 1 Iron Making male g 54 2 2 2 2 3 2 4 2 2 4 3 2 3 4 4 3 4 3 2 3 Iron Making male g 44 4 2 4 3 4 4 4 4 4 4 4 4 4 4 4 4 4 4 4 4 Iron Making male g 41 4 2 4 3 4 4 4 4 4 4 4 4 4 4 4 4 4 4 4 3 Iron Making male g 61 1 1 5 1 2 1 4 1 5 2 2 2 2 2 2 5 4 2 2 2 Iron Making male g 36 1 1 5 1 1 1 4 1 1 2 1 1 1 1 1 2 1 2 1 1 Iron Making male g 49 5 5 5 4 3 4 3 4 3 5 5 5 5 5 5 5 4 5 2 3 Iron Making male g 25 3 5 1 4 3 3 3 5 3 4 3 3 3 3 3 2 2 4 2 2 Iron Making male g 44 1 1 4 1 3 4 2 1 1 5 3 3 2 2 4 2 3 5 2 2 Iron Making male g 23 3 2 2 3 3 3 2 2 3 3 3 3 3 3 2 3 3 1 1 Iron Making male g 39 5 5 5 4 3 4 3 4 3 5 5 5 5 5 5 5 4 5 2 3 Iron Making male g 47 2 2 4 2 2 4 4 2 5 5 2 5 2 4 4 4 4 2 2 2 Iron Making male g 41 1 2 2 2 2 3 3 2 3 4 2 4 2 3 3 3 3 3 2 2 Iron Making male g 39 1 2 2 2 1 3 3 2 3 4 2 4 2 4 3 2 2 4 1 1 Iron Making male g 42 1 3 2 2 1 3 3 1 4 4 3 4 3 4 4 2 3 4 2 2 Iron Making male g 47 2 2 2 2 2 4 3 2 2 5 4 4 4 4 4 3 4 4 2 3 Iron Making male g 34 2 2 4 2 2 3 3 2 2 2 3 4 4 4 3 2 2 2 1 2 Iron Making male g 39 2 3 2 2 4 2 2 3 2 5 4 3 3 3 2 2 5 5 2 2 Iron Making male g 60 2 1 4 1 1 1 2 2 2 5 2 2 2 2 2 2 2 2 2 2 Iron Making male g 38 1 1 4 2 2 2 4 2 2 3 2 2 1 2 2 2 4 2 2 2 Iron Making male g 43 1 1 4 2 2 3 2 2 3 3 2 2 1 2 2 2 3 2 2 2 Iron Making male g 46 4 2 2 2 2 4 3 3 4 3 4 4 2 2 4 2 2 4 2 3 Iron Making male g 49 2 2 4 2 3 2 4 2 3 2 2 4 2 2 4 4 4 2 2 2 Iron Making male g 45 2 2 3 2 3 5 3 5 2 4 3 5 3 4 4 3 3 3 2 3 Iron Making male g 38 2 2 4 4 2 3 3 4 4 2 2 2 2 2 3 4 4 3 2 2 Iron Making male g 28 2 3 2 2 2 2 3 2 2 2 2 2 2 2 2 2 1 2 2 2 Iron Making male g 54 2 2 1 1 3 3 2 2 4 5 3 5 2 2 3 5 3 3 4 2 Iron Making male g 23 2 2 2 2 2 2 3 2 2 2 2 2 2 2 2 2 2 3 2 Iron Making male g 46 2 2 4 2 3 2 3 2 2 2 2 2 3 3 3 3 4 4 3 2 Iron Making male g 53 2 2 3 2 4 4 2 2 2 4 3 1 1 2 2 4 4 4 1 1
127
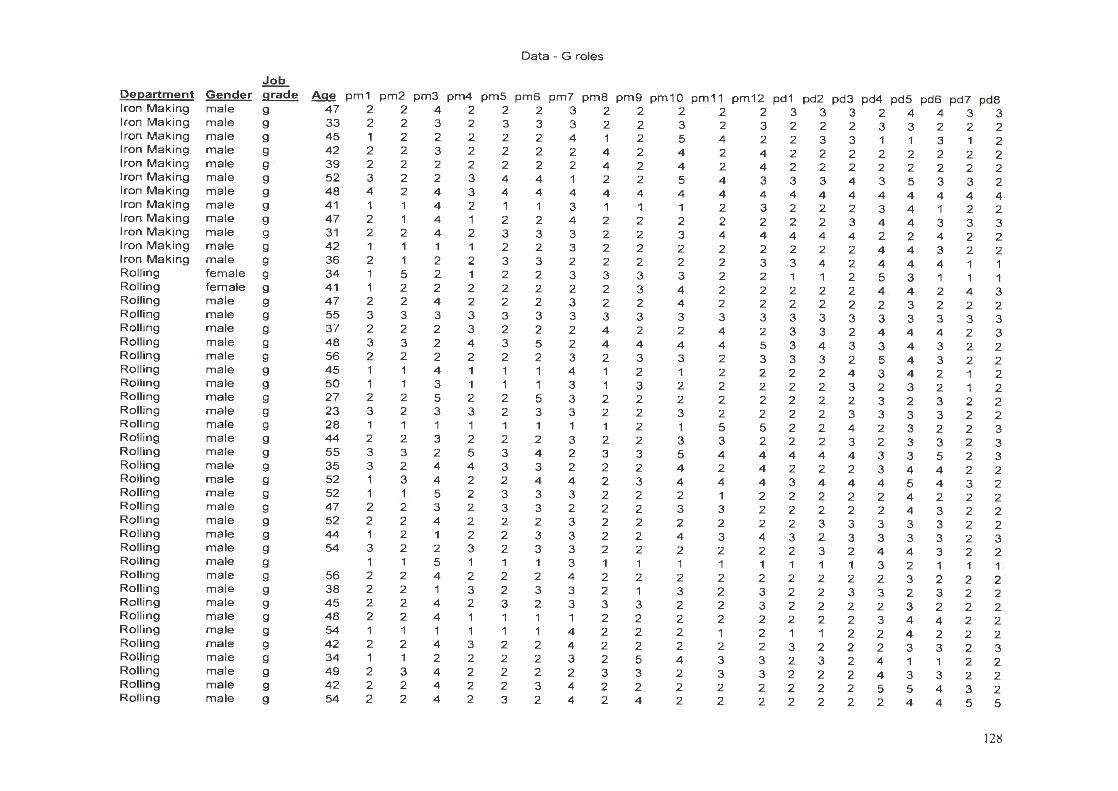
D epartment Iron Making Iron Making Iron Making Iron Making Iron Making Iron Making Iron Making Iron Making Iron Making Iron Making Iron Making Iron Making Roll ing Roll ing Rolling Rolling Roll ing Roll ing Roll ing Rolling Rolling Rolling Rolling Rolling Roll ing Rolling Rolling Rolling Rolling Roll ing Rolling Rolling Rolling Roll ing Rolling Ro lling Roll ing Roll ing Rolling Roll ing Rolling Ro lling Ro ll ing Rolling
Job G ender grade ma le g male g male g male g male g male g male g male g male g male g male g male g fe male g fe male g male g male g male g male g male g male g male g male g male g male g male g male g male g male g male g male g male g male g male g male g male g male g male g male g male g male g male g male g male g male g
D ata - G ro les
Age pm1 pm2 p m 3 pm4 p m 5 pm6 pm7 p m 8 pm 9 pm1 0 pm 11 pm12 pd1 pd2 pd3 pd4 pd5 pd6 pd7 pd8 47 2 2 4 2 2 2 3 2 2 2 2 2 3 3 3 2 4 4 3 3 33 2 2 3 2 3 3 3 2 2 3 2 3 2 2 2 3 3 2 2 2 45 1 2 2 2 2 2 4 1 2 5 4 2 2 3 3 1 1 3 1 2 4 2 2 2 3 2 2 2 2 4 2 4 2 4 2 2 2 2 2 2 2 2 39 2 2 2 2 2 2 2 4 2 4 2 4 2 2 2 2 2 2 2 2 52 3 2 2 3 4 4 1 2 2 5 4 3 3 3 4 3 5 3 3 2 48 4 2 4 3 4 4 4 4 4 4 4 4 4 4 4 4 4 4 4 4 41 1 1 4 2 1 1 3 1 1 1 2 3 2 2 2 3 4 1 2 2 47 2 1 4 1 2 2 4 2 2 2 2 2 2 2 3 4 4 3 3 3 3 1 2 2 4 2 3 3 3 2 2 3 4 4 4 4 4 2 2 4 2 2 42 1 1 1 1 2 2 3 2 2 2 2 2 2 2 2 4 4 3 2 2 36 2 1 2 2 3 3 2 2 2 2 2 3 3 4 2 4 4 4 1 1 34 1 5 2 1 2 2 3 3 3 3 2 2 1 1 2 5 3 1 1 1 41 1 2 2 2 2 2 2 2 3 4 2 2 2 2 2 4 4 2 4 3 47 2 2 4 2 2 2 3 2 2 4 2 2 2 2 2 2 3 2 2 2 55 3 3 3 3 3 3 3 3 3 3 3 3 3 3 3 3 3 3 3 3 37 2 2 2 3 2 2 2 4 2 2 4 2 3 3 2 4 4 4 2 3 48 3 3 2 4 3 5 2 4 4 4 4 5 3 4 3 3 4 3 2 2 56 2 2 2 2 2 2 3 2 3 3 2 3 3 3 2 5 4 3 2 2 45 1 1 4 1 1 1 4 1 2 1 2 2 2 2 4 3 4 2 1 2 50 1 1 3 1 1 1 3 1 3 2 2 2 2 2 3 2 3 2 1 2 27 2 2 5 2 2 5 3 2 2 2 2 2 2 2 2 3 2 3 2 2 2 3 3 2 3 3 2 3 3 2 2 3 2 2 2 2 3 3 3 3 2 2 2 8 1 1 1 1 1 1 1 1 2 1 5 5 2 2 4 2 3 2 2 3 44 2 2 3 2 2 2 3 2 2 3 3 2 2 2 3 2 3 3 2 3 55 3 3 2 5 3 4 2 3 3 5 4 4 4 4 4 3 3 5 2 3 35 3 2 4 4 3 3 2 2 2 4 2 4 2 2 2 3 4 4 2 2 52 1 3 4 2 2 4 4 2 3 4 4 4 3 4 4 4 5 4 3 2 52 1 1 5 2 3 3 3 2 2 2 1 2 2 2 2 2 4 2 2 2 47 2 2 3 2 3 3 2 2 2 3 3 2 2 2 2 2 4 3 2 2 52 2 2 4 2 2 2 3 2 2 2 2 2 2 3 3 3 3 3 2 2 44 1 2 1 2 2 3 3 2 2 4 3 4 3 2 3 3 3 3 2 3 54 3 2 2 3 2 3 3 2 2 2 2 2 2 3 2 4 4 3 2 2
11 5 1 1 1 3 1 1 1 1 1 111 3 21 11 56 2 2 4 2 2 2 4 2 2 2 2 2 2 2 2 2 3 2 2 2 38 2 2 1 3 2 3 3 2 1 3 2 3 2 2 3 3 2 3 2 2 45 2 2 4 2 3 2 3 3 3 2 2 3 2 2 2 2 3 2 2 2 48 2 2 4 1 1 1 1 2 2 2 2 2 2 2 2 3 4 4 2 2 54 1 1 1 1 1 1 4 2 2 2 1 2 1 1 2 2 4 2 2 2 4 2 2 2 4 3 2 2 4 2 2 2 2 2 3 2 2 2 3 3 2 3 34 1 1 2 2 2 2 3 2 5 4 3 3 2 3 2 4 1 1 2 2 49 2 3 4 2 2 2 2 3 3 2 3 3 2 2 2 4 3 3 2 2 4 2 2 2 4 2 2 3 4 2 2 2 2 2 2 2 2 5 5 4 3 2 54 2 2 4 2 3 2 4 2 4 2 2 2 2 2 2 2 4 4 5 5
128
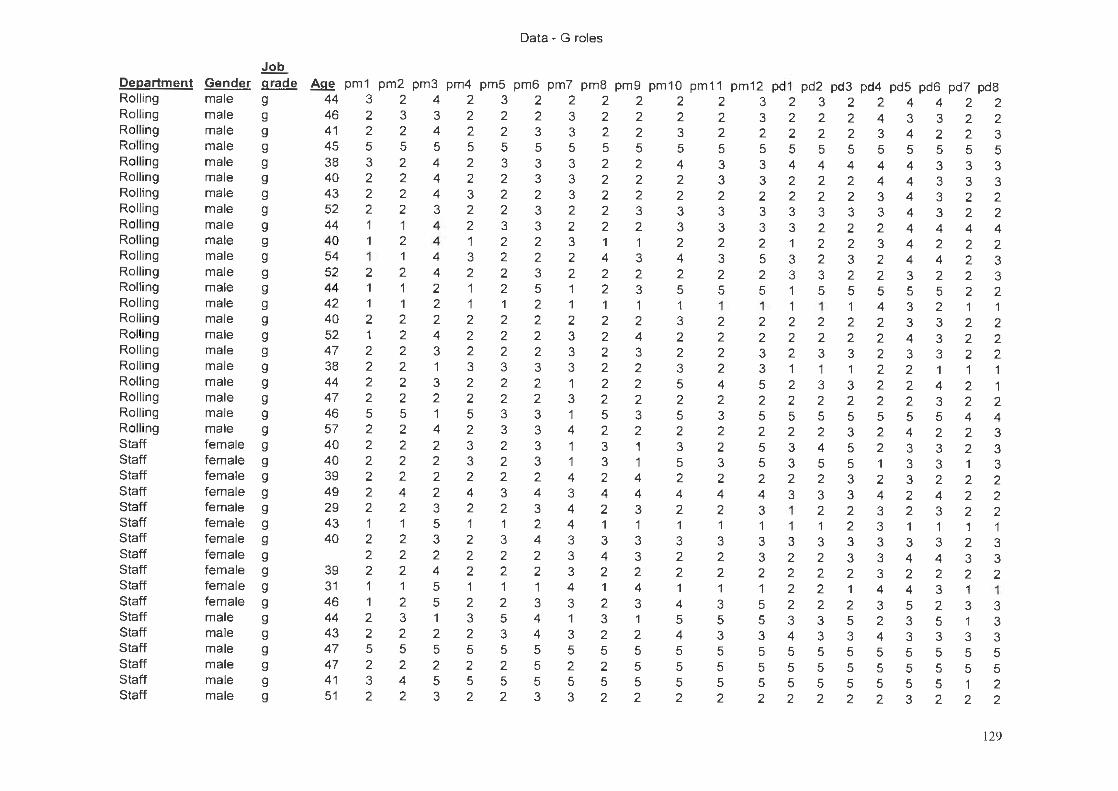
Department Rolling Rolling Rolling Rolling Rolling Rolling Rolling Rolling Rolling Rolling Rolling Rolling Rolling Rolling Rolling Rolling Rolling Rolling Rolling Rolling Rolling Rolling Staff Staff Staff Staff Staff Staff Staff Staff Staff Staff Staff Staff Staff Staff Staff Staff Staff
Job Gender grade male g male g male g male g male g male g male g male g male g male g male g male g male g male g male g male g male g male g male g male g male g male g female g female g female g female g female g female g female g female g female 9 female g female g male 9 male 9 male g male g male 9 male 9
Data - G roles
Age pm1 pm2 pm3 pm4 pm5 pm6 pm7 pm8 pm9 pm10 pm11 pm12 pd1 pd2 pd3 pd4 pd5 pd6 pd7 pd8 44 3 2 4 2 3 2 2 2 2 2 2 3 2 3 2 2 4 4 2 2 46 2 3 3 2 2 2 3 2 2 2 2 3 2 2 2 4 3 3 2 2 41 2 2 4 2 2 3 3 2 2 3 2 2 2 2 2 3 4 2 2 3 45 5 5 5 5 5 5 5 5 5 5 5 5 5 5 5 5 5 5 5 5 38 3 2 4 2 3 3 3 2 2 4 3 3 4 4 4 4 4 3 3 3 40 2 2 4 2 2 3 3 2 2 2 3 3 2 2 2 4 4 3 3 3 43 2 2 4 3 2 2 3 2 2 2 2 2 2 2 2 3 4 3 2 2 52 2 2 3 2 2 3 2 2 3 3 3 3 3 3 3 3 4 3 2 2 44 1 1 4 2 3 3 2 2 2 3 3 3 3 2 2 2 4 4 4 4 40 1 2 4 1 2 2 3 1 1 2 2 2 1 2 2 3 4 2 2 2 54 1 1 4 3 2 2 2 4 3 4 3 5 3 2 3 2 4 4 2 3 52 2 2 4 2 2 3 2 2 2 2 2 2 3 3 2 2 3 2 2 3 44 1 1 2 1 2 5 1 2 3 5 5 5 1 5 5 5 5 5 2 2 42 1 1 2 1 1 2 1 1 1 1 1 1 1 1 1 4 3 2 1 40 2 2 2 2 2 2 2 2 2 3 2 2 2 2 2 2 3 3 2 2 52 1 2 4 2 2 2 3 2 4 2 2 2 2 2 2 2 4 3 2 2 47 2 2 3 2 2 2 3 2 3 2 2 3 2 3 3 2 3 3 2 2 38 2 2 1 3 3 3 3 2 2 3 2 3 1 1 1 2 2 1 1 1 44 2 2 3 2 2 2 1 2 2 5 4 5 2 3 3 2 2 4 2 1 47 2 2 2 2 2 2 3 2 2 2 2 2 2 2 2 2 2 3 2 2 46 5 5 1 5 3 3 1 5 3 5 3 5 5 5 5 5 5 5 4 4 57 2 2 4 2 3 3 4 2 2 2 2 2 2 2 3 2 4 2 2 3 40 2 2 2 3 2 3 1 3 1 3 2 5 3 4 5 2 3 3 2 3 40 2 2 2 3 2 3 1 3 1 5 3 5 3 5 5 1 3 3 1 3 39 2 2 2 2 2 2 4 2 4 2 2 2 2 2 3 2 3 2 2 2 49 2 4 2 4 3 4 3 4 4 4 4 4 3 3 3 4 2 4 2 2 29 2 2 3 2 2 3 4 2 3 2 2 3 1 2 2 3 2 3 2 2 43 1 1 5 1 1 2 4 1 1 1 1 1 1 1 2 3 1 1 1 1 40 2 2 3 2 3 4 3 3 3 3 3 3 3 3 3 3 3 3 2 3
2 2 2 2 2 2 3 4 3 2 2 3 2 2 3 3 4 4 3 3 39 2 2 4 2 2 2 3 2 2 2 2 2 2 2 2 3 2 2 2 2 31 1 1 5 1 1 1 4 1 4 1 1 1 2 2 1 4 4 3 1 1 46 1 2 5 2 2 3 3 2 3 4 3 5 2 2 2 3 5 2 3 3 44 2 3 1 3 5 4 1 3 1 5 5 5 3 3 5 2 3 5 1 3 43 2 2 2 2 3 4 3 2 2 4 3 3 4 3 3 4 3 3 3 3 47 5 5 5 5 5 5 5 5 5 5 5 5 5 5 5 5 5 5 5 5 47 2 2 2 2 2 5 2 2 5 5 5 5 5 5 5 5 5 5 5 5 41 3 4 5 5 5 5 5 5 5 5 5 5 5 5 5 5 5 5 1 2 51 2 2 3 2 2 3 3 2 2 2 2 2 2 2 2 2 3 2 2 2
129
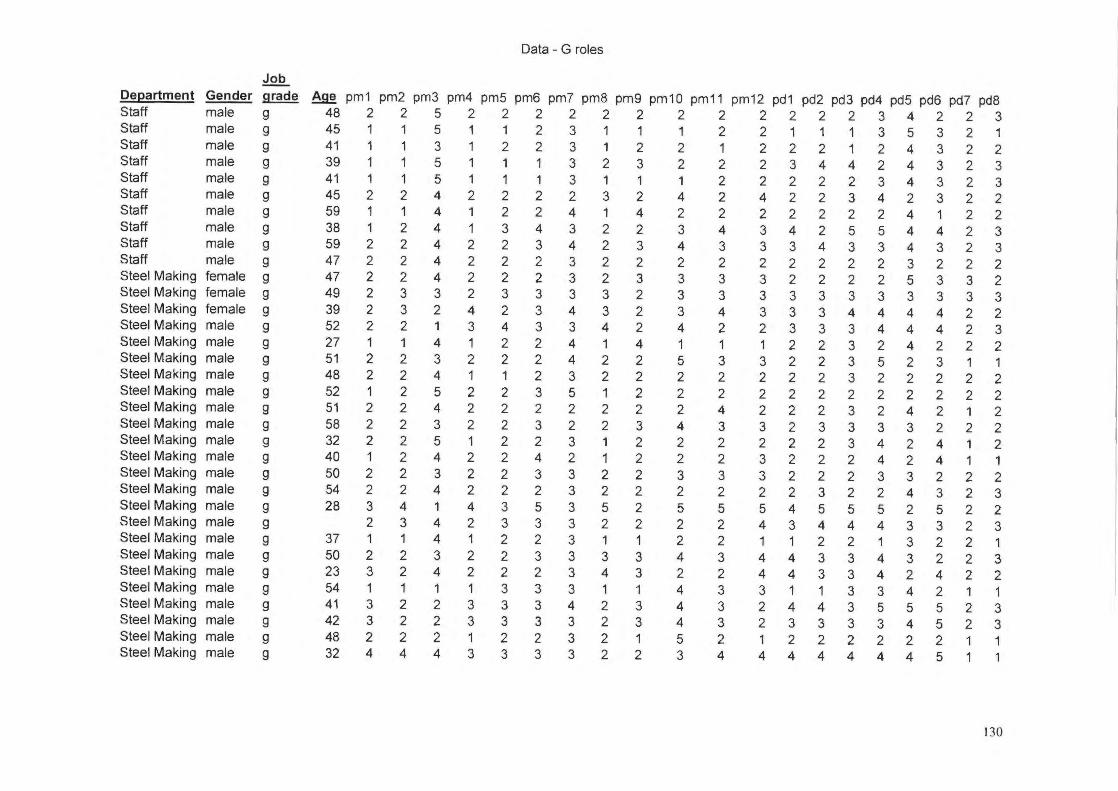
Data - G roles
Job
Department Gender grade Age pm1 pm2 pm3 pm4 pm5 pm6 pm7 pm8 pm9 pm10 pm11 pm12 pd1 pd2 pd3 pd4 pd5 pd6 pd7 pd8 Staff male g 48 2 2 5 2 2 2 2 2 2 2 2 2 2 2 2 3 4 2 2 3 Staff male g 45 1 1 5 1 1 2 3 1 1 1 2 2 1 1 1 3 5 3 2 1 Staff male g 41 1 1 3 1 2 2 3 1 2 2 1 2 2 2 1 2 4 3 2 2 Staff male g 39 1 1 5 1 1 1 3 2 3 2 2 2 3 4 4 2 4 3 2 3 Staff male g 41 1 1 5 1 1 1 3 1 1 1 2 2 2 2 2 3 4 3 2 3 Staff male g 45 2 2 4 2 2 2 2 3 2 4 2 4 2 2 3 4 2 3 2 2 Staff male g 59 1 1 4 1 2 2 4 1 4 2 2 2 2 2 2 2 4 1 2 2 Staff male g 38 1 2 4 1 3 4 3 2 2 3 4 3 4 2 5 5 4 4 2 3 Staff male g 59 2 2 4 2 2 3 4 2 3 4 3 3 3 4 3 3 4 3 2 3 Staff male g 47 2 2 4 2 2 2 3 2 2 2 2 2 2 2 2 2 3 2 2 2 Steel Making female g 47 2 2 4 2 2 2 3 2 3 3 3 3 2 2 2 2 5 3 3 2 Steel Making female g 49 2 3 3 2 3 3 3 3 2 3 3 3 3 3 3 3 3 3 3 3 Steel Making female g 39 2 3 2 4 2 3 4 3 2 3 4 3 3 3 4 4 4 4 2 2 Steel Making male g 52 2 2 1 3 4 3 3 4 2 4 2 2 3 3 3 4 4 4 2 3 Steel Making male g 27 1 1 4 1 2 2 4 1 4 1 1 1 2 2 3 2 4 2 2 2 Steel Making male g 51 2 2 3 2 2 2 4 2 2 5 3 3 2 2 3 5 2 3 1 1 Steel Making male g 48 2 2 4 1 1 2 3 2 2 2 2 2 2 2 3 2 2 2 2 2 Steel Making male g 52 1 2 5 2 2 3 5 1 2 2 2 2 2 2 2 2 2 2 2 2 Steel Making male g 51 2 2 4 2 2 2 2 2 2 2 4 2 2 2 3 2 4 2 1 2 Steel Making male g 58 2 2 3 2 2 3 2 2 3 4 3 3 2 3 3 3 3 2 2 2 Steel Making male g 32 2 2 5 1 2 2 3 1 2 2 2 2 2 2 3 4 2 4 1 2 Steel Making male g 40 1 2 4 2 2 4 2 1 2 2 2 3 2 2 2 4 2 4 1 1 Steel Making male g 50 2 2 3 2 2 3 3 2 2 3 3 3 2 2 2 3 3 2 2 2 Steel Making male g 54 2 2 4 2 2 2 3 2 2 2 2 2 2 3 2 2 4 3 2 3 Steel Making male g 28 3 4 1 4 3 5 3 5 2 5 5 5 4 5 5 5 2 5 2 2 Steel Making male g 2 3 4 2 3 3 3 2 2 2 2 4 3 4 4 4 3 3 2 3 Steel Making male g 37 1 1 4 1 2 2 3 1 1 2 2 1 1 2 2 1 3 2 2 1 Steel Making male g 50 2 2 3 2 2 3 3 3 3 4 3 4 4 3 3 4 3 2 2 3 Steel Making male g 23 3 2 4 2 2 2 3 4 3 2 2 4 4 3 3 4 2 4 2 2 Steel Making male g 54 1 1 1 1 3 3 3 1 1 4 3 3 1 1 3 3 4 2 1 1 Steel Making male g 41 3 2 2 3 3 3 4 2 3 4 3 2 4 4 3 5 5 5 2 3 Steel Making male g 42 3 2 2 3 3 3 3 2 3 4 3 2 3 3 3 3 4 5 2 3 Steel Making male g 48 2 2 2 1 2 2 3 2 1 5 2 1 2 2 2 2 2 2 1 1 Steel Making male g 32 4 4 4 3 3 3 3 2 2 3 4 4 4 4 4 4 4 5 1 1
130

I [I
ON3