IS THE BALANCED SCORECARD USEFUL IN A ... - Theseus
38
Vu Ngoc Mai IS THE BALANCED SCORECARD USEFUL IN A COMPETITIVE INDUSTRY? Using Tesco PLC as a case study in the UK grocery retail industry Thesis CENTRIA UNIVERSITY OF APPLIED SCIENCES Business Management November 2016
-
Upload
khangminh22 -
Category
Documents
-
view
2 -
download
0
Transcript of IS THE BALANCED SCORECARD USEFUL IN A ... - Theseus

Vu Ngoc Mai IS THE BALANCED SCORECARD USEFUL IN A COMPETITIVE INDUSTRY? Using Tesco PLC as a case study in the UK grocery retail industry Thesis CENTRIA UNIVERSITY OF APPLIED SCIENCES Business Management November 2016

ABSTRACT
Centria University of Applied Sciences
Date November2016
Author Vu Ngoc Mai
Degree Programme Business Management Name of thesis IS THE BALANCED SCORECARD USEFUL IN A COMPETITIVE INDUSTRY? Using Tesco PLC as a case study in the UK grocery retail industry.
Instructor Janne Peltoniemi
Page 31
Supervisor Janne Peltoniemi
Measuring performance was not only to know how a business is performing but also to enable it to perform better. Since the traditional performance measures could not provide sufficient information for managers to improve and maximize the future performance, performance measurement frameworks have been evolved in order to provide a more “balanced” view of organizational performance.
The purpose of the thesis was to explore the reasons that make Balanced Scorecard popular and different from the other performance measurement frameworks and to prove the usefulness of the Balanced Scorecard (BSC) in the UK grocery industry through case company, Tesco PLC.
The thesis was prepared by studying many articles, reports, journals, websites and books in order to provide the information about performance measurement system and models. In term of case study, most of data was analysed based on the annual reports of company in nearest time to reflect fair and reliable results from applying Balanced Scorecard in Tesco’s operation. The benefits as well as the performance that Tesco PLC has achieved by using BSC will be evaluated in order to underline the role of BSC in driving Tesco towards success even though the grocery market in the UK is highly competitive and unstable nowadays.
Key words: Balanced Scorecard, grocery retail industry, performance measurement.
ABSTRACT CONTENTS 1 INTRODUCTION ...................................................................................................... 1 2 THEORETICAL FRAMEWORK ............................................................................... 3
2.1 Performance measurement ............................................................................. 3 2.2 Performance measurement system ............................................................... 4 2.3. Performance measurement models .............................................................. 8
2.3.1 Performance Prism ................................................................................ 9 2.3.2 Performance Measurement Matrix (PMM) ......................................... 11 2.3.3 Balanced Scorecard (BSC) ................................................................. 12
2.3.3.1 Customer Perspective: How do we see us? ........................ 13 2.3.3.2 Internal Perspective: What must we excel at? .................... 14 2.3.3.3 Innovation and Learning Perspective: How can we continue to improve and create value? ........................................................... 14 2.3.3.4 Financial Perspective: How do we look at stakeholders? . 15
2.3.4 Why choose Balanced Scorecard? .................................................... 17
3 CASE STUDY: TESCO PLC .................................................................................. 19 3.1 The UK grocery retail industry overview ..................................................... 19 3.2 Tesco PLC overview ...................................................................................... 20
3.3 Application of Balanced Scorecard on Tesco PLC ..................................... 20 3.3.1 Results and Analysis ........................................................................... 24
4 CONCLUSION ........................................................................................................ 29
REFERENCES .......................................................................................................... 32 FIGURES FIGURE 1. Performance measurement system (adapted from Wolk, Dholakia, Kreitz 2009) ..........................................................................................................................4 FIGURE 2. The performance prism (adapted from Neely, Adams & Crowe 2002).....9 FIGURE 3. Performance measurement matrix (adapted from Keegan et al 1989)....11 FIGURE 4. Balanced Scorecard (adapted from Kaplan & Norton 1992)....................12 FIGURE 5. Tesco’s Steering Wheel........................................................................21 TABLES TABLE 1. Strengths and weaknesses of performance measurement frameworks....17 TABLE 2. Group results 2015/2016 (adapted from Tesco annual report and financial statements 2016)…………………………………………………………….....................25 TABLE 3. Percentage of group colleagues who are female (adapted from Tesco 2016)………………………………………………………………………………………. 27 TABLE 4. The amount of food waste (adapted from Tesco 2016).............................28 TABLE 5. Reduction in CO2 emissions across Groups (adapted from Tesco 2016)..29

1 1 INTRODUCTION Organizational performance measurement is always the priority in private as well as public
sectors, since it has important role in gathering, analysing and evaluating information
regarding the performance of employees, departments and organizations. According to Neel
(1998), performance measurement is defined as “the process of quantifying the efficiency
and effectiveness of past actions through acquisition, collation, sorting, analysis,
interpretation and dissemination of appropriate data”.
Prior to 1980s, financial data was used mainly in measuring performance. It included the
items that are expressed in monetary terms and managers spend more time on those items
than non-financial measures like: services, delivery, customer satisfaction even though it
had important role in competitive environment. However, this traditional method just showed
what the organization achieved in the past and it did not provide comprehensive information
for managers establishing long-term goals or improving and maximizing future performance.
In an attempt to improve those weakness, performance measurement frameworks has been
developed in order to provide a more balance view between non-financial and financial
measures, internal and external aspects. There are several frameworks that are used today,
for example: Balanced Scorecard (Kaplan and Norton 1992), Performance Prism (Neely &
Adams 2002), Performance Measurement Matrix (Keegan et al1989). Among these
frameworks, Balance Scorecard is one of the most popular models and it has been widely
used in business and industry, government, non-profit organization and so on.
The grocery retailing is such a dynamic and globalized industry, where the competition
between supermarket chains is intensive and extremely competitive. Most of supermarkets
describe themselves as a seeker of value. Their purposes are to supply the highest-quality
products and best services to the customers and to be the trend-leader in this industry.
However, a number of grocery stores keep increasing while the economy is seemingly
returning to the downturn and struggling in dealing with low commodity prices, weak global
trade and diminishing capital flows. Therefore, a question is asked for top managers of each
retailer: “How to distinguish themselves from the other companies and how to succeed in
this fast- growing industry?”

2 The thesis objective is to identify and investigate the critical elements that make BSC
popular and different from other performance measurement frameworks. Moreover, it
includes interpreting how to use BSC as a performance measurement tool in an
organization. In particular, the study is focusing on one company within one industry; it is
Tesco PLC, the UK’s leading food retailer in an extremely competitive environment. The
comparison of outcomes of Tesco PLC before and after applying BSC on their business
operation will be analysed and evaluated in order to emphasize the success of using BSC. In
the conclusion part, the thesis is going to emphasize the benefit of using BSC as
performance measurement tool in an organization as well as its role in the competitive
industry.
The structure of the study is divided into 4 chapters. The first chapter is the introduction,
which includes the problem statement and aims of study. The second chapter is literature
review that clarifies the definition of performance measurement, lists the well-known
performance measurement models and discusses what makes balance scorecard different
from other models. In chapter three, the application of BSC in case company will be
presented. The results that Tesco PLC achieved will be analysed and discussed in this
chapter. Last but not least, in the last part, the thesis is going to clarify whether the BSC is
useful in the UK grocery retail industry or not.

3 2 THEORETICAL FRAMEWORK In this section, the author will introduce a comprehensive view of performance measurement.
In addition, the process of performance measurement and its models will be analysed in
order to demonstrate the reason what makes BSC different from the others performance
measurement frameworks.
2.1 Performance measurement Organisational performance is referred as the outcomes of an organisation as measured
against its goals and objectives. Or it can be defined as the actual outputs that are delivered
to customers and stakeholders. The truth is that no matter what size a company is, how
many employees the company have, organisational performance is a concern. Because the
performance of an organisation reflects the image of the company, how they accomplish their
goals, objectives as well as maintain their position in a competitive market. Therefore, every
company should measure, monitor and analyse its performance.
I often say that when you can measure what you are speaking about, and express it in numbers, you know something about it; but when you cannot measure it, when you cannot express it in numbers, your knowledge is of a meager and unsatisfactory kind. If you cannot measure it, you cannot improve it. (Lord Kelvin 1883.)
This quote does emphasize the importance of measurement.
Measurement provides the basis for an organization to assess how well it is progressing towards its predetermined objectives, helps to identify areas of strengths and weakness, and decides on future initiatives, with the goal of improving organizational performance. (Amaratunga & Baldry, 2002.)
Amaratunga and Baldry believed this definition illustrates clearly the role and the process of
performance measurement clearly from different aspects. In the cycle of never- ending

4 improvement, performance measurement is playing an important role in identifying and
tracking progress against organizational goals. In addition, it identifies defect sources,
process trends, defect prevention and to ensure the plans are implemented effectively and
efficiently, as well as opportunities for improvements. Last but not least, performance
measurement compares the outcomes in order to against the internal and external
standards. Thus, performance measurement is an on-going process that enforces continuous
improvement for a better performance in the future.
2.2 Performance measurement system
Performance measurement is an iterative process that must be kept repeated on an ongoing
basis (Wolk, Dholakia & Kreitz 2009, 4). A good performance measurement system means
focusing on customers and doing the right things. As illustrated in figure 1, this system is
described as a circle including four major phases of activity.
FIGURE 1: Performance measurement system (adapted from Wolk, Dholakia & Kreitz 2009)

5 Mission defines the company's business, its objectives and its approach to reach those
objectives. Whereas, vision of success describes how an organization will change if it
implements successfully its mission (Wolk, Dholakia & Kreitz 2009,5). Mission and vision of
success is combined in order to provide a statement of the company's purposes, goals and
values. A well-conceived, well- communicated vision is a valuable managerial tool that
provides managers a reference point to translate these statements into objectives and
strategies and make strategic decision. Whereas, a good mission statement describes a
company’s business makeup and purpose in language specific enough to give the company
its own identity and distinguish it from other enterprises in the same or other industries. The
development of these two statements is an essential part of the strategic management
process and it helps to ensure each element of the strategic management process is aligned
to the company’s short- term and long- term goals. It also helps inspire employees to work
more productively by providing focus and common goals and creates closer linkages and
better communication with customers, suppliers and partners (Wolk, Dholakia & Kreitz
2009,5).
Activities are which engaged in the primary purpose of making a profit and carry out by the
organization. In the meanwhile, operations describe the processes and resources that you
use to produce the highest quality products or services as efficiently as possible (Wolk,
Dholakia & Kreitz 2009, 5). The combination of activities and operations does help the
organization in implementing its mission and realizing the value of visions.
The performance measurement cycle starts and ends at organization’s activities and
operations, and it move continuously through the four stages: measure, report, learn and
improve (Wolk, Dholakia & Kreitz 2009, 6). At the first stage of performance measurement
system, an organization normally uses performance metrics or performance indicators
determine a company's progress in achieving its strategic and operational goals, and also to
compare a company's finances and performance against the other business within its
industry. In order to make it more straightforward, the author is going to provide examples of
business metrics, which include some indicators that have been used popularly in business
context.

6 Firstly, financial metrics are the key that an organization can focus on financial statements. It
includes some important indicators that reflect a complete picture of financial health in the
company as well as provide information in predicting performance in the future. For example,
profit this is one of the most important indicators that show how successful an organization is
in generating profit. It is calculated by the proportion of money that an organization has
earned after reducing total expenses from revenue. Another metric that has been used often
is the amount of cost. No matter how much the revenue of the company is, the cost must be
managed and kept as low as possible. It is also important to track the production cost of
products that are offered by the company, as it is one of the largest expenses, directly
affecting to profitability. This indicator gives an idea about product markup and the actual
profit of company (Oetting 2015).
Secondly, customer metric is a simple measurement that is used to gauge what matters most
to the customers. Therefore, the company can have right strategic plan in order to attract and
maintain its customers as well as satisfy their needs. An organization cannot be successful
without customers. Thus, it is necessary to measure the degree of customer satisfaction that
reflects how well the company is doing in delivering value to customers. One of the most
important indicators in e-commerce as it shows how cost effective the marketing campaign is
customer acquisition cost. This is the amount of cost (marketing expense) that is used in
order to acquiring more customers. Whereas, the number of customers will give information
about whether or not an organization meets customer’s needs (Sauro 2014).
Thirdly, process metric is a measurement tool that helps companies to monitor, evaluate, and
improve its performance. The first metric that is used to measure process performance is the
percentage of product defects shows the loss from product defect effects on customer
satisfaction, profit of company as well as its position in competitive market. Hence, the lower
the percentage is, the better. Another indicator should be used is efficiency measure.
Efficiency is an important measure of company’s performance and it can be measured
differently in each aspect. For example, production is measured by the amount of costs and
profits for a given level of output. In order to achieve production efficiency, it requires the
minimization of total expenses and the maximization of profits (Davidson 2013).
Lastly, people metric is a measurement used to determine the value and effectiveness of
people initiatives. Measuring employee satisfaction is vital for departmental and
organizational health. The higher employee satisfaction level is, the more effective and

7 productive the production process will be. The annual employee turnover rate is a ratio of the
number of employees that leave a company compared with the average number of total
employees. The managers must keep eyes on this rate as if it is high, it might cause negative
impacts on total expense, stability and morale at workforce environment (Marr 2014).
There are numerous performance metrics that have been used but not all of them are
suitable for all industries. Therefore, it is very important to collect a master list of indicators,
which are the most suitable for business operations in order to give a pulse of business to
allow for course corrections. Subsequently, the master list will be compiled into a master
dashboard, as well as more detailed, program- level dashboard, which will be discussed
more in the next stage.
The second stage of the performance measurement system is report. Raw data is as useful
as no data. Therefore, in order to make use of the collected data in the previous stage and
communicate performance internally and externally, the organization will translate it into a
format by using two main reporting tools: a dashboard and a report card (Wolk, Dholakia &
Kreitz 2009, 38). A dashboard is a visual display of the most important performance
measurement indicators needed to achieve one or more objectives; consolidated and
arranged on a single screen so the information can be monitored at a glance. Different
indicators have different functions. For some indicators, it provides its values before the
implementation of projects or activities, whereas, the others show the specific, planned level
of results to be achieved within a specific timeframe. A performance measurement system
should include a management dashboard, which provides the management team and board
a comprehensive view of organizational performance through a selection of key indicators.
(Wolk, Dholakia & Kreitz 2009, 28). There are different kinds of dashboard, some are
inclined, and some have tables and data. No matter how it looks, the management
dashboard holds the information a leadership team needs to manage an organization.
Another dashboard is recommended for a big organization, which includes multiple
departments, programs and affiliations in different regions is program- level dashboard
(Wolk, Dholakia & Kreitz 2009, 28). This dashboard is used to track the performance of
individuals, departments or affiliations at a more detailed level and informs the management
dashboard in order to make sure that the work and goals of individual programs or activities
are connected with the management team. After compiling the chosen indicators into
dashboard, the responsibility of report card is to sum up the internal data that is mainly used

8 by management team in order to know whether or not they reach the targets or find problems
need attention. It also responsible for engaging external data with stakeholders, or using it to
communicate what the organization does to the citizens and service users.
Moving to the third stage, after collecting the performance measurement data, which contains
the wealth of organizational activities and operations, the management team and staff
members are going to analyze as well as interpret the information in order make right
decisions and find opportunities for improvement in the future (Wolk, Dholakia & Kreitz 2009,
52).
At the last stage, based on the insights and conclusions that are drawn from the previous
stage, the review team starts making decisions to improve activities and operations. From
this stage, the performance measurement cycle begins again (Wolk, Dholakia, Kreitz 2009,
53).
The role of performance measurement system in an organization is undeniable. It develops
the mission and vision statement into the strategy and turns it into actions in order to achieve
objectives and goals. It also provides analysis and review of data that enable managers to
make right decision and improvement of performance. Thus, performance measurement
system is a great way to understand, manage and improve the overall functioning state of an
organization. If it is done effectively and efficiently, it drives the organization towards
success.
2.3. Performance measurement models
Since measurement of performance is realized as a fundamental to managers, there are a lot
of performance measurement models have been developed in order to overcome the
limitations of traditional accounting system. In this section, the author is going to introduce
three frameworks, which are used widely in different sectors. These are: Performance Prism

9 (Neely 2002), Performance Measurement Matrix (Keegan et al. 1989) and Balanced
Scorecard (Kaplan & David 1992).
2.3.1 Performance Prism
FIGURE 2. The Performance Prism (adapted from Neely, Adams & Crowe 2001)
The Performance Prism, as showed in figure 2, was introduced by Adams and Neely (2002)
and they believe the Performance Prism is the second generation of performance
measurement framework. They claim that there are some major reasons that this framework
is needed to replace the first generation framework. Firstly, it is not acceptable to concentrate
on one or two groups of stakeholders (ACCA 2015). For example, the organizations tend to
focus solely on the needs of the owners and customers of the organization and forgot about
other stakeholders like suppliers or employees. Secondly, organizations have to align and
integrate strategies, processes, and capabilities in order to deliver real value to its

10 stakeholders. Last but not least, stakeholders must contribute something to the organization.
The relationship between the organization and its stakeholders is described as” stakeholders
are delivering what the organization expects from them.” (ACCA 2015)
The Performance Prism consists of five interrelated perspectives with the aim to manage
organizational performance
- Stakeholder satisfaction – who are our stakeholders and what do they want?
- Stakeholder contribution – what do we want and need from our stakeholders?
- Strategies – what strategies do we need to put in place to satisfy the wants and needs of or
our stakeholders while satisfying our own requirements too?
- Processes – what processes do we need to put in place to enable us to execute our
strategies?
- Capabilities – what capabilities do we need to put in place to allow us to operate our
processes?
Most of performance measurement frameworks or methodologies normally have stated that
measures are derived from strategy. However, Adams and Neely believed that the role of
strategy and the purpose of measurement are fundamentally misunderstood. According to
Performance Prism vision, measures are derived from the stakeholder satisfaction. It also
differs from the others when it not only considers the customers, owners but also suppliers,
employees, alliance partners and intermediaries. This framework starts from analyzing
stakeholders and their needs before considering strategy. Subsequently, it considers what
processes and capabilities are required to support the strategy before identifying appropriate
performance measures (Neely, Adams & Crowe 2001). This should lead to performance at
all levels of the organization that is consistent with the strategy, and help it to meet the needs
of a wider group of stakeholders.
In conclusion, Performance Prism is a strong, comprehensive framework that helps
management team think about key questions and address them when seeking to manage
their business. However, it is the reason that makes it difficult to utilize.

11 2.3.2 Performance Measurement Matrix (PMM)
FIGURE 3. Performance Measurement Matrix (adapted from Keegan et al. 1989)
Keegan developed the Performance Measurement Matrix in 1989, and it is an older model
comparing to the others. According to figure 3, this framework integrates financial, non-
financial, external and internal perspective of business performance. PMM helps to define
strategic objectives of an organization and translate the objectives into performance
measures using hierarchical approach, which is simple and flexible (Keegan et al. 1989).
According to Keegan, he believes that performance measures are derived from strategy and
it must be integrated vertically and horizontally. In addition, he also considers cost is the
fundamental of performance measurement then the focus should be on cost drivers and
measures are generated based on thorough understanding of cost relationships and
behavior. In short, PPM is a simple and incorporated structure. Its strength is seeking to
combine different dimensions of business performance: financial and non- financial, internal
and external. However, it is not well structured and does not make clear the links between
different dimensions of business performance.

12 2.3.3 Balanced Scorecard (BSC)
Before 1980s, traditional accounting systems tended to used financial data to measure
performance. Even though, the role of this method is undoubtedly important, this tool just
showed the results of past actions and did not help much in providing information for
managers improving performance or predict the future of company. In order to complement
the limitation of traditional accounting systems, after 1980s, many performance measurement
frameworks had been developed and one of the most successful and popular models is
Balanced Scorecard.
Balanced Scorecard was originated by Drs. Robert Kaplan and David Norton in 1992. This
framework integrates financial and non- financial measures to give managers a “balance”
view of organizational performance as well as information in order to achieve goals
successfully and make better decisions.
The balanced scorecard retains traditional financial measures. But financial measures tell the story of past events, an adequate story for industrial age companies for which investments in long-term capabilities and customer relationships were not critical for success. These financial measures are inadequate, however, for guiding and evaluating the journey that information age companies must make to create future value through investment in customers, suppliers, employees, processes, technology, and innovation. (Kaplan & Norton 1996.)
FIGURE 4. Balanced Scorecard (adapted from Kaplan & Norton 1992)

13
In the book “The Fifth Discipline”, published in 1990, Peter Senge stated a problem:” Many
leaders have personal visions that never get translated into shared visions that galvanize an
organization”. More than 80% of organizations failed to successfully implement strategies
even though they have inspiring visions. So how to close the gap between strategy and
execution?
According to BSC, measures are derived from strategies and visions. The BSC provides
executives with a comprehensive framework that translates a company’s vision and strategy
into a coherent set of performance measures (Kaplan & Norton 1992). As illustrated in Figure
4, BSC allows managers to view the business from four important perspectives:
- Customer perspective: How do customers see us?
- Internal Business perspective: What must we excel at?
- Learning and Growth perspective: How can we continue to improve and create value?
- Financial perspective: How do we look to stakeholders?
2.3.3.1 Customer Perspective: How do we see us?
An organization cannot achieve success without customers. A typical mission statement of
most of organization is “to deliver the highest quality and best service to customers”. But the
question is: how an organization distinguishes themselves from the other competitors? In the
book named “The discipline of market leader”, the authors Treacy and Wiersema suggested
three value disciplines or strategies that help the organization answer the question above.
Firstly, operational excellence is the discipline which organization pursues the strategy that
focuses on low price, convenience and reliability (Niven 2002, 15). It means that they provide
their customers with reliable products or service, at low price and hassle- free service. An
example of operational excellence company is McDonald. The second strategy is product
leadership. As product leadership is strategic priority, an organization must keep focusing on
developing the envelop of products (Niven 2002, 15). They create a culture of innovation,
out-of-the-box thinking. Constantly innovating, the company strives to offer leading-edge

14 products or useful new applications of existing products or services. Apple and Sony are
known as one of the companies that have successfully pursued product leadership strategy.
Unlike the other statement that delivering products or services to customers, the “customer
intimacy” strategy is about selling solution, not just products and services. In this
circumstance, the company is looking for building long- term relationship with their customers
through how much they understand customers’ needs (Niven 2002, 15). They don’t deliver
what market wants, they deliver what specific customers want.
Regardless of which strategies or discipline is chosen, customer perspective consists of
some common measures, for example: customer satisfaction, customer retention, customer
revenue and so on. The customer’s concerns usually result from four main categories: time,
quality, performance and service, and cost (Niven 2002, 15). According to Kaplan and
Norton (1992), an organization can measure time as a lead time: time required for company
meeting customer’s needs, and quality can be measured on the basis of on-time deliveries or
defected products returned. In addition, performance and service should be measured based
on how they create value to customers. Last but not least, cost is not the cost of product or
service; it is what does it” cost” when customer uses it. In order to put balance scorecard to
work, the organization should concentrate on those features when developing customer
measures.
2.3.3.2 Internal Perspective: What must we excel at?
If customer perspectives are all about how to meet customer’s satisfaction, internal
perspective refers to processes, decisions and actions occurring internally in the organization
so as to enable them to satisfy their customers and add value for shareholders afterward. In
an attempt to pursue market leadership position, a company should also identify core
competencies, critical technologies and decide which measures are important for critical
processes. Kaplan and Norton suggested some factors such as: productivity, employee
skills, cycle time and quality as the critical internal processes used in an organization.

15
2.3.3.3 Innovation and Learning Perspective: How can we continue to improve and create value?
The customer and internal process perspective are considered as having the most important
components that are critical for business success. It is rather focusing on the development
and improvement of existing products and services. In the business context nowadays,
where the competition is extremely competitive, the company is required to continuously
improve and innovate their current products or services and introduce new products with
updated capabilities (Niven 2002, 16).
Innovation and Learning Perspective is developed in order to help organization implement
these requirements above. According to Kaplan and Norton, some measures that are used in
Innovation and Learning Perspective are: maturity of improvements, growth, and competitive
success.
2.3.3.4 Financial Perspective: How do we look at stakeholders?
As long as business organizations exist, the traditional method of measurement must be
financial. Back to the first days of twentieth century, financial measurement innovations were
critical to success of American multinational corporation company named General Motors. It
is not surprised news as financial data plays key role in tracking whether the company’s
strategy, implementation and execution are contributing to bottom- line results. Financial
Perspective includes some common measures such as profitability, growth or shareholder
value (Kaplan & Norton 1992).
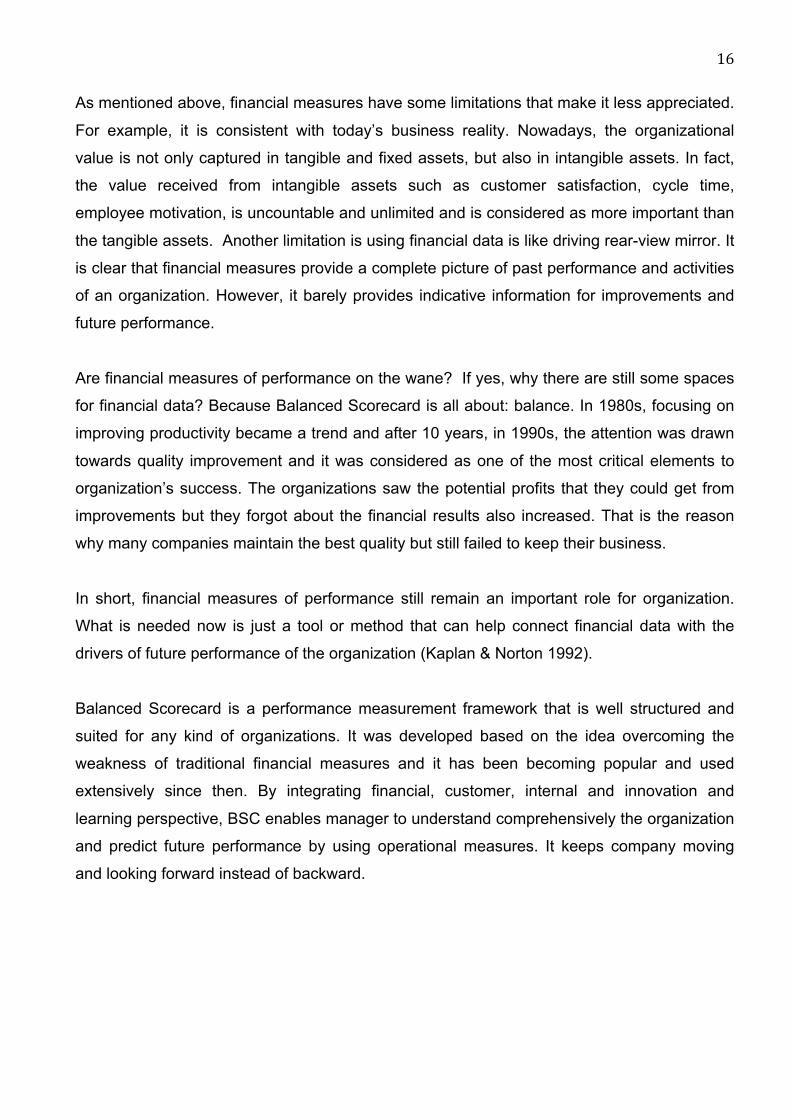
16 As mentioned above, financial measures have some limitations that make it less appreciated.
For example, it is consistent with today’s business reality. Nowadays, the organizational
value is not only captured in tangible and fixed assets, but also in intangible assets. In fact,
the value received from intangible assets such as customer satisfaction, cycle time,
employee motivation, is uncountable and unlimited and is considered as more important than
the tangible assets. Another limitation is using financial data is like driving rear-view mirror. It
is clear that financial measures provide a complete picture of past performance and activities
of an organization. However, it barely provides indicative information for improvements and
future performance.
Are financial measures of performance on the wane? If yes, why there are still some spaces
for financial data? Because Balanced Scorecard is all about: balance. In 1980s, focusing on
improving productivity became a trend and after 10 years, in 1990s, the attention was drawn
towards quality improvement and it was considered as one of the most critical elements to
organization’s success. The organizations saw the potential profits that they could get from
improvements but they forgot about the financial results also increased. That is the reason
why many companies maintain the best quality but still failed to keep their business.
In short, financial measures of performance still remain an important role for organization.
What is needed now is just a tool or method that can help connect financial data with the
drivers of future performance of the organization (Kaplan & Norton 1992).
Balanced Scorecard is a performance measurement framework that is well structured and
suited for any kind of organizations. It was developed based on the idea overcoming the
weakness of traditional financial measures and it has been becoming popular and used
extensively since then. By integrating financial, customer, internal and innovation and
learning perspective, BSC enables manager to understand comprehensively the organization
and predict future performance by using operational measures. It keeps company moving
and looking forward instead of backward.

17 2.3.4 Why choose Balanced Scorecard?
Each performance measurement framework has strengths and weaknesses, see TABLE 1.
TABLE 1. Strengths and Weaknesses of Performance Measurement Frameworks
Strengths Weakness
Performance
Prism
- Second generation of
performance measurement
framework
- Explicitly addresses all
stakeholder’s needs, not only
focus on one or two groups of
stakeholder
- Considers “what stakeholders
contribute to the company”.
- Difficult to utilize.
- Contains many indicators
that are not effective in
practice.
- Little concentration on
process of designing system
Performance
Measurement
Matrix
- Considers different dimensions
of business performance.
- Not well- structured
- Not suitable with the
capabilities and competencies
those companies are striving
nowadays.
Balanced
Scorecard
- Over shortcomings of
traditional measures.
- Closing the gap between
strategy and execution
- Provide comprehensive view of
performance.
- Addresses current and future
success.
- Breaking down measures to
- Costly and time- consuming.
- Lack of external focus.

18
lower level => everybody knows
objectives and goals clearly and
how to successfully achieve it.
TABLE 1. (Continues)
As analyzed in table 1, Balanced Scorecard remains itself as the best performance
measurement framework comparing to the others. It complements traditional financial
measures with additional “perspectives”, like customer, internal business process and
learning and growth and turns strategies into a continuous process that is owned by top-
level managers and employees in the company as well. Thus, people knows not only what to
do, but why. BSC also requires manager focus on what measures are critical for the success
of company’s strategy so that they will not spend much time on tracking more measures than
they can possibly use. Even though BSC has a lot of strengthens, there are still some
limitations. First of all, in order to implement Balanced Scorecard, the company must ensure
they complete vision statements, strategic plans and have active and constant system, which
requires time and financial cost. Secondly, some professors claim that BSC focuses more on
internal factors and neglects some aspects of external environment, for example: competitors
or changes in business environment. Last but not least, as mentioned above, all people in
the company must understand the process of implementing BSC. But before that, they have
to take part in training sessions to learn about this model and how it is used. The problem is
people might feel dispirited and want to resist the implementation. Hence, company must
have support activities to boost productivity of employee to strive for the company’s success.
In conclusion, despites of the limitations, Balanced Scorecard is still truly beneficial if it is fully
integrated into system of accounting. The scorecard functions are more than measurement
tools, like Larry Brady, the CEO of FMC Corp. said: “it is the cornerstone of the way you run
the business”.

19
3 CASE STUDY: TESCO PLC In this section, the author would like to introduce the overview of the grocery retail industry in
the United Kingdom as well as Tesco PLC. Moreover, the application of Balanced Scorecard
is performed in order to emphasize the benefits of using this framework in the competitive
market.
3.1 The UK grocery retail industry overview
Grocery retail industry in the UK is such a dynamic and fast- growing industry. According to
the statistics in 2015, there were more than 2.8 million people working in this industry, which
equals to 10,3% of the total UK workforce. This is the largest broad industrial group in Great
Britain by the number and proportion of employees. Moreover, its sales in 2015 were
approximately £339 billion, which accounts for 12.8% of the total UK economic output
(RetailEconomics 2015). The competition in this industry is getting more competitive when
the number of supermarket keeps rising day by day. Every retailer describes themselves as
the first choice for customers when it comes to supply high-quality products and best
services. With the evolvement in customer preference, a sharp move towards the increase of
demand on online shopping, natural/organic products and some alternative merchandises
emerging in grocery retail industry including beauty, household products and so on (Dunson
2015). Being aware of what have been changing this competitive industry, some companies
have successfully caught up with these trends and modified their strategies in order to meet
customer’s needs, for example: Tesco.

20 3.2 Tesco PLC overview
Found in 1919, Tesco PLC is a British international grocery and general merchandise retailer
with headquarters in Welwyn Garden City, Hertfordshire, England. As one the world’s largest
retailers with 470000 employees, Tesco operates 6902 shops across 14 countries and
serves millions of customers per week on their stores and online (Tesco annual report and
financial statement 2016). When Tesco was founded, it specialized in food and drink. In
2000, in an attempt to stay competitive by following customer preferences and society
changes, Tesco launched it own website: Tesco.com that allows customers to shop online
and continued to expand its range of products, which now includes clothes, insurance,
healthcare, dental, electrical and personal finance products. It also operates home shopping
service as well as providing consumer goods, telecommunication and financial service online
(Clark & Chan 2014). Despite of the precariousness and competitiveness of the industry,
according to annual report in 2016, Tesco still performed well with £48.4bn in sales, which
increased 0.1% growth in annual sales and 1.1% growth in annual profit comparing to last
year (Tesco annual report and financial statements 2016). A question is: “What leads to
Tesco’s global success and how Tesco differentiates themselves from the other
competitors?” The answer will be clarified in the next section.
3.3 Application of Balanced Scorecard on Tesco PLC
Tesco’s core vision is: “To be the most highly valued business by: the customers we serve,
the communities in which we operate, our loyal and committed colleagues and of course, our
shareholders”. In order to achieve the company’s growth and visions, Tesco sets out three
strategic priorities (Tesco 2016). These are:
- Regaining competitiveness in core UK business
- Protecting and strengthening the balance sheet
- Rebuilding trust and transparency

21 With the aim to clear goals for business to ensure the company delivers long- term
sustainable growth, Tesco manages their business by a balanced scorecard, called Steering
Wheel (FIGURE 5). Tesco has been using Balanced Scorecard for nearly 20 years and they
use it as a tool to set target for each objective in every segment and use key performance
indicators (KPIs) to track and measure their performance (Lawson, 2015). This scorecard is
slightly different from the original version, which was developed by Kaplan and Norton in
1992. The original BSC consists of four perspectives whereas the steering wheel contains
five segments: People, Finance, Customer, Operation and Community.
FIGURE 5. Tesco’s Steering Wheel (adapted from Tesco 2009)
In the finance segment, as mentioned above, one of Tesco’s strategic priorities is to protect
and strengthen their balance sheet. Because they believe a strong balance sheet means will
give them capability to enhance the quality of shopping trip for customers (Tesco annual
report and financial statements 2016, 7). In order to achieve this goal, Tesco has focused on

22 some areas. First of all, they have reduced the capital expenditure by taking more discipline
approach to capital investment and deliver, as planned. Moreover, they have increased the
ownership of freehold property by exchanging assets with British Land and reduced their
exposure to index-linked and fixed-uplift inflation. Last but not least, Tesco has reduced the
total of indebtedness by selling their Homeplus business in Korea (Tesco annual report and
financial statements 2016, 7). There are three out of six key performances indicators are
used to measure financial performance. These are: sales, operating profit and cash flow.
According to Kaplan and Norton, customer’s concerns usually results from 4 factors: quality,
time, performance and service and cost. Therefore, with the aim to increase the level of
customer satisfaction and customer retention as well as, Tesco has been making a £1 billion
commitment to improve the shopping trip, driving a strong pace of improvements in the things
that matter for customers: service, range, price, and availability. First of all, Tesco has
employed more than 9000 people in customer- facing roles and also ask people who work in
the office to spend more time at store. Moreover, they have also invested in increasing staff
levels, training and equipment for key departments in existing stores, such as produce and
meat. Because Tesco believes customers will receive better service if there are more well
trained, knowledgeable staffs at store (Tesco annual report and financial statements 2016,
6). For example, they distribute staffs equally in each area to ensure product availability and
presentation as well as answer customer’s questions timely. Secondly, the number of
products in each range has been increased at stores and consequently it makes customers
confused and puts pressure on employees. In this year, Tesco has reviewed the range of
products and decided to reduce 18% of total number of product lines with the aim to make
the range easier for customer to shop, save space for products that are purchased frequently
and ultimately increase the level of product availability. As customer wants lower, more
stable price they can trust all of the time, Tesco has decided to reduce price of hundred
branded products and own- brand products (Tesco annual report and financial statements
2016, 6).
Tesco’s most important asset will always be its people, who live by values to do their very
best for customers. The company has provided jobs for more than half a million people over
the world and is the largest private sector employer in the UK. With the advantage of having
over 6900 shops over 14 countries, Tesco is committed to provide more job opportunities in
area that really needed. Moreover, they have also spent a huge amount of money on
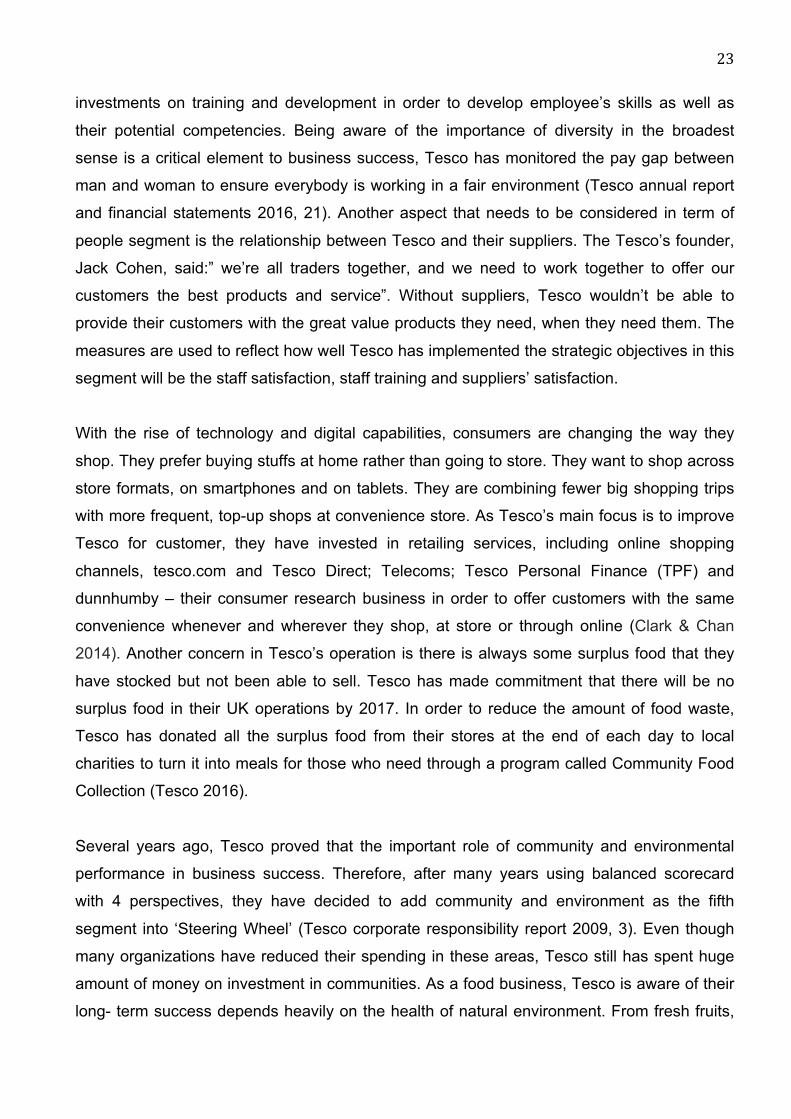
23 investments on training and development in order to develop employee’s skills as well as
their potential competencies. Being aware of the importance of diversity in the broadest
sense is a critical element to business success, Tesco has monitored the pay gap between
man and woman to ensure everybody is working in a fair environment (Tesco annual report
and financial statements 2016, 21). Another aspect that needs to be considered in term of
people segment is the relationship between Tesco and their suppliers. The Tesco’s founder,
Jack Cohen, said:” we’re all traders together, and we need to work together to offer our
customers the best products and service”. Without suppliers, Tesco wouldn’t be able to
provide their customers with the great value products they need, when they need them. The
measures are used to reflect how well Tesco has implemented the strategic objectives in this
segment will be the staff satisfaction, staff training and suppliers’ satisfaction.
With the rise of technology and digital capabilities, consumers are changing the way they
shop. They prefer buying stuffs at home rather than going to store. They want to shop across
store formats, on smartphones and on tablets. They are combining fewer big shopping trips
with more frequent, top-up shops at convenience store. As Tesco’s main focus is to improve
Tesco for customer, they have invested in retailing services, including online shopping
channels, tesco.com and Tesco Direct; Telecoms; Tesco Personal Finance (TPF) and
dunnhumby – their consumer research business in order to offer customers with the same
convenience whenever and wherever they shop, at store or through online (Clark & Chan
2014). Another concern in Tesco’s operation is there is always some surplus food that they
have stocked but not been able to sell. Tesco has made commitment that there will be no
surplus food in their UK operations by 2017. In order to reduce the amount of food waste,
Tesco has donated all the surplus food from their stores at the end of each day to local
charities to turn it into meals for those who need through a program called Community Food
Collection (Tesco 2016).
Several years ago, Tesco proved that the important role of community and environmental
performance in business success. Therefore, after many years using balanced scorecard
with 4 perspectives, they have decided to add community and environment as the fifth
segment into ‘Steering Wheel’ (Tesco corporate responsibility report 2009, 3). Even though
many organizations have reduced their spending in these areas, Tesco still has spent huge
amount of money on investment in communities. As a food business, Tesco is aware of their
long- term success depends heavily on the health of natural environment. From fresh fruits,
24 vegetables, fish, meat to the raw materials go into the other products; they all come from
natural ecosystem. Since the end of 2013 Tesco has been working with external experts and
colleagues to find out the key environments they have impacts on, including climate, forests,
marine, farmland and fresh waters and develop appropriate strategies in order to reduce their
influence on the biodiversity (Tesco 2016). In addition, Tesco wishes to make better
contribution to the communities where they operate because they know their business is only
vibrant if the relationship with their communities is vibrant too. Therefore, the company has
been working on some ways in order to support local communities as well as be a good
neighbor, such as supporting people who is in need through Neighborhood Food Collection
program, co-operating with British Red Cross to support communities to recover from crisis
(Tesco 2016). Last but not least, Tesco has strived to be a great employer in the
communities where they operate by offering young people chances to develop their skills and
gain experience as well as great jobs and opportunities.
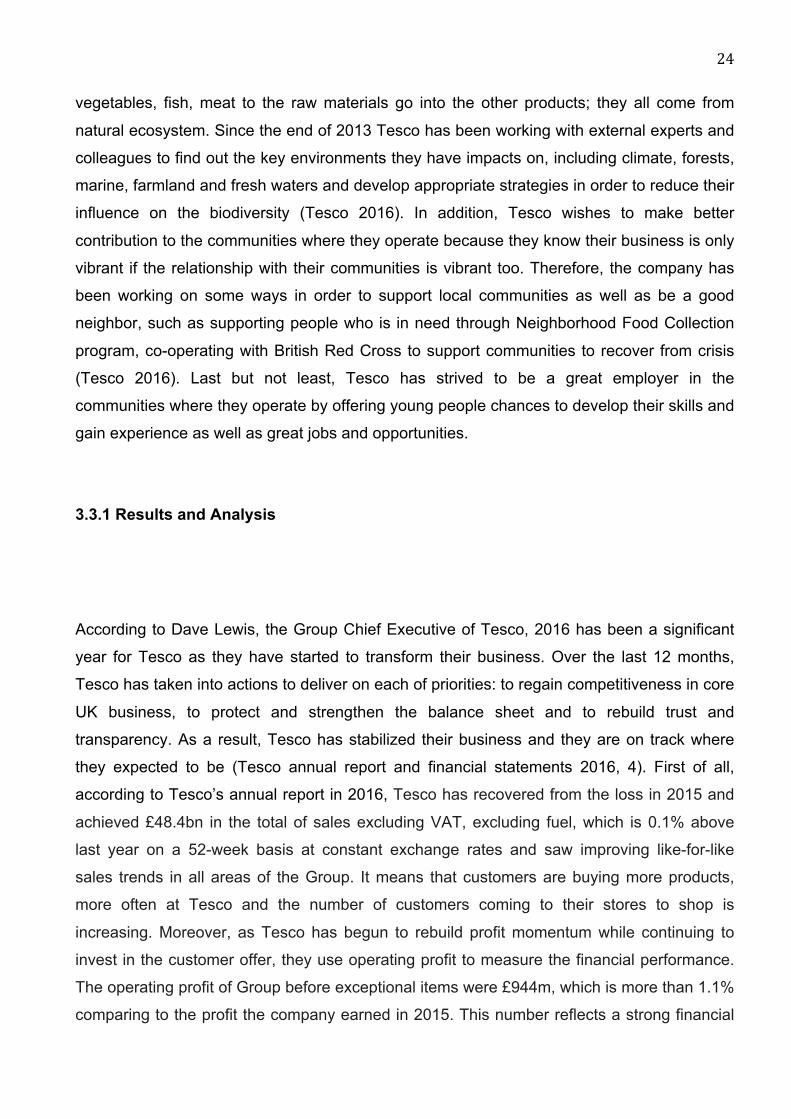
3.3.1 Results and Analysis
According to Dave Lewis, the Group Chief Executive of Tesco, 2016 has been a significant
year for Tesco as they have started to transform their business. Over the last 12 months,
Tesco has taken into actions to deliver on each of priorities: to regain competitiveness in core
UK business, to protect and strengthen the balance sheet and to rebuild trust and
transparency. As a result, Tesco has stabilized their business and they are on track where
they expected to be (Tesco annual report and financial statements 2016, 4). First of all,
according to Tesco’s annual report in 2016, Tesco has recovered from the loss in 2015 and
achieved £48.4bn in the total of sales excluding VAT, excluding fuel, which is 0.1% above
last year on a 52-week basis at constant exchange rates and saw improving like-for-like
sales trends in all areas of the Group. It means that customers are buying more products,
more often at Tesco and the number of customers coming to their stores to shop is
increasing. Moreover, as Tesco has begun to rebuild profit momentum while continuing to
invest in the customer offer, they use operating profit to measure the financial performance.
The operating profit of Group before exceptional items were £944m, which is more than 1.1%
comparing to the profit the company earned in 2015. This number reflects a strong financial

25 performance and it enables Tesco to deliver better shopping trip for customers and add more
value into their offers in the future. Last but not least, Tesco is committed to becoming more
efficient and reinvesting some of the savings they make to improve the shopping trip. In
2016, they successfully generated £2.6bn cash from retail operations, a 38.8% increase
year-on-year and reduced their total indebtedness by £6.2bn to £ (15.5) bn. It allows them to
keep the business running as well as reinvesting in order to serve little better every day for
their customers. (TABLE 2)
TABLE 2. Group Results 2015/2016 (adapted from Tesco annual report and financial
statements in 2016)
As mentioned above, the number of customers shopping at Tesco keeps rising and they are
shopping more products, more often at Tesco. Tesco’s main focus is customer and their
business exists to serve customers, therefore, they listen to their customers and act on what
is important to them to deliver the best shopping trip: price, service, range and availability. As
recorded in annual report 2016, the percentage of customer recommends Tesco and comes
back time again jumped from 77% in 2015 to 78,2% this year. They also measure customer
satisfaction through Customer Viewpoint Survey – a weekly measure that captures direct
customer feedback in every store. In total, they have seen an improvement of 5% in the
proportion of customers rating overall service and colleague helpfulness as excellent, and
every individual measure below this has also improved (Tesco annual report and financial
statements 2016, 6). This result has reflected completely what Tesco has been trying to do in
last 12 months. In order to respond customer’s wishes about buying products at lower and
26 more stable price, Tesco has launched their unique Brand Guarantee, which allows
customers to buy at least 10 different products and compare the total price with other grocery
shops, if the price at Tesco is more expensive then Tesco will refund instantly the difference.
Until now, Tesco is the first and only retailer in UK has been offering this program (Tesco
annual report and financial statements 2016, 6). As Tesco has employed more than 9000
employees and invested in training sessions and development program, the customer
service has been improved and the target level for on-shelf availability has been reached so
that customer can get what they want and when they want it. In addition, since customers
nowadays is demanding for fresh, natural and organic products, the company has unveiled
seven new discount brands, offering wide range of fresh foods with great prices and these
products are sourced from trusted suppliers.
Since 2015, along with regaining competitiveness in core UK business, Tesco has been
working on trust with their colleagues, customers, suppliers and other key stakeholders and
wanted to build more open and transparent relationships. Understanding people: customers,
colleagues, suppliers and other stakeholders, what matters to them and how to make things
better are the main core purposes of Tesco. With aim to build trust relationship with
customers, Tesco has developed new fresh product brands, which not only provide
customers fresh products but also give them the information where are the foods produced.
On the other hand, as mentioned above, employee is one of the most important assets of
Tesco. There is nothing more powerful that makes employees voluntarily serve the company
and customers with their best than the company keeps supporting their colleagues,
rewarding their achievements and creating opportunities for them to get on. Even when
Tesco unfortunately has to close their stores, they still try their best to find any possible
positions for their employees in alternative stores. With all the efforts Tesco has put on their
people, 81% of colleagues recommending Tesco as a great place to work in 2016, which is
11% above comparing to last year (Tesco annual report and financial statements 2016, 13).
Tesco has invested in training and development programs for many years because they are
aware of how valuable the well- trained, knowledgeable employees will provide for customers
and company. Since the beginning of 2015, Tesco has developed another training program
called Code of Business Product, offering employees the chances to develop their skills,
capabilities and understand compliance policies. Another objective Tesco has set is they are
ambitious to create a fair environment for their people, where they are rewarded and offered
same opportunities (Tesco annual report and financial statements 2016, 21). According to

27 the most recent data in 2014, the pay gap between man and woman was kept less than 1%
and the number of woman working at high- position in the company is also increasing year by
year (TABLE 3).
TABLE 3. Percentage of group colleagues who are female (adapted from Tesco 2016)
2014/2015 2015/2016
Board of Directors 23% 27%
Senior managers- Directors 24% 24%
Senior managers- Directors and
managers
31% 32%
All employees 57% 57%
There is the fact that Tesco cannot serve their customers without suppliers. Customers
expect to buy low price with stable quality products from Tesco. So how Tesco can fulfill their
customer’s wishes? The fastest way is to build strong relationship with their suppliers. Tesco
has fundamentally changed the way they operate and have implemented significant
initiatives that improve the way they work with suppliers and our commercial culture, and
simplify how they buy and sell. Since 2007, Tesco has established a series of Sustainable
Farming Group to ensure they build the long-term relationships with their farmers and so that
they can become British Agriculture’s most trusted partner (Tesco 2016). In this group, Tesco
and suppliers will work closely together to discuss more about sustainable products,
standards and customers’ needs. In addition, in January 2015 Tesco launched the Tesco
Supplier Network, their online community that enables them to easily interact with 5,000 of
their food and non-food suppliers around the world. Another action shows how Tesco cares
and supports their suppliers is a special helpline is set up for suppliers only in order to solve
any issues that rise within 48 hours (Tesco 2016). Consequently, the latest Supplier
Viewpoint measure of how suppliers view their relationships with Tesco displays the positive
impact of all these changes. The results show a significant improvement year-on-year,
increasing from 51% to 68% in the UK and from 58% to 70% for the Group as a whole
(Tesco annual report and financial statements 2016, 8). This data clearly implies how well the

28 suppliers are treated by Tesco and how strong and reliable relationship between Tesco and
their suppliers is. The kind of relationship is win- win, means that it brings benefits for both
Tesco and suppliers and the more powerful the relationship is, the more profits Tesco and
suppliers will get. That is the reason why building trust and transparent relationship with
suppliers is one of the Tesco’s strategic priorities and it needs to be done as soon as
possible.
Shopping online is about to explode. Retailers of all types are expanding product offerings,
adding in-store pickup, free shipping and experimenting with social media. Tesco is not
exceptional. Founded in 1919, Tesco first was a grocery store. After nearly one hundred
years, Tesco now is becoming the UK’s largest food retailer and expanding their range of
products, such as clothes, warehouse tools, and so on as well as developing their retailing
services. In order to enable customer shop whenever and wherever they want with the same
quality of products and services, Tesco has worked through a range of channels – from small
shops to large shops and through their growing online business. As part of improving our
offer, they are investing in making our channels even more efficient and convenient for their
customers (Clark & Chan 2014). On the other hand, Tesco has partnered with FareShare
FoodCloud to run The Community Food Connection (CFC) that help them to reduce the
amount of food. Those foods will be donated to local charities and turned into meals for
people who in need waste (Tesco annual report and financial statements 2016, 22).
TABLE 4. The amount of food waste (adapted from Tesco 2016)
2015/2016 59400 tones
2014/2015 57100 tones
2013/2014 57100 tones
According to TABLE 4, the number of food waste has increased by 4%. As Tesco has
committed there will be no surplus food waste in their operations across UK by 2020, it might
be a tough challenge for Tesco to reach their target (Tesco 2016). However, there still some
other possible ways that are partly helpful, such as: re- arranging the products on the shelf by

29 keeping the older products in front of the new ones and near the customer’s view, or
discounting foods that are not at peak of freshness.
Tesco is a responsible business. They have recognized that running their business
responsibly is important to their customers and increasingly crucial to their growth. As Tesco
has been aware of the importance of natural environment on their products, they have made
a commitment being a zero carbon business by 2050, as well as medium-term 2020 targets
(Tesco 2016). The TABLE 5 is the performance of the company in reducing the amount of
CO2 emissions. It clearly shows that Tesco has reduced more C02 emissions chronologically
across the Group. If the company keeps on doing like that, sooner or later they will achieve
their target they have set for 2020, which is reducing CO2 emissions per square foot of our
stores and distribution centers against a 2006/7 baseline by 50%.
TABLE 5. Reduction in CO2 emissions across Groups (adapted from Tesco 2016)
2015/2016 39.5%
2014/2015 38.3%
Since Tesco has been running Neighborhood Food Collections in 2012, they have donated
over 18 million meals to help people in need in the UK, including customer donation as well
as the 20% top- up from Tesco and food donated to their permanent collection points in 600
of their stores across the UK. Being in the relationship with British Red Cross, Tesco wishes
to support the communities that they are operating to recover from crisis. Because the
company believes every little help can make a big difference. Together with customers and
colleagues, Tesco has donated over £10.6 million to the Red Cross. This money has
provided vital support for emergencies in the UK, such as the 2009 flooding in Cockermouth,
as well as humanitarian work in overseas disasters like Nepal’s earthquake in 2015, Ebola
Outbreak Appeal in 2014 and so on (Tesco 2016). Last but not least, as Tesco is still doing
well in creating opportunities for people to get jobs, improve their skills as well as
competencies, last year, the company has exceeded the target, delivered 269 work
placements for unemployed young people instead of 250 people as committed and they aim
to continue deliver further 250 placements in 16 locations across the UK in the next year
(Tesco 2016).

30
4 CONCLUSION
2016 is a successful year of Tesco when the company has operated a balanced scorecard
framework to manage the business. This balanced scorecard is known within the Group as
the Steering Wheel, which combines the Group’s resources and focuses the efforts of
employees on delivering a little better everyday performance for customers, operations,
finance, people and community. The Steering Wheel enables Tesco to put appropriate
balance into the trade- off that need to be made all the time between the main levers of
management – such as delivery of customer metrics, operations measures and financial
measures. It enables the business to be operated and monitored on a balanced basis with
due regard to the needs of all stakeholders. For the owners of the business, it is simply
based around the philosophy that if they look after customers well and operate efficiently and
effectively, shareholders’ interests will always be best served by the inevitable outputs of
those – growth in sales, profits and returns.
The successes that Tesco has achieved in 2016 are displayed through positive numbers,
such as: the total amount of operating profit is £944bn, which is over 1.1% last year, or the
company has successfully generated £2.6bn cash from operations, increased by 39%
comparing to the amount in 2015. Moreover, the relationship between Tesco and their
suppliers, customers and colleagues is also significantly improved year- on- year. Despite
the fact that the competition between existing rivals is extremely high and the grocery retail
industry in the UK is facing with the decline of total sales in at least 20 years as a raging price
war and the falling cost of food commodities hit Britain’s supermarkets, Tesco still remains as
the leading supermarket with its total sales accounted for 28.2% of the total Great Britain
market sales, increased by 0,1% comparing to last year, according to Kantar Worldpanel
grocery share data in June 2016. Sir Terry Leahy one of the executives of Tesco revealed
that the success of Tesco lie in its balanced scorecard with its five perspectives and a long-
term strategy. The five- year summary of Tesco shows that it has grown from strength to
strength.
Even though there are some disadvantages of applying Balanced Scorecard into business
operation, like it is time- consuming and costly or it requires all employees in an organization

31 having a certain knowledge to understand how this framework works, it still proves itself to be
the most effective and powerful framework and if it is implemented well, it will definitely lead
to better performance. Therefore, if there is a question:” Is the Balanced Scorecard useful in
driving organization towards success in a competitive grocery retail industry?”, the answer
will be yes.

32
REFERENCES ACCA, 2015. The performance prism. Available: http://www.accaglobal.com/ie/en/student/exam-support-resources/professional-exams-study-resources/p5/technical-articles/performance-prism.html#mainContent. Accessed on 30 October. Chapman, C., Hopwood, A., & Shields, M. 2009. Handbook of Management Accounting Research. USA: Elsevier Ltd.
Chriyha, A., Beidouri, Z., & Bouksour, O. 2012. Proposal of a Performance Model based on the Balanced Scorecard for the Moroccan Textile Industry. IJCSI International Journal of Computer Science Issues 9, 410- 417.
Chou, C. 2004. Development of a Comprehensive Supply Chain Performance Measurement System: A Case Study in the Grocery Retail Industry. Massachusetts Institute of Technology Master of Engineering in Logistics Thesis.
Clark, T., & Chan, S. 2014. A history of Tesco: The rise of Britian’s biggest supermarket. Available: http://www.telegraph.co.uk/finance/markets/2788089/A-history-of-Tesco-The-rise-of-Britains-biggest-supermarket.html. Accessed on 30 October 2016.
Davidson, M. 2013. 28 manufacturing metrics that actually matter (The ones we rely on). Available: http://blog.lnsresearch.com/blog/bid/188295/28-manufacturing-metrics-that-actually-matter-the-ones-we-rely-on. Accessed 15 October 2016.
Duke, R.C. 1989. A Structural Analysis of the UK Grocery Retail Market. British Food Journal 91, 17 – 22.
Dunson, M. 2015. Five emerging trends for supermarket retailers to leverage in 2016. Available: http://www.chainstoreage.com/article/five-emerging-trends-supermarket-retailers-leverage-01. Accessed 28 October 2015.
Glavan, L.M. 2011. Understanding Process Performance Measurement Systems. Business Systems Research 2(2), 1-56.
Kantar Worldpanel, 2016. Grocery Market Share in the UK. Available: http://www.kantarworldpanel.com/en/grocery-market-share/great-britain. Accessed 5 November 2016.
Kaplan, R.S., & Norton, D.P. 1996. The Balanced Scorecard: Translating Strategy into Action. Massachusetts: Havard Business School.
Kaplan, R.S., & Norton, D.P. 1992. The Balanced Scorecard- Measures that Drive Performance. Massachusett : Havard Business School.

33 Lawson, M. 2015. Tesco ditches its Balanced Scorecard. Available: http://foodstrategy.co.uk/tesco-ditches-balanced-scorecard/. Accessed 19 November 2016.
Marr, S. 2014. Five people metrics everyone should know. Available: https://www.linkedin.com/pulse/20140819200414-64875646-five-people-metrics-everyone-should-know. Accessed 15 October 2016.
Morris, T. 2004. Tesco: A case study in supermarket excellence. New Zealand: Coriolis Research Ltd.
Niven, P.R. 2002. Balanced Scorecard Step- By- Step: Maximizing Performance and Maintaining Results. New York: John Wiley & Sons, Inc.
Oetting, J. 2015. 10 key financial metrics to measure the performance of your agency. Available: http://blog.hubspot.com/agency/financial-metrics#sm.00000iif45myvre3xwjm5mudz337a. Accessed 17 October 2016.
Monica, S., Mike, K., Pietro, M., Veronica, M., Steve, M., Bernard, M., Dina, G., Andy, N. 2007. Towards a definition of a business performance measurement system. International Journal of Operations and Production Management 27(8), 784- 801.
RetailEconomics, 2015. UK Retail Stats and Facts. Available: http://www.retaileconomics.co.uk/library-retail-stats-and-facts.asp. Accessed 2 November 2016.
Ruddick, G. 2015. Five facts that illustrate the dramatic changes in the supermarket industry. Available:http://www.telegraph.co.uk/finance/newsbysector/retailandconsumer/11522968/Five-facts-that-show-the-dramatic-changes-in-the-supermarket-industry.html. Accessed 1 November 2016.
Sauro, J. 2014. 10 customer metrics you should collect. Available: http://www.measuringu.com/blog/customer-metrics.php. Accessed 15 October 2016.
Singh, S., Darwish, T., & Potocˇnik, K. 2016. Measuring Organizational Performance: A Case for Subjective Measures. British Journal of Management 27, 214–224.
Smith, M. 2005. Performance measurement & management: A strategic approach to management accounting. City Road: SAGE Publications Ltd.
Sorooshian, S., Aziz, N., Ahmad, A., Jubidin S., & Mustapha, N. 2016. Review on Performance Measurement Systems. Mediterranean Journal of Social Sciences 7, 123- 132.
Striteska, M. 2012. Key Features of Strategic Performance Management Systems in Manufacturing Companies. Netherlands, Elsevier Ltd. DOI:10.1016/j.sbspro.2012.09.1091.
Tesco’s Annual Report and Financial Statements, 2016. Available: https://www.tescoplc.com/media/264194/annual-report-2016.pdf. Accessed 2 November 2016
Tesco’s Annual Report and Financial Statements, 2015. Available:

34 https://www.tescoplc.com/media/1426/tescoar15.pdf. Accessed 2 November 2016.
Tesco’s strategic report, 2015. Available: https://www.tescoplc.com/media/264150/strategic_report_15.pdf. Accessed 2 November 2016
Tesco’s Corporate Responsibility, 2015. Available:https://www.tescoplc.com/media/1069/tesco_cr15_corporateresponsibilityupdate2015.pdf. Accessed 2 November 2016.
Tesco. 2016. Being a great employer. Available: https://www.tescoplc.com/tesco-and-society/being-a-great-employer/. Accessed on 2 November 2016.
Tesco. 2016. Corporate responsibility report. 2009. Available: https://www.tescoplc.com/media/1464/tesco_cr_review_2009.pdf. Accessed 2 November 2016.
Tesco. 2016. Improving health. Available: https://www.tescoplc.com/tesco-and-society/improving-health/. Accessed on 2 November 2016.
Tesco. 2016. Reducing Food Waste. Available: https://www.tescoplc.com/tesco-and-society/reducing-food-waste/. Accessed 2 November 2016.
Tesco. 2016. Sourcing great products. Available: https://www.tescoplc.com/tesco-and-society/sourcing-great-products/. Accessed 2 November 2016.
Tesco. 2016. Supporting local communities. Available: https://www.tescoplc.com/tesco-and-society/supporting-local-communities/. Accessed on 2 November 2016.
Witcher, B., & Chau, V. 2008. Contrasting uses of balanced scorecards: case studies at two UK companies, Strategic Change. Wiley InterScience 17, 110- 114.
Wolk, A., Dholakia, A., & Kreitz, K. 2009. Building a Performance Measurement System: Using data to accelerate social impact. Massachusetts: Rootcause.
Wu, D. 2009. Measuring Performance in Small and Medium Enterprises in the Information & Communication Technology Industries. RMIT University. Doctorate of Philosophy Thesis.