The Atlas of Children's Health and Environment in the Americas
100
The Atlas of Children’s Health and Environment in the Americas N D I N A L U T S O R O P S A H O N D I N P E O V I M U P
-
Upload
khangminh22 -
Category
Documents
-
view
2 -
download
0
Transcript of The Atlas of Children's Health and Environment in the Americas
The Atlas of Children’sHealth and Environmentin the Americas
ND
IN
ALUT
SO
R
O
P
S
A
HO
ND
IN
P
E
OV I MU
P
PAHO HQ Library Cataloguing-in-PublicationPan American Health OrganizationThe Atlas of Children's Health and Environment in the AmericasWashington, D.C.: PAHO, © 2011
ISBN: 978-92-75-11651-7
I. Title
1. CHILD WELFARE2. ENVIRONMENTAL HEALTH3. ATLASES4. ENVIRONMENTAL POLLUTION - adverse effects5. INFANT MORTALITY - trends6. AMERICAS
NLM WM 17.DA1
The Pan American Health Organization welcomes requests for permission to reproduce or translate its publications, in part orin full. Applications and inquiries should be addressed to Editorial Services, Area of Knowledge Management andCommunications (KMC), Pan American Health Organization, Washington, D.C., U.S.A. The Area of Sustainable Development andEnvironmental Health (SDE) will be glad to provide the latest information on any changes made to the text, plans for new edi-tions, and reprints and translations already available.
©Pan American Health Organization, 2011. All rights reserved.
Publications of the Pan American Health Organization enjoy copyright protection in accordance with the provisions ofProtocol 2 of the Universal Copyright Convention. All rights are reserved.
The designations employed and the presentation of the material in this publication do not imply the expression of any opin-ion whatsoever on the part of the Secretariat of the Pan American Health Organization concerning the status of any country,territory, city or area or of its authorities, or concerning the delimitation of its frontiers or boundaries.
The mention of specific companies or of certain manufacturers' products does not imply that they are endorsed or recom-mended by the Pan American Health Organization in preference to others of a similar nature that are not mentioned. Errorsand omissions excepted, the names of proprietary products are distinguished by initial capital letters.
All reasonable precautions have been taken by the Pan American Health Organization to verify the information contained inthis publication. However, the published material is being distributed without warranty of any kind, either expressed orimplied. The responsibility for the interpretation and use of the material lies with the reader. In no event shall the PanAmerican Health Organization be liable for damages arising from its use.
Acknowledgments
The Sustainable Development and Environmental Health Area prepared this Atlas thanks to the support of PAHO’s Director,Mirta Roses Periago, Assistant Director, Dr. Socorro Gross-Galiano, and Area Manager, Dr. Luiz A. C. Galvão.
Our heartfelt gratitude goes to all the colleagues listed below who provided their professional experience, substantial con-tributions, and expert views in the preparation of this Atlas, as well as all those individuals who, throughout the Americas,joined in this effort:
• Eva Rehfuess, WHO• Enrique Loyola, WHO• Martha Shimkin, Independent Consultant, USA• Patricia Arbelaez, National School of Public Health, University of Antioquia, Colombia• Yehuda Benguigui, PAHO• Samuel Henao, PAHO • Carlos Corvalán, PAHO
Our special recognition also goes to the office of Children’s Health Protection, United States Environmental ProtectionAgency for their financial contribution towards this publication.
Preface . . . . . . . . . . . . . . . . . . . . . . . . . . . . . . . . . . . . . . . . . . . . . . . . . . . . . . . .1
Introduction . . . . . . . . . . . . . . . . . . . . . . . . . . . . . . . . . . . . . . . . . . . . . . . . . . . .3
Part 1: Healthy Environments Make Healthy Children . . . . . . . . . . . . . . . . . . . . .9
1. Entering the World with Health and Hope . . . . . . . . . . . . . . . . . . . . . . . . .10
2. A Safe and Healthy Environment Fosters Good Health . . . . . . . . . . . . . . .14
Part 2: All Children Need Food, Water, Sanitation, and Clean Air . . . . . . . . . . . .17
3. Surviving the First Months . . . . . . . . . . . . . . . . . . . . . . . . . . . . . . . . . . . . . .18
4. Children Need Safe and Sufficient Food . . . . . . . . . . . . . . . . . . . . . . . . . . . .22
5. Giving Children Clean Water . . . . . . . . . . . . . . . . . . . . . . . . . . . . . . . . . . . .26
6. Children Deserve Adequate Sanitation Services . . . . . . . . . . . . . . . . . . . .30
7. Clean Indoor Air Saves Children’s Lives . . . . . . . . . . . . . . . . . . . . . . . . . . . .34
Part 3: Children Thrive in a Nurturing Environment . . . . . . . . . . . . . . . . . . . . . .37
8. Children Living Free of Tobacco Smoke . . . . . . . . . . . . . . . . . . . . . . . . . . . .38
9. Controlling Air Pollution Supports Good Health in Children . . . . . . . . . . .42
10. End Childhood Lead Poisoning and other Chemical Exposure . . . . . . . . .46
11. Keeping Children Away from Pesticides . . . . . . . . . . . . . . . . . . . . . . . . . . .52
12. Don't Bug Me! . . . . . . . . . . . . . . . . . . . . . . . . . . . . . . . . . . . . . . . . . . . . . . . .56
13. Garbage Dumps Are No Place for Kids . . . . . . . . . . . . . . . . . . . . . . . . . . . .60
Part 4: Living in a Supportive Community . . . . . . . . . . . . . . . . . . . . . . . . . . . . . .63
14. Moving to the City . . . . . . . . . . . . . . . . . . . . . . . . . . . . . . . . . . . . . . . . . . . . .64
15. Adequate Shelter Offers Children a Safe Base . . . . . . . . . . . . . . . . . . . . . .68
16. Preparing for Disaster . . . . . . . . . . . . . . . . . . . . . . . . . . . . . . . . . . . . . . . . . .72
17. Schools Can Promote and Safeguard Environmental Health . . . . . . . . . . .76
18. Children Playing and Staying Safe . . . . . . . . . . . . . . . . . . . . . . . . . . . . . . . .80
19. Promote Child Safety through Fair Labor Standards . . . . . . . . . . . . . . . . .84
Part 5: Offering Children a Secure Future . . . . . . . . . . . . . . . . . . . . . . . . . . . . .89
20. Striving for Equality in Health and Environment . . . . . . . . . . . . . . . . . . . .90
Table of Contents
iv Table of Contents
List of Graphs & Tables . . . . . . . . . . . . . . . . . . . . . . . . . . . . . . . . . . . . . . . . . .4
Figure 1 Increasing cleanliness, efficiency, cost, and convenience. Decreasing health impacts. . . . . .35
Graph 1 Infant mortality trends, Latin America and the Caribbean, 1950–2015 (projected) . . . . . . . . .11
Graph 2 Estimated number of children surviving from birth to age 5,
Latin America and the Caribbean, 2004. . . . . . . . . . . . . . . . . . . . . . . . . . . . . . . . . . . . . . . . . . . .11
Graph 3 Five leading causes of mortality in children ages 0-14, by percentage,
Region of the Americas, 2002. . . . . . . . . . . . . . . . . . . . . . . . . . . . . . . . . . . . . . . . . . . . . . . . . . . .11
Graph 4 The influence of economic equality on child mortality, Latin America
and the Caribbean, 2003. . . . . . . . . . . . . . . . . . . . . . . . . . . . . . . . . . . . . . . . . . . . . . . . . . . . . . . .12
Graph 5 Child population, by age group, Region of the Americas, 2005. . . . . . . . . . . . . . . . . . . . . . . . .15
Graph 6 Proportionate mortality of children under age 14 from diseases related to
poor environmental conditions, by disease type and percentage,
Region of the Americas, 2002. . . . . . . . . . . . . . . . . . . . . . . . . . . . . . . . . . . . . . . . . . . . . . . . . . . .15
Graph 7 Environmental burden of disease, country groupings by development level,
Region of the Americas, 2002. . . . . . . . . . . . . . . . . . . . . . . . . . . . . . . . . . . . . . . . . . . . . . . . . . . .15
Graph 8 Exclusive breast-feeding among children aged 4-6 months, selected countries
of the Americas, 1998-2003. . . . . . . . . . . . . . . . . . . . . . . . . . . . . . . . . . . . . . . . . . . . . . . . . . . . . .19
Graph 9 Daily per capita calories availability in the Americas, selected countries
and territories and Regionwide, 2006. . . . . . . . . . . . . . . . . . . . . . . . . . . . . . . . . . . . . . . . . . . . .23
Graph 10 Correlation between female literacy, poverty, and stunting, Region of the Americas,
latest date available (1990-2002). . . . . . . . . . . . . . . . . . . . . . . . . . . . . . . . . . . . . . . . . . . . . . . . .23
Graph 11 Access to improved sources of drinking water and under-5 mortality rate,
Region of the Americas, 2002-2004. . . . . . . . . . . . . . . . . . . . . . . . . . . . . . . . . . . . . . . . . . . . . . .27
Graph 12 Correlation between gross national income and access to improved sources of water,
Region of the Americas, 2004. . . . . . . . . . . . . . . . . . . . . . . . . . . . . . . . . . . . . . . . . . . . . . . . . . . .27
Graph 13 Access to improved sources of drinking water, Latin America and the Caribbean,
1990 and 2004. . . . . . . . . . . . . . . . . . . . . . . . . . . . . . . . . . . . . . . . . . . . . . . . . . . . . . . . . . . . . . . .27
Graph 14 Acute diarrheal diseases mortality rate, children under age 5, by subregion,
Region of the Americas, 1995-2005. . . . . . . . . . . . . . . . . . . . . . . . . . . . . . . . . . . . . . . . . . . . . . . .27
Graph 15 Urban versus rural coverage of improved sanitation facilities in the Americas,
selected countries and territories and Regionwide, 2006. . . . . . . . . . . . . . . . . . . . . . . . . . . . .31
Graph 16 Access to basic sanitation services, Latin America and the Caribbean, 1990 and 2004. . . . . .31
Graph 17 Percentage of rural population with access to improved sanitation services,
selected countries and territories, Region of the Americas, 2006. . . . . . . . . . . . . . . . . . . . . . .31
Graph 18 Under-5 mortality rate and proportionate mortality due to acute respiratory infections (%),
selected subregions, Latin America and the Caribbean, 2005. . . . . . . . . . . . . . . . . . . . . . . . . .35
Graph 19 Percent of students 13-15 years old who support smoking bans in public places,
Latin America and the Caribbean, 2001-2005. . . . . . . . . . . . . . . . . . . . . . . . . . . . . . . . . . . . . . .39
Graph 20 Percent of youth 13-15 who smoke cigarettes, Latin America and the Caribbean, 2006
or latest available data. . . . . . . . . . . . . . . . . . . . . . . . . . . . . . . . . . . . . . . . . . . . . . . . . . . . . . . . .39
Graph 21 Correlation between students 13-15 years old who smoke and students who support
smoking bans, Latin America and the Caribbean, 2006 or latest available year. . . . . . . . . . .39
Graph 22 Particulate matter concentrations (standard average, 50 µ/m3), selected cities
in the Americas, 2000-2004. . . . . . . . . . . . . . . . . . . . . . . . . . . . . . . . . . . . . . . . . . . . . . . . . . . . .43
Graph 23 Estimated number of children under 19 years old who live in cities that exceed
their country’s air pollution standards (annual average concentration of PM-10) at least
in one year, Latin America and the Caribbean, 2000-2004. . . . . . . . . . . . . . . . . . . . . . . . . . . .43
Graph 24 Estimated percentage of children 1-5 years old with lead blood levels≥≥ ≥≥≥ 10 µ/dL,
United States of America, 1976-1980, 1988-1991, 1992-1994, and 1999-2000. . . . . . . . . . . . . . .47
Graph 25 Relationship between the phase-out leaded gasoline in on-road vehicles and
the decline in children's blood-lead levels in the U.S.. . . . . . . . . . . . . . . . . . . . . . . . . . . . . . . .47
Graph 26 Concentrations of lead in blood of children ages 5 and under . . . . . . . . . . . . . . . . . . . . . . . . .47
Graph 27 Trend in the cost of pesticide imports, Latin America and the Caribbean, 1990-2004. . . . . . .53
Graph 28 Incidence of pesticide poisoning in children under 15 years old and trend in
pesticide imports, Central America, 1992-2000. . . . . . . . . . . . . . . . . . . . . . . . . . . . . . . . . . . . . .53
Graph 29 Correlation between the incidence rate of pesticide poisoning in children under
15 years old and the import of pesticides, Central America, 1992-2000. . . . . . . . . . . . . . . . . .53
Graph 30 Annual malaria parasite incidence in malarious areas, subregions
of the Americas, 2006. . . . . . . . . . . . . . . . . . . . . . . . . . . . . . . . . . . . . . . . . . . . . . . . . . . . . . . . . .57
Graph 31 Number of dengue cases, Region of the Americas, 2006. . . . . . . . . . . . . . . . . . . . . . . . . . . . . .57
Graph 32 Average garbage generated per household, Latin America and the Caribbean
and regional average, 2005. . . . . . . . . . . . . . . . . . . . . . . . . . . . . . . . . . . . . . . . . . . . . . . . . . . . . .61
Graph 33 Final disposition of solid waste, Latin America and the Caribbean, 2005. . . . . . . . . . . . . . . . .61
Graph 34 Number of children in urban settings, Latin America and the Caribbean, 1950-2030
(projected). . . . . . . . . . . . . . . . . . . . . . . . . . . . . . . . . . . . . . . . . . . . . . . . . . . . . . . . . . . . . . . . . . .65
Graph 35 World cities with populations over 10 million, 2000. . . . . . . . . . . . . . . . . . . . . . . . . . . . . . . . .65
Graph 36 World urban population (%), 1800-2030 (projected). . . . . . . . . . . . . . . . . . . . . . . . . . . . . . . . . .65
Graph 37 Proportion of population living in overcrowded urban housing, selected countries,
Region of the Americas, latest data available (1998-2003). . . . . . . . . . . . . . . . . . . . . . . . . . . .69
Graph 38 Population affected by disasters, by disaster type, Region of the Americas, 2000-2006. . . .73
Graph 39 Selected disasters, by type, Region of the Americas, 1970-2005. . . . . . . . . . . . . . . . . . . . . . . .73
Graph 40 Total enrollment in primary school, children ages 5-12, Latin America
and the Caribbean, 1970-2000. . . . . . . . . . . . . . . . . . . . . . . . . . . . . . . . . . . . . . . . . . . . . . . . . . .77
Table of Contents v

Graph 41 School-aged population, by subregion, Region of the Americas, 2005. . . . . . . . . . . . . . . . . . .77
Graph 42 Schools with access to water and sanitation services,
selected Latin American countries, 2004. . . . . . . . . . . . . . . . . . . . . . . . . . . . . . . . . . . . . . . . . . .77
Graph 43 Proportionate mortality due to unintentional injuries, by injury type, children aged
0-14,a Region of the Americas, 2002. . . . . . . . . . . . . . . . . . . . . . . . . . . . . . . . . . . . . . . . . . . . . . .81
Graph 44 Estimated deaths from unintentional injuries, by injury type, children aged 5-14, by sex,
Region of the Americas, 2002. . . . . . . . . . . . . . . . . . . . . . . . . . . . . . . . . . . . . . . . . . . . . . . . . . . .81
Graph 45 Proportion (%) of child laborers, Region of the Americas and globally, 2000 and 2004. . . . .85
Graph 46 Percentage of children aged 5-14 working in agriculture and the services industry,
selected countries, Region of the Americas, 2005. . . . . . . . . . . . . . . . . . . . . . . . . . . . . . . . . . .85
Graph 47 Infant mortality rates, by ethnic group and nationwide, United States, 2001-2003. . . . . . . . .91
Graph 48 Urban population without access to water and sanitation services and affected
by undernutrition, by percentage and poverty level, Peru, 2001. . . . . . . . . . . . . . . . . . . . . . .91
Graph 49 Proportion of children aged 0-14 in white and non-white households, selected countries,
Region of the Americas, various years. . . . . . . . . . . . . . . . . . . . . . . . . . . . . . . . . . . . . . . . . . . . .91
Graph 50 Number of children under age 12 per family, selected Latin American countries,
1999-2002. . . . . . . . . . . . . . . . . . . . . . . . . . . . . . . . . . . . . . . . . . . . . . . . . . . . . . . . . . . . . . . . . . . .91
Table 1 Situation of children in the Americas, selected basic indicators, latest available data. . . . . .6
Table 2 Mortality in children from selected nutritional deficiencies,
Region of the Americas, 2002. . . . . . . . . . . . . . . . . . . . . . . . . . . . . . . . . . . . . . . . . . . . . . . . . . . .23
Table 3 Impacts of indoor air pollution on children’s health. . . . . . . . . . . . . . . . . . . . . . . . . . . . . . . . .35
vi Table of Contents
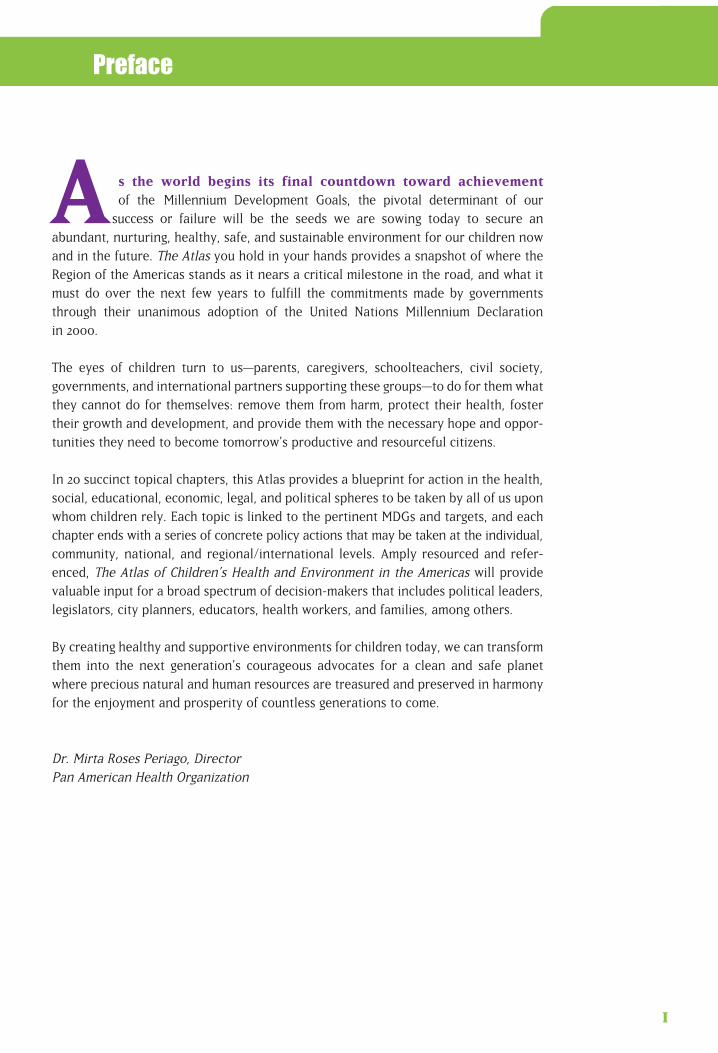
As the world begins its final countdown toward achievement of the Millennium Development Goals, the pivotal determinant of our
success or failure will be the seeds we are sowing today to secure an abundant, nurturing, healthy, safe, and sustainable environment for our children nowand in the future. The Atlas you hold in your hands provides a snapshot of where theRegion of the Americas stands as it nears a critical milestone in the road, and what itmust do over the next few years to fulfill the commitments made by governmentsthrough their unanimous adoption of the United Nations Millennium Declaration in 2000.
The eyes of children turn to us—parents, caregivers, schoolteachers, civil society, governments, and international partners supporting these groups—to do for them whatthey cannot do for themselves: remove them from harm, protect their health, fostertheir growth and development, and provide them with the necessary hope and oppor-tunities they need to become tomorrow’s productive and resourceful citizens.
In 20 succinct topical chapters, this Atlas provides a blueprint for action in the health,social, educational, economic, legal, and political spheres to be taken by all of us uponwhom children rely. Each topic is linked to the pertinent MDGs and targets, and eachchapter ends with a series of concrete policy actions that may be taken at the individual,community, national, and regional/international levels. Amply resourced and refer-enced, The Atlas of Children’s Health and Environment in the Americas will providevaluable input for a broad spectrum of decision-makers that includes political leaders,legislators, city planners, educators, health workers, and families, among others.
By creating healthy and supportive environments for children today, we can transformthem into the next generation’s courageous advocates for a clean and safe planetwhere precious natural and human resources are treasured and preserved in harmonyfor the enjoyment and prosperity of countless generations to come.
Dr. Mirta Roses Periago, DirectorPan American Health Organization
1
Preface

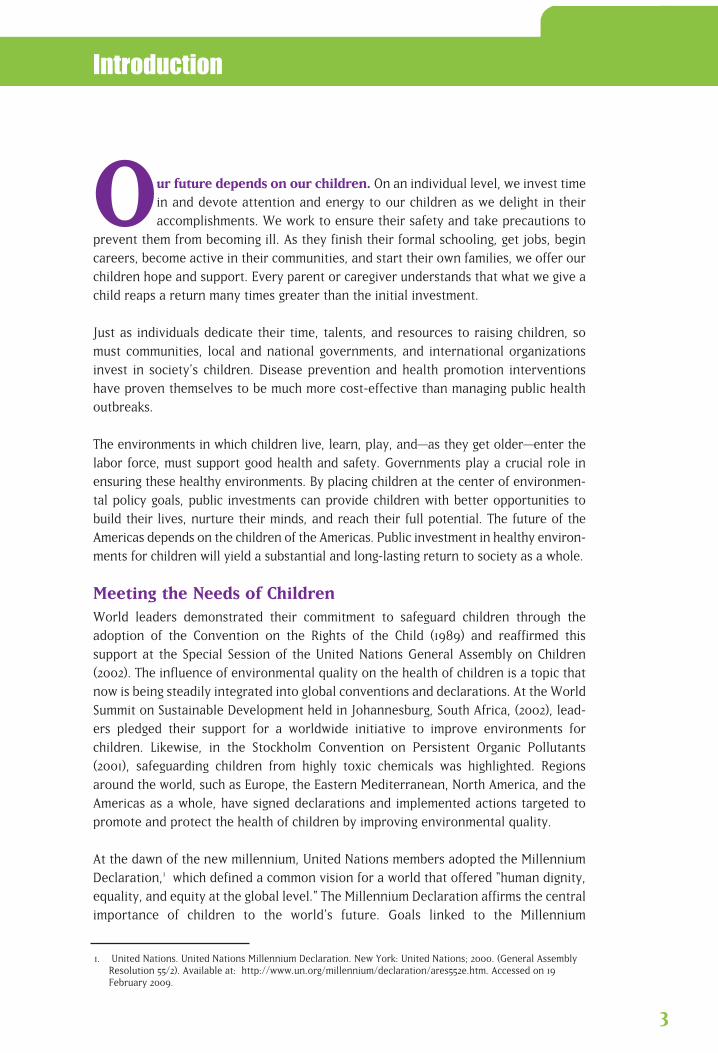
Our future depends on our children. On an individual level, we invest timein and devote attention and energy to our children as we delight in theiraccomplishments. We work to ensure their safety and take precautions to
prevent them from becoming ill. As they finish their formal schooling, get jobs, begincareers, become active in their communities, and start their own families, we offer ourchildren hope and support. Every parent or caregiver understands that what we give achild reaps a return many times greater than the initial investment.
Just as individuals dedicate their time, talents, and resources to raising children, somust communities, local and national governments, and international organizationsinvest in society’s children. Disease prevention and health promotion interventionshave proven themselves to be much more cost-effective than managing public healthoutbreaks.
The environments in which children live, learn, play, and—as they get older—enter thelabor force, must support good health and safety. Governments play a crucial role inensuring these healthy environments. By placing children at the center of environmen-tal policy goals, public investments can provide children with better opportunities tobuild their lives, nurture their minds, and reach their full potential. The future of theAmericas depends on the children of the Americas. Public investment in healthy environ-ments for children will yield a substantial and long-lasting return to society as a whole.
Meeting the Needs of Children World leaders demonstrated their commitment to safeguard children through theadoption of the Convention on the Rights of the Child (1989) and reaffirmed this support at the Special Session of the United Nations General Assembly on Children(2002). The influence of environmental quality on the health of children is a topic thatnow is being steadily integrated into global conventions and declarations. At the WorldSummit on Sustainable Development held in Johannesburg, South Africa, (2002), lead-ers pledged their support for a worldwide initiative to improve environments for children. Likewise, in the Stockholm Convention on Persistent Organic Pollutants(2001), safeguarding children from highly toxic chemicals was highlighted. Regionsaround the world, such as Europe, the Eastern Mediterranean, North America, and theAmericas as a whole, have signed declarations and implemented actions targeted topromote and protect the health of children by improving environmental quality.
At the dawn of the new millennium, United Nations members adopted the MillenniumDeclaration,1 which defined a common vision for a world that offered “human dignity,equality, and equity at the global level.” The Millennium Declaration affirms the centralimportance of children to the world’s future. Goals linked to the Millennium
3
Introduction
1. United Nations. United Nations Millennium Declaration. New York: United Nations; 2000. (General AssemblyResolution 55/2). Available at: http://www.un.org/millennium/declaration/ares552e.htm. Accessed on 19February 2009.
2. United Nations. Implementation of the United Nations Millennium Declaration: Report of the Secretary-General.New York: United Nations; 2002. (General Assembly document A/57/270, page 18, paragraph 99.) Available at:http://daccessdds.un.org/doc/UNDOC/GEN/N02/506/69/PDF/N0250669.pdf?OpenElement. Accessed on 20February 2009.
3. United Nations Development Program, U.N. Millennium Project. Investing in Development: A Practical Plan toAchieve the Millennium Development Goals. New York: UNDP; 2005. Available at: http://www.unmillenniumpro-ject.org/reports/fullreport.htm. Accessed on 12 March 2009.
Declaration aim to eradicate poverty, eliminate hunger, provide for safe and affordabledrinking water and basic sanitation services, provide primary education for all boys and girls,improve the lives of slum dwellers, promote gender equality, and ensure employability ofyoung people. The Declaration reminds the world of commitments made to safeguard theenvironment and highlights the need to hand down to children a world rich in naturalresources. Measurable, quantifiable targets were designed to assess and report yearlyprogress toward the eight Millennium Development Goals (MDGs). Throughout theMillennium Declaration and in progress reports by the United Nations, priority is given to thewell-being, safety, survival, and future of children. “Strategies to protect children and promote their welfare should be put in place,” noted former U.N. Secretary-General KofiAnnan in 2002. “There can be no issue more important.”2
Investments to improve children’s environmental health bring together
three important facets of the Millennium Development Goals: improving
the lives of children, improving the environment, and achieving sustain-
able economic growth. Interventions to improve children’s environmental
health include the alleviation of poverty and hunger, enhancing primary
education, the promotion of primary and secondary education for girls,
the reduction of child mortality, and the prevention of major diseases
such as malaria, Chagas’, and dengue.
Leaders of the Americas have recognized that children are our future and require publicattention and investment. The 2005 Millennium Development Goals report, entitledInvesting in Development: A Practical Plan to Achieve the Millennium Development Goals,states that Latin America and the Caribbean are among the best situated of developingregions in terms of their ability to meet the MDGs.3 At a June 2005 meeting of the health andenvironment ministers of the Region of the Americas, children’s environmental health wasdeclared a priority topic for national and international action and collaboration. Equity,access to health care, quality environments, and investment in children’s health and safetyare central environmental health policies of the Americas. Increasing understanding and taking action are the two avenues defined for policy goals and public investment. The over-arching objective will be to create and sustain environments for children that protect andpromote their health wherever they live, learn, play, and are growing and maturing into theadults of tomorrow.
The governments of the countries of the Americas have signaled their commitment to continue to support and achieve improvements in the lives of children of the Region. Despiteexcellent progress, policymakers know that more than 428,000 children still die in the
4 The Atlas of Children’s Health and Environment in the Americas
Americas every year before reaching the age of five.4 It has been estimated that 25% of the burden of disease in Latin America and the Caribbean can be attributed to poor environmental quality.5 These factors include unsafe water, inadequate sanitation and hygiene, urban air pollution, indoor smoke exposure from solid fuels, and leadexposure. The diseases they cause are all preventable. Accidents and injuries are theleading cause of death in children under five years of age in Canada and the UnitedStates, and asthma is the leading cause of illness, hospital stays, and missed schooldays. Infant mortality rates in the Americas range from 80.3 deaths per 1,000 live birthsin the poorest countries to 33.1 per 1,000 live births on average across Latin America andthe Caribbean to just over eight deaths per 1,000 in Canada and the United States, produc-ing an average of 20 infant deaths per 1,000 live births across the Region.6 Despite thesedisparities, there is a need in every country of the Americas to improve children’s environmental health and safety. Each country can also share its experience and knowledge with its neighbors throughout the Region. Serious public investment in children’s environmental health will improve the lives of all the Region’s children,thereby securing their future and that of the Americas as a whole.
I see healthy children and hear them laughing, ... . I think of all
people drinking safe water, breathing fresh air, and eating safe and
nutritious food. I envision all people living in homes that promote
development and protect well-being, ... . I think of all children,
everywhere, in every setting and from every background having the
best opportunities to grow and develop, learn and study and become
productive members of our society and our future leaders.
Dr. Mirta Roses Periago, Director
Pan American Health Organization
The Impact of Environment on Children's HealthChildren are at a greater risk than adults to environmental hazards. On the one hand,they can become exposed to environmental threats more easily than adults. On theother hand, their developing bodies may allow these exposures to take a greater toll ontheir health than in the case of adults. Distinctive behaviors and development stagesfind children placing unclean hands and objects in their mouths, rolling and crawling onthe ground and floor, and climbing to dangerous places as they explore their naturalsurroundings and try out new development skills. While a normal part of the growthand development process, these behaviors often place children in risky situations ifthey live, play, learn, and/or work in a degraded, contaminated, or unsafe environment.
4. World Health Organization. Burden of Disease: Estimates by Region. Geneva: WHO; 2005. Available at:http://www3.who.int/whosis/menu.cfm?path=evidence,burden,burden_estimates,burden_estimates_2002N,bur-den_estimates_2002N_2002Rev,burden_estimates_2002N_2002Rev_Region&language=english. Accessed on 20February 2009.
5. Prüss-Üstün A, Corvalán C. Preventing disease through healthy environments: towards an estimate of the environ-mental burden of disease. Geneva: World Health Organization; 2006. Available at: http://www.who.int/quantify-ing_ehimpacts/publications/preventingdisease.pdf. Accessed on 2 June 2009.
6. Pan American Health Organization. Health Situation in the Americas: Basic Indicators. Washington, DC: PAHO; 2005.
The Atlas of Children’s Health and Environment in the Americas 5
Poor children suffer the most. They tend to live in less safe and more polluted and degradedenvironments, while at the same time they suffer from poorer nutrition and more vulnerabledefense systems that are less able to ward off disease and infection. Poor children also tendto enter the workforce at a younger age to help support their families than their counterpartsin higher socioeconomic strata, thus exposing themselves to additional environmental dangers and risks.
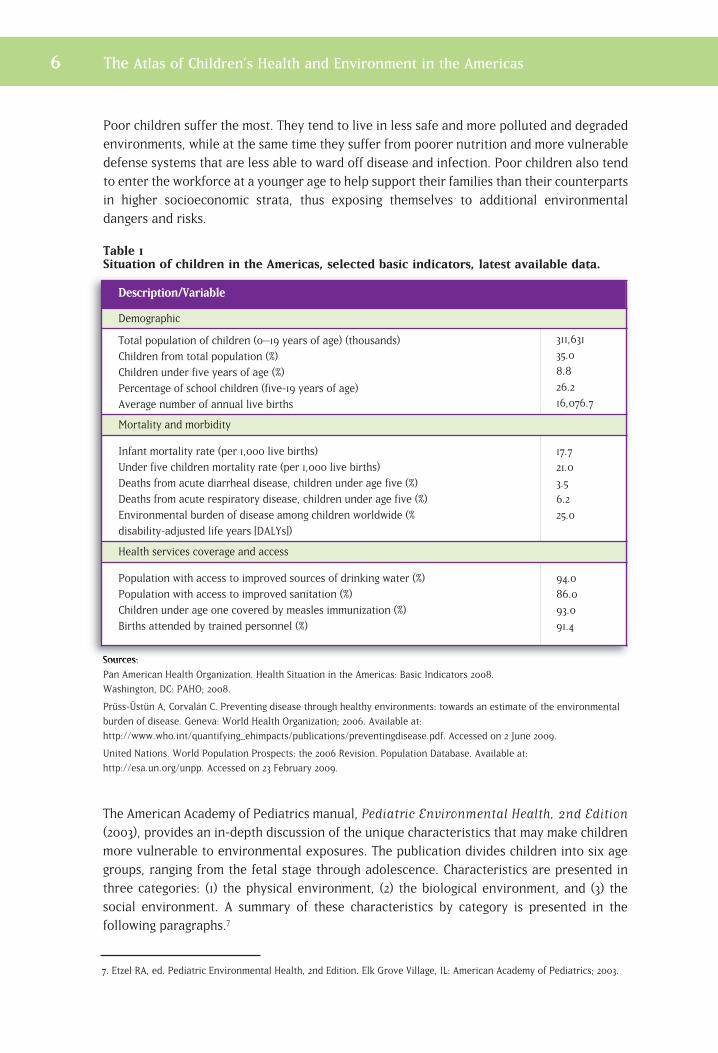
Table 1Situation of children in the Americas, selected basic indicators, latest available data.
Sources:
Pan American Health Organization. Health Situation in the Americas: Basic Indicators 2008.
Washington, DC: PAHO; 2008.
Prüss-Üstün A, Corvalán C. Preventing disease through healthy environments: towards an estimate of the environmental
burden of disease. Geneva: World Health Organization; 2006. Available at:
http://www.who.int/quantifying_ehimpacts/publications/preventingdisease.pdf. Accessed on 2 June 2009.
United Nations. World Population Prospects: the 2006 Revision. Population Database. Available at:
http://esa.un.org/unpp. Accessed on 23 February 2009.
The American Academy of Pediatrics manual, Pediatric Environmental Health, 2nd Edition(2003), provides an in-depth discussion of the unique characteristics that may make childrenmore vulnerable to environmental exposures. The publication divides children into six agegroups, ranging from the fetal stage through adolescence. Characteristics are presented inthree categories: (1) the physical environment, (2) the biological environment, and (3) thesocial environment. A summary of these characteristics by category is presented in the following paragraphs.7
Description/Variable
Demographic
Total population of children (0–19 years of age) (thousands)
Children from total population (%)
Children under five years of age (%)
Percentage of school children (five-19 years of age)
Average number of annual live births
311,631
35.0
8.8
26.2
16,076.7
Mortality and morbidity
Infant mortality rate (per 1,000 live births)
Under five children mortality rate (per 1,000 live births)
Deaths from acute diarrheal disease, children under age five (%)
Deaths from acute respiratory disease, children under age five (%)
Environmental burden of disease among children worldwide (%
disability-adjusted life years [DALYs])
17.7
21.0
3.5
6.2
25.0
Health services coverage and access
Population with access to improved sources of drinking water (%)
Population with access to improved sanitation (%)
Children under age one covered by measles immunization (%)
Births attended by trained personnel (%)
94.0
86.0
93.0
91.4
6 The Atlas of Children’s Health and Environment in the Americas
7. Etzel RA, ed. Pediatric Environmental Health, 2nd Edition. Elk Grove Village, IL: American Academy of Pediatrics; 2003.
The Atlas of Children’s Health and Environment in the Americas 7
Physical Environment: Where a child spends most or all of his or her time comprisesthe physical environment. A fetus is unique in this regard, in that the unborn child isexposed to what the mother ingests, breathes, and absorbs. A fetus is in a rapid stageof development that presents “critical windows”; during these particular moments, ifthe fetus is exposed to certain contaminants, overall growth and development processcan be greatly compromised. While generally speaking, development continues at aslower pace following birth and as the child enters into adolescence, it is thought that these windows of vulnerability exist throughout the child’s development intoadulthood. Harmful environmental exposures that occur during such critical periodswill cause greater negative effects.
Exposures considered particularly relevant to children throughout their developmentare derived from the locations where they spend the majority of their time, their airintake, food and water consumption, and behavior:
• Location: Infants and toddlers tend to spend long period of times in a single setting within the home. An infant or young toddler will spend time on the floor or ground, itting or crawling, thus exposing himself or herself to chemical residues on the floor-ing, or, if outside, those found in the soil or grass. Children in day care centers andschools are likewise exposed to these types of residues. As children grow into adolescents, they become increasingly independent, their ability to choose theirphysical locale is greatly enhanced, and they may take risks through misjudgments.
• Air intake: A child has a shorter stature than an adult and therefore breathes at a level that is closer to the ground. Chemicals that are heavier than air hover closeto the ground, creating greater levels of exposure for children than for adults in thesame space. At the same time, children breathe at a faster rate than adults and theirair intake is greater, which also increases their exposure to airborne environmentaltoxins.
• Food and water consumption: Children consume more water and food per poundof body weight than do adults, again increasing their exposure to chemicals andother contaminants that may be present in these substances. Children also tend toeat the same kinds of foods over and over again, so if a particular food is highly contaminated with pesticides or other chemicals, the exposure is repeated andtherefore higher than that of adults, whose diet is more varied.
• Behavior: The normal behavior of children as they grow and develop places themat an increased risk of exposure to harmful environmental substances. For example,infants and toddlers use their mouths to explore the world around them. They puttheir hands and foreign objects in their mouths to feel them and learn more aboutthem. If these objects contain harmful chemical or biological agents, children canreadily ingest these contaminants. Children are very curious and have little sense ofdanger. Young children do not have the capacity to protect themselves, choose theirenvironments, or—in the case of the youngest in this group—to physically removethemselves from harmful environments and go to ones that are safer.
8 The Atlas of Children’s Health and Environment in the Americas
Biological Environment: Once exposed to an environmental contaminant, any human—whether adult or child—will take in a certain dose of that contaminant through skin absorption, ingestion, or respiration. A fetus will be exposed through the placenta. Once the contaminant enters the body, it will be distributed and processed. The contaminant is eitherstored in or excreted from the body. Sometimes certain organs within the body are particularly vulnerable to certain contaminants. The physiological characteristics of a childat various stages of development will determine if and/or how much a contaminant willaffect him or her. Often, these physiological characteristics differ from those of adults, sothat children may be more susceptible to harmful environmental exposures than adults.Some special considerations as regards children are:
• Skin absorption: A child has a greater skin-to-body-mass ratio than an adult, and a newborn’s ratio is even greater than that of a young child. In the first two weeks of life,a newborn lacks natural defenses in the outer layer of skin and is significantly more vulnerable to exposure through skin absorption.
• Respiratory development: While lung function begins developing from the fetal stage,it does not reach full development until approximately age eight.
• Gastrointestinal physiology: A child absorbs certain nutrients (e.g., calcium) at higher levels than adults. Various chemicals (e.g., lead) may be absorbed at higher levels, mimicking the absorption of calcium.
• Distribution: The body’s fat and water content change the characteristics of distributionwithin the body. Since a child’s body composition is constantly changing throughout thedevelopment process, the distribution of environmental contaminants will also vary.
• Metabolism: A child’s ability to process (metabolize) contaminants may vary at differentstages, depending on his or her genetic makeup, and the enzymes serving as metabolicagents that are present in the body. Children’s metabolism, as compared to that of adults,may safeguard them from certain exposures, while exacerbating the health impactscaused by other exposures.
• Organ susceptibility: A child’s body develops from the fetal stage through adolescence.The functioning of the lungs and brain, as well as that of the nervous and reproductivesystems, for example, will continue to develop for years after birth. Exposures that target certain organs may cause long-term or permanent effects.
Social Environment: Poverty, malnutrition, environmental injustice, and child laborincrease children’s exposure to contaminants and their susceptibility to the effects of exposures. Most legislation, even in highly industrialized countries, traditionally has not considered the unique characteristics of children that increase their vulnerability to harmfulenvironmental exposures and can make them more susceptible to the negative health consequences of these exposures. Children have little influence over changes in society’sactions. They need advocates to protect and promote their health. Parents, caregivers, localand national governments, and professional groups—in particular, health workers—makeexcellent advocates for children’s environmental health.

A child may not realize that he or she is walking into adangerous environmental setting. Smoke near the openfire indoors might seem normal, even as the little girlcoughs, rubs her stinging eyes, and gasps for fresh air. Does theparent know that the carpet the toddler is crawling around on is stillcoated with pesticides after being sprayed to keep the mosquitoes out?The backyard battery-recycling business brings extra income to the fami-ly, but it also drops lead in the soil that blows around the communityduring the dry season. The teenager cannot find his helmet, but wants tojoin friends on a bicycle trip—just one short ride won’t hurt, he reasons.
While there are environmental hazards in our everyday life, much can bedone to protect public health in general and children’s health in particu-lar. The World Health Organization estimates that more than one-third ofchildren’s diseases worldwide could be prevented by improving environ-mental conditions.1 Protecting children is especially important because:
• Children are often not able to protect themselves and may evenunknowingly endanger themselves.
• Children are constantly developing, and as they grow and develop,their bodies may be more vulnerable to dangerous environmental expo-sures than the bodies of their parents or other adults around them.
1 Prüss-Üstün A, Corvalán C. Preventing disease through healthy environments: towards an estimate of the envi-ronmental burden of disease. Geneva: World Health Organization; 2006.
1Healthy Environments Make Healthy Children
10
Entering the World with Health and Hope
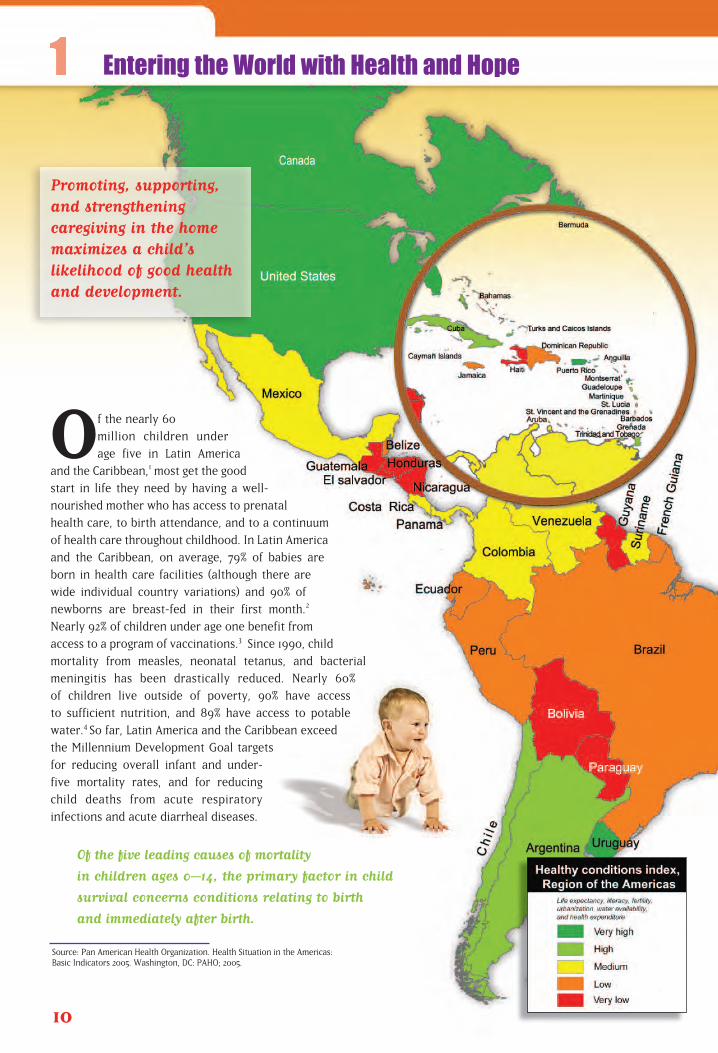
Of the nearly 60
million children under
age five in Latin America
and the Caribbean,1 most get the good
start in life they need by having a well-
nourished mother who has access to prenatal
health care, to birth attendance, and to a continuum
of health care throughout childhood. In Latin America
and the Caribbean, on average, 79% of babies are
born in health care facilities (although there are
wide individual country variations) and 90% of
newborns are breast-fed in their first month.2
Nearly 92% of children under age one benefit from
access to a program of vaccinations.3 Since 1990, child
mortality from measles, neonatal tetanus, and bacterial
meningitis has been drastically reduced. Nearly 60%
of children live outside of poverty, 90% have access
to sufficient nutrition, and 89% have access to potable
water.4 So far, Latin America and the Caribbean exceed
the Millennium Development Goal targets
for reducing overall infant and under-
five mortality rates, and for reducing
child deaths from acute respiratory
infections and acute diarrheal diseases.
Of the five leading causes of mortality
in children ages 0–14, the primary factor in child
survival concerns conditions relating to birth
and immediately after birth.
Source: Pan American Health Organization. Health Situation in the Americas: Basic Indicators 2005. Washington, DC: PAHO; 2005.
Promoting, supporting,and strengthening caregiving in the homemaximizes a child’s likelihood of good healthand development.
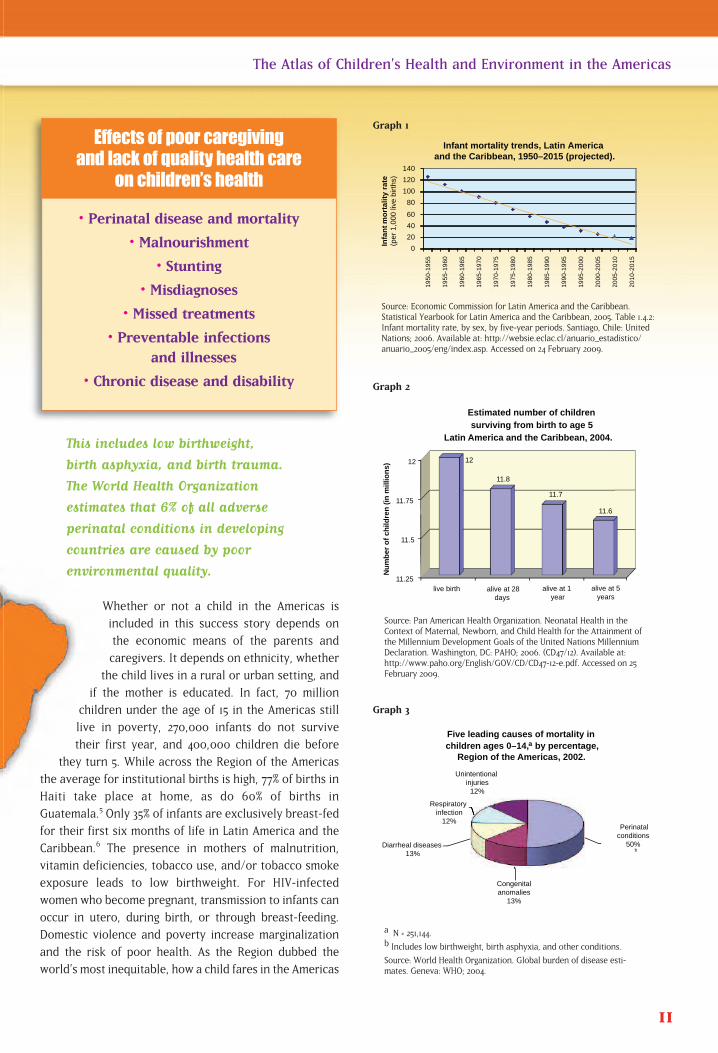
This includes low birthweight,
birth asphyxia, and birth trauma.
The World Health Organization
estimates that 6% of all adverse
perinatal conditions in developing
countries are caused by poor
environmental quality.
Whether or not a child in the Americas is
included in this success story depends on
the economic means of the parents and
caregivers. It depends on ethnicity, whether
the child lives in a rural or urban setting, and
if the mother is educated. In fact, 70 million
children under the age of 15 in the Americas still
live in poverty, 270,000 infants do not survive
their first year, and 400,000 children die before
they turn 5. While across the Region of the Americas
the average for institutional births is high, 77% of births in
Haiti take place at home, as do 60% of births in
Guatemala.5 Only 35% of infants are exclusively breast-fed
for their first six months of life in Latin America and the
Caribbean.6 The presence in mothers of malnutrition,
vitamin deficiencies, tobacco use, and/or tobacco smoke
exposure leads to low birthweight. For HIV-infected
women who become pregnant, transmission to infants can
occur in utero, during birth, or through breast-feeding.
Domestic violence and poverty increase marginalization
and the risk of poor health. As the Region dubbed the
world’s most inequitable, how a child fares in the Americas
11
The Atlas of Children’s Health and Environment in the Americas
Source: Economic Commission for Latin America and the Caribbean.Statistical Yearbook for Latin America and the Caribbean, 2005. Table 1.4.2:Infant mortality rate, by sex, by five-year periods. Santiago, Chile: UnitedNations; 2006. Available at: http://websie.eclac.cl/anuario_estadistico/anuario_2005/eng/index.asp. Accessed on 24 February 2009.
0
2 0
4 0
6 0
8 0
1 0 0
1 2 0
1 4 0
1 9
5 0
- 1 9
5 5
1 9
5 5
- 1 9
6 0
1 9
6 0
- 1 9
6 5
1 9
6 5
- 1 9
7 0
1 9
7 0
- 1 9
7 5
1 9
7 5
- 1 9
8 0
1 9
8 0
- 1 9
8 5
1 9
8 5
- 1 9
9 0
1 9
9 0
- 1 9
9 5
1 9
9 5
- 2 0
0 0
2 0
0 0
- 2 0
0 5
2 0
0 5
- 2 0
1 0
2 0
1 0
- 2 0
1 5
I n f a
n t
m o
r t a
l i t y
r a
t e
Infant mortality trends, Latin America and the Caribbean, 1950–2015 (projected).
(per
1,0
00 li
ve b
irths
)
Five leading causes of mortality in children ages 0–14, by percentage,
Region of the Americas, 2002.
Diarrheal diseases 13%
Respiratory infection
12%
Unintentional injuries
12%
Perinatalconditions
50%
Congenitalanomalies
13%
b
a
• Perinatal disease and mortality
• Malnourishment
• Stunting
• Misdiagnoses
• Missed treatments
• Preventable infections and illnesses
• Chronic disease and disability
Effects of poor caregiving and lack of quality health care
on children’s health
Estimated number of children surviving from birth to age 5
Latin America and the Caribbean, 2004.
Nu
mb
er o
f ch
ildre
n (
in m
illio
ns)
live birth alive at 28days
alive at 1 year
alive at 5years
11.25
11.5
11.75
12 12
11.8
11.7
11.6
Graph 1
Source: Pan American Health Organization. Neonatal Health in theContext of Maternal, Newborn, and Child Health for the Attainment ofthe Millennium Development Goals of the United Nations MillenniumDeclaration. Washington, DC: PAHO; 2006. (CD47/12). Available at:http://www.paho.org/English/GOV/CD/CD47-12-e.pdf. Accessed on 25February 2009.
Graph 2
a N = 251,144.b Includes low birthweight, birth asphyxia, and other conditions.
Source: World Health Organization. Global burden of disease esti-mates. Geneva: WHO; 2004.
Graph 3
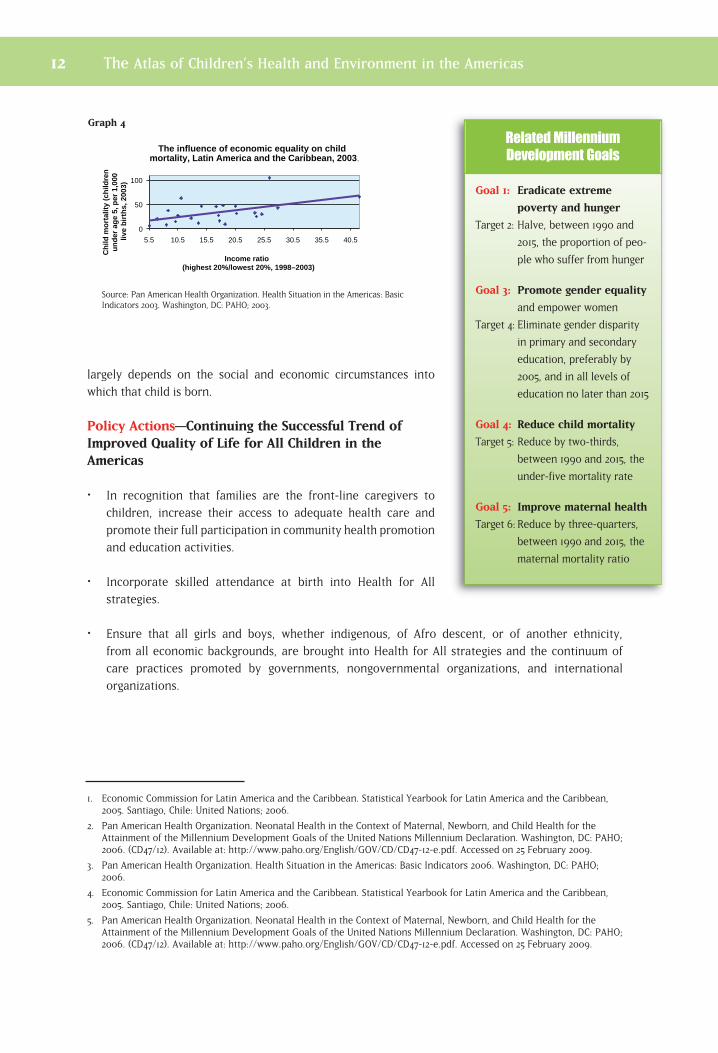
largely depends on the social and economic circumstances into
which that child is born.
Policy Actions—Continuing the Successful Trend ofImproved Quality of Life for All Children in theAmericas
• In recognition that families are the front-line caregivers to
children, increase their access to adequate health care and
promote their full participation in community health promotion
and education activities.
• Incorporate skilled attendance at birth into Health for All
strategies.
• Ensure that all girls and boys, whether indigenous, of Afro descent, or of another ethnicity,
from all economic backgrounds, are brought into Health for All strategies and the continuum of
care practices promoted by governments, nongovernmental organizations, and international
organizations.
1. Economic Commission for Latin America and the Caribbean. Statistical Yearbook for Latin America and the Caribbean,2005. Santiago, Chile: United Nations; 2006.
2. Pan American Health Organization. Neonatal Health in the Context of Maternal, Newborn, and Child Health for theAttainment of the Millennium Development Goals of the United Nations Millennium Declaration. Washington, DC: PAHO;2006. (CD47/12). Available at: http://www.paho.org/English/GOV/CD/CD47-12-e.pdf. Accessed on 25 February 2009.
3. Pan American Health Organization. Health Situation in the Americas: Basic Indicators 2006. Washington, DC: PAHO;2006.
4. Economic Commission for Latin America and the Caribbean. Statistical Yearbook for Latin America and the Caribbean,2005. Santiago, Chile: United Nations; 2006.
5. Pan American Health Organization. Neonatal Health in the Context of Maternal, Newborn, and Child Health for theAttainment of the Millennium Development Goals of the United Nations Millennium Declaration. Washington, DC: PAHO;2006. (CD47/12). Available at: http://www.paho.org/English/GOV/CD/CD47-12-e.pdf. Accessed on 25 February 2009.
12 The Atlas of Children’s Health and Environment in the Americas
Goal 1: Eradicate extreme
poverty and hunger
Target 2: Halve, between 1990 and
2015, the proportion of peo-
ple who suffer from hunger
Goal 3: Promote gender equality
and empower women
Target 4: Eliminate gender disparity
in primary and secondary
education, preferably by
2005, and in all levels of
education no later than 2015
Goal 4: Reduce child mortality
Target 5: Reduce by two-thirds,
between 1990 and 2015, the
under-five mortality rate
Goal 5: Improve maternal health
Target 6: Reduce by three-quarters,
between 1990 and 2015, the
maternal mortality ratio
0
50
100
5.5 10.5 15.5 20.5 25.5 30.5 35.5 40.5
Income ratio (highest 20%/lowest 20%, 1998–2003)
The influence of economic equality on child mortality, Latin America and the Caribbean, 2003
Ch
ild m
ort
alit
y (c
hild
ren
u
nd
er a
ge
5, p
er 1
,000
liv
e b
irth
s, 2
003)
.
Source: Pan American Health Organization. Health Situation in the Americas: BasicIndicators 2003. Washington, DC: PAHO; 2003.
Graph 4
Related Millennium
Development Goals
The Atlas of Children’s Health and Environment in the Americas 13
14
A Safe and Healthy Environment Fosters Good Health
Source: Pan American Health Organization, Health Analysis and Statistics Unit. Regional Core Health Data Initiative; Indicators Glossary. Washington, DC: PAHO; 2007.
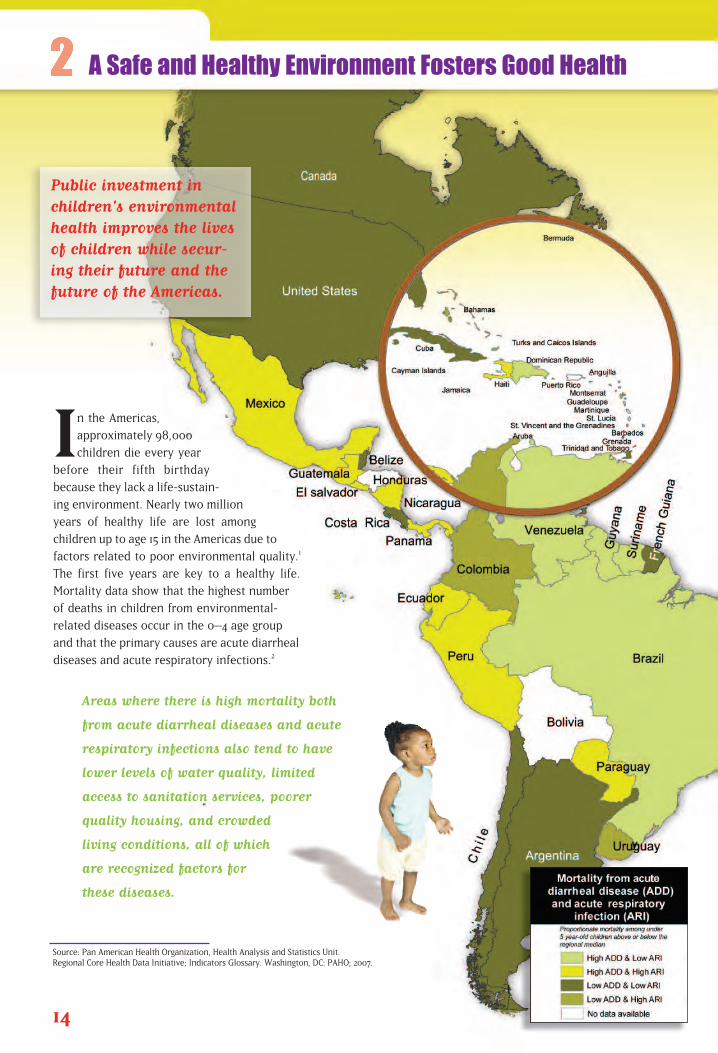
In the Americas,
approximately 98,000
children die every year
before their fifth birthday
because they lack a life-sustain-
ing environment. Nearly two million
years of healthy life are lost among
children up to age 15 in the Americas due to
factors related to poor environmental quality.1
The first five years are key to a healthy life.
Mortality data show that the highest number
of deaths in children from environmental-
related diseases occur in the 0–4 age group
and that the primary causes are acute diarrheal
diseases and acute respiratory infections.2
Areas where there is high mortality both
from acute diarrheal diseases and acute
respiratory infections also tend to have
lower levels of water quality, limited
access to sanitation services, poorer
quality housing, and crowded
living conditions, all of which
are recognized factors for
these diseases.
Public investment in children's environmentalhealth improves the livesof children while secur-ing their future and thefuture of the Americas.

In the Region’s industrialized nations, children face
environmental exposures that lead to asthma, neurologi-
cal and behavioral disorders, and cancers. Children in
developing countries of the Region not only face these
“modern” risks, but more traditional ones as well, such
as those from indoor smoke, poor water quality, lack of
sanitation, disease vectors, and other infrastructure-
related diseases.
Poor children need special attention in every country
of the Americas. They tend to live in less safe and more
polluted and degraded environments and to suffer from
poor nutrition and inadequate defense systems that are
unable to fight off disease and infection. Poor children
tend to have lower quality schools and less access to
adequate medical care. They also tend to become child
laborers at an early age to secure needed income and
help support themselves or their families.
More than 311 million children under
the age of 19 live in the Region of the
Americas.
As they grow, children’s health will be dependent upon
their living in a sustainable environment that provides
access to adequate sanitation, clean water, and
fresh air—both indoors and outdoors—and
safety from manmade and natural disas-
ters. Their communities, whether urban
or rural, must also offer basic safety
from war and violence, access to nearby
schools and health care of acceptable qual-
ity, and opportunities to improve their lives
and gain a hold on the future.
The World Health Organization
estimates that worldwide, nearly
one-quarter of all illnesses and deaths
in children under age 15 are due to
environmentally related diarrheal
diseases, malaria, and respiratory
infections. In the Americas, these
conditions play a major role in the
needless and preventable deaths
of children each year
15
The Atlas of Children’s Health and Environment in the Americas
Source: United Nations, Department of Economic and Social Affairs,Population Division. World Population Prospects: The 2006 Revision.Highlights. New York: United Nations; 2007 (ESA/P/WP.202). Availableat: http://www.un.org/esa/population/publications/wpp2006/WPP2006_Highlights_rev.pdf. Accessed on 18 March 2009.
Po
pu
lati
on
(in
th
ou
san
ds)
Child population, by age group, Region of the Americas, 2005.
75,000
80,000
Age 0-4
Age 5-9
Age 10-14
Age 15-19
78,490
77,644
78,486
77,011
Canada, Cuba
United States
Rest of Latin America and
the Caribbean
Bolivia, Ecuador,
Guatemala, Haiti, Nicaragua, Peru
Per
cen
tag
e o
f d
isea
se b
urd
en e
stim
ated
to
be
con
trib
ute
d b
y th
e en
viro
nm
ent
Development level
Environmental burden of disease, country groupings by development level,
Region of the Americas, 2002.
0
5
10
15
20
25
Proportionate mortality of children
under age 14 from diseases related to poor environmental conditions,
by disease type and percentage,Region of the Americas, 2002.
Injuries26%
Cancers7%
Respiratorydiseases
33%
Vector-bornediseases
2%
Diarrhealdiseases
32%
a
Graph 5
a N = 144,837.
Source: World Health Organization. Global burden of disease esti-mates. Geneva: WHO; 2004.
Graph 6
Source: Prüss-Üstün A, Corvalán C. Preventing disease throughhealthy environments: towards an estimate of the environmental bur-den of disease. Geneva: World Health Organization; 2006. Availableat: http://www.who.int/quantifying_ehimpacts/publications/prevent-ingdisease.pdf. Accessed on 2 June 2009.
Graph 7
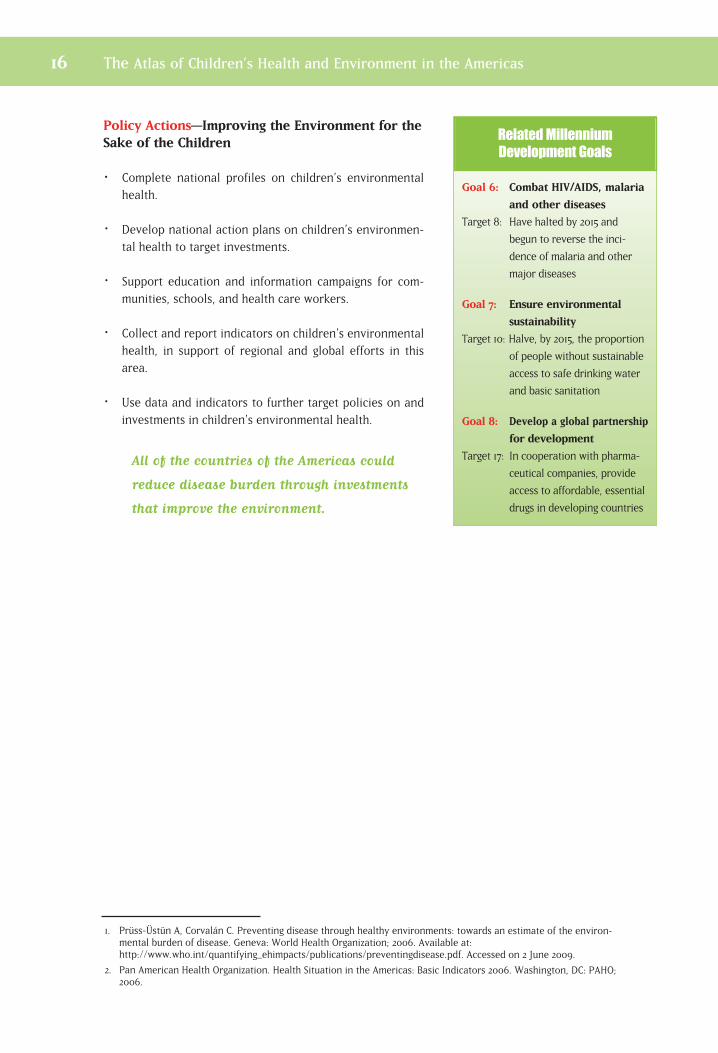
Policy Actions—Improving the Environment for theSake of the Children
• Complete national profiles on children’s environmentalhealth.
Develop national action plans on children’s environmen-tal health to target investments.
Support education and information campaigns for com-munities, schools, and health care workers.
Collect and report indicators on children’s environmentalhealth, in support of regional and global efforts in thisarea.
Use data and indicators to further target policies on andinvestments in children’s environmental health.
All of the countries of the Americas could
reduce disease burden through investments
that improve the environment.
1. Prüss-Üstün A, Corvalán C. Preventing disease through healthy environments: towards an estimate of the environ-mental burden of disease. Geneva: World Health Organization; 2006. Available at:http://www.who.int/quantifying_ehimpacts/publications/preventingdisease.pdf. Accessed on 2 June 2009.
2. Pan American Health Organization. Health Situation in the Americas: Basic Indicators 2006. Washington, DC: PAHO;2006.
16 The Atlas of Children’s Health and Environment in the Americas
Goal 6: Combat HIV/AIDS, malaria
and other diseases
Target 8: Have halted by 2015 and
begun to reverse the inci-
dence of malaria and other
major diseases
Goal 7: Ensure environmental
sustainability
Target 10: Halve, by 2015, the proportion
of people without sustainable
access to safe drinking water
and basic sanitation
Goal 8: Develop a global partnership
for development
Target 17: In cooperation with pharma-
ceutical companies, provide
access to affordable, essential
drugs in developing countries
Related Millennium
Development Goals
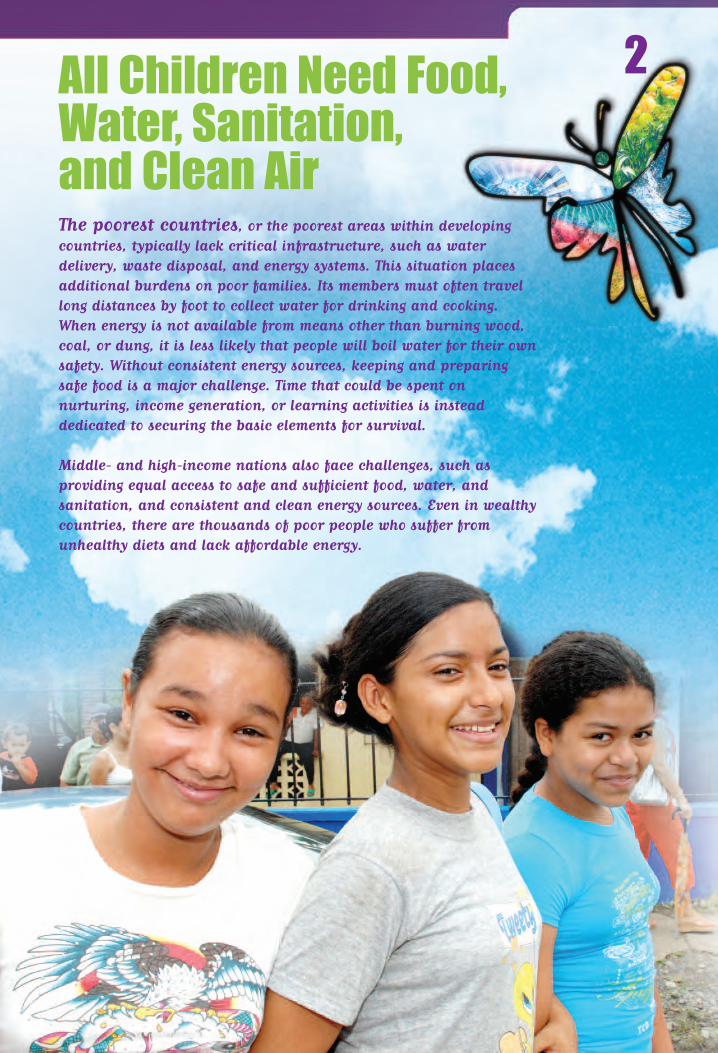
2
The poorest countries, or the poorest areas within developingcountries, typically lack critical infrastructure, such as water delivery, waste disposal, and energy systems. This situation placesadditional burdens on poor families. Its members must often travellong distances by foot to collect water for drinking and cooking. When energy is not available from means other than burning wood,coal, or dung, it is less likely that people will boil water for their ownsafety. Without consistent energy sources, keeping and preparingsafe food is a major challenge. Time that could be spent on nurturing, income generation, or learning activities is instead dedicated to securing the basic elements for survival.
Middle- and high-income nations also face challenges, such as providing equal access to safe and sufficient food, water, and sanitation, and consistent and clean energy sources. Even in wealthycountries, there are thousands of poor people who suffer fromunhealthy diets and lack affordable energy.
All Children Need Food, Water, Sanitation, and Clean Air

While breast-feeding is a culturally
accepted practice in Latin America
and the Caribbean, its prevalence is
far from optimal. While more than 90% of Latin
American and Caribbean newborns are breast-
fed for the first 15 days of life, only slightly more
than one-third are exclusively breast-fed to 4
months of age. The introduction of water, herbal teas,
and solid foods tends to occur early in life in these countries,
even though the United Nations Children’s Fund (UNICEF) and
World Health Organization (WHO) recommend that children be
exclusively breast-fed for six months prior to the introduction of
complimentary foods.
On average, for countries
reporting, less than one-third
of infants in the Region of the
Americas were breast-fed
exclusively through their first
six months of life.
Surviving the First Months
18
Exclusive breast-feeding during the firstsix months of life, andcontinued breast-feeding together withthe provision of safeand sufficient complementary foodsuntil age two or beyond,provide a child with the best possible startin life.
Source: UNICEF Global Database on Breastfeeding.

The importance of breast-feeding to the health and
survivability of infants is well-established. During the
1980s, WHO assumed a leadership role in combating
unethical marketing practices by companies that sold
breast-milk substitutes in developing countries. The
tactics included clever and attractive media advertising,
aggressive promotion of infant formula products in the
academic community, the provision of free samples to
pediatricians, and manipulation of local culture and
superstition. As a result, mothers received inadequate
counseling and inaccurate information from health care
providers regarding the superior nutritional benefits of
breast milk.
WHO’s International Code of Marketing of Breast-milk
Substitutes (1981) that came as a reaction to these private
sector abuses aimed “to contribute to the provision of safe
and adequate nutrition of infants and young children, and
in particular to promote breast-feeding . . . ”.1 This Code
and its guidelines are considered minimum requirements
to protect the health of infants and young children. Data
suggest that in developing countries, during the 1990–2000
period, exclusive breast-feeding levels rose from 46% to 53%
among infants younger than four months and from 34% to
39% in infants under six months of age.2
Breast milk alone is the only
food and drink an infant
needs for the first six
months.3 Infants exclusively
breast-fed for six months have
a lower incidence of gastrointestinal
infections compared to infants who
are not.
In 1990, public policy-makers from more than 30 coun-
tries signed the Innocenti Declaration on the Protection,
Promotion, and Support of Breast-feeding, which set
forth additional action strategies and operational targets
to strengthen breast-feeding promotion efforts on a
national scale. This was followed by the 1991 launching of
the Baby-friendly Hospital Initiative (BFHI), a global effort
by UNICEF and WHO to improve the role of maternity
care services and facilities, whether free-standing or in a
hospital, in enabling mothers to breast-feed babies for
19
The Atlas of Children’s Health and Environment in the Americas
1. World Health Organization. International Code of Marketing ofBreast-milk Substitutes. Geneva: WHO; 1981.
2. Labbok M. Breastfeeding: a woman’s reproductive right. Int J Gynaecol Obstet 2006;94(3):277–86.
3. United Nations Children’s Fund. Facts for Life. New York:UNICEF; 2002. Available at: http://www.unicef.org/ffl/pdf/facts-forlife-en-full.pdf. Accessed on 3 March 2009.
• It provides the best available nutrition for the first six months
of life.
• It promotes physical growth and mental development.
• It provides immunoglobulins, antibodies, and antioxidants and helps
reduce the risk of diarrhea and acute respiratory and ear infections.
• It may reduce the risk of obesity andchronic diseases later in life.
• It temporarily reduces the mother’sfertility and extends the periodbetween pregnancies, a factor
in child survival.
How breast-feeding benefits children’s health
Source: Nutrition data. Healthy Life Course, Family and CommunityHealth, Pan American Health Organization, 2011.
Per
u
Chi
le
Bol
ivia
Gua
tem
ala
Sai
nt K
itts
& N
evis
Cub
a
Hon
dura
s
Ecu
ador
Nic
arag
ua
Gre
nada
Col
ombi
a
Hai
ti
El S
alva
dor
Bel
ize
Guy
ana
Dom
inic
an R
epub
lic
Sur
inam
e
Par
agua
y
Ven
ezue
la
Trin
idad
& T
obag
o
Per
cen
tag
e
Exclusive breast-feeding among children aged 4-6 months, selected countries of the Americas, 1998-2003.
0
20
40
60
80
< 4 months < 6 months
Graph 8
the best start in life. Since the BFHI’s launching, the networkof baby-friendly facilities has grown to include more than20,000 facilities in more than 150 countries across the globe.4
Policy Actions—Promoting Exclusive Breast-feedingthrough the First Six Months of Life
Implement and enforce the International Code ofMarketing of Breast-milk Substitutes.
Establish and/or strengthen multisectoral breast-feedingpromotion committees and their coordination at thenational level, as called for in the Innocenti Declarationon the Protection, Promotion, and Support of Breast -feeding, to increase the number of women who exclu -sively breast-feed their childrenduring the first six months of life.
Strengthen support for maternityfacilities, health workers, and com-munity midwives in promotingbreast-feeding and in helping newmothers overcome all barriers toits practice.
20 The Atlas of Children’s Health and Environment in the Americas
Goal 4: Reduce child mortality
Target 5: Reduce by two-thirds,
between 1990 and 2015, the
under-five mortality rate
Goal 5: Improve maternal health
Target 6: Reduce by three-quarters,
between 1990 and 2015, the
maternal mortality ratio
Related Millennium
Development Goals
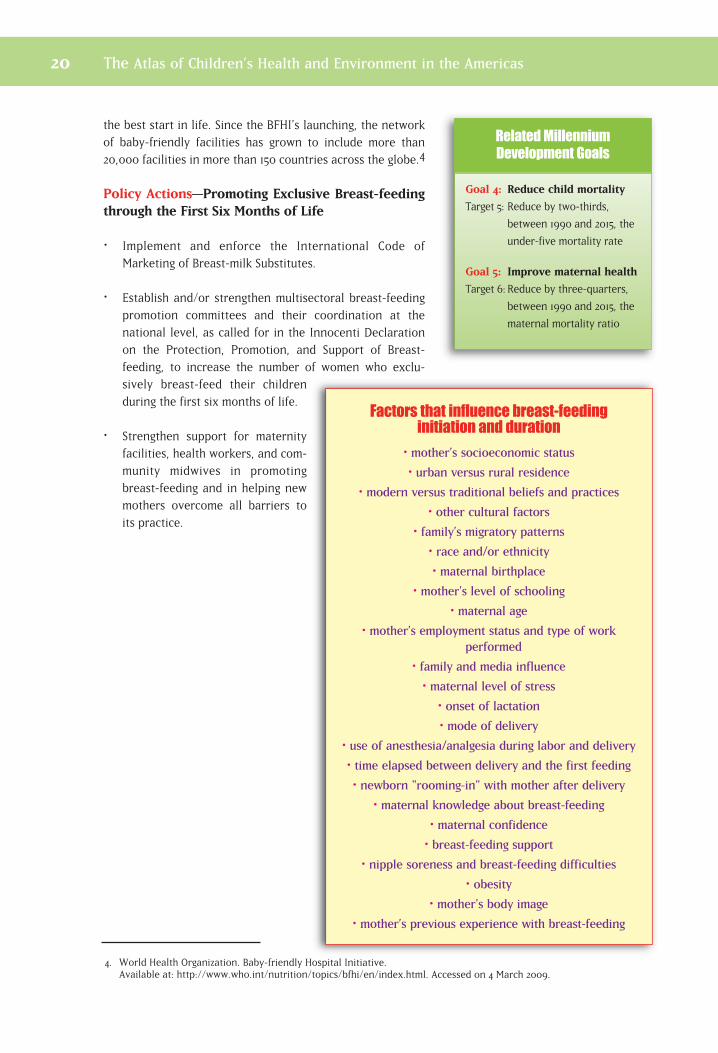
Factors that influence breast-feeding initiation and duration
• mother’s socioeconomic status
• urban versus rural residence
• modern versus traditional beliefs and practices
• other cultural factors
• family’s migratory patterns
• race and/or ethnicity
• maternal birthplace
• mother’s level of schooling
• maternal age
• mother’s employment status and type of work performed
• family and media influence
• maternal level of stress
• onset of lactation
• mode of delivery
• use of anesthesia/analgesia during labor and delivery
• time elapsed between delivery and the first feeding
• newborn "rooming-in" with mother after delivery
• maternal knowledge about breast-feeding
• maternal confidence
• breast-feeding support
• nipple soreness and breast-feeding difficulties
• obesity
• mother's body image
• mother’s previous experience with breast-feeding
4. World Health Organization. Baby-friendly Hospital Initiative. Available at: http://www.who.int/nutrition/topics/bfhi/en/index.html. Accessed on 4 March 2009.
The Atlas of Children’s Health and Environment in the Americas 21
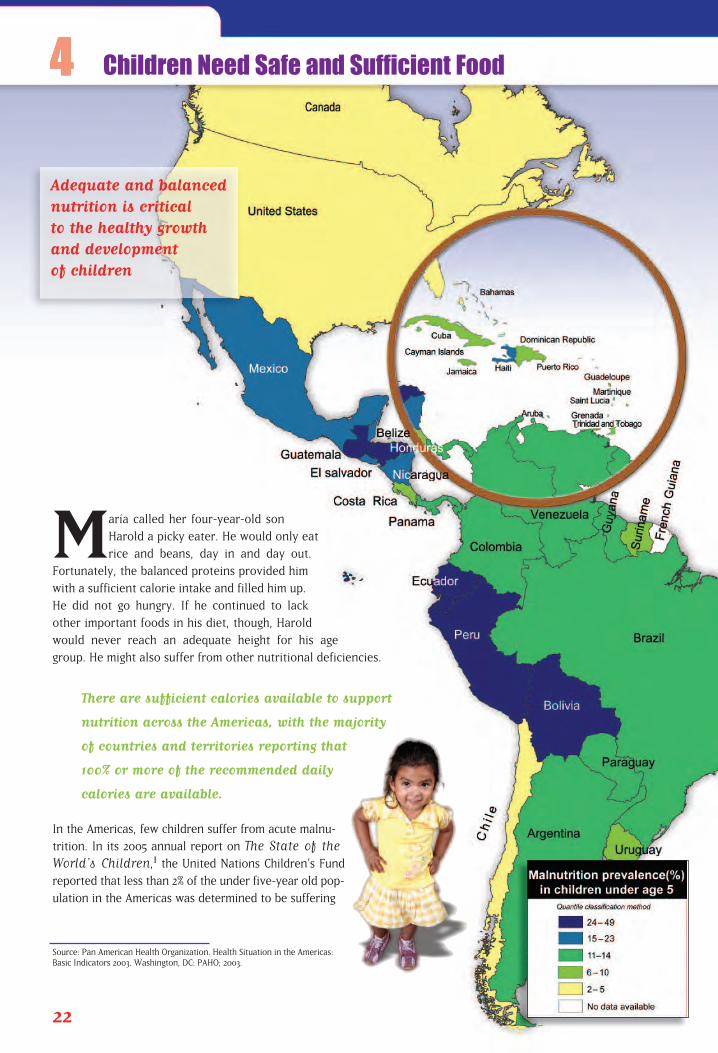
María called her four-year-old son
Harold a picky eater. He would only eat
rice and beans, day in and day out.
Fortunately, the balanced proteins provided him
with a sufficient calorie intake and filled him up.
He did not go hungry. If he continued to lack
other important foods in his diet, though, Harold
would never reach an adequate height for his age
group. He might also suffer from other nutritional deficiencies.
There are sufficient calories available to support
nutrition across the Americas, with the majority
of countries and territories reporting that
100% or more of the recommended daily
calories are available.
In the Americas, few children suffer from acute malnu-
trition. In its 2005 annual report on The State of theWorld’s Children,1 the United Nations Children’s Fund
reported that less than 2% of the under five-year old pop-
ulation in the Americas was determined to be suffering
22
Source: Pan American Health Organization. Health Situation in the Americas:Basic Indicators 2003. Washington, DC: PAHO; 2003.
Children Need Safe and Sufficient Food
Adequate and balancednutrition is critical to the healthy growthand development of children
from nutritional wasting, defined as being
10% or more underweight. Still, some of the
most impoverished countries in the Region
reported wasting levels as high as 6%.
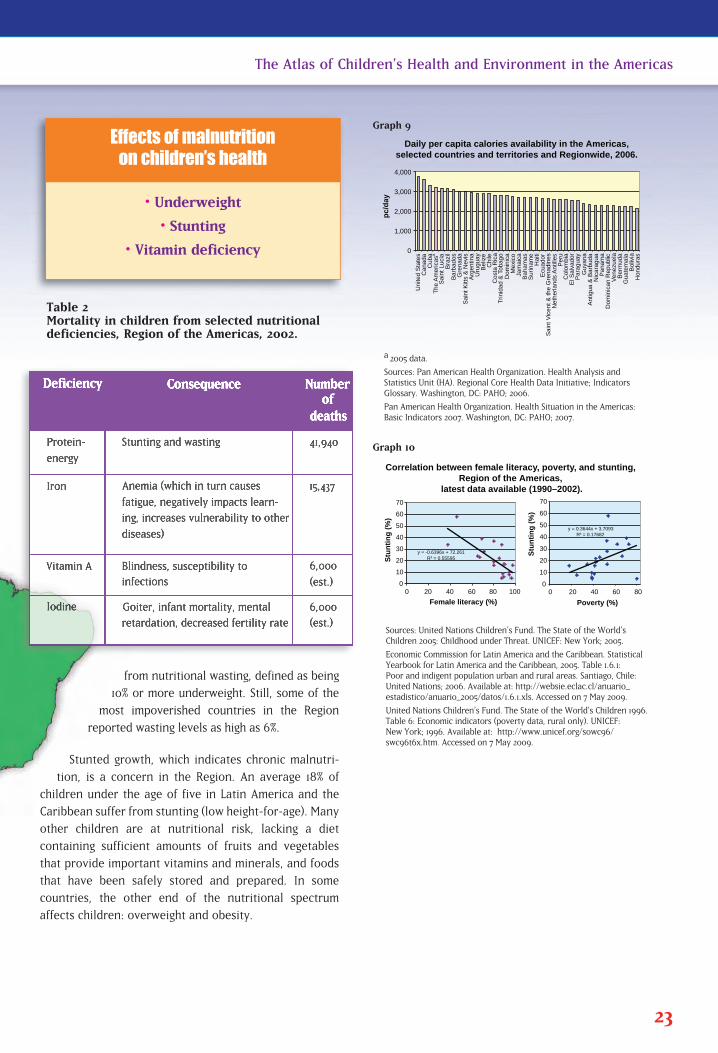
Stunted growth, which indicates chronic malnutri-
tion, is a concern in the Region. An average 18% of
children under the age of five in Latin America and the
Caribbean suffer from stunting (low height-for-age). Many
other children are at nutritional risk, lacking a diet
containing sufficient amounts of fruits and vegetables
that provide important vitamins and minerals, and foods
that have been safely stored and prepared. In some
countries, the other end of the nutritional spectrum
affects children: overweight and obesity.
23
The Atlas of Children’s Health and Environment in the Americas
• Underweight
• Stunting
• Vitamin deficiency
Effects of malnutrition on children’s health
Sources: United Nations Children’s Fund. The State of the World’sChildren 2005: Childhood under Threat. UNICEF: New York; 2005.
Economic Commission for Latin America and the Caribbean. StatisticalYearbook for Latin America and the Caribbean, 2005. Table 1.6.1: Poor and indigent population urban and rural areas. Santiago, Chile:United Nations; 2006. Available at: http://websie.eclac.cl/anuario_estadistico/anuario_2005/datos/1.6.1.xls. Accessed on 7 May 2009.
United Nations Children’s Fund. The State of the World’s Children 1996.Table 6: Economic indicators (poverty data, rural only). UNICEF: New York; 1996. Available at: http://www.unicef.org/sowc96/swc96t6x.htm. Accessed on 7 May 2009.
a 2005 data.
Sources: Pan American Health Organization. Health Analysis andStatistics Unit (HA). Regional Core Health Data Initiative; IndicatorsGlossary. Washington, DC: PAHO; 2006.
Pan American Health Organization. Health Situation in the Americas:Basic Indicators 2007. Washington, DC: PAHO; 2007.
0
1,000
2,000
3,000
4,000
Unite
d S
tate
s
Canada
Cuba
The A
merica
s
a
Sain
t Luci
a
Bra
zil
Barb
ados
Gre
nada
Sain
t K
itts
& N
evi
s A
rgentin
a
Uru
guay
Beliz
e
Chile
C
ost
a R
ica
Trinid
ad &
Tobago
Dom
inic
a
Mexi
co
Jam
aic
a
Baham
as
Surinam
e
Haiti
E
cuador
Neth
erlands
Antil
les
Peru
C
olo
mbia
Para
guay
Guya
na
Antig
ua &
Barb
uda
Nic
ara
gua
Panam
a
Dom
inic
an R
epublic
V
enezu
ela
B
erm
uda
Guate
mala
B
oliv
ia
Hondura
s
pc/
day
El S
alv
ador
Sain
t V
icent &
the G
renadin
es
Daily per capita calories availability in the Americas,selected countries and territories and Regionwide, 2006.
y = -0.6396x + 72.261 R = 0.55595
0
10
20
30
40
50
60
70
0 20 40 60 80 100
Stu
nti
ng
(%
)
Female literacy (%)
y = 0.3644x + 3.7093 R = 0.17682
0
10
20
30
40
50
60
70
0 20 40 60 80
Stu
nti
ng
(%
)
Poverty (%)
Correlation between female literacy, poverty, and stunting, Region of the Americas,
latest data available (1990–2002).
Graph 9
Graph 10
Table 2Mortality in children from selected nutritional deficiencies, Region of the Americas, 2002.
Poverty and malnutrition track each other
nearly one-for-one in the Americas. As the
percentage of the population living in poverty
decreases, so does the percentage of children
suffering from stunting. Female literacy has
an inverse relationship with these other two
factors. Among women who are better
educated, poverty and stunting incidences
are lower.
Food preparation is also important to ensure safety and goodhealth. Lack of access to safe drinking water and insufficientwater to support good hygiene negatively impact food safety.Without electricity, refrigerators cannot operate, thus pre-senting a challenge for the safe storage of perishable food-stuffs. Fresh foods that are not properly chilled, kept for toolong, or left uncovered allow dangerous bacteria to grow andreproduce. Contaminated foods cause foodborne diseases,which in turn are characterized by diarrhea and vomiting, andcan lead to dehydration. Repeated bouts with these diseasesmay lead to chronic nutritional deficiencies and malnutrition.
Policy Actions—Providing Children with the Nutrition They Need
•� Continue infrastructure investments to bring water, sanitation, and energy to householdsthroughout the Americas. These actions, in turn, will improve food safety.
•� Develop and implement food distribution programs for undernourished children.
•� Promote the creation of food fortification programs to facilitate children’s intake of adequatequantities of iron, Vitamin A, Vitamin B, and iodine to support good health.
•� Develop and disseminate education programs to teach parents and caregivers about safe foodstorage and preparation.
1. United Nations Children’s Fund. The State of the World’s Children 2005: Childhood under Threat. UNICEF: NewYork; 2005.
24 The Atlas of Children’s Health and Environment in the Americas
Goal 1: Eradicate extreme
poverty and hunger
Target 2: Halve, between 1990 and
2015, the proportion of peo-
ple who suffer from hunger
Goal 3: Promote gender equality
and empower women
Target 4: Eliminate gender disparity
in primary and secondary
education preferably by
2005 and in all levels of
education no later than 2015
Goal 4: Reduce child mortality
Target 5: Reduce by two-thirds,
between 1990 and 2015, the
under-five mortality rate
Related Millennium
Development Goals
The Atlas of Children’s Health and Environment in the Americas 25
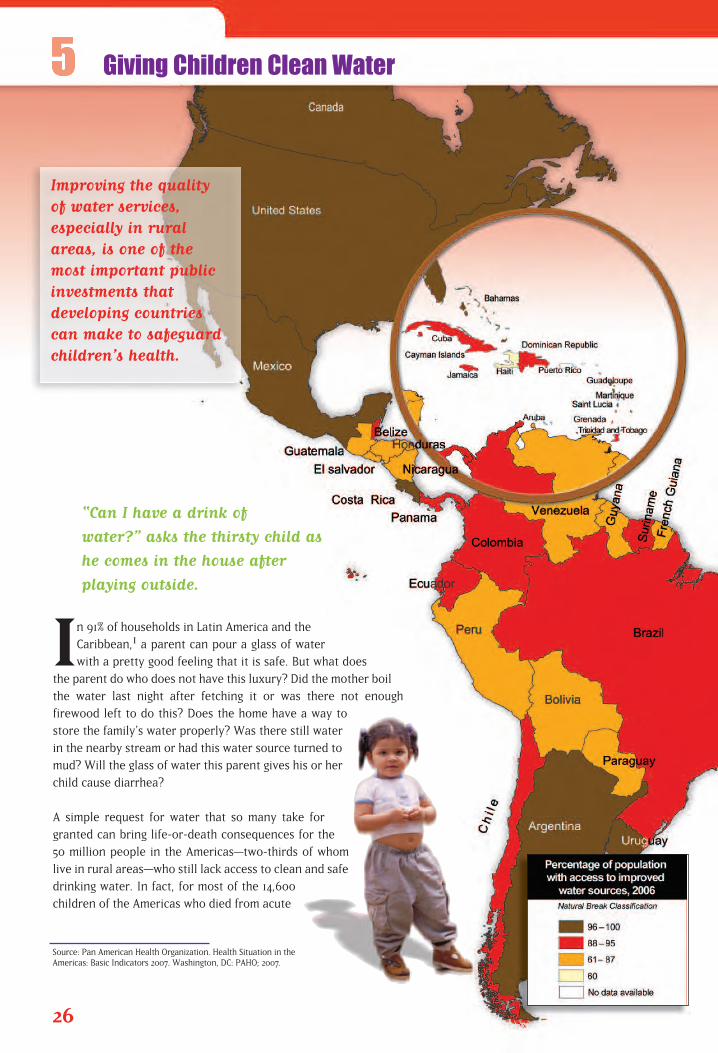
“Can I have a drink of
water?” asks the thirsty child as
he comes in the house after
playing outside.
In 91% of households in Latin America and the
Caribbean,1 a parent can pour a glass of water
with a pretty good feeling that it is safe. But what does
the parent do who does not have this luxury? Did the mother boil
the water last night after fetching it or was there not enough
firewood left to do this? Does the home have a way to
store the family’s water properly? Was there still water
in the nearby stream or had this water source turned to
mud? Will the glass of water this parent gives his or her
child cause diarrhea?
A simple request for water that so many take for
granted can bring life-or-death consequences for the
50 million people in the Americas—two-thirds of whom
live in rural areas—who still lack access to clean and safe
drinking water. In fact, for most of the 14,600
children of the Americas who died from acute
26
Source: Pan American Health Organization. Health Situation in theAmericas: Basic Indicators 2007. Washington, DC: PAHO; 2007.
Giving Children Clean Water
Improving the quality of water services, especially in ruralareas, is one of themost important publicinvestments that developing countriescan make to safeguardchildren’s health.
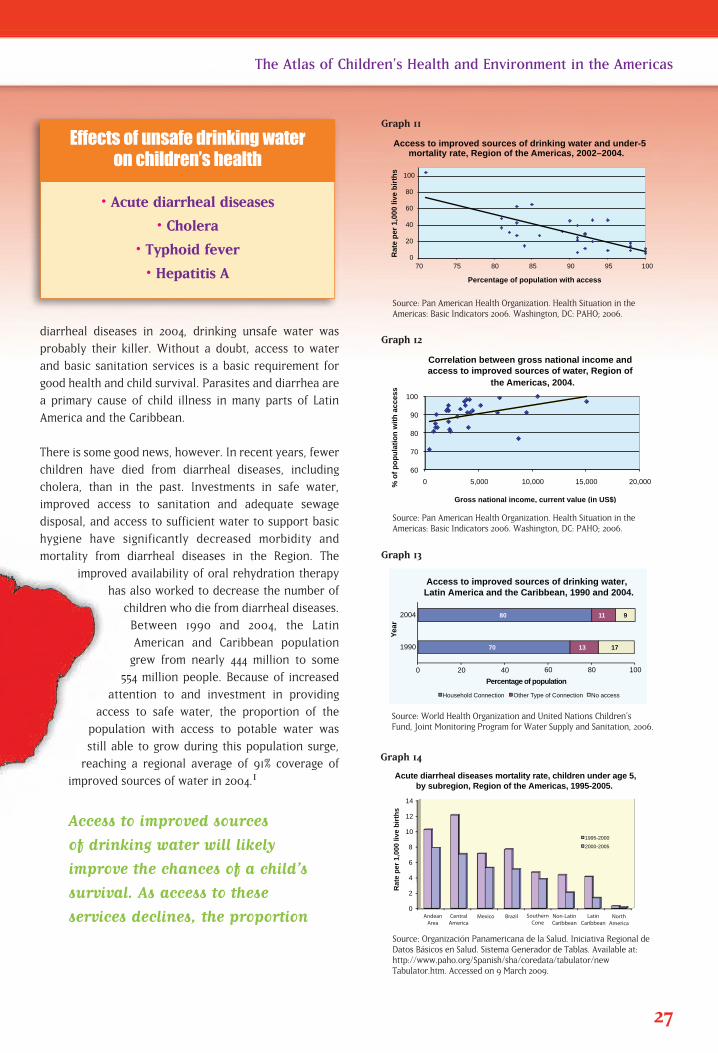
diarrheal diseases in 2004, drinking unsafe water was
probably their killer. Without a doubt, access to water
and basic sanitation services is a basic requirement for
good health and child survival. Parasites and diarrhea are
a primary cause of child illness in many parts of Latin
America and the Caribbean.
There is some good news, however. In recent years, fewer
children have died from diarrheal diseases, including
cholera, than in the past. Investments in safe water,
improved access to sanitation and adequate sewage
disposal, and access to sufficient water to support basic
hygiene have significantly decreased morbidity and
mortality from diarrheal diseases in the Region. The
improved availability of oral rehydration therapy
has also worked to decrease the number of
children who die from diarrheal diseases.
Between 1990 and 2004, the Latin
American and Caribbean population
grew from nearly 444 million to some
554 million people. Because of increased
attention to and investment in providing
access to safe water, the proportion of the
population with access to potable water was
still able to grow during this population surge,
reaching a regional average of 91% coverage of
improved sources of water in 2004.1
Access to improved sources
of drinking water will likely
improve the chances of a child’s
survival. As access to these
services declines, the proportion
27
The Atlas of Children’s Health and Environment in the Americas
Source: Pan American Health Organization. Health Situation in theAmericas: Basic Indicators 2006. Washington, DC: PAHO; 2006.
0
20
40
60
80
100
70 75 80 85 90 95 100
Rat
e p
er 1
,000
live
bir
ths
Percentage of population with access
Access to improved sources of drinking water and under-5 mortality rate, Region of the Americas, 2002–2004.
11
13
0 20 40 60 80 100
2004
1990
Yea
r
Household Connection Other Type of Connection No access
Percentage of population
Access to improved sources of drinking water,Latin America and the Caribbean, 1990 and 2004.
80
70
11
13
9
17
60
70
80
90
100
0 5,000 10,000 15,000 20,000 % o
f p
op
ula
tio
n w
ith
acc
ess
Gross national income, current value (in US$)
Correlation between gross national income and access to improved sources of water, Region of
the Americas, 2004.
Graph 11
Source: Pan American Health Organization. Health Situation in theAmericas: Basic Indicators 2006. Washington, DC: PAHO; 2006.
Source: World Health Organization and United Nations Children’sFund, Joint Monitoring Program for Water Supply and Sanitation, 2006.
Graph 12
Source: Organización Panamericana de la Salud. Iniciativa Regional deDatos Básicos en Salud. Sistema Generador de Tablas. Available at:http://www.paho.org/Spanish/sha/coredata/tabulator/newTabulator.htm. Accessed on 9 March 2009.
Graph 13
Rat
e p
er 1
,000
live
bir
ths
Acute diarrheal diseases mortality rate, children under age 5, by subregion, Region of the Americas, 1995-2005.
0
2
4
6
8
10
12
14
1995-2000
2000-2005
AndeanArea
CentralAmerica
Mexico Brazil SouthernCone
Non-LatinCaribbean
LatinCaribbean
NorthAmerica
Graph 14
• Acute diarrheal diseases
• Cholera
• Typhoid fever
• Hepatitis A
Effects of unsafe drinking water on children’s health
of children who may die from acute
diarrheal diseases before age five
increases.
With continued investment in the water services sector, thecountries of Latin America and the Caribbean will remain ontrack to meet the 2015 Millennium Development Goal targetfor access to improved sources of water. In fact, according tothe Inter-American Development Bank, an investment inwater services across Latin America and the Caribbean total-ing only US$ 1 billion per year in urban areas and US$ 100 million annually in rural areas will allow this entire region tomeet the 2015 Millennium Development Goal target for accessto improved sources of drinking water.2
Policy Actions—Continuing the Positive Trend ofIncreasing Access to Safe Water
Provide access to improved water sources for all children,including a focus on safe water provision at all schools.
Increase access to disinfected water sources and ensurecontinuity of services.
Educate schoolchildren about proper hygiene.
Protect all natural water resources, remembering they are the source of water for human consumption.
Promote home-based safe water treatment in rural zones where public water services are not yetavailable, so that all children have access to safe drinking water in their homes.
1. World Health Organization and United Nations Children’s Fund Joint Monitoring Program for Water Supply andSanitation. Meeting the MDG Drinking Water and Sanitation Target: the Urban and Rural Challenge of the Decade.WHO and UNICEF: Geneva; 2006. Available at:http://www.who.int/water_sanitation_health/monitoring/jmpfinal.pdf. Accessed on 1 June 2009.
2. Inter-American Development Bank. Las metas del milenio y las necesidades de inversión de América Latina y elCaribe. Document presented at the Financing Water and Sanitation Services: Options and Restraints internationalconference. 1–11 November 2003, Washington, DC.
28 The Atlas of Children’s Health and Environment in the Americas
Goal 4: Reduce child mortality
Target 5: Reduce by two-thirds,
between 1990 and 2015,
the under-five mortality
rate
Goal 7: Ensure environmental
sustainability
Target 10: Halve, by 2015, the propor-
tion of people without sus-
tainable access to safe
drinking water and basic
sanitation
Goal 8: Develop a global
partnership for
development
Target 17: In cooperation with
pharmaceutical companies,
provide access to afford-
able essential drugs in
developing countries
Related Millennium
Development Goals
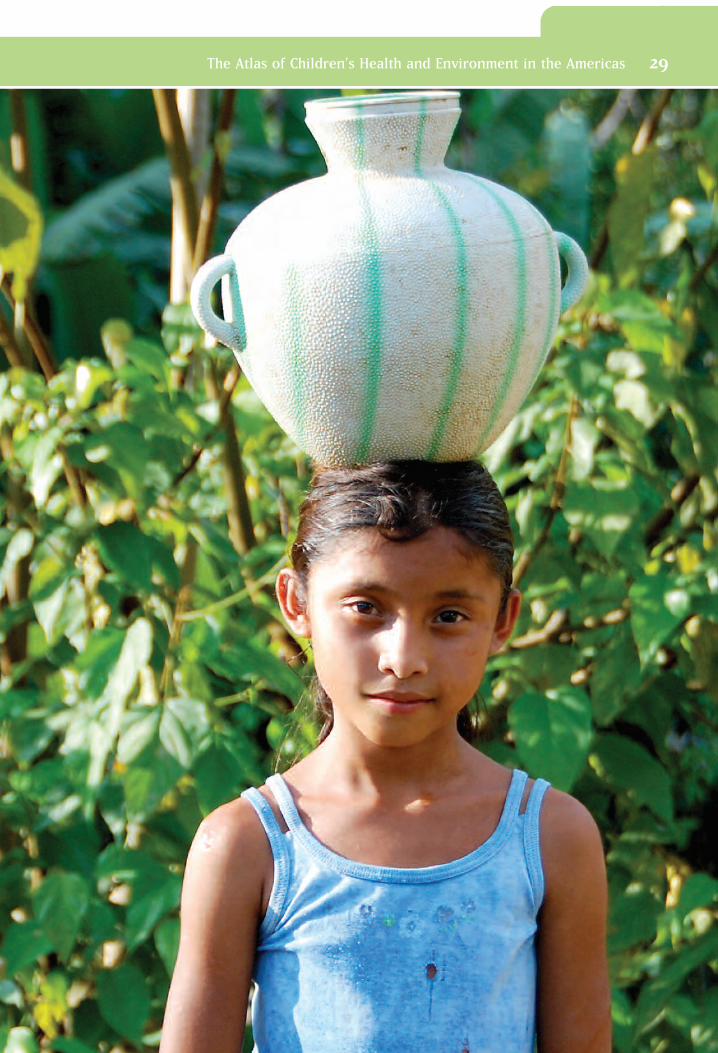
The Atlas of Children’s Health and Environment in the Americas 29
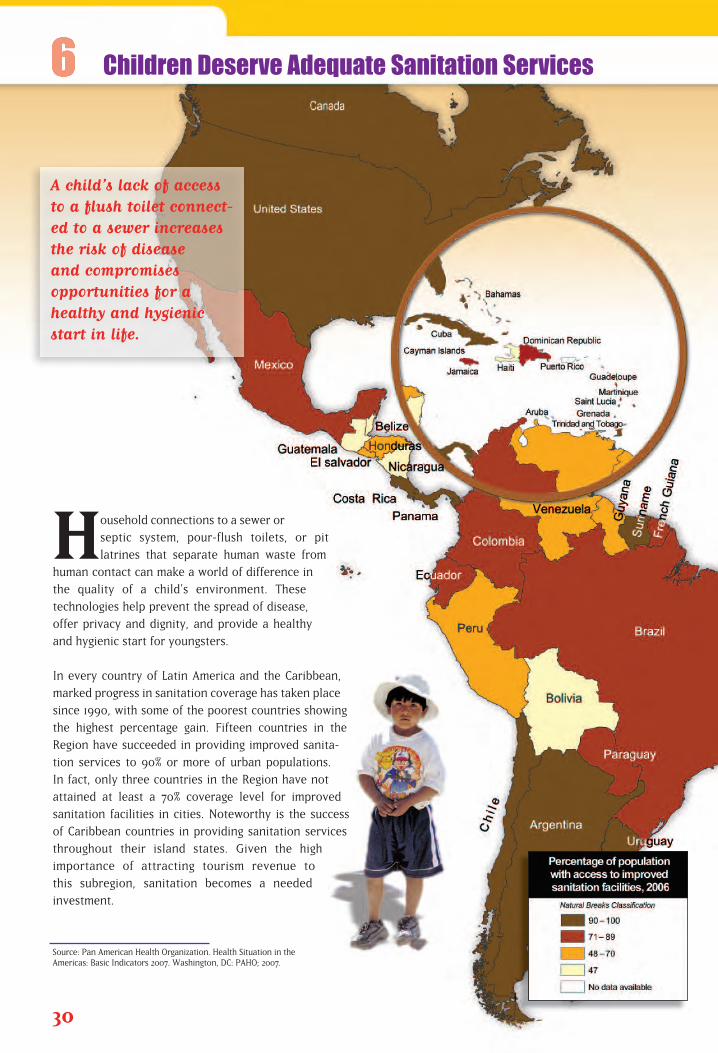
Household connections to a sewer or
septic system, pour-flush toilets, or pit
latrines that separate human waste from
human contact can make a world of difference in
the quality of a child’s environment. These
technologies help prevent the spread of disease,
offer privacy and dignity, and provide a healthy
and hygienic start for youngsters.
In every country of Latin America and the Caribbean,
marked progress in sanitation coverage has taken place
since 1990, with some of the poorest countries showing
the highest percentage gain. Fifteen countries in the
Region have succeeded in providing improved sanita-
tion services to 90% or more of urban populations.
In fact, only three countries in the Region have not
attained at least a 70% coverage level for improved
sanitation facilities in cities. Noteworthy is the success
of Caribbean countries in providing sanitation services
throughout their island states. Given the high
importance of attracting tourism revenue to
this subregion, sanitation becomes a needed
investment.
30
Source: Pan American Health Organization. Health Situation in theAmericas: Basic Indicators 2007. Washington, DC: PAHO; 2007.
Children Deserve Adequate Sanitation Services
A child’s lack of access to a flush toilet connect-ed to a sewer increasesthe risk of disease and compromises opportunities for ahealthy and hygienicstart in life.
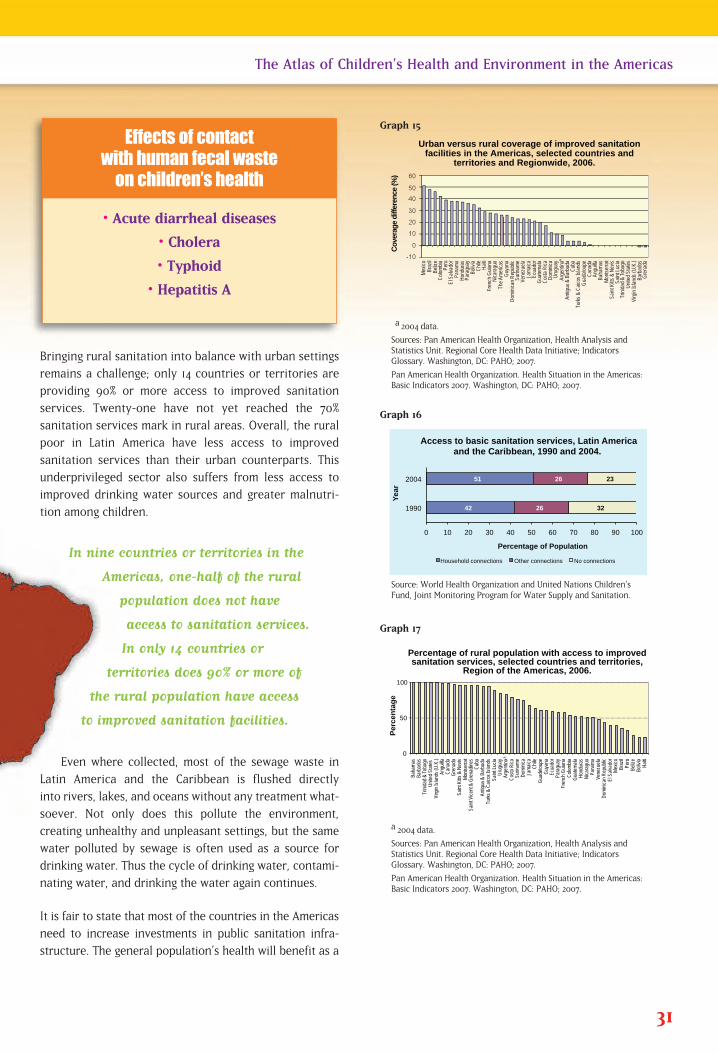
Bringing rural sanitation into balance with urban settings
remains a challenge; only 14 countries or territories are
providing 90% or more access to improved sanitation
services. Twenty-one have not yet reached the 70%
sanitation services mark in rural areas. Overall, the rural
poor in Latin America have less access to improved
sanitation services than their urban counterparts. This
underprivileged sector also suffers from less access to
improved drinking water sources and greater malnutri-
tion among children.
In nine countries or territories in the
Americas, one-half of the rural
population does not have
access to sanitation services.
In only 14 countries or
territories does 90% or more of
the rural population have access
to improved sanitation facilities.
Even where collected, most of the sewage waste in
Latin America and the Caribbean is flushed directly
into rivers, lakes, and oceans without any treatment what-
soever. Not only does this pollute the environment,
creating unhealthy and unpleasant settings, but the same
water polluted by sewage is often used as a source for
drinking water. Thus the cycle of drinking water, contami-
nating water, and drinking the water again continues.
It is fair to state that most of the countries in the Americas
need to increase investments in public sanitation infra-
structure. The general population’s health will benefit as a
31
The Atlas of Children’s Health and Environment in the Americas
a 2004 data.
Sources: Pan American Health Organization, Health Analysis andStatistics Unit. Regional Core Health Data Initiative; IndicatorsGlossary. Washington, DC: PAHO; 2007.
Pan American Health Organization. Health Situation in the Americas:Basic Indicators 2007. Washington, DC: PAHO; 2007.
Urban versus rural coverage of improved sanitation facilities in the Americas, selected countries and
territories and Regionwide, 2006.
Cov
erag
e di
ffere
nce
(%)
Mexic
oBr
azil
Beliz
eCo
lombia Peru
El S
alvad
orPa
nama
Hond
uras
Para
guay
Boliv
iaCh
ileHa
itiFr
ench
Guia
naNi
cara
gua
The A
meric
asGu
yana
Domi
nican
Rep
ublic
Surin
ame
Vene
zuela
Jama
icaEc
uado
rGu
atema
laCo
sta R
icaDo
minic
aUr
ugua
yAr
genti
naAn
tigua
& B
arbu
daCu
baTu
rks &
Caic
os Is
lands
Guad
aloup
eCa
nada
Angu
illaBa
hama
sMo
ntser
rat
Saint
Kitts
& N
evis
Saint
Lucia
Trini
dad &
Toba
goUn
ited S
tates
Virg
in Isl
ands
(U.K
.)Ba
rbad
osGr
enad
aa
0
50
100
Baha
mas
Barb
ados
Trini
dad &
Toba
go
Unite
d Stat
es
Virg
in Isl
ands
(U.K
.) An
guilla
C
anad
a G
rena
da
Saint
Kitts
& N
evis
Monts
erra
t Saint
Vice
nt &
Gren
adine
s C
uba
Antig
ua &
Bar
buda
Turks
& C
aicos
Islan
ds
Saint
Lucia
U
rugu
ay
Arge
ntina
Co
sta R
ica
Surin
ame
Domi
nica
Jama
ica
Chil
e Gu
adelo
upe
Guy
ana
Ecua
dor
Para
guay
Fr
ench
Guia
na
Colom
bia
Guate
mala
Hond
uras
Ni
cara
gua
Pana
ma
Vene
zuela
Do
minic
an R
epub
lic
El S
alvad
or
Mex
ico
Bra
zil
Per
u B
elize
B
olivia
H
aiti
Per
cen
tag
e
a
Percentage of rural population with access to improved sanitation services, selected countries and territories,
Region of the Americas, 2006.
0 10 20 30 40 50 60 70 80 90 100
1990
2004
Percentage of Population
Yea
r
Access to basic sanitation services, Latin America and the Caribbean, 1990 and 2004.
42
51
26
26
32
23
Household connections Other connections No connections
Graph 15
Source: World Health Organization and United Nations Children’sFund, Joint Monitoring Program for Water Supply and Sanitation.
Graph 16
a 2004 data.
Sources: Pan American Health Organization, Health Analysis andStatistics Unit. Regional Core Health Data Initiative; IndicatorsGlossary. Washington, DC: PAHO; 2007.
Pan American Health Organization. Health Situation in the Americas:Basic Indicators 2007. Washington, DC: PAHO; 2007.
Graph 17
• Acute diarrheal diseases
• Cholera
• Typhoid
• Hepatitis A
Effects of contact with human fecal waste
on children’s health
result: removing human waste from human contact reduces therisk of disease, improves the survivability of children, andincreases equity across all sectors of society.
Policy Actions—Increasing Access to SanitationServices
Make and follow through on political commitments to provide improved sanitation services equally to all ruraland urban populations.
In communities where there is little or no sanitation infrastructure, provide residents with adequate educationregarding the safe disposal of wastewater and sewage andproper hygienic practices to safeguard health and preventdisease.
Apply appropriate technologies to collect and treat waste-water that take into account local environmental conditionsand are respectful of residents’ socio-cultural values.
Develop sanitation provision policies that are sustainable,allocating sufficient human and financial resources todevelop systems that protect the environment, break thecycle of disease, and improve quality of life at the house-hold level.
32 The Atlas of Children’s Health and Environment in the Americas
Goal 2: Achieve universal
primary education
Target 3 Ensure that, by 2015, chil-
dren everywhere, boys and
girls alike, will be able to
complete a full course of
primary schooling
Goal 4: Reduce child mortality
Target 5: Reduce by two-thirds,
between 1990 and 2015,
the under-five mortality
rate
Goal 7: Ensure environmental
sustainability
Target 10: Halve, by 2015, the propor-
tion of people without
sustainable access to safe
drinking water and basic
sanitation
Related Millennium
Development Goals
The Atlas of Children’s Health and Environment in the Americas 33
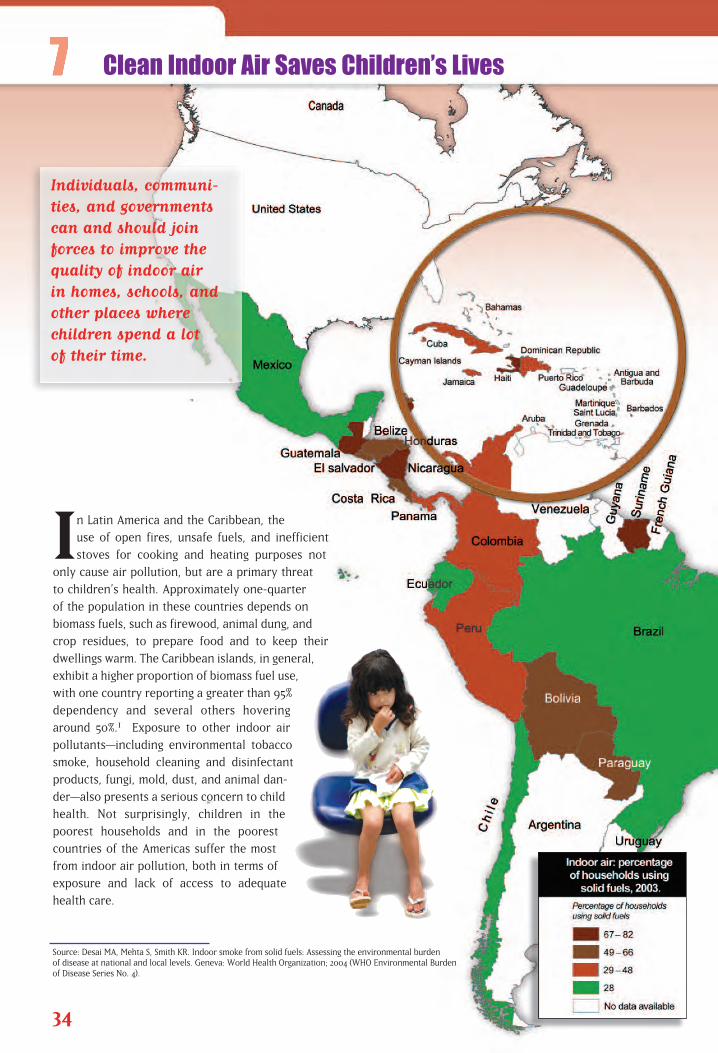
In Latin America and the Caribbean, the
use of open fires, unsafe fuels, and inefficient
stoves for cooking and heating purposes not
only cause air pollution, but are a primary threat
to children’s health. Approximately one-quarter
of the population in these countries depends on
biomass fuels, such as firewood, animal dung, and
crop residues, to prepare food and to keep their
dwellings warm. The Caribbean islands, in general,
exhibit a higher proportion of biomass fuel use,
with one country reporting a greater than 95%
dependency and several others hovering
around 50%.1 Exposure to other indoor air
pollutants—including environmental tobacco
smoke, household cleaning and disinfectant
products, fungi, mold, dust, and animal dan-
der—also presents a serious concern to child
health. Not surprisingly, children in the
poorest households and in the poorest
countries of the Americas suffer the most
from indoor air pollution, both in terms of
exposure and lack of access to adequate
health care.
34
Source: Desai MA, Mehta S, Smith KR. Indoor smoke from solid fuels: Assessing the environmental burden of disease at national and local levels. Geneva: World Health Organization; 2004 (WHO Environmental Burden of Disease Series No. 4).
Clean Indoor Air Saves Children’s Lives
Individuals, communi-ties, and governmentscan and should joinforces to improve thequality of indoor air in homes, schools, andother places where children spend a lot of their time.
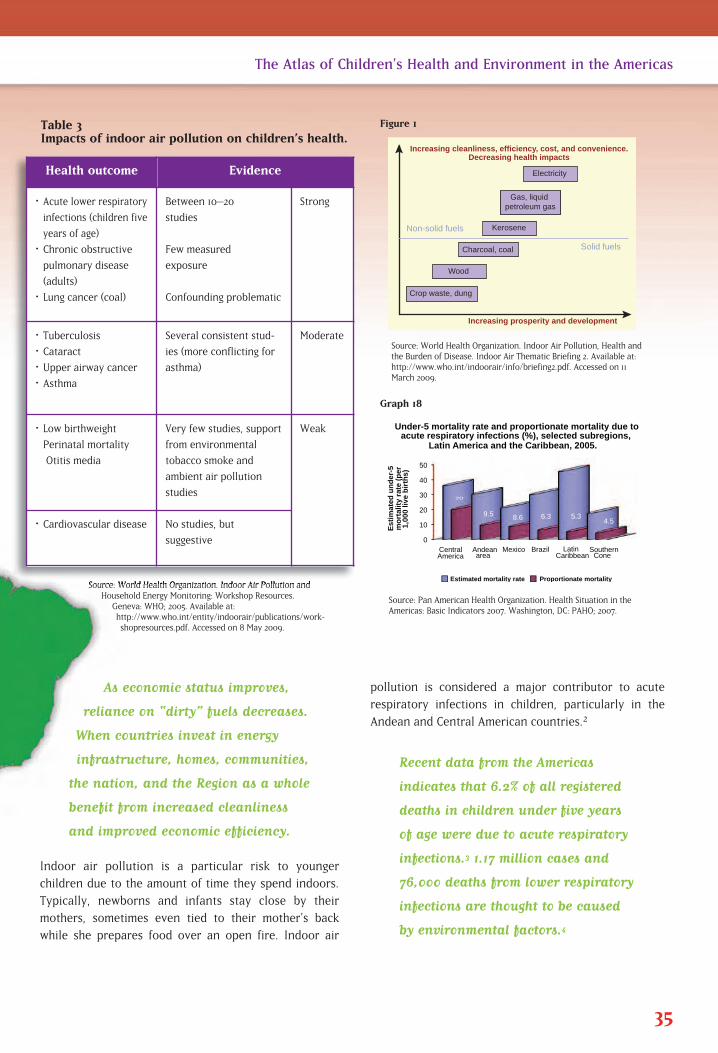
pollution is considered a major contributor to acute
respiratory infections in children, particularly in the
Andean and Central American countries.2
Recent data from the Americas
indicates that 6.2% of all registered
deaths in children under five years
of age were due to acute respiratory
infections.3 1.17 million cases and
76,000 deaths from lower respiratory
infections are thought to be caused
by environmental factors.4
As economic status improves,
reliance on “dirty” fuels decreases.
When countries invest in energy
infrastructure, homes, communities,
the nation, and the Region as a whole
benefit from increased cleanliness
and improved economic efficiency.
Indoor air pollution is a particular risk to younger
children due to the amount of time they spend indoors.
Typically, newborns and infants stay close by their
mothers, sometimes even tied to their mother’s back
while she prepares food over an open fire. Indoor air
35
The Atlas of Children’s Health and Environment in the Americas
Source: World Health Organization. Indoor Air Pollution, Health andthe Burden of Disease. Indoor Air Thematic Briefing 2. Available at:http://www.who.int/indoorair/info/briefing2.pdf. Accessed on 11March 2009.
Increasing cleanliness, efficiency, cost, and convenience.Decreasing health impacts
Non-solid fuels
Solid fuels
Electricity
Gas, liquid petroleum gas
Kerosene
Charcoal, coal
Wood
Crop waste, dung
Increasing prosperity and development
0
10
20
30
40
50
Central America
Andean area
Mexico Brazil Latin Caribbean
Southern Cone
20
9.5 8.6 6.3 5.3 4.5
Est
imat
ed u
nd
er-5
m
ort
alit
y ra
te (
per
1,
000
live
bir
ths)
Under-5 mortality rate and proportionate mortality due to acute respiratory infections (%), selected subregions,
Latin America and the Caribbean, 2005.
Estimated mortality rate Proportionate mortality
Figure 1
Source: Pan American Health Organization. Health Situation in theAmericas: Basic Indicators 2007. Washington, DC: PAHO; 2007.
Source: World Health Organization. Indoor Air Pollution andHousehold Energy Monitoring: Workshop Resources.
Geneva: WHO; 2005. Available at:http://www.who.int/entity/indoorair/publications/work-shopresources.pdf. Accessed on 8 May 2009.
Graph 18
Health outcome Evidence
• Acute lower respira tory
infections (children five
years of age)
• Chronic obstructive
pulmonary disease
(adults)
• Lung cancer (coal)
Between 10–20
studies
Few measured
exposure
Confounding problematic
Strong
• Tuberculosis
• Cataract
• Upper airway cancer
• Asthma
Several consistent stud-
ies (more conflicting for
asthma)
Moderate
• Low birthweight
Perinatal mortality
Otitis media
Very few studies, support
from environmental
tobacco smoke and
ambient air pollution
studies
Weak
• Cardiovascular disease No studies, but
suggestive
Table 3Impacts of indoor air pollution on children’s health.
Policy Actions—Integrating Clean Indoor Air intoHealthy Housing Initiatives
Incorporate clean indoor air provisions in healthy housingprograms to harmonize economic, technical, and housingdesign factors, which at the same time promote disease prevention and environmental sustainability and arerespectful of cultural values.
Improve the type of fuel used for cooking and heating, opting for cleaner, more efficient, and environmentally sustainable fuels, and investing in energy infrastructure tothe degree feasible to provide cleaner and more efficientfuels for rural and urban communities alike.
Improve stoves and open fires for cooking and heating,enabling them to vent outdoors and thus to significantlydecrease indoor pollution.
Promote micro-enterprises or cooperatives that developand sell upgraded ovens and provide assistance to familiesin upgrading households to improve ventilation systems.
Promote community-level education on indoor smoke and its dangers, with special attention on marginalized communities, to build their trust and capacity to developfeasible mechanisms to protect children from exposure toindoor smoke and pollutants.
1. United Nations. Millennium Development Goals Indicators. Available at:http://unstats.un.org/unsd/mi/mi_series_results.asp?rowID=712&fID=r15&cgID=419. Accessed on 11 March 2009.
2. Smith KR, Samet JM, Romieu I, Bruce N. Indoor air pollution in developing countries and acute lower respiratoryinfections in children. Thorax 2000;55:518–32.
3. Pan American Health Organization. Health Situation in the Americas: Basic Indicators 2008. Washington, DC:PAHO; 2008.
4. Prüss-Üstün A, Corvalán C. Preventing disease through healthy environments: towards an estimate of the environ-mental burden of disease. Table A2.3: Deaths attributable to environmental factors, by disease and mortality stra-tum, for WHO regions in 2002. Table A2.4: Burden of disease (in DALYs) attributable to environmental factors, bydisease and mortality stratum, for WHO regions in 2002. Geneva: World Health Organization; 2006. Available at:http://www.who.int/quantifying_ehimpacts/publications/preventingdisease.pdf. Accessed on 2 June 2009.
36 The Atlas of Children’s Health and Environment in the Americas
Goal 4: Reduce child mortality
Target 5: Reduce by two-thirds,
between 1990 and 2015, the
under-five mortality rate
Goal 6: Combat HIV/AIDS, malar-
ia, and other diseases
Target 8: Have halted by 2015 and
begun to reverse the inci-
dence of malaria and other
major diseases
Goal 7: Ensure environmental
sustainability
Target 10: Halve, by 2015, the propor-
tion of people without
sustainable access to safe
drinking water and basic
sanitation
Goal 8: Develop a global
partnership for
development
Target 17: In cooperation with
pharmaceutical companies,
provide access to afford-
able essential drugs in
developing countries
Related Millennium
Development Goals
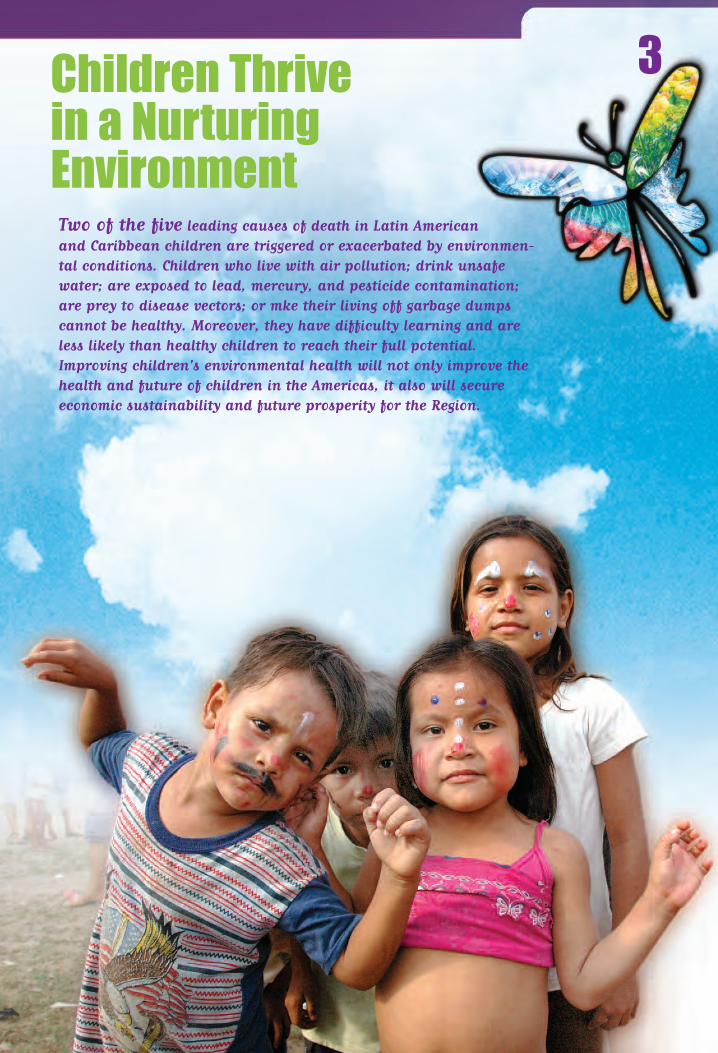
Children Thrive in a NurturingEnvironment
3
Two of the five leading causes of death in Latin Americanand Caribbean children are triggered or exacerbated by environmen-tal conditions. Children who live with air pollution; drink unsafewater; are exposed to lead, mercury, and pesticide contamination;are prey to disease vectors; or mke their living off garbage dumpscannot be healthy. Moreover, they have difficulty learning and areless likely than healthy children to reach their full potential.Improving children's environmental health will not only improve thehealth and future of children in the Americas, it also will secureeconomic sustainability and future prosperity for the Region.
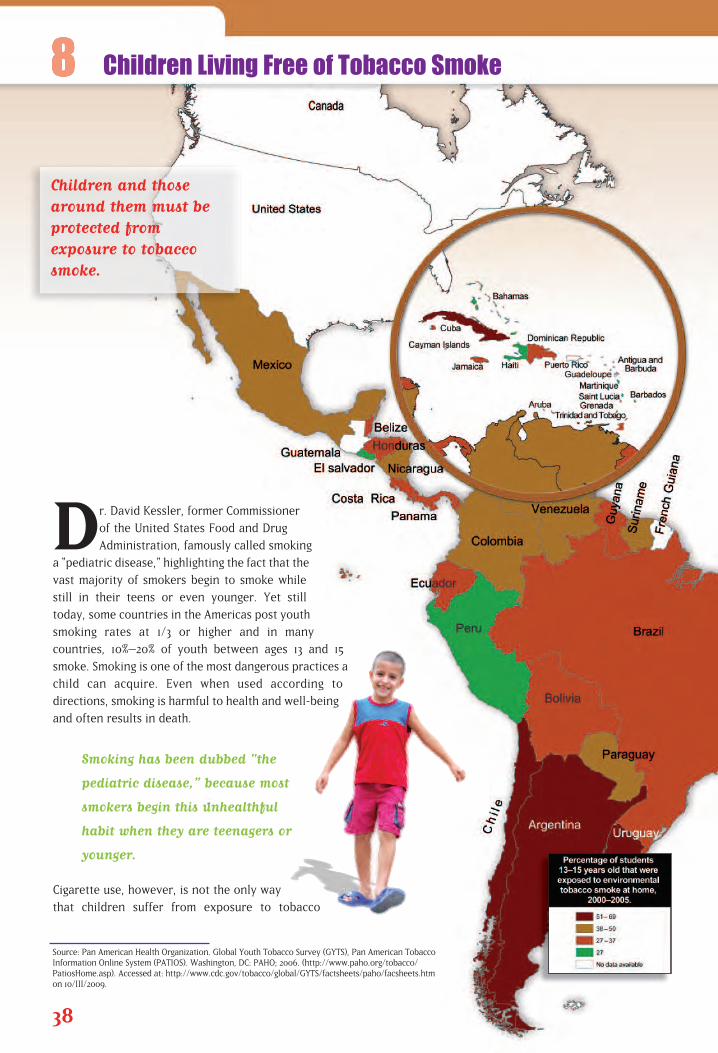
Dr. David Kessler, former Commissioner
of the United States Food and Drug
Administration, famously called smoking
a “pediatric disease,” highlighting the fact that the
vast majority of smokers begin to smoke while
still in their teens or even younger. Yet still
today, some countries in the Americas post youth
smoking rates at 1/3 or higher and in many
countries, 10%–20% of youth between ages 13 and 15
smoke. Smoking is one of the most dangerous practices a
child can acquire. Even when used according to
directions, smoking is harmful to health and well-being
and often results in death.
Smoking has been dubbed "the
pediatric disease,” because most
smokers begin this unhealthful
habit when they are teenagers or
younger.
Cigarette use, however, is not the only way
that children suffer from exposure to tobacco
38
Source: Pan American Health Organization. Global Youth Tobacco Survey (GYTS), Pan American Tobacco Information Online System (PATIOS). Washington, DC: PAHO; 2006. (http://www.paho.org/tobacco/PatiosHome.asp). Accessed at: http://www.cdc.gov/tobacco/global/GYTS/factsheets/paho/facsheets.htm on 10/III/2009.
Children Living Free of Tobacco Smoke
Children and thosearound them must beprotected from exposure to tobaccosmoke.
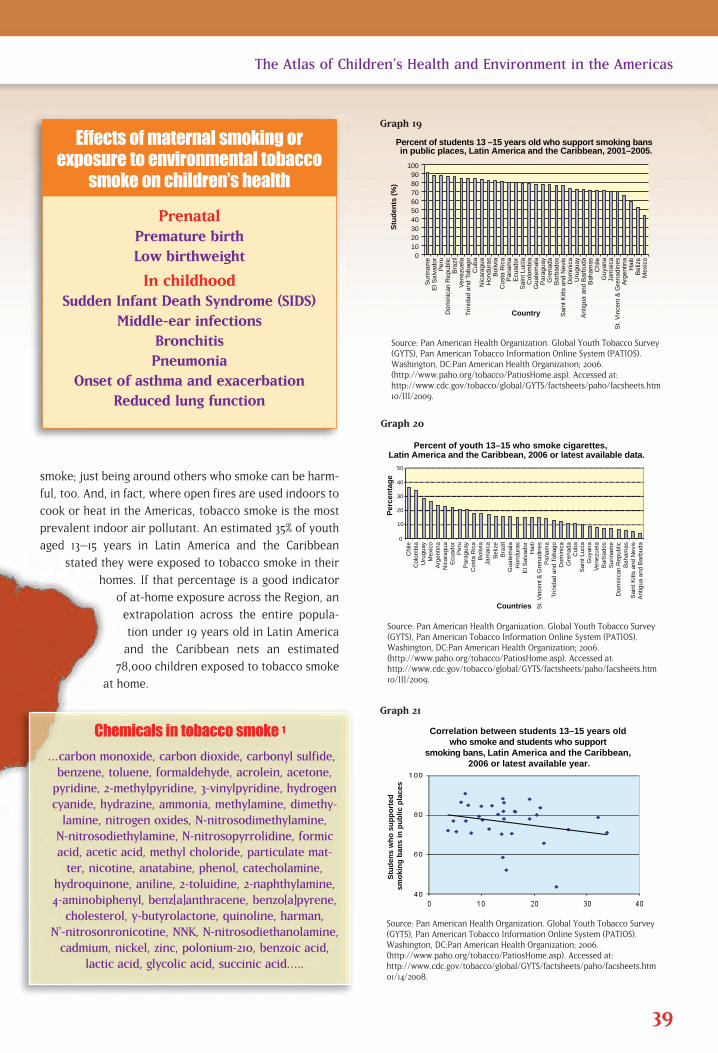
smoke; just being around others who smoke can be harm-
ful, too. And, in fact, where open fires are used indoors to
cook or heat in the Americas, tobacco smoke is the most
prevalent indoor air pollutant. An estimated 35% of youth
aged 13–15 years in Latin America and the Caribbean
stated they were exposed to tobacco smoke in their
homes. If that percentage is a good indicator
of at-home exposure across the Region, an
extrapolation across the entire popula-
tion under 19 years old in Latin America
and the Caribbean nets an estimated
78,000 children exposed to tobacco smoke
at home.
39
The Atlas of Children’s Health and Environment in the Americas
Source: Pan American Health Organization. Global Youth Tobacco Survey(GYTS), Pan American Tobacco Information Online System (PATIOS).Washington, DC:Pan American Health Organization; 2006.(http://www.paho.org/tobacco/PatiosHome.asp). Accessed at: http://www.cdc.gov/tobacco/global/GYTS/factsheets/paho/facsheets.htm10/III/2009.
0 10 20 30 40 50 60 70 80 90
100
Sur
inam
e
Per
u D
omin
ican
Rep
ublic
B
razi
l V
enez
uela
T
rinid
ad a
nd T
obag
o C
uba
Nic
arag
ua
Hon
dura
s B
oliv
ia
Cos
ta R
ica
Pan
ama
Ecu
ador
S
aint
Luc
ia
Col
ombi
a G
uate
mal
a P
arag
uay
Gre
nada
B
arba
dos
Sai
nt K
itts
and
Nev
is
Dom
inic
a U
rugu
ay
Ant
igua
and
Bar
buda
B
aham
as
Chi
le
Guy
ana
Jam
aica
S
t. V
ince
nt &
Gre
nadi
nes
Arg
entin
a H
aiti
Bel
ize
Mex
ico
Stu
den
ts (
%)
Percent of students 13 –15 years old who support smoking bansin public places, Latin America and the Caribbean, 2001–2005.
El S
alva
dor
Country
Correlation between students 13–15 years old who smoke and students who support
smoking bans, Latin America and the Caribbean, 2006 or latest available year.
Stu
den
s w
ho
su
pp
ort
ed
smo
kin
g b
ans
in p
ub
lic p
lace
s
40
50
Chi
le
Col
ombi
a U
rugu
ay
Mex
ico
Arg
entin
a N
icar
agua
E
cuad
or
Per
u P
arag
uay
Cos
ta R
ica
Bol
ivia
Ja
mai
ca
Bel
ize
Bra
zil
Gua
tem
ala
Hon
dura
s E
l Sal
vado
r H
aiti
St.
Vin
cent
& G
rena
dine
s P
anam
a Tr
inid
ad a
nd T
obag
o D
omin
ica
Gre
nada
C
uba
Sai
nt L
ucia
G
uyan
a V
enez
uela
B
arba
dos
Sur
inam
e D
omin
ican
Rep
ublic
B
aham
as
Sai
nt K
itts
and
Nev
is
Ant
igua
and
Bar
buda
Percent of youth 13–15 who smoke cigarettes, Latin America and the Caribbean, 2006 or latest available data.
Per
cen
tag
e
30
20
10
0
Countries
Graph 19
Source: Pan American Health Organization. Global Youth Tobacco Survey(GYTS), Pan American Tobacco Information Online System (PATIOS).Washington, DC:Pan American Health Organization; 2006.(http://www.paho.org/tobacco/PatiosHome.asp). Accessed at: http://www.cdc.gov/tobacco/global/GYTS/factsheets/paho/facsheets.htm10/III/2009.
Graph 20
Source: Pan American Health Organization. Global Youth Tobacco Survey(GYTS), Pan American Tobacco Information Online System (PATIOS).Washington, DC:Pan American Health Organization; 2006.(http://www.paho.org/tobacco/PatiosHome.asp). Accessed at: http://www.cdc.gov/tobacco/global/GYTS/factsheets/paho/facsheets.htm01/14/2008.
Graph 21
PrenatalPremature birthLow birthweight
In childhoodSudden Infant Death Syndrome (SIDS)
Middle-ear infectionsBronchitisPneumonia
Onset of asthma and exacerbation Reduced lung function
Effects of maternal smoking or exposure to environmental tobacco
smoke on children’s health
Chemicals in tobacco smoke 1
…carbon monoxide, carbon dioxide, carbonyl sulfide,benzene, toluene, formaldehyde, acrolein, acetone,pyridine, 2-methylpyridine, 3-vinylpyridine, hydrogencyanide, hydrazine, ammonia, methylamine, dimethy-lamine, nitrogen oxides, N-nitrosodimethylamine, N-nitrosodiethylamine, N-nitrosopyrrolidine, formicacid, acetic acid, methyl choloride, particulate mat-ter, nicotine, anatabine, phenol, catecholamine,
hydroquinone, aniline, 2-toluidine, 2-naphthylamine,4-aminobiphenyl, benz[a]anthracene, benzo[a]pyrene,cholesterol, y-butyrolactone, quinoline, harman,
N'-nitrosonronicotine, NNK, N-nitrosodiethanolamine,cadmium, nickel, zinc, polonium-210, benzoic acid,
lactic acid, glycolic acid, succinic acid…..
Fortunately, children and adults can be protected from thisharmful exposure with actions taken by individuals and countries. Public education builds support for smoke-free lawsand educates smokers to smoke outdoors and away from others, particularly children. At both local and national levels,cost-effective legislation can make all indoor public placesand workplaces smoke-free. Smoke-free environments arebeneficial because they reduce tobacco use overall. They alsochange behavior: people whose workplaces are smoke-freeare more likely to make their homes smoke-free, even if theyare smokers. With good public policy, children and their caregivers can enjoy clean air with every breath they take.
Policy Actions—Reducing Children's Exposure to Tobacco Smoke
Enact legislation to make all indoor public places and workplaces 100% smoke-free and join the 21countries in the Americas that have already ratified the World Health Organization FrameworkConvention on Tobacco Control (which also refers to exposure to tobacco smoke) to make this anAmericas-wide agreement.
Educate the public about the dangers of second-hand smoke for children and adults and how toprevent exposure; use education to build support for comprehensive smoke-free laws.
Require all tobacco packaging to carry large, image-based warnings about second-hand smoke (aswell as the many hazards of smoking). See examples of warnings at: http://www.paho.org/English/AD/SDE/RA/Tob_pack_warnings.htm.
1. California Environmental Protection Agency, Air Resources Board and Office of Environmental Health HazardAssessment, Air Toxicology and Epidemiology Branch. Proposed Identification of Environmental Tobacco Smoke asa Toxic Air Contaminant, SRP Approved Version. Sacramento, CA: EPA; June 24, 2005. Available at:http://www.arb.ca.gov/toxics/ets/finalreport/finalreport.htm.
40 The Atlas of Children’s Health and Environment in the Americas
Goal 3: Promote gender equality
and empower women
Target 4: Eliminate gender disparity
in primary and secondary
education preferably by
2005 and in all levels of
education no later than 2015
Goal 4: Reduce child mortality
Target 5: Reduce by two-thirds,
between 1990 and 2015, the
under-five mortality rate
Related Millennium
Development Goals
Ironically, many of the tobacco’s
toxic air pollutants with known
damaging effects on health are only
regulated when they come from a
source other than tobacco smoke.
The Atlas of Children’s Health and Environment in the Americas 41
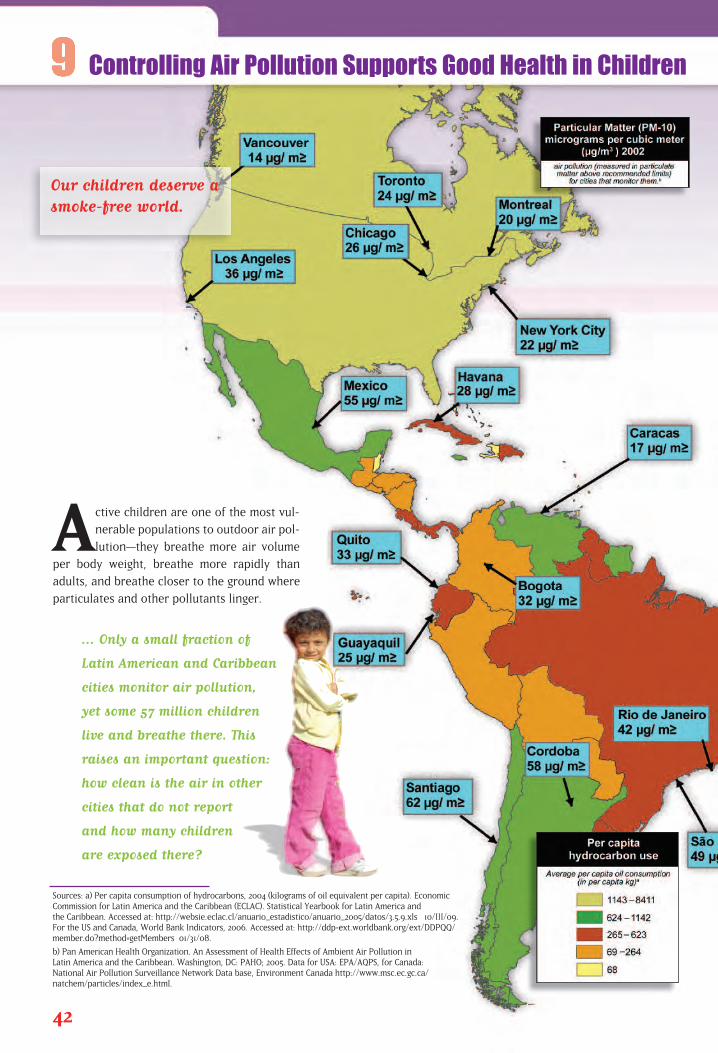
Active children are one of the most vul-
nerable populations to outdoor air pol-
lution—they breathe more air volume
per body weight, breathe more rapidly than
adults, and breathe closer to the ground where
particulates and other pollutants linger.
... Only a small fraction of
Latin American and Caribbean
cities monitor air pollution,
yet some 57 million children
live and breathe there. This
raises an important question:
how clean is the air in other
cities that do not report
and how many children
are exposed there?
42
Sources: a) Per capita consumption of hydrocarbons, 2004 (kilograms of oil equivalent per capita). Economic Commission for Latin America and the Caribbean (ECLAC). Statistical Yearbook for Latin America and the Caribbean. Accessed at: http://websie.eclac.cl/anuario_estadistico/anuario_2005/datos/3.5.9.xls 10/III/09. For the US and Canada, World Bank Indicators, 2006. Accessed at: http://ddp-ext.worldbank.org/ext/DDPQQ/member.do?method=getMembers 01/31/08.
b) Pan American Health Organization. An Assessment of Health Effects of Ambient Air Pollution in Latin America and the Caribbean. Washington, DC: PAHO; 2005. Data for USA: EPA/AQPS, for Canada: National Air Pollution Surveillance Network Data base, Environment Canada http://www.msc.ec.gc.ca/natchem/particles/index_e.html.
Controlling Air Pollution Supports Good Health in Children
Our children deserve asmoke-free world.
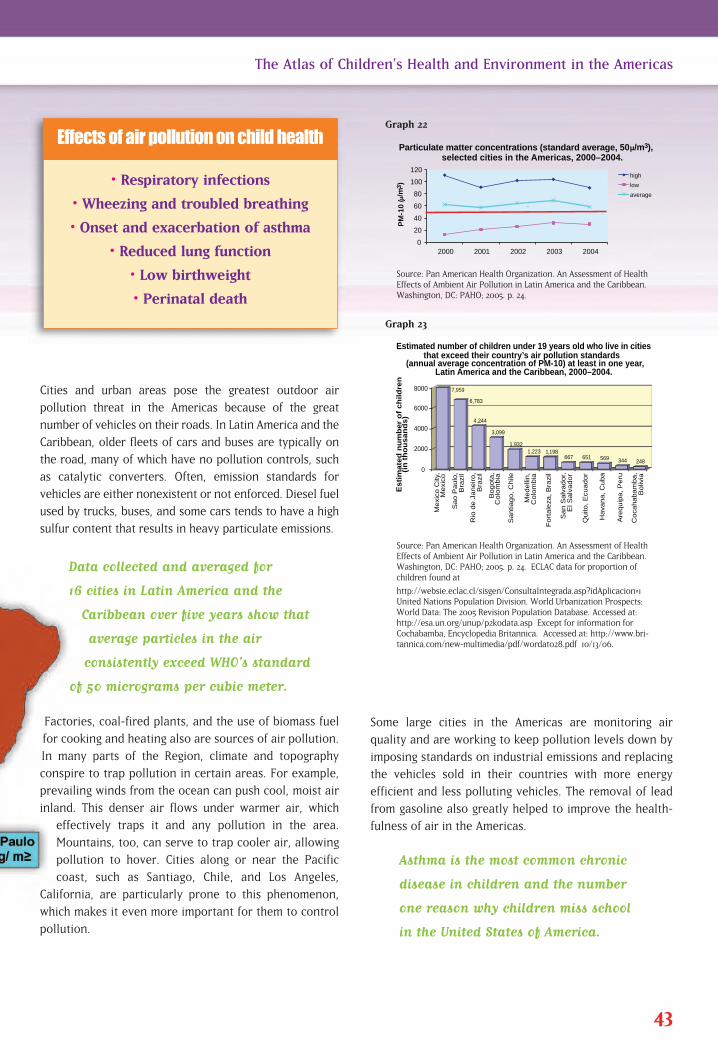
Some large cities in the Americas are monitoring air
quality and are working to keep pollution levels down by
imposing standards on industrial emissions and replacing
the vehicles sold in their countries with more energy
efficient and less polluting vehicles. The removal of lead
from gasoline also greatly helped to improve the health-
fulness of air in the Americas.
Asthma is the most common chronic
disease in children and the number
one reason why children miss school
in the United States of America.
Cities and urban areas pose the greatest outdoor air
pollution threat in the Americas because of the great
number of vehicles on their roads. In Latin America and the
Caribbean, older fleets of cars and buses are typically on
the road, many of which have no pollution controls, such
as catalytic converters. Often, emission standards for
vehicles are either nonexistent or not enforced. Diesel fuel
used by trucks, buses, and some cars tends to have a high
sulfur content that results in heavy particulate emissions.
Data collected and averaged for
16 cities in Latin America and the
Caribbean over five years show that
average particles in the air
consistently exceed WHO’s standard
of 50 micrograms per cubic meter.
Factories, coal-fired plants, and the use of biomass fuel
for cooking and heating also are sources of air pollution.
In many parts of the Region, climate and topography
conspire to trap pollution in certain areas. For example,
prevailing winds from the ocean can push cool, moist air
inland. This denser air flows under warmer air, which
effectively traps it and any pollution in the area.
Mountains, too, can serve to trap cooler air, allowing
pollution to hover. Cities along or near the Pacific
coast, such as Santiago, Chile, and Los Angeles,
California, are particularly prone to this phenomenon,
which makes it even more important for them to control
pollution.
43
The Atlas of Children’s Health and Environment in the Americas
Source: Pan American Health Organization. An Assessment of HealthEffects of Ambient Air Pollution in Latin America and the Caribbean.Washington, DC: PAHO; 2005. p. 24.
0
20
40
60
80
100
120
2000 2001 2002 2003 2004
PM
-10
(/m
3)
Particulate matter concentrations (standard average, 50 /m3), selected cities in the Americas, 2000–2004.
high
low
average
.
0
2000
4000
6000
8000
Mexi
co C
ity,
Mexi
co
Sao P
aulo
, B
razi
l
Rio
de J
aneiro,
B
razi
l
Bogota
, C
olo
mbia
Santia
go, C
hile
Medelli
n,
Colo
mbia
Fort
ale
za, B
razi
l
San S
alv
ador,
E
l Salv
ador
Quito
, E
cuador
Hava
na, C
uba
Are
quip
a, P
eru
Coca
habam
ba,
Boliv
ia
Es
tim
ate
d n
um
be
r o
f c
hil
dre
n
(in
th
ou
sa
nd
s)
Estimated number of children under 19 years old who live in cities that exceed their country’s air pollution standards
(annual average concentration of PM-10) at least in one year, Latin America and the Caribbean, 2000–2004.
7,959
6,783
4,244
3,099
1,932 1,223 1,198
667 651 569 344 248
Graph 22
Source: Pan American Health Organization. An Assessment of HealthEffects of Ambient Air Pollution in Latin America and the Caribbean.Washington, DC: PAHO; 2005. p. 24. ECLAC data for proportion of children found at
http://websie.eclac.cl/sisgen/ConsultaIntegrada.asp?idAplicacion=1United Nations Population Division. World Urbanization Prospects:World Data: The 2005 Revision Population Database. Accessed at:http://esa.un.org/unup/p2k0data.asp Except for information forCochabamba, Encyclopedia Britannica. \Accessed at: http://www.bri-tannica.com/new-multimedia/pdf/wordat028.pdf 10/13/06.
Graph 23
• Respiratory infections
• Wheezing and troubled breathing
• Onset and exacerbation of asthma
• Reduced lung function
• Low birthweight
• Perinatal death
Effects of air pollution on child health
Policy Actions—Making the Air More Breathable:
Monitor air pollution in large and industrial urban areas inorder to set good health standards for air quality and informthe public about the quality of the air.
• Reduce the sulfur content in diesel fuels.
Increase access to and efficiency of mass transit systems inmid-sized and large cities.
Promote the use of more fuel-efficient vehicles and cleanerfuels.
Develop air pollution advisories and educate the general public about their meaning, stimulatingpublic interest and action to safeguard children from dangerous levels of air pollution.
44 The Atlas of Children’s Health and Environment in the Americas
Goal 7: Ensure environmental
sustainability
Target 10: Halve, by 2015, the propor-
tion of people without
sustainable access to safe
drinking water and basic
sanitation
Related Millennium
Development Goal
The Atlas of Children’s Health and Environment in the Americas 45
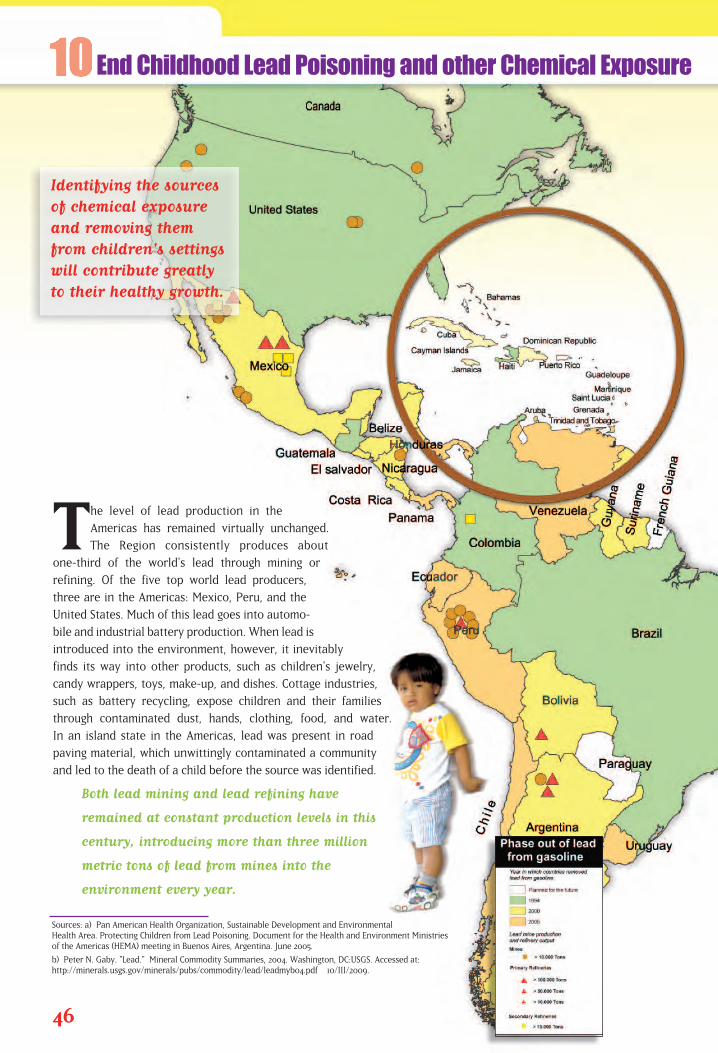
The level of lead production in the
Americas has remained virtually unchanged.
The Region consistently produces about
one-third of the world's lead through mining or
refining. Of the five top world lead producers,
three are in the Americas: Mexico, Peru, and the
United States. Much of this lead goes into automo-
bile and industrial battery production. When lead is
introduced into the environment, however, it inevitably
finds its way into other products, such as children's jewelry,
candy wrappers, toys, make-up, and dishes. Cottage industries,
such as battery recycling, expose children and their families
through contaminated dust, hands, clothing, food, and water.
In an island state in the Americas, lead was present in road
paving material, which unwittingly contaminated a community
and led to the death of a child before the source was identified.
Both lead mining and lead refining have
remained at constant production levels in this
century, introducing more than three million
metric tons of lead from mines into the
environment every year.
46
Sources: a) Pan American Health Organization, Sustainable Development and EnvironmentalHealth Area. Protecting Children from Lead Poisoning. Document for the Health and Environment Ministries of the Americas (HEMA) meeting in Buenos Aires, Argentina. June 2005.
b) Peter N. Gaby. "Lead." Mineral Commodity Summaries, 2004. Washington, DC:USGS. Accessed at:http://minerals.usgs.gov/minerals/pubs/commodity/lead/leadmyb04.pdf 10/III/2009.
End Childhood Lead Poisoning and other Chemical Exposure
Identifying the sourcesof chemical exposureand removing themfrom children's settingswill contribute greatlyto their healthy growth.
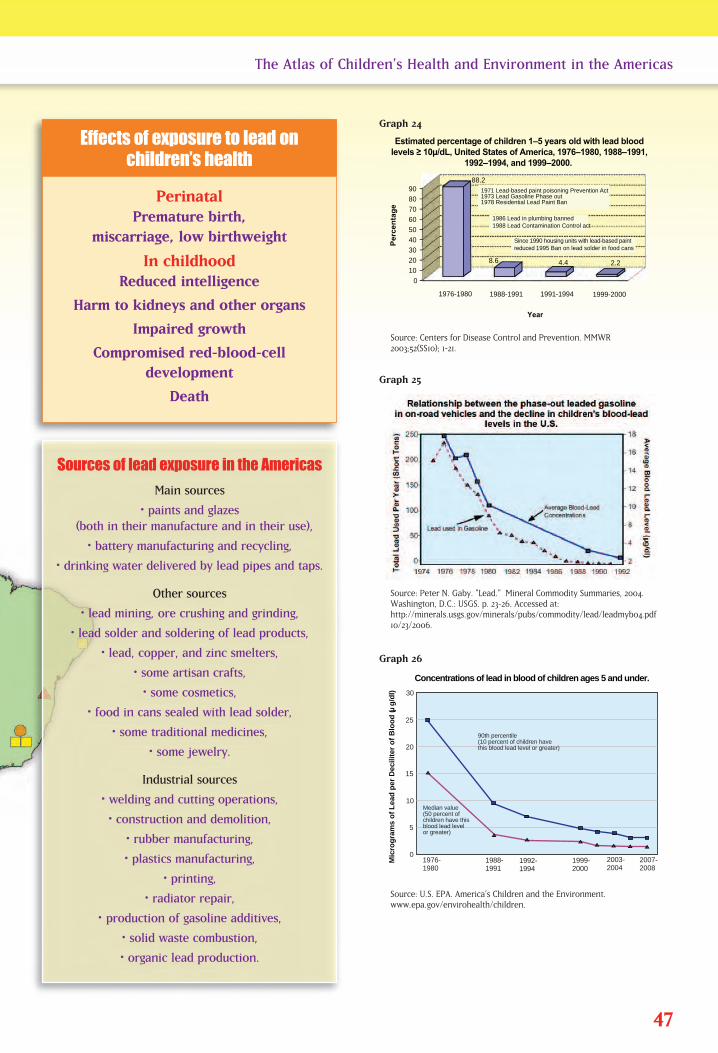
47
The Atlas of Children’s Health and Environment in the Americas
Source: Centers for Disease Control and Prevention. MMWR2003;52(SS10); 1-21.
0
10
20
30
40
50
60
70
80
90
1976-1980 1988-1991 1991-1994 1999-2000
1971 Lead-based paint poisoning Prevention Act1973 Lead Gasoline Phase out1978 Residential Lead Paint Ban
1986 Lead in plumbing banned1988 Lead Contamination Control act
Since 1990 housing units with lead-based paint reduced 1995 Ban on lead solder in food cans
Year
8.6
88.2
4.4 2.2
Estimated percentage of children 1–5 years old with lead blood levels ≥ 10µ/dL, United States of America, 1976–1980, 1988–1991,
1992–1994, and 1999–2000.
Pe
rce
nta
ge
30
Mic
rog
ram
s o
f L
ead
per
Dec
ilite
r o
f B
loo
d (
g/d
l)
25
20
15
10
5
01976-1980
1988-1991
1992-1994
1999-2000
2003-2004
2007-2008
Median value(50 percent ofchildren have thisblood lead levelor greater)
90th percentile(10 percent of children havethis blood lead level or greater)
Concentrations of lead in blood of children ages 5 and under.
Graph 24
Source: Peter N. Gaby. "Lead." Mineral Commodity Summaries, 2004.Washington, D.C.: USGS. p. 23-26. Accessed at:http://minerals.usgs.gov/minerals/pubs/commodity/lead/leadmyb04.pdf10/23/2006.
Graph 25
Source: U.S. EPA. America’s Children and the Environment. www.epa.gov/envirohealth/children.
Graph 26
Perinatal Premature birth,
miscarriage, low birthweight
In childhoodReduced intelligence
Harm to kidneys and other organs
Impaired growth
Compromised red-blood-cell development
Death
Effects of exposure to lead on children’s health
Sources of lead exposure in the Americas
Main sources
• paints and glazes (both in their manufacture and in their use),
• battery manufacturing and recycling,
• drinking water delivered by lead pipes and taps.
Other sources
• lead mining, ore crushing and grinding,
• lead solder and soldering of lead products,
• lead, copper, and zinc smelters,
• some artisan crafts,
• some cosmetics,
• food in cans sealed with lead solder,
• some traditional medicines,
• some jewelry.
Industrial sources
• welding and cutting operations,
• construction and demolition,
• rubber manufacturing,
• plastics manufacturing,
• printing,
• radiator repair,
•\ production of gasoline additives,
• solid waste combustion,
• organic lead production.
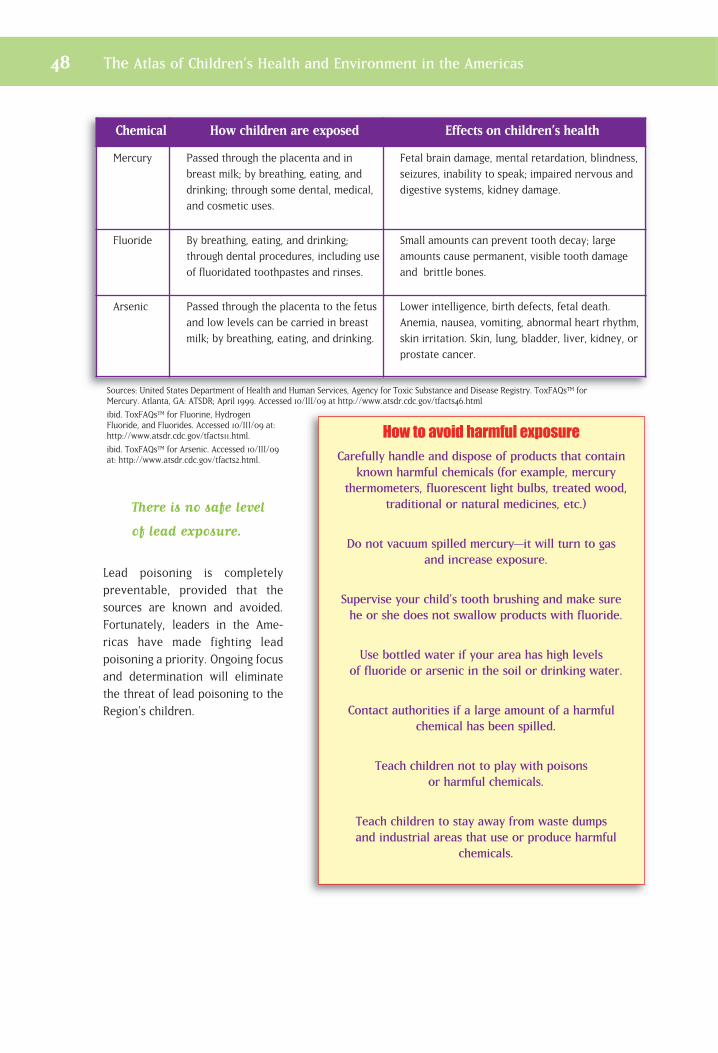
There is no safe level
of lead exposure.
Lead poisoning is completely preventable, provided that thesources are known and avoided.Fortunately, leaders in the Ame -ricas have made fighting lead poisoning a priority. Ongoing focusand determination will eliminatethe threat of lead poisoning to theRegion's children.
48 The Atlas of Children’s Health and Environment in the Americas
Chemical How children are exposed Effects on children’s health
Mercury Passed through the placenta and in
breast milk; by breathing, eating, and
drinking; through some dental, medical,
and cosmetic uses.
Fetal brain damage, mental retardation, blindness,
seizures, inability to speak; impaired nervous and
digestive systems, kidney damage.
Fluoride By breathing, eating, and drinking;
through dental procedures, including use
of fluoridated toothpastes and rinses.
Small amounts can prevent tooth decay; large
amounts cause permanent, visible tooth damage
and brittle bones.
Arsenic Passed through the placenta to the fetus
and low levels can be carried in breast
milk; by breathing, eating, and drinking.
Lower intelligence, birth defects, fetal death.
Anemia, nausea, vomiting, abnormal heart rhythm,
skin irritation. Skin, lung, bladder, liver, kidney, or
prostate cancer.
Sources: United States Department of Health and Human Services, Agency for Toxic Substance and Disease Registry. ToxFAQs™ forMercury. Atlanta, GA: ATSDR; April 1999. Accessed 10/III/09 at http://www.atsdr.cdc.gov/tfacts46.html
ibid. ToxFAQs™ for Fluorine, HydrogenFluoride, and Fluorides. Accessed 10/III/09 at:http://www.atsdr.cdc.gov/tfacts11.html.
ibid. ToxFAQs™ for Arsenic. Accessed 10/III/09at: http://www.atsdr.cdc.gov/tfacts2.html.
e
How to avoid harmful exposure
Carefully handle and dispose of products that containknown harmful chemicals (for example, mercury
thermometers, fluorescent light bulbs, treated wood,traditional or natural medicines, etc.)
Do not vacuum spilled mercury—it will turn to gas and increase exposure.
Supervise your child's tooth brushing and make sure he or she does not swallow products with fluoride.
Use bottled water if your area has high levels of fluoride or arsenic in the soil or drinking water.
Contact authorities if a large amount of a harmful chemical has been spilled.
Teach children not to play with poisons or harmful chemicals.
Teach children to stay away from waste dumps and industrial areas that use or produce harmful
chemicals.
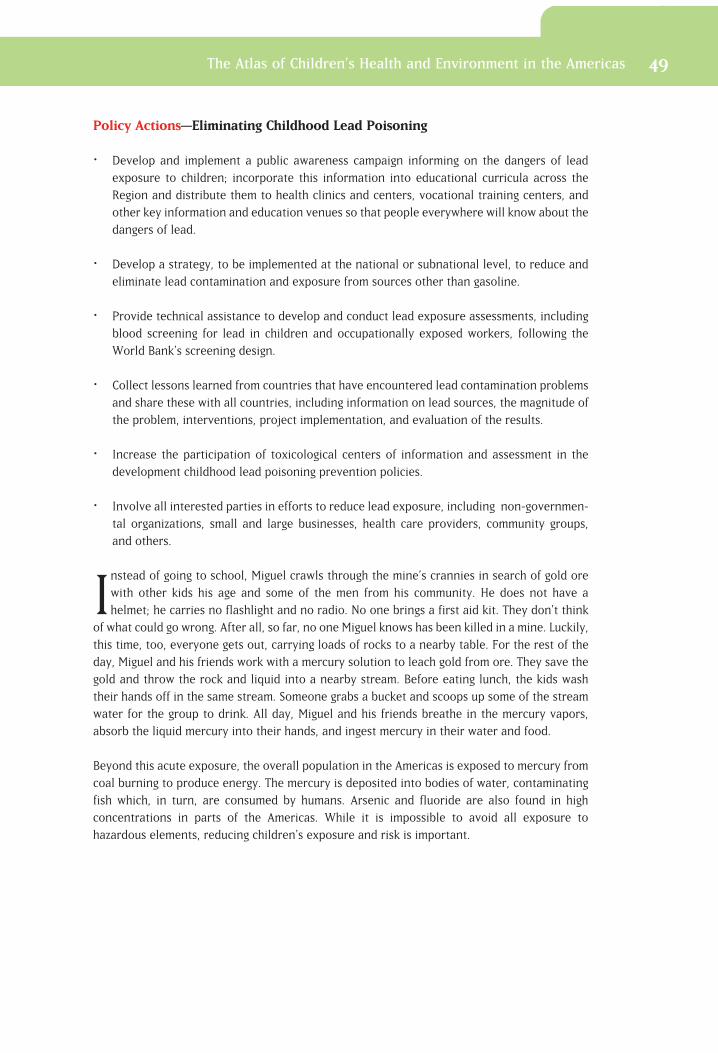
The Atlas of Children’s Health and Environment in the Americas 49
Policy Actions—Eliminating Childhood Lead Poisoning
Develop and implement a public awareness campaign informing on the dangers of lead
exposure to children; incorporate this information into educational curricula across the
Region and distribute them to health clinics and centers, vocational training centers, and
other key information and education venues so that people everywhere will know about the
dangers of lead.
Develop a strategy, to be implemented at the national or subnational level, to reduce and
eliminate lead contamination and exposure from sources other than gasoline.
Provide technical assistance to develop and conduct lead exposure assessments, including
blood screening for lead in children and occupationally exposed workers, following the
World Bank’s screening design.
Collect lessons learned from countries that have encountered lead contamination problems
and share these with all countries, including information on lead sources, the magnitude of
the problem, interventions, project implementation, and evaluation of the results.
Increase the participation of toxicological centers of information and assessment in the
development childhood lead poisoning prevention policies.
Involve all interested parties in efforts to reduce lead exposure, including non-governmen-
tal organizations, small and large businesses, health care providers, community groups,
and others.
Instead of going to school, Miguel crawls through the mine’s crannies in search of gold ore
with other kids his age and some of the men from his community. He does not have a
helmet; he carries no flashlight and no radio. No one brings a first aid kit. They don't think
of what could go wrong. After all, so far, no one Miguel knows has been killed in a mine. Luckily,
this time, too, everyone gets out, carrying loads of rocks to a nearby table. For the rest of the
day, Miguel and his friends work with a mercury solution to leach gold from ore. They save the
gold and throw the rock and liquid into a nearby stream. Before eating lunch, the kids wash
their hands off in the same stream. Someone grabs a bucket and scoops up some of the stream
water for the group to drink. All day, Miguel and his friends breathe in the mercury vapors,
absorb the liquid mercury into their hands, and ingest mercury in their water and food.
Beyond this acute exposure, the overall population in the Americas is exposed to mercury from
coal burning to produce energy. The mercury is deposited into bodies of water, contaminating
fish which, in turn, are consumed by humans. Arsenic and fluoride are also found in high
concentrations in parts of the Americas. While it is impossible to avoid all exposure to
hazardous elements, reducing children's exposure and risk is important.
Policy Actions—Safeguarding Children from Chemical Exposure
•� Provide assistance to child workers in informal gold minesto increase safety and reduce exposure to mercury.
•� Increase public awareness about chemical concerns; forexample, provide information on where high concentra-tions of arsenic or fluoride are located.
•� Develop and broadcast food and water advisories wheremercury, arsenic, or other known contaminants affect largefish or other foods or water.
• Reduce emissions from coal burning plants that produce electricity.
50 The Atlas of Children’s Health and Environment in the Americas
Goal 7: Ensure environmental
sustainability
Target 10: Halve, by 2015, the propor-
tion of people without
sustainable access to safe
drinking water and basic
sanitation
Related Millennium
Development Goal
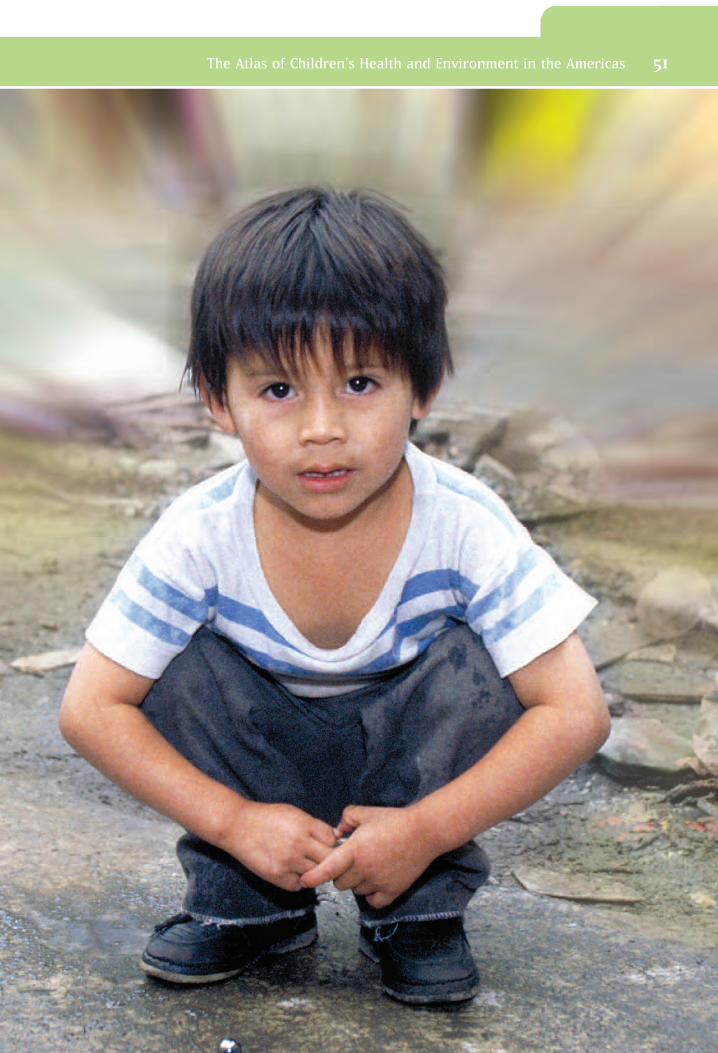
The Atlas of Children’s Health and Environment in the Americas 51
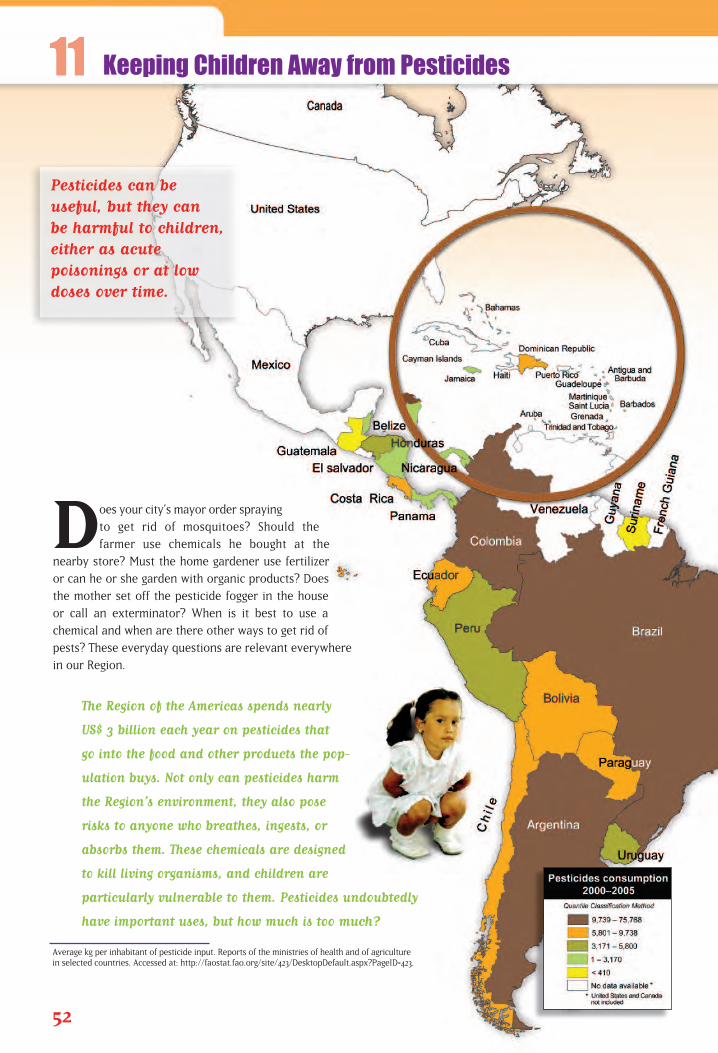
Does your city’s mayor order spraying
to get rid of mosquitoes? Should the
farmer use chemicals he bought at the
nearby store? Must the home gardener use fertilizer
or can he or she garden with organic products? Does
the mother set off the pesticide fogger in the house
or call an exterminator? When is it best to use a
chemical and when are there other ways to get rid of
pests? These everyday questions are relevant everywhere
in our Region.
The Region of the Americas spends nearly
US$ 3 billion each year on pesticides that
go into the food and other products the pop-
ulation buys. Not only can pesticides harm
the Region’s environment, they also pose
risks to anyone who breathes, ingests, or
absorbs them. These chemicals are designed
to kill living organisms, and children are
particularly vulnerable to them. Pesticides undoubtedly
have important uses, but how much is too much?
52
Average kg per inhabitant of pesticide input. Reports of the ministries of health and of agriculture in selected countries. Accessed at: http://faostat.fao.org/site/423/DesktopDefault.aspx?PageID=423.
Keeping Children Away from Pesticides
Pesticides can be useful, but they can be harmful to children,either as acute poisonings or at lowdoses over time.
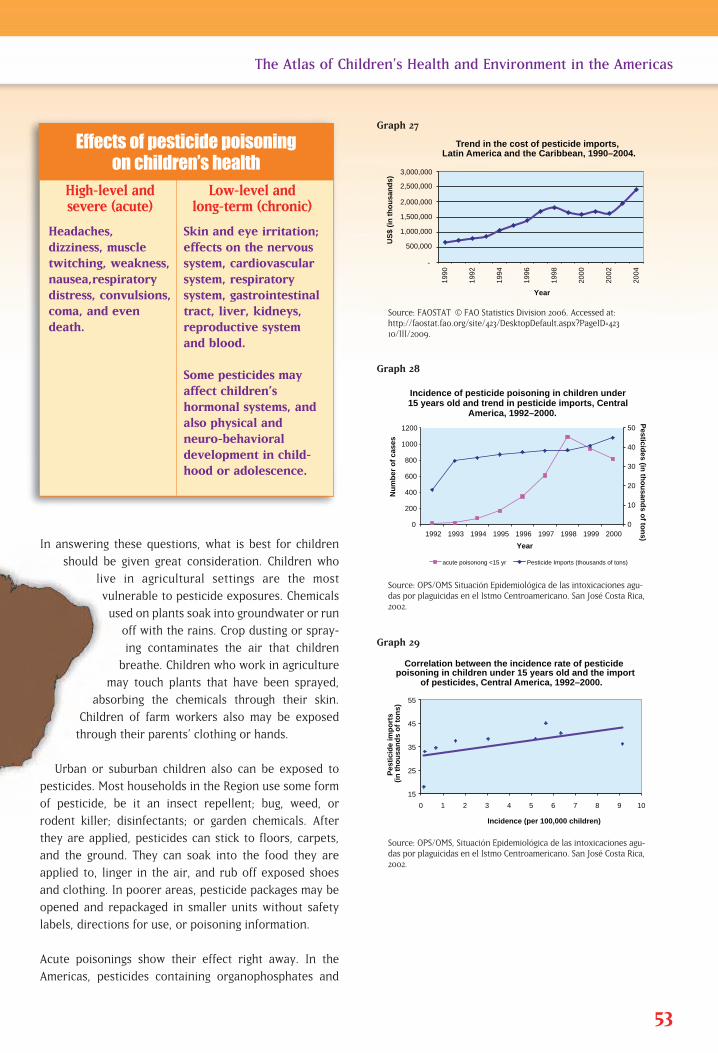
In answering these questions, what is best for children
should be given great consideration. Children who
live in agricultural settings are the most
vulnerable to pesticide exposures. Chemicals
used on plants soak into groundwater or run
off with the rains. Crop dusting or spray-
ing contaminates the air that children
breathe. Children who work in agriculture
may touch plants that have been sprayed,
absorbing the chemicals through their skin.
Children of farm workers also may be exposed
through their parents’ clothing or hands.
Urban or suburban children also can be exposed to
pesticides. Most households in the Region use some form
of pesticide, be it an insect repellent; bug, weed, or
rodent killer; disinfectants; or garden chemicals. After
they are applied, pesticides can stick to floors, carpets,
and the ground. They can soak into the food they are
applied to, linger in the air, and rub off exposed shoes
and clothing. In poorer areas, pesticide packages may be
opened and repackaged in smaller units without safety
labels, directions for use, or poisoning information.
Acute poisonings show their effect right away. In the
Americas, pesticides containing organophosphates and
53
The Atlas of Children’s Health and Environment in the Americas
Source: FAOSTAT | © FAO Statistics Division 2006. Accessed at:http://faostat.fao.org/site/423/DesktopDefault.aspx?PageID=42310/III/2009.
-
500,000
1,000,000
1,500,000
2,000,000
2,500,000
3,000,000
1990
1992
1994
1996
1998
2000
2002
2004
US
$ (i
n t
ho
usa
nd
s)
Trend in the cost of pesticide imports, Latin America and the Caribbean, 1990–2004.
Year
15
25
35
45
55
0 1 2 3 4 5 6 7 8 9 10
Pes
tici
de
imp
ort
s
(in
th
ou
san
ds
of
ton
s)
Incidence (per 100,000 children)
Correlation between the incidence rate of pesticide poisoning in children under 15 years old and the import
of pesticides, Central America, 1992–2000.
0
10
20
30
40
50
0
200
400
600
800
1000
1200
1992 1993 1994 1995 1996 1997 1998 1999 2000
Nu
mb
er o
f ca
ses
Incidence of pesticide poisoning in children under 15 years old and trend in pesticide imports, Central
America, 1992–2000.
acute poisonong <15 yr Pesticide Imports (thousands of tons)
Pesticid
es (in th
ou
sand
s of to
ns)
Year
Graph 27
Source: OPS/OMS Situación Epidemiológica de las intoxicaciones agu-das por plaguicidas en el Istmo Centroamericano. San José Costa Rica,2002.
Graph 28
Source: OPS/OMS, Situación Epidemiológica de las intoxicaciones agu-das por plaguicidas en el Istmo Centroamericano. San José Costa Rica,2002.
Graph 29
Effects of pesticide poisoning on children’s health
High-level andsevere (acute)
Low-level and long-term (chronic)
Headaches, dizziness, muscle twitching, weakness,nausea,respiratorydistress, convulsions, coma, and evendeath.
Skin and eye irritation;effects on the nervoussystem, cardiovascularsystem, respiratory system, gastrointestinaltract, liver, kidneys,reproductive system and blood.
Some pesticides mayaffect children’s hormonal systems, andalso physical and neuro-behavioral development in child-hood or adolescence.
carbonates are most often the culprits in poisonings.Unfortunately, pesticide poisonings in the Region often are notdiagnosed. In fact, the Pan American Health Organization estimates that pesticide poisoning cases are under-reported by50% to 80% regionwide. And, while acute poisonings becomeimmediately apparent, lower dose, long-term exposure in children can go unnoticed for a long time. Data on these chronic exposures is not readily available throughout theAmericas. Keeping children safe from pesticides in their homes,schools, and public places and minimizing their exposure asmuch as possible safeguards them from ill effects of pesticidesthat may not show up for years to come.
Policy Actions — ProtectingChildren from Pesticides Ban the import and use of the
most dangerous pesticides. Reduce pesticide use through
regulation, and put in place special restrictions for the moredangerous pesticides.
Control pesticide residues allow-able in food and drinking water,targeting safety guidelines for themost vulnerable population sets,such as infants and children.
Educate communities and workersabout alternatives to pesticides,proper use of pesticides, safetyprecautions, and emergency care.
Educate health workers and agricultural workers on how torecognize and manage pesticidepoisonings.
Establish and support at least onepoison control center.
Sign and implement the Treaty on Persistent Organic Pollutants (POPs) and include children'shealth in the POPs national implementation plan.
54 The Atlas of Children’s Health and Environment in the Americas
Goal 7: Ensure environmental
sustainability
Target 10: Halve, by 2015, the propor-
tion of people without
sustainable access to safe
drinking water and basic
sanitation
Related Millennium
Development Goal
How to prevent poisonings
Children and adolescents should not work with pesticides or chemicals.
All poisons should be stored out of children's reach.
Children should be removed from areas to be treatedwith pesticides.
Pesticide devices, such as rodent bait, should be inaccessible to children.
Pesticides should be kept in their original, labeled,childproof packages.
Children should be taught to stay away from pesticides and poisons.
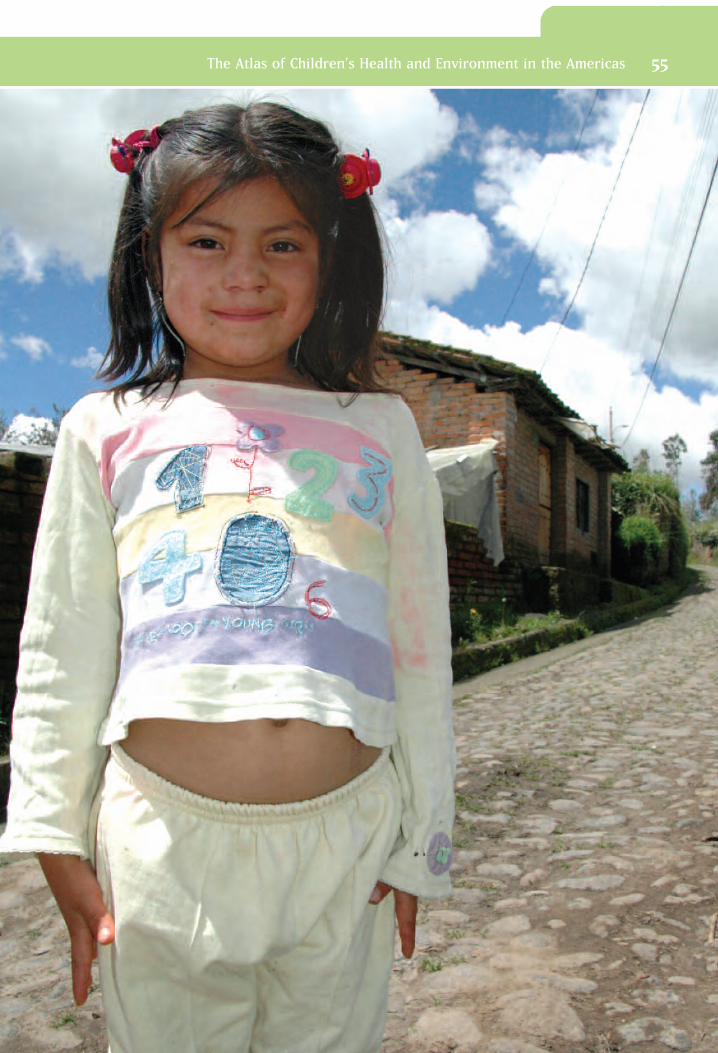
The Atlas of Children’s Health and Environment in the Americas 55
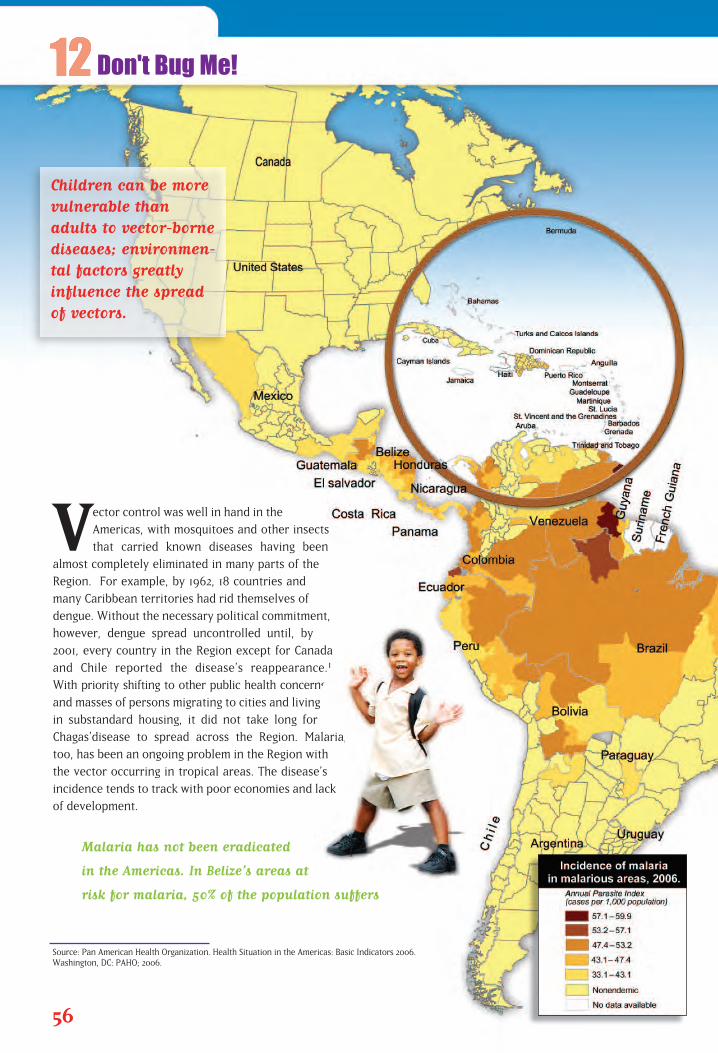
Vector control was well in hand in the
Americas, with mosquitoes and other insects
that carried known diseases having been
almost completely eliminated in many parts of the
Region. For example, by 1962, 18 countries and
many Caribbean territories had rid themselves of
dengue. Without the necessary political commitment,
however, dengue spread uncontrolled until, by
2001, every country in the Region except for Canada
and Chile reported the disease’s reappearance.1
With priority shifting to other public health concerns
and masses of persons migrating to cities and living
in substandard housing, it did not take long for
Chagas’disease to spread across the Region. Malaria,
too, has been an ongoing problem in the Region with
the vector occurring in tropical areas. The disease’s
incidence tends to track with poor economies and lack
of development.
Malaria has not been eradicated
in the Americas. In Belize’s areas at
risk for malaria, 50% of the population suffers
56
Source: Pan American Health Organization. Health Situation in the Americas: Basic Indicators 2006. Washington, DC: PAHO; 2006.
Don't Bug Me!
Children can be morevulnerable thanadults to vector-bornediseases; environmen-tal factors greatlyinfluence the spreadof vectors.
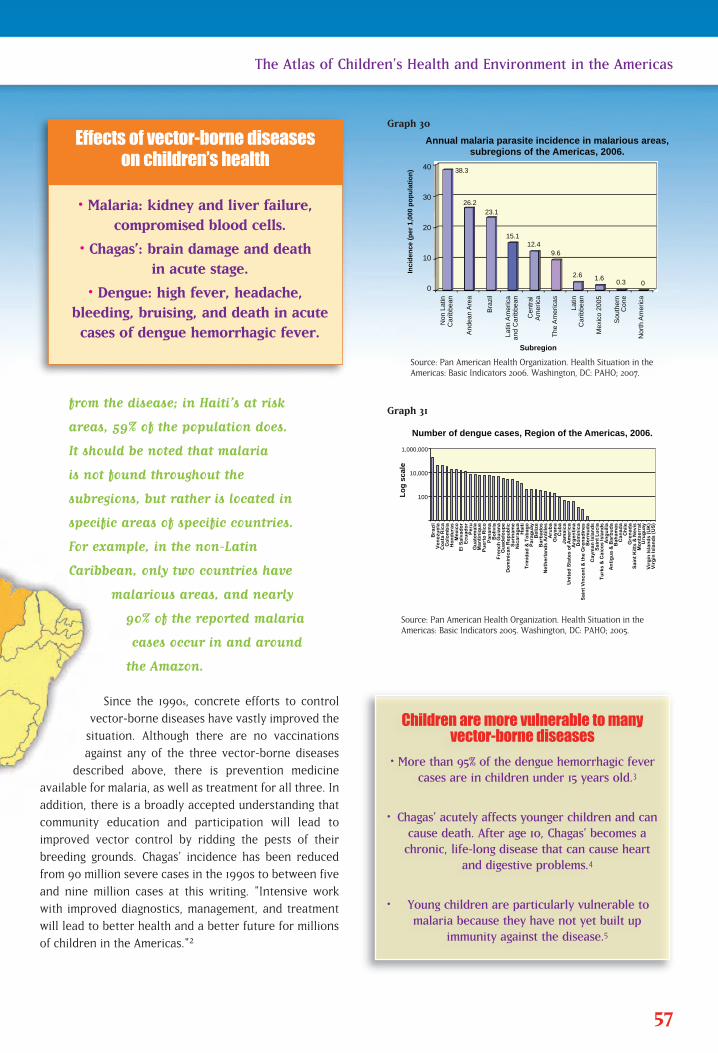
from the disease; in Haiti’s at risk
areas, 59% of the population does.
It should be noted that malaria
is not found throughout the
subregions, but rather is located in
specific areas of specific countries.
For example, in the non-Latin
Caribbean, only two countries have
malarious areas, and nearly
90% of the reported malaria
cases occur in and around
the Amazon.
Since the 1990s, concrete efforts to control
vector-borne diseases have vastly improved the
situation. Although there are no vaccinations
against any of the three vector-borne diseases
described above, there is prevention medicine
available for malaria, as well as treatment for all three. In
addition, there is a broadly accepted understanding that
community education and participation will lead to
improved vector control by ridding the pests of their
breeding grounds. Chagas’ incidence has been reduced
from 90 million severe cases in the 1990s to between five
and nine million cases at this writing. "Intensive work
with improved diagnostics, management, and treatment
will lead to better health and a better future for millions
of children in the Americas."2
57
The Atlas of Children’s Health and Environment in the Americas
Source: Pan American Health Organization. Health Situation in theAmericas: Basic Indicators 2005. Washington, DC: PAHO; 2005.
100
10,000
1,000,000
Lo
g s
cale
Number of dengue cases, Region of the Americas, 2006.
Bra
zil
V
en
ezu
ela
Co
lom
bia
H
on
du
ras
M
exi
co
E
cu
ad
or
P
eru
Gu
ate
ma
la
Pu
ert
o R
ico
Pa
na
ma
Bo
livia
D
om
inic
an
Re
pu
blic
S
uri
na
me
Nic
ara
gu
a
H
ait
i
Tri
nid
ad
& T
ob
ag
o
Pa
rag
ua
y
Be
lize
B
arb
ad
os
N
eth
erl
an
ds
An
tille
s
Aru
ba
Gu
yan
a
C
ub
a
J
am
aic
a
U
nit
ed
Sta
tes
of
Am
eri
ca
Arg
en
tin
a
Do
min
ica
S
ain
t V
inc
en
t &
th
e G
ren
ad
ine
s
Be
rmu
da
Ca
yma
n Is
lan
ds
Sa
int
Lu
cia
Tu
rks
& C
aic
os
Isla
nd
s A
ng
uill
a
A
nti
gu
a &
Ba
rbu
da
Ba
ha
ma
s
Ca
na
da
Ch
ile
G
ren
ad
a
S
ain
t K
itts
& N
evi
s M
on
tse
rra
t
Uru
gu
ay
V
irg
in Is
lan
ds
(UK
)
Vir
gin
Isla
nd
s (U
S)
Co
sta
Ric
a
El S
alv
ad
or
Ma
nti
niq
ue
Fre
nc
h G
uia
na
Gu
ad
elo
up
e
0
10
20
30
40
Non
Lat
in
Car
ibbe
an
And
ean
Are
a
Braz
il
Lat
in A
mer
ica
and
Car
ibbe
an
Cen
tral
A
mer
ica
The
Am
eric
as
L
atin
Car
ibbe
an
Mex
ico
2005
Sou
ther
n C
one
Nor
th A
mer
ica
Inci
den
ce (
per
1,0
00 p
op
ula
tio
n)
Annual malaria parasite incidence in malarious areas, subregions of the Americas, 2006.
38.3
26.2 23.1
15.1 12.4
9.6
2.6 1.6 0.3 0
Subregion
Graph 30
Graph 31
• Malaria: kidney and liver failure,compromised blood cells.
• Chagas’: brain damage and death in acute stage.
• Dengue: high fever, headache, bleeding, bruising, and death in acutecases of dengue hemorrhagic fever.
Effects of vector-borne diseaseson children’s health
Children are more vulnerable to manyvector-borne diseases
• More than 95% of the dengue hemorrhagic fevercases are in children under 15 years old.3
• Chagas’ acutely affects younger children and cancause death. After age 10, Chagas’ becomes achronic, life-long disease that can cause heart
and digestive problems.4
• Young children are particularly vulnerable tomalaria because they have not yet built up
immunity against the disease.5
Source: Pan American Health Organization. Health Situation in theAmericas: Basic Indicators 2006. Washington, DC: PAHO; 2007.

Policy Actions—Reducing Disease Vectors
Eliminate disease vectors by involving communities inremoval vector breeding opportunities.
Increase the public’s education about pest eradication andinitial care of vector-borne diseases.
Improve housing, especially in areas that have houses withthatched roofs or are made of mud or adobe.
Improve access to safe water and sanitation and removestanding water from the area near houses.
Screen blood supplies for vector-borne diseases.
1. Pan American Health Organization. Health in the Americas, 2002 edition, Vol. I. Washington, DC: PAHO; 2002, p. 251.2. Dr. Roberto Salvatella, Pan American Health Organization, head of Chagas eradication effort. Interview.
December 8, 2006.3. Pan American Health Organization. Health in the Americas , 2002, Vol. 1. Washington, DC: PAHO; 2002 p. 251.4. Centers for Disease Control and Prevention, Division of Parasitic Diseases. Fact Sheet for the General Public: Chagas
Diseases. Atlanta, GA: CDC. (Revised September 21, 2004) Accessed at: http://www.cdc.gov/NCIDOD/DPD/PARASITES/chagasdisease/2004_PDF_Chagas.pdf.
5. National Center for Infectious Diseases, Division of Parasitic Diseases. Malaria: The Impact of Malaria, a LeadingCause of Death Worldwide. Atlanta, GA: CDC, revised September 13, 2004. Accessed on March 10, 2009 at:http://www.cdc.gov/malaria/impact/index.htm.
58 The Atlas of Children’s Health and Environment in the Americas
Goal 6: Combat HIV/AIDS,
malaria, and other
diseases
Target 8: Have halted by 2015 and
begun to reverse the inci-
dence of malaria and other
major diseases
Goal 7: Ensure environmental
sustainability
Target 10: Halve, by 2015, the propor-
tion of people without
sustainable access to safe
drinking water and basic
sanitation
Goal 8: Develop a global
partnership for
development
Target 17: In cooperation with
pharmaceutical companies,
provide access to afford-
able essential drugs in
developing countries
Related Millennium
Development Goals
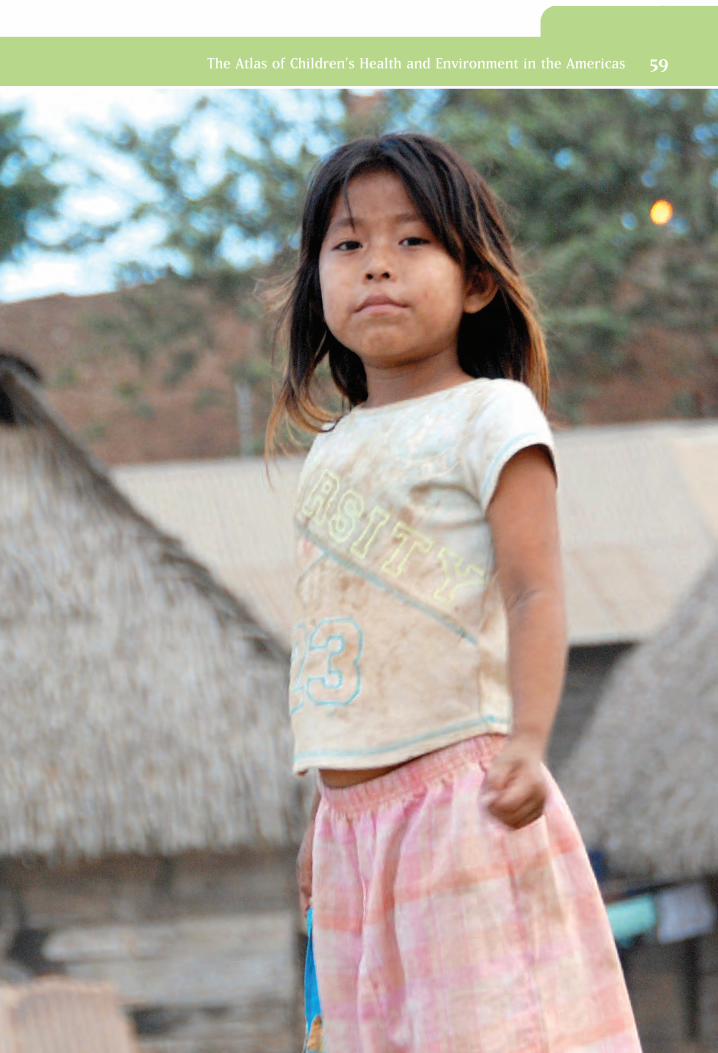
The Atlas of Children’s Health and Environment in the Americas 59
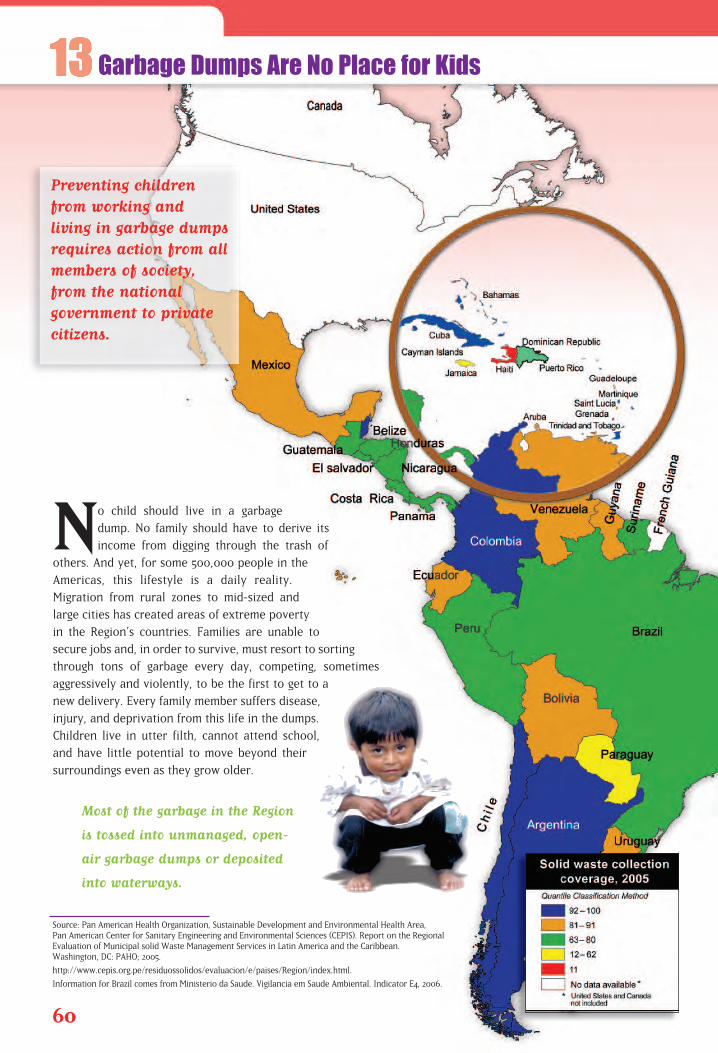
No child should live in a garbage
dump. No family should have to derive its
income from digging through the trash of
others. And yet, for some 500,000 people in the
Americas, this lifestyle is a daily reality.
Migration from rural zones to mid-sized and
large cities has created areas of extreme poverty
in the Region’s countries. Families are unable to
secure jobs and, in order to survive, must resort to sorting
through tons of garbage every day, competing, sometimes
aggressively and violently, to be the first to get to a
new delivery. Every family member suffers disease,
injury, and deprivation from this life in the dumps.
Children live in utter filth, cannot attend school,
and have little potential to move beyond their
surroundings even as they grow older.
Most of the garbage in the Region
is tossed into unmanaged, open-
air garbage dumps or deposited
into waterways.
60
Source: Pan American Health Organization, Sustainable Development and Environmental Health Area, Pan American Center for Sanitary Engineering and Environmental Sciences (CEPIS). Report on the Regional Evaluation of Municipal solid Waste Management Services in Latin America and the Caribbean. Washington, DC: PAHO; 2005.
http://www.cepis.org.pe/residuossolidos/evaluacion/e/paises/Region/index.html.
Information for Brazil comes from Ministerio da Saude. Vigilancia em Saude Ambiental. Indicator E4, 2006.
Garbage Dumps Are No Place for Kids
Preventing childrenfrom working and living in garbage dumpsrequires action from allmembers of society,from the national government to privatecitizens.
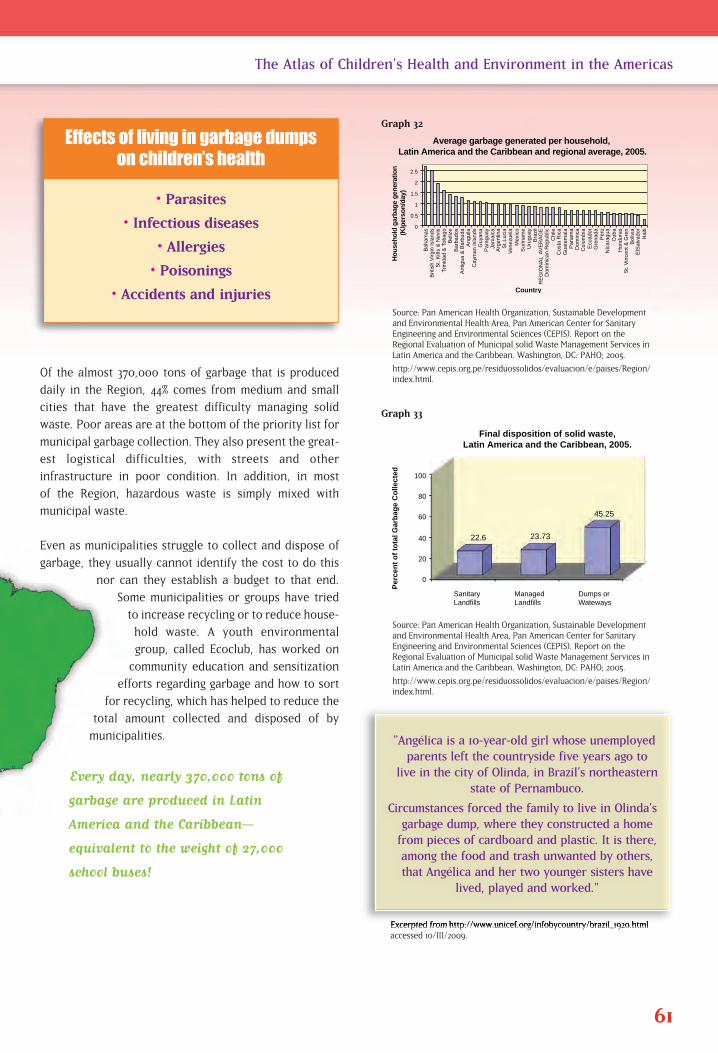
Of the almost 370,000 tons of garbage that is produced
daily in the Region, 44% comes from medium and small
cities that have the greatest difficulty managing solid
waste. Poor areas are at the bottom of the priority list for
municipal garbage collection. They also present the great-
est logistical difficulties, with streets and other
infrastructure in poor condition. In addition, in most
of the Region, hazardous waste is simply mixed with
municipal waste.
Even as municipalities struggle to collect and dispose of
garbage, they usually cannot identify the cost to do this
nor can they establish a budget to that end.
Some municipalities or groups have tried
to increase recycling or to reduce house-
hold waste. A youth environmental
group, called Ecoclub, has worked on
community education and sensitization
efforts regarding garbage and how to sort
for recycling, which has helped to reduce the
total amount collected and disposed of by
municipalities.
Every day, nearly 370,000 tons of
garbage are produced in Latin
America and the Caribbean—
equivalent to the weight of 27,000
school buses!
61
The Atlas of Children’s Health and Environment in the Americas
Source: Pan American Health Organization, Sustainable Developmentand Environmental Health Area, Pan American Center for SanitaryEngineering and Environmental Sciences (CEPIS). Report on theRegional Evaluation of Municipal solid Waste Management Services inLatin America and the Caribbean. Washington, DC: PAHO; 2005.
http://www.cepis.org.pe/residuossolidos/evaluacion/e/paises/Region/index.html.
0
0.5
1
1.5
2
2.5
Bah
amas
B
ritis
h V
irgin
Isla
nds
St.
Kitt
s &
Nev
is
Trin
idad
& T
obag
o B
eliz
e B
arba
dos
Ant
igua
& B
arbu
da
Ang
uila
C
aym
an Is
land
s G
uyan
a P
arag
uay
Jam
aica
A
rgen
tina
S
t. Lu
cia
Ven
ezue
la
Mex
ico
Sur
inam
e U
rugu
ay
Bra
zil
R
EG
ION
AL
AV
ER
AG
E
Dom
inic
an R
epub
lic
Chi
le
Cos
ta R
ica
Gua
tem
ala
Pan
ama
Dom
inca
C
olom
bia
Ecu
ador
G
rena
da
Per
u N
icar
agua
C
uba
Hon
dura
s S
t. V
ince
nt &
Gre
n
ElS
alva
dor
Bol
ivia
Hai
ti
Average garbage generated per household, Latin America and the Caribbean and regional average, 2005.
Ho
use
ho
ld g
arb
age
gen
erat
ion
(K
/per
son
/day
)
Country
Sanitary Landfills
Managed Landfills
Dumps or Wateways
Per
cen
t o
f to
tal G
arb
age
Co
llect
ed
Final disposition of solid waste, Latin America and the Caribbean, 2005.
0
20
40
60
80
100
22.6 23.73
45.25
Graph 32
Source: Pan American Health Organization, Sustainable Developmentand Environmental Health Area, Pan American Center for SanitaryEngineering and Environmental Sciences (CEPIS). Report on theRegional Evaluation of Municipal solid Waste Management Services inLatin America and the Caribbean. Washington, DC: PAHO; 2005.
http://www.cepis.org.pe/residuossolidos/evaluacion/e/paises/Region/index.html.
Excerpted from http://www.unicef.org/infobycountry/brazil_1920.htmlaccessed 10/III/2009.
Graph 33
• Parasites
• Infectious diseases
• Allergies
• Poisonings
• Accidents and injuries
Effects of living in garbage dumpson children’s health
"Angélica is a 10-year-old girl whose unemployedparents left the countryside five years ago to
live in the city of Olinda, in Brazil’s northeasternstate of Pernambuco.
Circumstances forced the family to live in Olinda’sgarbage dump, where they constructed a homefrom pieces of cardboard and plastic. It is there,among the food and trash unwanted by others,that Angélica and her two younger sisters have
lived, played and worked."

Policy Actions—Dealing with Trash at All Levels As a way to improve the garbage situation in Latin Americaand the Caribbean, actions can be taken to reduce the amountof waste produced, improve collection and disposal, and workthroughout society to remove children and other scavengersfrom open dumps.
A UNICEF-sponsored program in Brazil has had great suc-cess in removing children from garbage dumps. Lessonslearned from this multi-sector project—in which national,state, and local governments have actively participated—can be replicated elsewhere in the Region.
Countries and municipalities must develop and implementmultisector programs to stop children from scavenging ingarbage dumps. These programs might involve familysocial assistance and inclusion programs, school enroll-ment efforts, other governmental, nongovernmental, andprivate-enterprise provisions designed to meet basicneeds, among others.
Establish or increase a solid waste management authorityat the national and municipal levels, to provide regulation,assistance, coordination, and sustainability to garbage management.
Offer market incentives to better manage garbage, such as supporting recycling and garbagereduction initiatives at the household level, and providing technical and financial assistance tocities for solid waste management plans.
Increase society’s participation in waste management, promotion of recycling, reduction andreuse of waste, and opening everyone’s hearts and minds to help remove scavenging childrenfrom garbage dumps.
Goal 1: Eradicate extreme
poverty and hunger
Target 2: Halve, between 1990 and
2015, the proportion of peo-
ple who suffer from hunger
Goal 7: Ensure environmental
sustainability
Target 9: Integrate the principles of
sustainable development
into country policies and
programs and reverse the
loss of environmental
resources
Target 11: To improve the lives of at
least 100 million slum-
dwellers by 2020.
Related Millennium
Development Goals
62 The Atlas of Children’s Health and Environment in the Americas
Many individuals, communities, countries, and internationalorganizations have demonstrated their commitment to improving the environment and children’s well-being. The Millennium Declaration urges the world’s governments to make environmental management andhealth systems’ transformation priorities in all regions,1 and efforts atevery level—from local to international—are making important differ-ences. At the same time, there are still many challenges to overcome.Economic crises, disease outbreaks, demographic shifts, and competingnational political priorities often require immediate attention and action,and at times can overshadow the longer-term need to prevent disease,improve physical settings, and secure a healthy future for our children.
1. United Nations Development Program, U.N. Millennium Project. Investing in Development: A Practical Plan toAchieve the Millennium Development Goals. New York: UNDP; 2005. Available at: http://www.unmillenniumpro-ject.org/reports/fullreport.htm. Accessed on 12 March 2009.
Living in a SupportiveCommunity
4
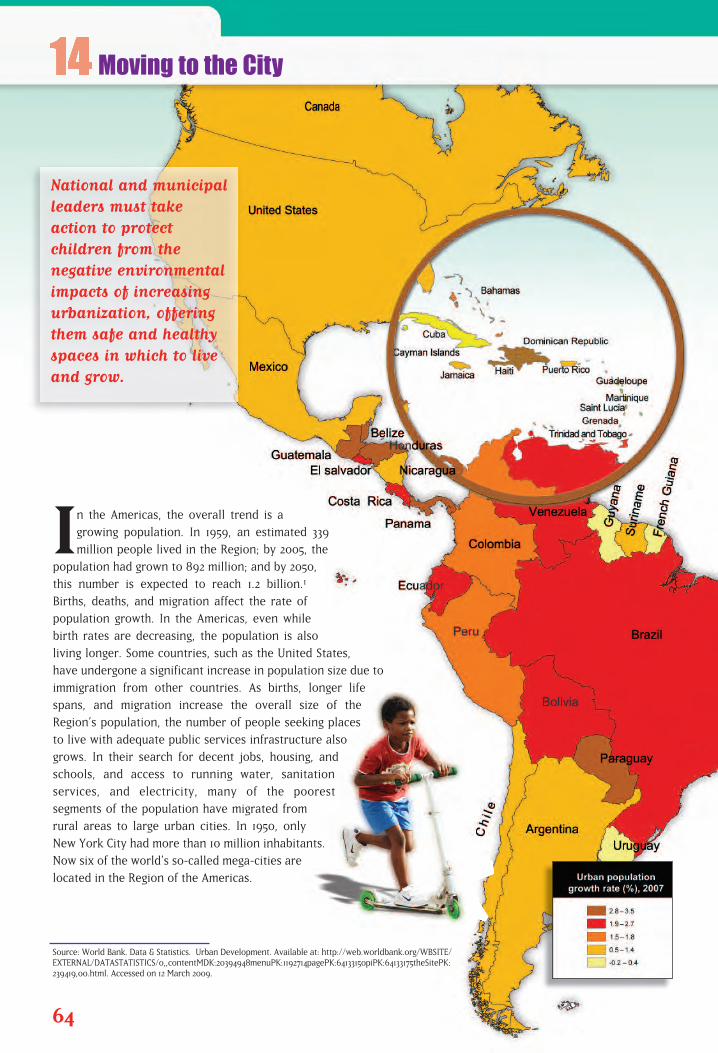
In the Americas, the overall trend is a
growing population. In 1959, an estimated 339
million people lived in the Region; by 2005, the
population had grown to 892 million; and by 2050,
this number is expected to reach 1.2 billion.1
Births, deaths, and migration affect the rate of
population growth. In the Americas, even while
birth rates are decreasing, the population is also
living longer. Some countries, such as the United States,
have undergone a significant increase in population size due to
immigration from other countries. As births, longer life
spans, and migration increase the overall size of the
Region’s population, the number of people seeking places
to live with adequate public services infrastructure also
grows. In their search for decent jobs, housing, and
schools, and access to running water, sanitation
services, and electricity, many of the poorest
segments of the population have migrated from
rural areas to large urban cities. In 1950, only
New York City had more than 10 million inhabitants.
Now six of the world’s so-called mega-cities are
located in the Region of the Americas.
64
Source: World Bank. Data & Statistics. Urban Development. Available at: http://web.worldbank.org/WBSITE/EXTERNAL/DATASTATISTICS/0,,contentMDK:20394948~menuPK:1192714~pagePK:64133150~piPK:64133175~theSitePK:239419,00.html. Accessed on 12 March 2009.
Moving to the City
National and municipalleaders must takeaction to protect children from the negative environmentalimpacts of increasingurbanization, offeringthem safe and healthyspaces in which to liveand grow.
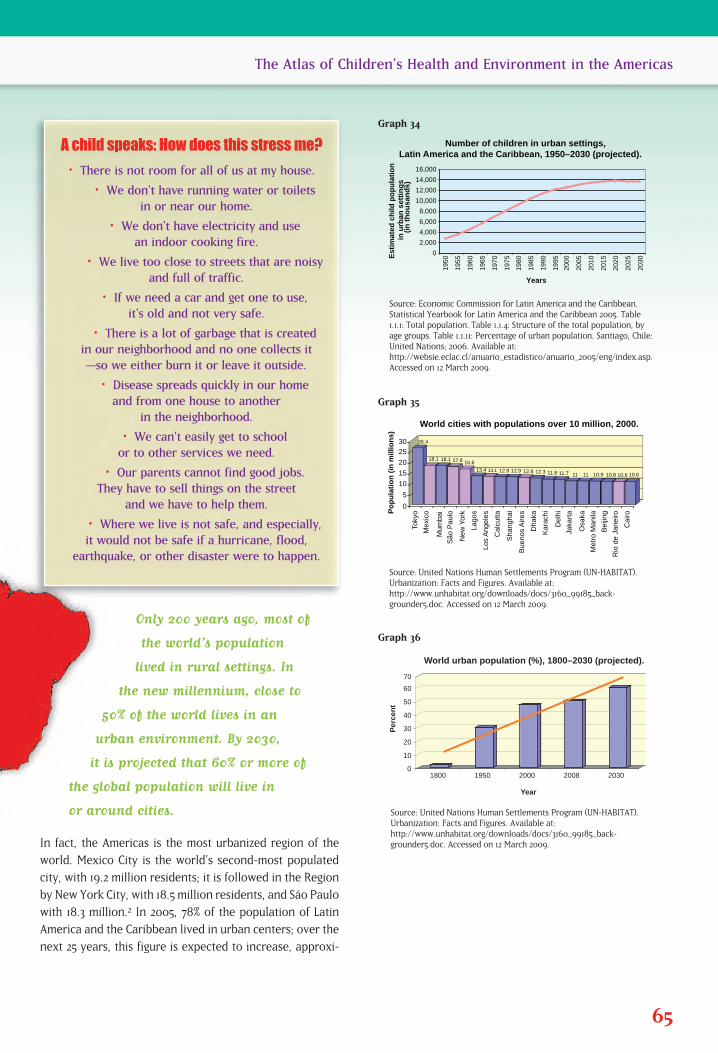
Only 200 years ago, most of
the world’s population
lived in rural settings. In
the new millennium, close to
50% of the world lives in an
urban environment. By 2030,
it is projected that 60% or more of
the global population will live in
or around cities.
In fact, the Americas is the most urbanized region of the
world. Mexico City is the world’s second-most populated
city, with 19.2 million residents; it is followed in the Region
by New York City, with 18.5 million residents, and São Paulo
with 18.3 million.2 In 2005, 78% of the population of Latin
America and the Caribbean lived in urban centers; over the
next 25 years, this figure is expected to increase, approxi-
65
The Atlas of Children’s Health and Environment in the Americas
Source: Economic Commission for Latin America and the Caribbean.Statistical Yearbook for Latin America and the Caribbean 2005. Table1.1.1: Total population. Table 1.1.4: Structure of the total population, byage groups. Table 1.1.11: Percentage of urban population. Santiago, Chile:United Nations; 2006. Available at:http://websie.eclac.cl/anuario_estadistico/anuario_2005/eng/index.asp.Accessed on 12 March 2009.
0
2,000
4,000
6,000
8,000
10,000
12,000
14,000
16,000
1950
1955
1960
1965
1970
1975
1980
1985
1990
1995
2000
2005
2010
2015
2020
2025
2030
Est
imat
ed c
hild
po
pu
lati
on
in
urb
an s
etti
ng
s(i
n t
ho
usa
nd
s)
Number of children in urban settings, Latin America and the Caribbean, 1950–2030 (projected).
Years
0
10
20
30
40
50
60
70
1800 1950 2000 2008 2030
World urban population (%), 1800–2030 (projected).
Per
cen
t
Year
Toky
o
Mex
ico
Mum
bai
São
Pau
lo
New
Yor
k
Lag
os
Los
Ang
eles
Cal
cutta
Sha
ngha
i
Bue
nos
Aire
s
Dha
ka
Kar
achi
D
elhi
Jaka
rta
Osa
ka
Met
ro M
anila
Bei
jing
Rio
de
Jane
iro
Cai
ro Po
pu
lati
on
(in
mill
ion
s)
World cities with populations over 10 million, 2000.
0
5
10
15
20
25
30 26.4
18.1 18.1 17.8 16.6
13.4 13.1 12.9 12.9 12.6 12.3 11.8 11.7 11 11 10.9 10.8 10.6 10.6
Graph 34
Source: United Nations Human Settlements Program (UN-HABITAT).Urbanization: Facts and Figures. Available at:http://www.unhabitat.org/downloads/docs/3160_99185_back-grounder5.doc. Accessed on 12 March 2009.
Graph 35
Source: United Nations Human Settlements Program (UN-HABITAT).Urbanization: Facts and Figures. Available at:http://www.unhabitat.org/downloads/docs/3160_99185_back-grounder5.doc. Accessed on 12 March 2009.
Graph 36
A child speaks: How does this stress me?
• There is not room for all of us at my house.
• We don't have running water or toilets in or near our home.
• We don't have electricity and use an indoor cooking fire.
• We live too close to streets that are noisy and full of traffic.
• If we need a car and get one to use, it's old and not very safe.
• There is a lot of garbage that is created in our neighborhood and no one collects it—so we either burn it or leave it outside.
• Disease spreads quickly in our home and from one house to another
in the neighborhood.
• We can't easily get to school or to other services we need.
• Our parents cannot find good jobs. They have to sell things on the street
and we have to help them.
• Where we live is not safe, and especially, it would not be safe if a hurricane, flood,
earthquake, or other disaster were to happen.
mating the current 87% figure for the urbanized population ofNorth America.2 The populations of not only mega-cities, butalso mid-sized cities, are burgeoning as more and more rural res-idents relocate to urban areas.
Of 19 cities in the world with populations over
10 million, six are found in the Region of the
Americas.
The increasing urbanization trend is accompanied by higherrates of urban poverty, with children disproportionately suffering the burden. More susceptible to diseases, children suffer from diarrheal diseases due to lack of clean drinkingwater and adequate sanitation services, as well as asthma andother upper and lower respiratory tract infections caused byinhaling polluted air indoors and outside. Inadequate housingalso encourages the spread of vectors; 95% of Chagas’ diseasecases are found among children. Lack of schools in peri-urbansettlements, unsafe conditions in and nearby shelters, insuffi-cient food, poor indoor and outdoor air quality—all of theseenvironmental hazards, especially when magnified in urbanslums, disproportionately affect children’s health and compro-mise their future. In light of the continued urbanization trendexpected for Latin America and the Caribbean in the future,ignoring this problem is not an option. Instead, national policy-makers need to begin taking concrete steps to ensure a healthyfuture for children throughout the Region.
Policy Actions—Planning Cities for the Future
Invest in urban planning to provide energy, water, and sanitation infrastructure; other needed public goods andservices; green spaces; access to adequate schools andhealth centers; and emergency response capacity.
Invest in rural energy, water, and sanitation infrastructure,and other needed public goods and services, in order tomake living outside of urban settings a viable option.
1. United Nations, Department of Economic and Social Affairs,Population Division. World Population Prospects: the 2004 Revision.Volume III: Analytical Report. New York: United Nations; 2006 (ST/ESA/SER.A/246). Available at:http://www.un.org/esa/population/publications/WPP2004/WPP2004_Vol3_Final/WPP2004_Analytical_Report.pdf. Accessed on 13 March 2009.
2. United Nations, Department of Economic and Social Affairs, Population Division. Population Challenges andDevelopment Goals. New York: United Nations; 2005 (ST/ESA/SER.A/248). Available at: http://www.un.org/esa/population/publications/pop_challenges/Population_Challenges.pdf. Accessed on 13 March 2009.
66 The Atlas of Children’s Health and Environment in the Americas
Goal 1: Eradicate extreme
poverty and hunger
Target 1: Halve, between 1990 and
2015, the proportion of
people whose income is less
than US$1 a day
Target 2: Halve, between 1990 and
2015, the proportion of
people who suffer from
hunger
Goal 2: Achieve universal
primary education
Target 3: Ensure that, by 2015,
children everywhere, boys
and girls alike, will be able
to complete a full course of
primary schooling
Goal 3: Promote gender equality
and empower women
Target 4: Eliminate gender disparity
in primary and secondary
education preferably by
2005 and in all levels of
education no later than 2015
Goal 7: Ensure environmental
sustainability
Target 9: Integrate the principles of
sustainable development
into country policies and
programs and reverse the
loss of environmental
resources
Goal 8: Develop a global part-
nership for development
Target 16: In cooperation with develop-
ing countries, develop and
implement strategies for
decent and productive work
for youth
Related Millennium
Development Goals
The Atlas of Children’s Health and Environment in the Americas 67

Julia’s family joined thousands of others
the day they took over a plot of land on the
edge of this small city. She, her mother, and
seven siblings built the tiny shack from discarded
materials they found on the ground. They had no
electricity, no running water, and only a dirt
floor. They had no screens in the window open-
ings and no furniture. They cooked behind the
shack on an open fire, not far from the place they
had designated as the toilet area. The city struggled to
provide services to the settlement, allowing children to
enroll in school and providing free access to the health
clinic. It took years, but one day, Julia’s house had
a light bulb dangling from the ceiling. Still, they
could not afford an electric heating element for
cooking. A standpipe was installed in the center
of the settlement, bringing untreated water.
Julia considered herself lucky. She lived in a
country that invested in social services and in
a community of people who cared.
Mass migration from rural to urban areas,
population growth, and poverty lead to
68
Source: World Bank. World Development Indicators 2005. Washington, DC: World Bank; 2005. Available at:http://devdata.worldbank.org/wdi2005/cover.htm. Accessed on 13 March 2009.
Adequate Shelter Offers Children a Safe Base
All children needhealthy and safe homesto live in as a base forlearning, developing,and preparing toassume their futurerole in society.
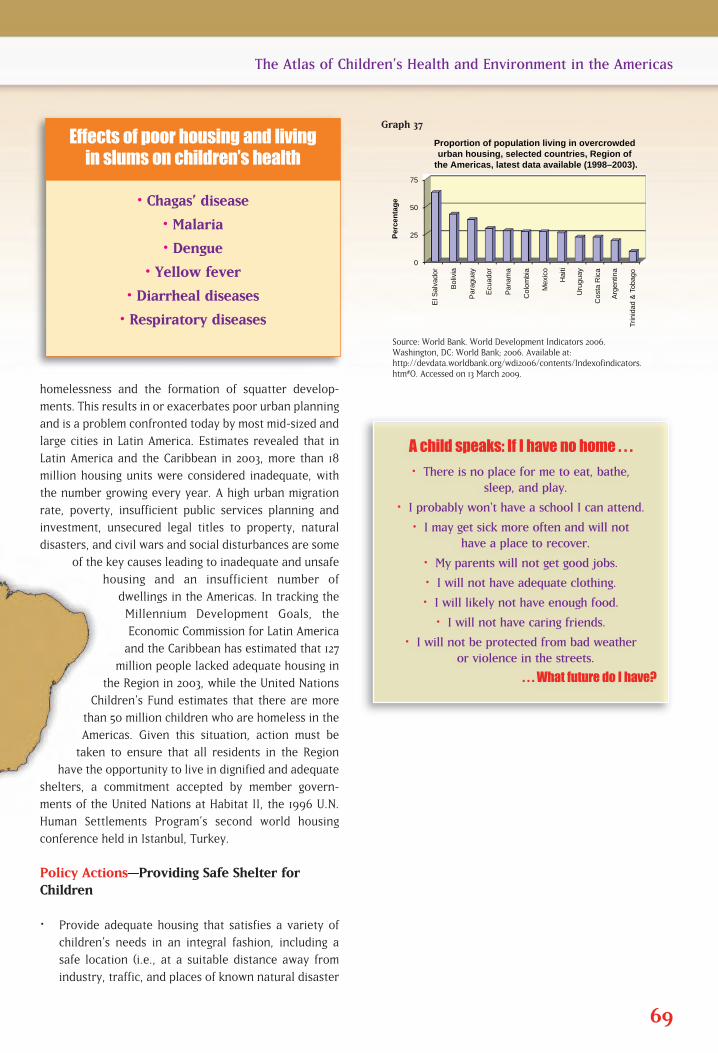
homelessness and the formation of squatter develop-
ments. This results in or exacerbates poor urban planning
and is a problem confronted today by most mid-sized and
large cities in Latin America. Estimates revealed that in
Latin America and the Caribbean in 2003, more than 18
million housing units were considered inadequate, with
the number growing every year. A high urban migration
rate, poverty, insufficient public services planning and
investment, unsecured legal titles to property, natural
disasters, and civil wars and social disturbances are some
of the key causes leading to inadequate and unsafe
housing and an insufficient number of
dwellings in the Americas. In tracking the
Millennium Development Goals, the
Economic Commission for Latin America
and the Caribbean has estimated that 127
million people lacked adequate housing in
the Region in 2003, while the United Nations
Children’s Fund estimates that there are more
than 50 million children who are homeless in the
Americas. Given this situation, action must be
taken to ensure that all residents in the Region
have the opportunity to live in dignified and adequate
shelters, a commitment accepted by member govern-
ments of the United Nations at Habitat II, the 1996 U.N.
Human Settlements Program’s second world housing
conference held in Istanbul, Turkey.
Policy Actions—Providing Safe Shelter forChildren
Provide adequate housing that satisfies a variety of
children’s needs in an integral fashion, including a
safe location (i.e., at a suitable distance away from
industry, traffic, and places of known natural disaster
69
The Atlas of Children’s Health and Environment in the Americas
Source: World Bank. World Development Indicators 2006.Washington, DC: World Bank; 2006. Available at:http://devdata.worldbank.org/wdi2006/contents/Indexofindicators.htm#O. Accessed on 13 March 2009.
0
25
50
75
El S
alva
dor
Bol
ivia
Par
agua
y
Ecu
ador
Pan
ama
Col
ombi
a
Mex
ico
Hai
ti
Uru
guay
Cos
ta R
ica
Arg
entin
a
Trin
idad
& T
obag
o
Per
cen
tag
e
Proportion of population living in overcrowded urban housing, selected countries, Region of
the Americas, latest data available (1998–2003).
Graph 37
• Chagas’ disease
• Malaria
• Dengue
• Yellow fever
• Diarrheal diseases
• Respiratory diseases
Effects of poor housing and living in slums on children’s health
A child speaks: If I have no home . . .
• There is no place for me to eat, bathe, sleep, and play.
• I probably won't have a school I can attend.
• I may get sick more often and will not have a place to recover.
• My parents will not get good jobs.
• I will not have adequate clothing.
• I will likely not have enough food.
• I will not have caring friends.
• I will not be protected from bad weather or violence in the streets.
. . . What future do I have?

potential); adequate physical construction and design (i.e.,structures made of suitable building materials and provid-ing sufficient space); access to basic public services ofacceptable quality (water, sanitation, and clean, efficientenergy sources); as well as other types of facilities thatpromote children’s healthy growth and development(schools, playgrounds, and other recreational areas; greenspaces; and health care centers).
Support health impact evaluations of public housing andurban development policies.
Strengthen local and national epidemiological surveillancesystems to better monitor and evaluate health status andrisk factors associated with housing conditions.
Encourage public health research to better understandthe relationship between housing and children’s health.
Develop community-based healthy housing programs that promote increased public awareness,information exchange, broad-based action, and collective participation.
Upgrade and refocus housing guidelines and codes to highlight and prioritize the importance ofchildren’s health and safety.
70 The Atlas of Children’s Health and Environment in the Americas
Goal 1: Eradicate extreme
poverty and hunger
Target 1: Halve, between 1990 and
2015, the proportion of
people whose income is less
than $US 1 a day
Goal 7: Ensure environmental
sustainability
Target 11: Have achieved by 2020 a
significant improvement
in the lives of at least
100 million slum dwellers
Related Millennium
Development Goals
The Atlas of Children’s Health and Environment in the Americas 71
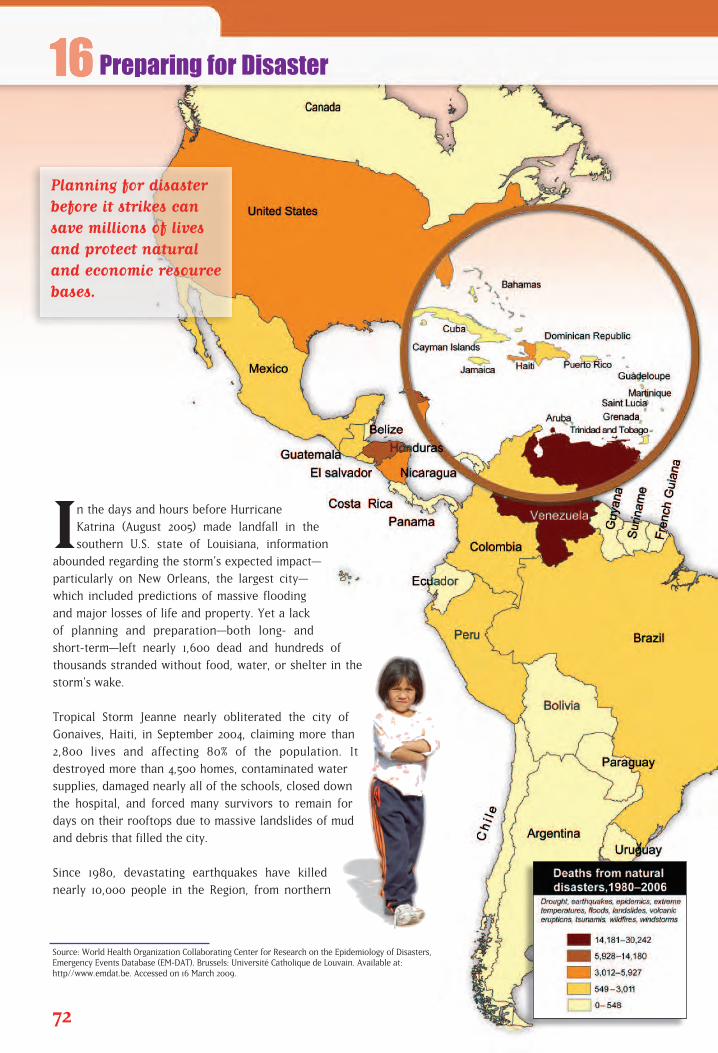
In the days and hours before Hurricane
Katrina (August 2005) made landfall in the
southern U.S. state of Louisiana, information
abounded regarding the storm’s expected impact—
particularly on New Orleans, the largest city—
which included predictions of massive flooding
and major losses of life and property. Yet a lack
of planning and preparation—both long- and
short-term—left nearly 1,600 dead and hundreds of
thousands stranded without food, water, or shelter in the
storm’s wake.
Tropical Storm Jeanne nearly obliterated the city of
Gonaives, Haiti, in September 2004, claiming more than
2,800 lives and affecting 80% of the population. It
destroyed more than 4,500 homes, contaminated water
supplies, damaged nearly all of the schools, closed down
the hospital, and forced many survivors to remain for
days on their rooftops due to massive landslides of mud
and debris that filled the city.
Since 1980, devastating earthquakes have killed
nearly 10,000 people in the Region, from northern
72
Source: World Health Organization Collaborating Center for Research on the Epidemiology of Disasters, Emergency Events Database (EM-DAT). Brussels: Université Catholique de Louvain. Available at: http//www.emdat.be. Accessed on 16 March 2009.
Preparing for Disaster
Planning for disasterbefore it strikes cansave millions of livesand protect naturaland economic resourcebases.
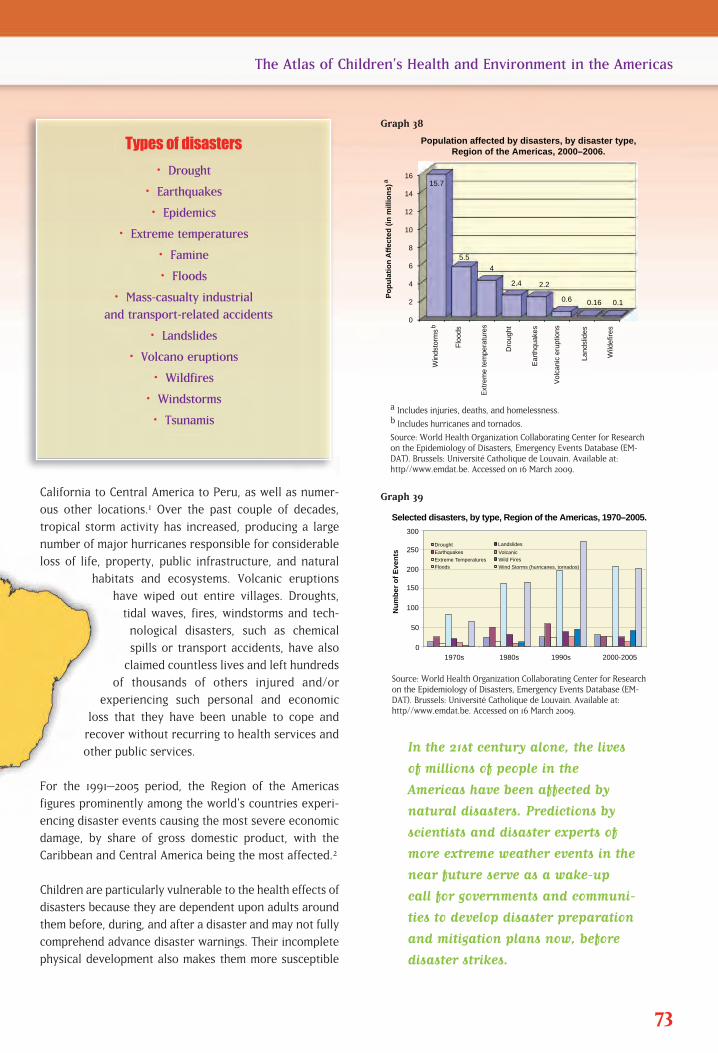
0
50
100
150
200
250
300
1970s 1980s 1990s 2000-2005
Nu
mb
er o
f E
ven
ts
Selected disasters, by type, Region of the Americas, 1970–2005.
Drought
Earthquakes
Extreme Temperatures Floods
Landslides
Volcanic
Wild Fires
Wind Storms (hurricanes, tornados)
California to Central America to Peru, as well as numer-
ous other locations.1 Over the past couple of decades,
tropical storm activity has increased, producing a large
number of major hurricanes responsible for considerable
loss of life, property, public infrastructure, and natural
habitats and ecosystems. Volcanic eruptions
have wiped out entire villages. Droughts,
tidal waves, fires, windstorms and tech-
nological disasters, such as chemical
spills or transport accidents, have also
claimed countless lives and left hundreds
of thousands of others injured and/or
experiencing such personal and economic
loss that they have been unable to cope and
recover without recurring to health services and
other public services.
For the 1991–2005 period, the Region of the Americas
figures prominently among the world’s countries experi-
encing disaster events causing the most severe economic
damage, by share of gross domestic product, with the
Caribbean and Central America being the most affected.2
Children are particularly vulnerable to the health effects of
disasters because they are dependent upon adults around
them before, during, and after a disaster and may not fully
comprehend advance disaster warnings. Their incomplete
physical development also makes them more susceptible
73
The Atlas of Children’s Health and Environment in the Americas
a Includes injuries, deaths, and homelessness.b Includes hurricanes and tornados.
Source: World Health Organization Collaborating Center for Researchon the Epidemiology of Disasters, Emergency Events Database (EM-DAT). Brussels: Université Catholique de Louvain. Available at:http//www.emdat.be. Accessed on 16 March 2009.
F
lood
s
Extr
eme
tem
pera
ture
s
Dro
ught
Ear
thqu
akes
Vol
cani
c er
uptio
ns
Land
slid
es
Wild
efire
s
Po
pu
lati
on
Aff
ecte
d (
in m
illio
ns)
Population affected by disasters, by disaster type,Region of the Americas, 2000–2006.
0
2
4
6
8
10
12
14
16 15.7
5.5
4
2.4 2.2
0.6 0.16 0.1
Win
dsto
rms
b
a
0
50
100
150
200
250
300
1970s 1980s 1990s 2000-2005
Nu
mb
er o
f E
ven
ts
Selected disasters, by type, Region of the Americas, 1970–2005.
Drought
Earthquakes
Extreme Temperatures Floods
Landslides
Volcanic
Wild Fires
Wind Storms (hurricanes, tornados)
Graph 38
Source: World Health Organization Collaborating Center for Researchon the Epidemiology of Disasters, Emergency Events Database (EM-DAT). Brussels: Université Catholique de Louvain. Available at:http//www.emdat.be. Accessed on 16 March 2009.
Graph 39
In the 21st century alone, the lives
of millions of people in the
Americas have been affected by
natural disasters. Predictions by
scientists and disaster experts of
more extreme weather events in the
near future serve as a wake-up
call for governments and communi-
ties to develop disaster preparation
and mitigation plans now, before
disaster strikes.
Types of disasters
• Drought
• Earthquakes
• Epidemics
• Extreme temperatures
• Famine
• Floods
• Mass-casualty industrial and transport-related accidents
• Landslides
• Volcano eruptions
• Wildfires
• Windstorms
• Tsunamis
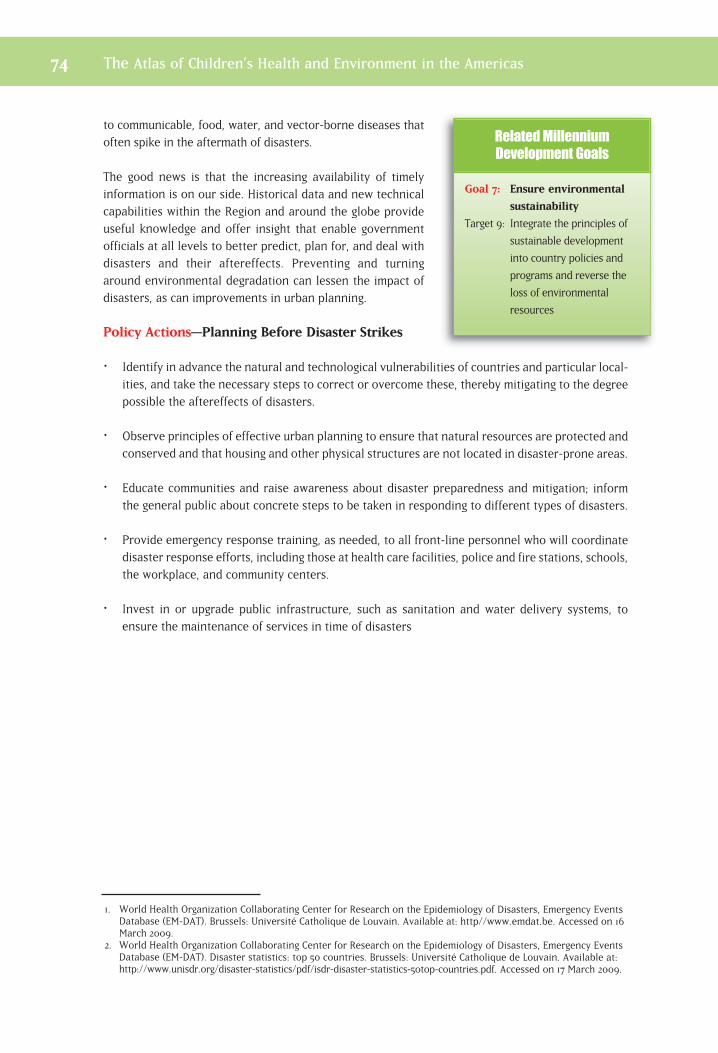
to communicable, food, water, and vector-borne diseases thatoften spike in the aftermath of disasters.
The good news is that the increasing availability of timelyinformation is on our side. Historical data and new technicalcapabilities within the Region and around the globe provideuseful knowledge and offer insight that enable governmentofficials at all levels to better predict, plan for, and deal withdisasters and their aftereffects. Preventing and turningaround environmental degradation can lessen the impact ofdisasters, as can improvements in urban planning.
Policy Actions—Planning Before Disaster Strikes
Identify in advance the natural and technological vulnerabilities of countries and particular local-ities, and take the necessary steps to correct or overcome these, thereby mitigating to the degreepossible the aftereffects of disasters.
Observe principles of effective urban planning to ensure that natural resources are protected andconserved and that housing and other physical structures are not located in disaster-prone areas.
Educate communities and raise awareness about disaster preparedness and mitigation; informthe general public about concrete steps to be taken in responding to different types of disasters.
Provide emergency response training, as needed, to all front-line personnel who will coordinatedisaster response efforts, including those at health care facilities, police and fire stations, schools,the workplace, and community centers.
Invest in or upgrade public infrastructure, such as sanitation and water delivery systems, toensure the maintenance of services in time of disasters
1. World Health Organization Collaborating Center for Research on the Epidemiology of Disasters, Emergency EventsDatabase (EM-DAT). Brussels: Université Catholique de Louvain. Available at: http//www.emdat.be. Accessed on 16March 2009.
2. World Health Organization Collaborating Center for Research on the Epidemiology of Disasters, Emergency EventsDatabase (EM-DAT). Disaster statistics: top 50 countries. Brussels: Université Catholique de Louvain. Available at:http://www.unisdr.org/disaster-statistics/pdf/isdr-disaster-statistics-50top-countries.pdf. Accessed on 17 March 2009.
74 The Atlas of Children’s Health and Environment in the Americas
Goal 7: Ensure environmental
sustainability
Target 9: Integrate the principles of
sustainable development
into country policies and
programs and reverse the
loss of environmental
resources
Related Millennium
Development Goals
The Atlas of Children’s Health and Environment in the Americas 75
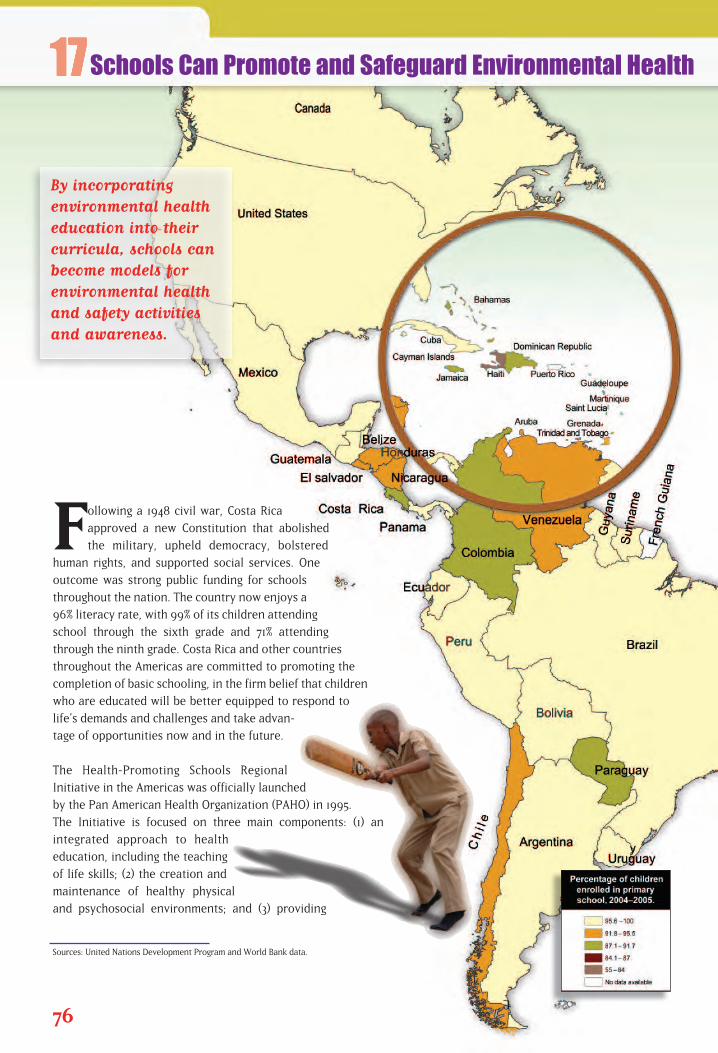
Following a 1948 civil war, Costa Rica
approved a new Constitution that abolished
the military, upheld democracy, bolstered
human rights, and supported social services. One
outcome was strong public funding for schools
throughout the nation. The country now enjoys a
96% literacy rate, with 99% of its children attending
school through the sixth grade and 71% attending
through the ninth grade. Costa Rica and other countries
throughout the Americas are committed to promoting the
completion of basic schooling, in the firm belief that children
who are educated will be better equipped to respond to
life’s demands and challenges and take advan-
tage of opportunities now and in the future.
The Health-Promoting Schools Regional
Initiative in the Americas was officially launched
by the Pan American Health Organization (PAHO) in 1995.
The Initiative is focused on three main components: (1) an
integrated approach to health
education, including the teaching
of life skills; (2) the creation and
maintenance of healthy physical
and psychosocial environments; and (3) providing
76
Sources: United Nations Development Program and World Bank data.
Schools Can Promote and Safeguard Environmental Health
By incorporating environmental healtheducation into theircurricula, schools canbecome models forenvironmental healthand safety activitiesand awareness.
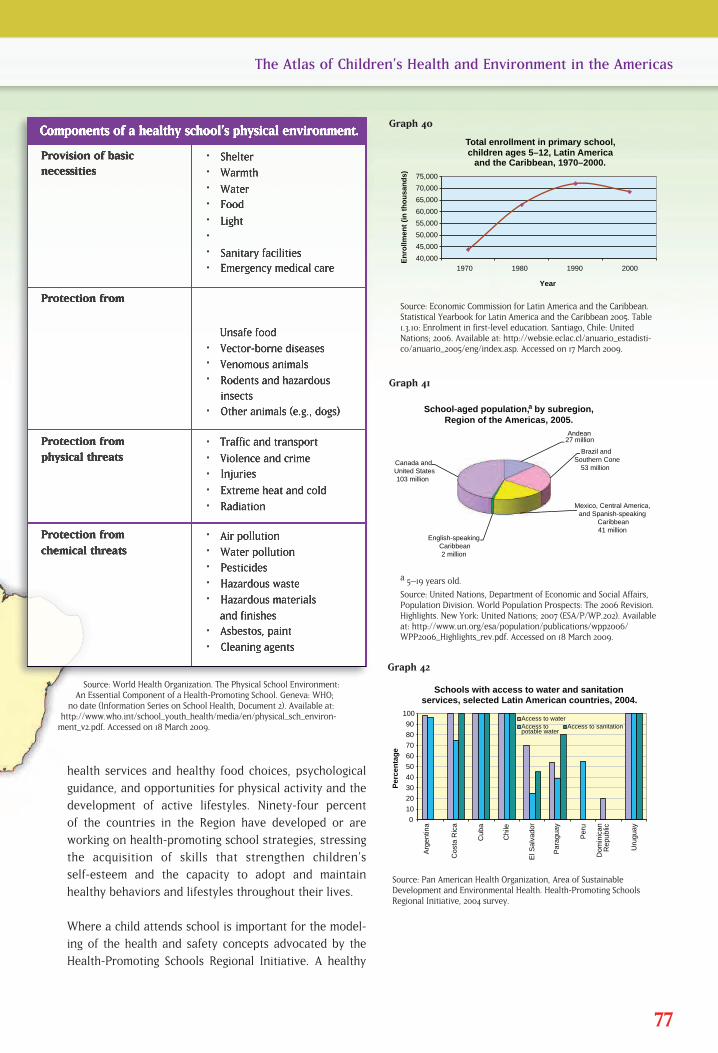
health services and healthy food choices, psychological
guidance, and opportunities for physical activity and the
development of active lifestyles. Ninety-four percent
of the countries in the Region have developed or are
working on health-promoting school strategies, stressing
the acquisition of skills that strengthen children’s
self-esteem and the capacity to adopt and maintain
healthy behaviors and lifestyles throughout their lives.
Where a child attends school is important for the model-
ing of the health and safety concepts advocated by the
Health-Promoting Schools Regional Initiative. A healthy
77
The Atlas of Children’s Health and Environment in the Americas
Source: Economic Commission for Latin America and the Caribbean.Statistical Yearbook for Latin America and the Caribbean 2005. Table1.3.10: Enrolment in first-level education. Santiago, Chile: UnitedNations; 2006. Available at: http://websie.eclac.cl/anuario_estadisti-co/anuario_2005/eng/index.asp. Accessed on 17 March 2009.
40,000
45,000
50,000
55,000
60,000
65,000
70,000
75,000
1970 1980 1990 2000
En
rollm
ent
(in
th
ou
san
ds)
Total enrollment in primary school, children ages 5–12, Latin America
and the Caribbean, 1970–2000.
Year
0
10
20
30
40
50
60
70
80
90
100
Arg
entin
a
Cos
ta R
ica
Cub
a
Chi
le
El S
alva
dor
Par
agua
y
Per
u
Dom
inic
an
Rep
ublic
Uru
guay
Per
cen
tag
e
Schools with access to water and sanitation services, selected Latin American countries, 2004.
Access to water Access to potable water
Access to sanitation
Andean 27 million
Brazil and Southern Cone
53 million
Mexico, Central America, and Spanish-speaking
Caribbean41 million
English-speaking Caribbean2 million
Canada and United States103 million
School-aged population, by subregion, Region of the Americas, 2005.
a
Graph 40
a 5–19 years old.
Source: United Nations, Department of Economic and Social Affairs,Population Division. World Population Prospects: The 2006 Revision.Highlights. New York: United Nations; 2007 (ESA/P/WP.202). Availableat: http://www.un.org/esa/population/publications/wpp2006/WPP2006_Highlights_rev.pdf. Accessed on 18 March 2009.
Graph 41
Source: Pan American Health Organization, Area of SustainableDevelopment and Environmental Health. Health-Promoting SchoolsRegional Initiative, 2004 survey.
Graph 42
Source: World Health Organization. The Physical School Environment:An Essential Component of a Health-Promoting School. Geneva: WHO;
no date (Information Series on School Health, Document 2). Available at:http://www.who.int/school_youth_health/media/en/physical_sch_environ-
ment_v2.pdf. Accessed on 18 March 2009.
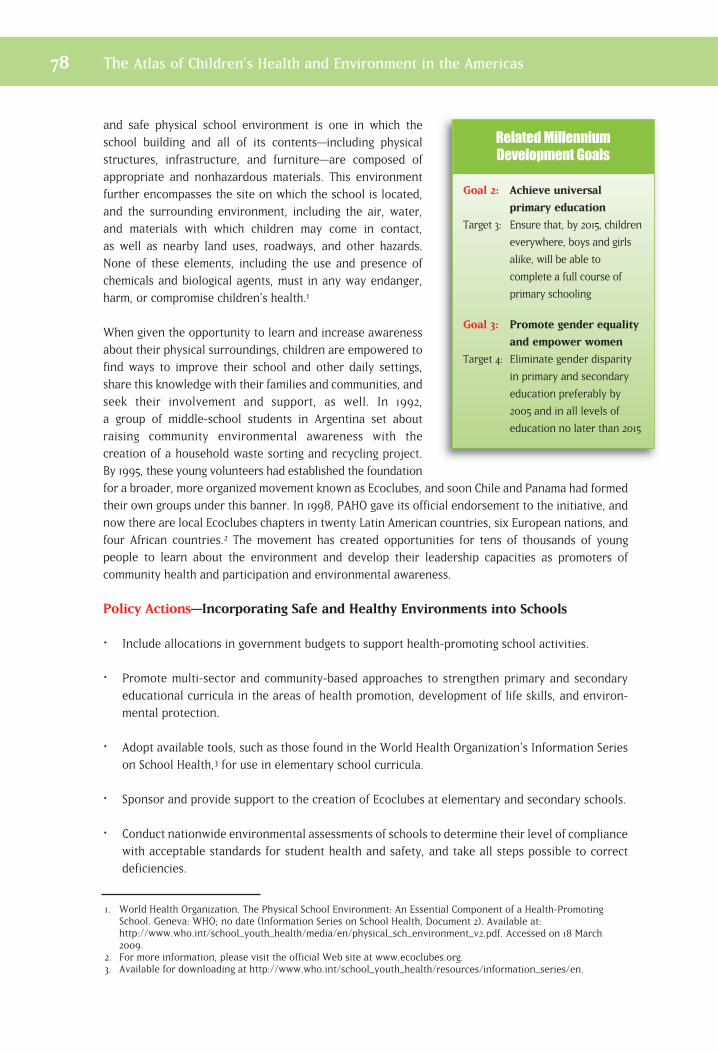
and safe physical school environment is one in which theschool building and all of its contents—including physicalstructures, infrastructure, and furniture—are composed ofappropriate and nonhazardous materials. This environmentfurther encompasses the site on which the school is located,and the surrounding environment, including the air, water,and materials with which children may come in contact, as well as nearby land uses, roadways, and other hazards.None of these elements, including the use and presence ofchemicals and biological agents, must in any way endanger,harm, or compromise children’s health.1
When given the opportunity to learn and increase awarenessabout their physical surroundings, children are empowered tofind ways to improve their school and other daily settings,share this knowledge with their families and communities, andseek their involvement and support, as well. In 1992, a group of middle-school students in Argentina set about raising community environmental awareness with the creation of a household waste sorting and recycling project.By 1995, these young volunteers had established the foundationfor a broader, more organized movement known as Ecoclubes, and soon Chile and Panama had formedtheir own groups under this banner. In 1998, PAHO gave its official endorsement to the initiative, andnow there are local Ecoclubes chapters in twenty Latin American countries, six European nations, andfour African countries.2 The movement has created opportunities for tens of thousands of young people to learn about the environment and develop their leadership capacities as promoters of community health and participation and environmental awareness.
Policy Actions—Incorporating Safe and Healthy Environments into Schools
Include allocations in government budgets to support health-promoting school activities.
Promote multi-sector and community-based approaches to strengthen primary and secondaryeducational curricula in the areas of health promotion, development of life skills, and environ-mental protection.
Adopt available tools, such as those found in the World Health Organization’s Information Serieson School Health,3 for use in elementary school curricula.
Sponsor and provide support to the creation of Ecoclubes at elementary and secondary schools.
Conduct nationwide environmental assessments of schools to determine their level of compliancewith acceptable standards for student health and safety, and take all steps possible to correctdeficiencies.
1. World Health Organization. The Physical School Environment: An Essential Component of a Health-PromotingSchool. Geneva: WHO; no date (Information Series on School Health, Document 2). Available at:http://www.who.int/school_youth_health/media/en/physical_sch_environment_v2.pdf. Accessed on 18 March2009.
2. For more information, please visit the official Web site at www.ecoclubes.org. 3. Available for downloading at http://www.who.int/school_youth_health/resources/information_series/en.
78 The Atlas of Children’s Health and Environment in the Americas
Goal 2: Achieve universal
primary education
Target 3: Ensure that, by 2015, children
everywhere, boys and girls
alike, will be able to
complete a full course of
primary schooling
Goal 3: Promote gender equality
and empower women
Target 4: Eliminate gender disparity
in primary and secondary
education preferably by
2005 and in all levels of
education no later than 2015
Related Millennium
Development Goals
The Atlas of Children’s Health and Environment in the Americas 79
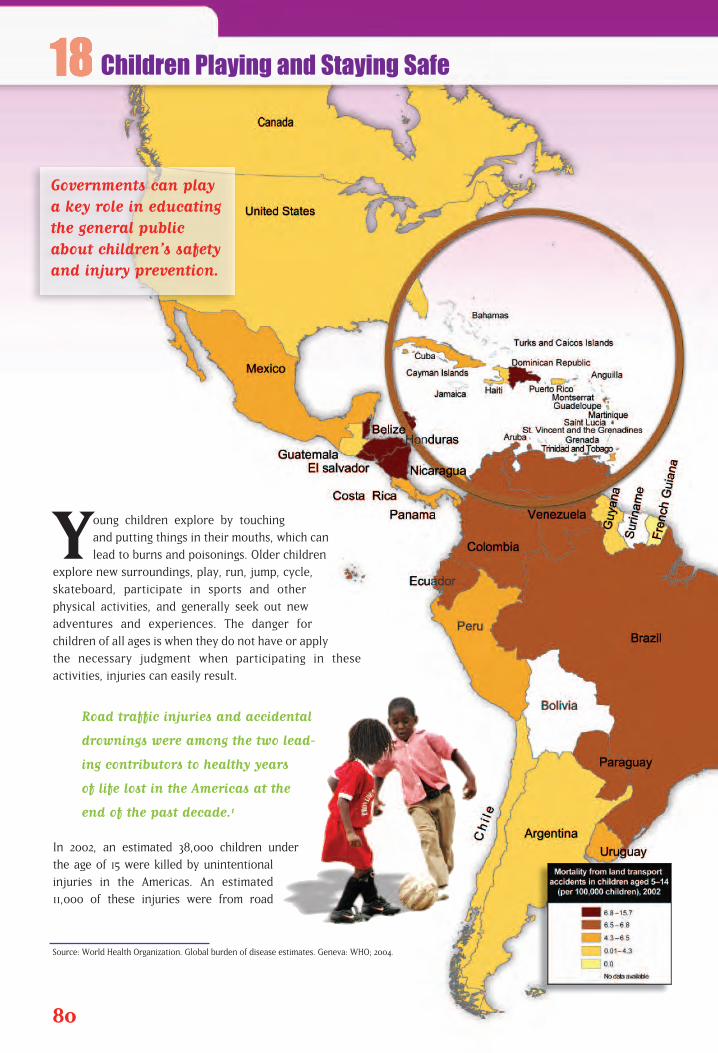
Young children explore by touching
and putting things in their mouths, which can
lead to burns and poisonings. Older children
explore new surroundings, play, run, jump, cycle,
skateboard, participate in sports and other
physical activities, and generally seek out new
adventures and experiences. The danger for
children of all ages is when they do not have or apply
the necessary judgment when participating in these
activities, injuries can easily result.
Road traffic injuries and accidental
drownings were among the two lead-
ing contributors to healthy years
of life lost in the Americas at the
end of the past decade.1
In 2002, an estimated 38,000 children under
the age of 15 were killed by unintentional
injuries in the Americas. An estimated
11,000 of these injuries were from road
80
Source: World Health Organization. Global burden of disease estimates. Geneva: WHO; 2004.
Children Playing and Staying Safe
Governments can playa key role in educatingthe general publicabout children’s safetyand injury prevention.
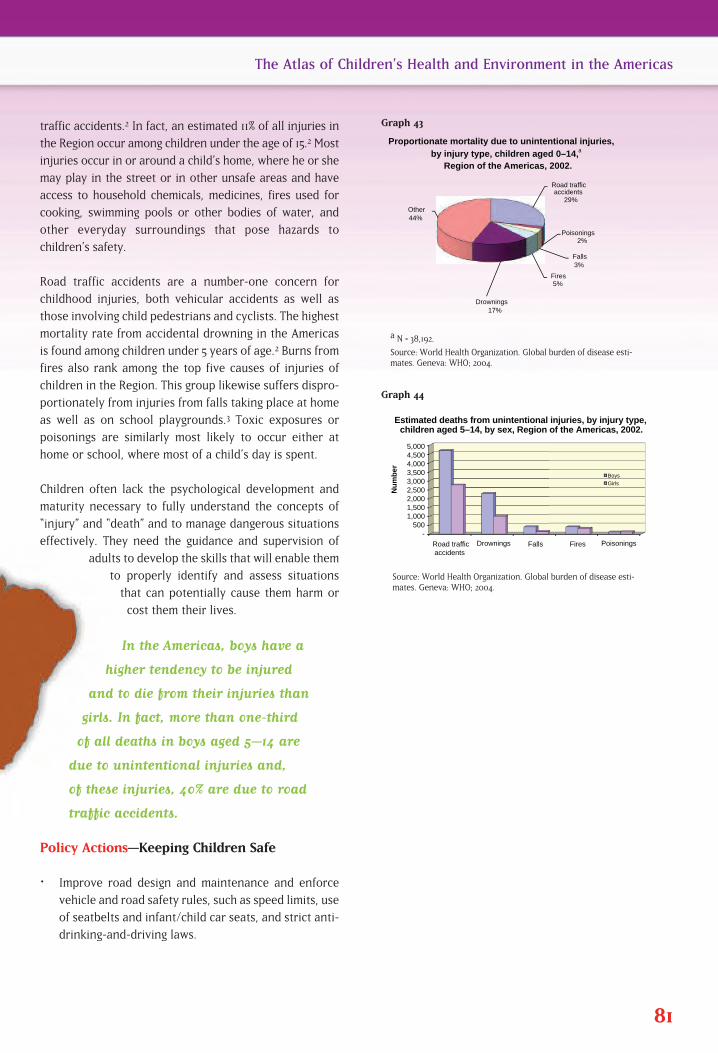
traffic accidents.2 In fact, an estimated 11% of all injuries in
the Region occur among children under the age of 15.2 Most
injuries occur in or around a child’s home, where he or she
may play in the street or in other unsafe areas and have
access to household chemicals, medicines, fires used for
cooking, swimming pools or other bodies of water, and
other everyday surroundings that pose hazards to
children’s safety.
Road traffic accidents are a number-one concern for
childhood injuries, both vehicular accidents as well as
those involving child pedestrians and cyclists. The highest
mortality rate from accidental drowning in the Americas
is found among children under 5 years of age.2 Burns from
fires also rank among the top five causes of injuries of
children in the Region. This group likewise suffers dispro-
portionately from injuries from falls taking place at home
as well as on school playgrounds.3 Toxic exposures or
poisonings are similarly most likely to occur either at
home or school, where most of a child’s day is spent.
Children often lack the psychological development and
maturity necessary to fully understand the concepts of
“injury” and “death” and to manage dangerous situations
effectively. They need the guidance and supervision of
adults to develop the skills that will enable them
to properly identify and assess situations
that can potentially cause them harm or
cost them their lives.
In the Americas, boys have a
higher tendency to be injured
and to die from their injuries than
girls. In fact, more than one-third
of all deaths in boys aged 5–14 are
due to unintentional injuries and,
of these injuries, 40% are due to road
traffic accidents.
Policy Actions—Keeping Children Safe
Improve road design and maintenance and enforce
vehicle and road safety rules, such as speed limits, use
of seatbelts and infant/child car seats, and strict anti-
drinking-and-driving laws.
81
The Atlas of Children’s Health and Environment in the Americas
a N = 38,192.
Source: World Health Organization. Global burden of disease esti-mates. Geneva: WHO; 2004.
Road traffic accidents
29%
Poisonings 2%
Falls 3%
Fires 5%
Drownings 17%
Other 44%
Proportionate mortality due to unintentional injuries, by injury type, children aged 0–14,
Region of the Americas, 2002.
a
- 500
1,000 1,500 2,000 2,500 3,000 3,500 4,000 4,500 5,000
Road traffic accidents
Drownings Falls Fires Poisonings
Nu
mb
er
Estimated deaths from unintentional injuries, by injury type, children aged 5–14, by sex, Region of the Americas, 2002.
Boys
Girls
Graph 43
Source: World Health Organization. Global burden of disease esti-mates. Geneva: WHO; 2004.
Graph 44
Install road signs near schools, reduce speed limits inschool zones, and employ other traffic techniques nearschools and in residential neighborhoods to protect children from speeders and other traffic violators.
Improve emergency health care, as well as informationsystems for recording and reporting case data for accidents and other unintentional injuries, disaggregatedby age and sex.
Establish safe play areas for children that are protected from high traffic and industrial areas.
In schools, develop safety curricula to teach children not to play in the streets; to wear properhelmets when riding a tricycle, bicycle, or scooter; to use sidewalks; and to cross the street onlyat marked intersections.
Develop, adopt, and enforce child protection and safety laws.
Develop and disseminate educational campaigns that promote behavioral change in the areas ofhome and playground safety, safe driving, and injury prevention.
1. Pan American Health Organization. Volume I: Health Conditions in the Americas. 2002 Edition. Washington, DC:PAHO; 2002 (Scientific and Technical Publication 587).
2. World Health Organization. Global burden of disease estimates. Geneva: WHO; 2004.3. World Health Organization. World report on child injury prevention. Geneva: WHO; 2008. Available at:
http://www.who.int/violence_injury_prevention/child/injury/world_report/en/. Accessed on 12 May 2009.
82 The Atlas of Children’s Health and Environment in the Americas
Goal 4: Reduce child mortality
Target 5: Reduce by two-thirds,
between 1990 and 2015, the
under-five mortality rate
Related Millennium
Development Goals
The Atlas of Children’s Health and Environment in the Americas 83
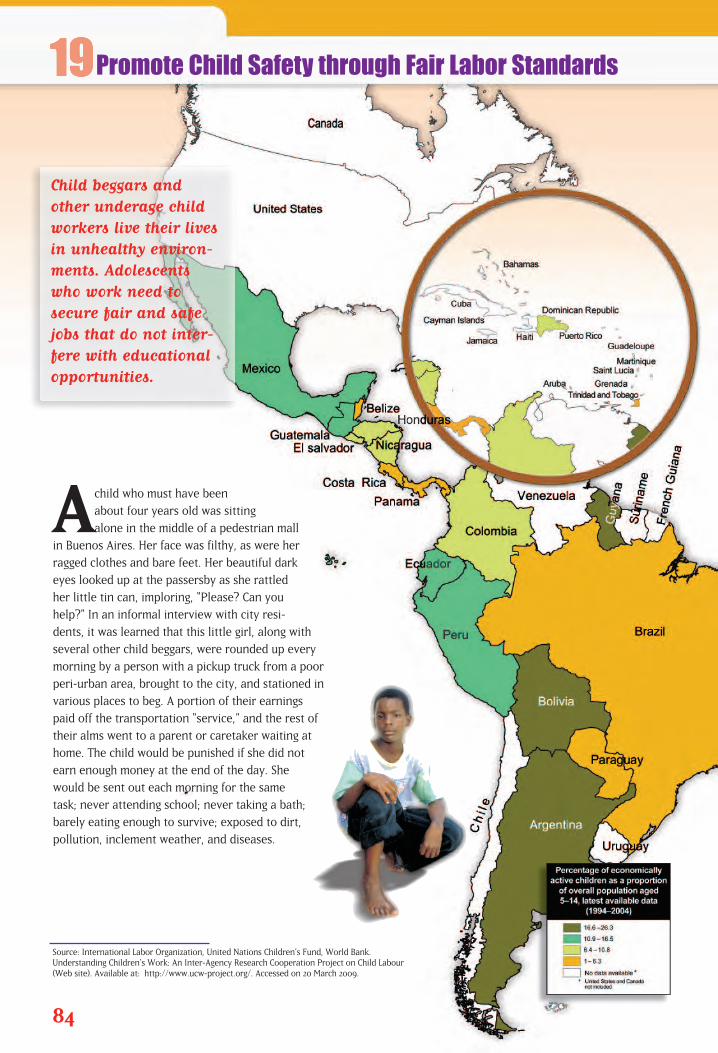
Achild who must have been
about four years old was sitting
alone in the middle of a pedestrian mall
in Buenos Aires. Her face was filthy, as were her
ragged clothes and bare feet. Her beautiful dark
eyes looked up at the passersby as she rattled
her little tin can, imploring, “Please? Can you
help?” In an informal interview with city resi-
dents, it was learned that this little girl, along with
several other child beggars, were rounded up every
morning by a person with a pickup truck from a poor
peri-urban area, brought to the city, and stationed in
various places to beg. A portion of their earnings
paid off the transportation “service,” and the rest of
their alms went to a parent or caretaker waiting at
home. The child would be punished if she did not
earn enough money at the end of the day. She
would be sent out each morning for the same
task; never attending school; never taking a bath;
barely eating enough to survive; exposed to dirt,
pollution, inclement weather, and diseases.
84
Source: International Labor Organization, United Nations Children’s Fund, World Bank. Understanding Children’s Work: An Inter-Agency Research Cooperation Project on Child Labour (Web site). Available at: http://www.ucw-project.org/. Accessed on 20 March 2009.
Promote Child Safety through Fair Labor Standards
Child beggars andother underage childworkers live their livesin unhealthy environ-ments. Adolescentswho work need tosecure fair and safejobs that do not inter-fere with educationalopportunities.
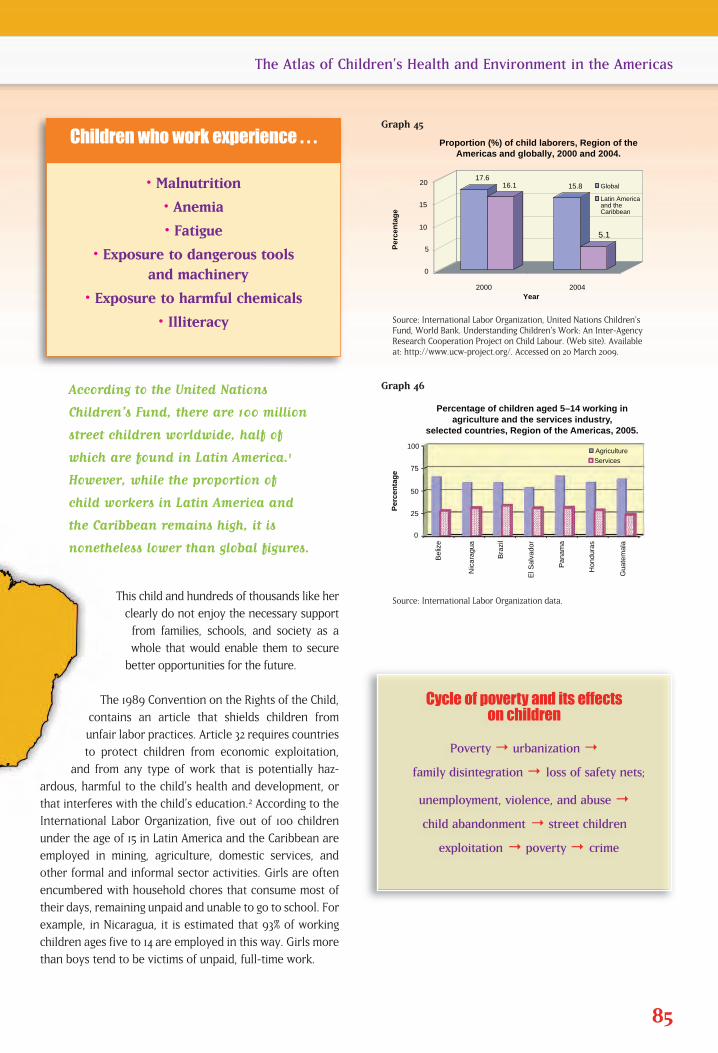
According to the United Nations
Children’s Fund, there are 100 million
street children worldwide, half of
which are found in Latin America.1
However, while the proportion of
child workers in Latin America and
the Caribbean remains high, it is
nonetheless lower than global figures.
This child and hundreds of thousands like her
clearly do not enjoy the necessary support
from families, schools, and society as a
whole that would enable them to secure
better opportunities for the future.
The 1989 Convention on the Rights of the Child,
contains an article that shields children from
unfair labor practices. Article 32 requires countries
to protect children from economic exploitation,
and from any type of work that is potentially haz-
ardous, harmful to the child’s health and development, or
that interferes with the child’s education.2 According to the
International Labor Organization, five out of 100 children
under the age of 15 in Latin America and the Caribbean are
employed in mining, agriculture, domestic services, and
other formal and informal sector activities. Girls are often
encumbered with household chores that consume most of
their days, remaining unpaid and unable to go to school. For
example, in Nicaragua, it is estimated that 93% of working
children ages five to 14 are employed in this way. Girls more
than boys tend to be victims of unpaid, full-time work.
85
The Atlas of Children’s Health and Environment in the Americas
Source: International Labor Organization, United Nations Children’sFund, World Bank. Understanding Children’s Work: An Inter-AgencyResearch Cooperation Project on Child Labour. (Web site). Availableat: http://www.ucw-project.org/. Accessed on 20 March 2009.
10
15
20
2000 2004
Per
cen
tag
e
Proportion (%) of child laborers, Region of the Americas and globally, 2000 and 2004.
Year
5
0
5.1
17.6 15.8 16.1 Global
Latin America and the Caribbean
0
25
50
75
100 B
eliz
e
Nic
arag
ua
Bra
zil
El S
alva
dor
Pan
ama
Hon
dura
s
Gua
tem
ala
Per
cen
tag
e
Percentage of children aged 5–14 working in agriculture and the services industry,
selected countries, Region of the Americas, 2005.
Agriculture
Services
Graph 45
Source: International Labor Organization data.
Graph 46
• Malnutrition
• Anemia
• Fatigue
• Exposure to dangerous tools and machinery
• Exposure to harmful chemicals
• Illiteracy
Children who work experience . . .
Cycle of poverty and its effects on children
Poverty → urbanization →
family disintegration → loss of safety nets;
unemployment, violence, and abuse →
child abandonment → street children �
exploitation → poverty → crime

While a devastating scenario—not only for the individual childbut also for the future strength of human capital fueling theRegion’s economic growth—some bright spots do exist. LatinAmerica and the Caribbean, in comparison with the rest of theworld, have seen a sharp decrease in the number of childworkers. The World Bank, United Children’s Fund, and theInternational Labor Organization have each promoted effortsto establish labor standards, eliminate the exploitation of children, improve schooling opportunities for this group, andremove them from the most hazardous forms of labor.
Policy Actions—Safeguarding Children fromEconomic Exploitation and Dangerous WorkEnvironments
Achieve intersectoral and interregional coordination todevelop and provide child protective services so that childbegging and other forms of child exploitation and slaveryare eliminated throughout the Americas.
Create a working group on children within the Inter-AmericanConference of Ministers of Labor of the Organization ofAmerican States to assess the situation of child labor anddevelop a plan of action to protect children, specifically con-sidering underage labor (under 15 years, as established byInternational Labor Organization Convention 138),3 dangerousforms of labor (ILO Convention 182),4 and child begging andother informal sector employment.
Establish and enforce a minimum employment age policy,as well as other effective mechanisms to protect childrenfrom dangerous jobs and exploitation.
Develop programs targeted to children and youth—includ-ing street children—that provide opportunities for educa-tion and skills development and viable alternatives to theunsafe and unhealthy conditions this group currentlyfaces. Investing in at-risk children is not only a question of social justice and human rights protection, but can also yield potential economic benefits for the future. Reaching out to streetchildren is likely to have a positive spillover effect (in terms of turning them into productive participants of society and preventing crime), whereas not investing in this group is likely to havea negative spillover effect (in terms of increased crime rates and poverty).
1. World Bank. Child Labor. Regional Activities: Latin America and the Caribbean. Available at: http://www1.world-bank.org/sp/childlabor/lac.asp. Accessed on 20 March 2009.
2. United Nations, Office of the High Commissioner for Human Rights. Convention on the Rights of the Child. Geneva:UNHCHR; 1989. Available at: http://www.unhchr.ch/html/menu3/b/k2crc.htm. Accessed on 23 March 2009.
3. International Labor Organization. ILO Convention 138 Concerning the Minimum Age for Admission to Employment.Geneva: ILO; 1973.
4. International Labor Organization. ILO Convention 182 Concerning the Prohibition and Immediate Action for theElimination of the Worst Forms of Child Labour. Geneva: ILO; 1999.
86 The Atlas of Children’s Health and Environment in the Americas
Goal 1: Eradicate extreme
poverty and hunger
Target 2: Halve, between 1990 and
2015, the proportion of peo-
ple who suffer from hunger
Goal 2: Achieve universal
primary education
Target 3: Ensure that, by 2015,
children everywhere, boys
and girls alike, will be able
to complete a full course of
primary schooling
Goal 3: Promote gender
equality and empower
women
Target 4: Eliminate gender disparity
in primary and secondary
education preferably by
2005 and in all levels of
education no later than
2015
Goal 8: Develop a global
partnership for
development
Target 16: In cooperation with
developing countries,
develop and implement
strategies for decent and
productive work for youth
Related Millennium
Development Goals
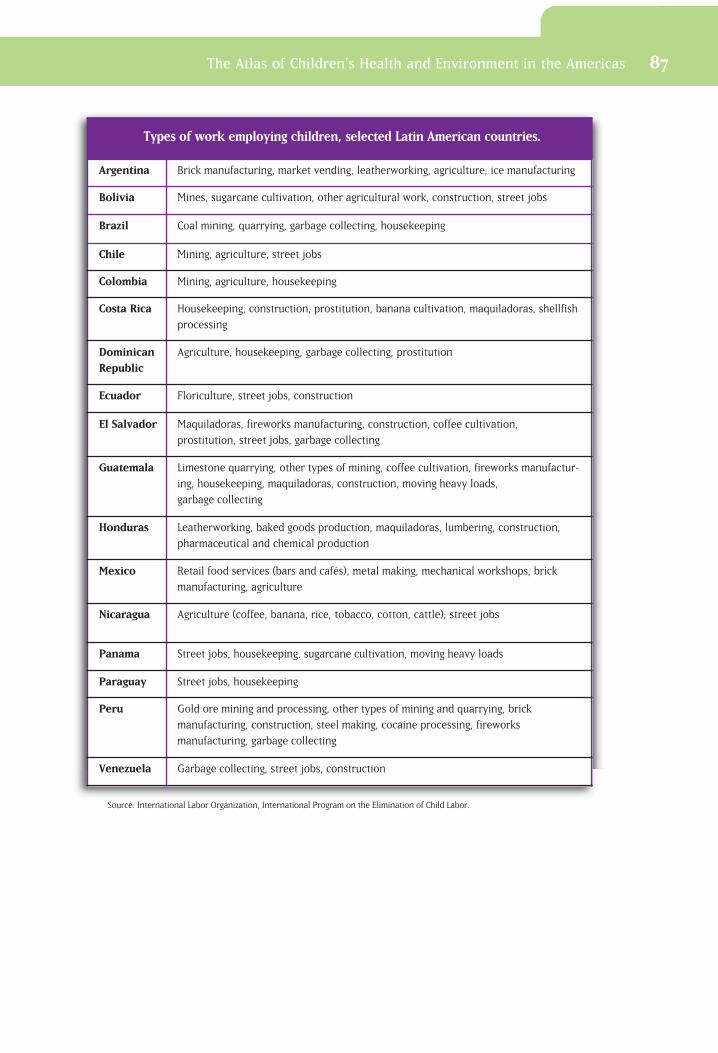
The Atlas of Children’s Health and Environment in the Americas 87
Types of work employing children, selected Latin American countries.
Argentina Brick manufacturing, market vending, leatherworking, agriculture, ice manufacturing
Bolivia Mines, sugarcane cultivation, other agricultural work, construction, street jobs
Brazil Coal mining, quarrying, garbage collecting, housekeeping
Chile Mining, agriculture, street jobs
Colombia Mining, agriculture, housekeeping
Costa Rica Housekeeping, construction, prostitution, banana cultivation, maquiladoras, shellfish
processing
DominicanRepublic
Agriculture, housekeeping, garbage collecting, prostitution
Ecuador Floriculture, street jobs, construction
El Salvador Maquiladoras, fireworks manufacturing, construction, coffee cultivation,
prostitution, street jobs, garbage collecting
Guatemala Limestone quarrying, other types of mining, coffee cultivation, fireworks manufactur-
ing, housekeeping, maquiladoras, construction, moving heavy loads,
garbage collecting
Honduras Leatherworking, baked goods production, maquiladoras, lumbering, construction,
pharmaceutical and chemical production
Mexico Retail food services (bars and cafés), metal making, mechanical workshops, brick
manufacturing, agriculture
Nicaragua Agriculture (coffee, banana, rice, tobacco, cotton, cattle); street jobs
Panama Street jobs, housekeeping, sugarcane cultivation, moving heavy loads
Paraguay Street jobs, housekeeping
Peru Gold ore mining and processing, other types of mining and quarrying, brick
manufacturing, construction, steel making, cocaine processing, fireworks
manufacturing, garbage collecting
Venezuela Garbage collecting, street jobs, construction
Source: International Labor Organization, International Program on the Elimination of Child Labor.

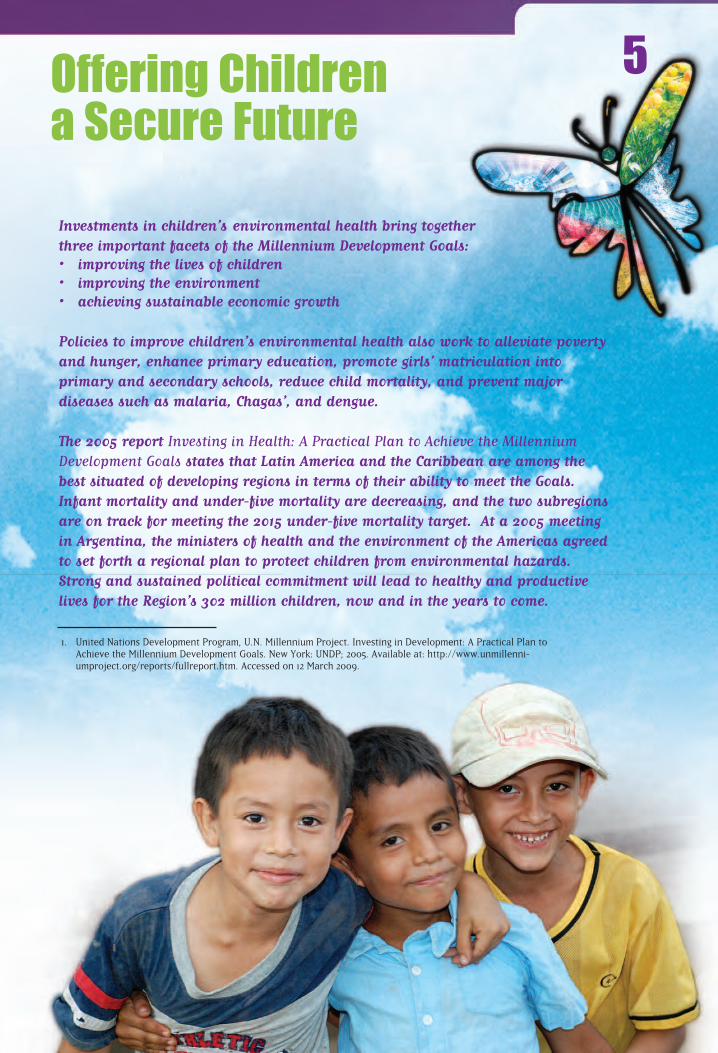
Offering Children a Secure Future
5
Investments in children’s environmental health bring togetherthree important facets of the Millennium Development Goals: • improving the lives of children• improving the environment• achieving sustainable economic growth
Policies to improve children’s environmental health also work to alleviate povertyand hunger, enhance primary education, promote girls’ matriculation into primary and secondary schools, reduce child mortality, and prevent major diseases such as malaria, Chagas’, and dengue.
The 2005 report Investing in Health: A Practical Plan to Achieve the MillenniumDevelopment Goals states that Latin America and the Caribbean are among thebest situated of developing regions in terms of their ability to meet the Goals.Infant mortality and under-five mortality are decreasing, and the two subregionsare on track for meeting the 2015 under-five mortality target. At a 2005 meetingin Argentina, the ministers of health and the environment of the Americas agreedto set forth a regional plan to protect children from environmental hazards.Strong and sustained political commitment will lead to healthy and productivelives for the Region’s 302 million children, now and in the years to come.
1. United Nations Development Program, U.N. Millennium Project. Investing in Development: A Practical Plan toAchieve the Millennium Development Goals. New York: UNDP; 2005. Available at: http://www.unmillenni-umproject.org/reports/fullreport.htm. Accessed on 12 March 2009.
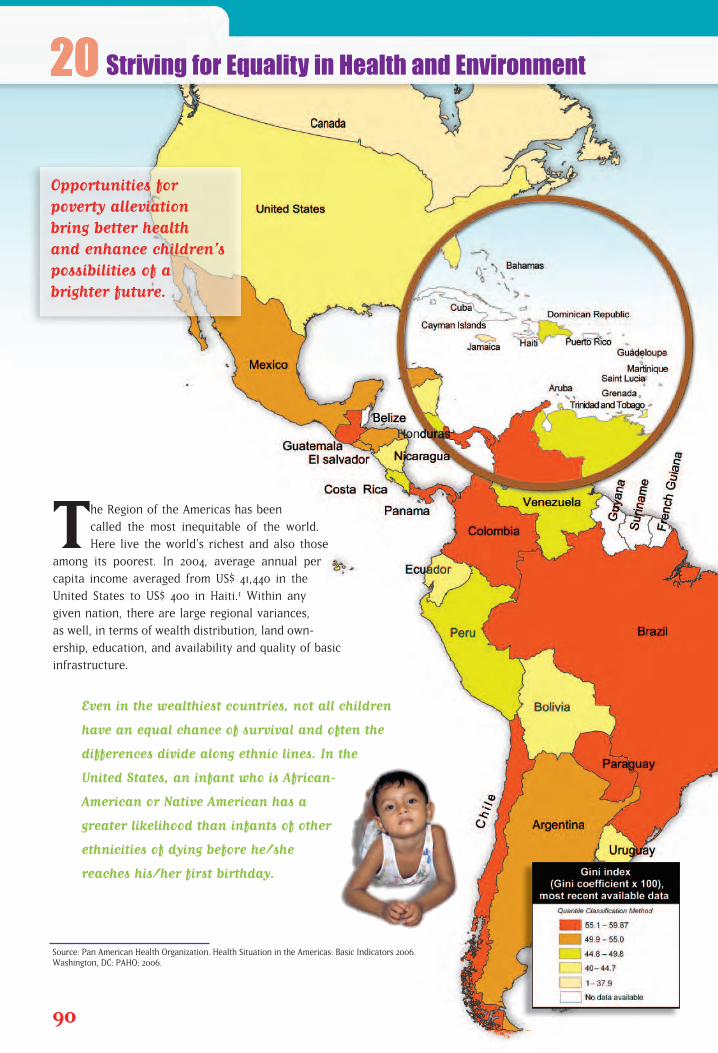
The Region of the Americas has been
called the most inequitable of the world.
Here live the world’s richest and also those
among its poorest. In 2004, average annual per
capita income averaged from US$ 41,440 in the
United States to US$ 400 in Haiti.1 Within any
given nation, there are large regional variances,
as well, in terms of wealth distribution, land own-
ership, education, and availability and quality of basic
infrastructure.
Even in the wealthiest countries, not all children
have an equal chance of survival and often the
differences divide along ethnic lines. In the
United States, an infant who is African-
American or Native American has a
greater likelihood than infants of other
ethnicities of dying before he/she
reaches his/her first birthday.
90
Source: Pan American Health Organization. Health Situation in the Americas: Basic Indicators 2006. Washington, DC: PAHO; 2006.
Striving for Equality in Health and Environment
Opportunities for poverty alleviationbring better health and enhance children’s possibilities of abrighter future.
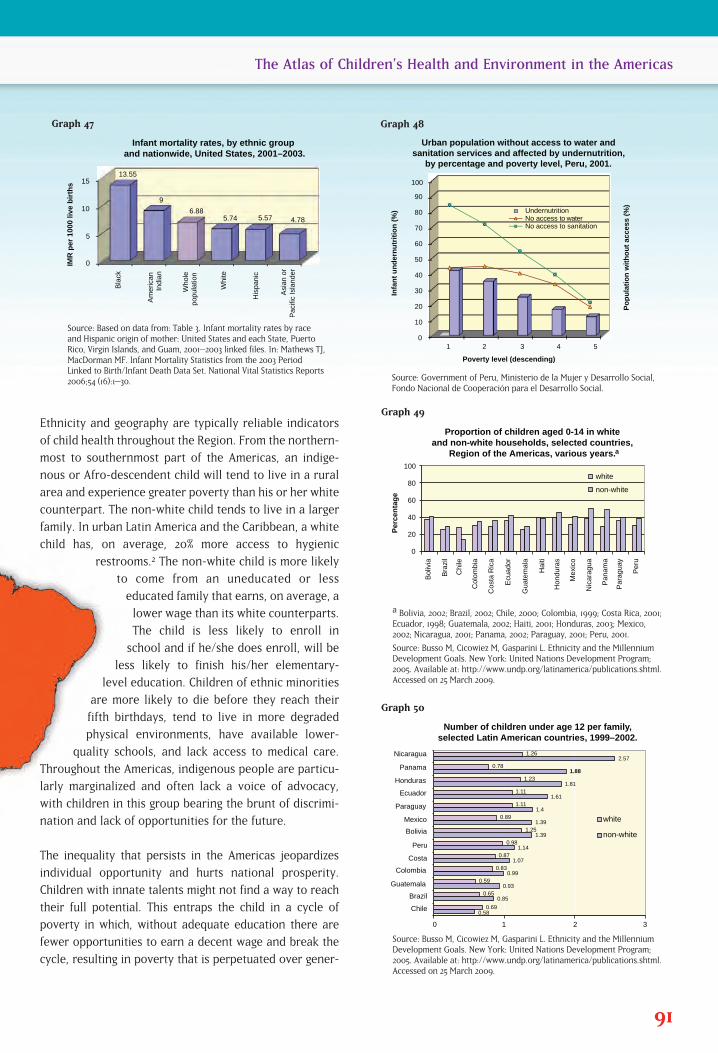
Ethnicity and geography are typically reliable indicators
of child health throughout the Region. From the northern-
most to southernmost part of the Americas, an indige-
nous or Afro-descendent child will tend to live in a rural
area and experience greater poverty than his or her white
counterpart. The non-white child tends to live in a larger
family. In urban Latin America and the Caribbean, a white
child has, on average, 20% more access to hygienic
restrooms.2 The non-white child is more likely
to come from an uneducated or less
educated family that earns, on average, a
lower wage than its white counterparts.
The child is less likely to enroll in
school and if he/she does enroll, will be
less likely to finish his/her elementary-
level education. Children of ethnic minorities
are more likely to die before they reach their
fifth birthdays, tend to live in more degraded
physical environments, have available lower-
quality schools, and lack access to medical care.
Throughout the Americas, indigenous people are particu-
larly marginalized and often lack a voice of advocacy,
with children in this group bearing the brunt of discrimi-
nation and lack of opportunities for the future.
The inequality that persists in the Americas jeopardizes
individual opportunity and hurts national prosperity.
Children with innate talents might not find a way to reach
their full potential. This entraps the child in a cycle of
poverty in which, without adequate education there are
fewer opportunities to earn a decent wage and break the
cycle, resulting in poverty that is perpetuated over gener-
91
The Atlas of Children’s Health and Environment in the Americas
Bla
ck
Am
eric
an
Indi
an
W
hole
po
pula
tion
Whi
te
His
pani
c
A
sian
or
Pac
ific
Isla
nder
IMR
per
100
0 liv
e b
irth
s
0
5
10
15
Infant mortality rates, by ethnic group and nationwide, United States, 2001–2003.
13.55
9
6.88 5.74 5.57 4.78
0
10
20
30
40
50
60
70
80
90
100
1 2 3 4 5
Po
pu
lati
on
wit
ho
ut
acce
ss (
%)
Infa
nt
un
der
nu
trit
ion
(%
)
Poverty level (descending)
Urban population without access to water and sanitation services and affected by undernutrition,
by percentage and poverty level, Peru, 2001.
Undernutrition No access to waterNo access to sanitation
Source: Based on data from: Table 3. Infant mortality rates by raceand Hispanic origin of mother: United States and each State, PuertoRico, Virgin Islands, and Guam, 2001–2003 linked files. In: Mathews TJ,MacDorman MF. Infant Mortality Statistics from the 2003 PeriodLinked to Birth/Infant Death Data Set. National Vital Statistics Reports2006;54 (16):1–30.
0
20
40
60
80
100
Bol
ivia
Bra
zil
Chi
le
Col
ombi
a
Cos
ta R
ica
Ecu
ador
Gua
tem
ala
Hai
ti
Hon
dura
s
Mex
ico
Nic
arag
ua
Pan
ama
Par
agua
y
Per
u
Per
cen
tag
e
white
non-white
Proportion of children aged 0-14 in white and non-white households, selected countries,
Region of the Americas, various years. a
Graph 47
Source: Government of Peru, Ministerio de la Mujer y Desarrollo Social,Fondo Nacional de Cooperación para el Desarrollo Social.
Graph 48
a Bolivia, 2002; Brazil, 2002; Chile, 2000; Colombia, 1999; Costa Rica, 2001;Ecuador, 1998; Guatemala, 2002; Haiti, 2001; Honduras, 2003; Mexico,2002; Nicaragua, 2001; Panama, 2002; Paraguay, 2001; Peru, 2001.
Source: Busso M, Cicowiez M, Gasparini L. Ethnicity and the MillenniumDevelopment Goals. New York: United Nations Development Program;2005. Available at: http://www.undp.org/latinamerica/publications.shtml.Accessed on 25 March 2009.
Graph 49
0 1 2 3
Chile
Brazil
Guatemala
Colombia
Costa
Peru
Bolivia
Mexico
Paraguay
Ecuador
Honduras
Panama
Nicaragua
Number of children under age 12 per family, selected Latin American countries, 1999–2002.
0.58
0.85
0.93
0.99
1.07
1.14
1.39
1.39
1.4
1.61
1.81
1.88
2.57
0.69
0.65
0.59
0.83
0.87
0.98
1.25
0.89
1.11
1.11
1.23
0.78
1.26
white
non-white
Source: Busso M, Cicowiez M, Gasparini L. Ethnicity and the MillenniumDevelopment Goals. New York: United Nations Development Program;2005. Available at: http://www.undp.org/latinamerica/publications.shtml.Accessed on 25 March 2009.
Graph 50
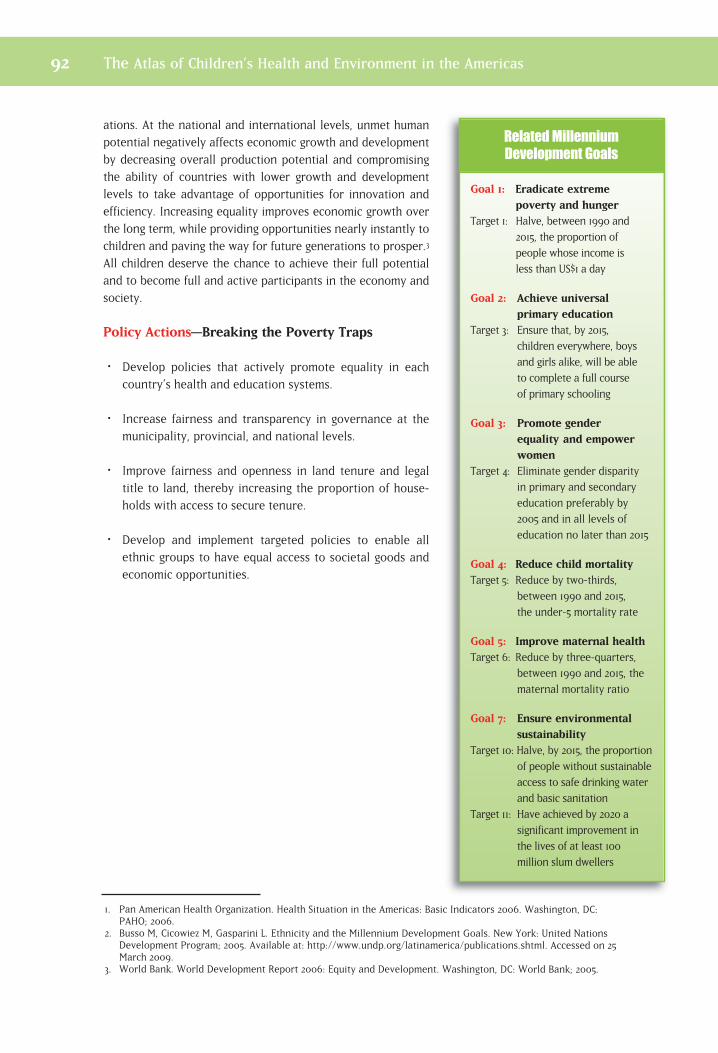
ations. At the national and international levels, unmet humanpotential negatively affects economic growth and developmentby decreasing overall production potential and compromisingthe ability of countries with lower growth and development levels to take advantage of opportunities for innovation andefficiency. Increasing equality improves economic growth overthe long term, while providing opportunities nearly instantly tochildren and paving the way for future generations to prosper.3
All children deserve the chance to achieve their full potentialand to become full and active participants in the economy andsociety.
Policy Actions—Breaking the Poverty Traps
�• Develop policies that actively promote equality in eachcountry’s health and education systems.
�• Increase fairness and transparency in governance at themunicipality, provincial, and national levels.
�• Improve fairness and openness in land tenure and legaltitle to land, thereby increasing the proportion of house-holds with access to secure tenure.
�• Develop and implement targeted policies to enable all ethnic groups to have equal access to societal goods andeconomic opportunities.
1. Pan American Health Organization. Health Situation in the Americas: Basic Indicators 2006. Washington, DC:PAHO; 2006.
2. Busso M, Cicowiez M, Gasparini L. Ethnicity and the Millennium Development Goals. New York: United NationsDevelopment Program; 2005. Available at: http://www.undp.org/latinamerica/publications.shtml. Accessed on 25March 2009.
3. World Bank. World Development Report 2006: Equity and Development. Washington, DC: World Bank; 2005.
92 The Atlas of Children’s Health and Environment in the Americas
Goal 1: Eradicate extremepoverty and hunger
Target 1: Halve, between 1990 and
2015, the proportion of
people whose income is
less than US$1 a day
Goal 2: Achieve universal primary education
Target 3: Ensure that, by 2015,
children everywhere, boys
and girls alike, will be able
to complete a full course
of primary schooling
Goal 3: Promote gender equality and empowerwomen
Target 4: Eliminate gender disparity
in primary and secondary
education preferably by
2005 and in all levels of
education no later than 2015
Goal 4: Reduce child mortalityTarget 5: Reduce by two-thirds,
between 1990 and 2015,
the under-5 mortality rate
Goal 5: Improve maternal healthTarget 6: Reduce by three-quarters,
between 1990 and 2015, the
maternal mortality ratio
Goal 7: Ensure environmentalsustainability
Target 10: Halve, by 2015, the proportion
of people without sustainable
access to safe drinking water
and basic sanitation
Target 11: Have achieved by 2020 a
significant improvement in
the lives of at least 100
million slum dwellers
Related Millennium
Development Goals
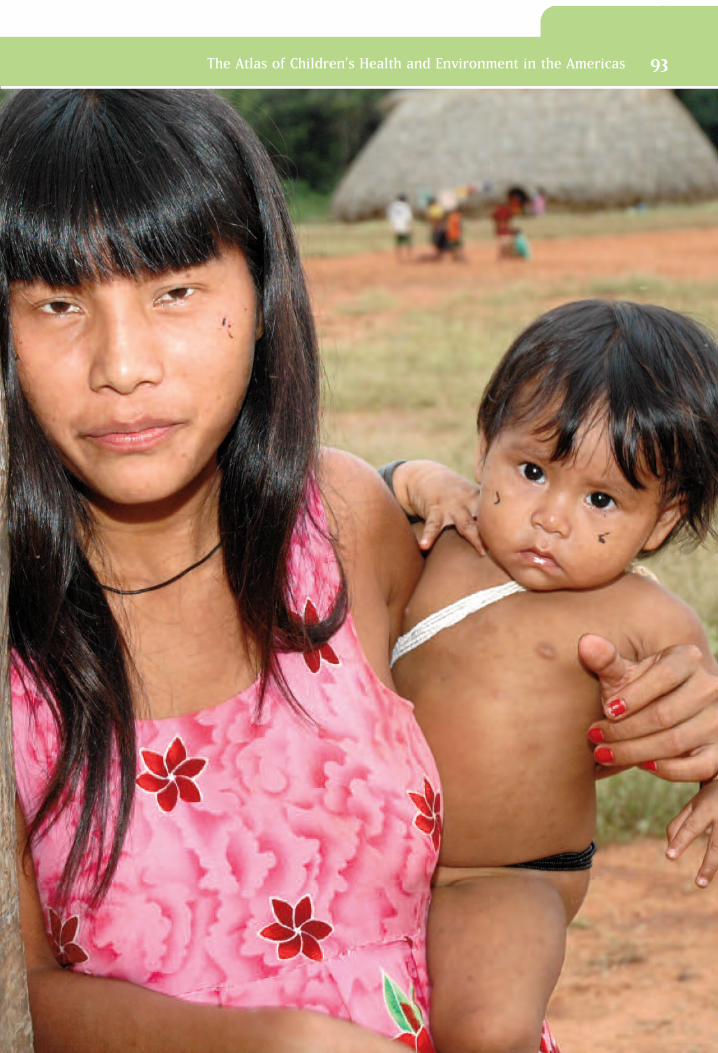
The Atlas of Children’s Health and Environment in the Americas 93