
Towards a minimum data set to assess soil organic matter quality in agricultural soils
Upload
independentCategory
view
0download
0
TECHNICAL ADVANCE
The AtGenExpress hormone and chemical treatment dataset: experimental design, data evaluation, model dataanalysis and data access
Hideki Goda1,†, Eriko Sasaki1,†, Kenji Akiyama1, Akiko Maruyama-Nakashita1, Kazumi Nakabayashi1, Weiqiang Li1, Mikihiro
Ogawa1, Yukika Yamauchi1, Jeremy Preston1, Ko Aoki1, Takatoshi Kiba2, Suguru Takatsuto3, Shozo Fujioka4, Tadao Asami5,
Takeshi Nakano4, Hisashi Kato1, Takeshi Mizuno2, Hitoshi Sakakibara1, Shinjiro Yamaguchi1, Eiji Nambara1, Yuji Kamiya1,
Hideki Takahashi1, Masami Yokota Hirai1, Tetsuya Sakurai1, Kazuo Shinozaki1, Kazuki Saito1, Shigeo Yoshida1 and
Yukihisa Shimada1,*
1RIKEN Plant Science Center, Tsurumi, Yokohama, Kanagawa 230-0045, Japan,2Laboratory of Molecular Microbiology, School of Agriculture, Nagoya University, Furocho, Chikusa-ku, Nagoya 464-8601, Japan,3Department of Chemistry, Joetsu University of Education, Joetsu-shi, Niigata 943-8512, Japan,4RIKEN Discovery Research Institute, Wako, Saitama 351-0198, Japan, and5Department of Applied Biological Chemistry, Graduate School of Agricultural and Life Sciences, The University of Tokyo, Yayoi,
Bunkyo-ku, Tokyo 113-8657, Japan
Received 22 February 2008; accepted 20 March 2008; published online 21 May 2008.
*For correspondence (fax +81 45 503 9492; e-mail [email protected]).†These authors contributed equally to this work.
Summary
We analyzed global gene expression in Arabidopsis in response to various hormones and in related
experiments as part of the AtGenExpress project. The experimental agents included seven basic phytohor-
mones (auxin, cytokinin, gibberellin, brassinosteroid, abscisic acid, jasmonate and ethylene) and their
inhibitors. In addition, gene expression was investigated in hormone-related mutants and during seed
germination and sulfate starvation. Hormone-inducible genes were identified from the hormone response data.
The effects of each hormone and the relevance of the gene lists were verified by comparing expression profiles
for the hormone treatments and related experiments using Pearson’s correlation coefficient. This approach was
also used to analyze the relationships among expression profiles for hormone responses and those included in
the AtGenExpress stress-response data set. The expected correlations were observed, indicating that this
approach is useful to monitor the hormonal status in the stress-related samples. Global interactions among
hormones-inducible genes were analyzed in a pairwise fashion, and several known and novel hormone
interactions were detected. Genome-wide transcriptional gene-to-gene correlations, analyzed by hierarchical
cluster analysis (HCA), indicated that our data set is useful for identification of clusters of co-expressed genes,
and to predict the functions of unknown genes, even if a gene’s function is not directly related to the
experiments included in AtGenExpress. Our data are available online from AtGenExpressJapan; the results of
genome-wide HCA are available from PRIMe. The data set presented here will be a versatile resource for future
hormone studies, and constitutes a reference for genome-wide gene expression in Arabidopsis.
Keywords: chemical genomics, phytohormone network analysis, co-expression network analysis, systems
biology, AtGenExpress.
Introduction
The sequencing of the Arabidopsis genome (Arabidopsis
Genome Initiative, 2000) is the first step toward under-
standing its function. Genomic sequencing and the collec-
tion of large numbers of cDNAs have enabled researchers to
predict genome-wide genetic structure and to design DNA
microarrays to monitor genome-wide gene expression. The
526 ª 2008 The AuthorsJournal compilation ª 2008 Blackwell Publishing Ltd
The Plant Journal (2008) 55, 526–542 doi: 10.1111/j.1365-313X.2008.03510.x
Affymetrix ATH1 array, an oligonucleotide-based DNA
microarray consisting of 22 746 probe sets that cover
approximately 23 700 genes (nearly the entire Arabidopsis
genome) was designed based on computer-predicted genes
(Redman et al., 2004). This system has been widely accepted
by the plant science community because of its high sensi-
tivity and reproducibility. Using this system, an international
research effort, the AtGenExpress consortium, was orga-
nized to enhance the knowledge of gene function in Ara-
bidopsis. Large-scale transcriptome data sets developed by
the AtGenExpress consortium have already detailed the
developmental process (Schmid et al., 2005) and stress
responses (Kilian et al., 2007) in Arabidopsis. Here, we
present a hormone-response data set based on treatment
with phytohormones and hormone-related inhibitors, and
analysis of hormone-related mutants, seed germination and
sulfate starvation.
Seven major plant hormones play central roles in the
regulation of plant growth, development and the stress
response: auxin, cytokinin (CK), gibberellin (GA), brassi-
nosteroid (BR), abscisic acid (ABA), jasmonate (JA) and
ethylene. Numerous studies have investigated the func-
tions of each hormone at the physiological and molecular
levels; however, no study has considered all seven
hormones at the same time. We conducted a comprehen-
sive analysis of the plant responses to all seven phyto-
hormones using defined conditions. Our results will
enable members of the plant science community to
compare hormonal effects and to study the complex
interactions among hormone networks. In fact, the data
presented here have already been used to analyze
hormone-induced expression profiles (Nemhauser et al.,
2006). We describe our experimental design and data
validation method, how to access the data, and the results
of a model analysis. In the model analysis, interactions
among hormone-inducible genes were analyzed in a
pairwise manner with respect to their time dependence
and direction (up or down). We also demonstrate that the
hormone-inducible genes of this data set may be used to
monitor hormone status in an experiment performed
using the ATH1 GeneChip.
Together with the other contributions from the AtGen-
Express project, our data set forms a large-scale tran-
scriptome database. One purpose of this study was to
establish a comprehensive database to facilitate searching
for gene expression patterns; however, another and more
ambitious motivation was to analyze genome-wide
co-expression in Arabidopsis so that the functions of
unknown genes can be predicted based on similarities
between their expression patterns and those of known
genes. Thus, we performed a genome-wide co-expression
analysis using HCA (Eisen et al., 1998) of data from the
AtGenExpress project to demonstrate the usefulness of
large-scale transcriptome data sets.
Results and discussion
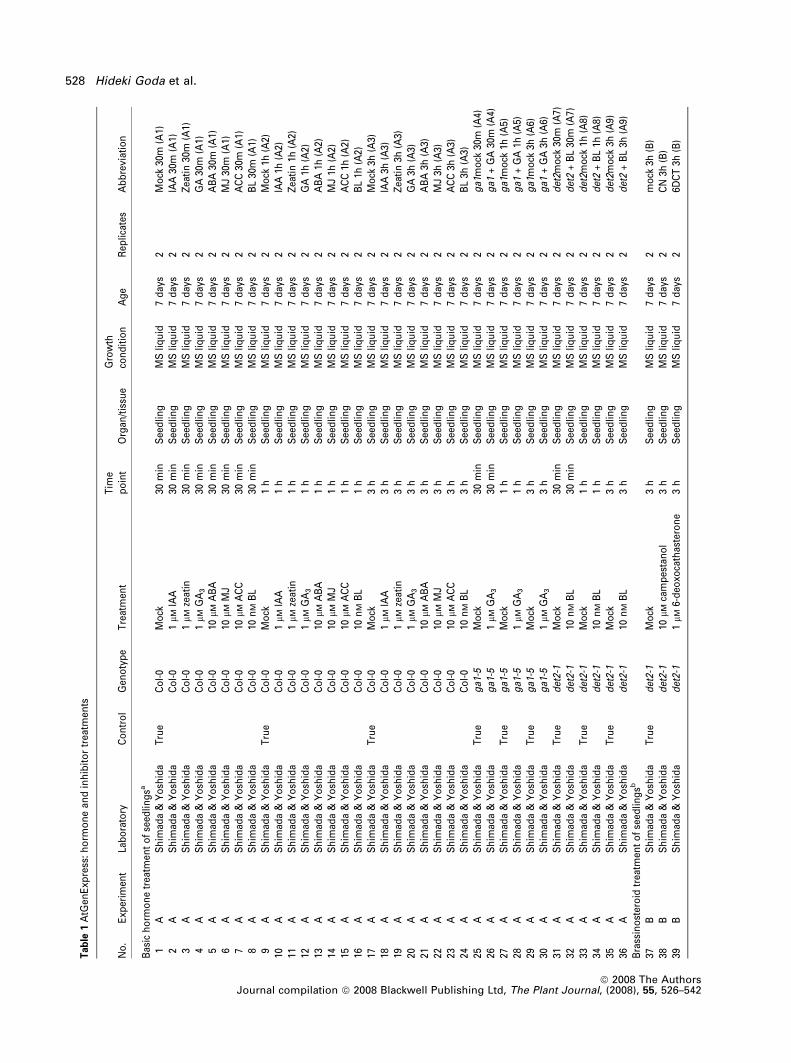
Experimental design and data overview
The AtGenExpress data set presented here (referred to
hereafter as the hormone series) includes treatment with
seven phytohormones, their inhibitors, hormone-related
mutants, and abiotic treatments, including seed imbibition
and sulfate starvation. The data were collected in five labo-
ratories at the RIKEN Plant Science Center and by colleagues
outside RIKEN. All hormones and inhibitors used are sum-
marized in Table 1. Seven hormones were applied to wild-
type seedlings. Indole-3-acetic acid (IAA) was used as auxin,
trans-zeatin was used as cytokinin, and 1-aminocycropro-
pane-1-carboxylic acid (ACC) was used in place of ethylene,
unless otherwise noted. In addition to the experiments on
wild-type seedlings, CK was applied to an ARR22-overex-
pressing line (Kiba et al., 2004), GA3 was applied to GA-defi-
cient ga1-5 seedlings, and GA4 was applied to ga1-3 seeds
(Koornneef and Van Der Veen, 1980). In addition, ABA was
applied to germinating wild-type seeds, and brassinolide (BL)
was applied to BR-deficient det2-1 seedlings (Li et al., 1996);
BR precursors were also applied to det2 seedlings. Moreover,
wild-type seedlings were exposed to inhibitors of GA, BR,
auxin and ethylene, other plant growth inhibitors, as well as
to salicylic acid (Table 1). BR-, GA-, and CK-related mutants
were also analyzed (Table 2). Germination was analyzed
using imbibed seeds to study hormonal function at this
developmental stage (Table 3). The effect of temperature on
seed germination was also assessed (Table 4). Seedlings
were transferred to sulfate-deficient medium to test sulfate-
regulated gene expression (Table 4). Each experiment was
performed twice or three times as biological replicates.
The number of detected genes (defined by detection
P < 0.05) ranged from 51 to 72% of total genes in all
experiments (Figure S1). Dry seeds and germinating seeds
expressed smaller numbers of genes compared to the other
samples. The total numbers of detected genes were com-
pared among the three major experiments conducted by
AtGenExpress: the development, stress and hormone series.
As shown in Figure 1, 21 095 genes were detected from 236
GeneChips in the hormone series, compared with 20 499
genes from 250 GeneChips in the stress series (Kilian et al.,
2007) and 21 268 genes from 237 GeneChips in the develop-
ment series (Schmid et al., 2005). In total, 476 genes were
unique to the development data set, 121 were unique to the
stress data set, and 359 genes were unique to the hormone
series. Newly detected genes from our data set are listed in
Table S1.
Hormone-inducible genes and hormone response validation
The effects of each hormone were confirmed using the
marker genes listed in Table 5. Each marker gene was up or
AtGenExpress hormone data 527
ª 2008 The AuthorsJournal compilation ª 2008 Blackwell Publishing Ltd, The Plant Journal, (2008), 55, 526–542
Tab
le1
AtG
enE
xpre
ss:
ho
rmo
ne
and
inh
ibit
or
trea
tmen
ts
No
.E
xper
imen
tLa
bo
rato
ryC
on
tro
lG
eno
typ
eT
reat
men
tT
ime
po
int
Org
an/t
issu
eG
row
thco
nd
itio
nA
ge
Rep
licat
esA
bb
revi
atio
n
Bas
ich
orm
on
etr
eatm
ent
of
seed
ling
sa
1A
Sh
imad
a&
Yo
shid
aT
rue
Co
l-0
Mo
ck30
min
See
dlin
gM
Sliq
uid
7d
ays
2M
ock
30m
(A1)
2A
Sh
imad
a&
Yo
shid
aC
ol-
01
lMIA
A30
min
See
dlin
gM
Sliq
uid
7d
ays
2IA
A30
m(A
1)3
AS
him
ada
&Y
osh
ida
Co
l-0
1l M
zeat
in30
min
See
dlin
gM
Sliq
uid
7d
ays
2Z
eati
n30
m(A
1)4
AS
him
ada
&Y
osh
ida
Co
l-0
1l M
GA
330
min
See
dlin
gM
Sliq
uid
7d
ays
2G
A30
m(A
1)5
AS
him
ada
&Y
osh
ida
Co
l-0
10lM
AB
A30
min
See
dlin
gM
Sliq
uid
7d
ays
2A
BA
30m
(A1)
6A
Sh
imad
a&
Yo
shid
aC
ol-
010
l MM
J30
min
See
dlin
gM
Sliq
uid
7d
ays
2M
J30
m(A
1)7
AS
him
ada
&Y
osh
ida
Co
l-0
10l M
AC
C30
min
See
dlin
gM
Sliq
uid
7d
ays
2A
CC
30m
(A1)
8A
Sh
imad
a&
Yo
shid
aC
ol-
010
nM
BL
30m
inS
eed
ling
MS
liqu
id7
day
s2
BL
30m
(A1)
9A
Sh
imad
a&
Yo
shid
aT
rue
Co
l-0
Mo
ck1
hS
eed
ling
MS
liqu
id7
day
s2
Mo
ck1h
(A2)
10A
Sh
imad
a&
Yo
shid
aC
ol-
01
l MIA
A1
hS
eed
ling
MS
liqu
id7
day
s2
IAA
1h(A
2)11
AS
him
ada
&Y
osh
ida
Co
l-0
1l M
zeat
in1
hS
eed
ling
MS
liqu
id7
day
s2
Zea
tin
1h(A
2)12
AS
him
ada
&Y
osh
ida
Co
l-0
1lM
GA
31
hS
eed
ling
MS
liqu
id7
day
s2
GA
1h(A
2)13
AS
him
ada
&Y
osh
ida
Co
l-0
10l M
AB
A1
hS
eed
ling
MS
liqu
id7
day
s2
AB
A1h
(A2)
14A
Sh
imad
a&
Yo
shid
aC
ol-
010
l MM
J1
hS
eed
ling
MS
liqu
id7
day
s2
MJ
1h(A
2)15
AS
him
ada
&Y
osh
ida
Co
l-0
10lM
AC
C1
hS
eed
ling
MS
liqu
id7
day
s2
AC
C1h
(A2)
16A
Sh
imad
a&
Yo
shid
aC
ol-
010
nM
BL
1h
See
dlin
gM
Sliq
uid
7d
ays
2B
L1h
(A2)
17A
Sh
imad
a&
Yo
shid
aT
rue
Co
l-0
Mo
ck3
hS
eed
ling
MS
liqu
id7
day
s2
Mo
ck3h
(A3)
18A
Sh
imad
a&
Yo
shid
aC
ol-
01
lMIA
A3
hS
eed
ling
MS
liqu
id7
day
s2
IAA
3h(A
3)19
AS
him
ada
&Y
osh
ida
Co
l-0
1lM
zeat
in3
hS
eed
ling
MS
liqu
id7
day
s2
Zea
tin
3h(A
3)20
AS
him
ada
&Y
osh
ida
Co
l-0
1lM
GA
33
hS
eed
ling
MS
liqu
id7
day
s2
GA
3h(A
3)21
AS
him
ada
&Y
osh
ida
Co
l-0
10l M
AB
A3
hS
eed
ling
MS
liqu
id7
day
s2
AB
A3h
(A3)
22A
Sh
imad
a&
Yo
shid
aC
ol-
010
l MM
J3
hS
eed
ling
MS
liqu
id7
day
s2
MJ
3h(A
3)23
AS
him
ada
&Y
osh
ida
Co
l-0
10lM
AC
C3
hS
eed
ling
MS
liqu
id7
day
s2
AC
C3h
(A3)
24A
Sh
imad
a&
Yo
shid
aC
ol-
010
nM
BL
3h
See
dlin
gM
Sliq
uid
7d
ays
2B
L3h
(A3)
25A
Sh
imad
a&
Yo
shid
aT
rue
ga1
-5M
ock
30m
inS
eed
ling
MS
liqu
id7
day
s2
ga1
mo
ck30
m(A
4)26
AS
him
ada
&Y
osh
ida
ga1
-51
lMG
A3
30m
inS
eed
ling
MS
liqu
id7
day
s2
ga1
+G
A30
m(A
4)27
AS
him
ada
&Y
osh
ida
Tru
eg
a1-5
Mo
ck1
hS
eed
ling
MS
liqu
id7
day
s2
ga1
mo
ck1h
(A5)
28A
Sh
imad
a&
Yo
shid
ag
a1-5
1l M
GA
31
hS
eed
ling
MS
liqu
id7
day
s2
ga1
+G
A1h
(A5)
29A
Sh
imad
a&
Yo
shid
aT
rue
ga1
-5M
ock
3h
See
dlin
gM
Sliq
uid
7d
ays
2g
a1m
ock
3h(A
6)30
AS
him
ada
&Y
osh
ida
ga1
-51
lMG
A3
3h
See
dlin
gM
Sliq
uid
7d
ays
2g
a1+
GA
3h(A
6)31
AS
him
ada
&Y
osh
ida
Tru
ed
et2-
1M
ock
30m
inS
eed
ling
MS
liqu
id7
day
s2
det
2mo
ck30
m(A
7)32
AS
him
ada
&Y
osh
ida
det
2-1
10n
MB
L30
min
See
dlin
gM
Sliq
uid
7d
ays
2d
et2
+B
L30
m(A
7)33
AS
him
ada
&Y
osh
ida
Tru
ed
et2-
1M
ock
1h
See
dlin
gM
Sliq
uid
7d
ays
2d
et2m
ock
1h(A
8)34
AS
him
ada
&Y
osh
ida
det
2-1
10n
MB
L1
hS
eed
ling
MS
liqu
id7
day
s2
det
2+
BL
1h(A
8)35
AS
him
ada
&Y
osh
ida
Tru
ed
et2-
1M
ock
3h
See
dlin
gM
Sliq
uid
7d
ays
2d
et2m
ock
3h(A
9)36
AS
him
ada
&Y
osh
ida
det
2-1
10n
MB
L3
hS
eed
ling
MS
liqu
id7
day
s2
det
2+
BL
3h(A
9)B
rass
ino
ster
oid
trea
tmen
to
fse
edlin
gsb
37B
Sh
imad
a&
Yo
shid
aT
rue
det
2-1
Mo
ck3
hS
eed
ling
MS
liqu
id7
day
s2
mo
ck3h
(B)
38B
Sh
imad
a&
Yo
shid
ad
et2-
110
lMca
mp
esta
no
l3
hS
eed
ling
MS
liqu
id7
day
s2
CN
3h(B
)39
BS
him
ada
&Y
osh
ida
det
2-1
1l M
6-d
eoxo
cath
aste
ron
e3
hS
eed
ling
MS
liqu
id7
day
s2
6DC
T3h
(B)
528 Hideki Goda et al.
ª 2008 The AuthorsJournal compilation ª 2008 Blackwell Publishing Ltd, The Plant Journal, (2008), 55, 526–542
Tab
le1
(Co
nti
nu
ed)
No
.E
xper
imen
tLa
bo
rato
ryC
on
tro
lG
eno
typ
eT
reat
men
tT
ime
po
int
Org
an/t
issu
eG
row
thco
nd
itio
nA
ge
Rep
licat
esA
bb
revi
atio
n
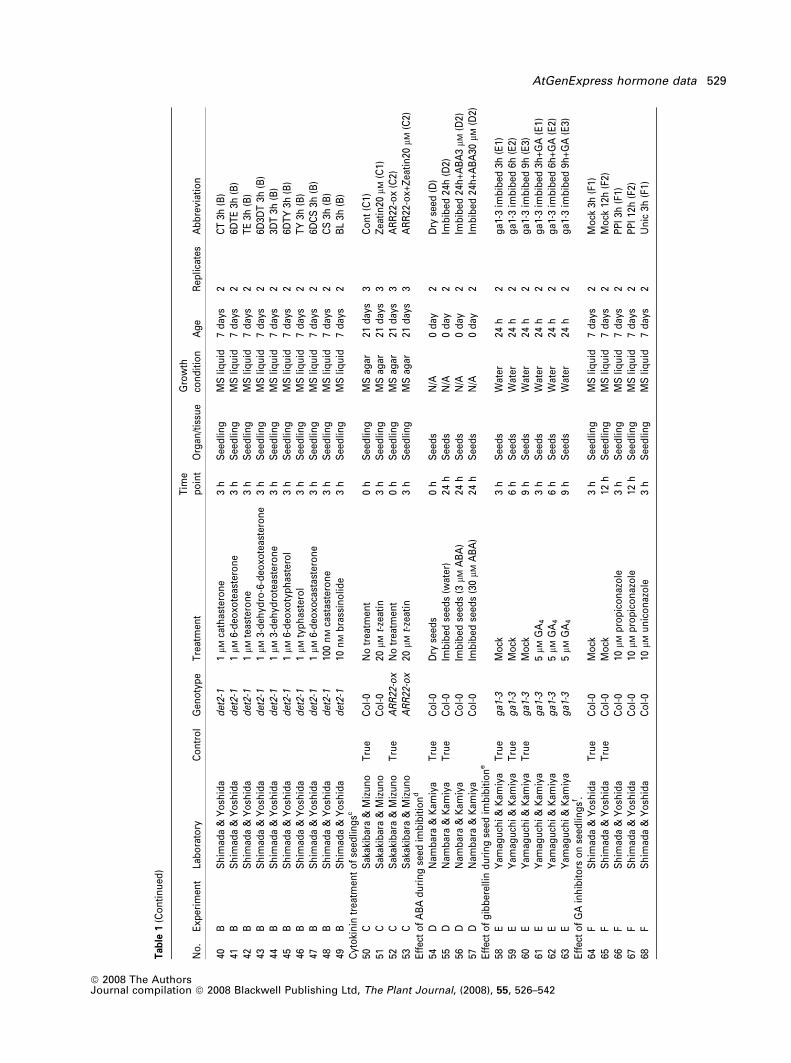
40B
Sh
imad
a&
Yo
shid
ad
et2-
11
lMca
thas
tero
ne
3h
See
dlin
gM
Sliq
uid
7d
ays
2C
T3h
(B)
41B
Sh
imad
a&
Yo
shid
ad
et2-
11
lM6-
deo
xote
aste
ron
e3
hS
eed
ling
MS
liqu
id7
day
s2
6DT
E3h
(B)
42B
Sh
imad
a&
Yo
shid
ad
et2-
11
lMte
aste
ron
e3
hS
eed
ling
MS
liqu
id7
day
s2
TE
3h(B
)43
BS
him
ada
&Y
osh
ida
det
2-1
1l M
3-d
ehyd
ro-6
-deo
xote
aste
ron
e3
hS
eed
ling
MS
liqu
id7
day
s2
6D3D
T3h
(B)
44B
Sh
imad
a&
Yo
shid
ad
et2-
11
l M3-
deh
ydro
teas
tero
ne
3h
See
dlin
gM
Sliq
uid
7d
ays
23D
T3h
(B)
45B
Sh
imad
a&
Yo
shid
ad
et2-
11
l M6-
deo
xoty
ph
aste
rol
3h
See
dlin
gM
Sliq
uid
7d
ays
26D
TY
3h(B
)46
BS
him
ada
&Y
osh
ida
det
2-1
1lM
typ
has
tero
l3
hS
eed
ling
MS
liqu
id7
day
s2
TY
3h(B
)47
BS
him
ada
&Y
osh
ida
det
2-1
1l M
6-d
eoxo
cast
aste
ron
e3
hS
eed
ling
MS
liqu
id7
day
s2
6DC
S3h
(B)
48B
Sh
imad
a&
Yo
shid
ad
et2-
110
0n
Mca
stas
tero
ne
3h
See
dlin
gM
Sliq
uid
7d
ays
2C
S3h
(B)
49B
Sh
imad
a&
Yo
shid
ad
et2-
110
nM
bra
ssin
olid
e3
hS
eed
ling
MS
liqu
id7
day
s2
BL
3h(B
)C
yto
kin
intr
eatm
ent
of
seed
ling
sc
50C
Sak
akib
ara
&M
izu
no
Tru
eC
ol-
0N
otr
eatm
ent
0h
See
dlin
gM
Sag
ar21
day
s3
Co
nt
(C1)
51C
Sak
akib
ara
&M
izu
no
Co
l-0
20lM
t-ze
atin
3h
See
dlin
gM
Sag
ar21
day
s3
Zea
tin
20lM
(C1)
52C
Sak
akib
ara
&M
izu
no
Tru
eA
RR
22-o
xN
otr
eatm
ent
0h
See
dlin
gM
Sag
ar21
day
s3
AR
R22
-ox
(C2)
53C
Sak
akib
ara
&M
izu
no
AR
R22
-ox
20lM
t-ze
atin
3h
See
dlin
gM
Sag
ar21
day
s3
AR
R22
-ox+
Zea
tin
20lM
(C2)
Eff
ect
of
AB
Ad
uri
ng
seed
imb
ibit
ion
d
54D
Nam
bar
a&
Kam
iya
Tru
eC
ol-
0D
ryse
eds
0h
See
ds
N/A
0d
ay2
Dry
seed
(D)
55D
Nam
bar
a&
Kam
iya
Tru
eC
ol-
0Im
bib
edse
eds
(wat
er)
24h
See
ds
N/A
0d
ay2
Imb
ibed
24h
(D2)
56D
Nam
bar
a&
Kam
iya
Co
l-0
Imb
ibed
seed
s(3
lMA
BA
)24
hS
eed
sN
/A0
day
2Im
bib
ed24
h+
AB
A3
lM(D
2)57
DN
amb
ara
&K
amiy
aC
ol-
0Im
bib
edse
eds
(30
l MA
BA
)24
hS
eed
sN
/A0
day
2Im
bib
ed24
h+
AB
A30
lM(D
2)E
ffec
to
fg
ibb
erel
lind
uri
ng
seed
imb
ibit
ion
e
58E
Yam
agu
chi
&K
amiy
aT
rue
ga1
-3M
ock
3h
See
ds
Wat
er24
h2
ga1
-3im
bib
ed3h
(E1)
59E
Yam
agu
chi
&K
amiy
aT
rue
ga1
-3M
ock
6h
See
ds
Wat
er24
h2
ga1
-3im
bib
ed6h
(E2)
60E
Yam
agu
chi
&K
amiy
aT
rue
ga1
-3M
ock
9h
See
ds
Wat
er24
h2
ga1
-3im
bib
ed9h
(E3)
61E
Yam
agu
chi
&K
amiy
ag
a1-3
5l M
GA
43
hS
eed
sW
ater
24h
2g
a1-3
imb
ibed
3h+
GA
(E1)
62E
Yam
agu
chi
&K
amiy
ag
a1-3
5l M
GA
46
hS
eed
sW
ater
24h
2g
a1-3
imb
ibed
6h+
GA
(E2)
63E
Yam
agu
chi
&K
amiy
ag
a1-3
5l M
GA
49
hS
eed
sW
ater
24h
2g
a1-3
imb
ibed
9h+
GA
(E3)
Eff
ect
of
GA
inh
ibit
ors
on
seed
ling
sf .64
FS
him
ada
&Y
osh
ida
Tru
eC
ol-
0M
ock
3h
See
dlin
gM
Sliq
uid
7d
ays
2M
ock
3h(F
1)65
FS
him
ada
&Y
osh
ida
Tru
eC
ol-
0M
ock
12h
See
dlin
gM
Sliq
uid
7d
ays
2M
ock
12h
(F2)
66F
Sh
imad
a&
Yo
shid
aC
ol-
010
l Mp
rop
ico
naz
ole
3h
See
dlin
gM
Sliq
uid
7d
ays
2P
PI
3h(F
1)67
FS
him
ada
&Y
osh
ida
Co
l-0
10lM
pro
pic
on
azo
le12
hS
eed
ling
MS
liqu
id7
day
s2
PP
I12
h(F
2)68
FS
him
ada
&Y
osh
ida
Co
l-0
10l M
un
ico
naz
ole
3h
See
dlin
gM
Sliq
uid
7d
ays
2U
nic
3h(F
1)
AtGenExpress hormone data 529
ª 2008 The AuthorsJournal compilation ª 2008 Blackwell Publishing Ltd, The Plant Journal, (2008), 55, 526–542

Tab
le1
(Co
nti
nu
ed)
No
.E
xper
imen
tLa
bo
rato
ryC
on
tro
lG
eno
typ
eT
reat
men
tT
ime
po
int
Org
an/t
issu
eG
row
thco
nd
itio
nA
ge
Rep
licat
esA
bb
revi
atio
n
69F
Sh
imad
a&
Yo
shid
aC
ol-
010
lMu
nic
on
azo
le12
hS
eed
ling
MS
liqu
id7
day
s2
Un
ic12
h(F
2)70
FS
him
ada
&Y
osh
ida
Co
l-0
10lM
pac
lob
utr
azo
l3
hS
eed
ling
MS
liqu
id7
day
s2
Pac
3h(F
1)71
FS
him
ada
&Y
osh
ida
Co
l-0
10l M
pac
lob
utr
azo
l12
hS
eed
ling
MS
liqu
id7
day
s2
Pac
12h
(F2)
72F
Sh
imad
a&
Yo
shid
aC
ol-
010
lMp
roh
exad
ion
e3
hS
eed
ling
MS
liqu
id7
day
s2
PX
3h(F
1)73
FS
him
ada
&Y
osh
ida
Co
l-0
10l M
pro
hex
adio
ne
12h
See
dlin
gM
Sliq
uid
7d
ays
2P
X12
h(F
2)E
ffec
to
fau
xin
inh
ibit
ors
on
seed
ling
sg
74F
Sh
imad
a&
Yo
shid
aT
rue
Co
l-0
Mo
ck3
hS
eed
ling
MS
liqu
id7
day
s2
Mo
ck3h
(F1)
75F
Sh
imad
a&
Yo
shid
aC
ol-
010
l M2,
4,6T
3h
See
dlin
gM
Sliq
uid
7d
ays
224
6T3h
(F1)
76F
Sh
imad
a&
Yo
shid
aC
ol-
010
l MP
CIB
3h
See
dlin
gM
Sliq
uid
7d
ays
2P
CIB
3h(F
1)77
FS
him
ada
&Y
osh
ida
Co
l-0
10lM
TIB
A3
hS
eed
ling
MS
liqu
id7
day
s2
TIB
A3h
(F1)
78F
Sh
imad
a&
Yo
shid
aC
ol-
010
l MN
PA
3h
See
dlin
gM
Sliq
uid
7d
ays
2N
PA
3h(F
1)E
ffec
to
fb
rass
ino
ster
oid
inh
ibit
ors
on
seed
ling
sh
79F
Sh
imad
a&
Yo
shid
aT
rue
Co
l-0
Mo
ck3
hS
eed
ling
MS
liqu
id7
day
s2
Mo
ck3h
(F1)
80F
Sh
imad
a&
Yo
shid
aT
rue
Co
l-0
Mo
ck12
hS
eed
ling
MS
liqu
id7
day
s2
Mo
ck12
h(F
2)81
FS
him
ada
&Y
osh
ida
Co
l-0
10l M
Brz
220
3h
See
dlin
gM
Sliq
uid
7d
ays
2B
rz22
010
lM3h
(F1)
82F
Sh
imad
a&
Yo
shid
aC
ol-
010
l MB
rz22
012
hS
eed
ling
MS
liqu
id7
day
s2
Brz
220
10lM
12h
(F2)
83F
Sh
imad
a&
Yo
shid
aC
ol-
010
lMB
rz91
3h
See
dlin
gM
Sliq
uid
7d
ays
2B
rz91
3h(F
1)84
FS
him
ada
&Y
osh
ida
Co
l-0
10l M
Brz
9112
hS
eed
ling
MS
liqu
id7
day
s2
Brz
9112
h(F
2)85
GS
him
ada
&Y
osh
ida
Tru
eC
ol-
0M
ock
3h
See
dlin
gM
Sliq
uid
7d
ays
2M
ock
3h(G
)86
GS
him
ada
&Y
osh
ida
Co
l-0
3l M
Brz
220
3h
See
dlin
gM
Sliq
uid
7d
ays
2B
rz22
03
lM3h
(G)
Eff
ect
of
eth
ylen
ein
hib
ito
rso
nse
edlin
gsi .
87F
Sh
imad
a&
Yo
shid
aT
rue
Co
l-0
Mo
ck3
hS
eed
ling
MS
liqu
id7
day
s2
Mo
ck3h
(F1)
88F
Sh
imad
a&
Yo
shid
aC
ol-
010
l MA
gN
O3
3h
See
dlin
gM
Sliq
uid
7d
ays
2A
gN
O3
3h(F
1)89
FS
him
ada
&Y
osh
ida
Co
l-0
10l M
AV
G3
hS
eed
ling
MS
liqu
id7
day
s2
AV
G3h
(F1)
Eff
ect
of
oth
erin
hib
ito
rso
nse
edlin
gsj
90F
Sh
imad
a&
Yo
shid
aT
rue
Co
l-0
Mo
ck3
hS
eed
ling
MS
liqu
id7
day
s2
Mo
ck3h
(F1)
91F
Sh
imad
a&
Yo
shid
aC
ol-
010
lMC
HX
3h
See
dlin
gM
Sliq
uid
7d
ays
2C
HX
3h(F
1)92
FS
him
ada
&Y
osh
ida
Co
l-0
10lM
MG
132
3h
See
dlin
gM
Sliq
uid
7d
ays
2M
G13
23h
(F1)
93F
Sh
imad
a&
Yo
shid
aT
rue
Co
l-0
Mo
ck12
hS
eed
ling
MS
liqu
id7
day
s2
Mo
ck12
h(F
2)94
FS
him
ada
&Y
osh
ida
Co
l-0
1l M
PN
O8
3h
See
dlin
gM
Sliq
uid
7d
ays
2P
NO
81
lM3h
(F1)
95F
Sh
imad
a&
Yo
shid
aC
ol-
01
l MP
NO
812
hS
eed
ling
MS
liqu
id7
day
s2
PN
O8
1lM
12h
(F2)
96G
Sh
imad
a&
Yo
shid
aT
rue
Co
l-0
Mo
ck3
hS
eed
ling
MS
liqu
id7
day
s2
Mo
ck3h
(G)
97G
Sh
imad
a&
Yo
shid
aC
ol-
010
lMP
NO
83
hS
eed
ling
MS
liqu
id7
day
s2
PN
O8
10lM
3h(G
)98
FS
him
ada
&Y
osh
ida
Co
l-0
10l M
ibu
pro
fen
3h
See
dlin
gM
Sliq
uid
7d
ays
2Ib
up
3h(F
1)
530 Hideki Goda et al.
ª 2008 The AuthorsJournal compilation ª 2008 Blackwell Publishing Ltd, The Plant Journal, (2008), 55, 526–542
downregulated as reported in the studies cited for each
experiment. Differentially expressed genes between the
mock- and hormone-treated samples were identified as
hormone-inducible genes (see Experimental procedures for
details). Genes were first filtered by the detection P-value,
calculated using Affymetrix Microarray Suite software. Of
the 22 746 genes (probe sets) represented on the GeneChip,
18 775 passed this filtering. The signal intensities were then
analyzed by Welch’s t-test at each of three time points, and
further filtered based on the false discovery rate (FDR, q
value < 0.1; Storey and Tibshirani, 2003). The numbers of
hormone-inducible genes (at low stringency) are shown in
Table 6. Their probe ID, AGI code, P value, q value, signal
ratio, and annotation are shown in Table S2. ABA-inducible
genes formed the largest group. When GA or BR were
applied to wild-type seedlings, the gene expression
responses were smaller than in similarly treated GA- or
BR-deficient mutants (data not shown). This was probably
because the hormone levels or responses were saturated in
the wild-type plants. We therefore adopted the results for the
hormone-deficient mutants as the typical hormone response
(low-stringency lists, Table 6 and Table S2). These gene lists
were further used to analyze their overlap (Figure 5).
We assessed the relevance of the hormone responses and
hormone-inducible gene lists by comparing the results of
the hormone treatment experiments to those of additional
experiments or previous experiments using Pearson’s cor-
relation coefficient. In the BR experiment, we compared
BL-induced gene expression with that induced by a BR-bio-
synthesis inhibitor, brassinazole (Brz). The BR-deficient det2
mutant was treated with BL or given mock treatment for 3 h,
while wild-type seedlings were treated with Brz or given
mock treatment for 3 h. The resulting BL signal ratios (BL/
mock on the x axis) were compared with those of Brz (Brz/
mock on the y axis) for the BR-inducible genes listed in
Table S2. The correlation coefficient between the two
experiments was )0.58. Although a negative correlation
was observed, it was less significant than that observed in a
previous report ()0.79, Goda et al., 2002). Based on the FDR
q value threshold, we estimated that 10% of the identified
genes were false positives, which could create noise in the
Pearson’s correlation analysis. Thus, we optimized the
correlation coefficients by adjusting the threshold of gene
selection for each hormone (see Experimental procedures)
to further exclude false-positive genes. This made the
correlation coefficients more significant for each hormone
(Figure 2): )0.78 for BL versus Brz in the BR experiment (41
genes), )0.52 for GA versus prohexadione in the GA
experiment (49 genes), )0.86 for ACC versus ethylene
inhibitor aminoethoxy-vinylglycine (AVG) in the ethylene
experiment (41 genes), 0.70 for ABA versus mannitol
treatment in the ABA experiment (472 genes), 0.43 for zeatin
versus an ARR21C-overexpressing mutant in the CK exper-
iment (52 genes), 0.61 for MJ versus Botrytis cinereaTab
le1
(Co
nti
nu
ed)
No
.E
xper
imen
tLa
bo
rato
ryC
on
tro
lG
eno
typ
eT
reat
men
tT
ime
po
int
Org
an/t
issu
eG
row
thco
nd
itio
nA
ge
Rep
licat
esA
bb
revi
atio
n
99F
Sh
imad
a&
Yo
shid
aC
ol-
010
lMd
amin
ozi
de
3h
See
dlin
gM
Sliq
uid
7d
ays
2B
93h
(F1)
100
FS
him
ada
&Y
osh
ida
Co
l-0
10lM
salic
ylic
acid
3h
See
dlin
gM
Sliq
uid
7d
ays
2S
al3h
(F1)
aA
rab
ido
psi
sth
alia
na
seed
ling
s(g
eno
typ
esC
ol-
0,g
a1-5
,o
rd
et2-
1)w
ere
gro
wn
inh
alf-
stre
ng
thM
Sliq
uid
med
ium
for
7d
ays
at23
�Can
dtr
eate
dw
ith
IAA
,ze
atin
,G
A3,
AB
A,
MJ,
AC
Co
rB
Lfo
r30
min
,1
ho
r3
h.
bA
rab
ido
psi
sth
alia
na
seed
ling
s(d
et2-
1)w
ere
gro
wn
inh
alf-
stre
ng
thM
Sliq
uid
med
ium
for
7d
ays
at23
�Can
dtr
eate
dw
ith
cam
pes
tan
ol,
6-d
eoxo
cath
aste
ron
e,ca
thas
tero
ne,
6-d
eoxo
teas
tero
ne,
teas
tero
ne,
3-d
ehyd
ro-6
-deo
xote
aste
ron
e,3-
deh
ydro
teas
tero
ne,
6-d
eoxo
typ
has
tero
l,ty
ph
aste
rol,
6-d
eoxo
cast
aste
ron
e,ca
stas
tero
ne
or
bra
ssin
olid
efo
r3
h.
c Ara
bid
op
sis
thal
ian
ase
edlin
gs
(Co
l-0
or
AR
R22
-ox)
wer
eg
row
no
nM
Sag
arp
late
sfo
r21
day
sat
22�C
and
trea
ted
wit
ht-
zeat
info
r3
h.
dD
ryse
eds
of
Ara
bid
op
sis
thal
ian
a(C
ol-
0)w
ere
imb
ibed
inw
ater
or
3lM
AB
Afo
r24
hat
22�C
un
der
con
tin
uo
us
ligh
t.eS
eed
so
fAra
bid
op
sis
thal
ian
a(g
a1-3
)wer
eim
bib
edat
4�C
inth
ed
ark
for
48h
and
then
incu
bat
edfo
r24
hu
nd
erw
hit
elig
hta
t22�
C.T
he
seed
sw
ere
then
incu
bat
edu
nd
erth
esa
me
con
dit
ion
sw
ith
5l M
GA
4o
rw
ater
for
3,6
or
9h
.f A
rab
ido
psi
sth
alia
na
seed
ling
s(C
ol-
0)w
ere
gro
wn
inh
alf-
stre
ng
thM
Sliq
uid
med
ium
for
7d
ays
at23
�Can
dtr
eate
dw
ith
pro
pic
on
azo
le,u
nic
on
azo
le,p
aclo
bu
traz
olo
rp
roh
exad
ion
efo
r3
or
12h
.gA
rab
ido
psi
sth
alia
na
seed
ling
s(C
ol-
0)w
ere
gro
wn
inh
alf-
stre
ng
thM
Sliq
uid
med
ium
for
7d
ays
at23
�Can
dtr
eate
dw
ith
2,4,
6-tr
ihyd
roxy
ben
zam
ide,
p-c
hlo
rop
hen
oxy
iso
bu
tyri
cac
id,
2,3,
5-tr
iiod
ob
enzo
icac
ido
rn
aph
thyl
ph
thal
amic
acid
for
3h
.hA
rab
ido
psi
sth
alia
na
seed
ling
s(C
ol-
0)w
ere
gro
wn
inh
alf-
stre
ng
thM
Sliq
uid
med
ium
for
7d
ays
at23
�Can
dtr
eate
dw
ith
bra
ssin
azo
le22
0o
rb
rass
inaz
ole
91fo
r3
or
12h
.i A
rab
ido
psi
sth
alia
na
seed
ling
s(C
ol-
0)w
ere
gro
wn
inh
alf-
stre
ng
thM
Sliq
uid
med
ium
for
7d
ays
at23
�Can
dtr
eate
dw
ith
Ag
NO
3o
ram
ino
eth
oxy
vin
ylg
lyci
ne
for
3h
.j A
rab
ido
psi
sth
alia
na
seed
ling
s(C
ol-
0)w
ere
gro
wn
inh
alf-
stre
ng
thM
Sliq
uid
med
ium
for
7d
ays
at23
�Can
dtr
eate
dw
ith
CH
X(c
yclo
hex
imid
e),M
G13
2(c
arb
ob
enzo
xyl-
leu
cin
yl-l
euci
nyl
-leu
cin
al),
PN
O8
(N-o
ctyl
-3-n
itro
-2,4
,6-t
rih
ydro
xyb
enza
mid
e),
ibu
pro
fen
,d
amin
ozi
de
or
salic
ylic
acid
for
3o
r12
h.
AtGenExpress hormone data 531
ª 2008 The AuthorsJournal compilation ª 2008 Blackwell Publishing Ltd, The Plant Journal, (2008), 55, 526–542
infection (Ferrari et al., 2007) in the JA experiment (758
genes), and 0.94 for IAA versus previous IAA treatment data
(Goda et al., 2004) in the auxin experiment (143 genes).
These data indicate that the gene expression profiles for
each hormone are well correlated with those in additional or
previous experiments, as were the direction of the correla-
Table 2 AtGenExpress: various genotypes
No. Experiment Laboratory Control Genotype TreatmentTimepoint Organ/tissue
Growthcondition
Age(days) Replicates Abbreviation
Comparison of plant hormone-related mutantsa
101 H Shimada & Yoshida True Ws-2 No treatment N/A Seedling MS liquid 7 2 WT-WS (H)102 H Shimada & Yoshida bri1-5 No treatment N/A Seedling MS liquid 7 2 bri1 (H)103 K Shimada & Yoshida True Ler-1 No treatment N/A Seedling MS liquid 7 2 WT-Ler (K)104 K Shimada & Yoshida ga1-5 No treatment N/A Seedling MS liquid 7 2 ga1 (K)ARR21C overexpressionb
105 L Sakakibara & Mizuno True Col-0 No treatment N/A Seedling MS agar 21 3 Cont (L)106 L Sakakibara & Mizuno ARR21C-ox No treatment N/A Seedling MS agar 21 3 ARR21C-ox (L)
aSeedlings were grown in half-strength MS liquid medium for 7 days at 23�C.bSeedlings were grown on MS agar plates for 21 days at 22�C.
Table 3 AtGenExpress: development (time course of early seed germination)a
No. Experiment Laboratory Control Genotype TreatmentTimepoint (h) Organ/tissue
Growthcondition
Age(days) Replicates Abbreviation
107 M Nambara & Kamiya True Col-0 No treatment 0 Seeds N/A 0 2 Dry seed (M)108 M Nambara & Kamiya Col-0 Imbibed seeds
(water)1 Seeds N/A 0 2 Imbibed
1 h (M)109 M Nambara & Kamiya Col-0 Imbibed seeds
(water)3 Seeds N/A 0 2 Imbibed
3 h (M)
aDry seeds of Arabidopsis thaliana (Col-0) were imbibed in water for 1 or 3 h at 22�C under continuous light.
Table 4 AtGenExpress: abiotic treatments
No. Experiment Laboratory Control Genotype TreatmentTimepoint(h)
Organ/tissueGrowthcondition
Age(days) Replicates Abbreviation
Differential temperature treatment of seedsa
110 N Yamaguchi &Kamiya
True Ler-0 Incubatedat 22�C
96 Seeds N/A 0 2 Imbibed96h22dg. (N)
111 N Yamaguchi &Kamiya
Ler-0 Incubatedat 4�C
96 Seeds N/A 0 2 Imbibed96h4dg. (N)
Response to sulfate limitationb
112 P Takahashi True Col-0 Mock 0 Root MGRL agar 10 2 +S 0h (P)113 P Takahashi True Col-0 Mock 2 Root MGRL agar 10 2 +S 2h (P2)114 P Takahashi True Col-0 Mock 4 Root MGRL agar 10 2 +S 4h (P3)115 P Takahashi True Col-0 Mock 8 Root MGRL agar 10 2 +S 8h (P4)116 P Takahashi True Col-0 Mock 12 Root MGRL agar 10 2 +S 12h (P5)117 P Takahashi True Col-0 Mock 24 Root MGRL agar 10 2 +S 24h (P6)118 P Takahashi Col-0 0 lM sulfate 2 Root MGRL agar 10 2 )S 2h (P2)119 P Takahashi Col-0 0 lM sulfate 4 Root MGRL agar 10 2 )S 4h (P3)120 P Takahashi Col-0 0 lM sulfate 8 Root MGRL agar 10 2 )S 8h (P4)121 P Takahashi Col-0 0 lM sulfate 12 Root MGRL agar 10 2 )S 12h (P5)122 P Takahashi Col-0 0 lM sulfate 24 Root MGRL agar 10 2 )S 24h (P6)
aSeeds of Arabidopsis thaliana (Ler-0), were irradiated with a far-red light pulse 1 h after imbibition, and then incubated for 96 h in the dark at22 or 4�C.bArabidopsis thaliana seedlings (Col-0) were grown vertically for 10 days on MGRL agar medium containing 1500 lM sulfate at 22�C under 16 h/8 hlight/dark cycles and then transferred to medium containing or lacking sulfate.
532 Hideki Goda et al.
ª 2008 The AuthorsJournal compilation ª 2008 Blackwell Publishing Ltd, The Plant Journal, (2008), 55, 526–542

tions (positive or negative). The number of hormone-induc-
ible genes decreased under these highly stringent condi-
tions because the number of false-negative genes increased.
These gene lists are considered highly stringent lists
(Table S5) and were used to analyze and estimate hormone
status as described below.
Analysis of hormone actions
Existing statistical analyses or clustering methods for
microarray data often fail to answer the specific questions of
interest to biologists (Dhollander et al., 2007; Hibbs et al.,
2007; Ivakhno and Armstrong, 2007). Moreover, compari-
sons of data across multiple laboratories have shown that the
data sets for each laboratory tend to be more similar to each
other than they are to those of other laboratories (data not
shown). Likewise, data on similar tissues from different
laboratories tend to be similar even though they focus on
different responses. Thus, developing methods to elucidate
clear biological relationships from high-dimensional bio-
logical data is very important. As shown in Figure 2, we
detected similarities between two independent experiments
using hormone-inducible genes selected by hormone treat-
ment, even when conducted in different laboratories using
samples of different tissues at different developmental
stages. We applied this approach to estimate hormone status
in multiple expression profiles from the AtGenExpress stress
series data set (Kilian et al., 2007). The experimental treat-
ments in this data set include cold, drought, UV-B, high salt,
high osmolarity, heat and wounding. Signal ratio values
(hormone treatment/mock, or stress treatment/control) were
calculated for both experiments and then transformed to a
log2 scale to adjust the origin (i.e. zero point). Then Pearson’s
correlations were calculated for each combination of stres-
sed sample and hormone-treated sample using the log signal
ratios for each hormone-inducible gene (highly stringent list
in Table S5). Significant correlations with ABA treatment
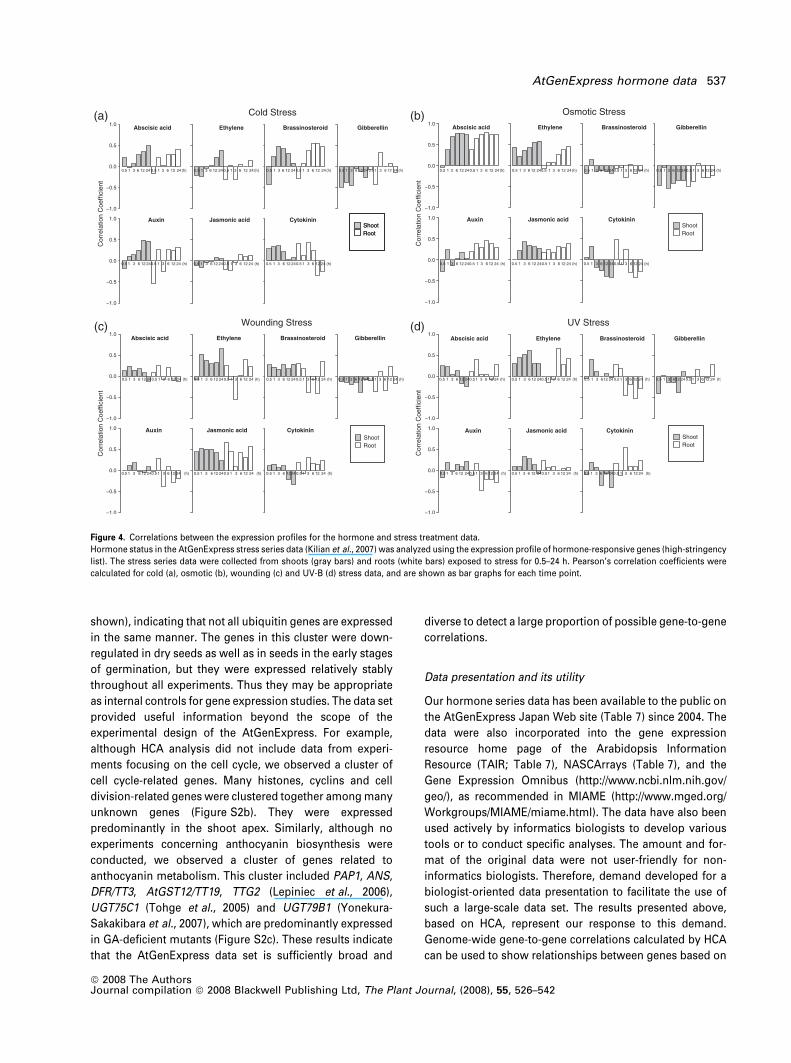
were observed soon after osmotic stress (Figure 4b).
Figure 1. Comparison of the numbers of detected genes in the AtGenExpress
project.
The numbers of genes detected at a significant level (detection level P < 0.05)
were compared among the hormone, stress and development data sets.
Table 5 Marker genes used to confirm the hormone responses
Gene symbol AGI locus Reference
AuxinIAA1 At4g14560 Abel et al. (1995)IAA2 At3g23030 Abel et al. (1995)
CytokininARR5 At3g48100 Taniguchi et al. (1998)ARR6 At5g62920 Taniguchi et al. (1998)ARR15 At1g74890 Kiba et al. (2002)
GibberellinAt-EXP1 At1g69530 Ogawa et al. (2003)GAI At1g14920 Ogawa et al. (2003)SCL3 At1g50420 Ogawa et al. (2003)
Abscisic acidRD29A At5g52310 Yamaguchi-Shinozaki
and Shinozaki (1993)COR15A At2g42540 Wilhelm and
Thomashow (1993)Jasmonate
JMT At1g19640 Seo et al. (2001)OPR3 At2g06050 Mussig et al. (2000)JIN1/MYC2/RAP1 At1g32640 Lorenzo et al. (2004)
EthyleneERS2 At1g04310 Hua et al. (1998)EFE At1g05010 Gomezlim et al. (1993)
BrassinosteroidBR6ox2/CYP85A2 At3g30180 Shimada et al. (2003)CPD/CYP90A At5g05690 Mathur et al. (1998)DWF4/CYP90B At3g50660 Noguchi et al. (2000)
Table 6 Number of genes differentially expressed followinghormone treatment
Time
30 min 1 h 3 h
WT + ABA (up) 14 267 1965WT + ABA (down) 17 225 1661WT + ACC (up) 164 145 29WT + ACC (down) 495 491 60det2 + BL (up) 0 76 923det2 + BL (down) 0 43 870ga1 + GA (up) 0 39 183ga1 + GA (down) 1 77 145WT + IAA (up) 33 61 250WT + IAA (down) 23 28 388WT + MJ (up) 231 415 576WT + MJ (down) 328 464 455WT + zeatin (up) 20 39 104WT + zeatin (down) 6 37 121
AtGenExpress hormone data 533
ª 2008 The AuthorsJournal compilation ª 2008 Blackwell Publishing Ltd, The Plant Journal, (2008), 55, 526–542
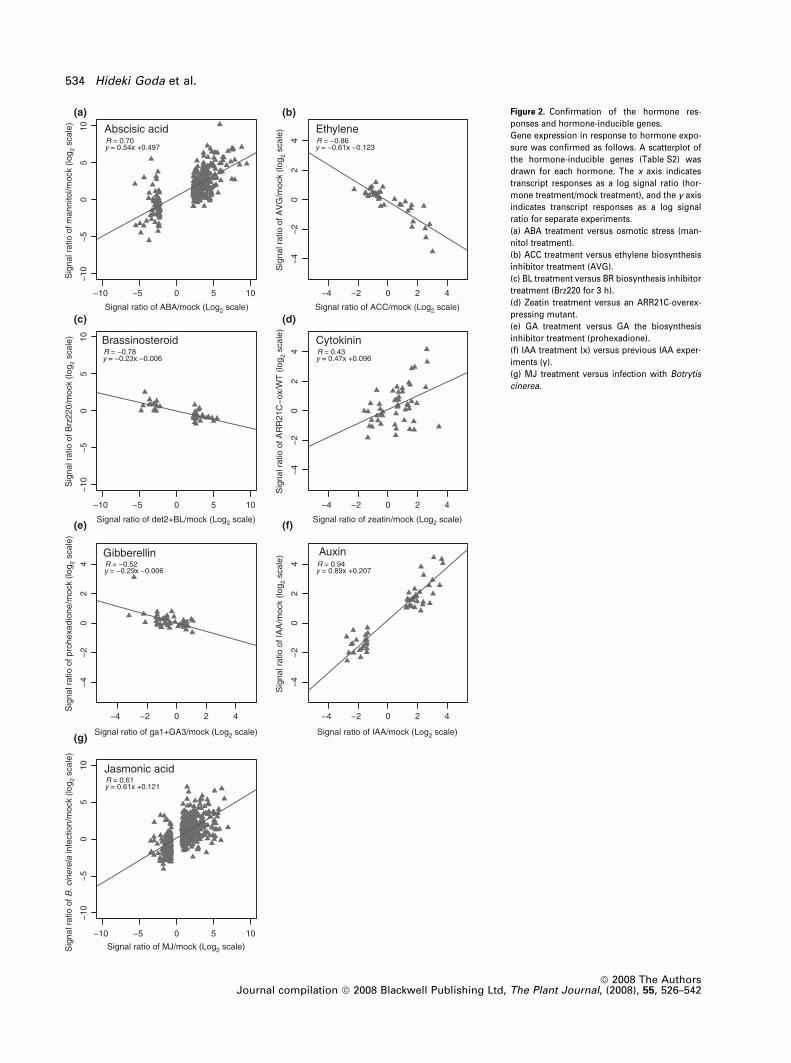
Figure 2. Confirmation of the hormone res-
ponses and hormone-inducible genes.
Gene expression in response to hormone expo-
sure was confirmed as follows. A scatterplot of
the hormone-inducible genes (Table S2) was
drawn for each hormone. The x axis indicates
transcript responses as a log signal ratio (hor-
mone treatment/mock treatment), and the y axis
indicates transcript responses as a log signal
ratio for separate experiments.
(a) ABA treatment versus osmotic stress (man-
nitol treatment).
(b) ACC treatment versus ethylene biosynthesis
inhibitor treatment (AVG).
(c) BL treatment versus BR biosynthesis inhibitor
treatment (Brz220 for 3 h).
(d) Zeatin treatment versus an ARR21C-overex-
pressing mutant.
(e) GA treatment versus GA the biosynthesis
inhibitor treatment (prohexadione).
(f) IAA treatment (x) versus previous IAA exper-
iments (y).
(g) MJ treatment versus infection with Botrytis
cinerea.
534 Hideki Goda et al.
ª 2008 The AuthorsJournal compilation ª 2008 Blackwell Publishing Ltd, The Plant Journal, (2008), 55, 526–542

Interestingly, the correlation was observed at an early stage
in the roots, beginning at 30 min and reaching a plateau after
1 h, whereas it was observed in the shoot after 1 h and did
not reach a plateau until 3 h, suggesting that the stress
response begins in the roots and then spreads to the shoot.
The result was consistent with the design of the experiments,
as the osmotic stress was applied to the roots (Kilian et al.,
2007). Similarly, a correlation with ABA was also observed
for cold stress; however, it was delayed and only became
significant 6 h after treatment (Figure 4a). The correlation
with ABA was even weaker for drought treatment (data not
shown), suggesting that the conditions used were mild. This
is consistent with the observations by Kilian et al. (2007),
because the drought-induced transcript response was small
compared to other stress-induced responses. Correlations
were also detected between ACC treatments and wounding
or between MJ treatments and wounding (Figure 4c), con-
sistent with previous studies showing that ethylene and JA
function in the response to wounding. An additional corre-
lation was detected between ACC treatment and UV-B irra-
diation (Figure 4d). In contrast to the strong interaction
between stress and stress-related hormones, we detected
little interaction with growth-related hormones. Neverthe-
less, we detected correlations that probably indicate novel
hormone actions, as follows. GA was inactivated by various
stressors, including cold, high osmolarity, wounding and UV
light. In contrast, CK was activated transiently by cold and
osmotic stress, especially in the roots. Thus, this approach
allowed us to simultaneously predict the status of all seven
hormones from a single experiment. Formerly, it was nec-
essary to rely on marker genes and endogenous hormones to
study hormone function because there was no conclusive
means to monitor the in vivo status of multiple hormones at
the same time.
Analysis of the hormone network
To obtain insight into the relationships among phytohor-
mones, we investigated whether there was significant
overlap between each set of hormone-inducible genes. The
hormone-inducible genes (Table S2) were classified into
groups based on whether they were up or downregulated at
each of three time points (30 min, 1 h and 3 h), and the
groups were compared in a pairwise manner using Fisher’s
exact test. A significant number of overlapped genes were
detected (pink in Table S4), more than would be expected by
chance, indicating that hormones regulate shared target
genes at the transcriptional level. This result was clearer
when the overlap was considered in terms of the direction
and/or time dependence of the response. For example, if
there was significant overlap between genes that were
inducible by hormone A and those that were inducible by
hormone B genes, and if the overlap was observed in the
same direction (i.e. the genes upregulated by hormone A
overlapped with those upregulated by hormone B and the
genes downregulated by hormone A overlapped with those
downregulated by hormone B), the two hormones regulate
common target genes in the same direction. Such interac-
tions were termed complete positive interactions (Fig-
ure 5a). In contrast, if the overlap occurred in opposite
directions (i.e. the genes upregulated by hormone A over-
lapped with those downregulated by hormone B, and vice
versa), the interaction was termed a complete negative
interaction (Figure 5b). Finally, if the overlap was incomplete
(i.e. there was significant overlap between the genes up-
regulated by hormone A and those upregulated by hormone
B, but not between the genes downregulated by hormone A
and those downregulated by hormone B), the interaction
was designated a partial positive interaction (Figure 5c,d) or
a partial negative interaction (Figure 5e,f). In partial inter-
actions, it is unlikely that the interaction can be accounted
for by regulation at the endogenous hormone level, even if
the amount of change is controlled by its transport. Partial
interactions are probably the result of limited overlap
between signaling pathways (e.g. two hormones share a
transcriptional regulator that may function as either an
activator or repressor). A partial positive interaction was
observed between auxin and BR (Figure 5h and Table S4),
which is consistent with previous reports showing that these
two hormones act synergistically in monocots and dicots.
Cross-talk between the two signaling pathways has been
suggested in recent molecular and genetic studies (Nakam-
ura et al., 2006; Nemhauser et al., 2004).
A complete interaction can be accounted for by one of two
mechanisms: either one of the hormones promotes the
active level of the other or they share the same signaling
pathway to promote sensitivities of each other. These
possibilities may be distinguished by considering the timing
of the interaction as follows. If hormone A induces the
biosynthesis of hormone B, induction of gene expression by
hormone B will be observed at a later time point after
hormone A treatment, and no early induction of gene
expression by hormone A will be observed following
hormone B treatment (Figure 5g). Consistent with this
model, early ethylene-inducible gene expression was ob-
served 3 h after auxin treatment (Figure 5h and Table S4),
whereas no early auxin-inducible gene expression was
observed following ACC (ethylene) treatment. This is con-
sistent with the fact that exogenous auxin induces ethylene
biosynthesis in various organs in many species. Given that a
similar interaction was found between auxin and ABA
(Figure 5h and Table S4), auxin probably induces the bio-
synthesis of ABA. In fact, NCED5/At1g30100, an ABA
biosynthetic gene, was induced by IAA treatment (signal
ratio = 4.6, P-value = 0.064, q value = 0.12, t-test at 3 h).
Positive interactions were also identified among the stress-
related hormones ABA, ethylene and JA (Figure 5h and
Table S4). Interestingly, because no time-dependent inter-
AtGenExpress hormone data 535
ª 2008 The AuthorsJournal compilation ª 2008 Blackwell Publishing Ltd, The Plant Journal, (2008), 55, 526–542
action was observed, stress-related hormones are more
likely to share signaling pathways than to activate the
biosynthesis of one another. The hormone network pre-
sented in Figure 5(h) is based on expression profiles from
Arabidopsis seedlings; it may not be applicable to other
tissues or species. Nevertheless, our results demonstrate the
usefulness of this type of analysis in studying hormone
networks and functions. This approach will be applicable to
other tissues and species once additional experiments have
been conducted. Nemhauser et al. (2006) used our data to
analyze hormone networks from the point of view of
hormone metabolism. The data presented here provide a
starting point from which to advance the understanding of
plant hormone networks using a systems-based approach.
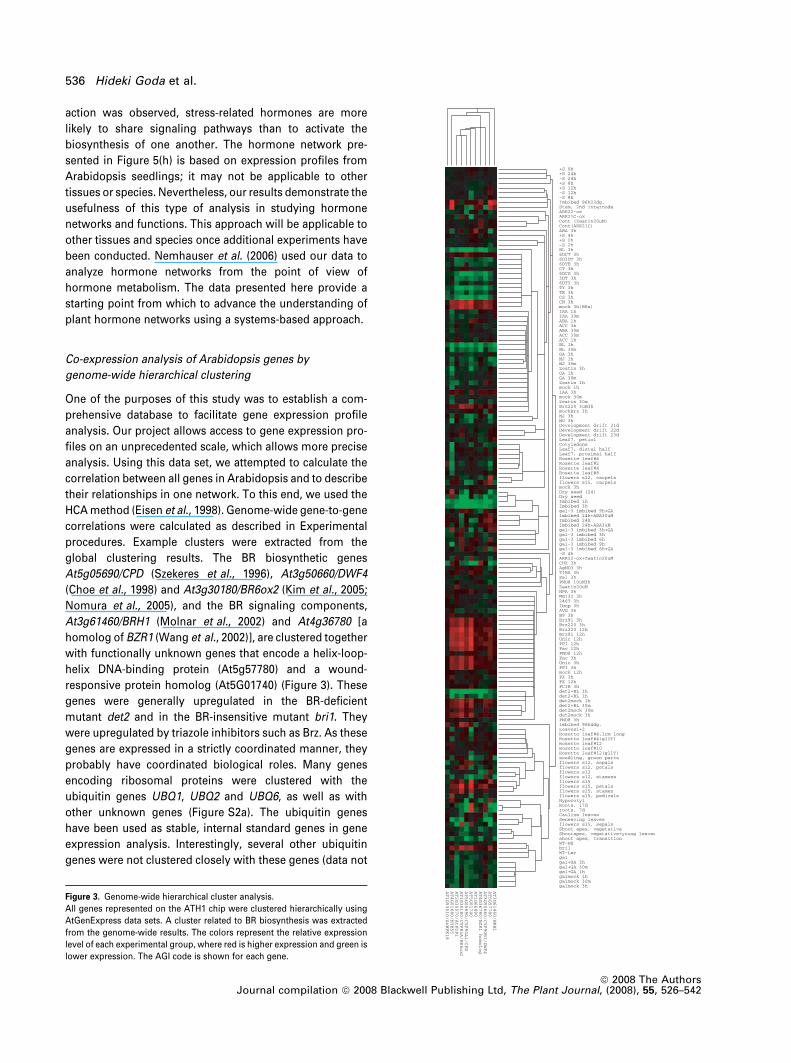
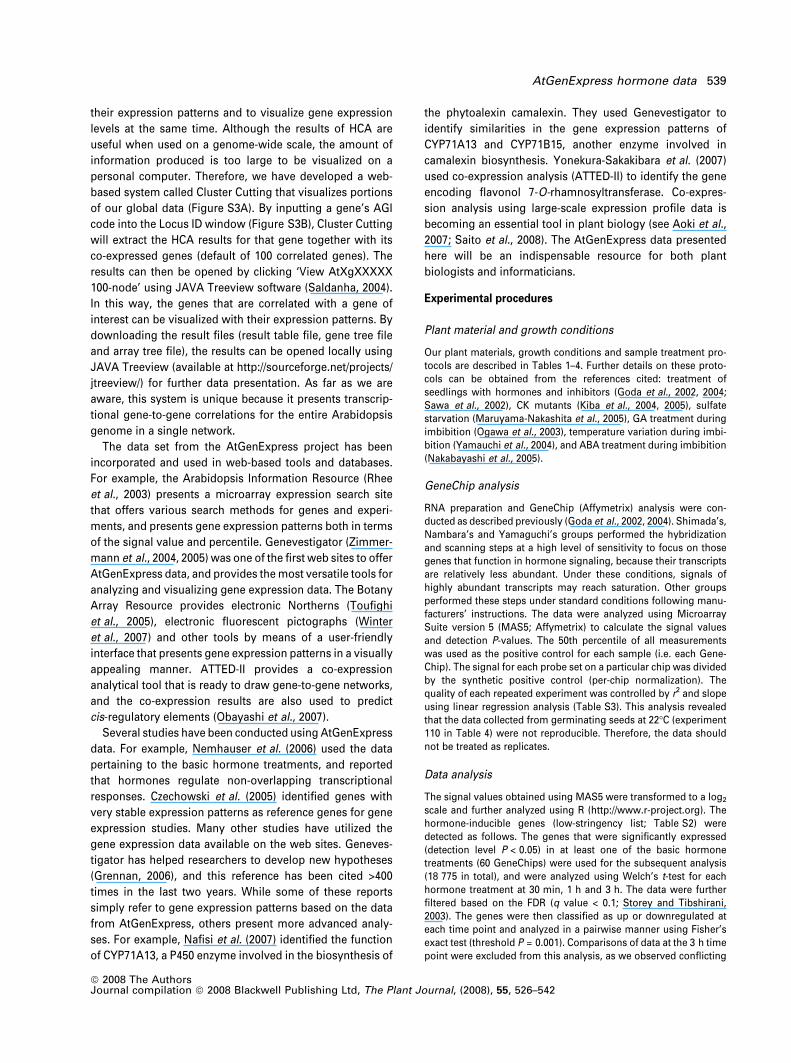
Co-expression analysis of Arabidopsis genes by
genome-wide hierarchical clustering
One of the purposes of this study was to establish a com-
prehensive database to facilitate gene expression profile
analysis. Our project allows access to gene expression pro-
files on an unprecedented scale, which allows more precise
analysis. Using this data set, we attempted to calculate the
correlation between all genes in Arabidopsis and to describe
their relationships in one network. To this end, we used the
HCA method (Eisen et al., 1998). Genome-wide gene-to-gene
correlations were calculated as described in Experimental
procedures. Example clusters were extracted from the
global clustering results. The BR biosynthetic genes
At5g05690/CPD (Szekeres et al., 1996), At3g50660/DWF4
(Choe et al., 1998) and At3g30180/BR6ox2 (Kim et al., 2005;
Nomura et al., 2005), and the BR signaling components,
At3g61460/BRH1 (Molnar et al., 2002) and At4g36780 [a
homolog of BZR1 (Wang et al., 2002)], are clustered together
with functionally unknown genes that encode a helix-loop-
helix DNA-binding protein (At5g57780) and a wound-
responsive protein homolog (At5G01740) (Figure 3). These
genes were generally upregulated in the BR-deficient
mutant det2 and in the BR-insensitive mutant bri1. They
were upregulated by triazole inhibitors such as Brz. As these
genes are expressed in a strictly coordinated manner, they
probably have coordinated biological roles. Many genes
encoding ribosomal proteins were clustered with the
ubiquitin genes UBQ1, UBQ2 and UBQ6, as well as with
other unknown genes (Figure S2a). The ubiquitin genes
have been used as stable, internal standard genes in gene
expression analysis. Interestingly, several other ubiquitin
genes were not clustered closely with these genes (data not
Figure 3. Genome-wide hierarchical cluster analysis.
All genes represented on the ATH1 chip were clustered hierarchically using
AtGenExpress data sets. A cluster related to BR biosynthesis was extracted
from the genome-wide results. The colors represent the relative expression
level of each experimental group, where red is higher expression and green is
lower expression. The AGI code is shown for each gene.
536 Hideki Goda et al.
ª 2008 The AuthorsJournal compilation ª 2008 Blackwell Publishing Ltd, The Plant Journal, (2008), 55, 526–542
shown), indicating that not all ubiquitin genes are expressed
in the same manner. The genes in this cluster were down-
regulated in dry seeds as well as in seeds in the early stages
of germination, but they were expressed relatively stably
throughout all experiments. Thus they may be appropriate
as internal controls for gene expression studies. The data set
provided useful information beyond the scope of the
experimental design of the AtGenExpress. For example,
although HCA analysis did not include data from experi-
ments focusing on the cell cycle, we observed a cluster of
cell cycle-related genes. Many histones, cyclins and cell
division-related genes were clustered together among many
unknown genes (Figure S2b). They were expressed
predominantly in the shoot apex. Similarly, although no
experiments concerning anthocyanin biosynthesis were
conducted, we observed a cluster of genes related to
anthocyanin metabolism. This cluster included PAP1, ANS,
DFR/TT3, AtGST12/TT19, TTG2 (Lepiniec et al., 2006),
UGT75C1 (Tohge et al., 2005) and UGT79B1 (Yonekura-
Sakakibara et al., 2007), which are predominantly expressed
in GA-deficient mutants (Figure S2c). These results indicate
that the AtGenExpress data set is sufficiently broad and
diverse to detect a large proportion of possible gene-to-gene
correlations.
Data presentation and its utility
Our hormone series data has been available to the public on
the AtGenExpress Japan Web site (Table 7) since 2004. The
data were also incorporated into the gene expression
resource home page of the Arabidopsis Information
Resource (TAIR; Table 7), NASCArrays (Table 7), and the
Gene Expression Omnibus (http://www.ncbi.nlm.nih.gov/
geo/), as recommended in MIAME (http://www.mged.org/
Workgroups/MIAME/miame.html). The data have also been
used actively by informatics biologists to develop various
tools or to conduct specific analyses. The amount and for-
mat of the original data were not user-friendly for non-
informatics biologists. Therefore, demand developed for a
biologist-oriented data presentation to facilitate the use of
such a large-scale data set. The results presented above,
based on HCA, represent our response to this demand.
Genome-wide gene-to-gene correlations calculated by HCA
can be used to show relationships between genes based on
Figure 4. Correlations between the expression profiles for the hormone and stress treatment data.
Hormone status in the AtGenExpress stress series data (Kilian et al., 2007) was analyzed using the expression profile of hormone-responsive genes (high-stringency
list). The stress series data were collected from shoots (gray bars) and roots (white bars) exposed to stress for 0.5–24 h. Pearson’s correlation coefficients were
calculated for cold (a), osmotic (b), wounding (c) and UV-B (d) stress data, and are shown as bar graphs for each time point.
AtGenExpress hormone data 537
ª 2008 The AuthorsJournal compilation ª 2008 Blackwell Publishing Ltd, The Plant Journal, (2008), 55, 526–542
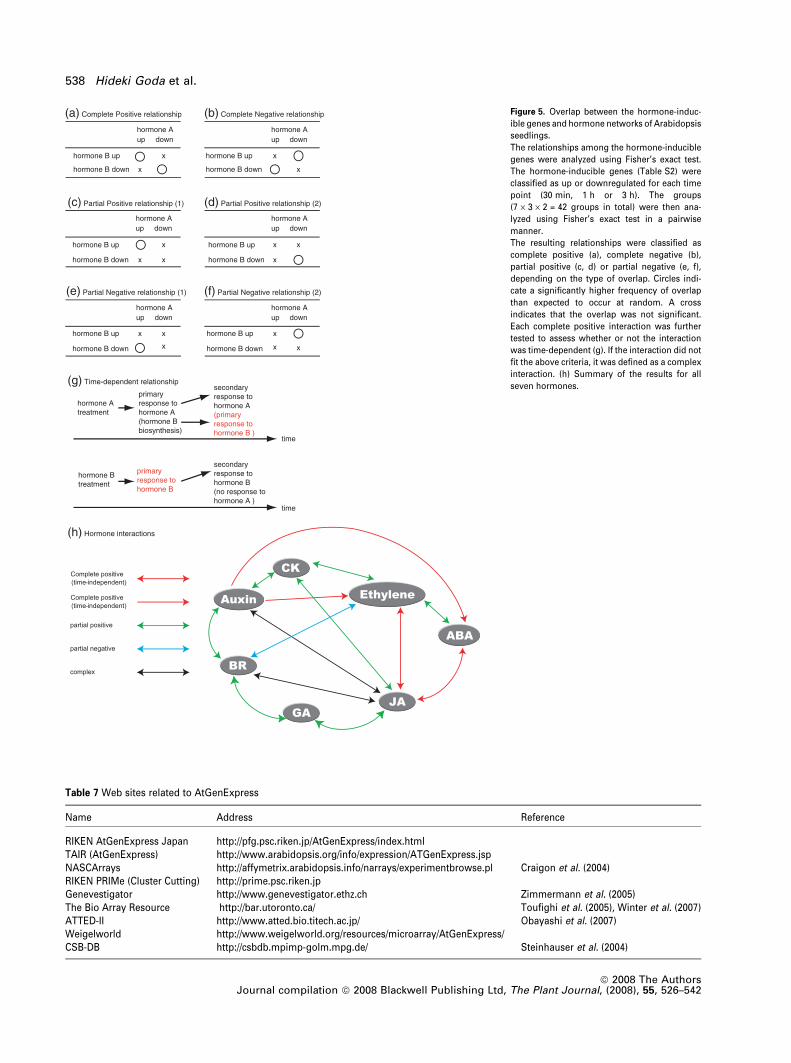
Figure 5. Overlap between the hormone-induc-
ible genes and hormone networks of Arabidopsis
seedlings.
The relationships among the hormone-inducible
genes were analyzed using Fisher’s exact test.
The hormone-inducible genes (Table S2) were
classified as up or downregulated for each time
point (30 min, 1 h or 3 h). The groups
(7 · 3 · 2 = 42 groups in total) were then ana-
lyzed using Fisher’s exact test in a pairwise
manner.
The resulting relationships were classified as
complete positive (a), complete negative (b),
partial positive (c, d) or partial negative (e, f),
depending on the type of overlap. Circles indi-
cate a significantly higher frequency of overlap
than expected to occur at random. A cross
indicates that the overlap was not significant.
Each complete positive interaction was further
tested to assess whether or not the interaction
was time-dependent (g). If the interaction did not
fit the above criteria, it was defined as a complex
interaction. (h) Summary of the results for all
seven hormones.
Table 7 Web sites related to AtGenExpress
Name Address Reference
RIKEN AtGenExpress Japan http://pfg.psc.riken.jp/AtGenExpress/index.htmlTAIR (AtGenExpress) http://www.arabidopsis.org/info/expression/ATGenExpress.jspNASCArrays http://affymetrix.arabidopsis.info/narrays/experimentbrowse.pl Craigon et al. (2004)RIKEN PRIMe (Cluster Cutting) http://prime.psc.riken.jpGenevestigator http://www.genevestigator.ethz.ch Zimmermann et al. (2005)The Bio Array Resource http://bar.utoronto.ca/ Toufighi et al. (2005), Winter et al. (2007)ATTED-II http://www.atted.bio.titech.ac.jp/ Obayashi et al. (2007)Weigelworld http://www.weigelworld.org/resources/microarray/AtGenExpress/CSB-DB http://csbdb.mpimp-golm.mpg.de/ Steinhauser et al. (2004)
538 Hideki Goda et al.
ª 2008 The AuthorsJournal compilation ª 2008 Blackwell Publishing Ltd, The Plant Journal, (2008), 55, 526–542
their expression patterns and to visualize gene expression
levels at the same time. Although the results of HCA are
useful when used on a genome-wide scale, the amount of
information produced is too large to be visualized on a
personal computer. Therefore, we have developed a web-
based system called Cluster Cutting that visualizes portions
of our global data (Figure S3A). By inputting a gene’s AGI
code into the Locus ID window (Figure S3B), Cluster Cutting
will extract the HCA results for that gene together with its
co-expressed genes (default of 100 correlated genes). The
results can then be opened by clicking ‘View AtXgXXXXX
100-node’ using JAVA Treeview software (Saldanha, 2004).
In this way, the genes that are correlated with a gene of
interest can be visualized with their expression patterns. By
downloading the result files (result table file, gene tree file
and array tree file), the results can be opened locally using
JAVA Treeview (available at http://sourceforge.net/projects/
jtreeview/) for further data presentation. As far as we are
aware, this system is unique because it presents transcrip-
tional gene-to-gene correlations for the entire Arabidopsis
genome in a single network.
The data set from the AtGenExpress project has been
incorporated and used in web-based tools and databases.
For example, the Arabidopsis Information Resource (Rhee
et al., 2003) presents a microarray expression search site
that offers various search methods for genes and experi-
ments, and presents gene expression patterns both in terms
of the signal value and percentile. Genevestigator (Zimmer-
mann et al., 2004, 2005) was one of the first web sites to offer
AtGenExpress data, and provides the most versatile tools for
analyzing and visualizing gene expression data. The Botany
Array Resource provides electronic Northerns (Toufighi
et al., 2005), electronic fluorescent pictographs (Winter
et al., 2007) and other tools by means of a user-friendly
interface that presents gene expression patterns in a visually
appealing manner. ATTED-II provides a co-expression
analytical tool that is ready to draw gene-to-gene networks,
and the co-expression results are also used to predict
cis-regulatory elements (Obayashi et al., 2007).
Several studies have been conducted using AtGenExpress
data. For example, Nemhauser et al. (2006) used the data
pertaining to the basic hormone treatments, and reported
that hormones regulate non-overlapping transcriptional
responses. Czechowski et al. (2005) identified genes with
very stable expression patterns as reference genes for gene
expression studies. Many other studies have utilized the
gene expression data available on the web sites. Geneves-
tigator has helped researchers to develop new hypotheses
(Grennan, 2006), and this reference has been cited >400
times in the last two years. While some of these reports
simply refer to gene expression patterns based on the data
from AtGenExpress, others present more advanced analy-
ses. For example, Nafisi et al. (2007) identified the function
of CYP71A13, a P450 enzyme involved in the biosynthesis of
the phytoalexin camalexin. They used Genevestigator to
identify similarities in the gene expression patterns of
CYP71A13 and CYP71B15, another enzyme involved in
camalexin biosynthesis. Yonekura-Sakakibara et al. (2007)
used co-expression analysis (ATTED-II) to identify the gene
encoding flavonol 7-O-rhamnosyltransferase. Co-expres-
sion analysis using large-scale expression profile data is
becoming an essential tool in plant biology (see Aoki et al.,
2007; Saito et al., 2008). The AtGenExpress data presented
here will be an indispensable resource for both plant
biologists and informaticians.
Experimental procedures
Plant material and growth conditions
Our plant materials, growth conditions and sample treatment pro-tocols are described in Tables 1–4. Further details on these proto-cols can be obtained from the references cited: treatment ofseedlings with hormones and inhibitors (Goda et al., 2002, 2004;Sawa et al., 2002), CK mutants (Kiba et al., 2004, 2005), sulfatestarvation (Maruyama-Nakashita et al., 2005), GA treatment duringimbibition (Ogawa et al., 2003), temperature variation during imbi-bition (Yamauchi et al., 2004), and ABA treatment during imbibition(Nakabayashi et al., 2005).
GeneChip analysis
RNA preparation and GeneChip (Affymetrix) analysis were con-ducted as described previously (Goda et al., 2002, 2004). Shimada’s,Nambara’s and Yamaguchi’s groups performed the hybridizationand scanning steps at a high level of sensitivity to focus on thosegenes that function in hormone signaling, because their transcriptsare relatively less abundant. Under these conditions, signals ofhighly abundant transcripts may reach saturation. Other groupsperformed these steps under standard conditions following manu-facturers’ instructions. The data were analyzed using MicroarraySuite version 5 (MAS5; Affymetrix) to calculate the signal valuesand detection P-values. The 50th percentile of all measurementswas used as the positive control for each sample (i.e. each Gene-Chip). The signal for each probe set on a particular chip was dividedby the synthetic positive control (per-chip normalization). Thequality of each repeated experiment was controlled by r2 and slopeusing linear regression analysis (Table S3). This analysis revealedthat the data collected from germinating seeds at 22�C (experiment110 in Table 4) were not reproducible. Therefore, the data shouldnot be treated as replicates.
Data analysis
The signal values obtained using MAS5 were transformed to a log2
scale and further analyzed using R (http://www.r-project.org). Thehormone-inducible genes (low-stringency list; Table S2) weredetected as follows. The genes that were significantly expressed(detection level P < 0.05) in at least one of the basic hormonetreatments (60 GeneChips) were used for the subsequent analysis(18 775 in total), and were analyzed using Welch’s t-test for eachhormone treatment at 30 min, 1 h and 3 h. The data were furtherfiltered based on the FDR (q value < 0.1; Storey and Tibshirani,2003). The genes were then classified as up or downregulated ateach time point and analyzed in a pairwise manner using Fisher’sexact test (threshold P = 0.001). Comparisons of data at the 3 h timepoint were excluded from this analysis, as we observed conflicting
AtGenExpress hormone data 539
ª 2008 The AuthorsJournal compilation ª 2008 Blackwell Publishing Ltd, The Plant Journal, (2008), 55, 526–542
relationships that were probably caused by secondary responses.To create the high-stringency gene list (Table S5), the followinganalysis and thresholds were applied to each hormone. The genesthat were significantly expressed (detection level P < 0.05) in at leastone of 12 GeneChip experiments (including mock treatment) wereincluded in the analysis. Then, four groups of data were analyzedusing standard one-way ANOVA: mock, 30 min, 1 h and 3 h. Thegenes were then filtered by their FDR q values (<0.05) and furtherfiltered based on the absolute value of their signal ratios (SR). Thethreshold SR and recovered gene number for each hormone wereas follows: ABA, SR = 2.25, n = 472; ACC, SR = 0.25, n = 41; BL,SR = 2.25, n = 41; CK, SR = 0.25, n = 143; GA, SR = 0, n = 49; IAA,SR = 1.25, n = 143; MJ, SR = 0.75, n = 758. Our conditions (n > 40)correspond to a Pearson’s correlation coefficient of 0.4 (P < 0.01).
Global hierarchical clustering
Data from all or a proportion of the following groups were includedin our analysis. Blaesing (diurnal), the Nottingham ArabidopsisStock Centre (light and pathogen), RIKEN: Shimada’s group (basichormone treatments, inhibitors, etc), RIKEN: Kamiya’s group (seedgermination, imbibition, ABA, low temperature, GA experiments),Mizuno and Sakakibara’s group (zeatin and ARRs), RIKEN: Takah-ashi’s group (sulfur starvation), the German Resource Centre forGenome Research (stress series), Scheible’s group (nitrogen star-vation), Weigel’s group (floral transition), Weigel’s group (organsand development). The data from the Nottingham ArabidopsisStock Centre, the German Resource Centre for Genome Researchand Weigel’s group were subdivided into smaller groups. TheNottingham Arabidopsis Stock Centre data were divided into a lightseries and pathogen series. The data from the German ResourceCentre for Genome Research were divided into three parts: rootexperiments, shoot experiments, and cell-culture experiments.Weigel’s organ-development experiments were divided into thefollowing three subgroups: floral stage 12, shoot apices, and other.All signal values were imported into GeneSpring (Agilent/Silicon-Genetics) and normalized per chip, assuming that the signal was atleast 10 (signals lower than 10 were corrected to 10). Per-genenormalization was also applied in the above 15 experimental sub-groups. The expression levels of each gene were normalized to theirown median as a synthetic positive control. The data sets were thenimported into Cluster 3 (de Hoon et al., 2004), transformed to a log2
scale. The genes and arrays were clustered using centroid linkage.Similarity metrics were defined using Pearson’s correlation.
Acknowledgements
We thank the Arabidopsis Information Resource for providing theAtGenExpress web site, and Ms Chitose Takahashi, Mr Hiroaki Yuasaand Mr Narumasa Miyauchi for technical assistance with data pro-cessing, and construction and the maintenance of the web system.We thank Dr Thomas Altmann (University of Potsdam) for coordi-nating the AtGenExpress project, Dr Alok Saldanha (StanfordUniversity) for providing JAVA Treeview, the RIKEN Super Com-bined Cluster (RSCC) for supplying computational resources, andthe data visualization service of Advanced Center for Computing andCommunication at RIKEN for assisting with data visualization.
Supplementary Material
The following supplementary material is available for this articleonline:
Figure S1. The number of significantly expressed genes (detectionlevel P < 0.05) from each GeneChip.Figure S2. Genome-wide hierarchical cluster analysis using AtGen-Express data.Figure S3. Cluster Cutting, a web-based co-expression/expressionviewer from RIKEN PRIMe.Table S1. Significantly expressed genes (detection level P < 0.05)from the hormone series data.Table S2. Hormone-inducible genes (low stringency).Table S3. Assessment of the replicated experiments using linearregression analysis.Table S4. Overlapping transcriptional targets in response tohormone treatment.Table S5. Hormone-inducible genes (high stringency).This material is available as part of the online article from http://www.blackwell-synergy.com.Please note: Blackwell publishing are not responsible for the contentor functionality of any supplementary materials supplied by theauthors. Any queries (other than missing material) should bedirected to the corresponding author for the article.
References
Abel, S., Nguyen, M.D. and Theologis, A. (1995) The Ps-Iaa4/5-likefamily of early auxin-inducible messenger-RNAs in Arabidopsisthaliana. J. Mol. Biol. 251, 533–549.
Aoki, K., Ogata, Y. and Shibata, D. (2007) Approaches for extractingpractical information from gene co-expression networks in plantbiology. Plant Cell Physiol. 48, 381–390.
Arabidopsis Genome Initiative (2000) Analysis of the genomesequence of the flowering plant Arabidopsis thaliana. Nature,408, 769–815.
Choe, S.W., Dilkes, B.P., Fujioka, S., Takatsuto, S., Sakurai, A. and
Feldmann, K.A. (1998) The DWF4 gene of Arabidopsis encodes acytochrome p450 that mediates multiple 22 alpha-hydroxylationsteps in brassinosteroid biosynthesis. Plant Cell, 10, 231–243.
Craigon, D., James, N., Okyere, J., Higgins, J., Jotham, J. and May,
S. (2004) NASCArrays: a repository for microarray data generatedby NASC’s transcriptomics service. Nucleic Acids Res. 32, D575–D577.
Czechowski, T., Stitt, M., Altmann, T., Udvardi, M. and Scheible, W.
(2005) Genome-wide identification and testing of superior refer-ence genes for transcript normalization in Arabidopsis. PlantPhysiol. 139, 5–17.
Dhollander, T., Sheng, Q., Lemmens, K., De Moor, B., Marchal, K.
and Moreau, Y. (2007) Query-driven module discovery in micro-array data. Bioinformatics, 23, 2573–2580.
Eisen, M., Spellman, P., Brown, P. and Botstein, D. (1998) Clusteranalysis and display of genome-wide expression patterns. Proc.Natl Acad. Sci. USA, 95, 14863–14868.
Ferrari, S., Galletti, R., Denoux, C., De Lorenzo, G., Ausubel, F. and
Dewdney, J. (2007) Resistance to Botrytis cinerea induced inArabidopsis by elicitors is independent of salicylic acid, ethylene,or jasmonate signaling but requires PHYTOALEXIN DEFICIENT 3.Plant Physiol. 144, 367–379.
Goda, H., Shimada, Y., Asami, T., Fujioka, S. and Yoshida, S. (2002)Microarray analysis of brassinosteroid-regulated genes inArabidopsis. Plant Physiol. 130, 1319–1334.
Goda, H., Sawa, S., Asami, T., Fujioka, S., Shimada, Y. and Yoshida,
S. (2004) Comprehensive comparison brassinosteroid-regulatedof auxin-regulated and brassinosteroid-regulated genes inArabidopsis. Plant Physiol. 134, 1555–1573.
Gomezlim, M.A., Valdeslopez, V., Cruzhernandez, A. and
Saucedoarias, L.J. (1993) Isolation and characterization of a gene
540 Hideki Goda et al.
ª 2008 The AuthorsJournal compilation ª 2008 Blackwell Publishing Ltd, The Plant Journal, (2008), 55, 526–542

involved in ethylene biosynthesis from Arabidopsis thaliana.Gene, 134, 217–221.
Grennan, A.K. (2006) Genevestigator. Facilitating web-based gene-expression analysis. Plant Physiol. 141, 1164–1166.
Hibbs, M.A., Hess, D.C., Myers, C.L., Huttenhower, C., Li, J.M. and
Troyanskaya, O. (2007) Exploring the functional landscape ofgene expression: directed search of large microarray compendia.Bioinformatics, 23, 2692–2699.
de Hoon, M., Imoto, S., Nolan, J. and Miyano, S. (2004) Open sourceclustering software. Bioinformatics, 20, 1453–1454.
Hua, J., Sakai, H., Nourizadeh, S., Chen, Q.H.G., Bleecker, A.B.,
Ecker, J.R. and Meyerowitz, E.M. (1998) EIN4 and ERS2 aremembers of the putative ethylene receptor gene family inArabidopsis. Plant Cell, 10, 1321–1332.
Ivakhno, S. and Armstrong, J.D. (2007) Non-linear dimensionalityreduction of signaling networks. BMC Syst. Biol. 1, 27.
Kiba, T., Yamada, H. and Mizuno, T. (2002) Characterization of theARR15 and ARR16 response regulators with special reference tothe cytokinin signaling pathway mediated by the AHK4 histidinekinase in roots of Arabidopsis thaliana. Plant Cell Physiol. 43,1059–1066.
Kiba, T., Aoki, K., Sakakibara, H. and Mizuno, T. (2004) Arabidopsisresponse regulator, ARR22, ectopic expression of which results inphenotypes similar to the wol cytokinin-receptor mutant. PlantCell Physiol. 45, 1063–1077.
Kiba, T., Naitou, T., Koizumi, N., Yamashino, T., Sakakibara, H. and
Mizuno, T. (2005) Combinatorial microarray analysis revealingArabidopsis genes implicated in cytokinin responses throughthe His fi Asp phosphorelay circuitry. Plant Cell Physiol. 46, 339–355.
Kilian, J., Whitehead, D., Horak, J., Wanke, D., Weinl, S., Batistic, O.,
D’Angelo, C., Bornberg-Bauer, E., Kudla, J. and Harter, K. (2007)The AtGenExpress global stress expression data set: protocols,evaluation and model data analysis of UV-B light, drought andcold stress responses. Plant J. 50, 347–363.
Kim, T.W., Hwang, J.Y., Kim, Y.S., Joo, S.H., Chang, S.C., Lee, J.S.,
Takatsuto, S. and Kim, S.K. (2005) Arabidopsis CYP85A2, acytochrome P450, mediates the Baeyer–Villiger oxidation of cas-tasterone to brassinolide in brassinosteroid biosynthesis. PlantCell, 17, 2397–2412.
Koornneef, M. and Van Der Veen, J.H. (1980) Induction and analysisof gibberellin sensitive mutants in Arabidopsis thaliana. Thor.Appl. Genet. 58, 257–263.
Lepiniec, L., Debeaujon, I., Routaboul, J.M., Baudry, A., Pourcel, L.,
Nesi, N. and Caboche, M. (2006) Genetics and biochemistry ofseed flavonoids. Annu. Rev. Plant Biol. 57, 405–430.
Li, J.M., Nagpal, P., Vitart, V., McMorris, T.C. and Chory, J. (1996) Arole for brassinosteroids in light-dependent development ofArabidopsis. Science, 272, 398–401.
Lorenzo, O., Chico, J.M., Sanchez-Serrano, J.J. and Solano, R.
(2004) Jasmonate-insensitive1 encodes a MYC transcription fac-tor essential to discriminate between different jasmonate-regu-lated defense responses in Arabidopsis. Plant Cell, 16, 1938–1950.
Maruyama-Nakashita, A., Nakamura, Y., Watanabe-Takahashi, A.,
Inoue, E., Yamaya, T. and Takahashi, H. (2005) Identification of anovel cis-acting element conferring sulfur deficiency response inArabidopsis roots. Plant J. 42, 305–314.
Mathur, J., Molnar, G., Fujioka, S. et al. (1998) Transcription of theArabidopsis CPD gene, encoding a steroidogenic cytochromeP450, is negatively controlled by brassinosteroids. Plant J. 14,593–602.
Molnar, G., Bancos, S., Nagy, F. and Szekeres, M. (2002) Charac-terisation of BRH1, a brassinosteroid-responsive RING-H2 genefrom Arabidopsis thaliana. Planta, 215, 127–133.
Mussig, C., Biesgen, C., Lisso, J., Uwer, U., Weiler, E.W. and
Altmann, T. (2000) A novel stress-inducible 12-oxophytodienoatereductase from Arabidopsis thaliana provides a potential linkbetween brassinosteroid-action and jasmonic-acid synthesis.J. Plant Physiol. 157, 143–152.
Nafisi, M., Goregaoker, S., Botanga, C., Glawischnig, E., Olsen, C.,
Halkier, B. and Glazebrook, J. (2007) Arabidopsis cytochromeP450 monooxygenase 71A13 catalyzes the conversion ofindole-3-acetaldoxime in camalexin synthesis. Plant Cell, 19,2039–2052.
Nakabayashi, K., Okamoto, M., Koshiba, T., Kamiya, Y. and Nam-
bara, E. (2005) Genome-wide profiling of stored mRNA in Ara-bidopsis thaliana seed germination: epigenetic and geneticregulation of transcription in seed. Plant J. 41, 697–709.
Nakamura, A., Nakajima, N., Goda, H., Shimada, Y., Hayashi, K.,
Nozaki, H., Asami, T., Yoshida, S. and Fujioka, S. (2006) Arabid-opsis Aux/IAA genes are involved in brassinosteroid-mediatedgrowth responses in a manner dependent on organ type. Plant J.45, 193–205.
Nemhauser, J.L., Mockler, T.C. and Chory, J. (2004) Interdepen-dency of brassinosteroid and auxin signaling in Arabidopsis.PLoS Biol. 2, 1460–1471.
Nemhauser, J.L., Hong, F.X. and Chory, J. (2006) Different planthormones regulate similar processes through largely nonover-lapping transcriptional responses. Cell, 126, 467–475.
Noguchi, T., Fujioka, S., Choe, S., Takatsuto, S., Tax, F.E., Yoshida,
S. and Feldmann, K.A. (2000) Biosynthetic pathways of brassin-olide in Arabidopsis. Plant Physiol. 124, 201–209.
Nomura, T., Kushiro, T., Yokota, T., Kamiya, Y., Bishop, G.J. and
Yamaguchi, S. (2005) The last reaction producing brassinolide iscatalyzed by cytochrome P-450s, CYP85A3 in tomato andCYP85A2 in Arabidopsis. J. Biol. Chem. 280, 17873–17879.
Obayashi, T., Kinoshita, K., Nakai, K., Shibaoka, M., Hayashi, S.,
Saeki, M., Shibata, D., Saito, K. and Ohta, H. (2007) ATTED-II: adatabase of co-expressed genes and cis elements for identifyingco-regulated gene groups in Arabidopsis. Nucleic Acids Res. 35,D863–D869.
Ogawa, M., Hanada, A., Yamauchi, Y., Kuwahara, A., Kamiya, Y. and
Yamaguchi, S. (2003) Gibberellin biosynthesis and responseduring Arabidopsis seed germination. Plant Cell, 15, 1591–1604.
Redman, J., Haas, B., Tanimoto, G. and Town, C. (2004) Develop-ment and evaluation of an Arabidopsis whole genome Affymetrixprobe array. Plant J. 38, 545–561.
Rhee, S., Beavis, W., Berardini, T. et al. (2003) The ArabidopsisInformation Resource (TAIR): a model organism database pro-viding a centralized, curated gateway to Arabidopsis biology,research materials and community. Nucleic Acids Res. 31, 224–228.
Saito, K., Hirai, M.Y. and Yonekura-Sakakibara, K. (2008) Decodinggenes by coexpression network and metabolomics – majorityreport by precogs. Trends Plant Sci. 13, 36–43.
Saldanha, A. (2004) Java Treeview – extensible visualization ofmicroarray data. Bioinformatics, 20, 3246–3248.
Sawa, S., Ohgishi, M., Goda, H., Higuchi, K., Shimada, Y., Yoshida,
S. and Koshiba, T. (2002) The HAT2 gene, a member of the HD-Zipgene family, isolated as an auxin inducible gene by DNA micro-array screening, affects auxin response in Arabidopsis. Plant J.32, 1011–1022.
Schmid, M., Davison, T.S., Henz, S.R., Pape, U.J., Demar, M.,
Vingron, M., Scholkopf, B., Weigel, D. and Lohmann, J.U. (2005)A gene expression map of Arabidopsis thaliana development.Nat. Genet. 37, 501–506.
Seo, H.S., Song, J.T., Cheong, J.J., Lee, Y.H., Lee, Y.W., Hwang, I.,
Lee, J.S. and Choi, Y.D. (2001) Jasmonic acid carboxyl methyl-
AtGenExpress hormone data 541
ª 2008 The AuthorsJournal compilation ª 2008 Blackwell Publishing Ltd, The Plant Journal, (2008), 55, 526–542
transferase: a key enzyme for jasmonate-regulated plantresponses. Proc. Natl Acad. Sci. 98, 4788–4793.
Shimada, Y., Goda, H., Nakamura, A., Takatsuto, S., Fujioka, S. and
Yoshida, S. (2003) Organ-specific expression of brassinosteroid-biosynthetic genes and distribution of endogenous brassinos-teroids in Arabidopsis. Plant Physiol. 131, 287–297.
Steinhauser, D., Junker, B.H., Luedemann, A., Selbig, J. and Kopka,
J. (2004) Hypothesis-driven approach to predict transcriptionalunits from gene expression data. Bioinformatics, 20, 1928–1939.
Storey, J. and Tibshirani, R. (2003) Statistical significance forgenome-wide experiments. Proc. Natl Acad. Sci. USA, 100,9440–9445.
Szekeres, M., Nemeth, K., Koncz-Kalman, Z., Mathur, J., Kausch-
mann, A., Altmann, T., Redei, G.P., Nagy, F., Schell, J. and Koncz,
C. (1996) Brassinosteroids rescue the deficiency of CYP90, acytochrome P450, controlling cell elongation and de-etiolation inArabidopsis. Cell, 85, 171–182.
Taniguchi, M., Kiba, T., Sakakibara, H., Ueguchi, C., Mizuno, T. and
Sugiyama, T. (1998) Expression of Arabidopsis response regula-tor homologs is induced by cytokinins and nitrate. FEBS Lett. 429,259–262.
Tohge, T., Nishiyama, Y., Hirai, M.Y. et al. (2005) Functional geno-mics by integrated and transcriptome of Arabidopsis MYB tran-scription factor. Plant J. 42, 218–235.
Toufighi, K., Brady, S.M., Austin, R., Ly, E. and Provart, N.J. (2005)The botany array resource: e-Northerns, expression angling, andpromoter analyses. Plant J. 43, 153–163.
Wang, Z.Y., Nakano, T., Gendron, J. et al. (2002) Nuclear-localizedBZR1 mediates brassinosteroid-induced growth and feedback
suppression of brassinosteroid biosynthesis. Dev. Cell, 2, 505–513.
Wilhelm, K. and Thomashow, M. (1993) Arabidopsis thalianaCOR15B, an apparent homolog of COR15A, is strongly res-ponsive to cold and ABA, but not drought. Plant Mol. Biol. 23,1073–1077.
Winter, D., Vinegar, B., Nahal, H., Ammar, R., Wilson, G. and
Provart, N. (2007) An ‘electronic fluorescent pictograph’ browserfor exploring and analyzing large-scale biological data sets. PLoSONE, 2, e718.
Yamaguchi-Shinozaki, K. and Shinozaki, K. (1993) Characterizationof the expression of a desiccation-responsive Rd29 gene ofArabidopsis thaliana and analysis of its promoter in transgenicplants. Mol. Gen. Genet. 236, 331–340.
Yamauchi, Y., Ogawa, M., Kuwahara, A., Hanada, A., Kamiya, Y. and
Yamaguchi, S. (2004) Activation of gibberellin biosynthesis andresponse pathways by low temperature during imbibition ofArabidopsis seeds. Plant Cell, 16, 367–378.
Yonekura-Sakakibara, K., Tohge, T., Niida, R. and Saito, K. (2007)Identification of a flavonol 7-O-rhamnosyltransferase genedetermining flavonoid pattern in Arabidopsis by transcriptomecoexpression analysis and reverse genetics. J. Biol. Chem. 282,14932–14941.
Zimmermann, P., Hirsch-Hoffmann, M., Hennig, L. and Gruissem,
W. (2004) GENEVESTIGATOR. Arabidopsis microarray databaseand analysis toolbox. Plant Physiol.. 136, 2621–2632.
Zimmermann, P., Hennig, L. and Gruissem, W. (2005) Gene-expression analysis and network discovery using Genevestigator.Trends Plant Sci. 10, 407–409.
542 Hideki Goda et al.
ª 2008 The AuthorsJournal compilation ª 2008 Blackwell Publishing Ltd, The Plant Journal, (2008), 55, 526–542
Copyright © 2022 FDOKUMEN