The Atacama Cosmology Telescope: Cosmological Parameters from the 2008 Power Spectra
20
arXiv:1009.0866v1 [astro-ph.CO] 4 Sep 2010 Draft version September 7, 2010 Preprint typeset using L A T E X style emulateapj v. 08/13/06 THE ATACAMA COSMOLOGY TELESCOPE: COSMOLOGICAL PARAMETERS FROM THE 2008 POWER SPECTRA J. Dunkley 1,2,3 , R. Hlozek 1 , J. Sievers 4 , V. Acquaviva 5,3 , P. A. R. Ade 6 , P. Aguirre 7 , M. Amiri 8 , J. W. Appel 2 , L. F. Barrientos 7 , E. S. Battistelli 9,8 , J. R. Bond 4 , B. Brown 10 , B. Burger 8 , J. Chervenak 11 , S. Das 12,2,3 , M. J. Devlin 13 , S. R. Dicker 13 , W. Bertrand Doriese 14 , R. D¨ unner 7 , T. Essinger-Hileman 2 , R. P. Fisher 2 , J. W. Fowler 14,2 , A. Hajian 4,3,2 , M. Halpern 8 , M. Hasselfield 8 , C. Hern´ andez-Monteagudo 15 , G. C. Hilton 14 , M. Hilton 16,17 , A. D. Hincks 2 , K. M. Huffenberger 18 , D. H. Hughes 19 , J. P. Hughes 5 , L. Infante 7 , K. D. Irwin 14 , J. B. Juin 7 , M. Kaul 13 , J. Klein 13 , A. Kosowsky 10 , J. M Lau 20,21,2 , M. Limon 22,13,2 , Y-T. Lin 23,3,7 , R. H. Lupton 3 , T. A. Marriage 24,3 , D. Marsden 13 , P. Mauskopf 6 , F. Menanteau 5 , K. Moodley 16,17 , H. Moseley 11 , C. B Netterfield 25 , M. D. Niemack 14,2 , M. R. Nolta 4 , L. A. Page 2 , L. Parker 2 , B. Partridge 26 , B. Reid 27,2 , N. Sehgal 20 , B. Sherwin 2 , D. N. Spergel 3 , S. T. Staggs 2 , D. S. Swetz 13,14 , E. R. Switzer 28,2 , R. Thornton 13,29 , H. Trac 30,31 , C. Tucker 6 , R. Warne 16 , E. Wollack 11 , Y. Zhao 2 Draft version September 7, 2010 ABSTRACT We present cosmological parameters derived from the angular power spectrum of the cosmic mi- crowave background (CMB) radiation observed at 148 GHz and 218 GHz over 296 deg 2 with the At- acama Cosmology Telescope (ACT) during its 2008 season. ACT measures fluctuations at scales 500 <ℓ< 10000. We fit a model for the lensed CMB, Sunyaev-Zel’dovich (SZ), and foreground contribution to the 148 GHz and 218 GHz power spectra, including thermal and kinetic SZ, Poisson power from radio and infrared point sources, and clustered power from infrared point sources. At ℓ = 3000, about half the power at 148GHz comes from primary CMB after masking bright radio sources. The power from thermal and kinetic SZ is estimated to be B 3000 =6.8 ± 2.9 μK 2 , where B ℓ ≡ ℓ(ℓ + 1)C ℓ /2π. The IR Poisson power at 148GHz is B 3000 =7.8 ± 0.7 μK 2 (C ℓ =5.5 ± 0.5 nK 2 ), and a clustered IR component is required with B 3000 =4.6 ± 0.9 μK 2 , assuming an analytic model for its power spectrum shape. At 218 GHz only about 15% of the power, approximately 27 μK 2 , is CMB anisotropy at ℓ = 3000. The remaining 85% is attributed to IR sources (approximately 50% Poisson and 35% clustered), with spectral index α =3.69 ± 0.14 for flux scaling as S(ν ) ∝ ν α . We estimate primary cosmological parameters from the less contaminated 148 GHz spectrum, marginalizing over SZ and source power. The ΛCDM cosmological model is a good fit to the data (χ 2 /dof = 29/46), and ΛCDM parameters estimated from ACT+WMAP are consistent with the 7-year WMAP limits, with scale invariant n s = 1 excluded at 99.7% CL (3σ). A model with no CMB lensing is disfavored at 2.8σ. By measuring the third to seventh acoustic peaks, and probing the Silk damping regime, the ACT data improve limits on cosmological parameters that affect the small-scale CMB power. The ACT data combined with WMAP give a 6σ detection of primordial helium, with Y P =0.313 ± 0.044, and a 4σ detection of relativistic species, assumed to be neutrinos, with N eff =5.3 ± 1.3 (4.6 ± 0.8 with BAO+H 0 data). From the CMB alone the running of the spectral index is constrained to be dn s /d ln k = −0.034 ± 0.018, the limit on the tensor-to-scalar ratio is r< 0.25 (95% CL), and the possible contribution of Nambu cosmic strings to the power spectrum is constrained to string tension Gμ < 1.6 × 10 −7 (95% CL). Subject headings: cosmology: cosmic microwave background, cosmology: observations 1 Sub-department of Astrophysics, University of Oxford, Denys Wilkinson Building, Keble Road, Oxford OX1 3RH, UK 2 Joseph Henry Laboratories of Physics, Jadwin Hall, Princeton University, Princeton, NJ, USA 08544 3 Department of Astrophysical Sciences, Peyton Hall, Princeton University, Princeton, NJ USA 08544 4 Canadian Institute for Theoretical Astrophysics, University of Toronto, Toronto, ON, Canada M5S 3H8 5 Department of Physics and Astronomy, Rutgers, The State University of New Jersey, Piscataway, NJ USA 08854-8019 6 School of Physics and Astronomy, Cardiff University, The Pa- rade, Cardiff, Wales, UK CF24 3AA 7 Departamento de Astronom´ ıa y Astrof´ ısica, Facultad de F´ ısica, Pontific´ ıa Universidad Cat´olica, Casilla 306, Santiago 22, Chile 8 Department of Physics and Astronomy, University of British Columbia, Vancouver, BC, Canada V6T 1Z4 9 Department of Physics, University of Rome “La Sapienza”, Pi- azzale Aldo Moro 5, I-00185 Rome, Italy 10 Department of Physics and Astronomy, University of Pitts- burgh, Pittsburgh, PA, USA 15260 11 Code 553/665, NASA/Goddard Space Flight Center, Green- belt, MD, USA 20771 12 Berkeley Center for Cosmological Physics, LBL and Depart- ment of Physics, University of California, Berkeley, CA, USA 94720 13 Department of Physics and Astronomy, University of Pennsyl- vania, 209 South 33rd Street, Philadelphia, PA, USA 19104 14 NIST Quantum Devices Group, 325 Broadway Mailcode 817.03, Boulder, CO, USA 80305 15 Max Planck Institut f¨ ur Astrophysik, Postfach 1317, D-85741 Garching bei M¨ unchen, Germany 16 Astrophysics and Cosmology Research Unit, School of Math- ematical Sciences, University of KwaZulu-Natal, Durban, 4041, South Africa 17 Centre for High Performance Computing, CSIR Campus, 15 Lower Hope St., Rosebank, Cape Town, South Africa 18 Department of Physics, University of Miami, Coral Gables, FL, USA 33124 19 Instituto Nacional de Astrof´ ısica, ´ Optica y Electr´ onica (INAOE), Tonantzintla, Puebla, Mexico 20 Kavli Institute for Particle Astrophysics and Cosmology, Stan- ford University, Stanford, CA, USA 94305-4085
Transcript of The Atacama Cosmology Telescope: Cosmological Parameters from the 2008 Power Spectra
arX
iv:1
009.
0866
v1 [
astr
o-ph
.CO
] 4
Sep
201
0Draft version September 7, 2010Preprint typeset using LATEX style emulateapj v. 08/13/06
THE ATACAMA COSMOLOGY TELESCOPE: COSMOLOGICAL PARAMETERS FROM THE 2008 POWERSPECTRA
J. Dunkley1,2,3, R. Hlozek1, J. Sievers4, V. Acquaviva5,3, P. A. R. Ade6, P. Aguirre7, M. Amiri8, J. W. Appel2,L. F. Barrientos7, E. S. Battistelli9,8, J. R. Bond4, B. Brown10, B. Burger8, J. Chervenak11, S. Das12,2,3,M. J. Devlin13, S. R. Dicker13, W. Bertrand Doriese14, R. Dunner7, T. Essinger-Hileman2, R. P. Fisher2,
J. W. Fowler14,2, A. Hajian4,3,2, M. Halpern8, M. Hasselfield8, C. Hernandez-Monteagudo15, G. C. Hilton14,M. Hilton16,17, A. D. Hincks2, K. M. Huffenberger18, D. H. Hughes19, J. P. Hughes5, L. Infante7, K. D. Irwin14,J. B. Juin7, M. Kaul13, J. Klein13, A. Kosowsky10, J. M Lau20,21,2, M. Limon22,13,2, Y-T. Lin23,3,7, R. H. Lupton3,
T. A. Marriage24,3, D. Marsden13, P. Mauskopf6, F. Menanteau5, K. Moodley16,17, H. Moseley11,C. B Netterfield25, M. D. Niemack14,2, M. R. Nolta4, L. A. Page2, L. Parker2, B. Partridge26, B. Reid27,2,
N. Sehgal20, B. Sherwin2, D. N. Spergel3, S. T. Staggs2, D. S. Swetz13,14, E. R. Switzer28,2, R. Thornton13,29,H. Trac30,31, C. Tucker6, R. Warne16, E. Wollack11, Y. Zhao2
Draft version September 7, 2010
ABSTRACT
We present cosmological parameters derived from the angular power spectrum of the cosmic mi-crowave background (CMB) radiation observed at 148GHz and 218GHz over 296deg2 with the At-acama Cosmology Telescope (ACT) during its 2008 season. ACT measures fluctuations at scales500 < ℓ < 10000. We fit a model for the lensed CMB, Sunyaev-Zel’dovich (SZ), and foregroundcontribution to the 148GHz and 218GHz power spectra, including thermal and kinetic SZ, Poissonpower from radio and infrared point sources, and clustered power from infrared point sources. Atℓ = 3000, about half the power at 148GHz comes from primary CMB after masking bright radiosources. The power from thermal and kinetic SZ is estimated to be B3000 = 6.8 ± 2.9 µK2, whereBℓ ≡ ℓ(ℓ+1)Cℓ/2π. The IR Poisson power at 148GHz is B3000 = 7.8± 0.7 µK2 (Cℓ = 5.5± 0.5 nK2),and a clustered IR component is required with B3000 = 4.6± 0.9 µK2, assuming an analytic model forits power spectrum shape. At 218GHz only about 15% of the power, approximately 27 µK2, is CMBanisotropy at ℓ = 3000. The remaining 85% is attributed to IR sources (approximately 50% Poissonand 35% clustered), with spectral index α = 3.69 ± 0.14 for flux scaling as S(ν) ∝ να. We estimateprimary cosmological parameters from the less contaminated 148GHz spectrum, marginalizing overSZ and source power. The ΛCDM cosmological model is a good fit to the data (χ2/dof = 29/46),and ΛCDM parameters estimated from ACT+WMAP are consistent with the 7-year WMAP limits,with scale invariant ns = 1 excluded at 99.7% CL (3σ). A model with no CMB lensing is disfavoredat 2.8σ. By measuring the third to seventh acoustic peaks, and probing the Silk damping regime, theACT data improve limits on cosmological parameters that affect the small-scale CMB power. TheACT data combined with WMAP give a 6σ detection of primordial helium, with YP = 0.313± 0.044,and a 4σ detection of relativistic species, assumed to be neutrinos, with Neff = 5.3 ± 1.3 (4.6 ± 0.8with BAO+H0 data). From the CMB alone the running of the spectral index is constrained to bedns/d ln k = −0.034 ± 0.018, the limit on the tensor-to-scalar ratio is r < 0.25 (95% CL), and thepossible contribution of Nambu cosmic strings to the power spectrum is constrained to string tensionGµ < 1.6× 10⁻⁷ (95% CL).
Subject headings: cosmology: cosmic microwave background, cosmology: observations
1 Sub-department of Astrophysics, University of Oxford, DenysWilkinson Building, Keble Road, Oxford OX1 3RH, UK
2 Joseph Henry Laboratories of Physics, Jadwin Hall, PrincetonUniversity, Princeton, NJ, USA 08544
3 Department of Astrophysical Sciences, Peyton Hall, PrincetonUniversity, Princeton, NJ USA 08544
4 Canadian Institute for Theoretical Astrophysics, University ofToronto, Toronto, ON, Canada M5S 3H8
5 Department of Physics and Astronomy, Rutgers, The StateUniversity of New Jersey, Piscataway, NJ USA 08854-8019
6 School of Physics and Astronomy, Cardiff University, The Pa-rade, Cardiff, Wales, UK CF24 3AA
7 Departamento de Astronomıa y Astrofısica, Facultad de Fısica,Pontificıa Universidad Catolica, Casilla 306, Santiago 22, Chile
8 Department of Physics and Astronomy, University of BritishColumbia, Vancouver, BC, Canada V6T 1Z4
9 Department of Physics, University of Rome “La Sapienza”, Pi-azzale Aldo Moro 5, I-00185 Rome, Italy
10 Department of Physics and Astronomy, University of Pitts-burgh, Pittsburgh, PA, USA 15260
11 Code 553/665, NASA/Goddard Space Flight Center, Green-
belt, MD, USA 2077112 Berkeley Center for Cosmological Physics, LBL and Depart-
ment of Physics, University of California, Berkeley, CA, USA 9472013 Department of Physics and Astronomy, University of Pennsyl-
vania, 209 South 33rd Street, Philadelphia, PA, USA 1910414 NIST Quantum Devices Group, 325 Broadway Mailcode
817.03, Boulder, CO, USA 8030515 Max Planck Institut fur Astrophysik, Postfach 1317, D-85741
Garching bei Munchen, Germany16 Astrophysics and Cosmology Research Unit, School of Math-
ematical Sciences, University of KwaZulu-Natal, Durban, 4041,South Africa
17 Centre for High Performance Computing, CSIR Campus, 15Lower Hope St., Rosebank, Cape Town, South Africa
18 Department of Physics, University of Miami, Coral Gables,FL, USA 33124
19 Instituto Nacional de Astrofısica, Optica y Electronica(INAOE), Tonantzintla, Puebla, Mexico
20 Kavli Institute for Particle Astrophysics and Cosmology, Stan-ford University, Stanford, CA, USA 94305-4085
2 J. Dunkley et al.
1. INTRODUCTION
Measurements of anisotropies in the cosmic microwavebackground (CMB) have played a central role in thedevelopment of the current concordance cosmologicalmodel (e.g., Smoot et al. 1992; Miller et al. 1999; deBernardis et al. 2000; Hanany et al. 2000; Spergel et al.2003). The ΛCDM model describes a flat universe with5% normal matter, 23% dark matter, 72% dark energy,and power-law Gaussian primordial fluctuations consis-tent with simple inflationary models (see e.g., Komatsuet al. 2010). Its parameters have been measured to afew percent level accuracy, using CMB data from theWMAP satellite and higher resolution experiments, com-bined with observations of large scale structure and thelocal expansion rate (Brown et al. 2009; Riess et al. 2009;Reid et al. 2010; Percival et al. 2010; Larson et al. 2010;Komatsu et al. 2010). The model fits a range of recentastronomical data including Type Ia supernova (Hickenet al. 2009; Kessler et al. 2009), galaxy cluster mea-surements (Vikhlinin et al. 2009; Mantz et al. 2010b;Rozo et al. 2010) and gravitational lensing observations(Massey et al. 2007; Fu et al. 2008; Schrabback et al.2010; Suyu et al. 2010).The WMAP satellite has measured the CMB over the
full sky down to 0.2 resolution. Measurements at higherresolution have been made by a set of complementaryballoon and ground-based experiments (e.g., Jones et al.2006; Brown et al. 2009; Reichardt et al. 2009; Sieverset al. 2009). The Atacama Cosmology Telescope (ACT)now measures fluctuations on scales from ≃0.4 to anarcminute. The signal observed in this angular rangeis composed of the damped acoustic peaks of the pri-mordial CMB signal (Silk 1968), subsequently lensed bylarge-scale structure, as well as point source emissionand fluctuations due to the Sunyaev-Zel’dovich (SZ) ef-fect (Sunyaev & Zel’dovich 1970), in which CMB photonsscatter off electrons in the hot intra-cluster and filamen-tary inter-galactic media. Limits on the SZ power spec-trum have been reported from the ACBAR, CBI andSZA experiments (Reichardt et al. 2009; Sievers et al.2009; Sharp et al. 2010), with a recent detection re-ported by the South Pole Telescope (SPT) (Lueker et al.2009). The first power spectrum measurement from ACT(Fowler et al. 2010) provided a limit on the SZ power
21 Department of Physics, Stanford University, Stanford, CA,USA 94305-4085
22 Columbia Astrophysics Laboratory, 550 W. 120th St. MailCode 5247, New York, NY USA 10027
23 Institute for the Physics and Mathematics of the Universe,The University of Tokyo, Kashiwa, Chiba 277-8568, Japan
24 Dept. of Physics and Astronomy, The Johns Hopkins Univer-sity, 3400 N. Charles St., Baltimore, MD 21218-2686
25 Department of Physics, University of Toronto, 60 St. GeorgeStreet, Toronto, ON, Canada M5S 1A7
26 Department of Physics and Astronomy, Haverford College,Haverford, PA, USA 19041
27 Institut de Ciencies del Cosmos (ICC), University ofBarcelona, Barcelona 08028, Spain
28 Kavli Institute for Cosmological Physics, 5620 South EllisAve., Chicago, IL, USA 60637
29 Department of Physics , West Chester University of Pennsyl-vania, West Chester, PA, USA 19383
30 Department of Physics, Carnegie Mellon University, Pitts-burgh, PA 15213
31 Harvard-Smithsonian Center for Astrophysics, Harvard Uni-versity, Cambridge, MA, USA 02138
spectrum, as well as on the point source contribution.In this paper we present cosmological parameter con-
straints from power spectra estimated from the ACT2008 observing season. We use the power spectrum toconstrain a model for the SZ and point source contribu-tion in the ACT 148GHz and 218GHz data. We thencombine the ACT 148GHz data with WMAP observa-tions, and additional cosmological distance measures, toconstrain the ΛCDM model and a set of extensions thathave particular effects at small scales.This is one of a set of papers on the ACT 2008 data
in the southern sky: Swetz et al. (2010) describes theACT experiment; Dunner et al. (2010) describes theobserving strategy and the data; Hajian et al. (2010)describes the calibration to WMAP; Das et al. (2010)presents the power spectra measured at 148GHz and218GHz, and this paper estimates parameters from thepower spectrum results. A high-significance SZ galaxycluster catalog is presented in Marriage et al. (2010a),with multi-wavelength observations described in Menan-teau et al. (2010) and their cosmological interpretationin Sehgal et al. (2010b). Marriage et al. (2010b) presentsthe 148GHz point source catalog. Hincks et al. (2009)and Fowler et al. (2010) presented the first maps of clus-ters and power spectra respectively, from a preliminaryversion of these maps. Improved map-making and powerspectrum estimates, with use of a larger area of sky, nowallow us to place new constraints on cosmological models.The paper is structured as follows. In §2 we describe
the ACT likelihood and parameter estimation method-ology. In §3 we present results on SZ and point sourceparameters from the small-scale power spectra. In §4 wepresent constraints on a set of cosmological models incombination with other cosmological data, and concludein §5.
2. METHODOLOGY
This section describes the methods used to estimateparameters from the ACT power spectra. The powerspectra, estimated from 296deg2 of sky observed in 2008,are described in Das et al. (2010), and details of the ex-periment, data reduction and map-making are describedin Swetz et al. (2010) and Dunner et al. (2010). Wewill estimate two sets of parameters: ‘primary’ and‘secondary’. Primary parameters describe the cosmo-logical model from which a theoretical primary CMBpower spectrum can be computed. Secondary parame-ters describe the additional power from SZ fluctuationsand foregrounds. We construct an ACT likelihood func-tion that returns the probability of the ACT data givensome theoretical CMB power spectrum and a set of sec-ondary parameters. Primary and secondary parametersare then estimated from ACT and additional datasets us-ing Markov Chain Monte Carlo (MCMC) methods. TheACT likelihood function is described in Section 2.1, andthe MCMC methods in 2.2.
2.1. ACT Likelihood
For maps of temperature fluctuations at 148GHz and218GHz, three cross-spectra are estimated in bands inthe range 500 < ℓ < 10000 for 148GHz, and 1500 <ℓ < 10000 for both the 218GHz and the 148× 218 GHzcross-spectrum (see Das et al. 2010). A likelihood func-tion is constructed to estimate parameters from these
ACT 2008 Parameters 3
spectra. The function returns the likelihood of the data,p(d|CCMB
ℓ ,Θ), given a theoretical lensed CMB spectrum,CCMB
ℓ , and a set of secondary parameters describing theadditional small-scale power, Θ. In this analysis we con-sider two likelihoods: the ‘148+218’ likelihood, whichreturns the likelihood of all three spectra given a model,and the ‘148-only’ likelihood, which returns the likeli-hood of just the 148GHz spectrum given a model.The temperature fluctuations in the ACT maps are
expected to be the sum of fluctuations from lensedCMB, thermal and kinetic SZ, radio point sources, in-frared point sources, and thermal dust emission from theGalaxy (see e.g., Sehgal et al. 2010a). These vary as func-tions of frequency. The lensed CMB and the kinetic SZare blackbody emission, and so are constant as a functionof frequency in thermodynamic units. The thermal SZemission has a known frequency dependence (Sunyaev& Zel’dovich 1970) and has negligible contribution at218GHz. The radio point sources emit synchrotron, andthe IR sources emit thermally, so both can be modeledas following power law emission in flux given a narrowenough frequency range. For frequency ν and directionn the signal in the maps can be modeled in thermal unitsas
∆T (ν, n) = ∆TCMB(n) +∆T SZ(ν, n) +∆T fg(ν, n), (1)
with lensed CMB fluctuations ∆TCMB(n). The SZ signalis the sum of thermal and kinetic components
∆T SZ(ν, n) =f(ν)
f(ν0)∆T tSZ
0 (n) + ∆T kSZ(n), (2)
where the factor f(ν) = 2 − (x/2)/ tanh(x/2), for x =hν/kBTCMB, converts the expected SZ emission fromthe Rayleigh-Jeans (RJ) limit to thermodynamic units,and ∆T tSZ
0 is the expected signal at frequency ν0. At218 GHz there is negligible thermal SZ signal, withf(218) = 0. The point source and Galactic componentsare modeled as
∆T fg(ν, n)=g(ν)
g(ν0)
∆T IR0
(
ν
ν0
)αd−2
+∆T rad0
(
ν
ν0
)αs−2
+∆TGal0
(
ν
ν0
)αg−2
, (3)
assuming that the IR and radio source emission in an-
tenna temperature, ∆T IR,rad0 , scale with global power
laws αd−2 and αs−2, respectively, where α is the indexin flux units. The factor g(ν) = (ex − 1)2/x2ex convertsfrom antenna to CMB thermodynamic temperature atfrequency ν. The factors are g = [1.71, 3.02] for 148GHzand 218GHz. Power law behavior is also assumed forthe Galactic dust emission ∆TGal
0 . This behavior is ex-pected to be a good approximation between 148GHz and218GHz, but breaks down over larger frequency ranges.To compute the likelihood one could first estimate the
CMB map, by subtracting off the foreground and SZcomponents. This is commonly done in CMB analysesfor subtracting Galactic components (e.g., Bennett et al.2003), and has also been used for subtracting the IRpoint sources (Hall et al. 2010; Lueker et al. 2009). How-ever, for the ACT frequencies and noise levels the radiosources cannot be neglected, so a linear combination of
the 148GHz and 218GHz maps will not remove all thesource contamination. Instead, we choose to construct amodel for the cross power spectra between frequency νiand νj ,
Cijℓ =
⟨
T ∗
ℓ (νi)Tℓ(νj)⟩
, (4)
where Tℓ is the Fourier transform of ∆T (n). For ACTanalysis we use a flat-sky approximation, described inDas et al. (2010). The individual components areassumed to be uncorrelated, so the theoretical cross-
spectrum Bth,ijℓ is modeled from Eq. 1 as
Bth,ijℓ = BCMB
ℓ +BtSZ,ijℓ +BkSZ,ij
ℓ +BIR,ijℓ +Brad,ij
ℓ +BGal,ijℓ ,
(5)where Bℓ ≡ ℓ(ℓ+ 1)Cℓ/2π. The first term, BCMB
ℓ , is thelensed primary CMB power spectrum and is the same atall frequencies. The thermal SZ (tSZ) power is modeledas
BtSZ,ijℓ = AtSZ
f(νi)
f(ν0)
f(νj)
f(ν0)BtSZ0,ℓ , (6)
where BtSZ0,ℓ is a template power spectrum corresponding
to the predicted tSZ emission at ν0 =148GHz for a modelwith σ8 = 0.8, to be described in Section 2.1.2, and AtSZ
is an amplitude parameter. The kinetic SZ (kSZ) poweris modeled as
BkSZ,ijℓ = AkSZB
kSZ0,ℓ , (7)
where BkSZ0,ℓ is a template spectrum for the predicted
blackbody kSZ emission for a model with σ8 = 0.8, alsodescribed in Section 2.1.2. The total SZ power is thengiven by
BSZ,ijℓ = AtSZ
f(νi)
f(ν0)
f(νj)
f(ν0)BtSZ0,ℓ +AkSZB
kSZ0,ℓ . (8)
The infrared point sources are expected to be clustered,and their power is modeled as
BIR,ijℓ =
[
Ad
(
ℓ
3000
)2
+AcBclust0,ℓ
]
g(νi)
g(ν0)
g(νj)
g(ν0)
(
νiν0
νjν0
)αd−2
(9)
where Ad and Ac are the values of BIR3000 at 148GHz for
Poisson and clustered dust terms respectively, assuminga normalized template spectrum Bclust
0,ℓ . This will be de-scribed in Section 2.1.3. This model assumes the samespectral index for the clustered and Poisson IR power.The radio sources are not expected to be significantlyclustered (see, e.g., Sharp et al. 2010; Hall et al. 2010),and so can be described by Poisson scale-free power, with
Brad,ijℓ = As
(
ℓ
3000
)2g(νi)
g(ν0)
g(νj)
g(ν0)
(
νiν0
νjν0
)αs−2
, (10)
with amplitude As normalized at ν0 =148GHz and ℓ =3000.Though we have described the pivot frequency as
ν0 =148GHz for all components in Eqs. 6-10, in practicewe use the band-centers for SZ, radio and dusty sourcesgiven in Table 4 of Swetz et al. (2010). The Galactic
emission, BGal,ijℓ , is expected to be sub-dominant on ACT
scales, as demonstrated in Das et al. (2010) using the

4 J. Dunkley et al.
FDS dust map (Finkbeiner et al. 1999) as a Galacticdust template, so is neglected in this analysis.Given SZ and clustered source templates, aside from
parameters constrained by BCMBℓ , this model has 7 free
parameters: five amplitudes AtSZ, AkSZ, Ad, Ac, As, andtwo spectral indices, αd, αs. As we will describe in Sec2.2.1, we impose priors on some of these and constrainothers. We refer to these parameters as ‘secondary’ pa-rameters, to distinguish them from ‘primary’ cosmologi-cal parameters describing the primordial fluctuations. Inpart of the analysis we will estimate parameters from the148GHz spectrum alone. In this case i = j and νi = ν0.The model in Eq. 5 then simplifies to
Bthℓ =BCMB
ℓ +AtSZBtSZ0,ℓ +AkSZB
kSZ0,ℓ
+(As +Ad)
(
ℓ
3000
)2
+AcBclust0,ℓ . (11)
This can be further simplified to
Bthℓ = BCMB
ℓ +ASZBSZ0,ℓ +Ap
(
ℓ
3000
)2
+AcBclust0,ℓ , (12)
where Ap = As + Ad is the total Poisson power atℓ = 3000, and ASZ = AkSZ = AtSZ measures the total SZpower, BSZ
0,ℓ = BtSZ0,ℓ + BkSZ
0,ℓ . This is the same parameter-
ization considered in Fowler et al. (2010), and has justthree secondary parameters: ASZ, Ap and Ac.Using this model, we can compute the theoretical spec-
tra for a given set of secondary parameters Θ, and fora given theoretical CMB temperature power spectrum.The data power spectra are not measured at every mul-tipole, so bandpower theoretical spectra are computed
using Cth,ijb = wij
bℓCth,ijℓ , where wij
bℓ is the bandpower win-dow function in band b for cross-spectrum ij, describedin Das et al. (2010).1 The data power spectra have cal-ibration uncertainties (to be described in Sec 2.1.1). Toaccount for these uncertainties we include two calibrationparameters y(νi), for each map i, that scale the estimated
data power spectra, C ijb , and their uncertainties, as
C ijb = y(νi)y(νj)C
ijb . (13)
The likelihood of the calibrated data is then given by
−2 lnL = (Cthb − Cb)
TΣ−1(Cthb − Cb) + ln detΣ, (14)
assuming Gaussian uncertainties on the measured band-powers with covariance matrix Σ. For the 148+218 like-lihood the model and data vectors Cth
b and Cb contain
three spectra, Cb = [C148,148b , C148,218
b , C218,218b ]. For the
148-only likelihood, Cb = C148,148b . We use the data
between 500 < ℓ < 10000 for the 148 × 148 GHz auto-spectrum, but restrict the range to 1500 < ℓ < 10000for the 218 × 218 GHz and the 148 × 218 GHz spectra.This range is chosen since for 148GHz at scales largerthan ℓ = 500 the signal cannot be accurately separatedfrom atmospheric noise, and for 218GHz the maps donot converge below ℓ = 1500, described in Das et al.(2010). The bandpower covariance matrixΣ is describedin the Appendix of Das et al. (2010), and includes cor-relations between the three spectra. Das et al. (2010)demonstrates with Monte-Carlo simulations that the co-variance is well modeled by a Gaussian distribution withnegligible correlation between bands.
1 Here we use the notation wbℓ for the bandpower window func-tions; Das et al. (2010) uses Bbℓ.
2.1.1. Calibration and beam uncertainty
The ACT calibration is described in Hajian et al.(2010). The 148GHz maps are calibrated using WMAP,resulting in a 2% map calibration error in temperatureunits, at effective ℓ = 700. The 218GHz maps are cal-ibrated using observations of Uranus, with a 7% cali-bration error at ℓ = 1500. The two calibration errorshave negligible covariance, and are treated as indepen-dent errors. For analyses using 148GHz data alone wemarginalize over the calibration uncertainty analyticallyfollowing Ganga et al. (1996) and Bridle et al. (2002). Forjoint analyses with the 148GHz and 218GHz data weexplicitly sample the calibration parameters y(νi) withGaussian priors of y(148) = 1.00 ± 0.02 and y(218) =1.00 ± 0.07. We check that the analytic and numeri-cal marginalization methods give the same results for148GHz.The beam window functions are described in Das et al.
(2010), and are estimated using maps of Saturn. Themaps are made with an independent pipeline to the ini-tial ACT beam estimates made in Hincks et al. (2009),but produce consistent results. The uncertainties onthe beam window functions are of order 0.7% for the148GHz band and 1.5% at 218GHz. Uncertainties in themeasured beams are incorporated using a likelihood ap-proximation described in Appendix A; the magnitude ofthe derived uncertainties is consistent with Hincks et al.(2009) and the uncertainties used in the parameter esti-mation in Fowler et al. (2010).
2.1.2. SZ templates
The thermal SZ template BtSZ0,ℓ describes the power
from tSZ temperature fluctuations from all clusters, nor-malized for a universe with amplitude of matter fluctu-ations σ8 = 0.8. There is uncertainty in the expectedshape and amplitude of this signal, arising due to incom-plete knowledge of the detailed gas physics that affectsthe integrated pressure of the clusters. Previous cosmo-logical studies, e.g., the ACBAR and CBI experiments,have used templates derived from hydrodynamical sim-ulations (Bond et al. 2005). The analysis for WMAP
used the analytic Komatsu-Seljak (K-S) spectrum de-rived from a halo model (Komatsu & Seljak 2001). Re-cent studies for SPT have considered simulations andanalytic templates from Sehgal et al. (2010a) and Shawet al. (2009).In this analysis we consider four thermal SZ tem-
plates, from Sehgal et al. (2010a), Trac, Bode, & Os-triker (2010), Battaglia et al. (2010), and Shaw et al.(2010). Trac, Bode, & Ostriker (2010) constructed sev-eral templates by processing a dark matter simulation toinclude gas in dark matter halos and in the filamentaryintergalactic medium. Their ‘standard’ model, which wasfirst described in Sehgal et al. (2010a), is referred to hereas ‘TBO-1’. It is based on the gas model in Bode, Os-triker, & Vikhlinin (2009), with the hot gas modeledwith a polytropic equation of state and in hydrostaticequilibrium, with star formation and feedback calibratedagainst observations of local clusters. This is the tem-plate considered in the ACT analysis by Fowler et al.(2010), and has a similar amplitude and shape to theK-S spectrum.Recent state-of-the-art simulations described in

ACT 2008 Parameters 5
Battaglia et al. (2010) have been used to predict the SZspectrum (referred to as ‘Battaglia’). Full hydrodynam-ical SPH simulations were made of large scale cosmicstructure, including radiative cooling, star formation,feedback from AGN and supernovae, and non-thermalpressure support. The predicted spectrum has 2/3 thepower compared to the TBO-1 spectrum and is more con-sistent with SZ measurements from SPT (Lueker et al.2009). It is also compatible with predictions made thatAGN heating would decrease the expected SZ power(Roychowdhury et al. 2005).These hydrodynamical simulations pre-date the SPT
observations, but there have also been recent develop-ments in simulating and modeling the expected SZ ef-fect in light of the SPT results in Lueker et al. (2009),and motivated by recent observations of the intra-clustermedium (see Trac, Bode, & Ostriker (2010) for a dis-cussion). In a second model described in Trac, Bode,& Ostriker (2010), the nonthermal20 model referred tohere as ‘TBO-2’, there is 20% non-thermal pressure sup-port, with increased star formation and reduced feed-back, which has the effect of lowering the predicted SZpower. The ‘Shaw’ model, described in Shaw et al.(2010), takes an analytic halo model approach, assum-ing hydrostatic equilibrium and a polytropic equation ofstate, with star formation, feedback from supernova andAGN, and energy transfer from dark matter to gas dur-ing mergers. It includes non-thermal pressure support.The spectra from each of these models are shown in Fig-ure 1, with all models normalized to σ8 = 0.8. We studyconstraints on all four templates. Apart from the TBO-1template, all have similar amplitudes of B3000 ≈ 5−6µK2
at ℓ = 3000, although the models have different amountsof star formation, feedback, and non-thermal support.The shape and amplitude of the expected kinetic SZ
power spectrum is highly uncertain. We use the kSZtemplate described in Sehgal et al. (2010a), also shownin Figure 1. The corresponding template for the non-thermal20 model in Trac, Bode, & Ostriker (2010) hasa similar amplitude. It is also consistent with predic-tions from second order perturbation theory (Hernandez-Monteagudo & Ho 2009). In this analysis the contamina-tion of the SZ signal by point sources is neglected, whichis shown in Lin et al. (2009) to be a good approximationfor radio galaxies. Lueker et al. (2009) show it is also agood assumption for IR sources for the current levels ofsensitivity.
2.1.3. Clustered source templates
The shape and amplitude of the power spectrum ofclustered dusty galaxies are not yet well characterized(Knox et al. 2001; Fernandez-Conde et al. 2008; Vieroet al. 2009; Hall et al. 2010), although there have beenmeasurements made by Viero et al. (2009) from theBLAST experiment. In Fowler et al. (2010) we adopteda simple power law model, with Bℓ ∝ ℓ. In this analysiswe move beyond this simple parameterization to considertwo alternative model templates. The first, ‘Src-1’, is ob-tained from the infrared source model described in Sec-tion 2.5.2 of Sehgal et al. (2010a). This model assumesthat the IR emission traces star formation in halos atz < 3, and that the number of IR galaxies in a givenhalo is proportional to its mass. For the spectral energydistribution (SED) of the galaxies, the model uses an ef-
Fig. 1.— Thermal SZ templates for four different models con-sidered in this analysis, and a single kSZ template, normalized at148GHz for cosmologies with σ8 = 0.8. The ‘TBO-1’ templateis from Sehgal et al. (2010a), described further in Trac, Bode, &Ostriker (2010) together with ‘TBO-2’, derived from N-body simu-lations. The ‘Battaglia’ model is derived from hydrodynamic SPHsimulations (Battaglia et al. 2010). The ‘Shaw’ model is based onan analytic halo model (Shaw et al. 2010). The ‘kSZ’ template isthe kinetic SZ template in Sehgal et al. (2010a). Two clustered IRsource templates considered (‘Src-1’ and ‘Src-2’) are described inSec 2.1.3 and normalized at ℓ = 3000. The IR source curves aremultiplied by ten for clarity.
fective graybody law in which the dust temperature is afunction of the CMB temperature, but its value at z = 0is a free parameter. The dust emissivity spectral indexand the typical IR luminosity and characteristic massesof the halos hosting IR galaxies are free parameters ofthe model. The model includes only the two-halo powerspectrum given in Eq. 24 of Sehgal et al. (2010a), withcontributions from pairs of galaxies in different halos.The parameters of the model have been updated fromSehgal et al. (2010a) to better fit the observed BLASTpower spectra at 250–500µm.2 This updated template isshown in Figure 1, normalized to unity at ℓ = 3000. Theshape is similar to the clustered model used in the SPTanalysis by Hall et al. (2010), peaking at ℓ ≃ 1000.We also consider the effect on our results of using an
alternative template, ‘Src-2’, that has both one-halo andtwo-halo power, following a halo model prescription sim-ilar to Viero et al. (2009). Dark matter halos are popu-lated using galaxy source counts from the source modelpresented in Lagache, Dole, & Puget (2003), and halooccupation distribution parameters are tuned to fit theBLAST power spectra. This normalized template is alsoshown in Figure 1. At large scales this has a similar shapeto the Src-1 template, but at small scales tends approx-imately to the Bℓ ∝ ℓ scaling adopted in Fowler et al.(2010), which was motivated by observations of galaxyclustering at small angles with typical correlation func-tion C(θ) ∝ θ−0.8 (Peebles 1980). The two templatesdiffer at ℓ > 3000, but at these angular scales the Pois-son power is expected to dominate over the clusteringterm.
2.1.4. Likelihood prescription
2 The updated parameters are β = 1.4, T0 = 25.5, M1 = 4×10¹¹,M2 = 2.5×10¹², Mcool = 5×10¹⁴, L⋆ = 2.3×10¹¹, with definitionsin Sehgal et al. (2010a).

6 J. Dunkley et al.
To summarize the methods, an analysis with the‘148+218’ likelihood follows these steps to return theACT likelihood for a given model:
• Select primary cosmological parameters, and com-pute a theoretical lensed CMB power spectrumBCMBℓ using the CAMB numerical Boltzmann code
(Lewis et al. 2000).
• Select values for secondary parameters Θ = AtSZ,AkSZ, Ad, Ac, As, αd, αs, and compute the total
theoretical power spectra Bth,ijℓ for 148×148, 148×
218 and 218× 218 using Eq. 5.
• Compute the bandpower theoretical power spectra
Cth,ijb = wij
bℓCth,ijℓ .
• Select values for the calibration factors for 148GHzand 218GHz, and compute the likelihood usingEq. 14 for 500 < ℓ < 10000 for 148 × 148 and1500 < ℓ < 10000 for 148× 218 and 218× 218.
• Add the likelihood term due to beam uncertainty,described in Appendix A.
A large part of our analysis uses only the 148GHz spec-trum. An analysis done with this ‘148-only’ likelihoodfollows these steps:
• Select primary cosmological parameters, and com-pute a theoretical lensed CMB power spectrumBCMBℓ using CAMB.
• Select values for secondary parameters Θ = ASZ,Ap, Ac and compute the total theoretical powerspectrum Bth
ℓ at 148GHz using Eq. 5.
• Compute the bandpower theoretical power spec-trum Cth
b = wbℓCthℓ .
• Compute the likelihood using Eq. 14 for 500 < ℓ <10000 for 148GHz.
• Add the likelihood term due to beam uncer-tainty, described in Appendix A, and analyticallymarginalize over the calibration uncertainty.
2.2. Parameter estimation methods
We use the ACT likelihood for two separate parameterinvestigations. The first uses the 148+218 likelihood toconstrain the secondary parameters, as our initial goal isto characterize the small-scale behavior, and investigatewhether this simple model sufficiently describes the ob-served emission. The second uses the 148-only likelihoodto constrain primary and secondary parameters.
2.2.1. Secondary parameters from 148 and 218GHz
For most of the investigation with the 148+218 likeli-hood we fix the primary cosmological parameters to thebest-fit ΛCDM parameters estimated from WMAP, asour goal is to characterize the small-scale power observedby ACT, and check the goodness of fit of this simplemodel. To map out the probability distribution for theseparameters we use an MCMC method. This uses theMetropolis algorithm to sample parameters (Metropo-lis et al. 1953), following the methodology described inDunkley et al. (2005).
There are seven possible secondary parameters, but wedo not allow them all to vary freely. The radio sources de-tected at 148GHz, described in Marriage et al. (2010b),are observed to have typical spectral index S(ν) ∝ ν−0.5
in flux units. By fitting a scaled source model fromToffolatti et al. (1998) to the detected sources, and us-ing it to extrapolate to fainter sources, Marriage et al.(2010b) predict a residual radio source power of Cℓ =2.8 ± 0.3 nK2. Converting units, we use these measure-ments to impose a Gaussian prior of As = 4.0± 0.4 µK2,and we fix αs = −0.5. We also fix AkSZ = AtSZ, asthe kSZ component is subdominant at 148GHz and theSZ models predict them to be the same for a given cos-mology. The other parameters (AtSZ, Ad, Ac, and αd)have uniform priors with positivity imposed on the am-plitudes. Parameter results are quoted using the meansand 68% confidence limits of the marginalized distribu-tions, with 95% upper or lower limits given when thedistribution is one-tailed. We also quote derived param-eters to indicate the power in different components at148GHz and 218GHz, for example the total power in SZat ℓ = 3000, BSZ
3000 ≡ (BkSZ + BtSZ)3000.
2.2.2. Parameters from 148GHz
In order to explore the probability distributions for aset of cosmological models, we use the 148-only likeli-hood for parameter estimation. The focus is on using the1000 < ℓ < 3000 spectrum to improve constraints on pri-mary cosmological parameters. It is important that theSZ and foregound contribution be marginalized over, butwe exclude the more contaminated 218GHz data giventhe current uncertainties in the foreground model. Tomap out the distribution for cosmological parameters weuse MCMC methods to explore the probability distribu-tions for various cosmological models.We parameterize cosmological models using
Ωbh2,Ωch
2,ΩΛ,∆2R, ns, τ. (15)
These are the basic ΛCDM parameters, describing a flatuniverse with baryon density Ωbh
2, cold dark matter(CDM) density Ωch
2, and a cosmological constant ΩΛ.Primordial perturbations are assumed to be scalar, adia-batic, and Gaussian, described by a power-law with spec-tral tilt ns, and amplitude ∆2
R, defined at pivot scale
k0 = 0.002/Mpc. We assume ‘instantaneous’ reioniza-tion, where the universe transitions from neutral to ion-ized over a redshift range ∆z = 0.5, with optical depth τ .Reionization likely takes place more slowly (e.g., Gnedin2000; Trac et al. 2008), but current CMB measurementsare insensitive to this choice (Larson et al. 2010). Wealso consider an additional set of primary parameters
dns/d lnk, r,Neff , YP , Gµ, (16)
that describe primordial perturbations with a runningscalar spectral index dns/d lnk, a tensor contributionwith tensor-to-scalar ratio r, a varying number of rel-ativistic species Neff , varying primordial Helium frac-tion YP , and cosmic strings with tension Gµ, usingthe Nambu string template described in Battye & Moss(2010). These parameters are added individually to theΛCDM model in order to look for possible deviationsfrom the concordance cosmology. Apart from Gµ theseparameters all take uniform priors, with positivity priorson r, Neff , and YP . The tensor spectral index is fixed at

ACT 2008 Parameters 7
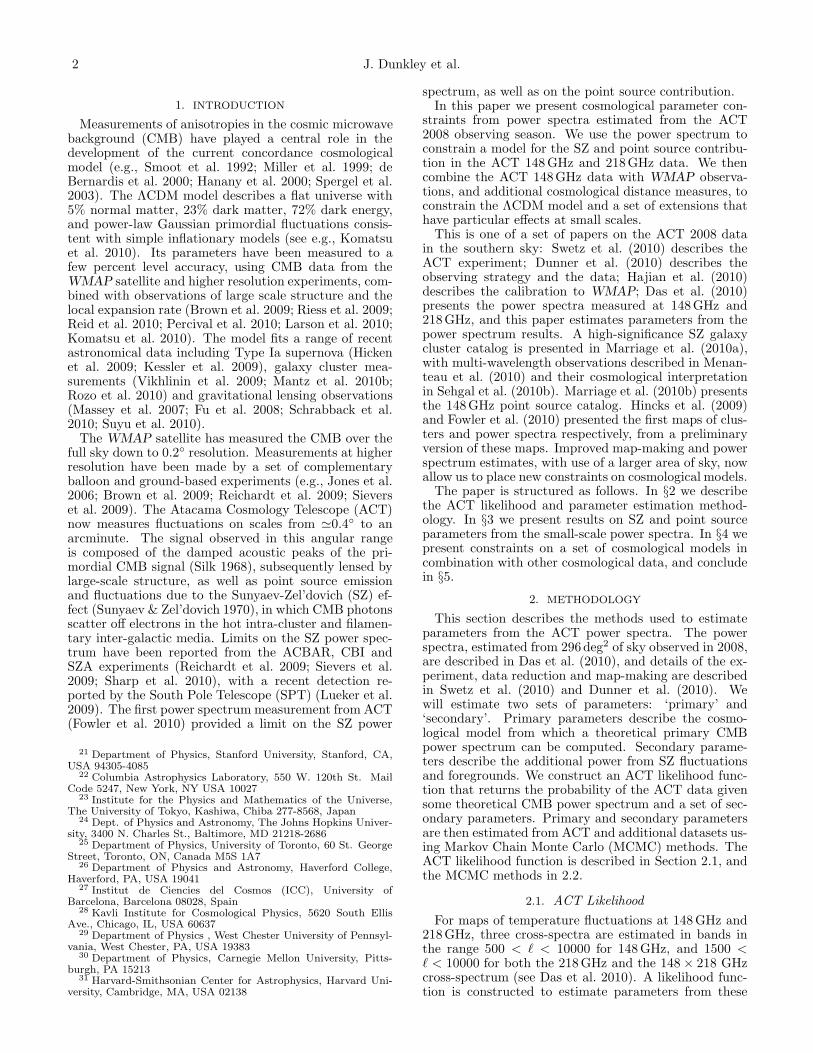
Fig. 2.— The angular power spectrum measured by ACT at 148GHz and 218GHz (Das et al. 2010), with the theoretical model forCMB, SZ, and point sources best-fit to the three spectra. The lensed CMB corresponds to the ΛCDM model with parameters derived fromWMAP (Komatsu et al. 2010). It dominates at large scales, but falls exponentially due to Silk damping. The majority of power at ℓ > 3000comes from extragalactic point sources below a ≈20 mJy flux cut after masking. The radio sources are sub-dominant, and are constrainedby a source model fit to detected sources at 148GHz (Marriage et al. 2010b). The infrared source emission, assumed to follow a powerlaw, is dominated by Poisson power at small scale, but about 1/3 of the IR power at ℓ = 3000 is attributed to clustered source emission,assuming a template described in the text. The best-fit SZ (thermal and kinetic) contribution at 148GHz (assuming the TBO-1 template,Sehgal et al. (2010a)) is 7µK2 at ℓ = 3000; the subdominant kinetic SZ also contributes at 218GHz. The data spectra and errors havebeen scaled by best-fit calibration factors of 1.022, 1.02 × 1.09 and 1.092 for the 148 × 148, 148 × 218, and 218× 218 spectra respectively.
nt = −r/8, and both the index and ratio are defined as ine.g., Komatsu et al. (2009). The CMB power spectrumfrom cosmic strings is expected to scale as (Gµ)2, so wefollow Sievers et al. (2009) and Battye & Moss (2010)by parameterizing the string power using qstr ∝ (Gµ)2.Limits on Gµ are then derived from qstr.We generate the lensed theoretical CMB spectra using
CAMB3, and for computational efficiency set the CMBto zero above ℓ = 4000 where the contribution is sub-dominant, less than 5% of the total power. To use the148-only ACT likelihood there are three secondary pa-rameters, ASZ, Ap, and Ac. For this part of the analysiswe use the TBO-1 and Src-1 SZ and clustered sourcetemplates, checking the effect on the primary parame-ters of substituting alternative templates. We also im-pose positivity priors on these parameters. We do notuse any information explicitly from the 218GHz spec-trum in this part of the analysis, using just the 148-only likelihood, although results are checked using the148+218 likelihood. The ACT likelihood is combinedwith the seven-year WMAP data and other cosmologicaldata sets. We use the MCMC code and methodologydescribed in Appendix C of Dunkley et al. (2009), withthe convergence test described in Dunkley et al. (2005).A subset of results are cross-checked against the publicly
3 Version Feb 2010, with Recfast 1.5.
available CosmoMC code.To place constraints on cosmological parameters we use
the 7-year WMAP data in combination with ACT, usingthe WMAP likelihood package v4.1 described in Larsonet al. (2010). WMAPmeasures the CMB over the full skyto 0.2 scales. All WMAP-only results shown for com-parison use MCMC chains from LAMBDA4, describedin Larson et al. (2010). We follow the methodologydescribed in Komatsu et al. (2010) to consider the ad-dition of distance measurements from astrophysical ob-servations, on the angular diameter distances measuredfrom Baryon Acoustic Oscillations (BAO) at z = 0.2 and0.35, and on the Hubble constant. The Gaussian priorson the distance ratios, rs/DV (z = 0.2) = 0.1905±0.0061and rs/DV (z = 0.35) = 0.1097±0.0036, are derived frommeasurements from the Two-Degree Field Galaxy Red-shift Survey (2dFGRS) and the Sloan Digital Sky SurveyData Release 7 (SDSS DR7), using a combined analysisof the two data-sets by Percival et al. (2010). The param-eter rs is the comoving sound horizon size at the baryondrag epoch, and DV (z) ≡ [(1 + z)2D2
A(z)cz/H(z)]1/3
is the effective distance measure for angular diameterdistance DA, and Hubble parameter H(z). The in-verse covariance matrix is given by Eq. 5 of Percivalet al. (2010). The Gaussian prior on the Hubble con-
4 http://lambda.gsfc.nasa.gov/
8 J. Dunkley et al.
TABLE 1Parameters describing SZ and extragalactic source model
at 148GHz and 218GHz
Parametera 148 + 218 GHz 148GHz -only
AtSZb 0.62± 0.26 < 0.77 (95% CL)
Ad (µK2) 7.8± 0.7 12.0 ± 1.9Ac (µK2) 4.6± 0.9 < 7.4 (95% CL)As (µK2)c 4.1± 0.4 4.0± 0.4αd
d 3.69± 0.14 −
χ2/dof 78/106 29/46aThe kSZ and tSZ coefficients are set equal, AkSZ = AtSZ. Ad, Ac
and As are the B3000 power for Poisson infrared galaxies, clusteredinfrared galaxies, and Poisson radio galaxies at 148GHz respec-tively. The ΛCDM parameters are not varied here.bFor the TBO-1 template. See Table 2 for other templates andconversion to SZ power.cA Gaussian prior As = 4.0±0.4 is imposed, and index αs = −0.5
assumed.dThe 148GHz-only data cannot constrain the IR point sourceindex αd.
stant, H0 = 74.2 ± 3.6 km s−1 Mpc−1, comes from themagnitude-redshift relation from HST observations of240 low-z Type Ia supernovae at z < 0.1 by Riess et al.(2009). The error includes both statistical and system-atic errors.
3. HIGH-ELL SZ AND POINT SOURCE MODEL
In this section we determine the goodness of fit of theSZ and point source model described in Section 2.1 to theACT 148GHz and 218GHz power spectra, and estimateits parameters. This uses the 148+218 likelihood sum-marized in Sec 2.1.4, initially holding the ΛCDM modelfixed to the primary CMB with parameters given in Ko-matsu et al. (2010). The best-fit model is a good fitto the three ACT power spectra over the full angularrange 500 < ℓ < 10000 (χ2 = 78 for 106 degrees of free-dom), with constraints on parameters given in Table 1 forthe TBO-1 SZ template and Src-1 source template. Thespectra are shown in Figure 2, with the estimated compo-nents indicated at each frequency. The mean calibrationfactors, defined in Eq. 13, are 1.02 and 1.09 for 148GHzand 218GHz respectively. These are consistent with theexpected values at the 1-1.2σ level. The best-fitting 1.09factor is driven by the ℓ < 2500 part of the 148 × 218cross-spectrum, where the primary CMB dominates. Atℓ = 3000, about half the power at 148GHz is from theprimary CMB (27 out of 50 µK2), with the remainderdivided among SZ, IR Poisson and clustered power, andradio Poisson power (4-8 µK2 in each component). At218GHz, only about 15% of the power comes from theprimary CMB at ℓ = 3000 (27 out of 170 µK2). Halfof the power is attributed to Poisson IR sources, the re-maining approximately 35% to power from clustered IRsources. The model fits the cross-spectrum, indicatingthat a similar population of galaxies is contributing atboth frequencies.
3.1. Constraints on SZ power
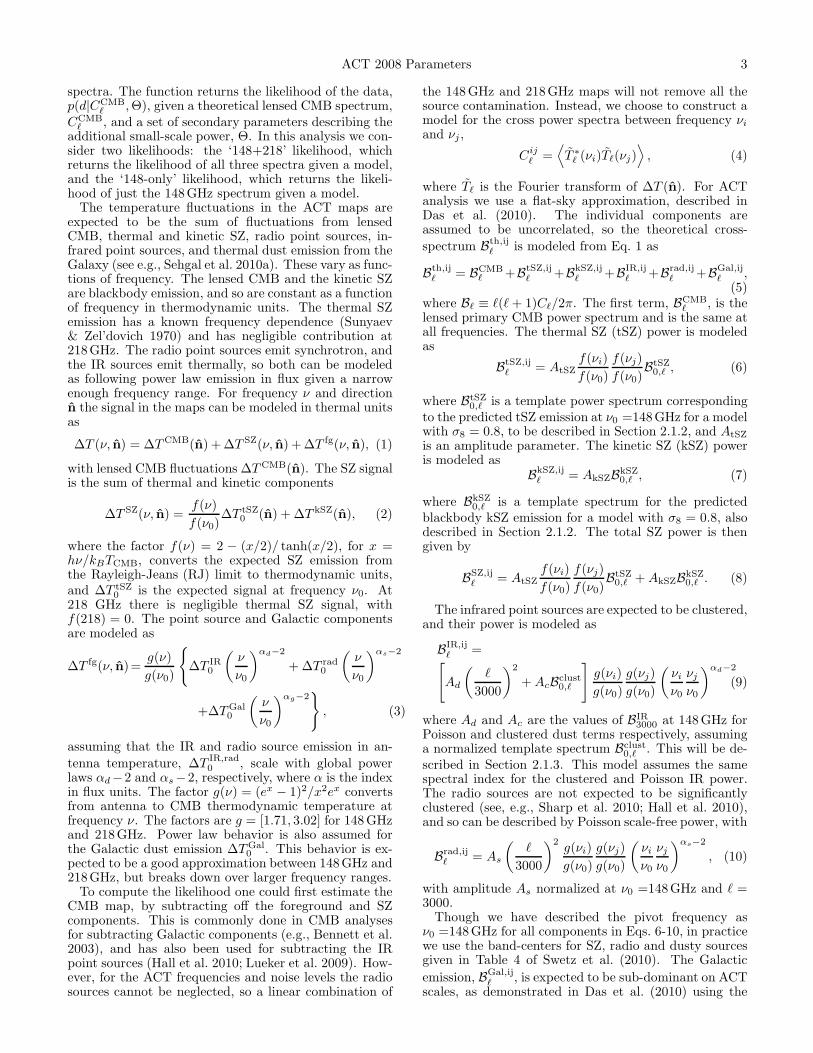
Using the multi-frequency spectra, power from SZfluctuations is detected at more than 95% CL, withestimated AtSZ for each template (TBO-1, TBO-2,Battaglia, and Shaw) given in Table 2 and shown in Fig-ure 3, marginalized over point source parameters. Theestimated SZ power at ℓ = 3000 is robust to varying theSZ template, with total SZ power (tSZ plus kSZ) esti-
TABLE 2Constraints on SZ emission
Templatea AtSZb BSZ
3000c σSZ,7
8 σSZ,98
(µK2) 0.8× (A1/7tSZ
) 0.8× (A1/9tSZ
)
TBO-1 0.62± 0.26 6.8± 2.9 0.74± 0.05 0.75 ± 0.04TBO-2 0.96± 0.43 6.7± 3.0 0.78± 0.05 0.79 ± 0.04Battaglia 0.85± 0.36 6.8± 2.9 0.77± 0.05 0.78 ± 0.04Shaw 0.87± 0.39 6.8± 3.0 0.77± 0.05 0.78 ± 0.04aTemplates are from Sehgal et al. (2010a), Trac, Bode, & Ostriker
(2010), Battaglia et al. (2010), and Shaw et al. (2010).bWe required AkSZ = AtSZ, as defined in Eqs. 6-7.cTotal tSZ and kSZ power at 148GHz, as defined in Eq. 8.
Fig. 3.— One-dimensional marginalized distributions for theestimated thermal SZ power in the ACT power spectra. There isevidence at the 95% CL level for non-zero SZ power. The valueAtSZ = 1 corresponds to the predicted thermal SZ amplitude in auniverse with σ8 = 0.8. The four curves correspond to the four SZtemplates shown in Figure 1; the TBO-1 template results in a lowervalue, although all are consistent with AtSZ = 1 at the 95% CL.The total SZ power (including kSZ) at 148GHz and ℓ = 3000 forall the templates is consistent, with ℓ(ℓ+ 1)CSZ
ℓ /2π = 7± 3 µK2.
mated to beBSZ3000 = 6.8± 2.9 µK2. (17)
The estimated template amplitude, AtSZ, varies from0.62±0.26 for the TBO-1 template, to 0.96±0.43 for theTBO-2 template. Note that AkSZ is fixed equal to AtSZ
in these cases, with amplitudes defined in Eqs. 6-7. Forthe TBO-1 template, the mean amplitude is lower thanexpected for a universe with σ8 = 0.8 (AtSZ = 1), butnot significantly. This is consistent with observations bySPT (Lueker et al. 2009), and is an improvement overthe initial estimate of AtSZ < 1.6 at 95% CL from theACT power spectrum presented in Fowler et al. (2010).Assuming that σ8 is within the limits estimated from pri-mary CMB data, e.g. from Komatsu et al. (2010), theamplitude is somewhat more consistent for the TBO-2,Battaglia, and Shaw templates, that include more de-tailed gas physics, with AtSZ = 1 within the 68% CLfor these templates. In all these cases we have held theprimary CMB parameters fixed. For a single test casewe marginalize over the 6 primary ΛCDM parameters inaddition to the secondary parameters. This marginaliza-tion results in an increase in the mean value of BSZ
3000 of

ACT 2008 Parameters 9
Fig. 4.— Marginalized distributions (68% and 95% CL) for parameters describing the SZ and point source emission in the ACT powerspectra. Left and center: The degeneracies between the total SZ power, BSZ
ℓ ≡ ℓ(ℓ+ 1)CSZℓ , and the infrared point source power, BIR
ℓ , at148GHz and ℓ = 3000 (solid unfilled contours), are broken with the addition of 218GHz data (solid filled contours). Both the Poisson andclustered IR power are shown, for two different clustered source templates (solid and dashed contours). A clustered source component isrequired to fit the multi-frequency data at 5σ significance. Right: The Poisson dust power and the index αd = 3.69 ± 0.14 (power law influx between 148GHz and 218GHz, and unconstrained from 148GHz alone) are anti-correlated; the index indicates a dust emissivity ofβ ≈ 1.7.
0.5 µK2 (a 0.2σ change), but a negligible increase in theuncertainty.The number of clusters, and therefore the expected
SZ power, is a strong function of the amplitude of mat-ter fluctuations, quantified by σ8 (Komatsu & Kitayama1999). In our model we scale the SZ templates by anoverall amplitude, and would like to infer an estimate forσ8 from AtSZ. In Fowler et al. (2010) we assumed a sev-enth power scaling, with AtSZ ∝ σ7
8 (Komatsu & Seljak2002), giving an upper limit of σSZ
8 < 0.84 at 95% CL, forAtSZ < 1.6. However, the exact scaling of the shape andamplitude with cosmology, and in particular with σ8, ismodel dependent and not precisely known (Lueker et al.2009; Battaglia et al. 2010; Trac et al. 2010). For theTBO templates the combined tSZ and kSZ signal scalesclose to the 7th power, with the tSZ varying approxi-mately as the 8th power (Trac, Bode, & Ostriker 2010).To bound the possible range we compute two limits, as-suming the tSZ part of the template varies as either σ7
8
or σ98 . The estimated values for σSZ
8 in these cases aregiven in Table 2.No detections have yet been made of the kinetic SZ
power spectrum. From SPT observations a 95% upperlimit on BkSZ
3000 of 13µK2 was estimated (Hall et al. 2010).If we allow the kSZ amplitude to be varied independentlyof the thermal SZ amplitude, we find an upper limit fromthe ACT data on the kinetic SZ contribution of
BkSZ3000 < 8µK2 (95% CL). (18)
This is consistent with predictions by Iliev et al. (2008) ofa 2µK2 Ostriker-Vishniac signal at ℓ = 3000 and a 3µK2
post-reionization kSZ signal, but would exclude modelswith higher levels of kSZ from patchy reionization.The estimated SZ power is a small signal, less than
10 µK2, and is correlated with other parameters. Wetherefore investigate the dependence of the constraint onthe priors imposed on other parameters. The SZ power isnot strongly correlated with the IR point source param-eters when the 218GHz data are included, as shown inFigure 4, and so using the ‘Src-2’ clustered source tem-plate in place of ‘Src-1’ has a negligible effect. There
is some correlation with the radio source power, as thisterm also contributes predominantly at 148GHz. Chang-ing the radio index to αs = 0 has little effect, but broad-ening the radio prior to As = 4±2 does reduce the signif-icance of the SZ detection to 0.48±0.27 using the TBO-1template; the SZ is anti-correlated with the radio power,and relaxing the prior allows a larger radio componentat 148GHz. This indicates the importance of the radiosource characterization in Marriage et al. (2010b) for es-timating the SZ power at 148GHz. A modest increasein the prior to As = 4± 0.8 has a negligible effect.If we restrict the analysis to 148GHz alone we find
consistent results, with BSZ3000 < 7.8 µK2 at 95% CL. The
best-fit model has χ2 = 29 for 46 degrees of freedom.In this case we cannot distinguish between the SZ andclustered source components; the joint constraint shownin Figure 4 shows that similar ℓ = 3000 power limits areplaced on both components; marginalizing over a clus-tered term has little effect on the estimated SZ ampli-tude. The mean IR Poisson term is higher in this case,as there are more models fitting the 148GHz data alonewith low SZ and clustered source power. The multi-frequency information then breaks this degenerecy andmore tightly constrains the Poisson power.
3.2. Unresolved point source emission
The power spectrum measures fluctuations due topoint sources below a flux cut of approximately 20 mJy.This is not an exact limit since the point source maskis constructed from sources with signal-to-noise ratiogreater than 5 (Marriage et al. 2010b). The point sourcepower observed at 148GHz and 218GHz has both syn-chrotron emission from radio galaxies, and IR emissionfrom dusty galaxies. At 148GHz the point source power,after removal of 5σ sources, is inferred to be split in ratioroughly 1:2 between radio and IR galaxies. Since we im-pose a prior on the residual radio power from Marriageet al. (2010b), we do not learn new information aboutthis component from the power spectrum. At 218GHzthe point source power is dominated by IR dust emis-

10 J. Dunkley et al.
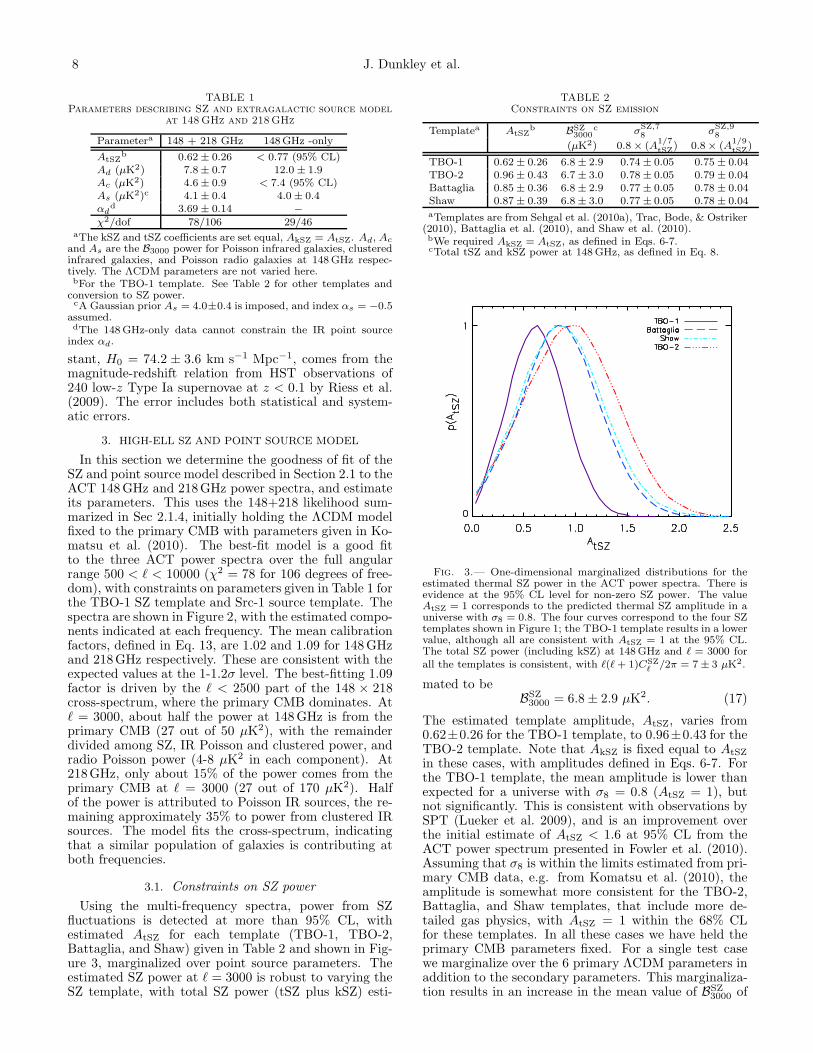
Fig. 5.— The power spectrum measured by ACT at 148GHz, scaled by ℓ4, over the range dominated by primordial CMB (ℓ < 3000).The spectrum is consistent with the WMAP power spectrum over the scales 500 < ℓ < 1000, and gives a measure of the third to seventhacoustic peaks. The best-fit ΛCDM cosmological model is shown, and is a good fit to the two datasets. At ℓ > 2000 the contributionfrom point soures and SZ becomes significant (dashed shows the total best-fit theoretical spectrum; solid is lensed CMB). Three additionaltheoretical models for the primordial CMB are shown with Neff=10 relativistic species, 4He fraction Yp = 0.5, and running of the spectralindex dns/d lnk = −0.075. They are consistent with WMAP but are excluded at least at the 95% level by the ACT data.
TABLE 3Derived constraints on unresolved IR source emissiona
148GHz 218GHz
Poisson B3000 (µK2)b 7.8± 0.7± 0.7 90± 5± 10Cℓ(nK
2) 5.5± 0.5± 0.6 63 ± 3± 6Cℓ (Jy2 sr−1) 0.85± 0.08± 0.09 14.7± 0.7± 1.8
Clustered B3000 (µK2)c 4.6± 0.9± 0.6 54± 12 ± 5
Total IR B3000 (µK2) 12.5± 1.2 144± 13aThe two errors indicate statistical uncertainty and a systematic
error due to clustered template uncertainty.bEquivalent to the parameter Ad for 148GHz.cEquivalent to the parameter Ac for 148GHz.
sion. The IR Poisson power is estimated to be Ad =7.8±0.7 µK2, with derived Poisson IR power at 148GHzand 218GHz given in Table 3. A clustered component isrequired to fit the data, with Ac = 4.6± 0.9 µK2, corre-sponding to power at 218GHz of B218
3000 = 54 ± 12 µK2.A model with no clustered component has a poorer fitto the data by ∆χ2 = 28, indicating a detection of clus-tering at the 5σ level. It is the 218GHz power spectrumthat provides this detection; the 148GHz spectrum isconsistent with no clustered component.In flux units, the effective index of unresolved IR emis-
sion isαd = 3.69± 0.14 (19)
between 148GHz and 218GHz, where S(ν) ∝ να. The
dust index and Poisson amplitude are anti-correlated,shown in Figure 4. This index estimate agrees with ob-servations by SPT, who find α = 3.9± 0.3 for the Pois-son component, and 3.8 ± 1.2 for the clustered compo-nent over the same frequency range (Hall et al. 2010). Aproperty that can be derived from the effective index, α,is the dust emissivity index, β. For galaxies at redshiftz = 0 the dust emission can be described by a modifiedblackbody, S(ν) ∝ νβBν(Td), for dust temperature Td.In the Rayleigh-Jeans (RJ) limit the flux then approx-imates to S(ν) ∝ νβ+2Td, with β = α − 2. Using thisrelation gives a dust emissivity index measured by ACTof β = 1.7 ± 0.14, consistent with models (e.g., Draine2003). However, the RJ limit is not expected to be asgood an approximation for redshifted graybodies (e.g.,Hall et al. 2010), adding an uncertainty to β of up to≃ 0.5. This should also be considered an effective in-dex, given the likely temperature variation within eachgalaxy.We test the dependence of these constraints on choices
made in the likelihood, using the same set of tests de-scribed in Sec 3.1. The estimated IR source parametersdo not depend strongly on the SZ template chosen, withless than 0.1σ change if we use the Battaglia or TBO-1SZ template. If the radio source index is set to αs = 0instead of −0.5 there is a ≃ 0.3σ reduction in the IR Pois-son source power at 148GHz, and a 0.2σ increase in thespectral index. As found in Sec 3.1, if the radio source
ACT 2008 Parameters 11
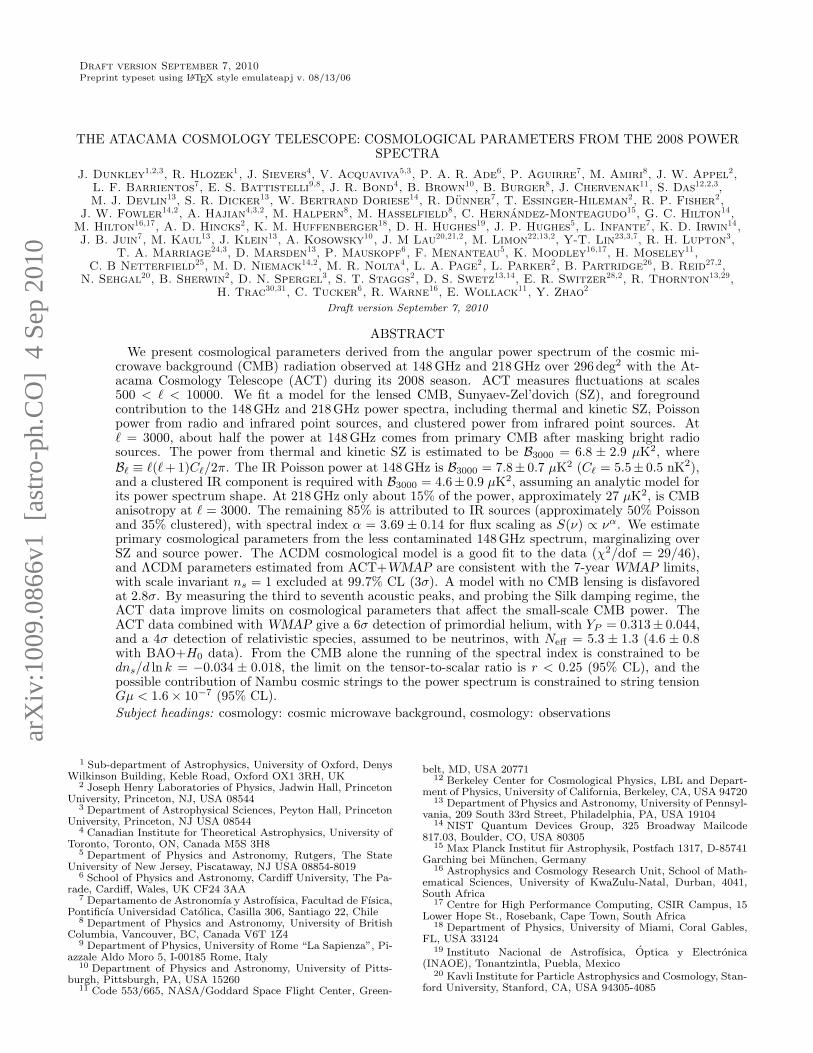
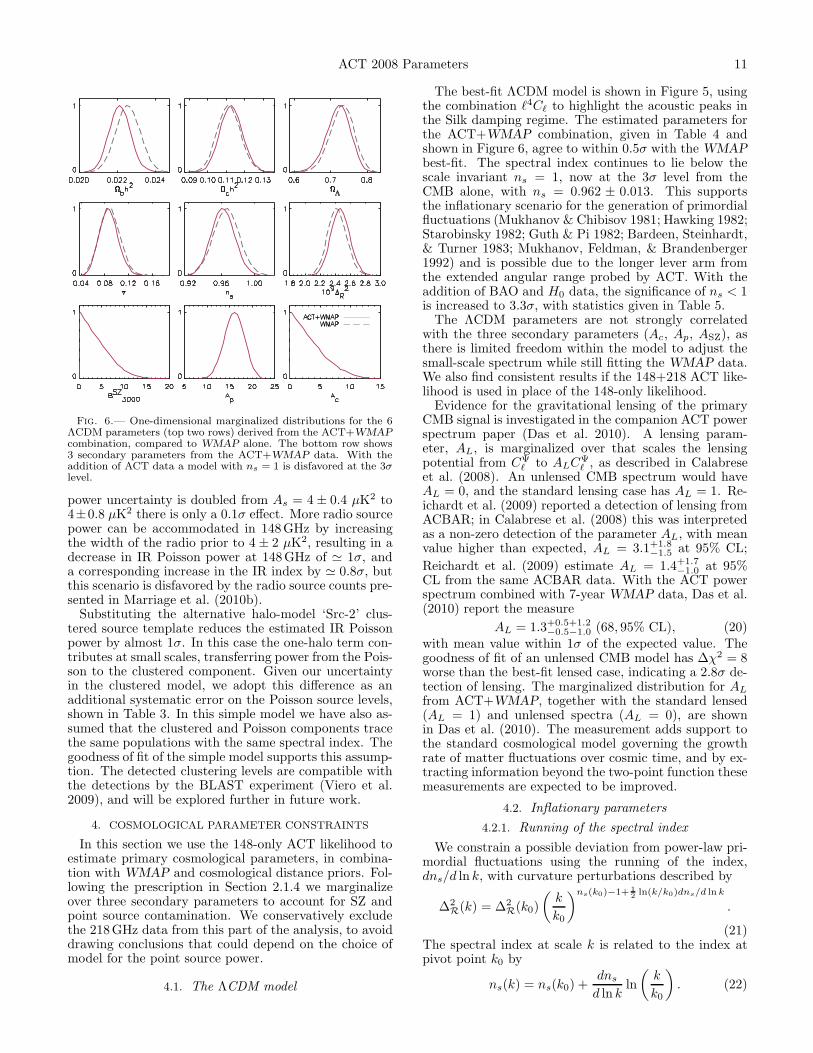
Fig. 6.— One-dimensional marginalized distributions for the 6ΛCDM parameters (top two rows) derived from the ACT+WMAP
combination, compared to WMAP alone. The bottom row shows3 secondary parameters from the ACT+WMAP data. With theaddition of ACT data a model with ns = 1 is disfavored at the 3σlevel.
power uncertainty is doubled from As = 4 ± 0.4 µK2 to4±0.8 µK2 there is only a 0.1σ effect. More radio sourcepower can be accommodated in 148GHz by increasingthe width of the radio prior to 4 ± 2 µK2, resulting in adecrease in IR Poisson power at 148GHz of ≃ 1σ, anda corresponding increase in the IR index by ≃ 0.8σ, butthis scenario is disfavored by the radio source counts pre-sented in Marriage et al. (2010b).Substituting the alternative halo-model ‘Src-2’ clus-
tered source template reduces the estimated IR Poissonpower by almost 1σ. In this case the one-halo term con-tributes at small scales, transferring power from the Pois-son to the clustered component. Given our uncertaintyin the clustered model, we adopt this difference as anadditional systematic error on the Poisson source levels,shown in Table 3. In this simple model we have also as-sumed that the clustered and Poisson components tracethe same populations with the same spectral index. Thegoodness of fit of the simple model supports this assump-tion. The detected clustering levels are compatible withthe detections by the BLAST experiment (Viero et al.2009), and will be explored further in future work.
4. COSMOLOGICAL PARAMETER CONSTRAINTS
In this section we use the 148-only ACT likelihood toestimate primary cosmological parameters, in combina-tion with WMAP and cosmological distance priors. Fol-lowing the prescription in Section 2.1.4 we marginalizeover three secondary parameters to account for SZ andpoint source contamination. We conservatively excludethe 218GHz data from this part of the analysis, to avoiddrawing conclusions that could depend on the choice ofmodel for the point source power.
4.1. The ΛCDM model
The best-fit ΛCDM model is shown in Figure 5, usingthe combination ℓ4Cℓ to highlight the acoustic peaks inthe Silk damping regime. The estimated parameters forthe ACT+WMAP combination, given in Table 4 andshown in Figure 6, agree to within 0.5σ with the WMAP
best-fit. The spectral index continues to lie below thescale invariant ns = 1, now at the 3σ level from theCMB alone, with ns = 0.962 ± 0.013. This supportsthe inflationary scenario for the generation of primordialfluctuations (Mukhanov & Chibisov 1981; Hawking 1982;Starobinsky 1982; Guth & Pi 1982; Bardeen, Steinhardt,& Turner 1983; Mukhanov, Feldman, & Brandenberger1992) and is possible due to the longer lever arm fromthe extended angular range probed by ACT. With theaddition of BAO and H0 data, the significance of ns < 1is increased to 3.3σ, with statistics given in Table 5.The ΛCDM parameters are not strongly correlated
with the three secondary parameters (Ac, Ap, ASZ), asthere is limited freedom within the model to adjust thesmall-scale spectrum while still fitting the WMAP data.We also find consistent results if the 148+218 ACT like-lihood is used in place of the 148-only likelihood.Evidence for the gravitational lensing of the primary
CMB signal is investigated in the companion ACT powerspectrum paper (Das et al. 2010). A lensing param-eter, AL, is marginalized over that scales the lensingpotential from CΨ
ℓ to ALCΨℓ , as described in Calabrese
et al. (2008). An unlensed CMB spectrum would haveAL = 0, and the standard lensing case has AL = 1. Re-ichardt et al. (2009) reported a detection of lensing fromACBAR; in Calabrese et al. (2008) this was interpretedas a non-zero detection of the parameter AL, with meanvalue higher than expected, AL = 3.1+1.8
−1.5 at 95% CL;
Reichardt et al. (2009) estimate AL = 1.4+1.7−1.0 at 95%
CL from the same ACBAR data. With the ACT powerspectrum combined with 7-year WMAP data, Das et al.(2010) report the measure
AL = 1.3+0.5+1.2−0.5−1.0 (68, 95% CL), (20)
with mean value within 1σ of the expected value. Thegoodness of fit of an unlensed CMB model has ∆χ2 = 8worse than the best-fit lensed case, indicating a 2.8σ de-tection of lensing. The marginalized distribution for AL
from ACT+WMAP, together with the standard lensed(AL = 1) and unlensed spectra (AL = 0), are shownin Das et al. (2010). The measurement adds support tothe standard cosmological model governing the growthrate of matter fluctuations over cosmic time, and by ex-tracting information beyond the two-point function thesemeasurements are expected to be improved.
4.2. Inflationary parameters
4.2.1. Running of the spectral index
We constrain a possible deviation from power-law pri-mordial fluctuations using the running of the index,dns/d ln k, with curvature perturbations described by
∆2R(k) = ∆2
R(k0)
(
k
k0
)ns(k0)−1+ 1
2ln(k/k0)dns/d ln k
.
(21)The spectral index at scale k is related to the index atpivot point k0 by
ns(k) = ns(k0) +dns
d ln kln
(
k
k0
)
. (22)

12 J. Dunkley et al.
TABLE 4
ΛCDM and extended model parameters and 68% confidence intervals from the ACT 2008 data combined withseven-year WMAP data.
Parametera ΛCDM ΛCDM ΛCDM ΛCDM ΛCDM ΛCDM+ dns/d ln k + r + Neff + YP + Gµ
Primary 100Ωbh2 2.214 ± 0.050 2.167± 0.054 2.246± 0.057 2.252± 0.055 2.236± 0.052 2.240 ± 0.053
ΛCDM Ωch2 0.1127 ± 0.0054 0.1214 ± 0.0074 0.1099± 0.0058 0.152± 0.025 0.1166± 0.0061 0.1115 ± 0.0055ΩΛ 0.721 ± 0.030 0.670± 0.046 0.738± 0.030 0.720± 0.030 0.711± 0.031 0.730 ± 0.029ns 0.962 ± 0.013 1.032± 0.039 0.974± 0.016 0.993± 0.021 0.974± 0.015 0.963 ± 0.013τ 0.087 ± 0.014 0.092± 0.016 0.087± 0.015 0.089± 0.015 0.087± 0.015 0.087 ± 0.015109∆2
R2.47± 0.11 2.44± 0.11 2.37± 0.13 2.40± 0.12 2.45± 0.11 2.43± 0.11
Extended dns/d lnk −0.034± 0.018r < 0.25Neff 5.3± 1.3YP 0.313± 0.044Gµ < 1.6×10⁻⁷
Derived σ8 0.813 ± 0.028 0.841± 0.032 0.803± 0.030 0.906± 0.059 0.846± 0.035 0.803 ± 0.029Ωm 0.279 ± 0.030 0.330± 0.046 0.262± 0.030 0.280± 0.030 0.289± 0.031 0.270 ± 0.029H0 69.7± 2.5 66.1± 3.0 71.4± 2.8 78.9± 5.9 69.5± 2.3 70.6± 2.5
Secondary BSZ3000 (µK2) < 10.2 < 12.3 < 10.0 < 12.1 < 13.0 < 8.8
Ap (µK2) 16.0± 2.0 14.9± 2.2 16.0± 2.0 15.1± 2.1 15.0± 2.1 16.1± 1.9Ac (µK2) < 8.7 < 10.4 < 8.0 < 11.1 < 11.2 < 7.4
−2 lnL 7500.0 7498.1 7500.1 7498.7 7498.8 7500.1
aFor one-tailed distributions, the upper 95% CL is given. Fortwo-tailed distributions the 68% CL are shown.
Fig. 7.— Two-dimensional marginalized limits (68% and95%) for the spectral index, ns, plotted at the pivot pointk0 = 0.015/Mpc, and the running of the index dns/d lnk, forACT+WMAP, compared to WMAP. This model has no tensorfluctuations. A negative running is preferred, but the data areconsistent with a power-law spectral index, with dns/d ln k = 0.
The simplest inflationary models predict that the run-ning of the spectral index with scale should be small (seee.g., Kosowsky & Turner 1995; Baumann et al. 2009), andthe detection of a scale dependence would provide evi-dence for alternative models for the early universe. Cos-mological constraints on deviations from scale invariancehave been considered recently by e.g., Easther & Peiris(2006); Kinney et al. (2006); Shafieloo & Souradeep(2008); Verde & Peiris (2008); Reichardt et al. (2009),using various parameterizations. With CMB data alone,the seven-year WMAP data show no evidence for sig-nificant running, with dns/d ln k = −0.034± 0.026, and
−0.041±0.023 when combined with ACBAR and QUADdata (Komatsu et al. 2010). With the measurement ofthe power spectrum at small scales by ACT, we find
dns/d lnk = −0.034± 0.018 (68% CL) (23)
and dns/d lnk =−0.024 ± 0.015 including BAO+H0.The estimated parameters are given in Tables 4 and5. Parameters are sampled using a pivot point k0 =0.002/Mpc for the spectral index. This choice of pivotpoint results in the index being strongly anti-correlatedwith the running, with ns(0.002) = 1.032 ± 0.039. InFigure 7 we show the index and its running at a decor-related pivot point k0 = 0.015/Mpc, chosen to minimizethe correlation between the two parameters (Cortes, Lid-dle, & Mukherjee 2007). The relation between the indexat these two pivot points is
ns(k0 = 0.015/Mpc)=ns(k0 = 0.002/Mpc)
+ ln(0.015/0.002)dns
d ln k, (24)
with other cosmological parameters unchanged. The run-ning prefers a negative value at 1.8σ, indicating enhanceddamping at small scales, but there is no statistically sig-nificant deviation from a power law spectral index.We choose this model to investigate the sensitivity
of the constraints to choices made in the likelihood, asdns/d ln k is more sensitive to the small-scale spectrum,and may be affected by the modeling of the point sourceand SZ contributions. We find less than 0.1σ variation inprimordial parameters if we substitute alternative shapesfor the SZ and clustered source templates, or limit theanalysis to the ℓ < 5000 data. The beam is measuredsufficently well over the angular range of interest thatresults are not changed if the beam uncertainty is ne-glected. These tests are described further in AppendixB, and give us confidence that the errors are not domi-nated by systematic effects.

ACT 2008 Parameters 13
TABLE 5
ΛCDM and extended model parameters and 68% confidence intervals from the ACT 2008 data combined withseven-year WMAP data, and measurements of H0 and BAO
Parametera ΛCDM ΛCDM ΛCDM ΛCDM+ dns/d ln k + r + Neff
Primary 100Ωbh2 2.222 ± 0.047 2.206± 0.047 2.237 ± 0.048 2.238 ± 0.046
ΛCDM Ωch2 0.113± 0.0034 0.1148± 0.0039 0.1117 ± 0.0033 0.140 ± 0.015ΩΛ 0.724 ± 0.016 0.713± 0.019 0.729 ± 0.017 0.715 ± 0.017ns 0.963 ± 0.011 1.017± 0.036 0.970 ± 0.012 0.983 ± 0.014τ 0.086 ± 0.013 0.095± 0.016 0.086 ± 0.015 0.086 ± 0.014109∆2
R2.46± 0.09 2.39± 0.10 2.40± 0.10 2.44± 0.09
Extended dns/d ln k −0.024± 0.015r < 0.19Neff 4.56± 0.75
Derived σ8 0.813 ± 0.022 0.820± 0.023 0.811 ± 0.022 0.885 ± 0.039Ωm 0.276 ± 0.016 0.287± 0.019 0.271 ± 0.017 0.285 ± 0.017H0 69.9± 1.4 69.1± 1.5 70.4± 1.5 75.5± 3.0
Secondary BSZ3000 (µK2) < 9.7 < 11.4 < 10.2 < 12.1
Ap (µK2) 16.1± 2.0 15.2± 2.0 16.1± 2.0 15.3± 2.1Ac (µK2) < 8.4 < 10.3 < 8.4 < 10.2
aFor one-tailed distributions, the upper 95% CL is given. Fortwo-tailed distributions the 68% CL are shown.
Fig. 8.— Two-dimensional marginalized distribution (68% and95% CL) for the tensor-to-scalar ratio r, and the scalar spectralindex ns, for ACT+WMAP data. By measuring the ℓ > 1000spectrum, the longer lever arm from ACT data further breaks thens − r degeneracy, giving a marginalized limit r < 0.25 (95% CL)from the CMB alone. The predicted values for a chaotic inflation-ary model with inflaton potential V (φ) ∝ φp with 60 e-folds areshown for p = 3, 2, 1, 2/3; p > 3 is disfavored at > 95% CL.
4.2.2. Gravitational waves
The concordance ΛCDM model assumes purely scalarfluctuations. Tensor fluctuations can also be seeded atearly times, propagating as gravitational waves. Theycontribute to the CMB temperature and polarizationanisotropy, polarizing the CMB with both an E-modeand B-mode pattern (e.g., Kamionkowski et al. 1997;Zaldarriaga & Seljak 1997). The tensor fluctuationpower is quantified using the tensor-to-scalar ratio r =∆2
h(k0)/∆2R(k0), where ∆
2h is the amplitude of primordial
gravitational waves, with pivot scale k0 = 0.002/Mpc.Inflationary models predict tensor fluctuations, with am-plitude related to the potential of the inflaton field (seee.g., Baumann et al. (2009) for a recent review.)
Direct B-mode polarization measurements from the BI-CEP experiment provide limits of r < 0.7 (95% CL, Chi-ang et al. (2010)). Temperature and E-mode fluctuationsover a range of scales currently provide a stronger indi-rect constraint on r, with r < 0.36 (95% CL) from theWMAP data (Komatsu et al. 2010). Models with a largevalue for r have increased power at large scales, whichcan be partly compensated by increasing the spectral in-dex of scalar fluctuations and reducing the scalar ampli-tude. This ‘ns−r’ degeneracy can be partly broken withlower-redshift observations that limit r < 0.24 (95% CL)from WMAP+BAO+H0 (Komatsu et al. 2010). It canalso be broken by measuring temperature fluctuationsat ℓ > 1000. The tightest CMB-only constraints sofar have come from WMAP CMB data combined withACBAR and QUAD small-scale CMB data (Pryke et al.2009), with r < 0.3 (95% CL). With ACT combinedwith WMAP we now find
r < 0.25 (95% CL) (25)
for the CMB temperature anisotropy power spec-trum alone, comparable to constraints from combinedcosmological datasets (r < 0.19 at 95% CL forACT+WMAP+BAO+H0). The parameter estimatesare given in Tables 4 and 5, and the dependence ofthe tensor amplitude on the spectral index is shownin Figure 8. For chaotic inflationary models with in-flaton potential V (φ) ∝ φp and N e-folds of inflation,the predicted tensor-to-scalar ratio is r = 4p/N , withns = 1 − (p + 2)/2N . The CMB data exclude p ≥ 3 atmore than 95% confidence for N = 60 e-folds.
4.3. Non-standard models
In addition to specifying the primordial perturbations,the concordance model assumes that there are three lightneutrino species, that standard BBN took place with spe-cific predictions for primordial element abundances, andthat there are no additional particles or fluctuations fromcomponents such as cosmic defects. The damping tail

14 J. Dunkley et al.
Fig. 9.— Constraints on the effective number of relativistic species, Neff . Left: One-dimensional marginalized distribution for Neff , fordata combinations indicated in the right panel. The standard model assumes three light neutrino species (Neff=3.04, dotted line); the meanvalue is higher, but 3.04 is within the 95% CL. Right: Two-dimensional marginalized distribution for Neff and equality redshift zeq, showingthat Neff can be measured separately from zeq. Neff is bounded from above and below by combining the small-scale ACT measurements ofthe acoustic peaks with WMAP measurements. The limit is further tightened by adding BAO and H0 constraints, breaking the degeneracybetween Neff and the matter density by measuring the expansion rate at late times.
measured by ACT offers a probe of possible deviationsfrom this standard model.
4.3.1. Number of relativistic species
The CMB is sensitive to the number of relativisticspecies at decoupling. Changing the effective numberof species affects the evolution of perturbations by alter-ing the expansion rate of the universe. Neutrinos alsostream relativistically out of density fluctuations, withadditional species suppressing the CMB peak heights andshifting the acoustic peak positions (Ma & Bertschinger1995; Bashinsky & Seljak 2004).The standard model of particle physics has three light
neutrino species, consistent with measurements of thewidth of the Z boson, giving Nν = 2.984± 0.008 (Parti-cle Data Book). Three neutrino species contribute about11% of the energy density of the universe at z ≈ 1100,with ρrel = [7/8(4/11)4/3Neff ]ργ . Cosmological datasetsare sensitive to ρrel, which can be composed of anylight particles produced during the Big Bang that donot couple to electrons, ions, or photons; or any ad-ditional contribution to the energy density of the uni-verse such as gravitational waves. Three light neutrinospecies correspond to Neff=3.04. Any deviation wouldindicate either additional relativistic species, or evidencefor non-standard interactions or non-thermal decoupling(Bashinsky & Seljak 2004).Recent constraints on the number of relativistic species
have been explored with CMB data from WMAP com-bined with low redshift probes by e.g., Spergel et al.(2007); Ichikawa et al. (2007); Mangano et al. (2007);Hamann et al. (2007); Dunkley et al. (2009); Komatsuet al. (2010); Reid et al. (2010). With WMAP data adetection was made of relativistic species with Neff> 2.7(95% CL), but the upper level was unconstrained. Bycombining with distance measures, Komatsu et al. (2010)limit the number of species to Neff= 4.34±0.88, and Reidet al. (2010) added optical cluster limits and LRG power
spectrum measures to find Neff= 3.77 ± 0.67. Mantz,Allen, & Rapetti (2010a) include X-ray cluster gas frac-tion and cluster luminosity measurements from ROSATand Chandra to estimate Neff= 3.4+0.6
−0.5, improving limitsby constraining the matter power spectrum at low red-shift. BBN observations limit Neff to 3.24± 0.6 (Cyburtet al. 2005).By combining the ACT power spectrum measurement
with WMAP, the effective number of species is estimatedfrom the CMB to be
Neff = 5.3± 1.3 (68% CL). (26)
A universe with no neutrinos is excluded at 4σ from theCMB alone, with the marginalized distribution shownin Figure 9. We can now put an upper bound on Neff
from the CMB alone using ACT. This improved measure-ment comes from the third to seventh peak positions andheights. The right panel of Figure 9 shows the redshiftof equality, zeq, as a function of the number of species.The relation of zeq to the number of species is given inEq. 53 of Komatsu et al. (2010). With large scale mea-surements the observable quantity from the third peakheight is just zeq, leading to a strong degeneracy betweenNeff and Ωch
2. With small-scale information the CMBdata allow a measure of Neff in addition to zeq due tothe additional effects of anisotropic stress on the pertur-bations. As an example, a model with Neff= 10 thatfits the WMAP data is shown in Figure 5. With a largeNeff the higher peaks are damped, and slightly shiftedto larger multipoles. The model is excluded by the ACTspectrum in the 1000 < ℓ < 2500 regime.The central value for Neff preferred by the
ACT+WMAP data is 1.7σ above the concordance value,with increased damping over the ΛCDM model; im-proved measurements of the spectrum will help refinethis measurement. This is not interpreted as a statisti-cally significant departure from the concordance value;the best-fit χ2 is only 1.3 less than for Neff=3.04. The

ACT 2008 Parameters 15
Fig. 10.— Constraint on the primordial helium mass fraction YP . Left: The one-dimensional marginalized distribution for YP derivedfrom the ACT+WMAP data compared to WMAP alone. The measurement of the Silk damping tail by ACT constrains the number offree electrons at recombination, giving a 6σ detection of primordial helium consistent with the BBN-predicted YP = 0.25. Right: Thetwo-dimensional marginalized distribution (68% and 95% CL) for YP and the spectral index ns; the degeneracy is partly broken with theACT data.
degeneracy between Neff and Ωch2 results in a higher
mean value for σ8, 0.906± 0.059, with all estimated pa-rameters given in Table 4. By adding the BAO and H0
data the Neff−Ωch2 degeneracy is further broken, with
Neff = 4.56±0.75 (68% CL). This central value is higherthan from joint constraints including X-ray and opti-cal cluster measurements (Reid et al. 2010; Mantz et al.2010a); improved CMB and low redshift measurementswill allow further constraints and consistency checks.
4.3.2. Primordial 4He abundance
In the standard BBN model, light nuclides are synthe-sized in the first few minutes after the Big Bang. Mea-surements of the abundance of helium are therefore sen-sitive to the expansion rate of the universe during thistime (Peebles 1966; Steigman et al. 1977). In standardBBN, the expected 4He mass fraction, YP , is related tothe baryon density, Ωbh
2, and the number of neutrino(or relativistic) species, Neff , by
YP = 0.2485+0.0016[(273.9Ωbh2−6)+100(S−1)], (27)
where S2 = 1 + (7/43)(Neff − 3) (see e.g., Kneller &Steigman 2004; Steigman 2007; Simha & Steigman 2008).For the ΛCDM model, with baryon density 100Ωbh
2 =2.214 ± 0.050 and N = 3.04 effective species, the pre-dicted helium fraction is YP = 0.2486 ± 0.0006, witherror dominated by the 0.02% uncertainty on the lin-ear fit in Eq. 27 (Steigman 2010). When the neu-trino species are allowed to vary (as in Section 4.3.1),the current prediction from ACT+WMAP+BAO+H0 isYP = 0.267±0.009. For comparison, the prediction fromthe baryon density derived from deuterium abundancemeasurements is YP = 0.2482 ± 0.0007 (see Steigman2010, for a review). A measurement of any deviationfrom this prediction could point the way to non-standardmodels, in particular those that affect the timing ofBBN (Steigman et al. 1977; Boesgaard & Steigman 1985;Jedamzik & Pospelov 2009). This includes modifications
to the Hubble expansion rate during BBN, energy injec-tion due to annihilation or decay of heavy particles, parti-cle catalysis of BBN reactions, and time variations in fun-damental constants (see, e.g., Peimbert (2008); Jedamzik& Pospelov (2009) for discussions).The 4He abundance estimated from observations of
metal poor extragalactic regions (see Steigman 2007; Pe-imbert 2008, for example) is YP = 0.252 ± 0.004 and0.252±0.001 (Izotov et al. 2007), although a higher mea-surement of YP = 0.2565±0.0010(stat)±0.0050(syst) hasrecently been made (Izotov & Thuan 2010). There aresystematic uncertainties in the astrophysically derivedabundances, as helium is depleted in stars.The CMB provides an alternative probe of the helium
abundance when the universe was ≃400,000 years old.Helium recombines earlier than hydrogen, at z ≈ 1800rather than z ≈ 1100, reducing the number density ofelectrons at recombination to ne = nb(1− YP ), where nb
is the baryon number density (Hu et al. 1995). It affectsthe CMB at small scales by modifying the recombina-tion process. A larger YP decreases the electron numberdensity, increasing the mean free path of Compton scat-tering. This leads to decreased power on small scales,due to enhanced Silk damping, as shown in Trotta &Hansen (2004) and Komatsu et al. (2010).For CMB analysis the primordial helium abundance
is usually assumed to be YP = 0.24. Constraints on avarying abundance from the CMB have been presentedin Trotta & Hansen (2004); Huey et al. (2004); Ichikawa& Takahashi (2006); Ichikawa et al. (2008); Dunkley et al.(2009); Komatsu et al. (2010), with a > 3σ detection ofYP = 0.33 ± 0.08 reported in Komatsu et al. (2010) forthe seven-year WMAP data combined with small-scaleCMB observations from ACBAR (Reichardt et al. 2009)and QUAD (Pryke et al. 2009). We now find
YP = 0.313± 0.044 (68% CL) (28)
with the ACT+WMAP data combination, a significantdetection of primordial helium from the CMB alone. The

16 J. Dunkley et al.
Fig. 11.— Joint two-dimensional marginalized distribution (68%and 95% CL) for the primordial helium mass fraction YP and thenumber of relativistic species Neff . The two are partly degenerate,as increasing Neff or YP leads to increased damping of the powerspectrum. The predicted standard-BBN relation between Neff andYP is indicated. The concordance Neff=3.04, YP = 0.25 modellies on the edge of the two-dimensional 68% CL, and a model withNeff=0, YP = 0 is excluded at high significance.
mean value is higher than predicted from ΛCDM, butconsistent at the 1.5σ level. A universe with no primor-dial helium is ruled out at 6σ. The distributions for YP
and its correlation with the spectral index are shown inFigure 10, with statistics in Table 4. Figure 5 shows howa higher helium fraction consistent with WMAP data(YP = 0.5) is ruled out by ACT’s determination of Silkdamping at small scales. There is still some uncertaintyin the exact details of recombination (e.g., Wong & Scott2007; Chluba et al. 2007; Switzer & Hirata 2008; Fendtet al. 2009; Chluba & Sunyaev 2010). A recent refine-ment of the numerical code for recombination used forthis analysis (Recfast 1.5, by Seager et al. (1999), up-dated to match Rubino-Martın et al. (2010)), gives a 2%change in the spectrum at ℓ = 2000. This is subdomi-nant to the 7% percent shift from a 1σ change in YP , sothese effects are not expected to significantly affect cur-rent constraints, although will become more important asthe data improve. If we consider the possible variationof both the primordial helium fraction and the numberof relativistic species, the constraints on each parameterare weakened as there is some degeneracy between thetwo effects. The joint marginalized distribution for theseparameters is shown in Figure 11, together with the pre-dicted relation between Neff and YP assuming standardBBN. The concordance Neff=3.04, YP = 0.25 model lieson the edge of the two-dimensional 68% CL, and a modelwith Neff=0, YP = 0, is excluded at high significance.
4.3.3. Cosmic strings
Observations of the acoustic peaks in the CMB powerspectrum have ruled out defects from phase transitionsas the dominant mechanism for seeding cosmic structure(see e.g., Vilenkin & Shellard 2000). However, certaininflation models predict string perturbations of similar
Fig. 12.— The power spectrum measured by ACT at 148GHz,scaled by ℓ4 and with best-fit secondary model subtracted, withthe best-fit ΛCDM (solid) compared to a model with maximal cos-mic string tension Gµ = 1.6 × 10⁻⁷ allowed by the ACT data at95% CL (dashed, assuming a Nambu string template described inSection 4.3.3). A model with the 95% upper limit allowed withoutincluding ACT data, with Gµ = 2.6× 10⁻⁷, is shown for compari-son (dot-dashed); it overpredicts the observed power in the range1500 < ℓ < 4000.
amplitudes to the inflationary perturbations (Linde 1994;Dvali & Tye 1999). Using the CMB one can constrainthe string tension, Gµ, and therefore the energy scaleat which the strings are formed. Unfortunately there issignificant uncertainty in the predicted power spectrumfrom cosmic string-generated anisotropies, due to diffi-culties in modeling the string network. Most approachesmodel the network as an ensemble of string segmentswith constant average properties, with string loops pro-duced that decay into radiation. The equations of motionare solved using either the Nambu or Abelian-Higgs (AH)method, described in e.g., Bennett & Bouchet (1990);Pogosian & Vachaspati (1999); Bevis et al. (2007); Bat-tye & Moss (2010).The small-scale CMB provides a unique probe of cos-
mic strings, with simulations and forecasts by Fraisseet al. (2008) and Bevis et al. (2010) predicting a powerlaw behavior that could dominate over the Silk dampingtail of the inflationary inhomogeneities, consistent withanalytic predictions by Hindmarsh (1994). Constraintshave been placed on the cosmic string tension from re-cent CMB and other cosmological data (Lo & Wright2005;Wyman et al. 2005, 2006; Battye et al. 2006; Fraisse2007; Bevis et al. 2007; Urrestilla et al. 2008; Sievers et al.2009). Most recently, Battye & Moss (2010) report limitsof Gµ < 2.6 × 10⁻⁷ (95% CL) for Nambu strings using5-year WMAP data combined with large-scale structureand BBN data. They find a significant dependence ofthis limit on the chosen string model, with up to a factorof three variation. For a simple comparison, we considerjust the Nambu cosmic string template used in Battye &Moss (2010), extended to scales ℓ > 3000 with a powerlaw, Bℓ ∝ ℓ−1 (Fraisse et al. 2008). The template isheld fixed for all cosmological models. Assuming thismodel, we find limits from ACT combined with WMAP
of qstr < 0.025 (95% CL), which corresponds to a tensionof
Gµ < 1.6× 10⁻⁷ (95% CL). (29)
The spectrum corresponding to this 95% upper limit is
ACT 2008 Parameters 17
shown in Figure 12, compared to the upper limit pre-ACT given in Battye & Moss (2010) which overpredictsthe power measured by ACT in the range 1500 < ℓ <4000. The joint constraint on the string tension and thescalar spectral index may also limit the class of hybridinflation models that produce cosmic strings at the endof inflation, and which typically predict a unity scalarspectral index. Battye et al. (2006) and Bevis et al.(2008) demonstrated that these models provided a goodfit to the data, but more recently Battye, Garbrecht,& Moss (2010) found that minimal D-term models arenow ruled out at a 4σ level with CMB combined withSDSS and BBN data, and that minimal F-term modelsare increasingly disfavored. The preference from CMBdata alone for a red spectrum with ns = 0.963 ± 0.013(ACT+WMAP), marginalized over a string contribution,provides further evidence against these hybrid models.
5. DISCUSSION
The power spectra measured at 148GHz and 218GHzby ACT, using observations made in the Southern skyin 2008, have provided a new probe of the physics af-fecting microwave fluctuations at small scales. The con-cordance ΛCDM cosmological model continues to be fa-vored, and possible deviations from this model are moretightly constrained. At 148GHz and 218GHz, the CMBis dominant at scales larger than ℓ ≃ 3000 and 2000 re-spectively, after bright sources have been removed. Atsmaller scales, a simple model for SZ and point sourceemission is a good fit to the ACT power spectra. By us-ing multi-frequency information we see a preference fornon-zero thermal Sunyaev-Zel’dovich fluctuations in the148GHz power spectrum at 2σ, with an amplitude con-sistent with observations by the South Pole Telescope.The mean amplitude is lower than the simplest clustermodels predict for a universe with σ8 = 0.8, but at lessthan 2σ significance. The level is consistent with expec-tations from recent models that include more complexgas physics; continued comparisons of observations andtheory will allow progress to be made on cluster model-ing. The frequency dependence of the infrared emissionhas the expected behavior of graybody emissivity fromdusty star-forming galaxies at redshifts 1 < z < 4, and aclustered infrared point source component is detected inthe ACT data at 5σ significance.The 1000 < ℓ < 3000 spectrum provides a measure
of the third to seventh acoustic peaks in the CMB, andthe Silk damping tail from the recombination process atz = 1100. Using this measurement we place tighter con-straints on deviations from the ΛCDM model. Giventhe uncertainty on the expected power spectrum from in-frared point sources, we have limited this part of the anal-ysis to the power spectrum from 148GHz. The data arefound to be consistent with no deviations from ΛCDM,and the gravitational lensing of the temperature powerspectrum is at the expected level, with an unlensed signaldisfavored at 2.8σ. We have detected primordial heliumat 6σ, and relativistic species at 4σ from the CMB alone,both consistent with the expected levels. The best-fitmodels prefer increased damping beyond the ΛCDM ex-pectation, but at less than the 2σ level. The cosmologicalparameters considered have distinct effects on the powerspectrum, but there is some degeneracy between Neff ,YP , and dn/d ln k. This means that an enhanced damp-
ing leads to higher mean values for either Neff or Yp, orto more negative dn/d lnk. These are seen at 1.4-1.8σfrom the concordance value when considered individu-ally as extensions to ΛCDM, but there is no evidencethat these deviations are statistically preferred. We donot find evidence for a gravitational wave component ora contribution from cosmic string fluctuations, indicat-ing the continued consistency of cosmological data withminimal inflationary models.
ACT is on the Chajnantor Science preserve, which wasmade possible by the Chilean Comision Nacional de In-vestigacion Cientıfica y Tecnologica. We are gratefulfor the assistance we received at various times from theALMA, APEX, ASTE, CBI/QUIET, and NANTEN2groups. The PWV data come from the public APEXweather website. Field operations were based at the DonEsteban facility run by Astro-Norte. Reed Plimpton andDavid Jacobson worked at the telescope during the 2008season. We thank Norm Jarosik for support through-out the project. We also thank Adam Moss and RichardBattye for sharing their cosmic string power spectrum,Laurie Shaw and Nick Battaglia for providing SZ powerspectra, and Bruce Bassett for suggestions on testinglensing in the power spectrum. We thank Marco Vieroand Graeme Addison for providing useful input on clus-tered point sources. This work was supported by theU.S. National Science Foundation through awards AST-0408698 for the ACT project, and PHY-0355328, AST-0707731 and PIRE-0507768. Funding was also providedby Princeton University and the University of Pennsyl-vania. The PIRE program made possible exchanges be-tween Chile, South Africa, Spain and the US that en-abled this research program. JD acknowledges supportfrom an RCUK Fellowship. RH received funding fromthe Rhodes Trust. VA, SD, AH, and TM were sup-ported through NASA grant NNX08AH30G. ADH re-ceived additional support from a Natural Science andEngineering Research Council of Canada (NSERC) PGS-D scholarship. AK and BP were partially supportedthrough NSF AST-0546035 and AST-0606975, respec-tively, for work on ACT. LI acknowledges partial sup-port from FONDAP Centro de Astrofısica. RD was sup-ported by CONICYT, MECESUP, and Fundacion An-des. ES acknowledges support by NSF Physics Fron-tier Center grant PHY-0114422 to the Kavli Instituteof Cosmological Physics. KM, M Hilton, and RW re-ceived financial support from the South African Na-tional Research Foundation (NRF), the Meraka Institutevia funding for the South African Centre for High Per-formance Computing (CHPC), and the South AfricanSquare Kilometer Array (SKA) Project. SD acknowl-edges support from the Berkeley Center for Cosmo-logical Physics. YTL acknowledges support from theWorld Premier International Research Center Initiative,MEXT, Japan. NS is supported by the U.S. Departmentof Energy contract to SLAC no. DE-AC3-76SF00515.We acknowledge the use of the Legacy Archive for Mi-crowave Background Data Analysis (LAMBDA). Sup-port for LAMBDA is provided by the NASA Office ofSpace Science. The data will be made public throughLAMBDA (http://lambda.gsfc.nasa.gov/) and the ACTwebsite (http://www.physics.princeton.edu/act/).

18 J. Dunkley et al.
APPENDIX
A. BEAM LIKELIHOOD
Following the prescription in Hinshaw et al. (2007), the likelihood of the beam-deconvolved spectrum is written as
L =∑
bb′
(Cb − Cb)(Q0 +Q1)−1bb′ (Cb′ − Cb′) + ln det(Q0 +Q1). (A1)
where Q0 contains noise and cosmic variance, and Q1 contains beam error. The matrix Q1 is diagonalized in the form
Q1 ≈ UUT , (A2)
where U is an Nb × M matrix with M ≪ Nb. The matrix U is computed by decomposing the unbinned beamcovariance matrix Σb, the covariance between normalized bℓ and bℓ′ , as
Σb ≈ PDPT . (A3)
The matrix Q1 is related to the beam covariance matrix Σb by
Qll′
1 = 4Cℓ
bℓΣb
Cℓ
bℓ, (A4)
so the elements of matrix U are given by
Ub,i = Mbℓ[2Cℓ
bℓPℓ,i
√
Di], (A5)
where Mbl are the bandpower window functions. Once decomposed, the Woodbury formula gives
(Q0 +Q1)−1≈ (Q0 +UU
T )−1 (A6)
=Q−10 −Q−1
0 U(
I+UTQ−10 U
)−1UTQ−1
0 . (A7)
The likelihood is then given by L = L0 + Lb, where
L0 =∑
bb′
(Cb − Cb)(Q0)−1bb′ (Cb′ − Cb′) + ln detQ0, (A8)
andLb = −
∑
bb′
(Cb − Cb)M−1(Cb′ − Cb′) +NM (A9)
where
M−1 =[
Q−10 U
(
I+UTQ−10 U
)−1UTQ−1
0
]
bb′(A10)
and NM = ln det(I+UTQ−10 U).
B. SENSITIVITY TO LIKELIHOOD ASSUMPTIONS
A set of assumptions are made in the ACT likelihood. We choose the ΛCDM+running model to check their effecton cosmological parameters, as subtleties in the small-scale treatment can be probed more thoroughly with thismodel than with the 6-parameter ΛCDM. The fiducial constraints on the ΛCDM+running model use data between500 < ℓ < 10000, including beam error and a 2% calibration error in temperature, and use the Src-1 clustered sourcetemplate and the TBO-1 SZ template. The assumptions we test are the choice of SZ and clustered source templates,the dependence of results on the beam and calibration error, and the range of angular scales used.Substituting the alternative halo-model clustered source template, Src-2, has a neglible effect on the primary cosmo-
logical parameters, as shown in Figure B1. Similarly, using the Battaglia SZ template (Battaglia et al. 2010), does notaffect primary parameters. The distribution of the SZ amplitude is broadened in this case as the template has a loweramplitude (as described in Sec 3.1), and by setting an upper limit on ASZ < 2 the distribution for Ap is narrowed. Weconclude from these tests that the systematic uncertainty on primary parameters from the model is small comparedto the statistical uncertainty.We also test the sensitivity to the calibration and beam uncertainty. Removing the 2% calibration error in the maps
decreases the errors on the primary parameters by up to 0.2σ. When the beam error is neglected, the constraints aretightened by about 0.1σ, but this is not a significant effect, consistent with the measurement of the beam. If insteadthe angular range is restricted to ℓ < 5000, the primary cosmological parameters are unaffected, but the SZ and pointsource amplitudes are more poorly determined.
REFERENCES
Bardeen, J. M., Steinhardt, P. J., & Turner, M. S. 1983,Phys. Rev. D, 28, 679
Bashinsky, S., & Seljak, U. 2004, Phys. Rev. D, 69, 083002

ACT 2008 Parameters 19
Fig. B1.— Tests of the 148GHz likelihood for the ΛCDM model with a running spectral index. The ‘standard’ model uses the likelihoodsettings described in Sec 2.1. The primary cosmological parameter constraints are not affected if we assume different template spectra forthe clustered point source component (‘Src-2’) and for the SZ spectrum (‘Battaglia’). Changing the angular range used from ℓmax = 10000to 5000 only alters the distribution of the secondary parameters, but leaves the primary model parameters unchanged. Parameters aretightened by about 0.1σ if the beam error is set to zero (‘No beam error’), and by up to 0.2σ is the calibration error is removed (‘0% Caliberror’).
Battaglia, N., Bond, J. R., Pfrommer, C., Sievers, J. L., & Sijacki,D. 2010, ArXiv e-prints, 1003.4256
Battye, R., Garbrecht, B., & Moss, A. 2010, Phys. Rev. D, 81,123512, 1001.0769
Battye, R., & Moss, A. 2010, ArXiv e-prints, 1005.0479Battye, R. A., Garbrecht, B., & Moss, A. 2006, JCAP, 9, 7,
arXiv:astro-ph/0607339Baumann, D. et al. 2009, in American Institute of Physics
Conference Series, Vol. 1141, American Institute of PhysicsConference Series, ed. S. Dodelson, D. Baumann, A. Cooray,J. Dunkley, A. Fraisse, M. G. Jackson, A. Kogut, L. Krauss,M. Zaldarriaga, & K. Smith , 10–120, 0811.3919
Bennett, C. L. et al. 2003, ApJ, 583, 1Bennett, D. P., & Bouchet, F. R. 1990, Phys. Rev. D, 41, 2408Bevis, N., Hindmarsh, M., Kunz, M., & Urrestilla, J. 2007,
Phys. Rev. D, 75, 065015, arXiv:astro-ph/0605018——. 2008, Physical Review Letters, 100, 021301, arXiv:astro-
ph/0702223——. 2010, ArXiv e-prints, 1005.2663Bode, P., Ostriker, J. P., & Vikhlinin, A. 2009, ApJ, 700, 989,
0905.3748Boesgaard, A. M., & Steigman, G. 1985, ARA&A, 23, 319Bond, J. R. et al. 2005, ApJ, 626, 12Bridle, S. L., Crittenden, R., Melchiorri, A., Hobson, M. P., Kneissl,
R., & Lasenby, A. N. 2002, MNRAS, 335, 1193Brown, M. L. et al. 2009, ApJ, 705, 978, 0906.1003Calabrese, E., Slosar, A., Melchiorri, A., Smoot, G. F., & Zahn, O.
2008, Phys. Rev. D, 77, 123531, 0803.2309Chiang, H. C. et al. 2010, ApJ, 711, 1123, 0906.1181Chluba, J., Rubino-Martın, J. A., & Sunyaev, R. A. 2007, MNRAS,
374, 1310, arXiv:astro-ph/0608242
Chluba, J., & Sunyaev, R. A. 2010, MNRAS, 402, 1221, 0909.2378Cortes, M., Liddle, A. R., & Mukherjee, P. 2007, Phys. Rev. D, 75,
083520, arXiv:astro-ph/0702170Cyburt, R. H., Fields, B. D., Olive, K. A., & Skillman, E. 2005,
Astroparticle Physics, 23, 313, arXiv:astro-ph/0408033Das, S., et al. 2010, ApJ submittedde Bernardis, P. et al. 2000, Nature, 404, 955Draine, B. T. 2003, ARA&A, 41, 241, arXiv:astro-ph/0304489Dunkley, J., Bucher, M., Ferreira, P. G., Moodley, K., & Skordis,
C. 2005, MNRAS, 356, 925, arXiv:astro-ph/0405462Dunkley, J. et al. 2009, ApJS, 180, 306, 0803.0586Dunner, R., et al. 2010, in preparationDvali, G., & Tye, S. 1999, Physics Letters B, 450, 72, arXiv:hep-
ph/9812483Easther, R., & Peiris, H. 2006, JCAP, 0609, 010, astro-ph/0604214Fendt, W. A., Chluba, J., Rubino-Martın, J. A., & Wandelt, B. D.
2009, ApJS, 181, 627, 0807.2577Fernandez-Conde, N., Lagache, G., Puget, J., & Dole, H. 2008,
A&A, 481, 885, 0801.4299Finkbeiner, D. P., Davis, M., & Schlegel, D. J. 1999, ApJ, 524, 867,
astro-ph/9905128Fowler, J. W. et al. 2010, ArXiv e-prints, 1001.2934Fraisse, A. A. 2007, JCAP, 3, 8, arXiv:astro-ph/0603589Fraisse, A. A., Ringeval, C., Spergel, D. N., & Bouchet, F. R. 2008,
Phys. Rev. D, 78, 043535, 0708.1162Fu, L. et al. 2008, A&A, 479, 9, arXiv:0712.0884Ganga, K., Ratra, B., & Sugiyama, N. 1996, ApJ, 461, L61+,
arXiv:astro-ph/9512168Gnedin, N. Y. 2000, ApJ, 535, 530, arXiv:astro-ph/9909383Guth, A. H., & Pi, S. Y. 1982, Phys. Rev. Lett., 49, 1110Hajian, A., et al. 2010, ApJ submitted
20 J. Dunkley et al.
Hall, N. R. et al. 2010, ApJ, 718, 632, 0912.4315Hamann, J., Hannestad, S., Raffelt, G. G., & Wong, Y. Y. Y. 2007,
JCAP, 0708, 021, arXiv:0705.0440 [astro-ph]Hanany, S. et al. 2000, ApJ, 545, L5Hawking, S. W. 1982, Phys. Lett., B115, 295Hernandez-Monteagudo, C., & Ho, S. 2009, MNRAS, 398, 790,
0903.2814Hicken, M., Wood-Vasey, W. M., Blondin, S., Challis, P., Jha, S.,
Kelly, P. L., Rest, A., & Kirshner, R. P. 2009, ApJ, 700, 1097,0901.4804
Hincks, A. D. et al. 2009, ArXiv e-prints, 0907.0461Hindmarsh, M. 1994, ApJ, 431, 534, arXiv:astro-ph/9307040Hinshaw, G. et al. 2007, ApJS, 170, 288, arXiv:astro-ph/0603451Hu, W., Scott, D., Sugiyama, N., & White, M. 1995, Phys. Rev. D,
52, 5498Huey, G., Cyburt, R. H., & Wandelt, B. D. 2004, Phys. Rev. D,
69, 103503Ichikawa, K., Kawasaki, M., & Takahashi, F. 2007, JCAP, 0705,
007, astro-ph/0611784Ichikawa, K., Sekiguchi, T., & Takahashi, T. 2008, Phys. Rev. D,
78, 043509, 0712.4327Ichikawa, K., & Takahashi, T. 2006, Phys. Rev. D, 73, 063528,
arXiv:astro-ph/0601099Iliev, I. T., Mellema, G., Pen, U., Bond, J. R., & Shapiro, P. R.
2008, MNRAS, 384, 863, arXiv:astro-ph/0702099Izotov, Y. I., & Thuan, T. X. 2010, ApJ, 710, L67, 1001.4440Izotov, Y. I., Thuan, T. X., & Stasinska, G. 2007, ApJ, 662, 15,
arXiv:astro-ph/0702072Jedamzik, K., & Pospelov, M. 2009, New Journal of Physics, 11,
105028, 0906.2087Jones, W. C. et al. 2006, ApJ, 647, 823, arXiv:astro-ph/0507494Kamionkowski, M., Kosowsky, A., & Stebbins, A. 1997,
Phys. Rev. D, 55, 7368Kessler, R. et al. 2009, ApJS, 185, 32, 0908.4274Kinney, W. H., Kolb, E. W., Melchiorri, A., & Riotto, A. 2006,
Phys. Rev., D74, 023502, astro-ph/0605338Kneller, J. P., & Steigman, G. 2004, New Journal of Physics, 6,
117, arXiv:astro-ph/0406320Knox, L., Cooray, A., Eisenstein, D., & Haiman, Z. 2001, ApJ, 550,
7, arXiv:astro-ph/0009151Komatsu, E. et al. 2009, ApJS, 180, 330, 0803.0547Komatsu, E., & Kitayama, T. 1999, ApJ, 526, L1Komatsu, E., & Seljak, U. 2001, MNRAS, 327, 1353——. 2002, MNRAS, 336, 1256Komatsu, E. et al. 2010, ArXiv e-prints, 1001.4538Kosowsky, A., & Turner, M. S. 1995, Phys. Rev. D, 52, 1739Lagache, G., Dole, H., & Puget, J. 2003, MNRAS, 338, 555,
arXiv:astro-ph/0209115Larson, D. et al. 2010, ArXiv e-prints, 1001.4635Lewis, A., Challinor, A., & Lasenby, A. 2000, ApJ, 538, 473Lin, Y., Partridge, B., Pober, J. C., Bouchefry, K. E., Burke, S.,
Klein, J. N., Coish, J. W., & Huffenberger, K. M. 2009, ApJ,694, 992, 0805.1750
Linde, A. D. 1994, Phys. Rev., D49, 748Lo, A. S., & Wright, E. L. 2005, ArXiv Astrophysics e-prints,
arXiv:astro-ph/0503120Lueker, M. et al. 2009, arXiv:0912.4317, 0912.4317Ma, C.-P., & Bertschinger, E. 1995, ApJ, 455, 7, arXiv:astro-
ph/9401007Mangano, G., Melchiorri, A., Mena, O., Miele, G., & Slosar, A.
2007, JCAP, 0703, 006, astro-ph/0612150Mantz, A., Allen, S. W., & Rapetti, D. 2010a, MNRAS, 406, 1805,
0911.1788Mantz, A., Allen, S. W., Rapetti, D., & Ebeling, H. 2010b,
MNRAS, 1029, 0909.3098Marriage, T., et al. 2010a, in preparationMarriage, T. A. et al. 2010b, ArXiv e-prints, 1007.5256Massey, R. et al. 2007, ApJS, 172, 239, arXiv:astro-ph/0701480Menanteau, F. et al. 2010, ArXiv e-prints, 1006.5126Metropolis, N., Rosenbluth, A. W., & Rosenbluth,
M. N. and Teller, A. H. 1953, J. Chem. Phys., 21, 1087Miller, A. D., et al. 1999, ApJ, 524, L1, astro-ph/9906421Mukhanov, V. F., & Chibisov, G. V. 1981, JETP Letters, 33, 532
Mukhanov, V. F., Feldman, H. A., & Brandenberger, R. H. 1992,Phys. Rept., 215, 203
Peebles, P. J. E. 1966, ApJ, 146, 542
——. 1980, The large-scale structure of the universe (Researchsupported by the National Science Foundation. Princeton, N.J.,Princeton University Press, 1980. 435 p.)
Peimbert, M. 2008, ArXiv e-prints, 0811.2980Percival, W. J. et al. 2010, MNRAS, 401, 2148, 0907.1660Pogosian, L., & Vachaspati, T. 1999, Phys. Rev. D, 60, 083504,
arXiv:astro-ph/9903361Pryke, . C., et al. 2009, Astrophys. J., 692, 1247, 0805.1944Reichardt, C. L. et al. 2009, ApJ, 694, 1200, 0801.1491Reid, B. A. et al. 2010, MNRAS, 404, 60, 0907.1659Riess, A. G. et al. 2009, ApJ, 699, 539, 0905.0695Roychowdhury, S., Ruszkowski, M., & Nath, B. B. 2005, ApJ, 634,
90, arXiv:astro-ph/0508120Rozo, E. et al. 2010, ApJ, 708, 645, 0902.3702Rubino-Martın, J. A., Chluba, J., Fendt, W. A., & Wandelt, B. D.
2010, MNRAS, 403, 439, 0910.4383Schrabback, T. et al. 2010, A&A, 516, A63+, 0911.0053Seager, S., Sasselov, D. D., & Scott, D. 1999, ApJ, 523, L1Sehgal, N. et al. 2010a, ApJ, 709, 920, arXiv:0908.0540Sehgal, N., et al. 2010b, In preparationShafieloo, A., & Souradeep, T. 2008, Phys. Rev. D, 78, 023511,
0709.1944Sharp, M. K. et al. 2010, ApJ, 713, 82, 0901.4342Shaw, L. D., Nagai, D., Bhattacharya, S., & Lau, E. T. 2010, ArXiv
e-prints, 1006.1945Shaw, L. D., Zahn, O., Holder, G. P., & Dore, O. 2009, ApJ, 702,
368, 0903.5322Sievers, J. L. et al. 2009, ArXiv e-prints, 0901.4540Silk, J. 1968, ApJ, 151, 459Simha, V., & Steigman, G. 2008, Journal of Cosmology and Astro-
Particle Physics, 6, 16, 0803.3465Smoot, G. F. et al. 1992, ApJ, 396, L1Spergel, D. N. et al. 2007, ApJS, 170, 377, arXiv:astro-ph/0603449——. 2003, ApJS, 148, 175Starobinsky, A. A. 1982, Phys. Lett., B117, 175Steigman, G. 2007, Annual Review of Nuclear and Particle Science,
57, 463, arXiv:0712.1100——. 2010, Journal of Cosmology and Astro-Particle Physics, 4,
29, 1002.3604Steigman, G., Schramm, D. N., & Gunn, J. E. 1977, Phys. Lett.,
B66, 202Sunyaev, R. A., & Zel’dovich, Y. B. 1970, 7, 3Suyu, S. H., Marshall, P. J., Auger, M. W., Hilbert, S., Blandford,
R. D., Koopmans, L. V. E., Fassnacht, C. D., & Treu, T. 2010,ApJ, 711, 201, 0910.2773
Swetz, D. S. et al. 2010, ArXiv e-prints, 1007.0290Switzer, E. R., & Hirata, C. M. 2008, Phys. Rev. D, 77, 083006,
arXiv:astro-ph/0702143Toffolatti, L., Argueso Gomez, F., de Zotti, G., Mazzei, P.,
Franceschini, A., Danese, L., & Burigana, C. 1998, MNRAS, 297,117
Trac, H., Bode, P., & Ostriker, J. P. 2010, ArXiv e-prints, 1006.2828Trac, H., Cen, R., & Loeb, A. 2008, ApJ, 689, L81, 0807.4530Trotta, R., & Hansen, S. H. 2004, Phys. Rev. D, 69, 023509Urrestilla, J., Bevis, N., Hindmarsh, M., Kunz, M., & Liddle, A. R.
2008, JCAP, 7, 10, 0711.1842Verde, L., & Peiris, H. 2008, JCAP, 7, 9, 0802.1219Viero, M. P. et al. 2009, ApJ, 707, 1766, 0904.1200Vikhlinin, A. et al. 2009, ApJ, 692, 1060, 0812.2720Vilenkin, A., & Shellard, E. P. S. 2000, Cosmic Strings and Other
Topological DefectsWong, W. Y., & Scott, D. 2007, MNRAS, 375, 1441, arXiv:astro-
ph/0610691Wyman, M., Pogosian, L., & Wasserman, I. 2005, Phys. Rev. D,
72, 023513, arXiv:astro-ph/0503364——. 2006, Phys. Rev. D, 73, 089905Zaldarriaga, M., & Seljak, U. 1997, Phys. Rev. D, 55, 1830