The Asset Portfolios of Native-Born and Foreign-Born Households
37
IZA DP No. 3304 The Asset Portfolios of Native-Born and Foreign-Born Households Deborah A. Cobb-Clark Vincent A Hildebrand DISCUSSION PAPER SERIES Forschungsinstitut zur Zukunft der Arbeit Institute for the Study of Labor January 2008
-
Upload
independent -
Category
Documents
-
view
0 -
download
0
Transcript of The Asset Portfolios of Native-Born and Foreign-Born Households

IZA DP No. 3304
The Asset Portfolios of Native-Born andForeign-Born Households
Deborah A. Cobb-ClarkVincent A Hildebrand
DI
SC
US
SI
ON
PA
PE
R S
ER
IE
S
Forschungsinstitutzur Zukunft der ArbeitInstitute for the Studyof Labor
January 2008

The Asset Portfolios of Native-Born
and Foreign-Born Households
Deborah A. Cobb-Clark RSSS, Australian National University
and IZA
Vincent A Hildebrand Glendon College, York University
and CEPS/INSTEAD
Discussion Paper No. 3304 January 2008
IZA
P.O. Box 7240 53072 Bonn
Germany
Phone: +49-228-3894-0 Fax: +49-228-3894-180
E-mail: [email protected]
Any opinions expressed here are those of the author(s) and not those of IZA. Research published in this series may include views on policy, but the institute itself takes no institutional policy positions. The Institute for the Study of Labor (IZA) in Bonn is a local and virtual international research center and a place of communication between science, politics and business. IZA is an independent nonprofit organization supported by Deutsche Post World Net. The center is associated with the University of Bonn and offers a stimulating research environment through its international network, workshops and conferences, data service, project support, research visits and doctoral program. IZA engages in (i) original and internationally competitive research in all fields of labor economics, (ii) development of policy concepts, and (iii) dissemination of research results and concepts to the interested public. IZA Discussion Papers often represent preliminary work and are circulated to encourage discussion. Citation of such a paper should account for its provisional character. A revised version may be available directly from the author.

IZA Discussion Paper No. 3304 January 2008
ABSTRACT
The Asset Portfolios of Native-Born and Foreign-Born Households*
This paper analyses the net worth and asset portfolios of native- and foreign-born Australian families using HILDA (wave 2) data. Specifically, we estimate a system of asset equations with an adding-up constraint imposed to control for variation in households’ total net worth. Our results indicate that after accounting for differences in human capital and income levels, single immigrants have a wealth advantage of almost $185,000 relative to single native-born individuals. Although the wealth gap between mixed and native-born couples is not statistically significant, immigrant-only couples have approximately $150,000 less wealth on average than native-born couples. Relative to equally wealthy native-born couples, immigrant-only couples hold substantially more of their wealth in their homes and less in the form of vehicles and financial assets. Mixed couples, on the other hand, allocate their wealth across assets in the same way as native-born couples. JEL Classification: J61, G11, J1 Keywords: wealth, immigrants, housing Corresponding author: Deborah Cobb-Clark Department of Economics Research School of Social Sciences Australian National University Canberra, ACT 0200 Australia E-mail: [email protected]
* This paper uses confidentialised unit record file data from the Household, Income and Labour Dynamics in Australia (HILDA) survey. The HILDA project was initiated and is funded by the Department of Families, Community Services, and Indigenous Affairs (FacSIA) and is managed by the Melbourne Institute of Applied Economic and Social Research (MIAESR). The findings and views reported in this paper, however, are those of the authors and should not be attributed to FaCSIA or MIAESR. The authors are grateful for support from the Social and Economic Dimensions of an Aging Population (SEDAP) Research Program, a SSHRC Grant (#410-2007-1477) and an Australian Research Council Discovery Grant (DP0666158). Mykhalo Oystrakh provided excellent research assistance.

1 Introduction
There is a great deal we do not understand about how households accumulate wealth.
However, it is clear is that �whatever the process �the result is enormous inequal-
ity in wealth across households. The richest 10 per cent of Australian households
are estimated to hold 45 per cent of all household wealth, while the bottom half
of the distribution owns less than 10 per cent of total household wealth (Heady et
al. 2005). Wealth inequality in other countries is similar (Davies and Shorrocks
2000; Wol¤ 2006). Economists are increasingly using detailed comparative studies
of wealth levels across groups as way of gaining a deeper understanding of both the
wealth generation process and the channels through which inequality might be gen-
erated. In the United States, the focus has been largely on racial di¤erences (Blau
and Graham 1990; Gittleman and Wol¤ 2000; Altonji and Doraszelski 2005) and
(more recently) on ethnicity (Cobb-Clark and Hildebrand 2006b, 2006c) or nativity
(Cobb-Clark and Hildebrand 2006a). In other countries like Canada, Germany, and
New Zealand there is also an increasing focus on the disparity in wealth levels be-
tween native- and foreign-born households (Shamsuddin and DeVoretz 1998; Zhang
2003; Bauer et al. 2007; Gibson et al. 2007; Sinning 2007). This international
evidence suggests that natives accumulate more wealth than do immigrants with
similar characteristics, though the magnitude of the gap varies widely across the
wealth distribution as well as between countries.
These issues have only recently begun to be studied in depth in Australia. Previ-
ous research suggests that foreign-born households hold less wealth than Australian-
born households (Heady et al. 2005), though the magnitude of the nativity wealth
gap in Australia is small compared to other countries, relatively constant across the
wealth distribution, and cannot be explained by di¤erences in the characteristics of
natives and immigrants (Bauer et al. 2007). We know less about nativity di¤erences
1

in the composition of wealth, however. This is unfortunate because institutional
barriers to credit markets, cultural in�uences on savings behavior, and variation in
residential patterns, earnings histories, and the incentives for precautionary savings
may all lead the portfolio choices of immigrants to di¤er from those of the native
born (see Cobb-Clark and Hildebrand 2006a; 2006b). Understanding more about
these issues is important for a number of reasons. First, research suggests that there
is a di¤erential propensity to consume out of non-�nancial (housing) and �nancial
wealth (Tan and Voss 2003; Bostic et al. 2005; Dvornak and Kohler 2007), implying
that consumption expenditure may di¤er among groups with similar wealth levels
but dissimilar portfolios. Second, the Australian debate on population aging has
thus far completely overlooked the fact that the immigrant population is aging more
rapidly than the Australian-born population.1 The Government�s report on the
challenges posed by an aging population does not di¤erentiate its projections by
nativity status for example (Commonwealth of Australia, 2002; 2007). Given that
there are important di¤erences in the life-cycle pattern of ownership and portfolio
shares across asset types (Porterba and Samwick 2001), any future �scal pressure
generated by population aging will rest heavily on how much, and what types, of
wealth Australian households �including immigrant households �hold. Third, as-
sets di¤er in terms of their expected rates of return, riskiness, and liquidity leading
them to serve di¤erent functions in providing for a household�s �nancial security.
Portfolio choices then have important implications for the rate at which wealth is
accumulated as well as for the adequacy of precautionary savings and retirement
income (see Bertaut and Starr-McCluer 2002). Finally, wealth appears to provide
a degree of economic security which is important in individuals� overall sense of
wellbeing (Heady and Wooden 2004).
This paper contributes to our understanding of these issues by analysing the
net worth and asset portfolios of Australian families using data from the House-
2

hold, Income and Labour Dynamics in Australia (HILDA) Survey. These data
are particularly well-suited to addressing questions related to the composition of
wealth among foreign-born households. In particular, wave 2 of HILDA included
a special module on household wealth and the survey�s relatively large sample size
allows us to explicitly di¤erentiate between native- and foreign-born single individ-
uals on the one hand and native-born, immigrant-only, and mixed couples on the
other. Our empirical speci�cation explicitly accounts for those households with
nonpositive wealth. Moreover, asset composition is allowed to depend on net worth
and our model of asset portfolios is therefore estimated as a system of equations
with cross-equation restrictions imposed to ensure that the adding-up requirement
is met (see Blau and Graham 1990). This estimation strategy allows us to answer
the following questions: First, how does net worth vary by nativity status, region
of origin, and immigration cohort. Second, how do the portfolio choices of equally
wealthy native- and foreign-born households di¤er?
We �nd that after accounting for di¤erences in human capital characteristics
and income levels, single immigrants have a wealth advantage of almost $185,000
relative to single native-born individuals. On the other hand, while the wealth gap
between mixed and native-born couples is not statistically signi�cant, immigrant-
only couples have approximately $150,000 less wealth on average than native-born
couples. Net worth is largely unrelated to a household�s arrival cohort, although
there is substantial variation in household net worth across region-of-origin groups.
Relative to equally wealthy native-born couples, immigrant-only couples hold sub-
stantially more of their wealth in their homes and less of their wealth in the form
of vehicles and �nancial assets. Mixed couples, on the other hand, allocate their
wealth across assets in the same way as native-born couples.
We proceed as follows. In Section 2 we discuss the details of the HILDA data,
while Section 3 describes the empirical speci�cation and presents our results. Our
3

conclusions follow in Section 4.
2 Data
2.1 The HILDA Survey
The data come from the Household Income and Labour Dynamics in Australia
(HILDA) Survey which is a longitudinal survey of Australian households encompass-
ing approximately 13,000 individual respondents living in more than 7,000 house-
holds. Our analysis exploits the 2002 release of HILDA (wave 2) which included a
special module on household wealth (see Wooden et al. 2002; Heady et al. 2005).
This wealth module is unique as it provides the only recent source of data on the
assets and liabilities of individual Australian households. While accurately measur-
ing assets and liabilities is always di¢ cult, the aggregate net worth of Australian
households estimated from HILDA matches aggregate wealth statistics derived from
national accounts by the Reserve Bank of Australia remarkably well (Marks et al.
2005). In addition, it is interesting to note that the distributions of the major
components of wealth captured in HILDA are consistent with various estimates over
the 1986-2000 period derived from indirect measures of wealth in previous studies
(see Marks et al. 2005 for a detailed discussion).
We restrict our sample to include all single- and couple-headed households in
which the reference person is between 25 years and 75 years old. Native-born couples
include all couple-headed households in which both partners were born in Australia,
while immigrant-only couples comprise all couple-headed households in which both
partners are foreign-born. Mixed couples are those in which one partner is native-
born and the other is foreign-born.2 Excluding all observations with missing values
on one or more of the variables of interest results in a total sample of 3360 couple-
headed households (including 2125 native-born, 664 mixed, and 571 immigrant-only
4

couples) and 2434 single-headed households (including 1851 native-born and 583
immigrant households).
Most of HILDA�s wealth components are collected at the household level (see
Heady 2003 for details). In this paper, we consider the way in which wealth is
distributed across the �ve broad asset types commonly discussed in the wealth liter-
ature including: net �nancial wealth, net business equity, net real estate equity, the
value of vehicles, and the total value of superannuation assets. More speci�cally,
net �nancial wealth is calculated as the total value of interest-bearing assets held
in banks and other institutions, stocks and mutual funds, life insurance funds, trust
funds and collectibles minus the total value of unsecured debts (which also includes
car loans). Net business equity includes the net value of all business shares owned
by all household members. Real estate captures the net value (equity) of all prop-
erties owned by household members including principal home, holiday and other
properties. The vehicle component re�ects the total value of all vehicles owned
by household members including all transport and recreational (such as boats or
caravans) vehicles.3 The superannuation component includes the total amount of
superannuation capital owned by all household members (see Heady 2003 for de-
tails).
2.2 Net Worth and Asset Portfolios
Information about household wealth, asset holdings, and income by nativity status
and household type is presented in Table 1. Although the median wealth levels of
native-born and mixed couples are virtually identical, immigrant-only couples have
approximately $85,000 less net worth at the median than other couples. This wealth
gap is likely to be related to di¤erences in the pattern of asset ownership. Virtually
all Australian couples �irrespective of their nativity status �report owning wealth in
the form of both �nancial assets and vehicles. However, while one in �ve native-born
5

and mixed couples own business assets, this is true of only 14 per cent of immigrant-
only couples. Similarly, immigrant-only couples are much less likely to own real
estate (77 versus 87 per cent) or have superannuation wealth (78 versus 90 per
cent). For those who do however, equity in real estate holdings is not signi�cantly
di¤erent to that of native-born couples though the value of superannuation assets
lags behind. Single immigrants, have similar wealth and income levels to single
native-born individuals. Rates of asset ownership are also very similar across the
two groups and �conditional on ownership �there is no signi�cant di¤erence in the
superannuation wealth of immigrants. Information about the characteristics of the
sample are presented by immigrant status and household type in the Appendix (see
Table A1).
[TABLE 1 HERE]
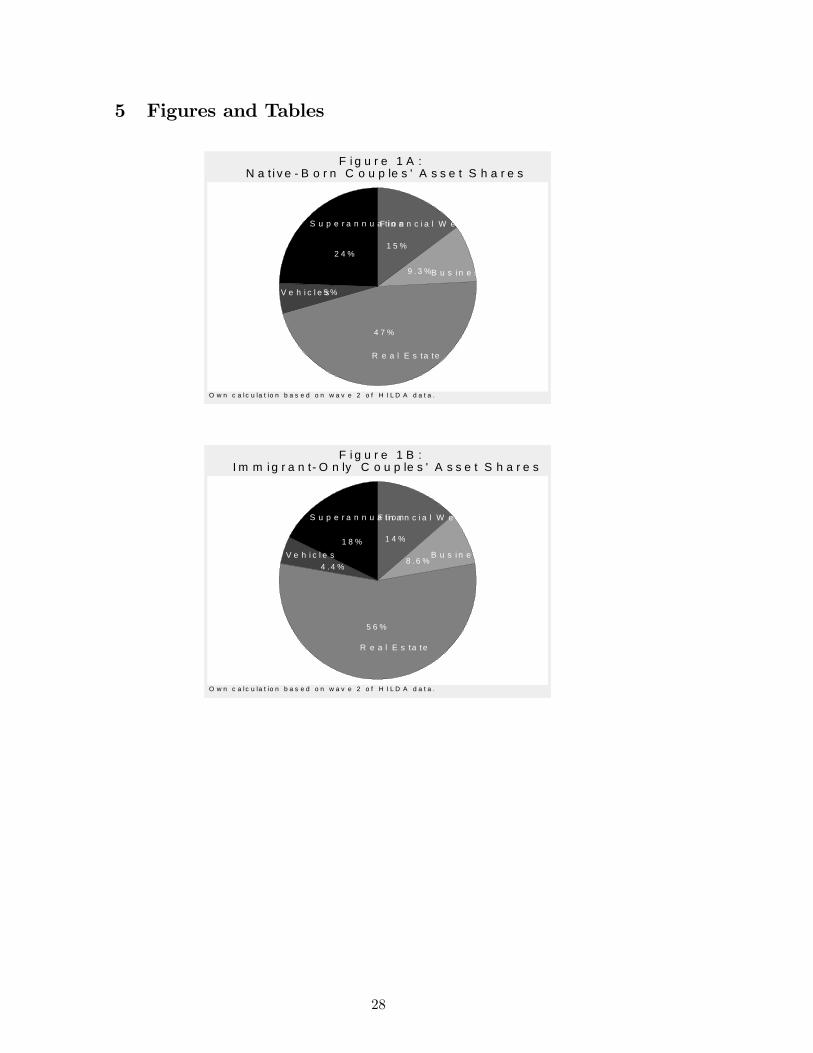
Given these di¤erences in wealth levels and patterns of asset ownership, it is
perhaps not surprising that asset portfolios are also related to nativity status and
household type. Figures 1A - 1E show the way in which each group�s net worth is
distributed across the �ve major asset categories. Although the average share of
wealth held as �nancial assets (approximately 14 per cent) and vehicles (approxi-
mately 5 per cent) is unrelated to a couple�s nativity status, there are substantial
di¤erences in the way the wealth is allocated across other asset types. Immigrant-
only couples hold over half (56 per cent) of their wealth in real estate, while 18
per cent of their wealth is in the form of superannuation assets (see Figure 1B).
In contrast, native-born and mixed couples have somewhat less of their wealth tied
up in real estate and instead have superannuation assets that account for fully a
quarter of their total wealth portfolio (see Figures 1A and 1C). Interestingly, the
asset portfolios of single individuals appear to be less sensitive to nativity status.
In particular, native- and foreign-born individuals allocate similar fractions of their
6

wealth to real estate (53 versus 58 per cent) and superannuation (17 versus 12 per
cent).
[FIGURES 1A - 1E HERE]
3 Empirical Speci�cation and the Results
It is possible that the relationship between nativity status and portfolio allocation
re�ects di¤erences between groups in the underlying factors such as income or life-
cycle stage which determine the way in which families allocate their wealth. Alter-
natively, these di¤erences may arise from disparities in wealth levels themselves. To
investigate this issue, we begin by estimating the determinants of net worth in order
to assess how wealth levels are related to household characteristics, in particular na-
tivity status. We then turn to estimating a simultaneous model of asset allocation
which takes account of a household�s net worth. This allows us to compare the asset
portfolios of households that are equally wealthy.
3.1 The Determinants of Net Worth
Conceptually, variation in wealth levels across households is due to di¤erences in the
level of inherited wealth, rates of return on existing assets, or in previous savings
behavior (i.e., income and consumption patterns). Most of the previous empirical
wealth literature estimates reduced-form models which are meant to capture the
fundamental relationships between household characteristics and these sources of
wealth disparity. Life-cycle theory, for example, suggests that consumption and
savings decisions �and ultimately wealth accumulation �are functions of permanent
rather than current income levels. If, however, households face income uncertainty
or credit constraints we would expect transitory income shocks to have an indepen-
dent e¤ect on wealth levels. Moreover, Lundberg and Ward-Batts (2000) note that
although much of the previous literature on the life-cycle behavior of households
7

has attempted to explain outcomes like savings levels or retirement patterns using
individual-based models, net worth is also likely to be a function of factors such as
spouses�relative bargaining power, savings goals, etc. Consistent with this, Lund-
berg and Ward-Batts provide evidence that the characteristics of both partners are
important determinants of household net worth.
Given this conceptual framework, we estimate the following reduced-form
model of net worth (Wi) for couple i:
sinh�1(Wi) = �0 + Yi�1 +Xi�2 + Ii � [Fi�1 +Mi�2 + Ci�3 +Ri�4] + �i (1)
where Yi is a vector of the household�s permanent and transitory income. Following
Blau and Graham (1990), we generate a measure of permanent income by predicting
income using income models estimated on wave 2 HILDA data.4 Moreover, Xi in-
cludes the demographic characteristics of both partners (a cubic in age and indicator
variables for previous relationships) as well as household characteristics (number of
children younger than 18 living in the household and the number of years a couple
has been together). Thus, �2 will largely re�ect the e¤ect of a household�s life-
cycle stage on wealth levels. The relationship between nativity status and wealth
levels is captured through a series of indicator variables which di¤erentiate between
immigrant-only (Fi) and mixed (Mi) couples and take account of both immigration
cohort and region of origin. Speci�cally, Ii is an indicator variable which takes
the value of one for couples with at least one foreign-born partner, i.e. whenever
Fi = 1 or Mi = 1. Given this, �1 and �2 capture the estimated wealth gap
between immigrant-only and mixed couples relative to similar native-born couples.
Moreover, the model includes a full set of indicators for arrival cohorts (Ci) and
regions of origin (Ri) to capture variation in wealth within the immigrant popula-
tion.5 Equation (1) is identi�ed by constraining the coe¢ cients on the cohort and
region of origin indicators to sum to zero.6 The model includes a random error
term, �it s N(0; �2); and all remaining terms are vectors of parameters to be esti-
8

mated. Finally, we adopt an inverse hyperbolic sine transformation (sinh�1) of the
wealth and income data which accounts for skewness in the distributions of these
variables, but unlike the more standard log transformation is de�ned for households
with nonpositive transitory income and net worth.7 The model for single individ-
uals is de�ned analogously. Marginal e¤ects and t-statistics from equation (1) are
calculated for both couples and single individuals and presented in Table 2.8
Not surprisingly, household wealth is closely related to both permanent and
transitory income. Speci�cally, couples hold an additional $57 dollars in net worth
for every additional dollar of permanent income they have, while single individuals
accumulate $83 dollars in wealth for each additional dollar of permanent income.
On the other hand, net worth is approximately $5 lower for every dollar that current
income falls short of permanent income. Consistent with Lundberg and Ward-Batts
(2000), we also �nd that the age of both partners is closely related to net worth. In-
terestingly, household wealth is not related to the number of years a couple has been
together, but is substantially lower when either partner has been previously married
though neither e¤ect is statistically signi�cant. On the other hand, divorced and
widowed individuals have approximately $215,000 less wealth on average than their
never-married counterparts, a di¤erence which is statistically signi�cant. Finally,
couples with children less than age 18 still at home have substantially less wealth
than couples without children or couples whose children have left home, though
there is no e¤ect of children on the wealth levels of single individuals.
[Table 2 HERE]
Foreign-born individuals have a wealth advantage of almost $185,000 relative to
similar native-born individuals. On the other hand, while the wealth gap between
mixed and native-born couples is not statistically signi�cant, immigrant-only couples
have substantially less wealth �approximately $150,000 on average �than native-
9

born couples with the same income levels and demographic pro�les. This wealth gap
is much larger than the unconditional nativity wealth (see Table 1) and is consistent
with previous evidence suggesting that, given their characteristics, immigrant-only
couples would be expected to have a wealth advantage if they accumulated wealth
in the same way as similar native-born couples (Bauer et al. 2007).
It is also interesting to consider how the wealth position of immigrants varies
with the length of time a household has been in Australia and where it migrated
from. The parameterization of equation (1) implies that �3 and �4 measure de-
viations in wealth across entry cohorts and regions of origin respectively from the
average wealth of the immigrant population as a whole (i.e. Ii = 1). Net worth is
largely unrelated to a household�s arrival cohort, although mixed and immigrant-only
couples arriving in Australia between 1975 and 1984 have signi�cantly more wealth
than the population of mixed and immigrant-only couples as a whole. In contrast,
there is substantial variation in household net worth across region of origin groups.
Households in which at least one partner is foreign born have higher than average
wealth when the household is from non-English-speaking Europe and substantially
lower than average wealth when the household is from a non-English-speaking coun-
try elsewhere in the world. Finally, foreign-born individuals from English-speaking
countries have signi�cantly lower net worth than the average. Consistent with
previous evidence for immigrants to the United States (Cobb-Clark and Hildebrand
2006a), these results highlight that there is considerable variation in wealth levels
within the population of immigrants to Australia which is more closely related to
regions of origin rather than to entry cohorts.
3.2 Asset Portfolios
Cultural in�uences on savings behaviour, di¤erential access to credit markets, dis-
parity in residential patterns and earnings pro�les, and the potential for return
10

migration may all lead native- and foreign-born households to not only acquire dif-
ferent levels of net worth, but to also allocate their wealth di¤erently across asset
types. For example, the savings behaviour and risk attitudes of children have been
linked to those of their parents (Chiteji and Stanford 1999; Dohmen et al. 2006) sug-
gesting that social norms in the sending country may in�uence the post-migration
portfolio decisions of immigrants. Risk attitudes may also be directly linked to
nativity (Bonin et al. 2007), and there are concerns that immigrants may face
particular barriers in accessing �nancial markets after migration (Osili and Paulson
2004; 2005) which may limit their ability to secure the necessary funding to purchase
assets such as housing or businesses. Finally, the potential for return migration
implies that immigrants have the ability to spread �nancial and labour market risk
across two markets which will in�uence the extent to they engage in precautionary
savings as well as the types of assets they hold (Galor and Stark 1990; Djajic and
Melbourne 1988; Djajic 1989; Dustmann 1987; Amuedo-Dorantes and Pozo 2002).
To gain a deeper understanding of these issues, we need an estimation strategy
that: �rst, recognizes that the propensity to invest in a speci�c asset will depend
on the type and amount of other assets held; and second, compares households
with the same level of net worth. Estimating a single-asset equation controlling
for immigrant status would ignore the simultaneous nature of the portfolio decision
as well as confound the e¤ect of disparity in wealth levels associated with nativity
status with nativity-related di¤erences in the propensity to allocate wealth to certain
assets. Therefore, we need to estimate a system of equations with an adding up
constraint imposed to account for total net worth (see Blau and Graham 1990).
Consequently, we estimate the following reduced-form model of asset composition:
sinh�1(Aik) = a0k + Yib1k +Xib2k +Wib3k (2)
+Ii � [Fia1k +Mia2k + FiWib4k +MiWib5k + Cib6k +Rib7k] + �ik
11

where Aik is the dollar value of asset k that household i holds. We consider �ve ma-
jor asset categories: �nancial wealth, business equity, real estate equity, total value
of vehicles, and superannuation funds. As above, Yi includes both permanent and
transitory income, while Xi includes those demographic characteristics re�ecting a
household�s life-cycle stage. These characteristics are assumed to have a direct e¤ect
on the allocation of wealth across asset types, while other characteristics, for exam-
ple education and occupation, a¤ect asset portfolios only indirectly through their
e¤ect on permanent income. Asset composition depends on net worth (Wi) in order
to account for any capital market imperfections (such as credit constraints) which
might vary across households and be related to the decision to hold a particular
asset. Di¤erences in the e¤ect of wealth on the asset portfolios of immigrant-only
and mixed couples relative to similar native-born couples are captured in equation
(2) by an interaction term between net worth (Wi) and our indicator variables for
immigrant-only (Fi) and mixed (Mi) couples. We again adopt an inverse hyper-
bolic sine transformation (sinh�1) of assets and income to account for the potentially
nonpositive and highly skewed nature of the distributions of these variables. Finally,
equation (2) is estimated as a system of equations and a set of cross-equation re-
strictions are imposed in order to satisfy the adding-up requirement that the sum
of assets across asset types equals net worth.9 The model for single individuals
is de�ned analogously. Marginal e¤ects and t-statistics from this estimation are
presented in Table 3 for couples and in Table 4 for single individuals.10
The way in which households allocate their wealth across major asset categories
is closely related to both permanent and transitory income levels. Comparing
households that are equally wealthy, but which have di¤erent incomes, we �nd that
at higher levels of permanent income both couples and single individuals are hold-
ing more of their net worth in business assets and superannuation and less of their
wealth in real estate. On the other hand, larger gaps between permanent and cur-
12

rent income levels, i.e. larger transitory income shocks, are associated with couples
allocating more of their portfolio to business assets, but less to superannuation and
�nancial wealth. These patterns imply that a couple with relatively little perma-
nent income that is also facing a transitory income shock will have concentrated more
of its wealth in housing than an equally wealthy couple with higher levels of income.
Single individuals experiencing a transitory income shock also hold more business
and fewer superannuation assets, though the relationship between transitory income
shocks and �nancial wealth, while negative, is insigni�cant. In sum, higher income
appears to be associated with a diversi�cation of wealth across all other asset types
for both couples and single individuals. Superannuation wealth, for example, is ex-
pected to increase between $16.31 (couples) and $18.40 (single individuals) for every
dollar permanent income increases, everything else equal. Finally, it is interesting
to note that when current income lags behind permanent income, both couples and
single individuals hold more equity in businesses. This is consistent with Anders-
son and Wadensjö (2006) who �nd that the propensity of becoming self-employed is
higher among workers whose predicted income di¤ers from their current income per-
haps suggesting that households are using self-employment to bu¤er against lower
than expected incomes.
[TABLES 3 AND 4 HERE]
Asset portfolios are also correlated with a household�s life-cycle stage. Increases
in the age of the household head, for example, are associated with a household
holding more of its wealth in �nancial assets and less in real estate or superannuation.
Although a household�s wealth level is directly related to the age of the spouse (see
Table 2), a spouse�s age is only loosely linked to the couple�s portfolio allocation once
we control for net worth and the age of the household head. Households with young
children under the age of 18 hold more of their wealth in the form of real estate and
13

less in the form of superannuation. Moreover, sole parents also have more equity in
businesses than equally wealthy single individuals without children at home. This
is consistent with previous evidence that the number of children at home is positively
related to the probability that a women is self-employed (Connelly 1992; Hildebrand
and Williams 2003; Williams 2004). Finally, divorced and widowed individuals hold
more real estate and less superannuation wealth on average than equally wealthy
never-married individuals, while it is the �nancial wealth and real estate holdings of
couples that are most closely related to the marriage history of spouses. On balance,
these results are broadly consistent with the way in which we expect asset portfolios
to evolve as households age. Younger households with children hold a relatively large
share of their assets in real estate, while older households have shifted their wealth to
liquid assets (�nancial wealth) from illiquid assets (real estate and superannuation)
(see Porterba and Sandwick 1997; Flavin and Yamashita 2002; Milligan 2005).
Relative to equally wealthy native-born couples, immigrant-only couples hold
substantially more (approximately $500,000 on average) of their wealth in their
homes and less of their wealth in the form of vehicles and �nancial assets. On
the other hand, mixed couples in which one partner is native born and the other is
foreign born allocate their wealth across assets in the same way as couples in which
both partners are native born. There are no statistical di¤erences in the portfolio
allocations of these latter two groups suggesting that intermarriage may be associ-
ated with the assimilation of immigrants�wealth levels and asset holdings towards
Australian norms. This would be consistent with other evidence that intermarriage
is associated with faster wage assimilation after migration (Meng and Gregory 2005;
Meng and Meurs 2006). Still, there is also no statistical di¤erence in the portfolio
allocations of foreign- and native-born single individuals (see Table 4) which may
imply that in Australia portfolio allocations do not di¤er much across nativity status
and that the di¤erences in the relative portfolio allocations of immigrant-only and
14
mixed couples stem from selectivity into intermarriage (see Kantarevic 2004). It is
particularly striking that, irrespective of household type, immigrants hold the same
level of superannuation wealth as equally wealthy native-born Australians. This
is somewhat surprising given the large US literature documenting the disparity in
the labour market outcomes, in particular the earnings pro�les, of immigrants and
natives (see for example Chiswick 1978; Borjas 1985; Schultz 1998). Immigrants to
Australia, however, have a lower earnings disadvantage upon entry as well as a slower
rate of earnings assimilation than do immigrants to the United States (Chiswick and
Miller 1985; Miller and Neo 2003) which may account for their ability to accumulate
superannuation wealth in a way that is consistent with native-born workers.
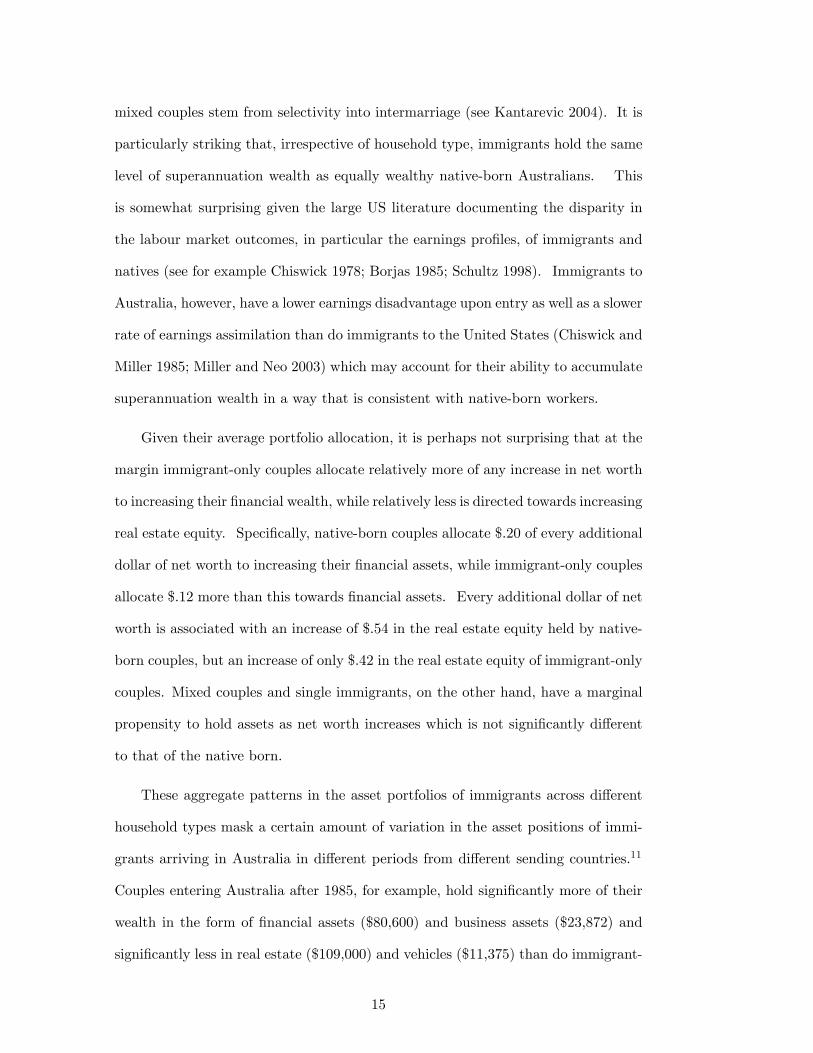
Given their average portfolio allocation, it is perhaps not surprising that at the
margin immigrant-only couples allocate relatively more of any increase in net worth
to increasing their �nancial wealth, while relatively less is directed towards increasing
real estate equity. Speci�cally, native-born couples allocate $.20 of every additional
dollar of net worth to increasing their �nancial assets, while immigrant-only couples
allocate $.12 more than this towards �nancial assets. Every additional dollar of net
worth is associated with an increase of $.54 in the real estate equity held by native-
born couples, but an increase of only $.42 in the real estate equity of immigrant-only
couples. Mixed couples and single immigrants, on the other hand, have a marginal
propensity to hold assets as net worth increases which is not signi�cantly di¤erent
to that of the native born.
These aggregate patterns in the asset portfolios of immigrants across di¤erent
household types mask a certain amount of variation in the asset positions of immi-
grants arriving in Australia in di¤erent periods from di¤erent sending countries.11
Couples entering Australia after 1985, for example, hold signi�cantly more of their
wealth in the form of �nancial assets ($80,600) and business assets ($23,872) and
signi�cantly less in real estate ($109,000) and vehicles ($11,375) than do immigrant-
15

only and mixed couples as a whole. Similarly, single immigrants arriving after 1985
also hold more �nancial assets and less real estate than more established immigrants
arriving earlier. This tendency of more recent immigrants to hold a larger share of
their total wealth in �nancial rather than housing assets is consistent with previous
evidence for immigrants to the United States (Cobb-Clark and Hildebrand 2006a).
Unfortunately, the cross-sectional nature of our data does not allow us to assess
the extent to which these patterns are due to life cycle e¤ects (aging e¤ects) rather
than to birth cohort e¤ects within the immigrant population. Finally, single indi-
viduals from non-English-speaking Europe have signi�cantly more of their wealth in
superannuation assets than do other single immigrants, while immigrants from other
non-English-speaking countries hold signi�cantly less wealth in superannuation and
vehicles.
4 Conclusions
Wealth plays a critical role in providing economic security to households throughout
the life cycle. Given this, there are a number of reasons to be interested in nativity
di¤erences in not only the level of household wealth, but also in its composition.
Consumption patterns have been linked to portfolio decisions (Tan and Voss 2003;
Bostic et al. 2005; Dvornak and Kohler 2007), for example, suggesting that ex-
penditure may di¤er amongst equally wealthy households with dissimilar portfolios.
Moreover, there is substantial life-cycle variation in the ownership rates and port-
folio shares of di¤erent assets (Porterba and Samwick 1997). This implies that an
understanding of the �scal e¤ects of population aging requires insight into the way
that wealth levels and asset portfolios di¤er across native- and foreign-born Aus-
tralian households. Finally, assets di¤er in terms of their expected rates of return,
riskiness, and liquidity leading them to serve di¤erent functions in providing for a
household�s �nancial security.
16

This paper begins to address these issues by analysing nativity di¤erences in the
net worth and asset portfolios of Australian families. To this end, we use HILDA
data to estimate the determinants of net worth and asset composition. Our es-
timation strategy accounts for the non-positive, highly-skewed nature of many of
our underlying data and allows us to estimate a system of asset equations with
cross-equation restrictions imposed to ensure that the adding-up requirement is met
(see Blau and Graham 1990). Our results indicate that single immigrants have
a wealth advantage of almost $185,000 relative to single native-born individuals
once di¤erences in human capital characteristics and income levels are taken into
account. However, couples in which both partners are foreign born have approx-
imately $150,000 less wealth on average than couples in which both partners are
native born. The wealth gap between mixed and native-born couples is not sta-
tistically signi�cant. While net worth is largely unrelated to a household�s arrival
cohort, there is substantial variation in household net worth across region-of-origin
groups. Immigrant-only couples hold substantially more of their wealth in their
homes and less of their wealth in the form of vehicles and �nancial assets than do
equally wealthy native-born couples. Mixed couples, on the other hand, allocate
their wealth across assets in the same way as native-born couples.
Taken together, these results suggest that there are many reasons to be opti-
mistic about the overall wealth position of immigrants to Australia. The nativity
wealth gap is much smaller in Australia than in other immigrant-receiving countries
for example (see Bauer et al 2007). At the median, immigrant-only couples have
approximately 83 per cent of the net worth of native-born couples, while mixed
couples and single immigrants have a small wealth advantage (see Table 1). Like
Bauer et al. 2007, however, we also �nd that mixed and immigrant-only couples�
wealth disadvantage grows once we control for a household�s income level and life-
cycle stage indicating that immigrant couples are positively selected with respect
17
to wealth-related characteristics. In contrast, the wealth advantage of single immi-
grants becomes larger rather than smaller once we condition on their characteristics
implying that �unlike immigrant couples �single immigrants are negatively selected
with respect to those characteristics most closely associated with net worth. Their
large wealth advantage only becomes apparent when we compare them to native-
born individuals with similar characteristics.
The di¤erences in the relative wealth position and asset holdings of mixed and
immigrant-only couples points to the possibility that intermarriage may facilitate
the wealth assimilation of immigrants to Australia. Couples in which one partner is
foreign born and the other native born have wealth levels and asset portfolios that
are not signi�cantly di¤erent to those of otherwise similar couples in which both
partners are native born. Assimilation in wealth associated with intermarriage
would be consistent with previous research which �nds that intermarriage is linked
to faster wage assimilation after migration (Meng and Gregory 2005; Meng and
Meurs 2006). At the same time, the cross-sectional nature of our data does not
allow us to account for any unobserved heterogeneity associated with intermarriage.
In particular, our �nding that immigrant couples are positively selected with respect
to wealth-related characteristics while single immigrants are negatively selected is
also consistent with positive selection into marriage generally. Unfortunately,
our cross-sectional data also do not allow us to make any progress in ascertaining
whether �as is the case with wages � there is assimilation in the wealth position
of immigrants with time since migration. Immigrant couples entering Australia
after 1985, for example, have more �nancial wealth and less real estate equity than
more established immigrant couples. This may be due either to life cycle e¤ects
(aging e¤ects) or to birth cohort e¤ects within the immigrant population. The
wealth module in wave 6 of the HILDA survey will provide a second observation
on household wealth which will prove useful in understanding the extent to which
18

immigrant�wealth position assimilates to that of the native-born population and
whether intermarriage facilitates this process.
Finally, it is striking that immigrants to Australia have the same level of su-
perannuation wealth as equally wealth native-born Australians given the large US
literature documenting the disparity in the earnings pro�les of immigrants and na-
tives (for example Chiswick 1978; Borjas 1985; Schultz 1998). Miller and Neo
(2003), however, conclude that the complex system of award rates of pay provides
immigrants with a degree of earnings protection when they �rst enter the labour
market leading the earnings gap for recent arrivals to be lower in Australia than in
the United States. We can only speculate about the extent to which these institu-
tional di¤erences also account for immigrants�ability to accumulate superannuation
wealth in a way that is consistent with native-born Australians. At the same time,
immigrant-only couples allocate more of their wealth to their homes and less to �-
nancial assets than do equally wealthy native-born couples which may leave them
more vulnerable to movements in the housing market. Given that there appears
to be a di¤erential propensity to consume out of non-�nancial (housing) and �nan-
cial wealth (Tan and Voss 2003; Bostic et al. 2005; Dvornak and Kohler 2007), it
would be useful to explore the consequences of this composition of wealth for the
consumption expenditure of these households.
19

References
Altonji, J. G. and Doraszelski, U. 2005. "The Role of Permanent Income and De-
mographics in Black/White Di¤erences in Wealth."Journal of Human Resources
40(1):1-30.
Amuedo-Dorantes, C. and Pozo, S. 2002. "Precautionary Savings by Young Immi-
grants and Young Natives." Southern Economic Journal 69(1):48-71.
Andersson, P. and Wadensjö, E. (2006. "Employees Who Become Self-Employed:
Do Labour Income and Wages Have an Impact?" IZA Discussion Paper 1971.
Australian Bureau of Statistics (ABS) (2003). Expanded Community Pro�le, 2001
Census Community Pro�le Series, Catalogue No. 2005.0, Commonwealth of Aus-
tralia.
Bauer, T. K., D. A. Cobb-Clark, V. Hildebrand, and M. Sinning 2007. "A Compar-
ative Analysis of the Nativity Wealth Gap. " Ruhr Economic Papers 6.
Bertaut, Carol and Martha Starr-McCluer. 2002. �Household Portfolios in the
United States.� Household Portfolios, edited by L. Guiso, M. Haliassos, and T.
Jappelli. Cambridge and London: MIT Press 181-217.
Blau, F. D. and Graham, J. W. 1990. "Black-White Di¤erences in Wealth and Asset
Composition." Quarterly Journal of Economics 105(2):321-339.
Bonin, H., A. Constant, K, Tatsiramos and K. F. Zimmermann 2007. "Native-
Migrant Di¤erences in Risk Attitudes." Applied Economics Letters forthcoming.
Borjas, George J., �Assimilation, Changes in Cohort Quality, and the Earnings of
Immigrants,�Journal of Labor Economics 3 (1985), 463-489.
20
Bostic, R., S. Gabriel, and G. Painter. 2006. �Housing Wealth, Financial Wealth,
and Consumption: New Evidence from Micro Data.�Lusk Center for Real Estate
Working Paper.
Burbidge, J., L. Magee, and Robb, A. 1988. �Alternative Transformations to Handle
Extreme Values of the Dependent Variable,� Journal of the American Statistical
Association, 83(401):123�7.
Chiswick, B. R. 1978. "The E¤ect of Americanization on the Earnings of Foreign-
Born Men." Journal of Political Economy 85(5):879-921.
Chiswick, B. R. and Miller, P. W. 1985. "Immigration Generation and Income in
Australia." Economic Record 61(73):540-53.
Chiteji, N. S. and Sta¤ord, F. P. 1999. "Portfolio Choices of Parents and their
Children as Young Adults: Asset Accumulation by African-American Families."
American Economic Review 89(2):377-80.
Cobb-Clark, D. A. and Hildebrand, V. A. 2006a. "The Wealth and Asset Holdings
of U.S.-Born and Foreign-Born Households: Evidence from SIPP Data." Review of
Income and Wealth 52(1):17-42.
Cobb-Clark, D. A. and Hildebrand, V. A. 2006b. "The Portfolio Choices of Hispanic
Couples." Social Science Quarterly 87(5): 1344-63.
Cobb-Clark, D. A. and Hildebrand, V. A. 2006c. "The Wealth of Mexican Ameri-
cans." Journal of Human Resources 41(4): 841-68.
Commonwealth of Australia 2002. Intergenerational Report 2002 - 2003. May. Copy-
right Services: Canberra ACT 2601.
Commonwealth of Australia 2007. Intergenerational Report 2007. April. Common-
wealth Copyright Administration: Canberra ACT 2600.
21

Connelly, Rachel. 1992. "Self-employment and Providing Child Care." Demography
29(1):17-29.
Davies, J. and Shorrocks, A. 2000. "The Distribution of Wealth" in Handbooks in
Economics, vol. 16 edited by Atkinson, A. B. and Bourguignon, F. New York and
Oxford: Elsevier Science, North-Holland.
Djajic, S. 1989. "Migrants in a Guest-worker System." Journal of Development Eco-
nomics 31:327-39.
Djajic, S. and Melbourne, R. 1988. "A General Equilibrium Model of Guest-worker
Migration." Journal of International Economics 25:335-51.
Dohmen, T., Falk, A., Hu¤mann, D. and Sunde, U. 2006. "The Intergenerational
Transmission of Risk and Trust Attitudes." IZA Discussion Paper No. 2380.
Dustmann, C. 1997. "Return Migration, Uncertainty and Precautionary Savings."
Journal of Development Economics 52:295-316.
Dvornak, N., and M. Kohler. 2003. "Housing Wealth, Stock Market Wealth and
Consumption: A Panel Analysis for Australia." Reserve Bank of Australia, Research
Discussion Paper 2003-07.
Flavin, M., & Yamashita, T. 2002. "Owner-occupied housing and the composition
of the household portfolio." American Economic Review, 92 (1):345-362.
Galor, O. and Stark, O. 1990. "Migrants�Savings, the Probability of Return Migra-
tion and Migrants�Performance." International Economic Review 31(2):463-67.
Gibson, J., Trinh L., and Stillman, S. 2007. �What Explains the Wealth Gap Be-
tween Immigrants and the New Zealand Born?� New Zealand Economic Papers
41(2):
22

Gittleman, M. and Wol¤, E. N. 2000. "Racial Di¤erences in Patterns of Wealth
Accumulation." Working Paper No. 311.
Greene, W. H., Econometric Analysis, 3rd edition, Prentice-Hall, Upper Saddle
River, NJ, 1997.
Heady, B. 2003. "Income and Wealth - Facilitating Multiple Approaches to Measure-
ment and Permitting Di¤erent Levels of Aggregation." HILDA Project Discussion
Paper Series, 3/03.
Heady, B and Wooden, M. 2004. "The E¤ects of Wealth and Income on Subjective
Well-Being and Ill-Being." Economic Record 80 (Special Issue): S24 - S33.
Heady, B., Marks, G., and Wooden, M. 2005. "The Structure and Distribution of
Household Wealth in Australia" Australian Economic Review 38(2):159-175.
Hildebrand, V. and Williams, D. 2003. "Self-employment and Caring for Children:
Evidence from Europe." IRISS-C/I Working Paper 2003-06, CEPS/INSTEAD, Dif-
ferdange, Luxembourg.
Kantarevic, J. 2004. "Interethnic Marriages and Economic Assimilation of Immi-
grants." IZA Discussion Paper 1142.
Lundberg S. and Ward-Batts J. 2000. "Saving for Retirement: Household Bargain-
ing and Household Net Worth." Department of Economics, University of Washing-
ton, Discussion Paper 0026.
Marks, G. N., Heady, B and Wooden, M. 2005. "Household Wealth in Australia:
Its Components, Distribution, and Correlates" Journal of Sociology 41(1): 47 - 68.
Meng, X. and Gregory R. 2005. "Intermarriage and the Economic Assimilation of
Immigrants." Journal of Labor Economics 23(1):135-176.
23

Meng, X. and Meurs, D. 2006. "Intermarriage, Language, and Economic Assimila-
tion Process: A Case Study of France." IZA Discussion Paper No. 2461.
Miller, P. and Neo, L. 2003. "Labour Market Flexibility and Immigrant Adjust-
ment." Economic Record 79(246):336-56.
Milligan, K. 2005. "Life-cycle asset accumulation and allocation in Canada." Cana-
dian Journal of Economics 38 (3): 1057-1106.
Osili, U. O. and Paulson, A. 2004. "Prospects for Immigrant-Native wealth Assim-
ilation: Evidence from Financial Market Participation." Federal Reserve Bank of
Chicago, Working Paper, 04-18.
Osili, U. O. and Paulson, A. 2005. "Institutional Quality and Financial Market
Development: Evidence from International Migrants in the U.S." Federal Reserve
Bank of Chicago, Working Paper, 04-19.
Poterba, J. and Samwick, A. 2001. �Household Portfolio Allocations Over the Life
Cycle," in Aging Issues in the U.S. and Japan, edited by S. Ogura, T. Tachibanaki,
and D. Wise. Chicago: University of Chicago Press 65-103.
Shamsuddin, A. F. M. and DeVoretz, D. J. 1998. "Wealth Accumulation of Canadian
and Foreign-Born Households in Canada." Review of Income and Wealth 44(4):515-
33.
Shultz, P. 1998. "Immigrant Quality and Assimilation: A Review of the US Litera-
ture." Journal of Population Economics 11(2):239-52.
Sinning, M. 2007 "Wealth and Asset Holdings of Immigrants in Germany. " IZA
Discussion Paper No. 3089.
Tan, A. and Voss, G. 2003. "Consumption and Wealth in Australia." Economic
Record 79(244): 39-56.
24

Williams, R. 2004. "E¤ects of Childcare Activities on the Duration of Self-
Employment in Europe." Entrepreneurship Theory and Practice 28(5):467-485
Wol¤, E. 2006. International Perspectives on Household Wealth. Cheltenham, U.K.
and Northampton, Mass.: Elgar in Association with the Levy Economics Institute.
Wooden, M., Freidin, S. and Watson, N. 2002. "The Household, Income and Labour
Dynamics in Australia (HILDA) Survey: Wave 1." Australian Economic Review
35(3):339-48.
Zhang, X. 2003. "The Wealth Position of Immigrant Families in Canada." Statistics
Canada, Analytical Studies Branch research paper 197.
25
Notes
1Fully 14.6 per cent of the foreign-born population is between the ages of 55-64in comparison to 7.9 per cent of the Australian-born population. In e¤ect, 35.7 percent of Australians aged 55-64 years old are foreign-born in comparison to 21.9 percent of the population overall. (Authors�calculations based on Table X03 (ABS2003)).
2Couple-headed households include both married and cohabiting couples.3We consider the total value of all vehicules, not vehicules equity as the amount
of car loan is lumped together with other debts (such as other loans, hire purchase oroverdraft) in the HILDA survey making it impossible to derive a measure of vehiculeequity.
4The explanatory variables include: a quadratic in age (both head and spouse),education (for both head and spouse), marital history variables, head�s occupation(including a dummy for not employed), states and territories dummies, householdtype dummies (immigrant and mixed), year of landing and origin group (englishspeaking, Europe, others) dummies. Predicted income resulting from this modelis used as our measure of permanent income. Transitory income is the di¤erencebetween permanent and current income so that positive values re�ect a lower thanexpected current income. An inverse hyperbolic sine transformation has been usedfor both permanent and transitory income.
5Following Marks et al. (2005), we designate the highest income earner as thehousehold�s person of reference. For immigrant-only couples we assign the referenceperson�s region of origin and cohort to the household. For mixed couples, the regionof origin and immigration cohort are those of the person of reference.
6This implies that �3 can be interpreted as the wealth gap between native-borncouples and the population of mixed couples irrespective of year of arrival or regionof origin. Similarly, �4 is the wealth gap between native-born couples and thepopulation of immigrant-only mixed couples.
7This function is approximates log(Wit) for positive values and -log(Wi) for neg-ative values of net worth (see Burbidge et al. 1988).
8Estimated coe¢ cients have been converted into marginal e¤ects which give thechange in net worth (measured in dollars) for each one unit change in the underlyingindependent variable. To illustrate, consider the e¤ect of a change in xit on wealthlevels (@Wit
@xit):
=@ sinh�1(Wit)
@xit
=@ sinh�1(Wit)
@Wit
@Wit
@xit@Wit
@xit=
@Wit
@ sinh�1(Wit):
Marginal e¤ects are calculated for each individual and then averaged over the
26

relevant sub-sample using the sample weights (see Greene, 1997, p. 876). Boot-strapped standard errors (with 500 replications) are used to calculate the reportedt-statistics.
9Speci�cally, we require that the estimated marginal e¤ect of an additional dollarof wealth sum to one across asset types, while the marginal e¤ect of a change in anyother independent variable is restricted to sum to zero. Note that while theseconstraints hold on average, they may not hold for any particular couple.10Marginal e¤ects and bootstrapped standard errors are calculated in the same
manner as above.11Recall that the parameterization of equation (equation 2) implies that b6 and b7
measure deviations in portfolio allocations across entry cohorts and regions of originrespectively from the average portfolio of the immigrant population as a whole (i.e.Ii = 1).
27
5 Figures and Tables
F i n a n c i a l W e a l th
B u s i n e s s
R e a l E s ta te
V e h i c l e s
S u p e r a n n u a ti o n
1 5 %
9 . 3 %
4 7 %
5 %
2 4 %
O w n c a l c u la t io n b a s e d o n w a v e 2 o f H I L D A d a t a .
F i g u r e 1 A :N a t i v e - B o r n C o u p le s ' A s s e t S h a r e s
F i n a n c i a l W e a l th
B u s i n e s s
R e a l E s ta te
V e h i c l e s
S u p e r a n n u a ti o n
1 4 %
8 . 6 %
5 6 %
4 . 4 %
1 8 %
O w n c a l c u la t io n b a s e d o n w a v e 2 o f H I L D A d a t a .
F i g u r e 1 B :I m m i g r a n t- O n ly C o u p le s ' A s s e t S h a r e s
28
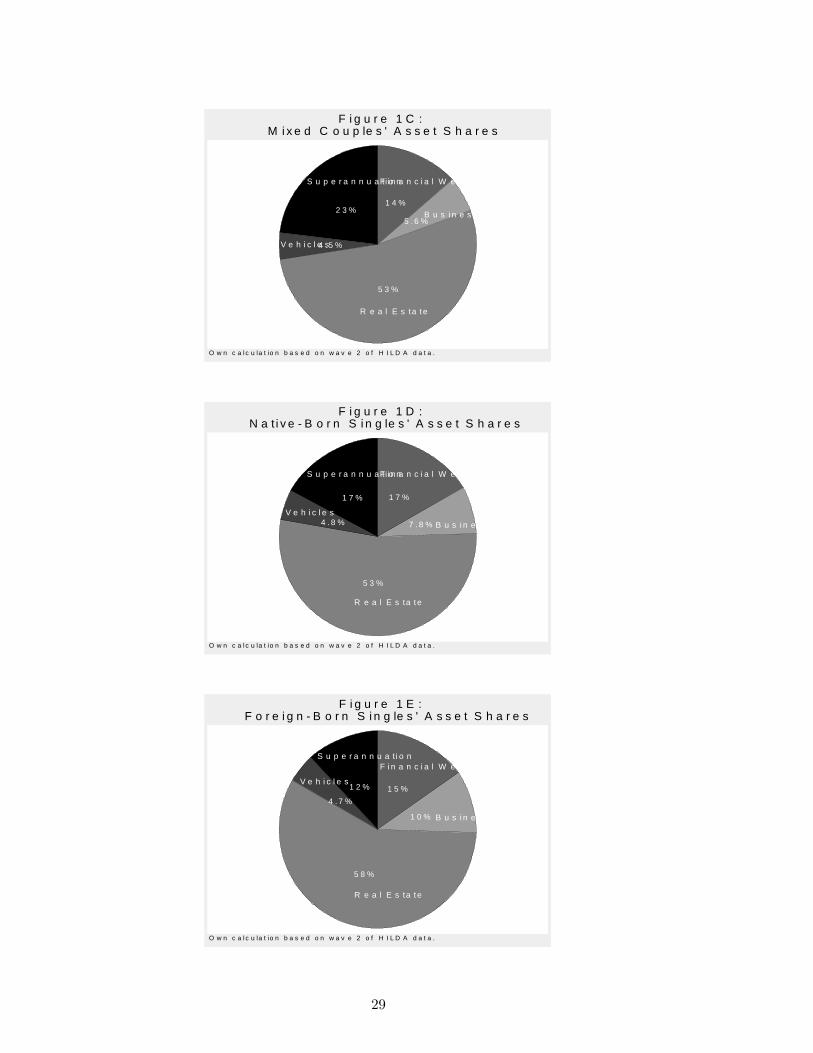
F i n a n c i a l W e a l th
B u s i n e s s
R e a l E s ta te
V e h i c l e s
S u p e r a n n u a ti o n
1 4 %
5 . 6 %
5 3 %
4 . 5 %
2 3 %
O w n c a l c u la t io n b a s e d o n w a v e 2 o f H I L D A d a t a .
F i g u r e 1 C :M i x e d C o u p le s ' A s s e t S h a r e s
F i n a n c i a l W e a l th
B u s i n e s s
R e a l E s ta te
V e h i c l e s
S u p e r a n n u a ti o n
1 7 %
7 . 8 %
5 3 %
4 . 8 %
1 7 %
O w n c a l c u la t io n b a s e d o n w a v e 2 o f H I L D A d a t a .
F i g u r e 1 D :N a t i v e - B o r n S i n g le s ' A s s e t S h a r e s
F i n a n c i a l W e a l th
B u s i n e s s
R e a l E s ta te
V e h i c l e s
S u p e r a n n u a ti o n
1 5 %
1 0 %
5 8 %
4 . 7 %
1 2 %
O w n c a l c u la t io n b a s e d o n w a v e 2 o f H I L D A d a t a .
F i g u r e 1 E :F o r e i g n - B o r n S i n g le s ' A s s e t S h a r e s
29

Table 1: Wealth Holding by Immigrant Status and Household Type
Native-Born Mixed Immigrant-OnlyCouple-Headed Households
Net WealthMean Total Net Wealth 530570 514685 442003�Median Total Net Wealth 354283 356000 268500�%>0 99 99 97
Mean Asset PortfolioAll householdsFinancial Wealth 77948 70727 60007Business 49592 28650� 38072Real Estate 247437 274281 245478Vehicles 26439 22995� 19465�Superannuation 129154 118033 78982�Conditional on owning the assetFinancial Wealth 110739 105226 83099�Business 282136 159235� 299667Real Estate 288165 327180� 319465Vehicles 27082 24147 20566�Superannuation 144213 131318 101818�
Proportion OwningFinancial Wealth 0.998 0.994 0.998Business 0.192 0.201 0.138�Real Estate 0.870 0.855 0.774�Vehicles 0.976 0.952� 0.946�Superannuation 0.896 0.899 0.776�
Current Income 64348 69939� 57173�
N 2125 664 571
Single-Headed Households
Net WealthMean Total Net Wealth 287047 309942Median Total Net Wealth 129000 144300%>0 94 95
Asset PortfolioAll householdsFinancial Wealth 47674 47672Business 22434 31120Real Estate 153309 179257Vehicles 13895 14532Superannuation 49735 37362�Conditional on owning the assetFinancial Wealth 67761 71582Business 277020 309441Real Estate 252319 281636Vehicles 16668 17818Superannuation 68917 54497
Proportion OwningFinancial Wealth 0.983 0.971Business 0.096 0.106Real Estate 0.615 0.641Vehicles 0.834 0.816Superannuation 0.722 0.686
Current Income 30507 29881
N 1851 583Note: Own calculation based on wave 2 of HILDA data.� Indicates a signi�cant di¤erencefrom native-born Australian households (.05 level). All �gures are reported in Australiandollars
30

Table 2: Determinants of Net Worth by Household Type (Marginal E¤ects andt-Statistics)
Couple-Headed Single-HeadedHouseholds Householdsdy/dx t-stat dy/dx t-stat
IncomePermanent Income 57.25 9.29 82.75 10.08Transitory Income -5.62 -3.15 -4.42 -2.86DemographicsAge 20166.22 2.77 33726.56 10.42Age of Spouse 23679.54 2.49 0.00 0.00Kids<18 -68608.97 -2.35 5241.76 0.12Years Married 182.79 0.03 0.00 0.00Head Prev. Married -190859.22 -1.45 -213487.13 -2.25Spouse Prev. Married -28450.85 -0.28ImmigrantsImmigrant Status 184435.66 2.37Immigrant-Only -149286.66 -2.10Mixed -115467.59 -1.46Year of Entry<1965 -20851.22 -0.30 -28026.94 -0.221965-1974 -41625.74 -0.45 57073.53 0.581975-1984 208429.86 2.23 -230525.85 -1.581985+ -145952.90 -1.14 201479.26 1.83Region of OriginEnglish Speaking -10882.33 -0.17 -256433.50 -3.09Non-English Europe 292958.96 2.76 202065.79 1.64Other Non-English -282076.63 -2.10 54367.72 0.50
N 3360 2434R2 0.14 0.14
Note: Married refers to relationships between persons who are eitherlegally married or e¤ectively living together in a de facto relationship.All �gures are reported in Australian dollars.
31

Table3:(Average)DeterminantsofAssetPortfolios:Couple-HeadedHouseholds(MarginalE¤ectsandt-Statistics)
FinancialWealth
BusinessAssets
RealEstate
Vehicles
Superannuation
dy/dx
t-stat
dy/dx
t-stat
dy/dx
t-stat
dy/dx
t-stat
dy/dx
t-stat
Income
PermanentIncome
0.74
0.36
1.97
3.88
-19.09
-9.18
0.08
0.49
16.31
12.94
TransitoryIncome
-1.50
-2.73
6.41
3.78
-2.38
-1.52
-0.62
-3.10
-1.91
-6.47
Dem
ographics
AgeofHead
13262.77
4.77
-1589.17
-1.84
-6785.28
-2.07
-237.95
-0.82
-4650.38
-3.10
AgeofSpouse
4531.32
1.68
882.53
1.09
-893.30
-0.87
-251.84
-0.23
-1937.82
-1.79
Kids<18
3361.54
0.28
830.02
0.22
38626.05
3.15
732.23
0.80
-43549.84
-8.03
YrsMarried
-4750.25
-2.27
148.60
0.21
3665.63
1.61
209.25
0.98
726.77
0.58
PreviouslyMarried
Head
53304.19
1.27
11401.17
0.81
-68494.20
-1.44
-1785.18
-0.36
5574.01
0.23
Spouse
-120834.32
-3.11
2177.00
0.17
131160.89
3.07
-2011.41
-0.40
-10492.16
-0.44
Immigrants
Immigrant-Only
-421555.41
-3.39
-17707.42
-0.77
503714.09
5.24
-31587.30
-2.11
-32863.97
-0.81
Mixed
-70373.77
-1.27
-19695.32
-0.80
43147.34
0.68
4616.74
0.48
42305.02
0.59
NetWorth
NetWorth
0.20
3.83
0.01
7.76
0.54
48.95
0.05
2.14
0.20
5.92
NetWorth�
Immigrant-Only
0.12
3.32
0.00
0.06
-0.12
-5.14
0.02
1.56
-0.01
-1.37
Mixed
0.53
1.94
0.00
0.64
0.00
-0.10
-0.21
-1.36
-0.32
-1.45
YearofEntry
<1965
-6141.91
-0.18
76.66
0.01
33822.88
0.91
4345.38
1.37
-32103.01
-1.30
1965-1974
-43486.40
-1.32
-7919.01
-0.95
54798.65
1.46
1824.37
0.59
-5217.62
-0.26
1975-1985
-30972.08
-0.75
-16029.18
-1.52
19942.85
0.45
5205.01
1.72
21853.40
1.23
>=1985
80600.38
2.12
23871.53
2.19
-108564.38
-2.80
-11374.76
-2.96
15467.23
0.82
RegionofOrigin
EnglishSpeaking
9643.91
0.35
-8066.14
-1.12
-31096.63
-1.04
4241.96
1.50
25276.90
1.65
Non-EnglishEurope
-29883.12
-0.89
6739.13
0.73
25124.24
0.67
-3253.93
-0.87
1273.68
0.07
OtherNon-English
20239.21
0.60
1327.01
0.14
5972.39
0.16
-988.04
-0.29
-26550.57
-1.40
N3360
3360
3360
3360
3360
R2
0.13
0.05
0.29
0.09
0.40
Note:
Married
referstorelationshipsbetweenpersonswhoareeitherlegallymarried
ore¤ectivelylivingtogetherinadefactorelationship.All�guresarereportedinAustralian
dollars
32

Table4:(Average)DeterminantsofAssetPortfolios:Single-HeadedHouseholds(MarginalE¤ectsandt-Statistics)
FinancialWealth
BusinessAssets
RealEstate
Vehicles
Superannuation
dy/dx
t-stat
dy/dx
t-stat
dy/dx
t-stat
dy/dx
t-stat
dy/dx
t-stat
Income
PermanentIncome
2.25
0.96
2.15
5.27
-24.94
-10.27
2.14
6.59
18.40
21.59
TransitoryIncome
-0.75
-1.41
0.34
3.15
0.90
1.63
-0.03
-0.61
-0.46
-5.14
Dem
ographics
AgeofHead
7525.93
8.87
192.50
1.01
-4673.90
-5.07
133.47
1.05
-3177.99
-8.66
Kids<18
-12723.03
-1.29
8696.50
3.16
38245.32
3.66
1384.92
1.04
-35603.71
-9.05
Prev.Married
-31363.46
-1.29
1743.46
0.25
54888.25
1.95
3041.74
0.87
-28309.98
-2.45
Immigrants
Immigrant
-40591.21
-1.15
4216.05
0.58
30976.56
1.02
-3787.22
-0.51
9185.82
0.50
NetWorth
NetWorth
-0.22
-0.98
0.05
5.16
0.36
35.93
0.38
1.93
0.43
8.42
NetWorth�Imm.
-0.22
-0.16
0.00
0.74
0.01
0.54
0.48
0.39
-0.27
-0.73
YearofEntry
<1965
613.30
0.02
-11737.06
-1.10
30759.04
0.86
1513.15
0.34
-21148.42
-1.61
1965-1974
-11992.03
-0.33
1961.65
0.18
2407.52
0.07
-459.26
-0.11
8082.13
0.72
1975-1985
-56263.83
-1.52
6489.20
0.55
53134.72
1.31
-4056.28
-0.71
696.19
0.05
>=1985
67642.56
1.93
3286.22
0.32
-86301.28
-2.34
3002.39
0.67
12370.11
1.32
RegionofOrigin
EnglishSpeaking
13346.92
0.49
-11117.21
-1.43
-5471.34
-0.20
4367.36
1.35
-1125.74
-0.14
Non-EnglishEurope
-30960.84
-0.89
-1507.08
-0.15
-8219.44
-0.23
5541.69
1.30
35145.68
3.27
OtherNon-English
17613.92
0.48
12624.30
1.13
13690.77
0.36
-9909.05
-2.16
-34019.94
-3.51
N2434
2434
2434
2434
2434
R2
0.09
0.07
0.28
0.10
0.43
Note:All�guresarereportedinAustraliandollars
33

5.1 Appendix
Table A1: Descriptive Statisitcs by Immigrant Status and Household Type
Couple-Headed Single-Headed
Native- Mixed Immigrant- Native- ImmigrantsBorn Only Born
DemographicsAge 47.1 46.9 50.8 46.6 47.8Age of Spouse 46.3 45.8 49.4Kids<18 1.0 0.8 0.8 0.5 0.5Education 11.9 12.2 12.2 11.6 11.9Education of Spouse 11.4 11.9 11.7Years of Marriage 22.6 19.7 25.4 21.3 19.2Previously MarriedHead 0.109 0.161 0.121 0.118 0.140Spouse 0.115 0.192 0.118OccupationManag-Admin 0.212 0.201 0.371 0.397 0.415Professional 0.115 0.107 0.064 0.051 0.047Assoc-Profess 0.185 0.225 0.162 0.146 0.157Tradesperson 0.117 0.126 0.078 0.087 0.062Advanced Service 0.122 0.093 0.106 0.056 0.061Intermediate Service 0.017 0.026 0.011 0.031 0.013Intermediate Production 0.080 0.072 0.077 0.103 0.120Elementary Service 0.083 0.065 0.074 0.043 0.033Labourers 0.023 0.022 0.023 0.048 0.044RegionNew South Wales 0.304 0.296 0.365 0.325 0.391Victoria 0.247 0.240 0.284 0.224 0.229Queensland 0.231 0.191 0.113 0.214 0.136South Australia 0.081 0.087 0.076 0.088 0.073West Australia 0.087 0.121 0.131 0.098 0.134Tasmania 0.033 0.022 0.005 0.028 0.008Northern Territory 0.004 0.013 0.007 0.008 0.006ACT 0.014 0.031 0.019 0.016 0.023Year of Entry<1965 0.212 0.160 0.000 0.2351965-1974 0.135 0.242 0.000 0.2441975-1984 0.065 0.148 0.000 0.1861985+ 0.122 0.450 0.000 0.335N 2125 664 571 1851 583
Note: Calculations are based on the second wave of the HILDA survey. Married refers torelationships between persons who are either legally married or e¤ectively living together ina de facto relationship. All �gures are reported in Australian dollars
34