
Born Entrepreneurs? - OAPEN
180
Born Entrepreneurs? Immigrant Self-Employment in Spain Amsterdam University Press DISSERTATIONS IMISCOE Nahikari Irastorza
-
Upload
khangminh22 -
Category
Documents
-
view
1 -
download
0
Transcript of Born Entrepreneurs? - OAPEN

Born Entrepreneurs?
Immigrant Self-Employment in Spain
A m s t e r d a m U n i v e r s i t y P r e s s
dissErtationsimiscoe
Are immigrants more enterprising than natives in Spain? How successful are migrant entrepreneurs compared to those who start businesses in their country of birth? With the growth of migration worldwide, questions such as these are garnering the attention of economists, policymakers and scholars. Born Entrepreneurs? asks how foreignness affects an immigrant’s ability to launch and to grow a successful business. It also explores the economic and social benefits that immigrants might derive from self-employment and the unique factors at play in so-called ethnic and immigrant entrepreneurship.
Nahikari Irastorza is a postdoctoral researcher funded by the Basque regional government at Metropolis British Columbia, Simon Fraser University. She has con-ducted research in Spain, Sweden, Colombia and Canada. She has published several book chapters and presented her work at various international conferences in Europe and North America. She has been awarded the Marie Curie International Outgoing Fellowship for the period 2011-2014.
“Most of Europe’s population growth comes from immigrants. Immigrant entrepreneurship is poorly understood, and Nahikari Irastorza has blazed a trail for Spain and the Basque Country with this fascinating study.”
Jonathan Levie, Reader, Hunter Centre for Entrepreneurship, University of Strathclyde, Glasgow
“This work presents a unique analysis to explain the differential success of Spanish immigrant entrepreneurs by employing the intriguing concept of the liability of foreignness, which alone warrants a careful reading of this book.”
Don DeVoretz, Professor of Economics, Simon Fraser University, Burnaby, British Columbia
“A comprehensive look at contemporary Spanish migration, a critical appraisal of policy shortcomings and a diagnosis for challenging some of migration studies’ previous analyses. In short, a much-welcomed book for anyone interested in understanding immigration to Spain.”
Margarida Marques, New University of Lisbon
IrastorzaBorn Entrepreneurs?
· ..
978 90 8964 211 0
Nahikari Irastorza

Born Entrepreneurs?

IMISCOEInternational Migration, Integration and Social Cohesion in Europe
The IMISCOE Research Network unites researchers from, at present, 25 institutesspecialising in studies of international migration, integration and social cohesion inEurope. What began in 2004 as a Network of Excellence sponsored by the SixthFramework Programme of the European Commission has become, as of April2009, an independent self-funding endeavour. From the start, IMISCOE haspromoted integrated, multidisciplinary and globally comparative research led byscholars from various branches of the economic and social sciences, the humanitiesand law. The Network furthers existing studies and pioneers new scholarship onmigration and migrant integration. Encouraging innovative lines of inquiry key toEuropean policymaking and governance is also a priority.
The IMISCOE-Amsterdam University Press Series makes the Network’s findingsand results available to researchers, policymakers and practitioners, the media andother interested stakeholders. High-quality manuscripts authored by Networkmembers and cooperating partners are evaluated by external peer reviews and theIMISCOE Editorial Committee. The Committee comprises the following members:
Christina Boswell, School of Social and Political Science, University of Edinburgh,United Kingdom
Tiziana Caponio, Department of Political Studies, University of Turin / Forum forInternational and European Research on Immigration (FIERI), Turin, Italy
Michael Collyer, Sussex Centre for Migration Research (SCMR), University ofSussex, United Kingdom
Rosita Fibbi, Swiss Forum for Migration and Population Studies (SFM), Universityof Neuchâtel, Switzerland / Institute of Social Sciences, University of Lausanne
Albert Kraler, International Centre for Migration Policy Development (ICMPD),Vienna, Austria
Leo Lucassen, Institute of History, Leiden University, The Netherlands
Jorge Malheiros, Centre of Geographical Studies (CEG), University of Lisbon, Portugal
Marco Martiniello, National Fund for Scientific Research (FNRS), Brussels / Centerfor Ethnic and Migration Studies (CEDEM), University of Liège, Belgium
Patrick Simon, National Demographic Institute (INED), Paris, France
Miri Song, School of Social Policy and Sociology, University of Kent, United Kingdom
IMISCOE Policy Briefs and more information can be found at www.imiscoe.org.

Born Entrepreneurs?
Immigrant Self-Employment in Spain
Nahikari Irastorza
IMISCOE Dissertations

Cover design: Studio Jan de Boer BNO, AmsterdamLayout: The DocWorkers, Almere
ISBN 978 90 8964 243 1e-ISBN 978 90 4851 2812NUR 741 / 763
© Nahikari Irastorza / Amsterdam University Press, Amsterdam 2010
All rights reserved. Without limiting the rights under copyrightreserved above, no part of this book may be reproduced, stored in orintroduced into a retrieval system, or transmitted, in any form or by anymeans (electronic, mechanical, photocopying, recording or otherwise)without the written permission of both the copyright owner and theauthor of the book.

Lehenengo aitari, gero amarigero anai-arrebarit’azken orduan, ixil-ixiliknere maite politari.
To my family, near and far


Table of contents
List of tables 9List of graphs 11
PART I: INTRODUCTION AND CONTEXT
1 Introduction 151.1 Justification of the study 151.2 Objectives of the study 171.3 Definition of concepts 18
1.3.1 Immigrants and foreigners 181.3.2 Entrepreneurs and the self-employed 19
1.4 Structure of the study 20
2 Immigration to Spain: policies and facts 232.1 Immigration, labour market and
entrepreneurship in Spain 232.1.1 International migration to Spain 232.1.2 Immigration and labour market trends in Spain 282.1.2.1 Social Security registrations 282.1.2.2Work permits 39
2.2 Immigration policies in Spain 482.2.1 Residence permits 482.2.2 Work permits 49
PART II: THEORETICAL DISCUSSION
3 Literature review 533.1 Determinants of immigrants’ self-employment 54
3.1.1 Individual-related factors 553.1.2 Context-related factors 57
3.2 Determinants of immigrants’ firm survival 593.2.1 The liability of foreignness on venture survival 613.2.2 Determinants of venture survival 62
3.3 Determinants of immigrants’ earnings 673.3.1 Individual-related factors 693.3.2 Context-related factors 70
3.4 Ex-ante discussion of ethnic/immigrant entrepreneurship 72

4 Conceptual framework 754.1 General conceptual framework: stages of immigrants’
entrepreneurial process 754.2 Pre-start-up stage: likelihood of self-employment 774.3 Post-start-up stage: Business survival 784.4 Post-start-up stage: Economic benefits 78
PART III: EMPIRICAL STUDY
5 Data and methodology 835.1 Description of the databases 835.2 Description of the samples 865.3 Description of the variables 92
5.3.1 Dependent variables 925.3.2 Independent variables 93
5.4 Formulation of hypotheses 975.5 Description of the methodology 995.6 Correlation analyses 105
6 Results of the empirical analysis 1176.1 Immigrants’ likelihood of self-employment 1176.2 Foreign-owned business survival 1246.3 Economic benefits of immigrants’ self-employment 1336.4 Summary of findings 137
PART IV: CONCLUSIONS AND IMPLICATIONS
7 Final conclusions 1437.1 Discussion of the main findings 1437.2 Ex-post discussion of ethnic/immigrant entrepreneurship1467.3 Limitations of the study 147
8 Academic and policy implications 1498.1 Policy implications 1498.2 Future research suggestions 150
References 153
APPENDICES
Appendix 1 Description of variables 161Appendix 2 Market entry, exit and turbulence rates in
the Basque Country 169Appendix 3 Cox regression analyses for simulations 172
8 BORN ENTREPRENEURS?
Tables
Table 1 Foreign population in Spain (1998-2007) 24Table 2 Foreign population in Spain by region of origin
(1998-2006) 27Table 3 Foreign population in Spain by country of origin and
gender (1998-2006) 29Table 4 Foreign population registered with the Social Security
department (1999-2005) 31Table 5 Foreign population registered with the Social Security
department by Spanish regions (1999-2005) 33-34Table 6 Foreign population registered with the Social Security
department by origin (1999-2005) 37Table 7 Foreign population registered with the Social Security
department by type of work and origin (January 2007) 38Table 8 Foreign population registered with the Social Security
department by age and gender (1999-2006) 40Table 9 Work permits issued to foreigners by the Spanish
authorities by type of work (1998-2005) 41Table 10 Work permits issued to foreigners by the Spanish
authorities by Spanish region (1998-2005) 42Table 11 Wage-employment permits issued to foreigners by the
Spanish authorities by Spanish region (1998-2005) 44Table 12 Self-employment work permits issued to foreigners by
the Spanish authorities by Spanish region (1998-2005) 46Table 13 Characteristics of the sample: Determinants of self-
employment 88-89Table 14 Characteristics of the sample: Determinants of firm
survival 89-90Table 15 Characteristics of the sample: Determinants of
earnings 91Table 16 Correlation matrix for potential entrepreneurs: Total
sample 104-105Table 17 Correlation matrix for potential entrepreneurs:
Immigrants 107Table 18 Correlation matrix for potential entrepreneurs:
Natives 108
Table 19 Correlation matrix for actual entrepreneurs: Totalsample 109
Table 20 Correlation matrix for actual entrepreneurs:Immigrants 110
Table 21 Correlation matrix for actual entrepreneurs: Natives 111Table 22 Correlation matrix: Total sample 112Table 23 Correlation matrix: Foreign-owned firms 112Table 24 Correlation matrix: Native-owned firms 112Table 25 Correlation matrix: Total sample with industry
specification 113Table 26 Correlation matrix for simulations: Native-owned
firms 114Table 27 Correlation matrix for simulations: Foreign-owned
firms 114Table 28 Correlation matrix: Self-employed immigrants 115Table 29 Correlation matrix: Salaried immigrants 116Table 30 Binomial regression analysis: Total sample 118-119Table 31 Binomial regression analysis: Immigrants and
natives 121Table 32 Effect of origin of entrepreneurs on venture survival 125Table 33 Foreign-owned venture survival 127Table 34 Native-owned venture survival 128Table 35 All firms’ survival with industry specification 129Table 36 Chi-square test for self-employment by income, all
immigrants 134Table 37 Binomial logistic regression analysis 135Table 38 Summary of findings 138-139
10 BORN ENTREPRENEURS?
Graphs
Graph 1 Foreign population in Spain (1998-2007) 26Graph 2 Foreign population in Spain by region of origin
(1998-2006) 26Graph 3 Foreign population in Spain by country of origin
(1998) 30Graph 4 Foreign population in Spain by country of origin
(2006) 30Graph 5 Foreign population registered with the Social Security
department (1999-2005) 32Graph 6 Foreign population registered with the Social Security
department by Spanish regions (1999-2005) 35Graph 7 Foreign population registered with the Social Security
department out of the total population registered (%) 36Graph 8 Foreign population registered with the Social Security
department by origin (1999-2005) 37Graph 9 Self-employment rates of the ten largest foreign groups
registered with the Social Security department(January 2007) 38
Graph 10 Work permits issued to foreigners by region out of thetotal work permits issued to foreigners in Spain (%) 43
Graph 11 Wage-employment permits issued to foreigners byregions out of the total wage-employment permitsissued to foreigners in Spain (%) 45
Graph 12 Self-employment permits issued to foreigners byregions out of the total self-employment permitsissued to foreigners in Spain (%) 47
Graph 13 Conceptual framework: Stages of immigrants’entrepreneurial process 76
Graph 14 Conceptual framework: Immigrants’ entrepreneurialprocess, pre-start-up stage 77
Graph 15 Conceptual framework: Immigrants’ entrepreneurialprocess, post-start-up stage. Business survival 78
Graph 16 Conceptual framework: Immigrants’ entrepreneurialprocess, post-start-up stage. Economic benefits 79

Graph 17 Cumulative percentage of mortality of sole proprietorsfirms created in the Basque Country by origin(1994 and 1998) 86
Graph 18 Native-owned firms simulating foreign-owned:Significant variables 131
Graph 19 Foreign-owned firms simulating native-owned:Significant variables 132
12 BORN ENTREPRENEURS?

Part I: Introduction and context

1 Introduction
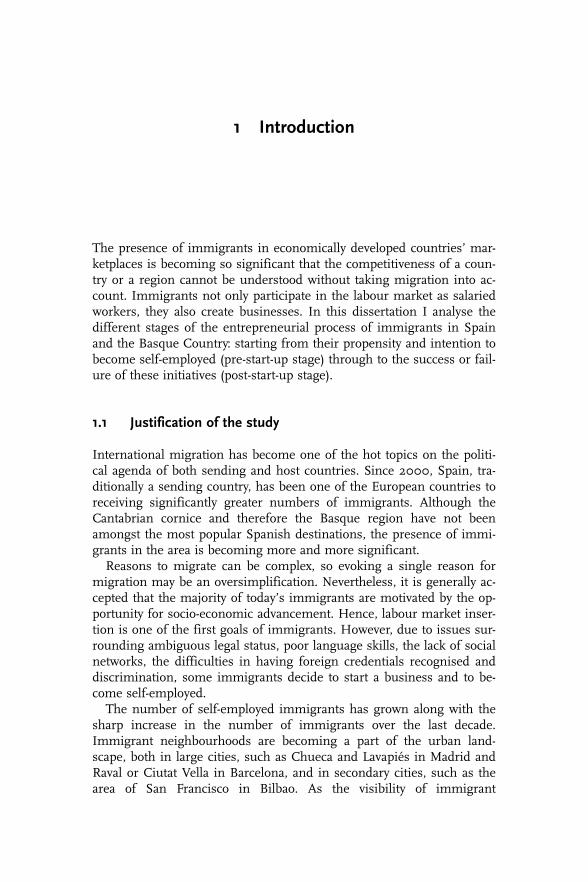
The presence of immigrants in economically developed countries’ mar-ketplaces is becoming so significant that the competitiveness of a coun-try or a region cannot be understood without taking migration into ac-count. Immigrants not only participate in the labour market as salariedworkers, they also create businesses. In this dissertation I analyse thedifferent stages of the entrepreneurial process of immigrants in Spainand the Basque Country: starting from their propensity and intention tobecome self-employed (pre-start-up stage) through to the success or fail-ure of these initiatives (post-start-up stage).
1.1 Justification of the study
International migration has become one of the hot topics on the politi-cal agenda of both sending and host countries. Since 2000, Spain, tra-ditionally a sending country, has been one of the European countries toreceiving significantly greater numbers of immigrants. Although theCantabrian cornice and therefore the Basque region have not beenamongst the most popular Spanish destinations, the presence of immi-grants in the area is becoming more and more significant.
Reasons to migrate can be complex, so evoking a single reason formigration may be an oversimplification. Nevertheless, it is generally ac-cepted that the majority of today’s immigrants are motivated by the op-portunity for socio-economic advancement. Hence, labour market inser-tion is one of the first goals of immigrants. However, due to issues sur-rounding ambiguous legal status, poor language skills, the lack of socialnetworks, the difficulties in having foreign credentials recognised anddiscrimination, some immigrants decide to start a business and to be-come self-employed.
The number of self-employed immigrants has grown along with thesharp increase in the number of immigrants over the last decade.Immigrant neighbourhoods are becoming a part of the urban land-scape, both in large cities, such as Chueca and Lavapiés in Madrid andRaval or Ciutat Vella in Barcelona, and in secondary cities, such as thearea of San Francisco in Bilbao. As the visibility of immigrant
entrepreneurs increases, so does the volume of the literature on immi-grant entrepreneurship.
In traditionally immigrant-receiving countries such as the UnitedStates, Canada, Australia and the United Kingdom, an extensive litera-ture is devoted to the entrepreneurial activity of immigrants and ethnicminorities (Light 1972, 1979; Portes 1986, 1989; Aldrich andWaldinger 1990; Bates 1997; Rath 2000, 2002; Rath and Kloosterman2000; Constant and Zimmermann 2004). In Spain, however, whereimmigration is a relatively recent phenomenon, the literature in thefield is rather scarce. Solé, Parella and Cavalcanti (2007) published a re-pertoire of the literature on ethnic entrepreneurship in Spain from theperspective of various disciplines, ranging from pioneer studies byBuckley (1998) and Beltrán (2000) to most recent publications by Soléand Parella (2005), Oso, Villares and Golías (2005) and GarcíaBallesteros et al. (2006).
Sociologists and anthropologists in Spain and also in the above-men-tioned countries have focused on the motivations and business strate-gies of the so-called ethnic and immigrant entrepreneurs, perhaps over-highlighting the ‘cultural’ aspect of these people and their businesses.On the other hand, only a few economists (Borjas 1986; Butler andHerring 1991; Bates 1997; Constant et al. 2003; Constant andZimmermann 2004; Levie 2007) have compared the entrepreneurialactivity of immigrants and natives without focusing on the ethno-cultur-al characteristics of entrepreneurs.
This dissertation aims to fill this gap in the economics literature bycomparing the entrepreneurial activity (during both the pre-start-up andpost-start-up stages) of immigrants and natives in Spain and the BasqueCountry.1 This will provide a better understanding of the behaviour ofentrepreneurs based on their individual characteristics and possible re-gional differences in the economy (immigration rates, unemploymentrates and immigration policies).
In sum, this dissertation is motivated by the following factors: (i) theincreasing number of firms created and operated by immigrants inSpain and the ensuing social implications of such a change; (ii) thescarcity of studies which have addressed the entrepreneurial activity ofimmigrants from an economic perspective; and (iii) a desire to shedsome light on the controversy surrounding the entrepreneurial activityof immigrants as a distinct form of entrepreneurship – the so-called im-migrant or ethnic entrepreneurship – and the benefits of self-employmentto entrepreneurs.
In order to analyse immigrants’ entrepreneurial process during boththe pre-start-up and post-start-up stages (i.e. their likelihood to seekself-employment and the probability of success of the businesses cre-ated by them), three sets of empirical tests have been conducted. First
16 BORN ENTREPRENEURS?
of all, I analyse and compare the desire and propensity of immigrantsfor entrepreneurship in Spain. I do this in order to build on previousstudies which report that immigrants are more enterprising because (i)they self-select and, thus, are usually enterprising (Constant andZimmermann 2004), and (ii) they are at a disadvantage in the host la-bour market and, thus, look to self-employment as a coping strategy(Light 1972).
Whereas the likelihood of immigrants becoming self-employed hasbeen examined (Constant and Zimmermann 2004; Levie 2007), little isknown about what happens once their ventures are created. How longdo firms survive? Are they as successful as native-owned firms? In thesecond and third sets of empirical tests I analyse the performance ofimmigrant and native businesses. Specifically, in my second empiricalstudy, I look at the survival rates of businesses as well as at some char-acteristics of foreign- and native-owned firms in the Basque Country.
The success of self-employment initiatives can also be measured bycomparing the income of entrepreneurs to the salaries of workers.Hence, my third set of analyses focuses on income differences betweenimmigrant entrepreneurs and non-entrepreneurs in Spain, in order toshed some light on the debate surrounding the socio-economic benefitsimmigrants derive from self-employment. These three topics provide ageneral overview of the entrepreneurial ability of immigrants and testthe appropriateness of entrepreneurship as a means to successful la-bour insertion.
1.2 Objectives of the study
The theoretical discussions of concepts related to the entrepreneurialactivity of immigrants and ethnic minorities, and the gaps found in em-pirical studies lead me to pose the following general and specific re-search objectives:
(1) To perform an empirical analysis of immigrant versus native entre-preneurship activity in Spain and the Basque Country, in order togain a better understanding of potential differences in terms of hu-man capital attributes, country of origin, and regional economies(immigration and unemployment rates and immigration policy).Two specific objectives arise from the first general objective:
(1.1) To establish whether there are differences in (i) the likelihoodof immigrants and natives starting a firm and (ii) the likelihoodof immigrants of various origins to starting a business.
INTRODUCTION 17

(1.2) To measure the success of entrepreneurship by analysing thesurvival rates of foreign versus native ventures, and by compar-ing the income immigrants’ obtain from self-employment tothat of salaried immigrants.
(2) To perform an empirical analysis of the benefits of self-employmentas a means of economic integration of immigrants. More specifi-cally, I aim to:
(2.1) Analyse the economic benefits immigrants may derive fromself-employment by comparing the earnings of salaried andself-employed immigrants and possible underlying factors toexplain potential gaps.
These objectives will be reached via the results obtained in each of thethree sets of empirical analyses comprised in this dissertation.
1.3 Definition of concepts
In order to avoid misunderstandings on the use of key concepts such asimmigrant versus foreigner and self-employed versus entrepreneur, in thissection I will define each of the terms used in this dissertation.
1.3.1 Immigrants and foreigners
In sociology, an immigrant is defined as an individual who changes hisor her place of residence from one geographically delimited area to an-other; in circumstances that generate a social, political or administrativereorganisation shift for the immigrant. People moving from oneSpanish town, province or region to another are internal immigrantswhile people moving from one country to another are international im-migrants. Some studies have focused on internal migration in Spainfrom the 1950s to the 1970s. Since the 1990s, however, internationalmigration has been what really matters in Spain. Given that this disser-tation analyses the entrepreneurial activity of international immigrants,I will hereon use the term ‘immigrant’ to refer only to internationalimmigrants.
On the other hand, the legal term ‘foreigner’ allows us to distinguishbetween individuals who have the Spanish citizenship from those whodo not. In Spain, the term ‘resident foreigners’ refers to the foreign-born who have lived in the country legally for more than three months,excluding those who have acquired citizenship and thus becameSpaniards.
18 BORN ENTREPRENEURS?
In sum, the concept of immigrant includes the whole population ofthe foreign-born who live in Spain, regardless of their citizenship,whereas foreigners are international migrants who live in Spain and donot have Spanish citizenship.
Two databases were used to conduct the empirical tests of this disser-tation. The first and the third sets of analyses are based on an annualsurvey conducted under the Global Entrepreneurship Monitor (GEM)project. Since the variable which distinguishes people according to theirorigin is based upon the question ‘In which country were you born?’, inthese tests I will use the sociological concept immigrant (versus native),regardless of citizenship. On the other hand, the second set of empiri-cal tests is based on the Basque firms’ census. Specifically, my sampleonly includes firms with one owner. These firms are classified by thepersonal ID of the entrepreneur, with those owned by non-Spaniardsstarting with an X. Thus, in these analyses I will use the term foreigner(and foreign-owned firms) to refer to immigrants who live in Spain buthave not acquired Spanish citizenship, and natives (and native-ownedfirms) to include natives and immigrants who became Spanish citizens.
1.3.2 Entrepreneurs and the self-employed
From Cantillon (circa 1730) to Gartner (1988) the concept of entrepre-neurship has been widely discussed in the literature. Due to the prolif-eration of theories and taxonomies which often conflict and overlap, ithas been claimed that defining the concepts of entrepreneur and entre-preneurship is one of the most difficult tasks faced by researchers work-ing in the field (Parker 2004). Parker (2004) illustrates this statementby showing the following viewpoints: labour economists equate entre-preneurs with the self-employed since they are risk-takers. Whereassome authors think this definition is too broad and argue that onlythose business owners who employ workers should be considered asentrepreneurs, others find the definition too narrow because it excludesentrepreneurship in the corporate and social spheres. In addition, manyother researchers, following the Schumpeterian tradition, identify entre-preneurship and the entrepreneurs with the innovation of products,production processes, markets or forms of organisation. Finally, somescholars focus on psychological traits and attitudes considered as parti-cular to entrepreneurs.
The concept of self-employment can also be controversial. The self-employed are often described as individuals who do not earn a salary byworking for others, but who earn an income by running a business attheir own risk. Parker (2004) summarises some of the conceptual pro-blems and grey areas of this definition as follows: in many governmentsurveys used in empirical research, the self-employment status is
INTRODUCTION 19
assessed by respondents and thus, is based on each individual’s under-standing of self-employment rather than on more objective legal or fis-cal definitions. In addition, there are some grey areas between paid em-ployment and self-employment. For instance, some workers classifiedas self-employed are in fact employees who work for one client firm.This is typical of the construction industry where workers are alsoknown as ‘falsely self-employed’. Finally, some other of the grey areasbetween employment and self-employment include freelancers, home-makers, franchise holders and members of worker cooperatives.
In this dissertation all these concepts will be defined according to thedescription of the explanatory variables in the two databases. Based onGEM data, in the first and third set of empirical tests the explanatoryvariable self-employed is built upon the f question ‘Are you, alone or withothers, currently the owner of a company you help manage, self-em-ployed, or selling any goods or services to others?’ Thus, a subjectiveanswer is elicited, according to which both self-employed and entrepreneurcould apply to people who answer in the affirmative. The second set ofanalyses is conducted by using firm census data provided by theBasque Statistical Institute that includes all firms created under variouslegal structures (sole proprietorship firms, worker cooperatives, limited-liability companies, publicly traded companies). Hence, since the unitof observation of this database is the firm, not all the people registeredas self-employed with the social security department are included in thedatabase, but only those who own a business. It also involves businessowners who are not necessarily self-employed.
For these and other reasons, both in the empirical tests and at theconceptual level, I will use both ‘entrepreneur’ and ‘self-employed’ as syno-nyms to refer to people who earn a living by working on their own.
1.4 Structure of the study
The dissertation is comprises of eight chapters organised in four parts:an introduction and justification of the object of study, a theoretical dis-cussion, the empirical study and the final conclusions.
In the two chapters of part one, I introduced and contextualised theobject of study. I state the aims and the rationale for the study, presentthe latest facts and figures on immigration, labour market and entrepre-neurship in Spain and review the Spanish immigration law.
A literature review analysing the determinants of self-employment,firm survival and earnings, as well as on appropriateness of the con-cepts of ethnic and immigrant entrepreneurship follows in the secondpart. I present the conceptual framework of my analyses in chapterfour.
20 BORN ENTREPRENEURS?

Chapter five, in part three, provides a description of the databases,samples, variables and methods. My empirical research work, aimed toanalyse the entrepreneurial ability of foreign immigrants (both at thepre-start-up and post-start-up stages), comprises chapter six. More speci-fically, in this chapter I compare the likelihood of immigrants startingan entrepreneurial activity to that of natives in Spain, the survival ratesof what will be defined as foreign-owned and native-owned firms in theBasque Country, and the earnings of immigrant entrepreneurs to thoseof salaried immigrants in Spain.
The final conclusions and the limitations of the study (chapter seven)as well as some policy implications and suggestions for future research(chapter eight) are presented in the last part of the dissertation.
INTRODUCTION 21

2 Immigration to Spain: Policies and facts
2.1 Immigration, labour market and entrepreneurship in Spain
This section provides an overview of the immigration, labour marketand self-employment numbers in Spain and the Basque Country in or-der to facilitate the understanding of both the theoretical and empiricalanalyses of my dissertation. The first part of this section focuses ongeneral facts about immigration, and the second one on salaried andself-employed foreigners in the Spanish labour market.
2.1.1 International migration to Spain
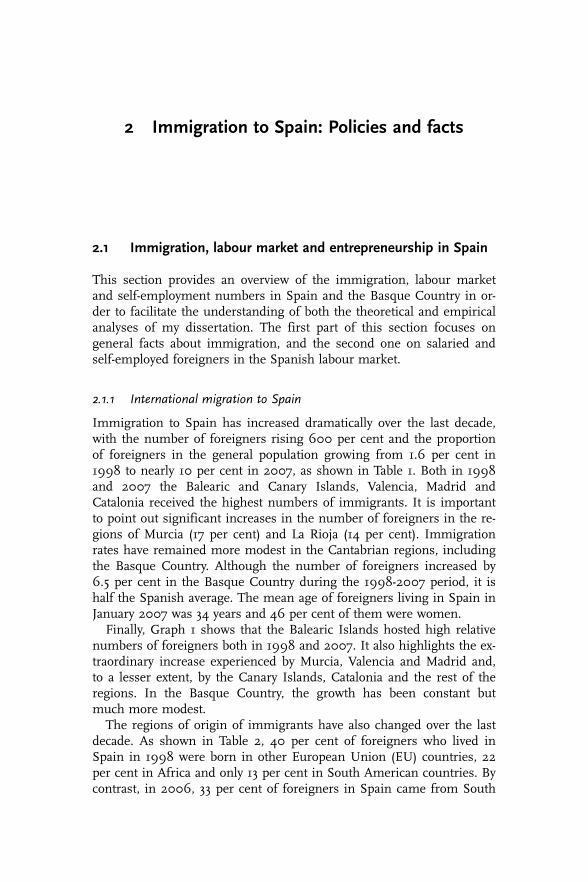
Immigration to Spain has increased dramatically over the last decade,with the number of foreigners rising 600 per cent and the proportionof foreigners in the general population growing from 1.6 per cent in1998 to nearly 10 per cent in 2007, as shown in Table 1. Both in 1998and 2007 the Balearic and Canary Islands, Valencia, Madrid andCatalonia received the highest numbers of immigrants. It is importantto point out significant increases in the number of foreigners in the re-gions of Murcia (17 per cent) and La Rioja (14 per cent). Immigrationrates have remained more modest in the Cantabrian regions, includingthe Basque Country. Although the number of foreigners increased by6.5 per cent in the Basque Country during the 1998-2007 period, it ishalf the Spanish average. The mean age of foreigners living in Spain inJanuary 2007 was 34 years and 46 per cent of them were women.
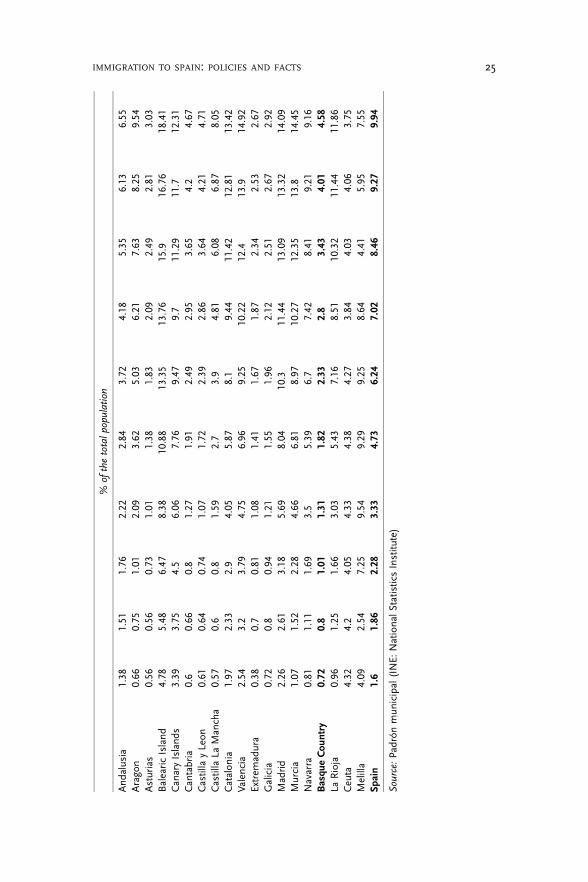
Finally, Graph 1 shows that the Balearic Islands hosted high relativenumbers of foreigners both in 1998 and 2007. It also highlights the ex-traordinary increase experienced by Murcia, Valencia and Madrid and,to a lesser extent, by the Canary Islands, Catalonia and the rest of theregions. In the Basque Country, the growth has been constant butmuch more modest.
The regions of origin of immigrants have also changed over the lastdecade. As shown in Table 2, 40 per cent of foreigners who lived inSpain in 1998 were born in other European Union (EU) countries, 22per cent in Africa and only 13 per cent in South American countries. Bycontrast, in 2006, 33 per cent of foreigners in Spain came from South

Table
1Foreignpopulation
inSpain
(1998-2007)
1998
1999
2000
2001
2002
2003
2004
2005
2006
2007
Num
berof
foreigners
And
alusia
99,781
110,114
128,916
164,145
212,202
282,90
132
1,570
420,20
748
8,92
852
6,94
2Arago
n7,84
68,938
12,051
25,132
44,028
61,896
77,545
96,848
105,361
123,591
Asturias
6,02
96,048
7,85
910,848
14,846
19,691
22,429
26,797
30,258
32,586
BalearicIsland
38,093
45,017
54,729
73,614
99,744
126,50
5131,42
3156,27
0167,751
189,437
Can
aryIsland
s55
,218
62,677
77,196
107,930
143,138
179,49
3185,78
122
2,26
023
3,44
724
8,87
1Can
tabria
3,147
3,463
4,27
36,833
10,334
13,677
16,364
20,547
23,834
26,744
CastillayLeon
15,121
16,000
18,381
26,572
42,640
59,440
71,300
91,318
106,159
118,95
1CastillaLa
Man
cha
9,85
410,292
13,854
27,887
48,123
70,899
88,858
115,22
3132,725
158,905
Catalon
ia121,36
1144,925
181,59
825
7,35
438
2,06
754
3,00
864
2,84
679
8,90
4913,757
966,00
4Valencia
102,118
130,192
156,20
7199,574
301,143
413,76
046
4,317
581,985
668,07
572
7,08
0Extrem
adura
4,08
27,476
8,713
11,627
15,125
17,885
20,066
25,341
27,467
29,068
Galicia
19,693
21,787
25,602
33,058
42,462
53,808
58,387
69,363
73,756
81,023
Madrid
115,20
2134,165
165,73
430
5,65
644
4,44
058
9,215
664,25
578
0,75
280
0,512
854,23
2Murcia
11,916
17,237
26,189
55,458
83,511
113,912
132,918
165,016
189,053
200,96
4Navarra
4,313
5,97
19,188
19,497
30,686
38,741
43,376
49,882
55,444
55,427
Basqu
eCou
ntry
15,198
16,793
21,140
27,438
38,408
49,231
59,166
72,894
85,542
98,108
LaRioja
2,53
93,320
4,39
78,193
15,288
20,570
24,988
31,075
35,037
36,583
Ceuta
3,114
3,093
3,05
03,28
13,334
3,20
32,863
3,03
73,078
2,861
Melilla
2,46
01,44
74,80
36,56
16,425
6,33
35,874
2,891
3,982
5,191
Spain
637,08
574
8,95
492
3,87
91,370,657
1,97
7,946
2,664,16
83,034,326
3,730,61
04,144,166
4,48
2,568
24 BORN ENTREPRENEURS?
%of
thetotalp
opulation
And
alusia
1.38
1.51
1.76
2.22
2.84
3.72
4.18
5.35
6.13
6.55
Arago
n0.66
0.75
1.01
2.09
3.62
5.03
6.21
7.63
8.25
9.54
Asturias
0.56
0.56
0.73
1.01
1.38
1.83
2.09
2.49
2.81
3.03
BalearicIsland
4.78
5.48
6.47
8.38
10.88
13.35
13.76
15.9
16.76
18.41
Can
aryIsland
s3.39
3.75
4.5
6.06
7.76
9.47
9.7
11.29
11.7
12.31
Can
tabria
0.6
0.66
0.8
1.27
1.91
2.49
2.95
3.65
4.2
4.67
CastillayLeon
0.61
0.64
0.74
1.07
1.72
2.39
2.86
3.64
4.21
4.71
CastillaLa
Man
cha
0.57
0.6
0.8
1.59
2.7
3.9
4.81
6.08
6.87
8.05
Catalon
ia1.97
2.33
2.9
4.05
5.87
8.1
9.44
11.42
12.81
13.42
Valencia
2.54
3.2
3.79
4.75
6.96
9.25
10.22
12.4
13.9
14.92
Extrem
adura
0.38
0.7
0.81
1.08
1.41
1.67
1.87
2.34
2.53
2.67
Galicia
0.72
0.8
0.94
1.21
1.55
1.96
2.12
2.51
2.67
2.92
Madrid
2.26
2.61
3.18
5.69
8.04
10.3
11.44
13.09
13.32
14.09
Murcia
1.07
1.52
2.28
4.66
6.81
8.97
10.27
12.35
13.8
14.45
Navarra
0.81
1.11
1.69
3.5
5.39
6.7
7.42
8.41
9.21
9.16
Basqu
eCou
ntry
0.72
0.8
1.01
1.31
1.82
2.33
2.8
3.43
4.01
4.58
LaRioja
0.96
1.25
1.66
3.03
5.43
7.16
8.51
10.32
11.44
11.86
Ceuta
4.32
4.2
4.05
4.33
4.38
4.27
3.84
4.03
4.06
3.75
Melilla
4.09
2.54
7.25
9.54
9.29
9.25
8.64
4.41
5.95
7.55
Spain
1.6
1.86
2.28
3.33
4.73
6.24
7.02
8.46
9.27
9.94
Source:Pa
drón
mun
icipal(INE:
Nationa
lStatisticsInstitu
te)
IMMIGRATION TO SPAIN: POLICIES AND FACTS 25
America, a mere 19 per cent from EU countries, 17 per cent fromAfrica and 16 per cent from other European but non-EU countries.
Graph 2 illustrates the changes in the foreign population of Spain byworld regions. The number of foreigners from South America andEuropean non-EU countries clearly increased between 1998 and 2006,and rose particularly sharply for South Americans between 2000 and2004. On the other hand, the percentage of foreigners born in EUcountries and, to a lesser extent, in Africa and Spain decreased. This isalso true of foreigners from other parts of the world, such as Asia andNorth America. Moreover, the percentage of foreigners from EU
Graph 1 Foreign population in Spain (1998-2007)
0%
2%
4%
6%
8%
10%
12%
14%
16%
18%
20%
1998 1999 2000 2001 2002 2003 2004 2005 2006 2007
Spain
Balearic Island
CanarianIslands
Catalonia
Valencia
Madrid
Murcia
Basque Country
La Rioja
Graph 2 Foreign population in Spain by region of origin (1998-2006)
0%
5%
10%
15%
20%
25%
30%
35%
40%
45%
1998 1999 2000 2001 2002 2003 2004 2005 2006
Spain
EU-25
Other European
Africa
CentralAmerica
North America
South America
Asia
Oceania
26 BORN ENTREPRENEURS?

Table
2Foreignpopulation
inSpain
byregion
oforigin
(1998-2006)
1998
1999
2000
2001
2002
2003
2004
2005
2006
Num
berof
foreigners
Spain
56,890
84,303
92,253
72,524
87,929
110,80
1127,378
166,413
188,29
1EU
-25
250,64
628
4,09
232
7,98
538
9,60
046
2,24
155
2,23
554
8,90
866
9,48
579
1,573
Other
Europe
an25
,136
28,542
41,286
96,315
179,583
303,39
440
4,53
756
4,159
671,707
Africa
138,124
157,678
207,43
729
8,89
939
9,83
649
2,95
154
1,518
663,156
725,96
0Cen
tralAmerica
30,444
36,472
46,852
62,189
78,546
94,697
101,43
9119,77
3127,504
North
America
15,063
16,798
18,955
23,025
28,290
36,901
38,660
47,107
47,650
SouthAmerica
82,301
97,515
136,632
356,92
964
7,36
495
0,02
11,136,002
1,32
1,800
1,38
2,450
Asia
37,483
42,408
51,220
69,636
92,321
120,995
133,840
176,290
206,47
6Ocean
ia998
1,146
1,258
1,540
1,836
2,173
2,044
2,427
2,555
Total
637,08
574
8,95
492
3,87
81,370,65
71,97
7,946
2,664,168
3,03
4,326
3,730,610
4,144,166
%of
thetotalforeign
populatio
n
Spain
8.93
11.26
9.99
5.29
4.45
4.16
4.20
4.46
4.54
EU-25
39.34
37.93
35.50
28.42
23.37
20.73
18.09
17.95
19.10
Other
Europe
an3.95
3.81
4.47
7.03
9.08
11.39
13.33
15.12
16.21
Africa
21.68
21.05
22.45
21.81
20.21
18.50
17.85
17.78
17.52
Cen
tralAmerica
4.78
4.87
5.07
4.54
3.97
3.55
3.34
3.21
3.08
North
America
2.36
2.24
2.05
1.68
1.43
1.39
1.27
1.26
1.15
SouthAmerica
12.92
13.02
14.79
26.04
32.73
35.66
37.44
35.43
33.36
Asia
5.88
5.66
5.54
5.08
4.67
4.54
4.41
4.73
4.98
Ocean
ia0.16
0.15
0.14
0.11
0.09
0.08
0.07
0.07
0.06
Total
100
100
100
100
100
100
100
100
100
Source:Pa
drón
mun
icipal(INE:
Nationa
lStatisticsInstitu
te)
IMMIGRATION TO SPAIN: POLICIES AND FACTS 27

countries decreased from 2000 to 2004 and began to increase there-after. Finally, the number of foreigners from other European countriesremained relatively stable from 1998 to 2000 and then started to in-crease gradually.
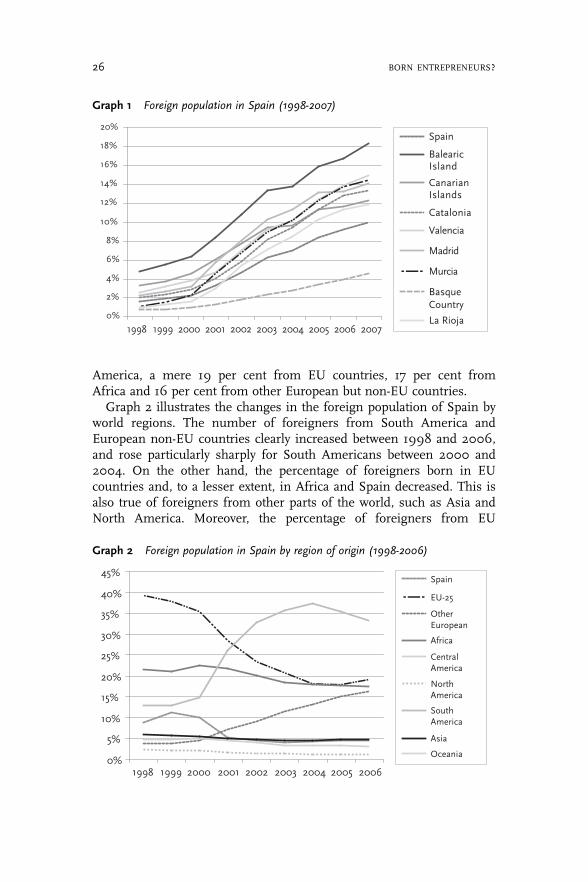
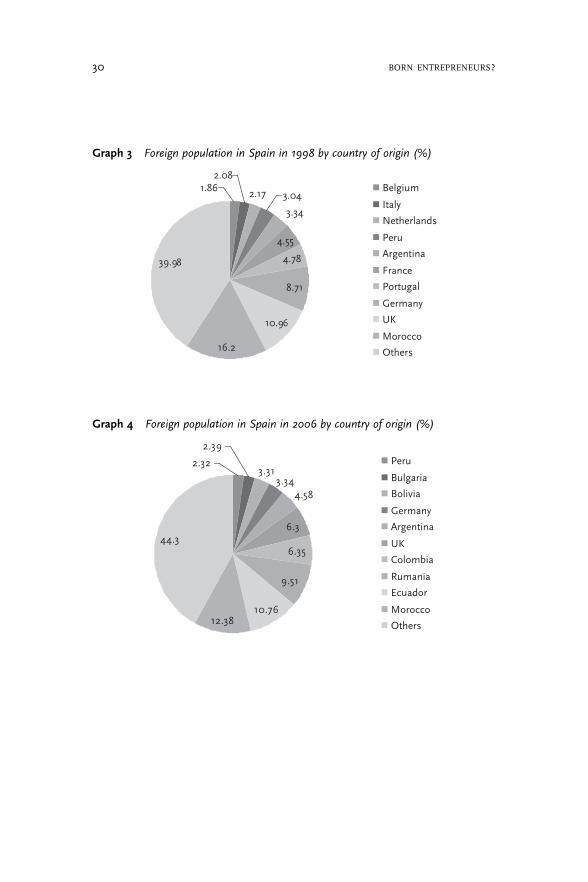
The numbers of foreigners in Spain in 1998 and 2006 are shown inTable 3 by country of origin and gender. The largest percentages of thepopulation appear in blue boxes.
As shown in Table 3, with few exceptions, the largest group of for-eigners who lived in Spain in 1998 came from EU countries, whereasover 40 per cent of the foreign population was Latin American in2006. In both years Moroccans constituted the largest group. However,while immigrants from the United Kingdom and Germany made upthe second largest groups in 1998, by 2006 they were replaced byEcuadorians and Romanians, after a dramatic growth over one decade.The largest number of male immigrants was that of Moroccans,whereas in the case of females, they were Ecuadorian.
Graphs 3 (1998) and 4 (2006) are based on Table 3. In 1998 the ten lar-gest groups constituted 60 per cent of the total foreign population, andover 55 per cent eight years later. In 1998 Moroccans, British, Germans,Portuguese and French constituted the largest groups (45 per cent).
By 2006, the composition of the foreign population by country of ori-gin had changed significantly. Moroccans were still the main group, fol-lowed by Ecuadorians, Romanians, Colombians and British. Thesegroups represented more than half of the foreign population who livedin Spain in 2006.
2.1.2 Immigration and labour market trends in Spain
In order to better understand the immigrants’ motivation and propen-sity for entrepreneurship in Spain, in this section I present some statis-tics about the affiliation of foreign workers with the Spanish SocialSecurity department and the work permits given to them by Spanish re-gion, type of work (self- or wage-employment), industry sector, originand gender.
2.1.2.1 Social Security registrationsThe increase in the foreign population in Spain resulted in an increasein the number of foreigners registered with the Spanish Social Securitydepartment. As shown in Table 4, foreigners registered with the SocialSecurity department represented 2 per cent of the general population in1999 and 8 per cent in 2005: the number of foreigners who joined thegeneral regime increased 400 per cent for the period to reach over onemillion entries by 2005.
28 BORN ENTREPRENEURS?
Table 3 Foreign population in Spain by country of origin and gender
(1998-2006)
Total Men Women
1998 2006 1998 2006 1998 2006
Number of foreigners
Belgium 11,840 27,439 5,501 13,961 6,338 13,478France 29,015 74,605 12,903 37,247 16,112 37,358Italy 13,261 54,914 8,611 34,879 4,650 20,035Netherlands 13,823 34,644 6,494 18,146 7,329 16,498Portugal 30,463 71,402 15,076 42,893 15,387 28,509Germany 55,475 138,573 26546 69868 28929 68705UK 69,818 261,116 33,376 132,610 36,443 128,506Morocco 103,225 513,007 66,869 345,808 36,356 167,199Argentina 21,285 189,625 10,306 98,541 10,979 91,084Peru 19,359 96,187 7,507 45,639 11,852 50,548Bolivia 1,190 137,159 495 59,672 695 77,487Colombia 9,884 263,339 3,137 113,697 6,747 149,642Ecuador 3,745 446,111 1,521 216,680 2,224 229,431Bulgaria 1,358 99,083 712 54,474 646 44,609Romania 2,260 394,078 1,269 210,906 991 183,172Total 382,383 2,308,121 198,342 1,229,641 184,041 1,078,480Other countries 254,702 1,836,045 123,919 985,828 130,783 850,217Total foreigners 637,085 4,144,166 322,261 2,215,469 314,824 1,928,697
% of the total foreign population
Belgium 1.86 0.66 1.71 0.63 2.01 0.70France 4.55 1.80 4.00 1.68 5.12 1.94Italy 2.08 1.33 2.67 1.57 1.48 1.04Netherlands 2.17 0.84 2.02 0.82 2.33 0.86Portugal 4.78 1.72 4.68 1.94 4.89 1.48Germany 8.71 3.34 8.24 3.15 9.19 3.56UK 10.96 6.30 10.36 5.99 11.58 6.66Morocco 16.20 12.38 20.75 15.61 11.55 8.67Argentina 3.34 4.58 3.20 4.45 3.49 4.72Peru 3.04 2.32 2.33 2.06 3.76 2.62Bolivia 0.19 3.31 0.15 2.69 0.22 4.02Colombia 1.55 6.35 0.97 5.13 2.14 7.76Ecuador 0.59 10.76 0.47 9.78 0.71 11.90Bulgaria 0.21 2.39 0.22 2.46 0.21 2.31Romania 0.35 9.51 0.39 9.52 0.31 9.50Total 60.02 55.70 61.55 55.50 58.46 55.92Other countries 39.98 44.30 38.45 44.50 41.54 44.08Total foreigners 100 100 100 100 100 100
Source: Padrón municipal (INE: National Statistics Institute)
IMMIGRATION TO SPAIN: POLICIES AND FACTS 29
Graph 3 Foreign population in Spain in 1998 by country of origin (%)
4.78
8.71
10.96
16.2
39.98
4.55
3.04
2.081.86
3.34
2.17 Belgium
Italy
Netherlands
Peru
Argentina
France
Portugal
Germany
UK
Morocco
Others
Graph 4 Foreign population in Spain in 2006 by country of origin (%)
6.3
6.35
9.51
10.7612.38
44.3
2.39
2.323.31
3.344.58
Peru
Bulgaria
Bolivia
Germany
Argentina
UK
Colombia
Rumania
Ecuador
Morocco
Others
30 BORN ENTREPRENEURS?

Interestingly, the percentage of foreigners registered as self-employedin 1999 out of the total self-employed in Spain (2.42 per cent) washigher than that of foreign people registered in the general regime (1.77per cent). However, by 2005 the percentage of foreigners registered inthe general regime out of the total population registered in Spain (7.42per cent) overtook that of the foreign self-employed (4.67 per cent). Inaddition, the presence of foreign workers in the domestic servant re-gime, already high in 1999 (30 per cent), reached 61 per cent of the to-tal people registered as domestic servants in Spain by 2005. The
Table 4 Foreign population registered with the Social Security department
(1999-2005)
1999 2000 2001 2002 2003 2004 2005
Number of foreigners registered
General regime 184,690 239,447 356,297 508,484 625,504 737,954 1,001,546Coal mining regime 398 415 446 481 500 531 521Agricultural regime 43,006 48,447 68,243 94,018 116,631 116,724 143,058Domestic servantregime
44,841 45,650 51,611 72,519 79,182 73,893 175,051
Sea workers regime 1,435 2,020 2,570 2,920 3,239 3,501 3,987Self-employmentregime
60,606 66,732 77,908 88,047 99,748 115,627 136,977
Total 334,976 402,711 557,074 766,470 924,805 1,048,230 1,461,140
% of the total population registered
General regime 1.77 2.16 3.06 4.21 5.02 5.73 7.42Coal mining regime 2.03 2.28 2.69 3.23 3.73 4.46 5.01Agricultural regime 3.72 4.25 6.05 8.37 10.28 10.75 13.71Domestic servantregime
30.09 30.21 33.11 41.20 42.89 40.82 61.49
Sea workers regime 1.81 2.55 3.29 3.82 4.27 4.70 5.48Self-employmentregime
2.42 2.60 2.98 3.31 3.65 4.07 4.67
Total 2.34 2.67 3.56 4.75 5.57 6.14 8.19
% of the total foreign population registered
General regime 55.14 59.46 63.96 66.34 67.64 70.40 68.55Coal mining regime 0.12 0.10 0.08 0.06 0.05 0.05 0.04Agricultural regime 12.84 12.03 12.25 12.27 12.61 11.14 9.79Domestic servantregime
13.39 11.34 9.26 9.46 8.56 7.05 11.98
Sea workers regime 0.43 0.50 0.46 0.38 0.35 0.33 0.27Self-employmentregime
18.09 16.57 13.99 11.49 10.79 11.03 9.37
Total 100 100 100 100 100 100 100
Source: Boletín de Estadísticas Laborales, Ministerio de Trabajo y Asuntos Sociales(INE: Spanish Statistics Institute)
IMMIGRATION TO SPAIN: POLICIES AND FACTS 31

agricultural and sea workers regimes also experienced substantial in-creases for the period.
The proportion of foreigners registered in the general regime to thetotal registered foreign population increased between 1999 and 2005while the self-employed decreased by nearly half. Foreigners registeredin the domestic servant regime decreased between 1999 and 2004, butincreased sharply in 2005. As a result, the proportion of people regis-tered in the general regime out of the total foreign population regis-tered with the Social Security department decreased in 2005. The agri-cultural regime decreased slightly until 2003 and sharply thereafter.
Graph 5 illustrates the changes in the foreign population registeredwith the Spanish Social Security department between 1999 and 2005.While in 1999 the proportion of foreigners listed as self-employed rela-tive to the total number of people registered as self-employed in Spainwas higher than that of foreigners registered in the general regime, in2001 the proportion was the same and the trend was reversed there-after. By 2005 foreigners represented over 7 per cent of people regis-tered in the general regime and under 5 per cent of the self-employed.Changes for all foreign workers are parallel to those of foreigners regis-tered in the general regime: both experienced a slight growth between1999 and 2000 and a sharper increase after 2004. For its part, the pro-portion of self-employed foreigners increased very gradually.
Both in 1999 and 2005 the majority of foreigners affiliated with theSocial Security department were registered in Catalonia, Madrid,Andalusia, Valencia and the Canary Islands (see Table 5). By 2005 the
Graph 5 Foreign population registered with the Social Security department
(1999-2005)
0%
1%
2%
3%
4%
5%
6%
7%
8%
9%
1999 2000 2001 2002 2003 2004 2005
General regimen Self-employed regimen All foreign workers
32 BORN ENTREPRENEURS?

Table 5 Foreign population registered with the Social Security department by
Spanish regions (1999-2005)
1999 2000 2001 2002 2003 2004 2005
Number of foreigners registered
Andalusia 38,792 44,718 61,446 84,589 101,416 114,029 157,081Aragon 6,595 8,800 13,613 20,384 24,711 29,016 44,771Asturias 2,674 3,061 4,297 5,624 6,342 6,941 9,975Balearic Island 19,132 26,853 32,611 38,977 42,911 46,236 62,041Canary Islands 33,549 37,486 46,104 57,034 61,768 66,833 80,586Cantabria 1,338 1,697 2,877 4,054 4,949 6,801 9,333Castilla y Leon 5,265 6,558 10,705 18,327 22,624 28,164 49,291Castilla La Mancha 6,294 7,708 12,615 18,619 21,819 27,324 39,612Catalonia 73,214 90,006 123,290 164,665 200,018 234,969 329,609Valencia 29,442 35,121 52,676 80,691 104,514 120,891 174,551Extremadura 5,083 5,472 6,579 7,507 7,543 7,673 8,946Galicia 6,912 7,850 9,999 12,566 15,012 18,690 25,192Madrid 75,140 89,415 124,323 173,658 209,262 229,407 318,418Murcia 16,190 18,999 29,218 42,743 55,325 57,059 77,807Navarra 4,198 5,681 8,994 12,439 15,747 17,866 23,645Basque Country 6,613 7,812 10,691 14,687 18,603 22,292 31,744La Rioja 2,073 2,739 4,092 6,327 8,163 9,905 13,939Ceuta 641 714 891 1,041 1,181 1,334 1,604Melilla 1,831 2,023 2,054 2,540 2,897 2,799 2,996Spain 334,976 402,713 557,075 766,472 924,805 1,048,229 1,461,140
% of the total foreign population registered
Andalusia 11.58 11.10 11.03 11.04 10.97 10.88 10.75Aragon 1.97 2.19 2.44 2.66 2.67 2.77 3.06Asturias 0.80 0.76 0.77 0.73 0.69 0.66 0.68Balearic Islands 5.71 6.67 5.85 5.09 4.64 4.41 4.25Canary Islands 10.02 9.31 8.28 7.44 6.68 6.38 5.52Cantabria 0.40 0.42 0.52 0.53 0.54 0.65 0.64Castilla y Leon 1.57 1.63 1.92 2.39 2.45 2.69 3.37Castilla La Mancha 1.88 1.91 2.26 2.43 2.36 2.61 2.71Catalonia 21.86 22.35 22.13 21.48 21.63 22.42 22.56Valencia 8.79 8.72 9.46 10.53 11.30 11.53 11.95Extremadura 1.52 1.36 1.18 0.98 0.82 0.73 0.61Galicia 2.06 1.95 1.79 1.64 1.62 1.78 1.72Madrid 22.43 22.20 22.32 22.66 22.63 21.89 21.79Murcia 4.83 4.72 5.24 5.58 5.98 5.44 5.33Navarra 1.25 1.41 1.61 1.62 1.70 1.70 1.62Basque Country 1.97 1.94 1.92 1.92 2.01 2.13 2.17La Rioja 0.62 0.68 0.73 0.83 0.88 0.94 0.95Ceuta 0.19 0.18 0.16 0.14 0.13 0.13 0.11Melilla 0.55 0.50 0.37 0.33 0.31 0.27 0.21Spain 100 100 100 100 100 100 100
IMMIGRATION TO SPAIN: POLICIES AND FACTS 33

number of foreigners registered with the Social Security department inSpain reached 1,400,000, whereas in the Basque Country they num-bered over 31,000. Nevertheless, the relative importance of some ofthese regions, such as Catalonia and Valencia (as well as in other re-gions where the presence of foreigners was not as important) increasedslightly between 1999 and 2005, while it decreased in the case ofAndalusia, Madrid and, especially, the Canary Islands.
Murcia and the Balearic Islands were the regions where the registra-tion of foreigners with the Social Security department relative to that ofthe total population was highest both in 1999 and in 2005. Madrid,Catalonia and, interestingly, La Rioja, which experienced a notable in-crease over the period, came next. The proportion of foreigners regis-tered with the Social Security department in Spain increased from 2.3per cent to 8.2 per cent and, in the Basque Country from around 0.8per cent to 3.5 per cent over the 1999-2005 period.
Graph 6 shows changes in the proportion of foreigners to the totalpopulation registered with the Social Security department for the fiveregions with the largest numbers of Social Security registrations, plus
Table 5 Foreign population registered with the Social Security department by
Spanish regions (1999-2005) (continued)
1999 2000 2001 2002 2003 2004 2005
% of the total population registered by region
Andalusia 1.71 1.88 2.47 3.29 3.77 4.08 5.40Aragon 1.50 1.93 2.90 4.24 4.99 5.69 8.38Asturias 0.83 0.91 1.23 1.58 1.76 1.90 2.67Balearic Island 5.49 7.26 8.49 9.98 10.93 11.58 14.73Canary Islands 5.60 5.91 6.98 8.34 8.78 9.32 10.81Cantabria 0.79 0.94 1.54 2.12 2.52 3.36 4.45Castilla y Leon 1.03 1.23 1.94 3.19 3.78 4.49 7.37Castilla La Mancha 0.81 0.96 1.54 2.23 2.57 3.12 4.38Catalonia 2.77 3.25 4.31 5.62 6.67 7.65 10.28Valencia 2.02 2.29 3.30 4.87 6.09 6.83 9.43Extremadura 1.56 1.62 1.92 2.16 2.12 2.13 2.42Galicia 0.81 0.89 1.11 1.36 1.59 1.93 2.53Madrid 3.52 3.93 5.19 7.02 8.23 8.77 11.49Murcia 4.18 4.65 6.76 9.32 11.36 11.32 14.66Navarra 1.98 2.56 3.88 5.20 6.39 7.05 9.04Basque Country 0.85 0.96 1.27 1.71 2.13 2.51 3.48La Rioja 2.08 2.62 3.77 5.69 6.99 8.22 11.09Ceuta 4.42 4.61 5.57 6.12 6.75 7.58 8.81Melilla 12.89 13.76 13.69 15.97 17.56 16.37 17.32Spain 2.34 2.67 3.56 4.75 5.57 6.14 8.19
Sources: Boletín de Estadísticas Laborales, Ministerio de Trabajo y Asuntos Sociales(INE: Spanish Statistics Institute)
34 BORN ENTREPRENEURS?
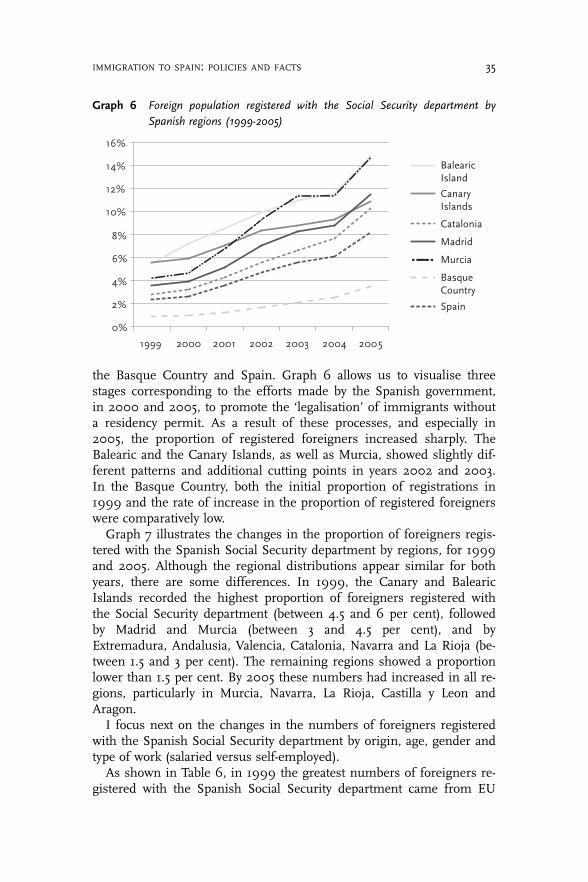
the Basque Country and Spain. Graph 6 allows us to visualise threestages corresponding to the efforts made by the Spanish government,in 2000 and 2005, to promote the ‘legalisation’ of immigrants withouta residency permit. As a result of these processes, and especially in2005, the proportion of registered foreigners increased sharply. TheBalearic and the Canary Islands, as well as Murcia, showed slightly dif-ferent patterns and additional cutting points in years 2002 and 2003.In the Basque Country, both the initial proportion of registrations in1999 and the rate of increase in the proportion of registered foreignerswere comparatively low.
Graph 7 illustrates the changes in the proportion of foreigners regis-tered with the Spanish Social Security department by regions, for 1999and 2005. Although the regional distributions appear similar for bothyears, there are some differences. In 1999, the Canary and BalearicIslands recorded the highest proportion of foreigners registered withthe Social Security department (between 4.5 and 6 per cent), followedby Madrid and Murcia (between 3 and 4.5 per cent), and byExtremadura, Andalusia, Valencia, Catalonia, Navarra and La Rioja (be-tween 1.5 and 3 per cent). The remaining regions showed a proportionlower than 1.5 per cent. By 2005 these numbers had increased in all re-gions, particularly in Murcia, Navarra, La Rioja, Castilla y Leon andAragon.
I focus next on the changes in the numbers of foreigners registeredwith the Spanish Social Security department by origin, age, gender andtype of work (salaried versus self-employed).
As shown in Table 6, in 1999 the greatest numbers of foreigners re-gistered with the Spanish Social Security department came from EU
Graph 6 Foreign population registered with the Social Security department by
Spanish regions (1999-2005)
0%
2%
4%
6%
8%
10%
12%
14%
16%
1999 2000 2001 2002 2003 2004 2005
Balearic Island
Canary Islands
Catalonia
Madrid
Murcia
Basque Country
Spain
IMMIGRATION TO SPAIN: POLICIES AND FACTS 35

Graph 7 Foreign population registered with the Social Security department out of
the total population registered (%)
1999
2005
0.79 – 1.50 1.51 – 3.00 3.01 – 4.50 4.51 – 6.00 6.01 – 9.00 9.01 – 12.0012.01 – 14.73
36 BORN ENTREPRENEURS?
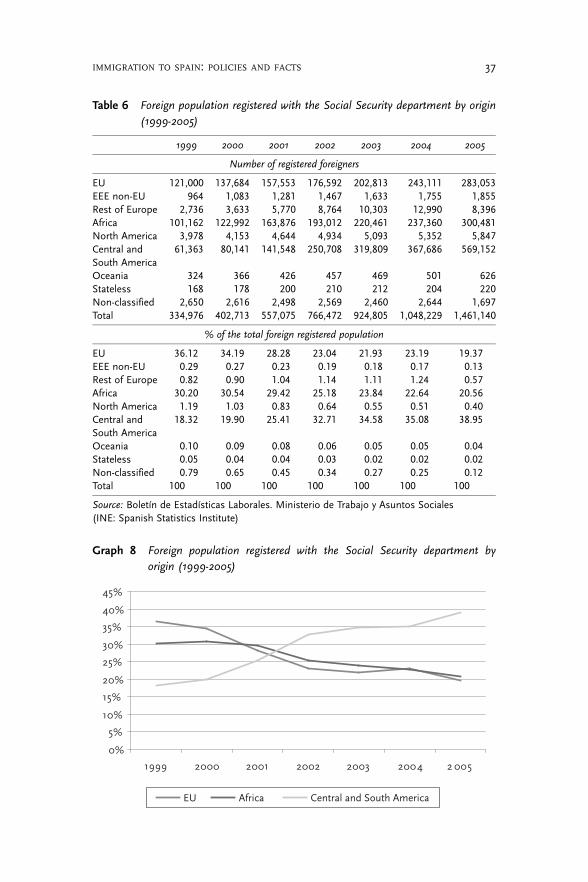
Table 6 Foreign population registered with the Social Security department by origin
(1999-2005)
1999 2000 2001 2002 2003 2004 2005
Number of registered foreigners
EU 121,000 137,684 157,553 176,592 202,813 243,111 283,053EEE non-EU 964 1,083 1,281 1,467 1,633 1,755 1,855Rest of Europe 2,736 3,633 5,770 8,764 10,303 12,990 8,396Africa 101,162 122,992 163,876 193,012 220,461 237,360 300,481North America 3,978 4,153 4,644 4,934 5,093 5,352 5,847Central andSouth America
61,363 80,141 141,548 250,708 319,809 367,686 569,152
Oceania 324 366 426 457 469 501 626Stateless 168 178 200 210 212 204 220Non-classified 2,650 2,616 2,498 2,569 2,460 2,644 1,697Total 334,976 402,713 557,075 766,472 924,805 1,048,229 1,461,140
% of the total foreign registered population
EU 36.12 34.19 28.28 23.04 21.93 23.19 19.37EEE non-EU 0.29 0.27 0.23 0.19 0.18 0.17 0.13Rest of Europe 0.82 0.90 1.04 1.14 1.11 1.24 0.57Africa 30.20 30.54 29.42 25.18 23.84 22.64 20.56North America 1.19 1.03 0.83 0.64 0.55 0.51 0.40Central andSouth America
18.32 19.90 25.41 32.71 34.58 35.08 38.95
Oceania 0.10 0.09 0.08 0.06 0.05 0.05 0.04Stateless 0.05 0.04 0.04 0.03 0.02 0.02 0.02Non-classified 0.79 0.65 0.45 0.34 0.27 0.25 0.12Total 100 100 100 100 100 100 100
Source: Boletín de Estadísticas Laborales. Ministerio de Trabajo y Asuntos Sociales(INE: Spanish Statistics Institute)
Graph 8 Foreign population registered with the Social Security department by
origin (1999-2005)
0%
5%
10%
15%
20%
25%
30%
35%
40%
45%
1999 2000 2001 2002 2003 2004 2 005
EU Africa Central and South America
IMMIGRATION TO SPAIN: POLICIES AND FACTS 37
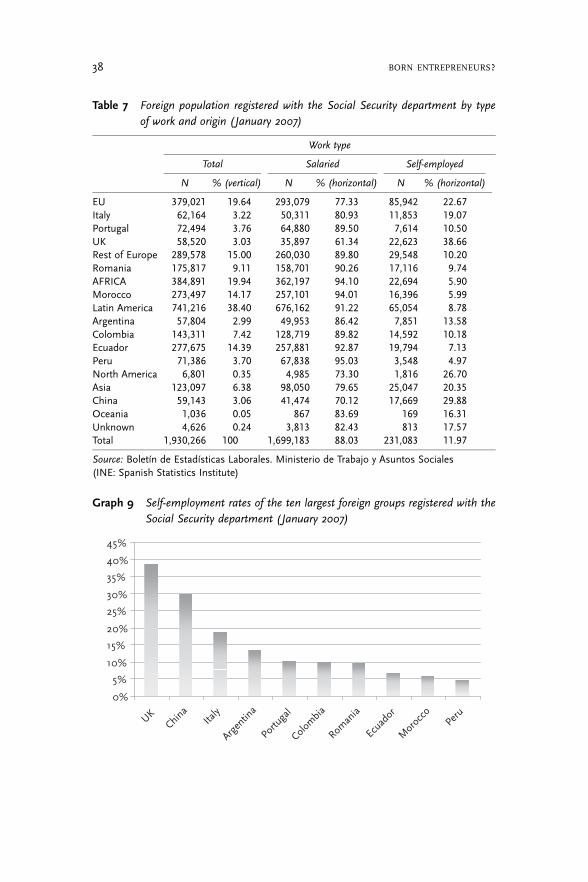
Table 7 Foreign population registered with the Social Security department by type
of work and origin (January 2007)
Work type
Total Salaried Self-employed
N % (vertical) N % (horizontal) N % (horizontal)
EU 379,021 19.64 293,079 77.33 85,942 22.67Italy 62,164 3.22 50,311 80.93 11,853 19.07Portugal 72,494 3.76 64,880 89.50 7,614 10.50UK 58,520 3.03 35,897 61.34 22,623 38.66Rest of Europe 289,578 15.00 260,030 89.80 29,548 10.20Romania 175,817 9.11 158,701 90.26 17,116 9.74AFRICA 384,891 19.94 362,197 94.10 22,694 5.90Morocco 273,497 14.17 257,101 94.01 16,396 5.99Latin America 741,216 38.40 676,162 91.22 65,054 8.78Argentina 57,804 2.99 49,953 86.42 7,851 13.58Colombia 143,311 7.42 128,719 89.82 14,592 10.18Ecuador 277,675 14.39 257,881 92.87 19,794 7.13Peru 71,386 3.70 67,838 95.03 3,548 4.97North America 6,801 0.35 4,985 73.30 1,816 26.70Asia 123,097 6.38 98,050 79.65 25,047 20.35China 59,143 3.06 41,474 70.12 17,669 29.88Oceania 1,036 0.05 867 83.69 169 16.31Unknown 4,626 0.24 3,813 82.43 813 17.57Total 1,930,266 100 1,699,183 88.03 231,083 11.97
Source: Boletín de Estadísticas Laborales. Ministerio de Trabajo y Asuntos Sociales(INE: Spanish Statistics Institute)
Graph 9 Self-employment rates of the ten largest foreign groups registered with the
Social Security department (January 2007)
0%
5%
10%
15%
20%
25%
30%
35%
40%
45%
UKChina
Italy
Argen
tina
Portuga
l
Colombia
Roman
ia
Ecuad
or
Moro
cco
Peru
38 BORN ENTREPRENEURS?

countries (36.1 per cent), Africa (30.2 per cent) and Central and SouthAmerica (18.3 per cent). However, between 1999 and 2005 the numberof foreigners from Central and South American countries registeredwith the Social Security department increased by over 800 per cent, thenumber of Africans by 200 per cent and that of EU countries by over100 per cent. As a result, by 2005 the largest groups of foreigners werefrom Central and South American countries (38.9 per cent), Africa(20.6 per cent) and the EU (19.4 per cent).
Based on Table 7, changes in the proportion of foreigners in the lar-gest origin groups from 1999 until 2005 are illustrated in Graph 8.
The largest groups of foreigners registered with the Spanish SocialSecurity department in January 2007 were from Ecuador (14.39 percent) and Morocco (14.17 per cent) (see Table 7). Of the total number ofregistered foreigners, 12 per cent were self-employed and the remainderwere salaried workers. Foreigners from North America, the EU andAsia showed the highest self-employment rates (26.7, 22.67 and 20.35per cent, respectively).
Graph 9 illustrates the self-employment rates of the ten largest for-eign groups registered with the Spanish Social Security department bycountry of origin in January 2007. The UK (38.66 per cent) and China(29.88 per cent) had the highest numbers of self-employed while fewerthan 20 per cent of other groups of foreigners were self-employed.
An analysis of the demographic features of the foreigners registeredwith the Social Security department shown in Table 8 revealed that themean age did not change between 1999 and 2006, and that the propor-tion of women increased from 35.4 to 39.1 per cent. The age structurefor foreign women and men is very similar, with foreigners betweenages 25 and 54 constituting over 80 per cent of the foreign population.
2.1.2.2 Work permitsIn 2005 the Spanish authorities issued more than 900,000 work per-mits to foreigners, ten times more than they did in 1998, as shown inTable 9. Wage-employment permits increased more than ten-fold butself-employment permits only doubled. As a result, the proportion ofself-employment permits out of the total number of permits decreasedfrom 6 per cent in 1998 to 1 per cent in 2005.
The number of work permits issued by the Spanish authorities to for-eigners increased for all Spanish regions between 1998 and 2005. Thehighest increase in the annual number of work permits occurred inCastilla La Mancha, Castilla y Leon, La Rioja, the Basque Country andValencia, and the lowest in Extremadura, Asturias, Catalonia, Andalusiaand Madrid. Both in 1999 and 2005, the largest numbers of permitswere issued in Madrid, Catalonia, Andalusia, Valencia and Murcia.
IMMIGRATION TO SPAIN: POLICIES AND FACTS 39

Table
8Foreignpopulation
registered
withtheSocialSecurity
departmentbyageandgender(1999-2006)
1999
2000
2001
2002
2003
2004
2005
2006
N%
N%
N%
N%
N%
N%
N%
N%
Totalforeign
populatio
n
16-19
5,86
11.75
7,740
1.92
10,668
1.92
12,790
1.67
13,548
1.46
15,832
1.51
25,779
1.76
31,093
1.71
20-24
33,985
10.15
44,496
11.05
65,420
11.74
92,014
12.00
100,62
810.88
101,416
9.67
154,852
10.60
189,530
10.40
25-54
278,413
83.11
331,422
82.30
458,126
82.24
633,35
082
.63
776,114
83.92
890,107
84.92
1,22
7,532
84.01
1,534,82
084
.22
55+
16,511
4.93
18,837
4.68
22,651
4.07
27,839
3.63
34,007
3.68
40,425
3.86
52,667
3.60
66,697
3.66
Total
334,97
6100
402,711
100
557,07
4100
766,47
0100
924,80
5100
1,04
8,230
100
1,46
1,140
100
1,822,40
6100
Men
16-19
3,95
11.83
5,126
1.95
7,237
1.98
8,52
81.71
8,94
31.50
10,546
1.58
16,088
1.80
19,522
1.76
20-24
20,888
9.66
28,089
10.69
41,938
11.45
57,974
11.65
62,099
10.45
61,581
9.21
89,365
10.01
109,596
9.89
25-54
179,920
83.22
216,554
82.39
301,729
82.36
412,40
982
.85
500,69
884
.23
569,86
785
.24
754,50
884
.51
939,00
684
.71
55<
11,304
5.23
12,921
4.92
15,334
4.19
18,465
3.71
22,272
3.75
26,215
3.92
32,610
3.65
40,116
3.62
Total
216,194
100
262,83
3100
366,37
6100
497,75
5100
594,42
6100
668,55
9100
892,80
7100
1,108,432
100
%men
64.54
65.27
65.77
64.94
64.28
63.78
61.10
60.82
Wom
en
16-19
1,910
1.61
2,613
1.87
3,431
1.80
4,26
21.59
4,60
41.39
5,285
1.39
9,692
1.71
11,572
1.62
20-24
13,097
11.04
16,406
11.74
23,480
12.32
34,040
12.67
38,529
11.66
39,833
10.49
65,484
11.52
79,932
11.20
25-54
98,370
82.94
114,76
782
.13
156,321
82.03
220,88
482
.23
275,40
683
.37
320,23
384
.35
473,017
83.23
595,80
983
.45
55<
5,166
4.36
5,882
4.21
7,288
3.82
9,351
3.48
11,728
3.55
14,207
3.74
20,054
3.53
26,580
3.72
Total
118,60
4100
139,730
100
190,577
100
268,62
4100
330,35
5100
379,65
2100
568,315
100
713,962
100
%wom
en35
.41
34.70
34.21
35.05
35.72
36.22
38.90
39.18
Source:Boletín
deEstadísticas
Labo
rales.Ministeriode
TrabajoyAsuntos
Sociales
(INE:
Span
ishStatisticsInstitu
te)
40 BORN ENTREPRENEURS?

As shown in Table 10, in 1998 over 28 per cent of all permits were is-sued to foreigners living in Madrid, over 24 per cent in Catalonia and12.65 per cent in Andalusia. The overall distribution of permits changedlittle between 1998 and 2005, although the numbers doubled, or nearlydoubled, in Castilla y Leon, Castilla La Mancha and the Basque Country.Graph 10 illustrates the fact that, aside from a few minor differences,the regional distribution of work permits issued to foreigners seems si-milar in 1998 and 2005.
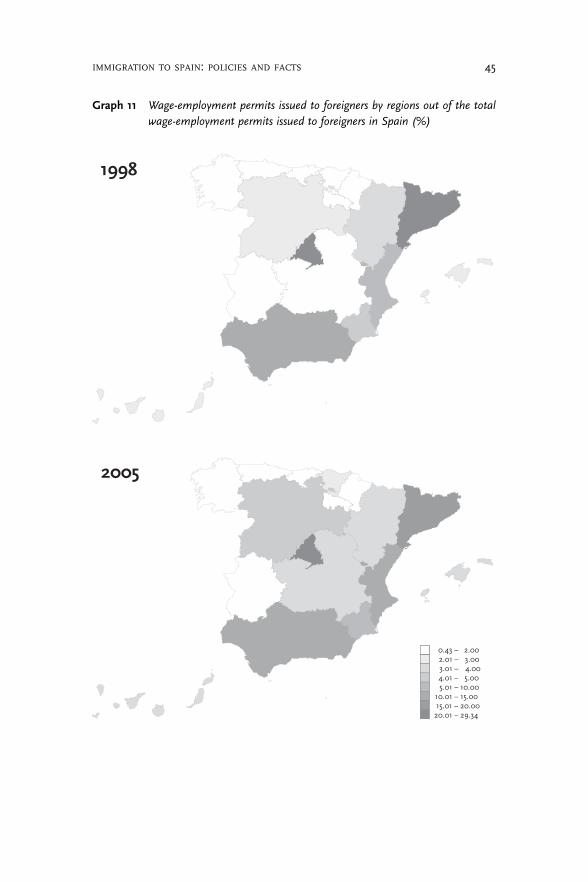
Since over 94 per cent of all permits (see Table 10) were issued to sal-aried foreigners over the 1998-2005 period, changes in the annualnumber of permits in the wage-employment labour market follow a pat-tern similar to that of all work permits, as shown in Table 11. Onceagain, Castilla La Mancha, Castilla y Leon and the Basque Country ex-perienced some of the largest increases in the annual number of per-mits between 1998 and 2005. Both in 1999 and 2005, the largest num-bers of permits was issued in Madrid (29.5 per cent), Catalonia (24.82per cent) and Andalusia (12.34 per cent). Since the majority of the per-mits were given in the wage market, the situation depicted in Graph 11for 1998 and 2005 is rather similar to that illustrated in Graph 10.
Finally, as shown in Table 12, the largest proportion of self-employ-ment permits in 1998 was issued to foreigners working in Andalusia(17.83 per cent), Catalonia (17.59 per cent) and Valencia (15.49 per cent).The number of annual self-employment permits issued to foreigners bythe Spanish authorities quadrupled in Madrid between 1998 and 2005,and doubled in Castilla y Leon and Navarra, while they decreased drasti-cally in Catalonia (to 6.85 per cent).
Graph 12 illustrates the changes in self-employment permits issuedto foreigners by the Spanish authorities by region in 1998 and 2005.Most noticeable is the increase in permits in the Madrid region.
Table 9 Work permits issued to foreigners by the Spanish authorities by type of
work (1998-2005)
1998 1999 2000 2001 2002 2003 2004 2005
Number of permits
Annual permits 85,526 118,538 292,120 298,676 318,613 271,776 498,280 923,012Salaried 80,614 111,516 278,153 289,212 312,267 264,495 484,394 913,117Self-employed 4,912 7,022 13,967 9,464 6,346 7,281 13,886 9,895
% of the annual number of permits
Salaried 94.26 94.08 95.22 96.83 98.01 97.32 97.21 98.93Self-employed 6.09 6.30 5.02 3.27 2.03 2.75 2.87 1.08
Source: Anuario de Estadísticas Laborales y de Asuntos Sociales. Ministerio de Trabajo yAsuntos Sociales (INE: National Statistics Institue)
IMMIGRATION TO SPAIN: POLICIES AND FACTS 41
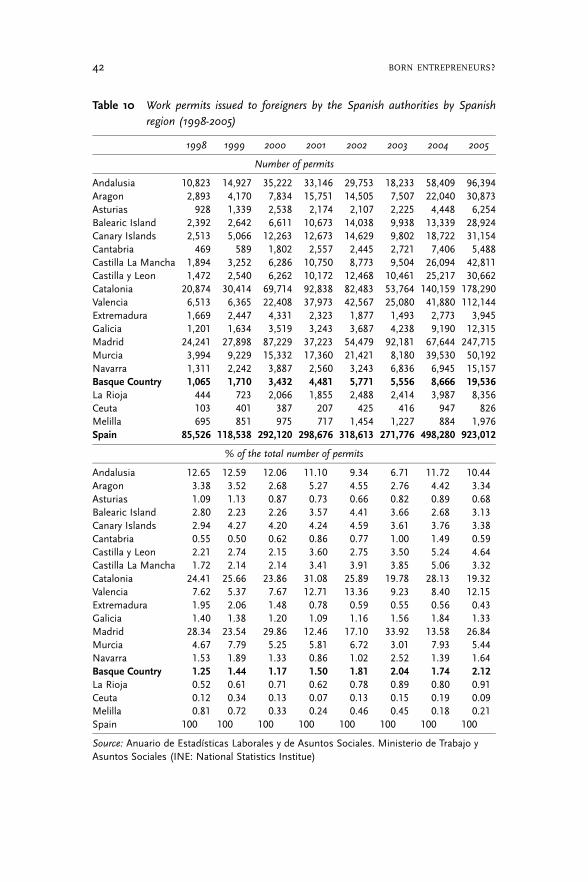
Table 10 Work permits issued to foreigners by the Spanish authorities by Spanish
region (1998-2005)
1998 1999 2000 2001 2002 2003 2004 2005
Number of permits
Andalusia 10,823 14,927 35,222 33,146 29,753 18,233 58,409 96,394Aragon 2,893 4,170 7,834 15,751 14,505 7,507 22,040 30,873Asturias 928 1,339 2,538 2,174 2,107 2,225 4,448 6,254Balearic Island 2,392 2,642 6,611 10,673 14,038 9,938 13,339 28,924Canary Islands 2,513 5,066 12,263 12,673 14,629 9,802 18,722 31,154Cantabria 469 589 1,802 2,557 2,445 2,721 7,406 5,488Castilla La Mancha 1,894 3,252 6,286 10,750 8,773 9,504 26,094 42,811Castilla y Leon 1,472 2,540 6,262 10,172 12,468 10,461 25,217 30,662Catalonia 20,874 30,414 69,714 92,838 82,483 53,764 140,159 178,290Valencia 6,513 6,365 22,408 37,973 42,567 25,080 41,880 112,144Extremadura 1,669 2,447 4,331 2,323 1,877 1,493 2,773 3,945Galicia 1,201 1,634 3,519 3,243 3,687 4,238 9,190 12,315Madrid 24,241 27,898 87,229 37,223 54,479 92,181 67,644 247,715Murcia 3,994 9,229 15,332 17,360 21,421 8,180 39,530 50,192Navarra 1,311 2,242 3,887 2,560 3,243 6,836 6,945 15,157Basque Country 1,065 1,710 3,432 4,481 5,771 5,556 8,666 19,536La Rioja 444 723 2,066 1,855 2,488 2,414 3,987 8,356Ceuta 103 401 387 207 425 416 947 826Melilla 695 851 975 717 1,454 1,227 884 1,976Spain 85,526 118,538 292,120 298,676 318,613 271,776 498,280 923,012
% of the total number of permits
Andalusia 12.65 12.59 12.06 11.10 9.34 6.71 11.72 10.44Aragon 3.38 3.52 2.68 5.27 4.55 2.76 4.42 3.34Asturias 1.09 1.13 0.87 0.73 0.66 0.82 0.89 0.68Balearic Island 2.80 2.23 2.26 3.57 4.41 3.66 2.68 3.13Canary Islands 2.94 4.27 4.20 4.24 4.59 3.61 3.76 3.38Cantabria 0.55 0.50 0.62 0.86 0.77 1.00 1.49 0.59Castilla y Leon 2.21 2.74 2.15 3.60 2.75 3.50 5.24 4.64Castilla La Mancha 1.72 2.14 2.14 3.41 3.91 3.85 5.06 3.32Catalonia 24.41 25.66 23.86 31.08 25.89 19.78 28.13 19.32Valencia 7.62 5.37 7.67 12.71 13.36 9.23 8.40 12.15Extremadura 1.95 2.06 1.48 0.78 0.59 0.55 0.56 0.43Galicia 1.40 1.38 1.20 1.09 1.16 1.56 1.84 1.33Madrid 28.34 23.54 29.86 12.46 17.10 33.92 13.58 26.84Murcia 4.67 7.79 5.25 5.81 6.72 3.01 7.93 5.44Navarra 1.53 1.89 1.33 0.86 1.02 2.52 1.39 1.64Basque Country 1.25 1.44 1.17 1.50 1.81 2.04 1.74 2.12La Rioja 0.52 0.61 0.71 0.62 0.78 0.89 0.80 0.91Ceuta 0.12 0.34 0.13 0.07 0.13 0.15 0.19 0.09Melilla 0.81 0.72 0.33 0.24 0.46 0.45 0.18 0.21Spain 100 100 100 100 100 100 100 100
Source: Anuario de Estadísticas Laborales y de Asuntos Sociales. Ministerio de Trabajo yAsuntos Sociales (INE: National Statistics Institue)
42 BORN ENTREPRENEURS?

Graph 10 Work permits issued to foreigners by region out of the total work permits
issued to foreigners in Spain (%)
1998
2005
0.43 – 2.00 2.01 – 4.00 4.01 – 6.00 6.01 – 10.0010.01 – 15.0015.01 – 20.0020.01 – 25.0025.01 – 28.34
IMMIGRATION TO SPAIN: POLICIES AND FACTS 43
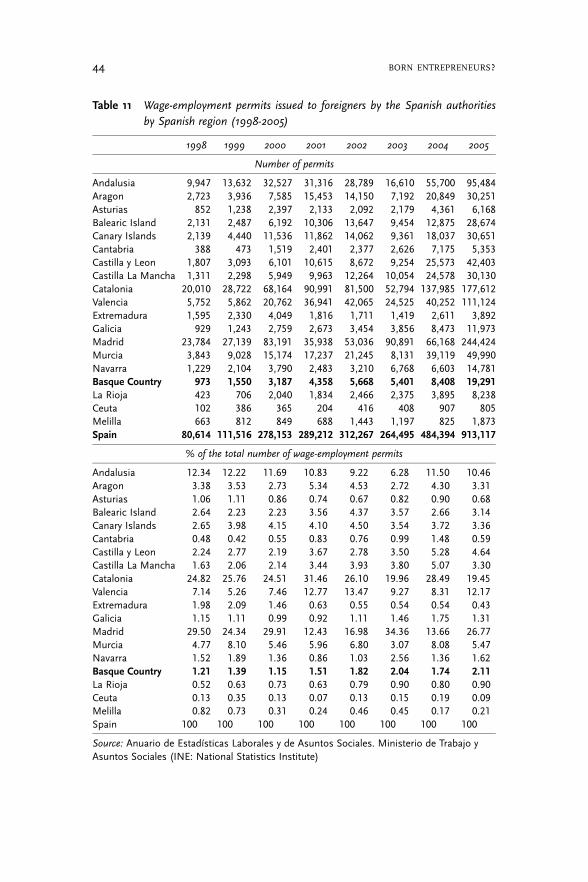
Table 11 Wage-employment permits issued to foreigners by the Spanish authorities
by Spanish region (1998-2005)
1998 1999 2000 2001 2002 2003 2004 2005
Number of permits
Andalusia 9,947 13,632 32,527 31,316 28,789 16,610 55,700 95,484Aragon 2,723 3,936 7,585 15,453 14,150 7,192 20,849 30,251Asturias 852 1,238 2,397 2,133 2,092 2,179 4,361 6,168Balearic Island 2,131 2,487 6,192 10,306 13,647 9,454 12,875 28,674Canary Islands 2,139 4,440 11,536 11,862 14,062 9,361 18,037 30,651Cantabria 388 473 1,519 2,401 2,377 2,626 7,175 5,353Castilla y Leon 1,807 3,093 6,101 10,615 8,672 9,254 25,573 42,403Castilla La Mancha 1,311 2,298 5,949 9,963 12,264 10,054 24,578 30,130Catalonia 20,010 28,722 68,164 90,991 81,500 52,794 137,985 177,612Valencia 5,752 5,862 20,762 36,941 42,065 24,525 40,252 111,124Extremadura 1,595 2,330 4,049 1,816 1,711 1,419 2,611 3,892Galicia 929 1,243 2,759 2,673 3,454 3,856 8,473 11,973Madrid 23,784 27,139 83,191 35,938 53,036 90,891 66,168 244,424Murcia 3,843 9,028 15,174 17,237 21,245 8,131 39,119 49,990Navarra 1,229 2,104 3,790 2,483 3,210 6,768 6,603 14,781Basque Country 973 1,550 3,187 4,358 5,668 5,401 8,408 19,291La Rioja 423 706 2,040 1,834 2,466 2,375 3,895 8,238Ceuta 102 386 365 204 416 408 907 805Melilla 663 812 849 688 1,443 1,197 825 1,873Spain 80,614 111,516 278,153 289,212 312,267 264,495 484,394 913,117
% of the total number of wage-employment permits
Andalusia 12.34 12.22 11.69 10.83 9.22 6.28 11.50 10.46Aragon 3.38 3.53 2.73 5.34 4.53 2.72 4.30 3.31Asturias 1.06 1.11 0.86 0.74 0.67 0.82 0.90 0.68Balearic Island 2.64 2.23 2.23 3.56 4.37 3.57 2.66 3.14Canary Islands 2.65 3.98 4.15 4.10 4.50 3.54 3.72 3.36Cantabria 0.48 0.42 0.55 0.83 0.76 0.99 1.48 0.59Castilla y Leon 2.24 2.77 2.19 3.67 2.78 3.50 5.28 4.64Castilla La Mancha 1.63 2.06 2.14 3.44 3.93 3.80 5.07 3.30Catalonia 24.82 25.76 24.51 31.46 26.10 19.96 28.49 19.45Valencia 7.14 5.26 7.46 12.77 13.47 9.27 8.31 12.17Extremadura 1.98 2.09 1.46 0.63 0.55 0.54 0.54 0.43Galicia 1.15 1.11 0.99 0.92 1.11 1.46 1.75 1.31Madrid 29.50 24.34 29.91 12.43 16.98 34.36 13.66 26.77Murcia 4.77 8.10 5.46 5.96 6.80 3.07 8.08 5.47Navarra 1.52 1.89 1.36 0.86 1.03 2.56 1.36 1.62Basque Country 1.21 1.39 1.15 1.51 1.82 2.04 1.74 2.11La Rioja 0.52 0.63 0.73 0.63 0.79 0.90 0.80 0.90Ceuta 0.13 0.35 0.13 0.07 0.13 0.15 0.19 0.09Melilla 0.82 0.73 0.31 0.24 0.46 0.45 0.17 0.21Spain 100 100 100 100 100 100 100 100
Source: Anuario de Estadísticas Laborales y de Asuntos Sociales. Ministerio de Trabajo yAsuntos Sociales (INE: National Statistics Institute)
44 BORN ENTREPRENEURS?
Graph 11 Wage-employment permits issued to foreigners by regions out of the total
wage-employment permits issued to foreigners in Spain (%)
1998
2005
0.43 – 2.00 2.01 – 3.00 3.01 – 4.00 4.01 – 5.00 5.01 – 10.0010.01 – 15.0015.01 – 20.0020.01 – 29.34
IMMIGRATION TO SPAIN: POLICIES AND FACTS 45

Table 12 Self-employment work permits issued to foreigners by the Spanish
authorities by Spanish region (1998-2005)
1998 1999 2000 2001 2002 2003 2004 2005
Number of permits
Andalusia 876 1,295 2,695 1,830 964 1,623 2,709 910Aragon 170 234 249 298 355 315 1,191 622Asturias 76 101 141 41 15 46 87 86Balearic Island 261 155 419 367 391 484 464 250Canary Islands 374 626 727 811 567 441 685 503Cantabria 81 116 283 156 68 95 231 135Castilla y Leon 87 159 185 135 101 250 521 408Castilla La Mancha 161 242 313 209 204 407 639 532Catalonia 864 1,692 1,550 1,847 983 970 2,174 678Valencia 761 503 1,646 1,032 502 555 1,628 1,020Extremadura 74 117 282 507 166 74 162 53Galicia 272 391 760 570 233 382 717 342Madrid 457 759 4,038 1,285 1,443 1,290 1,476 3,291Murcia 151 201 158 123 176 49 411 202Navarra 82 138 97 77 33 68 342 376Basque Country 92 160 245 123 103 155 258 245La Rioja 21 17 26 21 22 39 92 118Ceuta 1 15 22 3 9 8 40 21Melilla 32 39 126 29 11 30 59 103Spain 4,912 7,022 13,967 9,464 6,346 7,281 13,886 9,895
% of the total number of self-employment permits
Andalusia 17.83 18.44 19.30 19.34 15.19 22.29 19.51 9.20Aragon 3.46 3.33 1.78 3.15 5.59 4.33 8.58 6.29Asturias 1.55 1.44 1.01 0.43 0.24 0.63 0.63 0.87Balearic Island 5.31 2.21 3.00 3.88 6.16 6.65 3.34 2.53Canary Islands 7.61 8.91 5.21 8.57 8.93 6.06 4.93 5.08Cantabria 1.65 1.65 2.03 1.65 1.07 1.30 1.66 1.36Castilla y Leon 1.77 2.26 1.32 1.43 1.59 3.43 3.75 4.12Castilla La Mancha 3.28 3.45 2.24 2.21 3.21 5.59 4.60 5.38Catalonia 17.59 24.10 11.10 19.52 15.49 13.32 15.66 6.85Valencia 15.49 7.16 11.78 10.90 7.91 7.62 11.72 10.31Extremadura 1.51 1.67 2.02 5.36 2.62 1.02 1.17 0.54Galicia 5.54 5.57 5.44 6.02 3.67 5.25 5.16 3.46Madrid 9.30 10.81 28.91 13.58 22.74 17.72 10.63 33.26Murcia 3.07 2.86 1.13 1.30 2.77 0.67 2.96 2.04Navarra 1.67 1.97 0.69 0.81 0.52 0.93 2.46 3.80Basque Country 1.87 2.28 1.75 1.30 1.62 2.13 1.86 2.48La Rioja 0.43 0.24 0.19 0.22 0.35 0.54 0.66 1.19Ceuta 0.02 0.21 0.16 0.03 0.14 0.11 0.29 0.21Melilla 0.65 0.56 0.90 0.31 0.17 0.41 0.42 1.04Spain 100 100 100 100 100 100 100 100
Source: Anuario de Estadísticas Laborales y de Asuntos Sociales. Ministerio de Trabajo yAsuntos Sociales (INE: National Statistics Institute)
46 BORN ENTREPRENEURS?
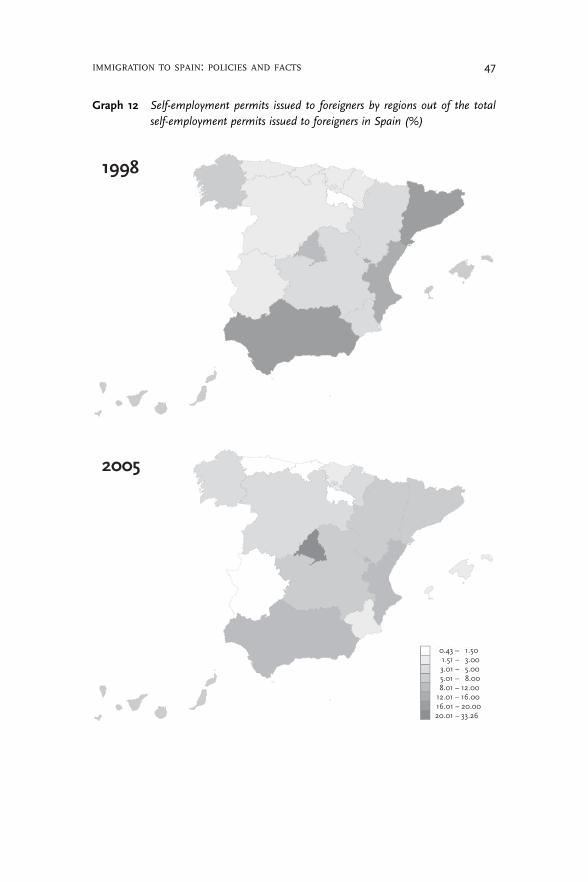
Graph 12 Self-employment permits issued to foreigners by regions out of the total
self-employment permits issued to foreigners in Spain (%)
2005
1998
0.43 – 1.50 1.51 – 3.00 3.01 – 5.00 5.01 – 8.00 8.01 – 12.0012.01 – 16.0016.01 – 20.0020.01 – 33.26
IMMIGRATION TO SPAIN: POLICIES AND FACTS 47
Madrid and the Mediterranean basin (i.e. Catalonia, Valencia, Murciaand Andalusia) show the highest proportion of foreigners who havebeen issued with both wage- and self-employment permits.Nevertheless, the regional distribution of these permits differs in thefollowing manner: wage-employment permits were more equally dis-tributed among all regions than self-employment permits, which weremore concentrated in Madrid. As a result, despite an increase in self-employment permits issued to foreigners between 1998 and 2005, few-er of these permits were issued in proportion to the total number ofpermits issued to foreigners in Spain.
2.2 Immigration policies in Spain
The rights and responsibilities of foreigners in Spain are regulated bythe Organic Law 8/2000, a spin-off of the Organic Law 4/2000. I nextsummarise the regulations governing residence and work permits with-in this legal framework.
2.2.1 Residence permits
Article 31 of the Organic Law 8/2000 stipulates that foreigners can ob-tain a temporary residence permit, valid for 90 days to five years, inone of three ways: (1) by proving that they can earn a living and do notneed to work, (2) by holding a valid wage- or self-employment permit or(3) by qualifying for family reunification programmes.
In addition, the Spanish authorities can issue temporary residencepermits to foreigners who once had such permits but let them lapse,and to those who can prove that they have been living in Spain for aminimum of five years. Finally, humanitarian reasons and exceptionalcircumstances can also be taken into account when issuing temporaryresidence permits.
As a general rule, foreigners who have had a continuous temporarypermit for five years qualify for a permanent residence permit (article32).
When large numbers of illegal foreigners live in Spain, the govern-ment adopts extraordinary measures whereby residence permits aregranted pending proof of residency in Spain for a certain time period.Amnesties were granted in 1986, 1991, 1996, 2000 (twice) and 2005.Of the 691,000 requests processed during the last amnesty, betweenFebruary and May 2005, 572,000 were granted.
48 BORN ENTREPRENEURS?

2.2.2 Work permits
According to article 36 of the same law, foreigners who want to gain ac-cess to the Spanish labour market must: (i) be 16 years old or older, (2)hold residence and work permits and (3) hold an officially recogniseddegree, where required by professional bodies.
The national employment situation is taken into account when for-eigners apply for a work permit as salaried workers for the first time.In other words, foreigners can be employed when no other worker inSpain, either Spanish or a foreigner with a work permit, is availableand qualified to do the work. This initial work permit is valid for a max-imum of five years and limits the applicant to a particular geographicalarea and a specific industry sector. The permit can be renewed underthe conditions listed in article 38 of the Organic Law 8/2000.
Moreover, the Spanish government forecasts an annual quota of jobsnot likely to be filled by the Spanish population and opens up positions,not to foreigners already in Spain, but to outsiders. The government de-cides on the number and the descriptions of available jobs. The annualquota represents less than 30 per cent of the work permits issued an-nually (Villena 2004).
The national employment situation is not taken into account in thefollowing three cases: (1) foreigners who come from countries exemptedfrom the work permit requirement via international agreements, (2) for-eigners who live in Spain legally and (3) foreigners who do not requirevisas (article 39).
Finally, the law does not specify requirements for those foreignerswho wish to start up a business. Article 37 states that (i) foreignersmust fulfill the same requirements as the Spanish-born for starting upand running a business; and (ii) they must prove that they have appliedfor the appropriate work permits. There are three types of self-employ-ment work permits for foreigners who wish to run a business in Spain:(1) the initial ‘D’ work permit allows foreigners to run a business eitherin a particular sector of activity or in a certain geographical area and itis valid for one year; (2) the renewed ‘D’ work permit is issued to for-eigners who wish to prolong their entrepreneurial activity. This permitis valid for two years and firms can be located anywhere in Spain; (3)the ‘E’ work permit is made available to foreigners who wish to prolongtheir entrepreneurial activity after the ‘renewed ‘D’ permit under thesame conditions as for the ‘renewed ‘D’ permit.
IMMIGRATION TO SPAIN: POLICIES AND FACTS 49


Part II: Theoretical discussion


3 Literature review
Over the last decades the proliferation of entrepreneurial activities ofimmigrants in European countries has been driven by increasing immi-gration from economically less developed countries. The emergenceand growing presence of immigrants’ businesses and the so-calledethnic economies in Canada, the UK and the US and, more recently, inother Western European countries (i.e. France, Germany, theNetherlands), have led to important advances in the research on ethnicand immigrant entrepreneurship (Light 1972, 1979, 1990, 1993;Bonacich 1973, 1987; Portes 1986, 1989, 1990; Aldrich and Waldinger1990; Waldinger et al. 1990; Bates 1997; Rath 2000, 2002; Rath andKloosterman 2000; Constant and Zimmermann 2004; Zimmermannet al. 2003, 2006). Nevertheless, the entrepreneurial activity of immi-grants has not been sufficiently explored in countries where increasedimmigration is a more recent phenomena, including Mediterraneancountries such as Spain. Moreover, whereas the propensity of immi-grants for self-employment has been analysed, little is known about theongoing development of these initiatives.
This dissertation aims to fill these gaps in the literature by analysingthe entrepreneurial activity of immigrants in Spain both before andafter start-up. While the first part of the literature review analyses thepropensity of immigrants to engage in entrepreneurial activities inSpain, the second and third parts focus on the performance of immi-grants’ businesses. More specifically, in the second part I present anoverview of the factors associated with firm survival, whereas in thethird one I discuss the economic benefits immigrants’ may obtain fromself-employment. The theoretical part ends with a review of the con-cepts ethnic and immigrant entrepreneurship.
I draw on human capital, social cognition and spatial economic the-ories as well as on studies on immigrant entrepreneurship to overviewthe literature on the determinants of self-employment, firm-survivaland the economic benefits of self-employment for immigrants.
3.1 Determinants of immigrants’ self-employment
To date, most studies on immigrant entrepreneurship have explainedthe existence of inter-group differences in entrepreneurial activity by cul-tural characteristics and the access to the host society’s bundle of oppor-tunities available to each immigrant group (Light 1972; Aldrich andWaldinger 1990; Butler and Herring 1991; Clark and Drinkwater 1998;Hammarstedt 2001; Constant et al. 2003; Levie 2007). In the majorityof these studies it is implied that individuals who belong to a particularethnic group constitute a homogeneous entity. Thus, the internal hetero-geneity perhaps present among individuals of the same group, such asthe differences derived from human capital endowments, are not takeninto account. With a few exceptions (Bearse 1982; Bates 1997; Constantand Zimmerman 2004; Levie 2007), the influence of individual attri-butes on their decision to start a firm has not been empirically tested. Ina previous empirical study carried out in Spain, I found that immigrantindividuals are more likely to intend to create a firm than native indivi-duals (Irastorza and Peña 2007). Nevertheless, I acknowledge that an in-dividual may show intent to create a new venture, but not succeed in theactual realisation of the venture – and this may happen for different rea-sons. For instance, the potential entrepreneur may give up on her origi-nal idea due to the emergence of new opportunities (i.e. more attractiveemployment opportunities) during the course of planning the firm start-up phase. Or alternatively, the potential entrepreneur may find obstacles,rather than opportunities, during this ex-ante period, which deter the en-trepreneur from starting a new business (i.e. obstacles associated withthe difficulties in raising funds, complex paperwork requirements, laterecognition of an insufficient ability to start-up and run a new firm,etc.). This second type of deterrents seems to be more widespread in theimmigrant community, since they often face additional obstacles asso-ciated with the liability of foreignness (Irastorza and Peña 2006).
This dissertation aims at extending that previous empirical study onpotential immigrant entrepreneurs in two ways: first, by testing whetherimmigrants are relatively more prone than native individuals to start upfirms and, second, by comparing factors linked to potential and actualentrepreneurial activities for immigrants and native individuals. In par-ticular, I pose the following research questions:
(1) Does the origin of an individual (i.e. immigrant versus native) affect thelikelihood of being a potential entrepreneur? And similarly, does the originof an individual (i.e. immigrant versus native) affect the likelihood ofbeing an actual entrepreneur?
(2) Are there differences in the intent and the actual switch to become entre-preneurs among immigrants by place of origin?
54 BORN ENTREPRENEURS?
(3) Does the intra-regional context of the host economy affect the intent orthe actual switch of individuals to become entrepreneurs?
(4) Do the determinants for immigrants’ self-employment differ from thoseof native individuals?
The theoretical framework of the first part of the literature review isbased upon the works by Bearse (1982) and Wagner and Sternberg(2004) who differentiate between two major sets of determinants: indi-vidual- and context-related factors. On the one hand, I consider humancapital endowment, socio-demographic characteristics and perceptualvariables as individual-related factors to explain both the intent to be-come and the act of becoming an entrepreneur. On the other hand,context-related factors include individuals’ culture of origin as well asenvironmental factors of the host society.
3.1.1 Individual-related factors
Conventional wisdom suggests that human capital factors such as age,education, work experience and business skills play a role in the deci-sion to start a firm. Mature individuals as well as those with entrepre-neurial experience are more likely to create a new firm (Butler andHerring 1991; Bates 1997; Mata and Pendakur 1999; Arenius andMinniti 2005; Levie 2007). I expect that mature people accumulate hu-man capital and, eventually, personal savings to start their own busi-ness. The longer the period of time spent by an immigrant in the hosteconomy, the higher the probability of becoming familiar with the localsystem and economy. However, the empirical evidence is not conclusiveon this regard. While some studies confirm a positive relationship be-tween the number of years spent in the host country and the probabilityto start up a firm (Razin 1999; Hammarstedt 2001, 2004; Schuetze2005), other authors conclude the opposite (Hjerm 2004), or do notfind a significant effect (Bauder 2005). A consensus has not yet beenreached about the effect of education on the propensity to self-employ-ment. Some studies find that highly educated people are more likely tocreate firms (Evans 1989; Razin 1999; Bates 1997) whereas others showthe opposite (Mata and Pendakur 1999; Hammarstedt 2001, 2004).
Bates (1997) examined firm creation rates in various industry sectorsand concluded that, while individuals with advanced education weremore likely to start up firms demanding a highly skilled labour force inthe service sector, individuals with low education levels were more likelyto create a firm in the construction sector. People who take the risk tomigrate often have an above-average level of education in their owncountries. Moreover, immigrants need to develop additional skills to
LITERATURE REVIEW 55
create and run successfully a new business in a foreign country. I sum-marise the findings of the literature in the following proposition:
Proposition 1: Individuals with more diverse and richer human capital endowmentare more likely to start up new firms.
The country of origin, gender and personal income are socio-demographic characteristics that may affect the decision to start a firm.Although results are not conclusive in this respect, empirical evidenceshows that men are more likely to create companies than women(Butler and Herring 1991; Bates 1995; Verheul et al. 2006; Levie 2007).Kofman et al. (2005) argue that, since unemployment levels are higherfor immigrant women than for men and this is also true for native wo-men in most economies, they resort to entrepreneurship as a means toearn money. Nonetheless, immigrant women often remain in suppor-tive roles in small businesses, rather than own them. Thus, consideringtoday’s social pattern, I expect that men will be more likely to createnew firms than women, particularly in the immigrant community.
Interestingly, studies on immigrant entrepreneurship suggest thatimmigrants are relatively more likely to become self-employed than na-tive individuals (Hammarstedt 2001; Schuetze 2005; Levie 2007). Risk-taking behaviour is one of the most salient characteristics of entrepre-neurs. Immigrants not only bear risk in leaving their home country, butthey also try to make a living by starting up a new firm in an unknownhost economy. Zimmermann et al. (2003) argue that the option to be-come an entrepreneur might be linked to the decision to migrate fromtheir home countries. In both cases, individuals seek self-realisation fa-cing an uncertain future, and bear risk by giving up their status in theircountry of origin.
From another point of view, the disadvantage hypothesis (Light 1972;1979) holds that immigrants choose self-employment as an alternativeto unemployment and non-satisfactory job conditions. In other words,entrepreneurial activity becomes an avenue for the socioeconomic ad-vancement of the disadvantaged (Constant et al. 2003; Constant andZimmermann 2004; Bauder 2005). Thus, I assume that a reasonableamount of individuals who belong to low-income segments of the popu-lation and have no easy access to the labour market will find self-employment as a logical alternative for their subsistence (necessity-drivenentrepreneurs). Most economies show a larger size of this segmentamong the immigrant population than among the native population.Therefore, it would not be surprising to expect a relatively higher intentlevel, and also realisation of self-employment among immigrants thanamong native individuals. This leads me to postulate the following:
56 BORN ENTREPRENEURS?
Proposition 2: Immigrants are more likely to become entrepreneurs than nativeindividuals.
Entrepreneurial cognitions are mental processes through which indivi-duals evaluate the decision to start a firm (Mitchell et al. 2002b).Arenius and Minniti (2005) found that decision-making processes ofnascent entrepreneurs are based on subjective perceptions rather thanon objective expectations of success. Therefore, it is pertinent to includeperceptual variables in my conceptual framework.
Entrepreneurial cognitions involve the evaluation of self-efficiency,risk perception as well as opportunity recognition. Empirical studiesshow that risk tolerance leads to a higher preference for self-employment, whereas fear of failure is found to have the opposite effect(Lee, Wong and Ho 2005; Arenius and Minniti 2005; Verheul et al.2006; Levie 2007). A high self-perception of entrepreneurial abilitiesand skills has a positive effect on firm creation (Mitchell et al. 2000;Lee, Wong and Ho 2005; Arenius and Minniti 2005; Levie 2007).Social cognition theory holds that human behaviour, cognition and theenvironment influence one another (Wood and Bandura 1989). A sig-nificant change in contextual factors is expected to have a correspond-ing shift in individuals’ cognition and behaviour (Corbett and Neck2007). Accordingly, Levie (2007) holds that the perception of good en-trepreneurial opportunities in the local economy positively affects thechoice to start up a firm. I summarise these findings as follows:
Proposition 3: Individuals’ positive perception of self-efficiency, risk tolerance andopportunities available in the local economy increase the likelihood of firmcreation.
3.1.2 Context-related factors
Cultural factors pertaining to immigrants’ country of origin and envir-onmental factors in the host country may contribute to the motivationand the decision to create a company. According to the social cognitiontheory, individuals learn from the environment in which they developtheir knowledge and skills by interacting with others in that context(Wood and Bandura 1989). The entrepreneurial attitude and behaviourembedded in the environment should thus influence the desire andpropensity of immigrants for firm creation. Studies show that cross-country idiosyncrasies affect entrepreneurial cognition and the propen-sity for venture creation (Busenitz and Lau 1996; Mitchell et al. 2000;Mitchell et al. 2002a; Uhlaner and Thurik 2003).
LITERATURE REVIEW 57

I should note that immigrants bring their own cultural backpack totheir host country; this may influence their attitude towards entrepre-neurship, particularly if the latter is highly valued in the home country.As mentioned earlier, most of the ethnic and immigrant entrepreneur-ship literature has focused on explaining inter-group differences in self-employment. The region of origin of immigrants, the ethnic group,self-employment tradition and religion are relevant factors found in theliterature which help in explaining the propensity for firm creation ofimmigrant groups (Light 1972; Aldrich and Waldinger 1990; Butler andHerring 1991; Clark and Drinkwater 1998; Hammarstedt 2001;Constant et al. 2003; Levie 2007). Based on previous studies, I posit thefollowing proposition:
Proposition 4: A country’s established entrepreneurial culture affects the likelihoodof its nationals to become entrepreneurs.
Environmental factors of the host region may also boost or hinder ven-ture creation. Spatial economics deals with the distribution and causesof geographic location of economic activities. Agglomeration econo-mies, socio-demographic factors, macroeconomic conditions and thepolitical climate may influence the decision to start up firms in a parti-cular location. A favourable habitat that nurtures young ventures is ex-pected to attract immigrant entrepreneurs.
Entrepreneurs often prefer to start up their firms in metropolitanareas due to the agglomeration economies arising in a concentratedlocation (Fotopoulos and Spence 2000; Morales and Peña 2003;Wagner and Sternberg 2004; Van Stel et al. 2006). Favourable socio-demographic factors, such as high population density and immigration,increase the demand for goods and services; in turn, these factors areexpected to increase the probability of venture creation (Reynolds et al.1995a; Rekers and Van Kempen 2000; Razin 1999; Belso Martínez2004). The effect of the unemployment rate of the host economy onfirm creation is not clear. While some studies suggest that a high un-employment rate is favourable to business start-ups (Clark andDrinkwater 1998; Wagner and Sternberg 2004), others show the oppo-site (Reynolds et al. 1995a). Reynolds et al. (1995a) explains that a highunemployment rate contributes to diminishing demand and potentialentrepreneurs are therefore discouraged to create new firms. Based onthe disadvantage hypothesis (1972), which claims that immigrants aremore likely to start up businesses because they do not have as goodchoices in the labour market, I posit that high unemployment rates in-crease the likelihood of seeking self-employment. In sum, I believe thatboth immigrant and native individuals are affected by environmental
58 BORN ENTREPRENEURS?
factors at the moment of making a decision on firm start-up. The find-ings of previous studies can be summarised in the followingproposition:
Proposition 5: Environmental factors (both economic and socio-demographic ones)have an influence on an individual’s propensity to become entrepreneurs.
In sum, the increase in migration and the emergence of a transnationaleconomy have lead to an increase in immigrant business activity. As aresult, the entrepreneurial activity of immigrants is gaining the atten-tion of an increasing number of scholars. Recent findings show that im-migrants are more prone to become entrepreneurs than native people(Hammarstedt 2001; Schuetze 2005; Levie 2007). The greater entrepre-neurial propensity of immigrants has been explained from differentperspectives. On the one hand, the immigrants’ decision to create firmshas been linked to their decision to migrate. In both cases, individualsseek self-realisation while they face an uncertain future, and they takerisks by giving up their status in their country of origin or by startingup a firm. Thus, immigrants as risk takers are expected to be moreprone to entrepreneurship than natives (Constant et al. 2003). On theother hand, the disadvantage hypothesis states that entrepreneurshipemerges as an alternative to unemployment and a mechanism to over-come difficult labour market barriers for many foreigners (Light 1979).Furthermore, it has been argued that entrepreneurial activities becomean avenue for the socio-economic advancement of the disadvantaged(Constant et al. 2003; Bauder 2005).
Whereas the immigrants’ likelihood of self-employment has beenwidely studied, there are very few studies on the performance of ven-tures created by them. The next two sections of the literature reviewanalyse the success of immigrant entrepreneurs by focusing on the sur-vival of initiatives created by them (in comparison to that of natives) aswell as the income obtained by entrepreneur versus salariedimmigrants.
3.2 Determinants of immigrants’ firm survival
Since the early 1980s, the destination of immigration in Europe haschanged from central and northern countries to the Mediterranean ba-sin. As a result, the immigration rates to southern European countrieshave increased substantially. In Spain, the percentage of documentedforeigners as a percent of the total population has grown from 1.8 percent in 1998 to 10 per cent in 2008. Economic integration is one of the
LITERATURE REVIEW 59
main objectives of immigrants to Europe. Due to high unemploymentrates, it is difficult to find a satisfactory job in Europe. The difficultiesexperienced by foreigners looking for employment are magnified sincethey have to deal with an additional liability of foreignness. Within thiscontext, entrepreneurship emerges as an alternative to unemploymentand a mechanism to overcome difficult labour market barriers for manyforeigners.
The literature on ethnic and immigrant entrepreneurship has focusedon examining the reasons that motivate foreign entrepreneurs to startup firms (Levie 2005; Schuetze 2005; Basu and Altinay 2002; Bates1997; Ward and Jenkins 1984). However, little is known about whathappens once a new venture is started-up by an immigrant. With a fewexceptions (Constant and Zimmermann 2004; Zimmermann et al.2006, 2003; Hammarstedt 2001), scholars have not paid much atten-tion to the study of venture performance by foreign entrepreneurs. Asfar as I know, only one author (Fertala 2004) has examined the survivalof foreign-owned firms. She concludes that native-owned firms survivelonger than foreign-owned but she could not find the reasons behindthis gap.
This dissertation aims to fill this gap in the literature by an analysisof the survival of foreign- and native-owned ventures, possible differ-ences and their determinants in the northern Spanish region of theBasque Country. I selected this geographical area for two reasons: (i)the higher percentage of foreigners registered as self-employed with thedepartment of Social Security (10.8 versus 9 per cent for Spain inJanuary 2007) even though the foreign population has traditionallybeen much smaller than that of Spain (4.6 per cent compared toSpain’s 9.9 per cent in January 2007); and (ii) the availability of data.
In sum, the purpose of this study is to analyse venture survival of for-eign and native entrepreneurs. Due to data limitations, I selected a sam-ple involving all the firms created in the Basque Country between years1993 and 2003 under the legal form of sole proprietor firms, i.e. com-panies started by one entrepreneur.
More precisely, I attempt to answer the following central questionsrelated to the likelihood of survival of firms operating in the BasqueCountry:
(5) Are ventures created by foreign entrepreneurs more or less likely to sur-vive than those started by native entrepreneurs?
(6) Are the determinants of business survival of native entrepreneurs simi-lar to those attributed to foreign entrepreneurs?
(7) If there is a gap in survival between native-owned versus foreign-ownedfirms, how can it be explained? Is the any liability of foreignness em-bedded in the entrepreneurial process of immigrant entrepreneurs?
60 BORN ENTREPRENEURS?

In order to answer these questions, firms’ internal characteristics –human capital and individual attributes of entrepreneurs and firm re-sources and strategies – as well as environmental factors – such as in-dustry specific characteristics, firm location and macroeconomic condi-tions – are analysed in the second part of the literature review. The lit-erature on immigrant entrepreneurship includes very few studies onfirm survival. Hence, I have to appeal to the general entrepreneurshipliterature in order to build a conceptual framework, construct a modeland derive my hypotheses.
This section of the literature review is divided into two parts. The firstpart features an examination of the effect of entrepreneurs’ origin (for-eign versus native) on business survival as a background to my researchquestions 5 and 6. The second part deals with the literature on determi-nants of business survival that I will relate to my research question 7.
3.2.1 The liability of foreignness on venture survival
Few studies have analysed venture success of foreign entrepreneurs.Fertala (2004) reports that the immigrant status is negatively associatedwith venture survival. She analyses to what extent the initial investmentin both human capital (as measured by age) and social capital (under-stood as networking ability) of entrepreneurs contribute to the perfor-mance of immigrant versus native entrepreneurs in Upper Bavaria. Sheconcludes that differences in venture survival between immigrant andnative entrepreneurs cannot be explained solely by differences in hu-man capital attributes as measured by age nor by human and social ca-pital investments, but does not suggest other possible determinants.
An alternative explanation to firm survival differences between nativeand immigrant entrepreneurs could be the liability of foreignness.Stinchcombe (1965) coined the concept of liability of newness in order toexplain the vulnerability of organisations in the start-up stage charac-terised by small size and limited financial as well as human capital re-sources. I argue that this liability of newness could be applied to bothentrepreneurs and wage workers, and that it is magnified in the case ofimmigrants who also have to face what I call the liability of foreignness,i.e. additional barriers such as poor language skills, the lack of labourexperience and human capital attributes required in the host country,and discrimination.
It has been argued that the composition of immigrant entrepreneursfrom less-developed countries, in terms of their human, financial, socialand cultural capital, is different from that of the native population andthat this is the main reason why they mainly enter industries that usual-ly require small outlays of capital and low levels of education(Kloosterman and Rath 2001). Solé and Parella (2005) define the
LITERATURE REVIEW 61
additional obstacles faced by immigrant entrepreneurs as they startbusinesses in Catalonia as follows: initial financial difficulties due to ashortage of savings and limited access to formal credit institutions, dif-ficulties in obtaining a work permit, the suspiciousness of native peopletowards firms created by immigrants and the abusive prize of premisesthey are asked to paid in comparison to natives.
Thus, based on the immigrant entrepreneurship literature, I state thefollowing proposition:
Proposition 6: Firms started by native entrepreneurs survive longer than those cre-ated by immigrants. The differences in venture survival between immigrant versuslocal entrepreneurs can be explained by the disadvantaged situation they find atrunning a business in a foreign country.
3.2.2 Determinants of venture survival
Factors affecting venture performance can be grouped in various ways.I propose a conceptual framework following the line of thinking devel-oped by Gimeno et al. (1997) and Schutjens and Wever (2000). Thisframework includes internal and external characteristics of the new ven-ture. On the one hand, I include the entrepreneurs’ human capital en-dowment and organisational resource-strategy factors as firm-internalfactors to explain venture survival. On the other hand, firm-external fac-tors relate to agglomeration economies are expected to influence newbusiness longevity.
Conventional wisdom suggests that human capital factors as well aspersonal characteristics such as education, experience, age and the gen-der of entrepreneurs affect venture success. Older, more educated andexperienced entrepreneurs are expected to perform better than younger,less educated and experienced entrepreneurs (Bates 1997; Schutjensand Wever 2000; Fertala 2004, Arias et al. 2004).
Given the limitations of my database and based on past studies onentrepreneurs’ human capital (Zacharaskis 1999; Honing 2001; Peña2002) and on ethnic entrepreneurship (Light 1984; Aldrich andWaldinger 1990; Mata and Pendakur 1999), I will consider the age andthe gender of entrepreneurs as person-related factors that affect busi-ness performance.
Most studies show that older entrepreneurs perform better than theiryounger counterparts (Cooper et al. 1989; Stuart and Abetti 1990;Constant and Zimmermann 2004). Older entrepreneurs usually havemore experience, and this positively affects venture performance. Insum, older foreign entrepreneurs are likely to accumulate more experi-ence and human capital attributes.
62 BORN ENTREPRENEURS?

The effect of gender of entrepreneurs on the success of ventures is am-biguous. While some studies show that women entrepreneurs build upless successful companies (Carvajal 2004), others show the opposite out-come (Lerner 1997; Baycan Levent et al. 2003; Fertala 2004). Moreover,Boden and Nucci (2000) found that the financial and human capital ac-quired by entrepreneurs in previous wage employment affect the successof firms, but that female entrepreneurs were at a disadvantage due to: (i)their lower average wage earnings and greater initial financial con-straints; (ii) the fact that women are less likely than men to have any priormanagerial experience; and (iii) the fact that women usually have feweryears of prior paid employment experience and therefore acquire lessvaluable human capital during wage employment. Conscious of the dualdiscrimination suffered by immigrant women entrepreneurs in a foreignand usually male-dominated market, I state that firms created by themdo not survive as long as those created by male immigrants.
Based on these studies of individual characteristics of entrepreneurs,I formulate this proposition:
Proposition 7: Firms created by more experienced and male entrepreneurs survivelonger than those started by their counterparts.
The resource-based view of competitive advantage states that organisa-tional resources and strategies serve to explain business survival. Thebasic assumption here is that resources and capabilities can be hetero-geneously distributed across competing firms, these differences can belong-lasting and they can help to explain why some firms outperformother firms (Barney 2001). The resources and capabilities of firms in-clude all the financial, physical, human and organisational assets theyuse to develop, manufacture and deliver products to their customers(Barney 1995).
The number of employees as well as their qualification and abilitiesconstitute the human resources of the firm. The number of employeesor the size of firms may influence their survival. There is enough empiri-cal evidence to suggest that venture size is positively linked to survival(Mata et al. 1995; Geroski 1995; Audretsch and Mahmood 1995; Sutton1997; Zhang 1999; Segarra and Callejón 2002). Since I am only analys-ing firms created by a single person, my sample is composed only ofsmall firms. To be exact, 93 and 96 per cent of the firms created by for-eign and native entrepreneurs, respectively, in the Basque Countrystarted with 0, 1 or 2 employees. I expect that the small size of the firmsthat constitute my sample have a negative effect on their survival.
The ethnic and immigrant entrepreneurship literature suggests, how-ever, that immigrant entrepreneurs often have family and co-ethnic
LITERATURE REVIEW 63

labour working without any formal contract. Certainly, the supportiverole of the family and, specially, of wives can be key competitive factorsfor immigrant entrepreneurs. Kofman et al. (2005) argue that womenunderstand the firm as a family and, thus, often remain in supportiverolls in small businesses. Ward and Jenkins (1984) suggested that em-ploying relatives and other community members might be a key compe-titive advantage for immigrant entrepreneurs. However, since my datais limited to formally employed labour, it is important to remember thatnon-formally recognised employees may be absent from the dataset.
Due to the liability inherent in being new, firms face risks in the in-itial stage of their development. In order to overcome initial difficultiesand to gain a competitive edge, firms employ different strategies.Nicholls-Nixon et al. (2000) propose the concept of ‘strategic experi-mentation’ defined as ‘a series of trial and error changes pursued alongvarious dimensions of strategy, over a relatively short period of time, inan effort to identify and establish a viable basis for competing’(Nicholls-Nixon et al. 2000: 496). They highlight environmental dyna-mism, uncertainty and hostility as factors that can affect organisationalstress. Dynamism refers to the continuous environmental changes thatcharacterised present-day markets. Environmental uncertainty concernsthe inability of firms to predict the impact of these environmentalchanges and to determine the available response options as well as theirconsequences. Nicholls-Nixon et al. (2000) add that dynamism and un-certainty can create both difficulties and opportunities by generatingnew possibilities for venture performance. It has been stated that busi-ness strategies involving mobility positively affect business success(Stearns et al. 1995). Based on this hypothesis, I argue that geographicalmobility may mitigate the impact of an uncertain and non-favourableenvironment and offer a new source of opportunity in a new location.Finally, environmental hostility refers to the threat that arises as a resultof the level of competition and volatility of the firms’ principal industry.I propose industry diversification as a possible experimentation strategyfor overcoming the environmental hostility.
Based on previous findings on the effect of firm-related factors onventure survival, I formulate my next proposition as follows:
Proposition 8: Firms’ resources and strategies affect venture survival. Firms with alarger initial size and those which apply experimental adaptation strategies survivelonger than those started with a smaller size.
Not only firms’ internal factors but environmental variables may alsoextend or shorten venture survival. The influence of external factors onventure performance has been widely studied in the entrepreneurship
64 BORN ENTREPRENEURS?

literature. Rekers and Van Kempen (2000) suggested that the spatialcontext has an effect on the start of ethnic enterprises: economic devel-opment – such as agglomeration effects, unemployment, subcontract-ing, and size of firms – the composition of the population of an area,the urban environment measured by the availability of premises, and lo-cal policy are the most significant influences on firm performance.They pointed out that these factors were not specific to ethnic entrepre-neurs, but that they affected potential entrepreneurs in general.
Audretsch et al. (1999) suggested that external factors faced by firms,such as industry characteristics or characteristics inherent to the localregion are important to understand venture performance. Rath (2002)claimed the need of taking into account the dynamics of socio-economicfactors in the study of the entrepreneurial activity of immigrants. Basedon previous studies on agglomeration economies and immigrant entre-preneurship, I suggest socio-economic variables such as regional unem-ployment and immigrations rates, the location of a firm in an urbanversus a rural environment and the particularities of industry sectors asfactors that may affect firm survival.
The industrial sector in which the company operates may have an in-fluence on venture survival. Aldrich and Waldinger (1990) argue thatimmigrant entrepreneurs often operate in marginal, post-industrial,segmented or exotic markets, where the barriers to entry are relativelylow and, consequently, the degree of competition is high. A generallyaccepted indicator to measure the intensity of competition and marketturbulence of an industry is the annual entry rate. Segarra and Callejón(2002) define the term ‘market turbulence’ as the sum of the rates ofgross entry and gross exit and affirm that the rates of entry are highlycorrelated with hazard rates across industries. Surprisingly, they foundthat the likelihood of venture survival was positively correlated withhigher entry rates, while other empirical studies (Audretsch et al. 2000;Fritsch et al. 2006) conclude the opposite.
I consider the industry entry rate as possibly being either an indicatorof low entry barriers or of the attractiveness and good health of an in-dustry. In both cases the competition is expected to be high but the ef-fect of higher entry rates on venture survival could vary depending onthe motivation (low barriers versus good health) of entering a specificindustry sector, with survival of firms starting in an industry sector dueto its low entry barriers expecting to be lower.
Besides, industry specific entry rates and the consequent marketrivalry are not the only possible determinants of market turbulence and,thus, market entry rates could not explain, by themselves, the likelihoodof survival of firms operating in specific industry sectors. The particulardynamic of certain industry sectors, such as construction – where fre-quently the life of the firm coincides with the duration of each project
LITERATURE REVIEW 65

and the subcontracting of self-employed is the common rule – capitalconstraints, etc., could be alternative explanatory factors behind marketturbulence non-explainable by market entry rates. Given these built-inlimitations on firm endurance, I will explore the effect of industry-specific market exit as an additional indicator of market turbulence onventure survival.
In the Basque Country, 75 and 71 per cent of foreign and native sin-gle entrepreneurs respectively operate in the construction, retail, hoteland catering and business services sectors, where the barriers to entryare low and competition and market turbulence greatest (see market en-try, exit and turbulence rates in Appendix 2). I expect that operating inthese industry sectors will have a negative effect on firm survival.
Empirical evidence suggests that geographical location could influ-ence the performance of firms. Holt (1987) listed some factors thatcould influence venture location: logistics and transport facilities, pat-terns of venture success or failure of an area, predisposition of banksand financial institutions, commercial disposal and subcontractor ser-vices, fabrication and suppliers. In this respect, it has been argued thatthe selection of an urban, rural or peripheral geographical area and theproximity of clients, suppliers and competitors can influence the suc-cess of the company (Stearns et al. 1995; Littunen 2000; Peña 2004).Razin (1999) maintained that locating firms in large metropolitan areasincreased the main earnings of immigrant entrepreneurs.
The socio-demographic composition of an area, and especially thesize of the immigrant population where the company is located, mightalso affect the success of immigrant entrepreneurs (Bull and Winter1991; Rekers and Van Kempen 2000; Fertala 2004). First, a lively com-mercial enclave with a high concentration of immigrant entrepreneurswith their own commercial networks can bring together co-ethnics look-ing for products from their places of origin; second, the enclave canconstitute an attraction for those individuals who, not belonging to thesame ethnic group, demand products that they perceive as different oreven exotic. In sum, locating a firm in an area with a large populationof immigrants would attract more clients and, thus, increase the likeli-hood of firm survival for immigrant entrepreneurs.
Finally, the macroeconomic environment in which the company iscreated affects the probability of its success. Specifically, the regionalunemployment rate may affect firm survival. Constant andZimmermann (2004) found that earnings of immigrants decreased forthose who lived in areas where the unemployment rate was high.Audretsch and Mahmood (1995) concluded that a high unemploymentrate had a negative effect on the likelihood of survival of new entrants.On the one hand, a high unemployment rate is symptomatic of a weakeconomy; on the other hand, entrepreneurship may emerge as an
66 BORN ENTREPRENEURS?

alternative to unemployment or non-satisfactory work conditions. Inother words, immigrants start businesses when they are less likely tosucceed: during an unfavourable economic cycle, when resources arescarce and their decision necessity-driven (Constant and Zimmermann2004).
Based on previous empirical findings on the effect of environmentalfactors on venture survival, I pose the last proposition of this section asfollows:
Proposition 9: Environmental factors (industry-related, economic and socio-demographic) have an influence on venture survival.
The first part of the literature review analyses the likelihood of immi-grants to become self-employed, whereas the second and third parts fo-cus on the performance of these initiatives. More specifically, in thissection I reviewed the literature on business survival and I posit thatdue to the liability of foreignness faced by immigrants, foreign-ownedfirms do not survive as long as native-owned ones. However, survival isnot the only indicator of the success of a business. The profitability of afirm is another way of measuring a firm’s success. Hence, in the thirdpart of the literature review I extend the study of the performance offoreign-owned businesses by comparing the earnings of entrepreneurimmigrants to those obtained by salaried immigrants.
3.3 Determinants of immigrants’ earnings
While the self-employment propensity of immigrants of different ori-gins is well documented, little is known about what happens to venturesstarted up by immigrants. Are earnings derived from the new ventureslarge enough to compensate for the opportunity cost of working forothers? There seems to be a consensus among scholars that opportunitycosts of becoming entrepreneurs are lower for immigrants than for na-tives; this is due to the barriers that prevent immigrants from accessingthe local labour market. Yet, the immigrant entrepreneurship literatureis not conclusive with regard to the potential greater earnings of self-employed immigrants. While some researchers claim that earningsfrom self-employment exceed salaries (Light 1984; Borjas 1986), otherssuggest the opposite (Hammarstedt 2001; Hjerm 2004).
I aim to contribute to the extant debate by analysing the determinantsof earnings of self-employed versus salaried immigrants in Spain. Thesocio-economic advancement hypothesis suggested by Constant et al.(2003) will be tested by examining the effect of entrepreneurship on
LITERATURE REVIEW 67
the earnings of immigrants. Constant et al. (2003) goes beyond the dis-advantage hypothesis when they state that entrepreneurship can be con-sidered as an avenue for immigrants’ upward mobility in the host coun-try. Specifically, I address the last set of research questions:
(8) Is there any significant difference between the earnings of self-employedand salaried immigrants?
(9) Are the explanatory factors for earnings similar for self-employed andsalaried immigrants?
Entrepreneurship has been claimed to be an alternative to overcome thesubstantial labour market barriers faced by immigrants due to their lia-bility of foreignness (i.e. additional barriers such as poor language skills,lack of work experience and human capital attributes required in thehost country, as well as discrimination). Nevertheless, the effectivenessof self-employment as a means to facilitate immigrants’ economic inte-gration is controversial. Whereas some empirical studies show a posi-tive relationship between self-employment and the earnings of immi-grants, other authors remain sceptical. Studies carried out in Germanyand the US show that the earnings of self-employed immigrants aregreater than those of salaried immigrants (Borjas 1986; Constant et al.2003). In contrast, empirical studies carried out in Sweden point to theopposite (Hammarstedt 2001; Hjerm 2004).
I believe that differences in the welfare state system and the attitudetowards discrimination across countries may influence the earnings ofself-employed and salaried immigrants. My study is conducted inSpain, where salaried immigrants often work in worse conditions thannatives. The liability of foreignness, or the additional difficulties facedby immigrants in a foreign country, slows down their incorporation intothe labour market. Considering these trends, I expect self-employmentto improve immigrants’ earnings.
Furthermore, I state that earning differences may depend on the mo-tivation of individuals to start up a firm. Empirical studies suggest thatmotivation influences business survival and growth, opportunity-drivenentrepreneurs being more likely to achieve business success than neces-sity-driven entrepreneurs (Arias et al., 2004). This is often true due tothe greater opportunity costs usually faced by opportunity-driven entre-preneurs who accordingly gain greater earnings.
Based on previous empirical studies on the origin and motivation ofentrepreneurs, I pose the following proposition:
68 BORN ENTREPRENEURS?
Proposition 10: Self-employed immigrants are likely to earn more than salaried im-migrants. Furthermore, opportunity-driven immigrant entrepreneurs are likely toearn more than their necessity-driven counterparts.
Literature on immigrant entrepreneurship has analysed human capital,socio-demographic, cultural, industry-sector and environmental factorsas predictors of entrepreneurial earnings. I believe that these factorscan be grouped according to the taxonomy suggested by Bearse (1982)and Wagner and Sternberg (2004) to analyse the determinants of firmcreation. I thus differentiate two major sets of determinants to analysethe predictors of self-employed and salaried immigrants’ earnings: indi-vidual- and context-related factors. In my conceptual framework I con-sider human capital endowment and socio-demographic characteristicsas individual-related factors, and industry sector and location variablesas context-related factors in the host society.
3.3.1 Individual-related factors
Conventional wisdom suggests that human capital attributes influencethe economic performance of individuals. A high level of education,work experience, the number of years in the host country and goodhost-language proficiency are human capital factors that increase theodds of high earnings for both self-employed and salaried immigrants.While some authors found a positive relationship between high qualifi-cations and high earnings among entrepreneur and non-entrepreneurimmigrants (Clark and Drinkwater 1998; Dávila and Mora 2002;Hjerm 2004), others did not find education to be significant (Constantet al. 2003; Hammarstedt 2004). Older individuals are expected to accu-mulate knowledge and valuable experience to launch new ventures. Theliterature on entrepreneurship shows that older entrepreneurs performbetter than their counterparts (Cooper et al. 1989; Stuart and Abetti1990; Constant and Zimmerman 2004). Work experience is also im-portant in the labour-market. In both instances, entrepreneurial andnon-entrepreneurial immigrants are expected to obtain a higher incomelevel as they accumulate experience. With rare exceptions, experience,in turn, correlates positively with age.
Socio-demographic factors such as gender, marital status and place ofbirth are also found to be predictors of earnings derived from entrepre-neurial activities and salaries of immigrants. Both the place of origin ofimmigrants and the ethnicity of non-migrant ethnic groups have beenrelated to their earnings. As shown by Hammarstedt (2001), the profileof immigrants coming from one specific country may differ dependingon the time period at which immigrants leave their country. Similarly,
LITERATURE REVIEW 69

the profile of immigrants varies across countries for the same period oftime. Moreover, several empirical studies show inter-group differencesbetween salaried immigrants’ earnings and those of immigrant entre-preneurs (Borjas 1986; Butler and Herring 1991; Hammarstedt 2001;Hjerm 2006). Although no unique pattern explains the income distri-bution of different ethnic groups, these studies suggest that immigrantsfrom socio-economically advanced countries earn more than those fromsocio-economically less advanced countries. In this case, immigrantsfrom North America and Europe who have a satisfactory living standardin their own countries are expected to maintain or improve their in-come levels when they move to Spain. Additionally, I believe that NorthAmericans and Europeans are both culturally and institutionally closerto one another than they are to Asians or Africans, and I expect thatthese immigrants’ increased familiarity with the host system will alsotranslate into better economic performance.
Based on previous studies on the effect of individual characteristicson immigrants’ earnings, I state the following proposition:
Proposition 11: Individuals with richer human capital endowments gain a higherincome than their counterparts.
3.3.2 Context-related factors
Wages vary across industry sectors and regions. Similarly, entrepre-neurs’ earnings are expected to differ depending on the type of busi-ness activity and the location of the venture. Hence, I must take into ac-count the effect of the context on the income level of both immigrantentrepreneurs and others. Context-related factors selected for my analy-sis relate to the industry sector, the firm location, and the macroeco-nomic characteristics of each Spanish region.
Constant and Zimmerman (2004) found that working in theconstruction and banking sector has a positive effect on the income ofboth immigrant entrepreneurs and salaried immigrants. Clark andDrinkwater (1998) also found that operating in the construction sectorincreases the income of the self-employed. In addition, the Salary-structure survey carried out by the Spanish Statistical Institute reportsthat the mean income for both native Spanish and immigrants in man-ufacturing is greater than that in other industry sectors (SpanishStatistical Institute 2002). Accordingly, I expect that industry sectorswill influence the earnings of immigrants, with those who work inmanufacturing and construction (i.e. transforming industries) being atan advantage.
70 BORN ENTREPRENEURS?
Firm location may also influence the earnings of both self-employedand salaried immigrants. Immigrant entrepreneurs often prefer to startup their firms in metropolitan areas due to the high density of the po-pulation – which should guarantee a greater demand for goods and ser-vices – and the agglomeration economies arising in a concentrated loca-tion. The literature on immigrant entrepreneurship shows that foreign-owned firms located in metropolitan areas perform better than those lo-cated in rural areas (Razin 1999; Hammarstedt 2004). Razin (1999) ex-plains this state of affairs by arguing that immigrants concentrate inmetropolitan areas, where the opportunity for the formation of ethnicniches is greater. The self-employed who work in these niches, wherethe demand for goods is greater, obtain greater earnings than do co-eth-nics outside the niche areas.
Other empirical studies (Clark and Drinkwater 1998; Constant andZimmerman 2004) show that macroeconomic conditions, measured byunemployment, influence the income of both self-employed and salar-ied workers. I believe that the regional GDP per capita may work as agood predictor of the earnings of self-employed and salaried immi-grants: it is reasonable to assume that immigrants who live in regionswhere the GDP per capita is above average will be more likely to earnmore, ceteris paribus. In addition, I expect that living in urban areaswill have a positive influence on the earnings of immigrants due to thegreater demand and the greater number of employment opportunitiesavailable.
Based on these studies, I pose my last proposition as follows:
Proposition 12: Environmental factors (industry-related economic and socio-demographic) have an effect on individuals’ wages.
In the first three sections of this chapter I presented and discussedfindings of previous empirical studies on the entrepreneurial motiva-tion, propensity and success of immigrants. In the concluding sectionof this chapter I will give a brief overview of the theoretical discussionon the appropriateness of labelling the entrepreneurial activity of immi-grants and members of ethnic minorities as immigrant and ethnic en-trepreneurship. Since this is an empirical dissertation, I will limit topresent the discussion in the following section and resume it in theconcluding chapter, in order to make a modest contribution based onthe empirical findings of this dissertation.
LITERATURE REVIEW 71
3.4 Ex-ante discussion of ethnic/immigrant entrepreneurship
The majority of studies on ethnic and immigrant entrepreneurship fallunder the umbrella of the ethnic and immigrant entrepreneurship litera-ture (e.g. Light 1972, 1979; Bonacich 1973, 1987; Aldrich and Waldinger1990; Waldinger et al. 1990). A large part of the ethnic and immigrantentrepreneurship literature has focused on explaining inter-group differ-ences in self-employment, often omitting the internal heterogeneitywhich may be found among individuals who belong to the same group.In addition, there is little empirical evidence about the uniqueness of theso-called ethnic and immigrant businesses as compared to those of themainstream. Moreover, it has been argued that the ethno-cultural charac-teristics of businesses owned by immigrants and members of ethnicminorities have been overstressed (Rath and Kloosterman 2000). In con-trast to the cultural approach, some researchers highlight the importanceof national and local socio-economic environments (e.g. Ram and Jones1998; Rath and Kloosterman 2000; Leung 2002). The significance ofthis idea is twofold: one the one hand, the same socio-economic contextcan affect immigrants coming from various countries with various hu-man capital attributes differently, and some immigrants may perceive op-portunities where others see constraints. The language spoken in thehost country, region or area, the presence or absence of so-called ethnicenclaves, and immigration policies designed to attract highly skilled im-migrants could exemplify this. On the other hand, and for the same rea-sons, people with the same origin and a similar profile could be success-ful in certain countries but not in others.
This empirical dissertation does not propose to start a long theoreticaldiscussion on the appropriateness of labelling the entrepreneurial activ-ity of immigrants and ethnic minorities as ethnic or immigrant entrepre-neurship. On the contrary, based on empirical findings, it aims to makea contribution to the debate. In this section the discussion is launchedand two of the literature streams on entrepreneurship are presented.
The resources theory (Light 1972; Light and Gold 2000) defines theconcept of ethnic resources as socio-cultural elements based on ethnic so-cial networks, such as marriage systems, religion, common language,credit associations, etc. Light (1972) differentiated ethnic resourcesfrom class resources, arguing that the latter are cultural and material at-tributes, such as human and financial capital, which characterise themiddle class all over the world. Nonetheless, the use of some ethnic re-sources – such as the formal or informal employment of family mem-bers in businesses, membership in alternative credit associations likethe rotary club – and the use of other social networks, is also usualamongst non-ethnic or mainstream entrepreneurs. In addition, it is im-portant to highlight that (i) not all immigrant entrepreneurs and those
72 BORN ENTREPRENEURS?
who belong to ethnic minorities make use of ethnic resources and (ii)different ethnic minorities use different ethnic resources. One couldask whether or not the classification of ethnic versus class resourcessimply translates the distinction between the resources used by ethnicminorities and those employed by the dominant groups.
In a second stream of the ethnic entrepreneurship literature, the in-teraction model, Aldrich and Waldinger (1990) claim that three groupsof factors interact in the creation of ethnic businesses: group character-istics, the opportunity structure and ethnic strategies. Group character-istics involve the human and social capital of entrepreneurs, such asmigration history, academic background and post-migratory socio-economic situation. As for ethnic resources, with the exception of mi-gration characteristics, these factors are also considered in the main-stream entrepreneurship literature as important to promote or hinderbusiness creation and venture success. The opportunity structure refersto market conditions, such as niches available to immigrants, as well asto the possibility of acquiring property. Finally, ethnic strategies arisefrom the use of ethnic resources to overcome the difficulties found inthe opportunity structure. Strategies involve the sharing of informationin public spaces where people of the same ethnic group meet(churches, ethnic associations, etc.), financial support from family,friends or co-ethnics, the employment of family members, hard work,etc. As for ethnic resources, these strategies can also apply to non-eth-nic small business owners. Once more, we could ask what makes thesestrategies ethnic: the practice or the individuals who carry out thatpractice.
In sum, these studies may simplify the diversity extant in businessesrun by immigrants and members of ethnic minorities in different ways.Firstly, they overstress the cultural component and, hence, undervalueindividual factors. Parella (2005) points out that some studies have trea-ted the entrepreneurial activity of immigrants and members of ethnicminorities as anomalous simply because firm owners were foreigners.Secondly, in these studies, immigrants and members of ethnic minori-ties all fall under the same ethnic umbrella with similar ethnic character-istics, regardless of their origin. Finally, researchers apply the term eth-nic to people who do not belong to the ethnic majority group and, thus,consider the mainstream as non-ethnic. Besides, the concept of ethnicityhas not been always used with appropriate rigor: some researchers ap-ply it to sub-national groups while others do so to whole countries. Thisis the case for the Chinese who belong to more than 50 recognised eth-nic groups but are often treated as if they all belong to only one. I willresume the discussion of the labelling of ethnic and immigrant entre-preneurship in the concluding part of the dissertation, after the mainfindings are presented.
LITERATURE REVIEW 73

4 Conceptual framework
Entrepreneurship comprises different stages: from the generation ofthe business idea and the desire to carry it out (pre-start-up stage), to itssuccessful implementation (post-start-up stage).
In this chapter I build on the literature review discussed in chapterthree to present the conceptual frameworks for my empirical studies.After presenting the general conceptual framework, which describes thestages of immigrants’ entrepreneurial processes, I show more detailedconceptual framework for each set of my empirical analyses, since thefactors affecting each part of the entrepreneurial process differ.
4.1 General conceptual framework: Stages of immigrants’entrepreneurial process
Traditionally, the literature on immigrant and ethnic entrepreneurshiphas focused on analysing inter-group differences in immigrant and eth-nic entrepreneurial activity (Light 1972; Aldrich and Waldinger 1990;Butler and Herring 1991; Clark and Drinkwater 1998). According tothese studies, cultural factors are the most significant factors affectingimmigrants’ self-employment. By contrast, there are few studies thatconsider environmental and individual factors as possible factors forimmigrants to become entrepreneurs (Bates 1997; Ram and Jones1998; Rath and Kloosterman 2000; Leung 2002; Constant andZimmerman 2004; Levie 2007).
Furthermore, whereas the majority of these studies have focused onanalysing the factors affecting immigrant self-employment, only a fewauthors (Bates 1997; Fertala 2004) have analysed the performance ofthese firms.
This dissertation aims to fill these gaps in the literature by using aconceptual framework that (i) takes into account both the pre-start-upand post-start-up stages of immigrants’ entrepreneurial process and (ii)incorporates individual-, firm- and context-related factors as possible de-terminants of business creation and success.
The general conceptual framework used to conduct the empirical partof this study is based upon the work of various other authors: Bearse

(1982), Gimeno et al. (1997), Schutjens and Wever (2000) and Wagnerand Sternberg (2004). On the one hand, Bearse (1982) and Wagner andSternberg (2004) analyse the factors affecting self-employment by divid-ing them into two major sets: individual- and context-related factors.On the other hand, Gimeno et al. (1997) and Schutjens and Wever(2000) analyse venture survival. These authors use a different taxonomywhen they classify factors affecting business survival into two differentgroups: firm-internal and firm-external factors. In this model, entrepre-neurs’ human capital and socio-demographic characteristics are classi-fied as firm-internal factors, whereas firm-external factors are equivalentto the environmental factors suggested by Bearse (1982) and Wagnerand Sternberg (2004).
I combine the work of these authors to propose a general conceptualframework for analysing the different stages (pre-start-up and post-start-up) of immigrants’ entrepreneurial process. As shown in Graph 13, thisframework examines individual-, firm- and context-related factors.Individual- and context-related factors are analysed in first stage of theprocess to explain both the intention to start a business and its imple-mentation. In the second stage, during which immigrants’ venture per-formance (i.e. firm survival and revenue) is analysed, the same twogroups of factors are considered along with a third group of factors: thecharacteristics of the established firm.
In sum, I use the taxonomy suggested by Bearse (1982) and Wagnerand Sternberg (2004) to conduct my first set of empirical analyses onthe determinants of self-employment, while I build on the work of
Graph 13 Conceptual framework: Stages of immigrants’ entrepreneurial process
PPrree--ssttaarrtt--uupp ssttaaggee
IInnddiivviidduuaall--rreellaatteedd ffaaccttoorrss
CCoonntteexxtt--rreellaatteedd ffaaccttoorrss
IInnddiivviidduuaall--rreellaatteedd ffaaccttoorrss
CCoonntteexxtt--rreellaatteedd ffaaccttoorrss
FFiirrmm--rreellaatteedd ffaaccttoorrss
PPoosstt--ssttaarrtt--uupp ssttaaggee
Intention to start up
Start up
Venture performance [survival + income]
76 BORN ENTREPRENEURS?

Gimeno et al. (1997) and Schutjens and Wever (2000) to analyse the ef-fect of firm-internal and firm-external factors on venture survival.Finally, the third empirical analysis compares economic benefits forself-employed and salaried immigrants. I tried to build a similar modelfor each sample (self-employed and salaried). Since I could only testfirms’ characteristics for the self-employed’ sample, I decided not to in-clude many firm-related variables in my models. Thus, I used the sametaxonomy as in the first empirical analysis and classified factors affect-ing immigrants’ revenues into two major groups: individual- andcontext-related factors.
A more detailed description of the conceptual framework designed toconduct each set of empirical analyses follows.
4.2 Pre-start-up stage: Likelihood of self-employment
The conceptual framework designed for the first empirical study, i.e. ananalysis of immigrants’ intention and actual likelihood to become self-employed, is built upon the works by Bearse (1982) and Wagner andSternberg (2004). These authors classify factors affecting immigrants’propensity to self-employment into two major groups: individual- andcontext-related factors.
As shown in Graph 14, I consider human capital endowment, socio-demographic characteristics and perceptual variables as individual-related factors to explain both the intent and act of becoming an entre-preneur. On the other hand, context-related factors include individuals’cultural origin as well as environmental factors of the host society.
Graph 14 Conceptual framework: Immigrants’ entrepreneurial process, pre-start-up
stage
Individual
related factors
Context-related factors
Perceptual
factors
Cultural factors
Environmental
factors
Pre-start-up
intention creation
Humancapital andsocio-demographic
CONCEPTUAL FRAMEWORK 77

4.3 Post-start-up stage: Business survival
The success of a business can be assessed in various ways. In this dis-sertation I analyse venture survival and revenue as indicators of the per-formance of firms created by immigrants (post-start-up stage).
The second set of empirical analyses compares the survival offoreign-owned and native-owned firms. To conduct this study I de-signed a conceptual framework based on the work by Schutjens andWever (2000) and Gimeno et al. (1997). This framework includes notonly individual-related and context-related factors, but also those ex-plaining an established firm’s characteristics.
According to this taxonomy, individual-related and firm-related fac-tors are classified as firm-internal factors, whereas context-related factorsare the equivalent of firm-external characteristics. As shown in Graph 15,on one hand, I include the entrepreneurs’ human capital and socio-demographic characteristics along with organisational resource-strategyas firm-internal factors to explain venture survival. On the other hand,factors related to industry sectors and agglomeration economies, whichare expected to influence new business longevity, are accounted as firmexternal.
4.4 Post-start-up stage: Economic benefits
My third set of empirical analyses aims to complement the secondstudy of the success of foreign-owned firms by comparing the earningsof self-employed and salaried immigrants. Since this study involvesboth self-employed and salaried immigrants, I decided to omit firm-related factors (in contrast to the framework used to analyse businesssurvival) in order to maintain the two samples as similar as possible.
Graph 15 Conceptual framework: Immigrants’ entrepreneurial process, post-start-up
stage. Business survival
Human capital andsocio-demographic
Resources and strategies
Industry-sector related
Environmentalfactors
Individualrelated factors
Context-related
factors
Firm-relatedfactors Fi
rm in
tern
al Firm
ext
erna
l
Post-start-up performance [firm survival]
78 BORN ENTREPRENEURS?
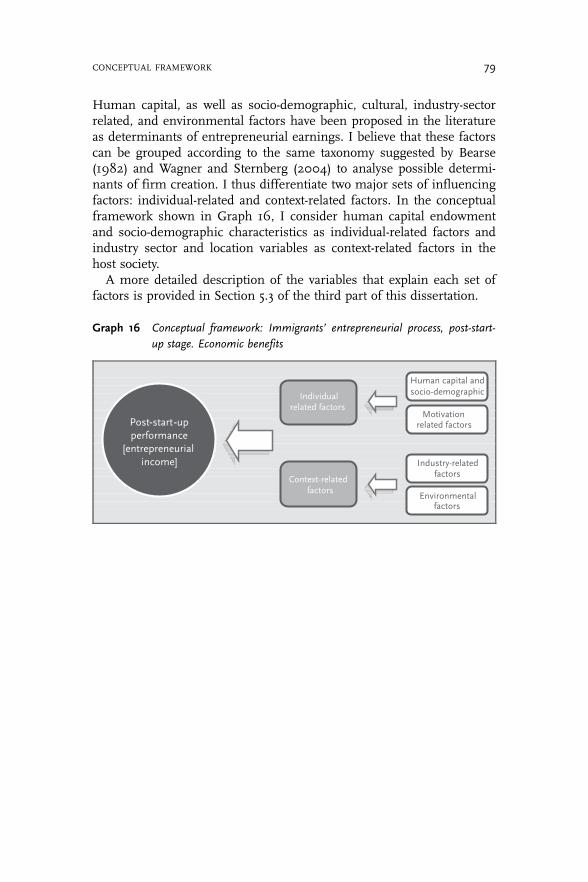
Human capital, as well as socio-demographic, cultural, industry-sectorrelated, and environmental factors have been proposed in the literatureas determinants of entrepreneurial earnings. I believe that these factorscan be grouped according to the same taxonomy suggested by Bearse(1982) and Wagner and Sternberg (2004) to analyse possible determi-nants of firm creation. I thus differentiate two major sets of influencingfactors: individual-related and context-related factors. In the conceptualframework shown in Graph 16, I consider human capital endowmentand socio-demographic characteristics as individual-related factors andindustry sector and location variables as context-related factors in thehost society.
A more detailed description of the variables that explain each set offactors is provided in Section 5.3 of the third part of this dissertation.
Graph 16 Conceptual framework: Immigrants’ entrepreneurial process, post-start-
up stage. Economic benefits
Individual
related factors
Context-related
factors
Human capital andsocio-demographic
Motivation related factors
Industry-relatedfactors
Environmental factors
Post-start-up performance
[entrepreneurial income]
CONCEPTUAL FRAMEWORK 79


Part III: Empirical study

5 Data and methodology
In this dissertation I analyse the entrepreneurial propensity and perfor-mance of immigrants. I do this by conducting three sets of empiricaltests: after assessing the prevalence of self-employment, I analyse thesuccess of immigrant enterprises through an empirical study of theirsurvival and an empirical study of the earnings of entrepreneur immi-grants. Since each of these studies requires the selection of differentdata, samples, variables and methods, the following sections are orga-nised around these three sets of empirical tests in order to better under-stand the whole analysis.
5.1 Description of the databases
The empirical study of this dissertation is conducted in two geographi-cal areas, Spain and the Basque Country, by using different databases.The selection of the geographical area corresponds mainly to the avail-ability and suitability of the data to carry out each set of the empiricaltests. On one hand, data collected by the Global EntrepreneurshipMonitor (GEM) consortium in Spain is used to analyse immigrants’likelihood of self-employment and the entrepreneurial rents obtained bythem. On the other hand, I use firm census data from 1993 to 2003provided by the Basque Statistical Institute to compare the survival offoreign-owned firms to that of native-owned ones. Being a census, thisdatabase allows me to follow the development of each firm year by year,which I could not do with the GEM cross-section data.
Data from GEM have been used to conduct two of the three sets ofempirical tests. The GEM research programme is an annual assessmentof the national level of entrepreneurial activity. Based on a harmonisedassessment of the level of national entrepreneurial activity for all partici-pating countries, the programme aims to explore of the role of entrepre-neurship in national economic growth. The study was initiated in 1999in ten countries and currently over 40 countries from all over the worldparticipate in this project. Data collection for the GEM project is basedon telephone surveys of representative samples of the adult populationof each country. Thus, GEM data involves entrepreneur, non-
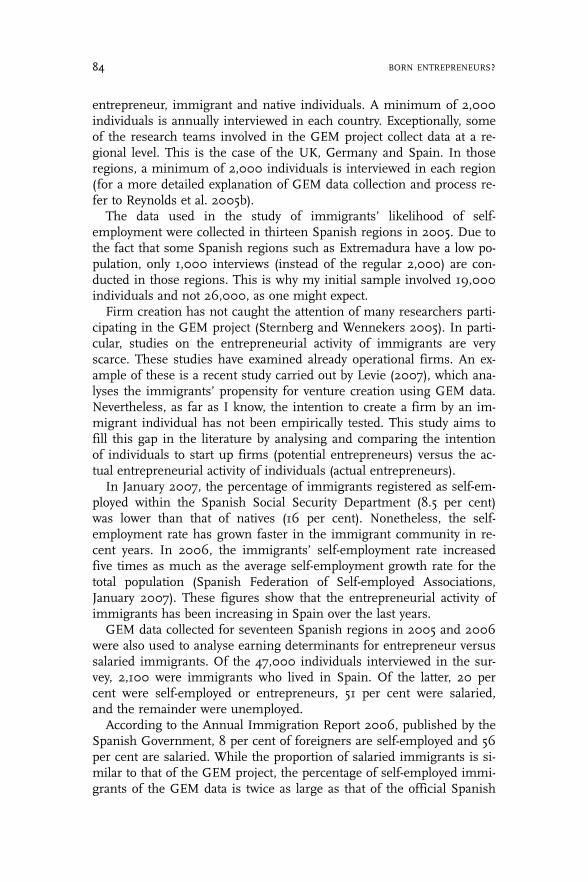
entrepreneur, immigrant and native individuals. A minimum of 2,000individuals is annually interviewed in each country. Exceptionally, someof the research teams involved in the GEM project collect data at a re-gional level. This is the case of the UK, Germany and Spain. In thoseregions, a minimum of 2,000 individuals is interviewed in each region(for a more detailed explanation of GEM data collection and process re-fer to Reynolds et al. 2005b).
The data used in the study of immigrants’ likelihood of self-employment were collected in thirteen Spanish regions in 2005. Due tothe fact that some Spanish regions such as Extremadura have a low po-pulation, only 1,000 interviews (instead of the regular 2,000) are con-ducted in those regions. This is why my initial sample involved 19,000individuals and not 26,000, as one might expect.
Firm creation has not caught the attention of many researchers parti-cipating in the GEM project (Sternberg and Wennekers 2005). In parti-cular, studies on the entrepreneurial activity of immigrants are veryscarce. These studies have examined already operational firms. An ex-ample of these is a recent study carried out by Levie (2007), which ana-lyses the immigrants’ propensity for venture creation using GEM data.Nevertheless, as far as I know, the intention to create a firm by an im-migrant individual has not been empirically tested. This study aims tofill this gap in the literature by analysing and comparing the intentionof individuals to start up firms (potential entrepreneurs) versus the ac-tual entrepreneurial activity of individuals (actual entrepreneurs).
In January 2007, the percentage of immigrants registered as self-em-ployed within the Spanish Social Security Department (8.5 per cent)was lower than that of natives (16 per cent). Nonetheless, the self-employment rate has grown faster in the immigrant community in re-cent years. In 2006, the immigrants’ self-employment rate increasedfive times as much as the average self-employment growth rate for thetotal population (Spanish Federation of Self-employed Associations,January 2007). These figures show that the entrepreneurial activity ofimmigrants has been increasing in Spain over the last years.
GEM data collected for seventeen Spanish regions in 2005 and 2006were also used to analyse earning determinants for entrepreneur versussalaried immigrants. Of the 47,000 individuals interviewed in the sur-vey, 2,100 were immigrants who lived in Spain. Of the latter, 20 percent were self-employed or entrepreneurs, 51 per cent were salaried,and the remainder were unemployed.
According to the Annual Immigration Report 2006, published by theSpanish Government, 8 per cent of foreigners are self-employed and 56per cent are salaried. While the proportion of salaried immigrants is si-milar to that of the GEM project, the percentage of self-employed immi-grants of the GEM data is twice as large as that of the official Spanish
84 BORN ENTREPRENEURS?

data. Here I have to bear in mind that the variable immigrant in GEM isbuilt upon the question ‘In which country were you born?’ and thus allthe respondents born abroad are codified as immigrants. In the officialSpanish statistics, on the other hand, the variable foreigner refers to na-tionality and distinguishes between Spaniards and foreigners; hence,immigrants with Spanish citizenship would be classified as Spaniards.Since the acquisition of knowledge and experience necessary to start upa business requires time, as does the acquisition of citizenship, it islikely that many self-employed immigrants are already Spanish citizensand reported as Spaniards in the Government data. I argue that thiscould in part explain the discrepancy between official Spanish data anddata collected by GEM with regard to self-employed immigrants.Leaving aside this observation, I believe that I obtained a representativesample of immigrants living in Spain.
Finally, firm census data provided by the Basque Statistical Institutewere used to compare the survival of foreign-owned firms to that of na-tive-owned ones in the Basque Country. This data are annually updated.
The Basque Country has a population of about two million inhabi-tants. In January 2007, the immigration rate reached 4.6 per cent,while the self-employment rate was 24.5 per cent overall and 10.8 percent for foreign entrepreneurs. An exploratory analysis of my databaseindicates that native-owned firms survive longer than foreign-ownedfirms at different points in time. Graph 17 illustrates the cumulativepercentage of mortality of foreign- and native-owned sole proprietorfirms created in the Basque Country in years 1994 and 1998. Thegraph shows that the cumulative mortality of firms started in 1998 byboth native and foreign single entrepreneurs in period 5 was higherthan the mortality of companies created in 1994. The lower averageGDP growth of the period 1993-1997 (3.4 per cent) compared to that of1998-2002 (5.9 per cent), as an indicator of the economic cycle, may ex-plain this gap in firm mortality rates registered in the two periods. Eventhough the cumulative mortality of native-owned firms created in 1994was higher than that of foreign-owned until period 4 – where the twolines cross – by period 5 the cumulative mortality of foreign-ownedfirms was higher than that of native-owned for companies created bothin 1994 and 1998.
I used firm census data supplied by the Basque Statistics Institutethat cover the 387,424 companies created in the Basque Country be-tween 1991 and 2004. Out of these companies, 3,232 were created byforeign entrepreneurs. Of the total population, I selected a sample invol-ving 127,908 firms (2,685 foreign-owned and 125,223 native-owned)created under the legal form of sole proprietor firms – i.e. by one entre-preneur – in the Basque Country between 1993 and 2003. The rationalefor selecting only sole proprietor firms is that I could not discriminate
DATA AND METHODOLOGY 85

between native- and foreign-owned firms registered in my database un-der other associative forms. The database contains information on theorigin, gender, and age of entrepreneurs. It also includes initial and fi-nal location, initial and final industry sector, initial and final size, andthe years of creation and cessation of firms.
Data to create additional environmental variables included in the em-pirical study were provided by the Spanish Statistics Institute, theSpanish Unemployment Institute, the Spanish Observatory ofImmigration and the Basque Statistical Institute.
5.2 Description of the samples
Different datasets were selected to conduct the three sets of empiricalstudies. Whereas two samples were extracted from GEM data to analysethe self-employment and earning determinants for immigrants and na-tives, I select the third sample from firm census data provided by theBasque Statistical Institute to compare the survival of foreign-ownedwith native-owned firms.
The first set of empirical analyses aims to examine the likelihood ofself-employment and the factors affecting it for immigrants and natives,
Graph 17 Cumulative percentage of mortality of sole proprietor firms created in the
Basque Country by origin (1994 and 1998)
0
10
20
30
40
50
60
70
80
90
100
1 2 3 4 5
Years
Native-owned 1994 Foreign-owned 1994
Native-owned 1998 Foreign-owned 1998
Cum
ulat
ive
mor
talit
y (%
)
86 BORN ENTREPRENEURS?
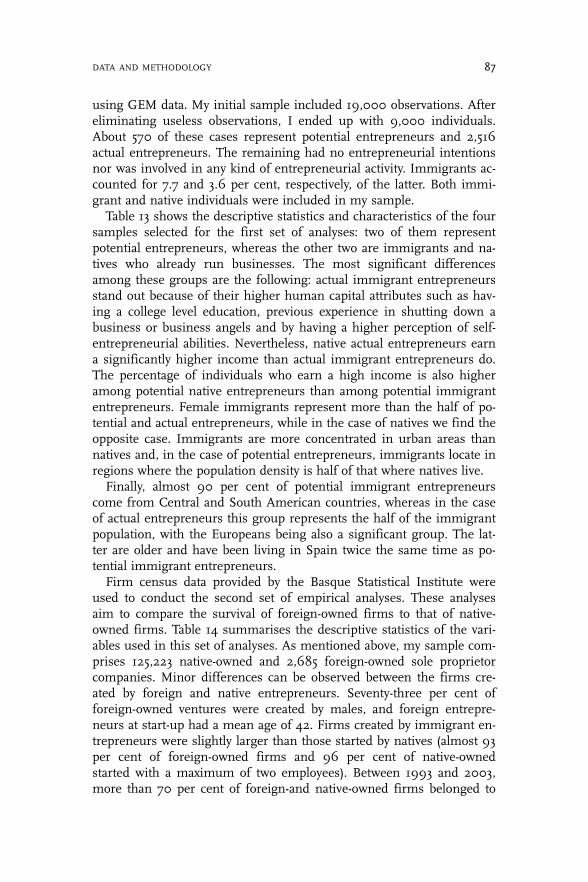
using GEM data. My initial sample included 19,000 observations. Aftereliminating useless observations, I ended up with 9,000 individuals.About 570 of these cases represent potential entrepreneurs and 2,516actual entrepreneurs. The remaining had no entrepreneurial intentionsnor was involved in any kind of entrepreneurial activity. Immigrants ac-counted for 7.7 and 3.6 per cent, respectively, of the latter. Both immi-grant and native individuals were included in my sample.
Table 13 shows the descriptive statistics and characteristics of the foursamples selected for the first set of analyses: two of them representpotential entrepreneurs, whereas the other two are immigrants and na-tives who already run businesses. The most significant differencesamong these groups are the following: actual immigrant entrepreneursstand out because of their higher human capital attributes such as hav-ing a college level education, previous experience in shutting down abusiness or business angels and by having a higher perception of self-entrepreneurial abilities. Nevertheless, native actual entrepreneurs earna significantly higher income than actual immigrant entrepreneurs do.The percentage of individuals who earn a high income is also higheramong potential native entrepreneurs than among potential immigrantentrepreneurs. Female immigrants represent more than the half of po-tential and actual entrepreneurs, while in the case of natives we find theopposite case. Immigrants are more concentrated in urban areas thannatives and, in the case of potential entrepreneurs, immigrants locate inregions where the population density is half of that where natives live.
Finally, almost 90 per cent of potential immigrant entrepreneurscome from Central and South American countries, whereas in the caseof actual entrepreneurs this group represents the half of the immigrantpopulation, with the Europeans being also a significant group. The lat-ter are older and have been living in Spain twice the same time as po-tential immigrant entrepreneurs.
Firm census data provided by the Basque Statistical Institute wereused to conduct the second set of empirical analyses. These analysesaim to compare the survival of foreign-owned firms to that of native-owned firms. Table 14 summarises the descriptive statistics of the vari-ables used in this set of analyses. As mentioned above, my sample com-prises 125,223 native-owned and 2,685 foreign-owned sole proprietorcompanies. Minor differences can be observed between the firms cre-ated by foreign and native entrepreneurs. Seventy-three per cent offoreign-owned ventures were created by males, and foreign entrepre-neurs at start-up had a mean age of 42. Firms created by immigrant en-trepreneurs were slightly larger than those started by natives (almost 93per cent of foreign-owned firms and 96 per cent of native-ownedstarted with a maximum of two employees). Between 1993 and 2003,more than 70 per cent of foreign-and native-owned firms belonged to
DATA AND METHODOLOGY 87
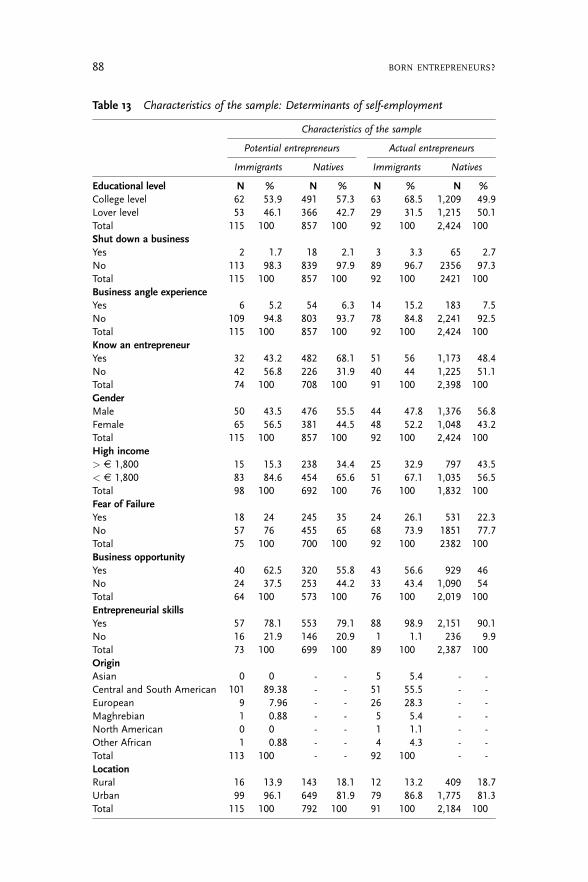
Table 13 Characteristics of the sample: Determinants of self-employment
Characteristics of the sample
Potential entrepreneurs Actual entrepreneurs
Immigrants Natives Immigrants Natives
Educational level N % N % N % N %College level 62 53.9 491 57.3 63 68.5 1,209 49.9Lover level 53 46.1 366 42.7 29 31.5 1,215 50.1Total 115 100 857 100 92 100 2,424 100Shut down a businessYes 2 1.7 18 2.1 3 3.3 65 2.7No 113 98.3 839 97.9 89 96.7 2356 97.3Total 115 100 857 100 92 100 2421 100Business angle experienceYes 6 5.2 54 6.3 14 15.2 183 7.5No 109 94.8 803 93.7 78 84.8 2,241 92.5Total 115 100 857 100 92 100 2,424 100Know an entrepreneurYes 32 43.2 482 68.1 51 56 1,173 48.4No 42 56.8 226 31.9 40 44 1,225 51.1Total 74 100 708 100 91 100 2,398 100GenderMale 50 43.5 476 55.5 44 47.8 1,376 56.8Female 65 56.5 381 44.5 48 52.2 1,048 43.2Total 115 100 857 100 92 100 2,424 100High income> E 1,800 15 15.3 238 34.4 25 32.9 797 43.5< E 1,800 83 84.6 454 65.6 51 67.1 1,035 56.5Total 98 100 692 100 76 100 1,832 100Fear of FailureYes 18 24 245 35 24 26.1 531 22.3No 57 76 455 65 68 73.9 1851 77.7Total 75 100 700 100 92 100 2382 100Business opportunityYes 40 62.5 320 55.8 43 56.6 929 46No 24 37.5 253 44.2 33 43.4 1,090 54Total 64 100 573 100 76 100 2,019 100Entrepreneurial skillsYes 57 78.1 553 79.1 88 98.9 2,151 90.1No 16 21.9 146 20.9 1 1.1 236 9.9Total 73 100 699 100 89 100 2,387 100OriginAsian 0 0 - - 5 5.4 - -Central and South American 101 89.38 - - 51 55.5 - -European 9 7.96 - - 26 28.3 - -Maghrebian 1 0.88 - - 5 5.4 - -North American 0 0 - - 1 1.1 - -Other African 1 0.88 - - 4 4.3 - -Total 113 100 - - 92 100 - -LocationRural 16 13.9 143 18.1 12 13.2 409 18.7Urban 99 96.1 649 81.9 79 86.8 1,775 81.3Total 115 100 792 100 91 100 2,184 100
88 BORN ENTREPRENEURS?

Table 13 Characteristics of the sample: Determinants of self-employment
(continued)
Descriptive statistics
Potential entrepreneurs Actual entrepreneurs
Immigrants Natives Immigrants Natives
Variable Mean Standard
deviation
Mean Standard
deviation
Mean Standard
deviation
Mean Standard
deviation
Age 33 10.48 38 12.98 39 10.29 43 12.05Years in Spain 8 11.31 - - 15 13.70 - -Cultural support index 2.02 0.86 1.86 0.87 1.71 0.92 1.70 0.97Pdensity05 393.79 798.03 868.48 1829.43 260.09 198.57 220.85 213.49Unempl04-05 10.71 2.51 10.97 3.27 10.33 2.49 10.78 2.95NewFirmsPC03 70.73 6.83 68.22 7.09 70.81 6.92 69.07 6.96
Source: GEM Spain (2005)
Table 14 Characteristics of the sample: Determinants of firm survival
Descriptive statistics
Foreigners Natives
Variable Mean Standard
deviation
Mean Standard
deviation
Initial age 42.1 9.4 - -Industry entry rate 12.9 4.5 15.3 10.5Industry exit rate 11.8 3.3 11.5 3.5
Characteristics of the sample
Foreigners Natives
Gender of entrepreneurs N % N %Male 1,074 73.4 - -Female 389 26.6 - -Total 1,463 100 - -Number of entrepreneursOne 2,685 100 125,223 100Two or more 0 0 0Total 2,685 100 125,223 100Initial number of employees0-2 2,492 92.8 120,279 96.13-5 163 6.1 4,275 3.46-9 27 1 504 0.410-14 2 0.1 104 0.115-19 0 0 34 0.020-49 1 0 21 0.050-99 0 0 4 0.0100-249 0 0 2 0.0Total 2,685 100 125,223 100
DATA AND METHODOLOGY 89

the construction, retail, hotel and catering, and business services sec-tors, followed by education in the case of foreign-owned firms and bytransport and communications and manufacturing in the case of native-owned. The 70 per cent of both foreign- and native-owned companieswere located in urban areas.
Finally, regional data from the GEM project were used to conduct mylast set of empirical analyses on earning determinants for entrepreneurand salaried immigrants. The data used in this study was collected forseventeen Spanish regions in 2005 and 2006. Of the 47,000 indivi-duals interviewed in the survey, 2,100 were immigrants who lived inSpain. Of the latter, 20 per cent were self-employed or entrepreneurs,51 per cent were salaried and the remainder were unemployed.
Table 14 Characteristics of the sample: Determinants of firm survival (continued)
Characteristics of the sample
Foreigners Natives
Sector N % N %Agriculture 0 0.0 1 0.0Extractive industries 0 0.0 11 0.0Manufacturing 68 2.5 6,732 5.4Electricity, gas and water 0 0.0 8 0.0Construction 419 15.6 19,809 15.9Retail and reparation 847 31.5 31,908 25.5Hotel and catering 404 15.0 15,486 12.4Transport and communication 74 2.8 13,753 11.0Banking and insurance 12 0.4 1,857 1.5Business services 364 13.6 21,926 17.6Public administration 0 0.0 2 0.0Education 252 9.4 2,661 2.1Health and social services 106 3.9 4,514 3.6Personal services 136 5.1 6,054 4.9Housing services 1 0.0 28 0.0Extraterritorial bodies 2 0.1 11 0.0Total 2,685 100 124,761 100LocationRural 816 30.4 38,364 30.7Urban 1,867 69.5 86,753 69.3Total 2,683 99.9 125,117 100Geographical mobility
No 2,675 99.6 123,769 98.8Yes 10 0.4 1,454 1.2Total 2,685 100 125,223 100Industry diversification
No 2,558 95.3 117,360 93.7Yes 127 4.7 7,863 6.3Total 2,685 100 125,223 100
Source: Basque Statistical Institute (1993-2003)
90 BORN ENTREPRENEURS?
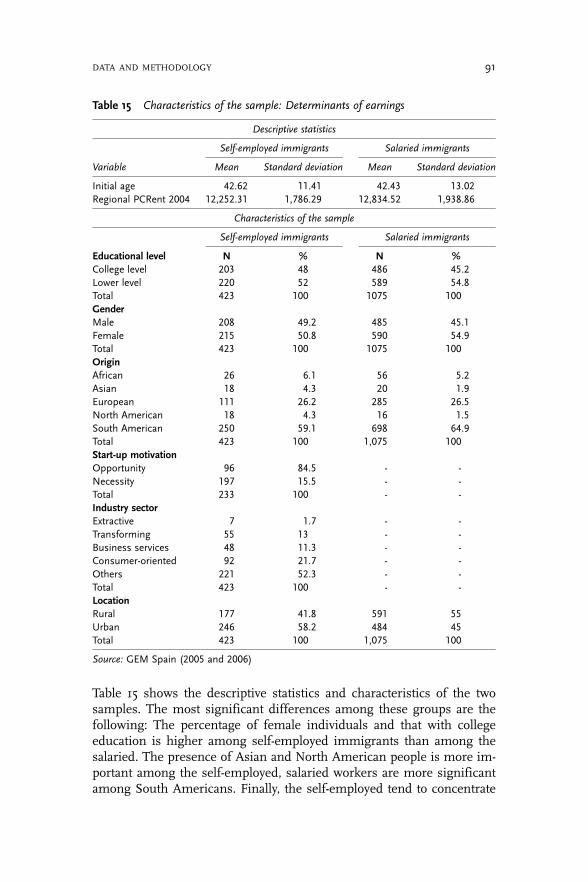
Table 15 shows the descriptive statistics and characteristics of the twosamples. The most significant differences among these groups are thefollowing: The percentage of female individuals and that with collegeeducation is higher among self-employed immigrants than among thesalaried. The presence of Asian and North American people is more im-portant among the self-employed, salaried workers are more significantamong South Americans. Finally, the self-employed tend to concentrate
Table 15 Characteristics of the sample: Determinants of earnings
Descriptive statistics
Self-employed immigrants Salaried immigrants
Variable Mean Standard deviation Mean Standard deviation
Initial age 42.62 11.41 42.43 13.02Regional PCRent 2004 12,252.31 1,786.29 12,834.52 1,938.86
Characteristics of the sample
Self-employed immigrants Salaried immigrants
Educational level N % N %College level 203 48 486 45.2Lower level 220 52 589 54.8Total 423 100 1075 100GenderMale 208 49.2 485 45.1Female 215 50.8 590 54.9Total 423 100 1075 100OriginAfrican 26 6.1 56 5.2Asian 18 4.3 20 1.9European 111 26.2 285 26.5North American 18 4.3 16 1.5South American 250 59.1 698 64.9Total 423 100 1,075 100Start-up motivationOpportunity 96 84.5 - -Necessity 197 15.5 - -Total 233 100 - -Industry sectorExtractive 7 1.7 - -Transforming 55 13 - -Business services 48 11.3 - -Consumer-oriented 92 21.7 - -Others 221 52.3 - -Total 423 100 - -LocationRural 177 41.8 591 55Urban 246 58.2 484 45Total 423 100 1,075 100
Source: GEM Spain (2005 and 2006)
DATA AND METHODOLOGY 91

more in urban areas and in regions with lower GDP per capita than sal-aried workers do. The majority of immigrants start up because they de-tect a good business opportunity and they operate mainly in consumer-oriented and business services.
5.3 Description of the variables
In this section the dependent and explanatory variables used in the em-pirical analyses will be explained. Each section will be organised aroundthe three sets of empirical analyses. A more specific definition of vari-ables is provided in Appendix 1.
5.3.1 Dependent variables
First of all, two dependent variables were selected from GEM data toanalyse the desire and likelihood of immigrants to become entrepre-neurs. The first dependent variable, Potential entrepreneur, representspeople who are not yet involved in an entrepreneurial activity, but ex-pect to become entrepreneurs within the next three years. This depen-dent variable is dichotomous and answers the question ‘Are you, aloneor with others, expecting to start a new business, including any type ofself-employment, within the next three years?’ Affirmative answers werecoded as potential entrepreneurs. This variable will allow us to distin-guish those individuals who intend to start a business (i.e. the dichoto-mous variable takes the value of 1), from those who do not (i.e. the di-chotomous variable takes the value of 0). My second variable, Actual en-trepreneurs, represents individuals who are involved in anentrepreneurial activity and it comprehends the combination of nascentfirms (i.e. up to three-months-old firms), baby businesses (i.e. firmswith a lifetime between three to 42 months) and established firms (i.e.firms older than 42 months). The distinction between potential versusactual entrepreneurs will allow us to compare the intent (i.e. ex-antestage) and realisation (i.e. ex-post stage) of entrepreneurial projectsamong immigrant and native individuals.
Secondly, I used firm census data to test and compare the venturesurvival experiences of companies created in the Basque Country by for-eign and native entrepreneurs between 1993 and 2003. I created a sin-gle dependent variable, Survival, that represents the number of yearsfrom firm inception to closure within the 1993-2003 time period.
Even though firm survival can be a sign of business success, closuresare not always a consequence of failure. Firms may cease to be regis-tered in my dataset for the following reasons: (i) immigrants may mi-grate in and out of entrepreneurship depending on labour market
92 BORN ENTREPRENEURS?
conditions, not on the profitability of their firm; in this case firm clo-sure would not be caused by business failure but by the hope for morefavourable conditions in the general labour market; (ii) geographicalmobility of firms from the Basque Country to other regions; (iii) themerging of firms; (iv) successful completion of projects in particular in-dustry sectors such as construction. Taking into account these possibili-ties, I do not consider closures synonymous with firm failure, but I stillwill consider those that survive as successful firms.
Finally, in order to compare the earnings of self-employed and salar-ied immigrants, I selected the dependent dummy variable Highincomefrom GEM data. This variable represents the distribution of themonthly earnings of immigrants. It was created by recoding the initialvariable Monthlyrents, built upon self-reported answers to a question onthe monthly income level falling into one of five categories (<E 600;E 600-1,200; E 1,200-1,800; E 1,800-2,400; and >E 2,400). The newvariable distinguishes between two income categories: a value of 0 is gi-ven to earnings situated between 0 and E 1,200 (below average) and avalue of 1 is given to earnings greater than E 1,200 (above average). Iselected this cutting point because, according to the latest salary-structure survey carried out by the Spanish Statistical Institute, theSpanish monthly net salary was E 1,160 in 2002. Thus, this dichoto-mous variable distinguishes between immigrants with above- and be-low-average earnings.
5.3.2 Independent variables
The independent variables selected from GEM data to predict the prob-ability of immigrants and natives to engage in entrepreneurial activitiescorrespond to the theoretical framework discussed in the literature sec-tion and include both individual-related and context-related factors.Individual-related factors include human capital endowments, socio-demographic characteristics and perceptual variables. Some indepen-dent variables were coded as binary variables. This is the case for hu-man capital and socio-economic variables of the individual, such asCollege (where a value of 1 is equal to having a college education),Shutd12 (takes the value of 1 if the respondent shut down a firm in thelast year), Busan (1 represents having had a business angel experiencein the past three years), Knowent (1 indicates knowing someone whostarted a firm in the past two years), Male (1 means being male), andHighincome (1 represents an income higher than E 1,200/month.
I included four perceptual variables in my empirical models: Fearfail(1 represents the fear of failure that would prevent respondents fromstarting up firms), Opport (1 indicates a favourable perception of entre-preneurial opportunities over the following six months), Skills (1
DATA AND METHODOLOGY 93
describes a favourable perception of self-entrepreneurial abilities andskills) and Cultsup. Cultsup is a cultural support index used in the GEMproject to capture the regional entrepreneurial culture. This variablecontains information about statements such as: ‘Starting a new busi-ness is a good career choice in my country of origin’, ‘A successfulbusiness provides good social standing’, and ‘New successful busi-nesses make the news in my home country.’ The variable Age indicatesthe exact age of the respondent, and I added its square term, Age2, totest whether a curvilinear relationship exists between an individual’sage and the intention to start up a new firm. Finally, the variableImmigrant is built upon the question ‘In which country were you born?’(a value of 1 is given when the respondent is an immigrant).
Context-related factors include individuals’ culture-related variablesand environmental variables of the host society. Culture-related vari-ables describe the place of origin of immigrants as follows: Csamerica (avalue of 1 for Central or South America), Asia (a value of 1 is given forAsia), Maghreb (a value of 1 is given for the Maghreb) and Safrica (a va-lue of 1 is given for Africa minus the Maghreb).
Data to create environmental variables on the thirteen regions ofSpain were provided by the Spanish National Statistics Institute, theSpanish National Unemployment Institute and the Spanish Observatoryof Immigration. I used regional level data to measure the environmen-tal factors of the regional economies. The environmental variables in-cluded in my study are as follows: Pdensity05 (which describes the regio-nal population density as measured by number of inhabitants to thesquare-Km for 2005), Foreignpop05 (indicates the percentage of foreign-ers per region in 2005), Unempl04-05 (calculates the average unemploy-ment rate per region in 2004 and 2005), and NewfirmsPC03 (representsthe number of firms created per 1,000 inhabitants in 2003 in each re-gion). The variable Urban takes the value of 1 when the respondent livesin an urban area (i.e. an area with more than 5,000 inhabitants).Finally, I created interaction variables by combining human capital andsocio-demographic variables. More specifically, I combined the variableImmigrant with Age, Male and Highincome, to verify whether immi-grants with a specific profile showed a higher potential to become en-trepreneurs or did really become entrepreneurs (see Appendix 1.1 for amore detailed description of the variables used in the first set ofanalyses).
The survival analysis was conducted by using firm census data fromthe Basque Country. Based on the conceptual framework discussed inthe literature section and following the line of thinking developed inpast studies by Gimeno et al. (1997), Schutjens and Wever (2000) andPeña (2004), I organised the independent variables to explain venturesurvival of foreign- vs. native-owned firms into two groups: firm
94 BORN ENTREPRENEURS?

internal and firm external variables. Within firm internal variables,those related to the human capital of entrepreneurs, firm resources andexperimental adaptation were used. Firm external variables weregrouped according to industry sector, location and socio-demographicfactors.
Some polychotomous variables were re-coded as 0-1 dummies so theycould be tested under a hazard Cox regression analysis. This recodingoccurred in the case of Small, Mobility, Diversific, Construc, Edu, Hotel,Manufact, Retail, Servicesco, Servicespers and Urban variables. The re-maining binary variables in my database are Immigrant and Male. Sincewe only have data on the gender and age of foreign-entrepreneurs, hy-potheses 7a and 7b could only be tested for foreign-owned companies.The opposite case occurred with the variable Mobility, which explains avariation from the initial to the final geographical location of the firm; i.e. the number of observations for those foreign-owned firms that hadchanged location was not large enough to be included in the Cox re-gression and thus, part of the hypothesis 8b could not be tested for for-eign-owned companies. For each of the dummy variables a value of 1 isgiven to those observations characterised by the name of the variableand 0 is assigned to those that do not fill this condition. For instance, avalue of 1 for the variable Construc means that the firm operates in theconstruction industry, whereas 0 means that it does not. In the case ofthe continuous variables Regimmi and Regunempl, value 1 is given tothose firms located in regions with a higher immigration rate than theaverage of the Basque Country between years 1991 and 2001, whereasvalue 0 is given to firms created in regions with an immigration ratelower than the average.
A further analysis of the variables Small and Urban is required. Thevariable Small explains whether the firm started up with 0 to 2 employ-ees (value = 1) or with more than two (value = 0). I have made this dis-tinction because more than 90 per cent of both native- and foreign-owned firms started with 0 to 2 employees. Urban is a dichotomousvariable created by modifying another variable which groups annual en-tries in twenty regions following the official classification of Basque re-gions suggested by the Basque Statistical Institute. Taking into accountthat the three largest metropolitan areas of the Basque Country are thecounty capitals, the three regions where the capital of each province islocated were codified as urban areas (value = 1) and the remaining asrural (value = 0). Selecting the three capitals as the most significant ur-ban areas can be rationalised as follows: (i) the highest population den-sity as well as the highest density of foreigners is found in these threecities; (ii) agglomeration economies are mainly concentrated in theseareas; and (ii) the majority of companies run by foreigners operate in
DATA AND METHODOLOGY 95
retailing and services, industry sectors mainly concentrated in the threecapitals.
Additionally, interaction variables linking specific industry sectors tothe origin of the entrepreneur were created in order to measure the ef-fect of being a foreign-born entrepreneur and operating in certain in-dustry sectors on venture survival. These variables are the following:Construc*Immi, Educ*Immi, Hotel*Immi, Manufact*Immi, Retail*Immi,Servicesco*Immi and Servicespers*Immi (see Appendix 1.2 for a more de-tailed description of these variables).
Finally, the third set of analyses was conducted by using GEM data.The independent variables used to predict the income distribution ofself-employed and salaried immigrants correspond to the theoreticalframework discussed in the literature and include both individual-related and context-related factors. Some independent variables werecoded as binary: human capital and socio-economic variables of the in-dividual, such as College (where a value of 1 is equal to a college educa-tion), Gender (1 for male) and Self-employed (a value of 1 for self-employed).
Based on the GNI per capita, The World Bank classifies countriesinto four groups: low-income, low-middle income, upper-middle in-come and high-income countries. According to data for 2003, NorthAmerica, Europe (with the exception of a few Eastern countries whichbelong to the lower-middle income) and Oceania belong to the lattertwo groups (The World Bank Group 2006). Due to practical reasonsand data limitations, I selected the variable Continent to describe the ori-gin of immigrants. Thus, the place of origin of immigrants is describedas follows: African (a value of 1 for immigrants from Africa), European(a value of 1 for European immigrants), North American (a value of 1 forNorth American immigrants) and South American (a value of 1 forSouth Americans). Asian immigrants are left as the base case. Since theOceanic group is not large enough to be introduced in the analysis, so-cio-economically advanced countries of my database will be representedby the variables North American and European. Finally, the quantitativevariable AGE stands for the exact age of respondents.
Context-related variables represent industry sectors and location.Industry sectors are Extractive (a value of 1 is assigned to people work-ing in extractive industries), Transforming (1 for transforming industrysectors), Business (1 for business services), and Consumer (1 for consu-mer-oriented services). The variable Urban takes a value of 1 when re-spondents live in urban areas (i.e. towns and cities of more than 5,000inhabitants). Data on the seventeen regions of Spain were provided bythe Spanish Statistical Institute: the variable RegGDPcap04 representsthe GDP per capita of each Spanish region in 2004 (see Appendix 1.3for a more detailed description of these variables).
96 BORN ENTREPRENEURS?
5.4 Formulation of hypotheses
As in the previous sections of this chapter, in this section I organise myresearch hypotheses in three groups: hypotheses numbers 1 to 5 aim totest the effect of the selected variables on the likelihood of self-employment for immigrants versus natives; hypotheses 6 to 10 areformulated to assess the effect of the second set of variables on the sur-vival of foreign-owned versus native-owned ventures; the last set ofhypotheses are posed to compare earnings of self-employed versus sal-aried immigrants.
I build on the propositions stated in the literature review section toformulate the following testable hypotheses on the determinants of im-migrants’ self-employment:
Hypothesis 1: Both immigrant and native individuals with a diverse andrich human capital endowment (i.e. number of years in Spain, age, educa-tion level and business experience) will be more likely to show an intent andto actually start up a firm than their counterparts.
Hypothesis 2: Immigrants are more likely to become entrepreneurs thannative individuals. Furthermore, immigrants with a low income (i.e. neces-sity-driven entrepreneurs) are more prone to start up firms than theircounterparts.
Hypothesis 3: Individuals’ positive perception of self-efficiency, risk toler-ance and opportunities available in the local economy increase the likelihoodof firm creation for immigrants and native individuals.
Hypothesis 4: The entrepreneurial culture embedded in the country of ori-gin of immigrants affects their intent and actual switch to becomeentrepreneurs.
Hypothesis 5: Certain environmental factors (such as living in an urbanarea, high foreign population density and high unemployment rates) willhave a positive influence on individuals’ intent and actual switch to becomeentrepreneurs.
The second set of hypotheses is formulated to analyse the effect ofthe origin of the entrepreneur on venture survival and to compare thedeterminants of foreign-owned versus native-owned firms as follows:
Hypothesis 6a: The likelihood of survival of firms created by native entre-preneurs is greater than that of firms created by foreign entrepreneurs.
Hypothesis 6b: The differences in venture survival between immigrant ver-sus local entrepreneurs can be explained by the ‘liability of foreignness’ pro-blem immigrant entrepreneurs have to face. This is understood as the disad-vantage situation they find at running a business in a foreign country,
DATA AND METHODOLOGY 97
originated as a result of a lack of knowledge of the host market rules, lan-guage skills and experience, and discrimination.
Hypothesis 7a: The probability of survival of firms created by older entre-preneurs is higher than that of firms created by younger entrepreneurs.
Hypothesis 7b: Firms created by male entrepreneurs survive longer thanthose created by their female counterparts.
Hypothesis 8a: The greater the initial size of the firm, the greater its likeli-hood of survival.
Hypothesis 8b: The application of experimental adaptation strategies,measured by geographical mobility and industry diversification, has a positiveeffect on venture survival.
Hypothesis 9a: Firms operating in highly turbulent industry sectors, mea-sured by high entry and exit rates, do not survive as long as firms operatingin less turbulent sectors.
Hypothesis 9b: Firms located in urban areas survive longer than those lo-cated in rural areas.
Hypothesis 9c: Foreign-owned firms located in an area with a large popu-lation of immigrants survive longer than foreign-owned firms located wherethere are few immigrants.
Hypothesis 9d: Unfavourable economic conditions, measured by unem-ployment, have a negative effect on venture survival.
The last set of hypotheses evaluates the economic benefit immigrantsmay obtain from self-employment by comparing the earnings of self-employed and salaried immigrants. I pose these hypotheses as follows:
Hypothesis 10a: Self-employed immigrants are likely to earn more thansalaried immigrants.
Hypothesis 10b: Opportunity-driven immigrant entrepreneurs are likely toearn more than their necessity-driven counterparts.
Hypothesis 11a: Factors enriching the human capital of individuals (i.e.education and experience) are positively associated with immigrants’earnings.
Hypothesis 11b: Immigrants from socio-economically advanced regions arelikely to earn more than immigrants from less advanced countries.
Hypothesis 12a: Self-employed immigrants operating in transforming in-dustry sectors are likely to earn more than their counterparts.
Hypothesis 12b: Immigrants working in wealthier regions and in metropo-litan areas are likely to earn more than their counterparts.
The methodology used to test these hypotheses is explained in thenext section and the results of the analyses are described in chapter six.
98 BORN ENTREPRENEURS?
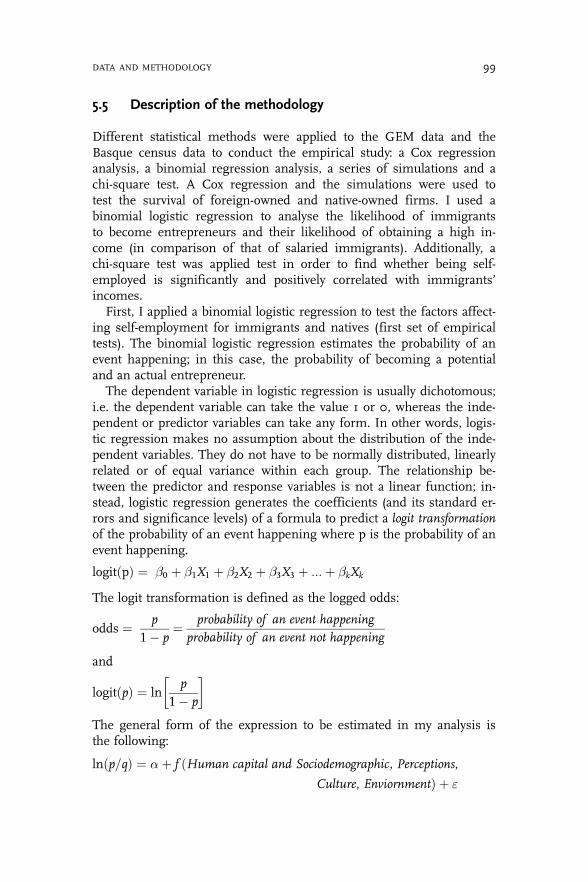
5.5 Description of the methodology
Different statistical methods were applied to the GEM data and theBasque census data to conduct the empirical study: a Cox regressionanalysis, a binomial regression analysis, a series of simulations and achi-square test. A Cox regression and the simulations were used totest the survival of foreign-owned and native-owned firms. I used abinomial logistic regression to analyse the likelihood of immigrantsto become entrepreneurs and their likelihood of obtaining a high in-come (in comparison of that of salaried immigrants). Additionally, achi-square test was applied test in order to find whether being self-employed is significantly and positively correlated with immigrants’incomes.
First, I applied a binomial logistic regression to test the factors affect-ing self-employment for immigrants and natives (first set of empiricaltests). The binomial logistic regression estimates the probability of anevent happening; in this case, the probability of becoming a potentialand an actual entrepreneur.
The dependent variable in logistic regression is usually dichotomous;i.e. the dependent variable can take the value 1 or 0, whereas the inde-pendent or predictor variables can take any form. In other words, logis-tic regression makes no assumption about the distribution of the inde-pendent variables. They do not have to be normally distributed, linearlyrelated or of equal variance within each group. The relationship be-tween the predictor and response variables is not a linear function; in-stead, logistic regression generates the coefficients (and its standard er-rors and significance levels) of a formula to predict a logit transformationof the probability of an event happening where p is the probability of anevent happening.
logitðpÞ ¼ �0 þ �1X1 þ �2X2 þ �3X3 þ :::þ �kXk
The logit transformation is defined as the logged odds:
odds ¼ p1� p
¼ probability of an event happeningprobability of an event not happening
and
logitðpÞ ¼ lnp
1� p
� �
The general form of the expression to be estimated in my analysis isthe following:
lnðp=qÞ ¼ �þ f Human capital and Sociodemographic, Perceptions,ðCulture, EnviornmentÞ þ "
DATA AND METHODOLOGY 99
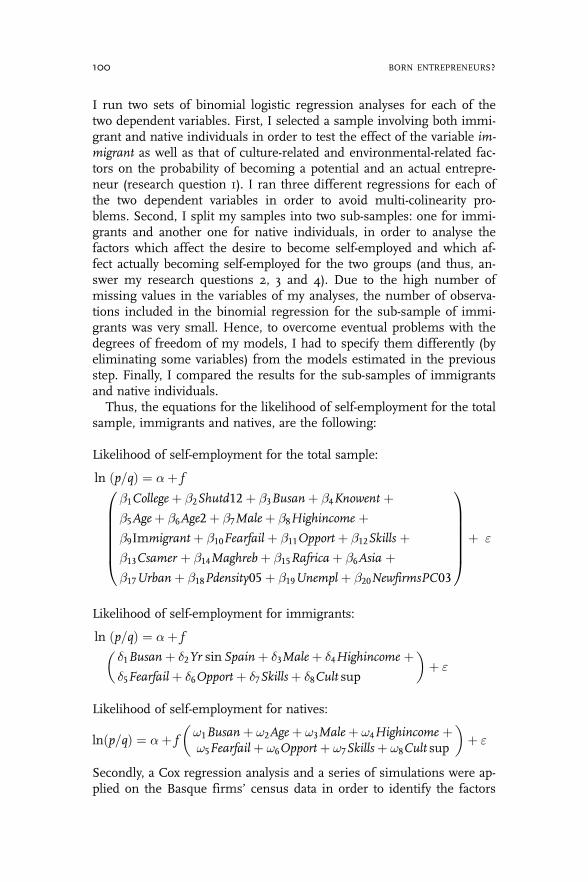
I run two sets of binomial logistic regression analyses for each of thetwo dependent variables. First, I selected a sample involving both immi-grant and native individuals in order to test the effect of the variable im-migrant as well as that of culture-related and environmental-related fac-tors on the probability of becoming a potential and an actual entrepre-neur (research question 1). I ran three different regressions for each ofthe two dependent variables in order to avoid multi-colinearity pro-blems. Second, I split my samples into two sub-samples: one for immi-grants and another one for native individuals, in order to analyse thefactors which affect the desire to become self-employed and which af-fect actually becoming self-employed for the two groups (and thus, an-swer my research questions 2, 3 and 4). Due to the high number ofmissing values in the variables of my analyses, the number of observa-tions included in the binomial regression for the sub-sample of immi-grants was very small. Hence, to overcome eventual problems with thedegrees of freedom of my models, I had to specify them differently (byeliminating some variables) from the models estimated in the previousstep. Finally, I compared the results for the sub-samples of immigrantsand native individuals.
Thus, the equations for the likelihood of self-employment for the totalsample, immigrants and natives, are the following:
Likelihood of self-employment for the total sample:
ln ðp=qÞ ¼ �þ f
�1Collegeþ �2Shutd12þ �3Busanþ �4Knowent þ�5Ageþ �6Age2þ �7Maleþ �8Highincome þ�9Immigrant þ �10Fearfailþ �11Opport þ �12Skills þ�13Csamer þ �14Maghrebþ �15Rafricaþ �6Asia þ�17Urban þ �18Pdensity05þ �19Unemplþ �20NewfirmsPC03
0BBBBBB@
1CCCCCCA
þ "
Likelihood of self-employment for immigrants:
ln ðp=qÞ ¼ �þ f
�1Busanþ �2Yr sin Spainþ �3Maleþ �4Highincome þ�5Fearfailþ �6Opportþ �7Skillsþ �8Cult sup
� �þ "
Likelihood of self-employment for natives:
lnðp=qÞ ¼ �þ f!1Busanþ !2Ageþ !3Maleþ !4Highincome þ!5Fearfailþ !6Opportþ !7Skillsþ !8Cult sup
� �þ "
Secondly, a Cox regression analysis and a series of simulations were ap-plied on the Basque firms’ census data in order to identify the factors
100 BORN ENTREPRENEURS?
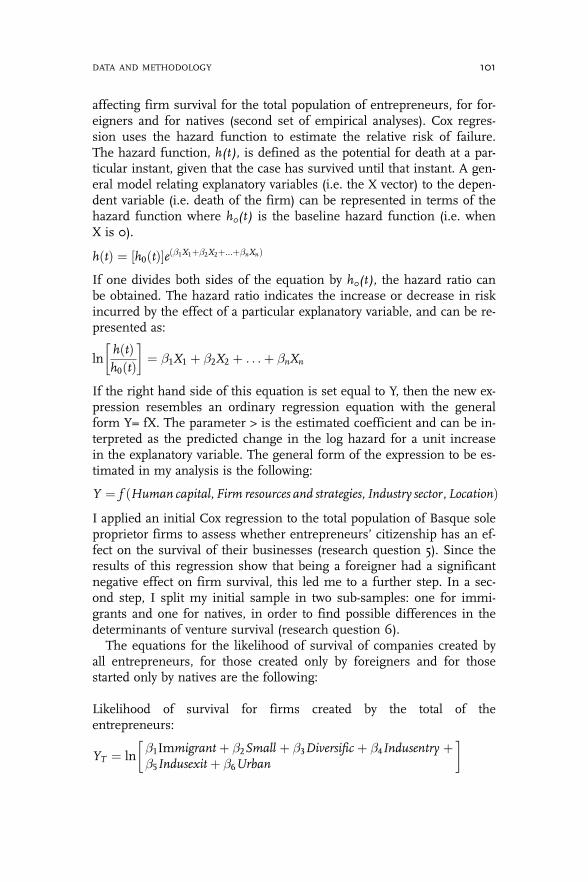
affecting firm survival for the total population of entrepreneurs, for for-eigners and for natives (second set of empirical analyses). Cox regres-sion uses the hazard function to estimate the relative risk of failure.The hazard function, h(t), is defined as the potential for death at a par-ticular instant, given that the case has survived until that instant. A gen-eral model relating explanatory variables (i.e. the X vector) to the depen-dent variable (i.e. death of the firm) can be represented in terms of thehazard function where h0(t) is the baseline hazard function (i.e. whenX is 0).
hðtÞ ¼ h0ðtÞ½ �eð�1X1þ�2X2þ...þ�nXnÞ
If one divides both sides of the equation by h0(t), the hazard ratio canbe obtained. The hazard ratio indicates the increase or decrease in riskincurred by the effect of a particular explanatory variable, and can be re-presented as:
lnhðtÞh0ðtÞ
� �¼ �1X1 þ �2X2 þ . . .þ �nXn
If the right hand side of this equation is set equal to Y, then the new ex-pression resembles an ordinary regression equation with the generalform Y= fX. The parameter > is the estimated coefficient and can be in-terpreted as the predicted change in the log hazard for a unit increasein the explanatory variable. The general form of the expression to be es-timated in my analysis is the following:
Y ¼ f ðHuman capital,Firm resources and strategies, Industry sector, LocationÞI applied an initial Cox regression to the total population of Basque soleproprietor firms to assess whether entrepreneurs’ citizenship has an ef-fect on the survival of their businesses (research question 5). Since theresults of this regression show that being a foreigner had a significantnegative effect on firm survival, this led me to a further step. In a sec-ond step, I split my initial sample in two sub-samples: one for immi-grants and one for natives, in order to find possible differences in thedeterminants of venture survival (research question 6).
The equations for the likelihood of survival of companies created byall entrepreneurs, for those created only by foreigners and for thosestarted only by natives are the following:
Likelihood of survival for firms created by the total of theentrepreneurs:
YT ¼ ln�1Immigrantþ �2Small þ �3Diversific þ �4Indusentry þ�5Indusexitþ �6Urban
� �
DATA AND METHODOLOGY 101
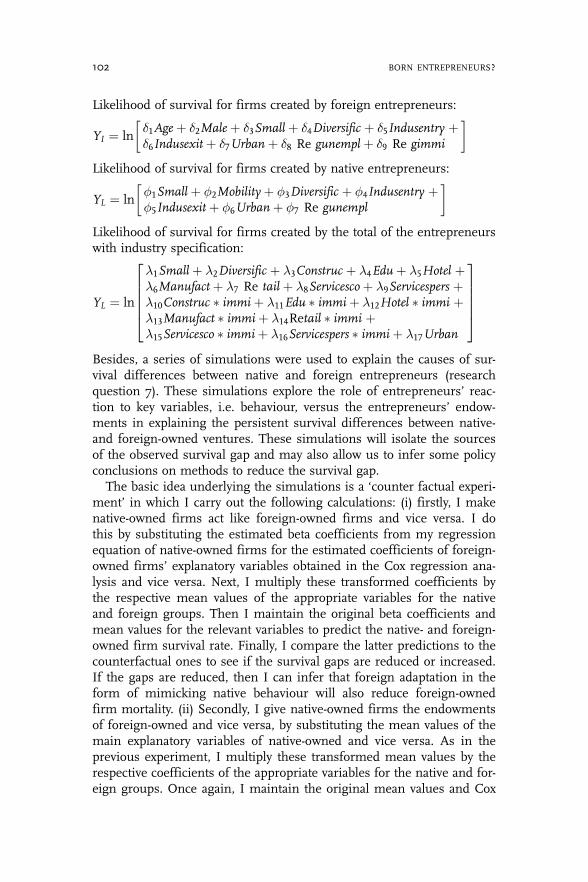
Likelihood of survival for firms created by foreign entrepreneurs:
YI ¼ ln�1Ageþ �2Maleþ �3Smallþ �4Diversific þ �5Indusentry þ�6Indusexitþ �7Urban þ �8 Re gunemplþ �9 Re gimmi
� �
Likelihood of survival for firms created by native entrepreneurs:
YL ¼ ln�1Smallþ �2Mobility þ �3Diversific þ �4Indusentry þ�5Indusexitþ �6Urban þ �7 Re gunempl
� �
Likelihood of survival for firms created by the total of the entrepreneurswith industry specification:
YL ¼ ln
�1Smallþ �2Diversific þ �3Construc þ �4Eduþ �5Hotel þ�6Manufact þ �7 Re tailþ �8Servicescoþ �9Servicespers þ�10Construc � immiþ �11Edu � immiþ �12Hotel � immi þ�13Manufact � immiþ �14Retail � immi þ�15Servicesco � immiþ �16Servicespers � immiþ �17Urban
266664
377775
Besides, a series of simulations were used to explain the causes of sur-vival differences between native and foreign entrepreneurs (researchquestion 7). These simulations explore the role of entrepreneurs’ reac-tion to key variables, i.e. behaviour, versus the entrepreneurs’ endow-ments in explaining the persistent survival differences between native-and foreign-owned ventures. These simulations will isolate the sourcesof the observed survival gap and may also allow us to infer some policyconclusions on methods to reduce the survival gap.
The basic idea underlying the simulations is a ‘counter factual experi-ment’ in which I carry out the following calculations: (i) firstly, I makenative-owned firms act like foreign-owned firms and vice versa. I dothis by substituting the estimated beta coefficients from my regressionequation of native-owned firms for the estimated coefficients of foreign-owned firms’ explanatory variables obtained in the Cox regression ana-lysis and vice versa. Next, I multiply these transformed coefficients bythe respective mean values of the appropriate variables for the nativeand foreign groups. Then I maintain the original beta coefficients andmean values for the relevant variables to predict the native- and foreign-owned firm survival rate. Finally, I compare the latter predictions to thecounterfactual ones to see if the survival gaps are reduced or increased.If the gaps are reduced, then I can infer that foreign adaptation in theform of mimicking native behaviour will also reduce foreign-ownedfirm mortality. (ii) Secondly, I give native-owned firms the endowmentsof foreign-owned and vice versa, by substituting the mean values of themain explanatory variables of native-owned and vice versa. As in theprevious experiment, I multiply these transformed mean values by therespective coefficients of the appropriate variables for the native and for-eign groups. Once again, I maintain the original mean values and Cox
102 BORN ENTREPRENEURS?
regression coefficients for the relevant variables to predict the native-and foreign-owned firm survival rate. Finally, I compare the latter pre-dictions to the counterfactual ones to see if the survival gaps are re-duced or increased. If the gaps are reduced, then I can infer that for-eign adaptation in the form of mimicking native endowments will alsoreduce foreign-owned firm mortality.
I have carried out two different analyses. In the first one, I only in-cluded the significant variables (Small, Diversif and Construc), whereasin the second one all the variables of the industry specification model– namely, Small, Diversif, Construc, Edu, Hotel, Manufact, Retail,Servicesco, Servicespers and Urban – were included. (See the results ofcorrelations matrixes and Cox regression analyses in Appendix 3).
To sum up, these simulations will allow me to find out whether theobserved gap in the survival of foreign- versus native-owned firms isdue to differences in the initial endowments or due to differences intheir behaviour, understood as the reaction to the ability of the entrepre-neur to run a business as well as to firm-external effects such as macro-economic conditions, customers’ attitude towards them, etc. Since mysample only involves sole-proprietor firms and thus the initial resourcesare supposed to be more similar than if all the legal forms were in-cluded, I expect that the behaviour effect will be more significant thanthe endowment effect.
Finally, two statistical methods were applied on GEM data to analysethe economic benefits of self-employment. In a first step, I selected asample involving the whole population of immigrants and applied achi-square test. Pearson’s chi-square for independence is used to assesswhether paired observations on two variables, expressed in a contin-gency table are independent of each other. In this case, I aimed to findwhether being self-employed is significantly and positively correlatedwith immigrants’ income (research question 8). A preliminary testshowed that there were significant differences between the earnings ofself-employed versus salaried immigrants and that led me to conductthe second analysis.
In a second step, I split my initial sample into two sub-samples (onefor self-employed and the other one for salaried immigrants), and ran abinary logistic regression analysis on both sub-samples in order to ana-lyse and compare the earning-determinants for self-employed and salar-ied immigrants (research question 9). The binary logistic regressionmethod estimates the probability of an event happening, in this case,the probability of earnings being above average for self-employed andsalaried immigrants.
DATA AND METHODOLOGY 103
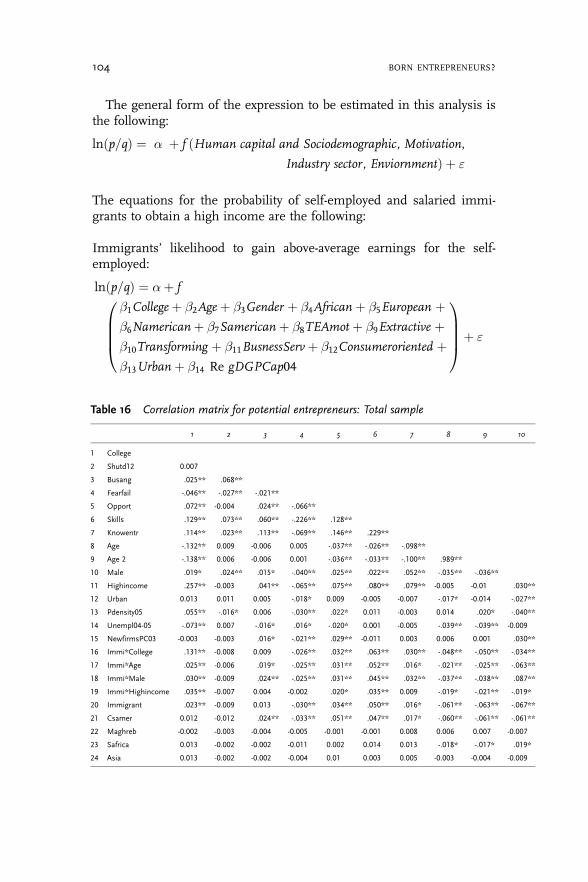
The general form of the expression to be estimated in this analysis isthe following:
lnðp=qÞ ¼ � þ f ðHuman capital and Sociodemographic, Motivation,
Industry sector, EnviornmentÞ þ "
The equations for the probability of self-employed and salaried immi-grants to obtain a high income are the following:
Immigrants’ likelihood to gain above-average earnings for the self-employed:
lnðp=qÞ ¼ �þ f
�1Collegeþ �2Ageþ �3Gender þ �4Africanþ �5European þ�6Namericanþ �7Samericanþ �8TEAmot þ �9Extractive þ�10Transforming þ �11BusnessServþ �12Consumeroriented þ�13Urban þ �14 Re gDGPCap04
0BBB@
1CCCAþ "
Table 16 Correlation matrix for potential entrepreneurs: Total sample
1 2 3 4 5 6 7 8 9 10
1 College
2 Shutd12 0.007
3 Busang .025** .068**
4 Fearfail -.046** -.027** -.021**
5 Opport .072** -0.004 .024** -.066**
6 Skills .129** .073** .060** -.226** .128**
7 Knowentr .114** .023** .113** -.069** .146** .229**
8 Age -.132** 0.009 -0.006 0.005 -.037** -.026** -.098**
9 Age 2 -.138** 0.006 -0.006 0.001 -.036** -.033** -.100** .989**
10 Male .019* .024** .015* -.040** .025** .022** .052** -.035** -.036**
11 Highincome .257** -0.003 .041** -.065** .075** .080** .079** -0.005 -0.01 .030**
12 Urban 0.013 0.011 0.005 -.018* 0.009 -0.005 -0.007 -.017* -0.014 -.027**
13 Pdensity05 .055** -.016* 0.006 -.030** .022* 0.011 -0.003 0.014 .020* -.040**
14 Unempl04-05 -.073** 0.007 -.016* .016* -.020* 0.001 -0.005 -.039** -.039** -0.009
15 NewfirmsPC03 -0.003 -0.003 .016* -.021** .029** -0.011 0.003 0.006 0.001 .030**
16 Immi*College .131** -0.008 0.009 -.026** .032** .063** .030** -.048** -.050** -.034**
17 Immi*Age .025** -0.006 .019* -.025** .031** .052** .016* -.021** -.025** -.063**
18 Immi*Male .030** -0.009 .024** -.025** .031** .045** .032** -.037** -.038** .087**
19 Immi*Highincome .035** -0.007 0.004 -0.002 .020* .035** 0.009 -.019* -.021** -.019*
20 Immigrant .023** -0.009 0.013 -.030** .034** .050** .016* -.061** -.063** -.067**
21 Csamer 0.012 -0.012 .024** -.033** .051** .047** .017* -.060** -.061** -.061**
22 Maghreb -0.002 -0.003 -0.004 -0.005 -0.001 -0.001 0.008 0.006 0.007 -0.007
23 Safrica 0.013 -0.002 -0.002 -0.011 0.002 0.014 0.013 -.018* -.017* .019*
24 Asia 0.013 -0.002 -0.002 -0.004 0.01 0.003 0.005 -0.003 -0.004 -0.009
104 BORN ENTREPRENEURS?
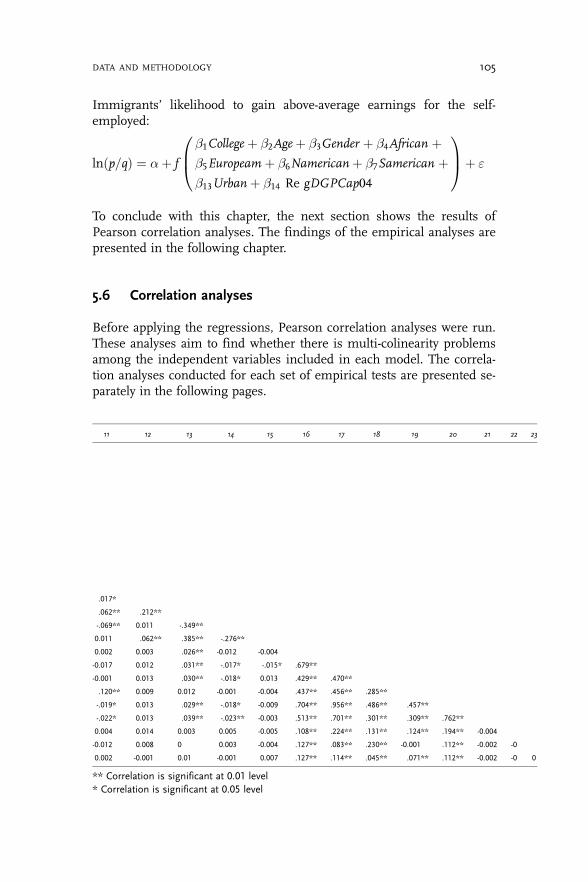
Immigrants’ likelihood to gain above-average earnings for the self-employed:
lnðp=qÞ ¼ �þ f
�1Collegeþ �2Ageþ �3Gender þ �4African þ�5Europeam þ �6Namericanþ �7Samerican þ�13Urban þ �14 Re gDGPCap04
0B@
1CAþ "
To conclude with this chapter, the next section shows the results ofPearson correlation analyses. The findings of the empirical analyses arepresented in the following chapter.
5.6 Correlation analyses
Before applying the regressions, Pearson correlation analyses were run.These analyses aim to find whether there is multi-colinearity problemsamong the independent variables included in each model. The correla-tion analyses conducted for each set of empirical tests are presented se-parately in the following pages.
11 12 13 14 15 16 17 18 19 20 21 22 23
.017*
.062** .212**
-.069** 0.011 -.349**
0.011 .062** .385** -.276**
0.002 0.003 .026** -0.012 -0.004
-0.017 0.012 .031** -.017* -.015* .679**
-0.001 0.013 .030** -.018* 0.013 .429** .470**
.120** 0.009 0.012 -0.001 -0.004 .437** .456** .285**
-.019* 0.013 .029** -.018* -0.009 .704** .956** .486** .457**
-.022* 0.013 .039** -.023** -0.003 .513** .701** .301** .309** .762**
0.004 0.014 0.003 0.005 -0.005 .108** .224** .131** .124** .194** -0.004
-0.012 0.008 0 0.003 -0.004 .127** .083** .230** -0.001 .112** -0.002 -0
0.002 -0.001 0.01 -0.001 0.007 .127** .114** .045** .071** .112** -0.002 -0 0
** Correlation is significant at 0.01 level* Correlation is significant at 0.05 level
DATA AND METHODOLOGY 105

Tables 16 to 21 show the results of the correlations applied to test theexplanatory variables used to explain the probability of immigrants andnatives to become self-employed. The correlation analysis run for the to-tal sample of individuals (Tables 16 and 19) show that there is colinear-ity between the variables Immigrant and Csamer (the variable which de-scribes people coming from Central and South American countries).The colinearity is explained by the fact that 90 per cent of the sampleused to assess the desire of immigrants to become entrepreneurs andmore than 55 per cent of the sample used to test their likelihood to be-come entrepreneurs came from Central or South American countries.Because of this problem, I run two different models for each sample:one of them includes the variable Immigrant and the other one uses thevariable Csamer as well as the rest of variables explaining the origin ofimmigrants. A third model with some interaction variables created bylinking the variable Immigrant to some human capital and socio-demo-graphic variables is also included. The remaining models of the first setof empirical analyses do not present significantly high colinearityproblems.
The second set of empirical tests aims to compare the survival of for-eign-owned and native-owned firms. Tables 22 to 27 show the results ofcorrelation analyses corresponding to this set of analyses. Since signifi-cantly high colinearity problems were found among the variablesUrban, RegUnempl (variable which describes regional unemploymentrates) and RegImmi (variable which describes regional immigrationrates), three different Cox regressions were run for each model.
106 BORN ENTREPRENEURS?

Table
17Correlation
matrixforpotential
entrepreneurs:Im
migrants
12
34
56
78
910
1112
13
1College
2Sh
utd1
2.123
3Busan
g.060
-.031
4Kno
wen
tr.000
-.102
.274*
5YrsinS
Pain
.139
.052
.001
-.014
6Male
.177
.152
.031
.249*
-.059
7Highincom
e.124
-.061
.246*
.123
-.058
.118
8Fearfail
-.132
-.065
.006
-.177
.021
-.331**
-.148
9Opp
ort
-.081
.098
-.067
.044
.004
.091
-.006
-.410**
10Skills
.154
.062
.128
-.127
.231*
.092
.220
-.081
.190
11Cultsup
.056
-.153
-.005
.117
-.198
.060
-.127
-.103
.150
-.074
12Urban
.233*
.053
.094
.073
.023
.150
.034
-.051
.041
.033
-.095
13Fo
reignp
op05
-.081
.106
.061
-.070
-.052
-.075
-.195
.004
.275
.079
.074
.146
14New
firmsPC03
-.079
.202
-.133
-.022
-.074
-.009
-.010
.129
.356*
.173
-.097
.099
.641**
**Correlatio
nissign
ificant
at0.01
level
*Correlatio
nissign
ificant
at0.05
level
DATA AND METHODOLOGY 107
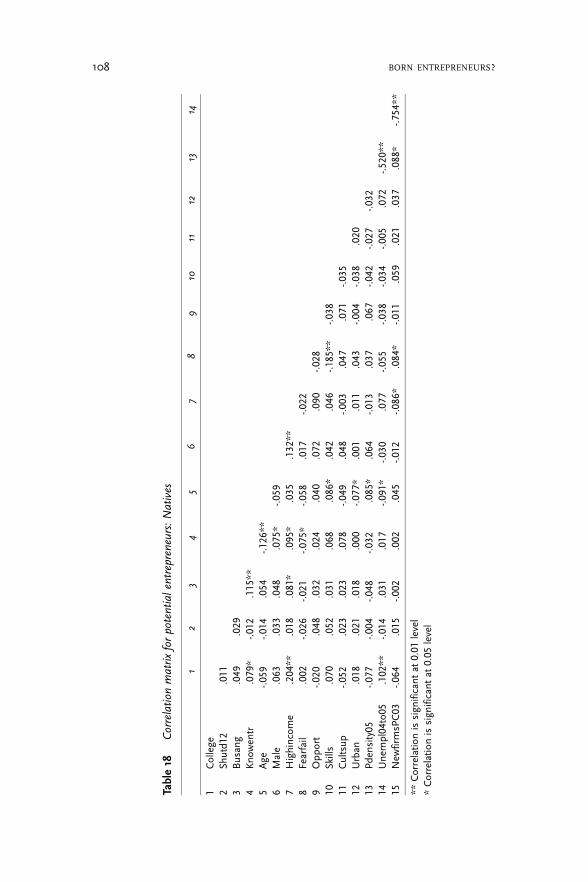
Table
18Correlation
matrixforpotential
entrepreneurs:Natives
12
34
56
78
910
1112
1314
1College
2Sh
utd1
2.011
3Busan
g.049
.029
4Kno
wen
tr.079*
-.012
.115**
5Age
-.059
-.014
.054
-.126
**6
Male
.063
.033
.048
.075*
-.059
7Highincom
e.204**
.018
.081*
.095*
.035
.132
**8
Fearfail
.002
-.026
-.021
-.075*
-.058
.017
-.022
9Opp
ort
-.020
.048
.032
.024
.040
.072
.090
-.028
10Skills
.070
.052
.031
.068
.086*
.042
.046
-.185
**-.0
3811
Cultsup
-.052
.023
.023
.078
-.049
.048
-.003
.047
.071
-.035
12Urban
.018
.021
.018
.000
-.077
*.001
.011
.043
-.004
-.038
.020
13Pd
ensity05
-.077
-.004
-.048
-.032
.085*
.064
-.013
.037
.067
-.042
-.027
-.032
14Une
mpl04to05
.102**
-.014
.031
.017
-.091*
-.030
.077
-.055
-.038
-.034
-.005
.072
-.520**
15New
firmsPC03
-.064
.015
-.002
.002
.045
-.012
-.086
*.084*
-.011
.059
.021
.037
.088*
-.754**
**Correlatio
nissign
ificant
at0.01
level
*Correlatio
nissign
ificant
at0.05
level
108 BORN ENTREPRENEURS?
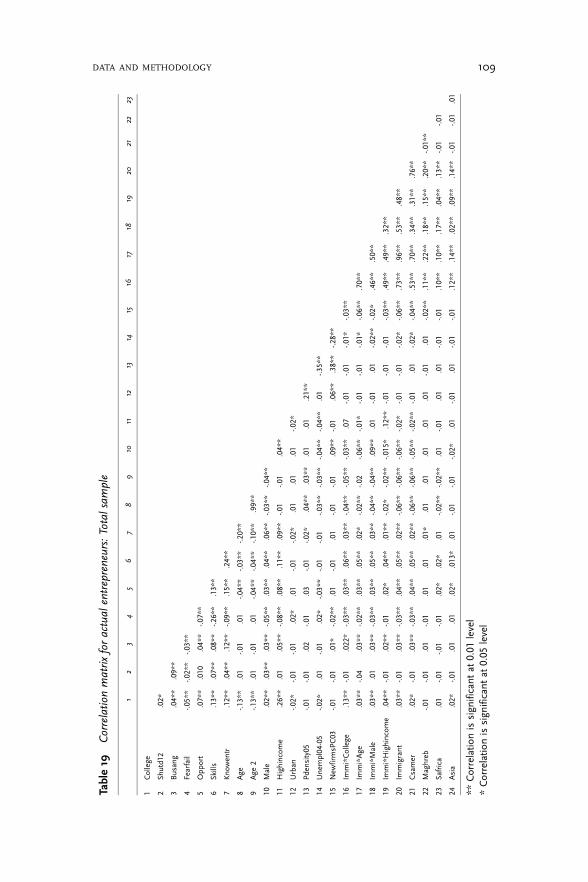
Table
19Correlation
matrixforactual
entrepreneurs:Totalsample
12
34
56
78
910
1112
1314
1516
1718
1920
2122
23
1College
2Sh
utd1
2.02*
3Busan
g.04*
*.09*
*
4Fearfail
-.05*
*-.0
2**
-.03*
*
5Opp
ort
.07*
*.010
.04*
*-.0
7**
6Skills
.13*
*.07*
*.08*
*-.2
6**
.13*
*
7Kno
wen
tr.12*
*.04*
*.12*
*-.0
9**
.15*
*.24*
*
8Age
-.13*
*.01
-.01
.01
-.04**
-.03*
*-.2
0**
9Age
2-.1
3**
.01
-.01
.01
-.04**
-.04*
*-.1
0**
.99*
*
10Male
.02*
*.03*
*.03*
*-.0
5**
.03*
*.04*
*.06*
*-.0
3**
-.04*
*
11Highincom
e.26*
*.01
.05*
*-.0
8**
.08*
*.11**
.09*
*-.0
1-.0
1.04*
*
12Urban
-.02*
-.01
-.01
.02*
.01
-.01
-.02*
.01
.01
.01
-.02*
13Pd
ensity05
-.01
-.01
.02
-.01
.03
-.01
-.02*
.04*
*.03*
*.01
.01
.21**
14Une
mpl04
-05
-.02*
.01
-.01
.02*
-.03**
-.01
-.01
-.03*
*-.0
3**
-.04*
*-.0
4**
.01
-.35*
*
15New
firmsPC03
-.01
-.01
.01*
-.02**
.01
-.01
.01
-.01
-.01
.09*
*-.0
1.06*
*.38*
*-.2
8**
16Im
mi*College
.13*
*-.0
1.022
*-.0
3**
.03*
*.06*
*.03*
*-.0
4**
-.05*
*-.0
3**
.07
-.01
-.01
-.01*
-.03*
*
17Im
mi*Age
.03*
*-.0
4.03*
*-.0
2**
.03*
*.05*
*.02*
-.02*
*-.0
2-.0
6**
-.01*
-.01
-.01
-.01*
-.06*
*.70*
*
18Im
mi*Male
.03*
*.01
.03*
*-.0
3**
.03*
*.05*
*.03*
*-.0
4**
-.04*
*.09*
*.01
-.01
.01
-.02**
-.02*
.46*
*.50*
*
19Im
mi*Highincom
e.04*
*-.0
1.02*
*-.0
1.02*
.04*
*.01**
-.02*
-.02*
*-.0
15*
.12*
*-.0
1-.0
1-.0
1-.0
3**
.49*
*.49*
*.32*
*
20Im
migrant
.03*
*-.0
1.03*
*-.0
3**
.04*
*.05*
*.02*
*-.0
6**
-.06*
*-.0
6**
-.02*
-.01
-.01
-.02*
-.06*
*.73*
*.96*
*.53*
*.48*
*
21Csamer
.02*
-.01
.03*
*-.0
3**
.04*
*.05*
*.02*
*-.0
6**
-.06*
*-.0
5**
-.02*
*-.0
1.01
-.02*
-.04*
*.53*
*.70*
*.34*
*.31**
.76*
*
22Maghreb
-.01
-.01
.01
-.01
.01
.01
.01*
.01
.01
.01
.01
.01
-.01
.01
-.02*
*.11**
.22*
*.18*
*.15*
*.20*
*-.0
1**
23Safrica
.01
-.01
-.01
-.01
.02*
.02*
.01
-.02*
*-.0
2**
.01
-.01
.01
.01
-.01
-.01
.10*
*.10*
*.17*
*.04*
*.13*
*-.0
1-.0
1
24Asia
.02*
-.01
.01
.01
.02*
.013*
.01
-.01
-.01
-.02*
.01
-.01
.01
-.01
-.01
.12*
*.14*
*.02*
*.09*
*.14*
*-.0
1-.0
1.01
**Correlatio
nissign
ificant
at0.01
level
*Correlatio
nissign
ificant
at0.05
level
DATA AND METHODOLOGY 109
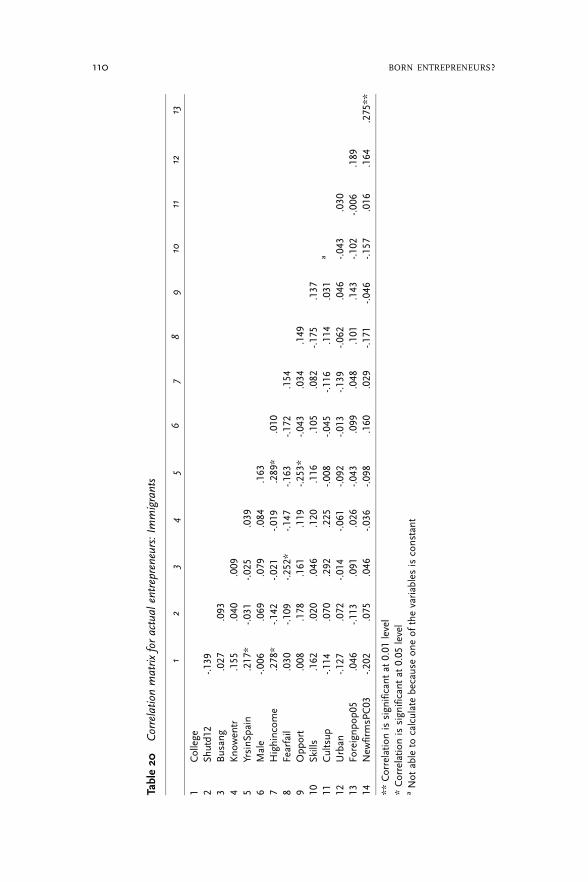
Table
20Correlation
matrixforactual
entrepreneurs:Im
migrants
12
34
56
78
910
1112
13
1College
2Sh
utd1
2-.1
393
Busan
g.027
.093
4Kno
wen
tr.155
.040
.009
5YrsinS
pain
.217*
-.031
-.025
.039
6Male
-.006
.069
.079
.084
.163
7Highincom
e.278
*-.1
42-.0
21-.0
19.289*
.010
8Fearfail
.030
-.109
-.252
*-.1
47-.1
63-.1
72.154
9Opp
ort
.008
.178
.161
.119
-.253
*-.0
43.034
.149
10Skills
.162
.020
.046
.120
.116
.105
.082
-.175
.137
11Cultsup
-.114
.070
.292
.225
-.008
-.045
-.116
.114
.031
a
12Urban
-.127
.072
-.014
-.061
-.092
-.013
-.139
-.062
.046
-.043
.030
13Fo
reignp
op05
.046
-.113
.091
.026
-.043
.099
.048
.101
.143
-.102
-.006
.189
14New
firmsPC03
-.202
.075
.046
-.036
-.098
.160
.029
-.171
-.046
-.157
.016
.164
.275**
**Correlatio
nissign
ificant
at0.01
level
*Correlatio
nissign
ificant
at0.05
level
aNot
ableto
calculatebecauseon
eof
thevariablesisconstant
110 BORN ENTREPRENEURS?
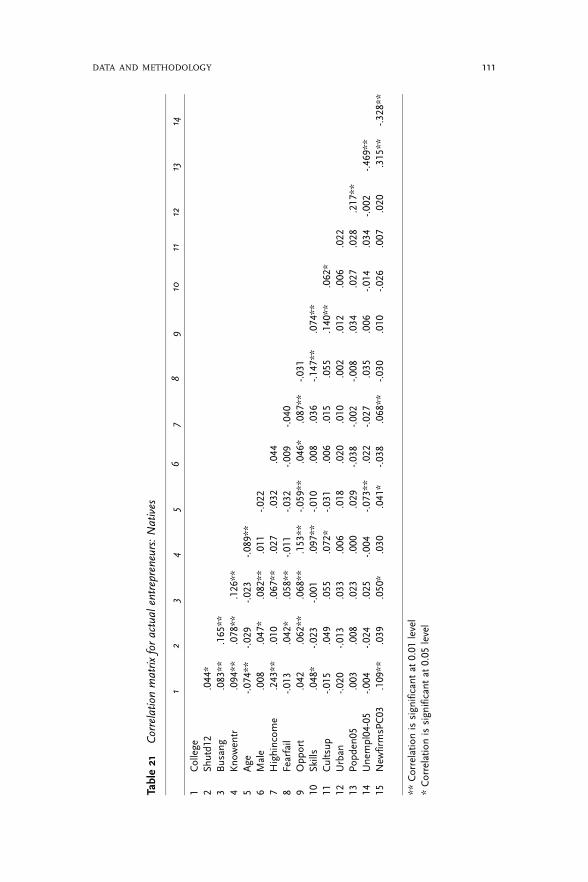
Table
21Correlation
matrixforactual
entrepreneurs:Natives
12
34
56
78
910
1112
1314
1College
2Sh
utd1
2.044*
3Busan
g.083**
.165
**4
Know
entr
.094**
.078**
.126**
5Age
-.074**
-.029
-.023
-.089**
6Male
.008
.047*
.082**
.011
-.022
7Highincom
e.243**
.010
.067**
.027
.032
.044
8Fearfail
-.013
.042*
.058**
-.011
-.032
-.009
-.040
9Opp
ort
.042
.062**
.068**
.153
**-.0
59**
.046*
.087**
-.031
10Skills
.048*
-.023
-.001
.097
**-.0
10.008
.036
-.147
**.074**
11Cultsup
-.015
.049
.055
.072
*-.0
31.006
.015
.055
.140
**.062*
12Urban
-.020
-.013
.033
.006
.018
.020
.010
.002
.012
.006
.022
13Po
pden
05.003
.008
.023
.000
.029
-.038
-.002
-.008
.034
.027
.028
.217**
14Une
mpl04-05
-.004
-.024
.025
-.004
-.073**
.022
-.027
.035
.006
-.014
.034
-.002
-.469**
15New
firmsPC03
.109**
.039
.050*
.030
.041*
-.038
.068**
-.030
.010
-.026
.007
.020
.315**
-.328**
**Correlatio
nissign
ificant
at0.01
level
*Correlatio
nissign
ificant
at0.05
level
DATA AND METHODOLOGY 111
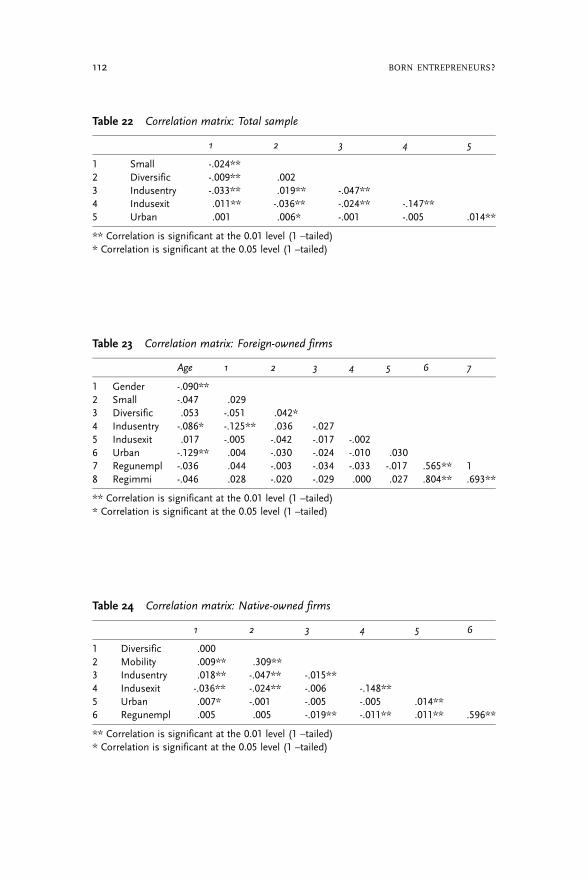
Table 22 Correlation matrix: Total sample
1 2 3 4 5
1 Small -.024**2 Diversific -.009** .0023 Indusentry -.033** .019** -.047**4 Indusexit .011** -.036** -.024** -.147**5 Urban .001 .006* -.001 -.005 .014**
** Correlation is significant at the 0.01 level (1 –tailed)* Correlation is significant at the 0.05 level (1 –tailed)
Table 23 Correlation matrix: Foreign-owned firms
Age 1 2 3 4 5 6 7
1 Gender -.090**2 Small -.047 .0293 Diversific .053 -.051 .042*4 Indusentry -.086* -.125** .036 -.0275 Indusexit .017 -.005 -.042 -.017 -.0026 Urban -.129** .004 -.030 -.024 -.010 .0307 Regunempl -.036 .044 -.003 -.034 -.033 -.017 .565** 18 Regimmi -.046 .028 -.020 -.029 .000 .027 .804** .693**
** Correlation is significant at the 0.01 level (1 –tailed)* Correlation is significant at the 0.05 level (1 –tailed)
Table 24 Correlation matrix: Native-owned firms
1 2 3 4 5 6
1 Diversific .0002 Mobility .009** .309**3 Indusentry .018** -.047** -.015**4 Indusexit -.036** -.024** -.006 -.148**5 Urban .007* -.001 -.005 -.005 .014**6 Regunempl .005 .005 -.019** -.011** .011** .596**
** Correlation is significant at the 0.01 level (1 –tailed)* Correlation is significant at the 0.05 level (1 –tailed)
112 BORN ENTREPRENEURS?

Table
25Correlation
matrix:Totalsamplewithindustry
specification
12
34
56
78
910
1112
1314
1516
17
1Sm
all
-.024
**
2Diversific
-.009
**.002
3Con
struc
-.001
.049
**.018**
4Ed
u.070
**-.0
15**
.007
*-.0
66**
5Hotel
.012**
-.149
**-.0
25**
-.163
**-.0
57**
6Man
ufact
-.018**
-.056
**.046
**-.1
03**
-.036
**-.0
89**
7Retail
.020
**.026
**.028
**-.2
54**
-.090
**-.2
21**
-.139
**
8Servicesco
-.015**
.058
**.003
-.199
**-.0
70**
-.173
**-.1
09**
-.270
**
9Servicespe
rs.002
-.010**
-.003
-.098
**-.0
34**
-.085
**-.0
53**
-.132
**-.1
04**
10Con
struc*Im
mi
.392
**.005
-.002
.132
**-.0
09**
-.022
**-.0
14**
-.034
**-.0
26**
-.013**
11Ed
u*Im
mi
.303
**-.0
15**
-.001
-.019**
.291**
-.017**
-.011**
-.026
**-.0
20**
-.010**
-.003
12Hotel*Immi
.384
**-.0
72**
-.010**
-.024
**-.0
09**
.149
**-.0
13**
-.033
**-.0
26**
-.013**
-.003
-.003
13Man
ufact*Im
mi
.158
**-.0
04.004
-.010**
-.004
-.009
**.097
**-.0
14**
-.011**
-.005
-.001
-.001
-.001
14Retail*Im
mi
.558
**.009
**-.0
02-.0
35**
-.012**
-.031**
-.019**
.139
**-.0
38**
-.018**
-.005
-.004
-.005
-.002
15Servicesco*Immi
.365
**.006
*-.0
05-.0
23**
-.008
**-.0
20**
-.013**
-.031**
.116**
-.012**
-.003
-.002
-.003
-.001
-.004
16Servicespe
rs*Immi
.223
**.003
.000
-.014**
-.005
-.012**
-.008**
-.019**
-.015**
.145
**-.0
02-.0
01-.0
02-.0
01-.0
03-.0
02
17Urban
.001
.006
*-.0
01-.0
32**
-.002
-.005
-.076**
.015**
.070
**.000
-.012**
-.008
**.010**
-.005
.004
.010**
.007
*
**Correlatio
nissign
ificant
atthe0.01
level(1–tailed)
*Correlatio
nissign
ificant
atthe0.05
level(1–tailed)
DATA AND METHODOLOGY 113
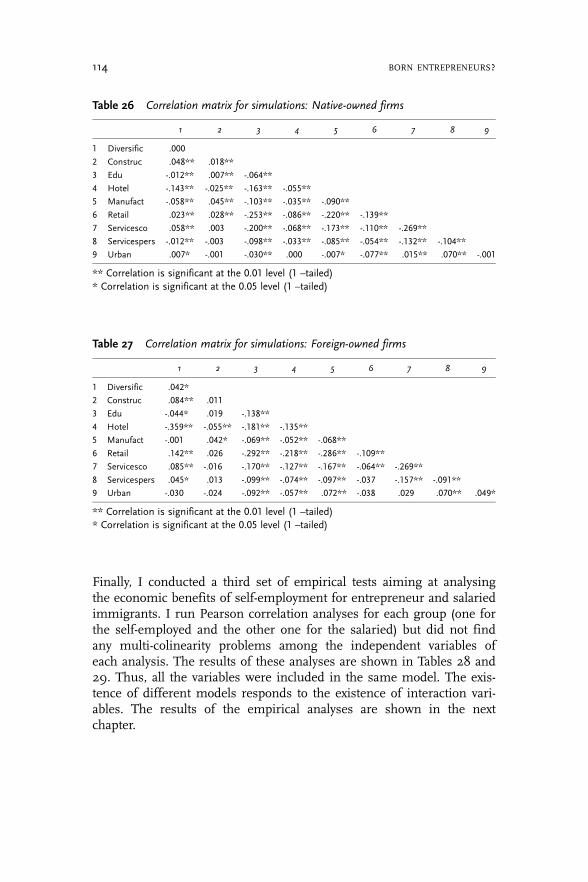
Table 26 Correlation matrix for simulations: Native-owned firms
1 2 3 4 5 6 7 8 9
1 Diversific .000
2 Construc .048** .018**
3 Edu -.012** .007** -.064**
4 Hotel -.143** -.025** -.163** -.055**
5 Manufact -.058** .045** -.103** -.035** -.090**
6 Retail .023** .028** -.253** -.086** -.220** -.139**
7 Servicesco .058** .003 -.200** -.068** -.173** -.110** -.269**
8 Servicespers -.012** -.003 -.098** -.033** -.085** -.054** -.132** -.104**
9 Urban .007* -.001 -.030** .000 -.007* -.077** .015** .070** -.001
** Correlation is significant at the 0.01 level (1 –tailed)* Correlation is significant at the 0.05 level (1 –tailed)
Table 27 Correlation matrix for simulations: Foreign-owned firms
1 2 3 4 5 6 7 8 9
1 Diversific .042*
2 Construc .084** .011
3 Edu -.044* .019 -.138**
4 Hotel -.359** -.055** -.181** -.135**
5 Manufact -.001 .042* -.069** -.052** -.068**
6 Retail .142** .026 -.292** -.218** -.286** -.109**
7 Servicesco .085** -.016 -.170** -.127** -.167** -.064** -.269**
8 Servicespers .045* .013 -.099** -.074** -.097** -.037 -.157** -.091**
9 Urban -.030 -.024 -.092** -.057** .072** -.038 .029 .070** .049*
** Correlation is significant at the 0.01 level (1 –tailed)* Correlation is significant at the 0.05 level (1 –tailed)
Finally, I conducted a third set of empirical tests aiming at analysingthe economic benefits of self-employment for entrepreneur and salariedimmigrants. I run Pearson correlation analyses for each group (one forthe self-employed and the other one for the salaried) but did not findany multi-colinearity problems among the independent variables ofeach analysis. The results of these analyses are shown in Tables 28 and29. Thus, all the variables were included in the same model. The exis-tence of different models responds to the existence of interaction vari-ables. The results of the empirical analyses are shown in the nextchapter.
114 BORN ENTREPRENEURS?
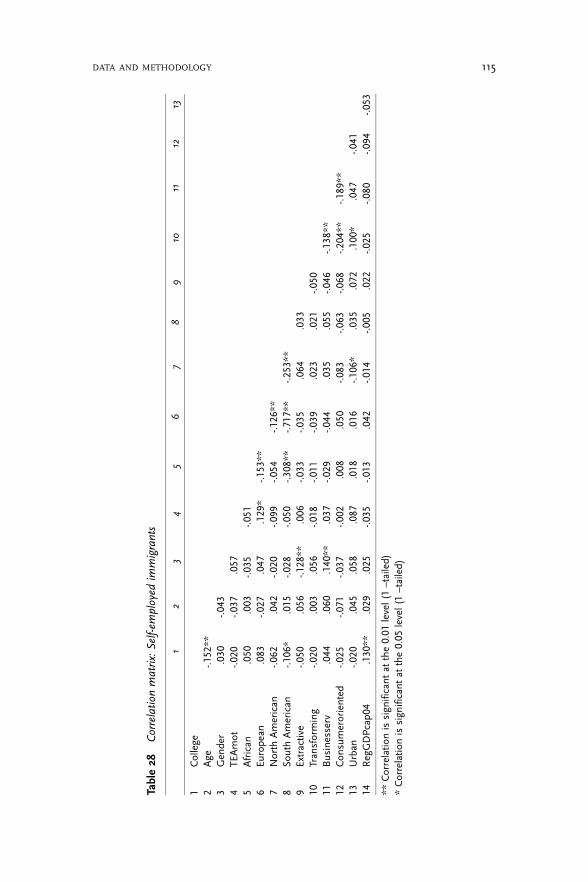
Table
28Correlation
matrix:Self-em
ployed
immigrants
12
34
56
78
910
1112
13
1College
2Age
-.152
**3
Gen
der
.030
-.043
4TE
Amot
-.020
-.037
.057
5African
.050
.003
-.035
-.051
6Eu
rope
an.083
-.027
.047
.129
*-.1
53**
7North
American
-.062
.042
-.020
-.099
-.054
-.126
**8
SouthAmerican
-.106
*.015
-.028
-.050
-.308
**-.7
17**
-.253**
9Extractive
-.050
.056
-.128**
.006
-.033
-.035
.064
.033
10Tran
sforming
-.020
.003
.056
-.018
-.011
-.039
.023
.021
-.050
11Businesserv
.044
.060
.140
**.037
-.029
-.044
.035
.055
-.046
-.138
**12
Con
sumeroriented
-.025
-.071
-.037
-.002
.008
.050
-.083
-.063
-.068
-.204
**-.1
89**
13Urban
-.020
.045
.058
.087
.018
.016
-.106
*.035
.072
.100
*.047
-.041
14RegGDPcap
04.130**
.029
.025
-.035
-.013
.042
-.014
-.005
.022
-.025
-.080
-.094
-.053
**Correlatio
nissign
ificant
atthe0.01
level(1–tailed)
*Correlatio
nissign
ificant
atthe0.05
level(1–tailed)
DATA AND METHODOLOGY 115

Table 29 Correlation matrix: Salaried immigrants
1 2 3 4 5 6 7 8
1 College2 Age -.178**3 Gender .052 -.0084 African -.053 .032 -.0115 European .005 -.043 .002 -.141**6 North American .043 -.038 -.019 -.029 -.074*7 South American .021 .042 .028 -.319** -.817** -.167**8 Urban -.007 .031 -.058 -.002 .003 .012 -.0139 RegGDPca04 .070* .012 .083** .025 -.039 -.016 .028 .112**
** Correlation is significant at the 0.01 level (1 –tailed)* Correlation is significant at the 0.05 level (1 –tailed)
116 BORN ENTREPRENEURS?
6 Results of the empirical analysis
6.1 Immigrants’ likelihood of self-employment
My first set of regressions aims to test the factors affecting self-employ-ment for immigrants and natives. This analysis was conducted in twosteps: in the first binomial regression, I assess whether being immi-grant has any effect on the likelihood of self-employment. The positiveanswer obtained in the first regression led me to compare the effect ofa set of explanatory variables on the probability of immigrants and na-tives becoming self-employed.
The results of my first binomial regression analysis suggest that theplace of origin affects not only the intent, but also the actual switch ofan individual to become an entrepreneur. I found that immigrants aremore likely to show intent to become entrepreneurs; nevertheless, na-tive individuals are more likely to really start up a new venture. Thisanalysis provides answers to research questions 1, 2 and 3. The secondset of analyses is carried out to answer research question 4. Main find-ings for each question are discussed next.
(1) Does the origin of an individual (i.e. immigrant versus native) affect the like-lihood of being a potential entrepreneur? And similarly, does the origin of anindividual (i.e. immigrant versus native) affect the likelihood of being an ac-tual entrepreneur?
I conducted my first test on the whole sample of immigrants and nativeindividuals. As shown in Table 30, I found that immigrants are morelikely to show intent to become entrepreneurs than native individuals.This finding confirms the first part of hypothesis 2 and previous find-ings by Hammarstedt (2001), Schuetze (2005) and Levie (2007).Furthermore, the significant coefficient of the interaction variable be-tween the age and the origin of individuals suggests that mature immi-grants’ probability to intend to start up a firm in a period of three yearsis higher than that of young immigrants. Interestingly, the binomial re-gression analysis for the actual entrepreneurs’ model shows the oppo-site results, i.e. immigrants are less likely to start up a firm than native
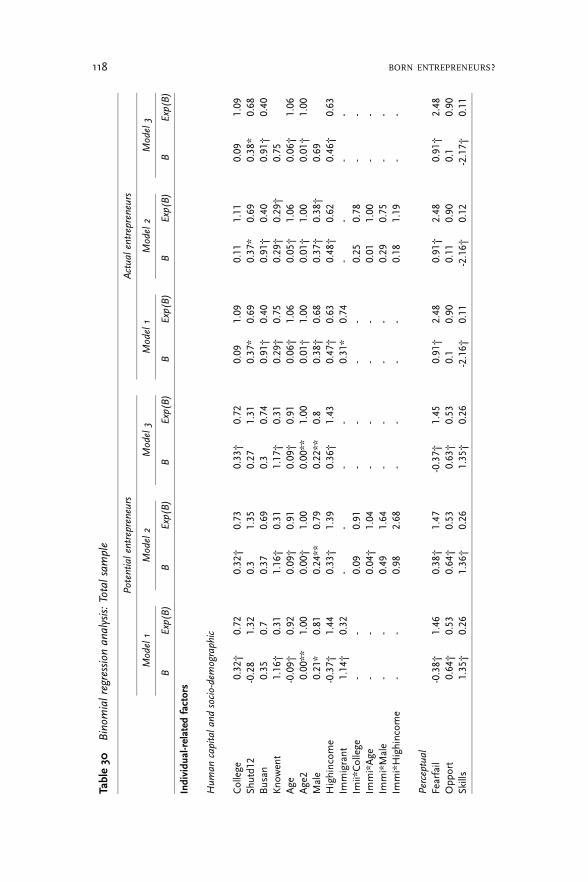
Table
30Binom
ialregression
analysis:Totalsample
Potential
entrepreneurs
Actual
entrepreneurs
Model1
Model2
Model3
Model1
Model2
Model3
BExp(B)
BExp(B)
BExp(B)
BExp(B)
BExp(B)
BExp(B)
Individual-related
factors
Human
capitalandsocio-demographic
College
0.32†
0.72
0.32†
0.73
0.33†
0.72
0.09
1.09
0.11
1.11
0.09
1.09
Shutd1
2-0.28
1.32
0.3
1.35
0.27
1.31
0.37*
0.69
0.37
*0.69
0.38
*0.68
Busan
0.35
0.7
0.37
0.69
0.3
0.74
0.91†
0.40
0.91†
0.40
0.91†
0.40
Kno
wen
t1.16†
0.31
1.16†
0.31
1.17†
0.31
0.29†
0.75
0.29†
0.29†
0.75
Age
-0.09†
0.92
0.09†
0.91
0.09†
0.91
0.06†
1.06
0.05†
1.06
0.06†
1.06
Age2
0.00
**1.00
0.00†
1.00
0.00**
1.00
0.01†
1.00
0.01†
1.00
0.01†
1.00
Male
0.21*
0.81
0.24**
0.79
0.22**
0.8
0.38†
0.68
0.37†
0.38†
0.69
Highincom
e-0.37†
1.44
0.33†
1.39
0.36†
1.43
0.47†
0.63
0.48†
0.62
0.46†
0.63
Immigrant
1.14†
0.32
--
--
0.31*
0.74
--
--
Imii*College
--
0.09
0.91
--
--
0.25
0.78
--
Immi*Age
--
0.04†
1.04
--
--
0.01
1.00
--
Immi*Male
--
0.49
1.64
--
--
0.29
0.75
--
Immi*Highincom
e-
-0.98
2.68
--
--
0.18
1.19
--
Perceptual
Fearfail
-0.38†
1.46
0.38†
1.47
-0.37†
1.45
0.91†
2.48
0.91†
2.48
0.91†
2.48
Opp
ort
0.64
†0.53
0.64†
0.53
0.63†
0.53
0.1
0.90
0.11
0.90
0.1
0.90
Skills
1.35†
0.26
1.36†
0.26
1.35†
0.26
-2.16†
0.11
-2.16†
0.12
-2.17†
0.11
118 BORN ENTREPRENEURS?

Context-related
factors
Culture-related:Origin
Csamer
--
--
1.54†
0.21
--
--
0.18
0.83
Maghreb
--
--
-18.52
0.018
--
--
-1.27
0.28
Rafrica
--
--
0.8
0.45
--
--
-1.24
0.29
Asia
--
--
-19.75
0.03
--
--
-1.62
0.20
Environmental:Destiny
Urban
0.21
0.81
0.23
0.8
0.2
0.82
0.01
1.01
0.01
1.01
0.01
1.01
Pden
sity05
0.01
1.00
0.01
1.00
0.01
1.00
0.01
1.00
0.01
1.00
0.01
1.00
Une
mpl04
-05
-0.04*
0.96
-0.04*
0.96
-0.04**
0.96
0.02
1.02
0.02
1.02
0.02
1.02
New
firmspc03
0.13*
1.14
0.14*
1.15
0.14**
1.15
0.07
1.07
0.07
1.07
0.07
1.07
Con
stan
t1.54
*4.68
-0.83
0.44
-35.54
00.89*
0.41
0.82
0.44
3.11*
22.36
N87
6187
6187
619176
9176
9176
-2log-likelihoo
d25
20.41
2518.47
2509
.91
6232.60
6228.67
6229
.03
Nagelkerke’sR
0.19
0.19
0.19
0.27
0.27
0.27
Chi-squ
are
495.39†
497.33†
505.89†
1558
.18†
1562
.11†
1561.75†
†Sign
ificant
atthe0.01
level(1–tailed)
**Sign
ificant
atthe0.05
level(1–tailed)
*Sign
ificant
atthe0.1level(1–tailed)
RESULTS OF THE EMPIRICAL ANALYSIS 119
individuals. Similarly, I found other contrasting results between the po-tential and actual entrepreneurs’ models. For instance, male individualswho know entrepreneurs are more likely to show intent, but less likelyto start up a new business. Moreover, while a U-shape relationship ex-ists between individuals’ age and the intent to create a new firm, an in-verse U-shape relationship prevails between individual’s age and firmcreation in the actual entrepreneurs’ model.
The negative sign of the variable Highincome shown in both modelsindicates that obtaining a low income increases the probability ofindividuals to intent and to switch to start up a firm and thus, providessupport for the disadvantage hypothesis (Light 1972, 1979).
All the perceptual variables were significant in the potential entrepre-neurs’ models. Individuals who perceive good business opportunities,no fear for business failure and have a high self-confidence in them-selves are more likely to show intent to start up firms.
Interestingly, the sign of coefficients for the last two variables are theopposite again in the actual entrepreneurs’ models. These findings sug-gest that individuals who are more likely to create firms are not as opti-mistic as the individuals who show only intent to start up a newventure.
In sum, my results show that while immigrant individuals are morelikely to show intent to start up a new firm than their native counter-parts, the latter are more likely to get actually involved in entrepreneur-ial activities. The liability of foreignness faced by immigrants during ex-ante period, such as additional barriers associated with the difficultiesin raising funds, unfamiliarity with the market system, complex paper-work requirements, as well as a late recognition of an insufficient abilityto start up and run a new firm, may deter the entrepreneur to start up anew firm and thus explain this gap.
(2) Are there differences in the intent and the actual switch to become entrepre-neurs among immigrants by place of origin?
Ethnic and immigrant entrepreneurship literature suggests that the ori-gin of immigrants, the ethnic group they belong to, their cultural tradi-tion of self-employment, etc., explain the high propensity of certaingroups for self-employment (Light 1972; Aldrich and Waldinger 1990;Butler and Herring 1991; Clark and Drinkwater 1998; Hammarstedt2001; Constant et al. 2003; Levie 2007). Moreover, cross-country differ-ences affect entrepreneurial cognition and venture creation both insideand outside the home country (Busenitz and Lau 1996; Mitchell et al.2000; Mitchell et al. 2002a; Uhlaner and Thurik 2003). In other words,people who migrate from a country characterised by a highly
120 BORN ENTREPRENEURS?

entrepreneurial culture to another country would be more likely to cre-ate firms in the host country than those who migrate from less entre-preneurial areas.
As shown in Table 31, the third model exhibits that the intention ofimmigrants from Central and South America to become self-employedis higher than that of other foreigners. Nevertheless, I found no signifi-cant evidence to support that the propensity to start up firms variesacross immigrant groups. This finding could suggest the existence ofsome difficulties in the fulfilment of the desire to start an entrepreneur-ial process. In order to refine my analysis, the variable cultural support,an index suggested by the GEM project to measure the impact of na-tional and regional entrepreneurial culture on the entrepreneurial activ-ity, was included in my second set of analyses to predict the probabilitythat immigrants and natives would start firms. This variable was onlysignificant for the probability of native individuals to become actual en-trepreneurs, and, thus, my findings do not support hypothesis 4 con-cerning the effect of the national entrepreneurial culture on the likeli-hood of immigrants for becoming self-employed.
Table 31 Binomial regression analysis: Immigrants and natives
Potential entrepreneurs Actual entrepreneurs
Immigrants Natives Immigrants Natives
B Exp(B) B Exp(B) B Exp(B) B Exp(B)
Individual-related factors
Human capital and socio-demographic
Busan 10.47† 0 0.46 0.63 -1.49** 0.23 -1.00† 0.37Age - - -0.02† 0.98 - - -0.01** 0.99Years in Spain -0.27** 0.76 - - 0.03 1.03 - -Male 3.14† 0.04 0.25 0.78 -0.22 0.80 -0.36† 0.70High Income -5.49** 241.93 -0.37* 1.44 -0.75 0.47 -0.51† 0.60
Perceptual factors
Fearfail -1.68 5.39 -0.22 1.25 0.98* 2.66 0.94† 2.57Opport 1.55 0.21 0.47† 0.63 -0.56 0.57 -0.04 0.96Skills -2.47** 11.82 1.67† 0.19 -20.56 0.00 -2.16† 0.12Cultsup 0.14 1.15 0.11 1.12 -0.25 0.78 -0.10** 0.91
Constant 5.16 174.32 -1.37** 0.25 1.17 3.22 0.34 1.41N 85 3709 120 4458-2 log-likelihood 36.05 1061.48 96.23 3085.37Nagelkerke’s R 0.55 0.11 0.45 0.27Chi-square 29.45† 111.20† 44.93† 746.40†
† Significant at the 0.01 level (1 –tailed)** Significant at the 0.05 level (1 –tailed)* Significant at the 0.1 level (1 –tailed)
RESULTS OF THE EMPIRICAL ANALYSIS 121
(3) Does the intra-regional context of the host economy affect the intent or the ac-tual switch of individuals to become entrepreneurs?
Wagner and Sternberg (2004) state that, to date, most empirical studieson entrepreneurship have been carried out at the national level, ignor-ing the inter-regional differences within a particular country. Furtherstudies are needed in order to gain a better understanding of the effectof context-related variables at a regional level. Following the recommen-dation by Wagner and Sternberg (2004) I examined the influence of re-gional environmental variables on the intention of firm creation.
Environmental factors in the host regions can either boost venturecreation, or produce the opposite effect. My results show that the inten-tion of individuals to become entrepreneurs increases in regions wherethere is a higher density of new firms per capita and a lower unemploy-ment rate. These findings partially support hypothesis 5 for potentialentrepreneurs and confirm previous findings by Fotopoulos and Spence(2000), Morales and Peña (2003), Wagner and Sternberg (2004) andVan Stel et al. (2006). It is not surprising to find a larger number of in-dividuals intending to start businesses in locations where a high entre-preneurial activity prevails. The negative effect of unemployment on theintent to start up a firm may be explained by Reynolds’ argument thathigher unemployment rates are associated with lower market demand,which, in turn, prevents entrepreneurs from creating new businesses.Or, conversely, being an entrepreneur in a wealthy local economy withlow unemployment rates can be perceived as a more promising careerchoice. None of the environmental variables was found to be significantfor the actual entrepreneurs’ models.
(4) Do the determinants for immigrants’ self-employment differ from those of na-tive individuals?
I split my initial sample in two sub-samples to analyse and compare thedeterminants of the intent and the switch to actual firm creation be-tween immigrants and native individuals. At this stage of my study, Ihad to specify the models differently from the original model, since Iended up with a lower number of observations for each sub-sample. Ithus had to omit some explanatory variables examined in the modelstested in the first part of my analysis.
Table 31 shows that the explanatory power of the models applied tothe two sub-samples, immigrants and native individuals, are clearly dif-ferent. The Nagelkerke R-square is larger for the regressions run forimmigrants in both potential and actual entrepreneurs’ models; this
122 BORN ENTREPRENEURS?

seems logical considering the lower number of observations of thesamples.
I noted that being mature has a negative effect on the probability ofnatives who both intend and switch to become entrepreneurs.Furthermore, I found that the number of years spent in Spain by an im-migrant and being female has a negative effect on the self-employmentintention of immigrants. This may be due to the fact that immigrantsmay face a higher opportunity cost to become entrepreneurs as theyspend more time in the host economy and thereby find more attractiveways to integrate in the society. In contrast, native female individualsare more likely to start up a firm than native males. Interestingly, Ifound that, while having a business angel experience is significant andhas a very strong positive effect on the intention of immigrants to be-come self-employed, it has the opposite effect for actual entrepreneurs.According to my results, this human capital asset is not significant fornative individuals. These findings partially support my first hypothesisand confirm, to a large extent, previous empirical findings that link hu-man capital to the choice of becoming entrepreneurs (Butler andHerring 1991; Bates 1997; Mata and Pendakur 1999; Arenius andMinniti 2005; Levie 2007).
A high monthly earning has a negative effect on the intent and theactual switch to self-employment for both immigrants and native indivi-duals, with the effect being much stronger for immigrants in the firstmodel but not significant in the second one. This finding lends supportto the second part of my second hypothesis and is consistent with theresults of analyses conducted by Light (1972, 1979), Constant et al.(2003) and Bauder (2005).
Perceiving good entrepreneurial opportunities in the local economicenvironment increases the probability of native individuals who intendto start up a firm, whereas its effect is not significant for immigrants.This may be explained by the fact that immigrants are usually neces-sity-driven entrepreneurs rather than opportunity-driven ones. Lee,Wong and Ho (2005) and Arenius and Minniti (2005) reported similarfindings about the positive influence of perceiving entrepreneurial op-portunities in the propensity of individuals for firm creation.
Self-perception of entrepreneurial abilities and skills has a positive in-fluence on the entrepreneurial intent for native individuals but, unex-pectedly, has the opposite effect for immigrants. Immigrants who al-ready earn a high income are not likely to choose self-employment as acareer option, but firm creation becomes an alternative when immi-grants face difficulties in integrating the labour market of the hostcountry. From cross-tabs analyses, I noticed that only 6 per cent of im-migrants with high income and 12 per cent of immigrants with collegeeducation are potential entrepreneurs. This suggests that the human
RESULTS OF THE EMPIRICAL ANALYSIS 123

capital endowments and the entrepreneurial experience of potential im-migrant entrepreneurs are in general quite poor. Following the reason-ing advocated by the disadvantage hypothesis, my results show that theremaining 94 per cent and 88 per cent of immigrants with high earn-ings and college education, respectively, would not be planning to starta business because they already enjoy a comfortable socioeconomic si-tuation in the host economy.
In sum, whereas some factors have similar effects on the self-employ-ment propensity of immigrants and natives, others do not. It is note-worthy to mention that considering the magnitude of the coefficients,high-income immigrants are much more reluctant to start up firms thannative individuals. Furthermore, although low-income immigrant indivi-duals show intention to become entrepreneurs, they do not seem to belikely to become entrepreneurs. On the contrary, low income native in-dividuals are more likely not only to intend to become entrepreneurs,but also to actually become entrepreneurs.
6.2 Foreign-owned business survival
My second set of empirical analyses aims to examine the effects ofbeing an immigrant on firm survival. I conduct a set of Cox regressionanalysis and a series of simulations of Basque firms’ census data to an-swer to my three research questions related to factors affecting foreign-owned firms’ survival.
The results of the Cox regression analysis suggest that the origin ofentrepreneurs affects venture survival and that firms created by nativeentrepreneurs survive longer than those created by foreigners. I havecarried out two analyses in order to test the effect of the origin of entre-preneurs on firm survival (research question 5) and to compare the ex-planatory variables of the survival of foreign- and native-own firms (re-search question 6). Additionally, I run a third regression to analyse theeffect of specific industry sectors and their interaction with the originof the entrepreneur on venture survival. The results of these analysesare shown below.
(5) Are ventures created by foreign entrepreneurs in the Basque Country more orless likely to survive than those started by native entrepreneurs?
In the first analysis, the Cox regression covers the whole sample offirms in order to test the influence of the independent variableImmigrant on the dependent survival. I assigned a unit value to firmscreated by foreign entrepreneurs and 0 to those created by natives. The
124 BORN ENTREPRENEURS?

positive sign of the explanatory variable Immigrant shown in Table 32indicates, as expected, that the foreign origin of entrepreneurs has apositive effect on firm mortality and thus, a negative effect on venturesurvival; i.e. native-owned companies survive longer than foreign-owned. This finding confirms hypothesis 6a and previous studies onforeign-owned firms’ survival (e.g. Fertala 2004).
In the same analysis, I tested the effect of core variables such asfirms’ initial size, industry specific entry and exit rates and the locationof the firm on venture survival. I found that higher initial resources asmeasured by firm size and industry diversification have positive effectson venture survival. This confirmed my third set of hypotheses on sizeand experimental adaptation strategies for the whole sample of entre-preneurs operating in the Basque Country between 1993 and 2003.
The positive sign of the variable Indusexit shows that, as expected,firms operating in industry sectors with higher exit rates do not surviveas long as those which operate in sectors characterised by lower exitrates, while the negative sign of the variable Indusentry indicates that op-erating in industry sectors with higher entry rates has a positive effect onventure survival. These findings confirm part of my hypothesis 9a re-lated to the negative effect of high exit rates on venture survival and re-ject the other one, concerning the negative effect of high entry rates.
Table 32 Effect of origin of entrepreneurs on venture survival
Model I
B Exp(B)
Firm internal variablesHuman capital and socio-demographic
Immigrant 0.08* 0.92
Resources and strategies
Small 0.19** 0.83Diversific -0.66** 1.93
Firm external variablesIndustry sector
Indusentry -0.01** 0.99Indusexit 0.02** 1.02
Location
Urban 0.04** 0.96
N 67,747Significance 0.001
** Significant at the 0.01 level (1 –tailed)* Significant at the 0.05 level (1 –tailed)
RESULTS OF THE EMPIRICAL ANALYSIS 125
Finally, I found that the location in an urban area (i.e. any of thethree regions in which the county capitals are located) has a negative ef-fect on firm longevity, with firms started in a rural area surviving long-er. This finding does not confirm either the generalised hypothesis sup-ported in the literature (Stearns et al. 1995; Razin 1999; Littunen 2000;Peña 2004) or my hypothesis 9b.
(6) Are the determinants of business survival of native entrepreneurs similar tothose attributed to foreign entrepreneurs?
Next, I split the sample into two sub-samples: foreign entrepreneursand native entrepreneurs. I tested four models for foreign-owned firmsand three for native-owned firms with a Cox regression analysis. Thedecision to run more than one regression responds to the co-linearityproblems found in the correlation matrix between the variables Urban,Regimmi and Regunempl (refer to chapter five, section 5.6, for correla-tion matrixes). In the first two models a set of regressions were runwith an identical set of variables for both sub-samples. In these cases Ilooked for a comparative basis in order to observe similarities and dif-ferences between the significance of the same set of explanatory vari-ables. However, some of the variables of the last model applied to for-eign-owned firms differ from the ones applied to native-owned firmssince there were not enough cases for three of the explanatory variables,namely, Age, Male and Mobility. In the case of the variable Regimmi Iwas interested in testing the effect of locating a firm in those areas withhigher foreign population on the survival of foreign-owned firms butnot on the survival of native-owned firms. Therefore, I decided to main-tain the rest of the variables and add the variable Regimmi in the thirdmodel and Male and Age in the fourth one for companies started-up byforeign entrepreneurs, and Mobility for those created by natives.
Featuring results for foreign-owned firms, Table 33 shows that beingan older entrepreneur and experiencing industry diversification, i.e.moving from one industry sector to another between the year of incep-tion to firm closure, increase the likelihood of firm survival. These find-ings support previous work (Stuart and Abetti 1990; Cooper et al. 1989;Constant and Zimmermann 2004; Peña 2004) with respect to the hu-man capital attributes of foreign entrepreneurs as well as to the thesisof strategic experimentation strategies (Nicholls-Nixon et al. 2000). Myhypothesis 7a and 8b are also confirmed.
As expected, having a smaller firm (0-2 employees) decreases theprobability of survival for foreign-owned firms, whereas being located inareas with a high density of foreigners has a positive effect on foreign-owned firm survival. These findings confirm my hypotheses 8a and 9c.
126 BORN ENTREPRENEURS?
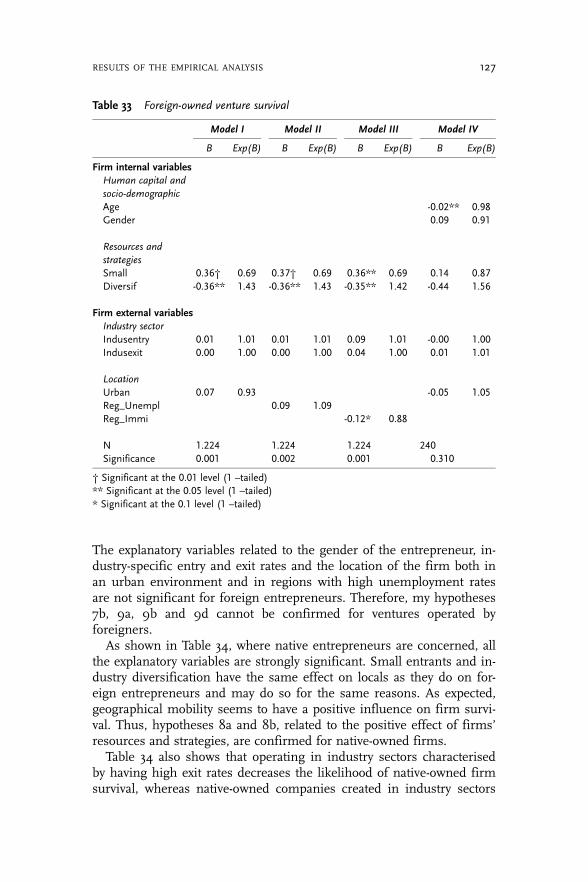
The explanatory variables related to the gender of the entrepreneur, in-dustry-specific entry and exit rates and the location of the firm both inan urban environment and in regions with high unemployment ratesare not significant for foreign entrepreneurs. Therefore, my hypotheses7b, 9a, 9b and 9d cannot be confirmed for ventures operated byforeigners.
As shown in Table 34, where native entrepreneurs are concerned, allthe explanatory variables are strongly significant. Small entrants and in-dustry diversification have the same effect on locals as they do on for-eign entrepreneurs and may do so for the same reasons. As expected,geographical mobility seems to have a positive influence on firm survi-val. Thus, hypotheses 8a and 8b, related to the positive effect of firms’resources and strategies, are confirmed for native-owned firms.
Table 34 also shows that operating in industry sectors characterisedby having high exit rates decreases the likelihood of native-owned firmsurvival, whereas native-owned companies created in industry sectors
Table 33 Foreign-owned venture survival
Model I Model II Model III Model IV
B Exp(B) B Exp(B) B Exp(B) B Exp(B)
Firm internal variables
Human capital and
socio-demographic
Age -0.02** 0.98Gender 0.09 0.91
Resources and
strategies
Small 0.36† 0.69 0.37† 0.69 0.36** 0.69 0.14 0.87Diversif -0.36** 1.43 -0.36** 1.43 -0.35** 1.42 -0.44 1.56
Firm external variables
Industry sector
Indusentry 0.01 1.01 0.01 1.01 0.09 1.01 -0.00 1.00Indusexit 0.00 1.00 0.00 1.00 0.04 1.00 0.01 1.01
Location
Urban 0.07 0.93 -0.05 1.05Reg_Unempl 0.09 1.09Reg_Immi -0.12* 0.88
N 1.224 1.224 1.224 240Significance 0.001 0.002 0.001 0.310
† Significant at the 0.01 level (1 –tailed)** Significant at the 0.05 level (1 –tailed)* Significant at the 0.1 level (1 –tailed)
RESULTS OF THE EMPIRICAL ANALYSIS 127
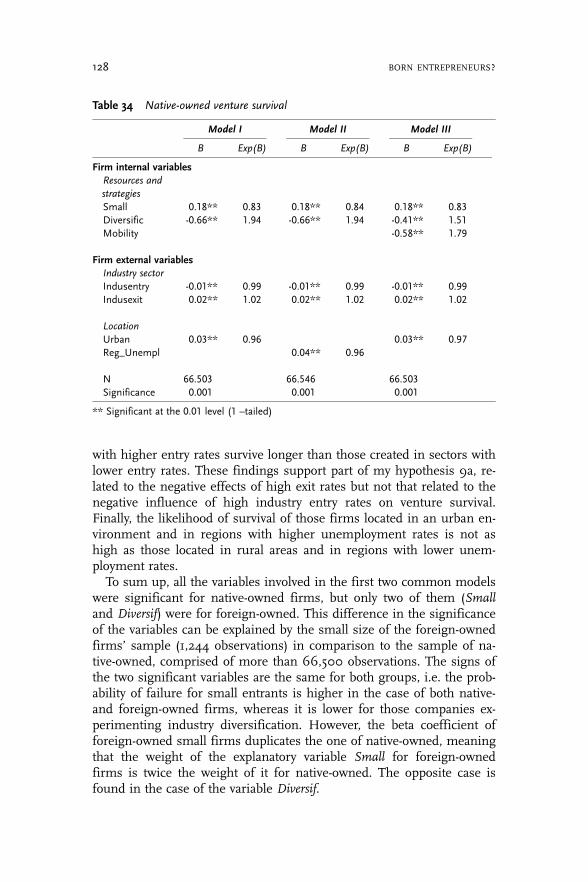
with higher entry rates survive longer than those created in sectors withlower entry rates. These findings support part of my hypothesis 9a, re-lated to the negative effects of high exit rates but not that related to thenegative influence of high industry entry rates on venture survival.Finally, the likelihood of survival of those firms located in an urban en-vironment and in regions with higher unemployment rates is not ashigh as those located in rural areas and in regions with lower unem-ployment rates.
To sum up, all the variables involved in the first two common modelswere significant for native-owned firms, but only two of them (Smalland Diversif) were for foreign-owned. This difference in the significanceof the variables can be explained by the small size of the foreign-ownedfirms’ sample (1,244 observations) in comparison to the sample of na-tive-owned, comprised of more than 66,500 observations. The signs ofthe two significant variables are the same for both groups, i.e. the prob-ability of failure for small entrants is higher in the case of both native-and foreign-owned firms, whereas it is lower for those companies ex-perimenting industry diversification. However, the beta coefficient offoreign-owned small firms duplicates the one of native-owned, meaningthat the weight of the explanatory variable Small for foreign-ownedfirms is twice the weight of it for native-owned. The opposite case isfound in the case of the variable Diversif.
Table 34 Native-owned venture survival
Model I Model II Model III
B Exp(B) B Exp(B) B Exp(B)
Firm internal variables
Resources and
strategies
Small 0.18** 0.83 0.18** 0.84 0.18** 0.83Diversific -0.66** 1.94 -0.66** 1.94 -0.41** 1.51Mobility -0.58** 1.79
Firm external variablesIndustry sector
Indusentry -0.01** 0.99 -0.01** 0.99 -0.01** 0.99Indusexit 0.02** 1.02 0.02** 1.02 0.02** 1.02
Location
Urban 0.03** 0.96 0.03** 0.97Reg_Unempl 0.04** 0.96
N 66.503 66.546 66.503Significance 0.001 0.001 0.001
** Significant at the 0.01 level (1 –tailed)
128 BORN ENTREPRENEURS?
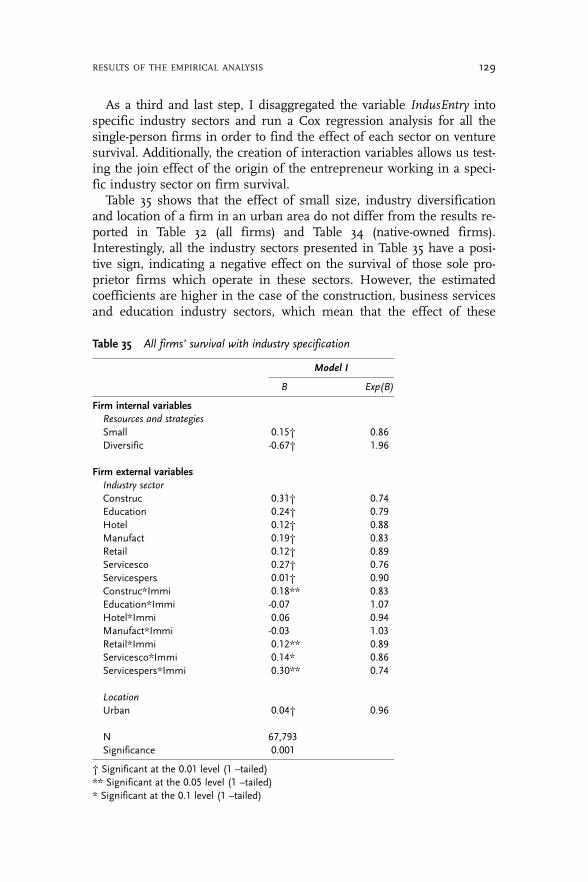
As a third and last step, I disaggregated the variable IndusEntry intospecific industry sectors and run a Cox regression analysis for all thesingle-person firms in order to find the effect of each sector on venturesurvival. Additionally, the creation of interaction variables allows us test-ing the join effect of the origin of the entrepreneur working in a speci-fic industry sector on firm survival.
Table 35 shows that the effect of small size, industry diversificationand location of a firm in an urban area do not differ from the results re-ported in Table 32 (all firms) and Table 34 (native-owned firms).Interestingly, all the industry sectors presented in Table 35 have a posi-tive sign, indicating a negative effect on the survival of those sole pro-prietor firms which operate in these sectors. However, the estimatedcoefficients are higher in the case of the construction, business servicesand education industry sectors, which mean that the effect of these
Table 35 All firms’ survival with industry specification
Model I
B Exp(B)
Firm internal variablesResources and strategies
Small 0.15† 0.86Diversific -0.67† 1.96
Firm external variables
Industry sector
Construc 0.31† 0.74Education 0.24† 0.79Hotel 0.12† 0.88Manufact 0.19† 0.83Retail 0.12† 0.89Servicesco 0.27† 0.76Servicespers 0.01† 0.90Construc*Immi 0.18** 0.83Education*Immi -0.07 1.07Hotel*Immi 0.06 0.94Manufact*Immi -0.03 1.03Retail*Immi 0.12** 0.89Servicesco*Immi 0.14* 0.86Servicespers*Immi 0.30** 0.74
Location
Urban 0.04† 0.96
N 67,793Significance 0.001
† Significant at the 0.01 level (1 –tailed)** Significant at the 0.05 level (1 –tailed)* Significant at the 0.1 level (1 –tailed)
RESULTS OF THE EMPIRICAL ANALYSIS 129
explanatory variables on the likelihood of mortality is higher than the ef-fect of hotel and catering, manufacturing and retail. Immigrants whocreated their company in the construction, retail, business services andpersonal service sectors do not survive as long as immigrants and na-tives who operate in other industries, being the sectors of personal ser-vices and construction the ones which have the strongest influence onfirm survival. Finally, the variables created from the interaction of theorigin of the entrepreneur and education, hotel and manufacturing arenot significant.
A possible explanation to the unexpected positive effect of operatingin industry sectors characterised by having high entry rates could be thegood health of these sectors, which exert a pull effect for new firms andextend their life duration. On the contrary, I argue that the lower survi-val rates of firms that operate in the construction industry sector is ow-ing to the nature of the sector, where often the short life of firms coin-cides with the duration of each project. The unexpected positive effect ofhigh unemployment rates on survival could mean that entrepreneurscease operations to take paid employment during periods of low unem-ployment and, vice versa, the lack of better job opportunities that charac-terised periods of high unemployment may encourage entrepreneurs tocontinue their business even when the results may not be so satisfac-tory. For its part, the negative effect of locating a firm in an urban envir-onment could be explained by a higher competition level and greaterfixed operating costs than in rural areas. Yet the disadvantage situationthat companies located in rural areas are expected to have in terms ofthe proximity of clients and suppliers should not be so significant in theBasque Country because it scopes over a relatively small geographicalarea where the population density is high and the communication infra-structure system good. Thus, firms operating in urban areas would needa higher profit margin than those operating in rural areas to cover costs.
Preliminary analysis of my data showed a gap between foreign andnative-owned firms, with native-owned surviving the longest. Cox re-gression cannot, however, explain this gap. Below I present a series ofsimulations that explore the role of behaviour – which involves the abil-ity to run a business as well as the reaction to firm-external effects suchas macroeconomic conditions, customers’ attitude towards them, etc. –versus endowments in explaining the persistent survival differences be-tween native- and foreign-owned ventures (research question 7). I carryout this analysis for two different models: the first one will include onlythose variables that were significant for both native- and foreign-ownedfirms (Small, Diversif and Construc), whereas in the second one all thekey explanatory variables with industry specification are included(Small, Diversif, Construc, Edu, Hotel, Manufact, Retail, Servicesco,Servicespers and Urban).
130 BORN ENTREPRENEURS?

(7) How can the differences in survival between foreign- versus native-ownedfirms be explained? Is there any ‘liability of foreignness’ embedded in the en-trepreneurial process of foreign-owned firms?
Graph 18 shows the survival rates of native-owned firms as well asthose of native-owned firms simulating foreign-owned both in terms ofbehaviour and endowments, obtained from the regression of the signifi-cant variables.
The average likelihood of mortality for native-owned firms operatingin the Basque Country between years 1993 and 2003 is 14.1 per cent.When I make native-owned firms act like foreign-owned by substitutingthe beta coefficients obtained in the Cox regression analysis, the prob-ability of death increases up to 34.5 per cent, reaching the real esti-mated likelihood of foreign-owned firms. On the contrary, when I givenative-owned firms the endowments of foreign-owned by substitutingthe average endowments of each of the three significant explanatoryvariables (namely, size, industry diversification and construction) thevariation in the probability of death is not significant. If all the key ex-planatory variables are considered (simulations with all the key explana-tory variables are available from the author under request), a small shiftis perceived in the endowment line. The probability of failure of native-owned firms reaches 36.5 per cent. As in the previous analysis, thesepercentages increases (up to 42.8 per cent) if I make native-owned be-have as foreign-owned. The shift in the likelihood of mortality for na-tive-owned firms simulating foreign-owned endowments (from 36.5 to38.1 per cent) is much lower than the growth resulting from the beha-viour effect of native-owned simulating foreign-owned firms. The main
Graph 18 Native-owned firms simulating foreign-owned: Significant variables
34.51
14.10
14.63
10
15
20
25
30
35
40
45
50
Native-owned Native-owned simulating foreign-owned
Behaviour Endowment
Mor
talit
y (%
)
RESULTS OF THE EMPIRICAL ANALYSIS 131
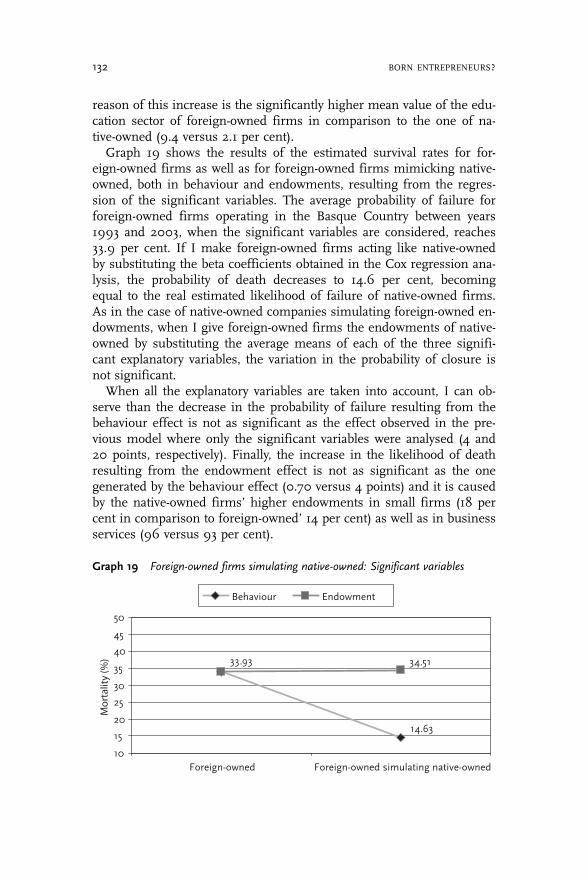
reason of this increase is the significantly higher mean value of the edu-cation sector of foreign-owned firms in comparison to the one of na-tive-owned (9.4 versus 2.1 per cent).
Graph 19 shows the results of the estimated survival rates for for-eign-owned firms as well as for foreign-owned firms mimicking native-owned, both in behaviour and endowments, resulting from the regres-sion of the significant variables. The average probability of failure forforeign-owned firms operating in the Basque Country between years1993 and 2003, when the significant variables are considered, reaches33.9 per cent. If I make foreign-owned firms acting like native-ownedby substituting the beta coefficients obtained in the Cox regression ana-lysis, the probability of death decreases to 14.6 per cent, becomingequal to the real estimated likelihood of failure of native-owned firms.As in the case of native-owned companies simulating foreign-owned en-dowments, when I give foreign-owned firms the endowments of native-owned by substituting the average means of each of the three signifi-cant explanatory variables, the variation in the probability of closure isnot significant.
When all the explanatory variables are taken into account, I can ob-serve than the decrease in the probability of failure resulting from thebehaviour effect is not as significant as the effect observed in the pre-vious model where only the significant variables were analysed (4 and20 points, respectively). Finally, the increase in the likelihood of deathresulting from the endowment effect is not as significant as the onegenerated by the behaviour effect (0.70 versus 4 points) and it is causedby the native-owned firms’ higher endowments in small firms (18 percent in comparison to foreign-owned’ 14 per cent) as well as in businessservices (96 versus 93 per cent).
Graph 19 Foreign-owned firms simulating native-owned: Significant variables
33.93
14.63
34.51
10
15
20
25
30
35
40
45
50
Foreign-owned Foreign-owned simulating native-owned
Behaviour Endowment
Mor
talit
y (%
)
132 BORN ENTREPRENEURS?
These findings confirm the results obtained in the Cox regressionanalysis, where I found that the probability of death for foreign-ownedfirms is higher than that of native-owned. They show that (i) as ex-pected, the gap in the likelihood of mortality between native-owned ver-sus foreign-owned firms is due to their behaviour and not to their initi-al endowments and that (ii) this gap would disappear if foreign-ownedfirms acted like native-owned firms and vice versa. Since the behavioureffect – i.e. differences in the ability to run a business and the reactionto firm-external factors between immigrant and native entrepreneurs –explains the existing venture-survival gap, I suggest that immigrant en-trepreneurs face the ‘liability of foreignness’ problem, understood asthe disadvantage situation they find at running a business in a foreigncountry, originated as a result of a lack of knowledge of the host marketrules, language skills and experience, and discrimination. This findingsupports my hypothesis 6b.
6.3 Economic benefits of immigrants’ self-employment
Finally, I conducted a chi-square test and two binomial logistic regressionanalyses to assess the economic benefits that immigrants may obtainfrom self-employment and answer my last two research questions. First,the chi-square test is used to see if there is an income gap between self-employed and salaried immigrants (research question 8). Second, I run abinomial logistic regression to compare the effect of a set of independentvariables on the earnings of self-employed and salaried immigrants (re-search question 9). The results of these analyses are shown next.
(8) Is there any significant difference between the earnings of self-employed andsalaried immigrants?
The chi-square test indicates that there are significant differences in theincome distribution between entrepreneurial and salaried immigrants.The income distribution of self-employed and salaried immigrants isshown in Table 36, where the percentage of self-employed immigrantsis slightly superior for the highest income levels (i.e. 30.7 per cent ofself-employed immigrants earn more than E 1,800/month, while only25.9 per cent of salaried immigrants do). This finding confirms my hy-pothesis 10a and supports previous findings by Borjas (1986), Butlerand Herring (1991) and Constant et al. (2003).
The positive answer to this question led me to conduct a second analy-sis on the effect of a certain number of individual-related and
RESULTS OF THE EMPIRICAL ANALYSIS 133
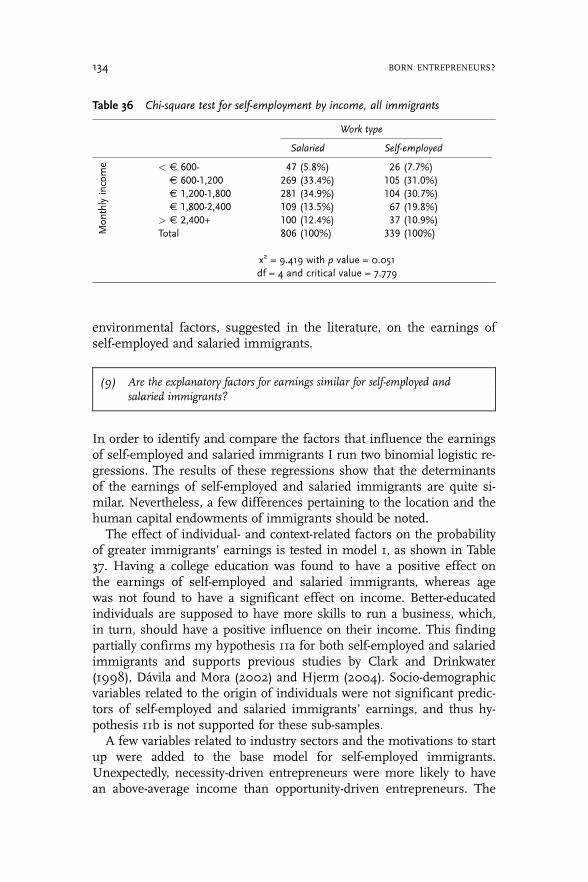
environmental factors, suggested in the literature, on the earnings ofself-employed and salaried immigrants.
(9) Are the explanatory factors for earnings similar for self-employed andsalaried immigrants?
In order to identify and compare the factors that influence the earningsof self-employed and salaried immigrants I run two binomial logistic re-gressions. The results of these regressions show that the determinantsof the earnings of self-employed and salaried immigrants are quite si-milar. Nevertheless, a few differences pertaining to the location and thehuman capital endowments of immigrants should be noted.
The effect of individual- and context-related factors on the probabilityof greater immigrants’ earnings is tested in model 1, as shown in Table37. Having a college education was found to have a positive effect onthe earnings of self-employed and salaried immigrants, whereas agewas not found to have a significant effect on income. Better-educatedindividuals are supposed to have more skills to run a business, which,in turn, should have a positive influence on their income. This findingpartially confirms my hypothesis 11a for both self-employed and salariedimmigrants and supports previous studies by Clark and Drinkwater(1998), Dávila and Mora (2002) and Hjerm (2004). Socio-demographicvariables related to the origin of individuals were not significant predic-tors of self-employed and salaried immigrants’ earnings, and thus hy-pothesis 11b is not supported for these sub-samples.
A few variables related to industry sectors and the motivations to startup were added to the base model for self-employed immigrants.Unexpectedly, necessity-driven entrepreneurs were more likely to havean above-average income than opportunity-driven entrepreneurs. The
Table 36 Chi-square test for self-employment by income, all immigrants
Work type
Salaried Self-employed
Mon
thlyincome < E 600- 47 (5.8%) 26 (7.7%)
E 600-1,200 269 (33.4%) 105 (31.0%)E 1,200-1,800 281 (34.9%) 104 (30.7%)E 1,800-2,400 109 (13.5%) 67 (19.8%)
> E 2,400+ 100 (12.4%) 37 (10.9%)Total 806 (100%) 339 (100%)
x2 = 9.419 with p value = 0.051
df = 4 and critical value = 7.779
134 BORN ENTREPRENEURS?
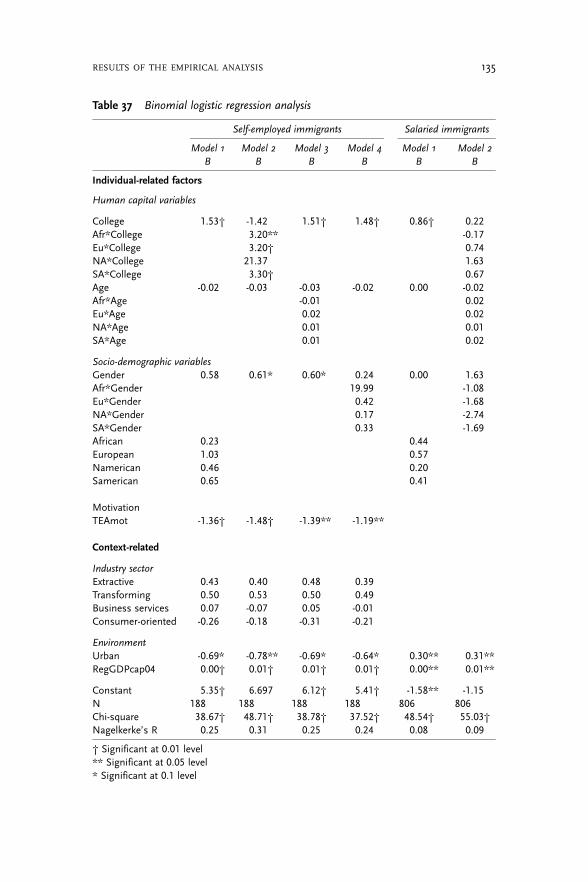
Table 37 Binomial logistic regression analysis
Self-employed immigrants Salaried immigrants
Model 1 Model 2 Model 3 Model 4 Model 1 Model 2
B B B B B B
Individual-related factors
Human capital variables
College 1.53† -1.42 1.51† 1.48† 0.86† 0.22Afr*College 3.20** -0.17Eu*College 3.20† 0.74NA*College 21.37 1.63SA*College 3.30† 0.67Age -0.02 -0.03 -0.03 -0.02 0.00 -0.02Afr*Age -0.01 0.02Eu*Age 0.02 0.02NA*Age 0.01 0.01SA*Age 0.01 0.02
Socio-demographic variables
Gender 0.58 0.61* 0.60* 0.24 0.00 1.63Afr*Gender 19.99 -1.08Eu*Gender 0.42 -1.68NA*Gender 0.17 -2.74SA*Gender 0.33 -1.69African 0.23 0.44European 1.03 0.57Namerican 0.46 0.20Samerican 0.65 0.41
MotivationTEAmot -1.36† -1.48† -1.39** -1.19**
Context-related
Industry sector
Extractive 0.43 0.40 0.48 0.39Transforming 0.50 0.53 0.50 0.49Business services 0.07 -0.07 0.05 -0.01Consumer-oriented -0.26 -0.18 -0.31 -0.21
Environment
Urban -0.69* -0.78** -0.69* -0.64* 0.30** 0.31**RegGDPcap04 0.00† 0.01† 0.01† 0.01† 0.00** 0.01**
Constant 5.35† 6.697 6.12† 5.41† -1.58** -1.15N 188 188 188 188 806 806Chi-square 38.67† 48.71† 38.78† 37.52† 48.54† 55.03†Nagelkerke’s R 0.25 0.31 0.25 0.24 0.08 0.09
† Significant at 0.01 level** Significant at 0.05 level* Significant at 0.1 level
RESULTS OF THE EMPIRICAL ANALYSIS 135

high risk usually involved in opportunity-driven ventures may indeedresult in more business failures. The income of opportunity-driven im-migrant entrepreneurs might therefore be, on average, lower than thatearned by necessity-driven business owners. Hence, hypothesis 10b isrejected for self-employed immigrants.
Environment-related variables were found to be significant for bothself-employed and salaried immigrants. The earnings of self-employedand salaried immigrants living in wealthier regions were more likely tobe above average than their counterparts’. Nevertheless, whereas livingin an urban area increased the probability of greater income for salariedimmigrants, the opposite was found for self-employed immigrants. Thenegative effect of living in urban areas on the income of the self-em-ployed may be due to the high cost of urban commercial premises thatleave a smaller profit margin to entrepreneurs. In sum, my hypothesis12b is completely supported for salaried immigrants and only partiallyfor the self-employed. None of the industry-related variables were signif-icant and thus hypothesis 12a was not supported for immigrantentrepreneurs.
In short, self-employed immigrants who fill one of the following con-ditions, i.e. holding a college degree, being necessity-driven, or livingeither in rural areas or wealthier regions, are expected to reap above-average earnings. On the other hand, the income of salaried immigrantswho have a college education or live either in urban areas or in wealthierregions is likely to be greater than for other salaried immigrants.
Additional models included interaction variables in order to capturethe joined effect of the origin of individuals and human capital vari-ables. Due to the modest number of observations for self-employed im-migrants, I ran three regression analyses to include interaction variablescombining education level, age and gender of individuals with their ori-gin (models 2, 3 and 4). As shown in Table 37, the effect of interactionvariables was stronger for self-employed than for salaried immigrants.On the one hand, I found that the earnings of highly educated, self-em-ployed Africans, Europeans and South Americans were more likely tobe above average than those of their counterparts. On the other hand,my results show that, while being male increased the probability ofabove-average earnings from self-employment in models 2 and 3, noneof the interaction variables combining the origin, the age and gender ofindividuals were significant.
The findings of the three empirical analyses are summarised and re-lated to the hypotheses formulated in chapter five next.
136 BORN ENTREPRENEURS?

6.4 Summary of findings
In this dissertation the entrepreneurial propensity and business perfor-mance of immigrants are examined. I do this by conducting three setsof empirical analysis. First, I addressed the subject of the intent andpropensity of individuals, immigrants and natives, to engage in entre-preneurial activities and found that while immigrant individuals aremore likely to show intent to become entrepreneurs, native individualsare more likely to actually create a new venture. My results also showthat origin-related factors are significant to explain inter-group differ-ences in the intention to undertake entrepreneurial activities, withCentral and South American individuals being more likely to show anintent to become self-employed than people from other geographicalareas. Finally, context-related factors also explain the intent but not theprobability of really engaging in entrepreneurial activities.
Second, I sought to assess business survival differences between for-eign and native-owned sole proprietor firms. The findings show thatthe foreign birth status of entrepreneurs affects survival, with firms cre-ated by natives surviving longer than foreign-owned ventures. Based onthe result of the simulation analyses, I suggest that the main differ-ences in survival between native- and foreign-owned firms are causedby the liability of foreignness, i.e. a disadvantage situation originated asa result of a lack of knowledge of the host market rules, language skillsand experience, and discrimination, which makes the immigrant entre-preneurs’ ability to run a business in a foreign country as well as theirreaction to environmental factors less effective and favourable.
Finally, I examined the earnings of self-employed and salaried immi-grants in Spain, and found that earnings of immigrant entrepreneurswere slightly greater than those of salaried immigrants. Human capitalvariables, such as educational levels, and environmental variables re-lated to the location of individuals and firms were found to be the mostsignificant predictors of both self-employed and salaried immigrants’earnings.
Table 38 summarises the main results of the empirical study. A moredetailed discussion of these findings follows.
RESULTS OF THE EMPIRICAL ANALYSIS 137
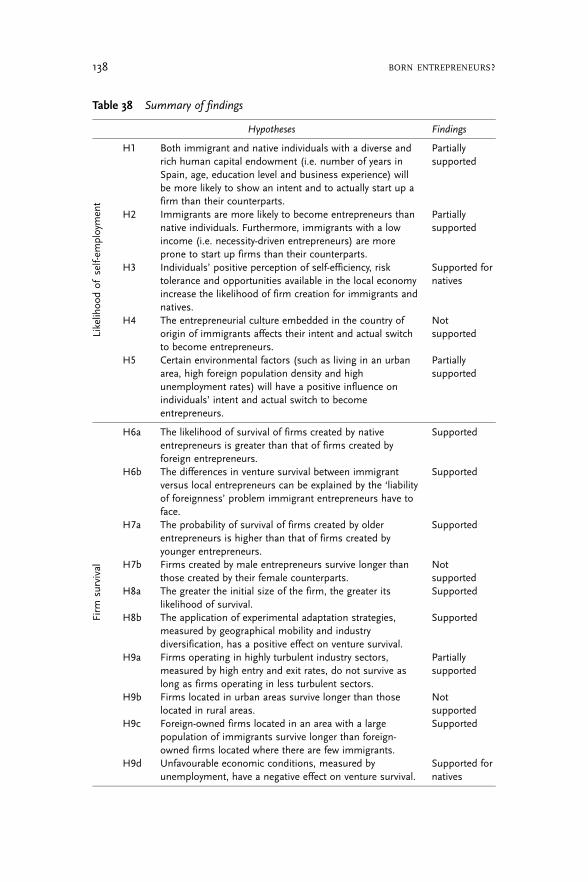
Table 38 Summary of findings
Hypotheses Findings
Likelihoo
dof
self-em
ploymen
t
H1 Both immigrant and native individuals with a diverse andrich human capital endowment (i.e. number of years inSpain, age, education level and business experience) willbe more likely to show an intent and to actually start up afirm than their counterparts.
Partiallysupported
H2 Immigrants are more likely to become entrepreneurs thannative individuals. Furthermore, immigrants with a lowincome (i.e. necessity-driven entrepreneurs) are moreprone to start up firms than their counterparts.
Partiallysupported
H3 Individuals’ positive perception of self-efficiency, risktolerance and opportunities available in the local economyincrease the likelihood of firm creation for immigrants andnatives.
Supported fornatives
H4 The entrepreneurial culture embedded in the country oforigin of immigrants affects their intent and actual switchto become entrepreneurs.
Notsupported
H5 Certain environmental factors (such as living in an urbanarea, high foreign population density and highunemployment rates) will have a positive influence onindividuals’ intent and actual switch to becomeentrepreneurs.
Partiallysupported
H6a The likelihood of survival of firms created by nativeentrepreneurs is greater than that of firms created byforeign entrepreneurs.
Supported
H6b The differences in venture survival between immigrantversus local entrepreneurs can be explained by the ‘liabilityof foreignness’ problem immigrant entrepreneurs have toface.
Supported
H7a The probability of survival of firms created by olderentrepreneurs is higher than that of firms created byyounger entrepreneurs.
Supported
H7b Firms created by male entrepreneurs survive longer thanthose created by their female counterparts.
Notsupported
H8a The greater the initial size of the firm, the greater itslikelihood of survival.
Supported
H8b The application of experimental adaptation strategies,measured by geographical mobility and industrydiversification, has a positive effect on venture survival.
SupportedFirm
survival
H9a Firms operating in highly turbulent industry sectors,measured by high entry and exit rates, do not survive aslong as firms operating in less turbulent sectors.
Partiallysupported
H9b Firms located in urban areas survive longer than thoselocated in rural areas.
Notsupported
H9c Foreign-owned firms located in an area with a largepopulation of immigrants survive longer than foreign-owned firms located where there are few immigrants.
Supported
H9d Unfavourable economic conditions, measured byunemployment, have a negative effect on venture survival.
Supported fornatives
138 BORN ENTREPRENEURS?

Hypotheses FindingsEcon
omic
bene
fitsof
self-em
ploymen
t
H10a Self-employed immigrants are likely to earn more thansalaried immigrants.
Supported
H10b Opportunity-driven immigrant entrepreneurs are likely toearn more than their necessity-driven counterparts.
Notsupported
H11a Factors enriching the human capital of individuals (i.e.education and experience) are positively associated withimmigrants’ earnings.
Supported
H11b Immigrants from socio-economically advanced regions arelikely to earn more than immigrants from less advancedcountries.
Notsupported
H12a Self-employed immigrants operating in transformingindustry sectors are likely to earn more than theircounterparts.
Notsupported
H12b Immigrants working in wealthier regions and inmetropolitan areas are likely to earn more than theircounterparts.
Partiallysupported
RESULTS OF THE EMPIRICAL ANALYSIS 139


Part IV: Conclusions and implications


7 Final conclusions
The entrepreneurial activity of immigrants is increasingly attracting theattention of researchers, policymakers, financial institutions and otherbusiness stakeholders. This is due to the proliferation and visibility offoreign-owned businesses in metropolitan areas all over the world. InSpain, where the percentage of foreign population increased from 1.6per cent in 1998 to almost 10 per cent in 2007, the number of foreign-ers registered with the Social Security department as self-employed roseto almost 5 per cent of the total self-employed population by 2005. Thisreality is particularly noticeable in certain areas of large cities such asMadrid and Barcelona. However, not all businesses run by immigrantsare noticeable and different from those run by natives.
This dissertation aimed to analyse different aspects of the entrepre-neurial activity of immigrants in Spain and the Basque Country. In thischapter I discuss my key findings, resume the debate on the conceptsof ethnic and immigrant literature, briefly comment on the efficiency ofentrepreneurship as a means of social integration and present the lim-itations of the study.
7.1 Discussion of the main findings
The entrepreneurial activity of immigrants and ethnic minorities hasbeen scrutinised in countries with a long immigration history, such asthe US, Canada, Australia and the UK, whereas in countries such asSpain, where immigration is a recent phenomenon, the literature in thefield is scarce. In addition, immigrant entrepreneurship has been stu-died mainly by sociologists and anthropologists, who focused on theethno-cultural characteristics of immigrants, often ignoring individualattributes such as human capital. Even the ‘embedded’ model suggestedby Aldrich and Waldinger (1990) to study the entrepreneurial propen-sity of immigrants and ethnic minority groups, which includes bothgroup characteristics and environmental factors, focuses on inter-groupdifferences in self-employment. Hence, this approach also emphasisescultural characteristics to the detriment of individual ones. More re-cently, a few economists (Bates 1997; Constant and Zimmermann

2004; Fertala 2004; Levie 2007) have analysed the self-employmentpropensity of immigrants and ethnic minorities by highlighting the hu-man capital and the socio-demographic characteristics of entrepreneurs.Nevertheless, whereas all these authors studied the likelihood of immi-grants and ethnic minority members to become entrepreneurs, onlytwo of them – Bates (1997) and Fertala (2004) – analysed the survivalrates of their firms. In this dissertation I proposed to contribute to theliterature by comparing the entrepreneurial activity of immigrant andnative entrepreneurs, both in the start-up process and in the post-crea-tion stage, based on a framework that includes three levels of analysis:the individual, the firm and its environment (research objective 1).
More specifically, first, I studied the intention and propensity of im-migrant and native individuals to engage in entrepreneurial activities(research objective 1.1). I found that, while immigrants are more likelyto intend to become entrepreneurs, natives are more likely to actuallycreate a new venture. The obstacles immigrants often face in their at-tempts to access the labour market and their liability of foreignnessmay partially explain my finding.
Second, I analysed the performance (survival and generated income)of firms created by immigrants (research objectives 1.2). Specifically, thesecond set of empirical tests aimed to assess business survival differ-ences between foreign- and native-owned sole-proprietor firms. I foundthat firms created by natives survived longer than foreign-owned ven-tures, and that the gap in the likelihood of closure between native- andforeign-owned firms is generated by the ‘behaviour effect’, i.e. the abilityof the entrepreneur to run a business and react to environmental condi-tions, and not by the ‘endowment effect’. As in the first set of analyses, Isuggested that the main differences in survival between native- and for-eign-owned firms were caused by the liability of foreignness. The latteris the result of a lack of knowledge of the host market rules, poor lan-guage skills, limited experience, and discrimination. This liability hin-ders the immigrant entrepreneurs’ ability to run a business in the hostcountry and makes their reaction to environmental factors less effective.
Finally, I found that the reported earnings of immigrant entrepre-neurs were slightly higher than those of salaried immigrants. This find-ing supports the socioeconomic advancement hypothesis proposed byConstant et al. (2003), which states that entrepreneurship can be anavenue for immigrants’ upward mobility in the host country.Unfortunately I could not test the relationship between business crea-tion and social participation due to the lack of pertinent data on thenumber of hours worked, the interaction of entrepreneurs with localpeople both at work and during their leisure time, and the natives’ atti-tudes towards immigrant businesses and individuals before and afterfirms are created. Hence, I could not contribute to the debate on the
144 BORN ENTREPRENEURS?
efficiency of self-employment as a means of social integration of immi-grants in the host society. To further explore the motivations and conse-quences of business creation (research objectives 2 and 2.1), next Ibriefly review the literature on the socio-economic benefits of self-em-ployment, by paying special attention to the results of a previous ex-ploratory study conducted by myself among immigrant small businessowners in the Basque Country (Irastorza and Peña 2008).
The economic and social benefits derived from business creation de-pend, to some extent, on the choices available to entrepreneurs in thelabour market and on the welfare system in the host country. On onehand, where individuals do not expect to find a satisfactory job in thewage labour market, self-employment can be a sound alternative. Onthe other hand, if the unemployment benefits in a particular country ex-ceed the economic returns of owning a business, the benefits derivedfrom self-employment are not economic, but may boost social wellbeingand personal self-esteem.
A controversy surrounds the benefits immigrants derive from self-employment. While some researchers suggest that business creationcan promote the socio-economic advancement of immigrants (Constantand Zimmermann 2004; Parella 2005), others contend the opposite(Hjerm 2004; Irastorza and Peña 2008). Hjerm (2004) questions theefficiency of self-employment as a means of socio-economic integrationin the host society, arguing that immigrant business owners often worklong hours, do not make large profits, and, thus, have little time left forsocial interactions away from work.
Half of the ten business owners who participated in the study ofIrastorza and Peña (2008) declared that they started a business in orderto improve their working conditions and for economic advancement (i.e. necessity-driven entrepreneurs). The GEM project defines necessity-driven entrepreneurs as individuals who become self-employed becausethey cannot find better employment. Hence, the profit and growth ex-pectations of businesses created by necessity-driven entrepreneurs arelikely to be lower than those of opportunity-driven entrepreneurs whocreate firms because they detect good business opportunities. These in-terviewees’ answers thus confirm the disadvantage hypothesis coinedby Light (1972). When asked whether their economic situation had im-proved since they became self-employed, four respondents said yes.However, all four of them added that they worked longer hours thanthey used to. Three other interviewees did not notice any socio-econom-ic advancement and the remainder confessed having lost money bystarting their own business. Finally, only one interviewee thought thathis social network had grown since he had been in business, and all theothers declared that they did not have time to socialise since theyworked very long hours.
FINAL CONCLUSIONS 145
To summarise, my third set of empirical tests indicated that self-em-ployed immigrants earned more than salaried ones. However, I lackeddata about key variables such as the number of hours worked. Due tothe liability of newness and the liability of smallness, new small busi-ness owners usually work longer hours than salaried workers in orderto survive the critical initial five-year period. Thus, had I been able tocontrol for the number of hours worked, my results may have beendifferent.
7.2 Ex-post discussion of ethnic/immigrant entrepreneurship
In the literature chapter of this dissertation the appropriateness of label-ling the entrepreneurial activity of immigrants and ethnic minorities asethnic or immigrant was discussed. The diversity extant in businessesrun by immigrants and members of ethnic minorities was simplified inprevious studies by overstressing entrepreneurs’ culture at the expenseof individual factors, by treating the whole population of immigrants ormembers of ethnic minorities as an homogeneous group, and, finally,by using the ambiguous concept of ethnicity to refer only to minorities.
Due to data limitations I could not carry out an exhaustive analysis ofbehavioural differences amongst immigrants from various ethnicgroups. Nevertheless, comparing foreign- and native-owned firms al-lowed me to reach some informed conclusions. My findings suggestthat the enterprising ability of immigrants differs from that of nativesin the following manner: more immigrants than natives intend to startbusinesses while they are less likely than natives to put their resolveinto practice. I argued that the first finding may be explained by the dis-advantage hypothesis (Light 1972) and the enterprising nature of immi-grants, and the second finding may be the result of the liability of for-eignness they experience. Hence, in both cases differences in the inten-tion and the propensity to start a business should not be attributed toethnicity, but to the availability of material resources (private property,human capital, investments [Light 1984]) and alternative employmentopportunities.
The same conclusion can be drawn from the main result of my sec-ond set of empirical tests: foreign-owned firms do not survive as longas native-owned firms. Once more I argued that the liability of foreign-ness, i.e. the unfamiliarity of the host market rules, poor languageskills, lack of work experience, and discrimination might cause thisgap. Therefore, the ethnicity argument cannot be used to explain thisfinding either.
To sum up, due to data limitations I could not compare previous stu-dies which treat the entrepreneurial activity of immigrants differently
146 BORN ENTREPRENEURS?

from that of natives’. Nevertheless, the results obtained in my empiricalanalysis allow me to make a modest contribution to this debate. Myfindings show that the differences in entrepreneurial attitude and beha-viour between immigrants and natives stem from unequal access to theopportunity structure, the availability of resources, the familiarity withthe host society’s rules, language and the market system, and not fromthe ethnicity or the origin of the entrepreneur.
7.3 Limitations of the study
In this section I present the general limitations of this dissertation aswell as the specific limitations of the empirical study.
An important limitation of my research work is data availability. Onone hand, firm census data provided by the Basque Statistical Instituteinclude a large number of individuals but a limited number of vari-ables. Furthermore, it allows distinguishing between foreign- and na-tive-owned sole-proprietor firms only. Hence, caution is recommendedin the interpretation of my results. The differences in initial endow-ments between native- and foreign-owned sole-proprietor firms, whichstart with similar human capital resources, are expected to be lowerthan the differences between native- and foreign-owned firms of all le-gal forms, where a higher heterogeneity of human capital and financialresources can be found and thus the lower initial endowments whichcharacterised foreign-owned firms is expected to have a more signifi-cant impact. I believe that if I analysed the whole population of firms(including all legal forms) operating in the Basque Country between1993 and 2003, the survival gap between foreign- and native-ownedfirms would increase. On the other hand, the selection of sole-proprie-tor firms allows the comparison of two groups with the same endow-ments in terms of number of entrepreneurs and similar sizes, facilitat-ing the test of the reasons behind these differences. The small numberof human capital explanatory variables in my database constitutes thesecond limitation of this study. Nevertheless, it should be noted that Iapplied a series of simulations that may have partly compensated formy limited data on the human capital characteristics of entrepreneurs.Thus, in spite of this shortcoming, I believe that the results are robustenough to contribute to and extend the scant literature on survival dif-ferences of foreign- and native-owned firms.
On the other hand, the GEM questionnaire was designed to analysethe early stages of entrepreneurial activity in various countries in thecontext of the economic growth of these countries. Thus, it is appropri-ate to study start-up processes and their determinant factors, but not toanalyse the labour market of those countries. This is especially
FINAL CONCLUSIONS 147

noticeable in my third set of empirical tests, where not only the predic-tive power of my models is limited, but also the sample size for the im-migrant entrepreneurs group is modest. Moreover, I could not assessthe opportunity cost of self-employment due to insufficient data, suchas the number of hours worked per week.
Moreover, the main target group of this dissertation is the immigrantpopulation and, more specifically, self-employed immigrants. Since theGlobal Entrepreneurship Monitor (GEM) conducts a yearly survey inwhich a limited number of immigrants participate, the data did not al-low me to carry out a more detailed analysis of immigrants by origin.Thus, in the main analyses conducted in this dissertation I could onlydifferentiate between natives and immigrants, treating them as two dis-tinct but internally homogeneous groups. To overcome this limitation,when the data allowed, I included origin-related factors as independentvariables in my model. Nevertheless, some sub-samples have a shortnumber of observations.
Finally, secondary data and quantitative methods were used in theempirical analysis of this dissertation. Quantitative methods are appro-priate to produce quantifiable data and results that can be generalisedto larger populations. However, since no database can capture all the in-dividuals and variables at work in real life, the application of quantita-tive methods on secondary data de-contextualises human behaviour andremoves the studied object from its real setting.
148 BORN ENTREPRENEURS?
8 Academic and policy implications
8.1 Policy implications
The main policy implications inferred from my study are summarisedhere. In each set of empirical studies conducted in this dissertation, Iidentify some gaps that could be filled with appropriate policy initia-tives. These gaps are as follows:L Firstly, there is a gap in the self-employment propensity of potential
and actual entrepreneurs, between immigrants and natives.Policymakers should bear in mind that the entrepreneurial intent ofan individual may not result in the creation of a firm by such an in-dividual; and that immigrants, as a disadvantaged group, may bemore likely to intend to start firms than natives, but, for similar rea-sons, less likely to succeed in doing so.
L Secondly, there is a gap in the survival rates of native- and foreign-owned firms, with the former surviving longer than the latter. I sug-gest that this may be caused by the liability of foreignness, i.e. ad-verse situations arising from a lack of familiarity with the host mar-ket rules, poor language skills, lack of work experience, anddiscrimination.
L Finally, there is an income gap between self-employed and salariedimmigrants, with the self-employed earning more than the salaried.This dissertation provides empirical evidence for slightly greatergains in immigrant earnings derived from self-employment thanfrom salaried employment. Various factors may cause this gap. Onthe one hand, salaried immigrants may face more obstacles in the la-bour market than native workers. Empirical studies show that, otherthings being equal, and depending on the industry sector, male im-migrants earn between 7.2 and 16.3 per cent less than native men(Martín 2006). On the other hand, apart from the traditional low-skilled and labour-intensive activities referred to in the immigrantentrepreneurship literature, immigrants may be creating innovativeand profitable businesses, and, thus, earning more.
L Policymakers should be aware of the increasing significance of theentrepreneurial activity of immigrants in Spain and offer tailored re-sponses to improve their economic integration in the situations

described above. Some policy initiatives that could help reduce thesegaps are:
L On the one hand, policymakers should study the wage labour marketand identify the factors that compel immigrants to resort to self-em-ployment; policies should reduce differences in access to the labourmarket and in job conditions. Initiatives could entail speeding up thework permit application process and the recognition of foreign cre-dentials, or adopting measures to combat discrimination towards sal-aried immigrants.
L On the other hand, policymakers should take into account factorsthat hinder the start-up process of immigrant firms. Policies whichfacilitate initial financing and make expert support available to immi-grant entrepreneurs during the initial years of their firms’ operationshould be adopted so that immigrants can overcome the additionalbarriers caused by the liability of foreignness both at the firm pre-creation and post-creation stages.
L Finally, the promotion of entrepreneurship should also target immi-grants who are increasingly becoming self-employed.
8.2 Future research suggestions
To conclude, in this section I suggest some ideas to further analyse thespecific topics of this dissertation as well as other related subjects forfuture research lines.
More exhaustive analyses of more complex databases (either in termsof number of variables or individuals) must be carried out. The labourmarket insertion of immigrants may vary over time, according to theregulatory framework and the development of the welfare state of hostcountries. An international comparison at different points in timewould provide an assessment of the effect of diverse social and institu-tional environments on the economic integration of immigrants.Finally, the application of qualitative techniques, such as in-depth inter-views, would result in a better understanding of the factors (motivation,business strategies and their consequences) underlying immigrants’ en-trepreneurial initiatives. More specifically, further in-depth analysis isneeded for reasons as follows:
(i) To explain the gap between the intent versus the act of becomingentrepreneurs for immigrants. I suggested that the liability of foreign-ness hinders the firm start-up process for immigrants; however, this to-pic remains unexplored.
(ii) To assess and compare the survival of foreign-owned firms overyears and across geographical areas. The exploratory analysis of my da-tabase indicates that there is a gap in mortality of firms created in 1994
150 BORN ENTREPRENEURS?
versus those created in 1998. It would be interesting to carry out thesame analysis at different points in time in order to test the effect of en-vironmental factors, such as economic growth and socio-demographicalchanges (e.g. an increase in the foreign population) on firm survival.Besides, a comparative study of foreign-owned firm survival across dif-ferent countries and different Spanish regions would provide an assess-ment of country and regional entrepreneurial opportunities as well aspolicy initiatives.
(iii) To explore the characteristics of firms’ created by immigrantssuch as the innovation activities and the technological level of firms,growth strategies and the initial financial capital of immigrantentrepreneurs.
(iv) Furthermore, the labour market situation and the earnings ofimmigrants may vary according to the regulatory frameworks and thedevelopment of the welfare state of various countries. A cross-countrycomparison would allow an assessment of the effect of diverse socialand institutional environments on the economic integration ofimmigrants.
Some additional topics related to the entrepreneurial activity of immi-grants that have remained largely unexplored are the following:L The ex-ante and ex-post immigration career of entrepreneurs. Very
few studies focus on the career paths of self-employed immigrants,before and after they immigrate. Does entrepreneurship affect immi-grants and natives alike? Can profiles of immigrant entrepreneurs bedrawn? What career path do immigrants who created and shut downfirms follow?
L Profiles of immigrant entrepreneurs. Studies on ethnic and immi-grant entrepreneurship often describe immigrant-owned businessesas small, local and labour-intensive. The strategic behaviour of immi-grant entrepreneurs has been linked to the characteristics of their re-spective ethnic groups (Leung 2001), often ignoring the heterogene-ity in the human capital characteristics and in the firms created byimmigrants with similar ethnic backgrounds. So far no serious at-tempt has been made to classify self-employed immigrants by theirhuman capital characteristics, their immigration history, or theirbusiness characteristics. Self-employed immigrants’ profiles wouldfill a gap in the literature and help design tailored responses to im-migrant entrepreneurs according to their particular needs.
L The relationship between immigration, immigrants’ entrepreneurialactivity, total entrepreneurial activity and economic growth of a coun-try. As a result of increasing migration from economically less devel-oped countries to Europe, the debate on the benefits and costs of im-migration has become one of the hot topics on the EU’s political
ACADEMIC AND POLICY IMPLICATIONS 151
agenda. Whereas governments are concerned with the level of sup-port granted to newcomers via their welfare systems, several authorshave found that immigration is beneficial for host economies (Borjas1995; Poot 2007), although there is no consensus on the extent ofthese benefits. Whereas Poot (2007) claims that new immigration in-creases the economic growth of host countries in several ways (risein national productivity, total entrepreneurial activity and innovation),Borjas (1995) contends that the economic benefits derived from im-migration in the US are modest, and he suggests the implementa-tion of policies to attract highly skilled immigrants. In addition, scantstudies quantified the relationship between immigration, the entre-preneurial activity of immigrants, the total entrepreneurial activityand the economic growth of a country. An international comparisonof the effect of migration (both immigration and emigration) on theentrepreneurial activity and the economic growth of countries wouldfill this gap in the literature.
152 BORN ENTREPRENEURS?
References
Aldrich, H. and R. Waldinger (1990), ‘Ethnicity and Entrepreneurship’, Annual Review ofSociology 16: 111-35.
Arenius, P. and M. Minniti (2005), ‘Perceptual Variables and Nascent Entrepreneurs’.Small Business Economics 24: 233-247.
Arias, A., Carvajal, P. and Peña, I. (2004), ‘Necessity- versus Opportunity-drivenEntrepreneurs: Evidence from Ecuador and Spain’, paper presented at the ‘BabsonKauffman Entrepreneurship Research Conference’, Glasgow, 3-5 June 2004.
Audretsch, D. B., P. Houweling and A.R. Thurik (2000), ‘Firm Survival in theNetherlands’, Review of Industrial Organisation 16 (1): 1-11
Audretsch, D.B. and Mahmood, T. (1995), ‘New Firm Survival: New Results Using aHazard Function’, The Review of Economics and Statistics 77 (1): 97-103.
Barney, J.B. (1995), ‘Looking Inside for Competitive Advantage’, Academy of ManagementExecutive 9 (4): 49-61.
Barney, J.B. (2001), ‘Resource-based Theories of Competitive Advantage: A Ten-yearRetrospective on the Resource-based View’, Journal of Management 27: 643-650.
Basu, A. and E. Altinay (2002), ‘The interaction between culture and entrepreneurship inLondon's immigrant business’, International Small Business Journal 20 (4): 371-400.
Bates, T. (1997), Race, Self-Employment and Mobility: An Illusive American Dream.Washington: The Woodrow Wilson Center Press.
Bauder, H. (2005), ‘Immigrants’ Attitudes towards Self-Employment: The Significance ofEthnic Origin, Rural and Urban Background and Labour Market Context’. RIIMWorking Paper Series: Paper No. 05-13. Vancouver Centre of Excellence.
Baycan Levent, T., E. Masurel and P. Nijkamp (2003), ‘Diversity in Entrepreneurship:Ethnic and Female Roles in Urban Economic Life’, International Journal of SocialEconomics 30 (11): 1131-1161.
Bearse, P.J. (1982), ‘A Study of Entrepreneurship by region and SMSA Sise’, in K. Vesper(ed.), Frontiers of Entrepreneurship Research, 78-112. Wellesley: Babson College.
Belso Martínez, J. A. (2004), ‘Una aproximación inicial al papel del Mercado de Trabajo,la Inmigración y la Conflictividad Socio-laboural como Factores Explicativos de laCreación de Empresas’. Estudios de Economía Aplicada 22(1): 67-82.
Beltrán, J. (2000), ‘La Empresa Familiar. Trabajo, Redes Sociales y Familia en el ColectivoChino’, Ofrim/Suplementos 6: 119-153.
Boden, R.J. and A.R. Nucci (2000), ‘On the Survival Prospects of Men’s and Women’sNew Business Ventures’, Journal of Business Venturing 15: 347-362.
Bonacich, E. (1973), ‘A Theory of Middleman Minorities’, American Sociological Review 38(5): 583-594.
Bonacich, E. (1987), ‘Making it in America’. Sociological Perspectives 30 (4): 446-67.Borjas, B.G. (1986), ‘The self-employment experience of immigrants’, The Journal of
Human Resources 21(4): 485-506.Borjas, G. J. (1995), ‘The Economic Benefits from Immigration’, Journal of Economic
Perspectives 9: 1–22.

Buckley, M. (1998), ‘Inmigración y Comercio en Madrid: Nuevos Negocios para NuevasGentes’, Anales de Geografía de la Universidad Complutense 18: 283-297.
Bull, I. and F. Winter (1991), ‘Community Differences in Business Births and BusinessGrowths’, Journal of Business Venturing 6: 29-43.
Busenitz, L. W. and C. Lau (1996), ‘A Cross-cultural Cognitive Model of New VentureCreation’. Entrepreneurship Theory and Practice 20(4): 25-39.
Butler, J.S. and C. Herring (1991), ‘Ethnicity and Entrepreneurship in America: Toward anExplanation of Racial and Ethnic Group Variations in Self-Employment’. SociologicalPerspectives 34(1): 79-94.
Carvajal, R.P. (2004), Empresas de nueva creación en la provincia de Tungurahua-Ecuador(1996-2000). Doctoral Thesis, University of Deusto, Donostia-San Sebastian.
Clark, K. and S. Drinkwater (1998), ‘Pushed Out or Pulled in? Self-employment amongEthnic Minorities in England and Wales’, paper presented at the ‘InternationalConference on Self-Employment’, Burlington, 24-26 September 1998. Available atwww.ciln.mcmaster.ca/papers/seconf/pushed.pdf.
Constant, E., Y. Schachmurove and K.F. Zimmermann (2003), ‘What makes an entrepre-neur and does it pay? Native men, Turks and other migrants in Germany’, IZADiscussion Paper No. 940.
Constant, E. and K.F. Zimmermann (2004), ‘The Making of Entrepreneurs in Germany:Are Native Men and Immigrants Alike?’ IZA Discussion Paper Series: PaperNo. 1440.
Cooper, A.C., W.C. Dunkelberg and C.Y. Woo (1989), ‘Entrepreneurship and the InitialSize of Firms’, Journal of Business Venturing 4: 317-332.
Corbett, A. and H. Neck (2007), ‘An Empirical Investigation of the Cognitions ofCorporate Entrepreneurs’, paper presented at the ‘Babson College EntrepreneurshipResearch Conference’, Madrid, 7-9 June 2007.
Dávila, A. and Mora, M.T. (2002), ‘English proficiency and immigrant entrepreneurial in-come in the U.S.’. Available at www.econ.duke.edu/aeasp/seminar_files/semi-nar2003_files/DAVMORA.pdf.
Engelen, E. (2001), ‘“Breaking in” and “breaking out”: A Weberian approach to entrepre-neurial opportunities’, Journal of Ethnic and Migration Studies 27(2): 203-223.
Evans, M.D.R. (1989), ‘Immigrant Entrepreneurship: Effects of Ethnic Market Sise andIsolated Labour Poor’. American Sociological Review 54(6): 950-962.
Fertala, N. (2004), ‘Do Human and Social Capital Investments Influence Survival? AStudy of Immigrant Entrepreneurship in Upper Bavaria’, paper presented at the‘Babson College Entrepreneurship Research Conference’, Glasgow, 3-5 December2004.
Fotopoulos, G. and N. Spence (2000), ‘Regional Variations of Firm Births, Deaths andGrowth Patterns in the UK, 1980-1991’. Growth and Change 32: 151-173.
Fritsch, M., U. Brixy and O. Falck (2006), ‘The Effect of Industry, Region, and Time onNew Business Survival – A Multi-Dimensional Analysis’, Review of IndustrialOrganisation 28: 285-306.
García Ballesteros, A. and A. Redondo González (2006), Inmigrantes emprendedores en laComunidad de Madrid, Comunidad de Madrid, Consejería de Economía e InnovaciónTecnológica.
Geroski, P.A. (1995), ‘What Do We Know about Entry?’, International Journal of IndustrialOrganisation 13: 421-220.
Gimeno, J., T.B. Folta, A.C. Cooper and C.Y. Woo (1997), ‘Survival of the Fittest?Entrepreneurial Human Capital and the Persistence of Underperforming Firms’,Administrative Science Quarterly 42: 750-783.
Hammarstedt, M. (2001), ‘Immigrant self-employment in Sweden - its variations andsome possible determinants’. Entrepreneurship & Regional Development 13 (2): 147-161.
154 BORN ENTREPRENEURS?

Hammarstedt, M. (2004), ‘Self-Employment among Immigrants in Sweden – An Analysisof Intragroup Differences’. Small Business Economics 23: 115-126.
Hammarstedt, M. (2006), ‘The predicted earnings differential and immigrant self-employ-ment in Sweden’, Applied Economics 38:619-630.
Hjerm, M. (2004), ‘Immigrant Entrepreneurship in the Swedish Welfare State’. Sociology38(4): 739-756.
Holt, D.H. (1987), ‘Network Support Systems: How Communities can EncourageEntrepreneurship’, in R. Ronstadt, J.A. Hornaday, R. Peterson and K.H. Vesper (eds.),Frontiers of Entrepreneurship Research, 44-56. Wellesley: Center for EntrepreneurialStudies, Babson College.
Honing, B. (2001), ‘Human Capital and Structural Upheaval: A Study of ManufacturingFirms in the West Bank’, Journal of Business Venturing 16: 575-594.
Instituto Nacional de Estadística (2007), ‘Encuesta de estructura salarial. Año 2002’.Available at www.ine.es/inebase/cgi/axi.
Irastorza, N. and I. Peña (2006), ‘Venture Survival of Immigrant versus LocalEntrepreneurs in the Basque Country’, paper presented at the ‘XX RENT Conference,ECSB’, Brussels, 22-24 November 2006.
Irastorza, N. and I. Peña (2007), ‘Entrepreneurial Activity of Immigrants versus Natives inSpain: Are Immigrants more Enterprising than Natives?’, paper presented at the‘Babson College Entrepreneurship Research Conference’, Madrid, 7-9 June 2007.
Irastorza, N. and I. Peña (2008), ‘Immigration and Self-Employment in the BasqueAutonomous Community: A Qualitative Approach’ in C. Firth and A. Ibarrola,Migrations in a Global Context: Transitions and Transformations Emerging fromInternational Human Mobility. Bilbao: Universidad de Deusto.
Kloosterman, R. and J. Rath (2001), ‘Immigrant Entrepreneurs in Advanced Economies’,Journal of Ethnic and Migration Studies: Special Issue on Immigrant Entrepreneurship 27(2): 189-201.
Kofman, E., A. Phizacklea, P. Raghuram and R. Sales (2005), Gender and InternationalMigration in Europe: Employment, Welfare and Politics. London: Routledge.
Lee, L., P. Wong and Y. Ho (2004) ‘Entrepreneurial Propensities: The Influence of Self-Efficacy, Opportunity Perception and Social Network’. NUS Working Paper 2004/02.NUS Entrepreneurial Centre, Singapore.
Lerner, M. (1997), ‘Israeli Women Entrepreneurs: An Examination of Factors AffectingPerformance’, Journal of Business Venturing 12: 315-339.
Leung, M.W.H. (2001), ‘Get IT going: New ethnic Chinese business. The case ofTaiwanese-owned computer rms in Hamburg’, Journal of Ethnic and Migration Studies27 (2): 277-294.
Levie, J (2005), ‘Immigration, in-migration, ethnicity and entrepreneurship: insights fromthe GEM UK database’. Second GEM Research Conference. Hungarian Academy ofSciences, Budapest.
Levie, J. (2007), ‘Immigration, In-Migration, Ethnicity and Entrepreneurship in theUnited Kingdom’. Small Business Economics 28: 143-169.
Ley, D. (2003), ‘Seeking Homo Economicus: The Strange Story of Canada’s BusinessImmigration Programme’, Annals of the Association of American Geographers 93 (2):426-441.
Light, I. (1972), Ethnic Enterprise in America. Berkley and London: University of CaliforniaPress.
Light, I. (1979), ‘Disadvantage minorities in self-employment’. International Journal ofComparative Sociology 20: 31-45.
Light, I. (1984), ‘Immigrant and ethnic enterprise in North America’, Ethnic and RacialStudies 7: 195-216.
REFERENCES 155

Light, I. and P. Bhachu (1993), Immigration and Entrepreneurship: Culture, Capital andEthnic Networks. New Brunswick: Transaction Publishers.
Light, I., P. Bhachu and S. Karageorgis (1993), ‘Migration Networks and ImmigrantEntrepreneurship’ in Light, I. And Bhachu, P. (eds.), Immigration andEntrepreneurship, 25-49. New Brunswick: Transactions Publishers.
Light, I. and S. Gold (2000), Ethnic Economies. San Diego, London and Sydney: AcademicPress.
Littunen, H. (2000), ‘Networks and Local Environmental Characteristics in the Survival ofNew Firms’, Small Business Economics 15: 59-71.
Martín, C. (2006), ‘Una comparación entre el salario de los trabajadores españoles y extra-njeros’, Revista del Ministerio de Trabajo y Asuntos Sociales: 61-76.
Massey, D.S. (1988), ‘Economic Development and International Migration in ComparativePerspective’, Population and Development Review 14: 383-413.
Mata, F. and R. Pendakur (1999), ‘Immigration, Labour Force Integration and the Pursuitof Self-employment’. International Migration Review 33 (2): 378-402.
Mata, J. and P. Portugal (1994), ‘Life Duration of New Firms’, The Journal of IndustrialEconomics 42 (3): 227-243.
Mata, J., P. Portugal and P. Guimarães (1995), ‘The Survival of New Plants: Star-upConditions and Post-Entry Evolution’, International Journal of Industrial Organisation13: 459-481.
Mitchell, R., B. Smith, K. Seawright and E. Morse (2000), ‘Cross-cultural Cognitions andthe Venture Creation Decision’. Academy of Management Journal 43 (5): 974-993.
Mitchell, R., B. Smith, E. Morse, K. Seawright, A. Peredo and B. McKenzie (2002a), ‘AreEntrepreneurial Cognitions Universal? Assessing Entrepreneurial Cognition acrossCultures’. Entrepreneurship Theory and Practice, Summer 2002: 9-32.
Mitchell, R., L. Busenitz, T. Lant, P. McDougall, E. Morse and B. Smith (2002b), ‘Towarda Theory of Entrepreneurial Cognition: Rethinking the People Side ofEntrepreneurship Research’. Entrepreneurship Theory and Practice, Winter: 93-104.
Morales, L. and I. Peña (2003), ‘Dinamismo de nuevas empresas y clusters naturales.Evidencia de la Comunidad Autónoma del País Vasco 1993-1999’. Ekonomiaz 53:160-183.
Nicholls-Nixon, C.L., A.C. Cooper and C.Y. Woo (2000), ‘Strategic Experimentation:Understanding Change and Performance’, New Ventures in Journal of BusinessVenturing 15: 493-521.
Oso, L., M. Villares and M. Golías (2006), O Colectivo Inmigrante ante o Proceso deEmprendemento, Santiago de Compostela, Secretaría Xeral de Emigración, Xuntade Galicia.
Parella, S. (2005), ‘Estrategias de los comercios étnicos en Barcelona, España’, Política yCultura 23: 257-275.
Parker (2004), The Economics of Self-Employment and Entrepreneurship, Cambridge:Cambridge University Press.
Peña, I (2002), ‘Intellectual Capital and Business Start-up Success’, Journal of IntellectualCapital 3 (2): 189-198.
Poot, J. (2007), ‘Demographic change and regional competitiveness: The effects of immi-gration and ageing’, Population Studies Centre Discussion Papers, Discussion Paper.
Portes, A. and R.D. Manning (1986), ‘The Immigrant Enclave: Theory and EmpiricalExamples’ in S. Olzak and J. Nagel (eds.), Competitive Ethnic Relations, 47-68. NewYork: Academic Press.
Portes, A. and L. Jensen (1989), ‘What’s an Ethnic Enclave? The Case for ConceptualClarity’, American Sociological Review 57: 768-771.
Portes, A. and R.G. Rumbaut (1990), Immigrant America. Berkeley: University ofCalifornia Press.
156 BORN ENTREPRENEURS?
Portes, A. and M. Zhou (1990), ‘Self-employment and the earnings of immigrants’,American Sociological Review 2: 219-230.
Ram, M. and T. Jones (1998), Ethnic minorities in business. Milton Keynes: Small BusinessResearch Trust, Open University Business School.
Rath, J. (2000), Immigrant Businesses: An Exploration of their Embeddedness in the Economic,Politico-Institutional and Social Environment, Houndmills, Basingstoke, Hampshire:Macmillan Press.
Rath, J. (2002), ‘A quintessential immigrant niche? The non-case of immigrants in theDutch construction industry’, Entrepreneurship and Regional Development 14: 355-372.
Rath, J. and R. Kloosterman (2000), ‘Outsiders’ Business: A Critical Review of Researchon Immigrant Entrepreneurship’, International Migration Review 34 (3): 657-681.
Razin, E. (1999), ‘Immigrant entrepreneurs and the urban milieu: evidence from the U.S., Canada and Israel’, RIIM Working Paper Series: Paper No. 99-1, Vancouver Centreof Excellence.
Rekers, A. and R. van Kempen (2000), ‘Location Matters: Ethnic Entrepreneurs and theSpatial Context’ in J. Rath (ed.), Immigrant Businesses: An Exploration of theirEmbeddedness in the Economic, Politico-Institutional and Social Environment, 54-69.Houndmills, Basingstoke, Hampshire: Macmillan Press.
Reynolds, P., B. Miller and W. Maki (1995a), ‘Explaining Regional Variations in BusinessBirths and Deaths: U.S. 1976-88’. Small Business Economics 7: 389-407.
Reynolds, P., N. Bosma, E. Autio, S. Hunt, N. De Bono, I. Servais, P. López-García and N.Chin (2005b), ‘Global Entrepreneurship Monitor: Data Collection, Design andImplementation 1998-2003’. Small Business Economics 24: 205-231.
Schuetze, H.J. (2005), ‘The Self-Employment Experience of Immigrants to Canada’. RIIMWorking Paper Series. Paper No. 05-24. Vancouver Centre of Excellence.
Schutjens, V. and E. Wever (2000), ‘Determinants of Firm Success’, Papers in RegionalScience 79 (2): 135-153.
Segarra, A. and M. Callejón (2002), ‘New Firms’ Survival and Market Turbulence: NewEvidence from Spain’, Review of Industrial Organisation 20: 1-14.
Solé, C. and S. Parella (2005), Negocios étnicos: Los comercios de los inmigrantes no comuni-tarios en Cataluña. Barcelona: Fundació CIDOB.
Solé, C., S.E. Parella, and L. Cavalcanti (2007), El empresario inmigrante en España,Colección Estudios Sociales 21. Obra Social Fundación La Caixa.
Stearns, T., P. Reynolds and M. Williams (1995), ‘New Firm Survival: Industry, Strategyand Location’, Journal of Business Venturing 10: 23-42.
Sternberg, R. and S. Wennekers (2005), ‘Determinants and Effects of New BusinessCreation Using Global Entrepreneurship Data’. Small Business Economics 24: 193-203.
Stinchcombe, A.L. (1965), ‘Social Structure and Organisations’ in J.G. March (ed.),Handbook of Organisations, 142-92. Chicago: Rand McNally.
Stuart, R.W. and P.A. Abetti (1990), ‘Impact of Entrepreneurial and ManagementExperience on Early Performance’, Journal of Business Venturing 5: 151-162.
Sutton, J. (1997), ‘Gibrat´s Legacy’, Journal of Economic Literature 35: 40-59.The World Bank Group (2006), ‘Income per person. GNI per capita, 2003’. Available at
http://web.worldbank.org/WBSITE/EXTERNAL/DATASTATISTICS/0,,contentMDK:20435613~menuPK:1545601~pagePK:64133150~piPK:64133175~theSiteP-K:239419,00.html.
Uhlaner, L. and R. Thurik (2003), ‘Post-Materialism: A Cultural Factor influencing TotalEntrepreneurial Activity across Nations’. SCALES Paper N200321. EIM Business andPolicy Research.
Van Stel, A., D. Storey and R. Thurik (2006), ‘The Effect of Business Regulations onNascent and Young Business Entrepreneurship’. SCALES Paper H200609. EIMBusiness and Policy Research.
REFERENCES 157
Verheul, I., R. Thurik and I. Grilo (2006), ‘Determinants of Self-employment Preferenceand Realisation of Women and Men in Europe and the United States’. RENT XX –
Research in Entrepreneurship and Small Business Conference. Brussels, November 2006.Villena, M. (2004), ‘Demografía, Mercado de Trabajo y Política de Inmigración’. Full text
available at www.eumed.net/cursecon/libreria.Wagner, J. and R. Sternberg (2004), ‘Start-up Activities, Individual Characteristics and the
Regional Milieu: Lessons for Entrepreneurship Support Policies from German Micro-data’. The Annals of Regional Science Spring.
Waldinger, R., H. Aldrich and R. Ward (1990), Ethnic Entrepreneurs, Immigrant Business inIndustrial Societies. London, Thousand Oaks and New Delhi: Sage.
Ward, R. and R. Jenkins (1984), Ethnic Communities in Business: Strategies for EconomicSurvival. Cambridge: Cambridge University Press.
Woo, C.Y., A.C. Cooper, W.C. Dunkelberg, U. Daellenbach and W.J. Dennis (1989),‘Determinants of Growth for Small and Large Entrepreneurial Start-ups’ in R.H.Brockhaus, N.C. Churchill, J.A. Katz, B.A. Kirchhoff, K.H. Vesper and W.E. Wetzel(eds.), Frontiers of Entrepreneurial Research, 134-47. Wellesley: Babson College.
Wood, R. and A. Bandura (1989), ‘Social Cognitive Theory of OrganisationalManagement’, Academy of Management Review 14 (3): 361-384.
Zacharaskis, A.L. (1999), ‘Differing Perceptions of New Venture Failure: A MatchedExploratory Study of Venture Capitalists and Entrepreneurs’, Journal of Small BusinessManagement 37 (3): 1-14.
Zhang, K. (1999), ‘Problems and Strategies of Chinese Immigrants: A Study ofRestaurant Sector in the Dutch Labour Market’, RIIM Working Paper Series: PaperNo. 99-08. Vancouver Centre of Excellence.
Zimmermann, K.F., A. Bonin, E. Constant and K. Tatsiramos (2006), ‘Native-MigrantDifferences in Risk Attitudes’. IZA Discussion Paper Series: Paper No. 1999.
Zimmermann, K.F., A. Constant and Y. Schachmurove (2003), ‘What Makes anEntrepreneur and Does it Pay? Native Men, Turks and Other Immigrants inGermany’, IZA Discussion Paper Series: Paper No. 940.
158 BORN ENTREPRENEURS?

Appendices

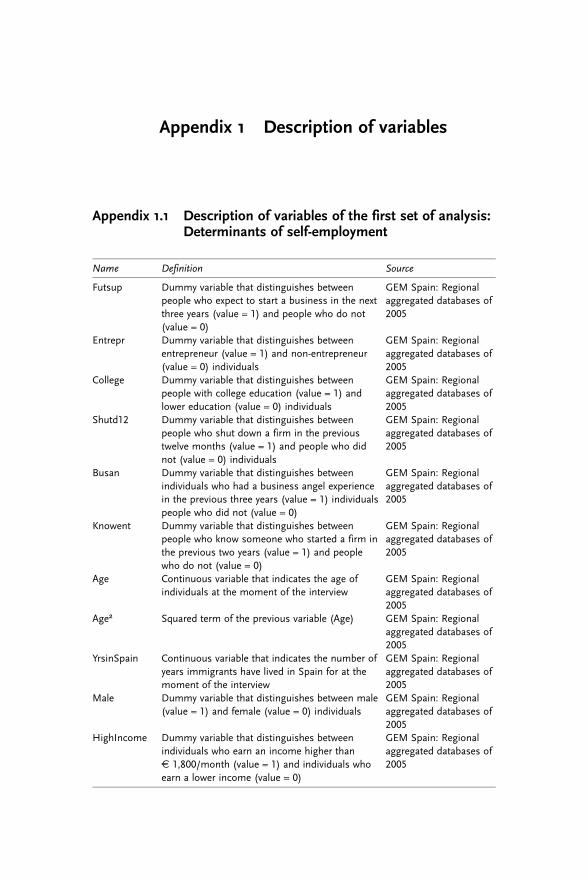
Appendix 1 Description of variables
Appendix 1.1 Description of variables of the first set of analysis:Determinants of self-employment
Name Definition Source
Futsup Dummy variable that distinguishes betweenpeople who expect to start a business in the nextthree years (value = 1) and people who do not(value = 0)
GEM Spain: Regionalaggregated databases of2005
Entrepr Dummy variable that distinguishes betweenentrepreneur (value = 1) and non-entrepreneur(value = 0) individuals
GEM Spain: Regionalaggregated databases of2005
College Dummy variable that distinguishes betweenpeople with college education (value = 1) andlower education (value = 0) individuals
GEM Spain: Regionalaggregated databases of2005
Shutd12 Dummy variable that distinguishes betweenpeople who shut down a firm in the previoustwelve months (value = 1) and people who didnot (value = 0) individuals
GEM Spain: Regionalaggregated databases of2005
Busan Dummy variable that distinguishes betweenindividuals who had a business angel experiencein the previous three years (value = 1) individualspeople who did not (value = 0)
GEM Spain: Regionalaggregated databases of2005
Knowent Dummy variable that distinguishes betweenpeople who know someone who started a firm inthe previous two years (value = 1) and peoplewho do not (value = 0)
GEM Spain: Regionalaggregated databases of2005
Age Continuous variable that indicates the age ofindividuals at the moment of the interview
GEM Spain: Regionalaggregated databases of2005
Age² Squared term of the previous variable (Age) GEM Spain: Regionalaggregated databases of2005
YrsinSpain Continuous variable that indicates the number ofyears immigrants have lived in Spain for at themoment of the interview
GEM Spain: Regionalaggregated databases of2005
Male Dummy variable that distinguishes between male(value = 1) and female (value = 0) individuals
GEM Spain: Regionalaggregated databases of2005
HighIncome Dummy variable that distinguishes betweenindividuals who earn an income higher thanE 1,800/month (value = 1) and individuals whoearn a lower income (value = 0)
GEM Spain: Regionalaggregated databases of2005
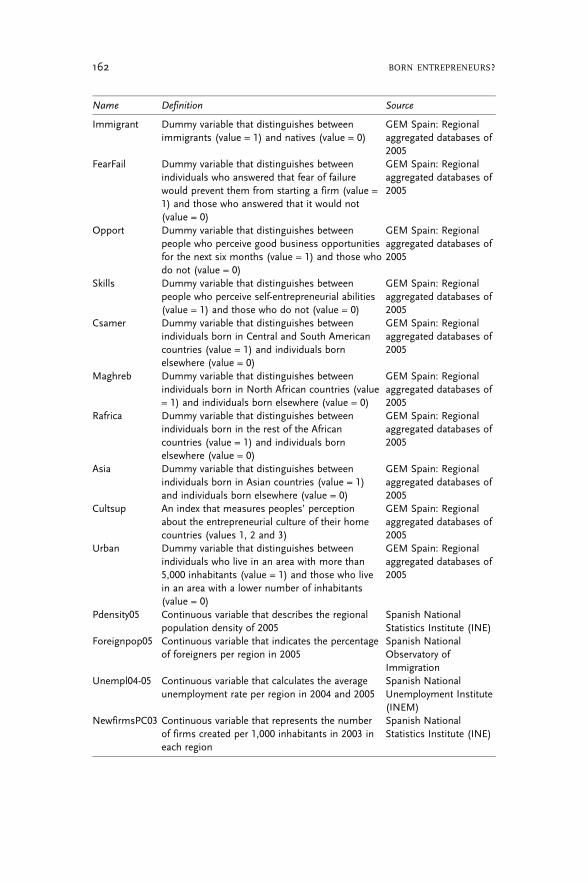
Name Definition Source
Immigrant Dummy variable that distinguishes betweenimmigrants (value = 1) and natives (value = 0)
GEM Spain: Regionalaggregated databases of2005
FearFail Dummy variable that distinguishes betweenindividuals who answered that fear of failurewould prevent them from starting a firm (value =1) and those who answered that it would not(value = 0)
GEM Spain: Regionalaggregated databases of2005
Opport Dummy variable that distinguishes betweenpeople who perceive good business opportunitiesfor the next six months (value = 1) and those whodo not (value = 0)
GEM Spain: Regionalaggregated databases of2005
Skills Dummy variable that distinguishes betweenpeople who perceive self-entrepreneurial abilities(value = 1) and those who do not (value = 0)
GEM Spain: Regionalaggregated databases of2005
Csamer Dummy variable that distinguishes betweenindividuals born in Central and South Americancountries (value = 1) and individuals bornelsewhere (value = 0)
GEM Spain: Regionalaggregated databases of2005
Maghreb Dummy variable that distinguishes betweenindividuals born in North African countries (value= 1) and individuals born elsewhere (value = 0)
GEM Spain: Regionalaggregated databases of2005
Rafrica Dummy variable that distinguishes betweenindividuals born in the rest of the Africancountries (value = 1) and individuals bornelsewhere (value = 0)
GEM Spain: Regionalaggregated databases of2005
Asia Dummy variable that distinguishes betweenindividuals born in Asian countries (value = 1)and individuals born elsewhere (value = 0)
GEM Spain: Regionalaggregated databases of2005
Cultsup An index that measures peoples’ perceptionabout the entrepreneurial culture of their homecountries (values 1, 2 and 3)
GEM Spain: Regionalaggregated databases of2005
Urban Dummy variable that distinguishes betweenindividuals who live in an area with more than5,000 inhabitants (value = 1) and those who livein an area with a lower number of inhabitants(value = 0)
GEM Spain: Regionalaggregated databases of2005
Pdensity05 Continuous variable that describes the regionalpopulation density of 2005
Spanish NationalStatistics Institute (INE)
Foreignpop05 Continuous variable that indicates the percentageof foreigners per region in 2005
Spanish NationalObservatory ofImmigration
Unempl04-05 Continuous variable that calculates the averageunemployment rate per region in 2004 and 2005
Spanish NationalUnemployment Institute(INEM)
NewfirmsPC03 Continuous variable that represents the numberof firms created per 1,000 inhabitants in 2003 ineach region
Spanish NationalStatistics Institute (INE)
162 BORN ENTREPRENEURS?
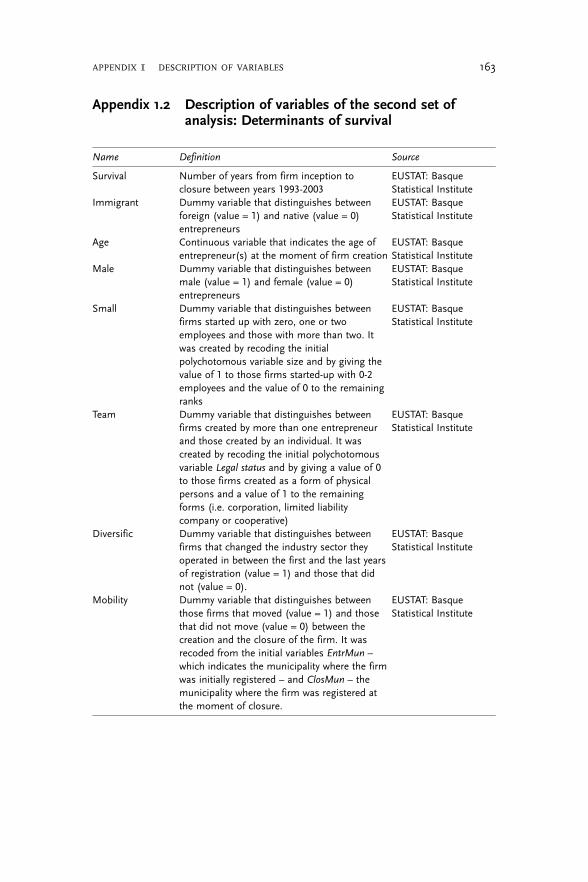
Appendix 1.2 Description of variables of the second set ofanalysis: Determinants of survival
Name Definition Source
Survival Number of years from firm inception toclosure between years 1993-2003
EUSTAT: BasqueStatistical Institute
Immigrant Dummy variable that distinguishes betweenforeign (value = 1) and native (value = 0)entrepreneurs
EUSTAT: BasqueStatistical Institute
Age Continuous variable that indicates the age ofentrepreneur(s) at the moment of firm creation
EUSTAT: BasqueStatistical Institute
Male Dummy variable that distinguishes betweenmale (value = 1) and female (value = 0)entrepreneurs
EUSTAT: BasqueStatistical Institute
Small Dummy variable that distinguishes betweenfirms started up with zero, one or twoemployees and those with more than two. Itwas created by recoding the initialpolychotomous variable size and by giving thevalue of 1 to those firms started-up with 0-2employees and the value of 0 to the remainingranks
EUSTAT: BasqueStatistical Institute
Team Dummy variable that distinguishes betweenfirms created by more than one entrepreneurand those created by an individual. It wascreated by recoding the initial polychotomousvariable Legal status and by giving a value of 0to those firms created as a form of physicalpersons and a value of 1 to the remainingforms (i.e. corporation, limited liabilitycompany or cooperative)
EUSTAT: BasqueStatistical Institute
Diversific Dummy variable that distinguishes betweenfirms that changed the industry sector theyoperated in between the first and the last yearsof registration (value = 1) and those that didnot (value = 0).
EUSTAT: BasqueStatistical Institute
Mobility Dummy variable that distinguishes betweenthose firms that moved (value = 1) and thosethat did not move (value = 0) between thecreation and the closure of the firm. It wasrecoded from the initial variables EntrMun –
which indicates the municipality where the firmwas initially registered – and ClosMun – themunicipality where the firm was registered atthe moment of closure.
EUSTAT: BasqueStatistical Institute
APPENDIX 1 DESCRIPTION OF VARIABLES 163
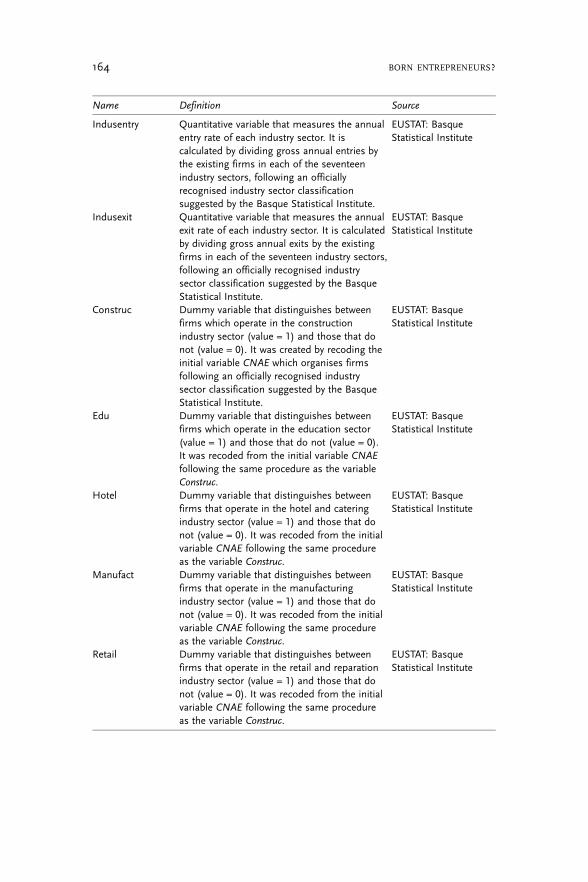
Name Definition Source
Indusentry Quantitative variable that measures the annualentry rate of each industry sector. It iscalculated by dividing gross annual entries bythe existing firms in each of the seventeenindustry sectors, following an officiallyrecognised industry sector classificationsuggested by the Basque Statistical Institute.
EUSTAT: BasqueStatistical Institute
Indusexit Quantitative variable that measures the annualexit rate of each industry sector. It is calculatedby dividing gross annual exits by the existingfirms in each of the seventeen industry sectors,following an officially recognised industrysector classification suggested by the BasqueStatistical Institute.
EUSTAT: BasqueStatistical Institute
Construc Dummy variable that distinguishes betweenfirms which operate in the constructionindustry sector (value = 1) and those that donot (value = 0). It was created by recoding theinitial variable CNAE which organises firmsfollowing an officially recognised industrysector classification suggested by the BasqueStatistical Institute.
EUSTAT: BasqueStatistical Institute
Edu Dummy variable that distinguishes betweenfirms which operate in the education sector(value = 1) and those that do not (value = 0).It was recoded from the initial variable CNAE
following the same procedure as the variableConstruc.
EUSTAT: BasqueStatistical Institute
Hotel Dummy variable that distinguishes betweenfirms that operate in the hotel and cateringindustry sector (value = 1) and those that donot (value = 0). It was recoded from the initialvariable CNAE following the same procedureas the variable Construc.
EUSTAT: BasqueStatistical Institute
Manufact Dummy variable that distinguishes betweenfirms that operate in the manufacturingindustry sector (value = 1) and those that donot (value = 0). It was recoded from the initialvariable CNAE following the same procedureas the variable Construc.
EUSTAT: BasqueStatistical Institute
Retail Dummy variable that distinguishes betweenfirms that operate in the retail and reparationindustry sector (value = 1) and those that donot (value = 0). It was recoded from the initialvariable CNAE following the same procedureas the variable Construc.
EUSTAT: BasqueStatistical Institute
164 BORN ENTREPRENEURS?
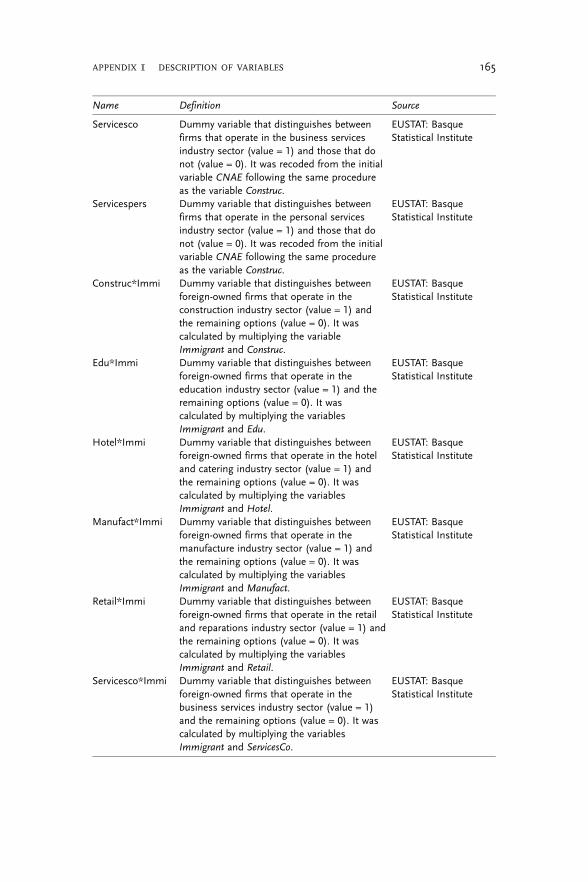
Name Definition Source
Servicesco Dummy variable that distinguishes betweenfirms that operate in the business servicesindustry sector (value = 1) and those that donot (value = 0). It was recoded from the initialvariable CNAE following the same procedureas the variable Construc.
EUSTAT: BasqueStatistical Institute
Servicespers Dummy variable that distinguishes betweenfirms that operate in the personal servicesindustry sector (value = 1) and those that donot (value = 0). It was recoded from the initialvariable CNAE following the same procedureas the variable Construc.
EUSTAT: BasqueStatistical Institute
Construc*Immi Dummy variable that distinguishes betweenforeign-owned firms that operate in theconstruction industry sector (value = 1) andthe remaining options (value = 0). It wascalculated by multiplying the variableImmigrant and Construc.
EUSTAT: BasqueStatistical Institute
Edu*Immi Dummy variable that distinguishes betweenforeign-owned firms that operate in theeducation industry sector (value = 1) and theremaining options (value = 0). It wascalculated by multiplying the variablesImmigrant and Edu.
EUSTAT: BasqueStatistical Institute
Hotel*Immi Dummy variable that distinguishes betweenforeign-owned firms that operate in the hoteland catering industry sector (value = 1) andthe remaining options (value = 0). It wascalculated by multiplying the variablesImmigrant and Hotel.
EUSTAT: BasqueStatistical Institute
Manufact*Immi Dummy variable that distinguishes betweenforeign-owned firms that operate in themanufacture industry sector (value = 1) andthe remaining options (value = 0). It wascalculated by multiplying the variablesImmigrant and Manufact.
EUSTAT: BasqueStatistical Institute
Retail*Immi Dummy variable that distinguishes betweenforeign-owned firms that operate in the retailand reparations industry sector (value = 1) andthe remaining options (value = 0). It wascalculated by multiplying the variablesImmigrant and Retail.
EUSTAT: BasqueStatistical Institute
Servicesco*Immi Dummy variable that distinguishes betweenforeign-owned firms that operate in thebusiness services industry sector (value = 1)and the remaining options (value = 0). It wascalculated by multiplying the variablesImmigrant and ServicesCo.
EUSTAT: BasqueStatistical Institute
APPENDIX 1 DESCRIPTION OF VARIABLES 165
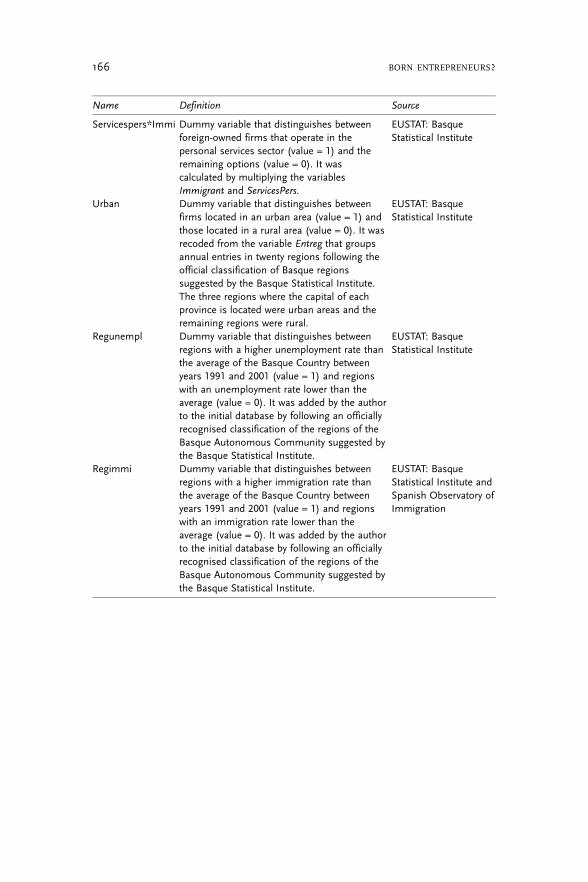
Name Definition Source
Servicespers*Immi Dummy variable that distinguishes betweenforeign-owned firms that operate in thepersonal services sector (value = 1) and theremaining options (value = 0). It wascalculated by multiplying the variablesImmigrant and ServicesPers.
EUSTAT: BasqueStatistical Institute
Urban Dummy variable that distinguishes betweenfirms located in an urban area (value = 1) andthose located in a rural area (value = 0). It wasrecoded from the variable Entreg that groupsannual entries in twenty regions following theofficial classification of Basque regionssuggested by the Basque Statistical Institute.The three regions where the capital of eachprovince is located were urban areas and theremaining regions were rural.
EUSTAT: BasqueStatistical Institute
Regunempl Dummy variable that distinguishes betweenregions with a higher unemployment rate thanthe average of the Basque Country betweenyears 1991 and 2001 (value = 1) and regionswith an unemployment rate lower than theaverage (value = 0). It was added by the authorto the initial database by following an officiallyrecognised classification of the regions of theBasque Autonomous Community suggested bythe Basque Statistical Institute.
EUSTAT: BasqueStatistical Institute
Regimmi Dummy variable that distinguishes betweenregions with a higher immigration rate thanthe average of the Basque Country betweenyears 1991 and 2001 (value = 1) and regionswith an immigration rate lower than theaverage (value = 0). It was added by the authorto the initial database by following an officiallyrecognised classification of the regions of theBasque Autonomous Community suggested bythe Basque Statistical Institute.
EUSTAT: BasqueStatistical Institute andSpanish Observatory ofImmigration
166 BORN ENTREPRENEURS?
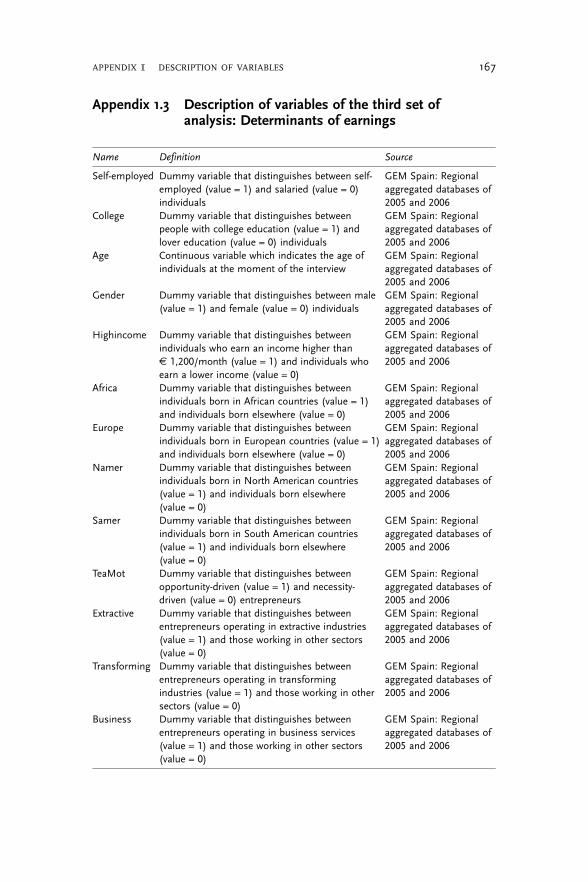
Appendix 1.3 Description of variables of the third set ofanalysis: Determinants of earnings
Name Definition Source
Self-employed Dummy variable that distinguishes between self-employed (value = 1) and salaried (value = 0)individuals
GEM Spain: Regionalaggregated databases of2005 and 2006
College Dummy variable that distinguishes betweenpeople with college education (value = 1) andlover education (value = 0) individuals
GEM Spain: Regionalaggregated databases of2005 and 2006
Age Continuous variable which indicates the age ofindividuals at the moment of the interview
GEM Spain: Regionalaggregated databases of2005 and 2006
Gender Dummy variable that distinguishes between male(value = 1) and female (value = 0) individuals
GEM Spain: Regionalaggregated databases of2005 and 2006
Highincome Dummy variable that distinguishes betweenindividuals who earn an income higher thanE 1,200/month (value = 1) and individuals whoearn a lower income (value = 0)
GEM Spain: Regionalaggregated databases of2005 and 2006
Africa Dummy variable that distinguishes betweenindividuals born in African countries (value = 1)and individuals born elsewhere (value = 0)
GEM Spain: Regionalaggregated databases of2005 and 2006
Europe Dummy variable that distinguishes betweenindividuals born in European countries (value = 1)and individuals born elsewhere (value = 0)
GEM Spain: Regionalaggregated databases of2005 and 2006
Namer Dummy variable that distinguishes betweenindividuals born in North American countries(value = 1) and individuals born elsewhere(value = 0)
GEM Spain: Regionalaggregated databases of2005 and 2006
Samer Dummy variable that distinguishes betweenindividuals born in South American countries(value = 1) and individuals born elsewhere(value = 0)
GEM Spain: Regionalaggregated databases of2005 and 2006
TeaMot Dummy variable that distinguishes betweenopportunity-driven (value = 1) and necessity-driven (value = 0) entrepreneurs
GEM Spain: Regionalaggregated databases of2005 and 2006
Extractive Dummy variable that distinguishes betweenentrepreneurs operating in extractive industries(value = 1) and those working in other sectors(value = 0)
GEM Spain: Regionalaggregated databases of2005 and 2006
Transforming Dummy variable that distinguishes betweenentrepreneurs operating in transformingindustries (value = 1) and those working in othersectors (value = 0)
GEM Spain: Regionalaggregated databases of2005 and 2006
Business Dummy variable that distinguishes betweenentrepreneurs operating in business services(value = 1) and those working in other sectors(value = 0)
GEM Spain: Regionalaggregated databases of2005 and 2006
APPENDIX 1 DESCRIPTION OF VARIABLES 167

Name Definition Source
Consumer Dummy variable that distinguishes betweenentrepreneurs operating in consumer-orientedservices (value = 1) and those working in othersectors (value = 0)
GEM Spain: Regionalaggregated databases of2005 and 2006
Urban Dummy variable that distinguishes betweenindividuals who live in an area with more than5,000 inhabitants (value = 1) and those who livein an area with a lower number of inhabitants(value = 0)
GEM Spain: Regionalaggregated databases of2005 and 2006
RegGDPcap04 Continuous variable that describes the regionalGDP per capita in 2004
Spanish NationalStatistics Institute (INE)
168 BORN ENTREPRENEURS?
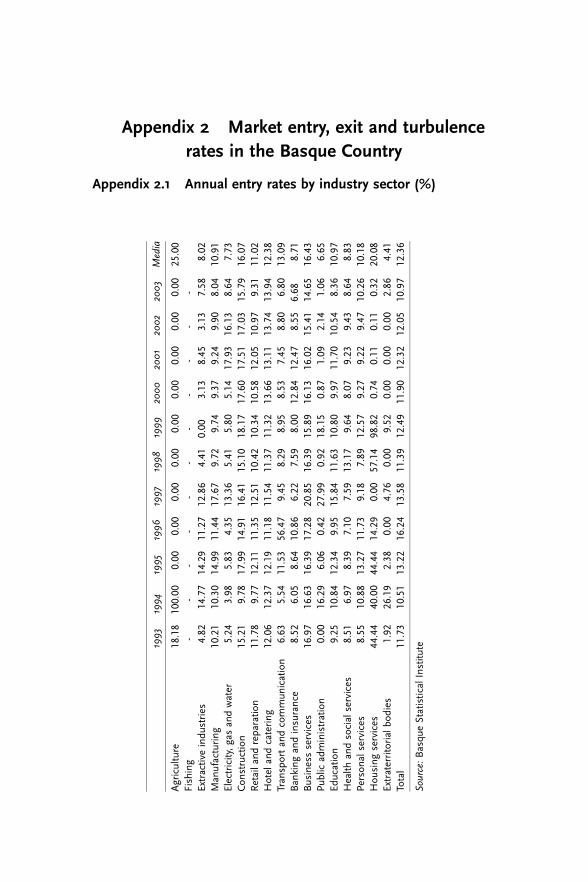
Appendix 2 Market entry, exit and turbulence
rates in the Basque Country
Appendix 2.1 Annual entry rates by industry sector (%)
1993
1994
1995
1996
1997
1998
1999
2000
2001
2002
2003
Media
Agriculture
18.18
100.00
0.00
0.00
0.00
0.00
0.00
0.00
0.00
0.00
0.00
25.00
Fishing
--
--
--
--
--
-Extractiveindu
stries
4.82
14.77
14.29
11.27
12.86
4.41
0.00
3.13
8.45
3.13
7.58
8.02
Man
ufacturing
10.21
10.30
14.99
11.44
17.67
9.72
9.74
9.37
9.24
9.90
8.04
10.91
Electricity,g
asan
dwater
5.24
3.98
5.83
4.35
13.36
5.41
5.80
5.14
17.93
16.13
8.64
7.73
Con
struction
15.21
9.78
17.99
14.91
16.41
15.10
18.17
17.60
17.51
17.03
15.79
16.07
Retailand
repa
ratio
n11.78
9.77
12.11
11.35
12.51
10.42
10.34
10.58
12.05
10.97
9.31
11.02
Hotelan
dcatering
12.06
12.37
12.19
11.18
11.54
11.37
11.32
13.66
13.11
13.74
13.94
12.38
Tran
sportan
dcommun
ication
6.63
5.54
11.53
56.47
9.45
8.29
8.95
8.53
7.45
8.80
6.80
13.09
Ban
king
andinsurance
8.52
6.05
8.64
10.86
6.22
7.59
8.00
12.84
12.47
8.55
6.68
8.71
Businessservices
16.97
16.63
16.39
17.28
20.85
16.39
15.89
16.13
16.02
15.41
14.65
16.43
Publicadministration
0.00
16.29
6.06
0.42
27.99
0.92
18.15
0.87
1.09
2.14
1.06
6.65
Education
9.25
10.84
12.34
9.95
15.84
11.63
10.80
9.97
11.70
10.54
8.36
10.97
Health
andsocialservices
8.51
6.97
8.39
7.10
7.59
13.17
9.64
8.07
9.23
9.43
8.64
8.83
Person
alservices
8.55
10.88
13.27
11.73
9.18
7.89
12.57
9.27
9.22
9.47
10.26
10.18
Hou
sing
services
44.44
40.00
44.44
14.29
0.00
57.14
98.82
0.74
0.11
0.11
0.32
20.08
Extraterritorialbo
dies
1.92
26.19
2.38
0.00
4.76
0.00
9.52
0.00
0.00
0.00
2.86
4.41
Total
11.73
10.51
13.22
16.24
13.58
11.39
12.49
11.90
12.32
12.05
10.97
12.36
Source:Basqu
eStatisticalInstitu
te
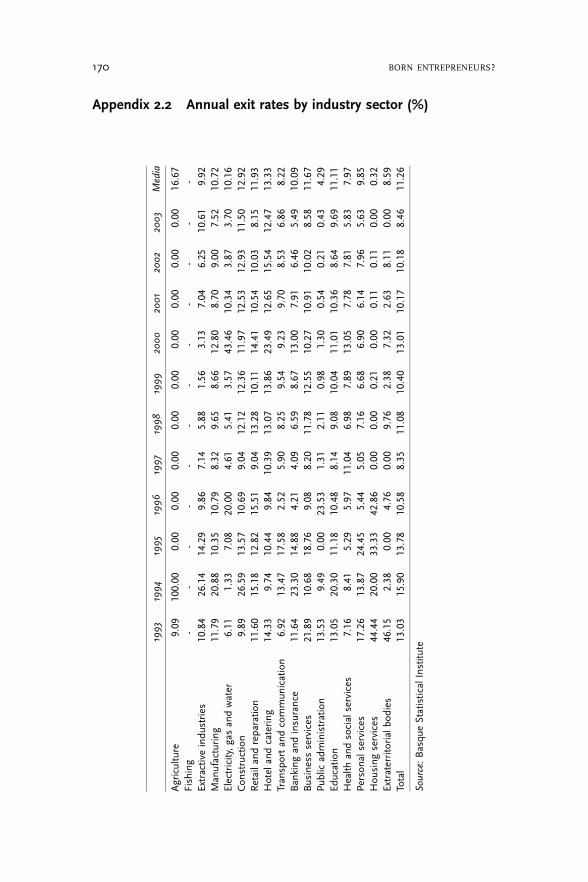
Appendix 2.2 Annual exit rates by industry sector (%)
1993
1994
1995
1996
1997
1998
1999
2000
2001
2002
2003
Media
Agriculture
9.09
100.00
0.00
0.00
0.00
0.00
0.00
0.00
0.00
0.00
0.00
16.67
Fishing
--
--
--
--
--
--
Extractiveindu
stries
10.84
26.14
14.29
9.86
7.14
5.88
1.56
3.13
7.04
6.25
10.61
9.92
Man
ufacturing
11.79
20.88
10.35
10.79
8.32
9.65
8.66
12.80
8.70
9.00
7.52
10.72
Electricity,g
asan
dwater
6.11
1.33
7.08
20.00
4.61
5.41
3.57
43.46
10.34
3.87
3.70
10.16
Con
struction
9.89
26.59
13.57
10.69
9.04
12.12
12.36
11.97
12.53
12.93
11.50
12.92
Retailand
repa
ratio
n11.60
15.18
12.82
15.51
9.04
13.28
10.11
14.41
10.54
10.03
8.15
11.93
Hotelan
dcatering
14.33
9.74
10.44
9.84
10.39
13.07
13.86
23.49
12.65
15.54
12.47
13.33
Tran
sportan
dcommun
ication
6.92
13.47
17.58
2.52
5.90
8.25
9.54
9.23
9.70
8.53
6.86
8.22
Ban
king
andinsurance
11.64
23.30
14.88
4.21
4.09
6.59
8.67
13.00
7.91
6.46
5.49
10.09
Businessservices
21.89
10.68
18.76
9.08
8.20
11.78
12.55
10.27
10.91
10.02
8.58
11.67
Publicadministration
13.53
9.49
0.00
23.53
1.31
2.11
0.98
1.30
0.54
0.21
0.43
4.29
Education
13.05
20.30
11.18
10.48
8.14
9.08
10.04
11.01
10.36
8.64
9.69
11.11
Health
andsocialservices
7.16
8.41
5.29
5.97
11.04
6.98
7.89
13.05
7.78
7.81
5.83
7.97
Person
alservices
17.26
13.87
24.45
5.44
5.05
7.16
6.68
6.90
6.14
7.96
5.63
9.85
Hou
sing
services
44.44
20.00
33.33
42.86
0.00
0.00
0.21
0.00
0.11
0.11
0.00
0.32
Extraterritorialbo
dies
46.15
2.38
0.00
4.76
0.00
9.76
2.38
7.32
2.63
8.11
0.00
8.59
Total
13.03
15.90
13.78
10.58
8.35
11.08
10.40
13.01
10.17
10.18
8.46
11.26
Source:Basqu
eStatisticalInstitu
te
170 BORN ENTREPRENEURS?

Appendix 2.3 Annual rates of turbulence by industry sector (%)
1993
1994
1995
1996
1997
1998
1999
2000
2001
2002
2003
Media
Agriculture
27.27
200.00
0.00
0.00
0.00
0.00
0.00
0.00
0.00
0.00
0.00
41.67
Fishing
--
--
--
--
--
--
Extractiveindu
stries
15.66
40.91
28.57
21.13
20.00
10.29
1.56
6.25
15.49
9.38
18.18
17.94
Man
ufacturing
21.99
31.18
25.34
22.23
26.00
19.38
18.41
22.17
17.94
18.90
15.56
21.63
Electricity,g
asan
dwater
11.35
5.31
12.92
24.35
17.97
10.81
9.38
48.60
28.28
20.00
12.35
17.89
Con
struction
25.10
36.37
31.56
25.61
25.45
27.22
30.53
29.58
30.04
29.96
27.29
28.99
Retailand
repa
ratio
n23.38
24.95
24.93
26.87
21.55
23.70
20.45
24.99
22.59
21.00
17.46
22.95
Hotelan
dcatering
26.39
22.11
22.63
21.02
21.92
24.44
25.17
37.15
25.76
29.29
26.40
25.70
Tran
sportan
dcommun
ication
13.55
19.01
29.11
58.99
15.34
16.54
18.49
17.75
17.15
17.33
13.66
21.31
Ban
king
andinsurance
20.16
29.34
23.51
15.07
10.31
14.18
16.67
25.84
20.38
15.01
12.16
18.80
Businessservices
38.86
27.32
35.15
26.36
29.05
28.17
28.44
26.40
26.94
25.43
23.23
28.10
Publicadministration
13.53
25.78
6.06
23.95
29.30
3.03
19.13
2.17
1.63
2.36
1.49
10.94
Education
22.30
31.14
23.52
20.42
23.98
20.71
20.84
20.98
22.06
19.18
18.04
22.08
Health
andsocialservices
15.67
15.38
13.69
13.07
18.63
20.16
17.53
21.12
17.01
17.24
14.47
16.81
Person
alservices
25.81
24.75
37.72
17.17
14.23
15.05
19.25
16.17
15.36
17.44
15.88
20.03
Hou
sing
services
88.89
60.00
77.78
57.14
0.00
57.14
99.04
0.74
0.21
0.21
0.32
20.39
Extraterritorialbo
dies
48.08
28.57
2.38
4.76
4.76
9.76
11.90
7.32
2.63
8.11
2.86
13.00
Total
24.76
26.41
27.00
26.82
21.93
22.47
22.88
24.91
22.49
22.23
19.43
23.62
Source:Basqu
eStatisticalInstitu
te
APPENDIX 2 MARKET ENTRY, EXIT 171

Appendix 3 Cox regression analyses for
simulations
Appendix 3.1 Cox regression analysis for simulations:Native-owned firms
Model IN=66,988 Significance=0.000
B Exp(B)
Firm internal variables
Firm resources and strategies
Small 0.14** 0.87Diversific -0.68** 1.97
Firm external variablesIndustry sector
Construc 0.31** 0.73Education 0.24** 0.79Hotel 0.12** 0.88Manufact 0.18** 0.83Retail 0.12** 0.89Servicesco 0.27** 0.76Servicespers 0.11** 0.90
Location
Urban 0.04** 0.96
** Correlation is significant at the 0.01 level (1 –tailed)* Correlation is significant at the 0.05 level (1 –tailed)
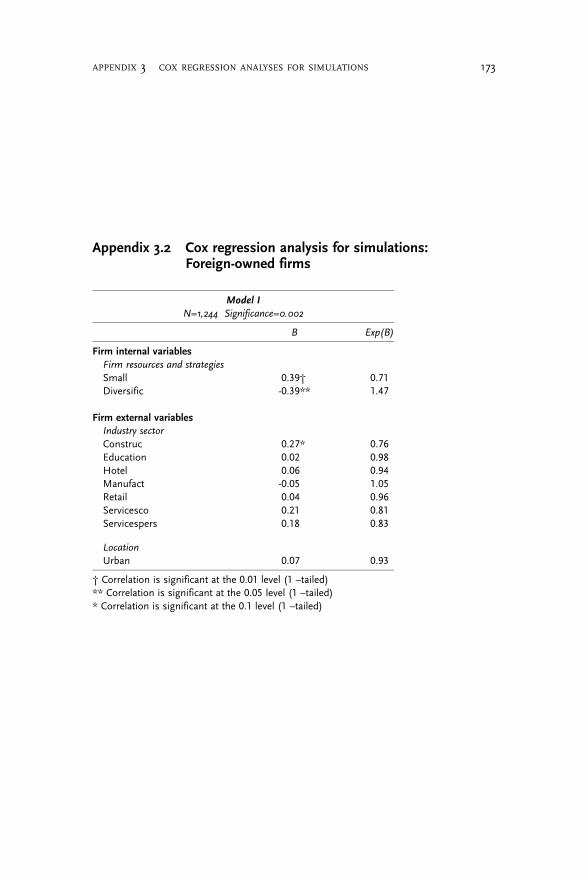
Appendix 3.2 Cox regression analysis for simulations:Foreign-owned firms
Model IN=1,244 Significance=0.002
B Exp(B)
Firm internal variables
Firm resources and strategies
Small 0.39† 0.71Diversific -0.39** 1.47
Firm external variablesIndustry sector
Construc 0.27* 0.76Education 0.02 0.98Hotel 0.06 0.94Manufact -0.05 1.05Retail 0.04 0.96Servicesco 0.21 0.81Servicespers 0.18 0.83
Location
Urban 0.07 0.93
† Correlation is significant at the 0.01 level (1 –tailed)** Correlation is significant at the 0.05 level (1 –tailed)* Correlation is significant at the 0.1 level (1 –tailed)
APPENDIX 3 COX REGRESSION ANALYSES FOR SIMULATIONS 173

Other IMISCOE titles
IMISCOE Research
Rinus Penninx, Maria Berger, Karen Kraal, Eds.The Dynamics of International Migration and Settlement in Europe: AState of the Art2006 (ISBN 978 90 5356 866 8)(originally appearing in IMISCOE Joint Studies)
Leo Lucassen, David Feldman, Jochen Oltmer, Eds.Paths of Integration: Migrants in Western Europe (1880-2004)2006 (ISBN 978 90 5356 883 5)
Rainer Bauböck, Eva Ersbøll, Kees Groenendijk, Harald Waldrauch, Eds.Acquisition and Loss of Nationality: Policies and Trends in 15 EuropeanCountries, Volume 1: Comparative Analyses2006 (ISBN 978 90 5356 920 7)
Rainer Bauböck, Eva Ersbøll, Kees Groenendijk, Harald Waldrauch, Eds.Acquisition and Loss of Nationality: Policies and Trends in 15 EuropeanCountries, Volume 2: Country Analyses2006 (ISBN 978 90 5356 921 4)
Rainer Bauböck, Bernhard Perchinig, Wiebke Sievers, Eds.Citizenship Policies in the New Europe2007 (ISBN 978 90 5356 922 1)
Veit BaderSecularism or Democracy? Associational Governance of Religious Diversity2007 (ISBN 978 90 5356 999 3)
Holger Kolb, Henrik Egbert, Eds.Migrants and Markets: Perspectives from Economics and the OtherSocial Sciences2008 (ISNB 978 90 5356 684 8)
Ralph Grillo, Ed.The Family in Question: Immigrant and Ethnic Minorities inMulticultural Europe2008 (ISBN 978 90 5356 869 9)

Corrado Bonifazi, Marek Okólski, Jeannette Schoorl, Patrick Simon, Eds.International Migration in Europe: New Trends and New Methodsof Analysis2008 (ISBN 978 90 5356 894 1)
Maurice Crul, Liesbeth Heering, Eds.The Position of the Turkish and Moroccan Second Generation in Amsterdamand Rotterdam: The TIES Study in the Netherlands2008 (ISBN 978 90 8964 061 1)
Marlou Schrover, Joanne van der Leun, Leo Lucassen, Chris Quispel, Eds.Illegal Migration and Gender in a Global and Historical Perspective2008 (ISBN 978 90 8964 047 5)
Gianluca P. ParolinCitizenship in the Arab World: Kin, Religion and Nation-State2009 (ISBN 978 90 8964 045 1)
Rainer Bauböck, Bernhard Perchinig, Wiebke Sievers, Eds.Citizenship Policies in the New Europe: Expanded and Updated Edition2009 (ISBN 978 90 8964 108 3)
Cédric Audebert, Mohamed Kamel Doraï, Eds.Migration in a Globalised World: New Research Issues and Prospects2010 (ISBN 978 90 8964 157 1)
Richard Black, Godfried Engbersen, Marek Okólski, Cristina Pantîru, Eds.A Continent Moving West? EU Enlargement and Labour Migration fromCentral and Eastern Europe2010 (ISBN 978 90 8964 156 4)
Charles Westin, José Bastos, Janine Dahinden, Pedro Góis, Eds.Identity Processes and Dynamics in Multi-Ethnic Europe2010 (ISBN 978 90 8964 046 8)
Rainer Bauböck, Thomas Faist, Eds.Diaspora and Transnationalism: Concepts, Theories and Methods2010 (ISBN 978 90 8964 238 7)
IMISCOE Reports
Rainer Bauböck, Ed.Migration and Citizenship: Legal Status, Rights and Political Participation2006 (ISBN 978 90 5356 888 0)

Michael Jandl, Ed.Innovative Concepts for Alternative Migration Policies: Ten InnovativeApproaches to the Challenges of Migration in the 21st Century2007 (ISBN 978 90 5356 990 0)
Jeroen Doomernik, Michael Jandl, Eds.Modes of Migration Regulation and Control in Europe2008 (ISBN 978 90 5356 689 3)
Michael Jandl, Christina Hollomey, Sandra Gendera, Anna Stepien,Veronika BilgerMigration and Irregular Work In Austria: A Case Study of the Structureand Dynamics of Irregular Foreign Employment in Europe at the Beginningof the 21st Century2008 (ISBN 978 90 8964 053 6)
Heinz Fassmann, Ursula Reeger, Wiebke Sievers, Eds.Statistics and Reality: Concepts and Measurements of Migration in Europe2009 (ISBN 978 90 8964 052 9)
Karen Kraal, Judith Roosblad, John Wrench, Eds.Equal Opportunities and Ethnic Inequality in European Labour Markets:Discrimination, Gender and Policies of Diversity2009 (ISBN 978 90 8964 126 7)
Tiziana Caponio, Maren Borkert, Eds.The Local Dimension of Migration Policymaking2010 (ISBN 978 90 8964 232 5)
Raivo Vetik, Jelena Helemäe, Eds.The Russian Second Generation in Tallinn and Kohtla-Järve: The TIESStudy in Estonia2010 (ISBN 978 90 8964 250 9)
IMISCOE Dissertations
Panos Arion HatziprokopiouGlobalisation, Migration and Socio-Economic Change in ContemporaryGreece: Processes of Social Incorporation of Balkan Immigrants in Thessaloniki2006 (ISBN 978 90 5356 873 6)

Floris VermeulenThe Immigrant Organising Process: Turkish Organisations in Amsterdamand Berlin and Surinamese Organisations in Amsterdam, 1960-20002006 (ISBN 978 90 5356 875 0)
Anastasia ChristouNarratives of Place, Culture and Identity: Second-GenerationGreek-Americans Return ‘Home’2006 (ISBN 978 90 5356 878 1)
Katja RušinovićDynamic Entrepreneurship: First and Second-Generation ImmigrantEntrepreneurs in Dutch Cities2006 (ISBN 978 90 5356 972 6)
Ilse van LiemptNavigating Borders: Inside Perspectives on the Process of Human Smugglinginto the Netherlands2007 (ISBN 978 90 5356 930 6)
Myriam ChertiParadoxes of Social Capital: A Multi-Generational Study of Moroccansin London2008 (ISBN 978 90 5356 032 7)
Marc HelblingPractising Citizenship and Heterogeneous Nationhood: Naturalisationsin Swiss Municipalities2008 (ISBN 978 90 8964 034 5)
Jérôme JaminL’imaginaire du complot: Discours d’extrême droite en France etaux Etats-Unis2009 (ISBN 978 90 8964 048 2)
Inge Van NieuwenhuyzeGetting by in Europe’s Urban Labour Markets: Senegambian Migrants’Strategies for Survival, Documentation and Mobility2009 (ISBN 978 90 8964 050 5)
Nayla MoukarbelSri Lankan Housemaids in Lebanon: A Case of ‘Symbolic Violence’ and‘Every Day Forms of Resistance’2009 (ISBN 978 90 8964 051 2)
John Davies‘My Name Is Not Natasha’: How Albanian Women in France UseTrafficking to Overcome Social Exclusion (1998-2001)2009 (ISBN 978 90 5356 707 4)
Dennis BroedersBreaking Down Anonymity: Digital Surveillance of Irregular Migrantsin Germany and the Netherlands2009 (ISBN 978 90 8964 159 5)
Arjen LeerkesIllegal Residence and Public Safety in the Netherlands2009 (ISBN 978 90 8964 049 9)
Jennifer Leigh McGarrigleUnderstanding Processes of Ethnic Concentration and Dispersal:South Asian Residential Preferences in Glasgow2009 (ISBN 978 90 5356 671 8)
João SardinhaImmigrant Associations, Integration and Identity: Angolan, Brazilianand Eastern European Communities in Portugal2009 (ISBN 978 90 8964 036 9)
IMISCOE Textbooks
Marco Martiniello, Jan Rath, Eds.Selected Studies in International Migration and Immigrant Incorporation2010 (ISBN 978 90 8964 160 1)