
The Asian Crisis: What Did Local Stock Markets Expect?
21
BIS Working Papers No 261 The Asian crisis: what did local stock markets expect? by Alicia García Herrero, Jacob Gyntelberg and Andrea Tesei Monetary and Economic Department September 2008 JEL classification: F31, G15 and G14. Keywords: Asian crisis, currency crisis, information content of local equity prices.
Transcript of The Asian Crisis: What Did Local Stock Markets Expect?

BIS Working Papers No 261
The Asian crisis: what did local stock markets expect? by Alicia García Herrero, Jacob Gyntelberg and Andrea Tesei
Monetary and Economic Department September 2008
JEL classification: F31, G15 and G14. Keywords: Asian crisis, currency crisis, information content of local equity prices.

BIS Working Papers are written by members of the Monetary and Economic Department of the Bank for International Settlements, and from time to time by other economists, and are published by the Bank. The views expressed in them are those of their authors and not necessarily the views of the BIS.
Copies of publications are available from:
Bank for International Settlements Press & Communications CH-4002 Basel, Switzerland E-mail: [email protected]
Fax: +41 61 280 9100 and +41 61 280 8100
This publication is available on the BIS website (www.bis.org).
© Bank for International Settlements 2008. All rights reserved. Limited extracts may be reproduced
or translated provided the source is stated.
ISSN 1020-0959 (print)
ISSN 1682-7678 (online)
ii
AbstractIn this paper we investigate whether cross-sectional information from local equity marketscontained information on devaluation expectations during the Asian crisis. We concentrate onthe information content of equity prices as these markets were in general the largest and mostliquid at the time and, thus, presumably the best carriers of information. Using an event-studyapproach for the period leading up to each of the devaluations which occurred during the Asiancrisis (namely those of Indonesia, Korea, Malaysia, the Philippines and Thailand), we comparereturns in the equity prices of exporting and non-exporting firms. This is based on the assumptionthat the expectation of a devaluation should help the stock of exporting firms outperform thoseof non-exporting firms. Overall we do find some evidence supporting this hypothesis, althoughat different degrees depending on the country. Our second finding is that local equity marketprices, as reflected in the different patterns seen for exporters and non-exporters, did to at leastto some extent price in the possibility that the Thai devaluation would be followed by othercountries in the region.
JEL codes: F31, G15 and G14
Keywords: Asian crisis, currency crisis, information content of local equity prices
The Asian crisis: what did local stock markets expect? iii


Contents
Abstract ........................................................................................................ iii
1 Introduction ............................................................................................ 1
2 Experiment and data ................................................................................ 2
2.1 Export sector .................................................................................. 3
2.1.1 Exporter subindices ................................................................. 3
2.1.2 Individual firms ....................................................................... 4
2.2 Non-export sector ............................................................................ 4
3 Procedures ............................................................................................ 5
3.1 Event dates .................................................................................... 5
3.2 Event window.................................................................................. 7
3.3 Normal returns, abnormal returns and cumulative abnormal returns .............. 7
4 Results ................................................................................................. 8
4.1 Controlling for macroeconomic factors................................................... 11
5 Concluding thoughts................................................................................. 12
Appendix A Data characteristics ...................................................................... 13
Appendix B Event study robustness to estimation window ...................................... 14
References.................................................................................................... 15
The Asian crisis: what did local stock markets expect? v


The Asian crisis: what did local stock markets expect?
Alicia García Herrero, Jacob Gyntelberg and Andrea Tesei 1
1. Introduction
Currency crises are a major source of concern for emerging countries. Their output and fiscallosses are well documented in the literature. As a consequence, significant research effortshave been devoted to this area. Some of the efforts have been devoted to improving the abilityto predict such crisis.In this paper we consider the information content of equity prices and their usefulness inpredicting the devaluations which were to occur during the Asian crisis. We take as our startingpoint that an expectation of a significant devaluation should help the stock prices of exportingfirms outperform those of non-exporting firms and possibly the overall market. We comparethe evolution of exporting firms’ equity prices with that of non-exporting firms or the generalstock index for the five Southeast Asian countries which underwent a large devaluation duringthe period 1997-98. Using an event-study approach for the period leading up to each of thedevaluations during that period (namely those of Indonesia, Korea, Malaysia, the Philippinesand Thailand), we compare returns in the equity prices of exporting and non-exporting firms.We find that exporting firms stock prices did in fact outperform those of non-exporters aswell as the general market - in the period leading up the devaluations, although at differentdegrees depending on the country. We also find that equity markets did react to devaluationsin other countries. We interpret this as an indication that local market participants attached anon-negligible probability to the possibility that Thailand’s currency crisis would spread to othercountries in the region.Our paper can be considered as a study of the information embedded in local equity marketprices during a period of stress. Our approach is consistent with Cohen and Remolona (2008),who provide evidence that stock prices in Asia before the crises were driven to a larger extent bylocal information, whereas during the crisis itself they were driven by foreign investor sentiments.We focus on equity markets as these were more liquid and had a higher capitalisation than localbond markets in Asia in the mid to late 1990s. Further, the devaluations during the Asian crisisis found to be one of the most difficult to predict by literature on early warning indicators.In a more restrictive way, given the short-run predictive power of our indicator, our papercontributes to the literature on early warning indicators. Pioneering work was conductedby Kaminski, Lizondo and Reinhart (1998). They monitor the evolution of a number ofmacroeconomic variables, such as the current account balance or the real exchange rate,and assess whether a variable deviates from its normal trend beyond a certain threshold value.If it does, this variable is said to issue a signal. Guesnerie and Woodford (2003), though, reporton the limited predictive power of the Kaminski, Lizondo and Reinhart (1998) model whentesting whether it would have been able to forecast the Thai crisis in 1997. Following this,a great number of forecasting models has emerged both in the academic literature, as wellas in the private sector. Most of them relying on multivariate logit or probit regressions. Berg,Borensztein and Patillo (2004) offer an excellent overview of the predictive capacity of such
1 Alicia García Herrero, BBVA, email: [email protected], Jacob Gyntelberg (Correspondingauthor: Senior economist, Bank for International Settlements, [email protected]). Andrea Tesei,Pompeu Fabra University, email: [email protected]. The authors thank Louisa Wagner and MagdalenaErdem for excellent assistance when completing the paper. We also thank Ramon Moreno, Patric McGuire,Bill Nelson, Frank Packer, Eli Remolona and seminar participants at the Bank for International Settlements foruseful comments and discussions. All errors remain our own. The views expressed in this paper are those ofthe author and should not be attributed to the Bank for International Settlements, BBVA or its other staff.
The Asian crisis: what did local stock markets expect? 1

models and find it to be very poor in the short-term horizon and only slightly better in the long-term than the Kaminski, Lizondo and Reinhart (1998) framework. The results are especiallypoor when applied to the Asian crisis.
Very few papers in the early warnings literature have considered the predictive power ofdomestic financial markets. This is a particularly relevant issue for Southeast Asia, given themuch larger size of their financial system as compared to other emerging regions. Probablythe roughest - but earliest - attempt is that of Ferri, Liu and Stiglitz (1999), who look into theinformational value embedded in the sovereign ratings of Asian countries prior to the 1997crisis and conclude that credit rating agencies failed to predict the emergence of the crisis.More recently Crespo Cuaresma and Slacik (2007) exploit the term structure of interest rates toobtain estimates of changes in the timing of the currency crises in the Czech Republic in 1997and Russia in 1998. They find their indicator to have a very good short-term predictor power.One potential issue with an indicator based on the term structure however, is endogeneity.In fact, it is constructed with exchange rate and money-market interest rates, which are bothindicators of exchange rate pressures.
The paper is structured as follows. In the following section we present our hypothesis and thedata. The third section describes the statistical methodology used. In the fourth section wepresent our results. The final section concludes.
2. Experiment and data
The paper deals with stock market developments prior to the devaluations which occurred inIndonesia, Korea, Malaysia, the Philippines and Thailand in 1997. In particular, it comparesstock returns of exporting companies versus those of non-exporting companies to determinewhether investors favoured the former prior to a devaluation in the form of higher relative returns,compared to a calm period (ie well before the crisis). The fact that we can interpret such higherrelative returns as a sign that investors were expecting a devaluation has a key underlyingassumption, namely that exporting firms would generally benefit from a devaluation, relative tonon-exporting firms.
While initially this is a plausible assumption one may consider several reasons why this neednot be the case. The first is that the amount of foreign currency indebtedness was larger forexporting firms. This would imply that devaluation would increase the cost of debt relatively morefor exporters. Such expected balance sheet effect would need to be larger than the expectedcompetitiveness effect in order for exporting firms not to be favoured by devaluation. We havenot been able to take into account information on the level and structure of individual firms’ debtprior to the Asian crisis. Allayannis, Brown and Klapper (2003) however studies balance sheeteffects from foreign currency debt and currency hedging practices of non-financial firms fromeight East Asian countries over the period 1996–98. They document that foreign currency debtdid not have a significantly larger impact on financial performance than local currency debt. Theirfindings also suggest that for firms in East Asia, foreign cash incomes were in fact a substitutefor derivatives based hedging for dollar indebted firms during the Asian crisis. Similarly, Bleakleyand Cowan (2005) find that non-financial firms in Latin American emerging countries tend tomatch the currency denomination of their liabilities with the exchange rate sensitivity of theirprofits. Because of this matching, they also find that the negative balance sheet effect ofdepreciation is more than offset by the competitiveness gains due to the depreciation. A secondreason why a devaluation need not favour exporters is that a devaluation might result in highercosts of production inputs. For instance, although the computer industry may be considered ashighly export oriented, because a large share of gross sales arise from exports. However, itmight in fact benefit less from a depreciation than industries that are less dependent on importedgoods such as mining and textiles. Unfortunately, we have not been able to account for thesetypes of effects as we do not have data on input costs. Overall this implies however, that it should
2 The Asian crisis: what did local stock markets expect?

be even more difficult statistically to not reject our hypothesis. Finally, a devaluation would notfavour an exporting firm would be one in which the major trading partners also devalue theircurrencies. The trade structure for the five countries does however rule out this scenario. Themost important export destinations prior to the crisis for the five countries were the US, Japanand Singapore and trade between the crisis countries was limited, ranging from the 7.9 percentof the total country exports for Thailand to 11.8 percent for Indonesia.
In order to compare stock market returns in the five countries in our sample, we single outthe main exporting sector/firm and compare it with non-exporting sectors or, at least, the stockmarket general index. The scope of this exercise, though, is limited by the relatively small sizeof Asian stock markets prior to the Asian crisis. Table 1 offers details about the main indices ofthese countries’ stock markets.
Table 1Characteristics of main equity indices in sample countries
Country Name Market capitalisation in 1996 1 Number of sub-sectors
Thailand SET Index 55.5 25
Philippines PCOMP Index 97.4 n/a
Malaysia KLCI Index 294.0 n/a
Indonesia JCI Index 40.4 9
Korea KOSPI Index 26.2 19
1 As percent of GDP.Sources: World Federation of Exchanges; National authorities.
2.1 Export sector
2.1.1 Exporter subindices
Ideally, we would like to compare the returns of all exporting sectors/firms with the non exportingones. An exporting sector should be one in which firms obtain more than half of their revenuesfrom exports. Since such detailed data does not really exist as early as 1997, we opt forconcentrating on the most export oriented sectors/firms relative to others for each country inour sample. In fact, we take the stock market sub-index of the most export oriented sector ineach country’s main equity index.
We choose the most export-oriented sectors by analysing the trade composition of the samplecountries in 1996 as reported by the Economist Intelligence Unit and we also reinforce ourchoice by looking on Bloomberg at the revenues composition for the 5 biggest companieslisted on the chosen exporting sector. In the three countries where sub-indices for the exportingsectors exist, we find that the biggest companies listed have revenues from exports well abovethe 50 percent. threshold.
Unfortunately, it has not been possible to find similar indices for the export sector. One reasonfor this is that the structure of equity market indices reflect the industry structure in a givencountry. A second reason is that not all countries had sufficiently granular sub-index structuresin place. Finally, equity indices are in general not typically organised to capture exporters andnon-exporters.
For Thailand we use the electronic sector sub-index (SETETRON). This is composed ofcomputers and computer parts, which comprised more than 11 percent of total manufactured
The Asian crisis: what did local stock markets expect? 3

goods exports in 1996, the second most important category of manufactured exports. Besides,the traditional main exporting categories, textiles and garments, were only rising at a 5 percentannual rate over the 1994–96 period, whereas high technology exports were growing at a 25–40 percent annually. Finally, the SETETRON represents only a small share of the overall SETIndex (see Appendix A), which limits the influence of this sub-index on the main index, usedas benchmark in this exercise. For Indonesia we use the mining sub-index (JAKMINE) sincemineral fuels were the most important exporting sector, with as much as 25.8 percent of totalexports, in 1996. Nonetheless, the JAKMINE sub-index is small enough (12.3 percent) relativeto the main Jakarta Composite Index (JCI), used as benchmark.For Koreawe use the sub-index for heavy industries (KOSPTREQ) whose principal componentsare machine, motor and ship producers all of which are export oriented with over 80 percentof the total production exported and some of its most prominent firms exporting their wholeproduction. As in the case of Thailand and Indonesia, the proportion of the KOSPTREQ sub-index, as compared to the main KOSPI index, is not very large (10.2 percent). ForMalaysia andthe Philippines the markets have no sectoral breakdown so that we need to do a more granularanalysis, based on firm-level information.
2.1.2 Individual firms
For the Philippines we chose a firm specialised in exporting telephone services, PLDT. This isbecause practically all its revenue comes from calls from abroad and is billed in USD.2 WhilePLDT accounts for a big share of the main index (25.8 percent of the PCOMP Index), itsevolution does not seem to be influenced by its large size since the other large stocks did notperform as well as PLDT did.For Malaysia we chose the largest listed company in the palm oil production sector, GoldenHope Plantations. At the end of 1996, 86 percent of the total production of palm oil in Malaysiawas exported, making it the most export oriented sector in the Malaysian economy. In fact,Golden Hope Plantations concentrates more than half of its sales abroad.In order to better compare results across countries, we select some exporting firms for thosecountries for which there is data on sub-sectors, namely Indonesia, Korea and Thailand. ForIndonesia we choose a manufacturer of garments - Karwell ID - which exported most of itsproduction at the time of the crisis.3 In fact, the textile industry was the most export oriented atthe end of 1996.Finally, for Korea we choose Samsung Heavy Industries, which manufactures oil tankers,container ships and passenger ferries. Almost 90 percent of its revenues come from salesin the rest of the world.
2.2 Non-export sector
The non-export sub-index chosen for each country should be the least export oriented. In thecase of Southeast Asia, as in many other countries, the most suitable sectors should be theservice sectors, such as banking, insurance and real estate. Unfortunately, it has not beenpossible to find similar indices for the non-export sectors, for the same reasons that it has notbeen possible for exporters.
2 A Bloomberg report dated 11 July 1997 states: "While the economy may take a hit, many companies areexpected to benefit from the devaluation, especially exporters whose goods will be cheaper abroad ...".Revenues at Ph. Long Distance Tel. Co will swell because half its business comes from international calls,which are billed in dollars. Those dollars now buy more pesos when PLDT brings its earnings home."
3 As Bloomberg reports, the company’s customers are mostly from overseas retail companies.
4 The Asian crisis: what did local stock markets expect?

For Thailand we use the insurance sub-index (SETINS), whose three biggest listed companieshave 100 percent domestic revenues. For both Indonesia and Korea we use the real estatesub-index. In the case of Indonesia, we perform a robustness test with another available sector,namely the chemical and industrial one, whose share of domestic revenues is close to 100percent, as for the real estate sub-index. Details on the composition of these sub-indices canbe found in Appendix A.4 The absence of a detailed breakdown for Philippines and Malaysiaprevents from identifying a non-exporting sub-index so that only the main stock market indexcan be used as benchmark.
3. Procedures
We use an event-study methodology to compare the daily evolution of exporting firms’ equityprices with that of the general stock index, or the non-export sector if available, for each of thecountries in our sample. This methodology allows us to exploit the daily frequency of the equitymarket prices data, which is crucial to assess the information content of stock markets, as wellas their capacity to predict the devaluations which followed. For details on the methodology,see Campbell, Lo and MacKinlay (1996). We control for potentially relevant macroeconomicand financial factors in a separate panel regression.
3.1 Event dates
Identifying event dates is key in event study methodology and is not always easy. The easiestone is the first devaluation, namely that of Thailand. On 2 July 1997 the Thai baht declined14 percent, the lowest rate since January 1985 and there was also an official announcementthat the exchange rate would be a managed float from that date.As can be seen from Figure 1, it is also relatively straightforward to identify the date of the crisisfor the Philippines. Also, 2 July for Thailand falls within this definition. Nine days after Thailand’sdevaluation, on 11 July, the Philippines also abandoned the defence of the peso. On this dayit declined 11.5 percent before trading was suspended. The currency dropped to 29.45 againstthe US dollar, its lowest value in four years. In the previous one-and-a-half year, the peso hadbeen virtually fixed to the dollar. It is perhaps worth noting that the Bangko Central tried not tolet the peso float until the very last moment. On 10 July the overnight rate was raised to anunprecedented 32 percent.It is however, not straightforward to identify an exact date for the remaining countries. Both theIndonesian and the Malaysian currencies became more volatile following the Thai devaluationin early July, with the Indonesian rupiah also responding to the initial devaluation of the ringgit.The fluctuations had, however, been contained and insulated by the strong intervention by BankIndonesia. In the case of Korea the currency remained relatively stable until much later in theyear. To identify the event date in a transparent way we used the mean and standard deviationof the daily exchange rate variations for the two and a half years preceding the 2 July 1997.We identify the event date as the first day in the first period (after the 2 July 1997) in whichthe exchange rates depreciated vis-à-vis the US dollar by more than i) 3 times the standarddeviation and ii) for at least three consecutive days. This procedure avoids picking up single-day events, thus ensuring that we identify the first day in a period of repeated violations of anestablished threshold. Thus implicitly we define the event as a powerful and protracted deviationfrom a well consolidated pattern.
4 Companies in these non-export sectors may have overseas assets which would result in positive balance-sheeteffects from a devaluation. However, the correlation of returns with exchange rate movements was very lowduring crisis in the considered sectors.
The Asian crisis: what did local stock markets expect? 5
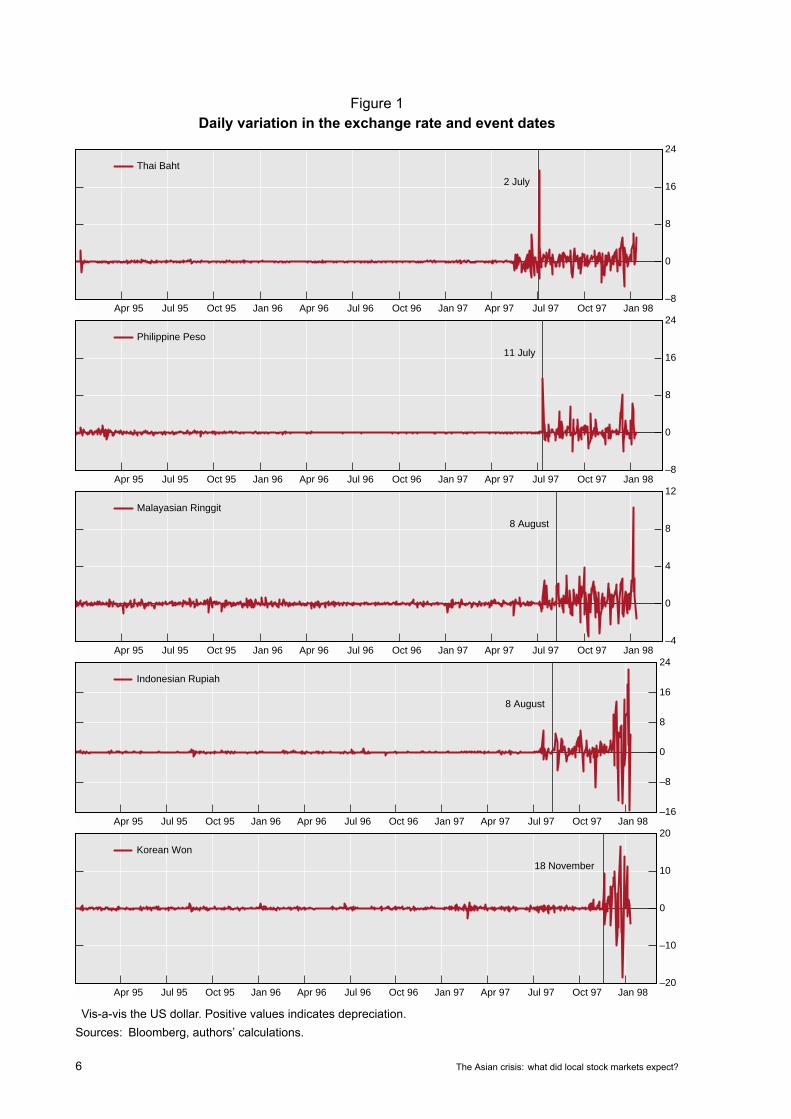
Figure 1Daily variation in the exchange rate and event dates
–8
0
8
16
24
Apr 95 Jul 95 Oct 95 Jan 96 Apr 96 Jul 96 Oct 96 Jan 97 Apr 97 Jul 97 Oct 97 Jan 98
2 July
Thai Baht
–8
0
8
16
24
Apr 95 Jul 95 Oct 95 Jan 96 Apr 96 Jul 96 Oct 96 Jan 97 Apr 97 Jul 97 Oct 97 Jan 98
11 July
Philippine Peso
–4
0
4
8
12
Apr 95 Jul 95 Oct 95 Jan 96 Apr 96 Jul 96 Oct 96 Jan 97 Apr 97 Jul 97 Oct 97 Jan 98
8 August
Malayasian Ringgit
–16
–8
0
8
16
24
Apr 95 Jul 95 Oct 95 Jan 96 Apr 96 Jul 96 Oct 96 Jan 97 Apr 97 Jul 97 Oct 97 Jan 98
8 August
Indonesian Rupiah
–20
–10
0
10
20
Apr 95 Jul 95 Oct 95 Jan 96 Apr 96 Jul 96 Oct 96 Jan 97 Apr 97 Jul 97 Oct 97 Jan 98
18 November
Korean Won
Vis-a-vis the US dollar. Positive values indicates depreciation.Sources: Bloomberg, authors’ calculations.
6 The Asian crisis: what did local stock markets expect?

For both Indonesia and Malaysia the event date we have chosen was 8 August, more thanone month after the beginning of the financial turmoil in East Asia. On this day both the ringgitand the rupiah depreciated by over three times the standard deviation. A few days later on14 August the rupiah depreciated by more than 4 percent, followed by a further depreciation of6 percent on the following day. The Malaysian ringgit had a few large depreciations of 4.5–5.5percent against the USD in the weeks following the Thai devaluation. However, our procedureidentified the event date on 8 August since this was the first time in which the ringgit outpacedour defined threshold for three consecutive days. This date is one week before the Bank NegaraMalaysia stopped defending the ringgit. The ringgit lost 5.4 percent in this occasion on a weeklybasis dropping to 24-year low against the US dollar on the 15 August.
For Korea it is also difficult to pinpoint an event date. For Korea the first signs of difficultiesappeared at the end of October. On 28 October, the won depreciated by more than the officialdaily limit for the first time. Despite repeated reassurance by the Bank of Korea that the countryhad sufficient foreign currency reserves, speculative attacks continued during November. Onthe 18 and 19 of November, the won repeatedly hit the floor of the fluctuation band depreciatingaround 2.5 percent vis-à-vis the dollar. Following our methodology, the date chosen as event is18 November, the first day of the first three consecutive days where the won depreciated morethan three times the standard deviation of the normal period daily variation. On this day theKorean Won depreciated by more than 2 percent. A few days the later on the 20 November,it depreciated by almost 10 percent. It is perhaps worth noting that on the 20 November theKorean government widened the band to 10 percent allowed fluctuation from the previous 2.25percent.
3.2 Event window
Following a standard event study methodology, we distinguish between the event window andthe estimation window. The estimation window should be chosen as a suitably long periodbefore the event, in our case the currency devaluation. Such estimation window is used toestimate differences in stock market returns between the export and non-export sectors duringquiet times. Such "normal" returns will, then, be used as benchmark to calculate the "abnormal"returns, that is, those in the run up to the devaluation. The event window is the period overwhich the returns of the sectors involved in the event will be examined. In our case, this eventcoincides with the run-up to each country’s currency devaluation. For all countries the eventwindow is chosen as the 20 days preceding the event and 10 days after the event.
The latter serve to investigate the short-run impact of the devaluation on the returns of exportingfirms relative to others. In fact, after the devaluation occurs, we should observe a widening gapbetween the returns in the general index and those in the exporting sector, with these lastones taking effective advantage of the occurred devaluation. In any event study, the mostrelevant part of the exercise is the evolution of abnormal returns prior to the devaluation. Toavoid the influence of the Thai crisis on other countries and the overlapping of estimation andevent windows, we consider one-year-and-a-half of daily observations (330 working days) upto 16 May 1997.
3.3 Normal returns, abnormal returns and cumulative abnormal returns
We now calculate normal, abnormal returns and cumulative abnormal returns (CARs) followingCampbell, Lo and MacKinlay (1996). In our setting, the differential return (R) is calculated asthe difference between the exporting and the non-exporting sector/firm (or the general stockmarket index), depending on the specification.
Rt = Day t returns for exporter - Day t returns for non-exporter
The Asian crisis: what did local stock markets expect? 7
To calculate the normal returns, E(R), we use the average differential return over the estimationwindow. This could be labeled a "constant-mean-difference-in-returns" model. Formally:
E(R) = Average daily return in the estimation window
To calculate the daily abnormal returns Et in the event window we take the difference betweenthe daily return differential during the event window and the average daily return in the estimationwindow.
Et = Rt − E(R)
To calculate the cumulative abnormal returns (CAR) for a given period we simply sum over thedaily abnormal returns in the event window, namely:
CARt,t+n = Et +Et+1 + . . . +Et+n
The difference between the CAR and the normal returns should provide a measure of the impactof the event on the relative value of the exporting sector equity.
4. Results
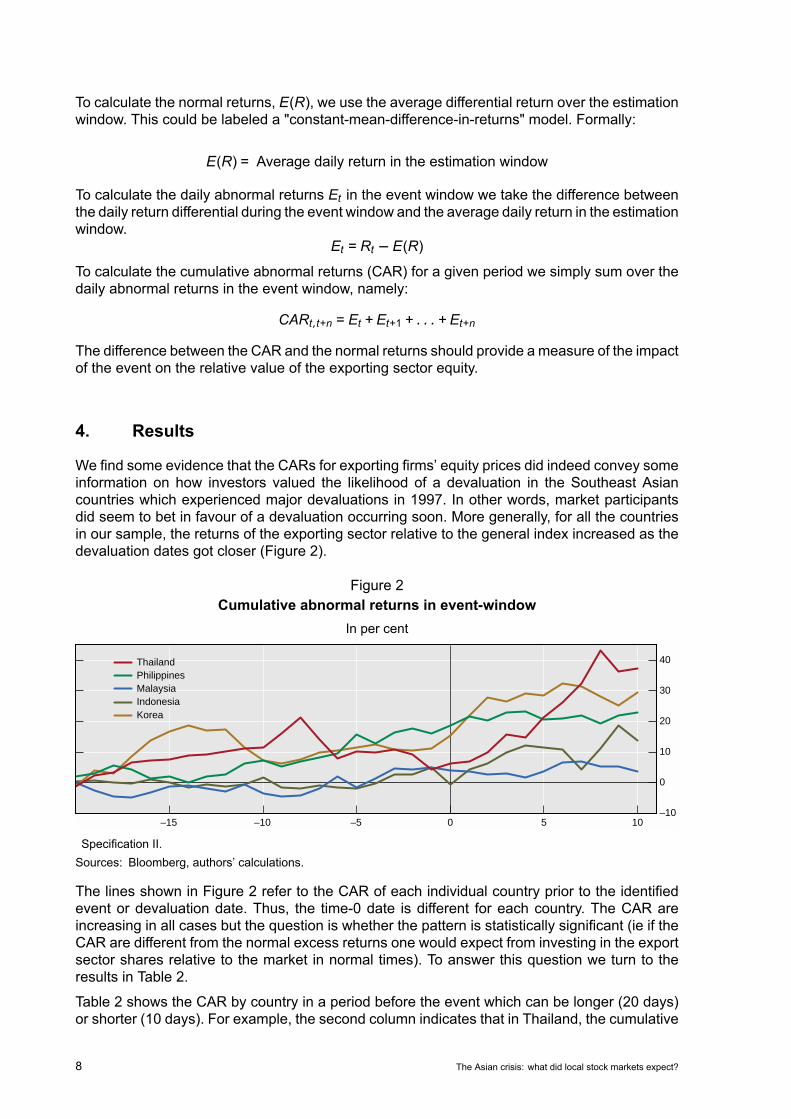
We find some evidence that the CARs for exporting firms’ equity prices did indeed convey someinformation on how investors valued the likelihood of a devaluation in the Southeast Asiancountries which experienced major devaluations in 1997. In other words, market participantsdid seem to bet in favour of a devaluation occurring soon. More generally, for all the countriesin our sample, the returns of the exporting sector relative to the general index increased as thedevaluation dates got closer (Figure 2).
Figure 2Cumulative abnormal returns in event-window
In per cent
–10
0
10
20
30
40
–15 –10 –5 0 5 10
ThailandPhilippinesMalaysiaIndonesiaKorea
Specification II.Sources: Bloomberg, authors’ calculations.
The lines shown in Figure 2 refer to the CAR of each individual country prior to the identifiedevent or devaluation date. Thus, the time-0 date is different for each country. The CAR areincreasing in all cases but the question is whether the pattern is statistically significant (ie if theCAR are different from the normal excess returns one would expect from investing in the exportsector shares relative to the market in normal times). To answer this question we turn to theresults in Table 2.
Table 2 shows the CAR by country in a period before the event which can be longer (20 days)or shorter (10 days). For example, the second column indicates that in Thailand, the cumulative
8 The Asian crisis: what did local stock markets expect?

abnormal returns from investing in the electronic (exporting) sector relative to the general indexwas 6.65 percent for the 20 days before the devaluation. The statistical significance is obtainedby comparing the excess returns with those that would have been obtained on the same timespan during a normal period. In this case, the probability of observing in normal times an excessreturn of the exporting sector over the general index of as much as 6.65 percent in 20 daysis less than 12 percent. By the same logic, investing in the Philippines exporting firm 20 daysbefore the crisis would guarantee 16.22 percent over the general index. The probability ofobserving such an excess return in normal periods is very close to zero percent.
Table 2Before the events
Cumulative abnormal returns and significance level
Specification I: Specification II: Specification III:
Export sector - Export firm - Export sector -
General index General index Non-export sector
20 days 10 days 20 days 10 days 20 days 10 days
Thailand6.65 3.44 4.41 –6.68 5.31 6.93∗
(0.12) (0.19) (0.37) (0.76) (0.23) (0.09)
Philippines16.22∗∗∗ 10.11∗∗∗
(0.01) (0.01)
Malaysia6.01 7.74∗
(0.25) (0.10)
Indonesia1.39 5.00∗ 4.93 5.42 –1.20 5.89
(0.43) (0.10) (0.34) (0.26) (0.56) (0.15)
Korea2.53 2.78 11.14 –0.25 7.11 6.46∗
(0.23) (0.12) (0.12) (0.51) (0.11) (0.06)
∗ Significance between 5 and 10 percent. ∗∗ Significance between 1 and 5 percent. ∗∗∗ Significance below 1pct.Sources: Bloomberg, authors’ calculations.
The first specification compares the sub-index for the exporting sector with the main index.Here we find that the CARs for Thailand, Indonesia and Korea are all positive and very close tobeing significant at the 10 percent level in the 10 days or two weeks prior to the event date. InThailand, they were also positive and close to being significant at the 10 percent level 20 daysor 4 weeks before the devaluation.
The second specification, which compares a single exporting firm with the main index, allows usto calculate CAR for all countries in our sample. The above table shows a strong and significantabnormal behaviour during the last 20 as well 10 trading days before the event in the Philippines.This likely reflects the impact of the Thai devaluation which took place on 2 July, only 9 daysbefore the devaluation of the peso. For both Indonesia and Malaysia we find high and positiveCARs 10 and 20 days before the devaluation, although none of them are statistically significant.For both Thailand and Korea the evidence with this specification is mixed, as the CARs arenegative in some cases and only one of them is even close to statistical significance. Thisfinding may reflect that the export sector chosen for Thailand is computers and computer parts
The Asian crisis: what did local stock markets expect? 9

sub-index which may have a higher degree of imported inputs than the sectors chosen for theother countries.The third specification compares the exporting sector with the non-exporting sector. Thisspecification provides only limited support for our hypothesis 20 days before the event. Inthe 10 days closest to the devaluations however, there is some evidence that excess returnsare positive and high for the export sector.5 The results are almost statistically significant forIndonesia and statistically significant for both Thailand and Korea.6
Overall, we interpret these results as providing some support for the hypothesis that thedevaluation was in fact expected by local equity market participants during the Asian crisis.The results are robust to changes in the estimation window. Appendix B provides results similarto those shown in Table 2 where the estimation period was moved back one month. As one cansee, the results are very similar to those presented in Table 2, and in some cases stronger.
Table 3After the events
Cumulative abnormal returns and significance level
5 days after THB devaluation 5 days after PHP devaluation
Thailand14.86∗∗∗ 2.24
(0.01) (0.24)
Philippines8.10∗∗∗ 2.10
(0.01) (0.25)
Malaysia5.08 6.71
(0.28) (0.18)
Indonesia10.28 9.22
(0.23) (0.22)
Specification II. ∗ Significance between 5 and 10 percent. ∗∗ Significance between 1 and 5 percent.∗∗∗ Significance below 1 percent.Sources: Bloomberg, authors’ calculations.
Up to now we have considered the presence of devaluation expectations for the local currencyfor equity prices in the local market. We now consider to what extent the other countries’ equitymarkets responded to the devaluation of the Thai baht and peso.As shown in Table 3, we find that following the Thai devaluation all markets had higher returns forexporters, with the difference being statistically significant for both Thailand and the Philippines.The findings for the latter however, likely also reflect expectations of a devaluation of the pesowhich occurred a few days later. Similarly, we also find that the following the devaluation of thepeso returns were higher for exporters in all markets. The results are however, less strong thanfollowing the devaluation of the baht. We interpret the results in Table 3 as an indication that
5 For Malaysia similar results were found using Kuala Lumpur Kepong BHD, with a similar share of revenuesfrom exports and with sales in other Asian countries not affected by the 1997 crisis.
6 Given Korea’s higher level of financial development, we are also able to perform an additional test, namelycomparing Samsung Heavy Industries branch with the Samsung Securities branch, which is fully home based.By comparing two subsidiaries of the same firm this exercise controls (to some extent for firm heterogeneity).The results are similar in spirit to those presented in Table 2. We thank Doo Yong Yang for suggesting thisadditional specification.
10 The Asian crisis: what did local stock markets expect?

both the devaluation of the baht and the peso in early July resulted in devaluation of the othercurrencies as being seen as more likely than before, with the impact of the Thai devaluationbeing the most important.
4.1 Controlling for macroeconomic factors
Event study methodology is, by nature, a uni-variate methodology. To check the robustness ofour results to the inclusion of other variables, we move to panel regression. This allows us tocontrol for potentially relevant financial and macroeconomic determinants of the devaluationwhich occurred during the Asian crisis, drawing from the literature of early warning indicatorsreviewed before. The disadvantage of this methodology, compared to the event study analysis,is obvious in our case: it cannot profit from the daily nature of the stock market information, ascontrol variables have a much lower frequency (monthly in few cases and, otherwise, quarterlyor yearly).
Table 4Controlling for macroeconomic factors
Significance of explanatory variables in logit regression
Objective variable
Excess returns0.056∗∗ 0.062∗ 0.057∗∗ 0.065∗
(0.01) (0.03) (0.01) (0.02)
Macroeconomic control variables
Change in domestic credit0.041 0.529
(one period lag) (0.64) (0.46)
Change in REER0.024 0.025
(one period lag) (0.74) (0.74)
Change in CPI0.035 0.011
(one period lag) (0.81) (0.93)
Change in industrial production0.028 0.029
(one period lag) (0.38) (0.34)
Observations: 120 Observations: 120 Observations: 120 Observations: 120
Pseudo R2 = 0.04 Pseudo R2 = 0.05 Pseudo R2 = 0.05 Pseudo R2 = 0.06
∗ Significant at 5 percent level ∗∗ Significant at 1 percent level. P-values are reported in parenthesis.Source: Authors’ calculations.
However, even if we have to aggregate the daily data on the stock markets, to make themcomparable with the other macroeconomic control variables, we still succeed in building ourobjective variable (excess returns) starting from daily observations in the following way: wefirst consider two years of daily observations (from 10.01.1995 to 27.12.1996) and we obtainthe daily average excess returns in this period. This will represent our out-of-sample period.We then get the daily average excess returns on a monthly basis for all the months startingfrom January 1997 until December 1998. This will represent our in-sample period. By takingthe difference between the out-of-sample and the in-sample average daily excess returns, weobtain our objective variable.
The Asian crisis: what did local stock markets expect? 11

The dependent variable is a categorical variable built in accordance with the literature on earlywarning systems: it characterises an event as any devaluation in the exchange rate vis-à-visthe US Dollar which exceed the 90th percentile of monthly variation in the two years in-sample-period. This means that of the 24 months under consideration (from January 1997 to December1998), only three will be considered as events. After controlling for unobserved heterogeneitywith fixed effects, we find that excess returns by exporting companies are significantly higherjust prior to the devaluation, as compared with those that had been obtained during a normalperiod (our out-of-sample period). None of the other controls are found to be significant, whichconfirms the general view in the literature that the Asian devaluations were extremely difficultto predict using macroeconomic variables.
5. Concluding thoughts
In this paper we have used event study methodology to analyse whether stock markets in thefive Southeast Asian countries which devalued in 1997, namely Indonesia, Korea, Malaysia,the Philippines and Thailand could have conveyed useful information to predict the 1997currency crises. The underlying assumption for our analysis is that a large devaluation shouldbenefit exporting firms relatively more than non-exporting firms. The implication being that ifa depreciation is seen as likely, returns for exporting firm equities should be unusually highrelative to non-exporting firm equities in the period leading up the event.
We relied on three different specifications with different degrees of granularity. First wecompared, where available an export sector subindex with the main index. Second, wecompared individual firm equity prices for exporting firms with the main index. The third andfinal specification compared the export sector index with a non-export sector index.
Our results broadly confirm, using several different data combinations for the event study, thatlocal equity markets favoured exporters in the periods leading up to the devaluations. We alsofind that equitymarkets in the other sample countries reacted by favouring exporters immediatelyafter the devaluation of the Thai baht. We interpret this as mild evidence in favour of investorsexpecting Thailand’s currency crisis to spread to other countries in the region, contrary to whatmany had thought. Using a panel regression, we also find that the event-study results are robustto the inclusion macroeconomic variables generally used in the literature.
12 The Asian crisis: what did local stock markets expect?

Appendix A: Data characteristics
Table A.1Data characteristics
Country Variable Description
Thailand
SET Main stock index
SETETRON Electronic sub-index. Main export sector in the SET index. Represents 1.83 percent of the SET
Index.
SETINS Insurance sub-index. Main non-export sector in the SET index.
Muramoto Electronics1 Produces and exports electronics components. More than 80 percent of revenues from sales
abroad.
Korea
KOSPI Main stock index
KOSPTREQ Heavy industrial equipment sub-index. Almost 100 percent export oriented. It represents 10.3
percent of the KOSPI Index
KOSPCONS Real estate sub-index. Main home-based sector in the KOSPI Index
Samsung Heavy Industries Ltd Manufactures crude oil tankers. Also produces steel and bridge structures. More than 80
percent of revenues from sales abroad
PhilippinesPCOMP Main stock index
Philippine LDT Provides domestic and international telephone services. Predominant share of revenues are
from sales abroad.
MalaysiaKLCI Main stock index
Golden Hope Plantations2 Produces and processes rubber and palm oil. More than 50 percent of revenues from sales
abroad. Two biggest companies in the palm oil production sector. For further information:
www.ids.org.my/stats/Agriculture
Indonesia
JCI Main stock index
JAKMINE Electronic sub-index. Main export sector in the SET index. Represents 1.83 percent of SET
Index.
JAKCONS3 Insurance sub-index. Main non-export sector in the SET index.
Medco Energi Internasional4 Provides exploration, production and support services for oil, natural gas and other energy
industries. Two biggest exporting companies listed in the Jakmine Index for which data are
available.
1 Hana, MPT and Delta considered as alternatives. 2 KPK considered as alternative. 3 JAKBIND considered asalternative. 4 TINS considered as alternative.Sources: Bloomberg, Economist Intelligence Unit
The Asian crisis: what did local stock markets expect? 13

Appendix B: Event study robustness to estimation window
Table B.1Event study results with different estimation window
Cumulative abnormal returns and significance level
Specification I: Specification II: Specification III:
Export sector - Export firm - Export sector -
General index General index Non-export sector
20 days 10 days 20 days 10 days 20 days 10 days
Thailand7.50∗ 3.87 6.34 -5.89 5.20 6.88∗
(0.09) (0.16) (0.32) (0.73) (0.23) (0.09)
Philippines16.74∗∗∗ 10.36∗∗∗
(0.003) (0.01)
Malaysia7.96 7.80∗
(0.16) (0.08)
Indonesia7.92∗ 1.49 2.23 8.29 -1.00 5.98
((0.07)) (0.42) (0.45) (0.24) (0.55) (0.15)
Korea9.95∗∗∗ 2.94∗∗∗ 12.35∗ .35 7.78∗ 6.80∗∗
(0.00) (0.11) (0.08) (0.48) (0.09) (0.049)
∗ Significance between 5 and 10 percent. ∗∗ Significance between 1 and 5 percent. ∗∗∗ Significance below 1percent.Sources: Bloomberg, authors’ calculations.
14 The Asian crisis: what did local stock markets expect?

References
Allayannis, G, G Brown and L Klapper (2003): “Capital structure and financial risk: evidencefrom foreign debt use in east asia”, Journal of Finance, vol 58, pp 2285–812.
Berg, A, E Borensztein and C Patillo (2004): “Assessing early warning systems: how have theyworked in practice?”, IMF Working Paper no WP/04/52.
Bleakley, H and K Cowan (2005): “Dollar debt and devaluations: much ado about nothing?”,IADB Working Paper no 532.
Campbell, J, A W Lo and A C MacKinlay (1996): The econometrics of financial markets,Princeton University Press, Princeton.
Cohen, B and E Remolona (2008): “Information flows during the asian crisis: evidence fromclosed-end funds”, Journal of International Money and Finance, vol 27, pp 636–53.
Crespo Cuaresma, J and T Slacik (2007): “An ’almost-too-late’ warning mechanism for currencycrises”, University of Innsbruck Working Paper no 2007-10.
Ferri, G, L G Liu and J E Stiglitz (1999): “The pro-cyclical behaviour of credit rating agencies:evidence from the east asian crisis”, Economic Notes, vol 28, pp 335–55.
Guesnerie, R and M Woodford (2003): “Can currency crises be forecast?”, in G Gandolfoand F Marzano (eds), International economic flows, currency crises, investment and economicdevelopment, essays in memory of vittorio marrama, EUROMA, Roma.
Kaminski, G, S Lizondo and C M Reinhart (1998): “Leading indicators of currency crisis”, IMFStaff Papers, vol 45, pp 1–48.
The Asian crisis: what did local stock markets expect? 15