DETECTION OF SOLAR-LIKE OSCILLATIONS FROM KEPLER PHOTOMETRY OF THE OPEN CLUSTER NGC 6819

arX
iv:a
stro
-ph/
0607
452v
1 1
9 Ju
l 200
6
Mon. Not. R. Astron. Soc. 000, 1–?? (2002) Printed 5 February 2008 (MN LATEX style file v2.2)
The Arecibo Galaxy Environment Survey: Precursor
Observations of the NGC 628 group
R. Auld,1, R. F. Minchin2, J. I. Davies1, B. Catinella2,W. van Driel3, P. A. Henning4,
S. Linder5, E. Momjian2,E. Muller6, K. O’Neil7, S. Sabatini8, S. Schneider9,
G. Bothun10, L. Cortese1, M. Disney1, G. L. Hoffman11, M. Putman12,
J. L. Rosenberg13, M. Baes14, W. J. G. de Blok15,A. Boselli16, E. Brinks17, N. Brosch18,
J. Irwin19,I. D. Karachentsev20, V. A. Kilborn6,21, B. Koribalski6, K. Spekkens221Department of Physics & Astronomy, Cardiff University, UK2Arecibo Observatory, HC3 Box 53995, Arecibo, PR 00612, USA3Observatoire de Meudon, 5 Place Jules Janssen, 92195 Meudon, France4Institute for Astrophysics, University of New Mexico, 800 Yale Blvd, NE, Albuquerque, NM 87131, USA5Hamburger Sternwarte, Universitat, Gojenbergsweg 112, 21029 Hamburg, Germany6Australia National Telescope Facility, CSIRO, P.O. Box 76, Epping, NSW 1710, Australia7National Radio Astronomy Observatory, Green Bank, WV 24944, USA8INAF-OAR, via di Frascati 33, 00040 Monteporzio Catone, Roma, Italy9Department of Astronomy, University of Massachusetts, Amherst, MA 01003, USA10Department of Physics, University of Oregon, Eugene, OR 97403, USA11Hugel Science Center, Lafayette College, Easton, PA 18042, USA12Department of Astronomy, University of Michigan, Ann Arbor, MI 48109, USA13Harvard-Smithsonian Center for Astrophysics, 60 Garden Street, MS 65, Cambridge, MA 02138-1516, USA14European Southern Observatory, Casilla 19001, Santiago 19, Chile15RSAA, Australian National University, Mount Stromlo Observatory, Cotter Road, Weston Creek, ACT 2611, Australia16Laboratoire d’Astrophysique, Traverse du Siphon, BP8, 13376 Marseille, France17Centre for Astrophysics Research, Science & Technology Research Institute, University of Hertfordshire, Hatfield, AL10 9AB, UK18The Wise Observatory and the School of Physics and Astronomy, Raymond and Beverly Sackler Faculty of Exact Sciences,
Tel Aviv University, Tel Aviv 69978, Israel19Department of Physics, Queen’s University, Kingston, Ontario K7L 3N6, Canada20Special Astrophysical Observatory, Russian Academy of Sciences, Niszhnij Arkhyz 369167, Zelencukskaya, Karachai-Cherkessia, Russia21Centre for Astrophysics and Supercomputing, Swinburne University of Technology, P.O. Box 218, Hawthorn, VIC 3122, Australia22Jansky Fellow, NRAO, Department of Physics and Astronomy, Rutgers, The State University of New Jersey, Piscataway, NJ 08854, USA
Accepted 0000 December 00. Received 0000 December 00; in original form 2004 July 26

2 Auld et al.
ABSTRACT
The Arecibo Galaxy Environment Survey (AGES) is one of several H i surveysutilising the new Arecibo L-band Feed Array (ALFA) fitted to the 305m radio tele-scope at Arecibo⋆. The survey is specifically designed to investigate various galacticenvironments to higher sensitivity, higher velocity resolution and higher spatial res-olution than previous fully sampled, 21 cm multibeam surveys. The emphasis is onmaking detailed observations of nearby objects although the large system bandwidth(100 MHz) will allow us to quantify the H i properties over a large instantaneousvelocity range.
In this paper we describe the survey and its goals and present the results from theprecursor observations of a 5◦×1◦ region containing the nearby (∼ 10 Mpc) NGC 628group. We have detected all the group galaxies in the region including the low mass(MHI ∼ 107M⊙) dwarf, dw0137+1541 (Briggs, 1986). The fluxes and velocities forthese galaxies compare well with previously published data. There is no intra-groupneutral gas detected down to a limiting column density of 2×1018cm−2.
In addition to the group galaxies we have detected 22 galaxies beyond the NGC628 group, 9 of which are previously uncatalogued. We present the H i data for theseobjects and also SuperCOSMOS images for possible optical galaxies that might beassociated with the H i signal. We have used V/Vmax analysis to model how manygalaxies beyond 1000 km s−1 should be detected and compare this with our results.The predicted number of detectable galaxies varies depending on the H i mass function(HIMF) used in the analysis. Unfortunately the precursor survey area is too small todetermine whether this is saying anything fundamental about the HIMF or simplyhighlighting the effect of low number statistics. This is just one of many questionsthat will be addressed by the complete AGES survey.
Key words: Cosmology: H i surveys, HIMF, galaxy evolution, HVCs, galaxy envi-ronment
1 INTRODUCTION
With the advent of 21cm multibeam receivers on single dishtelescopes, it has become possible to carry out fully sam-pled surveys over large areas of sky. The H i Parkes All SkySurvey (HIPASS: Barnes et al. 2001) and its sister surveythe H i Jodrell All Sky Survey (HIJASS: Lang et al. 2001)have recently completed mapping the whole sky south of δ=+25◦ as well as selected fields north of δ=+25◦. These sur-veys have been used to construct H i selected catalogues ofgalaxies (Koribalski et al. 2004, Meyer et al. 2004), identifyextended H i structures and High Velocity Clouds (HVCs) inthe Local Group (Putman et al. 2002; Putman et al. 2003),place limits on the faint end of the HIMF (Kilborn, Webster& Staveley-Smith 1999; Zwaan et al. 2005), to identify a pop-ulation of gas-rich galaxies (Minchin et al. 2003), to placelimits on the number of previously undetected H i clouds andextended H i features (Ryder et al. 2001; Davies et al. 2001;Ryan-Weber et al. 2004), to measure the H i properties ofcluster galaxies (Waugh et al. 2002; Davies et al. 2004) andto measure the cosmic mass density of neutral gas (Zwaan etal. 2003). Although these surveys have been very successfulin many ways they have suffered from rather poor sensitivity(∼13 mJy beam−1), velocity resolution (∼ 18 km s−1) andspatial resolution (HIPASS: ∼ 15′, HIJASS: ∼ 12′). Theyhave however set a benchmark against which other surveyswill be measured.
The installation of the Arecibo L-Band Feed Array(ALFA) at Arecibo presents the opportunity to survey thesky with higher sensitivity and higher spatial resolution than
has been achievable previously. In addition to the receiver ar-ray, new back-ends have been designed specifically for Galac-tic, extragalactic and pulsar observers. Three consortia havebeen formed to gain the full potential from ALFA: PALFAfor Pulsar research, GALFA for Galactic science and EALFAis the extragalactic consortium. The new back-end for ex-tragalactic astronomers provides not only increased spectralresolution but also more bandwidth than was available forprevious H i surveys.
The Arecibo Galaxy Environment Survey (AGES)forms one of four working groups within EALFA andwill study environmental effects on H i characteristics. TheArecibo Legacy Fast ALFA, ALFALFA, survey (Giovanelliet al. 2005) covers a larger area (∼7000 sq. deg.) but ismuch shallower than AGES (Tint ∼24s). AGES will use2000 hours of telescope time over the next 5 years and willgo deeper than ALFALFA to produce a much more sensitivesurvey (Tint ∼300s) over a smaller area (∼200 sq. deg.).
The Zone of Avoidance survey, ZOA (Henning et al. inprep.) will concentrate on the low-Galactic latitude (b < 5◦)portion of the sky visible to Arecibo. By performing com-mensal observations with the Galactic ALFA working group(GALFA) and the Pulsar ALFA working group (PALFA),they will reach a Tint ∼ 270s.
The ALFA Ultra Deep Survey, AUDS (Freudling et al.in prep.) will reach an integration time of ∼75 hours, over asmall area (∼0.4 sq. deg.) and will search for objects moredistant than the previous surveys will be able to detect.
The paper is organised as follows: first we describe theaims of the AGES survey and the survey fields. Then in

AGES: observations of the NGC 628 group 3
section 2 we discuss the observing strategy and the data re-duction. In section 3 we describe the precursor observationsof the field around NGC 628 and present preliminary anal-ysis. In 4 we present the results from the NGC 628 groupand discuss objects detected beyond the NGC 628 group.Conclusions of the AGES precursor observations are givenin section 5.
2 THE ARECIBO GALAXY ENVIRONMENTSURVEY (AGES)
Exploiting the improvements in sensitivity, velocity resolu-tion and spatial resolution offered by the ALFA system, theArecibo Galaxy Environment Survey (AGES) aims to studythe atomic hydrogen properties of different galactic envi-ronments to sensitive limits; low H i masses (5 × 10⁶M⊙)1
and low column densities (3 × 1018cm−2). These environ-ments range from apparent voids in the large scale struc-ture of galaxies, via isolated spiral galaxies and their halos,to galaxy-rich regions associated with galaxy clusters andfilamentary structures. Our intentions are: to explicitly in-vestigate the HIMF in each environment, to measure thespatial distribution of H i selected galaxies, to identify in-dividual low mass and low column density objects, to de-termine the low column density extent of large galaxies andto compare our results with expectations derived from QSOabsorption line studies. In addition we aim to explore the na-ture of High Velocity Clouds (HVCs) and their possible linkto dwarf galaxies, measure the contribution of neutral gas tothe global baryonic mass density, identify gaseous tidal fea-tures as signatures of mergers and interactions and compareour results with numerical models of galaxy formation.
While ALFALFA and AGES share similar goals, by go-ing deeper AGES will be able to reach lower mass limitsand column density limits than ALFALFA at any given dis-tance. An added benefit of choosing smaller fields is thatdeep multi-wavelength comparison surveys become muchmore feasible. This is extremely important as it will al-low us to study not only objects of interest but also thesurrounding environment which may be influencing theirevolution. This environment may stretch over length scalesof degrees, particularly for nearby galaxies, requiring sensi-tive telescopes with large fields of view. The Hubble SpaceTelescope, MEGACAM on the Canada-France-Hawaii Tele-scope, GALEX and UKIRT amongst others will be used fordeep observations of each of the AGES fields in optical, UV,and NIR bands.
2.1 The Arecibo L-band Feed Array (ALFA)
Here we summarise the properties of ALFA. For a morecomplete description the reader is referred to Giovanelli etal. (2005). ALFA operates between 1.225 and 1.525 GHzand consists of a cluster of seven cooled dual-polarisationfeed horns. The outer six feeds are arranged in a hexago-nal pattern around the central beam. The digital back-endsignal processors are Wide-band Arecibo Pulsar Processors(WAPPs) that have been upgraded to perform spectral line
1 at the distance of the Virgo Cluster (16 Mpc)
observing. The WAPPs were configured to cover 100 MHzobserving bandwidth with 4096 channels, giving a channelspacing of 24.4 kHz ≡ 5.15 km s−1 at the rest frequency ofH i. At 1.4 GHz the mean half power beam width is 3.4′andthe mean system temperature is 30 K.
2.2 The AGES fields
Because Arecibo is a fixed-dish telescope the observable skyis restricted in declination (−1◦ . δ . +38◦) on-source timeis limited to typically a 2 hour window centred on the merid-ian on any night. To optimise scheduling, AGES fields werechosen across a range of RAs (Fig. 1). Most areas comprise a5◦×4◦ field with an integration time of 300s per point in two
polarisations. The rms noise in the final data is estimatedto be between 0.5–1 mJy/beam per channel for a channelseparation of 5.15 km s−1. At the distance of the Virgo clus-ter (∼16 Mpc) this will enable us to reach an H i mass limitof 5 × 10⁶M⊙ (W50 = 30 km s−1), and will permit us todetect H i masses as low as 5 × 10⁷M⊙ out to 3 times thisdistance. This is of particular significance as the HIMF ispoorly constrained below 108M⊙.
2.2.1 The Virgo cluster
We have selected two regions of the Virgo cluster to makea comparison of the H i properties of cluster galaxies withthose in the field. Both regions avoid the inner 1◦ of the clus-ter as the large continuum source associated with M87 limitsthe dynamic range in the area of about 1 degree around it.Also previous observations indicate very little H i within thecluster core (Davies et al. 2004).
The first region is 10◦×2◦ centred on (α, δ) = 12h 30m
00s, 8◦ 00′ 00′′. This region will be imaged as part of theUKIDSS large area survey (Lawrence et al. in prep.) in J, Hand K bands. We also have deep B-band images of the re-gion taken with the Isaac Newton Telescope, on La Palma.To complement these data, this region will also be observedby GALEX (Martin et al. 2005) in the near (2300 A) andfar ultraviolet (1500 A) later in 2006. NIR bands are lesssusceptible to extinction and are thus more accurate mea-sures of stellar mass. Optical-NIR colours can also be usedfor studying galaxy metallicity and star formation histories.UV is a tracer of ongoing star formation and will allow usto compare current star formation rates with integrated starformation histories. The UV is also useful for searching forsigns of star formation in tidal features.
The second region is a 5◦×1◦ E–W strip centred on
(α, δ) = 12h 48m 00s, 11◦ 36′ 00′′. This strip extends radiallytowards the cluster edge and will be used to observe changesin galaxy properties with radius from the cluster centre, ex-panding on the work of Sabatini et al. (2003). This stripextends through the galaxy grouping known as sub-clusterA that is associated with M87 (Binggeli et al. 1993). Theresults of these observations will be useful for comparingwith models of how the cluster environment affects galaxyevolution (tidal stripping, ram pressure stripping etc.).
We will also search for low mass galaxy companions orcluster dwarf galaxies as well as previously unidentified H i
clouds. Another interesting study will be to see how bary-onic material (stars, X-ray gas, neutral gas) in the cluster

4 Auld et al.
Figure 1. A northern sky map showing the location of the AGES fields.
is distributed and compare this with the environment sur-rounding field galaxies.
2.2.2 The local void
We have selected a 5◦×4◦ region centred on (α, δ) = 18h
38m 00s, 18◦ 00′ 00′′. We will search for H i signatures thatmight be associated with very low surface brightness galaxiesor with H i clouds devoid of stars. The properties of galaxiesdetected will provide an interesting comparison with thosein more dense environments.
2.2.3 M33 and the Perseus-Pisces filament
This will comprise a 5◦×4◦ region centred on (α, δ) = 01h
34m 00s, 30◦ 40′ 00′′. The aim is to map in detail the envi-ronment of M33 to search for tidal bridges, HVCs etc. thatare signatures of diffuse hydrogen in the Local Group. West-meier et al. (2005) and Braun & Thilker (2005) have alreadyobserved numerous HVCs around M31 and M33, as well asa H i bridge connecting M31 and M33.
M33 will occupy about 1 sq. deg. at the centre of thefield. At the distance of M33, the ALFA beam width (3.4′)will be about 0.6 kpc, providing us with superb spatial res-olution. The H i mass sensitivity will be as low 2×10⁴M⊙.The Perseus-Pisces filament will become visible behind M33at approximately 4000–6000 km s−1.
2.2.4 The cluster A1367
A1367 is a spiral-rich, dynamically young cluster at a ve-locity of around 6500 km s−1, and is currently forming atthe intersection of two large scale filaments (Cortese et al.2004). Recent optical and X-ray observations (i.e. Gavazziet al.2001; Sun & Murray, 2002) suggest that ram pressurestripping and tidal interactions are strongly affecting theevolution of cluster galaxies, making this cluster the idealplace to study the environmental effects on the gas content.The whole cluster will just about fill a 5◦
×4◦ region centredon (α, δ) = 11h 44m 00s, 19◦ 50′ 00′′. Given the morphol-ogy of the cluster we expect many detections including newobjects that are more prominent in H i than other wave-lengths. The H i mass detection limit at this distance will beapproximately 2×10⁸ M⊙.
2.2.5 The Leo I group
This group lies at about 1000 km s−1 and we will surveya 5◦
×4◦ region centred on (α, δ) = 10h 45m 00s, 11◦ 48′
00′′. The group is of particular interest because of the rel-atively large number of early-type galaxies (e.g. NGC 3377& NGC 3379) and will make a good comparison with spi-ral rich groups. We should reach a lower H i mass limit of∼ 2 × 10⁶ M⊙ at its distance of 10 Mpc.
2.2.6 The NGC 7448 group
NGC 7448 is a Sbc spiral galaxy at a velocity of ∼ 2200 kms−1, with a number of late and early type companions. Thegroup will serve as a good contrast to the Leo I group. Wewill study a 5◦
×4◦ area centred on (α, δ) = 23h 00m 00s,15◦ 59′ 00′′. At the distance of this group (30.6 Mpc) weshould reach a H i mass limit of 1.8×10⁶ M⊙.
2.2.7 The NGC 3193 group
NGC 3193, in contrast to NGC 7448, is an elliptical galaxyand there are another 9 known group members all part ofa well defined galaxy filament. NGC 3193 has a velocity of1362 km s−1 and we will be surveying an area of 5◦
×4◦
centred on (α, δ) = 10h 03m 00s, 21◦ 53′ 00′′. The lower H i
mass limit at this distance (18.9 Mpc) will be approximately7.0×106 M⊙.
2.2.8 Individual galaxies
This will consist of observations of pairs of galaxies (prin-ciple galaxy either early or late type) and very isolatedgalaxies such as NGC 1156 and UGC 2082. NGC 1156 hasno neighbouring galaxies within 10◦ (Karachentsev, 1996),UGC 2082 has no neighbour within 5 ◦ in the Nearby Galax-ies Atlas (Tully & Fisher, 1987). Details are shown in Table1.
2.2.9 AGESVOLUME
In addition to the data collected from the targets mentionedabove, the large system bandwidth (100 MHz) will allowus to simultaneously sample a much deeper volume of theuniverse and search for more distant galaxies along the lineof sight out to cz ∼ 19000 km s−1. The detection limitat this distance will be MHI = 1.4 × 10⁹M⊙. This is theAGESVOLUME and will be a very important part of the

AGES: observations of the NGC 628 group 5
Table 1. H i Survey fields for individual galaxies.
Galaxy RA dec. Type Vsys Distance H i mass limit Comments Survey(h m s) (◦ ′ ′′) (km s−1) (Mpc) (M⊙) area
NGC 6555 18 06 00 17 30 00 Sc, 2225 30.9 1.9×10⁷ paired with 5◦×4◦
face-on NGC 6548NGC 2577 08 24 00 22 30 00 S0 2057 28.6 1.6×10⁷ paired with 5◦×4◦
UGC 4375NGC 7332 22 36 00 23 48 00 S0 (pec) 375 5.2 5×10⁵ paired with 2.5◦×2◦
NGC 7339UGC2082 02 36 00 25 48 00 Sc, 696 9.7 1.8×10⁶ very 2.5◦×2◦
edge-on isolatedNGC 1156 03 00 00 25 12 00 Irr 375 5.2 5×10⁵ very 2.5◦×2◦
isolated
project, providing information on the HIMF, the baryonicmass density of neutral gas and the distribution of H i.
2.3 Observing strategy
A number of observing strategies were considered for thesurvey, which involved pointed observations, drift scanning,driven scanning techniques or combinations thereof. Thesuccessful observing method had to strike the right balancebetween data quality and observing efficiency.
Giovanelli et al. (2005) describe in detail an observingmode known as drift scanning. As the name suggests, thearray is kept at a fixed azimuth and elevation while the skydrifts overhead. The benefits of this technique are that thetelescope gain remains constant and the system temperatureonly varies slowly over a single scan. Standing waves set upbetween the receiver and the dish cause ripples to appear inthe spectrum baseline. These waves are quasi-periodic anddepend on the polarisation, the geometry of the dish andthe location of continuum sources in the main beam andsidelobes. Hence each beam and polarisation will have a dif-ferent baseline ripple at any given time. This baseline ripplecan cause confusion with low signal sources so limiting itseffect is highly desirable. The drift scan technique has theadvantage that this ripple is more or less constant over thecourse of the scan. It is then possible to accurately estimatethe ripple and remove it from the data during the data re-duction. The benefits made the drift scan highly desirablefor our own observations.
The Earth’s rotation rate governs the on source time ina drift scan. For Arecibo this means that each point in thesky takes 12s to cross the beam at 1.4 GHz. 25 separate scansare then required per point to reach the 300s integrationtime. Since the technique used in ALFALFA only allows forscans taken along the meridian (Giovanelli et al. 2005) it wasnecessary to adapt the method to allow us to conduct scansbefore and after transit, and hence build up sky coveragemore quickly.
In order to compensate for the change in parallacticangle, and thus achieve uniform sky coverage, ALFA mustbe rotated before every scan. The geometry of the Gregoriansystem projects a slightly elliptical beam pattern on the sky.The projected beams are also slightly elliptical (see Fig. 2).As a result of these effects, once the array is rotated to
Figure 2. An illustration of the projected ALFA footprint, (a)unrotated with respect to the direction of the scan, and (b) ro-tated to produce equidistant beams of 2.1′ separation. Dottedlines indicate the individual beam tracks across the sky.
produce equidistant beam tracks, the beam separation isslightly larger than that required for Nyquist sampling. Toattain fully sampled sky coverage it is necessary to staggerthe declination of individual scans by ∼1′ (half the beamseparation). An IDL routine has been developed to calculatethe rotation angle and the starting coordinates and LSTs inadvance of every observing run. This staggering is arrangedsuch that every beam covers the same patch of sky helpingto combat variations in gain between the beams. Anotherbenefit of this method is to reduce the impact of sidelobecontamination. This effect is discussed separately in the nextsection.
2.4 Data reduction
Data reduction will be performed using the aips++ pack-ages livedata and gridzilla (Barnes et al. 2001), devel-oped by the Australian Telescope National Facility (ATNF).These packages were originally designed for the HIPASS andHIJASS surveys but were modified to accept the AreciboCIMAFITS file format. livedata performs bandpass esti-mation and removal, Doppler tracking and calibrates theresidual spectrum. It also has the ability to apply spec-tral smoothing if required. Bandpass calibration can be per-formed using a variety of algorithms, all based around themedian statistic. The median has the advantage that it ismore robust to outliers than the mean statistic. This prop-erty makes the median estimated bandpass more resistantto radio frequency interference (RFI).

6 Auld et al.
Figure 3. An illustration of the ALFA beam footprint to em-phasise the strength and symmetry of the sidelobes. (a) A highlystretched image of the combined response of all seven ALFAbeams, the image size is 32′×32′. (b) The beam separations havebeen stretched to 2.5 times the true separations to highlight thesidelobes of the beams. The angular scales of each beam is correctand unchanged. The image size in this case is 48′×48′. (Figuresappear courtesy of Carl Heiles.)
gridzilla is a gridding package that co-adds all thespectra using a suitable algorithm, to produce 3-D dat-acubes. The user has full control over which beams andpolarisations to select, the frequency range, the image sizeand geometry, pixel size and data validation parameters aswell as the gridding parameters themselves. Various weight-ing functions are available for gridding the data. The out-put datacube has two spatial dimensions and the spectraldimension can be chosen by the user to be frequency, wave-length or velocity (numerous conventions are available foreach choice). Full details of the bandpass estimation andgridding technique are given in Barnes et al. (2001).
The sidelobes for the central beam are symmetric, whilesidelobe levels for each of the outer beams are highly asym-metric, as shown in Fig. 3. Our ability to regain low columndensity emission could be highly compromised if they arenot corrected, particularly near bright objects or very ex-tended objects. In the final, gridded data, each beam hascontributed equally to each pixel apart from at the extremeedges of the map where sky coverage is not complete. Fig.3(b) highlights the radial alignment of the peaks of each ofthe sidelobes. When median gridding is applied this meansthat in order for a pixel to be significantly contaminatedby sidelobe emission, the source must appear in more thanthree of the beams. Point sources can therefore be consid-ered free of sidelobe contamination. It should be noted thatthere is likely to be some low level contamination in extendedobjects and we are investigating ways to reduce this.
3 PRECURSOR OBSERVATIONS
The observations were taken using the 305m radio telescopelocated at Arecibo, Puerto Rico. We were allocated a to-tal of 86 hours which was split between different observingstrategies, as part of a ‘shared risk’ strategy. The drift scanobservations received 42.5 hours and we discuss only theseobservations in this paper. The observations were taken over22 nights between November 19th 2004 and December 18th2004. No radar blanking was used because it was not func-tional at the time, leading to several sources of RFI as dis-
cussed later. System malfunctions were inevitable during atesting run such as this, but only four nights’ of observingwere affected. This corresponded to approximately 10 hourslost time.
3.1 The NGC 628 group
The group is centred round a large, face-on spiral, NGC628 and the peculiar spiral NGC 660. NGC 628 is associ-ated with several companions: UGC 1104, UGC 1171, UGC1176(DDO13), UGC A20 and KDG10. NGC 660 also hasa couple of companions: UGC 1195 and UGC 1200 (Fig.4). Most of the companions are star forming dwarf irregu-lars and together these galaxies form a gas-rich group anal-ogous to the Local Group (Sharina et al., 1996). The reces-sional velocity of NGC 628 is ∼660 km s−1 (Huchra, Vogeley& Geller, 1999; de Vaucouleurs, 1991; Kamphuis & Briggs,1992) placing it at approximately 10 Mpc away (assumingno peculiar motion and Ho = 75 km s−1 Mpc−1, as usedin Briggs, 1986). Supernovae measurements (Hendry et al.2005) give a distance measurement of 9.3±1.8 Mpc.
NGC 628 has a very narrow velocity width, W50 = 56km s−1 (Kamphuis & Briggs 1992). It is close enough toallow detection of low-mass H i objects with only MHI =2× 10⁶M⊙ of neutral hydrogen, but separated enough fromlocal Galactic gas to be able to detect any high velocitygas associated with the galaxy. Kamphuis & Briggs (1992)looked at this galaxy at 21cm with the VLA and discoveredhigh velocity gas on the outskirts of NGC 628 but nothingthat could be considered HVCs. A few years earlier anothersurvey (Briggs, 1986) revealed a new, low-mass companion,dw0137+1541 (MHI = 7×10⁶M⊙). This group has also beencovered by the HIPASS northern extension. The interestingaspects of the group and the availability of comparison ob-servations from other instruments made it a natural choicefor precursor observations using a new instrument.
3.2 Observations and data reduction
A 5◦×1◦ field was chosen centred on a position halfway
between NGC 628 and the nearest dwarf UGC 1176 (Fig.4). The region includes NGC 628, UGC 1176, UGC 1171,KDG010 and dw0137+1541. The observing band was cen-tred on 1381 MHz, giving a heliocentric velocity range of−2270 km s−1 to +20079 km s−1. The roll off at the edgeof the bandpass due to the filter reduces the sensitivity forabout 1000 km s−1 at either end.
The strategy consisted of two sets of scans. The firstset covered the entire field on one night while the secondset were offset by half a beam width as shown in Fig. 5.This observing strategy differs slightly from those describedin section 2.3 since in this technique individual points inthe sky are only covered by one or two beams. This was anecessary sacrifice since the tools that assisted in the designof the survey strategy were still in development.
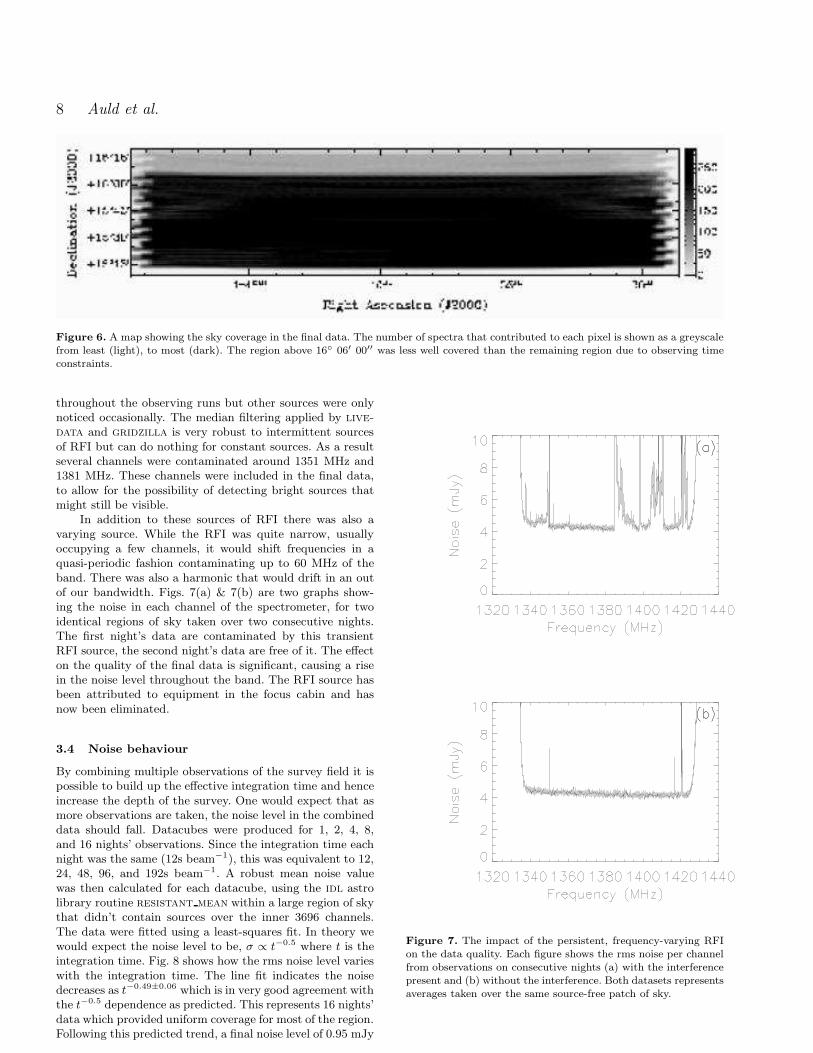
Observations were planned such that the central driftscan was always conducted close to the meridian. Due tothe time limits imposed by the telescope schedule, this of-ten meant only four of the five scans were completed. Withthe available time we were able to cover most of the regionto a uniform depth using 16 nights’ data. Due to observing

AGES: observations of the NGC 628 group 7
Figure 4. The NGC 628 group with the observed field outlined.Group members are denoted by a cross, dw0137+1541 has notbeen included due to its proximity to UGC 1176 and UGC 1171.
constraints, the region north of 16◦ 06′ 00′′ was often omit-ted from the observing run, and hence this region was onlyobserved successfully on 6 nights. This is illustrated by Fig.6, which shows the number of spectra that were obtained foreach pixel in the final, gridded data. This was reflected in thenoise quality of the final data which was significantly poorerfor the more sparsely covered region (above ∼16◦06′00′′).Calibration was performed at the beginning of every scanusing a high-temperature noise diode that was injected intothe beam for a duration of 1s. We integrated every 1s foreach of the 7 beams, both polarisations and 4096 channelsas 4-bit floating point numbers. Over a 20 minute drift scanthis equates to a total file size of ∼ 395 Mb.
After data reduction, the resulting fits datacubefrom gridzilla has dimensions of RA, dec and veloc-ity/frequency. The 5◦
×1◦ region was gridded using a mediangridding technique into 1′
×1′ pixels, each of which containsa 4096 channel spectrum. This produced a ∼365 Mb file. Ini-tial investigations of the effects of RFI and the behaviour ofnoise in the data were conducted using idl. Detailed analysisof the NGC 628 group was performed using miriad, gipsy
and karma.
3.3 Radio Frequency Interference (RFI)
Man-made RFI is now, unfortunately, a constant source ofcontamination at most radio observatories. At Arecibo inthe L-band there are a number of RFI sources. The L3 GPSsatellite appears at approximately 1381 MHz. There are alsoseveral narrow contributions from aircraft radar at FAA andPunta Salinas in the range 1200–1381 MHz. While RFI fromPunta Salinas was not noticed during the observations, twosources were noticed at 1350 MHz (FAA radar) and 1381MHz (L3 GPS). These interference sources were present
Figure 5. An illustration of how the sky coverage is built upover two nights of observations. The declination axis has beenstretched for convenience. The solid lines represent the centralbeam tracks, the dashed lines mark the outer beam tracks. Onthe first night (a), 5 separate drift scans are performed to coverthe 5◦×1◦ area. On the second night (b), exactly the same patternis reproduced offset by half the beam separation (the outer beamsfrom the second night at denoted by dotted lines). On subsequentnights the two patterns are alternated to build up integrationtime and also maintain uniform sky coverage. Due to observa-tion scheduling it was often necessary to drop the northern-mostscan. Galaxies are marked with a cross, with NGC 628 markedfor guidance. Refer to Fig. 4 to locate other group members.
8 Auld et al.
Figure 6. A map showing the sky coverage in the final data. The number of spectra that contributed to each pixel is shown as a greyscalefrom least (light), to most (dark). The region above 16◦ 06′ 00′′ was less well covered than the remaining region due to observing timeconstraints.
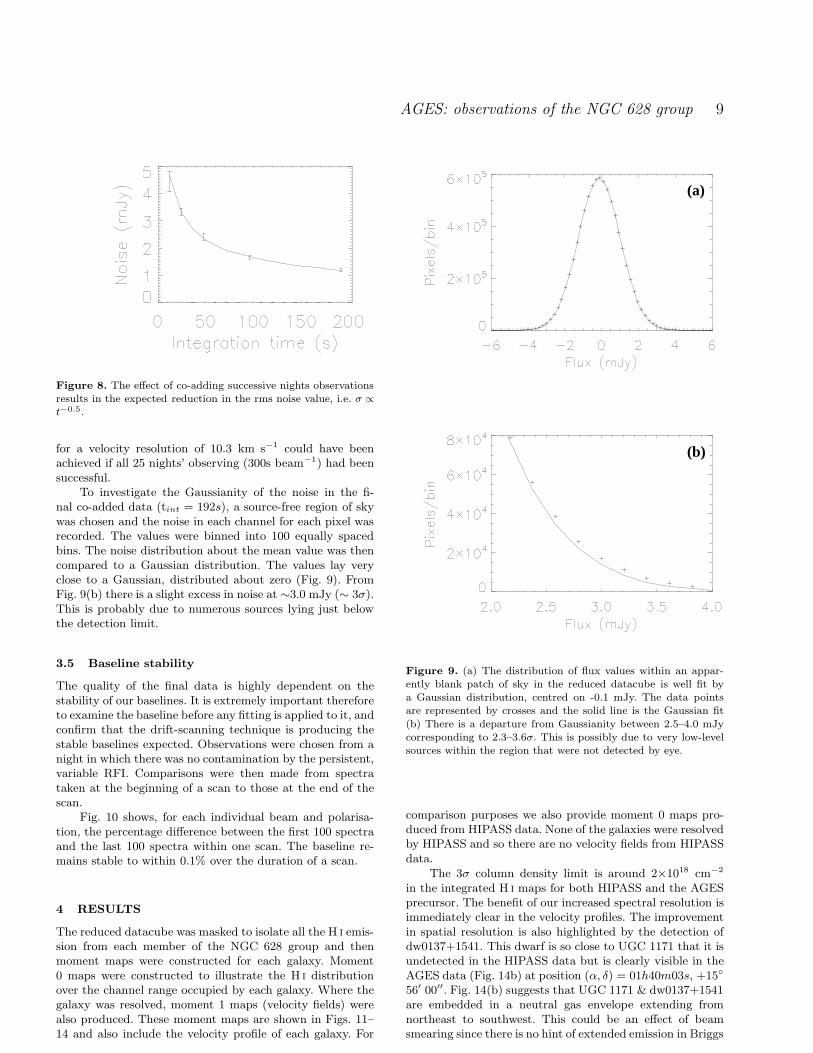
throughout the observing runs but other sources were onlynoticed occasionally. The median filtering applied by live-
data and gridzilla is very robust to intermittent sourcesof RFI but can do nothing for constant sources. As a resultseveral channels were contaminated around 1351 MHz and1381 MHz. These channels were included in the final data,to allow for the possibility of detecting bright sources thatmight still be visible.
In addition to these sources of RFI there was also avarying source. While the RFI was quite narrow, usuallyoccupying a few channels, it would shift frequencies in aquasi-periodic fashion contaminating up to 60 MHz of theband. There was also a harmonic that would drift in an outof our bandwidth. Figs. 7(a) & 7(b) are two graphs show-ing the noise in each channel of the spectrometer, for twoidentical regions of sky taken over two consecutive nights.The first night’s data are contaminated by this transientRFI source, the second night’s data are free of it. The effecton the quality of the final data is significant, causing a risein the noise level throughout the band. The RFI source hasbeen attributed to equipment in the focus cabin and hasnow been eliminated.
3.4 Noise behaviour
By combining multiple observations of the survey field it ispossible to build up the effective integration time and henceincrease the depth of the survey. One would expect that asmore observations are taken, the noise level in the combineddata should fall. Datacubes were produced for 1, 2, 4, 8,and 16 nights’ observations. Since the integration time eachnight was the same (12s beam−1), this was equivalent to 12,24, 48, 96, and 192s beam−1. A robust mean noise valuewas then calculated for each datacube, using the idl astrolibrary routine resistant mean within a large region of skythat didn’t contain sources over the inner 3696 channels.The data were fitted using a least-squares fit. In theory wewould expect the noise level to be, σ ∝ t−0.5 where t is theintegration time. Fig. 8 shows how the rms noise level varieswith the integration time. The line fit indicates the noisedecreases as t−0.49±0.06 which is in very good agreement withthe t−0.5 dependence as predicted. This represents 16 nights’data which provided uniform coverage for most of the region.Following this predicted trend, a final noise level of 0.95 mJy
Figure 7. The impact of the persistent, frequency-varying RFIon the data quality. Each figure shows the rms noise per channelfrom observations on consecutive nights (a) with the interferencepresent and (b) without the interference. Both datasets representsaverages taken over the same source-free patch of sky.
AGES: observations of the NGC 628 group 9
Figure 8. The effect of co-adding successive nights observationsresults in the expected reduction in the rms noise value, i.e. σ ∝
t−0.5.
for a velocity resolution of 10.3 km s−1 could have beenachieved if all 25 nights’ observing (300s beam−1) had beensuccessful.
To investigate the Gaussianity of the noise in the fi-nal co-added data (tint = 192s), a source-free region of skywas chosen and the noise in each channel for each pixel wasrecorded. The values were binned into 100 equally spacedbins. The noise distribution about the mean value was thencompared to a Gaussian distribution. The values lay veryclose to a Gaussian, distributed about zero (Fig. 9). FromFig. 9(b) there is a slight excess in noise at ∼3.0 mJy (∼ 3σ).This is probably due to numerous sources lying just belowthe detection limit.
3.5 Baseline stability
The quality of the final data is highly dependent on thestability of our baselines. It is extremely important thereforeto examine the baseline before any fitting is applied to it, andconfirm that the drift-scanning technique is producing thestable baselines expected. Observations were chosen from anight in which there was no contamination by the persistent,variable RFI. Comparisons were then made from spectrataken at the beginning of a scan to those at the end of thescan.
Fig. 10 shows, for each individual beam and polarisa-tion, the percentage difference between the first 100 spectraand the last 100 spectra within one scan. The baseline re-mains stable to within 0.1% over the duration of a scan.
4 RESULTS
The reduced datacube was masked to isolate all the H i emis-sion from each member of the NGC 628 group and thenmoment maps were constructed for each galaxy. Moment0 maps were constructed to illustrate the H i distributionover the channel range occupied by each galaxy. Where thegalaxy was resolved, moment 1 maps (velocity fields) werealso produced. These moment maps are shown in Figs. 11–14 and also include the velocity profile of each galaxy. For
(a)
(b)
Figure 9. (a) The distribution of flux values within an appar-ently blank patch of sky in the reduced datacube is well fit bya Gaussian distribution, centred on -0.1 mJy. The data pointsare represented by crosses and the solid line is the Gaussian fit
(b) There is a departure from Gaussianity between 2.5–4.0 mJycorresponding to 2.3–3.6σ. This is possibly due to very low-levelsources within the region that were not detected by eye.
comparison purposes we also provide moment 0 maps pro-duced from HIPASS data. None of the galaxies were resolvedby HIPASS and so there are no velocity fields from HIPASSdata.
The 3σ column density limit is around 2×1018 cm−2
in the integrated H i maps for both HIPASS and the AGESprecursor. The benefit of our increased spectral resolution isimmediately clear in the velocity profiles. The improvementin spatial resolution is also highlighted by the detection ofdw0137+1541. This dwarf is so close to UGC 1171 that it isundetected in the HIPASS data but is clearly visible in theAGES data (Fig. 14b) at position (α, δ) = 01h40m03s, +15◦
56′ 00′′. Fig. 14(b) suggests that UGC 1171 & dw0137+1541are embedded in a neutral gas envelope extending fromnortheast to southwest. This could be an effect of beamsmearing since there is no hint of extended emission in Briggs

10 Auld et al.
Figure 10. Percentage variation of the raw bandpass over a singlescan for each individual beam and polarisation. Each raw band-pass remains unvarying to within ∼0.1%.
et al. (1986), but it is possible that it is real and has beenresolved out by the synthesised beam of the VLA.
An important step is to compare the velocity profilesfrom AGES and HIPASS to see if the flux calibration isbeing performed correctly. From Figs. 11–14 the fluxes cal-culated from the AGES data are generally in agreement withthe HIPASS data. The most probable reason for discrepan-cies is that the gridding technique responds differently tosources of different size and strength. The problem is thatthe gridding technique tends to overestimate the flux of ex-tended objects (objects comparable to or larger than thebeam size). This was an expected side effect of the griddingprocess and Barnes et al. (2001) simulated observations inthe HIPASS data using sources of known flux and size toquantify the effect and calculate correction values. Anotherside effect of the technique is to produce larger gridded beamsizes for stronger sources (see Tables 2 & 3 in Barnes et al.2001).
We have corrected for this as follows. First the ratio ofthe AGES source size to the AGES beam was found. Thesource size was measured from higher resolution H i data(Briggs, 1986; Briggs, 1992). This ratio was multiplied bythe HIPASS mean observing beam size (14.4′) to find thesize of a hypothetical HIPASS source that would produce theequivalent source/beam ratio. Table 3 in Barnes et al. (2001)was then used to find the HIPASS flux-weighted beam areafor this hypothetical source. The ratio of the HIPASS flux-weighted beam area to the mean observing beam area wasthen calculated. Finally the AGES observing beam area wasthen multiplied by this ratio to get the AGES flux-weightedbeam area. The integrated flux was then simply the summedAGES flux from the source multiplied by the AGES pixelsize divided by the AGES flux-weighted beam area.
There are other possible sources of inaccuracy in theAGES data. The gain calibration did not take into accountthe telescope’s response at different zenith angles - beyonda zenith angle of ∼15◦ the Arecibo 305m dish is known tolose sensitivity since only part of the dish is illuminated.This effect was limited since very few scans were taken atzenith angles greater than 15◦.The system temperature isalso known to vary over the frequency range of the systemwhich was not taken into account during the data reduction.Steps are underway to document these variations so thatthey may be included in future revisions of livedata andgridzilla.
Table 2 shows the measured parameters from AGES,for each galaxy, compared to those measured from HIPASSand also from other previous surveys (Kamphuis & Briggs,1982; Briggs, 1986; Huchtmeier, 2003). Positions were foundfrom applying the fitting routine imfit within miriad to theflux map integrated over the galaxy’s velocity extent. Un-certainties are shown in brackets after each measurement.Positional uncertainties for AGES data were estimated fromfitting NRAO VLA Sky Survey (Condon et al., 1998) sourcesto a continuum map produced from our data. For AGES, po-sitions of NVSS sources were found to be accurate to within±30′′. Uncertainties in position from the HIPASS data weretaken from Zwaan et al. (2003). The AGES positions agreewith HIPASS and previous measurements to within the mea-sured uncertainties.
The uncertainties in each of the H i properties dependon the S/N of the source, the velocity width of the source,the velocity resolution and the shape of the spectrum. Anexcellent summary of techniques for estimating the uncer-tainties in these H i properties is given in Koribalski et al.(2004) and references therein. The uncertainty in the inte-grated flux density is given by
σ(FHI) = 4 × SN−1(SpeakFHIδv)1/2 (1)
where Speak is the peak flux, SN is the ratio of Speak toσ(Speak), FHI is the integrated flux and δv is the veloc-ity resolution of the data. σ(Speak) is found to increase inextended sources, regions of high 20-cm continuum emis-sion and it also increases with rising flux density values. Weadopt the estimate of Koribalski et al. (2004) that (σSpeak)2
= rms2 + (0.05 Speak)2.The uncertainty in the systemic velocity is given by:
σ(Vsys) = 3 × SN−1(Pδv)1/2 (2)
where P = 0.5× (W20 −W50), which is simply a measure of

AGES: observations of the NGC 628 group 11
the steepness of the profile edges. Errors in the widths aregiven by σ(W50) = 2 × σ(Vsys) and σ(W20) = 3 × σ(Vsys).Distances are based on pure Hubble flow and the associatederrors arise from the errors in the integrated flux.
One of the aspects of AGES is the potential to detectdiffuse H i that is located in the intergroup or intraclus-ter medium. The high resolution of the AGES observations,however, has the advantage of allowing differentiation be-tween H i that may be associated with a hitherto unknownLSB galaxy in the group (for instance, see Pisano et al.2004) and a more extended, smooth, diffuse component orextended clump of emission within the overall structure ofthe group. The nature of the distribution of baryonic mate-rial in this medium (e.g. White et al. 2003) can provideinteresting constraints on structure formation (see Mihoset al. 2005; Osmond et al. 2004). In Fig. 4, the rectangu-lar survey area has physical dimensions of approximately 1Mpc×200 kpc. This provides an indication of how spreadout this group is. The overall physical radius of the NGC628 extended group is approximately 1.5 Mpc with a rela-tively low velocity dispersion of 100–150 km s−1 dependingon which choices are made for group membership. Overallits physical extent is similar to our Local Group, but it con-tains more than just 3 bright galaxies (all the listed UGCand NGC galaxies are more massive than M33).
There appears to be no evidence of intra-group gasdown to a H i column density of 2×1018 cm−2 integratedover a velocity width, ∆v = 50 km s−1. In Table 2, the sumof the detected H i masses is approximately 2×10¹⁰M⊙, ofwhich 1/2 belongs to NGC 628 and its extended H i emis-sion. Excising that region from the search area and usingour observed upper limit on column density of any H i emis-sion, leads to an upper limit of 5×10⁸M⊙ for the integratedsmooth, intergroup H i mass that might be distributed be-tween NGC 628 and KDG 010. This is less than 3% ofthe H i mass observed to exist in the bodies of the galaxiesand strongly suggests that tidal interactions in this gas-richgroup of galaxies have not been very robust in removing H i
from the host galaxies. This result is consistent with thesymmetry and pronounced lack of tidal distortion of the ex-tended H i emission around NGC 628. Perhaps this suggeststhat loose galaxy structures, like the NGC 628 group andthe Local Group are too dynamically young for sufficientinteractions to have occurred.
4.1 Objects beyond the NGC 628 group
Due to the large observing bandwidth offered by the WAPPs(100 MHz) it was expected that a number of background ob-jects would also be detected. The datacube was examinedby eye for more distant objects and 22 other objects weredetected out to a velocity of cz=17500 km s−1. Includingthe NGC 628 group this gives a detection rate of 5.4 ob-jects deg−2. This implies that the total number of galaxiesdetected by AGES will be ∼1500. The ALFALFA survey(Giovanelli et al. 2005) has predicted that they will detect a20000 objects over an area of 7000 deg2, giving an averagedetection rate of 2.9 deg−2.
Another important aspect of this project is to identifypotential optical counterparts. Positional data is not enoughfor optical associations, it is also necessary to obtain opticalspectral data to compare the redshift of the gas with that
of the visible galaxies in the image field. If the positionalor spectral data of the radio observations don’t correlatewith that of the optical observations, then an optical ob-ject cannot be considered the optical counterpart to the H i
emission.
NED was used to search for objects within a 3′ radiusof each H i detection. 6′
×6′ POSS II images, taken from theSuperCOSMOS database, were also examined for possibleoptical counterparts. Of the 22 detections, 9 appear to bepreviously uncatalogued and none of the objects are listedin NED as having previous H i measurements. SDSS red-shift data is available for only 3 objects, but these comparefavourably with the H i redshifts as described below. TheH i detections are listed in Table 3 along with any objectslisted in NED within a 3′ radius. The final column in Table3 shows the angular distance between the centre of the H i
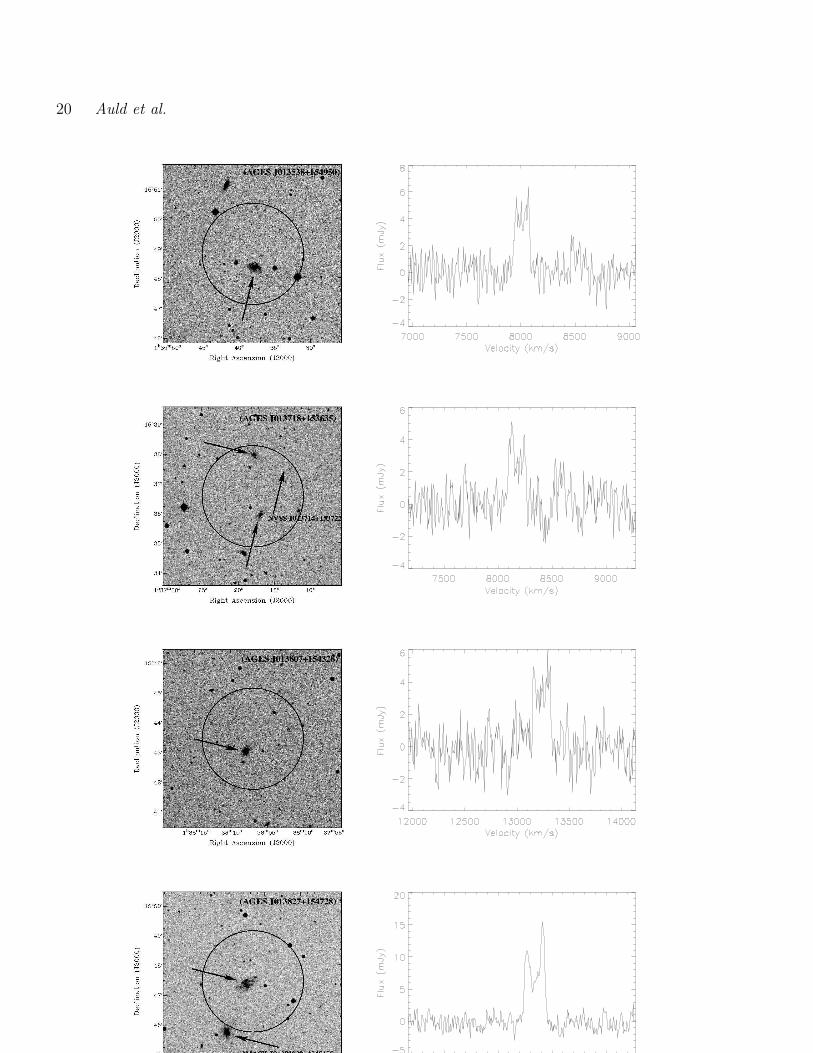
detection and the NED object’s position. Fig. 15 shows theSuperCOSMOS images for each object, centred on the H i
detection, together with the H i spectra. The Arecibo beamis represented by the circle and is to scale. Optical detec-tions within the Arecibo beam have been identified with anarrow and previously catalogued objects have been labelled.Descriptions of the images and the corresponding spectraare given below. Although some objects coincide with thecentre of the H i emission, one should bear in mind thatwithout optical redshift data, it is impossible to say for cer-tain whether or not these objects are associated with thegas.
AGES J013149+152353 This signal coincides withthe SDSS galaxy, SDSS J013149.81+152326.5. There isan optical redshift available for this galaxy placing it atcz =10717 km s−1. The radio data place the galaxyat a recessional velocity of cz =10705 km s−1. SDSSJ013149.81+152326.5 is a spiral galaxy and this morphol-ogy is reflected in the H i profile. This galaxy appears to besomewhat isolated since there are no galaxies reported inthis region within 1700 km s−1.
AGES J013204+152947 The SDSS galaxy, SDSSJ013204.6+153001.2, falls almost in the centre of theArecibo beam. It has an optically measured redshift ofcz =13195 km s−1 from the SDSS. Our radio measurementof the recessional velocity is cz =13196 km s−1. The goodagreement between the positional and redshift data make italmost certain that this is the source of the H i. This galaxyhas a red optical colour (g−r ∼0.75 mag) typically observedin early type galaxies (Bernardi et al. 2003). Moreover theSDSS nuclear spectrum shows a red continuum and no signof recent star formation (i.e. no emission lines). A similar redcolour (g − r ∼0.84 mag) is associated with the companion,2MASX J01320599+1529298, which lies within the beam.
AGES J013313+160139 Spiral structure is clearlyseen in the H i profile and is probably coming from 2MASXiJ0133132+160125 which lies in the centre of the beam.
AGES J013323+160222 The H i profile for this ob-ject is not the large S/N signal centred at cz ∼8650 km s−1 inFig. 4.1, but that located at cz ∼ 8350 km s−1. The large sig-nal is coming from AGES J013313+160139 (Fig. 4.1). AGESJ013323+160222 is admittedly a marginal detection (∼ 3σ)and will no doubt require deeper H i observations to con-firm. There is a faint smudge visible in B and R (not shown)located at 01h 33m 14.8s, 16◦ 02′ 56′′.
AGES J013538+154850 The H i position is likely to

12 Auld et al.
Table 2. H i measurements of the NGC 628 group.
Survey RA DEC Vsys W50 W20 FHI MHI
(2000) (2000) (km s−1) (km s−1) (km s−1) (Jy km s−1) (×108M⊙)
NGC 628
AGES 1 36 41.9 (2.0) 15 47 44 (30) 659.2 (1) 56 (2) 73 (3) 352.6 (3.7) 9.1 (0.1)HIPASS 1 36 42.0 (4.5) 15 47 34 (48) 654 (3) 50 (6) 75 (9) 431 (13) 11.0 (0.3)Kamphuis 1 36 42.0 (1.0) 15 47 12 (14) 657 (0.7) 56 (1) — 470.1 12& Briggs (1982)
KDG010
AGES 1 43 34.9 (2.0) 15 41 48 (30) 792 (1) 34 (2) 49 (3) 3.13 (0.28) 0.80 (0.07)HIPASS 1 43 46.5 (4.6) 15 42 48 (48) 787 (5) 27 (10) 45 (15) 2.0 (1.1) 0.5 (0.3)Huchtmeier 1 43 37.2 (4.6) 15 41 43 (48) 788.9 (0.4) 32 (1.1) — 2.35 0.6(2003)
UGC 1176
AGES 1 40 06.0 (2.0) 15 54 45 (30) 634 (1) 36 (2) 54 (3) 27.4 (1.9) 7.0 (0.5)HIPASS 1 40 08.4 (4.6) 15 55 06 (48) 628 (2) 40 (4) 58 (6) 28.2 (4.3) 7.2 (1.8)Briggs (1986) 1 40 07.7 (1.0) 15 53 55 (14) 629 (1) 38 (1) — 30.17 7.7
UGC 1171
AGES 1 39 38.6 (2.0) 15 55 19 (30) 743 (1) 29 (2) 41 (3) 1.46 (0.14) 0.37 (0.04)HIPASS 1 40 00.2 (4.6) 15 53 56 (48) 743 (2) 27 (4) 45 (6) 2.2 (1.2) 0.56 (0.3)Briggs (1986) 1 39 44.2 (1.0) 15 54 01 (14) 740 (3) 23 (4) — 1.80 0.5
dw0137+1541
AGES 1 40 03.9 (2.0) 15 55 45 (30) 749 (1) 28 (2) 47 (3) 0.39 (0.21) 0.10 (0.05)HIPASS — — — — — — —Briggs (1986) 1 40 09.2 (1.0) 15 56 16 (14) 750 (5) 23 (10) — 0.27 0.07
be coming from the spiral located near the centre of theimage. This is supported by the H i profile which is a typicalspiral, but only optical redshift data would really tie downthe H i emission to this galaxy.
AGES J013718+153635 The H i profile for this ob-ject is typical of a spiral galaxy. Tying it down to a singlegalaxy is difficult though. There is a 21cm continuum source(NVSS J013714+153722) located at a distance of 1.2′. Thisframe is rather densely populated with at least five galaxiespresent, two of which fall within the Arecibo beam. Neitherof these sources have any redshift information listed in NEDfor comparison. The continuum source could be associatedwith the smudge at 01h 37m 17.7s, 15◦ 38′ 00′′and this justfalls within the edge of the H i beam. The H i signal couldalso be coming from the object at 01h 37m 17.0s, 15◦ 39′
50′′.
AGES J013807+154328 The H i profile of thisgalaxy suggests a spiral galaxy of mass ∼4.5 ×10⁹M⊙. Theoptical counterpart is probably the object located near thecentre of the POSS II frame (Fig. 4.1) but this object is notlisted in NED. There is a hint of spiral structure in the op-tical which does lend support to this being the counterpart.Optical spectroscopy would be needed to help confirm this.
AGES J013827+154728 While the bright galaxy tothe south of the frame in Fig. 4.1 is identified by NED as2MASX J01383039+1545455, the object in the centre of theframe is not listed at all. The double horn H i profile in-dicates a large, spiral galaxy. The optical image, however,shows a galaxy with a rather clumpy structure, although
it may be exaggerated by the presence of foreground stars.Without optical redshift data one can’t say for certain thatthis galaxy is the source of the H i emission. However thecorrelation between the positions of the radio and opticaldata is very good.
AGES J013917+154613 There is a faint galaxy thatcan been seen nestling amongst the cluster of stars just southof the centre of the image. Although quite dim comparedwith the surrounding stars, the galaxy’s neutral gas content(3.3×10⁹M⊙) suggests we are looking at a Milky Way sizedgalaxy that is merely far away (∼ 230 Mpc). This is unusualsince this galaxy also has approximately the same mass asobject 2 and is at the same distance, yet nothing as obvi-ous as 2MASX J01463012+1543250 lies within the Arecibobeam.
AGES J013953+151955 This galaxy is probably theedge-on galaxy located in Fig. 4.1 at 01h 39m 55.0s, 15◦
20′ 34′′. This galaxy has also been identified by SDSS withan optical recessional velocity of cz =16693 km s−1. Ourredshift of cz=16806 km s−1 compares reasonably well withthis. The shape of the spectrum is fairly Gaussian and hasa narrow width (W50 = 49 km s−1). It would be highlyunusual for a galaxy as massive as this one (5.1×10⁹M⊙) tohave such a narrow profile unless we were viewing it face-on. SDSS J013955.02+152036.7 looks more like an edge-ongalaxy, so either some of the H i flux is hidden in the noiseor this galaxy is not responsible for the H i emission. Moresensitive radio observations would show for certain if we are

AG
ES:observa
tions
ofth
eN
GC
628
group
13
RA DEC Vsys Distance W50 W20 FHI MHI Previously catalogued Angular MHI/LH
AGES ID (2000) (2000) (km s−1) (Mpc) (km s−1) (km s−1) (Jy km s−1)(×108M⊙) objects separation(arcmin) M⊙/L⊙
J013149+152353 01 31 48.9 15 23 53 10705 (3) 146 178 (6) 220 (9) 1.44 (0.11) 72.2 SDSS J01314980+1523265 0.5 0.9J013204+152947 01 32 04.1 15 29 47 13196 (7) 178 326 (14) 400 (21) 1.01 (0.11) 75.5 SDSS J013204.6+153001.2 0.3 0.1
2MASX J01320599+1529298 0.5 0.5J013313+160139 01 33 12.9 16 01 39 8895 (3) 122 138 (6) 194 (9) 1.69 (0.11) 59.0 2MASXi J0133132+160125 0.2 —J013323+160222 01 33 22.8 16 00 21 8587 (1) 118 69 (2) 81 (3) 0.07 (0.02) 2.1 New — —J013538+154850 01 35 38.0 15 48 50 8012 (3) 110 132 (6) 153 (9) 0.61 (0.08) 17.5 New — —J013718+153635 01 37 18.0 15 36 35 8174 (4) 112 144 (8) 169 (12) 0.46 (0.08) 13.7 NVSS J013714+153722 1.2 0.3J013807+154328 01 38 07.0 15 43 28 13237 (2) 179 162 (4) 169 (6) 0.60 (0.08) 45.4 New — —J013827+154728 01 38 26.8 15 47 28 8339 (2) 114 182 (3) 201 (5) 1.74 (0.11) 53.4 New — —J013917+154613 01 39 17.1 15 46 13 17080 (5) 228 51 (9) 98 (14) 0.27 (0.05) 33.5 New — —J013953+151955 01 39 52.7 15 19 55 16806 (6) 224 231 (12) 284 (18) 0.43 (0.07) 51.1 SDSS J013955.02+152036.7 0.9 —J013956+153135 01 39 56.2 15 31 35 17343 (7) 231 105 (14) 214 (21) 0.42 (0.07) 53.7 New — —J014013+153319 01 40 13.0 15 33 19 17052 (7) 227 535 (14) 566 (21) 1.33 (0.13) 163.0 2MASX J01401331+1533345 0.3 0.2J014025+151903 01 40 25.2 15 19 03 16848 (5) 225 44 (9) 101 (14) 0.31 (0.06) 36.7 2MASX J01402402+1518240 0.7 0.2J014033+160513 01 40 32.6 16 05 13 13017 (4) 176 101 (8) 152 (12) 0.59 (0.07) 42.6 2MASXi J0140360+160414 1.3 —J014430+161502 01 44 30.3 16 15 02 5020 (2) 70 107 (3) 121 (5) 0.61 (0.07) 7.0 New — —J014524+155923 01 45 23.7 15 59 23 5050 (4) 70 34 (7) 60 (11) 0.18 (0.04) 2.1 New — —J014630+154332 01 46 30.4 15 43 32 17495 (3) 232 132 (6) 167 (9) 0.73 (0.09) 92.7 2MASX J01463012+1543250 0.1 0.4J014644+155622 01 46 44.0 15 56 22 7063 (5) 97 27 (10) 51 (15) 0.10 (0.05) 2.2 2MASX J01465179+1557192 2.1 0.07J014719+155603 01 47 19.1 15 56 03 5191 (3) 72 86(7) 104 (11) 0.35 (0.07) 4.3 NVSS J014722+155737 1.8 —J014742+161317 01 47 41.7 16 13 17 4890 (3) 68 138 (6) 177 (9) 1.02 (0.09) 11.1 2MASXi J0147459+161318 1.0 —J014752+155855 01 47 51.7 15 58 55 17514 (11) 233 450 (22) 578 (33) 1.59 (0.13) 200.0 2MASX J01475424+1558247 0.8 1.0
2MASX J01475424+1559387 1.0 —J014834+152756 01 48 33.7 15 27 56 12985 (4) 175 114 (8) 129 (12) 0.50 (0.07) 36.3 New — —
Table
3.H
ipro
perties
ofobjects
detected
bey
ond
the
NG
C628
gro
up.

14 Auld et al.
Figure 11. NGC 628 (a) HIPASS H i contours overlaid on a POSS II image. Contours (×1018 cm−2): 2.8 (3σ), 50, 100, 150, 200, 250,300, 350, 400, 450, 500. The solid circle illustrates the size of the HIPASS beam. (b) AGES H i contours overlaid on a POSS II image.Contours (×1018 cm−2): 2.2 (3σ), 100, 200, 300, 400, 500, 600, 700, 800, 900, 1000, 1100. The solid circle illustrates the size of theAGES beam.(c) H i velocity profiles: HIPASS is shown as the dashed line, AGES as the solid line. (d) Velocity field from AGES data.Isovelocity contours increase from light to dark: 635, 640, 645, 650, 655, 659, 660, 665, 670, 675, 680, 685, 690 km s−1.
just measuring the peak of one of the double-horns that onewould expect from such an edge-on system.
AGES J013956+153135 The H i signal is about a 5-σdetection with a peak of around 5.5 mJy and W50=105 kms−1. The optical counterpart is a little more tricky. Thereis a small smudge in Fig. 15 (object 4) at 01h 39m 55.0s,15◦ 30′ 22′′. However, the H i mass is ∼ 5 × 10⁹H⊙, whichis similar to object 2. Therefore we might expect to see agalaxy of a similar size to 2MASX J01463012+1543250. Thisis a very interesting detection. There are no obvious opticalcounterparts but the POSS II image is relatively shallow soit is possible this H i detection has a low surface brightnessoptical counterpart. Deep optical follow-up observations are
essential to try and determine whether this object has anoptical association.
AGES J014013+153319 Two objects have beenidentified within the beam that could be contributing tothe H i emission. The H i profile shows an excess of neutralgas in the approaching half of the spectrum. This could bedue to superposition of individual profiles or due to asym-metry in the gas distribution of one of the galaxies, if thesegalaxies are indeed responsible for the H i emission.
AGES J014025+151903 This object has a narrowvelocity width (W50 = 44 km s−1) but is a 6-σ detec-tion. 2 objects exist in NED in this area, but one of themis a distant quasar (SDSS J014026.6+151813.5). 2MASXJ01402402+1518240 falls within the Arecibo beam and
AGES: observations of the NGC 628 group 15
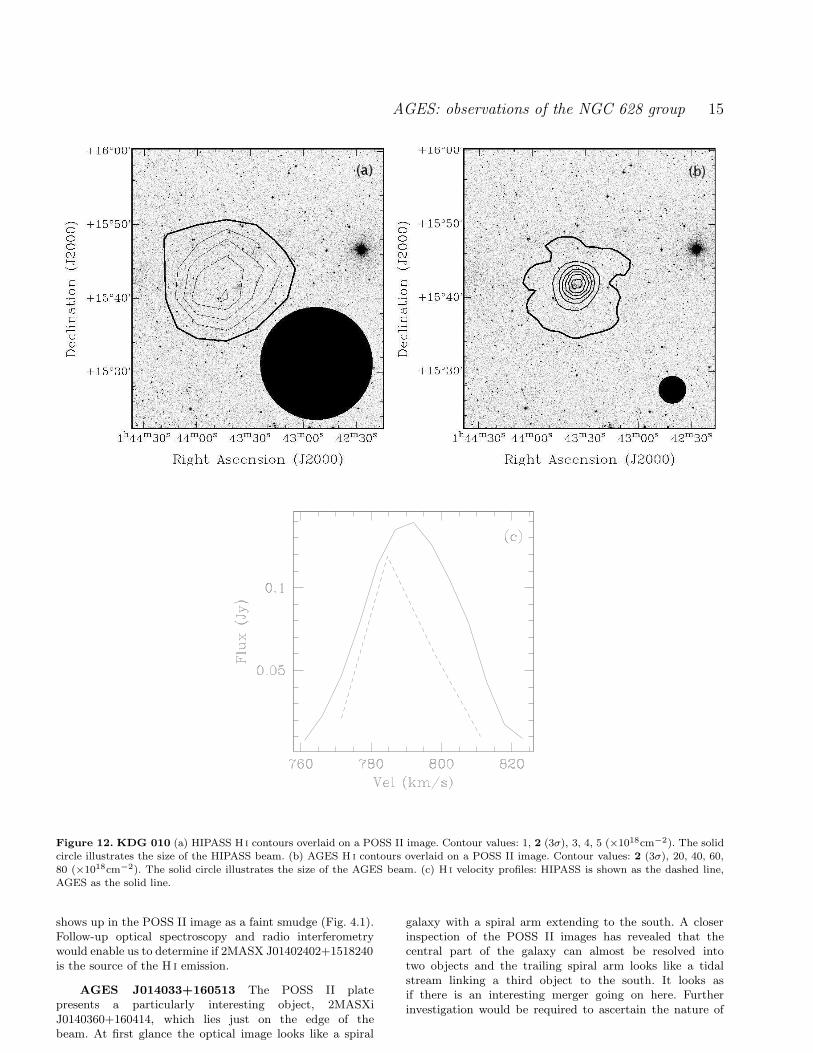
Figure 12. KDG 010 (a) HIPASS H i contours overlaid on a POSS II image. Contour values: 1, 2 (3σ), 3, 4, 5 (×1018cm−2). The solidcircle illustrates the size of the HIPASS beam. (b) AGES H i contours overlaid on a POSS II image. Contour values: 2 (3σ), 20, 40, 60,
80 (×1018cm−2). The solid circle illustrates the size of the AGES beam. (c) H i velocity profiles: HIPASS is shown as the dashed line,AGES as the solid line.
shows up in the POSS II image as a faint smudge (Fig. 4.1).Follow-up optical spectroscopy and radio interferometrywould enable us to determine if 2MASX J01402402+1518240is the source of the H i emission.
AGES J014033+160513 The POSS II platepresents a particularly interesting object, 2MASXiJ0140360+160414, which lies just on the edge of thebeam. At first glance the optical image looks like a spiral
galaxy with a spiral arm extending to the south. A closerinspection of the POSS II images has revealed that thecentral part of the galaxy can almost be resolved intotwo objects and the trailing spiral arm looks like a tidalstream linking a third object to the south. It looks asif there is an interesting merger going on here. Furtherinvestigation would be required to ascertain the nature of

16 Auld et al.
Figure 13. UGC 1176 (a) HIPASS H i contours overlaid on a POSS II image. Contours (×1018 cm−2): 2 (3σ) 5, 10, 15, 20, 25, 30, 35,40, 45. The solid circle illustrates the size of the HIPASS beam. (b) AGES H i contours overlaid on a POSS II image. Contours (×1018
cm−2): 2 (3σ), 60, 120, 180, 240, 300, 360, 420. The solid circle illustrates the size of the AGES beam. (c) H i velocity profiles: HIPASSis shown as the dashed line, AGES as the solid line. (d) Velocity field from AGES data. Isovelocity contours increase from light to dark:620, 625, 630, 634, 635, 640.
this merger, and to determine whether or not these objectsare responsible for the H i emission.
AGES J01430+161502 The H i signal is unmistak-able but locating the optical source is not as straightforward.2MASX J01443758+1615501 is present in the optical framein Fig. 4.1 but its position would place it at the very edgeof the beam. The H i position is more likely linked to thesmudge nearer the centre of the beam at 01h 44m 33.5s, 16◦
14′ 48′′. Its elongated structure is pointing towards 2MASXJ01443758+1615501 which may be the result of an interac-tion with this galaxy.
AGES J014524+155923 Although the H i detectionis narrow (W50 = 30 km s−1) the peak flux is a 6-σ detectionand the source of the H i is more or less centred on the galaxyin Fig. 4.1 at 01h 45m 22.5s, 15◦ 59′ 00′′. This is the least
massive of the detected galaxies, with a H i mass of ∼2.1×10⁸ M⊙.
AGES 014630+154332 The H i profile is double-horned with a width of 132 km s−1, suggesting this object isa spiral galaxy but the galaxy located at the centre of opticalimage does not reflect this. It is a very circular object, so ifthis object is the optical counterpart to the H i it must havea very bright bulge or very diffuse arms. It’s circular naturealso suggests we are looking at the galaxy face-on, but if thiswas the case the H i profile would look more Gaussian.
AGES J014644+155622 Although the H i signal ofthis object is very narrow (26 km s−1) it persists over severalchannels suggesting that it is indeed real even though thepeak is only a 4-σ detection. There are two objects visible onthe optical image (Fig. 4.1) that are on the edge of the beam.The first object, 2MASX J01465179+1557192, is very bright

AGES: observations of the NGC 628 group 17
Figure 14. UGC 1171 & dw0137+1541 (a) HIPASS H i contours overlaid on a POSS II image. Contours (×1018 cm−2): 2 (3σ), 3.The solid circle illustrates the size of the HIPASS beam. (b) AGES H i contours overlaid on a POSS II image. Contours (×1018 cm−2):2 (3σ), 5, 10, 20, 30. The solid circle illustrates the size of the AGES beam. (c) H i velocity profiles for UGC 1171 and dw0137+1541:HIPASS data for UGC 1171 is shown as the dashed line, AGES data for UGC 1171 is the solid line. Dw0137+1541 is shown by thedash-dot line.
and large although it is 2.1′ away from the centre point ofthe H i emission. The second object is only visible as a faintsmudge in the B-band and R-band images but is closer inseparation (∼1.5′). The second object is not listed in NED.
AGES J014719+155603 The optical frame showsonly one possible optical counterpart. The object is locatedat 01h 47m 21.5s, 15◦ 57′ 00′′. NVSS J014722+155737 islisted in NED less than 30 ′′away from the optical detectionand is probably the source of the radio emission. Whether ornot it is the source of the H i emission is difficult to say. Thepositions do not match that well but optical spectra wouldhelp make this distinction.
AGES J014742+161317 The H i profile is fairlyGaussian with a velocity width of W50 = 138 km s−1. The
optical image shows two possible counterparts at 01h 47m
39.0s, 16◦ 13′ 56′′ (most likely) and 01h 47m 46.0s, 16◦ 13′
18′′ (2MASXi 0147459+161318). Further investigation willreveal the true source of the H i emission.
AGES J014752+155855 There are 2 galaxies in theB-band image that fall within the beam. Both are listed as2MASS objects and the H i emission may be coming fromone, both, or neither of these objects. Without higher res-olution H i images and optical spectra it is impossible todistinguish between them.
AGES J014834+152756 The double-horned H i ve-locity profile and the optical image both indicate the thisgalaxy is a spiral. On closer inspection of the optical datait seems that the galaxy may be a one-armed spiral. Again

18 Auld et al.
15.4Dec
linat
ion
15.6
1.80
15.816.016.2
1.75
1.7016000
140001.65
12000
RA (dec
mial ho
urs)
1.60 10000
Velocity (km/s)
8000
1.556000
Figure 16. A 3D plot of the positions of the galaxies beyond theNGC 628 group with their H i redshifts.
this object is not listed in NED. It would be interesting toacquire higher resolution radio data of this object to see ifthere is tidal debris linked to this perturbed spiral.
There are a further 15 objects whose signals were con-sidered too marginal (S/N . 3σ and ∆v < 30 km s−1) tobe included in this paper pending further follow-up observa-tions from Arecibo and several other large radio telescopes.From the velocity information alone there appear to be fourgroup associations at around 6000, 8000, 12500 and 16000km s−1. J013149+152353 is the one exception being the onlygalaxy that has no other neighbour within 1700 km s−1. Fig.16 is a 3D plot of the galaxies, position and redshift. Fromthis it is possible to distinguish 3 groups: 1 group at ∼5000km s−1, one at ∼8000 km s−1 and one at ∼17000 km s−1.The objects at ∼12500 km s−1 seem too scattered in RA tobe considered a group, although they may be the massivetracers of a filament running at right-angles to our line ofsight at this velocity.
4.2 Detection efficiency
The precursor survey covered an area of about 4.6 sq.deg.with an rms noise of 1.1 mJy (for 10 km s−1 resolution) andanother 0.9 sq.deg. with an rms noise of 1.8 mJy. Using thesenoise values we tested the distribution of detections beyondthe NGC 628 group using a V/Vmax test following the proce-dures described in greater detail by Rosenberg & Schneider(2002). Assuming the line-width dependence for detectionsthat they found along with a roll-off in completeness near thedetection limit, the expected mean value of V/Vmax shouldbe 0.61. By adjusting the signal-to-noise level at which thereis a 50% completeness in the detection rate, we found that atan effective S/N = 7 (for a source of 300 km s−1 line width),the correct value of V/Vmax was recovered. This sensitivitylevel is very similar to those derived from V/Vmax tests ofpast blind H i surveys.
Given these sensitivity estimates, we modelled the pre-dicted number of sources that should be detected within theprecursor survey volume. This analysis is complicated by thefact that the precursor survey covered an area centred on aknown group with a substantial void region behind it. Wepopulated the volume with galaxies based on the HIMF de-rived from an analysis of the Parkes data (Zwaan et al. 2003)down to an H i mass of 3×10⁶M⊙. The model galaxies weregiven rotation speeds consistent with the range normallyobserved for their H i mass, and then given a random orien-tation as well as a standard deviation of 300 km s−1 relative
to the Hubble flow. We then ‘observed’ the volume at themeasured sensitivity and completeness levels of the surveyand determined which galaxies would be detected, repeat-ing this process 1000 times to estimate the likely number ofgalaxies we should detect.
Based on the Parkes HIMF function we would have ex-pected to detect 49.2±6.8 galaxies in total. This is almosttwice as high as the actual number detected, 27, but onlyabout 3σ from the predicted number. Since the nearby vol-ume contains both a known group and a void, we can lookinstead at the results for the more distant portion of thevolume—indeed no galaxies were detected with velocitiesbetween that of the NGC 628 group and cz = 4890 km s−1.If we consider the volume beyond 4500 km s−1, where wemight anticipate that the volume is relatively unbiased by lo-cal large scale structure, the predicted number of detectionsis 42.3±6.3. This is again about 3σ more than the numberdetected in this volume, 22.
The predicted number of sources for the Parkes HIMFis higher than would be predicted with most other massfunctions because of the relatively high normalisation factor(Φ⋆ = 0.0086 Mpc−3), which indicates the relative num-ber of galaxies near the ‘knee’ in the mass function atlog(MHI⋆/M⊙) = 9.79. Both the HIMFs of Rosenberg &Schneider (2002) and Zwaan et al. (1997) have lower nor-malisation factors yielding a predicted number of detectionsof 37.2±6.2 and 28.4±5.3 respectively. Given the limitedarea covered by the precursor study, this result may indicatemore about cosmic variance than about the HIMF. It shouldalso be noted that because of the relatively low sensitivityof the Parkes survey, its results are based on a relativelynearby volume of space. The full AGES survey will providea much larger and deeper volume for testing the variance ofthe HIMF.
4.3 H-band properties
In order to preform a preliminary study of the stellar proper-ties of our H i selected sample we use the 2MASS (Skrutskieet al. 2006) data available for the candidate NIR counter-parts listed in Table 3. The near infrared data are ideal forthis kind of analysis since they are less affected by extinctionand they are a good indicator of stellar mass (Gavazzi et al.1996; Rosenberg, Schneider & Posson-Brown 2005).
2MASS data (extracted from the extended source cat-alogue) were available for only 15 candidate counterpartsof our 27 H i sources. Fig. 17 shows the distribution of theMHI/LH ratio, of the H-band effective radius (re: the ra-dius containing 50% of the light), effective surface brightness(µe: the mean surface brightness within re) and concentra-tion index (C31: the ratio of the radii containing 75% and25% of the light.) for our sample. As a reference, Fig. 18shows the same distribution for a sample of 114 galaxies be-longing to the HIPASS equatorial strip (Garcia-Appadoo,2005). The two samples occupy a similar parameter spacebeing composed by ‘normal’ disk-like gas-rich galaxies. Anydeeper analysis of the stellar content of the H i sources mustbe postponed to future works due to the lack of sufficientlydeep near infrared and optical data. We only point out thatthe distribution of the MHI/LH ratio shown in Fig. 17 hasto be considered as a lower limit of the real distribution of

AGES: observations of the NGC 628 group 19
20 Auld et al.

AGES: observations of the NGC 628 group 21

22 Auld et al.

AGES: observations of the NGC 628 group 23

24 Auld et al.
Figure 15 – continued Top to bottom: B band images and accompanying H i spectra for objects J014752+014752 and J014834+152756
AGES sources, since it is based on the 15 brightest H-bandcandidate counterparts in our sample.
5 CONCLUSIONS
The precursor observations of NGC 628 and its companionshave shown that the observing strategy and the data reduc-tion pipeline are all working successfully. The detection rateis close to what we would expect for this volume. With 192sintegration time it has been possible to reach a column den-sity limit of 2×1018cm−2. Studying the NGC 628 group hasrevealed no intergalactic gas down to this column densitylimit.
The detection of dw0137+1541 has shown that the sur-vey is sensitive to low mass H i objects. We have also demon-strated the ability of AGES to detect galaxies out to a veloc-ity of 17500 km s−1. 3 groups have been identified beyondthe NGC 628 group. Of the 22 detections outside of theNGC 628 group, 9 are new detections and 3 galaxies withredshift data available from SDSS compare well with theH i redshifts. 15 low signal-noise detections have also beenidentified and we have applied for time at several large ra-dio telescopes for follow-up observations to confirm thesesources.
From the point of dark galaxy detection, superCOS-MOS images have revealed that there is an optical detectionwithin each H i beam, but these objects cannot be assumedto be associated with the H i emission on grounds of spa-tial coincidence alone. Optical redshift data, and possiblyhigher resolution H i observations will be required to confirmthe associations. To this end we are applying for follow-upobservations on several other telescopes.
One of the project goals is to study the HIMF in dif-ferent environments. With only 27 objects this sample, ismuch too small to perform any meaningful analysis of theHIMF. However, we have shown that the quality of this datais good enough that the galaxies can be included with thosefrom future AGES fields to compile a HIMF.
ACKNOWLEDGEMENTS
The AGES group wish to thank the NAIC director, BobBrown, for granting us time on the Arecibo radio telescope.The Arecibo Observatory is part of the National Astronomyand Ionosphere Center, which is operated by Cornell Univer-sity under a cooperative agreement with the National Sci-ence Foundation. We would also like to thank all the staffat the observatory who ensured the observations went assmoothly as possible. Individual thanks go to Mikael Lerner,

AGES: observations of the NGC 628 group 25
Figure 17. AGES precursor sample H i–H-band properties. (a)MHI/LH distribution. The shaded region represents measuredvalues, the dotted lines represent estimated lower limits for thosegalaxies that were not detected in H-band. The white region isthe sum of the measured values and the estimated values. (b)H-band concentration parameter distribution. Bulge galaxies are
those galaxies with a value greater than 4. (c) H-band effectivesurface brightness distribution. (d) H-band effective radius.
Phil Perillat and Jeff Hagen for their excellent work on thedata collection system and the telescope operating software.We are very grateful to the ALFALFA and AUDS workinggroups for sharing their knowledge and experiences with usand helping us to avoid potential pitfalls. Thanks also toCarl Heiles for allowing us to use his images. J. L. Rosen-berg is funded under NSF grant ast-0302049. This researchhas made use of the NASA/IPAC Extragalactic Database(NED) which is operated by the Jet Propulsion Laboratory,California Institute of Technology, under contract with theNational Aeronautics and Space Administration.
REFERENCES
Barnes D. G. et al., 2001, Mon. Not. R. Astr. Soc., 322, 486
Bernardi M. et al., 2003, Astron. J., 125, 1817
Binggeli B., Tammann G. A., Sandage A., 1987, Astron. J.,94, 251
Binggeli B., Popescu C. C., Tammann G. A., 1993, Astr.Astrophys. Suppl., 98, 275
Briggs F. H., 1986, Astrophys. J., 300, 613
Buckley M. W., Flint K., Impey C. D., Bolte M., 2003,American Astronomical Society Meeting Abstracts,203,
Figure 18. HIPASS Equatorial Strip H i–H-band properties. (a)MHI/LH distribution. The shaded region represents measuredvalues, the dotted lines represent estimated lower limits for thosegalaxies that were not detected in H-band. The white region isthe sum of the measured values and the estimated values. (b)H-band concentration parameter distribution. Bulge galaxies are
those galaxies with a value greater than 4. (c) H-band effectivesurface brightness distribution. (d) H-band effective radius.
Condon J. J., Cotton W. D., Greisen E. W., Yin Q. F.,Perley R. A., Taylor G. B., Broderick J. J., 1998,Astron. J., 115, 1693
Davies J. I., de Blok W. J. G., Smith R. M., Kambas A.,Sabatini S., Linder S. M., Salehi-Reyhani S. A., 2001,Mon. Not. R. Astr. Soc., 328, 1151
Davies J. et al., 2004, Mon. Not. R. Astr. Soc., 349, 922
de Vaucouleurs G., de Vaucouleurs A., Corwin H. G.,Buta R. J., Paturel G., Fouque P., 1991, Third Refer-ence Catalogue of Bright Galaxies. Volume 1-3, XII,2069 pp. 7 figs.. Springer-Verlag Berlin HeidelbergNew York
Garcia-Appadoo D. A., 2005, PhD thesis, Cardiff University
Gavazzi G., Pierini D., Boselli A., 1996, Astron. Astrophys.,312, 397
Gavazzi G., Boselli A., Mayer L., Iglesias-Paramo J.,Vılchez J. M., Carrasco L., 2001, Astrophys. J. Let-ters, 563, L23
Giovanelli R. et al., 2005, Astron. J., 130, 2598
Hendry M. A. et al., 2005, Mon. Not. R. Astr. Soc., 359, 906
Huchra J. P., Vogeley M. S., Geller M. J., 1999, Astrophys.J. Suppl., 121, 287

26 Auld et al.
Huchtmeier W. K., Karachentsev I. D., Karachentseva V. E.,2003, Astron. Astrophys., 401, 483
Kamphuis J., Briggs F., 1992, Astron. Astrophys., 253, 335
Karachentsev I., Musella I., Grimaldi A., 1996, Astron. As-trophys., 310, 722
Kilborn K., Webster R. L., Staveley-Smith L., 1999, Publs.Astr. Soc. Aust., 16, 8
Koribalski B. S. et al., 2004, Astron. J., 128, 16
Lang R. H. et al., 2003, Mon. Not. R. Astr. Soc., 342, 738
Martin D. C. et al., 2005, Astrophys. J. Letters, 619, L1
Meyer M. J. et al., 2004, Mon. Not. R. Astr. Soc., 350, 1195
Mihos J. C., Harding P., Feldmeier J., Morrison H., 2005,Astrophys. J. Letters, 631, L41
Minchin R. F. et al., 2003, Mon. Not. R. Astr. Soc., 346, 787
Osmond J. P. F., Ponman T. J., Finoguenov A., 2004, Mon.Not. R. Astr. Soc., 355, 11
Pisano D. J., Wakker B. P., Wilcots E. M., Fabian D., 2004,Astron. J., 127, 199
Putman M. E. et al., 2002, Astron. J., 123, 873
Putman M. E., Staveley-Smith L., Freeman K. C., Gib-son B. K., Barnes D. G., 2003, Astrophys. J., 586,170
Rosenberg J. L., Schneider S. E., 2002, Astrophys. J., 567,247
Rosenberg J. L., Schneider S. E., Posson-Brown J., 2005,Astron. J., 129, 1311
Ryan-Weber E. V. et al., 2004, Astron. J., 127, 1431
Ryder S. D. et al., 2001, Astrophys. J., 555, 232
Sabatini S., Davies J., Scaramella R., Smith R., Baes M.,Linder S. M., Roberts S., Testa V., 2003, Mon. Not.R. Astr. Soc., 341, 981
Sharina M. E., Karachentsev I. D., Tikhonov N. A., 1996,Astr. Astrophys. Suppl., 119, 499
Skrutskie M. F. et al., 2006, Astron. J., 131, 1163
Sun M., Murray S. S., 2002, Astrophys. J., 576, 708
Tully R. B., Fisher J. R., 1987, Nearby galaxies Atlas. Cam-bridge: University Press, 1987
Waugh M. et al., 2002, Mon. Not. R. Astr. Soc., 337, 641
White P. M., Bothun G., Guerrero M. A., West M. J., Bark-house W. A., 2003, Astrophys. J., 585, 739
Zwaan M. A., Briggs F. H., Sprayberry D., Sorar E., 1997,Astrophys. J., 490, 173
Zwaan M. A. et al., 2003, Astron. J., 125, 2842
Zwaan M. A., Meyer M. J., Staveley-Smith L., Web-ster R. L., 2005, Mon. Not. R. Astr. Soc., 359, L30
Copyright © 2022 FDOKUMEN