The Application of Web 2.0 Tools in University Libraries of India
16
University of Nebraska - Lincoln DigitalCommons@University of Nebraska - Lincoln Library Philosophy and Practice (e-journal) Libraries at University of Nebraska-Lincoln September 2019 e Application of Web 2.0 Tools in University Libraries of India Sandip S. Patel Gujarat University Ahmedabad, [email protected] Atul Bha Gujarat University Ahmedabad, [email protected] Follow this and additional works at: hps://digitalcommons.unl.edu/libphilprac Part of the Library and Information Science Commons Patel, Sandip S. and Bha, Atul, "e Application of Web 2.0 Tools in University Libraries of India" (2019). Library Philosophy and Practice (e-journal). 2984. hps://digitalcommons.unl.edu/libphilprac/2984
-
Upload
khangminh22 -
Category
Documents
-
view
0 -
download
0
Transcript of The Application of Web 2.0 Tools in University Libraries of India
University of Nebraska - LincolnDigitalCommons@University of Nebraska - Lincoln
Library Philosophy and Practice (e-journal) Libraries at University of Nebraska-Lincoln
September 2019
The Application of Web 2.0 Tools in UniversityLibraries of IndiaSandip S. PatelGujarat University Ahmedabad, [email protected]
Atul BhattGujarat University Ahmedabad, [email protected]
Follow this and additional works at: https://digitalcommons.unl.edu/libphilpracPart of the Library and Information Science Commons
Patel, Sandip S. and Bhatt, Atul, "The Application of Web 2.0 Tools in University Libraries of India" (2019). Library Philosophy andPractice (e-journal). 2984.https://digitalcommons.unl.edu/libphilprac/2984
The Application of Web 2.0 Tools in University Libraries of India
Sandip S. Patel
Librarian,
Gujarat Arts & Science College,
Ahmedabad, India
Atul Bhatt
Associate Professor,
Department of Library & Information Science,
Gujarat University,
Ahmedabad, India
Abstract:
This research study aims to focus towards the application or evaluation of Web 2.0 tools in State
University Libraries of India. The present study deals with the extent usage of Web 2.0 in State
University Libraries of India.This research used content analysis based on quantitative and
qualitative data which is collected by website observation and questionnaire method. Out of 348
Indian State University Libraries 69% of libraries are having official website and 31% of
libraries are lacking any dedicated library webpage. It is found that 9.77% of the Indian State
University Libraries were using Web 2.0 technologies to provide services to their users. It is
found that the highest Web 2.0 application index is in state of Kerala. OPAC 2.0, Mashups, RSS,
Social Bookmarking & Tagging, Social Networking Services, Vodcast and Blog are the most
widely applied technology and YouTube, Google Docs, Instant Messaging, Wikis are the least
used technology amongst respondent libraries.
Keywords: Web 2.0 tools, Social Media technology, Library 2.0, Web 2.0 application, Social
media application, Social Networking Services
Introduction:
The emergence of ICT has made communication process dynamic,fast and reliable interaction
across boundaries is now possible. According to Liu (2008) “Academic library websites are
libraries virtual presentation to the world”.(PEW Research Centre, 2017) observed that around
seven-in-ten Americans use social media to connect with one another, engage with news content,
share information and entertain themselves. In 2005 only 5% adults used social media platforms
and today 69% of the public uses some type of social media. This improvement has made
libraries around the globe to rethink their library services and quick to apply web 2.0 components
for example Blog, RSS, Wikis, Bookmarking site, instant messaging (IM), and social networking
sites like Facebook, and Myspace, etc., into their library to serve their patrons in effective way.
Indian university libraries also started embracing the technology so that they may easily outreach
their users. It is likely that none of the research is focused towards the application or evaluation
of Web 2.0 tools in State university libraries of India. Hence, the present study deals with the
extent of usage of Web 2.0 in state university libraries of India.
Research Objectivesof the study:
1 To identify Web 2.0 technologies those are applied in Indian state university libraries.
2 To examine purposes of Web 2.0 uses in the libraries.
3 To investigate characteristic features of the use of Web 2.0 in the libraries.
4 To compare usage of Web 2.0 in state wise Indian state university.
5 To know whether some innovative information services are being provided using Web
2.0 tools.
Literature review:
(Linh, 2008) conducted a survey to present general picture of application of Web 2.0
technologies in Australian University Libraries (AULs). It was found that two thirds of AULs
have deployed the Web 2.0 tools and only four tools namely RSS, blogs, instant messaging and
podcasts are used for some specific purposes with basic
features.(Kannikaparameshwari&Nikam, 2009) analyzed the utilization of Web 2.0 tools in
selected Indian libraries like National Law schools, IIM's, IIT's. It was discovered that 25% of
libraries deployed at least one Web 2.0 tools. Out of 28 Indian libraries, three libraries are
utilizing Web 2.0 tools with application index of 34.8.(Tripathi& Kumar, 2010) examined that
“Use of Web 2.0 tools in academic libraries: A reconnaissance of the international landscape”
furthermore, they found that 211 libraries 76.2% had applied no less than one of the Web 2.0
technologies, while 66 of them 23.8% of libraries are lacking the Web 2.0 tools. (Han &Quan
Liu, 2010) have conducted online survey of 38 top Chinese university libraries websites and
discovered that more than two-thirds of the 38 top Chinese university libraries are having
number of Web 2.0 tools through the essential functions of these internet sites. RSS are the most
common, while IM, Blog, SNS and Wiki are less consistent.(Si, Shi, & Chen, 2011) preferred
“top 30 Chinese university and looked into the use of Web 2.0 tools”. It was discovered that
Two-thirds of Chinese university libraries have deployed number of Web 2.0 tools. RSS was the
most extensively applied, while Wiki was minimal.(Patel & Poluru, 2013) depicted that that
there are very few university libraries in Gujarat that are applying Web 2.0 tools for different
purposes and Eight technologies are employed by university libraries in Gujarat namely RSS,
Blog, Instant Messaging, Facebook, Twitter, Google Docs, Podcasts, YouTube. It was found that
RSS is the only tool that is being utilized at the maximum because of its functional simplicity
whereas the other tools are least utilized.(Boateng&Quan Liu, 2014) explored in the article titled
“web 2.0 technologies usage and trends in the top 100 US academic libraries through the
academic library websites”. They noticed that all 100 scholastic libraries had an online
networking available on Facebook and Twitter, making Social networking service the most
generally adopted Web 2.0 technologies. The wiki was the minimum connected Web 2.0 tool.
Blog was the second most famous web 2.0 applications with a 99% of interest rate, followed by
RSS and IM/Chat with 97%and 91%of interest respectively. The Vodcast and Podcast had 47%
and 46% of interest rates individually, while social bookmarking/tagging also utilized by 39% of
the scholarly libraries.(Xu, Ouyang, & Chu, 2009) examined the websites of 81 scholarly library
sites in the New York state and found that “42% of them applied at least one Web 2.0 tools, for
example, blog while execution of those tools in individual libraries changes
significantly”.(Mahmood& Richardson, 2011) Surveyed web sites of100 member educational
libraries of Association of Research Libraries (USA) and discovered that all libraries utilizing
various tools of Web 2.0, Micro blogs, RSS, Personal blogs, Instant Messaging (IM), Mashups,
Podcasts, Vodcasts and Social Networking sites were greatly implemented, photo sharing, while
Wikis, presentation showing, virtual worlds, vertical search engines, personalized webpages and
were used less. Librariansutilizing these tools for sharing media, marketing library services, to
conduct information literacy programs and to provide user education, providing information
about print and digital resources, and soliciting responses of users.Awele and Foluke (2019)
studied the Web 2.0 applicationsblog, wiki, podcast and social network (Facebook) etc. used by
the students and observed that most of students are familiar with Web 2.0 applications and are
using for educational purposes.Jerome et.al.(2019) studied Web 2.0 application in LIS centres in
developing countries and discussed few tools blog, RSS instant messaging and SNS they have
suggested that policy should be framed for the purpose.
Research Methodology:
This research used content analysis which have used for the quantitative approach. Content
analysis method has been applied to modern technologies such as web sites, television, radio,
internet (Salinas, 2006). “Content analysis used to identify record the meaning of documents and
other forms of communications in a systematic and quantitative way” (Allen & David, 1990).
(Krippendorff, 2013) expressed that content analysis is content responsive, accepts unstructured
material, can prepare representative structures, and can manage substantial amounts of data.
This study has been carried out from only State University Libraries of India and 348 Indian
State University Libraries websites have been observed to examine adoption of Web 2.0 tools for
providing easy and fast services to their Library users. Further, University libraries website have
been analysedwhich have implemented Web 2.0 technology. During the study 34 state
universities have implemented Web 2.0 tools so that these libraries are treated as final size of the
sample for the present research.
• The study covers only those Indian state university libraries, whose websites are
accessible through the Internet.
• The study covers only those Web 2.0 tools and technologies that are publicly available
for study
Stages of the Study:
1 In the first stage (I), Prepared a list of University from UGC website (University Grants
Commission, 2015) (Appendix-1)
2 In the second stage (II), observation in regard of Web 2.0 based services offered by the
Indian state University Libraries have been using their Library websites/pages and
prepared a list of university those are using Web 2.0 tools.
3 In the third stage (III), A structured online questionnaire/checkpoints has been prepared
with the help of software Google document and circulated to the Indian state university
libraries that are using web 2.0 tools.
4 In the fourth stage (IV), of this study is data analysis, presentation of research, compare
usage of web 2.0 tools in state wise.
5 In the Fifth stage (V), is related to findings, suggestions and conclusion
Observation Method:
The data was collected by visiting the library websites. 348 Indian State University Libraries
websites home page/subpages accessed and identified for implementation of Web 2.0
technologies sometimes, a direct hyperlink to Web 2.0 tools was not accessible on the home
pages of the libraries; at that point the Google internet searcher used to find links to Web 2.0
tools on library sites.
Questionnaire/checklist method:
Questionnaires/Checklist Prepared based on the study of literature. There are no such standards
tools available for evaluating application of Web 2.0 in the library and the reality that Web 2.0 is
a group of different technologies. Based on (Tripathi& Kumar, 2010), (Boateng&Quan Liu,
2014), (CuongLinh, 2008), (Baro, Joyce Ebiagbe, &Zaccheaus Godfrey, 2013) others study have
been referred and prepared structured online questionnaire/ Checklist with the help of software
provided by Google document and circulated to the 34 Indian state university libraries that are
using Web 2.0 tools. In this investigation, the investigator finalized 123 checkpoints divided into
12 Categories (Table: 1) to know the usage of Web 2.0 tools in Libraries. “Each checkpoint
allotted a value 1 or 0 according to yes or no answer”.
Table: 1Distribution of Categories of Checkpoint
Categories Web 2.0 tools Number of Checkpoints
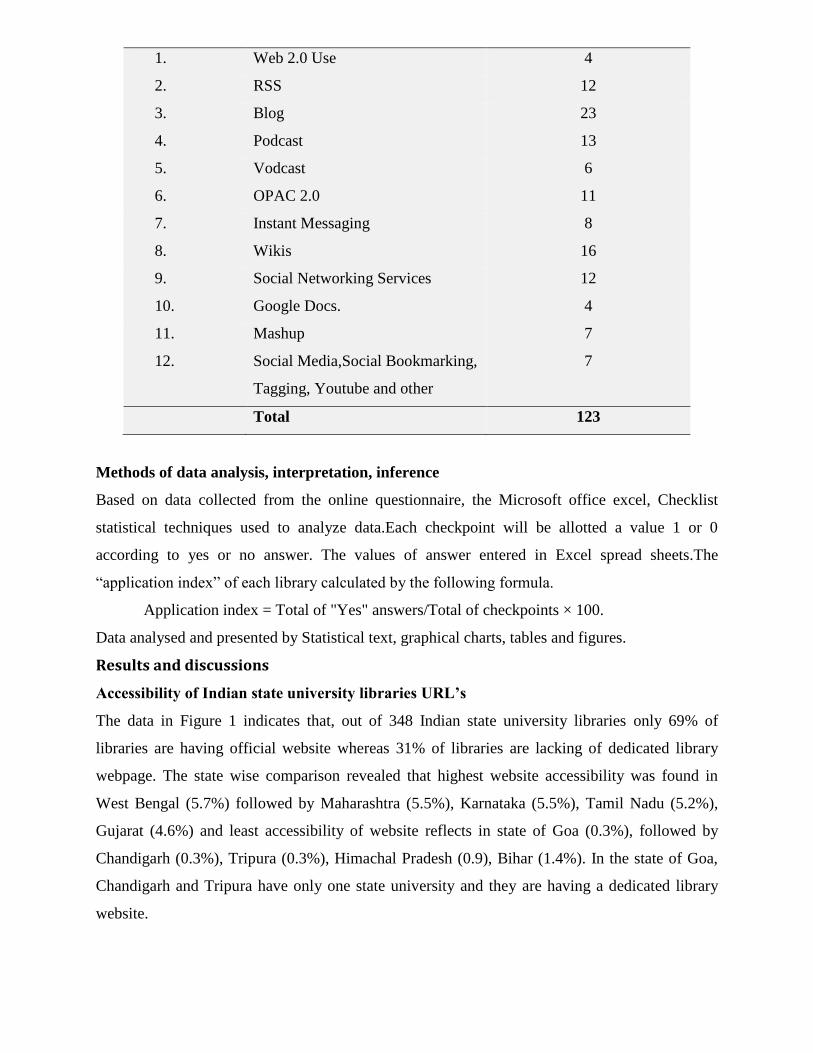
1. Web 2.0 Use 4
2. RSS 12
3. Blog 23
4. Podcast 13
5. Vodcast 6
6. OPAC 2.0 11
7. Instant Messaging 8
8. Wikis 16
9. Social Networking Services 12
10. Google Docs. 4
11. Mashup 7
12. Social Media,Social Bookmarking,
Tagging, Youtube and other
7
Total 123
Methods of data analysis, interpretation, inference
Based on data collected from the online questionnaire, the Microsoft office excel, Checklist
statistical techniques used to analyze data.Each checkpoint will be allotted a value 1 or 0
according to yes or no answer. The values of answer entered in Excel spread sheets.The
“application index” of each library calculated by the following formula.
Application index = Total of "Yes" answers/Total of checkpoints × 100.
Data analysed and presented by Statistical text, graphical charts, tables and figures.
Results and discussions
Accessibility of Indian state university libraries URL’s
The data in Figure 1 indicates that, out of 348 Indian state university libraries only 69% of
libraries are having official website whereas 31% of libraries are lacking of dedicated library
webpage. The state wise comparison revealed that highest website accessibility was found in
West Bengal (5.7%) followed by Maharashtra (5.5%), Karnataka (5.5%), Tamil Nadu (5.2%),
Gujarat (4.6%) and least accessibility of website reflects in state of Goa (0.3%), followed by
Chandigarh (0.3%), Tripura (0.3%), Himachal Pradesh (0.9), Bihar (1.4%). In the state of Goa,
Chandigarh and Tripura have only one state university and they are having a dedicated library
website.
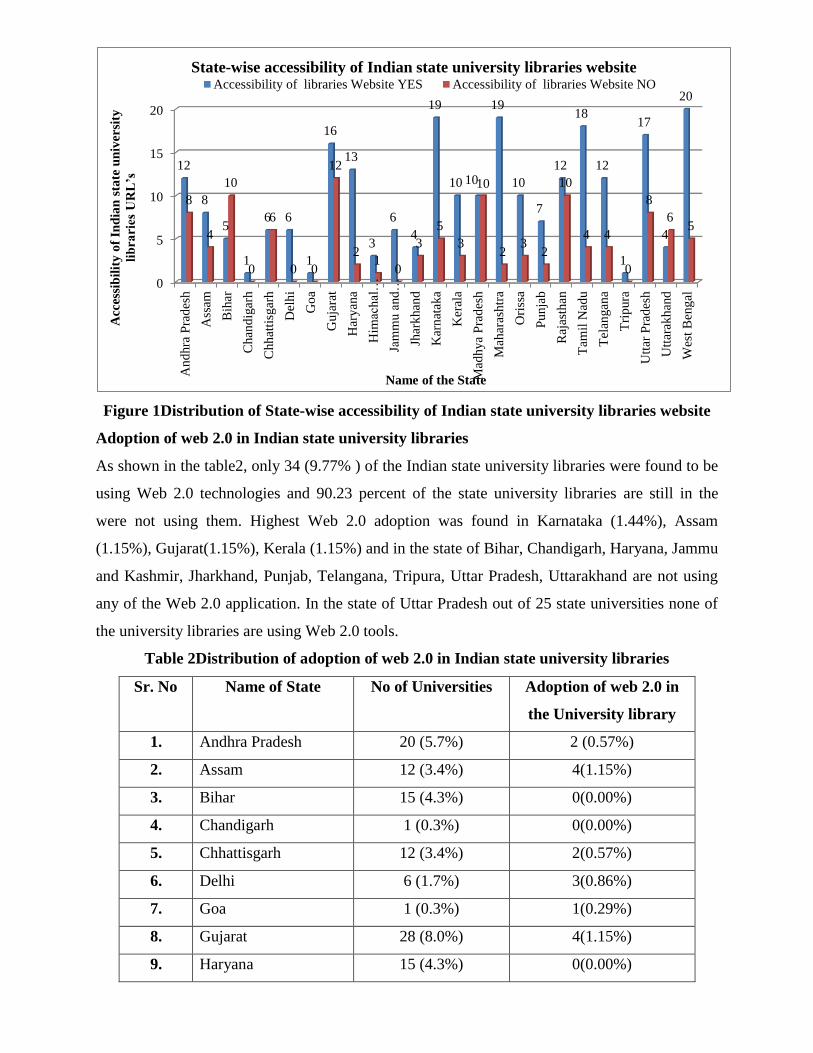
Figure 1Distribution of State-wise accessibility of Indian state university libraries website
Adoption of web 2.0 in Indian state university libraries
As shown in the table2, only 34 (9.77% ) of the Indian state university libraries were found to be
using Web 2.0 technologies and 90.23 percent of the state university libraries are still in the
were not using them. Highest Web 2.0 adoption was found in Karnataka (1.44%), Assam
(1.15%), Gujarat(1.15%), Kerala (1.15%) and in the state of Bihar, Chandigarh, Haryana, Jammu
and Kashmir, Jharkhand, Punjab, Telangana, Tripura, Uttar Pradesh, Uttarakhand are not using
any of the Web 2.0 application. In the state of Uttar Pradesh out of 25 state universities none of
the university libraries are using Web 2.0 tools.
Table 2Distribution of adoption of web 2.0 in Indian state university libraries
Sr. No Name of State No of Universities Adoption of web 2.0 in
the University library
Websites
1. Andhra Pradesh 20 (5.7%) 2 (0.57%)
2. Assam 12 (3.4%) 4(1.15%)
3. Bihar 15 (4.3%) 0(0.00%)
4. Chandigarh 1 (0.3%) 0(0.00%)
5. Chhattisgarh 12 (3.4%) 2(0.57%)
6. Delhi 6 (1.7%) 3(0.86%)
7. Goa 1 (0.3%) 1(0.29%)
8. Gujarat 28 (8.0%) 4(1.15%)
9. Haryana 15 (4.3%) 0(0.00%)
0
5
10
15
20
An
dhra
Pra
des
h
Ass
am
Bih
ar
Chan
dig
arh
Chh
atti
sgar
h
Del
hi
Go
a
Gu
jara
t
Har
yan
a
Him
ach
al…
Jam
mu
and
…
Jhar
khan
d
Kar
nat
aka
Ker
ala
Mad
hy
a P
rad
esh
Mah
aras
htr
a
Ori
ssa
Pu
nja
b
Raj
asth
an
Tam
il N
adu
Tel
angan
a
Tri
pura
Utt
ar P
rad
esh
Utt
arak
han
d
Wes
t B
eng
al
12
8
5
1
6 6
1
16
13
3
6
4
19
10 10
19
10
7
12
18
12
1
17
4
20
8
4
10
0
6
0 0
12
21
0
3
5
3
10
23
2
10
4 4
0
8
65
Acc
essi
bil
ity
of
Ind
ian
sta
te u
niv
ersi
ty
lib
rari
es U
RL
’s
Name of the State
State-wise accessibility of Indian state university libraries websiteAccessibility of libraries Website YES Accessibility of libraries Website NO
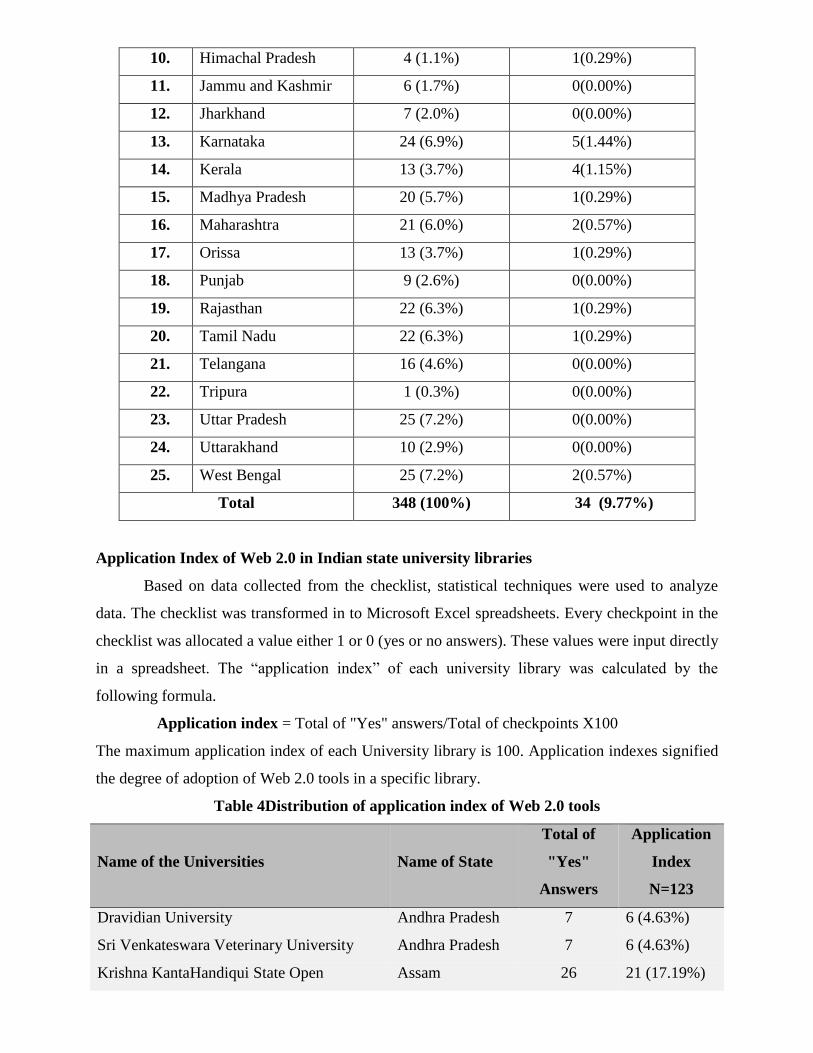
10. Himachal Pradesh 4 (1.1%) 1(0.29%)
11. Jammu and Kashmir 6 (1.7%) 0(0.00%)
12. Jharkhand 7 (2.0%) 0(0.00%)
13. Karnataka 24 (6.9%) 5(1.44%)
14. Kerala 13 (3.7%) 4(1.15%)
15. Madhya Pradesh 20 (5.7%) 1(0.29%)
16. Maharashtra 21 (6.0%) 2(0.57%)
17. Orissa 13 (3.7%) 1(0.29%)
18. Punjab 9 (2.6%) 0(0.00%)
19. Rajasthan 22 (6.3%) 1(0.29%)
20. Tamil Nadu 22 (6.3%) 1(0.29%)
21. Telangana 16 (4.6%) 0(0.00%)
22. Tripura 1 (0.3%) 0(0.00%)
23. Uttar Pradesh 25 (7.2%) 0(0.00%)
24. Uttarakhand 10 (2.9%) 0(0.00%)
25. West Bengal 25 (7.2%) 2(0.57%)
Total 348 (100%) 34 (9.77%)
Application Index of Web 2.0 in Indian state university libraries
Based on data collected from the checklist, statistical techniques were used to analyze
data. The checklist was transformed in to Microsoft Excel spreadsheets. Every checkpoint in the
checklist was allocated a value either 1 or 0 (yes or no answers). These values were input directly
in a spreadsheet. The “application index” of each university library was calculated by the
following formula.
“:Application index = Total of "Yes" answers/Total of checkpoints X100”
The maximum application index of each University library is 100. Application indexes signified
the degree of adoption of Web 2.0 tools in a specific library.
Table 4Distribution of application index of Web 2.0 tools
Name of the Universities Name of State
Total of
"Yes"
Answers
Application
Index
N=123
Dravidian University Andhra Pradesh 7 6 (4.63%)
Sri Venkateswara Veterinary University Andhra Pradesh 7 6 (4.63%)
Krishna KantaHandiqui State Open Assam 26 21 (17.19%)

University
National Law University and Judicial
Academy Assam 34 28 (22.47%)
Assam Agricultural University Assam 19 15 (12.56%)
Gauhati University Assam 8 7 (5.29%)
Pt.RavishankarShukla University Chhattisgarh 10 8 (6.61%)
Indira Gandhi KrishiVishwavidyalaya Chhattisgarh 24 20 (15.86%)
Delhi Technological University Delhi 22 18 (14.54%)
Indraprastha Institute of Information
Technology Delhi 23 19 (15.20%)
National Law University Delhi 11 9 (7.27%)
Goa University Goa 35 28 (23.13%)
CEPT University Gujarat 15 12 (9.91%)
Smt. Hansa Mehta Library Gujarat 40 33 (26.44%)
Saurashtra University Gujarat 22 18 (14.54%)
Veer Narmad South Gujarat University Gujarat 6 5 (3.97%)
ChaudharySarwan Kumar Himachal
Pradesh KrishiVishvavidyalaya
Himachal
Pradesh 19 15 (12.56%)
Gulbarga University Karnataka 24 20 (15.86%)
Mangalore University Karnataka 8 7 (5.29%)
University of Horticultural Sciences Karnataka 17 14 (11.24%)
Mysore University Karnataka 18 15 (11.90%)
Vesveswaraiah Technological University Karnataka 8 7 (5.29%)
Cochin Unviersity of Science & Technology Kerala 26 21 (17.19%)
Mahatma Gandhi Unversity Kerala 22 18 (14.54%)
Kerala Agricultural Unviersity Kerala 28 23 (18.51%)
Kerala University Kerala 28 23 (18.51%)
Vikram University Madhya Pradesh 6 5 (3.97%)
SavitribaiPhule Pune University Maharashtra 6 5 (3.97%)
Maharashtra Animal & Fishery Sciences
University Maharashtra 12 10 (7.93%)
National Law University Orrisa 21 17 (13.88%)
Rajasthan University of Veterinary &
Animal Sciences Rajasthan 20 16 (13.22%)

Anna University Tamil Nadu 6 5 (3.97%)
VidyaSagar University West Bengal 8 7 (2.29%)
The West Bengal National University of
Juridical Science West Bengal 19 15 (12.56%)
Total 492
Table 4 shows that the adoption of Web 2.0 technology in Indian State University
libraries, highest applications found in the Smt. Hansa Mehta Library (26.44%), followed by
Goa University (23.13%), National Law University and Judicial Academy (22.47%), Kerala
University (18.51%), Kerala Agricultural Unviersity (18.51%), Cochin Unviersity of Science &
Technology (17.19%), Krishna KantaHandiqui State Open University (17.19%), Gulbarga
University (15.86%), Indira Gandhi KrishiVishwavidyalaya (15.86%), Indraprastha Institute of
Information Technology (15.20%), Mahatma Gandhi Unversity (14.54%), Saurashtra
University(14.54%), Delhi Technological University (14.54%), National Law University, Orrisa
(13.88%), Rajasthan University of Veterinary & Animal Sciences (13.22%), The West Bengal
National University of Juridical Science (12.56%), ChaudharySarwan Kumar Himachal Pradesh
KrishiVishvavidyalaya (12.56%), Assam Agricultural University (12.56%) and the least
adoption of Web 2.0 in Veer Narmad South Gujarat University (3.97%), Vikram University
(3.97%), SavitribaiPhule Pune University (3.97%), Anna University (3.97%), Dravidian
University (4.63%), Sri Venkateswara Veterinary University (4.63%).
The mean of Web 2.0 application indexes is calculated by the following formula:
“Mean application Index = Total of application indexes/Number of State University
Libraries”
Mean = 492/34 = 14.47
Thus, the mean of Web 2.0 application indexes in selected Libraries is approximately 14 points.
It is found from the Table 4.5 that the Smt. Hansa Mehta Library, The Maharaja Sayajirao
University of Baroda, gained the highest application index with 26.44 points.
Distribution of State-Wise Application Index of web 2.0 in Indian state university
libraries
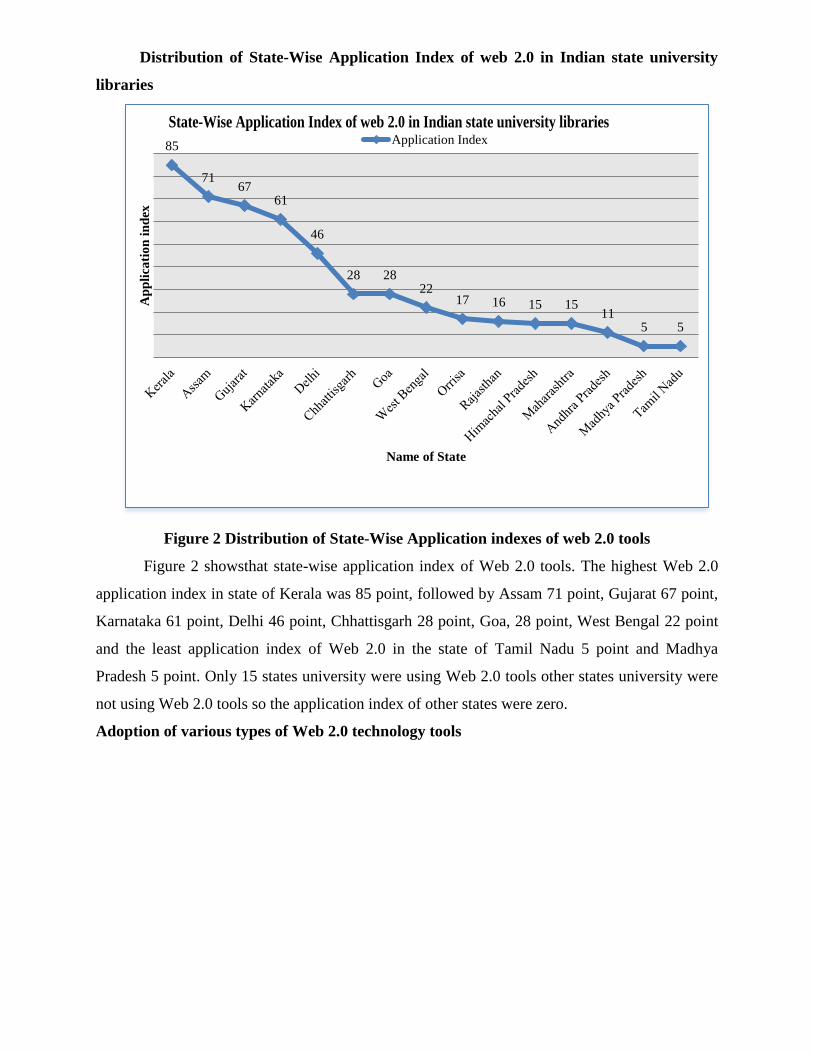
Figure 2 Distribution of State-Wise Application indexes of web 2.0 tools
Figure 2 showsthat state-wise application index of Web 2.0 tools. The highest Web 2.0
application index in state of Kerala was 85 point, followed by Assam 71 point, Gujarat 67 point,
Karnataka 61 point, Delhi 46 point, Chhattisgarh 28 point, Goa, 28 point, West Bengal 22 point
and the least application index of Web 2.0 in the state of Tamil Nadu 5 point and Madhya
Pradesh 5 point. Only 15 states university were using Web 2.0 tools other states university were
not using Web 2.0 tools so the application index of other states were zero.
Adoption of various types of Web 2.0 technology tools
85
7167
61
46
28 2822
17 16 15 1511
5 5
Ap
pli
cati
on
in
dex
Name of State
Application Index
State-Wise Application Index of web 2.0 in Indian state university libraries
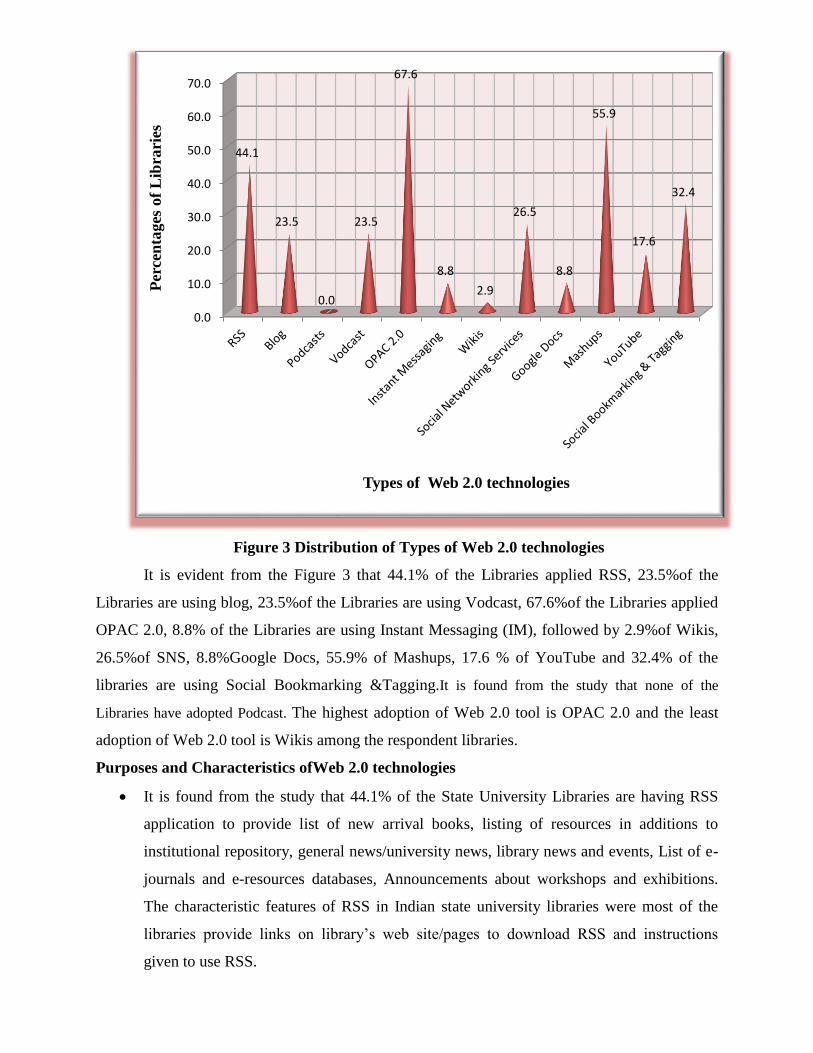
Figure 3 Distribution of Types of Web 2.0 technologies
It is evident from the Figure 3 that 44.1% of the Libraries applied RSS, 23.5%of the
Libraries are using blog, 23.5%of the Libraries are using Vodcast, 67.6%of the Libraries applied
OPAC 2.0, 8.8% of the Libraries are using Instant Messaging (IM), followed by 2.9%of Wikis,
26.5%of SNS, 8.8%Google Docs, 55.9% of Mashups, 17.6 % of YouTube and 32.4% of the
libraries are using Social Bookmarking &Tagging.It is found from the study that none of the
Libraries have adopted Podcast. The highest adoption of Web 2.0 tool is OPAC 2.0 and the least
adoption of Web 2.0 tool is Wikis among the respondent libraries.
Purposes and Characteristics ofWeb 2.0 technologies
• It is found from the study that 44.1% of the State University Libraries are having RSS
application to provide list of new arrival books, listing of resources in additions to
institutional repository, general news/university news, library news and events, List of e-
journals and e-resources databases, Announcements about workshops and exhibitions.
The characteristic features of RSS in Indian state university libraries were most of the
libraries provide links on library’s web site/pages to download RSS and instructions
given to use RSS.
0.0
10.0
20.0
30.0
40.0
50.0
60.0
70.0
44.1
23.5
0.0
23.5
67.6
8.8
2.9
26.5
8.8
55.9
17.6
32.4
Per
cen
tages
of
Lib
rari
es
Types of Web 2.0 technologies

• 23.5% of the State University Libraries are using Blog to provide common information,
list of new books, hours of operation, holidays, list of e-resources and databases,
information literacy, research tips and suggestions. The characteristic features of Blog is
blog accessible to all by default, blog links is givenon library’s homepage, archival
entries are up to 1 year old, time and dates of postings of blog entries, categories for
postings, entries are searchable, blog links given on library catalogue and instructions
also accessible on blogs.
• It was found that 23.5% of the libraries are using Vodcast to provide library orientation
tours and given guidance to access e-resources from on and off campus.
• 67.6% of the libraries have applied OPAC 2.0 for export book record databases, provide
option for more searches from other website and search interfaces to the library’s
homepages. The characteristic features of OPAC 2.0 were allow patrons to save records
and searches, Patrons able to make tagging, comment, rating, make book suggestion.
• 8.8% of the libraries are using instant messaging to provide reference services, suggestion
on library services, and guidance with resources. Features of instant messaging in Indian
state university libraries were “text-based chat” was offered and I.M. services are
available eight hours a day.
• It was found that 2.9% of the State University Libraries have implemented Wikis as
subject guides, project planning, listings of resource, training resources. The main
features of Wikis are allows users to edit contents of Wiki, provide keyword search
engine, link to library home page.
• 26.5% of the libraries are using Social Networking Services to sharing pictures/video
clips, library news/events, information about library resources, marketing of library
services and information about new acquisitions. Most of the Indian State University
libraries are providing social networking sites links on library’s homepages.
• It was found that 8.8% of the libraries are using Google Docs for create & share
documents, spreadsheets, presentations.
• 55.9% of the libraries are using Mashups to retrieve title image in OPAC from Google
books, Amazon and other online shopping site. Provide search interface from Google
scholar, worldcat, Google books.
• It is found that 17.6% of the Libraries are using YouTube and 32.4% of the Libraries are
using social bookmarking & tagging.
It is found from the study that few libraries are providing innovative library services to their
patrons with web 2.0 application and Smt. Hansa Mehta Library, Gujarat has developed own

RSS for providing current alert service.Indraprastha Institute of Information Technology, Delhi
adopted InstantMessaging by using “tawk.to” free live messaging app.It was suggested that other
state university library should adopt this type of application for providing virtual reference
services.
Recommendations
Application of Web 2.0 technology may impact relationship between users and libraries by
improving involvements of users in the library activities. Now-a-days Web 2.0 tools are very
popular among young generation and libraries should use this tool to provide information
literacy among users in effective way. Libraries can perform in excellent way to publish and
share content with library users using Web 2.0 tools. The Indian state university libraries have to
adopt highly developed technologies like Web 2.0 tools to provide the most excellent services to
the users. In the present study, none of the national library has adopted podcasts tool completely.
Less number of libraries has adopted Wiki, Instant Messaging, Google Docs tools. The libraries
have to adopt the latest web 2.0 tools like Wiki, podcasts, Instant Messaging etc. to organize the
required online information resources for the benefit of patrons. The study found that in the state
of Bihar, Chandigarh, Haryana, Jammu and Kashmir, Jharkhand, Punjab, Telangana, Tripura,
Uttar Pradesh and Uttarakhand none of the state universities have adopted single Web 2.0 tools,
so state higher education commission should take necessary action for implementation of Web
2.0 tools. University Grants Commission (UGC) has to prepare framework & guidelines for use
of Web 2.0 technologies/social media for Indian State Universities.
Conclusion:
This study focus on the application of Web 2.0 tools in Indian State University Libraries that
deployed any types of Web 2.0 technologies. Thus this study helps to understand the present
scenario of the state university libraries related to implementation of Web 2.0 technologies. So
that this study is reflects that how the Indian State Universities offering library services with web
2.0 application to library patrons at the same time this study do not evaluate the impact of these
applications but obvious it is found from literature search that these applications plays very
major role to connect the users and in Information Literacy. The results of this investigation will
serve as a guidefor the academic libraries for planning and implementing some innovative
information services through use of Web 2.0 tools. Librarians may also find this helpful once
they want to implement such technologies in their libraries.
The findings of the study reflects that web 2.0 tools and technologies are open source, easy to
learn, easy to install, and help to get updated in concerned field. This research has a lot of impact
as it addresses the application of web 2.0 tools in libraries. It attempts to provide academic
libraries with helpful information to meet needs of the their user in better way and effectively
applying of Web 2.0 technologies. It is found from the study that OPAC 2.0, blogs, Instant
Messaging, Really simple Syndication (RSS), Mashups and Vodcast are very popular among the
respondent libraries but still usage of web 2.0 tools for library services among the Indian State
University is not encouraging and they may start library services with web 2.0 tools to provide
better library services to their patronsand to create user-friendly environment.
References:
Adibi, Awele and okocha, foluke, "Adoption of Web 2.0 Applications for Education by Students
in Nigeria" (2019).Library Philosophy and Practice (e-journal). 2507.
https://digitalcommons.unl.edu/libphilprac/2507
Allen, B., & David, R. (1990).Content analysis in library and information science
research.Library & Information Science Research, 12(3), 251–262.
Baro, E. E., Joyce Ebiagbe, E., &Zaccheaus Godfrey, V. (2013). Web 2.0 tools usage: a
comparative study of librarians in university libraries in Nigeria and South Africa.
Library Hi Tech News, 30(5), 10–20. https://doi.org/10.1108/LHTN-04-2013-0021
Boateng, F., &Quan Liu, Y. (2014). Web 2.0 applications’ usage and trends in top US academic
libraries. Library Hi Tech, 32(1), 120–138. https://doi.org/10.1108/LHT-07-2013-0093
CuongLinh, N. (2008). A survey of the application of Web 2.0 in Australasian university
libraries.Library Hi Tech, 26(4), 630–653. https://doi.org/10.1108/07378830810920950
Han, Z., &Quan Liu, Y. (2010). Web 2.0 applications in top Chinese university libraries. Library
Hi Tech, 28(1), 41–62. https://doi.org/10.1108/07378831011026689
Idiegbeyan-ose, Jerome; Okocha, Foluke; Aregbesola, Ayooluwa; Owolabi, Sola; Eyiolorunshe,
Toluwani; and Yusuf, Felicia, "Application of Web 2.0 Technology in Library and
Information Centres in Developing Countries: Challenges and Way Forward" (2019).
Library Philosophy and Practice (e-journal). 2387.
https://digitalcommons.unl.edu/libphilprac/2387
Kannikaparameshwari, G., &Nikam, K. (2009).Evaluation of Web 2.0 Technologies Application
in Selected Indian Libraries.Presented at the National Seminar on Management of Digital
Information Sources, Bangalore: Department of Library and Information Center, RNS
Institution of Technology. Retrieved from
http://www.academia.edu/335141/Evaluation_of_Web_2.0_Technologies_Application_i
n_Selected_Indian_Libraries
Krippendorff, K. (2013). Content analysis: an introduction to its methodology (3rd ed). Los
Angeles ; London: SAGE.
Linh, N. C. (2008). A survey of the application of Web 2.0 in Australasian university
libraries.Library Hi Tech, 26(4), 630–653. doi:10.1108/07378830810920950

Liu, S. (2008).Engaging Users: The Future of Academic Library Web Sites.College & Research
Libraries, 69(1), 6–27
Mahmood, K., & Richardson, J. V. (2011). Adoption of Web 2.0 in US academic libraries: a
survey of ARL library websites. Program: Electronic Library and Information Systems,
45(4), 365–375. doi:10.1108/00330331111182085
Patel, Sandip and Poluru, Lalitha. (2013). How Far or Near to 24 X 7 Libraries? Analysis of
Application of Web 2.0 Tools in University Libraries of Gujarat.In Rejuvenated Libraries
for Empowered Users (Dr. TAV Murthy Festschrift Volume, 2012–13). UK: Digital
Information Research Ltd.
PEW Research Centre. (2017, January 12). Social Media Fact Sheet. Retrieved August 26, 2017,
from http://www.pewinternet.org/fact-sheet/social-media
Salinas, R. (2006). A content analysis of Latina Web content.Library & Information Science
Research, 28(2), 297–324. https://doi.org/10.1016/j.lisr.2006.03.007
Si, L., Shi, R., & Chen, B. (2011).An investigation and analysis of the application of Web 2.0 in
Chinese university libraries.The Electronic Library, 29(5), 651–668.
doi:10.1108/02640471111177080
Tripathi, M., & Kumar, S. (2010). Use of Web 2.0 tools in academic libraries: A reconnaissance
of the international landscape. The International Information & Library Review, 42(3),
195–207. doi:10.1016/j.iilr.2010.07.005
Xu, C., Ouyang, F., & Chu, H. (2009). The Academic Library Meets Web 2.0: Applications and
Implications. The Journal of Academic Librarianship, 35(4), 324–331.
doi:10.1016/j.acalib.2009.04.003