
The application of the Global Trigger Tool: a systematic review
10
International Journal for Quality in Health Care, 2016, 28(6), 640–649 doi: 10.1093/intqhc/mzw115 Advance Access Publication Date: 24 September 2016 Article Article The application of the Global Trigger Tool: a systematic review PETER D. HIBBERT 1,2 , CHARLOTTE J. MOLLOY 1,2 , TAMARA D. HOOPER 1,2 , LOUISE K. WILES 1,2 , WILLIAM B. RUNCIMAN 1,2,3 , PETER LACHMAN 4 , STEPHEN E. MUETHING 5 , and JEFFREY BRAITHWAITE 1 1 Australian Institute of Health Innovation, Macquarie University, Level 6, 75 Talavera Road, Macquarie University, New South Wales 2109, Australia, 2 Centre for Population Health Research, Sansom Institute for Health Research, University of South Australia, GPO Box 2471, Adelaide, South Australia 5001, Australia, 3 Australian Patient Safety Foundation, PO Box 2471, IPC CWE-53, Adelaide, South Australia 5001, Australia, 4 Great Ormond Street Hospital NHS Foundation Trust, Great Ormond St, London WC1N 3JH, UK, and 5 James M. Anderson Center for HealthCare Excellence, Cincinnati Children’s Hospital Medical Center, Cincinnati, OH 45229-3039, USA Address reprint requests to: Mr Peter Hibbert, Australian Institute of Health Innovation, Level 6, 75 Talavera Road, Macquarie University, Sydney NSW 2109, Australia. Tel: + 618 8302 1291; Fax: +612 8088 6234; E-mail: [email protected] Accepted 30 August 2016 Abstract Purpose: This study describes the use of, and modifications and additions made to, the Global Trigger Tool (GTT) since its first release in 2003, and summarizes its findings with respect to counting and characterizing adverse events (AEs). Data sources: Peer-reviewed literature up to 31st December 2014. Study selection: A systematic review was conducted in accordance with the Preferred Reporting Items for Systematic Reviews and Meta-Analyses statement. Data extraction: Two authors extracted and compiled the demographics, methodologies and results of the selected studies. Results of data synthesis: Of the 48 studies meeting the eligibility criteria, 44 collected data from inpatient medical records and four from general practice records. Studies were undertaken in 16 countries. Over half did not follow the standard GTT protocol regarding the number of reviewers used. ‘Acts of omission’ were included in one quarter of studies. Incident reporting detected between 2% and 8% of AEs that were detected with the GTT. Rates of AEs varied in general inpatient studies between 7% and 40%. Infections, problems with surgical procedures and medica- tion were the most common incident types. Conclusion: The GTT is a flexible tool used in a range of settings with varied applications. Substantial differences in AE rates were evident across studies, most likely associated with meth- odological differences and disparate reviewer interpretations. AE rates should not be compared between institutions or studies. Recommendations include adding ‘omission’ AEs, using prevent- ability scores for priority setting, and re-framing the GTT’s purpose to understand and characterize AEs rather than just counting them. Key words: Global Trigger Tool, patient safety, quality of care, adverse events, systematic review © The Author 2016. Published by Oxford University Press in association with the International Society for Quality in Health Care. All rights reserved. For permissions, please e-mail: [email protected] 640 Downloaded from https://academic.oup.com/intqhc/article/28/6/640/2607812 by guest on 18 September 2022
-
Upload
khangminh22 -
Category
Documents
-
view
6 -
download
0
Transcript of The application of the Global Trigger Tool: a systematic review
International Journal for Quality in Health Care, 2016, 28(6), 640–649doi: 10.1093/intqhc/mzw115
Advance Access Publication Date: 24 September 2016Article
Article
The application of the Global Trigger Tool:
a systematic review
PETER D. HIBBERT1,2, CHARLOTTE J. MOLLOY1,2, TAMARA D. HOOPER1,2,
LOUISE K. WILES1,2, WILLIAM B. RUNCIMAN1,2,3, PETER LACHMAN4,
STEPHEN E. MUETHING5, and JEFFREY BRAITHWAITE1
1Australian Institute of Health Innovation, Macquarie University, Level 6, 75 Talavera Road, Macquarie University,New South Wales 2109, Australia, 2Centre for Population Health Research, Sansom Institute for Health Research,University of South Australia, GPO Box 2471, Adelaide, South Australia 5001, Australia, 3Australian Patient SafetyFoundation, PO Box 2471, IPC CWE-53, Adelaide, South Australia 5001, Australia, 4Great Ormond Street HospitalNHS Foundation Trust, Great Ormond St, London WC1N 3JH, UK, and 5James M. Anderson Center for HealthCareExcellence, Cincinnati Children’s Hospital Medical Center, Cincinnati, OH 45229-3039, USA
Address reprint requests to: Mr Peter Hibbert, Australian Institute of Health Innovation, Level 6, 75 Talavera Road, MacquarieUniversity, Sydney NSW 2109, Australia. Tel: + 618 8302 1291; Fax: +612 8088 6234; E-mail: [email protected]
Accepted 30 August 2016
Abstract
Purpose: This study describes the use of, and modifications and additions made to, the Global
Trigger Tool (GTT) since its first release in 2003, and summarizes its findings with respect to
counting and characterizing adverse events (AEs).
Data sources: Peer-reviewed literature up to 31st December 2014.
Study selection: A systematic review was conducted in accordance with the Preferred Reporting
Items for Systematic Reviews and Meta-Analyses statement.
Data extraction: Two authors extracted and compiled the demographics, methodologies and
results of the selected studies.
Results of data synthesis: Of the 48 studies meeting the eligibility criteria, 44 collected data from
inpatient medical records and four from general practice records. Studies were undertaken in 16
countries. Over half did not follow the standard GTT protocol regarding the number of reviewers
used. ‘Acts of omission’ were included in one quarter of studies. Incident reporting detected
between 2% and 8% of AEs that were detected with the GTT. Rates of AEs varied in general
inpatient studies between 7% and 40%. Infections, problems with surgical procedures and medica-
tion were the most common incident types.
Conclusion: The GTT is a flexible tool used in a range of settings with varied applications.
Substantial differences in AE rates were evident across studies, most likely associated with meth-
odological differences and disparate reviewer interpretations. AE rates should not be compared
between institutions or studies. Recommendations include adding ‘omission’ AEs, using prevent-
ability scores for priority setting, and re-framing the GTT’s purpose to understand and characterize
AEs rather than just counting them.
Key words: Global Trigger Tool, patient safety, quality of care, adverse events, systematic review
© The Author 2016. Published by Oxford University Press in association with the International Society for Quality in Health Care. All rights reserved.For permissions, please e-mail: [email protected] 640
Dow
nloaded from https://academ
ic.oup.com/intqhc/article/28/6/640/2607812 by guest on 18 Septem
ber 2022
Introduction
The study of patient safety has been a policy priority since the publi-cation of national reports [1–3] drawing attention to high rates ofhealthcare-associated harm [4–7]. Methods for measuring and char-acterizing patient safety have also attracted attention as health ser-vices, governments and researchers seek to make progress intackling harm. These include incident reporting [8, 9], medicalrecord review (MRR) [4], observational and ethnographic studies[10, 11], patient-experience surveys [12], routine collection of safetymetrics [13] and automated data extraction from electronic medicalrecords [14].
Two-stage MRRs were designed to provide data on the fre-quency and types of adverse events (AEs) [15]. The most frequentlyused are the ‘Harvard method’ (HM) [4, 5, 16, 17] and the GlobalTrigger Tool (GTT) [18–20]. The HM definition has a more restrict-ive threshold of AEs: ‘… result(ing) in prolongation of hospital stay,temporary or permanent disability or death’ [5] compared to theGTT definition: ‘additional monitoring, treatment, or hospitaliza-tion, or that results in death’ [20]. Both the GTT and the HMinvolve a Stage 1 screening process for the presence of criteria (HM)or triggers (GTT), followed by a more in-depth manual review ofthe medical record for the presence of an AE (Stage 2). After AEshave been detected with the GTT, their rates may be calculated anddisplayed graphically over time [20]. The GTT aims to ‘provide aneasy-to-use method for accurately identifying AEs (harm) and meas-uring the rate of AEs over time’ [20]. The GTT is often used as anadjunct to incident reporting to reduce the number of AEs that areundetected [20]. It can be used by teams and senior leadership toprioritize resource allocation to the most frequent or harmful AEs,thereby optimizing the impact of patient safety initiatives and tomonitor improvements over time [20]. It was originally developedfor adult inpatients, but has been modified for hospital specialties[21–28] and primary care [29–31].
Researchers are using the GTT for its original purpose of meas-uring AEs at an organizational or other level to assess the rate ofharm, to assess its utility and reliability, or to compare its resultswith other AE data sources. Researchers are also applying a numberof modifications and additions to the standard GTT such as thenumber of reviewers used and data fields collected. These changesare for presumably pragmatic reasons and reflect the GTT’sflexibility.
We aim to describe the reasons for using the GTT, type of spe-cialties where it is being used, and the modifications and additionsto the standard GTT protocol. Additionally, we will summarize thefindings with respect to counting and characterizing AEs.
Data sources
A systematic review and narrative synthesis was conducted in adherenceto the Preferred Reporting Items for Systematic Reviews and Meta-Analyses (PRISMA) statement [32]. We searchedMEDLINE, EMBASEand CINAHL for articles up to and including December 2014, usingthe search term ‘Global Trigger Tool’. We also hand-searched the keyjournals BMJ Quality and Safety and the International Journal forQuality in Health Care. Figure 1 depicts the search strategy.
Study selection
Included were studies, published in English, which collected data(from MRR) using a variant of the GTT (including two studies that
used a blended GTT–HM approach) [21, 25]. Studies using an auto-mated process to detect triggers were excluded because a systematicreview has previously been undertaken [33]. In total, 48 studies metthe inclusion criteria.
Data extraction
Table 1 provides the research questions for this study, organized bycategories, and a summary of the GTT protocol instructions [20].Two authors (P.D.H., C.J.M.) extracted and compiled the studydemographics, methodology and results data.
An additional research question (‘what were the reasons forundertaking the study?’) was also posed. These reasons were itera-tively developed from reviewing the studies. For the research ques-tions in Table 1 relating to GTT ‘Methodology—sampling’ and‘Methodology—data collection and analysis’, we reported our find-ings for all 48 studies and, where appropriate, for those with thereason of measuring AE rates to assess the rate of harm (the ‘AEmeasurement’ studies).
Risk of bias in individual studies
Critical appraisal of the included studies and meta-analysis of theAE rates across studies were not undertaken due to methodologicalheterogeneity, including the disparate methods of using the GTTand recognition by the GTT protocol that reviewer skills will varybetween organizations [20]. Despite our review being focused on theapplication of a tool, rather than success of an intervention, it maystill be possible that publication bias affected the results of thisstudy. For example, research that used the GTT methodology thatyielded low levels of AEs, may be less likely to get published thanreports of higher AE levels.
Results of data synthesis
Just over one-half (26/48, 54%) (Supplementary Table A.1) of stud-ies cited measuring the AE rate as a reason for undertaking theresearch. Assessing the utility of the GTT as a measurement toolwas the second most frequently cited reason (17/48, 35%).Characterizing AEs (for example using incident types, preventability,or severity) was the next most common reason (15/48, 31%), how-ever 14/15 of these studies were also AE measurement studies. Threeof the five cited reasons for undertaking the studies were related tomethodological issues—assessing the GTT’s utility, developing GTTspecialty versions (12/48, 25%) and comparing the GTT with otherAE data sources (9/48, 19%).
Demographics and methodology—sampling
The 48 studies had been conducted in 16 countries with 18 (38%)in the USA (Table 2, Supplementary Table A.2). Most (44/48, 92%)had been undertaken in hospitals with four (8%) in general practice(GP) (Table 2, Supplementary Table A.2). Adverse drug events(ADEs) only were collected in nine studies in various specialties [35–43]. Of the hospital-based studies, over half were undertaken in asingle institution (24/44, 55%) (Table 2, Supplementary Table A.2).The 44 hospital studies reviewed 76 617 records, while the GP stud-ies reviewed 2387 records.
641The application of the Global Trigger Tool • Quality Assessment
Dow
nloaded from https://academ
ic.oup.com/intqhc/article/28/6/640/2607812 by guest on 18 Septem
ber 2022

Sample sizeOne quarter (12/48, 25%) of the studies and a similar proportionof the AE measurement studies (7/26, 26%) used the GTT sam-pling methodology of reviewing 10 records every 2 weeks or 20per month. The number of records reviewed in the 44 hospital-based studies ranged from 50 to 17 295 with a median of 574 anda mean of 1741 (Supplementary Table A.2). In the four GP stud-ies, sample sizes ranged from 170 to 1289 records (mean 597)(Supplementary Table A.2), and 637 to 4117 consultations(reported for three GP studies; mean 2335).
Methodology—data collection and analysis
Definition of AEThe GTT protocol’s AE definition was used in 13/48 studies (27%),and a further three (6%) used a modified version. A similar propor-tion of AE measurement studies (10/26, 38%) used either the GTTdefinition or a modification. Nine studies (19%) used the HM defin-ition or a modified version of it; 14 (29%) used their own definitionor a definition from another source. Nine studies (19%) reported noexplicit definition; but a number of these stated they were using
GTT methodology. Acts of omission were included in one quarter(12/48, 25%) of studies [24, 25, 28, 36, 38, 47, 49, 55–59] and5/26 (19%) of the AE measurement studies.
Number of reviewersThe GTT protocol recommends assignment of two primaryreviewers and one authenticating physician [20]. Just over one quar-ter of studies (13/48, 27%) (Supplementary Table A.3) and AEmeasurement studies (7/26, 27%) used this method. The most fre-quently used other method was one primary and one secondaryreviewer (8/48, 17%). In nearly one quarter of studies (11/48,23%), the method was not explicitly described.
Inter-rater reliabilityJust under half of the studies (22/48, 46%) and AE measurementstudies (11/26, 42%) measured inter-rater reliability (IRR) betweenreviewers, using either Kappa (k) scores or per cent (%) agreement.Detailed results of IRR reporting are outlined in SupplementaryTables A.4–A.7.
Figure 1 Systematic review process. Screened by two authors (PDH, CJM).
642 Hibbert et al.
Dow
nloaded from https://academ
ic.oup.com/intqhc/article/28/6/640/2607812 by guest on 18 Septem
ber 2022

Use of AE preventability scalesA preventability scale was used in 27/48 (56%) studies(Supplementary Table A.8) and 19/26 (73%) of AE measurementstudies. Likert scales were used in 16/27 (59%) studies with a 6-point scale used most frequently (11 studies). Of those 11 studieswhich did not use a Likert scale, four used non-explicit reviewerinterpretation.
Use of type of Patient Safety ClassificationOver half of the studies (28/48, 58%) and nearly three-quarters ofthe AE measurement studies (19/26, 73%) used a classification todescribe what went wrong (an incident type) [73]. Of the four GPstudies, two used a classification. The classification systems used 4–72 categories.
Scale for level of severity of harm usedThe NCC MERP [34] was used as the scale of harm in 37/48 (77%) ofthe studies (Supplementary Table A.9) with one using an
otolaryngology adaptation [28]. Four studies did not measure the scaleof harm [39, 42, 60, 65].
Methods of reporting AE ratesThe percentage of admissions with an AE was the most frequentmethod used (36/48, 75%) followed by AEs per 100 admissions(29/48, 60%) and then AEs per 1000 patient days (22/48, 46%)(Supplementary Table A.10). The figures for AE measurement stud-ies were 22/26 (85%), 18/26 (69%) and 17/26 (65%), respectively.All three methods were used in 10 studies (21%) with 9 of thesebeing AE measurement studies.
Comparisons of AE rates obtained with the GTT to incidentreporting ratesIn eight studies (17%) a comparison of GTT data with AEs detectedvia incident reporting was undertaken [26, 27, 36, 47, 56, 64, 66, 72].All of these were AE measurement studies. Incident reporting systemsdetected 2–8% of AEs detected using the GTT (average of 4%)(Supplementary Table A.11). Nilsson [57] reported GTT AEs detected
Table 1 Systematic review research questions and GTT protocol instructions
Research questioncategory
Research questions Equivalent instructions from the revised standard GTT protocol [20]
Demographicinformation
Country Not applicable.
Methodology—sampling
Healthcare care type (e.g. hospital, general orfamily practice)
The GTT is designed to detect AEs in hospital.
Healthcare specialty or patient type (or examplesurgical, intensive care unit, orthopaedics,cancer)
Designed for general adult inpatients—i.e. sampled across an entirepopulation of discharged adult patients excluding psychiatric andrehabilitation patients.
Number of institutions One institution at a time.Sample size and frequency The GTT protocol recommends institutions undertake 20 MRRs per
month or 10 per fortnight.Methodology—data
collection andanalysis
Definition of an AE Unintended physical injury resulting from or contributed to by medical carethat requires additional monitoring, treatment or hospitalization, or thatresults in death.
Includes only those AEs related to the active delivery of care (‘acts ofcommission’) and excludes, as much as possible, issues related tosubstandard care (‘acts of omission’).
Number of reviewers Minimum three reviewers. Two reviewers to review triggers and search forAEs; one reviewer to confirm whether an AE has occurred.
Use of inter-rater reliability (IRR) scores The protocol recommends that individual hospitals do not conductexhaustive studies to measure reliability, but does encourage teams tocontinually promote consistent, standard record review procedures, useof triggers and interpretation of AEs.
Use of AEs preventability scales The protocol recommends that there should be no attempt to measurepreventability.
Use and type of patient safety ‘incident type’classification
Not specifically recommended but the protocol states that ‘Hospitals havefound this categorization to be useful in prioritizing areas forimprovement work.’
Scale used for level of severity of harm Adapted classification from the National Coordinating Council forMedication Error Reporting and Prevention (NCC MERP) Index forCategorizing Errors [34].
Methods of reporting AE rates Three methods recommended:- % of admissions with an AE- % rate of AEs per admission- Rate of AEs per 1000 patient days
Comparisons of AE rates obtained with the GTTto incident reporting rates
The protocol does not mention comparing results with incident reportingrates.
Findings—AE ratesand characteristics
Preventable AEs Not applicable.AE rates Not applicable.Incident types Not applicable.
643The application of the Global Trigger Tool • Quality Assessment
Dow
nloaded from https://academ
ic.oup.com/intqhc/article/28/6/640/2607812 by guest on 18 Septem
ber 2022

compared with those reported to a national repository for sentinelevents. They found the repository detected 5% of AEs detected withthe GTT.
AE rates and characteristics
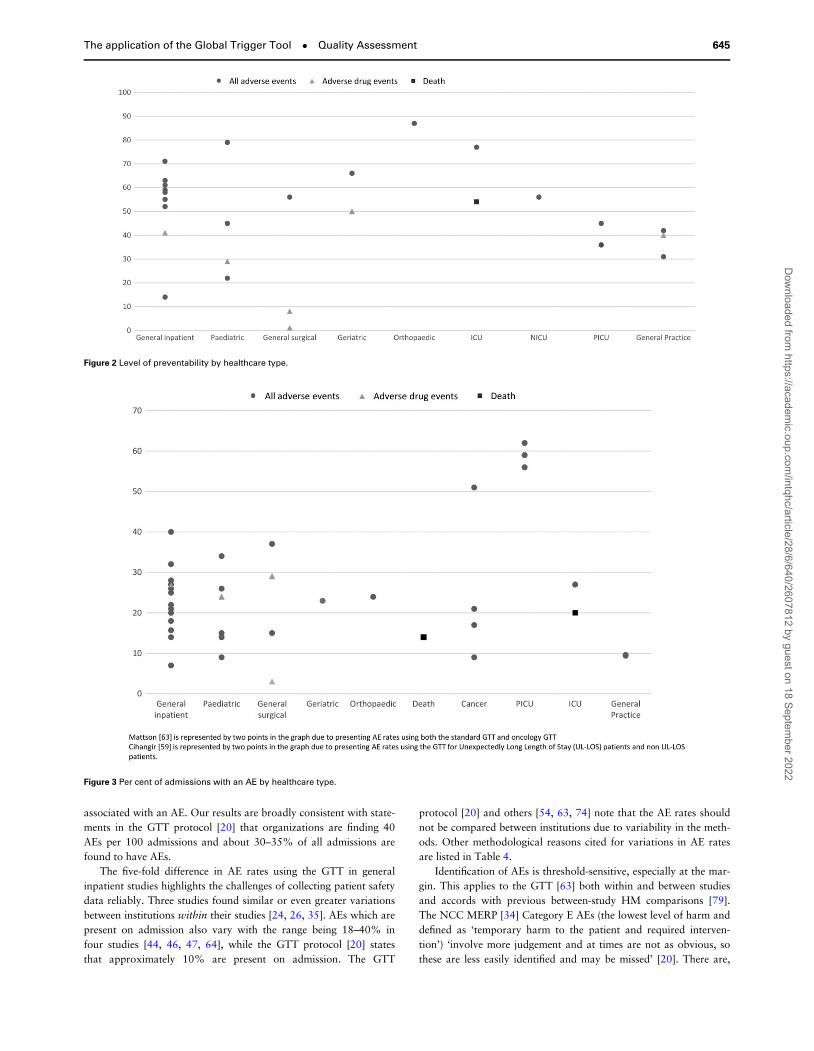
Preventable AEsFigure 2 shows the percentage of AEs deemed preventable by health-care speciality or patient type. The results are highly variable with,
for example, four paediatric studies ranging from 22% to 79%. Inthe nine general hospital studies, results ranged from 14% to 71%with six of these clustering between 50% and 63%.
AE ratesFigure 3 and Supplementary Figs A.1 and A.2 show the AE ratesusing the three methods. The range of admissions with an AE, for17 general inpatient (general, general medical, general surgical) stud-ies, varied between 7% and 40% with a cluster of nine studiesbetween 20% and 29%. For general inpatients, the rates of AEs per100 admissions was 8–51%. The rates of paediatric studies rangedfrom 9% to 34%, and three PICU studies reported rates between56% and 62%.
Incident typesOf the 21 studies undertaken using general inpatient, general surgi-cal or general medical patients’ records, 10 used classification sys-tems with sufficient commonality to allow comparison (Table 3). Ofthese, nine were AE measurement studies. In 8/10 studies, infections,medications and surgical/procedure AEs were the top three typesreported, comprising 73% of all AEs reported.
Discussion
Use of the GTT is becoming more common, with 14 studies pub-lished between 2006 and 2010 and 34 between 2011 and 2014. It isbeing used in a wide range of specialties. The most frequent reasonfor undertaking a study was to measure AE rates. We found varia-tions from the GTT protocol with respect to definitions, sample sizesand frequency of samples, use of reviewers and reporting of IRR.Additional data fields, for incident type classification and prevent-ability, have been added, especially by the AE measurement studies.Overall, sample sizes are generally much larger than described in theGTT protocol [20] and the NCC MERP scale [34] is commonlyused. Doupi [74] underlines this heterogeneity, indicating that ‘everyimplementation of the GTT seems to be an own local variant withthe two-staged review approach and the NCC MERP method ofseverity assessment … being the only truly stable elements acrossstudies’. The GTT is intended to be modifiable [20] and its useacross a range of sub-specialties and the variations described aboveare testament to its flexibility.
The limitation of potential publication bias was mentioned in themethods. Although there is no MeSH term for GTTs, given theunique combination of the three words ‘global’, ‘trigger’ and ‘tools’,it is likely we found all relevant studies. There is extensive overlap inthe methods of the HM and GTT and some studies did not explicitlyoutline definitions but stated that they were using the GTT method-ology. The strength of the study is that it uses instructions from thestandard GTT protocol as the categories against which to assessvariability in the use of the GTT.
Rates of AEs
It is often stated that 10% of acute care hospital admissions areassociated with AEs. This is largely based on MRRs using the HMmethod. A systematic review of eight of these studies found a meanoverall incidence of 9.2% [75]. Our review found that the GTT fre-quently detects higher rates of harm. In general hospitals, rates ofAEs per 100 admissions ranged from 7% to 51% with 11 out of 12general studies reporting more than 10% of admissions being
Table 2 GTT studies by healthcare type, country and number of
hospitals
Country n Reference number
USA 18 [18, 22, 26–28, 35–37,44–53]
Sweden 4 [54–57]England 3 [24, 39, 58]Netherlands 3 [38, 40, 59]Canada 3 [21, 25, 60]Denmark 3 [61–63]Belgium 2 [43, 64]Australia 2 [65, 66]NZ 2 [42, 67]Spain 2 [68, 69]Korea 1 [70]Norway 1 [23]Scotland 1 [31]Thailand 1 [71]Palestine 1 [72]Finland 1 [41]Total 48
Specialty n (records) Reference numberGeneral inpatients 16 (44 690) [18, 41–49, 54, 61, 64,
70–72]Paediatric 7 (10 813) [21–25, 36, 55]General practicea 4 (2387) [31, 35, 65, 67]General surgical 4 (1673) [39, 40, 50, 69]Cancer 3 (941) [59, 62, 63]Intensive care unit (ICU)b 3 (12 842) [52, 56, 58]Paediatric intensive care
unit (PICU)3 (1052) [27, 53, 66]
Geriatricc 2 (1690) [38, 68]General medical 1 (250) [51]General inpatient death 1 (1817) [60]Paediatric surgical 1 (50) [28]Neonatal intensive care
unit (NICU)1 (749) [26]
Orthopaedic 1 (350) [57]Paediatric rehabilitation 1 (60) [37]Total 48 (79 004)
No. of hospitalsd n Reference number1 24 [22, 23, 28, 37, 39–43,
51, 53–57, 59, 60,63, 64, 66, 68–71]
2–5 8 [18, 38, 45, 49, 58, 61,62, 72]
6–10 3 [25, 44, 47]11–15 5 [26, 27, 36, 46, 50]>15 4 [21, 24, 48, 52]Total 44
aNon-inpatient.bNilsson [56] applied the GTT to patients who had died.cSuarez [68] both inpatient and outpatient.dHospital-based GTT studies only.
644 Hibbert et al.
Dow
nloaded from https://academ
ic.oup.com/intqhc/article/28/6/640/2607812 by guest on 18 Septem
ber 2022
associated with an AE. Our results are broadly consistent with state-ments in the GTT protocol [20] that organizations are finding 40AEs per 100 admissions and about 30–35% of all admissions arefound to have AEs.
The five-fold difference in AE rates using the GTT in generalinpatient studies highlights the challenges of collecting patient safetydata reliably. Three studies found similar or even greater variationsbetween institutions within their studies [24, 26, 35]. AEs which arepresent on admission also vary with the range being 18–40% infour studies [44, 46, 47, 64], while the GTT protocol [20] statesthat approximately 10% are present on admission. The GTT
protocol [20] and others [54, 63, 74] note that the AE rates shouldnot be compared between institutions due to variability in the meth-ods. Other methodological reasons cited for variations in AE ratesare listed in Table 4.
Identification of AEs is threshold-sensitive, especially at the mar-gin. This applies to the GTT [63] both within and between studiesand accords with previous between-study HM comparisons [79].The NCC MERP [34] Category E AEs (the lowest level of harm anddefined as ‘temporary harm to the patient and required interven-tion’) ‘involve more judgement and at times are not as obvious, sothese are less easily identified and may be missed’ [20]. There are,
Figure 3 Per cent of admissions with an AE by healthcare type.
Figure 2 Level of preventability by healthcare type.
645The application of the Global Trigger Tool • Quality Assessment
Dow
nloaded from https://academ
ic.oup.com/intqhc/article/28/6/640/2607812 by guest on 18 Septem
ber 2022

therefore, multiple reasons why results from studies using the GTTshould not be compared.
Various explanations have been proposed to explain why theGTT generally yields higher rates of AEs than the HM. Firstly, dueto the HM definition’s more restrictive threshold, minor AEs such aspain, small haematomas, and nausea and vomiting are more likelyto be included as an AE by the GTT. Secondly, the HM studies areolder and patients may have had a lower acuity [18]. However arelatively recent HM study collecting data in the Netherlands in2004 and 2008 found rates of 4.1% and 6.2%, respectively [80].
One study has tested the HM and the GTT in orthopaedicpatients using two different teams [57] and the same ‘combined’ def-inition. They found that HM identified more AEs with those asso-ciated with minimal levels of harm and particular types (mainlyurinary retention, infiltrated IV infusions, pressure ulcers andHospital Acquired Infections (HAIs)) were responsible for the differ-ences. The authors conclude that the main differences are probablyperceptual and that with implicit review, manuals cannot describeall conceivable AEs because situational and individual factors mustbe applied [57]. This study [57] and others [21, 51] also illustratethe flexibility of the GTT, such as being able to use a blended HM/GTT definition.
Our results show that incident reporting uncovers an average ofonly 4% (range: 2–8%) of the number of the AEs found using theGTT. This accords with statements in the GTT protocol [20] and a
study which found incident reports detected only 7% of thosedetected by the HM [81]. Patient-reported incidents in hospitals, col-lected via a standard national patient-experience survey, significantlycorrelated with patient harm rates based on the GTT [12]. Incidentreports may contain more detail on contributing and contextual fac-tors than MRR and may be more useful for developing preventiveand corrective strategies [82]. No gold standard for the detection ofAEs exists [26, 27, 35, 36, 40, 51, 55, 61, 68] so best practice is toinclude all available data sources as each method captures differenttypes of AEs [47, 49, 62]. The various methods should be viewed as‘complementary rather than interchangeable’ [47].
AEs associated with omission of care
Although the GTT definition of an AE is broader than that used inHM studies, it excludes ‘omissions of care’. The GTT protocol [20]uses the example that a patient not appropriately treated for hyper-tension, who subsequently experienced a stroke, would not havethis incident captured as an AE. The problems with this approachare the level of detail in the medical record for making a judgementas to whether omission and commission were involved, and theextent to which the outcome can be attributed to the ‘incident’. TheGTT frequently detects HAIs, but determining whether these arecommissions (applying a wound dressing that is not sterile) or omis-sions (not providing prophylactic antibiotics) may not be possiblefrom medical records. AEs associated with omissions are noted asan important source of learning for improvement [75], and shouldbe included.
Inter-rater reliability
Differences in IRR were observed for both finding triggers andAEs. IRRs ranged from little better than chance (0.34–0.40) toquite good (0.86–0.89). If an attempt to track changes within aninstitution is to be made, using experienced teams with at leastone constant team member [83] and consistent quality assurance[20], are to be emphasized. Quality assurance should include astructured protocol for review based on the structure of the med-ical record, regular team-based mock MRRs, discussion andcomparison of results, and ongoing monitoring and feedback[26, 61].
Preventability
We found nine different scales for measuring preventability andhigh variability between studies. Such differences have been notedpreviously [47, 54]. There are challenges associated with prevent-ability in assessing AEs using MRRs, particularly due to subjectivity[36, 47, 53, 55, 62, 75, 76]. Based on these limitations, Schildmeijer[54] recommends that preventability scores not be used. The GTTprotocol states that there should be no attempt to measure AE pre-ventability as those which are unpreventable are only an innovationaway from being preventable. The GTT protocol also argues that asthe GTT is meant to track changes over time, if the definition of AEsconstantly changes depending on what is deemed preventable, anymeasure over time would become meaningless [20]. On the otherhand, the level of preventability can be used with severity and fre-quency as criteria for setting priorities for improvement activitiesand learning [36, 46, 53]. The studies whose purpose was to meas-ure AE rates were indicating a preference to use a preventabilityscale. Kennerley [47] describes the ‘low hanging fruit’ of high pre-ventability as HAIs and pressure ulcers and Doupi [74] describes
Table 4 Methodological reasons for variations in AE rates
Methodological reasons for variations Reference number
Completeness of medical records (includingbetween wards)
[25, 31, 35, 38, 40,43, 58, 61, 72, 76]
Documentation layout and structure [35, 61, 72]Performance of teams changes over time [42, 55, 61, 63, 74,
76]Experienced teams (collecting 2–3 more AEs) [63, 77]Use of external or internal teams [74, 77]Differences in quality assurance activities (such as
training, review procedures and performingmock MRRs)
[55, 61, 67]
Inclusion criteria (such as greater than 3 daysadmission instead of the standard 1 day)
[47]
Definitional variations [21, 57, 67]AEs associated with omission of care [47]Use of different triggers [20]Differing interpretations by reviewers [26, 27, 54, 55, 58,
74, 78]Hindsight bias and between professions variation [61, 67]
Table 3 Per cent of total AEs by category
Referencenumber
[64] [61] [18] [47] [68] [72] [70] [44] [71] [48]
Infection 44 24 18 13 13 19 14 15 17 –
Surgical/procedural
23 14 28 41 10 27 47 32 20 –
Medication 12 8 38 26 51 15 20 28 15 23Pressure ulcer 8 11 3 2 2 2 8 6 2 5Fall 1 5 1 1 0 – 4 1 1 –
Other 12 38 12 17 24 37 7 18 45 72
‘–’ Category not reported by the referenced study.
646 Hibbert et al.
Dow
nloaded from https://academ
ic.oup.com/intqhc/article/28/6/640/2607812 by guest on 18 Septem
ber 2022

several studies using preventability as a process for learning. If thelevel of preventability is to be collected, it should not be used as anAE inclusion criterion or to make comparisons or progress, but sim-ply as an aid to priority setting.
Classification
Over half of the GTT studies, and three-quarters of the AE measure-ment studies, include an incident type classification although the useof one is not explicitly recommended in the GTT protocol.Identification of clusters of like-incidents is a prerequisite for the-matic analysis with respect to common features which may point toremedial strategies. This underlies the utility of a universal classifica-tion system [82], such as the International Classification for PatientSafety (ICPS) [73].
GTT purpose—measurement and learning
If a hospital reviewed 20 records per month as per the GTT proto-col, and assuming an AE rate of 30%, 6 AEs would be detected permonth. Based on the findings in Table 3, these would typically com-prise two HAIs, two surgical AEs, one medication and one ‘other’.Such use of a broad heterogeneous measure such as AE rates totrack progress over time has justifiably been called into question asany changes that may have occurred due to an intervention in onearea (e.g. falls) may be negated or even reversed by changes inanother (e.g. medications) [84]. Table 3 over-simplifies the situationas hundreds of types of safety problems at hospital level have beenpreviously described using the HM [85] and up to 72 categoriesusing the GTT [44].
Given these limitations, the purpose of the GTT should be re-framed as an opportunity to detect AEs, raise awareness of theselocally [47] and to characterize the most frequent types of AEs [46, 56]for prioritization for quality improvement. Two of the five casestudies (‘Stories from Experienced Organisations’) in the GTT proto-col [20] use a classification system to prioritize those incident typesfor action (Florida and OSF Healthcare System). There is immensevalue in characterizing the nature of the AEs as this information canhelp direct limited quality improvement resources towards AEs thatmight be more likely to have care processes that could be productiv-ity redesigned [46].
Conclusion
The GTT is a flexible tool which is being used in a variety of waysacross a range of healthcare domains and specialties. Incident typeclassifications and preventability scales are frequently being used instudies aiming to measure an organization’s AE rate.
The GTT yields rates of admissions with AEs for general inpati-ents of 7–40%. HAIs, surgical/procedural problems and medicationincidents are the most commonly detected AEs. This substantialvariability in the rates of AEs detected, even within institutions, pre-cludes comparisons between studies. These are thought to be duemainly to methodological variations and differences in the mindsetsand experiences of reviewers. The main advantages of using theGTT regularly are to characterize the most frequent types of AEs forprioritization for quality improvement and to increase the mindful-ness of healthcare professionals with respect to patient safety byregularly drawing attention to the fact that every one in three orfour patients is likely to suffer harm.
Changes that could be considered for new versions of the GTTare including ‘omission’ AEs and concentrating on understanding
and characterizing events rather than counting them. We advocatethe consistent use of a comprehensive classification, such as theICPS, so that clusters of like events can be extracted for systematicstudy in order to develop preventive and corrective strategies. Anestimate of preventability could also be used but only as an add-itional criterion in priority setting.
Supplementary material
Supplementary material is available at INTQHC Journal online.
Funding
This work is supported by National Health and Medical Research Council(NHMRC) Partnership Grant [APP1065898]. It is led by the AustralianInstitute of Health Innovation, Macquarie University. The partners in theresearch are BUPA Health Foundation Australia (senior partner), SydneyChildren’s Hospitals Network, NSW Kids and Families, Children’s HealthQueensland, the South Australian Department of Health, the University ofSouth Australia (UniSA) and the NSW Clinical Excellence Commission.
References
1. Donaldson LJ. An organisation with a memory: report of an expert work-ing group on learning from adverse events in the NHS. Crown,Department of Health, 2000.
2. Committee on Quality of Health Care in America IoM To err is human.In: Building a Safer Health System. Washington, DC: Institute ofMedicine, 2000.
3. Runciman W, Moller J. Iatrogenic Injury in Australia. Australian PatientSafety Foundation, Adelaide, Australia, 2001.
4. Wilson RM, Runciman WB, Gibberd RW et al. The quality in Australianhealth care study. Med J Aust 1995;163:458–71.
5. Leape LL, Brennan TA, Laird N et al. The nature of adverse events inhospitalized patients. Results of the Harvard Medical Practice Study II. NEngl J Med 1991;324:377–84.
6. Brennan TA, Leape LL, Laird NM et al. Incidence of adverse events andnegligence in hospitalized patients. Results of the Harvard MedicalPractice Study I. N Engl J Med 1991;324:370–6.
7. Montserrat-Capella D, Suárez M, Ortiz L et al. Frequency of ambulatorycare adverse events in Latin American countries: the AMBEAS/PAHOcohort study. Int J Qual Health Care 2015;27:52–9.
8. Donaldson LJ, Sukhmeet SP, Darzi A. Patient-safety-related hospitaldeaths in England: thematic analysis of incidents reported to a Nationaldatabase 2010–2012. PLoS Med 2014;11:e1001667.
9. Rees P, Edwards A, Panesar S et al. Safety incidents in the primary careoffice setting. Pediatrics 2015;135:1027–35.
10. Catchpole K, Mishra A, Handa A et al. Teamwork and error in the oper-ating room: analysis of skills and roles. Ann Surg 2008;247:699–706.
11. Westbrook JI, Woods A, Rob MI et al. Association of interruptions withan increased risk and severity of medication administration errors. ArchIntern Med 2010;170:683–90.
12. Bjertnaes O, Deilkås ET, Skudal KE et al. The association betweenpatient-reported incidents in hospitals and estimated rates of patientharm. Int J Qual Health Care 2015;27:26–30.
13. Power M, Fogarty M, Madsen J et al. Learning from the design anddevelopment of the NHS safety thermometer. Int J Qual Health Care2014;26:287–97.
14. Muething SE, Conway PH, Kloppenborg E et al. Identifying causes ofadverse events detected by an automated trigger tool through in-depthanalysis. Qual Saf Health Care 2010;19:435–9.
15. Michel P. Strengths and Weaknesses of Available Methods for Assessingthe Nature and Scale of Harm Caused by the Health System: LiteratureReview. Geneva: World Health Organisation, 2003.
647The application of the Global Trigger Tool • Quality Assessment
Dow
nloaded from https://academ
ic.oup.com/intqhc/article/28/6/640/2607812 by guest on 18 Septem
ber 2022

16. Davis P, Lay-Yee R, Briant R et al. Adverse Events in New Zealand
Public Hospitals: Principal Findings from a National Survey. Wellington:Ministry of Health, 2011.
17. Baker GR, Norton PG, Flintoft V et al. The Canadian adverse eventsstudy: the incidence of adverse events among hospital patients in Canada.Can Med Assoc J 2004;170:1678–86.
18. Classen DC, Resar R, Griffin F et al. ’Global trigger tool’ shows thatadverse events in hospitals may be ten times greater than previously mea-sured. Health Aff (Millwood) 2011;30:581–9.
19. Resar RK, Rozich JD, Classen D. Methodology and rationale for themeasurement of harm with trigger tools. Qual Saf Health Care 2003;12:ii39–45.
20. Griffin FA, Resar RK. IHI Global Trigger Tool for Measuring Adverse
Events, 2nd edn. Cambridge, MA: Institute for Healthcare Improvement,2009.
21. Matlow AG, Baker GR, Flintoft V et al. Adverse events among childrenin Canadian hospitals: the Canadian Paediatric Adverse Events Study.Can Med Assoc J 2012;184:30.
22. Kirkendall ES, Kloppenborg E, Papp J et al. Measuring adverse eventsand levels of harm in pediatric inpatients with the Global Trigger Tool.Pediatrics 2012;130:e1206–14.
23. Solevag AL, Nakstad B. Utility of a Paediatric Trigger Tool in aNorwegian department of paediatric and adolescent medicine. BMJ Open2014;4:e005011.
24. Chapman SM, Fitzsimons J, Davey N et al. Prevalence and severity ofpatient harm in a sample of UK-hospitalised children detected by thePaediatric Trigger Tool. BMJ Open 2014;4:e005066.
25. Matlow AG, Cronin CMG, Flintoft V et al. Description of the develop-ment and validation of the Canadian Paediatric Trigger Tool. BMJ Qual
Saf 2011;20:416–23.26. Sharek PJ, Horbar JD, Mason W et al. Adverse events in the neonatal
intensive care unit: development, testing, and findings of an NICU-focused trigger tool to identify harm in North American NICUs.Pediatrics 2006;118:1332–40.
27. Agarwal S, Classen D, Larsen G et al. Prevalence of adverse events inpediatric intensive care units in the United States. Pediatr Crit Care Med
2010;11:568–78.28. Lander L, Roberson DW, Plummer KM et al. A trigger tool fails to iden-
tify serious errors and adverse events in pediatric otolaryngology.Otolaryngol Head Neck Surg 2010;143:480–6.
29. NHS Institute for Innovation and Improvement. Primary Care TriggerTool—Introduction: NHS; 2013. http://www.institute.nhs.uk/safer_care/primary_care_2/introductiontoprimarycaretriggertool.html.
30. 1000 Lives. Tools for Improvement: How to Use Trigger Tools. TheHealth Foundation, 2010.
31. de Wet C, Bowie P. The preliminary development and testing of a globaltrigger tool to detect error and patient harm in primary-care records.Postgrad Med J 2009;85:176–80.
32. Moher D, Liberati A, Tetzlaff J et al. Preferred reporting items for system-atic reviews and meta-analyses: the PRISMA statement. Br Med J 2009;339:b2535.
33. Govindan M, Van Citters AD, Nelson EC et al. Automated detection ofharm in healthcare with information technology: a systematic review.Qual Saf Health Care 2010;19:e11.
34. National Coordination Council for Medication Error Reporting andPrevention. NCC MERP Index for Categorizing Medication Errors 2001.
35. Singh R, McLean-Plunckett EA, Kee R et al. Experience with a triggertool for identifying adverse drug events among older adults in ambulatoryprimary care. Qual Saf Health Care 2009;18:199–204.
36. Takata GS, Mason W, Taketomo C et al. Development, testing, and find-ings of a pediatric-focused trigger tool to identify medication-relatedharm in US children’s hospitals. Pediatrics 2008;121:e927–35.
37. Burch KJ. Using a trigger tool to assess adverse drug events in a children’srehabilitation hospital. J Paediatr Pharmacol Ther 2011;16:204–9.
38. Klopotowska JE, Wierenga PC, Smorenburg SM et al. Recognition ofadverse drug events in older hospitalized medical patients. Eur J ClinPharmacol 2013;69:75–85.
39. Franklin BD, Birtch S, Schachter M et al. Testing a trigger tool as a meth-od of detecting harm from medication errors in a UK hospital: a pilotstudy. Int J Pharm Pract 2010;18:305–11.
40. De Boer M, Kiewiet JJS, Boeker EB et al. A targeted method for standar-dized assessment of adverse drug events in surgical patients. J Eval ClinPract 2013;19:1073–82.
41. Harkanen M, Kervinen M, Ahonen J et al. Patient-specific risk factors ofadverse drug events in adult inpatients—evidence detected using theGlobal Trigger Tool method. J Clin Nurs 2015;24:582–91.
42. Zolezzi M, Forbes A, Parsotam N et al. Investigation of trigger tools fordetecting adverse drug reactions. J Pharm Pract Res 2007;37:225–7.
43. Carnevali L, Krug B, Amant F et al. Performance of the adverse drug eventtrigger tool and the global trigger tool for identifying adverse drug events:experience in a Belgian hospital. Ann Pharmacother 2013;47:1414–9.
44. Landrigan CP, Parry GJ, Bones CB et al. Temporal trends in rates ofpatient harm resulting from medical care. N Engl J Med 2010;363:2124–34.
45. Naessens JM, O’Byrne TJ, Johnson MG et al. Measuring hospital adverseevents: assessing inter-rater reliability and trigger performance of theGlobal Trigger Tool. Int J Qual Health Care 2010;22:266–74.
46. Good VS, Saldana M, Gilder R et al. Large-scale deployment of theGlobal Trigger Tool across a large hospital system: refinements for thecharacterisation of adverse events to support patient safety learningopportunities. BMJ Qual Saf 2011;20:25–30.
47. Kennerly DA, Kudyakov R, da Graca B et al. Characterization of adverseevents detected in a large health care delivery system using an enhancedGlobal Trigger Tool over a five-year interval. Health Serv Res 2013;49:1407–25.
48. Garrett PR Jr, Sammer C, Nelson A, Paisley KA et al. Developing andimplementing a standardized process for global trigger tool applicationacross a large health system. Jt Comm J Qual Patient Saf 2013;39:292–7.
49. Naessens JM, Campbell CR, Huddleston JM et al. A comparison of hos-pital adverse events identified by three widely used detection methods. IntJ Qual Health Care 2009;21:301–7.
50. Griffin FA, Classen DC. Detection of adverse events in surgical patientsusing the Trigger Tool approach. Qual Saf Health Care 2008;17:253–8.
51. O’Leary KJ, Devisetty VK, Patel AR et al. Comparison of traditional trig-ger tool to data warehouse based screening for identifying hospitaladverse events. BMJ Qual Saf 2013;22:130–8.
52. Resar RK, Rozich JD, Simmonds T et al. A trigger tool to identify adverseevents in the intensive care unit. Jt Comm J Qual Patient Saf 2006;32:585–90.
53. Larsen G, Donaldson A, Parker H et al. Preventable harm occurring tocritically ill children. Pediatr Crit Care Med 2007;8:331–6.
54. Schildmeijer K, Nilsson L, Arestedt K et al. Assessment of adverse eventsin medical care: lack of consistency between experienced teams using theglobal trigger tool. BMJ Qual Saf 2012;21:307–14.
55. Unbeck M, Lindemalm S, Nydert P et al. Validation triggers and develop-ment of a pediatric trigger tool to identify adverse events. BMC HealthServ Res 2014;14:655.
56. Nilsson L, Pihl A, Tågsjõ M et al. Adverse events are common on theintensive care unit: results from a structured record review. ActaAnaesthesiol Scand 2012;56:959–65.
57. Unbeck M, Schildmeijer K, Henriksson P et al. Is detection of adverseevents affected by record review methodology? an evaluation of the‘Harvard Medical Practice Study’ method and the ‘Global Trigger Tool’.Patient Saf Surg 2013;7:10.
58. Garry DA, McKechnie SR, Culliford DJ et al. A prospective multicentreobservational study of adverse iatrogenic events and substandard carepreceding intensive care unit admission (PREVENT). Anaesthesia 2014;69:137–42.
59. Cihangir S, Borghans I, Hekkert K et al. A pilot study on record review-ing with a priori patient selection. BMJ Open 2013;3:e003034.
60. Zimmerman R, Pierson S, McLean R et al. Aiming for zero preventabledeaths: using death review to improve care and reduce harm. Healthc Q2010;13: Spec No. 81–7.
648 Hibbert et al.
Dow
nloaded from https://academ
ic.oup.com/intqhc/article/28/6/640/2607812 by guest on 18 Septem
ber 2022

61. Von Plessen C, Kodal AM, Anhoj J. Experiences with global trigger toolreviews in five Danish hospitals: an implementation study. BMJ Open2012;2:e001324.
62. Lipczak H, Knudsen JL, Nissen A. Safety hazards in cancer care: findingsusing three different methods. BMJ Qual Saf 2011;20:1052–6.
63. Mattsson TO, Knudsen JL, Lauritsen J et al. Assessment of the globaltrigger tool to measure, monitor and evaluate patient safety in cancerpatients: reliability concerns are raised. BMJ Qual Saf 2013;22:571–9.
64. Rutberg H, Risberg MB, Sjödahl R et al. Characterisations of adverseevents detected in a university hospital: a 4 year study using the GlobalTrigger Tool method. BMJ Open 2014;4:e004879.
65. Hibbert P, Williams H. The use of a glober trigger tool to inform qualityand safety in Australian general practice: a pilot study. Aust FamPhysician 2014;43:723–6.
66. Hooper AJ, Tibballs J. Comparison of a Trigger Tool and voluntaryreporting to identify adverse events in a paediatric intensive care unit.Anaesth Intensive Care 2014;42:199–206.
67. Eggleton KS, Dovey SM. Using triggers in primary care patient records toflag increased adverse events risk and mesaure patient safety at cliniclevel. N Z Med J 2014;127:45–52.
68. Suarez C, Menendez MD, Alonso J et al. Detection of adverse events inan acute geriatric hospital over a 6-year period using the global triggertool. J Am Geriatr Soc 2014;62:896–900.
69. Perez Zapata AI, Gutierrez Samaniego M, Rodriguez Cuellar E et al.Detection of adverse events in general surgery using the ‘Trigger Tool’methodology. Cir Esp 2015;93:84–90.
70. Hwang J, Chin HJ, Chang Y. Characteristics associated with the occur-rence of adverse events: a retrospective medical record review using theGlobal Trigger Tool in a fully digitalized tertiary teaching hospital inKorea. J Eval Clin Pract 2014;20:27–35.
71. Asavaroengchai S, Sriratanaban J, Hiransuthikul N et al. Identifyingadverse events in hospitalized patients using Global Trigger Tool inThailand. Asian. Biomedicine 2009;3:545–50.
72. Najjar S, Hamdan M, Euwema MC et al. The Global Trigger Tool showsthat one out of seven patients suffers harm in Palestinian hospitals: chal-lenges for launching a strategic safety plan. Int J Qual Health Care 2013;25:640–7.
73. Runciman W, Hibbert P, Thomson R et al. Towards an internationalclassification for patient safety: key concepts and terms. Int J Qual HealthCare 2009;21:18–26.
74. Doupi P, Svaar H, Bjørn B, et al. Use of the Global Trigger Tool inpatient safety improvement efforts: Nordic experiences. Cogn TechnolWork 2015;17:45–54
75. de Vries EN, Ramrattan MA, Smorenburg SM et al. The incidence andnature of in-hospital adverse events: a systematic review. Qual Saf Health
Care 2008;17:216–23.76. Schildmeijer K, Nilsson L, Perk J et al. Strengths and weaknesses of work-
ing with the Global Trigger Tool method for retrospective record review:focus group interviews with team members. BMJ Open 2013;3:e003131.
77. Sharek PJ, Parry G, Goldmann D et al. Performance characteristics of amethodology to quantify adverse events over time in hospitalized patients.Health Serv Res 2011;46:654–78.
78. Lilford R, Edwards A, Girling A et al. Inter-rater reliabilty of case-noteaudit: a systematic review. J Health Serv Res Policy 2007;12:173–80.
79. Runciman WB, Webb RK, Helps SC et al. A comparison of iatrogenicinjury studies in Australia and the USA II: reviewer behaviour and qualityof care. Int J Qual Health Care 2000;12:379–88.
80. Baines RJ, Langelaan M, De Bruijne MC et al. Changes in adverse eventrates in hospitals over time: a longitudinal retrospective patient recordreview study. BMJ Qual Saf 2013;22:290–8.
81. Sari ABA, Sheldon TA, Cracknell A et al. Sensitivity of routine system forreporting patient safety incidents in an NHS hospital: retrospectivepatient case note review. Br Med J 2007;334:79.
82. Runciman WB, Williamson JAH, Deakin A et al. An integrated frame-work for safety, quality and risk management: an information and inci-dent management system based on a universal patient safetyclassification. Qual Saf Health Care 2006;15:i82–90.
83. Mevik K, Griffin FA, Hansen TE et al. Is inter-rater reliability of GlobalTrigger Tool results altered when members of the review team arereplaced? Int J Qual Health Care 2016.
84. Shojania KG, Marang-van de Mheen PJ. Temporal trends in patientsafety in the Netherlands: reductions in preventable adverse events or theend of adverse events as a useful metric? BMJ Qual Saf 2015;24:541–4.
85. Runciman WB, Edmonds MJ, Pradhan M. Setting priorities for patientsafety. Qual Saf Health Care 2002;11:224–9.
649The application of the Global Trigger Tool • Quality Assessment
Dow
nloaded from https://academ
ic.oup.com/intqhc/article/28/6/640/2607812 by guest on 18 Septem
ber 2022