Predictive Power of the "Trigger Tool" for the detection of ...
10
Pérez Zapata et al. Patient Safety in Surgery (2022) 16:7 https://doi.org/10.1186/s13037-021-00316-3 RESEARCH Predictive Power of the "Trigger Tool" for the detection of adverse events in general surgery: a multicenter observational validation study Ana Isabel Pérez Zapata 1* , Elías Rodríguez Cuéllar 1 , Marta de la Fuente Bartolomé 2 , Cristina Martín‑Arriscado Arroba 3 , María Teresa García Morales 3 , Carmelo Loinaz Segurola 1 , Manuel Giner Nogueras 4 , Ángel Tejido Sánchez 5 , Pedro Ruiz López 1 , Eduardo Ferrero Herrero 1 and The Research Collaboration Group Abstract Background: In spite of the global implementation of standardized surgical safety checklists and evidence‑based practices, general surgery remains associated with a high residual risk of preventable perioperative complications and adverse events. This study was designed to validate the hypothesis that a new “Trigger Tool” represents a sensitive predictor of adverse events in general surgery. Methods: An observational multicenter validation study was performed among 31 hospitals in Spain. The previ‑ ously described “Trigger Tool” based on 40 specific triggers was applied to validate the predictive power of predict‑ ing adverse events in the perioperative care of surgical patients. A prediction model was used by means of a binary logistic regression analysis. Results: The prevalence of adverse events among a total of 1,132 surgical cases included in this study was 31.53%. The “Trigger Tool” had a sensitivity and specificity of 86.27% and 79.55% respectively for predicting these adverse events. A total of 12 selected triggers of overall 40 triggers were identified for optimizing the predictive power of the “Trigger Tool”. Conclusions: The “Trigger Tool” has a high predictive capacity for predicting adverse events in surgical procedures. We recommend a revision of the original 40 triggers to 12 selected triggers to optimize the predictive power of this tool, which will have to be validated in future studies. Keywords: Adverse event, General surgery, “Trigger Tool” © The Author(s) 2022. Open Access This article is licensed under a Creative Commons Attribution 4.0 International License, which permits use, sharing, adaptation, distribution and reproduction in any medium or format, as long as you give appropriate credit to the original author(s) and the source, provide a link to the Creative Commons licence, and indicate if changes were made. The images or other third party material in this article are included in the article’s Creative Commons licence, unless indicated otherwise in a credit line to the material. If material is not included in the article’s Creative Commons licence and your intended use is not permitted by statutory regulation or exceeds the permitted use, you will need to obtain permission directly from the copyright holder. To view a copy of this licence, visit http://creativecommons.org/licenses/by/4.0/. The Creative Commons Public Domain Dedication waiver (http://creativeco mmons.org/publicdomain/zero/1.0/) applies to the data made available in this article, unless otherwise stated in a credit line to the data. Background Identification of adverse events is relevant for patient safety. e overall rate of adverse events during hospitalization varies from 3% to 17%, of which approxi- mately 50% are deemed preventable [1–3]. Adverse events entail a clinical impact and an increase in resources [4]. e most expensive are surgical, those related to medication and diagnostic delay [5, 6]. Surgical units are the areas with the highest frequency of adverse events [7]. ey are related to 1.9% to 3.6% of adverse events in patients admitted to hospital, which Open Access *Correspondence: [email protected] 1 General and Gastrointestinal Department at 12 de Octubre University Hospital, Avda Córdoba sn, 28041 Madrid, Spain Full list of author information is available at the end of the article
-
Upload
khangminh22 -
Category
Documents
-
view
3 -
download
0
Transcript of Predictive Power of the "Trigger Tool" for the detection of ...
Pérez Zapata et al. Patient Safety in Surgery (2022) 16:7 https://doi.org/10.1186/s13037-021-00316-3
RESEARCH
Predictive Power of the "Trigger Tool" for the detection of adverse events in general surgery: a multicenter observational validation studyAna Isabel Pérez Zapata1*, Elías Rodríguez Cuéllar1, Marta de la Fuente Bartolomé2, Cristina Martín‑Arriscado Arroba3, María Teresa García Morales3, Carmelo Loinaz Segurola1, Manuel Giner Nogueras4, Ángel Tejido Sánchez5, Pedro Ruiz López1, Eduardo Ferrero Herrero1 and The Research Collaboration Group
Abstract
Background: In spite of the global implementation of standardized surgical safety checklists and evidence‑based practices, general surgery remains associated with a high residual risk of preventable perioperative complications and adverse events. This study was designed to validate the hypothesis that a new “Trigger Tool” represents a sensitive predictor of adverse events in general surgery.
Methods: An observational multicenter validation study was performed among 31 hospitals in Spain. The previ‑ously described “Trigger Tool” based on 40 specific triggers was applied to validate the predictive power of predict‑ing adverse events in the perioperative care of surgical patients. A prediction model was used by means of a binary logistic regression analysis.
Results: The prevalence of adverse events among a total of 1,132 surgical cases included in this study was 31.53%. The “Trigger Tool” had a sensitivity and specificity of 86.27% and 79.55% respectively for predicting these adverse events. A total of 12 selected triggers of overall 40 triggers were identified for optimizing the predictive power of the “Trigger Tool”.
Conclusions: The “Trigger Tool” has a high predictive capacity for predicting adverse events in surgical procedures. We recommend a revision of the original 40 triggers to 12 selected triggers to optimize the predictive power of this tool, which will have to be validated in future studies.
Keywords: Adverse event, General surgery, “Trigger Tool”
© The Author(s) 2022. Open Access This article is licensed under a Creative Commons Attribution 4.0 International License, which permits use, sharing, adaptation, distribution and reproduction in any medium or format, as long as you give appropriate credit to the original author(s) and the source, provide a link to the Creative Commons licence, and indicate if changes were made. The images or other third party material in this article are included in the article’s Creative Commons licence, unless indicated otherwise in a credit line to the material. If material is not included in the article’s Creative Commons licence and your intended use is not permitted by statutory regulation or exceeds the permitted use, you will need to obtain permission directly from the copyright holder. To view a copy of this licence, visit http:// creat iveco mmons. org/ licen ses/ by/4. 0/. The Creative Commons Public Domain Dedication waiver (http:// creat iveco mmons. org/ publi cdoma in/ zero/1. 0/) applies to the data made available in this article, unless otherwise stated in a credit line to the data.
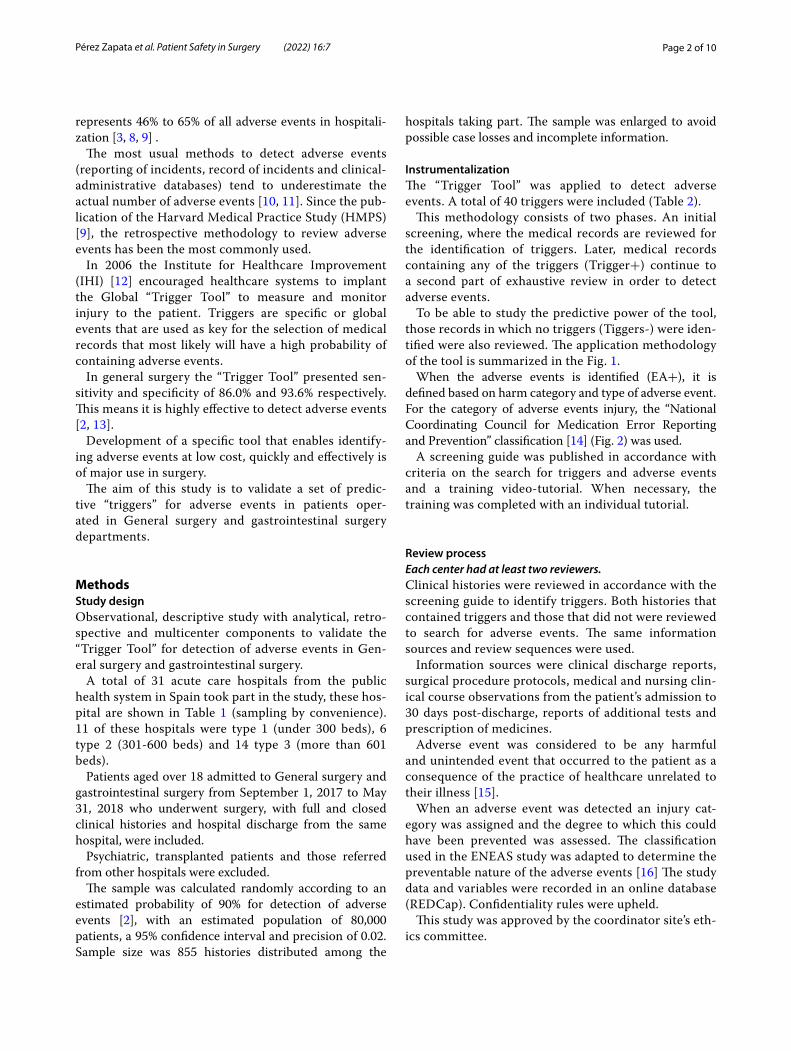
BackgroundIdentification of adverse events is relevant for patient safety. The overall rate of adverse events during
hospitalization varies from 3% to 17%, of which approxi-mately 50% are deemed preventable [1–3].
Adverse events entail a clinical impact and an increase in resources [4]. The most expensive are surgical, those related to medication and diagnostic delay [5, 6].
Surgical units are the areas with the highest frequency of adverse events [7]. They are related to 1.9% to 3.6% of adverse events in patients admitted to hospital, which
Open Access
*Correspondence: [email protected] General and Gastrointestinal Department at 12 de Octubre University Hospital, Avda Córdoba sn, 28041 Madrid, SpainFull list of author information is available at the end of the article
Page 2 of 10Pérez Zapata et al. Patient Safety in Surgery (2022) 16:7
represents 46% to 65% of all adverse events in hospitali-zation [3, 8, 9] .
The most usual methods to detect adverse events (reporting of incidents, record of incidents and clinical-administrative databases) tend to underestimate the actual number of adverse events [10, 11]. Since the pub-lication of the Harvard Medical Practice Study (HMPS) [9], the retrospective methodology to review adverse events has been the most commonly used.
In 2006 the Institute for Healthcare Improvement (IHI) [12] encouraged healthcare systems to implant the Global “Trigger Tool” to measure and monitor injury to the patient. Triggers are specific or global events that are used as key for the selection of medical records that most likely will have a high probability of containing adverse events.
In general surgery the “Trigger Tool” presented sen-sitivity and specificity of 86.0% and 93.6% respectively. This means it is highly effective to detect adverse events [2, 13].
Development of a specific tool that enables identify-ing adverse events at low cost, quickly and effectively is of major use in surgery.
The aim of this study is to validate a set of predic-tive “triggers” for adverse events in patients oper-ated in General surgery and gastrointestinal surgery departments.
MethodsStudy designObservational, descriptive study with analytical, retro-spective and multicenter components to validate the “Trigger Tool” for detection of adverse events in Gen-eral surgery and gastrointestinal surgery.
A total of 31 acute care hospitals from the public health system in Spain took part in the study, these hos-pital are shown in Table 1 (sampling by convenience). 11 of these hospitals were type 1 (under 300 beds), 6 type 2 (301-600 beds) and 14 type 3 (more than 601 beds).
Patients aged over 18 admitted to General surgery and gastrointestinal surgery from September 1, 2017 to May 31, 2018 who underwent surgery, with full and closed clinical histories and hospital discharge from the same hospital, were included.
Psychiatric, transplanted patients and those referred from other hospitals were excluded.
The sample was calculated randomly according to an estimated probability of 90% for detection of adverse events [2], with an estimated population of 80,000 patients, a 95% confidence interval and precision of 0.02. Sample size was 855 histories distributed among the
hospitals taking part. The sample was enlarged to avoid possible case losses and incomplete information.
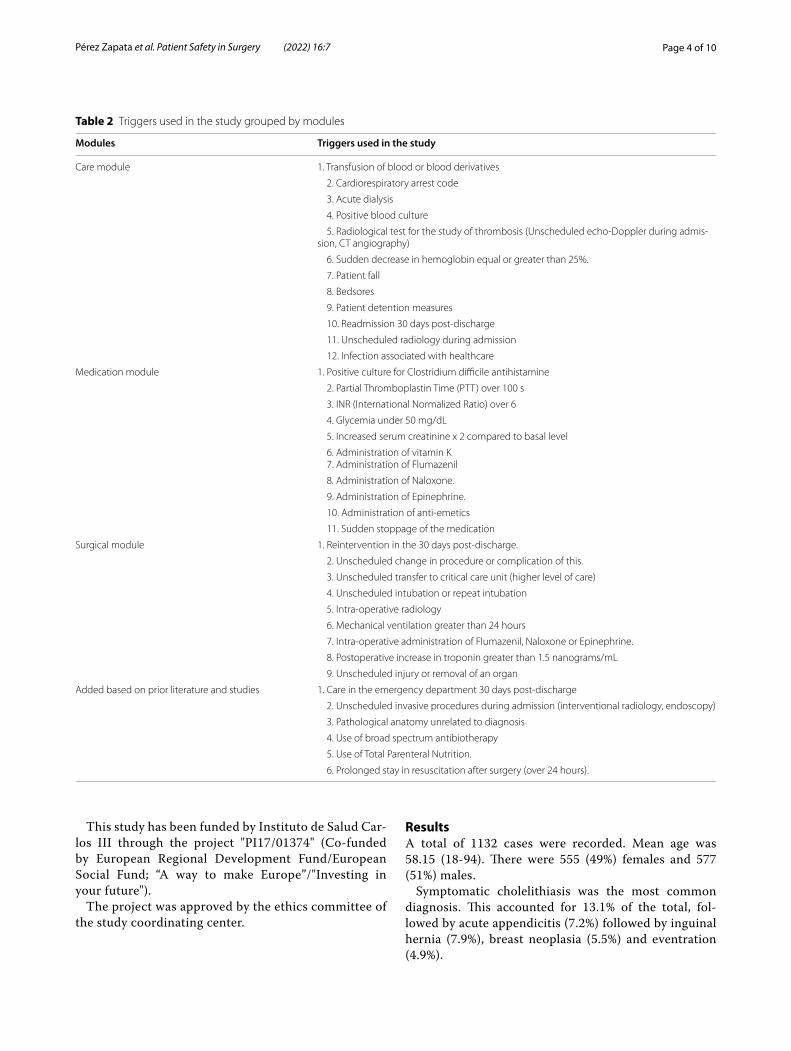
InstrumentalizationThe “Trigger Tool” was applied to detect adverse events. A total of 40 triggers were included (Table 2).
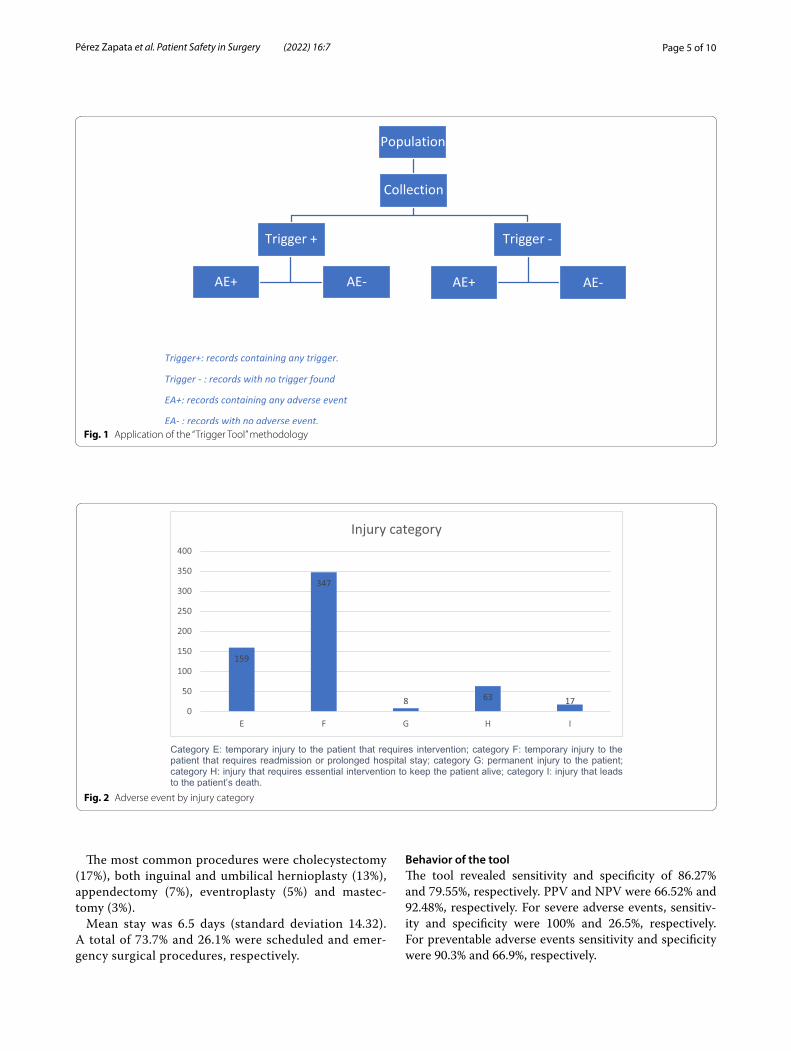
This methodology consists of two phases. An initial screening, where the medical records are reviewed for the identification of triggers. Later, medical records containing any of the triggers (Trigger+) continue to a second part of exhaustive review in order to detect adverse events.
To be able to study the predictive power of the tool, those records in which no triggers (Tiggers-) were iden-tified were also reviewed. The application methodology of the tool is summarized in the Fig. 1.
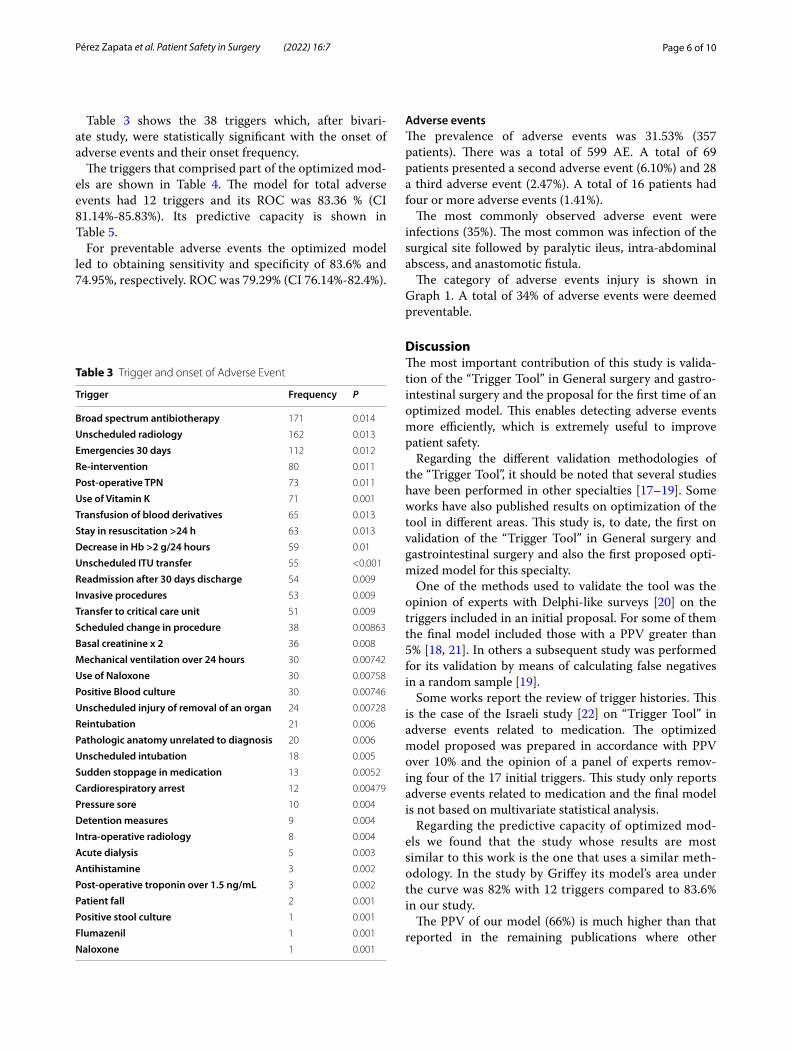
When the adverse events is identified (EA+), it is defined based on harm category and type of adverse event. For the category of adverse events injury, the “National Coordinating Council for Medication Error Reporting and Prevention” classification [14] (Fig. 2) was used.
A screening guide was published in accordance with criteria on the search for triggers and adverse events and a training video-tutorial. When necessary, the training was completed with an individual tutorial.
Review processEach center had at least two reviewers.Clinical histories were reviewed in accordance with the screening guide to identify triggers. Both histories that contained triggers and those that did not were reviewed to search for adverse events. The same information sources and review sequences were used.
Information sources were clinical discharge reports, surgical procedure protocols, medical and nursing clin-ical course observations from the patient’s admission to 30 days post-discharge, reports of additional tests and prescription of medicines.
Adverse event was considered to be any harmful and unintended event that occurred to the patient as a consequence of the practice of healthcare unrelated to their illness [15].
When an adverse event was detected an injury cat-egory was assigned and the degree to which this could have been prevented was assessed. The classification used in the ENEAS study was adapted to determine the preventable nature of the adverse events [16] The study data and variables were recorded in an online database (REDCap). Confidentiality rules were upheld.
This study was approved by the coordinator site’s eth-ics committee.
Page 3 of 10Pérez Zapata et al. Patient Safety in Surgery (2022) 16:7
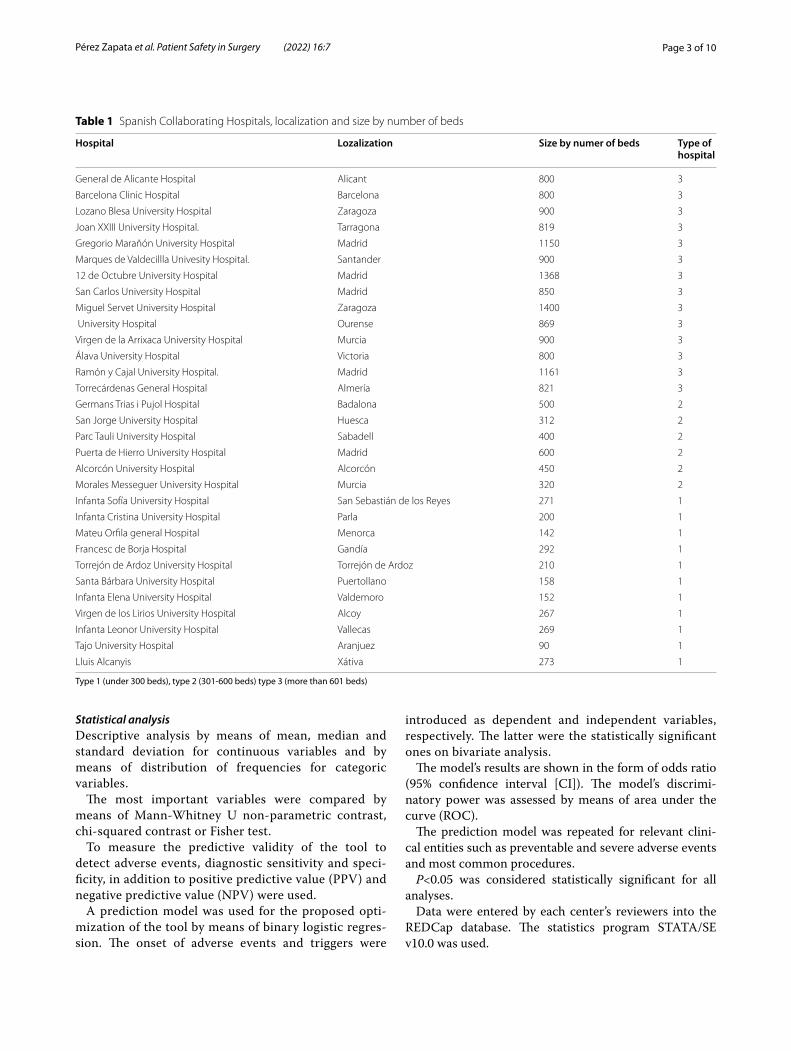
Statistical analysisDescriptive analysis by means of mean, median and standard deviation for continuous variables and by means of distribution of frequencies for categoric variables.
The most important variables were compared by means of Mann-Whitney U non-parametric contrast, chi-squared contrast or Fisher test.
To measure the predictive validity of the tool to detect adverse events, diagnostic sensitivity and speci-ficity, in addition to positive predictive value (PPV) and negative predictive value (NPV) were used.
A prediction model was used for the proposed opti-mization of the tool by means of binary logistic regres-sion. The onset of adverse events and triggers were
introduced as dependent and independent variables, respectively. The latter were the statistically significant ones on bivariate analysis.
The model’s results are shown in the form of odds ratio (95% confidence interval [CI]). The model’s discrimi-natory power was assessed by means of area under the curve (ROC).
The prediction model was repeated for relevant clini-cal entities such as preventable and severe adverse events and most common procedures.P<0.05 was considered statistically significant for all
analyses.Data were entered by each center’s reviewers into the
REDCap database. The statistics program STATA/SE v10.0 was used.
Table 1 Spanish Collaborating Hospitals, localization and size by number of beds
Type 1 (under 300 beds), type 2 (301-600 beds) type 3 (more than 601 beds)
Hospital Lozalization Size by numer of beds Type of hospital
General de Alicante Hospital Alicant 800 3
Barcelona Clinic Hospital Barcelona 800 3
Lozano Blesa University Hospital Zaragoza 900 3
Joan XXIII University Hospital. Tarragona 819 3
Gregorio Marañón University Hospital Madrid 1150 3
Marques de Valdecillla Univesity Hospital. Santander 900 3
12 de Octubre University Hospital Madrid 1368 3
San Carlos University Hospital Madrid 850 3
Miguel Servet University Hospital Zaragoza 1400 3
University Hospital Ourense 869 3
Virgen de la Arrixaca University Hospital Murcia 900 3
Álava University Hospital Victoria 800 3
Ramón y Cajal University Hospital. Madrid 1161 3
Torrecárdenas General Hospital Almería 821 3
Germans Trias i Pujol Hospital Badalona 500 2
San Jorge University Hospital Huesca 312 2
Parc Tauli University Hospital Sabadell 400 2
Puerta de Hierro University Hospital Madrid 600 2
Alcorcón University Hospital Alcorcón 450 2
Morales Messeguer University Hospital Murcia 320 2
Infanta Sofía University Hospital San Sebastián de los Reyes 271 1
Infanta Cristina University Hospital Parla 200 1
Mateu Orfila general Hospital Menorca 142 1
Francesc de Borja Hospital Gandía 292 1
Torrejón de Ardoz University Hospital Torrejón de Ardoz 210 1
Santa Bárbara University Hospital Puertollano 158 1
Infanta Elena University Hospital Valdemoro 152 1
Virgen de los Lirios University Hospital Alcoy 267 1
Infanta Leonor University Hospital Vallecas 269 1
Tajo University Hospital Aranjuez 90 1
Lluis Alcanyis Xátiva 273 1
Page 4 of 10Pérez Zapata et al. Patient Safety in Surgery (2022) 16:7
This study has been funded by Instituto de Salud Car-los III through the project "PI17/01374" (Co-funded by European Regional Development Fund/European Social Fund; “A way to make Europe”/"Investing in your future").
The project was approved by the ethics committee of the study coordinating center.
ResultsA total of 1132 cases were recorded. Mean age was 58.15 (18-94). There were 555 (49%) females and 577 (51%) males.
Symptomatic cholelithiasis was the most common diagnosis. This accounted for 13.1% of the total, fol-lowed by acute appendicitis (7.2%) followed by inguinal hernia (7.9%), breast neoplasia (5.5%) and eventration (4.9%).
Table 2 Triggers used in the study grouped by modules
Modules Triggers used in the study
Care module 1. Transfusion of blood or blood derivatives
2. Cardiorespiratory arrest code
3. Acute dialysis
4. Positive blood culture
5. Radiological test for the study of thrombosis (Unscheduled echo‑Doppler during admis‑sion, CT angiography)
6. Sudden decrease in hemoglobin equal or greater than 25%.
7. Patient fall
8. Bedsores
9. Patient detention measures
10. Readmission 30 days post‑discharge
11. Unscheduled radiology during admission
12. Infection associated with healthcare
Medication module 1. Positive culture for Clostridium difficile antihistamine
2. Partial Thromboplastin Time (PTT) over 100 s
3. INR (International Normalized Ratio) over 6
4. Glycemia under 50 mg/dL
5. Increased serum creatinine x 2 compared to basal level
6. Administration of vitamin K 7. Administration of Flumazenil
8. Administration of Naloxone.
9. Administration of Epinephrine.
10. Administration of anti‑emetics
11. Sudden stoppage of the medication
Surgical module 1. Reintervention in the 30 days post‑discharge.
2. Unscheduled change in procedure or complication of this.
3. Unscheduled transfer to critical care unit (higher level of care)
4. Unscheduled intubation or repeat intubation
5. Intra‑operative radiology
6. Mechanical ventilation greater than 24 hours
7. Intra‑operative administration of Flumazenil, Naloxone or Epinephrine.
8. Postoperative increase in troponin greater than 1.5 nanograms/mL
9. Unscheduled injury or removal of an organ
Added based on prior literature and studies 1. Care in the emergency department 30 days post‑discharge
2. Unscheduled invasive procedures during admission (interventional radiology, endoscopy)
3. Pathological anatomy unrelated to diagnosis
4. Use of broad spectrum antibiotherapy
5. Use of Total Parenteral Nutrition.
6. Prolonged stay in resuscitation after surgery (over 24 hours).
Page 5 of 10Pérez Zapata et al. Patient Safety in Surgery (2022) 16:7
The most common procedures were cholecystectomy (17%), both inguinal and umbilical hernioplasty (13%), appendectomy (7%), eventroplasty (5%) and mastec-tomy (3%).
Mean stay was 6.5 days (standard deviation 14.32). A total of 73.7% and 26.1% were scheduled and emer-gency surgical procedures, respectively.
Behavior of the toolThe tool revealed sensitivity and specificity of 86.27% and 79.55%, respectively. PPV and NPV were 66.52% and 92.48%, respectively. For severe adverse events, sensitiv-ity and specificity were 100% and 26.5%, respectively. For preventable adverse events sensitivity and specificity were 90.3% and 66.9%, respectively.
Fig. 1 Application of the “Trigger Tool” methodology
Fig. 2 Adverse event by injury category
Page 6 of 10Pérez Zapata et al. Patient Safety in Surgery (2022) 16:7
Table 3 shows the 38 triggers which, after bivari-ate study, were statistically significant with the onset of adverse events and their onset frequency.
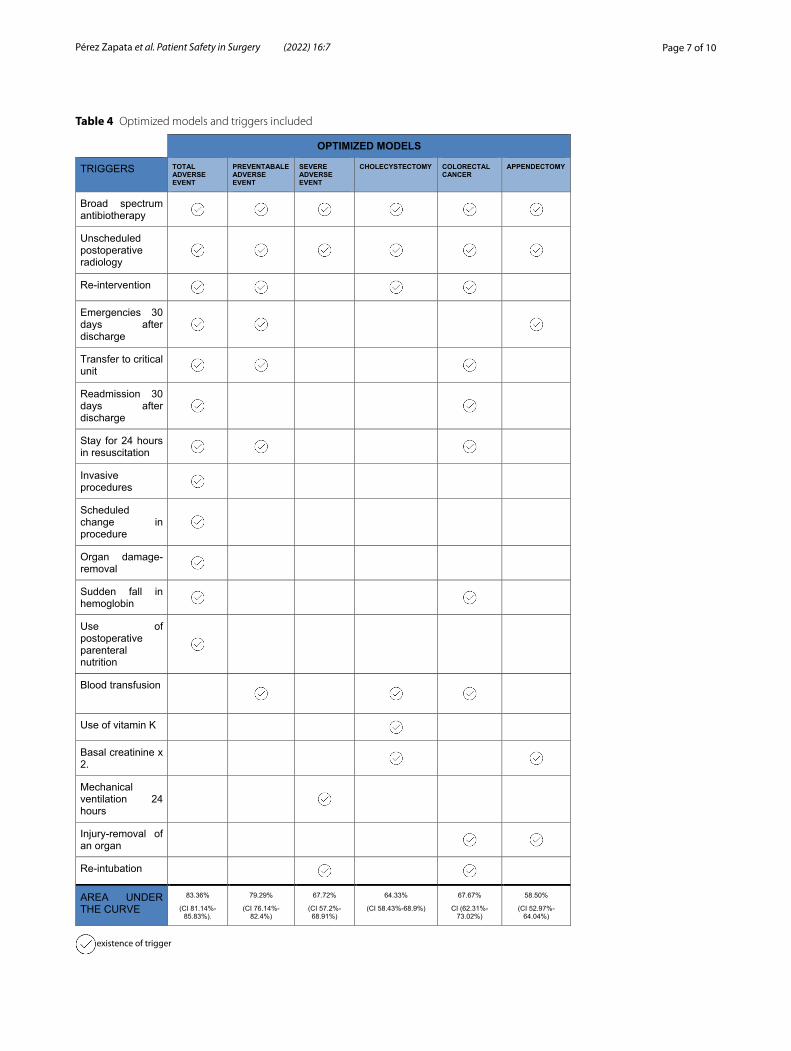
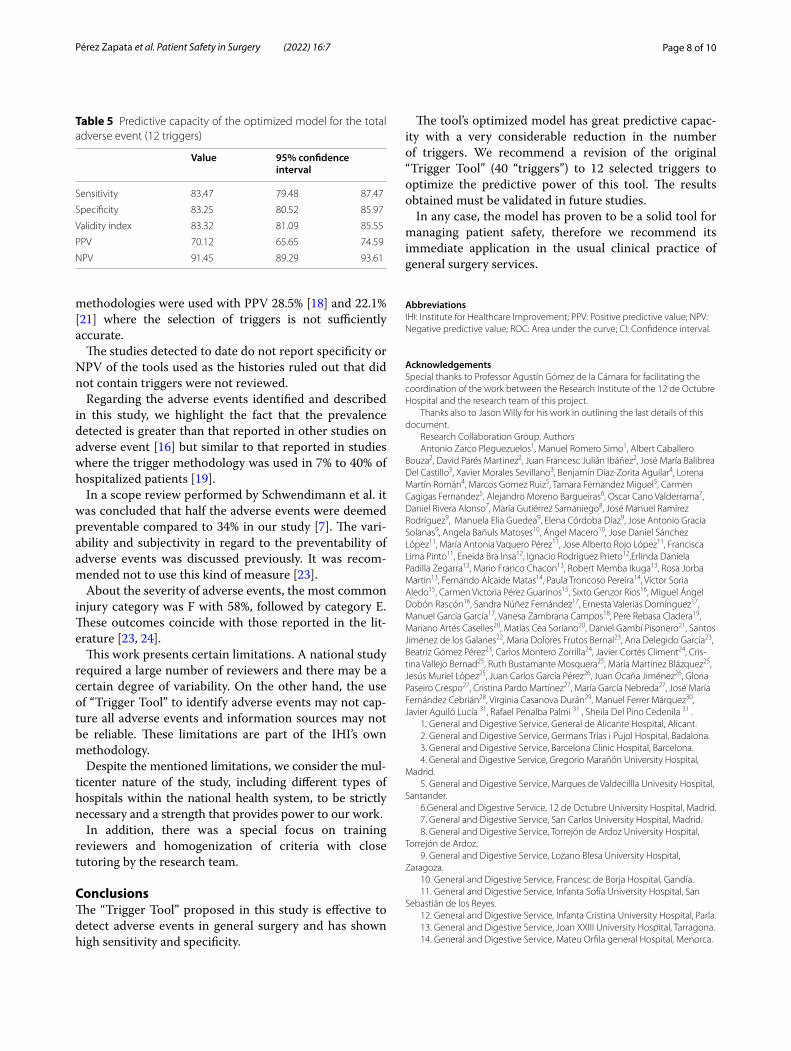
The triggers that comprised part of the optimized mod-els are shown in Table 4. The model for total adverse events had 12 triggers and its ROC was 83.36 % (CI 81.14%-85.83%). Its predictive capacity is shown in Table 5.
For preventable adverse events the optimized model led to obtaining sensitivity and specificity of 83.6% and 74.95%, respectively. ROC was 79.29% (CI 76.14%-82.4%).
Adverse eventsThe prevalence of adverse events was 31.53% (357 patients). There was a total of 599 AE. A total of 69 patients presented a second adverse event (6.10%) and 28 a third adverse event (2.47%). A total of 16 patients had four or more adverse events (1.41%).
The most commonly observed adverse event were infections (35%). The most common was infection of the surgical site followed by paralytic ileus, intra-abdominal abscess, and anastomotic fistula.
The category of adverse events injury is shown in Graph 1. A total of 34% of adverse events were deemed preventable.
DiscussionThe most important contribution of this study is valida-tion of the “Trigger Tool” in General surgery and gastro-intestinal surgery and the proposal for the first time of an optimized model. This enables detecting adverse events more efficiently, which is extremely useful to improve patient safety.
Regarding the different validation methodologies of the “Trigger Tool”, it should be noted that several studies have been performed in other specialties [17–19]. Some works have also published results on optimization of the tool in different areas. This study is, to date, the first on validation of the “Trigger Tool” in General surgery and gastrointestinal surgery and also the first proposed opti-mized model for this specialty.
One of the methods used to validate the tool was the opinion of experts with Delphi-like surveys [20] on the triggers included in an initial proposal. For some of them the final model included those with a PPV greater than 5% [18, 21]. In others a subsequent study was performed for its validation by means of calculating false negatives in a random sample [19].
Some works report the review of trigger histories. This is the case of the Israeli study [22] on “Trigger Tool” in adverse events related to medication. The optimized model proposed was prepared in accordance with PPV over 10% and the opinion of a panel of experts remov-ing four of the 17 initial triggers. This study only reports adverse events related to medication and the final model is not based on multivariate statistical analysis.
Regarding the predictive capacity of optimized mod-els we found that the study whose results are most similar to this work is the one that uses a similar meth-odology. In the study by Griffey its model’s area under the curve was 82% with 12 triggers compared to 83.6% in our study.
The PPV of our model (66%) is much higher than that reported in the remaining publications where other
Table 3 Trigger and onset of Adverse Event
Trigger Frequency P
Broad spectrum antibiotherapy 171 0.014
Unscheduled radiology 162 0.013
Emergencies 30 days 112 0.012
Re-intervention 80 0.011
Post-operative TPN 73 0.011
Use of Vitamin K 71 0.001
Transfusion of blood derivatives 65 0.013
Stay in resuscitation >24 h 63 0.013
Decrease in Hb >2 g/24 hours 59 0.01
Unscheduled ITU transfer 55 <0.001
Readmission after 30 days discharge 54 0.009
Invasive procedures 53 0.009
Transfer to critical care unit 51 0.009
Scheduled change in procedure 38 0.00863
Basal creatinine x 2 36 0.008
Mechanical ventilation over 24 hours 30 0.00742
Use of Naloxone 30 0.00758
Positive Blood culture 30 0.00746
Unscheduled injury of removal of an organ 24 0.00728
Reintubation 21 0.006
Pathologic anatomy unrelated to diagnosis 20 0.006
Unscheduled intubation 18 0.005
Sudden stoppage in medication 13 0.0052
Cardiorespiratory arrest 12 0.00479
Pressure sore 10 0.004
Detention measures 9 0.004
Intra-operative radiology 8 0.004
Acute dialysis 5 0.003
Antihistamine 3 0.002
Post-operative troponin over 1.5 ng/mL 3 0.002
Patient fall 2 0.001
Positive stool culture 1 0.001
Flumazenil 1 0.001
Naloxone 1 0.001
Page 7 of 10Pérez Zapata et al. Patient Safety in Surgery (2022) 16:7
Table 4 Optimized models and triggers included
existence of trigger
Page 8 of 10Pérez Zapata et al. Patient Safety in Surgery (2022) 16:7
methodologies were used with PPV 28.5% [18] and 22.1% [21] where the selection of triggers is not sufficiently accurate.
The studies detected to date do not report specificity or NPV of the tools used as the histories ruled out that did not contain triggers were not reviewed.
Regarding the adverse events identified and described in this study, we highlight the fact that the prevalence detected is greater than that reported in other studies on adverse event [16] but similar to that reported in studies where the trigger methodology was used in 7% to 40% of hospitalized patients [19].
In a scope review performed by Schwendimann et al. it was concluded that half the adverse events were deemed preventable compared to 34% in our study [7]. The vari-ability and subjectivity in regard to the preventability of adverse events was discussed previously. It was recom-mended not to use this kind of measure [23].
About the severity of adverse events, the most common injury category was F with 58%, followed by category E. These outcomes coincide with those reported in the lit-erature [23, 24].
This work presents certain limitations. A national study required a large number of reviewers and there may be a certain degree of variability. On the other hand, the use of “Trigger Tool” to identify adverse events may not cap-ture all adverse events and information sources may not be reliable. These limitations are part of the IHI’s own methodology.
Despite the mentioned limitations, we consider the mul-ticenter nature of the study, including different types of hospitals within the national health system, to be strictly necessary and a strength that provides power to our work.
In addition, there was a special focus on training reviewers and homogenization of criteria with close tutoring by the research team.
ConclusionsThe “Trigger Tool” proposed in this study is effective to detect adverse events in general surgery and has shown high sensitivity and specificity.
The tool’s optimized model has great predictive capac-ity with a very considerable reduction in the number of triggers. We recommend a revision of the original “Trigger Tool” (40 “triggers”) to 12 selected triggers to optimize the predictive power of this tool. The results obtained must be validated in future studies.
In any case, the model has proven to be a solid tool for managing patient safety, therefore we recommend its immediate application in the usual clinical practice of general surgery services.
AbbreviationsIHI: Institute for Healthcare Improvement; PPV: Positive predictive value; NPV: Negative predictive value; ROC: Area under the curve; CI: Confidence interval.
AcknowledgementsSpecial thanks to Professor Agustín Gómez de la Cámara for facilitating the coordination of the work between the Research Institute of the 12 de Octubre Hospital and the research team of this project.
Thanks also to Jason Willy for his work in outlining the last details of this document.
Research Collaboration Group. AuthorsAntonio Zarco Pleguezuelos1, Manuel Romero Simo1, Albert Caballero
Bouza2, David Parés Martinez2, Juan Francesc Julián Ibáñez2, José María Balibrea Del Castillo3, Xavier Morales Sevillano3, Benjamín Díaz‑Zorita Aguilar4, Lorena Martín Román4, Marcos Gomez Ruiz5, Tamara Fernandez Miguel5, Carmen Cagigas Fernandez5, Alejandro Moreno Bargueiras6, Oscar Cano Valderrama7, Daniel Rivera Alonso7, María Gutiérrez Samaniego8, José Manuel Ramírez Rodríguez9, Manuela Elia Guedea9, Elena Córdoba Diaz9, Jose Antonio Gracia Solanas9, Angela Bañuls Matoses10, Ángel Macero10, Jose Daniel Sánchez López11, María Antonia Vaquero Pérez11, Jose Alberto Rojo López11, Francisca Lima Pinto11, Eneida Bra Insa12, Ignacio Rodríguez Prieto12,Erlinda Daniela Padilla Zegarra13, Mario Franco Chacon13, Robert Memba Ikuga13, Rosa Jorba Martin13, Fernando Alcaide Matas14, Paula Troncoso Pereira14, Víctor Soria Aledo15, Carmen Victoria Pérez Guarinos15, Sixto Genzor Rios16, Miguel Ángel Dobón Rascón16, Sandra Núñez Fernández17, Ernesta Valerias Domínguez17, Manuel García García17, Vanesa Zambrana Campos18, Pere Rebasa Cladera19, Mariano Artés Caselles20, Matías Cea Soriano20, Daniel Gambí Pisonero21, Santos Jiménez de los Galanes22, Maria Dolores Frutos Bernal23, Ana Delegido García23, Beatriz Gómez Pérez23, Carlos Montero Zorrilla24, Javier Cortés Climent24, Cris‑tina Vallejo Bernad25, Ruth Bustamante Mosquera25, María Martínez Blázquez25, Jesús Muriel López25, Juan Carlos García Pérez26, Juan Ocaña Jiménez26, Gloria Paseiro Crespo27, Cristina Pardo Martínez27, María García Nebreda27, José María Fernández Cebrián28, Virginia Casanova Durán29, Manuel Ferrer Márquez30, Javier Aguiló Lucía 31, Rafael Penalba Palmi 31 , Sheila Del Pino Cedenila 31 .
1. General and Digestive Service, General de Alicante Hospital, Alicant.2. General and Digestive Service, Germans Trias i Pujol Hospital, Badalona.3. General and Digestive Service, Barcelona Clinic Hospital, Barcelona.4. General and Digestive Service, Gregorio Marañón University Hospital,
Madrid.5. General and Digestive Service, Marques de Valdecillla Univesity Hospital,
Santander.6.General and Digestive Service, 12 de Octubre University Hospital, Madrid.7. General and Digestive Service, San Carlos University Hospital, Madrid.8. General and Digestive Service, Torrejón de Ardoz University Hospital,
Torrejón de Ardoz.9. General and Digestive Service, Lozano Blesa University Hospital,
Zaragoza.10. General and Digestive Service, Francesc de Borja Hospital, Gandía.11. General and Digestive Service, Infanta Sofía University Hospital, San
Sebastián de los Reyes.12. General and Digestive Service, Infanta Cristina University Hospital, Parla.13. General and Digestive Service, Joan XXIII University Hospital, Tarragona.14. General and Digestive Service, Mateu Orfila general Hospital, Menorca.
Table 5 Predictive capacity of the optimized model for the total adverse event (12 triggers)
Value 95% confidence interval
Sensitivity 83.47 79.48 87.47
Specificity 83.25 80.52 85.97
Validity index 83.32 81.09 85.55
PPV 70.12 65.65 74.59
NPV 91.45 89.29 93.61
Page 9 of 10Pérez Zapata et al. Patient Safety in Surgery (2022) 16:7
15. General and Digestive Service, Morales Messeguer University Hospital, Murcia.
16. General and Digestive Service, Miguel Servet University Hospital, Zaragoza.
17. General and Digestive Service, Ourense University Hospital, Ourense.18. General and Digestive Service, San Jorge University Hospital, Huesca.19. General and Digestive Service, Parc Tauli University Hospital, Sabadell.20. General and Digestive Service, Puerta de Hierro University Hospital,
Madrid.21. General and Digestive Service, Santa Bárbara University Hospital,
Puertollano.22. General and Digestive Service, Infanta Elena University Hospital,
Valdemoro.23. General and Digestive Service, Virgen de la Arrixaca University Hospital,
Murcia.24. General and Digestive Service, Virgen de los Lirios University Hospital,
Alcoy.25. General and Digestive Service, Álava University Hospital, Victoria.26. General and Digestive Service, Ramón y Cajal University Hospital.27. General and Digestive Service, Infanta Leonor University Hospital,
Vallecas.28. General and Digestive Service, Alcorcón University Hospital, Alcorcón.29. General and Digestive Service, Tajo University Hospital, Aranjuez.30. General and Digestive Service, Torrecárdenas General Hospital, Almería.31. General and Digestive Service, Lluis Alcanyis, Xátiva.
Informed consentAccording to the ethics committee’s assessment and given the research project’s observational, descriptive and non‑interventionist methodology, informed consent was not required from the patients included in the study.
We acted in accordance with the prevailing data protection law and rules that regulate the processing of patient information by the Spanish health system.
Consent to participateNot applicable
This manuscript does not report on or involve the use of any animal or human data ortissue.
Authors’ ContributionsAIPZ was the principal investigator of the study. Together with ERC and PRL they developed the research project that was eligible for the Carlos III Institute grant. MFB was in charge of coordinating the team of collaborators in the centers participating in the study. CLS and EFH facilitated contact with reference centers and provided methodological support for the resolution of doubts to the participants. Lastly, CMA, MTG and AIPZ performed the statisti‑cal analysis. The author(s) read and approved the final manuscript.
FundingThis study was subsidized by the European Regional Development Fund ("A way to make Europe") by means of a research grant awarded by the Spanish Ministry of Economy, Industry and Competitiveness of the Government of Spain, through Carlos III Health Institute.
Availability of data and materialsThe study data and variables were recorded in an online database (REDCap). Those are available for testing by reviewers if needed. Confidentiality rules were upheld.
Declarations
Ethics approval and consent to participateThe research project was approved by the 12 de Octubre University Hospital Ethics Committee.About the consent to participate, it is not applicable in this case.This manuscript does not report on or involve the use of any animal or human data or tissue.
Consent for publicationNot applicable
Competing interestsNone of the authors have any conflict of interest to declare in regard to the performingor publication of this work.
Author details1 General and Gastrointestinal Department at 12 de Octubre University Hospital, Avda Córdoba sn, 28041 Madrid, Spain. 2 General and Gastrointestinal Department at Infanta Elena University Hospital, Valdemoro, Spain. 3 Biomedi‑cal Research Fundation, 12 de Octubre University Hospital, Madrid, Spain. 4 Madrid Proffesor Surgery Department at Medicine Faculty. Complutense University, San Carlos University Hospital, Madrid, Spain. 5 Urology Department, 12 de Octubre University Hospital, Avda Córdoba sn, 28041 Madrid, Spain.
Received: 20 October 2021 Accepted: 19 December 2021
References 1. Aranaz J, Aibar C, Vitaller J, Ruiz P. Estudio Nacional sobre Efectos adversos
ligados a la Hospitalización ENEAS 2005. Madrid: Spanish Ministry of Health and Consumer Affairs; 2006.
2. Pérez Zapata AI, Gutiérrez Samaniego M, Rodríguez Cuéllar E. Ruiz López PDetection of adverse events in general surgery by applying the Trigger Tool methodology. Cir Esp. 2015;93(2):84–90.
3. Hibbert P, Molloy C, Hooper T, Wiles L, Runciman W, Lachman P, et al. The application of the Global Trigger Tool: a systematic review. Int J Qual Health Care. 2016;28(6):640–9.
4. Lapointe‑ShawL BCM. CMAJ. 2019;191:E877–8. https:// doi. org/ 10. 1503/ cmaj. 190912.
5. Kjellberg J, Wolf RT, Kruse M, Susanne R, Vestergaard J, Nielsen KJ, et al. Costs associated with adverse events among acute patients. BMC Health Serv Res. 2017;17:651.
6. Carey K. Stefos T Measuring the cost of hospital adverse patient safety events. Health Econ. 2011;20(12):1417–30.
7. Schwendimann R, Blatter C, Dhaini S, Simon M, Ausserhofer D. The occur‑rence, types, consequences and preventability of in‑hospital adverse events ‑ a scoping review. BMC Health Serv Res. 2018;18:521.
8. Zegers M, de Bruijne MC, de Keizer B, Merten H, Groenewegen PP, van der Wal G, et al. The incidence, root‑causes, and outcomes of adverse events in surgical units: implication for potential prevention strategies. Patient Saf Surg. 2011;5:13.
9. Brennan TA, Leape LL, Laird NM, Hebert L, Localio AR, Lawthers AG, et al. Incidence of adverse events and negligence in hospitalized patients. Results of the Harvard Medical Practice Study I. N Engl J Med. 1991;324:370–6.
10. Pérez Zapata A, Gutierrez Samaniego M, Rodríguez Cuéllar E. Agustín Gómez de la Cámara y Pedro Ruiz López. Comparison of the Trigger Tool with the minimum basic data set for detecting adverse events in general surgery. J Healthc Qual Res. 2016;32(4):209–14.
11. Visser A, Slaman AE, van Leijen CM, Gouma DJ, Goslings JC, Ubbink T. Trigger tool versus verbal inventory to detect surgical complications. Langenbecks Arch Surg. 2015;400:821–30.
12. Griffin FA, Resar RK. IHI Global Trigger Tool for Measuring Adverse Events.IHI Innovation Series white paper. Cambridge, MA: Institute for Healthcare Improvement; 2007. Available at www. IHI. org
13. Kaibel Val R, Ruiz López P, Pérez Zapata A, de la Gómez CA, dela Cruz Vigo F. Detection of adverse events in thyroid and parathyroid surgery using trigger tool and Minimum Basic Data Set (MBDS). J Healthc Qual Res. 2020;35(6):348–54.
14. National Coordinating Council for Medication Error Reporting and Prevention Index for Categorizing Errors. Available at http:// www. nccme rp. org/ medEr rorCa tIndex. html.
15. The Conceptual Framework for the International Classification for Patient Safety (ICPS). Geneva: WHO; 2009. Available at: https:// www. who. int/ patie ntsaf ety/ taxon omy/ icps_ full_ report. pdf.
16. Aranaz JM, Aibar C, Vitaller J, Ruiz P, Limón R, Terol E, et al. Incidence of adverse events (AEs) related to health care in Spain, Results of the
Page 10 of 10Pérez Zapata et al. Patient Safety in Surgery (2022) 16:7
• fast, convenient online submission
•
thorough peer review by experienced researchers in your field
• rapid publication on acceptance
• support for research data, including large and complex data types
•
gold Open Access which fosters wider collaboration and increased citations
maximum visibility for your research: over 100M website views per year •
At BMC, research is always in progress.
Learn more biomedcentral.com/submissions
Ready to submit your researchReady to submit your research ? Choose BMC and benefit from: ? Choose BMC and benefit from:
Spanish National Study of Adverse Events (ENEAS). J Epidemiol Com‑munity Health. 2008;62(12):1022–9. https:// doi. org/ 10. 1136/ jech. 2007. 065227.
17. Unbeck M, Lindemalm S, Nydert P, Ygge BM, Nylén U, Berglund C, et al. Validation of triggers and development of a pediatric trigger tool to identify adverse events. BMC Health Serv Res. 2014;14:655.
18. Hu Q, Qin Z, Zhan M, Chen Z, Wu B, Xu T. Validating the Chinese geriatric trigger tool and analyzing adverse drug event associated risk factors in elderly Chinese patients: A retrospective review. PLoS ONE. 2020;15(4):e0232095.
19. Griffey R, Schneider R, Todorov A. The Emergency Department Trig‑ger Tool: Validation and Testing to Optimize. Yield Acad Emerg Med. 2020;27(12):1279–90.
20. Griffey R, Schneider R, Adler LM, Capp R, Carpenter C, Farmer B, et al. Development of an Emergency Department Trigger Tool Using a System‑atic Search and Modified Delphi Process. J Patient Saf. 2020;16(1):e11‑e17.
21. Toscano MD, Galván M, Otero MJ, FSánchez S, Font Noguera I, Pérez Guerrero MC. Validating a Trigger Tool for detecting Adverse Drugs Events in Eldery Patients With Multimorbidity (TRIGGER_CHRON). J Patient Saf. 2021 Dec 1;17(8):e976–e982.
22. Zimlichman E, Gueta I, Daliyot D, Daliyot D, Ziv A, Oberman B, et al. Adverse Drug Event Rate in Israeli Hospitals: Validation of an International Trigger Tool and an International Comparison Study. Isr Med Assoc J. 2018;20(11):665–69.
23. Schildmeijer K, Nilsson L, Arestedt K. Assessment of adverse events in medical care: lack of consistency between experienced teams using the global trigger tool. BMJ Qual Saf. 2012;21:307–14.
24. Kennerly DA, Kudyakov R, da Graca B, Saldana M, Compton J, Nicewander D, et al. Characterization of adverse events detected in a large health care delivery system using an enhanced global trigger tool over a five‑year interval. Health Serv Res. 2014;49(5):1407–25.
Publisher’s NoteSpringer Nature remains neutral with regard to jurisdictional claims in pub‑lished maps and institutional affiliations.