The Anthem at Riverside III Senior Apartments
116
Market Feasibility Analysis The Anthem at Riverside III Senior Apartments South Fulton, Fulton County, Georgia Prepared for: Anthem Senior III, LP Site Inspection: May 11, 2021 Effective Date: May 11, 2021
-
Upload
khangminh22 -
Category
Documents
-
view
2 -
download
0
Transcript of The Anthem at Riverside III Senior Apartments

Market Feasibility Analysis
The Anthem at Riverside III Senior Apartments
South Fulton, Fulton County, Georgia
Prepared for:
Anthem Senior III, LP
Site Inspection: May 11, 2021 Effective Date: May 11, 2021

The Anthem at Riverside III | Table of Contents
Page i
TABLE OF CONTENTS
EXECUTIVE SUMMARY ........................................................................................................... 1
1. INTRODUCTION .............................................................................................................. 8
A. Overview of Subject .............................................................................................................................................. 8 B. Purpose of Report ................................................................................................................................................. 8 C. Format of Report .................................................................................................................................................. 8 D. Client, Intended User, and Intended Use ............................................................................................................. 8 E. Applicable Requirements ...................................................................................................................................... 8 F. Scope of Work ...................................................................................................................................................... 8 G. Report Limitations ................................................................................................................................................ 9 H. Other Remarks ...................................................................................................................................................... 9
2. PROJECT DESCRIPTION .................................................................................................. 10
A. Project Overview ................................................................................................................................................ 10 B. Project Type and Target Market ......................................................................................................................... 10 C. Building Types and Placement ............................................................................................................................ 10 D. Detailed Project Description ............................................................................................................................... 11
1. Project Description ..................................................................................................................................... 11 2. Proposed Timing of Development ............................................................................................................. 11
3. SITE EVALUATION ......................................................................................................... 12
A. Site Analysis ........................................................................................................................................................ 12 1. Site Location ............................................................................................................................................... 12 2. The Anthem at Riverside Development ..................................................................................................... 13 3. General Description of Land Uses Surrounding the Subject Site ............................................................... 14 4. Land Uses Surrounding the Subject Site .................................................................................................... 15
B. Neighborhood Analysis ....................................................................................................................................... 16 1. General Description of Neighborhood ....................................................................................................... 16 2. Neighborhood Planning Activities .............................................................................................................. 16 3. Public Safety ............................................................................................................................................... 16
C. Site Visibility and Accessibility ............................................................................................................................ 17 1. Visibility ...................................................................................................................................................... 17 2. Vehicular Access ......................................................................................................................................... 17 3. Availability of Public Transit and Interregional Transit .............................................................................. 17 4. Pedestrian Access ....................................................................................................................................... 18 5. Accessibility Improvements under Construction and Planned .................................................................. 18
D. Residential Support Network .............................................................................................................................. 18 1. Key Facilities and Services near the Subject Site ........................................................................................ 18 2. Essential Services ....................................................................................................................................... 19 3. Commercial Goods and Services ................................................................................................................ 19 4. Location of Low-Income Housing ............................................................................................................... 20
E. Site Conclusion ................................................................................................................................................... 20
4. MARKET AREA .............................................................................................................. 21
A. Introduction ........................................................................................................................................................ 21 B. Delineation of Market Area ................................................................................................................................ 21
5. COMMUNITY DEMOGRAPHIC DATA .............................................................................. 23
A. Introduction and Methodology .......................................................................................................................... 23 B. Trends in Population and Households ................................................................................................................ 23
1. Recent Past Trends ..................................................................................................................................... 23 2. Projected Trends ........................................................................................................................................ 24 3. Building Permit Trends ............................................................................................................................... 24 4. Trends in Older Adult Households ............................................................................................................. 25
C. Demographic Characteristics .............................................................................................................................. 25
The Anthem at Riverside III | Table of Contents
Page i i
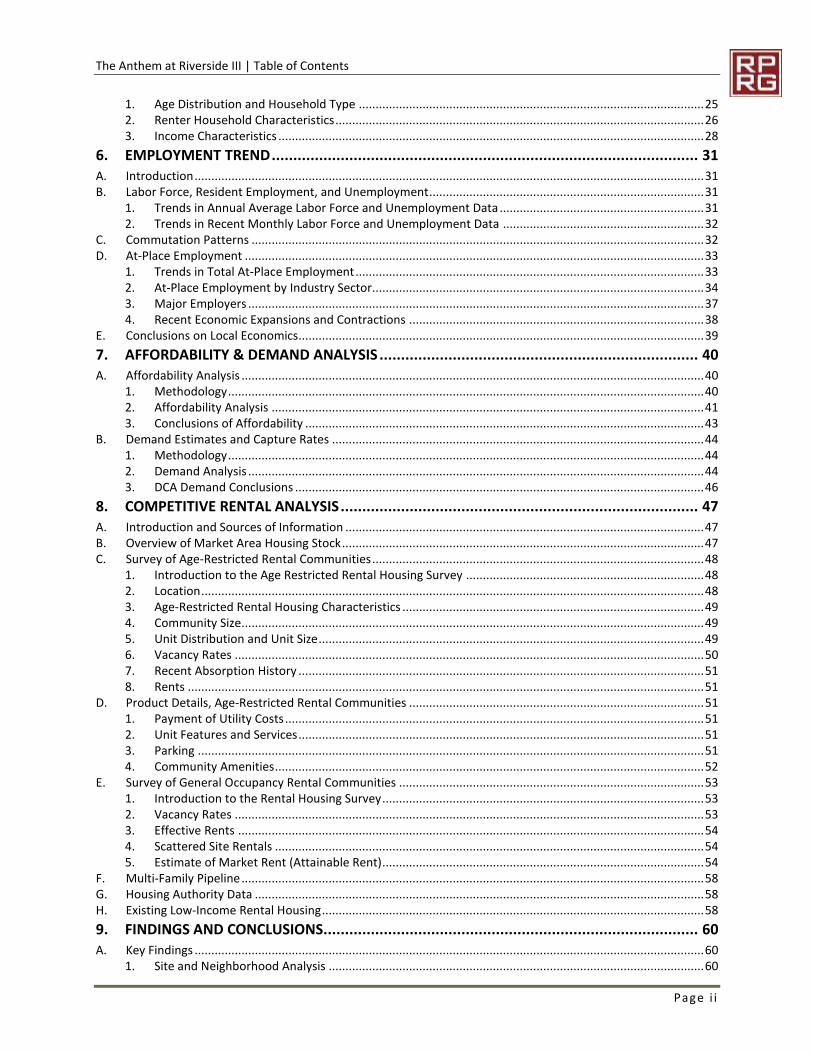
1. Age Distribution and Household Type ....................................................................................................... 25 2. Renter Household Characteristics .............................................................................................................. 26 3. Income Characteristics ............................................................................................................................... 28
6. EMPLOYMENT TREND ................................................................................................... 31
A. Introduction ........................................................................................................................................................ 31 B. Labor Force, Resident Employment, and Unemployment .................................................................................. 31
1. Trends in Annual Average Labor Force and Unemployment Data ............................................................. 31 2. Trends in Recent Monthly Labor Force and Unemployment Data ............................................................ 32
C. Commutation Patterns ....................................................................................................................................... 32 D. At-Place Employment ......................................................................................................................................... 33
1. Trends in Total At-Place Employment ........................................................................................................ 33 2. At-Place Employment by Industry Sector................................................................................................... 34 3. Major Employers ........................................................................................................................................ 37 4. Recent Economic Expansions and Contractions ........................................................................................ 38
E. Conclusions on Local Economics......................................................................................................................... 39
7. AFFORDABILITY & DEMAND ANALYSIS .......................................................................... 40
A. Affordability Analysis .......................................................................................................................................... 40 1. Methodology .............................................................................................................................................. 40 2. Affordability Analysis ................................................................................................................................. 41 3. Conclusions of Affordability ....................................................................................................................... 43
B. Demand Estimates and Capture Rates ............................................................................................................... 44 1. Methodology .............................................................................................................................................. 44 2. Demand Analysis ........................................................................................................................................ 44 3. DCA Demand Conclusions .......................................................................................................................... 46
8. COMPETITIVE RENTAL ANALYSIS ................................................................................... 47
A. Introduction and Sources of Information ........................................................................................................... 47 B. Overview of Market Area Housing Stock ............................................................................................................ 47 C. Survey of Age-Restricted Rental Communities ................................................................................................... 48
1. Introduction to the Age Restricted Rental Housing Survey ....................................................................... 48 2. Location ...................................................................................................................................................... 48 3. Age-Restricted Rental Housing Characteristics .......................................................................................... 49 4. Community Size.......................................................................................................................................... 49 5. Unit Distribution and Unit Size ................................................................................................................... 49 6. Vacancy Rates ............................................................................................................................................ 50 7. Recent Absorption History ......................................................................................................................... 51 8. Rents .......................................................................................................................................................... 51
D. Product Details, Age-Restricted Rental Communities ........................................................................................ 51 1. Payment of Utility Costs ............................................................................................................................. 51 2. Unit Features and Services ......................................................................................................................... 51 3. Parking ....................................................................................................................................................... 51 4. Community Amenities ................................................................................................................................ 52
E. Survey of General Occupancy Rental Communities ........................................................................................... 53 1. Introduction to the Rental Housing Survey ................................................................................................ 53 2. Vacancy Rates ............................................................................................................................................ 53 3. Effective Rents ........................................................................................................................................... 54 4. Scattered Site Rentals ................................................................................................................................ 54 5. Estimate of Market Rent (Attainable Rent) ................................................................................................ 54
F. Multi-Family Pipeline .......................................................................................................................................... 58 G. Housing Authority Data ...................................................................................................................................... 58 H. Existing Low-Income Rental Housing .................................................................................................................. 58
9. FINDINGS AND CONCLUSIONS....................................................................................... 60
A. Key Findings ........................................................................................................................................................ 60 1. Site and Neighborhood Analysis ................................................................................................................ 60

The Anthem at Riverside III | Table of Contents
Page i i i
2. Economic Context ...................................................................................................................................... 60 3. Population and Household Trends ............................................................................................................. 61 4. Demographic Analysis ................................................................................................................................ 61 5. Competitive Housing Analysis .................................................................................................................... 62
B. Product Evaluation ............................................................................................................................................. 63 C. Price Position ...................................................................................................................................................... 64
10. ABSORPTION AND STABILIZATION RATES .................................................................. 66
A. Absorption Estimate ........................................................................................................................................... 66 B. Impact on Existing and Pipeline Rental Market .................................................................................................. 66
11. INTERVIEWS .............................................................................................................. 66
12. CONCLUSIONS AND RECOMMENDATIONS ................................................................. 67
APPENDIX 1 UNDERLYING ASSUMPTIONS AND LIMITING CONDITIONS ............................... 68
APPENDIX 2 ANALYST CERTIFICATIONS ............................................................................... 70
APPENDIX 3 NCHMA CERTIFICATION .................................................................................... 71
APPENDIX 4 ANALYST RESUMES ......................................................................................... 72
APPENDIX 5 DCA CHECKLIST ............................................................................................... 75
APPENDIX 6 RENTAL COMMUNITY PROFILES ....................................................................... 80
TABLES, FIGURES AND MAPS
Table 1 Detailed Unit Mix and Rents, The Anthem at Riverside III ............................................................................. 11 Table 2 Unit Features and Community Amenities, The Anthem at Riverside III......................................................... 11 Table 3 Key Facilities and Services .............................................................................................................................. 18 Table 4 Population and Household Projections .......................................................................................................... 24 Table 5 Persons per Household, Anthem Market Area .............................................................................................. 24 Table 6 Building Permits by Structure Type, Fulton County ....................................................................................... 25 Table 7 Trends in Senior Households, Anthem Market Area ...................................................................................... 25 Table 8 Age Distribution ............................................................................................................................................. 26 Table 9 Households by Household Type ...................................................................................................................... 26 Table 10 Households by Tenure 2000 - 2024............................................................................................................. 27 Table 11 Senior Households by Tenure (55+) ............................................................................................................ 27 Table 12 Renter Households by Age of Householder ................................................................................................ 27 Table 13 Renter Households by Household Size ......................................................................................................... 28 Table 14 Household Income ........................................................................................................................................ 28 Table 15 Senior Household Income, Households 55+ ................................................................................................. 29 Table 16 Senior Household Income by Tenure, Households 55+ ................................................................................ 29 Table 17 Rent Burdened and Substandard Housing, Anthem Market Area ................................................................ 30 Table 18 Labor Force and Unemployment Rates ........................................................................................................ 31 Table 19 Monthly Labor Force Data and Unemployment Rates................................................................................. 32 Table 20 Commutation Data, Anthem Market Area .................................................................................................... 33 Table 21 Major Employers, Atlanta Metro Area ......................................................................................................... 37 Table 22 WARN Notices, Fulton County ..................................................................................................................... 38 Table 23 2021 Total and Renter Income Distribution (55+), Anthem Market Area ................................................... 41 Table 24 LIHTC Income and Rent Limits, Atlanta-Sandy Springs-Roswell MSA ........................................................ 41 Table 25 Affordability Analysis, The Anthem at Riverside III ...................................................................................... 42 Table 26 Homeownership to Rental Housing Conversion .......................................................................................... 44 Table 27 Unit Mix and Income Targeting, Anthem at Riverside I ............................................................................... 45 Table 28 Unit Mix and Income Targeting, Anthem at Riverside II .............................................................................. 45 Table 29 Overall Demand Estimates, The Anthem at Riverside III ............................................................................. 46 Table 30 Demand Estimates by Floor Plan, The Anthem at Riverside III ................................................................... 46 Table 31 Occupied Units by Structure Type and Tenure ............................................................................................ 47 Table 32 Dwelling Units by Year Built and Tenure ...................................................................................................... 48

The Anthem at Riverside III | Table of Contents
Page iv
Table 33 Value of Owner-Occupied Housing Stock ..................................................................................................... 48 Table 34 Rental Summary, Senior Rental Communities .............................................................................................. 50 Table 35 Rental Summary, Deeply Subsidized Senior Communities ........................................................................... 50 Table 36 Utility Arrangement and Unit Features, Senior Communities ...................................................................... 51 Table 37 Community Amenities, Senior Communities ................................................................................................ 52 Table 38 Rental Summary, Unit Distribution, Size, and Pricing – Surveyed Communities .......................................... 54 Table 39 Estimate of Market Rent Adjustments .......................................................................................................... 55 Table 40 Adjusted Rent Comparison, One-Bedroom Units ........................................................................................ 56 Table 41 Adjusted Rent Comparison, Two-Bedroom ................................................................................................. 57 Table 42 Market Rent and Rent Advantage Summary ............................................................................................... 58 Table 43 Subsidized Communities, Anthem Market Area .......................................................................................... 59 Figure 1 Site Plan, The Anthem at Riverside III ............................................................................................................ 10 Figure 2 Views of Subject Site ...................................................................................................................................... 13 Figure 3 Satellite Image of Subject Site ....................................................................................................................... 14 Figure 4 Views of Surrounding Land Uses ................................................................................................................... 15 Figure 5 At-Place Employment, Fulton County ........................................................................................................... 34 Figure 6 Total Employment by Sector, 2020 Q3 ......................................................................................................... 35 Figure 7 Employment Change by Sector, 2011-2020 Q1 ............................................................................................ 36 Figure 8 Employment Change by Sector, 2020 (Q1-Q3) ............................................................................................. 36 Figure 9 Price Position, The Anthem at Riverside III .................................................................................................... 64
Map 1 Site Location .................................................................................................................................................... 12 Map 2 Crime Index ...................................................................................................................................................... 17 Map 3 Location of Key Facilities and Services ............................................................................................................ 19 Map 4 Anthem Market Area ....................................................................................................................................... 22 Map 5 Major Employers, Atlanta Metro Area ............................................................................................................ 38 Map 6 Surveyed Senior Communities, Anthem Market Area..................................................................................... 49 Map 7 Surveyed General Occupancy Communities.................................................................................................... 53 Map 8 Subsidized Rental Communities ...................................................................................................................... 59

The Anthem at Riverside III | Executive Summary
Page 1
EXECUTIVE SUMMARY
Anthem Senior III, LP has retained Real Property Research Group, Inc. (RPRG) to conduct a comprehensive market feasibility analysis for The Anthem at Riverside III, a proposed age-restricted rental community in southwestern Fulton County, Georgia. The subject property will be the final phase of a planned three-phase development; the first phase was awarded nine percent Low Income Housing Tax Credits in 2018 and is undergoing initial lease up; the second phase is under construction. The Anthem at Riverside III will be a 60-unit age-restricted rental community financed in part with nine percent Low Income Housing Tax Credits (LIHTC), allocated by the Georgia Department of Community Affairs (DCA), and will be restricted to households with householder age 55 and older. Nine units will benefit from Project Based Rental Assistance (PBRA) through the Section 8 program.
Project Description
• The site for The Anthem at Riverside III is on the southwest corner of the Waycrest Drive and Riverside Drive SW intersection roughly one-quarter mile south of Fulton Industrial Boulevard in southwestern Fulton County, Georgia.
• The Anthem at Riverside III will offer 60 age-restricted rental units targeting households with householder age 55 and older. The proposed unit mix includes 36 one-bedroom units and 24 two-bedroom units targeting senior households (55+). Income targeting includes 53 LIHTC units including nine with additional PBRA subsidies and seven market rate units.
• A detailed summary of the subject property, including the rent and unit configuration, is shown in the table below. The rents shown will include water, sewer, and trash removal.
• The Anthem at Riverside III will be competitive with the surveyed senior rental communities as each unit will include a dishwasher, garbage disposal, microwave, grab bars, emergency pull cords, ceiling fans, and washer and dryer connections.
• The Anthem at Riverside III’s community amenities will include a community room, fitness center, outdoor garden, covered picnic pavilion, medical office, and laundry facilities. The subject’s amenities will be generally comparable to most of the existing senior communities in the market area; Big Bethel Village offers the most extensive communities in the market area that are slightly superior to those planned at the subject property. The proposed amenities are appropriate and will be well received by the target market of very low and moderate income senior households.
Unit Mix/Rents
Type Bed BathIncome
Target#
Heated Sq.
Feet
Gross
Rent
Utility
AllowanceNet Rent
Rent/ Sq.
Foot
LIHTC/PBRA 1 1 50% 7 653 $980 $120 $860 $1.32LIHTC 1 1 60% 25 653 $830 $72 $758 $1.16
Market 1 1 MKT 4 653 $900 $900 $1.38Subtotal 36 60.0%
LIHTC/PBRA 2 2 50% 2 963 $1,120 $158 $962 $1.00LIHTC 2 2 50% 3 963 $828 $94 $734 $0.76LIHTC 2 2 60% 16 963 $1,014 $94 $920 $0.96
Market 2 2 MKT 3 963 $1,050 $1,050 $1.09Subtotal 24 40.0%
Total/Average 60Rents include water, sewer, and trash removal. Source: Anthem Senior III, LPContract Rent

The Anthem at Riverside III | Executive Summary
Page 2
1. Site Description / Evaluation:
The subject site is a suitable location for senior rental housing as it has access to public transportation, amenities, services, and transportation arteries.
• The site for The Anthem at Riverside III is on the south side of Waycrest Drive and west side of Riverside Drive SW in southwestern Fulton County, Georgia. The subject site is less than one-quarter mile south of Fulton Industrial Boulevard which is a major north-south thoroughfare in the region. Surrounding land uses include an apartment community (Panther Riverside Parc), undeveloped land, and industrial uses to the north along Fulton Industrial Boulevard.
• Industrial uses are common to the north and west while residential uses are common to the south and east within several miles of the site. Residential uses within a few miles of the site include single-family detached homes which are generally well-maintained with a range of values (modest to upper) and multi-family rental communities.
• Community services, public transit, a pharmacy, a bank, two convenience stores, recreation, and medical facilities are within roughly two miles of the site. A MARTA bus stop is less than one-quarter mile north of the site on Fulton Industrial Boulevard.
• The Anthem at Riverside III will have visibility from Riverside Drive SW and Waycrest Drive which have light traffic. Awareness for the subject will be increased given its entrance will be adjacent to Panther Riverside Parc, a 280-unit multi-family rental community.
• The subject site is suitable for the proposed development of affordable senior rental housing and is adjacent to the first two phases of the subject property.
2. Market Area Definition
• The Anthem Market Area consists of census tracts west of Interstate 285 in southwestern Fulton County, the eastern corner of Douglas County, and the southern corner of Cobb County near Interstate 20. Census tracts in Cobb County and Douglas County were included in this market area due to proximity to the site and the similarities in neighborhood composition. Senior residents of this market area would likely consider the subject site a suitable shelter location and the most comparable multi-family rental communities are inside this market area. The market area is bounded by Interstate 285 to the east given distance and the transition from less dense suburban development to denser urban development; a senior renter considering the subject property would be unlikely to consider living inside the Interstate 285 perimeter. The market area is bounded roughly by South Fulton Parkway to the south given census tracts south of this boundary extend five miles south to Interstate 85 and include the separate and distinct markets of Fairburn and Union City.
• The boundaries of the Anthem Market Area and their approximate distance from the subject site are Skyview Drive / Six Flags Drive to the north (5.2 miles), Interstate 285 to the east (5.3 miles), roughly South Fulton Parkway to the south (5.5 miles), and Bomar Road/Anneewakee Creek to the west (5.9 miles).
3. Community Demographic Data
• The Anthem Market Area had significant senior household growth (55+) from 2010 to 2021 and growth is expected to remain strong through 2024. Senior household growth in the market area has outpaced total household growth significantly on a percentage basis since 2010 and is expected to continue this trend over the next two years.
The Anthem at Riverside III | Executive Summary
Page 3
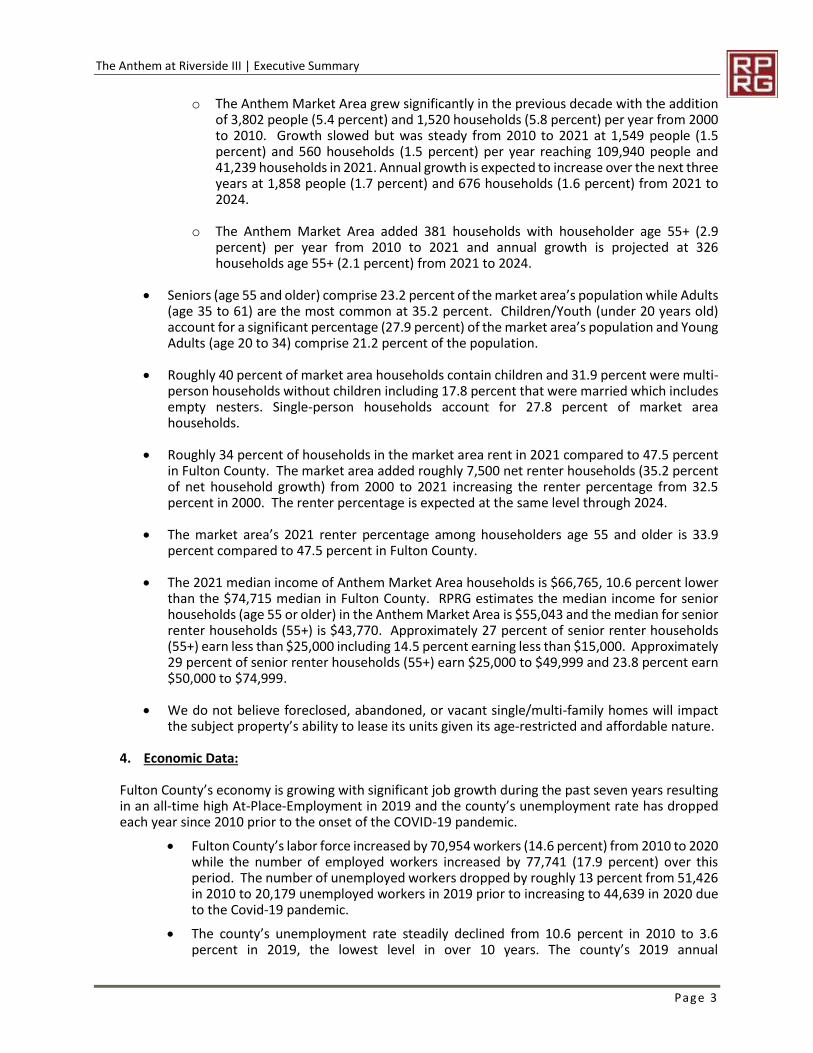
o The Anthem Market Area grew significantly in the previous decade with the addition of 3,802 people (5.4 percent) and 1,520 households (5.8 percent) per year from 2000 to 2010. Growth slowed but was steady from 2010 to 2021 at 1,549 people (1.5 percent) and 560 households (1.5 percent) per year reaching 109,940 people and 41,239 households in 2021. Annual growth is expected to increase over the next three years at 1,858 people (1.7 percent) and 676 households (1.6 percent) from 2021 to 2024.
o The Anthem Market Area added 381 households with householder age 55+ (2.9 percent) per year from 2010 to 2021 and annual growth is projected at 326 households age 55+ (2.1 percent) from 2021 to 2024.
• Seniors (age 55 and older) comprise 23.2 percent of the market area’s population while Adults (age 35 to 61) are the most common at 35.2 percent. Children/Youth (under 20 years old) account for a significant percentage (27.9 percent) of the market area’s population and Young Adults (age 20 to 34) comprise 21.2 percent of the population.
• Roughly 40 percent of market area households contain children and 31.9 percent were multi-person households without children including 17.8 percent that were married which includes empty nesters. Single-person households account for 27.8 percent of market area households.
• Roughly 34 percent of households in the market area rent in 2021 compared to 47.5 percent in Fulton County. The market area added roughly 7,500 net renter households (35.2 percent of net household growth) from 2000 to 2021 increasing the renter percentage from 32.5 percent in 2000. The renter percentage is expected at the same level through 2024.
• The market area’s 2021 renter percentage among householders age 55 and older is 33.9 percent compared to 47.5 percent in Fulton County.
• The 2021 median income of Anthem Market Area households is $66,765, 10.6 percent lower than the $74,715 median in Fulton County. RPRG estimates the median income for senior households (age 55 or older) in the Anthem Market Area is $55,043 and the median for senior renter households (55+) is $43,770. Approximately 27 percent of senior renter households (55+) earn less than $25,000 including 14.5 percent earning less than $15,000. Approximately 29 percent of senior renter households (55+) earn $25,000 to $49,999 and 23.8 percent earn $50,000 to $74,999.
• We do not believe foreclosed, abandoned, or vacant single/multi-family homes will impact the subject property’s ability to lease its units given its age-restricted and affordable nature.
4. Economic Data:
Fulton County’s economy is growing with significant job growth during the past seven years resulting in an all-time high At-Place-Employment in 2019 and the county’s unemployment rate has dropped each year since 2010 prior to the onset of the COVID-19 pandemic.
• Fulton County’s labor force increased by 70,954 workers (14.6 percent) from 2010 to 2020 while the number of employed workers increased by 77,741 (17.9 percent) over this period. The number of unemployed workers dropped by roughly 13 percent from 51,426 in 2010 to 20,179 unemployed workers in 2019 prior to increasing to 44,639 in 2020 due to the Covid-19 pandemic.
• The county’s unemployment rate steadily declined from 10.6 percent in 2010 to 3.6 percent in 2019, the lowest level in over 10 years. The county’s 2019 annual

The Anthem at Riverside III | Executive Summary
Page 4
unemployment rate was above the state rate (3.5 percent), but below the national rate (3.7 percent). Reflecting the impact of the COVID-19 pandemic, the county’s unemployment spiked to 13.8 percent in April 2020 before stabilizing over the next eleven months, decreasing to 4.9 percent in March 2021 which is higher than the state rate (4.0 percent) but below the national rate (6.0 percent).
• Fulton County’s economy rapidly expanded from 2010 to 2019 with the net addition of 204,054 jobs (29.2 percent), reaching an all-time high At-Place Employment of 903,005 jobs in 2019; annual At-Place Employment growth has outpaced the national employment growth rate in eight of the past nine years. The county added an annual average of 25,913 job from 2013 to 2019. Reflecting the impact of the COVID-19 pandemic, the county lost 63,405 jobs through the first three quarters of 2020 although most of these losses are expected to be temporary as reflected by the quick recovery of the unemployment rate, the leading economic indicator.
• Fulton County’s economy is diverse with six industry sectors representing at least eight percent of total At-Place-Employment. Professional-Business is the largest employment sector in Fulton County at 25.7 percent of jobs in 2020 (Q3) compared to 14.8 percent of jobs nationally.
• Reflecting broad economic expansion, all industry sectors added jobs in Fulton County from 2011 to 2020 (1Q). Eight sectors grew by at least 24 percent including the county’s largest sector (Professional-Business) which increased by 46.1 percent.
• Many large job expansions have been announced recently in or near downtown Atlanta in the past three years. In contrast, RPRG identified 156 WARN notices in 2020 and four WARN notices in 2021 with a combined with 18,073 jobs lost primarily as a result of the COVID 19 pandemic; much of the job loss is expected to be temporary.
5. Project Specific Affordability and Demand Analysis:
• The Anthem at Riverside III will contain 53 LIHTC units reserved for households earning at or below 50 percent and 60 percent of the Area Median Income (AMI); nine units at 50 percent will have PBRA through the Section 8 program. We have evaluated the LIHTC units without this additional assistance to test market conditions.
• Without PBRA, the proposed LIHTC units will target renter householders earning from $24,840 to $41,400. Without PBRA, the 53 LIHTC units without PBRA would need to capture 6.9 percent of the 768 age and income-qualified renter households in order to lease-up.
• The affordability capture rate for the seven market units is 0.4 percent based on 1,969 income qualified households.
• All renter affordability capture rates are within acceptable levels for an age-restricted rental community indicating that sufficient age and income-qualified renter households exist in the market area to support the proposed units without accounting for PBRA. The proposed PBRA on nine units at The Anthem at Riverside III removes the minimum income, significantly increases income qualified renters, and reduces the project’s renter affordability capture rates.
• All demand capture rates are within DCA thresholds with and without PBRA. The overall LIHTC capture rates are 7.2 percent accounting for PBRA and 15.4 percent without PBRA. The project-wide capture rate including market rate units but not accounting for PBRA is 6.3 percent.

The Anthem at Riverside III | Executive Summary
Page 5
6. Competitive Rental Analysis
RPRG surveyed eight senior rental communities including six with LIHTC units without additional communities and 23 general occupancy rental communities in the Anthem Market Area. Both senior and general occupancy rental markets were performing well with limited vacancies especially the senior market with three vacancies at stabilized communities and an aggregate vacancy rate below one percent.
Senior Rental Communities:
• Among the four stabilized senior LIHTC communities without additional subsidies, only three of 549 units were reported vacant for a rate of 0.5 percent. Anthem at Riverside opened earlier this year and has 27 of 80 units vacant for a rate of 33.8 percent. Big Bethel Village is currently undergoing renovations and the property manager was unable to provide information on vacancies or temporary tenant renovation; this community has historically been 100 percent occupied. All units with PBRA are 100 percent occupied with waiting lists.
• Among surveyed senior rental communities without PBRA, net rents, unit sizes, and rents per square foot are:
o One-bedroom units – have an average effective rent of $858. Based on an average unit size of 713 square feet, this equates to $1.17 per square foot. One-bedroom effective rents ranged from $396 for the 30 percent AMI LIHTC units at Heritage at Walton Reserve to $1,398 for the market rate units at Legacy at Walton Lakes.
o Two-bedroom units – have an average effective rent of $1,060. Based on an average unit size of 1,034 square feet, this equates to $1.03 per square foot. Two-bedroom effective rents ranged from $825 for the 50 percent AMI LIHTC units at Martin House at Adamsville to $1,685 for the market rate units at Legacy at Walton Lakes.
General Occupancy Rental Communities:
• The general occupancy rental market is performing well with 143 vacancies among 5,794 combined units for an aggregate vacancy rate of 2.5 percent. One general occupancy community is undergoing renovations with 42 of 330 units vacant. The aggregate vacancy rate among the 22 stabilized communities is 1.8 percent among 5,464 units. Among the general occupancy LIHTC communities, only six of 676 units were reported vacant for a rate of 0.9 percent.
• Among surveyed general occupancy rental communities, net rents, unit sizes, and rents per square foot are as follows:
o One-bedroom rents average $1,093 for 795 square feet or $1.37 per square foot. The average one bedroom LIHTC rent is $824.
o Two-bedroom rents average $1,241 for 1,061 square feet or $1.17 per square foot. The average two bedroom LIHTC rent is $891.
• The estimated market rents (attainable rent) for the units at The Anthem at Riverside III are $1,127 for one-bedroom units and $1,307 for two-bedroom units. All proposed rents have significant market advantages including the market rate units. The weighted average market advantage among LIHTC units is 33.1 percent. For the purposes of market advantage, we conservatively utilized the maximum allowable LIHTC rent for one bedroom units at 50 percent AMI although this rent is higher than the rent for 50 percent two bedroom units without PBRA.
• The only directly comparable communities identified in the market area are the first two phases of the subject property, which will be stabilized before the community enters the

The Anthem at Riverside III | Executive Summary
Page 6
market. The demand estimates indicate sufficient demand for all three phases of the subject property.
7. Absorption/Stabilization Estimates
• Based on projected senior household growth, acceptable capture rates, strong senior rental market conditions, we expect the nine proposed units with PBRA at The Anthem at Riverside III to lease-up in one month and the 51 units without PBRA to lease-up at a pace of 20 units per month. The units with and without PBRA will lease-up simultaneously. At this rate, the subject property will reach a stabilized occupancy of at least 93 percent within 2.5 months. Without PBRA, the subject property would reach a stabilized occupancy of at least 93 percent within three months with an average monthly absorption of 20 units.
• Given the strong projected senior household growth and strong senior rental market including waiting lists at all surveyed senior communities, we do not believe the development of the subject property will have an adverse impact on existing rental communities in the Anthem Market Area including those with tax credits. Demand for affordable senior rental housing is likely to increase over the next two years given the strong senior household growth projected in the Anthem Market Area.
8. Overall Conclusion / Recommendation
Based on an analysis of projected senior household growth trends, affordability, and demand estimates (with or without PBRA), current rental market conditions, and socio-economic and demographic characteristics of the Anthem Market Area, RPRG believes that the subject property, with or without the inclusion of PBRA, will be able to successfully reach and maintain a stabilized occupancy of at least 93 percent following its entrance into the rental market; the community is likely to sustain stabilized occupancy of 95 percent or higher. The subject property will be competitively positioned with existing senior communities in the Anthem Market Area and the units will be well received by the target market. We recommend proceeding with the project as planned.
DCA Summary Table:
Income/Unit Size Income LimitsUnits
Proposed
Renter Income
Qualification %
Total
DemandSupply
Net
Demand
Capture
RateAbsorption
Est. of Mkt
Rent
Market
Rents Band
Proposed
Rents
50% w/PBRA no min$ - $34,500One Bedroom Units 7 35.3% 670 30 640 1.1% 1 Month $1,127 $785-$1,398 $736Two Bedroom Units 2 37.9% 721 18 703 0.3% 1 Month $1,307 $943-$1,685 $876
50% AMI $24,840 - $34,500Two Bedroom Units 3 11.9% 226 0 226 1.3% 1 Month $1,307 $943-$1,685 $828
60% AMI $24,900 - $41,400One Bedroom Units 25 16.6% 316 54 262 9.5% 3 months $1,127 $785-$1,398 $830Two Bedroom Units 16 12.6% 240 32 208 7.7% 3 months $1,307 $943-$1,685 $920
120% AMI $29,160 - $82,800One Bedroom Units 4 48.4% 919 9 910 0.4% 3 months $1,127 $785-$1,398 $900Two Bedroom Units 3 43.7% 831 7 824 0.4% 3 months $1,307 $943-$1,685 $1,050
By BedroomOne Bedroom Units 36 53.7% 1,019 93 926 3.9% 3 months $1,127 $785-$1,398Two Bedroom Units 24 55.4% 1,053 57 996 2.4% 3 months $1,307 $943-$1,685
Project Total $24,840 - $82,80050% w/PBRA no min$ - $34,500 9 37.9% 721 48 673 1.3% 1 Month
50% AMI $24,840 - $34,500 3 11.9% 226 0 226 1.3% 1 Month60% AMI $24,900 - $41,400 41 19.5% 370 86 284 14.5% 3 Months
LIHTC Units w/ PBRA no min$ - $41,400 53 45.6% 865 134 731 7.2% 3 MonthsLIHTC w/o PBRA $24,840 - $41,400 44 19.5% 371 86 285 15.4% 3 Months
120% AMI $29,160 - $82,800 7 50.1% 951 16 935 0.7% 3 MonthsTotal Units (No PBRA) $24,840 - $82,800 60 55.4% 1,053 102 951 6.3% 3 Months

The Anthem at Riverside III | Executive Summary
Page 7
SUMMARY TABLE:
Development Name: Anthem at Riverside III Total # Units: 60
Location: Waycrest Drive, South Fulton, Fulton County, GA # LIHTC Units: 53
PMA Boundary:
North: Skyview Dr/Six Flags Dr., East: I-285, South: South Fulton Pkwy, West: Bomar Road/Anneewakee Creek
Farthest Boundary Distance to Subject: 5.9 miles
RENTAL HOUSING STOCK – (found on pages 50, 54, 56-58)
Type # Properties Total Units Vacant Units Average Occupancy
All Rental Housing 32 6,543 173 97.4%
Market-Rate Housing 21 5,118 137 97.3%
Assisted/Subsidized Housing not to include LIHTC
LIHTC 11 1,425 36 97.5%
Stabilized Comps 29 6,013 104 98.3%
Properties in construction & lease up 3 530 69 86.9%
Subject Development Achievable Market Rent Highest Unadjusted Comp Rent
# Units
# Bedrooms
# Baths
Size (SF)
Proposed Tenant Rent
Per Unit Per SF Advantage Per Unit Per SF
7 1 1 653 $736* $1,127 $1.73 34.7% $1,398 $1.73
25 1 1 653 $758 $1,127 $1.73 32.8% $1,398 $1.73
4 1 1 653 $900 $1,127 $1.73 20.2% $1,398 $1.73
5 2 2 963 $734 $1,307 $1.36 43.9% $1,685 $1.38
16 2 2 963 $920 $1,307 $1.36 29.6% $1,685 $1.38
3 2 2 963 $1,050 $1,307 $1.36 19.7% $1,685 $1.38 *Lesser of proposed and Max LIHTC Rents shown for PBRA Units
CAPTURE RATES (found on page 46)
Targeted Population 50%
AMI/PBRA 50% AMI 60% AMI
LIHTC w/ PBRA
LIHTC w/o
PBRA Overall
Capture Rate 1.3% 1.3% 14.5% 7.2% 15.4% 6.3%

The Anthem at Riverside III | Introduction
Page 8
1. INTRODUCTION
A. Overview of Subject
The subject of this report is The Anthem at Riverside III, a proposed affordable age-restricted rental community in South Fulton, Fulton County, Georgia. The subject property will be the third phase of a planned three-phase development; the first phase was awarded nine percent Low Income Housing Tax Credits in 2018 and is undergoing initial lease up while the second phase was awarded nine percent Low Income Tax Credits in 2019 and is under construction. The Anthem at Riverside III will be a 60 unit age-restricted rental community financed in part with nine percent Low Income Housing Tax Credits (LIHTC) to be allocated by the Georgia Department of Community Affairs (DCA) and will be restricted to households with householder age 55 and older. Nine units will benefit from Project Based Rental Assistance (PBRA) through the Section 8 program and seven units will be market rate, unencumbered by tenant rent and income restrictions.
B. Purpose of Report
The purpose of this market study is to perform a market feasibility analysis through an examination of the economic context, a demographic analysis of the defined market area, a competitive housing analysis, a derivation of demand, and an affordability analysis.
C. Format of Report
The report format is comprehensive and conforms to DCA’s 2021 Market Study Manual and Qualified Allocation Plan (QAP). The market study also considered the National Council of Housing Market Analysts’ (NCHMA) recommended Model Content Standards and Market Study Index.
D. Client, Intended User, and Intended Use
The Client is Anthem Senior III, LP (Developer). Along with the Client, the Intended Users are DCA, potential lenders, and investors.
E. Applicable Requirements
This market study is intended to conform to the requirements of the following:
• DCA’s 2021 Market Study Manual and Qualified Allocation Plan (QAP).
• The National Council of Housing Market Analysts’ (NCHMA) Recommended Model Content.
F. Scope of Work
To determine the appropriate scope of work for the assignment, we considered the intended use of the market study, the needs of the user, the complexity of the property, and other pertinent factors. Our concluded scope of work is described below:
• Please refer to Appendix 5 for a detailed list of DCA requirements as well as the corresponding pages of requirements within the report.
• Tad Scepaniak (Managing Principal) conducted a site visit on May 11, 2020. Brett Welborn (Analyst) conducted site inspections for the first two phases of the development.

The Anthem at Riverside III | Introduction
Page 9
• Primary information gathered through field and phone interviews was used throughout the various sections of this report. The interviewees included rental community property managers and planning officials with South Fulton, Douglas County, and Cobb County.
• This report utilizes HUD’s 2020 Rent and Income Limits per DCA’s 2021 QAP.
• All pertinent information obtained was incorporated in the appropriate section(s) of this report.
G. Report Limitations
The conclusions reached in a market assessment are inherently subjective and should not be relied upon as a determinative predictor of results that will actually occur in the marketplace. There can be no assurance that the estimates made or assumptions employed in preparing this report will in fact be realized or that other methods or assumptions might not be appropriate. The conclusions expressed in this report are as of the date of this report, and an analysis conducted as of another date may require different conclusions. The actual results achieved will depend on a variety of factors, including the performance of management, the impact of changes in general and local economic conditions, and the absence of material changes in the regulatory or competitive environment. Reference is made to the statement of Underlying Assumptions and Limiting Conditions contained in Appendix I of this report.
H. Other Remarks
This market study was completed based on data collected in April and May 2021 during the national COVID-19 pandemic. Specific data on potential economic and demographic projections are not available at this time as household projections were developed prior to the onset of the pandemic; however, recent economic data including monthly unemployment data and quarterly At-Place Employment data provide an indication of the impact of the pandemic on specific markets relative to the state and nation. In the process of analyzing demographic projections including household growth and tenure trends, we have considered all available information including economic and competitive data. This market study will comment on the potential impact of the evolving situation on demand for multi-family rental housing.

The Anthem at Riverside III | Project Description
Page 10
2. PROJECT DESCRIPTION
A. Project Overview
The Anthem at Riverside III will comprise 60 age-restricted rental units targeting households with householder age 55 and older. The proposed unit mix includes 36 one bedroom units and 24 two bedroom units targeting senior households (55+) earning up to 60 percent of the Area Median Income (AMI); nine units will benefit from Project Based Rental Assistance (PBRA) through the Section 8 program and seven units will be market rate.
B. Project Type and Target Market
The Anthem at Riverside III will target very low, low, and moderate income senior renter households (55+). The subject property will primarily target singles and couples with a unit mix of one and two bedroom units.
C. Building Types and Placement
The proposed units will be contained within a four-story mid-rise building with secured entrances, interior hallways, and elevator service. The building will have wood frames with HardiPlank siding and brick exteriors (Figure 1). The subject property will have an entrance on Waycrest Drive. The mid-rise building will be “L” shaped with most community amenities integrated into the building; a courtyard with gardening area and covered picnic pavilion will be to the east of the subject property between Phase I and II; surface parking will be to the west and south of the building. Phase III is highlighted in orange in the upper left corner on the following figure.
Figure 1 Site Plan, The Anthem at Riverside III
Source: Anthem Senior III, LP
The Anthem at Riverside III | Project Description
Page 11
D. Detailed Project Description
1. Project Description
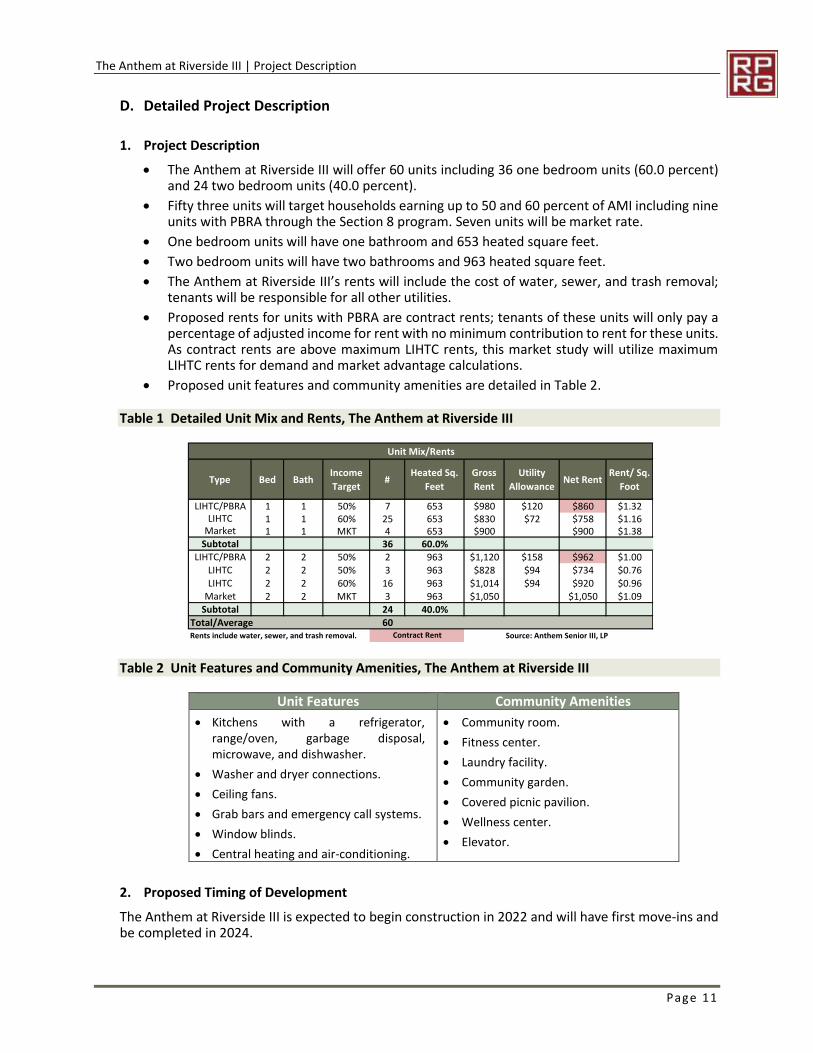
• The Anthem at Riverside III will offer 60 units including 36 one bedroom units (60.0 percent) and 24 two bedroom units (40.0 percent).
• Fifty three units will target households earning up to 50 and 60 percent of AMI including nine units with PBRA through the Section 8 program. Seven units will be market rate.
• One bedroom units will have one bathroom and 653 heated square feet.
• Two bedroom units will have two bathrooms and 963 heated square feet.
• The Anthem at Riverside III’s rents will include the cost of water, sewer, and trash removal; tenants will be responsible for all other utilities.
• Proposed rents for units with PBRA are contract rents; tenants of these units will only pay a percentage of adjusted income for rent with no minimum contribution to rent for these units. As contract rents are above maximum LIHTC rents, this market study will utilize maximum LIHTC rents for demand and market advantage calculations.
• Proposed unit features and community amenities are detailed in Table 2.
Table 1 Detailed Unit Mix and Rents, The Anthem at Riverside III
Table 2 Unit Features and Community Amenities, The Anthem at Riverside III
Unit Features Community Amenities
• Kitchens with a refrigerator, range/oven, garbage disposal, microwave, and dishwasher.
• Washer and dryer connections.
• Ceiling fans.
• Grab bars and emergency call systems.
• Window blinds.
• Central heating and air-conditioning.
• Community room.
• Fitness center.
• Laundry facility.
• Community garden.
• Covered picnic pavilion.
• Wellness center.
• Elevator.
2. Proposed Timing of Development
The Anthem at Riverside III is expected to begin construction in 2022 and will have first move-ins and be completed in 2024.
Unit Mix/Rents
Type Bed BathIncome
Target#
Heated Sq.
Feet
Gross
Rent
Utility
AllowanceNet Rent
Rent/ Sq.
Foot
LIHTC/PBRA 1 1 50% 7 653 $980 $120 $860 $1.32LIHTC 1 1 60% 25 653 $830 $72 $758 $1.16
Market 1 1 MKT 4 653 $900 $900 $1.38Subtotal 36 60.0%
LIHTC/PBRA 2 2 50% 2 963 $1,120 $158 $962 $1.00LIHTC 2 2 50% 3 963 $828 $94 $734 $0.76LIHTC 2 2 60% 16 963 $1,014 $94 $920 $0.96
Market 2 2 MKT 3 963 $1,050 $1,050 $1.09Subtotal 24 40.0%
Total/Average 60Rents include water, sewer, and trash removal. Source: Anthem Senior III, LPContract Rent

The Anthem at Riverside III | Site Evaluation
Page 12
3. SITE EVALUATION
A. Site Analysis
1. Site Location
The site for The Anthem at Riverside III is on the southwest corner of the Waycrest Drive and Riverside Drive SW intersection roughly one-quarter mile south of Fulton Industrial Boulevard in southwestern Fulton County, Georgia (Map 1).
Map 1 Site Location
Phase I of the development is undergoing initial lease up and Phase II is currently under construction. Phase III is currently a wooded parcel (Figure 2). The Anthem at Riverside III will be a 60 unit, age-restricted, mid-rise, LIHTC rental community.

The Anthem at Riverside III | Site Evaluation
Page 13
2. The Anthem at Riverside Development
Phase I of the development has been built and is open while Phase II is currently under construction. Phase III is currently a wooded parcel (Figure 2). The Anthem at Riverside III will be a 60 unit, age-restricted, mid-rise, LIHTC rental community.
Figure 2 Views of Subject Site
Site frontage along Waycrest Drive facing west
Site frontage along Waycrest Drive facing east
Phase I
Phase II

The Anthem at Riverside III | Site Evaluation
Page 14
3. General Description of Land Uses Surrounding the Subject Site
The subject site is just south of Fulton Industrial Boulevard which is a major north/south thoroughfare in western Fulton County; Fulton Industrial Boulevard includes large concentrations of industrial uses. The site is on the southern edge of dense industrial development along this thoroughfare. Panther Riverside Parc Apartments is adjacent to the site to the north and is the only residential use identified within one-half mile of the site. Large tracts of wooded land are directly south, east, and west of the site. Residential uses are common roughly one mile south and east of the site including primarily moderate to upper value single-family detached homes in generally good condition (Figure 3).
Figure 3 Satellite Image of Subject Site

The Anthem at Riverside III | Site Evaluation
Page 15
4. Land Uses Surrounding the Subject Site
The land uses surrounding the subject site are as follows (Figure 4):
• North: Panther Riverside Parc Apartments, Quaker Southeast Distribution Center, Sto Corp., and the Gateway Atlanta Industrial Park
• East: Wooded land
• South: Wooded land
• West: Wooded land
Figure 4 Views of Surrounding Land Uses
Panther Riverside Parc Apartments to the north.
Sto Corp. manufacturing facility to the north.
Quaker Southeast Distribution Center to the
northeast.
Atlanta Gateway Industrial Park to the north.
Wooded land to the south along Riverside Drive
SW.

The Anthem at Riverside III | Site Evaluation
Page 16
B. Neighborhood Analysis
1. General Description of Neighborhood
The subject site is just south of Fulton Industrial Boulevard which is a major north/south thoroughfare running along the Chattahoochee River near the border of Fulton and Cobb/Douglas Counties. The Fulton Industrial Boulevard corridor consists primarily of small to large industrial centers with restaurants and convenience stores also common. The site is on the southern edge of the densest industrial development on Fulton Industrial Boulevard with areas to the south more sparsely developed. Land uses outside of this industrial area are primarily residential with single-family detached homes with a range of values (modest to upper) and multi-family rental communities common to the south and east of the site. The subject site is within roughly one mile of the Chattahoochee River which is Fulton County’s border with Douglas County and Cobb County. The areas of Cobb County and Douglas County south of Interstate 20 and near the Chattahoochee River have a similar neighborhood composition including industrial uses along the Chattahoochee River and residential uses extending outward.
2. Neighborhood Planning Activities
New development in the subject site’s immediate vicinity is limited as the Fulton Industrial Boulevard corridor is densely developed and largely built-out. The newest development near the site is Panther Riverside Parc Apartments, which is adjacent to the site and was built in 2009. Several new for-sale single-family detached home and townhome neighborhoods were identified within three miles of the site with prices generally ranging from $200,000 to $400,000. One of the closest new communities is Waterford Commons by DR Horton Homes to the south near Campbellton Road. Amazon recently constructed a large facility near the intersection of Campbellton Road and Fulton Industrial Parkway roughly two miles south of the site. The $62.5 million facility was announced in 2020 is expected to create roughly 500 jobs once fully operational later this year.
3. Public Safety
CrimeRisk is a census tract level index that measures the relative risk of crime compared to a national average. AGS analyzes known socio-economic indicators for local jurisdictions that report crime statistics to the FBI under the Uniform Crime Reports (UCR) program. An index of 100 reflects a total crime risk on par with the national average, with values below 100 reflecting below average risk and values above 100 reflecting above average risk. Based on detailed modeling of these relationships, CrimeRisk provides a detailed view of the risk of total crime as well as specific crime types at the census tract level. In accordance with the reporting procedures used in the UCR reports, aggregate indexes have been prepared for personal and property crimes separately as well as a total index. However, it must be recognized that these are un-weighted indexes, in that a murder is weighted no more heavily than purse snatching in this computation. The analysis provides a useful measure of the relative overall crime risk in an area but should be used in conjunction with other measures.
The 2020 CrimeRisk Index for the census tracts in the general vicinity of the subject site are color coded with the site’s census tract being light blue, indicating a crime risk (200 to 299) above the national average (100) (Map 2). This crime risk is comparable to much of the market area including the location of a majority of the most comparable rental communities. Based on this data and field observations, we do not expect crime or the perception of crime to negatively impact the subject property’s marketability. Furthermore, the subject will have controlled access entrances which will enhance overall security.

The Anthem at Riverside III | Site Evaluation
Page 17
Map 2 Crime Index
C. Site Visibility and Accessibility
1. Visibility
The Anthem at Riverside III will have visibility from Riverside Drive SW and Waycrest Drive, both of have light traffic. Awareness for the subject property will be enhanced given its entrance will be adjacent to a 280-unit rental community (Panther Riverside Parc) and its two sister communities.
2. Vehicular Access
The subject property will be accessible via an entrance on Waycrest Drive to the north which has light traffic; RPRG does not anticipate problems with accessibility. Turn lanes on Riverside Drive facilitate access to Waycrest Drive for both north and southbound traffic. Riverside Drive SW connects to Fulton Industrial Boulevard roughly one-quarter mile north of the site.
3. Availability of Public Transit and Interregional Transit
The Metropolitan Atlanta Rapid Transit Authority (MARTA) is the major provider of mass transit in the Metro Atlanta area. MARTA provides both fixed-route bus service and a heavy rail system traveling primarily throughout Fulton and DeKalb Counties, inside and outside of the Atlanta city limits. The Anthem at Riverside III is roughly one-quarter mile south of a MARTA bus stop at the intersection of Fulton Industrial Boulevard and Riverside Drive SW on Route 73. Route 73 runs along Fulton Industrial Boulevard and M.L.K. Jr. Drive NW connecting the site to additional bus routes and the Hamilton E

The Anthem at Riverside III | Site Evaluation
Page 18
Holmes Rail Station. The Hamilton E Holmes MARTA Station provides rail service on the Blue Line, which travels in an east and west direction.
From a regional perspective, the subject site is within six miles of both Interstate 20 and Interstate 285 which connect the site to the Atlanta Metro Area and the southeastern United States. State Highways 6 (Camp Creek Parkway) and 70 (Fulton Industrial Parkway) are both within one mile of the site providing access to the region west of Atlanta. Hartsfield-Jackson International Airport is the closest major airport to the site at approximately 10 miles to the southeast.
4. Pedestrian Access
All neighborhood amenities are at least one mile from the site and are not walkable except for a MARTA bus stop which is roughly one-quarter mile from the site on Fulton Industrial Boulevard and is walkable given light traffic on Riverside Drive and a sidewalk along a portion of the road. The lack of walkability is not a concern given the commuter nature of the area; most multi-family communities in the region are not within walking distance of commercial uses.
5. Accessibility Improvements under Construction and Planned
RPRG reviewed information from local stakeholders to assess whether any capital improvement projects affecting road, transit, or pedestrian access to the subject site are currently underway or likely to commence within the next few years. Observations made during the site visit contributed to this process. Through this research, RPRG did not identify any major roadway or transit improvements that would have a direct impact on the site.
D. Residential Support Network
1. Key Facilities and Services near the Subject Site
The appeal of any given community is often based in part to its proximity to those facilities and services required daily. Key facilities and services and their distances from the subject site are listed in Table 3 and their locations are plotted on Map 3.
Table 3 Key Facilities and Services
Establishment Type Address
Driving
DistanceMARTA Public Transit Fulton Industrial Blvd. @ Tradewater Pkwy. 0.2 mile
CVS Pharmacy 5815 Campbellton Rd. SW 1 mile
Fulton County Fire Department Fire 5890 Plummer Rd. SW 1.3 miles
Bank of America Bank 5695 Fulton Industrial Blvd. SW 2.1 miles
QuikTrip Convenience Store 5705 Fulton Industrial Blvd. SW 2.1 miles
US Post Office Post Office 5686 Fulton Industrial Blvd. SW 2.1 miles
Sandtown Park & Gymnasium Public Park 5320 Campbellton Rd. 2.1 miles
Concentra Urgent Care Doctor/Medical 5670 Fulton Industrial Blvd. SW 2.2 miles
Shell Convenience Store 5630 Fulton Industrial Blvd. SW 2.3 miles
Fulton County Police Department Police 141 Pryor St. SW 2.9 miles
Wolf Creek Library Library 3100 Enon Rd. SW 3.2 miles
Family Dollar General Retail 4472 Campbellton Rd. SW 4.2 miles
Dollar General General Retail 4465 Campbellton Rd. SW 4.2 miles
Walmart General Retail 1100 Thornton Rd. 5.5 miles
Publix Grocery 3695 Cascade Rd. 6.2 miles
Walmart General Retail 1105 Research Center Dr. SW 6.7 miles
Greenbriar Mall Mall 2841 Greenbriar Pkwy. SW 7.1 miles
Harriett G Darnell Sr. Facility Senior Center 677 Fairburn Rd. NW 8 miles
Wellstar Douglas Hospital Hospital 8954 Hospital Dr. 10.9 miles
Source: Field and Internet Research, RPRG, Inc.

The Anthem at Riverside III | Site Evaluation
Page 19
Map 3 Location of Key Facilities and Services
2. Essential Services
Health Care
Wellstar Douglas Hospital is the closest major medical center to the site at 10.9 miles to the west in Douglasville. This 108-bed hospital offers a full range of services including emergency medicine, imaging, laboratory, cardiology, surgical, obstetrical, and newborn care, and general medicine.
Concentra Urgent Care offers family medicine services 2.2 miles north of the site on Fulton Industrial Boulevard.
Senior Services
The Harriett G Darnell Multi-purpose Senior Facility is eight miles northeast of the site on Fairburn Road. The center offers senior services, a fitness center, a 350-seat auditorium and cafeteria, a heated pool, a library, conference rooms, gardens, and walking trails. Planned activities include fitness classes, art classes, and nutritional education.
3. Commercial Goods and Services
Convenience Goods
The term “convenience goods” refers to inexpensive, nondurable items that households purchase on a frequent basis and for which they generally do not comparison shop. Examples of convenience goods are groceries, fast food, health and beauty aids, household cleaning products, newspapers, and gasoline.

The Anthem at Riverside III | Site Evaluation
Page 20
The Anthem at Riverside III will be within one mile of a pharmacy (CVS) on Campbellton Road and within roughly two miles of two convenience stores (QuikTrip and Shell) and a bank (Bank of America) on Fulton Industrial Boulevard. Several restaurants are also within two miles of the site. The closest grocery store is Publix, roughly six miles east of the site near the Cascade Road and Interstate 285 interchange.
Comparison Goods
The term “comparison goods” refers to larger ticket merchandise that households purchase on an infrequent basis and for which they usually comparison shop.
Family Dollar and Dollar General are roughly four miles east of the site on Campbellton Road. Walmart Supercenter is 5.5 miles east of the site near the Cascade Road and Interstate 285 interchange and an additional Walmart Supercenter is 6.7 miles northwest of the site in Lithia Springs. Greenbriar Mall is roughly seven miles east of the site and is anchored by Macy’s. The mall also offers many smaller retailers and a food court.
4. Location of Low-Income Housing
A list and map of existing low-income housing in the Anthem Market Area are provided in the Existing Low-Income Rental Housing section of this report, starting on page 58.
E. Site Conclusion
The subject site is within roughly two miles of neighborhood amenities including public transit (within one-quarter mile on Fulton Industrial Boulevard), medical facilities, recreation, a pharmacy, a bank, and convenience stores. Additional amenities including shopping are a greater distance from the site but convenient from local thoroughfares. The site is appropriate for the proposed use of affordable senior rental housing.
The Anthem at Riverside III | Market Area
Page 21
4. MARKET AREA
A. Introduction
The primary market area for The Anthem at Riverside III is defined as the geographic area from which future residents of the community would primarily be drawn and in which competitive rental housing alternatives are located. In defining the market area, RPRG sought to accommodate the joint interests of conservatively estimating housing demand and reflecting the realities and dynamics of the local rental housing marketplace.
B. Delineation of Market Area
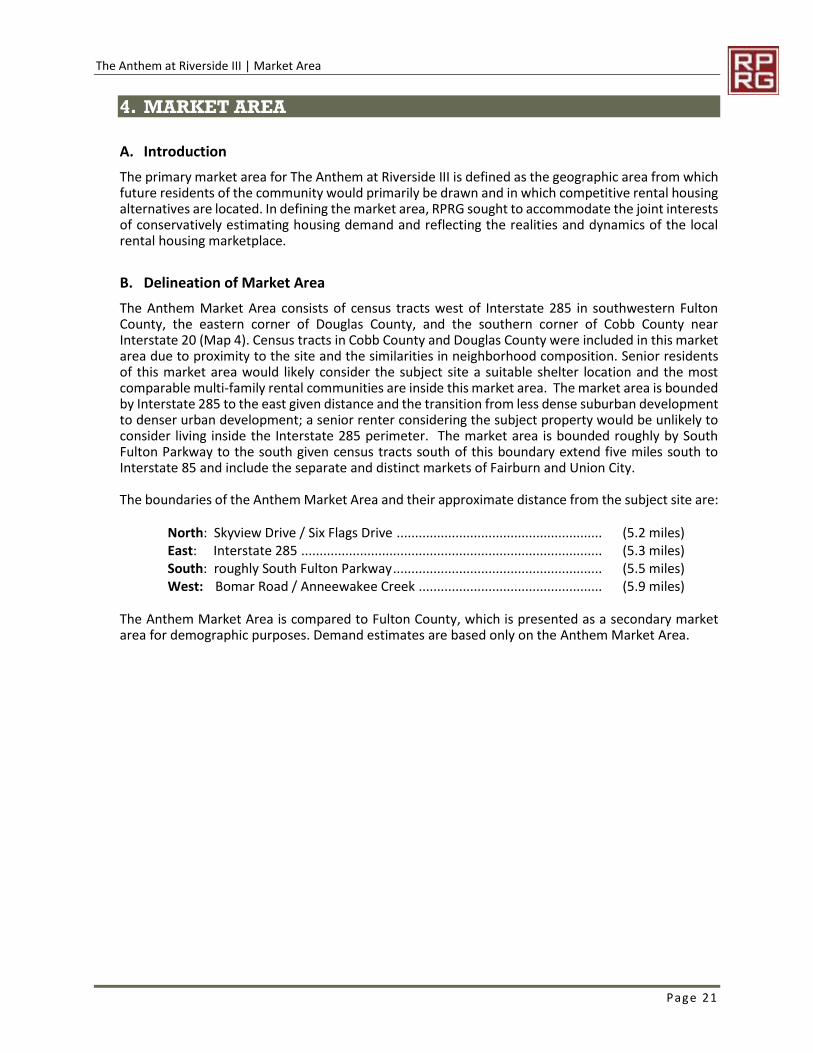
The Anthem Market Area consists of census tracts west of Interstate 285 in southwestern Fulton County, the eastern corner of Douglas County, and the southern corner of Cobb County near Interstate 20 (Map 4). Census tracts in Cobb County and Douglas County were included in this market area due to proximity to the site and the similarities in neighborhood composition. Senior residents of this market area would likely consider the subject site a suitable shelter location and the most comparable multi-family rental communities are inside this market area. The market area is bounded by Interstate 285 to the east given distance and the transition from less dense suburban development to denser urban development; a senior renter considering the subject property would be unlikely to consider living inside the Interstate 285 perimeter. The market area is bounded roughly by South Fulton Parkway to the south given census tracts south of this boundary extend five miles south to Interstate 85 and include the separate and distinct markets of Fairburn and Union City.
The boundaries of the Anthem Market Area and their approximate distance from the subject site are:
North: Skyview Drive / Six Flags Drive ........................................................ (5.2 miles) East: Interstate 285 .................................................................................. (5.3 miles) South: roughly South Fulton Parkway ......................................................... (5.5 miles) West: Bomar Road / Anneewakee Creek .................................................. (5.9 miles)
The Anthem Market Area is compared to Fulton County, which is presented as a secondary market area for demographic purposes. Demand estimates are based only on the Anthem Market Area.

The Anthem at Riverside III | Market Area
Page 22
Map 4 Anthem Market Area

The Anthem at Riverside III | Community Demographic Data
Page 23
5. COMMUNITY DEMOGRAPHIC DATA
A. Introduction and Methodology
RPRG analyzed recent trends in population and households in the Anthem Market Area and Fulton County using several sources. For small area estimates, we examined projections of population and households prepared by Esri, a national data vendor. We compared and evaluated data in the context of decennial U.S. Census data from 2000 and 2010 as well as building permit trend information. Demographic data is presented for 2010, 2021, and 2024 per DCA’s 2021 Market Study Guide.
We recognize that available demographic estimates and projections were largely developed prior to the onset of the national COVID-19 pandemic. At its onset, the national pandemic was expected by many to have a significant negative impact on short term economic growth and thus potentially reducing housing demand. The availability and significant administration of vaccines as well as the recently passed $1.9 trillion federal coronavirus relief package are expected to accelerate economic recovery following economic disruption experienced during the second and third quarters of 2020. As evidenced by recent economic indicators, current development activity, and market conditions, the pandemic has not had a significant long term impact on most markets’ household growth or housing demand. As the demographic projections utilized in this report were largely developed prior to the COVID-19 pandemic, they do not reflect the impact of COVID 19 on population and household growth. The demographic projections in this section have not been altered; however, RPRG will discuss the potential impact of the COVID-19 pandemic on housing demand over the projection period in the Findings and Conclusions section of this report.
B. Trends in Population and Households
1. Recent Past Trends
The Anthem Market Area grew significantly in the previous decade with the net addition of 38,016 people (69.3 percent) and 15,200 households (76.5 percent) between the 2000 and 2010 census counts (Table 4). Growth is estimated to have slowed but remained strong over the past eleven years with the net addition of 17,043 people (18.3 percent) and 6,163 households (17.6 percent) from 2010 to 2021; annual growth was 1,549 people (1.5 percent) and 560 households (1.5 percent) over this period.
Population and household growth rates in Fulton County were steady but significantly slower than in the Anthem Market Area from 2000 to 2010 with annual growth of 1.2 percent among population and 1.6 percent among households. Annual growth rates in Fulton County were similar to the market area over the past eleven years at 1.6 percent among population and 1.7 percent among households from 2010 to 2021.
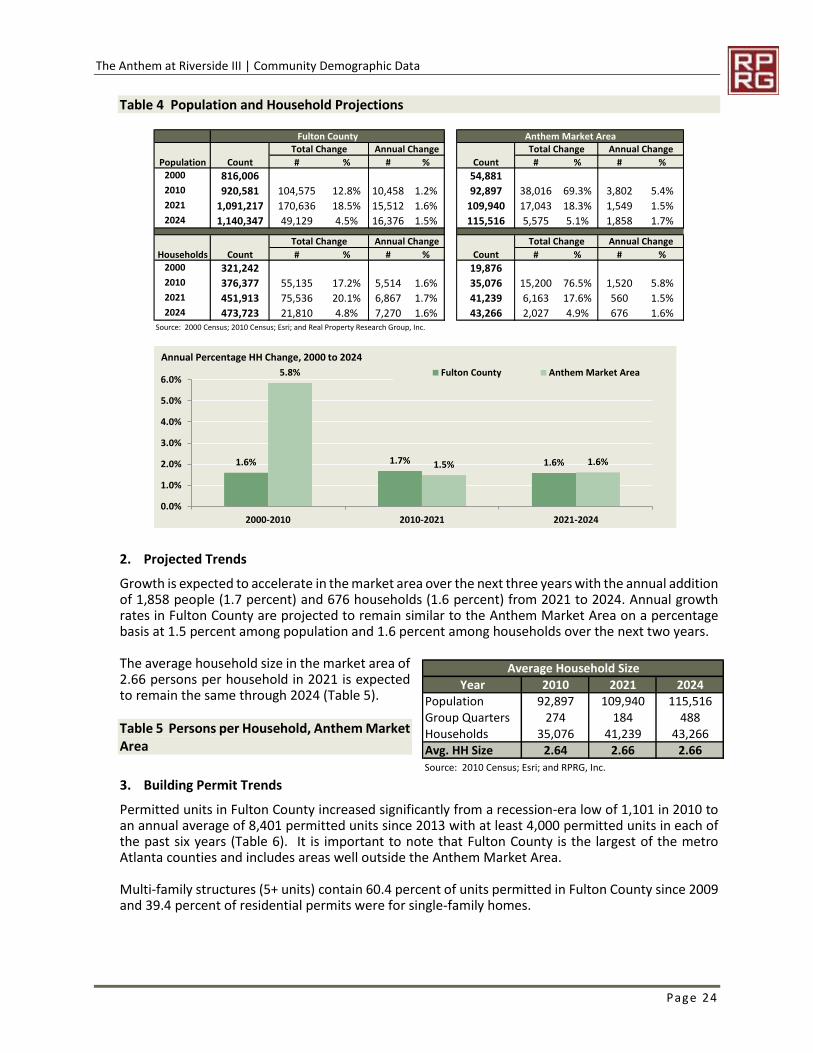
The Anthem at Riverside III | Community Demographic Data
Page 24
Table 4 Population and Household Projections
2. Projected Trends
Growth is expected to accelerate in the market area over the next three years with the annual addition of 1,858 people (1.7 percent) and 676 households (1.6 percent) from 2021 to 2024. Annual growth rates in Fulton County are projected to remain similar to the Anthem Market Area on a percentage basis at 1.5 percent among population and 1.6 percent among households over the next two years.
The average household size in the market area of 2.66 persons per household in 2021 is expected to remain the same through 2024 (Table 5).
Table 5 Persons per Household, Anthem Market Area
3. Building Permit Trends
Permitted units in Fulton County increased significantly from a recession-era low of 1,101 in 2010 to an annual average of 8,401 permitted units since 2013 with at least 4,000 permitted units in each of the past six years (Table 6). It is important to note that Fulton County is the largest of the metro Atlanta counties and includes areas well outside the Anthem Market Area.
Multi-family structures (5+ units) contain 60.4 percent of units permitted in Fulton County since 2009 and 39.4 percent of residential permits were for single-family homes.
Fulton County Anthem Market AreaTotal Change Annual Change Total Change Annual Change
Population Count # % # % Count # % # %2000 816,006 54,8812010 920,581 104,575 12.8% 10,458 1.2% 92,897 38,016 69.3% 3,802 5.4%2021 1,091,217 170,636 18.5% 15,512 1.6% 109,940 17,043 18.3% 1,549 1.5%2024 1,140,347 49,129 4.5% 16,376 1.5% 115,516 5,575 5.1% 1,858 1.7%
Total Change Annual Change Total Change Annual Change
Households Count # % # % Count # % # %2000 321,242 19,8762010 376,377 55,135 17.2% 5,514 1.6% 35,076 15,200 76.5% 1,520 5.8%2021 451,913 75,536 20.1% 6,867 1.7% 41,239 6,163 17.6% 560 1.5%2024 473,723 21,810 4.8% 7,270 1.6% 43,266 2,027 4.9% 676 1.6%
Source: 2000 Census; 2010 Census; Esri; and Real Property Research Group, Inc.
1.6% 1.7% 1.6%
5.8%
1.5% 1.6%
0.0%
1.0%
2.0%
3.0%
4.0%
5.0%
6.0%
2000-2010 2010-2021 2021-2024
Fulton County Anthem Market Area
Annual Percentage HH Change, 2000 to 2024
Year 2010 2021 2024Population 92,897 109,940 115,516Group Quarters 274 184 488Households 35,076 41,239 43,266Avg. HH Size 2.64 2.66 2.66Source: 2010 Census; Esri; and RPRG, Inc.
Average Household Size

The Anthem at Riverside III | Community Demographic Data
Page 25
Table 6 Building Permits by Structure Type, Fulton County
4. Trends in Older Adult Households
Senior households (ages 55 and older) are expected to increase significantly faster than total households on a percentage basis in the Anthem Market Area; senior household growth includes both net migration and aging in place. The Anthem Market Area had 11,147 households with householder age 55+ as of the 2010 Census and is estimated to have added 381 households with householder age 55+ per year from 2010 to 2021 (2.9 percent annual growth) (Table 7). Households with householder age 55+ are projected to increase at an annual rate of 2.1 percent or 326 households from 2021 to 2024.
Table 7 Trends in Senior Households, Anthem Market Area
C. Demographic Characteristics
1. Age Distribution and Household Type
The Anthem Market Area is similar to Fulton County with a median age of 35. Reflecting its suburban location and large percentage of families, the Anthem Market Area has a large proportion of Adults and Children/Youth. Adults age 35-61 comprise the largest percentage of the Anthem Market Area’s population at 35.2 percent and Children/Youth under the age of 20 account for 27.9 percent of the population (Table 8). Young Adults comprise 21.2 percent of the Anthem Market Area’s population and Seniors age 62 and older account for 15.7 percent of the population. Fulton County has a larger proportion of Young Adults and Seniors and a smaller proportion of Children/Youth when compared to the market area.
2009 775 8 4 742 1,529
2010 783 0 7 311 1,101
2011 961 4 7 982 1,954
2012 1,668 0 4 1,760 3,432
2013 2,121 6 20 6,111 8,258
2014 2,405 14 0 5,679 8,098
2015 3,016 8 0 6,681 9,705
2016 3,281 10 0 8,120 11,411
2017 3,766 6 4 5,248 9,024
2018 4,394 10 0 5,647 10,051
2019 3,817 2 9 2,568 6,396
2020 2,822 10 0 1,431 4,263
2009-2020 29,034 70 51 44,538 73,693
Ann. Avg. 2,639 6 5 4,049 6,699
5+
Units
Ann.
TotalYear
Single -
Unit
Two
Units
3-4
Units
Fulton County
1,5291,101
1,954
3,432
8,2588,098
9,705
11,411
9,024
10,051
6,396
4,263
0
2,000
4,000
6,000
8,000
10,000
12,000
2009 2010 2011 2012 2013 2014 2015 2016 2017 2018 2019 2020
Total Housing Units Permitted 2009 - 2020
Anthem Market Area Total Annual Total AnnualAge of HH 2010 2021 2024 # % # % # % # %55 to 61 4,188 37.6% 4,835 31.5% 4,996 30.6% 647 15.4% 59 1.3% 161 3.3% 54 1.1%62-64 1,689 15.2% 2,072 13.5% 2,141 13.1% 383 22.7% 35 1.9% 69 3.3% 23 1.1%65 to 74 3,533 31.7% 5,499 35.9% 5,733 35.1% 1,966 55.6% 179 4.1% 234 4.3% 78 1.4%75 and older 1,737 15.6% 2,929 19.1% 3,441 21.1% 1,192 68.6% 108 4.9% 512 17.5% 171 5.5%
Householders
55+11,147 15,334 16,311 4,187 37.6% 381 2.9% 977 6.4% 326 2.1%
All
Households35,076 41,239 43,266 6,163 17.6% 560 1.5% 2,027 4.9% 676 1.6%
Source: 2010 Census; Esri; RPRG
Change 2010 to 2021 Change 2021 to 2024

The Anthem at Riverside III | Community Demographic Data
Page 26
Table 8 Age Distribution
Households with children were the most common household type in the Anthem Market Area as of the 2010 Census at 40.3 percent. Nearly one-third (31.9 percent) of market area households were multi-person households without children including 17.8 percent married households without children which includes empty nesters, a primary target market of the subject property. Roughly 28 percent of market area households were single-person households (Table 9). Fulton County had a significantly lower percentage of households with children and a significantly higher percentage of single-person households when compared to the market area.
Table 9 Households by Household Type
2. Renter Household Characteristics
Almost 34 percent of households in the Anthem Market Area rent in 2021, lower than the 47.5 percent in Fulton County; the renter percentage increased in the market area but decreased in the county since 2000 (Table 10). The market area’s renter percentage is projected increase slightly to 34 percent.
# % # %Children/Youth 268,027 24.6% 30,683 27.9% Under 5 years 65,044 6.0% 7,723 7.0% 5-9 years 65,310 6.0% 8,017 7.3% 10-14 years 66,241 6.1% 7,953 7.2% 15-19 years 71,432 6.5% 6,989 6.4%Young Adults 261,902 24.0% 23,276 21.2% 20-24 years 81,813 7.5% 6,833 6.2% 25-34 years 180,089 16.5% 16,443 15.0%Adults 383,994 35.2% 38,676 35.2% 35-44 years 154,642 14.2% 15,166 13.8% 45-54 years 141,646 13.0% 15,264 13.9% 55-61 years 87,706 8.0% 8,246 7.5%Seniors 177,294 16.2% 17,306 15.7% 62-64 years 37,588 3.4% 3,534 3.2% 65-74 years 85,523 7.8% 8,858 8.1% 75-84 years 38,737 3.5% 3,969 3.6% 85 and older 15,445 1.4% 945 0.9%
TOTAL 1,091,217 100% 109,940 100%
Median Age
Source: Esri; RPRG, Inc.
35 35
Fulton CountyAnthem Market
Area2021 Age
Distribution
24.6%
24.0%
35.2%
16.2%
27.9%
21.2%
35.2%
15.7%
0% 10% 20% 30% 40%
Child/Youth
YoungAdults
Adults
Seniors
% PopTy
pe
2021 Age Distribution
Anthem Market Area Fulton County
# % # %
Married w/Children 66,799 17.7% 6,924 19.7%
Other w/ Children 49,326 13.1% 7,221 20.6%
Households w/ Children 116,125 30.9% 14,145 40.3%
Married w/o Children 67,509 17.9% 6,260 17.8%
Other Family w/o Children 26,434 7.0% 3,294 9.4%
Non-Family w/o Children 33,002 8.8% 1,625 4.6%
Households w/o Children 126,945 33.7% 11,179 31.9%
Singles 133,307 35.4% 9,752 27.8%
Total 376,377 100% 35,076 100%
Source: 2010 Census; RPRG, Inc.
2010 Households by
Household Type
Fulton CountyAnthem
Market Area
35.4%
33.7%
30.9%
27.8%
31.9%
40.3%
0% 10% 20% 30% 40% 50%
Singles
HH w/oChildren
HH w/Children
% HouseholdsHo
use
ho
ld T
ype
2010 Households by Household TypeAnthem Market Area Fulton County

The Anthem at Riverside III | Community Demographic Data
Page 27
Table 10 Households by Tenure 2000 - 2024
Lower than the overall renter percentage, 24.1 percent of senior households (55+) are renters in the market area compared to 33.2 percent in Fulton County (Table 11).
Table 11 Senior Households by Tenure (55+)
Working age households (ages 25 to 54) form the core of renter households in the Anthem Market Area at two-thirds (66.3 percent) of renter households. More than one-quarter (26.4 percent) of market area renters are ages 55 years and older including 13.8 percent ages 65 and older and less than eight percent are under 25 years old (Table 12). Fulton County renters are generally younger with a significantly larger proportion of renters under 35 years old when compared to the market area (41.3 percent versus 34.6 percent).
Table 12 Renter Households by Age of Householder
Fulton County 2000 2010 2021 2024Housing Units # % # % # % # %Owner Occupied 167,119 52.0% 202,262 53.7% 237,045 52.5% 245,039 51.7%Renter Occupied 154,123 48.0% 174,115 46.3% 214,868 47.5% 228,684 48.3%Total Occupied 321,242 100% 376,377 100% 451,913 100% 473,723 100%
Total Vacant 27,390 60,728 56,903 56,313TOTAL UNITS 348,632 437,105 508,816 530,036
Anthem Market
Area
Housing Units # % # % # % # %
Owner Occupied 13,407 67.5% 22,414 63.9% 27,251 66.1% 28,565 66.0%
Renter Occupied 6,469 32.5% 12,662 36.1% 13,988 33.9% 14,701 34.0%
Total Occupied 19,876 100.0% 35,076 100.0% 41,239 100.0% 43,266 100.0%
Total Vacant 1,253 4,592 3,725 3,768
TOTAL UNITS 21,129 39,668 44,963 47,034
Source: 2000 Census; 2010 Census; Esri; RPRG, Inc.
202420212000 2010
Senior Households 55+ Fulton County
Anthem Market
Area
2021 Households # % # %Owner Occupied 110,041 66.8% 11,642 75.9%Renter Occupied 54,681 33.2% 3,692 24.1%Total Occupied 164,722 100.0% 15,334 100.0%
Source: 2000 Census; 2010 Census; ESRI; RPRG
Renter
HouseholdsFulton County
Anthem Market
Area
Age of HHldr # % # %15-24 years 22,989 10.7% 1,020 7.3% 225-34 years 65,665 30.6% 3,813 27.3% 235-44 years 41,371 19.3% 2,909 20.8% 145-54 years 30,161 14.0% 2,554 18.3% 155-64 years 23,879 11.1% 1,759 12.6%65-74 years 16,501 7.7% 1,187 8.5% 175+ years 14,301 6.7% 746 5.3% 2Total 214,868 100% 13,988 100%Source: Esri, Real Property Research Group, Inc.
10.7%
30.6%
19.3%
14.0%
11.1%
7.7%
6.7%
7.3%
27.3%
20.8%
18.3%
12.6%
8.5%
5.3%
0% 10% 20% 30% 40%
15-24
25-34
35-44
45-54
55-64
65-74
75+
Age
of
Ho
use
ho
lder
2021 Renter HHs by Age of HHldrAnthem Market Area
Fulton County

The Anthem at Riverside III | Community Demographic Data
Page 28
Nearly 59 percent of all renter households in the market area contained one or two people including 35.4 percent with one person (Table 13). Approximately 29 percent of market area renter households had three or four people and 12.3 percent were large households with five or more people. Fulton County renter households were smaller when compared to the market area with a larger proportion of one and two-person households and a smaller proportion of renter households with three or more people.
Table 13 Renter Households by Household Size
3. Income Characteristics
The 2021 median income in the Anthem Market Area is $66,765, $7,950 or 10.6 percent below the $74,715 median in Fulton County (Table 14). Roughly 24 percent of market area households earn less than $35,000, 32.5 percent earn incomes of $35,000 to $74,999, and 43.7 percent earn incomes of at least $75,000 including 30.7 percent earning $100,000 or more.
Table 14 Household Income
Senior households (55+) in the Anthem Market Area have a 2021 median income of $55,043 per year, 22.4 percent lower than the $67,346 median in Fulton County (Table 15). The market area includes a significant proportion of low to moderate income senior households (55+) with 22.3 percent earning less than $25,000, 23.8 percent earning $25,000 to $49,999, and 19.5 percent earning $50,000 to $74,999. Approximately 34 percent of market area senior households (55+) earn upper incomes of at least $75,000. Fulton County has a larger proportion of senior households (55+) earning $100,000 or more when compared to the market area (36.0 percent versus 23.1 percent).
Fulton CountyAnthem
Market Area
# % # %1-person hhld 76,903 44.2% 4,482 35.4%
2-person hhld 44,044 25.3% 2,935 23.2%
3-person hhld 22,463 12.9% 2,142 16.9%
4-person hhld 14,953 8.6% 1,547 12.2%
5+-person hhld 15,752 9.0% 1,556 12.3%
TOTAL 174,115 100% 12,662 100%
Source: 2010 Census
Renter
Occupied
44.2%
25.3%
12.9%
8.6%
9.0%
35.4%
23.2%
16.9%
12.2%
12.3%
0% 20% 40% 60%
1-person
2-person
3-person
4-person
5+-person
Ho
use
hold
Siz
e
2010 Persons per Renter HH
AnthemMarket Area
Fulton County
# % # %
less than $15,000 41,846 9.3% 3,425 8.3% 2
$15,000 $24,999 31,256 6.9% 3,073 7.5% 3
$25,000 $34,999 29,065 6.4% 3,298 8.0% 4
$35,000 $49,999 46,001 10.2% 5,570 13.5% 5
$50,000 $74,999 78,682 17.4% 7,835 19.0% 6
$75,000 $99,999 50,444 11.2% 5,366 13.0% 7
$100,000 $149,999 65,092 14.4% 6,759 16.4% 8
$150,000 Over 109,527 24.2% 5,914 14.3% 9
Total 451,913 100% 41,239 100% 10
Median Income $74,715 $66,765 Source: Esri; Real Property Research Group, Inc.
Anthem Market
AreaFulton CountyEstimated 2021
Household Income
9.3%
6.9%
6.4%
10.2%
17.4%
11.2%
14.4%
24.2%
8.3%
7.5%
8.0%
13.5%
19.0%
13.0%
16.4%
14.3%
0% 5% 10% 15% 20% 25% 30%
<$15K
$15-$24K
$25-$34K
$35-$49K
$50-$74K
$75-$99K
$100-$149K
$150+k
2021 Household Income
Anthem Market Area
Fulton County

The Anthem at Riverside III | Community Demographic Data
Page 29
Table 15 Senior Household Income, Households 55+
Based on the U.S. Census Bureau’s American Community Survey (ACS) data and breakdown of tenure and household estimates, the 2021 median income for senior householders (age 55 and older) in the Anthem Market Area is $43,770 for renters and $60,146 for owners (Table 16). Approximately 28 percent of senior renter households earn less than $25,000 including 14.5 percent earning less than $15,000. Roughly 29 percent of senior renter households (55+) earn $25,000 to $49,999 and 23.8 percent earn $50,000 to $74,999.
Table 16 Senior Household Income by Tenure, Households 55+
Approximately 37 percent of senior renter households (55+) in the Anthem Market Area pay at least 40 percent of income for rent (Table 17). Approximately 2.5 percent of renter households are living in substandard conditions; this includes only overcrowding and incomplete plumbing.
# % # %
less than $15,000 20,517 12.5% 1,793 11.7%
$15,000 $24,999 15,495 9.4% 1,625 10.6%
$25,000 $34,999 11,059 6.7% 1,419 9.3%
$35,000 $49,999 16,622 10.1% 2,227 14.5%
$50,000 $74,999 26,904 16.3% 2,992 19.5%
$75,000 $99,999 14,876 9.0% 1,731 11.3%
$100,000 $149,999 21,361 13.0% 1,792 11.7%
$150,000 $199,999 10,764 6.5% 720 4.7%
$200,000 over 27,123 16.5% 1,035 6.7%
Total 164,722 100% 15,334 100%
Median IncomeSource: American Community Survey 2015-2019 Estimates, RPRG, Inc.
2021 HH Income for
Householders 55+
Anthem
Market AreaFulton County
$55,043 $67,346
11.7%
10.6%
9.3%
14.5%
19.5%
11.3%
11.7%
4.7%
6.7%
12.5%
9.4%
6.7%
10.1%
16.3%
9.0%
13.0%
6.5%
16.5%
0.0% 5.0% 10.0% 15.0% 20.0% 25.0%
<$15K
$15-$24K
$25-$34K
$35-$49K
$50-$74K
$75-$99K
$100-$149K
$150-$199K
$200K>
% of Households
Ho
use
ho
ld I
nco
me
Fulton County
Anthem Market Area
2021 HH Income for Householders 55+
# % # %
less than $15,000 535 14.5% 1,258 10.8% 2
$15,000 $24,999 485 13.1% 1,140 9.8% 3
$25,000 $34,999 469 12.7% 950 8.2% 4
$35,000 $49,999 612 16.6% 1,615 13.9% 5
$50,000 $74,999 879 23.8% 2,113 18.2% 6
$75,000 $99,999 296 8.0% 1,435 12.3% 7
$100,000 $149,999 300 8.1% 1,493 12.8% 8
$150,000 $199,999 73 2.0% 647 5.6% 9
$200,000 over 44 1.2% 991 8.5% 10
Total 3,692 100% 11,642 100%
Median Income 23
Source: American Community Survey 2015-2019 Estimates, RPRG, Inc.
Renter
Households
Owner
Households
$43,770 $60,146
Anthem Market Area
Householders 55+
535
485
469
612
879
296
300
73
44
1,258
1,140
950
1,615
2,113
1,435
1,493
647
991
0 500 1,000 1,500 2,000 2,500
<$15K
$15-$24K
$25-$34K
$35-$49K
$50-$74K
$75-$99K
$100-$149K
$150-$199K
$200K>
# of Households
Ho
use
ho
ld I
nco
me
2021 HHIncome by Tenure, Households 55+
Owner Households
Renter Households

The Anthem at Riverside III | Community Demographic Data
Page 30
Table 17 Rent Burdened and Substandard Housing, Anthem Market Area
Rent Cost Burden Substandardness
Total Households # % Total Households
Less than 10.0 percent 272 1.6% Owner occupied:
10.0 to 14.9 percent 1,031 6.1% Complete plumbing facilities: 23,454
15.0 to 19.9 percent 2,176 12.9% 1.00 or less occupants per room 23,297
20.0 to 24.9 percent 2,671 15.9% 1.01 or more occupants per room 157
25.0 to 29.9 percent 1,852 11.0% Lacking complete plumbing facilities: 37
30.0 to 34.9 percent 2,372 14.1% Overcrowded or lacking plumbing 194
35.0 to 39.9 percent 801 4.8%
40.0 to 49.9 percent 1,373 8.2% Renter occupied:
50.0 percent or more 3,881 23.1% Complete plumbing facilities: 16,835
Not computed 406 2.4% 1.00 or less occupants per room 16,410
Total 16,835 100% 1.01 or more occupants per room 425
Lacking complete plumbing facilities: 0
> 35% income on rent 6,055 36.9% Overcrowded or lacking plumbing 425
Households 65+ # % Substandard Housing 619
Less than 20.0 percent 498 18.6% % Total Stock Substandard 1.5%
20.0 to 24.9 percent 443 16.5% % Rental Stock Substandard 2.5%
25.0 to 29.9 percent 203 7.6%
30.0 to 34.9 percent 334 12.5%
35.0 percent or more 1,096 40.9%
Not computed 108 4.0%
Total 2,682 100%
> 35% income on rent 1,096 42.6%
> 40% income on rent 36.9%
Source: American Community Survey 2015-2019

The Anthem at Riverside III | Employment Trend
Page 31
6. EMPLOYMENT TREND
A. Introduction
This section of the report focuses primarily on economic trends and conditions in Fulton County, Georgia, the county in which the subject site is located. Economic trends in Georgia and the nation are discussed for comparison purposes. It is important to note that this section presents the latest economic data available at the local level. This data may not fully reflect the downturn associated with COVID-19 business closures and job losses. The exact economic impact on any specific market area or county will be dependent on the longevity and severity of the COVID-19 pandemic over the next several months which may be shortened with the availability of vaccines. RPRG provides the most recent data available and will provide an analysis and conclusion on the potential impact of COVID-19 in the conclusion section of this market study.
B. Labor Force, Resident Employment, and Unemployment
1. Trends in Annual Average Labor Force and Unemployment Data
Fulton County’s annual average labor force has increased over the last ten years, adding a net total of 70,954 workers (an increase of 14.6 percent) since 2010 (Table 18). It is notable that employed workers increased by 77,741 (17.9 percent) during this period while unemployed workers decreased by 6,787 (13.2 percent). Reflecting the impact of the COVID-19 pandemic, the county’s labor force decreased in 2020 with a significant increase in workers classified as unemployed.
Fulton County’s average annual unemployment rate has been historically similar to the state and has declined steadily from its peak of 10.6 percent at the height of the recession in 2010 in tandem with a decline in unemployment in both the state and the nation. Prior to 2020, the annual average unemployment rate reached 3.6 percent in 2019 in the county, comparable to 3.5 percent in the state and 3.7 percent in the nation. Reflecting the impact of the COVID-19 pandemic, average annual unemployment rates increased to 8.0 percent in the county, 6.5 percent in the state, and 8.1 percent in the nation.
Table 18 Labor Force and Unemployment Rates
Annual Average
Unemployment 2010 2011 2012 2013 2014 2015 2016 2017 2018 2019 2020Labor Force 486,278 497,801 509,382 507,565 508,619 508,815 531,124 553,991 555,178 560,412 557,232Employment 434,852 447,564 463,742 466,867 472,618 477,884 502,170 526,963 532,352 540,233 512,593Unemployment 51,426 50,237 45,640 40,698 36,001 30,931 28,954 27,028 22,826 20,179 44,639Unemployment Rate
Fulton County 10.6% 10.1% 9.0% 8.0% 7.1% 6.1% 5.5% 4.9% 4.1% 3.6% 8.0%Georgia 10.7% 10.1% 9.0% 8.1% 7.1% 6.1% 5.4% 4.8% 4.0% 3.5% 6.5%
United States 9.6% 8.8% 8.3% 7.4% 6.2% 5.3% 4.9% 4.4% 3.9% 3.7% 8.1%Source: U.S. Department of Labor, Bureau of Labor Statistics
0.0%
2.0%
4.0%
6.0%
8.0%
10.0%
12.0%
2010 2011 2012 2013 2014 2015 2016 2017 2018 2019 2020
Fulton County
Georgia
United States
Un
emp
loy

The Anthem at Riverside III | Employment Trend
Page 32
2. Trends in Recent Monthly Labor Force and Unemployment Data
The impact of COVID-19 pandemic on Fulton County economy is presented in recent monthly labor force and unemployment data (Table 20). The number of employed workers increased through February 2020 before declining in March and declining significantly in April. While the number of unemployed workers more than tripled between January and May 2020, the number of those unemployed has declined by 63.7 percent as of March 2021.
During the first two months of 2020, the unemployment rate remained relatively flat in the county, the state, and at the national level but climbed dramatically in April as the economy was negatively impacted by closures related to the COVID-19 pandemic. Peak monthly unemployment rates in April were 13.8 percent in the county, 12.2 percent in the state, and 14.4 percent in the nation. As of March 2021, the unemployment rate has significantly improved to 4.9 percent in Fulton County, 4.0 percent in Georgia, and 6.0 percent in the United States. Although the unemployment rate remains above pre-pandemic levels, the number of employed workers is approaching previous levels.
Table 19 Monthly Labor Force Data and Unemployment Rates
C. Commutation Patterns
The majority (54.8 percent) of workers residing in the Anthem Market Area spent 30 minutes or more commuting to work including 25.9 commuting 45 minutes or more. Approximately 27 percent of Anthem Market Area workers commuted 15 to 29 minutes while 17.8 percent commuted less than 15 minutes or worked at home (Table 20).
The majority (58.6 percent) of workers residing in the Anthem Market Area worked in their county of residence while 39.5 percent worked in another Georgia county. The wide range of commute times and large proportion of workers employed outside their county of residence is influenced by the market area including portions of three counties and reflects the market area’s relative proximity/accessibility to employment concentrations throughout Metro Atlanta. Nearly two percent of Anthem Market Area workers were employed outside the state.
Monthly Unemployment Jan-20 Feb-20 Mar-20 Apr-20 May-20 Jun-20 Jul-20 Aug-20 Sep-20 Oct-20 Nov-20 Dec-20 Jan-21 Feb-21 Mar-21Labor Force 566,508 569,635 567,554 544,238 553,654 553,863 552,710 545,746 544,883 561,387 562,908 563,697 557,307 562,227 563,452Employment 546,082 549,912 544,096 468,979 489,340 492,296 495,198 495,329 498,648 522,016 524,341 524,883 523,240 532,003 536,098Unemployment 20,426 19,723 23,458 75,259 64,314 61,567 57,512 50,417 46,235 39,371 38,567 38,814 34,067 30,224 27,354
Unemployment RateFulton County 3.6% 3.5% 4.1% 13.8% 11.6% 11.1% 10.4% 9.2% 8.5% 7.0% 6.9% 6.9% 6.1% 5.4% 4.9%
Georgia 3.6% 3.4% 3.7% 12.2% 9.5% 8.7% 8.1% 7.0% 6.4% 5.4% 5.3% 5.6% 5.0% 4.4% 4.0%United States 4.0% 3.8% 4.5% 14.4% 13.0% 11.2% 10.5% 8.5% 7.7% 6.6% 6.4% 6.5% 6.8% 6.6% 6.0%
Source: U.S. Department of Labor, Bureau of Labor Statistics
0.0%
2.0%
4.0%
6.0%
8.0%10.0%12.0%
14.0%
16.0%
Jan-20 Feb-20 Mar-20 Apr-20 May-20 Jun-20 Jul-20 Aug-20 Sep-20 Oct-20 Nov-20 Dec-20 Jan-21 Feb-21 Mar-21
United States
Georgia
Fulton County

The Anthem at Riverside III | Employment Trend
Page 33
Table 20 Commutation Data, Anthem Market Area
D. At-Place Employment
1. Trends in Total At-Place Employment
Fulton County added 204,054 net jobs (29.2 percent net growth) from 2010 to 2019 with job growth in eight of the past nine years. This job growth is more than triple the jobs lost in 2008 and 2009 during the recession, resulting in an all-time high annual average At-Place Employment of 903,005 jobs in 2019 (Figure 5). The county added at least 20,000 jobs in each of the past six years including more than 32,000 jobs in 2016 which is the largest single-year addition since 2008. Reflecting the impact of the COVID-19 pandemic, the county lost 63,405 jobs during the first three quarters of 2020 although most losses are expected to be temporary and similar to losses on a percentage basis to the nation.
As illustrated by the lines in the bottom portion of Figure 5, Fulton County experienced a larger dip in jobs on a percentage basis during the recession when compared to the nation; however, the county has rebounded faster with job growth rates exceeding the nation’s on a percentage basis in eight of the past nine years.
Travel Time to Work Place of Work
Workers 16 years+ # % Workers 16 years and over # %
Did not work at home: 50,449 93.7% Worked in state of residence: 52,820 98.1%
Less than 5 minutes 551 1.0% Worked in county of residence 31,557 58.6%
5 to 9 minutes 1,198 2.2% Worked outside county of residence 21,263 39.5%
10 to 14 minutes 4,430 8.2% Worked outside state of residence 1,035 1.9%
15 to 19 minutes 4,811 8.9% Total 53,855 100%
20 to 24 minutes 7,647 14.2% Source: American Community Survey 2015-2019
25 to 29 minutes 2,289 4.3%
30 to 34 minutes 9,959 18.5%
35 to 39 minutes 2,145 4.0%
40 to 44 minutes 3,479 6.5%
45 to 59 minutes 7,098 13.2%
60 to 89 minutes 4,047 7.5%
90 or more minutes 2,795 5.2%
Worked at home 3,406 6.3%
Total 53,855
Source: American Community Survey 2015-2019
In County58.6%
Outside County39.5%
Outside State 1.9%
2015-2019 Commuting PatternsAnthem Market Area

The Anthem at Riverside III | Employment Trend
Page 34
Figure 5 At-Place Employment, Fulton County
2. At-Place Employment by Industry Sector
Professional-Business is the largest employment sector in Fulton County at 25.7 percent of all jobs in 2020 Q3 compared to 14.8 percent of jobs nationally (Figure 6). The Trade-Transportation-Utilities, Education-Health, and Government sectors each account for at least 11.7 percent of jobs in the county. In addition to the Professional-Business sector discussed above, the Financial Activities and Information sectors account for a significantly higher percentage of jobs relative to the nation. Fulton County has a significantly smaller percentage of jobs in the Government, Construction, Manufacturing, Education-Health, and Trade-Transportation-Utilities sectors when compared to the nation.
74
1,0
81
69
8,9
51
70
4,3
42
72
4,0
59
72
1,1
70
74
5,6
13
76
6,2
33
79
1,5
62
82
3,7
03
85
1,4
23
87
5,0
91
90
3,0
05
83
9,6
00
0
100,000
200,000
300,000
400,000
500,000
600,000
700,000
800,000
900,000
1,000,000
2008 2009 2010 2011 2012 2013 2014 2015 2016 2017 2018 2019 2020 Q3
At
Pla
ce E
mp
loym
en
t
Total At Place Employment
Source: U.S. Department of Labor, Bureau of Labor Statistics, Quarterly Census of Employment and Wages
-17,869
-42,130
5,391
19,717
-2,889
24,44320,620
25,32932,141
27,72023,668
27,914
-63,405-8.0%
-6.0%
-4.0%
-2.0%
0.0%
2.0%
4.0%
6.0%
-70,000
-60,000
-50,000
-40,000
-30,000
-20,000
-10,000
0
10,000
20,000
30,000
40,000
50,000
2008 2009 2010 2011 2012 2013 2014 2015 2016 2017 2018 2019 2020 Q3
Change in At Place Employment
Annual Change in Fulton County At Place Employment
United States Annual Employment Growth Rate
Fulton County Annual Employment Growth Rate
An
nu
al C
han
ge in
At
Pla
ce
% A
nn
ual G
row
th
Source: U.S. Department of Labor, Bureau of Labor Statistics, Quarterly Census of Employment and Wages

The Anthem at Riverside III | Employment Trend
Page 35
Figure 6 Total Employment by Sector, 2020 Q3
All sectors added jobs in Fulton County from 2011 to 2020 Q1 with the largest percentage gains in the Professional-Business (46.1 percent), Construction (40.2 percent), Education-Health (30.9 percent), and Other (29.9 percent) sectors (Figure 7). All sectors grew by at least 8.0 percent. Fulton County significantly outperformed the nation in all but two sectors (Trade-Transportation-Utilities and Manufacturing).
Given the rapidly changing economic conditions in the latter part of 2020, we have isolated At-Place Employment change by sector from the first quarter of 2020 (Pre-Pandemic) to the third quarter of 2020 (most recent data available) Figure 8). Over this period, all sectors lost jobs in Fulton County, comparable to the nation which lost jobs in nine of 11 sectors. The largest decline was in the Leisure-Hospitality (33 percent or 32,000 jobs) sector. This sector was one of the hardest hit sectors from the COVID-19 pandemic. These losses are considered temporary and expected to recover as business and leisure resumes.
Fulton County Employment by
Industry Sector 2020 Q3Sector Jobs
Other 22,296
Leisure-Hospitality 73,247
Education-Health 107,509
Professional-Business 215,400
Financial Activities 83,544
Information 54,163
Trade-Trans-Utilities 137,307
Manufacturing 26,116
Construction 19,792
Natl. Res.-Mining 339Government 97,920
Total Employment 837,633
11.7%
0.0%
2.4%
3.1%
16.4%
6.5%
10.0%
25.7%
12.8%
8.7%
2.7%
16.1%
1.4%
5.3%
8.8%
18.9%
2.0%
6.2%
14.8%
16.2%
7.7%
2.6%
0.0% 5.0% 10.0% 15.0% 20.0% 25.0% 30.0%
Government
Natl Res.-Mining
Construction
Manufacturing
Trade-Trans-…
Information
Financial…
Professional-…
Education Health
Leisure-…
Other
Total Employment by Sector 2020 Q3
United States
Fulton County
Source: U.S. Department of Labor, Bureau of Labor Statistics, Quarterly Census of Employment and Wages

The Anthem at Riverside III | Employment Trend
Page 36
Figure 7 Employment Change by Sector, 2011-2020 Q1
Figure 8 Employment Change by Sector, 2020 (Q1-Q3)
8.1%
24.7%
40.2%
4.2%
8.0%
25.8%
27.4%
46.1%
30.9%
24.2%
29.9%
4.4%
-7.4%
32.1%
8.3%
10.2%
8.2%
12.4%
21.7%
23.2%
19.6%
1.2%
-20.0% -10.0% 0.0% 10.0% 20.0% 30.0% 40.0% 50.0%
Government
Natl Res.-Mining
Construction
Manufacturing
Trade-Trans-Utilities
Information
Financial Activities
Professional-Business
Education Health
Leisure-Hospitality
Other
Employment Change by Sector, 2011 to 2020 Q1United States
Fulton County
Source: U.S. Department of Labor, Bureau of Labor Statistics, Quarterly Census of Employment and Wages
Sector 2020 Q1 2020 Q3#
Change
%
Change Other 26,250 21,455 -4,795 -18%Leisure-
Hospitality98,417 66,150 -32,266 -33%
Education-
Health113,483 105,594 -7,889 -7%
Professional-
Business230,338 210,821 -19,517 -8%
Financial
Activities84,704 83,187 -1,517 -2%
Information 58,603 52,402 -6,202 -11%Trade-Trans-
Utilities143,879 136,362 -7,517 -5%
Manufacturing 26,899 25,815 -1,084 -4%
Construction 20,298 19,461 -837 -4%Natl. Res.-
Mining343 334 -9 -3%
Government 99,345 97,143 -2,202 -2%Total
Employment902,559 818,725 -83,833 -9%
Fulton County Employment by Industry Sector
2020 Q1 - 2020 Q3
-2.2%
-2.5%
-4.1%
-4.0%
-5.2%
-10.6%
-1.8%
-8.5%
-7.0%
-32.8%
-18.3%
-9.2%
4.6%
1.2%
-5.2%
-4.0%
-9.4%
-2.0%
-4.7%
-6.8%
-21.0%
-13.0%
-50% -40% -30% -20% -10% 0% 10%
Government
Natl Res.-Mining
Construction
Manufacturing
Trade-Trans-Utilities
Information
Financial Activities
Professional-Business
Education Health
Leisure-Hospitality
Other
Employment Change by Sector, 2020 Q1-2020 Q3
UnitedStates
FultonCounty
Source: U.S. Department of Labor, Bureau of Labor Statistics, Quarterly Census of Employment and Wages

The Anthem at Riverside III | Employment Trend
Page 37
3. Major Employers
Most Metro Atlanta major employers fall into two industry sectors – Education-Health (eight employers) and Trade-Transportation-Utilities (seven employers) (Table 21). Education-Health employers are comprised of major medical providers in the region, Centers for Disease Control and Prevention, and Georgia Institute of Technology. Trade-Transportation-Utilities employers include a major airline (Delta), three retailers (Publix, Kroger, and The Home Depot), two utilities/telecommunications providers (AT&T and Southern Company), and a shipping/delivery company (UPS).
The largest employment concentration in the Atlanta Metro Area is in downtown Atlanta which is 14 miles to the northeast and is home to corporate headquarters for The Coca-Cola Company, Southern Company, AT&T, and UPS (Map 5). The largest employer in Metro Atlanta is Delta Airlines which is at Hartsfield-Jackson International Airport roughly 10 miles southeast of the site. Given the site’s proximity to Interstates 20 and 285, downtown Atlanta and most major employers throughout the Metro Atlanta Area are convenient to the site. Numerous industrial/distribution employers are along Fulton Industrial Boulevard near the site.
Table 21 Major Employers, Atlanta Metro Area
Rank Name Sector Employment
1 Delta Air Lines Transportation 34,500
2 Emory University & Emory Healthcare Education / Healthcare 32,091
3 The Home Depot Retail 16,510
4 Northside Hospital Healthcare 16,000+
5 Piedmont Healthcare Healthcare 15,900
6 Publix Super Markets Retail 15,591
7 WellStar Health System Healthcare 15,353
8 The Kroger Co. Retail 15,000+
9 AT&T Telecommunications 15,000
10 UPS Distribution 14,594
11 Marriott International Travel & Leisure 12,000+
12 Children's Healthcare of Atlanta Healthcare 9,000
13 Cox Enterprises Media 8,894
14 Centers for Disease Control and Prevention Government / Healthcare 8,403
15 The Coca-Cola Company Manufacturing / Retail 8,000
16 Southern Company Utilities 7,753
17 Grady Health System Healthcare 7,600
18 SunTrust Bank Financial Activities 7,478
19 Georgia Institute of Technology Education 7,139
20 State Farm Financial Services 6,000
Source: Metro Atlanta Chamber of Commerce
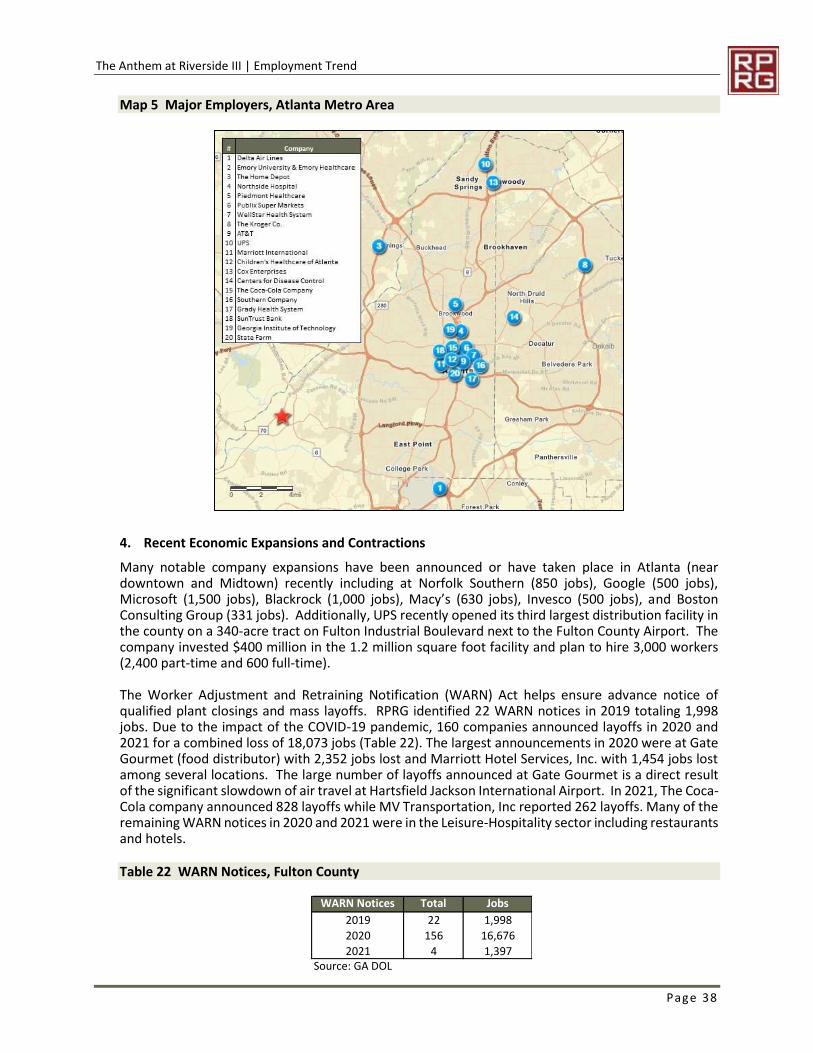
The Anthem at Riverside III | Employment Trend
Page 38
Map 5 Major Employers, Atlanta Metro Area
4. Recent Economic Expansions and Contractions
Many notable company expansions have been announced or have taken place in Atlanta (near downtown and Midtown) recently including at Norfolk Southern (850 jobs), Google (500 jobs), Microsoft (1,500 jobs), Blackrock (1,000 jobs), Macy’s (630 jobs), Invesco (500 jobs), and Boston Consulting Group (331 jobs). Additionally, UPS recently opened its third largest distribution facility in the county on a 340-acre tract on Fulton Industrial Boulevard next to the Fulton County Airport. The company invested $400 million in the 1.2 million square foot facility and plan to hire 3,000 workers (2,400 part-time and 600 full-time). The Worker Adjustment and Retraining Notification (WARN) Act helps ensure advance notice of qualified plant closings and mass layoffs. RPRG identified 22 WARN notices in 2019 totaling 1,998 jobs. Due to the impact of the COVID-19 pandemic, 160 companies announced layoffs in 2020 and 2021 for a combined loss of 18,073 jobs (Table 22). The largest announcements in 2020 were at Gate Gourmet (food distributor) with 2,352 jobs lost and Marriott Hotel Services, Inc. with 1,454 jobs lost among several locations. The large number of layoffs announced at Gate Gourmet is a direct result of the significant slowdown of air travel at Hartsfield Jackson International Airport. In 2021, The Coca-Cola company announced 828 layoffs while MV Transportation, Inc reported 262 layoffs. Many of the remaining WARN notices in 2020 and 2021 were in the Leisure-Hospitality sector including restaurants and hotels.
Table 22 WARN Notices, Fulton County
WARN Notices Total Jobs
2019 22 1,998
2020 156 16,676
2021 4 1,397Source: GA DOL

The Anthem at Riverside III | Employment Trend
Page 39
E. Conclusions on Local Economics
Fulton County has experienced significant and steady economic growth since 2010, consistently outperforming the national economy on a percentage basis. The county reached an all-time high At-Place Employment of 903,005 jobs in 2019. The county’s most recent annual average unemployment rate of 3.6 percent in 2019 is a significant improvement since 2010 and is similar to the state rate of 3.5 percent. The county’s economy is well diversified with six sectors each accounting for at least eight percent of the county’s job base. Prior to the COVID-19 pandemic, job growth was expected to continue given the strong and consistent growth over the past seven years as well as the large recent or announced job expansions in the county. While the extent of the pandemic’s impact on the local economy is uncertain, Fulton County’s strong recent track record of growth and recovery following the previous recession-era (2008-2010) suggests the county will rebound following the COVID-19 related economic contraction. Given these past trends, growth is projected to continue in Fulton County in the long term, but likely at a reduced rate due to the impact of the COVID-19 pandemic. The county’s unemployment rate has recovered significantly over the past eleven months with significant recovery of jobs lost at the onset of the COVID-19 pandemic.
The Anthem at Riverside III | Affordability & Demand Analysis
Page 40
7. AFFORDABILITY & DEMAND ANALYSIS
A. Affordability Analysis
1. Methodology
The Affordability Analysis tests the percentage of age (55+) and income-qualified households in the market area that the subject community must capture to achieve full occupancy. The first component of the Affordability Analysis involves looking at the total household income distribution and renter household income distribution among primary market area households 55 and older for the target year of 2024. RPRG calculated the income distribution for both total households and renter households (55+) based on the relationship between owner and renter household incomes by income cohort from the 2015-2019 American Community Survey along with estimates and projected income growth by Esri (Table 23).
A housing unit is typically said to be affordable to households that would be expending a certain percentage of their annual income or less on the expenses related to living in that unit. In the case of rental units, these expenses are generally of two types – monthly contract rents paid to landlords and payment of utility bills for which the tenant is responsible. The sum of the contract rent and utility bills is referred to as a household’s ‘gross rent burden’. For the Affordability Analysis, RPRG employs a 40 percent gross rent burden for seniors age 55 or older. This rent burden only applies for tenants who do not receive PBRA. As minimum income limits will not apply for the nine units with PBRA and contract rents are above maximum allowable levels, RPRG used the maximum allowable LIHTC gross rent for these units.
HUD has computed a 2020 median household income of $86,200 for the Atlanta-Sandy Springs-Roswell MSA. Based on that median income, adjusted for household size, the maximum income limit and minimum income requirements are computed for each floor plan (Table 24). The proposed units at The Anthem at Riverside III will target renter households earning up to 50 and 60 percent of the Area Median Income (AMI), adjusted for household size while the proposed market rate units will target senior renter households earning up to 120 percent AMI. The minimum income limits are calculated assuming up to 40 percent of income is spent on total housing cost (rent plus utilities). The maximum allowable incomes for LIHTC units are based on an average household size of 1.5 persons for one-bedroom units and a maximum of two persons two-bedroom units. Maximum gross rents, however, are based on the federal regulation of 1.5 persons per bedroom.
For the purposes of this analysis, we have conducted demand for the units with PBRA separately. For the overall LIHTC and project-wide capture rates, we have assumed no PBRA.

The Anthem at Riverside III | Affordability & Demand Analysis
Page 41
Table 23 2021 Total and Renter Income Distribution (55+), Anthem Market Area
Table 24 LIHTC Income and Rent Limits, Atlanta-Sandy Springs-Roswell MSA
2. Affordability Analysis
This analysis looks at the affordability of the proposed units at the subject property (Table 25):
• Looking at the one bedroom 60 percent AMI units (most common floorplan), the overall shelter cost at the proposed units would be $830 ($758 net rent plus a $72 allowance to cover all utilities expect water, sewer, and trash removal).
• We determined that a one-bedroom unit would be affordable to senior renter households (55+) earning at least $24,900 per year by applying a 40 percent rent burden to this gross rent.
2024 Income # % # %
less than $15,000 1,736 10.6% 531 13.5%
$15,000 $24,999 1,631 10.0% 499 12.7%
$25,000 $34,999 1,430 8.8% 485 12.3%
$35,000 $49,999 2,285 14.0% 644 16.4%
$50,000 $74,999 3,120 19.1% 940 23.9%
$75,000 $99,999 1,849 11.3% 325 8.3%
$100,000 $149,999 2,073 12.7% 356 9.0%
$150,000 Over 2,187 13.4% 149 3.8%
Total 16,311 100% 3,929 100%
Median Income
Source: American Community Survey 2015-2019 Projections, RPRG, Inc.
Anthem Market Area
$58,603 $45,461
2024 Total Senior
Householders aged
55+
2024 Senior Renter
Householders aged
55+
HUD 2020 Median Household Income
Atlanta-Sandy Springs-Roswell, GA HUD Metro FMR Area $86,200
Very Low Income for 4 Person Household $43,100
2020 Computed Area Median Gross Income $86,200
Utility Allowance: $72
$94
Household Income Limits by Household Size:Household Size 30% 40% 50% 60% 80% 100% 120% 150% 200%
1 Person $18,120 $24,160 $30,200 $36,240 $48,320 $60,400 $72,480 $90,600 $120,800
2 Persons $20,700 $27,600 $34,500 $41,400 $55,200 $69,000 $82,800 $103,500 $138,0007 Persons $0 $0 $0 $0 $0 $08 Persons $0 $0 $0 $0 $0 $0
Imputed Income Limits by Number of Bedroom (Assuming 1.5 persons per bedroom):
Persons
# Bed-
rooms 30% 40% 50% 60% 80% 100% 120% 150% 200%
1.5 1 $19,410 $25,880 $32,350 $38,820 $51,760 $64,700 $77,640 $97,050 $129,4002 2 $20,700 $27,600 $34,500 $41,400 $55,200 $69,000 $82,800 $103,500 $138,000
LIHTC Tenant Rent Limits by Number of Bedrooms (assumes 1.5 persons per bedroom):
30% 40% 50% 60% 80%Gross Net Gross Net Gross Net Gross Net Gross Net
1 Bedroom $485 $413 $647 $575 $808 $736 $970 $898 $1,294 $1,222
2 Bedroom $582 $488 $776 $682 $970 $876 $1,164 $1,070 $1,552 $1,458Source: U.S. Department of Housing and Urban Development
# Persons
1 Bedroom
2 Bedroom

The Anthem at Riverside III | Affordability & Demand Analysis
Page 42
A projected 2,904 senior renter households (55+) in the market area will earn at least this amount in 2024.
• The maximum income limit for a one-bedroom unit at 60 percent AMI is $38,820 based on an average household size of 1.5 persons. According to the interpolated income distribution for 2024, 2,250 renter households (55+) in the Anthem Market Area will have incomes exceeding this 60 percent LIHTC income limit.
• Subtracting the 2,904 renter households (55+) with incomes above the maximum income limit from the 2,250 renter households (55+) that could afford to rent this unit, RPRG computes that an estimated 654 renter households (55+) in the Anthem Market Area will fall within the band of affordability for the subject’s one bedroom units at 60 percent AMI. The subject property would need to capture 3.8 percent of these income-qualified renter households (55+) to absorb the proposed 25 one bedroom units at 60 percent AMI.
• Using the same methodology, we determined the band of qualified households for the remaining floor plan types and the subject property overall. The remaining renter capture rates by floor plan range from 0.2 to 3.8 percent and capture rates by income level are 0.6 percent for 50 percent AMI units with PBRA, 0.6 percent for 50 percent AMI units, 5.4 percent for 60 percent AMI units, 6.9 percent for all LIHTC units without PBRA, 0.4 percent for market rate units, and the project’s overall capture rate without accounting for PBRA is 2.8 percent (Table 25). Overall LIHTC capture rate decreases from 6.9 percent without PBRA to 3.0 percent with PBRA.
Table 25 Affordability Analysis, The Anthem at Riverside III
50% w/PBRA 40% Rent Burden One Bedroom Units Two Bedroom Units Three Bedroom Units
Min. Max. Min. Max.
Number of Units 7 2Gross Rent $808 $970Income Range (Min, Max) no min$ $32,350 no min$ $34,500
Renter Households
Range of Qualified Hhlds 3,929 2,542 3,929 2,438
1,387 1,491
Renter HH Capture Rate 0.5% 0.1%
# Qualified Hhlds
50% AMI 40% Rent Burden Two Bedroom Units Three Bedroom Units
Number of Units 3
Net Rent $734
Gross Rent $828Income Range (Min, Max) $24,840 $34,500
Renter Households
Range of Qualified Hhlds 2,907 2,438
469
Renter HH Capture Rate 0.6%
# Qualified Hhlds

The Anthem at Riverside III | Affordability & Demand Analysis
Page 43
3. Conclusions of Affordability
All renter affordability capture rates are within acceptable levels for an age-restricted rental community indicating that sufficient age and income-qualified renter households exist in the market area to support the proposed units.
60% AMI 40% Rent Burden One Bedroom Units Two Bedroom Units Three Bedroom Units
Number of Units 25 16
Net Rent $758 $920Gross Rent $830 $1,014
Income Range (Min, Max) $24,900 $38,820 $30,420 $41,400
Renter Households
Range of Qualified Hhlds 2,904 2,250 2,636 2,139
# Qualified Households 654 497
Renter HH Capture Rate 3.8% 3.2%
120% AMI 40% Rent Burden One Bedroom Units Two Bedroom Units Three Bedroom Units
Number of Units 4 3
Net Rent $900 $1,050
Gross Rent $972 $1,144
Income Range (Min, Max) $29,160 $77,640 $34,320 $82,800Renter Households
Range of Qualified Hhlds 2,697 795 2,447 728
1,902 1,718
Renter HH Capture Rate 0.2% 0.2%
# Qualified Households
Band of Qualified Hhlds# Qualified
HHsCapture Rate
Income no min$ $34,50050% w/PBRA 9 Households 3,929 2,438 1,491 0.6%
Income $24,840 $34,50050% AMI 3 Households 2,907 2,438 469 0.6%
Income $24,900 $41,40060% AMI 41 Households 2,904 2,139 765 5.4%
Income no min$ $41,400
53 Households 3,929 2,139 1,790 3.0%
Income $24,840 $41,400
53 Households 2,907 2,139 768 6.9%
Income $29,160 $82,800120% AMI 7 Households 2,697 728 1,969 0.4%
Income $24,840 $82,800Total Units 60 Households 2,907 728 2,178 2.8%
Source: Income Projections, RPRG, Inc.
Income Target # UnitsRenter Households = 3,929
LIHTC Units w/ PBRA
LIHTC Units w/o PBRA

The Anthem at Riverside III | Affordability & Demand Analysis
Page 44
B. Demand Estimates and Capture Rates
1. Methodology
DCA’s demand methodology for Elderly communities consists of four components:
• The first component of demand is household growth. This number is the number of income-qualified renter households (55+) projected to move into the Anthem Market Area between the base year (2021) and the placed-in-service year of 2024.
• The next component of demand is income-qualified renter households (55+) living in substandard households. “Substandard” is defined as having more than 1.01 persons per room and/or lacking complete plumbing facilities. According to ACS data, 2.5 percent of renter occupied are “substandard” (see Table 17 on page 30). This substandard percentage is applied to current senior households (55+).
• The third component of demand is cost burdened renters, which is defined as those renter households paying more than 40 percent of household income for housing costs. According to ACS data, 36.9 percent of Anthem Market Area renter households (65+) are categorized as cost burdened (see Table 17 on page 30). This cost burdened percentage is applied to the current senior household base (55+).
• The final component of demand is from homeowners converting to rental housing. There is a lack of detailed local or regional information regarding the movership of elderly homeowners to rental housing. According to the American Housing Survey conducted for the U.S. Census Bureau in 2015, 5.4 percent of elderly households move each year in the United States. Of those moving within the past twelve months and reporting tenure, 11.5 percent moved from owned to rental housing (Table 26). This equates to 1.2 percent of all senior households converting from owners to renters. Given the lack of local information, this source is the most current and accurate. This component of demand is limited to two percent of total demand.
Table 26 Homeownership to Rental Housing Conversion
The data assumptions used in the calculation of these demand estimates are detailed at the bottom of Table 29. Income qualification percentages for demand estimates are derived by using the Affordability Analysis detailed in Table 25. As DCA considered units with PBRA as leasable, the overall LIHTC and project-wide capture rates do not include the nine proposed units with PBRA. The inclusion of these units and the removal of the minimum income limit would significantly increase demand and lower capture rates.
2. Demand Analysis
According to DCA’s demand methodology, all comparable units recently funded by DCA, proposed for funding for a bond allocation from DCA, or any comparable units at communities undergoing lease-
Tenure of Previous Residence - Renter Occupied Units
Senior Households 65+ # % Annual
Household Members Moving in Past Two Years 34,782,000
Total 65+ HH Members Moving within the Past Two
Years 3,741,000 10.8% 5.4%
Moved from Owner Occupied Housing 1,846,000 49.3% 24.7%
Moved from Renter Occupied Housing 1,895,000 50.7% 25.3%
% of Senior Households Moving Within the Past Year 10.8% 5.4%
% of Senior Movers Converting from Owners to Renters 23.0% 11.5%
% of Senior Households Converting from Homeowners to Renters 2.5% 1.2%
Source: American Housing Survey, 2015
United States
Homeownership to Rental Housing Conversion

The Anthem at Riverside III | Affordability & Demand Analysis
Page 45
up are to be subtracted from the demand estimates to arrive at net demand. For the purposes of this analysis, we have subtracted the comparable units at Phase I (Table 27) and Phase II (Table 28) of the subject property from the demand estimate. All units with PBRA at these phases are subtracted from the 50 percent/PBRA demand at Phase III but not the overall capture rates calculated without PBRA.
Table 27 Unit Mix and Income Targeting, Anthem at Riverside I
Table 28 Unit Mix and Income Targeting, Anthem at Riverside II
The overall capture rates for the units at The Anthem at Riverside III are 7.1 percent for the 41 LIHTC units without PBRA and 6.3 percent for market rate and LIHTC units without PBRA (Table 29). The capture rate for the nine 50 percent units with PBRA is 1.3 percent. The inclusion of these units in the overall capture rate would increase the overall demand estimate and lower the capture rates to 7.2 percent for all LIHTC units. Capture rates by bedroom range from 0.3 percent to 9.5 percent (Table 30). All capture rates are acceptable and indicate sufficient demand to support the proposed units at the subject property with and without PBRA.
Anthem at Riverside Phase I
Unit Mix/Rents
Type Bed Bath Income Target Quantity
Mid Rise 1 1 30%/ACC 2
Mid Rise 1 1 60%/PBRA 14
Mid Rise 1 1 60% 23
Mid Rise 1 1 Market Rate 9
Mid Rise 2 2 60%/PBRA 10
Mid Rise 2 2 60% 15
Mid Rise 2 2 Market Rate 7
Total 80
Unit Mix/Rents
Type Bed BathIncome
Target#
Heated Sq.
Feet
Gross
Rent
Utility
AllowanceNet Rent
LIHTC/PBRA 1 1 60% 14 700 $769 $69 $700LIHTC 1 1 60% 31 700 $765 $65 $700
Subtotal 45 64.3%
LIHTC/PBRA 2 2 60% 8 975 $939 $89 $850
LIHTC 2 2 60% 17 975 $934 $84 $850
Subtotal 25 35.7%
Total/Average 70Rents include water, sewer, and trash removal. Contract rent Source: Anthem Senior II, LP

The Anthem at Riverside III | Affordability & Demand Analysis
Page 46
Table 29 Overall Demand Estimates, The Anthem at Riverside III
Table 30 Demand Estimates by Floor Plan, The Anthem at Riverside III
3. DCA Demand Conclusions
All capture rates are below DCA thresholds for units with and without PBRA.
Income/Unit Size Income LimitsUnits
Proposed
Renter Income
Qualification %
Total
DemandSupply
Net
Demand
Capture
Rate
50% w/PBRA no min$ - $34,500One Bedroom Units 7 35.3% 670 30 640 1.1%Two Bedroom Units 2 37.9% 721 18 703 0.3%
50% AMI $24,840 - $34,500Two Bedroom Units 3 11.9% 226 0 226 1.3%
60% AMI $24,900 - $41,400One Bedroom Units 25 16.6% 316 54 262 9.5%Two Bedroom Units 16 12.6% 240 32 208 7.7%
120% AMI $29,160 - $82,800One Bedroom Units 4 48.4% 919 9 910 0.4%Two Bedroom Units 3 43.7% 831 7 824 0.4%
By BedroomOne Bedroom Units 36 53.7% 1,019 93 926 3.9%Two Bedroom Units 24 55.4% 1,053 57 996 2.4%
Project Total $24,840 - $82,80050% w/PBRA no min$ - $34,500 9 37.9% 721 48 673 1.3%
50% AMI $24,840 - $34,500 3 11.9% 226 0 226 1.3%60% AMI $24,900 - $41,400 41 19.5% 370 86 284 14.5%
LIHTC Units w/ PBRA no min$ - $41,400 53 45.6% 865 134 731 7.2%LIHTC w/o PBRA $24,840 - $41,400 44 19.5% 371 86 285 15.4%
120% AMI $29,160 - $82,800 7 50.1% 951 16 935 0.7%Total Units (No PBRA) $24,840 - $82,800 60 55.4% 1,053 102 951 6.3%
Income/Unit Size Income LimitsUnits
Proposed
Renter Income
Qualification %
Total
DemandSupply
Net
Demand
Capture
Rate
50% w/PBRA no min$ - $34,500One Bedroom Units 7 35.3% 670 30 640 1.1%Two Bedroom Units 2 37.9% 721 18 703 0.3%
50% AMI $24,840 - $34,500Two Bedroom Units 3 11.9% 226 0 226 1.3%
60% AMI $24,900 - $41,400One Bedroom Units 25 16.6% 316 54 262 9.5%Two Bedroom Units 16 12.6% 240 32 208 7.7%
120% AMI $29,160 - $82,800One Bedroom Units 4 48.4% 919 9 910 0.4%Two Bedroom Units 3 43.7% 831 7 824 0.4%
By BedroomOne Bedroom Units 36 53.7% 1,019 93 926 3.9%Two Bedroom Units 24 55.4% 1,053 57 996 2.4%

The Anthem at Riverside III | Competitive Rental Analysis
Page 47
8. COMPETITIVE RENTAL ANALYSIS
A. Introduction and Sources of Information
This section presents data and analyses pertaining to the supply of rental housing in the Anthem Market Area. We pursued several avenues of research to identify multifamily rental projects that are in the planning stages or under construction in the Anthem Market Area. We contacted planning and zoning officials with all jurisdictions in the market area and reviewed recent approved permits in the City of Atlanta’s online permit database as well as LIHTC allocation lists provided by DCA. The rental survey was conducted in May 2020.
B. Overview of Market Area Housing Stock
The renter occupied housing stock in both the Anthem Market Area and Fulton County include a large proportion of multi-family structures with market area rentals less dense than the county’s overall rental stock. Multi-family structures with five or more units account for the majority (54.8 percent) of market area renter occupied units including 44.2 percent in structures with 10 or more units (Table 31). Single-family detached homes account for 34.2 percent of renter occupied units in the market area. The Anthem Market Area contains a larger proportion of single-family detached home rentals and a smaller proportion of rentals in multi-family structures when compared to the county.
Reflecting the recent growth in the Anthem Market Area, its housing stock is significantly newer than in Fulton County. Renter occupied units in the market area have a median year built of 1994 compared to 1988 in the county with 45 percent of renter occupied units in the market area built since 2000. Approximately 51 percent of market area renter occupied units were built from 1960 to 1999 and just 4.6 percent were built prior to 1960. The median year built of owner-occupied units is 1988 in the market area and county; roughly 57 percent of market area owner-occupied units were built from 1990 to 2009 including 41.0 percent built in the 2000’s (Table 32).
According to ACS data, the median value among owner-occupied housing units in the Anthem Market Area as of 2015-2019 was $183,607, $129,675 or 41.4 percent lower than the Fulton County median of $313,283 (Table 33). This data is a less accurate and reliable indicator of home prices in an area than actual sales data, but offers insight on relative housing values among two or more areas.
Table 31 Occupied Units by Structure Type and Tenure
Fulton CountyAnthem
Market Area Fulton County
Anthem
Market Area # % # % # % # %
1, detached 163,877 77.4% 21,921 93.3% 37,813 19.1% 5,754 34.2%1, attached 19,810 9.4% 624 2.7% 6,595 3.3% 618 3.7%2 790 0.4% 10 0.0% 5,194 2.6% 148 0.9%3-4 2,541 1.2% 16 0.1% 10,917 5.5% 566 3.4%5-9 4,039 1.9% 315 1.3% 26,927 13.6% 1,795 10.7%10-19 3,643 1.7% 101 0.4% 39,108 19.7% 3,295 19.6%20+ units 15,969 7.5% 0 0.0% 70,308 35.4% 4,143 24.6%Mobile home 1,194 0.6% 504 2.1% 1,548 0.8% 516 3.1%TOTAL 211,863 100% 23,491 100% 198,410 100% 16,835 100%Source: American Community Survey 2015-2019
Renter OccupiedOwner Occupied
Structure Type

The Anthem at Riverside III | Competitive Rental Analysis
Page 48
Table 32 Dwelling Units by Year Built and Tenure
Table 33 Value of Owner-Occupied Housing Stock
C. Survey of Age-Restricted Rental Communities
1. Introduction to the Age Restricted Rental Housing Survey
RPRG surveyed six senior rental communities in the Anthem Market Area, all of which were funded through the Low Income Housing Tax Credit (LIHTC) program including two with Project Based Rental Assistance (PBRA) on all units and two with PBRA on select units. Three surveyed communities offer market rate units. All surveyed communities are considered comparable to the subject property given The Anthem at Riverside III will offer standard LIHTC units and LIHTC units with PBRA. The deeply subsidized communities are presented separately. In instances where senior communities contain both deeply subsidized units and units without PBRA, data for each unit type is shown on separate tables. Profile sheets with detailed information on each surveyed community, including photographs, are attached as Appendix 6.
2. Location
The closest senior community to the subject site are the initial phase of Anthem Riverside, which is undergoing initial lease up. Three senior communities are in the northern portion of the market area including two in the northeast near I-285 and I-20. Two LIHTC communities to the southeast near I-
Fulton CountyAnthem
Market Area Fulton County
Anthem Market
Area # % # % # % # %
2014 or later 5,884 2.8% 575 2.4% 9,837 5.0% 431 2.6% 2010 to 2013 6,246 2.9% 1,147 4.9% 9,141 4.6% 930 5.5% 2000 to 2009 49,537 23.4% 9,625 41.0% 42,827 21.6% 6,133 36.4% 1990 to 1999 39,379 18.6% 3,649 15.5% 33,573 16.9% 1,812 10.8% 1980 to 1989 33,397 15.8% 2,008 8.5% 28,171 14.2% 2,140 12.7% 1970 to 1979 19,857 9.4% 2,245 9.6% 27,007 13.6% 2,562 15.2% 1960 to 1969 18,850 8.9% 2,924 12.4% 19,568 9.8% 2,061 12.2% 1950 to 1959 15,466 7.3% 884 3.8% 14,533 7.3% 453 2.7% 1940 to 1949 7,727 3.6% 302 1.3% 5,231 2.6% 119 0.7%
1939 or earlier 15,525 7.3% 132 0.6% 8,820 4.4% 194 1.2%TOTAL 211,868 100% 23,491 100% 198,708 100% 16,835 100%MEDIAN YEAR
BUILT 1988 1998 1988 1994Source: American Community Survey 2015-2019
Renter OccupiedOwner Occupied
Year Built 2.6%
5.5%
36.4%
10.8%
12.7%
15.2%
12.2%
2.7%
0.7%
1.2%
5.0%
4.6%
21.6%
16.9%
14.2%
13.6%
9.8%
7.3%
2.6%
4.4%
0% 10% 20% 30% 40%
2014 or later
2010 to 2013
2000 to 2009
1990 to 1999
1980 to 1989
1970 to 1979
1960 to 1969
1950 to 1959
1940 to 1949
1939 or earlier
2015-2019 Rental Units by Year Built
Anthem Market Area
Fulton County
# % # %
less than $60,000 9,449 4.5% 1,532 6.5%$60,000 $99,999 15,012 7.1% 2,621 11.2%
$100,000 $149,999 20,841 9.8% 4,352 18.5%$150,000 $199,999 22,463 10.6% 4,821 20.5%$200,000 $299,999 34,232 16.2% 6,762 28.8%$300,000 $399,999 29,638 14.0% 2,369 10.1%$400,000 $499,999 22,989 10.9% 494 2.1%$500,000 $749,999 33,022 15.6% 312 1.3%$750,000 over 24,222 11.4% 228 1.0%
Total 211,868 100% 23,491 100%
Median ValueSource: American Community Survey 2015-2019
2015-2019 Home ValueFulton County
Anthem Market
Area
$313,283 $183,607
4.5%
7.1%
9.8%
10.6%
16.2%
14.0%
10.9%
15.6%
11.4%
6.5%
11.2%
18.5%
20.5%
28.8%
10.1%
2.1%
1.3%
1.0%
0% 10% 20% 30% 40%
< $60K
$60-$99K
$100-149k
$150-$199K
$200-$299K
$300-$399K
$400-$499K
$500-$749K
$750>
% of Owner Occupied Dwellings
Ho
me
Val
ue
($
00
0s)
2015-2019 Home Value Anthem Market Area
Fulton County

The Anthem at Riverside III | Competitive Rental Analysis
Page 49
285 and two LIHTC communities with additional subsidies are on the southern edge of the market area near South Fulton Parkway (Map 7).
Map 6 Surveyed Senior Communities, Anthem Market Area
3. Age-Restricted Rental Housing Characteristics
All existing senior LIHTC communities are mid-rise buildings with interior hallways and secured entrances and two communities offer garden-style buildings; all surveyed communities are three or four stories and offer elevator service (Table 34, Table 35). All surveyed communities have attractive facades with brick and siding exteriors and senior-oriented features and community amenities.
4. Community Size
The surveyed senior LIHTC communities range from 80 to 166 units and average 125 units (Table 34). The two senior communities with PBRA on all LIHTC units each have 150 units (Table 35).
5. Unit Distribution and Unit Size
All surveyed senior communities offer one and two-bedroom units and Big Bethel Village also offers 18 efficiency units (Table 34, Table 35). The unit mix breakdown of units without PBRA is 57.5 percent one-bedroom units and 40.1 percent two-bedroom units. The average unit sizes among these communities are 713 square feet for one-bedroom units and 1,034 square feet for two-bedroom units.
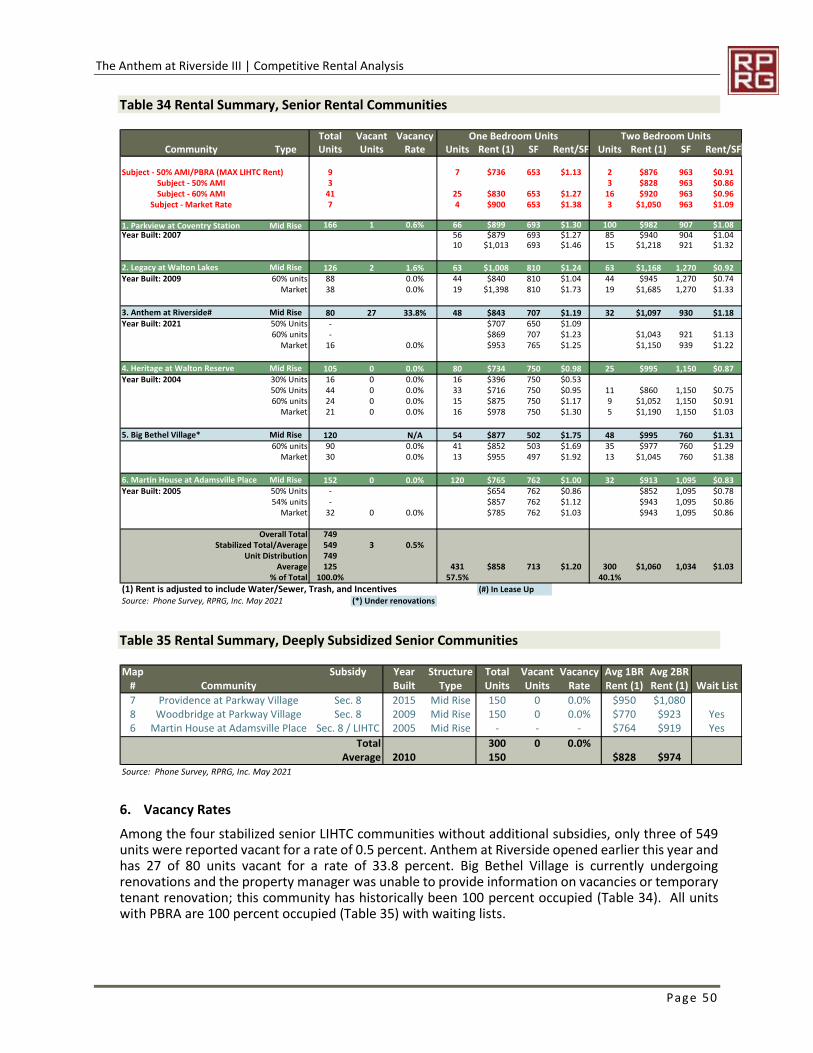
The Anthem at Riverside III | Competitive Rental Analysis
Page 50
Table 34 Rental Summary, Senior Rental Communities
Table 35 Rental Summary, Deeply Subsidized Senior Communities
6. Vacancy Rates
Among the four stabilized senior LIHTC communities without additional subsidies, only three of 549 units were reported vacant for a rate of 0.5 percent. Anthem at Riverside opened earlier this year and has 27 of 80 units vacant for a rate of 33.8 percent. Big Bethel Village is currently undergoing renovations and the property manager was unable to provide information on vacancies or temporary tenant renovation; this community has historically been 100 percent occupied (Table 34). All units with PBRA are 100 percent occupied (Table 35) with waiting lists.
Total Vacant Vacancy One Bedroom Units Two Bedroom UnitsCommunity Type Units Units Rate Units Rent (1) SF Rent/SF Units Rent (1) SF Rent/SF
Subject - 50% AMI/PBRA (MAX LIHTC Rent) 9 7 $736 653 $1.13 2 $876 963 $0.91Subject - 50% AMI 3 3 $828 963 $0.86Subject - 60% AMI 41 25 $830 653 $1.27 16 $920 963 $0.96
Subject - Market Rate 7 4 $900 653 $1.38 3 $1,050 963 $1.09
1. Parkview at Coventry Station Mid Rise 166 1 0.6% 66 $899 693 $1.30 100 $982 907 $1.08Year Built: 2007 56 $879 693 $1.27 85 $940 904 $1.04
10 $1,013 693 $1.46 15 $1,218 921 $1.32
2. Legacy at Walton Lakes Mid Rise 126 2 1.6% 63 $1,008 810 $1.24 63 $1,168 1,270 $0.92Year Built: 2009 60% units 88 0.0% 44 $840 810 $1.04 44 $945 1,270 $0.74
Market 38 0.0% 19 $1,398 810 $1.73 19 $1,685 1,270 $1.33
3. Anthem at Riverside# Mid Rise 80 27 33.8% 48 $843 707 $1.19 32 $1,097 930 $1.18Year Built: 2021 50% Units - $707 650 $1.09
60% units - $869 707 $1.23 $1,043 921 $1.13Market 16 0.0% $953 765 $1.25 $1,150 939 $1.22
4. Heritage at Walton Reserve Mid Rise 105 0 0.0% 80 $734 750 $0.98 25 $995 1,150 $0.87Year Built: 2004 30% Units 16 0 0.0% 16 $396 750 $0.53
50% Units 44 0 0.0% 33 $716 750 $0.95 11 $860 1,150 $0.7560% units 24 0 0.0% 15 $875 750 $1.17 9 $1,052 1,150 $0.91
Market 21 0 0.0% 16 $978 750 $1.30 5 $1,190 1,150 $1.03
5. Big Bethel Village* Mid Rise 120 N/A 54 $877 502 $1.75 48 $995 760 $1.3160% units 90 0.0% 41 $852 503 $1.69 35 $977 760 $1.29
Market 30 0.0% 13 $955 497 $1.92 13 $1,045 760 $1.38
6. Martin House at Adamsville Place Mid Rise 152 0 0.0% 120 $765 762 $1.00 32 $913 1,095 $0.83Year Built: 2005 50% Units - $654 762 $0.86 $852 1,095 $0.78
54% units - $857 762 $1.12 $943 1,095 $0.86Market 32 0 0.0% $785 762 $1.03 $943 1,095 $0.86
Overall Total 749Stabilized Total/Average 549 3 0.5%
Unit Distribution 749Average 125 431 $858 713 $1.20 300 $1,060 1,034 $1.03
% of Total 100.0% 57.5% 40.1%
(1) Rent is adjusted to include Water/Sewer, Trash, and Incentives (#) In Lease Up
Source: Phone Survey, RPRG, Inc. May 2021 (*) Under renovations
Map Subsidy Year Structure Total Vacant Vacancy Avg 1BR Avg 2BR# Community Built Type Units Units Rate Rent (1) Rent (1) Wait List
7 Providence at Parkway Village Sec. 8 2015 Mid Rise 150 0 0.0% $950 $1,0808 Woodbridge at Parkway Village Sec. 8 2009 Mid Rise 150 0 0.0% $770 $923 Yes6 Martin House at Adamsville Place Sec. 8 / LIHTC 2005 Mid Rise - - - $764 $919 Yes
Total 300 0 0.0%Average 2010 150 $828 $974
Source: Phone Survey, RPRG, Inc. May 2021

The Anthem at Riverside III | Competitive Rental Analysis
Page 51
7. Recent Absorption History
Anthem at Riverside I is the most recent addition to the market area. This community opened in February 2021 and has leased 53 units in roughly 2.5 months for an average monthly absorption of 21 units. All other communities were built in 2015 or earlier.
8. Rents
Rents presented in Table 34 are net or effective rents, as opposed to street or advertised rents. The net rents reflect adjustments to street rents to equalize the impact of utility policies across complexes. Specifically, the net rents are adjusted to include the cost of water, sewer, and trash removal.
• One-bedroom units – have an average effective rent of $858. Based on an average unit size of 713 square feet, this equates to $1.17 per square foot. One-bedroom effective rents ranged from $396 for the 30 percent AMI LIHTC units at Heritage at Walton Reserve to $1,398 for the market rate units at Legacy at Walton Lakes.
• Two-bedroom units – have an average effective rent of $1,060. Based on an average unit size of 1,034 square feet, this equates to $1.03 per square foot. Two-bedroom effective rents ranged from $825 for the 50 percent AMI LIHTC units at Martin House at Adamsville to $1,685 for the market rate units at Legacy at Walton Lakes.
D. Product Details, Age-Restricted Rental Communities
1. Payment of Utility Costs
Three senior communities without PBRA include only the cost of trash removal in the rent, two include water, sewer, and trash removal, and Big Bethel Village includes all utilities (Table 36). The Anthem at Riverside III will include water, sewer, and trash removal.
2. Unit Features and Services
All surveyed senior communities without PBRA offer dishwashers, washer and dryer connections, grab bars, and emergency pull cords (Table 36). Three communities include a microwave in each kitchen, and one includes a full-size washer and dryer. The Anthem at Riverside III will be competitive with the surveyed senior rental communities as each unit will include a dishwasher, garbage disposal, microwave, grab bars, emergency pull cords, ceiling fans, and washer and dryer connections.
Table 36 Utility Arrangement and Unit Features, Senior Communities
3. Parking
All surveyed senior communities offer free surface parking; none offer covered parking options.
Utilities included in Rent
Community Hea
t
Co
oki
ng
Ele
ctri
c
Wat
er
Tras
h Dish-
washer
Micro-
Wave
In-Unit
Laundry
Grab
Bar
Emergency
Pull
Subject Property o o o x x STD STD Hook Ups STD STD
Parkview at Coventry Station* o o o o x STD STD STD - Full STD STD
Legacy at Walton Lakes* o o o o x STD STD Hook Ups STD STD
Anthem at Riverside* o o o x x STD STD Hook Ups STD STD
Heritage at Walton Reserve* o o o x x STD Hook Ups STD STD
Big Bethel Village* x x x x x STD Hook Ups STD STD
Martin House at Adamsville Place* o o o o x STD Hook Ups STD STD
Source: Phone Survey, RPRG, Inc. May 2021 (*) LIHTC

The Anthem at Riverside III | Competitive Rental Analysis
Page 52
4. Community Amenities
The surveyed communities without PBRA offer extensive community amenities including a multi-purpose room, fitness room, and barber shop at all properties and an arts and crafts room, theater, library, and computer center in three properties each (Table 37). A community garden is offered at one property and walking paths are offered at two properties. The Anthem at Riverside III’s community amenities will include a community room, fitness center, outdoor garden, covered picnic pavilion, medical office, and laundry facilities. The subject’s amenities will be generally comparable to most of the existing senior communities in the market area; Big Bethel Village offers the most extensive communities in the market area that are slightly superior to those planned at the subject property. The proposed amenities are appropriate and will be well received by the target market of very low to low income senior households.
Table 37 Community Amenities, Senior Communities
Community Mu
ltip
urp
ose
Ro
om
Co
mp
ute
r
Ce
nte
r
Gar
de
nin
g
Fitn
ess
Ce
nte
r
Wal
kin
g P
ath
s
Lib
rary
The
atre
Fitn
ess
Ce
nte
r
Bar
be
r Sh
op
Subject Property x o x x o o o o o
Parkview at Coventry Station* x x x x x x x x x
Legacy at Walton Lakes* x x x x o x x x x
Anthem at Riverside* x x x x o o o x o
Heritage at Walton Reserve* x x o x x o o x x
Big Bethel Village* x x x x x x x x x
Martin House at Adamsville Place* x o o x o x x x x
Source: Phone Survey, RPRG, Inc. May 2021 (*) LIHTC

The Anthem at Riverside III | Competitive Rental Analysis
Page 53
E. Survey of General Occupancy Rental Communities
1. Introduction to the Rental Housing Survey
RPRG surveyed 23 general occupancy multi-family rental communities in the Anthem Market Area in May 2021. Although not considered direct competition for the subject property, these general occupancy rental communities represent an alternative rental housing option for seniors in the Anthem Market Area. Accordingly, we believe these communities can have some impact on the pricing and positioning of the subject community. Their performance also lends insight into the overall health and competitiveness of the rental environment in the area. Profile sheets with detailed information on each surveyed community, including photographs, are attached as Appendix 6. The location of each community relative to the subject site is shown on Map 7.
Map 7 Surveyed General Occupancy Communities
2. Vacancy Rates
The general occupancy rental market is performing well with 143 vacancies among 5,794 combined units for an aggregate vacancy rate of 2.5 percent (Table 38). One of the general occupancy communities is undergoing renovations up with 42 of 330 units. The aggregate vacancy rate among the 22 stabilized communities is 1.8 percent among 5,464 units. Among the general occupancy LIHTC communities, only six of 676 units were reported vacant for a rate of 0.9 percent.

The Anthem at Riverside III | Competitive Rental Analysis
Page 54
Table 38 Rental Summary, Unit Distribution, Size, and Pricing – Surveyed Communities
3. Effective Rents
Rents presented in Table 38 are net or effective rents, as opposed to street or advertised rents. The net rents reflect adjustments to street rents to equalize the impact of utility policies across complexes. Specifically, the net rents are adjusted to include the cost of water, sewer, and trash removal. Average effective rents by floor plan are as follows:
• One-bedroom rents average $1,093 for 795 square feet or $1.37 per square foot. The average one bedroom LIHTC rent is $824.
• Two-bedroom rents average $1,241 for 1,061 square feet or $1.17 per square foot. The average two bedroom LIHTC rent is $891.
4. Scattered Site Rentals
Given the proposed income and age restrictions, scattered site rentals are not expected to be a significant source of competition for the proposed units at Anthem Market Area. We were unable to obtain specific foreclosure data, but foreclosures have been low throughout the region and foreclosure activity will not negatively impact the demand for the subject property.
5. Estimate of Market Rent (Attainable Rent)
To better understand how the proposed rents compare with the rental market, rents of the most comparable communities are adjusted for a variety of factors including curb appeal, square footage, utilities, and amenities. For the purposes of this analysis, we utilities the market rate units at
Total Vacant Vacancy One Bedroom Units Two Bedroom Units Three Bedroom Units# Community Units Units Rate Units Rent(1) SF Rent/SF Units Rent(1) SF Rent/SF Units Rent(1) SF Rent/SF
Subject - 50% AMI/PBRA (MAX LIHTC Rent) 9 7 $736 653 $1.13 2 $876 963 $0.91
Subject - 50% AMI 3 3 $828 963 $0.86
Subject - 60% AMI 41 25 $830 653 $1.27 16 $920 963 $0.96
Subject - Market Rate 7 4 $900 653 $1.38 3 $1,050 963 $1.09
1 Century Sweetwater Creek 240 5 2.1% $1,298 885 $1.47 $1,884 1,120 $1.68 $1,903 1,362 $1.402 Crestmark 334 0 0.0% 98 $1,301 803 $1.62 162 $1,645 1,145 $1.44 74 $1,945 1,368 $1.423 Avonlea Tributary 360 5 1.4% $1,253 845 $1.48 $1,593 1,241 $1.28 $1,760 1,543 $1.144 Landing Square 322 12 3.7% $1,175 739 $1.59 $1,560 1,196 $1.30 $1,726 1,538 $1.125 Panther Riverside Parc 280 8 2.9% 98 $1,340 876 $1.53 147 $1,550 1,106 $1.40 35 $1,666 1,350 $1.236 Villas at Princeton Lakes 208 4 1.9% 40 $1,245 975 $1.28 140 $1,515 1,175 $1.29 28 $1,375 1,350 $1.027 The Life at Marketplace# 330 42 12.7% $1,255 750 $1.67 $1,507 900 $1.67 $1,706 1,200 $1.428 Ashford at Spring Lake 180 12 6.7% 36 $1,345 846 $1.59 100 $1,500 1,186 $1.26 44 $1,515 1,365 $1.119 The Park at Marketplace 350 1 0.3% 168 $1,260 831 $1.52 154 $1,495 1,189 $1.26 28 $1,690 1,399 $1.21
10 Ansley at Princeton Lakes 306 8 2.6% 134 $1,310 730 $1.79 148 $1,490 1,170 $1.27 24 $1,745 1,309 $1.3311 The Slate 350 11 3.1% 84 $1,318 876 $1.50 196 $1,426 1,167 $1.22 70 $1,561 1,434 $1.0912 Manchester Place 308 8 2.6% 144 $1,146 767 $1.49 132 $1,377 1,171 $1.18 32 $1,843 1,509 $1.2213 Columns at Sweetwater Creek 270 0 0.0% $1,281 849 $1.51 $1,370 1,154 $1.19 $1,650 1,406 $1.1714 Ashley Courts at Cascade II 37 - - 4 $1,195 740 $1.61 15 $1,341 964 $1.39 18 $1,397 1,325 $1.0515 Ashley Courts at Cascade III^ 25 - - 7 $1,195 740 $1.61 11 $1,341 939 $1.43 7 $1,394 1,275 $1.0916 West Eleven 224 0 0.0% 56 $1,049 830 $1.26 130 $1,327 1,119 $1.19 36 $1,630 1,335 $1.2217 Greens at Cascade 160 3 1.9% 24 $1,170 908 $1.29 96 $1,255 1,152 $1.09 40 $1,390 1,390 $1.0018 Cascade Glen 364 7 1.9% $960 840 $1.14 $1,150 1,099 $1.05 $1,320 1,316 $1.0019 Ashley Courts at Cascade I^ 23 - - 12 $1,107 925 $1.20 11 $1,154 1,250 $0.9220 Lake Crossing 300 11 3.7% 100 $972 736 $1.32 120 $1,092 1,061 $1.03 80 $1,187 1,248 $0.9521 Walton Reserve 60% AMI* 147 0 0.0% $905 850 $1.06 $1,086 1,175 $0.92 $1,232 1,485 $0.8314 Ashley Courts at Cascade II 60% AMI* 96 2 2.1% 10 $875 740 $1.18 54 $1,040 956 $1.09 32 $1,224 1,325 $0.9215 Ashley Courts at Cascade III 60% AMI*^ 25 2 8.0% 9 $875 740 $1.18 11 $1,040 923 $1.13 5 $1,224 1,275 $0.9622 300 Riverside 232 0 0.0% $950 793 $1.20 $1,038 1,050 $0.99 $1,350 1,268 $1.0719 Ashley Courts at Cascade I 60% AMI*^ 84 2 2.4% 16 $848 738 $1.15 43 $1,015 928 $1.09 25 $1,224 1,250 $0.9823 Creekside at Adamsville Place 80% 147 0 0.0% $905 698 $1.30 $1,010 973 $1.04 $1,205 1,169 $1.0319 Ashley Courts at Cascade I 50% AMI* 29 - - 4 $1,195 750 $1.59 5 $864 890 $0.97 20 $994 1,250 $0.8014 Ashley Courts at Cascade II 50% AMI* 53 - - 40 $864 975 $0.89 13 $994 1,325 $0.7515 Ashley Courts at Cascade III 50% AMI*^ 10 - - 5 $864 884 $0.98 5 $994 1,275 $0.7823 Creekside at Adamsville Place 60% - - - $710 698 $1.02 $815 973 $0.84 $902 1,169 $0.7723 Creekside at Adamsville Place 30% - - - $279 698 $0.40 $309 973 $0.32 $318 1,169 $0.27
Total/Average 5,794 143 2.5% $1,093 795 $1.37 $1,241 1,061 $1.17 $1,394 1,330 $1.05Stabilized Total/Average 5,464 101 1.8%
LIHTC Total/Average 676 6 0.9% $824 739 $1.11 $891 965 $0.92 $1,031 1,269 $0.81 Unit Distribution 3,380 1,032 1,721 627
% of Total 58.3% 30.5% 50.9% 18.6%(1) Rent is adjusted to include water/sewer, trash, and Incentives (*) LIHTC (^) Has 4Br units (#) Renovating as vacant Source: Phone Survey, RPRG, Inc. May 2021

The Anthem at Riverside III | Competitive Rental Analysis
Page 55
adjustments made are broken down into four classifications. These classifications and an explanation of the adjustments made follows:
Table 39 Estimate of Market Rent Adjustments
• Rents Charged – current rents charged, adjusted for utilities and incentives, if applicable.
• Design, Location, Condition – adjustments made in this section include:
➢ Building Design - An adjustment was made, if necessary, to reflect the attractiveness of the proposed product relative to the comparable communities above and beyond what is applied for year built and/or condition. An adjustment of $25 was utilized to account for the superior mid-rise design at the subject property compared to garden apartments at the three market rate properties.
➢ Year Built/Rehabbed - We applied a value of $0.75 for each year newer a property is relative to a comparable.
➢ Condition and Neighborhood – We rated these features on a scale of 1 to 5 with 5 being the most desirable. An adjustment of $20 per variance was applied for condition. Likewise, the neighborhood or location adjustment was $20 per variance.
➢ Square Footage - Differences between comparables and the subject property are accounted for by an adjustment of $0.25 per foot.
➢ Senior Features – A $25 adjustment was utilized to account for senior features at the subject property including grab bars and emergency call systems.
• Unit Equipment/Amenities – Adjustments were made for amenities included or excluded at the subject property. The exact value of each specific value is somewhat subjective as particular amenities are more attractive to certain renters and less important to others. Adjustment values were between $5 and $25 for each amenity. An adjustment of $30 per bathroom was utilized where applicable.
• Site Equipment – Adjustments were made in the same manner as with the unit amenities. Adjustment values were between $5 and $15 for each amenity.
Based on our adjustment calculations, the estimated market rents (attainable rent) for the units at The Anthem at Riverside III are $1,127 for one-bedroom units (Table 40) and $1,307 for two-bedroom units (Table 41). All proposed rents have significant market advantages including the market rate units. The weighted average market advantage among LIHTC units is 33.1 percent (Table 42). For the purposes of market advantage, we conservatively utilized the maximum allowable LIHTC rent for one bedroom units at 50 percent AMI although this rent is higher than the rent for 50 percent two bedroom units without PBRA.
B. Design, Location, Condition
Structure / Stories
Year Built / Condition $0.75
Senior Features $25.00
Quality/Street Appeal $20.00
Building Type $25.00
Location $20.00
C. Unit Equipment / Amenities
Number of Bedrooms $100.00
Number of Bathrooms $30.00
Unit Interior Square Feet $0.25
Balcony / Patio / Porch $5.00
AC Type: $5.00
Range / Refrigerator $25.00
Microwave / Dishwasher $5.00
Washer / Dryer: In Unit $25.00
Washer / Dryer: Hook-ups $5.00
D. Site Equipment / Amenities
Community Room $10.00
Pool $15.00
Recreation Areas $5.00
Fitness Center $10.00
Rent Adjustments Summary

The Anthem at Riverside III | Competitive Rental Analysis
Page 56
Table 40 Adjusted Rent Comparison, One-Bedroom Units
Atlanta Fulton Atlanta Fulton Austell Fulton
A. Rents Charged Subject Data $ Adj. Data $ Adj. Data $ Adj.
Street Rent (60% LIHTC) $758 $1,383 $0 $1,060 $0 $978 $0
Utilities Included W, S, T T $25 All ($105) W, S, T $0
Rent Concessions None $0 None $0 None $0
Effective Rent $758
In parts B thru D, adjustments were made only for differences
B. Design, Location, Condition Data $ Adj. Data $ Adj. Data $ Adj.
Structure / Stories Mid-Rise Mid-Rise $0 Mid-Rise $0 Mid-Rise $0
Year Built / Condition 2023 2009 $11 2003 $15 2004 $14
Quality/Street Appeal Above Average Above Average $0 Average $20 Above Average $0
Location Average Average $0 Average $0 Average $0
C. Unit Equipment / Amenities Data $ Adj. Data $ Adj. Data $ Adj.
Number of Bedrooms 1 1 $0 1 $0 1 $0
Number of Bathrooms 1 1 $0 1 $0 1 $0
Unit Interior Square Feet 653 810 ($39) 497 $39 750 ($24)
Balcony / Patio / Porch No No $0 No $0 Yes ($5)
AC Type: Central Central $0 Central $0 Central $0
Range / Refrigerator Yes / Yes Yes / Yes $0 Yes / Yes $0 Yes / Yes $0
Microwave / Dishwasher Yes / Yes Yes / Yes $0 No / Yes $5 No / Yes $5
Washer / Dryer: In Unit No No $0 No $0 No $0
Washer / Dryer: Hook-ups Yes Yes $0 Yes $0 Yes $0
D. Site Equipment / Amenities Data $ Adj. Data $ Adj. Data $ Adj.
Parking ($ Fee) Free Surface Free Surface $0 Free Surface $0 Free Surface $0
Club House Yes Yes $0 Yes $0 Yes $0
Pool No No $0 No $0 No $0
Recreation Areas Yes Yes $0 Yes $0 Yes $0
Fitness Center Yes Yes $0 Yes $0 Yes $0
Business/Computer Center No Yes $0 Yes $0 Yes $0
E. Adjustments Recap Positive Negative Positive Negative Positive Negative
Total Number of Adjustments 1 1 4 0 2 2
Sum of Adjustments B to D $11 ($39) $79 $0 $19 ($29)
F. Total Summary
Gross Total Adjustment
Net Total Adjustment
G. Adjusted And Achievable Rents
Estimated Market Rent $1,127
Rent Advantage $ $369
Rent Advantage % 32.8%
Atlanta, Fulton County
$1,408 $955 $978
Adjusted Rent
% of Effective Rent 98.0% 108.3%
$1,380 $1,034 $968
99.0%
$50
($28)
$79
$79
Adj. Rent Adj. Rent Adj. Rent
$48
($10)
One Bedroom Units
Subject Property Comparable Property #1
Legacy at Walton Lakes
4687 Camp Creek Pkwy
Anthem at Riverside III
Riverside Drive SW
Comparable Property #2
Big Bethel Village
500 Richard Allen Blvd SW
Heritage at Walton Reserve
1675 Walton Reserve Blvd
Comparable Property #3

The Anthem at Riverside III | Competitive Rental Analysis
Page 57
Table 41 Adjusted Rent Comparison, Two-Bedroom
Atlanta Fulton Atlanta Fulton Austell Fulton
A. Rents Charged Subject Data $ Adj. Data $ Adj. Data $ Adj.
Street Rent (60% LIHTC) $920 $1,665 $0 $1,175 $0 $1,190 $0
Utilities Included W, S, T T $30 All ($130) W, S, T $0
Rent Concessions None $0 None $0 None $0
Effective Rent $920
In parts B thru D, adjustments were made only for differences
B. Design, Location, Condition Data $ Adj. Data $ Adj. Data $ Adj.
Structure / Stories Mid-Rise Mid-Rise $0 Mid-Rise $0 Mid-Rise $0
Year Built / Condition 2023 2009 $11 2003 $15 2004 $14
Quality/Street Appeal Above Average Above Average $0 Average $20 Above Average $0
Location Average Average $0 Average $0 Average $0
C. Unit Equipment / Amenities Data $ Adj. Data $ Adj. Data $Adj.
Number of Bedrooms 2 2 $0 2 $0 2 $0
Number of Bathrooms 2 2 $0 2 $0 2 $0
Unit Interior Square Feet 963 1,270 ($77) 760 $51 1,150 ($47)
Balcony / Patio / Porch No No $0 No $0 Yes ($5)
AC Type: Central Central $0 Central $0 Central $0
Range / Refrigerator Yes / Yes Yes / Yes $0 Yes / Yes $0 Yes / Yes $0
Microwave / Dishwasher Yes / Yes Yes / Yes $0 No / Yes $5 No / Yes $5
Washer / Dryer: In Unit No No $0 No $0 No $0
Washer / Dryer: Hook-ups Yes Yes $0 Yes $0 Yes $0
D. Site Equipment / Amenities Data $ Adj. Data $ Adj. Data $ Adj.
Parking ($ Fee) Free Surface Free Surface $0 Free Surface $0 Free Surface $0
Club House Yes Yes $0 Yes $0 Yes $0
Pool No No $0 No $0 No $0
Recreation Areas Yes Yes $0 Yes $0 Yes $0
Fitness Center Yes Yes $0 Yes $0 Yes $0
Business/Computer Center No Yes $0 Yes $0 Yes $0
E. Adjustments Recap Positive Negative Positive Negative Positive Negative
Total Number of Adjustments 1 1 4 0 2 2
Sum of Adjustments B to D $11 ($77) $91 $0 $19 ($52)
F. Total Summary
Gross Total Adjustment
Net Total Adjustment
G. Adjusted And Achievable Rents
Estimated Market Rent $1,307
Rent Advantage $ $387
Rent Advantage % 29.6%
% of Effective Rent 108.7% 97.2%96.1%
$1,136 $1,157Adjusted Rent $1,629
Subject Property
Legacy at Walton Lakes
Atlanta, Fulton County
$88 $91 $71
Adj. Rent
Anthem at Riverside III
Riverside Drive SW
($66) $91 ($33)
Adj. Rent Adj. Rent
Two Bedroom Units
$1,695 $1,045 $1,190
Comparable Property #1 Comparable Property #2 Comparable Property #3
4687 Camp Creek Pkwy 500 Richard Allen Blvd SW 1675 Walton Reserve Blvd
Big Bethel Village Heritage at Walton Reserve

The Anthem at Riverside III | Competitive Rental Analysis
Page 58
Table 42 Market Rent and Rent Advantage Summary
F. Multi-Family Pipeline
The only directly comparable pipeline units in the market area are the first two phases of the subject property. Anthem at Riverside I includes 80 units and is included in the surveyed communities. The second phase will include 70 units among one and two bedroom floorplans; all units at Phase II will be at comparable including 22 units with PBRA and 48 units without PBRA. All comparable units are subtracted from the demand estimate despite absorption of 53 units at Phase I over the past 2.5 months.
G. Housing Authority Data
The subject site and surrounding area is served by The Housing Authority of Fulton County which manages more than 2,200 Section 8 Housing Choice Vouchers (HCV) with a closed waiting list.
H. Existing Low-Income Rental Housing
Fourteen affordable rental communities are in the market area including 11 LIHTC communities (Table 43). Eight senior LIHTC communities operate in the market area including six with units without PBRA and two with PBRA on all units; all eight of these communities were surveyed and included in this analysis. The location of these communities relative to the subject site is shown in Map 8.
50% AMI Units
One
Bedroom
Two
Bedroom
Subject Rent $736 $734
Est. Market Rent $1,127 $1,307
Rent Advantage ($) $391 $573
Rent Advantage (%) 34.7% 43.9%
Proposed Units 7 5
60% AMI Units
One
Bedroom
Two
Bedroom
Subject Rent $758 $920
Est. Market Rent $1,127 $1,307
Rent Advantage ($) $369 $387
Rent Advantage (%) 32.8% 29.6%
Proposed Units 25 16
Mkt. Rate Units
One
Bedroom
Two
Bedroom
Subject Rent $900 $1,050
Estimated Market Rent $1,127 $1,307
Rent Advantage ($) $227 $257
Rent Advantage (%) 20.2% 19.7%
Proposed Units 4 3
Weighted Average LIHTC Advantage 33.1%

The Anthem at Riverside III | Competitive Rental Analysis
Page 59
Table 43 Subsidized Communities, Anthem Market Area
Map 8 Subsidized Rental Communities
Community Subsidy Type Address DistanceAshley Courts at Cascade I, II, III LIHTC Family 1371 Kimberly Way 6.5 milesCreekside at Adamsville Place LIHTC Family Adamsville Dr. 7 milesWalton Reserve LIHTC Family 7075 Walton Reserve Lane 6.8 milesBig Bethel Village LIHTC Senior 500 Richard Allen Blvd. SW 7.8 milesHeritage at Walton Reserve LIHTC Senior 1675 Walton Reserve Blvd. 6.9 milesLegacy at Walton Lakes LIHTC Senior 4687 Camp Creek Pkwy. 4.9 milesParkview at Coventry Station LIHTC Senior 13381 Greenbriar Pkwy SW 7 milesAnthem at Riverside Phase I, II LIHTC/Section 8 Senior 1910 Waycrest Dr. 0 mileMartin House at Adamsville Place LIHTC/Section 8 Senior 3724 MLK Jr. Dr. 7.1 milesProvidence at Parkway Village LIHTC/Section 8 Senior 5095 Southwood Rd. 9 milesWoodbridge at Parkway Village LIHTC/Section 8 Senior 5151 Thompson Rd. 8.9 milesBarge Road High Rise Public Housing Senior 2440 Barge Rd. SW 6.1 milesCatholic Retirement Facilities, Inc. Section 8 Senior 2973 Butner Rd. SW 4.5 milesQLS Villa Section 8 Senior 4020 Danforth Rd. SW 5.8 milesSource: HUD, GA DCA, Atlanta Housing Authority

The Anthem at Riverside III | Findings and Conclusions
Page 60
9. FINDINGS AND CONCLUSIONS
A. Key Findings
Based on the preceding review of the subject project and demographic and competitive housing trends in the Anthem Market Area, RPRG offers the following key findings:
1. Site and Neighborhood Analysis
The subject site is a suitable location for senior rental housing as it has access to public transportation, amenities, services, and transportation arteries.
• The site for The Anthem at Riverside III is on the south side of Waycrest Drive and west side of Riverside Drive SW in southwestern Fulton County, Georgia. The subject site is less than one-quarter mile south of Fulton Industrial Boulevard which is a major north-south thoroughfare in the region. Surrounding land uses include an apartment community (Panther Riverside Parc), undeveloped land, and industrial uses to the north along Fulton Industrial Boulevard.
• Industrial uses are common to the north and west while residential uses are common to the south and east within several miles of the site. Residential uses within a few miles of the site include single-family detached homes which are generally well-maintained with a range of values (modest to upper) and multi-family rental communities.
• Community services, public transit, a pharmacy, a bank, two convenience stores, recreation, and medical facilities are within roughly two miles of the site. A MARTA bus stop is less than one-quarter mile north of the site on Fulton Industrial Boulevard.
• The Anthem at Riverside III will have visibility from Riverside Drive SW and Waycrest Drive which have light traffic. Awareness for the subject will be increased given its entrance will be adjacent to Panther Riverside Parc, a 280-unit multi-family rental community.
• The subject site is suitable for the proposed development of affordable senior rental housing and is adjacent to the first two phases of the subject property.
2. Economic Context
Fulton County’s economy is growing with significant job growth during the past seven years resulting in an all-time high At-Place-Employment in 2019 and the county’s unemployment rate has dropped each year since 2010 prior to the onset of the COVID-19 pandemic.
• Fulton County’s labor force increased by 70,954 workers (14.6 percent) from 2010 to 2020 while the number of employed workers increased by 77,741 (17.9 percent) over this period. The number of unemployed workers dropped by roughly 13 percent from 51,426 in 2010 to 20,179 unemployed workers in 2019 prior to increasing to 44,639 in 2020 due to the Covid-19 pandemic.
• The county’s unemployment rate steadily declined from 10.6 percent in 2010 to 3.6 percent in 2019, the lowest level in over 10 years. The county’s 2019 annual unemployment rate was above the state rate (3.5 percent), but below the national rate (3.7 percent). Reflecting the impact of the COVID-19 pandemic, the county’s unemployment spiked to 13.8 percent in April 2020 before stabilizing over the next eleven months, decreasing to 4.9 percent in March 2021 which is higher than the state rate (4.0 percent) but below the national rate (6.0 percent).
• Fulton County’s economy rapidly expanded from 2010 to 2019 with the net addition of 204,054 jobs (29.2 percent), reaching an all-time high At-Place Employment of 903,005 jobs in 2019; annual At-Place Employment growth has outpaced the national employment growth rate in eight of the past nine years. The county added an annual average of 25,913 job from 2013 to 2019. Reflecting the impact of the COVID-19 pandemic, the county lost 63,405 jobs through the first three quarters of 2020 although most of these losses are expected to be

The Anthem at Riverside III | Findings and Conclusions
Page 61
temporary as reflected by the quick recovery of the unemployment rate, the leading economic indicator.
• Fulton County’s economy is diverse with six industry sectors representing at least eight percent of total At-Place-Employment. Professional-Business is the largest employment sector in Fulton County at 25.7 percent of jobs in 2020 (Q3) compared to 14.8 percent of jobs nationally.
• Reflecting broad economic expansion, all industry sectors added jobs in Fulton County from 2011 to 2020 (1Q). Eight sectors grew by at least 24 percent including the county’s largest sector (Professional-Business) which increased by 46.1 percent.
• Many large job expansions have been announced recently in or near downtown Atlanta in the past three years. In contrast, RPRG identified 156 WARN notices in 2020 and four WARN notices in 2021 with a combined with 18,073 jobs lost primarily as a result of the COVID 19 pandemic; much of the job loss is expected to be temporary.
3. Population and Household Trends
The Anthem Market Area had significant senior household growth (55+) from 2010 to 2021 and growth is expected to remain strong through 2024. Senior household growth in the market area has outpaced total household growth significantly on a percentage basis since 2010 and is expected to continue this trend over the next three years.
• The Anthem Market Area grew significantly in the previous decade with the addition of 3,802 people (5.4 percent) and 1,520 households (5.8 percent) per year from 2000 to 2010. Growth slowed but was steady from 2010 to 2021 at 1,549 people (1.5 percent) and 560 households (1.5 percent) per year reaching 109,940 people and 41,239 households in 2021. Annual growth is expected to increase over the next three years at 1,858 people (1.7 percent) and 676 households (1.6 percent) from 2021 to 2024.
• The Anthem Market Area added 381 households with householder age 55+ (2.9 percent) per year from 2010 to 2021 and annual growth is projected at 326 households age 55+ (2.1 percent) from 2021 to 2024.
4. Demographic Analysis
The Anthem Market Area’s demographics reflect its suburban nature with a larger proportion of families and lower renter percentage when compared to Fulton County. Senior households (55+) have a moderate median income lower than the county median.
• Seniors (age 55 and older) comprise 23.2 percent of the market area’s population while Adults (age 35 to 61) are the most common at 35.2 percent. Children/Youth (under 20 years old) account for a significant percentage (27.9 percent) of the market area’s population and Young Adults (age 20 to 34) comprise 21.2 percent of the population.
• Roughly 40 percent of market area households contain children and 31.9 percent were multi-person households without children including 17.8 percent that were married which includes empty nesters. Single-person households account for 27.8 percent of market area households.
• Roughly 34 percent of households in the market area rent in 2021 compared to 47.5 percent in Fulton County. The market area added roughly 7,500 net renter households (35.2 percent of net household growth) from 2000 to 2021 increasing the renter percentage from 32.5 percent in 2000. The renter percentage is expected at the same level through 2024.
• The market area’s 2021 renter percentage among householders age 55 and older is 33.9 percent compared to 47.5 percent in Fulton County.
• The 2021 median income of Anthem Market Area households is $66,765, 10.6 percent lower than the $74,715 median in Fulton County. RPRG estimates the median income for senior

The Anthem at Riverside III | Findings and Conclusions
Page 62
households (age 55 or older) in the Anthem Market Area is $55,043 and the median for senior renter households (55+) is $43,770. Approximately 27 percent of senior renter households (55+) earn less than $25,000 including 14.5 percent earning less than $15,000. Approximately 29 percent of senior renter households (55+) earn $25,000 to $49,999 and 23.8 percent earn $50,000 to $74,999.
5. Competitive Housing Analysis
RPRG surveyed eight senior rental communities including six with LIHTC units without additional communities and 23 general occupancy rental communities in the Anthem Market Area. Both senior and general occupancy rental markets were performing well with limited vacancies especially the senior market with three vacancies at stabilized communities and an aggregate vacancy rate below one percent.
Senior Rental Communities:
• Among the four stabilized senior LIHTC communities without additional subsidies, only three of 549 units were reported vacant for a rate of 0.5 percent. Anthem at Riverside opened earlier this year and has 27 of 80 units vacant for a rate of 33.8 percent. Big Bethel Village is currently undergoing renovations and the property manager was unable to provide information on vacancies or temporary tenant renovation; this community has historically been 100 percent occupied. All units with PBRA are 100 percent occupied with waiting lists.
• Among surveyed senior rental communities without PBRA, net rents, unit sizes, and rents per square foot are:
o One-bedroom units – have an average effective rent of $858. Based on an average unit size of 713 square feet, this equates to $1.17 per square foot. One-bedroom effective rents ranged from $396 for the 30 percent AMI LIHTC units at Heritage at Walton Reserve to $1,398 for the market rate units at Legacy at Walton Lakes.
o Two-bedroom units – have an average effective rent of $1,060. Based on an average unit size of 1,034 square feet, this equates to $1.03 per square foot. Two-bedroom effective rents ranged from $825 for the 50 percent AMI LIHTC units at Martin House at Adamsville to $1,685 for the market rate units at Legacy at Walton Lakes.
General Occupancy Rental Communities:
• The general occupancy rental market is performing well with 143 vacancies among 5,794 combined units for an aggregate vacancy rate of 2.5 percent. One general occupancy community is undergoing renovations with 42 of 330 units vacant. The aggregate vacancy rate among the 22 stabilized communities is 1.8 percent among 5,464 units. Among the general occupancy LIHTC communities, only six of 676 units were reported vacant for a rate of 0.9 percent.
• Among surveyed general occupancy rental communities, net rents, unit sizes, and rents per square foot are as follows:
o One-bedroom rents average $1,093 for 795 square feet or $1.37 per square foot. The average one bedroom LIHTC rent is $824.
o Two-bedroom rents average $1,241 for 1,061 square feet or $1.17 per square foot. The average two bedroom LIHTC rent is $891.
• The estimated market rents (attainable rent) for the units at The Anthem at Riverside III are $1,127 for one-bedroom units and $1,307 for two-bedroom units. All proposed rents have significant market advantages including the market rate units. The weighted average market advantage among LIHTC units is 33.1 percent. For the purposes of market advantage, we conservatively utilized the maximum allowable LIHTC rent for one bedroom units at 50

The Anthem at Riverside III | Findings and Conclusions
Page 63
percent AMI although this rent is higher than the rent for 50 percent two bedroom units without PBRA.
• The only directly comparable communities identified in the market area are the first two phases of the subject property, which will be stabilized before the community enters the market. The demand estimates indicate sufficient demand for all three phases of the subject property.
B. Product Evaluation
Considered in the context of the competitive environment, the relative position of The Anthem at Riverside III is as follows:
• Site: The subject site is acceptable for a rental housing development targeted toward very low, low, and moderate income senior renter households. The site is generally comparable to the locations of the surveyed senior rental communities in the market area and surrounding land uses are compatible with multi-family senior-oriented rental housing including wooded land to the south and east and Panther Riverside Parc Apartments to the north. The subject site is convenient to public transportation, major thoroughfares, and neighborhood amenities including healthcare facilities, restaurants, convenience stores, a bank, a pharmacy, and recreational facilities within roughly two miles. The site is adjacent to the first two phases of the subject property; Phase One has leased well since opening.
• Unit Distribution: The proposed distribution for The Anthem at Riverside III includes 36 one-bedroom units (60 percent) and 24 two-bedroom units (40 percent). One and two-bedroom units are offered at all surveyed senior rental communities and the proposed unit distribution is similar to the existing senior rental market which includes 57.5 percent one-bedroom units and 40.1 percent two-bedroom units. Affordability and demand capture rates suggest sufficient age and income qualified renter households to afford the proposed unit mix. The proposed unit distribution will be well received by the target market.
• Unit Size: The proposed unit sizes at The Anthem at Riverside III are 653 square feet for one-bedroom units and 963 square feet for two-bedroom units. The proposed unit sizes are smaller than the averages among senior LIHTC communities, but comparable if not larger than Parkview at Coventry Station and Big Bethel Village. The proposed unit sizes are reasonable and appropriate at the proposed price points.
• Unit Features: The Anthem at Riverside III will be competitive with the surveyed senior rental communities as each unit will include a dishwasher, garbage disposal, microwave, grab bars, emergency pull cords, ceiling fans, and washer and dryer connections. The subject property will compete well with existing affordable senior and general occupancy communities.
• Community Amenities: The Anthem at Riverside III’s community amenities will include a community room, fitness center, outdoor garden, covered picnic pavilion, medical office, and laundry facilities. The subject’s amenities will be generally comparable to most of the existing senior communities in the market area; Big Bethel Village offers the most extensive communities in the market area that are slightly superior to those planned at the subject property. The proposed amenities are appropriate and will be well received by the target market of very low to low income senior households.
• Marketability: The planned features and amenities at The Anthem at Riverside III will be competitive in the Anthem Market Area and will be more appealing to senior households than those offered at comparable general occupancy communities. The proposed product will be competitive in the market especially given the low price point when compared to the existing senior rental housing stock in the market.

The Anthem at Riverside III | Findings and Conclusions
Page 64
C. Price Position
The proposed LIHTC rents at the subject property are positioned among existing LIHTC units in the market area and well below the highest priced LIHTC units (Figure 9). The proposed market rate rents are positioned between existing LIHTC and market rate units and well below most market rate units including those at LIHTC communities. The proposed rents will be well received in the market area and are likely conservative based on the proposed product and current market conditions.
Figure 9 Price Position, The Anthem at Riverside III
Legacy at Walton Lakes 60%
Legacy at Walton Lakes
Anthem at Riverside 50%
Anthem at Riverside 60%
Anthem at Riverside
Heritage at Walton Reserve 30%
Heritage at Walton Reserve 50%
Heritage at Walton Reserve 60%
Heritage at Walton Reserve
Big Bethel Village 60%
Big Bethel Village
Martin House at Adamsville Place 50%
Martin House at Adamsville Place 54%
Martin House at Adamsville Place
Parkview at Coventry Station 60%
Parkview at Coventry Station
Subject - 50%Subject - 60%
Subject - Market
Ashley Courts at Cascade III 60%
Ashley Courts at Cascade II 60%
Creekside at Adamsville Place 60%
Creekside at Adamsville Place 30%
Gegeral Market Rate Average
400
500
600
700
800
900
$200 $300 $400 $500 $600 $700 $800 $900 $1,000 $1,100 $1,200 $1,300 $1,400
One Bedroom Rent by Unit Size
Squ
are
Fe
et
Net Rent
Senior Tax Credit
Senior Market Rate
General Market Rate Average
General Tax Credit

The Anthem at Riverside III | Findings and Conclusions
Page 65
Legacy at Walton Lakes 60%
Legacy at Walton Lakes
Anthem at Riverside 60%
Anthem at Riverside
Heritage at Walton Reserve 50%
Heritage at Walton Reserve 60%
Heritage at Walton Reserve
Big Bethel Village 60%
Big Bethel Village
Martin House at Adamsville Place 50%
Martin House at Adamsville Place 54%
Martin House at Adamsville Place
Parkview at Coventry Station 60%
Parkview at Coventry Station
Gegeral Market Rate Average
Subject - 50%
Subject - 60%Subject - Market Ashley Courts at Cascade III
60%
Ashley Courts at Cascade II 60%
Ashley Courts at Cascade III 50%
Ashley Courts at Cascade I 50%
Ashley Courts at Cascade II 50%
Creekside at Adamsville Place 60%
Creekside at Adamsville Place 30%
700
800
900
1,000
1,100
1,200
1,300
$200 $300 $400 $500 $600 $700 $800 $900 $1,000 $1,100 $1,200 $1,300 $1,400 $1,500 $1,600 $1,700
Two Bedroom Rent by Unit Size
Squ
are
Fe
et
Net Rent
Senior Tax Credit
Senior Market Rate
General Market Rate Average
General Tax Credit

The Anthem at Riverside III | Interviews
Page 66
10. ABSORPTION AND STABILIZATION RATES
A. Absorption Estimate
The projected absorption rate is based on projected senior household growth, age and income-qualified renter households, affordability/demand estimates, rental market conditions, and the marketability of the proposed site and product.
• The first phase of the subject property has leased an average of roughly 21 units per month since opening in February 2021.
• The market area is projected to add 326 households with householders age 55+ per year from 2021 to 2024 for annual growth of 2.1 percent.
• The senior rental market is very strong in the Anthem Market Area with aggregate vacancy rates of 0.5 percent among 549 units at stabilized communities without PBRA and 0.0 percent among units with PBRA.
• Without accounting for PBRA, 768 senior renter households (55+) will be income-qualified for one or more of the LIHTC units at The Anthem at Riverside III resulting in an overall renter capture rate of 6.9 percent which is acceptable for an age-restricted community. More than 1,900 senior renter households will be income qualified for the proposed market rate units; the overall capture rate including market rate units is 0.4 percent.
• DCA demand capture rates are all within DCA thresholds including project-wide capture rates of 15.4 percent for LIHTC units without PBRA and 0.7 percent for market rate units. the capture rate for LIHTC units accounting for PBRA drops to 7.2 percent.
• The Anthem at Riverside III will offer an attractive product that will be a desirable rental community for very low to low income senior households (55+) in the Anthem Market Area. the proposed rents are lower than many existing LIHTC communities with a comparable product.
Based on projected senior household growth, acceptable capture rates, strong senior rental market conditions, we expect the nine proposed units with PBRA at The Anthem at Riverside III to lease-up in one month and the 51 units without PBRA to lease-up at a pace of 20 units per month. The units with and without PBRA will lease-up simultaneously. At this rate, the subject property will reach a stabilized occupancy of at least 93 percent within 2.5 months. Without PBRA, the subject property would reach a stabilized occupancy of at least 93 percent within three months with an average monthly absorption of 20 units.
B. Impact on Existing and Pipeline Rental Market
Given the strong projected senior household growth and strong senior rental market including waiting lists at all surveyed senior communities, we do not believe the development of the subject property will have an adverse impact on existing rental communities in the Anthem Market Area including those with tax credits. Demand for affordable senior rental housing is likely to increase over the next couple years given the strong senior household growth projected in the Anthem Market Area.
11. INTERVIEWS
Primary information gathered through field and phone interviews was used throughout the various sections of this report. The interviewees included rental community property managers and planning officials with South Fulton, Douglas County, and Cobb County.

The Anthem at Riverside III | Conclusions and Recommendations
Page 67
12. CONCLUSIONS AND RECOMMENDATIONS
Based on an analysis of projected senior household growth trends, affordability, and demand estimates (with or without PBRA), current rental market conditions, and socio-economic and demographic characteristics of the Anthem Market Area, RPRG believes that the subject property, with or without the inclusion of PBRA, will be able to successfully reach and maintain a stabilized occupancy of at least 93 percent following its entrance into the rental market; the community is likely to sustain stabilized occupancy of 95 percent or higher. The subject property will be competitively positioned with existing senior communities in the Anthem Market Area and the units will be well received by the target market. We recommend proceeding with the project as planned.
Tad Scepaniak Managing Principal
Income/Unit Size Income LimitsUnits
Proposed
Renter Income
Qualification %
Total
DemandSupply
Net
Demand
Capture
RateAbsorption
Est. of Mkt
Rent
Market
Rents Band
Proposed
Rents
50% w/PBRA no min$ - $34,500One Bedroom Units 7 35.3% 670 30 640 1.1% 1 Month $1,127 $785-$1,398 $736Two Bedroom Units 2 37.9% 721 18 703 0.3% 1 Month $1,307 $943-$1,685 $876
50% AMI $24,840 - $34,500Two Bedroom Units 3 11.9% 226 0 226 1.3% 1 Month $1,307 $943-$1,685 $828
60% AMI $24,900 - $41,400One Bedroom Units 25 16.6% 316 54 262 9.5% 3 months $1,127 $785-$1,398 $830Two Bedroom Units 16 12.6% 240 32 208 7.7% 3 months $1,307 $943-$1,685 $920
120% AMI $29,160 - $82,800One Bedroom Units 4 48.4% 919 9 910 0.4% 3 months $1,127 $785-$1,398 $900Two Bedroom Units 3 43.7% 831 7 824 0.4% 3 months $1,307 $943-$1,685 $1,050
By BedroomOne Bedroom Units 36 53.7% 1,019 93 926 3.9% 3 months $1,127 $785-$1,398Two Bedroom Units 24 55.4% 1,053 57 996 2.4% 3 months $1,307 $943-$1,685
Project Total $24,840 - $82,80050% w/PBRA no min$ - $34,500 9 37.9% 721 48 673 1.3% 1 Month
50% AMI $24,840 - $34,500 3 11.9% 226 0 226 1.3% 1 Month60% AMI $24,900 - $41,400 41 19.5% 370 86 284 14.5% 3 Months
LIHTC Units w/ PBRA no min$ - $41,400 53 45.6% 865 134 731 7.2% 3 MonthsLIHTC w/o PBRA $24,840 - $41,400 44 19.5% 371 86 285 15.4% 3 Months
120% AMI $29,160 - $82,800 7 50.1% 951 16 935 0.7% 3 MonthsTotal Units (No PBRA) $24,840 - $82,800 60 55.4% 1,053 102 951 6.3% 3 Months

The Anthem at Riverside III | Appendix 1 Underlying Assumptions and Limiting Conditions
Page 68
APPENDIX 1 UNDERLYING ASSUMPTIONS AND LIMITING
CONDITIONS
In conducting the analysis, we will make the following assumptions, except as otherwise noted in our report: 1. There are no zoning, building, safety, environmental or other federal, state or local laws, regulations or codes which would prohibit or impair the development, marketing or operation of the subject project in the manner contemplated in our report, and the subject project will be developed, marketed and operated in compliance with all applicable laws, regulations and codes. 2. No material changes will occur in (a) any federal, state or local law, regulation or code (including, without limitation, the Internal Revenue Code) affecting the subject project, or (b) any federal, state or local grant, financing or other program which is to be utilized in connection with the subject project. 3. The local, national and international economies will not deteriorate, and there will be no significant changes in interest rates or in rates of inflation or deflation. 4. The subject project will be served by adequate transportation, utilities and governmental facilities. 5. The subject project will not be subjected to any war, energy crisis, embargo, strike, earthquake, flood, fire or other casualty or act of God. 6. The subject project will be on the market at the time and with the product anticipated in our report, and at the price position specified in our report. 7. The subject project will be developed, marketed and operated in a highly professional manner. 8. No projects will be developed which will be in competition with the subject project, except as set forth in our report. 9. There are neither existing judgments nor any pending or threatened litigation, which could hinder the development, marketing or operation of the subject project.

The Anthem at Riverside III | Appendix 1 Underlying Assumptions and Limiting Conditions
Page 69
The analysis will be subject to the following limiting conditions, except as otherwise noted in our report: 1. The analysis contained in this report necessarily incorporates numerous estimates and assumptions with respect to property performance, general and local business and economic conditions, the absence of material changes in the competitive environment and other matters. Some estimates or assumptions, however, inevitably will not materialize, and unanticipated events and circumstances may occur; therefore, actual results achieved during the period covered by our analysis will vary from our estimates and the variations may be material. 2. Our absorption estimates are based on the assumption that the product recommendations set forth in our report will be followed without material deviation. 3. All estimates of future dollar amounts are based on the current value of the dollar, without any allowance for inflation or deflation. 4. We have no responsibility for considerations requiring expertise in other fields. Such considerations include, but are not limited to, legal matters, environmental matters, architectural matters, geologic considerations, such as soils and seismic stability, and civil, mechanical, electrical, structural and other engineering matters. 5. Information, estimates and opinions contained in or referred to in our report, which we have obtained from sources outside of this office, are assumed to be reliable and have not been independently verified. 6. The conclusions and recommendations in our report are subject to these Underlying Assumptions and Limiting Conditions and to any additional assumptions or conditions set forth in the body of our report.

The Anthem at Riverside III | Appendix 2 Analyst Certifications
Page 70
APPENDIX 2 ANALYST CERTIFICATIONS
I affirm that I have made a physical inspection of the market area and the subject property and that information has been used in the full study of the need and demand for the proposed units. The report was written according to DCA’s market study requirements, the information included is accurate and the report can be relied upon by DCA as a true assessment of the low-income housing rental market.
To the best of my knowledge, the market can support the project as shown in the study. I understand that any misrepresentation of this statement may result in the denial of further participation in DCA’s rental housing programs. I also affirm that I have no interest in the project or relationship with the ownership entity and my compensation is not contingent on this project being funded.
__________________
Tad Scepaniak
Managing Principal
Real Property Research Group, Inc. Warning: Title 18 U.S.C. 1001, provides in part that whoever knowingly and willfully makes or uses a document containing
any false, fictitious, or fraudulent statement or entry, in any manner in the jurisdiction of any department or agency of the
United States, shall be fined not more than $10,000 or imprisoned for not more than five years or both.

The Anthem at Riverside III | Appendix 3 NCHMA Certification
Page 71
APPENDIX 3 NCHMA CERTIFICATION
This market study has been prepared by Real Property Research Group, Inc., a member in good standing of the National Council of Housing Market Analysts (NCHMA). This study has been prepared in conformance with the standards adopted by NCHMA for the market analysts’ industry. These standards include the Standard Definitions of Key Terms Used in Market Studies for Affordable Housing Projects and Model Content Standards for the Content of Market Studies for Affordable Housing Projects. These Standards are designed to enhance the quality of market studies and to make them easier to prepare, understand, and use by market analysts and by the end users. These Standards are voluntary only, and no legal responsibility regarding their use is assumed by the National Council of Housing Market Analysts.
Real Property Research Group, Inc. is duly qualified and experienced in providing market analysis for Affordable Housing. The company’s principals participate in NCHMA educational and information sharing programs to maintain the highest professional standards and state-of-the-art knowledge. Real Property Research Group, Inc. is an independent market analyst. No principal or employee of Real Property Research Group, Inc. has any financial interest whatsoever in the development for which this analysis has been undertaken.
While the document specifies Real Property Research Group, Inc., the certification is always signed by the individual completing the study and attesting to the certification.
Real Property Research Group, Inc.
____ Tad Scepaniak___ _ Name
_ Managing Principal___ _
Title
_________ May 11, 2021 _______
Date

The Anthem at Riverside III | Appendix 4 Analyst Resumes
Page 72
APPENDIX 4 ANALYST RESUMES
TAD SCEPANIAK
Managing Principal
Tad Scepaniak assumed the role of Real Property Research Group’s Managing Principal in November 2017 following more than 15 years with the firm. Tad has extensive experience conducting market feasibility studies on a wide range of residential and mixed-use developments for developers, lenders, and government entities. Tad directs the firm’s research and production of feasibility studies including large-scale housing assessments to detailed reports for a specific project on a specific site. He has extensive experience analyzing affordable rental communities developed under the Low Income Housing Tax Credit (LIHTC) program and market-rate apartments developed under the HUD 221(d)(4) program and conventional financing. Tad is the key contact for research contracts many state housing finance agencies, including several that commission market studies for LIHTC applications. Tad is National Chair of the National Council of Housing Market Analysts (NCHMA) and previously served as Vice Chair and Co-Chair of Standards Committee. He has taken a lead role in the development of the organization's Standard Definitions and Recommended Market Study Content, and he has authored and co-authored white papers on market areas, derivation of market rents, and selection of comparable properties. Tad is also a founding member of the Atlanta chapter of the Lambda Alpha Land Economics Society. Areas of Concentration:
• Low Income Tax Credit Rental Housing: Mr. Scepaniak has worked extensively with the Low Income Tax Credit program throughout the United States, with special emphasis on the Southeast and Mid-Atlantic regions.
• Senior Housing: Mr. Scepaniak has conducted feasibility analysis for a variety of senior oriented rental housing. The majority of this work has been under the Low Income Tax Credit program; however his experience includes assisted living facilities and market rate senior rental communities.
• Market Rate Rental Housing: Mr. Scepaniak has conducted various projects for developers of market rate rental housing. The studies produced for these developers are generally used to determine the rental housing needs of a specific submarket and to obtain financing.
• Public Housing Authority Consultation: Tad has worked with Housing Authorities throughout the United States to document trends rental and for sale housing market trends to better understand redevelopment opportunities. He has completed studies examining development opportunities for housing authorities through the Choice Neighborhood Initiative or other programs in Florida, Georgia, North Carolina, South Carolina, Texas, and Tennessee.
Education: Bachelor of Science – Marketing; Berry College – Rome, Georgia

The Anthem at Riverside III | Appendix 4 Analyst Resumes
Page 73
ROBERT M. LEFENFELD Founding Principal
Mr. Lefenfeld, Founding Principal of the firm, with over 30 years of experience in the field of residential market research. Before founding Real Property Research Group in 2001, Bob served as an officer of research subsidiaries of Reznick Fedder & Silverman and Legg Mason. Between 1998 and 2001, Bob was Managing Director of RF&S Realty Advisors, conducting residential market studies throughout the United States. From 1987 to 1995, Bob served as Senior Vice President of Legg Mason Realty Group, managing the firm’s consulting practice and serving as publisher of a Mid-Atlantic residential data service, Housing Market Profiles. Prior to joining Legg Mason, Bob spent ten years with the Baltimore Metropolitan Council as a housing economist. Bob also served as Research Director for Regency Homes between 1995 and 1998, analyzing markets throughout the Eastern United States and evaluating the company’s active building operation.
Bob provides input and guidance for the completion of the firm’s research and analysis products. He combines extensive experience in the real estate industry with capabilities in database development and information management. Over the years, he has developed a series of information products and proprietary databases serving real estate professionals. Bob has lectured and written extensively about residential real estate market analysis. Bob has created and teaches the market study module for the MBA HUD Underwriting course and has served as an adjunct professor for the Graduate Programs in Real Estate Development, School of Architecture, Planning and Preservation, University of Maryland College Park. He is the past National Chair of the National Council of Housing Market Analysts (NCHMA) and currently chairs its FHA Committee.
Areas of Concentration:
• Strategic Assessments: Mr. Lefenfeld has conducted numerous corridor analyses throughout the United States to assist building and real estate companies in evaluating development opportunities. Such analyses document demographic, economic, competitive, and proposed development activity by submarket and discuss opportunities for development.
• Feasibility Analysis: Mr. Lefenfeld has conducted feasibility studies for various types of residential developments for builders and developers. Subjects for these analyses have included for-sale single-family and townhouse developments, age-restricted rental and for-sale developments, large multi-product PUDs, urban renovations and continuing care facilities for the elderly.
• Information Products: Bob has developed a series of proprietary databases to assist clients in monitoring growth trends. Subjects of these databases have included for sale housing, pipeline information, and rental communities.
Education:
Master of Urban and Regional Planning; The George Washington University. Bachelor of Arts - Political Science; Northeastern University.

The Anthem at Riverside III | Appendix 4 Analyst Resumes
Page 74
BRETT WELBORN Analyst
Brett Welborn entered the field of Real Estate Market Research in 2008, joining Real Property Research Group’s (RPRG) Atlanta office as a Research Associate upon college graduation. During Brett’s time as a Research Associate, he gathered economic, demographic, and competitive data for market feasibility analyses and other consulting projects completed by the firm. Through his experience, Brett progressed to serve as Analyst for RPRG for the past five years and has conducted market studies for LIHTC and market rate communities.
Areas of Concentration:
• Low Income Housing Tax Credit Rental Housing: Brett has worked with the Low Income Housing Tax Credit program, evaluating general occupancy and senior oriented developments for State allocating agencies, lenders, and developers. His work with the LIHTC program has spanned a range of project types, including newly constructed communities and rehabilitations.
• Market Rate Rental Housing – Brett has conducted projects for developers of market rate rental housing. The studies produced for these developers are generally used to determine the rental housing needs of a specific submarket and to obtain financing.
Education: Bachelor of Business Administration – Real Estate; University of Georgia, Athens, GA

The Anthem at Riverside III | Appendix 5 DCA Checklist
Page 75
APPENDIX 5 DCA CHECKLIST
A. Executive Summary
1. Project Description:
i. Brief description of the project location including address and/or position
relative to the closest cross-street ............................................................................................... Page(s) 1
ii. Construction and Occupancy Types ........................................................................................... Page(s) 1
iii. Unit mix, including bedrooms, bathrooms, square footage, Income targeting,
rents, and utility allowance .......................................................................................................... Page(s) 1
iv. Any additional subsidies available, including project based rental assistance
(PBRA) ........................................................................................................................................ Page(s) 1
v. Brief description of proposed amenities and how they compare with existing
properties .................................................................................................................................... Page(s) 1
2. Site Description/Evaluation:
i. A brief description of physical features of the site and adjacent parcels ..................................... Page(s) 2
ii. A brief overview of the neighborhood land composition (residential,
commercial, industrial, agricultural). ......................................................................................... Page(s) 2
iii. A discussion of site access and visibility ..................................................................................... Page(s) 2
iv. Any significant positive or negative aspects of the subject site ................................................... Page(s) 2
v. A brief summary of the site’s proximity to neighborhood services including
shopping, medical care, employment concentrations, public transportation, etc ........................ Page(s) 2
vi. A brief discussion of public safety, including comments on local perceptions,
maps, or statistics of crime in the area ....................................................................................... Page(s) 2
vii. An overall conclusion of the site’s appropriateness for the proposed
development ................................................................................................................................ Page(s) 2
3. Market Area Definition:
i. A brief definition of the primary market area (PMA) including boundaries and
their approximate distance from the subject property ................................................................. Page(s) 2
4. Community Demographic Data:
i. Current and projected household and population counts for the PMA. ....................................... Page(s) 2
ii. Household tenure including any trends in rental rates. ............................................................... Page(s) 2
iii. Household income level. ............................................................................................................. Page(s) 2
iv. Impact of foreclosed, abandoned / vacant, single and multi-family homes, and
commercial properties in the PMA of the proposed development. .............................................. Page(s) 2
5. Economic Data:
i. Trends in employment for the county and/or region.. .................................................................. Page(s) 3
ii. Employment by sector for the primary market area. ................................................................... Page(s) 3
iii. Unemployment trends for the county and/or region for the past five years. ................................ Page(s) 3
iv. Brief discussion of recent or planned employment contractions or expansions. ......................... Page(s) 3
v. Overall conclusion regarding the stability of the county’s economic environment.. .................... Page(s) 3
6. Project Specific Affordability and Demand Analysis:
i. Number of renter households income qualified for the proposed development
given retention of current tenants (rehab only), the proposed unit mix, income
targeting, and rents. For senior projects, this should be age and income
qualified renter households. ........................................................................................................ Page(s) 4
ii. Overall estimate of demand based on DCA’s demand methodology. ......................................... Page(s) 4
iii. Capture rates for the proposed development including the overall project, all
LIHTC units (excluding any PBRA or market rate units), by AMI, by bedroom
type, and a conclusion regarding the achievability of these capture rates. ................................. Page(s) 4

The Anthem at Riverside III | Appendix 5 DCA Checklist
Page 76
7. Competitive Rental Analysis
i. An analysis of the competitive properties in the PMA. ............................................................... Page(s) 5
ii. Number of properties. .................................................................................................................. Page(s) 5
iii. Rent bands for each bedroom type proposed. ............................................................................ Page(s) 5
iv. Average market rents. ................................................................................................................. Page(s) 5
8. Absorption/Stabilization Estimate:
i. An estimate of the number of units expected to be leased at the subject
property, on average, per month. ................................................................................................ Page(s) 6
ii. Number of months required for the project to stabilize at 93% occupancy. ................................ Page(s) 6
9. Overall Conclusion:
i. Overall conclusion regarding potential for success of the proposed
development. ............................................................................................................................... Page(s) 6
10. Summary Table ................................................................................................................................... Page(s) 7
B. Project Description
1. Project address and location. .............................................................................................................. Page(s) 10
2. Construction type. ............................................................................................................................... Page(s) 10
3. Occupancy Type. ................................................................................................................................ Page(s) 10
4. Special population target (if applicable). ............................................................................................. Page(s) N/A
5. Number of units by bedroom type and income targeting (AMI). .......................................................... Page(s) 11
6. Unit size, number of bedrooms, and structure type. ........................................................................... Page(s) 11
7. Rents and Utility Allowances. .............................................................................................................. Page(s) 11
8. Existing or proposed project based rental assistance. ........................................................................ Page(s) 11
9. Proposed development amenities. ...................................................................................................... Page(s) 11
10. For rehab proposals, current occupancy levels, rents being charged, and tenant
incomes, if available, as well as detailed information with regard to the scope of
work planned. Scopes of work should include an estimate of the total and per unit
construction cost.. ............................................................................................................................... Page(s) N/A
11. Projected placed-in-service date. ........................................................................................................ Page(s) 11
C. Site Evaluation
1. Date of site / comparables visit and name of site inspector. ............................................................... Page(s) 8
2. Physical features of the site and adjacent parcel, including positive and negative
attributes ............................................................................................................................................... Page(s) 12-15
3. The site’s physical proximity to surrounding roads, transportation (including bus
stops), amenities, employment, and community services.. ................................................................. Page(s) 17-20
4. Labeled photographs of the subject property (front, rear and side elevations, on- site
amenities, interior of typical units, if available), of the neighborhood, and street
scenes with a description of each vantage point. ..................................................................... Page(s) 13, 15
5. A map clearly identifying the project and proximity to neighborhood amenities. A
listing of the closest shopping areas, schools, employment centers, medical facilities
and other amenities that would be important to the target population and the
proximity in miles to each. .................................................................................................................. Page(s) 19
6. The land use and structures of the area immediately surrounding the site including
significant concentrations of residential, commercial, industrial, vacant, or
agricultural uses; comment on the condition of these existing land uses. .......................................... Page(s) 14
7. Any public safety issues in the area, including local perceptions of crime, crime
statistics, or other relevant information. ............................................................................................. Page(s) 16
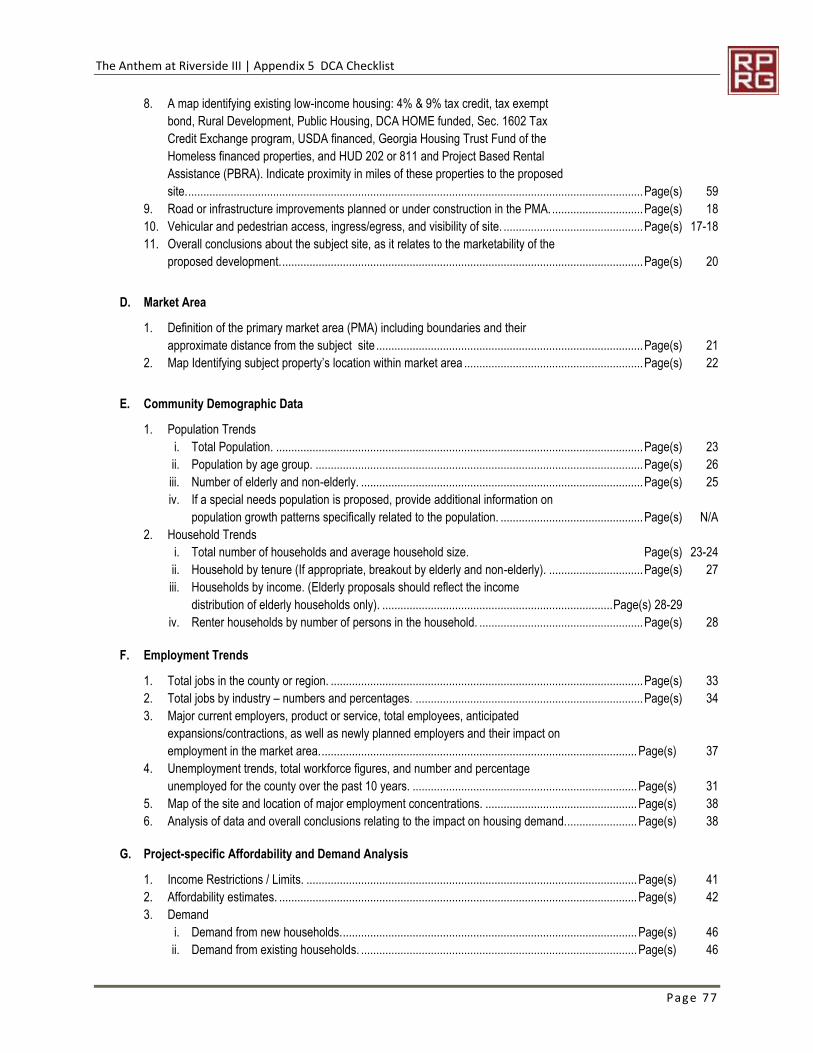
The Anthem at Riverside III | Appendix 5 DCA Checklist
Page 77
8. A map identifying existing low-income housing: 4% & 9% tax credit, tax exempt
bond, Rural Development, Public Housing, DCA HOME funded, Sec. 1602 Tax
Credit Exchange program, USDA financed, Georgia Housing Trust Fund of the
Homeless financed properties, and HUD 202 or 811 and Project Based Rental
Assistance (PBRA). Indicate proximity in miles of these properties to the proposed
site. ...................................................................................................................................................... Page(s) 59
9. Road or infrastructure improvements planned or under construction in the PMA. .............................. Page(s) 18
10. Vehicular and pedestrian access, ingress/egress, and visibility of site. .............................................. Page(s) 17-18
11. Overall conclusions about the subject site, as it relates to the marketability of the
proposed development. ....................................................................................................................... Page(s) 20
D. Market Area
1. Definition of the primary market area (PMA) including boundaries and their
approximate distance from the subject site ........................................................................................ Page(s) 21
2. Map Identifying subject property’s location within market area ........................................................... Page(s) 22
E. Community Demographic Data
1. Population Trends
i. Total Population. ......................................................................................................................... Page(s) 23
ii. Population by age group. ............................................................................................................ Page(s) 26
iii. Number of elderly and non-elderly. ............................................................................................. Page(s) 25
iv. If a special needs population is proposed, provide additional information on
population growth patterns specifically related to the population. ............................................... Page(s) N/A
2. Household Trends
i. Total number of households and average household size. Page(s) 23-24
ii. Household by tenure (If appropriate, breakout by elderly and non-elderly). ............................... Page(s) 27
iii. Households by income. (Elderly proposals should reflect the income
distribution of elderly households only). ............................................................................ Page(s) 28-29
iv. Renter households by number of persons in the household. ...................................................... Page(s) 28
F. Employment Trends
1. Total jobs in the county or region. ....................................................................................................... Page(s) 33
2. Total jobs by industry – numbers and percentages. ........................................................................... Page(s) 34
3. Major current employers, product or service, total employees, anticipated
expansions/contractions, as well as newly planned employers and their impact on
employment in the market area. ........................................................................................................ Page(s) 37
4. Unemployment trends, total workforce figures, and number and percentage
unemployed for the county over the past 10 years. .......................................................................... Page(s) 31
5. Map of the site and location of major employment concentrations. .................................................. Page(s) 38
6. Analysis of data and overall conclusions relating to the impact on housing demand........................ Page(s) 38
G. Project-specific Affordability and Demand Analysis
1. Income Restrictions / Limits. ............................................................................................................. Page(s) 41
2. Affordability estimates. ...................................................................................................................... Page(s) 42
3. Demand
i. Demand from new households. ................................................................................................. Page(s) 46
ii. Demand from existing households. ........................................................................................... Page(s) 46

The Anthem at Riverside III | Appendix 5 DCA Checklist
Page 78
iii. Elderly Homeowners likely to convert to rentership. ................................................................. Page(s) 44
iv. Net Demand and Capture Rate Calculations ........................................................................... Page(s) 44-46
H. Competitive Rental Analysis (Existing Competitive Rental Environment
1. Detailed project information for each competitive rental community surveyed
i. Name and address of the competitive property development. .................................................. Page(s) App. 6
ii. Name, title, and phone number of contact person and date contact was made. ...................... Page(s) App. 6
iii. Description of property. ............................................................................................................. Page(s) App. 6
iv. Photographs. ............................................................................................................................. Page(s) App. 6
v. Square footages for each competitive unit type. ................................................ Page(s) 50, 54, App. 5
vi. Monthly rents and the utilities included in the rents of each unit type. ...................................... Page(s) 50, 54,
App. 5
vii. Project age and current physical condition. ............................................................................... Page(s) 54,
App. 8
viii. Concessions given if any. .......................................................................................................... Page(s) 54
ix. Current vacancy rates, historic vacancy factors, waiting lists, and turnover
rates, broken down by bedroom size and structure type. .......................................................... Page(s) 54
x. Number of units receiving rental assistance, description of assistance as
project or tenant based. ............................................................................................................ Page(s) App. 8
xi. Lease-up history ....................................................................................................................... Page(s) 51
Additional rental market information
1. An analysis of the vouchers available in the Market Area, including if vouchers
go unused and whether waitlisted households are income-qualified and when
the list was last updated. . ........................................................................................................... Page(s) 58
2. If the proposed development represents an additional phase of an existing
housing development, include a tenant profile and information on a waiting list
of the existing phase. .................................................................................................................. Page(s) 10, 50
3. A map showing the competitive projects and all LIHTC and Bond proposed
projects which have received tax credit allocations within the market area.. .............................. Page(s) 59
4. An assessment as to the quality and compatibility of the proposed amenities to
what is currently available in the market. .................................................................................... Page(s) 63
5. Consider tenancy type. If comparable senior units do not exist in the PMA,
provide an overview of family-oriented properties, or vice versa. Account for
differences in amenities, unit sizes, and rental levels. ................................................................ Page(s) N/A
6. Provide the name, address/location, name of owner, number of units, unit
configuration, rent structure, estimated date of market entry, and any other
relevant market analysis information of developments in the planning,
rehabilitation, or construction stages. If there are none, provide a statement to
that effect.. ................................................................................................................................... Page(s) 54
7. Provide documentation and diagrams on how the projected initial rents for the
project compare to the rental range for competitive projects within the PMA and
provide an average market rent for each of the proposed unit types. ......................................... Page(s) 51, 55
8. Comment on any other DCA funded projects located outside of the primary
area, but located within a reasonable distance from the proposed project.. ............................... Page(s) N/A
9. Rental trends in the PMA for the last five years including average occupancy
trends and projection for the next two years. ................................................................................... N/A
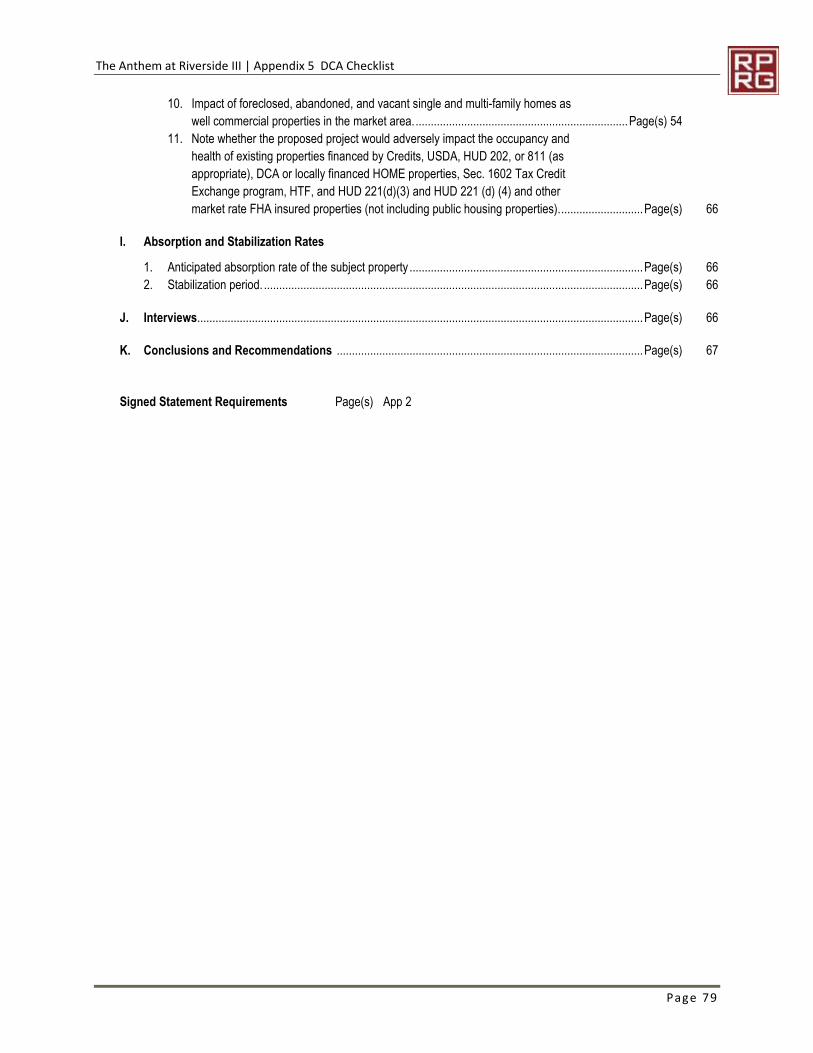
The Anthem at Riverside III | Appendix 5 DCA Checklist
Page 79
10. Impact of foreclosed, abandoned, and vacant single and multi-family homes as
well commercial properties in the market area. ...................................................................... Page(s) 54
11. Note whether the proposed project would adversely impact the occupancy and
health of existing properties financed by Credits, USDA, HUD 202, or 811 (as
appropriate), DCA or locally financed HOME properties, Sec. 1602 Tax Credit
Exchange program, HTF, and HUD 221(d)(3) and HUD 221 (d) (4) and other
market rate FHA insured properties (not including public housing properties). ........................... Page(s) 66
I. Absorption and Stabilization Rates
1. Anticipated absorption rate of the subject property ............................................................................. Page(s) 66
2. Stabilization period. ............................................................................................................................. Page(s) 66
J. Interviews ................................................................................................................................................... Page(s) 66
K. Conclusions and Recommendations ..................................................................................................... Page(s) 67
Signed Statement Requirements Page(s) App 2

The Anthem at Riverside III | Appendix 6 Rental Community Profiles
Page 80
APPENDIX 6 RENTAL COMMUNITY PROFILES

RealProperty Research Group
Anthem at Riverside Senior Community Profile
1910 Waycrest Dr SW
Atlanta,GA 30331
Property Manager: --
Opened in 2021
CommunityType: LIHTC - Elderly
80 Units
Structure Type: Mid Rise
Owner: --
Historic Vacancy & Eff. Rent (1)
Bedroom Avg $/SqFtAvg SqFt%Total Avg Rent
Eff
One
Two
Three
Four+
One/Den
Two/Den
--
$850
--
$1,107
--
--
--
--
708
--
932
--
--
--
--
$1.20
--
$1.19
--
--
--
--
--
--
--
--
--
--
Utilities in Rent:
Heat:
Heat Fuel: Electric
Hot Water:
Cooking:
Electricity:
Wtr/Swr:
Trash:
Community Amenities
Clubhouse:
Comm Rm:
Centrl Lndry:
Fitness:
Hot Tub:
Sauna:
Gardening:
Walking Pth:
Library:
Arts&Crafts:
Health Rms:
Guest Suite:
Conv Store:
ComputerCtr:
Floorplans (Published Rents as of 5/7/2021) (2)
Elevator:
33.8% Vacant (27 units vacant) as of 5/7/2021
Features
Standard: Dishwasher; Disposal; Microwave; Ceiling Fan; In Unit Laundry (Hook-
ups); Central A/C; Grabbar; Emergency Response
Select Units: --
Optional($): --
Incentives:
$500 gift card
Security: --
Unit Mix & Effective Rent (1)
Adjustments to Rent
Parking: Free Surface Parking
Comments
62+. Opened 02/2021. Units Mix: 48 1BRs, 32 2BRs. 16 units are market rate.
Select units have RA
Beauty Salon:
Date %Vac 1BR $ 2BR $ 3BR $
33.8%5/7/21* $850 $1,107 --
40.0%4/9/21* $878 $996 --
Description BRs Bath Rent SqFt ProgramRent/SF#UnitsFeature
1 1 $749 650 LIHTC/ 50%$1.15----
1 1 $911 650 LIHTC/ 60%$1.40----
1 1 $995 765 Market$1.30----
1 1 $911 765 LIHTC/ 60%$1.19----
2 1 $1,085 866 LIHTC/ 60%$1.25----
2 1 $1,175 866 Market$1.36----
2 2 $1,085 976 LIHTC/ 60%$1.11----
2 2 $1,200 976 Market$1.23----
2 2 $1,200 976 Market$1.23----
© 2021 Real Property Research Group, Inc.
GA121-036675Anthem at Riverside
(1) Effective Rent is Published Rent, net of utilities and concessions. (2) Published Rent is rent as quoted by management.

RealProperty Research Group
Big Bethel Village Senior Community Profile
500 Richard Allen Blvd SW
Atlanta,GA 30331
Property Manager: HJ Russell
Opened in 2003
CommunityType: LIHTC - Elderly
120 Units
Structure Type: Mid Rise
Owner: --
Historic Vacancy & Eff. Rent (1)
Bedroom Avg $/SqFtAvg SqFt%Total Avg Rent
Eff
One
Two
Three
Four+
One/Den
Two/Den
$788
$879
$869
$995
--
--
--
350
465
631
760
--
--
--
$2.25
$1.89
$1.38
$1.31
--
--
--
15.0%
35.0%
10.0%
40.0%
--
--
--
Utilities in Rent:
Heat:
Heat Fuel: Electric
Hot Water:
Cooking:
Electricity:
Wtr/Swr:
Trash:
Community Amenities
Clubhouse:
Comm Rm:
Centrl Lndry:
Fitness:
Hot Tub:
Sauna:
Gardening:
Walking Pth:
Library:
Arts&Crafts:
Health Rms:
Guest Suite:
Conv Store:
ComputerCtr:
Floorplans (Published Rents as of 5/7/2021) (2)
Elevator:
100.0% Vacant (120 units vacant) as of 5/7/2021
Features
Standard: Dishwasher; Disposal; Ice Maker; In Unit Laundry (Hook-ups); Central
A/C; Grabbar; Emergency Response; Van/Transportation; Carpet
Select Units: --
Optional($): --
Incentives:
None
Security: Intercom
Unit Mix & Effective Rent (1)
Adjustments to Rent
Parking: Free Surface Parking
Comments
All units under renovation. Expect to complete by May of 2022.
Beauty Salon:
Date %Vac 1BR $ 2BR $ 3BR $
100.0%5/7/21 $877 $995 --
0.0%9/21/20 $840 $995 --
1.7%5/9/19 $808 $909 --
1.7%3/30/18 $782 $914 --
Description BRs Bath Rent SqFt ProgramRent/SF#UnitsFeature
Eff 1Garden $930 350 Market$2.664--
Eff 1Garden $861 350 LIHTC/ 60%$2.4614--
1 1Garden $1,060 435 Market$2.445--
1 1Garden $957 435 LIHTC/ 60%$2.2019--
1 1Garden $1,060 505 Market$2.106--
1 1Garden $957 505 LIHTC/ 60%$1.9012--
1 1Garden $1,060 631 Market$1.682Den
1 1Garden $957 631 LIHTC/ 60%$1.5210Den
2 2Garden $1,107 760 LIHTC/ 60%$1.4635--
2 2Garden $1,175 760 Market$1.5513--
© 2021 Real Property Research Group, Inc.
GA121-008043Big Bethel Village
(1) Effective Rent is Published Rent, net of utilities and concessions. (2) Published Rent is rent as quoted by management.

RealProperty Research Group
Heritage at Walton Reserve Senior Community Profile
1675 Walton Reserve Boulevard
Austell,GA 30168
Property Manager: --
Opened in 2004
CommunityType: LIHTC - Elderly
105 Units
Structure Type: 3-Story Mid Rise
Owner: --
Historic Vacancy & Eff. Rent (1)
Bedroom Avg $/SqFtAvg SqFt%Total Avg Rent
Eff
One
Two
Three
Four+
One/Den
Two/Den
--
$734
--
$995
--
--
--
--
750
--
1,150
--
--
--
--
$0.98
--
$0.87
--
--
--
--
76.2%
--
23.8%
--
--
--
Utilities in Rent:
Heat:
Heat Fuel: Natural Gas
Hot Water:
Cooking:
Electricity:
Wtr/Swr:
Trash:
Community Amenities
Clubhouse:
Comm Rm:
Centrl Lndry:
Fitness:
Hot Tub:
Sauna:
Gardening:
Walking Pth:
Library:
Arts&Crafts:
Health Rms:
Guest Suite:
Conv Store:
ComputerCtr:
Floorplans (Published Rents as of 5/7/2021) (2)
Elevator:
0.0% Vacant (0 units vacant) as of 5/7/2021
Features
Standard: Dishwasher; Disposal; In Unit Laundry (Hook-ups); Central A/C;
Patio/Balcony; Grabbar; Emergency Response; Carpet
Select Units: --
Optional($): --
Incentives:
None.
Security: --
Unit Mix & Effective Rent (1)
Adjustments to Rent
Parking: Free Surface Parking
Comments
Shuffleboard, cyber café. Activites director on staff.
Waiting lists: 1BR- 6-12 months, 2BR- 1-2 years.
1st floor faux hardwood; 2nd & 3rd floors have carpet flooring. Email: [email protected].
Beauty Salon:
Date %Vac 1BR $ 2BR $ 3BR $
0.0%5/7/21 $734 $995 --
0.0%5/9/19 $644 $854 --
0.0%3/29/18 $631 $841 --
0.0%3/31/17 $614 $826 --
Description BRs Bath Rent SqFt ProgramRent/SF#UnitsFeature
1 1Garden $875 750 LIHTC/ 60%$1.1715--
1 1Garden $978 750 Market$1.3016--
1 1Garden $716 750 LIHTC/ 50%$.9533--
1 1Garden $396 750 LIHTC/ 30%$.5316--
2 2Garden $1,190 1,150 Market$1.035--
2 2Garden $860 1,150 LIHTC/ 50%$.7511--
2 2Garden $1,052 1,150 LIHTC/ 60%$.919--
© 2021 Real Property Research Group, Inc.
GA067-007328Heritage at Walton Reserve
(1) Effective Rent is Published Rent, net of utilities and concessions. (2) Published Rent is rent as quoted by management.

RealProperty Research Group
Legacy at Walton Lakes Senior Community Profile
4687 Camp Creek Pkwy.
Atlanta,GA 30331
Property Manager: --
Opened in 2009
CommunityType: LIHTC - Elderly
126 Units
Structure Type: 3-Story Mid Rise
Owner: --
Historic Vacancy & Eff. Rent (1)
Bedroom Avg $/SqFtAvg SqFt%Total Avg Rent
Eff
One
Two
Three
Four+
One/Den
Two/Den
--
$1,008
--
$1,168
--
--
--
--
810
--
1,270
--
--
--
--
$1.24
--
$0.92
--
--
--
--
50.0%
--
50.0%
--
--
--
Utilities in Rent:
Heat:
Heat Fuel: Electric
Hot Water:
Cooking:
Electricity:
Wtr/Swr:
Trash:
Community Amenities
Clubhouse:
Comm Rm:
Centrl Lndry:
Fitness:
Hot Tub:
Sauna:
Gardening:
Walking Pth:
Library:
Arts&Crafts:
Health Rms:
Guest Suite:
Conv Store:
ComputerCtr:
Floorplans (Published Rents as of 5/6/2021) (2)
Elevator:
1.6% Vacant (2 units vacant) as of 5/6/2021
Features
Standard: Dishwasher; Disposal; Microwave; Ice Maker; Ceiling Fan; In Unit
Laundry (Hook-ups); Central A/C; Patio/Balcony; Grabbar; Emergency
Response
Select Units: --
Optional($): --
Incentives:
None.
Security: Gated Entry
Unit Mix & Effective Rent (1)
Adjustments to Rent
Parking: Free Surface Parking
Comments
Opened April 2009 and lease up in November 2009. Vacant units both 2BR.
Gameroom and Picnic area
Beauty Salon:
Date %Vac 1BR $ 2BR $ 3BR $
1.6%5/6/21 $1,008 $1,168 --
1.6%4/9/21 $923 $1,089 --
0.0%1/15/21 $923 $1,089 --
0.0%9/21/20 $900 $1,055 --
Description BRs Bath Rent SqFt ProgramRent/SF#UnitsFeature
-- -- -- -- --------
1 1PBRA / Garden $825 810 LIHTC/ 60%$1.0218--
1 1Garden $1,383 810 Market$1.7119--
1 1Garden $825 810 LIHTC/ 60%$1.0226--
2 2PBRA / Garden $925 1,270 LIHTC/ 60%$.7320--
2 2Garden $925 1,270 LIHTC/ 60%$.7324--
2 2Garden $1,665 1,270 Market$1.3119--
© 2021 Real Property Research Group, Inc.
GA121-012570Legacy at Walton Lakes
(1) Effective Rent is Published Rent, net of utilities and concessions. (2) Published Rent is rent as quoted by management.

RealProperty Research Group
Martin House at Adamsville Place Senior Community Profile
3724 Martin Luther King Jr. Dr.
Atlanta,GA 30331
Property Manager: Lincoln Prop.
Opened in 2005
CommunityType: LIHTC - Elderly
152 Units
Structure Type: 4-Story Mid Rise
Owner: Atlanta Development Neighb
Historic Vacancy & Eff. Rent (1)
Bedroom Avg $/SqFtAvg SqFt%Total Avg Rent
Eff
One
Two
Three
Four+
One/Den
Two/Den
--
$769
--
$914
--
--
--
--
762
--
1,095
--
--
--
--
$1.01
--
$0.83
--
--
--
--
--
--
--
--
--
--
Utilities in Rent:
Heat:
Heat Fuel: Electric
Hot Water:
Cooking:
Electricity:
Wtr/Swr:
Trash:
Community Amenities
Clubhouse:
Comm Rm:
Centrl Lndry:
Fitness:
Hot Tub:
Sauna:
Gardening:
Walking Pth:
Library:
Arts&Crafts:
Health Rms:
Guest Suite:
Conv Store:
ComputerCtr:
Floorplans (Published Rents as of 5/6/2021) (2)
Elevator:
0.0% Vacant (0 units vacant) as of 5/6/2021
Features
Standard: Dishwasher; Disposal; Ice Maker; In Unit Laundry (Hook-ups); Central
A/C; Grabbar; Emergency Response; Carpet
Select Units: Patio/Balcony
Optional($): --
Incentives:
None.
Security: --
Unit Mix & Effective Rent (1)
Adjustments to Rent
Parking: Free Surface Parking
Comments
Age restricted 55+. 120 1BRs, 32 2BR
Waiting list. 32 units market rate and 121 50% units. No set rates for LIHTC units.
Gated parking lot. MARTA bus comes directly to pick up tenants in wheelchairs.
Beauty Salon:
Date %Vac 1BR $ 2BR $ 3BR $
0.0%5/6/21 $769 $914 --
0.7%5/9/19 $758 $905 --
0.0%4/16/18 $578 $921 --
1.3%3/31/17 $850 $746 --
Description BRs Bath Rent SqFt ProgramRent/SF#UnitsFeature
-- -- -- -- --------
1 1Mid Rise - Elevator $770 762 Market$1.01----
1 1Mid Rise - Elevator $842 762 LIHTC/ 54%$1.10----
1 1Mid Rise - Elevator $639 762 LIHTC/ 50%$.84----
1 1Mid Rise - Elevator $770 762 Market$1.01----
1 1Mid Rise - Elevator $749 762 Section 8/ 54%$.98----
2 2Mid Rise - Elevator $923 1,095 Market$.84----
2 2Mid Rise - Elevator $899 1,095 Section 8/ 54%$.82----
2 2Mid Rise - Elevator $832 1,095 LIHTC/ 50%$.76----
2 2Mid Rise - Elevator $923 1,095 LIHTC/ 54%$.84----
© 2021 Real Property Research Group, Inc.
GA121-008798Martin House at Adamsville Place
(1) Effective Rent is Published Rent, net of utilities and concessions. (2) Published Rent is rent as quoted by management.

RealProperty Research Group
Parkview at Coventry Station Senior Community Profile
3381 Greenbriar Pkwy
Atlanta,GA
Property Manager: --
Opened in 2007
CommunityType: LIHTC - Elderly
166 Units
Structure Type: Mid Rise
Owner: --
Historic Vacancy & Eff. Rent (1)
Bedroom Avg $/SqFtAvg SqFt%Total Avg Rent
Eff
One
Two
Three
Four+
One/Den
Two/Den
--
$899
--
$982
--
--
--
--
693
--
907
--
--
--
--
$1.30
--
$1.08
--
--
--
--
39.8%
--
60.2%
--
--
--
Utilities in Rent:
Heat:
Heat Fuel: Electric
Hot Water:
Cooking:
Electricity:
Wtr/Swr:
Trash:
Community Amenities
Clubhouse:
Comm Rm:
Centrl Lndry:
Fitness:
Hot Tub:
Sauna:
Gardening:
Walking Pth:
Library:
Arts&Crafts:
Health Rms:
Guest Suite:
Conv Store:
ComputerCtr:
Floorplans (Published Rents as of 5/13/2021) (2)
Elevator:
0.6% Vacant (1 units vacant) as of 5/13/2021
Features
Standard: Dishwasher; Disposal; Ceiling Fan; In Unit Laundry (Full Size); Central
A/C; Grabbar; Emergency Response
Select Units: --
Optional($): --
Incentives:
None
Security: Keyed Bldg Entry; Cameras
Unit Mix & Effective Rent (1)
Adjustments to Rent
Parking: Free Surface Parking
Comments
Waiting list.
White appliances and laminate countertops.
Beauty Salon:
Date %Vac 1BR $ 2BR $ 3BR $
0.6%5/13/21 $899 $982 --
0.0%1/15/21 $893 $1,067 --
0.0%9/21/20 $869 $1,034 --
2.4%9/4/13 -- -- --
Description BRs Bath Rent SqFt ProgramRent/SF#UnitsFeature
1 1Mid Rise - Elevator $864 693 LIHTC/ 60%$1.2556--
1 1Mid Rise - Elevator $998 693 Market$1.4410--
2 1Mid Rise - Elevator $920 893 LIHTC/ 60%$1.0374--
2 1Mid Rise - Elevator $1,198 893 Market$1.3410--
2 1.5Mid Rise - Elevator $920 978 LIHTC/ 60%$.945--
2 1.5Mid Rise - Elevator $1,198 978 Market$1.223--
2 2Mid Rise - Elevator $920 978 LIHTC/ 60%$.946--
2 2Mid Rise - Elevator $1,198 978 Market$1.222--
© 2021 Real Property Research Group, Inc.
GA121-010635Parkview at Coventry Station
(1) Effective Rent is Published Rent, net of utilities and concessions. (2) Published Rent is rent as quoted by management.

RealProperty Research Group
Providence at Parkway Village Senior Community Profile
5095 Southwood Rd.
Fairburn,GA 30213
Property Manager: --
Opened in 2015
CommunityType: LIHTC - Elderly
150 Units
Structure Type: 3-Story Mid Rise
Owner: --
Historic Vacancy & Eff. Rent (1)
Bedroom Avg $/SqFtAvg SqFt%Total Avg Rent
Eff
One
Two
Three
Four+
One/Den
Two/Den
--
$975
--
$1,110
--
--
--
--
709
--
928
--
--
--
--
$1.38
--
$1.20
--
--
--
--
--
--
--
--
--
--
Utilities in Rent:
Heat:
Heat Fuel: Electric
Hot Water:
Cooking:
Electricity:
Wtr/Swr:
Trash:
Community Amenities
Clubhouse:
Comm Rm:
Centrl Lndry:
Fitness:
Hot Tub:
Sauna:
Gardening:
Walking Pth:
Library:
Arts&Crafts:
Health Rms:
Guest Suite:
Conv Store:
ComputerCtr:
Floorplans (Published Rents as of 5/10/2021) (2)
Elevator:
0.0% Vacant (0 units vacant) as of 5/10/2021
Features
Standard: Dishwasher; Disposal; Microwave; Ceiling Fan; In Unit Laundry (Full
Size); Central A/C; Grabbar; Emergency Response
Select Units: --
Optional($): --
Incentives:
None.
Security: Gated Entry
Unit Mix & Effective Rent (1)
Adjustments to Rent
Parking: Free Surface Parking
Comments
62+. Section 8 - rent is contract rent.
Internet café, grilling area, gazebo.
Beauty Salon:
Date %Vac 1BR $ 2BR $ 3BR $
0.0%5/10/21 $975 $1,110 --
4.0%5/9/19 $730 $856 --
0.0%4/2/18 $730 $861 --
0.0%4/5/17 $730 $869 --
Description BRs Bath Rent SqFt ProgramRent/SF#UnitsFeature
1 1Mid Rise - Elevator $950 709 Section 8$1.34----
2 2Mid Rise - Elevator $1,080 928 Section 8$1.16----
© 2021 Real Property Research Group, Inc.
GA121-024838Providence at Parkway Village
(1) Effective Rent is Published Rent, net of utilities and concessions. (2) Published Rent is rent as quoted by management.

RealProperty Research Group
Woodbridge at Parkway Village Senior Community Profile
5151 Thompson Rd.
Fairburn,GA
Property Manager: --
Opened in 2009
CommunityType: LIHTC - Elderly
150 Units
Structure Type: 3-Story Mid Rise
Owner: --
Historic Vacancy & Eff. Rent (1)
Bedroom Avg $/SqFtAvg SqFt%Total Avg Rent
Eff
One
Two
Three
Four+
One/Den
Two/Den
--
$770
--
$923
--
--
--
--
706
--
946
--
--
--
--
$1.09
--
$0.98
--
--
--
--
61.3%
--
38.7%
--
--
--
Utilities in Rent:
Heat:
Heat Fuel: Electric
Hot Water:
Cooking:
Electricity:
Wtr/Swr:
Trash:
Community Amenities
Clubhouse:
Comm Rm:
Centrl Lndry:
Fitness:
Hot Tub:
Sauna:
Gardening:
Walking Pth:
Library:
Arts&Crafts:
Health Rms:
Guest Suite:
Conv Store:
ComputerCtr:
Floorplans (Published Rents as of 5/10/2021) (2)
Elevator:
0.0% Vacant (0 units vacant) as of 5/10/2021
Features
Standard: Dishwasher; Disposal; Microwave; Ice Maker; Ceiling Fan; In Unit
Laundry (Full Size); Central A/C; Grabbar; Emergency Response
Select Units: --
Optional($): --
Incentives:
None.
Security: Gated Entry; Keyed Bldg Entry
Unit Mix & Effective Rent (1)
Adjustments to Rent
Parking: Free Surface Parking
Comments
Waiting list, Community leased-up in four months upon opening in 2009.
Section 8, rent is contract rent. Shuffle Board
Beauty Salon:
Date %Vac 1BR $ 2BR $ 3BR $
0.0%5/10/21 -- -- --
0.0%5/9/19 $770 $923 --
0.0%3/29/18 $770 $925 --
0.0%3/31/17 $770 $923 --
Description BRs Bath Rent SqFt ProgramRent/SF#UnitsFeature
1 1Mid Rise - Elevator $770 706 Section 8$1.0992--
2 2Mid Rise - Elevator $923 946 Section 8$.9858--
© 2021 Real Property Research Group, Inc.
GA121-018825Woodbridge at Parkway Village
(1) Effective Rent is Published Rent, net of utilities and concessions. (2) Published Rent is rent as quoted by management.

RealProperty Group Research
300 Riverside Multifamily Community Profile
7440 Riverside Pkwy.
Austell,GA 30168
Property Manager: --
Opened in 1971
CommunityType: Market Rate - General
232 Units
Structure Type: Townhouse
Owner: --
Historic Vacancy & Eff. Rent (1)
Bedroom Avg $/SqFtAvg SqFt%Total Avg Rent
Eff
One
Two
Three
Four+
One/Den
Two/Den
--
$950
--
$1,038
--
$1,350
--
--
793
--
1,050
--
1,268
--
--
$1.20
--
$0.99
--
$1.07
--
--
--
--
--
--
--
--
Utilities in Rent:
Heat:
Heat Fuel: Electric
Hot Water:
Cooking:
Electricity:
Wtr/Swr:
Trash:
Community Amenities
Clubhouse:
Comm Rm:
Centrl Lndry:
Fitness:
Hot Tub:
Sauna:
Pool-Outdr:
Playground:
Basketball:
Tennis:
Volleyball:
CarWash:
BusinessCtr:
ComputerCtr:
Floorplans (Published Rents as of 5/11/2021) (2)
Elevator:
0.0% Vacant (0 units vacant) as of 5/11/2021
FeaturesStandard: Dishwasher; Disposal; In Unit Laundry (Hook-ups); Central A/C;
Patio/Balcony
Select Units: --
Optional($): --
Incentives:
None
Security: --
Unit Mix & Effective Rent (1)
Adjustments to Rent
Parking 1: Free Surface Parking
Comments
Parking 2: --
Fee: -- Fee: --
Date %Vac 1BR $ 2BR $ 3BR $
0.0%5/11/21 $950 $1,038 $1,350
3.0%5/9/19 -- $961 $1,011
5.2%3/29/18 -- $880 $955
6.9%4/5/17 -- $855 $940
Description BRs Bath Rent SqFt ProgramRent/SF#UnitsFeature
1 1Garden $925 793 Market$1.17----
2 1Garden $970 1,005 Market$.97----
2 2Garden $1,045 1,095 Market$.95----
3 2Garden $1,315 1,268 Market$1.04----
© 2021 Real Property Research Group, Inc.
GA067-024839300 Riverside
(1) Effective Rent is Published Rent, net of concessions and assumes that water, sewer and trash is included in rent (2) Published Rent is rent as quoted by management.

RealProperty Group Research
Ansley at Princeton Lakes Multifamily Community Profile
3871 Redwine Rd.
Atlanta,GA 30344
Property Manager: Provence Real Estate
Opened in 2009
CommunityType: Market Rate - General
306 Units
Structure Type: 3-Story Garden
Owner: --
Historic Vacancy & Eff. Rent (1)
Bedroom Avg $/SqFtAvg SqFt%Total Avg Rent
Eff
One
Two
Three
Four+
One/Den
Two/Den
--
$1,310
--
$1,490
--
$1,745
--
--
730
--
1,170
--
1,309
--
--
$1.79
--
$1.27
--
$1.33
--
--
43.8%
--
48.4%
--
7.8%
--
Utilities in Rent:
Heat:
Heat Fuel: Electric
Hot Water:
Cooking:
Electricity:
Wtr/Swr:
Trash:
Community Amenities
Clubhouse:
Comm Rm:
Centrl Lndry:
Fitness:
Hot Tub:
Sauna:
Pool-Outdr:
Playground:
Basketball:
Tennis:
Volleyball:
CarWash:
BusinessCtr:
ComputerCtr:
Floorplans (Published Rents as of 5/6/2021) (2)
Elevator:
2.6% Vacant (8 units vacant) as of 5/6/2021
FeaturesStandard: Dishwasher; Disposal; Microwave; Ice Maker; Ceiling Fan; In Unit
Laundry (Full Size); Central A/C; Patio/Balcony; HighCeilings; Storage
(In Unit)
Select Units: --
Optional($): --
Incentives:
None.
Security: Unit Alarms; Gated Entry
Unit Mix & Effective Rent (1)
Adjustments to Rent
Parking 1: Free Surface Parking
Comments
Community also has a theater, pet grooming station, cyber café & grilling area.
Black apps, WI closets, built in computer stations.
Began leasing in June 2009 & leased up to 95% in October 2010.
Parking 2: Detached Garage
Fee: -- Fee: $125
Date %Vac 1BR $ 2BR $ 3BR $
2.6%5/6/21 $1,310 $1,490 $1,745
4.9%5/8/19 $1,225 $1,320 $1,445
4.9%3/29/18 $1,011 $1,392 $1,526
8.2%1/24/18 $1,074 $1,294 $1,613
Description BRs Bath Rent SqFt ProgramRent/SF#UnitsFeature
1 1A1 Piedmont / Garden $1,285 643 Market$2.0048--
1 1A2 Highland / Garden $1,285 751 Market$1.7152--
1 1A3 Windsor / Garden $1,285 805 Market$1.6030--
1 1G1 Habersham / Garden $1,285 943 Market$1.364--
2 2B1/B2 Juniper / Garden $1,460 1,170 Market$1.25148--
3 2C1 Ashford / Garden $1,710 1,309 Market$1.3124--
© 2021 Real Property Research Group, Inc.
GA121-014750Ansley at Princeton Lakes
(1) Effective Rent is Published Rent, net of concessions and assumes that water, sewer and trash is included in rent (2) Published Rent is rent as quoted by management.

RealProperty Group Research
Ashford at Spring Lake Multifamily Community Profile
6200 Bakers Ferry Road
Atlanta,GA 30331
Property Manager: R James
Opened in 2003
CommunityType: Market Rate - General
180 Units
Structure Type: 3-Story Garden
Owner: Lane Company
Historic Vacancy & Eff. Rent (1)
Bedroom Avg $/SqFtAvg SqFt%Total Avg Rent
Eff
One
Two
Three
Four+
One/Den
Two/Den
--
$1,345
--
$1,500
--
$1,515
--
--
846
--
1,186
--
1,365
--
--
$1.59
--
$1.26
--
$1.11
--
--
20.0%
--
55.6%
--
24.4%
--
Utilities in Rent:
Heat:
Heat Fuel: Electric
Hot Water:
Cooking:
Electricity:
Wtr/Swr:
Trash:
Community Amenities
Clubhouse:
Comm Rm:
Centrl Lndry:
Fitness:
Hot Tub:
Sauna:
Pool-Outdr:
Playground:
Basketball:
Tennis:
Volleyball:
CarWash:
BusinessCtr:
ComputerCtr:
Floorplans (Published Rents as of 5/6/2021) (2)
Elevator:
6.7% Vacant (12 units vacant) as of 5/6/2021
FeaturesStandard: Dishwasher; Disposal; Ice Maker; Ceiling Fan; In Unit Laundry (Hook-
ups); Central A/C; Patio/Balcony; Storage (In Unit); Carpet / Ceramic
Select Units: HighCeilings
Optional($): --
Incentives:
None.
Security: Gated Entry
Unit Mix & Effective Rent (1)
Adjustments to Rent
Parking 1: Free Surface Parking
Comments
Parking 2: --
Fee: -- Fee: --
Date %Vac 1BR $ 2BR $ 3BR $
6.7%5/6/21 $1,345 $1,500 $1,515
2.8%5/8/19 $990 $1,120 $1,325
7.8%4/2/18 $990 $1,120 $1,325
0.0%4/4/17 $865 $970 $1,125
Description BRs Bath Rent SqFt ProgramRent/SF#UnitsFeature
1 1Garden $1,330 846 Market$1.5736--
2 2Garden $1,480 1,186 Market$1.25100--
3 2Garden $1,490 1,365 Market$1.0944--
© 2021 Real Property Research Group, Inc.
GA121-006071Ashford at Spring Lake
(1) Effective Rent is Published Rent, net of concessions and assumes that water, sewer and trash is included in rent (2) Published Rent is rent as quoted by management.

RealProperty Group Research
Ashley Courts at Cascade I Multifamily Community Profile
1371 Kimberly Way
Atlanta,GA 30331
Property Manager: --
Opened in 2001Last Major Rehab in 2009
CommunityType: LIHTC - General
152 Units
Structure Type: Garden/TH
Owner: --
Historic Vacancy & Eff. Rent (1)
Bedroom Avg $/SqFtAvg SqFt%Total Avg Rent
Eff
One
Two
Three
Four+
One/Den
Two/Den
--
$917
--
$1,021
--
$1,128
$1,344
--
740
--
924
--
1,250
1,400
--
$1.24
--
$1.10
--
$0.90
$0.96
--
13.2%
--
39.5%
--
36.8%
10.5%
Utilities in Rent:
Heat:
Heat Fuel: Electric
Hot Water:
Cooking:
Electricity:
Wtr/Swr:
Trash:
Community Amenities
Clubhouse:
Comm Rm:
Centrl Lndry:
Fitness:
Hot Tub:
Sauna:
Pool-Outdr:
Playground:
Basketball:
Tennis:
Volleyball:
CarWash:
BusinessCtr:
ComputerCtr:
Floorplans (Published Rents as of 5/10/2021) (2)
Elevator:
1.3% Vacant (2 units vacant) as of 5/10/2021
FeaturesStandard: Dishwasher; Disposal; In Unit Laundry (Stacked); Central A/C;
Patio/Balcony; Carpet
Select Units: Ceiling Fan
Optional($): --
Incentives:
None.
Security: Unit Alarms; Gated Entry
Unit Mix & Effective Rent (1)
Adjustments to Rent
Parking 1: Free Surface Parking
Comments
46 units have Project Based Rental Assistance (PBRA).
6 units vacant total PHI, II and III. Mngmnt did not have breakdown per phase.
Pricing uniform across all phases. Unavailable for some floorplans.
Parking 2: --
Fee: -- Fee: --
Date %Vac 1BR $ 2BR $ 3BR $
1.3%5/10/21 $917 $1,021 $1,128
0.0%9/21/20 $917 $1,035 $1,164
0.7%6/1/20 $1,031 $1,047 $1,169
3.9%5/8/19 $811 $912 $1,059
Description BRs Bath Rent SqFt ProgramRent/SF#UnitsFeature
1 1Garden $848 738 LIHTC/ 60%$1.1516--
1 1Garden $1,195 750 Market$1.594--
2 1Garden $864 890 LIHTC/ 50%$.975--
2 1Garden $1,107 890 Market$1.245--
2 1Garden $1,015 890 LIHTC/ 60%$1.1416--
2 2Garden $1,107 950 Market$1.177--
2 2Garden $1,015 950 LIHTC/ 60%$1.0727--
3 2Garden $1,224 1,250 LIHTC/ 60%$.9825--
3 2Garden $1,154 1,250 Market$.9211--
3 2Garden $994 1,250 LIHTC/ 50%$.8020--
4 2Garden $1,298 1,400 Market$.934--
4 2Garden $1,359 1,400 LIHTC/ 60%$.9712--
© 2021 Real Property Research Group, Inc.
GA121-005938Ashley Courts at Cascade I
(1) Effective Rent is Published Rent, net of concessions and assumes that water, sewer and trash is included in rent (2) Published Rent is rent as quoted by management.

RealProperty Group Research
Ashley Courts at Cascade II Multifamily Community Profile
1371 Kimberly Way
Atlanta,GA 30331
Property Manager: --
Opened in 2002
CommunityType: LIHTC - General
149 Units
Structure Type: Garden/TH
Owner: --
Historic Vacancy & Eff. Rent (1)
Bedroom Avg $/SqFtAvg SqFt%Total Avg Rent
Eff
One
Two
Three
Four+
One/Den
Two/Den
--
$966
--
$1,017
--
$1,226
$1,379
--
740
--
964
--
1,325
1,275
--
$1.31
--
$1.05
--
$0.93
$1.08
--
9.4%
--
73.2%
--
42.3%
18.8%
Utilities in Rent:
Heat:
Heat Fuel: Natural Gas
Hot Water:
Cooking:
Electricity:
Wtr/Swr:
Trash:
Community Amenities
Clubhouse:
Comm Rm:
Centrl Lndry:
Fitness:
Hot Tub:
Sauna:
Pool-Outdr:
Playground:
Basketball:
Tennis:
Volleyball:
CarWash:
BusinessCtr:
ComputerCtr:
Floorplans (Published Rents as of 5/10/2021) (2)
Elevator:
1.3% Vacant (2 units vacant) as of 5/10/2021
FeaturesStandard: Dishwasher; Disposal; Microwave; In Unit Laundry (Stacked); Central
A/C; Patio/Balcony; Carpet
Select Units: --
Optional($): --
Incentives:
None.
Security: Unit Alarms; Gated Entry
Unit Mix & Effective Rent (1)
Adjustments to Rent
Parking 1: Free Surface Parking
Comments
6 vacant units total in PHI, II and III. Mngmnt didn't have breakdown. Pricing uniform in all and unavail for some FP.
Parking 2: --
Fee: -- Fee: --
Date %Vac 1BR $ 2BR $ 3BR $
1.3%5/10/21 $966 $1,017 $1,226
4.0%9/21/20 $968 $1,105 $1,266
0.7%6/1/20 $1,093 $1,050 $1,235
4.0%5/8/19 $838 $913 $1,066
Description BRs Bath Rent SqFt ProgramRent/SF#UnitsFeature
1 1Garden $1,195 740 Market$1.614--
1 1Garden $875 740 LIHTC/ 60%$1.1810--
2 1Garden $1,040 890 LIHTC/ 60%$1.1712--
2 1Garden $1,341 890 Market$1.512--
2 2Garden $1,341 975 Market$1.3813--
2 2Garden $1,040 975 LIHTC/ 60%$1.0742--
2 2Garden $864 975 LIHTC/ 50%$.8940--
3 2Garden $1,224 1,325 LIHTC/ 60%$.9232--
3 2Garden $994 1,325 LIHTC/ 50%$.7513--
3 2Garden $1,397 1,325 Market$1.0518--
4 2Garden $1,500 1,275 Market$1.184--
4 2Garden $1,359 1,275 LIHTC/ 60%$1.0712--
4 2Garden $1,359 1,275 LIHTC/ 60%$1.0712--
© 2021 Real Property Research Group, Inc.
GA121-005939Ashley Courts at Cascade II
(1) Effective Rent is Published Rent, net of concessions and assumes that water, sewer and trash is included in rent (2) Published Rent is rent as quoted by management.

RealProperty Group Research
Ashley Courts at Cascade III Multifamily Community Profile
1371 Kimberly Way
Atlanta,GA 30331
Property Manager: --
Opened in 2001
CommunityType: LIHTC - General
96 Units
Structure Type: Garden
Owner: --
Historic Vacancy & Eff. Rent (1)
Bedroom Avg $/SqFtAvg SqFt%Total Avg Rent
Eff
One
Two
Three
Four+
One/Den
Two/Den
--
$1,015
--
$1,130
--
$1,226
$1,426
--
740
--
922
--
1,275
279
--
$1.37
--
$1.23
--
$0.96
$5.12
--
16.7%
--
28.1%
--
17.7%
37.5%
Utilities in Rent:
Heat:
Heat Fuel: Natural Gas
Hot Water:
Cooking:
Electricity:
Wtr/Swr:
Trash:
Community Amenities
Clubhouse:
Comm Rm:
Centrl Lndry:
Fitness:
Hot Tub:
Sauna:
Pool-Outdr:
Playground:
Basketball:
Tennis:
Volleyball:
CarWash:
BusinessCtr:
ComputerCtr:
Floorplans (Published Rents as of 5/10/2021) (2)
Elevator:
2.1% Vacant (2 units vacant) as of 5/10/2021
FeaturesStandard: Dishwasher; Disposal; In Unit Laundry (Stacked); Central A/C;
Patio/Balcony
Select Units: --
Optional($): --
Incentives:
None.
Security: Unit Alarms; Gated Entry
Unit Mix & Effective Rent (1)
Adjustments to Rent
Parking 1: Free Surface Parking
Comments
29 units have PBRA
6 vacant units total in PHI, II and III. Mngmnt didn't have breakdown. Pricing uniform in all and unavail for some FP.
Parking 2: --
Fee: -- Fee: --
Date %Vac 1BR $ 2BR $ 3BR $
2.1%5/10/21 $1,015 $1,130 $1,226
0.0%9/21/20 -- -- --
1.0%6/1/20 $1,049 $1,067 $1,275
4.2%5/9/19 $884 $980 $1,097
Description BRs Bath Rent SqFt ProgramRent/SF#UnitsFeature
1 1Garden $875 740 LIHTC/ 60%$1.189--
1 1Garden $1,195 740 Market$1.617--
2 1Garden $1,341 884 Market$1.524--
2 1Garden $1,040 884 LIHTC/ 60%$1.186--
2 1Garden $864 884 LIHTC/ 50%$.985--
2 2Garden $1,341 970 Market$1.387--
2 2Garden $1,040 970 LIHTC/ 60%$1.075--
3 2Garden $994 1,275 LIHTC/ 50%$.785--
3 2Garden $1,394 1,275 Market$1.097--
3 2Garden $1,224 1,275 LIHTC/ 60%$.965--
4 2Townhouse $1,359 -- LIHTC/ 60%--15--
4 2Townhouse $1,500 -- Market--14--
4 2Garden $1,359 1,433 LIHTC/ 60%$.954--
4 2Garden $1,500 1,433 Market$1.053--
© 2021 Real Property Research Group, Inc.
GA121-006072Ashley Courts at Cascade III
(1) Effective Rent is Published Rent, net of concessions and assumes that water, sewer and trash is included in rent (2) Published Rent is rent as quoted by management.
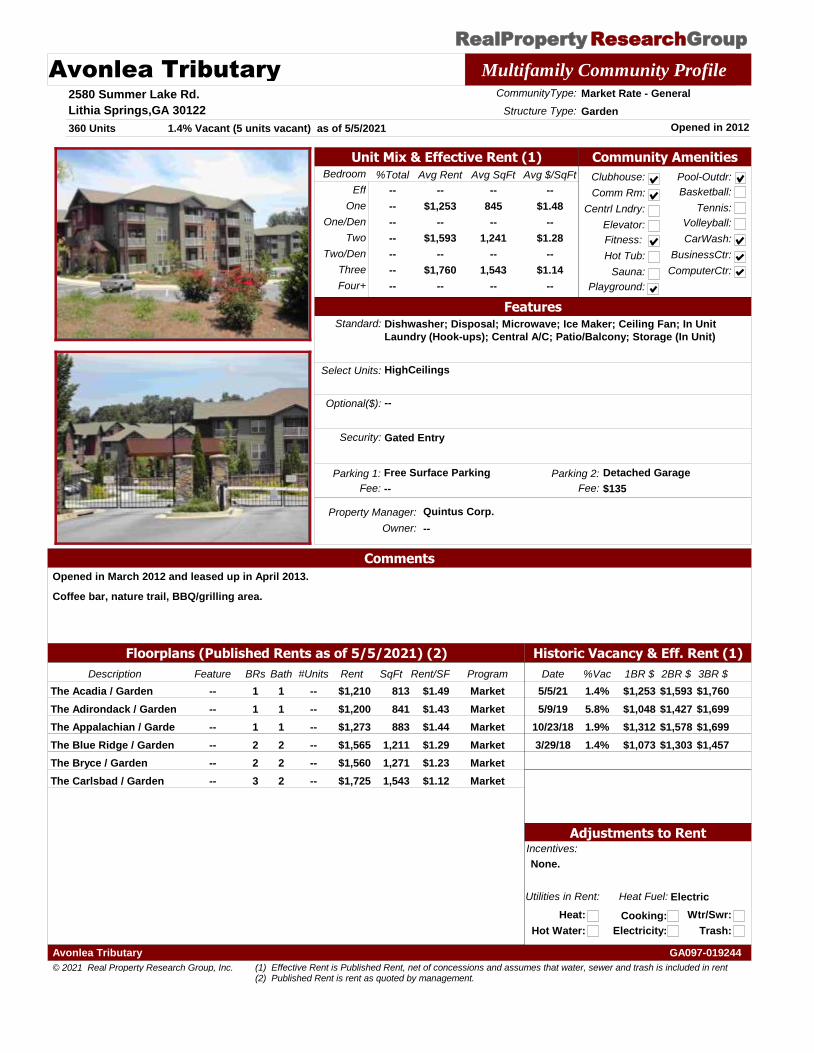
RealProperty Group Research
Avonlea Tributary Multifamily Community Profile
2580 Summer Lake Rd.
Lithia Springs,GA 30122
Property Manager: Quintus Corp.
Opened in 2012
CommunityType: Market Rate - General
360 Units
Structure Type: Garden
Owner: --
Historic Vacancy & Eff. Rent (1)
Bedroom Avg $/SqFtAvg SqFt%Total Avg Rent
Eff
One
Two
Three
Four+
One/Den
Two/Den
--
$1,253
--
$1,593
--
$1,760
--
--
845
--
1,241
--
1,543
--
--
$1.48
--
$1.28
--
$1.14
--
--
--
--
--
--
--
--
Utilities in Rent:
Heat:
Heat Fuel: Electric
Hot Water:
Cooking:
Electricity:
Wtr/Swr:
Trash:
Community Amenities
Clubhouse:
Comm Rm:
Centrl Lndry:
Fitness:
Hot Tub:
Sauna:
Pool-Outdr:
Playground:
Basketball:
Tennis:
Volleyball:
CarWash:
BusinessCtr:
ComputerCtr:
Floorplans (Published Rents as of 5/5/2021) (2)
Elevator:
1.4% Vacant (5 units vacant) as of 5/5/2021
FeaturesStandard: Dishwasher; Disposal; Microwave; Ice Maker; Ceiling Fan; In Unit
Laundry (Hook-ups); Central A/C; Patio/Balcony; Storage (In Unit)
Select Units: HighCeilings
Optional($): --
Incentives:
None.
Security: Gated Entry
Unit Mix & Effective Rent (1)
Adjustments to Rent
Parking 1: Free Surface Parking
Comments
Opened in March 2012 and leased up in April 2013.
Coffee bar, nature trail, BBQ/grilling area.
Parking 2: Detached Garage
Fee: -- Fee: $135
Date %Vac 1BR $ 2BR $ 3BR $
1.4%5/5/21 $1,253 $1,593 $1,760
5.8%5/9/19 $1,048 $1,427 $1,699
1.9%10/23/18 $1,312 $1,578 $1,699
1.4%3/29/18 $1,073 $1,303 $1,457
Description BRs Bath Rent SqFt ProgramRent/SF#UnitsFeature
1 1The Acadia / Garden $1,210 813 Market$1.49----
1 1The Adirondack / Garden $1,200 841 Market$1.43----
1 1The Appalachian / Garde $1,273 883 Market$1.44----
2 2The Blue Ridge / Garden $1,565 1,211 Market$1.29----
2 2The Bryce / Garden $1,560 1,271 Market$1.23----
3 2The Carlsbad / Garden $1,725 1,543 Market$1.12----
© 2021 Real Property Research Group, Inc.
GA097-019244Avonlea Tributary
(1) Effective Rent is Published Rent, net of concessions and assumes that water, sewer and trash is included in rent (2) Published Rent is rent as quoted by management.

RealProperty Group Research
Cascade Glen Multifamily Community Profile
3901 Campbellton Rd. SW
Atlanta,GA 30331
Property Manager: JAMCO Properties
Opened in 1980Last Major Rehab in 2015
CommunityType: Market Rate - General
364 Units
Structure Type: Garden
Owner: --
Historic Vacancy & Eff. Rent (1)
Bedroom Avg $/SqFtAvg SqFt%Total Avg Rent
Eff
One
Two
Three
Four+
One/Den
Two/Den
--
$960
--
$1,150
--
$1,320
--
--
840
--
1,099
--
1,316
--
--
$1.14
--
$1.05
--
$1.00
--
--
--
--
--
--
--
--
Utilities in Rent:
Heat:
Heat Fuel: Natural Gas
Hot Water:
Cooking:
Electricity:
Wtr/Swr:
Trash:
Community Amenities
Clubhouse:
Comm Rm:
Centrl Lndry:
Fitness:
Hot Tub:
Sauna:
Pool-Outdr:
Playground:
Basketball:
Tennis:
Volleyball:
CarWash:
BusinessCtr:
ComputerCtr:
Floorplans (Published Rents as of 5/10/2021) (2)
Elevator:
1.9% Vacant (7 units vacant) as of 5/10/2021
FeaturesStandard: Dishwasher; Disposal; In Unit Laundry (Hook-ups); Central A/C
Select Units: --
Optional($): --
Incentives:
None.
Security: --
Unit Mix & Effective Rent (1)
Adjustments to Rent
Parking 1: Free Surface Parking
Comments
In process of renovating as units become vacant. Mngmnt thinks about 10 units have been completed.
Parking 2: --
Fee: -- Fee: --
Date %Vac 1BR $ 2BR $ 3BR $
1.9%5/10/21 $960 $1,150 $1,320
4.9%5/9/19 $675 $805 $875
0.0%3/29/18 $753 $794 $894
2.2%4/5/17 $629 $763 $845
Description BRs Bath Rent SqFt ProgramRent/SF#UnitsFeature
1 1Garden $960 840 Market$1.14----
2 1.5Garden $1,100 1,093 Market$1.01----
2 2Garden $1,200 1,104 Market$1.09----
3 2Garden $1,320 1,316 Market$1.00----
© 2021 Real Property Research Group, Inc.
GA121-010630Cascade Glen
(1) Effective Rent is Published Rent, net of concessions and assumes that water, sewer and trash is included in rent (2) Published Rent is rent as quoted by management.

RealProperty Group Research
Century Sweetwater Creek Multifamily Community Profile
1100 Preston Landing Cir.
Lithia Springs,GA 30122
Property Manager: First Communities
Opened in 2002
CommunityType: Market Rate - General
240 Units
Structure Type: Garden
Owner: --
Historic Vacancy & Eff. Rent (1)
Bedroom Avg $/SqFtAvg SqFt%Total Avg Rent
Eff
One
Two
Three
Four+
One/Den
Two/Den
--
$1,298
$1,298
$1,884
--
$1,903
--
--
803
967
1,120
--
1,362
--
--
$1.62
$1.34
$1.68
--
$1.40
--
--
--
--
--
--
--
--
Utilities in Rent:
Heat:
Heat Fuel: Electric
Hot Water:
Cooking:
Electricity:
Wtr/Swr:
Trash:
Community Amenities
Clubhouse:
Comm Rm:
Centrl Lndry:
Fitness:
Hot Tub:
Sauna:
Pool-Outdr:
Playground:
Basketball:
Tennis:
Volleyball:
CarWash:
BusinessCtr:
ComputerCtr:
Floorplans (Published Rents as of 5/5/2021) (2)
Elevator:
2.1% Vacant (5 units vacant) as of 5/5/2021
FeaturesStandard: Dishwasher; Disposal; Microwave; Ice Maker; Ceiling Fan; In Unit
Laundry (Hook-ups); Central A/C; Patio/Balcony; HighCeilings; Carpet /
Hardwood
Select Units: Fireplace
Optional($): --
Incentives:
None
Security: Unit Alarms; Gated Entry; Keyed Bldg Entry
Unit Mix & Effective Rent (1)
Adjustments to Rent
Parking 1: Free Surface Parking
Comments
FKA Preston Landing at Sweetwater Creek.
Parking 2: Detached Garage
Fee: -- Fee: $100
Date %Vac 1BR $ 2BR $ 3BR $
2.1%5/5/21 $1,298 $1,884 $1,903
0.0%5/9/19 $1,125 $1,278 $1,550
2.9%3/29/18 $1,170 $1,300 $1,445
5.4%4/4/17 $943 $1,203 $1,475
Description BRs Bath Rent SqFt ProgramRent/SF#UnitsFeature
1 1Garden $1,273 803 Market$1.58----
1 1.5Garden $1,273 967 Market$1.32--Den
2 2Garden $1,854 1,120 Market$1.66----
3 2Garden $1,868 1,362 Market$1.37----
© 2021 Real Property Research Group, Inc.
GA097-022599Century Sweetwater Creek
(1) Effective Rent is Published Rent, net of concessions and assumes that water, sewer and trash is included in rent (2) Published Rent is rent as quoted by management.

RealProperty Group Research
Columns at Sweetwater Creek Multifamily Community Profile
100 Columns Drive
Lithia Springs,GA 30122
Property Manager: --
Opened in 2001
CommunityType: Market Rate - General
270 Units
Structure Type: 3-Story Garden
Owner: --
Historic Vacancy & Eff. Rent (1)
Bedroom Avg $/SqFtAvg SqFt%Total Avg Rent
Eff
One
Two
Three
Four+
One/Den
Two/Den
--
$1,281
--
$1,370
--
$1,650
--
--
849
--
1,154
--
1,406
--
--
$1.51
--
$1.19
--
$1.17
--
--
--
--
--
--
--
--
Utilities in Rent:
Heat:
Heat Fuel: Electric
Hot Water:
Cooking:
Electricity:
Wtr/Swr:
Trash:
Community Amenities
Clubhouse:
Comm Rm:
Centrl Lndry:
Fitness:
Hot Tub:
Sauna:
Pool-Outdr:
Playground:
Basketball:
Tennis:
Volleyball:
CarWash:
BusinessCtr:
ComputerCtr:
Floorplans (Published Rents as of 5/7/2021) (2)
Elevator:
0.0% Vacant (0 units vacant) as of 5/7/2021
FeaturesStandard: Dishwasher; Disposal; Microwave; Ice Maker; In Unit Laundry (Hook-
ups); Central A/C; Patio/Balcony; Storage (In Unit)
Select Units: Fireplace
Optional($): --
Incentives:
None.
Security: Fence
Unit Mix & Effective Rent (1)
Adjustments to Rent
Parking 1: Free Surface Parking
Comments
No unit breakdown
Parking 2: Detached Garage
Fee: -- Fee: $85
Date %Vac 1BR $ 2BR $ 3BR $
0.0%5/7/21 $1,281 $1,370 $1,650
2.2%5/9/19 $1,010 $1,158 $1,185
5.2%11/21/18 $960 $1,118 $1,275
3.0%4/2/18 $950 $1,073 $1,375
Description BRs Bath Rent SqFt ProgramRent/SF#UnitsFeature
1 1Garden $1,256 849 Market$1.48----
2 1Garden $1,275 1,131 Market$1.13----
2 2Garden $1,405 1,178 Market$1.19----
3 2Garden $1,615 1,406 Market$1.15----
© 2021 Real Property Research Group, Inc.
GA097-021567Columns at Sweetwater Creek
(1) Effective Rent is Published Rent, net of concessions and assumes that water, sewer and trash is included in rent (2) Published Rent is rent as quoted by management.

RealProperty Group Research
Creekside at Adamsville Place Multifamily Community Profile
3718 Martin Luther King Jr. Dr. SW
Atlanta,GA 30331
Property Manager: --
Opened in 2020
CommunityType: LIHTC - General
147 Units
Structure Type: 4-Story Mid Rise
Owner: --
Historic Vacancy & Eff. Rent (1)
Bedroom Avg $/SqFtAvg SqFt%Total Avg Rent
Eff
One
Two
Three
Four+
One/Den
Two/Den
--
$631
--
$711
--
$808
--
--
698
--
973
--
1,169
--
--
$0.90
--
$0.73
--
$0.69
--
--
--
--
--
--
--
--
Utilities in Rent:
Heat:
Heat Fuel: Electric
Hot Water:
Cooking:
Electricity:
Wtr/Swr:
Trash:
Community Amenities
Clubhouse:
Comm Rm:
Centrl Lndry:
Fitness:
Hot Tub:
Sauna:
Pool-Outdr:
Playground:
Basketball:
Tennis:
Volleyball:
CarWash:
BusinessCtr:
ComputerCtr:
Floorplans (Published Rents as of 5/10/2021) (2)
Elevator:
0.0% Vacant (0 units vacant) as of 5/10/2021
FeaturesStandard: Dishwasher; Disposal; Microwave; Ceiling Fan; In Unit Laundry (Hook-
ups); Central A/C; Patio/Balcony; HighCeilings; Vinyl/Linoleum / Carpet
Select Units: --
Optional($): --
Incentives:
None.
Security: Keyed Bldg Entry
Unit Mix & Effective Rent (1)
Adjustments to Rent
Parking 1: Free Surface Parking
Comments
Opened in Sept/Oct. PL began in Jun '20. All units completed and leased, but mng did not know when.
Black apps, faux HW, upgraded fixtures.
Parking 2: --
Fee: -- Fee: --
Date %Vac 1BR $ 2BR $ 3BR $
0.0%5/10/21 $631 $711 $808
Description BRs Bath Rent SqFt ProgramRent/SF#UnitsFeature
1 1Mid Rise - Elevator $254 698 LIHTC/ 30%$.36----
1 1Mid Rise - Elevator $685 698 LIHTC/ 60%$.98----
1 1Mid Rise - Elevator $880 698 LIHTC/ 80%$1.26----
2 2Mid Rise - Elevator $279 973 LIHTC/ 30%$.29----
2 2Mid Rise - Elevator $785 973 LIHTC/ 60%$.81----
2 2Mid Rise - Elevator $980 973 LIHTC/ 80%$1.01----
3 2Mid Rise - Elevator $283 1,169 LIHTC/ 30%$.24----
3 2Mid Rise - Elevator $867 1,169 LIHTC/ 60%$.74----
3 2Mid Rise - Elevator $1,170 1,169 LIHTC/ 80%$1.00----
© 2021 Real Property Research Group, Inc.
GA121-037086Creekside at Adamsville Place
(1) Effective Rent is Published Rent, net of concessions and assumes that water, sewer and trash is included in rent (2) Published Rent is rent as quoted by management.

RealProperty Group Research
Crestmark Multifamily Community Profile
945 Crestmark Blvd.
Lithia Springs,GA 30122
Property Manager: --
Opened in 1993Last Major Rehab in 2015
CommunityType: Market Rate - General
334 Units
Structure Type: Garden
Owner: --
Historic Vacancy & Eff. Rent (1)
Bedroom Avg $/SqFtAvg SqFt%Total Avg Rent
Eff
One
Two
Three
Four+
One/Den
Two/Den
--
$1,301
--
$1,645
--
$1,945
--
--
803
--
1,145
--
1,368
--
--
$1.62
--
$1.44
--
$1.42
--
--
29.3%
--
48.5%
--
22.2%
--
Utilities in Rent:
Heat:
Heat Fuel: Electric
Hot Water:
Cooking:
Electricity:
Wtr/Swr:
Trash:
Community Amenities
Clubhouse:
Comm Rm:
Centrl Lndry:
Fitness:
Hot Tub:
Sauna:
Pool-Outdr:
Playground:
Basketball:
Tennis:
Volleyball:
CarWash:
BusinessCtr:
ComputerCtr:
Floorplans (Published Rents as of 5/7/2021) (2)
Elevator:
0.0% Vacant (0 units vacant) as of 5/7/2021
FeaturesStandard: Dishwasher; Disposal; In Unit Laundry (Full Size); Central A/C; Cable TV
Select Units: Fireplace
Optional($): --
Incentives:
None. Daily pricing.
Security: Fence; Gated Entry
Unit Mix & Effective Rent (1)
Adjustments to Rent
Parking 1: Free Surface Parking
Comments
Jogging trails.
Mandatory $105 fee for W/D, pest and cable.
Parking 2: Detached Garage
Fee: -- Fee: $150
Date %Vac 1BR $ 2BR $ 3BR $
0.0%5/7/21 $1,301 $1,645 $1,945
1.5%4/30/21 $1,411 $1,514 $1,690
1.8%5/9/19 $1,306 $1,282 $1,370
0.9%10/23/18 $981 $1,175 $1,394
Description BRs Bath Rent SqFt ProgramRent/SF#UnitsFeature
1 1Garden $1,286 803 Market$1.6098--
2 2Garden $1,625 1,145 Market$1.42162--
3 2Garden $1,920 1,368 Market$1.4074--
© 2021 Real Property Research Group, Inc.
GA097-022594Crestmark
(1) Effective Rent is Published Rent, net of concessions and assumes that water, sewer and trash is included in rent (2) Published Rent is rent as quoted by management.

RealProperty Group Research
Greens at Cascade Multifamily Community Profile
4355 Cascade Road
Atlanta,GA 30331
Property Manager: S & S Property Mana
Opened in 1989
CommunityType: Market Rate - General
160 Units
Structure Type: Garden
Owner: --
Historic Vacancy & Eff. Rent (1)
Bedroom Avg $/SqFtAvg SqFt%Total Avg Rent
Eff
One
Two
Three
Four+
One/Den
Two/Den
--
$1,170
--
$1,255
--
$1,390
--
--
908
--
1,152
--
1,390
--
--
$1.29
--
$1.09
--
$1.00
--
--
15.0%
--
60.0%
--
25.0%
--
Utilities in Rent:
Heat:
Heat Fuel: Electric
Hot Water:
Cooking:
Electricity:
Wtr/Swr:
Trash:
Community Amenities
Clubhouse:
Comm Rm:
Centrl Lndry:
Fitness:
Hot Tub:
Sauna:
Pool-Outdr:
Playground:
Basketball:
Tennis:
Volleyball:
CarWash:
BusinessCtr:
ComputerCtr:
Floorplans (Published Rents as of 5/5/2021) (2)
Elevator:
1.9% Vacant (3 units vacant) as of 5/5/2021
FeaturesStandard: Dishwasher; Disposal; In Unit Laundry (Hook-ups); Central A/C;
Patio/Balcony; Carpet
Select Units: Fireplace
Optional($): --
Incentives:
None.
Security: --
Unit Mix & Effective Rent (1)
Adjustments to Rent
Parking 1: Free Surface Parking
Comments
Undergoing renovations as units become vacant. Appx 50% units completed. Rents are the same.
Black apps. Faux HW floors.
Parking 2: --
Fee: -- Fee: --
Date %Vac 1BR $ 2BR $ 3BR $
1.9%5/5/21 $1,170 $1,255 $1,390
11.3%11/26/19 $825 $925 $917
5.6%6/4/19 $867 $990 $1,183
5.6%5/9/19 $945 $1,080 $1,265
Description BRs Bath Rent SqFt ProgramRent/SF#UnitsFeature
1 1Garden $1,170 908 Market$1.2924--
2 2Garden $1,255 1,152 Market$1.092--
2 2Garden $1,255 1,152 Market$1.0994--
3 2Garden $1,390 1,390 Market$1.003--
3 2Garden $1,390 1,390 Market$1.0037--
© 2021 Real Property Research Group, Inc.
GA121-005942Greens at Cascade
(1) Effective Rent is Published Rent, net of concessions and assumes that water, sewer and trash is included in rent (2) Published Rent is rent as quoted by management.

RealProperty Group Research
Lake Crossing Multifamily Community Profile
1325 Six Flags Dr
Austell,GA 30168
Property Manager: --
Opened in 1987
CommunityType: Market Rate - General
300 Units
Structure Type: Garden
Owner: --
Historic Vacancy & Eff. Rent (1)
Bedroom Avg $/SqFtAvg SqFt%Total Avg Rent
Eff
One
Two
Three
Four+
One/Den
Two/Den
--
$972
--
$1,092
--
$1,187
--
--
736
--
1,061
--
1,248
--
--
$1.32
--
$1.03
--
$0.95
--
--
33.3%
--
40.0%
--
26.7%
--
Utilities in Rent:
Heat:
Heat Fuel: Electric
Hot Water:
Cooking:
Electricity:
Wtr/Swr:
Trash:
Community Amenities
Clubhouse:
Comm Rm:
Centrl Lndry:
Fitness:
Hot Tub:
Sauna:
Pool-Outdr:
Playground:
Basketball:
Tennis:
Volleyball:
CarWash:
BusinessCtr:
ComputerCtr:
Floorplans (Published Rents as of 5/11/2021) (2)
Elevator:
3.7% Vacant (11 units vacant) as of 5/11/2021
FeaturesStandard: Dishwasher; Disposal; In Unit Laundry (Hook-ups); Central A/C;
Patio/Balcony
Select Units: Microwave; Ceiling Fan
Optional($): --
Incentives:
None.
Security: Gated Entry
Unit Mix & Effective Rent (1)
Adjustments to Rent
Parking 1: Free Surface Parking
Comments
Black or white apps. Fishing pond.
Parking 2: --
Fee: -- Fee: --
Date %Vac 1BR $ 2BR $ 3BR $
3.7%5/11/21 $972 $1,092 $1,187
3.0%5/9/19 $872 $1,030 $1,127
18.0%3/29/18 $793 $891 $960
17.0%4/4/17 $690 $918 $998
Description BRs Bath Rent SqFt ProgramRent/SF#UnitsFeature
1 1Garden $972 736 Market$1.32100--
1 1Garden $982 784 Market$1.25----
2 2Garden $1,077 1,005 Market$1.07----
2 2Garden $1,092 1,061 Market$1.03120--
3 2Garden $1,187 1,248 Market$.9580--
3 2Garden $1,212 1,301 Market$.93----
© 2021 Real Property Research Group, Inc.
GA067-016974Lake Crossing
(1) Effective Rent is Published Rent, net of concessions and assumes that water, sewer and trash is included in rent (2) Published Rent is rent as quoted by management.

RealProperty Group Research
Landing Square Multifamily Community Profile
3378 Greenbriar Pkwy SW
Atlanta,GA 30331
Property Manager: Alliance
Opened in 2008
CommunityType: Market Rate - General
322 Units
Structure Type: 3-Story Garden
Owner: --
Historic Vacancy & Eff. Rent (1)
Bedroom Avg $/SqFtAvg SqFt%Total Avg Rent
Eff
One
Two
Three
Four+
One/Den
Two/Den
--
$1,175
--
$1,560
--
$1,726
--
--
739
--
1,196
--
1,538
--
--
$1.59
--
$1.30
--
$1.12
--
--
--
--
--
--
--
--
Utilities in Rent:
Heat:
Heat Fuel: Electric
Hot Water:
Cooking:
Electricity:
Wtr/Swr:
Trash:
Community Amenities
Clubhouse:
Comm Rm:
Centrl Lndry:
Fitness:
Hot Tub:
Sauna:
Pool-Outdr:
Playground:
Basketball:
Tennis:
Volleyball:
CarWash:
BusinessCtr:
ComputerCtr:
Floorplans (Published Rents as of 5/10/2021) (2)
Elevator:
3.7% Vacant (12 units vacant) as of 5/10/2021
FeaturesStandard: Dishwasher; Disposal; Microwave; Ceiling Fan; In Unit Laundry (Hook-
ups); Central A/C; Patio/Balcony; HighCeilings; Storage (In Unit)
Select Units: --
Optional($): --
Incentives:
None
Security: Gated Entry
Unit Mix & Effective Rent (1)
Adjustments to Rent
Parking 1: Free Surface Parking
Comments
FKA Alta Coventry Station.
Dog park. Black apps.
Parking 2: Detached Garage
Fee: -- Fee: $130
Date %Vac 1BR $ 2BR $ 3BR $
3.7%5/10/21 $1,175 $1,560 $1,726
3.1%5/8/19 $970 $1,324 $1,518
5.6%3/30/18 $917 $1,155 $1,340
14.9%4/5/17 $784 $1,109 $1,263
* Indicates initial lease-up.
Description BRs Bath Rent SqFt ProgramRent/SF#UnitsFeature
1 1E1 Patio / Garden $1,103 657 Market$1.68--Patio/Balcony
1 1E1 Sunroom / Garden $1,103 677 Market$1.63--Sunroom
1 1A1 / Garden $1,103 751 Market$1.47--Patio or Sunroom
1 1A2 / Garden $1,392 870 Market$1.60--Patio or Sunroom
2 2B1 / Garden $1,560 1,009 Market$1.55--Patio or Sunroom
2 2B2 / Garden $1,560 1,236 Market$1.26--Patio or Sunroom
2 2B3 Sunroom / Garden $1,560 1,264 Market$1.23--Sunroom
2 2B3 Patio / Garden $1,560 1,276 Market$1.22--Patio/Balcony
3 2C1 Patio / Garden $1,726 1,521 Market$1.13--Patio/Balcony
3 2C1 Sunroom / Garden $1,726 1,554 Market$1.11--Sunroom
© 2021 Real Property Research Group, Inc.
GA121-011193Landing Square
(1) Effective Rent is Published Rent, net of concessions and assumes that water, sewer and trash is included in rent (2) Published Rent is rent as quoted by management.

RealProperty Group Research
Manchester Place Multifamily Community Profile
1600 Blairs Bridge Rd.
Lithia Springs,GA 30122
Property Manager: --
Opened in 2001
CommunityType: Market Rate - General
308 Units
Structure Type: Garden/TH
Owner: --
Historic Vacancy & Eff. Rent (1)
Bedroom Avg $/SqFtAvg SqFt%Total Avg Rent
Eff
One
Two
Three
Four+
One/Den
Two/Den
--
$1,146
--
$1,377
--
$1,843
--
--
767
--
1,171
--
1,509
--
--
$1.49
--
$1.18
--
$1.22
--
--
46.8%
--
42.9%
--
10.4%
--
Utilities in Rent:
Heat:
Heat Fuel: Gas
Hot Water:
Cooking:
Electricity:
Wtr/Swr:
Trash:
Community Amenities
Clubhouse:
Comm Rm:
Centrl Lndry:
Fitness:
Hot Tub:
Sauna:
Pool-Outdr:
Playground:
Basketball:
Tennis:
Volleyball:
CarWash:
BusinessCtr:
ComputerCtr:
Floorplans (Published Rents as of 5/6/2021) (2)
Elevator:
2.6% Vacant (8 units vacant) as of 5/6/2021
FeaturesStandard: Dishwasher; Disposal; In Unit Laundry (Hook-ups); Central A/C;
Patio/Balcony
Select Units: Fireplace
Optional($): --
Incentives:
None.
Security: Gated Entry
Unit Mix & Effective Rent (1)
Adjustments to Rent
Parking 1: Free Surface Parking
Comments
Currently renovating as units become vacant. About 50% units are complete.
White app. FKA Tree Lodge.
Parking 2: --
Fee: -- Fee: --
Date %Vac 1BR $ 2BR $ 3BR $
2.6%5/6/21 $1,146 $1,377 $1,843
1.0%4/30/21 $1,177 $1,345 $1,655
2.9%5/9/19 $1,010 $1,220 $1,562
1.0%10/23/18 $968 $1,167 $1,478
Description BRs Bath Rent SqFt ProgramRent/SF#UnitsFeature
1 1Mundy Renovated / Gard $1,310 665 Market$1.97----
1 1Mundy Classic / Garden $990 665 Market$1.4960--
1 1Akers Classic / Garden $1,215 840 Market$1.4584--
1 1Akers Renovated / Garde $1,360 840 Market$1.62----
2 2.5Barnes Renovated / Gard $1,410 1,064 Market$1.33----
2 2.5Barnes Classic / Garden $1,255 1,064 Market$1.1866--
2 2Howell Renovated / Gard $1,555 1,258 Market$1.24----
2 2Howell Classic / Garden $1,430 1,258 Market$1.1460--
2 2.5Autry Renovated / Townh $1,710 1,474 Market$1.16--Garage
2 2.5Autry Classic / Townhous $1,525 1,474 Market$1.036Garage
3 2.5Terrell Classic / Garden $1,770 1,432 Market$1.2420--
3 2.5Terrell Renovated / Garde $1,710 1,432 Market$1.19----
3 2.5Arnold Classic / Townhou $1,870 1,638 Market$1.1412Garage
© 2021 Real Property Research Group, Inc.
GA097-022595Manchester Place
(1) Effective Rent is Published Rent, net of concessions and assumes that water, sewer and trash is included in rent (2) Published Rent is rent as quoted by management.

RealProperty Group Research
Panther Riverside Parc Multifamily Community Profile
1925 Waycrest Dr.
Atlanta,GA 30331
Property Manager: --
Opened in 2009
CommunityType: Market Rate - General
280 Units
Structure Type: Garden
Owner: --
Historic Vacancy & Eff. Rent (1)
Bedroom Avg $/SqFtAvg SqFt%Total Avg Rent
Eff
One
Two
Three
Four+
One/Den
Two/Den
--
$1,340
--
$1,550
--
$1,666
--
--
876
--
1,106
--
1,350
--
--
$1.53
--
$1.40
--
$1.23
--
--
35.0%
--
52.5%
--
12.5%
--
Utilities in Rent:
Heat:
Heat Fuel: Electric
Hot Water:
Cooking:
Electricity:
Wtr/Swr:
Trash:
Community Amenities
Clubhouse:
Comm Rm:
Centrl Lndry:
Fitness:
Hot Tub:
Sauna:
Pool-Outdr:
Playground:
Basketball:
Tennis:
Volleyball:
CarWash:
BusinessCtr:
ComputerCtr:
Floorplans (Published Rents as of 5/7/2021) (2)
Elevator:
2.9% Vacant (8 units vacant) as of 5/7/2021
FeaturesStandard: Dishwasher; Disposal; Microwave; Ice Maker; Ceiling Fan; In Unit
Laundry (Hook-ups); Central A/C; Patio/Balcony; HighCeilings; Storage
(In Unit)
Select Units: Fireplace
Optional($): --
Incentives:
None. Daily pricing.
Security: Fence; Gated Entry
Unit Mix & Effective Rent (1)
Adjustments to Rent
Parking 1: Free Surface Parking
Comments
Opened September 15, 2009 and leased up in May 2011.
Management did not have pricing info on 3BD/2BA.
Parking 2: --
Fee: -- Fee: --
Date %Vac 1BR $ 2BR $ 3BR $
2.9%5/7/21 $1,340 $1,550 --
5.0%5/9/19 $1,147 $1,274 $1,666
5.0%3/30/18 $1,139 $1,407 $1,556
4.3%4/5/17 $1,210 $1,146 $1,706
* Indicates initial lease-up.
Description BRs Bath Rent SqFt ProgramRent/SF#UnitsFeature
1 1Garden $1,315 795 Market$1.6528--
1 1Garden $1,315 908 Market$1.4570--
2 2Garden $1,600 1,051 Market$1.5244--
2 2Garden $1,486 1,129 Market$1.32103--
3 2Garden $1,631 1,350 Market$1.2135--
© 2021 Real Property Research Group, Inc.
GA121-012810Panther Riverside Parc
(1) Effective Rent is Published Rent, net of concessions and assumes that water, sewer and trash is included in rent (2) Published Rent is rent as quoted by management.
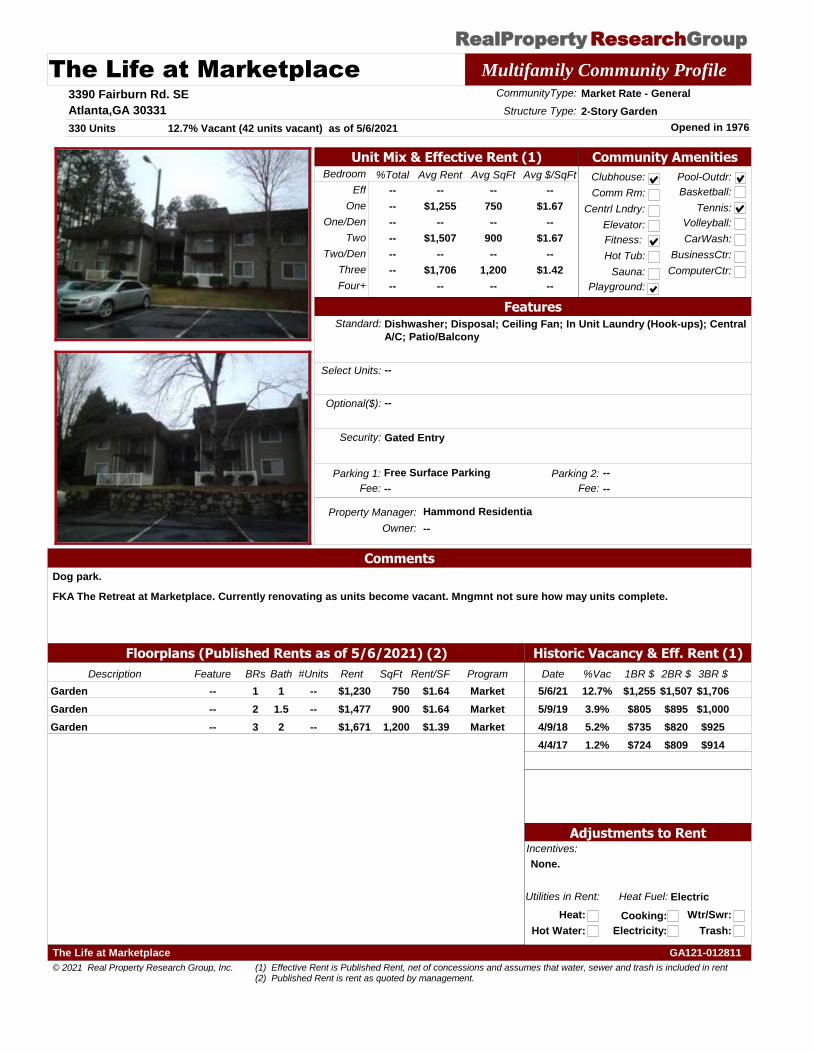
RealProperty Group Research
The Life at Marketplace Multifamily Community Profile
3390 Fairburn Rd. SE
Atlanta,GA 30331
Property Manager: Hammond Residentia
Opened in 1976
CommunityType: Market Rate - General
330 Units
Structure Type: 2-Story Garden
Owner: --
Historic Vacancy & Eff. Rent (1)
Bedroom Avg $/SqFtAvg SqFt%Total Avg Rent
Eff
One
Two
Three
Four+
One/Den
Two/Den
--
$1,255
--
$1,507
--
$1,706
--
--
750
--
900
--
1,200
--
--
$1.67
--
$1.67
--
$1.42
--
--
--
--
--
--
--
--
Utilities in Rent:
Heat:
Heat Fuel: Electric
Hot Water:
Cooking:
Electricity:
Wtr/Swr:
Trash:
Community Amenities
Clubhouse:
Comm Rm:
Centrl Lndry:
Fitness:
Hot Tub:
Sauna:
Pool-Outdr:
Playground:
Basketball:
Tennis:
Volleyball:
CarWash:
BusinessCtr:
ComputerCtr:
Floorplans (Published Rents as of 5/6/2021) (2)
Elevator:
12.7% Vacant (42 units vacant) as of 5/6/2021
FeaturesStandard: Dishwasher; Disposal; Ceiling Fan; In Unit Laundry (Hook-ups); Central
A/C; Patio/Balcony
Select Units: --
Optional($): --
Incentives:
None.
Security: Gated Entry
Unit Mix & Effective Rent (1)
Adjustments to Rent
Parking 1: Free Surface Parking
Comments
Dog park.
FKA The Retreat at Marketplace. Currently renovating as units become vacant. Mngmnt not sure how may units complete.
Parking 2: --
Fee: -- Fee: --
Date %Vac 1BR $ 2BR $ 3BR $
12.7%5/6/21 $1,255 $1,507 $1,706
3.9%5/9/19 $805 $895 $1,000
5.2%4/9/18 $735 $820 $925
1.2%4/4/17 $724 $809 $914
Description BRs Bath Rent SqFt ProgramRent/SF#UnitsFeature
1 1Garden $1,230 750 Market$1.64----
2 1.5Garden $1,477 900 Market$1.64----
3 2Garden $1,671 1,200 Market$1.39----
© 2021 Real Property Research Group, Inc.
GA121-012811The Life at Marketplace
(1) Effective Rent is Published Rent, net of concessions and assumes that water, sewer and trash is included in rent (2) Published Rent is rent as quoted by management.

RealProperty Group Research
The Park at Marketplace Multifamily Community Profile
3725 Princeton Lakes Pkwy
Atlanta,GA 30331
Property Manager: BH Mgt.
Opened in 2006
CommunityType: Market Rate - General
350 Units
Structure Type: 4-Story Garden
Owner: --
Historic Vacancy & Eff. Rent (1)
Bedroom Avg $/SqFtAvg SqFt%Total Avg Rent
Eff
One
Two
Three
Four+
One/Den
Two/Den
--
$1,260
--
$1,495
--
$1,690
--
--
831
--
1,189
--
1,399
--
--
$1.52
--
$1.26
--
$1.21
--
--
48.0%
--
44.0%
--
8.0%
--
Utilities in Rent:
Heat:
Heat Fuel: Electric
Hot Water:
Cooking:
Electricity:
Wtr/Swr:
Trash:
Community Amenities
Clubhouse:
Comm Rm:
Centrl Lndry:
Fitness:
Hot Tub:
Sauna:
Pool-Outdr:
Playground:
Basketball:
Tennis:
Volleyball:
CarWash:
BusinessCtr:
ComputerCtr:
Floorplans (Published Rents as of 5/6/2021) (2)
Elevator:
0.3% Vacant (1 units vacant) as of 5/6/2021
FeaturesStandard: Dishwasher; Disposal; Microwave; Ice Maker; Ceiling Fan; In Unit
Laundry (Full Size); Central A/C; Patio/Balcony; Storage (In Unit)
Select Units: Fireplace; HighCeilings
Optional($): --
Incentives:
None.
Security: Unit Alarms; Gated Entry; Keyed Bldg Entry
Unit Mix & Effective Rent (1)
Adjustments to Rent
Parking 1: Free Surface Parking
Comments
Community offers pet walking, housekeeping services, valet trash, grilling areas, DVD library, cyber lounge.
Classic & renovated units. SS apps, HW floors, and granite CT in renovated.
Parking 2: Detached Garage
Fee: -- Fee: $100
Date %Vac 1BR $ 2BR $ 3BR $
0.3%5/6/21 $1,260 $1,495 $1,690
2.0%1/15/21 $1,219 $1,378 $1,795
2.0%5/9/19 $1,146 $1,351 $1,673
7.1%3/29/18 $1,181 $1,426 $1,726
Description BRs Bath Rent SqFt ProgramRent/SF#UnitsFeature
1 1The Hampton - Renovate $1,340 741 Market$1.81----
1 1The Hampton - Classic / $1,215 741 Market$1.6442--
1 1The Hamilton - Renovate $1,380 819 Market$1.68----
1 1The Hamilton - Classic / $1,255 819 Market$1.5370--
1 1The Lincoln - Renovated / $1,425 912 Market$1.56----
1 1The Lincoln - Classic / Ga $1,300 912 Market$1.4356--
2 1The Franklin - Classic / G $1,390 1,043 Market$1.3314--
2 1The Franklin - Renovated $1,540 1,043 Market$1.48----
2 2The Bryce - Classic / Gar $1,455 1,176 Market$1.2470--
2 2The Bryce - Renovated / $1,605 1,176 Market$1.36----
2 2The Benjamin - Classic / $1,555 1,232 Market$1.2670--
2 2The Benjamin - Renovate $1,705 1,232 Market$1.38----
3 2The Washington - Renov $1,840 1,399 Market$1.32----
3 2The Washington - Classic $1,690 1,399 Market$1.2128--
© 2021 Real Property Research Group, Inc.
GA121-009478The Park at Marketplace
(1) Effective Rent is Published Rent, net of concessions and assumes that water, sewer and trash is included in rent (2) Published Rent is rent as quoted by management.

RealProperty Group Research
The Slate Multifamily Community Profile
1473 Sand Bay Dr SW
Atlanta,GA 30331
Property Manager: --
Opened in 2009
CommunityType: Market Rate - General
350 Units
Structure Type: 3-Story Garden
Owner: --
Historic Vacancy & Eff. Rent (1)
Bedroom Avg $/SqFtAvg SqFt%Total Avg Rent
Eff
One
Two
Three
Four+
One/Den
Two/Den
--
$1,318
--
$1,426
--
$1,561
--
--
876
--
1,167
--
1,434
--
--
$1.50
--
$1.22
--
$1.09
--
--
24.0%
--
56.0%
--
20.0%
--
Utilities in Rent:
Heat:
Heat Fuel: Electric
Hot Water:
Cooking:
Electricity:
Wtr/Swr:
Trash:
Community Amenities
Clubhouse:
Comm Rm:
Centrl Lndry:
Fitness:
Hot Tub:
Sauna:
Pool-Outdr:
Playground:
Basketball:
Tennis:
Volleyball:
CarWash:
BusinessCtr:
ComputerCtr:
Floorplans (Published Rents as of 5/11/2021) (2)
Elevator:
3.1% Vacant (11 units vacant) as of 5/11/2021
FeaturesStandard: Dishwasher; Microwave; Ice Maker; Ceiling Fan; In Unit Laundry (Hook-
ups); Central A/C; Patio/Balcony
Select Units: --
Optional($): --
Incentives:
None.
Security: Gated Entry
Unit Mix & Effective Rent (1)
Adjustments to Rent
Parking 1: Free Surface Parking
Comments
FKA Sandtown Vista. Dog park.
Black apps. Reserved parking fee from $75-$100.
Parking 2: Fee for Reserved
Fee: -- Fee: $88
Date %Vac 1BR $ 2BR $ 3BR $
3.1%5/11/21 $1,318 $1,426 $1,561
2.3%5/9/19 $1,143 $1,041 $1,537
9.1%3/29/18 $963 $1,126 $1,243
8.0%4/4/17 $940 $1,068 $1,270
Description BRs Bath Rent SqFt ProgramRent/SF#UnitsFeature
1 1Garden $1,293 876 Market$1.4884--
2 2Garden $1,396 1,167 Market$1.20196--
3 2Garden $1,526 1,434 Market$1.0670--
© 2021 Real Property Research Group, Inc.
GA121-021571The Slate
(1) Effective Rent is Published Rent, net of concessions and assumes that water, sewer and trash is included in rent (2) Published Rent is rent as quoted by management.

RealProperty Group Research
Villas at Princeton Lakes Multifamily Community Profile
751 Fairburn Rd. SW
Atlanta,GA 30331
Property Manager: --
Opened in 2004
CommunityType: Market Rate - General
208 Units
Structure Type: Garden
Owner: --
Historic Vacancy & Eff. Rent (1)
Bedroom Avg $/SqFtAvg SqFt%Total Avg Rent
Eff
One
Two
Three
Four+
One/Den
Two/Den
--
$1,245
--
$1,515
--
$1,375
--
--
975
--
1,175
--
1,350
--
--
$1.28
--
$1.29
--
$1.02
--
--
19.2%
--
67.3%
--
13.5%
--
Utilities in Rent:
Heat:
Heat Fuel: Electric
Hot Water:
Cooking:
Electricity:
Wtr/Swr:
Trash:
Community Amenities
Clubhouse:
Comm Rm:
Centrl Lndry:
Fitness:
Hot Tub:
Sauna:
Pool-Outdr:
Playground:
Basketball:
Tennis:
Volleyball:
CarWash:
BusinessCtr:
ComputerCtr:
Floorplans (Published Rents as of 5/11/2021) (2)
Elevator:
1.9% Vacant (4 units vacant) as of 5/11/2021
FeaturesStandard: Dishwasher; Disposal; In Unit Laundry (Hook-ups); Central A/C;
Patio/Balcony; Storage (In Unit)
Select Units: --
Optional($): --
Incentives:
None.
Security: Gated Entry
Unit Mix & Effective Rent (1)
Adjustments to Rent
Parking 1: Free Surface Parking
Comments
Coffee bar, kids club room. Former LIHTC community - The Preserve at Cascade.
Parking 2: Detached Garage
Fee: -- Fee: $150
Date %Vac 1BR $ 2BR $ 3BR $
1.9%5/11/21 $1,245 $1,515 $1,375
1.0%1/29/21 $1,165 $1,390 $1,555
2.9%9/22/20 $1,174 $1,309 $1,584
3.8%6/5/20 $1,174 $1,289 $1,524
Description BRs Bath Rent SqFt ProgramRent/SF#UnitsFeature
1 1Garden $1,230 975 Market$1.2640--
2 2Garden $1,495 1,175 Market$1.27140--
3 2Garden $1,350 1,350 Market$1.0028--
© 2021 Real Property Research Group, Inc.
GA121-008509Villas at Princeton Lakes
(1) Effective Rent is Published Rent, net of concessions and assumes that water, sewer and trash is included in rent (2) Published Rent is rent as quoted by management.

RealProperty Group Research
Walton Reserve Multifamily Community Profile
7075 Walton Reserve Ln.
Austell,GA
Property Manager: --
Opened in 2003
CommunityType: LIHTC - General
250 Units
Structure Type: 3-Story Garden
Owner: --
Historic Vacancy & Eff. Rent (1)
Bedroom Avg $/SqFtAvg SqFt%Total Avg Rent
Eff
One
Two
Three
Four+
One/Den
Two/Den
--
$905
--
$1,086
--
$1,232
--
--
850
--
1,175
--
1,485
--
--
$1.06
--
$0.92
--
$0.83
--
--
12.8%
--
64.4%
--
22.8%
--
Utilities in Rent:
Heat:
Heat Fuel: Electric
Hot Water:
Cooking:
Electricity:
Wtr/Swr:
Trash:
Community Amenities
Clubhouse:
Comm Rm:
Centrl Lndry:
Fitness:
Hot Tub:
Sauna:
Pool-Outdr:
Playground:
Basketball:
Tennis:
Volleyball:
CarWash:
BusinessCtr:
ComputerCtr:
Floorplans (Published Rents as of 5/13/2021) (2)
Elevator:
0.0% Vacant (0 units vacant) as of 5/13/2021
FeaturesStandard: Dishwasher; Disposal; Microwave; Ceiling Fan; In Unit Laundry (Hook-
ups); Central A/C; Patio/Balcony
Select Units: --
Optional($): --
Incentives:
None
Security: Gated Entry
Unit Mix & Effective Rent (1)
Adjustments to Rent
Parking 1: Free Surface Parking
Comments
Adventure Center - after-school program on-site.
Waiting list.
Received 2019 LIHTC allocation
Parking 2: --
Fee: -- Fee: --
Date %Vac 1BR $ 2BR $ 3BR $
0.0%5/13/21 $905 $1,086 $1,232
0.0%11/30/18 $796 $955 $1,079
Description BRs Bath Rent SqFt ProgramRent/SF#UnitsFeature
1 1Garden $890 850 LIHTC/ 60%$1.0532--
2 2Garden $1,066 1,175 LIHTC/ 60%$.91161--
3 2Garden $1,207 1,485 LIHTC/ 60%$.8157--
© 2021 Real Property Research Group, Inc.
GA067-029782Walton Reserve
(1) Effective Rent is Published Rent, net of concessions and assumes that water, sewer and trash is included in rent (2) Published Rent is rent as quoted by management.

RealProperty Group Research
West Eleven Multifamily Community Profile
1104 Westchase Lane
Atlanta,GA 30336
Property Manager: --
Opened in 2006
CommunityType: Market Rate - General
224 Units
Structure Type: 3-Story Garden
Owner: --
Historic Vacancy & Eff. Rent (1)
Bedroom Avg $/SqFtAvg SqFt%Total Avg Rent
Eff
One
Two
Three
Four+
One/Den
Two/Den
--
$1,049
--
$1,327
--
$1,630
--
--
830
--
1,119
--
1,335
--
--
$1.26
--
$1.19
--
$1.22
--
--
25.0%
--
58.0%
--
16.1%
--
Utilities in Rent:
Heat:
Heat Fuel: Electric
Hot Water:
Cooking:
Electricity:
Wtr/Swr:
Trash:
Community Amenities
Clubhouse:
Comm Rm:
Centrl Lndry:
Fitness:
Hot Tub:
Sauna:
Pool-Outdr:
Playground:
Basketball:
Tennis:
Volleyball:
CarWash:
BusinessCtr:
ComputerCtr:
Floorplans (Published Rents as of 5/7/2021) (2)
Elevator:
0.0% Vacant (0 units vacant) as of 5/7/2021
FeaturesStandard: Dishwasher; Disposal; Ceiling Fan; In Unit Laundry (Full Size); Central
A/C; Carpet / Ceramic
Select Units: --
Optional($): --
Incentives:
None.
Security: Gated Entry
Unit Mix & Effective Rent (1)
Adjustments to Rent
Parking 1: Free Surface Parking
Comments
Former LIHTC community.
Dog park, picnic area, outdoor kitchen. Black apps.
Parking 2: Fee for Reserved
Fee: -- Fee: $20
Date %Vac 1BR $ 2BR $ 3BR $
0.0%5/7/21 $1,049 $1,327 $1,630
7.6%5/9/19 $1,074 $1,342 $1,534
3.1%3/29/18 $1,030 $1,245 $1,360
0.4%1/23/18 $1,010 $1,200 $1,330
Description BRs Bath Rent SqFt ProgramRent/SF#UnitsFeature
1 1Garden $1,024 830 Market$1.2356--
2 2Garden $1,297 1,119 Market$1.16130--
3 2Garden $1,595 1,335 Market$1.1936--
© 2021 Real Property Research Group, Inc.
GA121-010615West Eleven
(1) Effective Rent is Published Rent, net of concessions and assumes that water, sewer and trash is included in rent (2) Published Rent is rent as quoted by management.