MEETING AGENDA - Riverside County Transportation ...
165
MEETING AGENDA Budget and Implementation Committee Time: 9:30 a.m. Date: February 22, 2021 Pursuant to Governor Newsom’s Executive Order N-29-20, (March 18, 2020), the meeting will only be conducted via video conferencing and by telephone. COMMITTEE MEMBERS Lloyd White, Chair / David Fenn, City of Beaumont Raymond Gregory, Vice Chair / Mark Carnevale, City of Cathedral City David Happe / Alberto Sanchez, City of Banning Linda Molina / Wendy Hewitt, City of Calimesa Jeremy Smith / Larry Greene, City of Canyon Lake Steven Hernandez / Denise Delgado, City of Coachella Scott Matas / Russell Betts, City of Desert Hot Springs Bob Magee / Natasha Johnson, City of Lake Elsinore Jan Harnik / Kathleen Kelly, City of Palm Desert Lisa Middleton / Dennis Woods, City of Palm Springs Chuck Conder / Erin Edwards, City of Riverside Alonso Ledezma / Crystal Ruiz, City of San Jacinto Ben J. Benoit / Joseph Morabito, City of Wildomar Karen Spiegel, County of Riverside, District II Chuck Washington, County of Riverside, District III STAFF Anne Mayer, Executive Director Theresia Trevino, Chief Financial Officer AREAS OF RESPONSIBILITY Annual Budget Development and Oversight Competitive Federal and State Grant Programs Countywide Communications and Outreach Programs Countywide Strategic Plan Legislation Public Communications and Outreach Programs Short Range Transit Plans
-
Upload
khangminh22 -
Category
Documents
-
view
1 -
download
0
Transcript of MEETING AGENDA - Riverside County Transportation ...

MEETING AGENDA
Budget and Implementation Committee
Time: 9:30 a.m.
Date: February 22, 2021
Pursuant to Governor Newsom’s Executive Order N-29-20, (March 18, 2020), the meeting will
only be conducted via video conferencing and by telephone.
COMMITTEE MEMBERS
Lloyd White, Chair / David Fenn, City of Beaumont
Raymond Gregory, Vice Chair / Mark Carnevale, City of
Cathedral City
David Happe / Alberto Sanchez, City of Banning
Linda Molina / Wendy Hewitt, City of Calimesa
Jeremy Smith / Larry Greene, City of Canyon Lake
Steven Hernandez / Denise Delgado, City of Coachella
Scott Matas / Russell Betts, City of Desert Hot Springs
Bob Magee / Natasha Johnson, City of Lake Elsinore
Jan Harnik / Kathleen Kelly, City of Palm Desert
Lisa Middleton / Dennis Woods, City of Palm Springs
Chuck Conder / Erin Edwards, City of Riverside
Alonso Ledezma / Crystal Ruiz, City of San Jacinto
Ben J. Benoit / Joseph Morabito, City of Wildomar
Karen Spiegel, County of Riverside, District II
Chuck Washington, County of Riverside, District III
STAFF
Anne Mayer, Executive Director
Theresia Trevino, Chief Financial Officer
AREAS OF RESPONSIBILITY
Annual Budget Development and Oversight
Competitive Federal and State Grant Programs
Countywide Communications and Outreach Programs
Countywide Strategic Plan
Legislation
Public Communications and Outreach Programs
Short Range Transit Plans

RIVERSIDE COUNTY TRANSPORTATION COMMISSION BUDGET AND IMPLEMENTATION COMMITTEE
www.rctc.org
AGENDA*
*Actions may be taken on any item listed on the agenda
9:30 a.m.
Monday, February 22, 2021
Pursuant to Governor Newsom’s Executive Order N-29-20, (March 18, 2020), the Budget and
Implementation Committee meeting will only be conducted via video conferencing and by
telephone. Please follow the instructions below to join the meeting remotely.
INSTRUCTIONS FOR ELECTRONIC PARTICIPATION
Join Zoom Meeting
https://rctc.zoom.us/j/82229840830
Meeting ID: 822 2984 0830
One tap mobile
+16699006833,,82229840830# US (San Jose)
For members of the public wishing to submit comment in connection with the Budget and
Implementation Committee Meeting please email written comments to the Clerk of the Board at
[email protected] prior to February 21, 2021 at 5:00 p.m. and your comments will be made part of
the official record of the proceedings. Members of the public may also make public comments
through their telephone or Zoom connection when recognized by the Chair.
In compliance with the Brown Act and Government Code Section 54957.5, agenda materials distributed
72 hours prior to the meeting, which are public records relating to open session agenda items, will be
available for inspection by members of the public prior to the meeting on the Commission’s website,
www.rctc.org.
In compliance with the Americans with Disabilities Act, Government Code Section 54954.2, Executive Order
N-29-20, and the Federal Transit Administration Title VI, please contact the Clerk of the Board at
(951) 787-7141 if special assistance is needed to participate in a Committee meeting, including accessibility
and translation services. Assistance is provided free of charge. Notification of at least 48 hours prior to the
meeting time will assist staff in assuring reasonable arrangements can be made to provide assistance at the
meeting.
1. CALL TO ORDER
2. ROLL CALL
3. PLEDGE OF ALLEGIANCE

Budget and Implementation Committee
February 22, 2021
Page 2
4. PUBLIC COMMENTS – Under the Brown Act, the Board should not take action on or discuss
matters raised during public comment portion of the agenda which are not listed on the
agenda. Board members may refer such matters to staff for factual information or to be
placed on the subsequent agenda for consideration. Each individual speaker is limited to
speak three (3) continuous minutes or less.
5. ADDITIONS/REVISIONS (The Committee may add an item to the Agenda after making a
finding that there is a need to take immediate action on the item and that the item came to
the attention of the Committee subsequent to the posting of the agenda. An action adding
an item to the agenda requires 2/3 vote of the Committee. If there are less than 2/3 of the
Committee members present, adding an item to the agenda requires a unanimous vote.
Added items will be placed for discussion at the end of the agenda.)
6. CONSENT CALENDAR - All matters on the Consent Calendar will be approved in a single
motion unless a Commissioner(s) requests separate action on specific item(s). Items pulled
from the Consent Calendar will be placed for discussion at the end of the agenda.
6A. APPROVAL OF MINUTES – JANUARY 25, 2021
Page 1
6B. QUARTERLY SALES TAX ANALYSIS
Page 7
Overview
This item is for the Committee to:
1) Receive and file the sales tax analysis for Quarter 3, 2020 (3Q 2020); and
2) Forward to the Commission for final action.
6C. QUARTERLY INVESTMENT REPORT
Page 16
Overview
This item is for the Committee to:
1) Receive and file the Quarterly Investment Report for the quarter ended
December 31, 2020; and
2) Forward to the Commission for final action.

Budget and Implementation Committee
February 22, 2021
Page 3
6D. QUARTERLY PUBLIC ENGAGEMENT METRICS REPORT, OCTOBER-DECEMBER 2020
Page 112
Overview
This item is for the Committee to:
1) Receive and file the Quarterly Public Engagement Metrics Report for October-
December 2020; and
2) Forward to the Commission for final action.
7. PROPOSED POLICY GOALS AND OBJECTIVES FOR FISCAL YEAR 2021/22 BUDGET
Page 121
Overview
This item is for the Committee to:
1) Review and approve the proposed Commission Policy Goals and Objectives for the
Fiscal Year 2021/22 Budget;
2) Review and approve the Fiscal Accountability Policies for the FY 2021/22 Budget; and
3) Forward to the Commission for final action.
8. COUNTY OF RIVERSIDE REQUEST FOR ADDITIONAL FUNDS FOR THE SALT CREEK TRAIL
Page 129
Overview
This item is for the Committee to:
1) Approve federal Congestion Mitigation and Air Quality (CMAQ) funds in the
additional amount of $160,000 for a total amount of $5,844,203 to fully fund
construction of the Salt Creek Trail project; and
2) Forward to the Commission for final action.
9. TRANSPORTATION NETWORK COMPANIES ACCESS FOR ALL PROGRAM
Page 134
Overview
This item is for the Committee to:
1) Authorize the Commission to become the Access Fund Administrator (AFA) for the
Transportation Network Companies (TNC) Access for All program for Riverside
County;
2) Authorize the Chair or Executive Director, pursuant to legal counsel review, to
execute agreements and/or documents related to the TNC Access for All program, on
behalf of the Commission; and
3) Forward to the Commission for final action.
Budget and Implementation Committee
February 22, 2021
Page 4
10. STATE AND FEDERAL LEGISLATIVE UPDATE
Page 136
Overview
This item is for the Committee to:
1) Receive and file an update on state and federal legislation; and
2) Forward to the Commission for final action.
11. ITEM(S) PULLED FROM CONSENT CALENDAR AGENDA
12. COMMISSIONERS / STAFF REPORT
Overview
This item provides the opportunity for the Commissioners and staff to report on attended
and upcoming meeting/conferences and issues related to Commission activities.
13. ADJOURNMENT
The next Budget and Implementation Committee meeting is scheduled to be held at
9:30 a.m., March 22, 2021, via Zoom.

AGENDA ITEM 6A
MINUTES


RIVERSIDE COUNTY TRANSPORTATION COMMISSION
BUDGET AND IMPLEMENTATION COMMITTEE
Monday, January 25, 2021
MINUTES
1. CALL TO ORDER
The meeting of the Budget and Implementation Committee was called to order by
Chair Lloyd White at 9:30 a.m. via Zoom Meeting ID: 881 2053 8327, pursuant to Governor
Newsom’s Executive Order N-29-20.
2. ROLL CALL
Members/Alternates Present Members Absent
Ben J. Benoit* David Happe
Patricia Lock Dawson Jan Harnik
Denise Delgado Alonso Ledezma
Raymond Gregory
Bob Magee
Scott Matas
Linda Molina
Jeremy Smith
Karen Spiegel
Chuck Washington
Lloyd White
Dennis Woods
*Arrived after the meeting was called to order.
3. PLEDGE OF ALLEGIANCE
Chair White led the Budget and Implementation Committee in a flag salute.
4. PUBLIC COMMENTS
There were no requests to speak from the public.
5. ADDITIONS / REVISIONS
There were no additions or revisions to the agenda.
1

RCTC Budget and Implementation Committee Minutes
January 25, 2021
Page 2
6. CONSENT CALENDAR - All matters on the Consent Calendar will be approved in a single
motion unless a Commissioner(s) requests separate action on specific item(s). Items pulled
from the Consent Calendar will be placed for discussion at the end of the agenda.
M/S/C (Gregory/Spiegel) to approve the following Consent Calendar item(s):
6A. APPROVAL OF MINUTES – NOVEMBER 23, 2020
6B. SINGLE SIGNATURE AUTHORITY REPORT
1) Receive and file the Single Signature Authority report for the second
quarter ended December 31, 2020; and
2) Forward to the Commission for final action.
7. ADOPT RESOLUTION NO. 21-001 RELATED TO PROCUREMENT POLICY MANUAL AND
RESOLUTION NO. 21-002 RELATED TO ELECTRONIC SIGNATURE USE POLICY
Matt Wallace, Deputy Director of Financial Administration, presented the resolutions
related to the Procurement Policy Manual (PPM) and to the Electronic Signature Use
Policy, highlighting the following:
• RCTC procurement history
• RCA implementation and management services agreement
• 2021 Comprehensive RCTC/RCA PPM with the revisions
• Electronic Signature Use Policy
• Next steps
At this time, Commissioner Ben J. Benoit joined the meeting.
Commissioner Raymond Gregory expressed appreciation for the staff report and the
presentation and asked for further clarification about the change in the Executive
Director’s signature authority and removing some constraints, such as having multiple
changes on the same contract.
Matt Wallace replied that a few years ago the Commission approved an increase to the
Executive Director’s individual contract authority from $150,000 to $250,000. Based on
a recent review of RCTC’s contracts and consideration for the existing procurement
threshold, staff and legal counsel felt that the recommended increase is appropriate. He
added due to the recent implementation of the management services agreement with
Western Riverside County Regional Conservation Authority (RCA), future agreements that
benefit both RCTC and RCA may be combined to realize efficiencies. He noted on a
quarterly basis staff prepares the single signature report for the Commission identifying
all the contracts the Executive Director has signed. Matt Wallace referred to the language
2

RCTC Budget and Implementation Committee Minutes
January 25, 2021
Page 3
that was removed and explained it was ambiguous and confusing and from a process
standpoint the language was no longer needed.
In response to Commissioner Gregory’s question if the Commission anticipates there may
be a need to raise the Executive Director’s contract authority, Matt Wallace replied it is
related to the joint contracts and it has been several years since the Commission has
asked for an increase. He explained the last approval for the individual contract authority
from $150,000 to $250,000 was because the federal guidelines were changed to reflect
that much and now years later in looking at all the number of contracts that RCTC has and
the unpredictability about RCA coming on board, it allows flexibility for the Commission
to exercise contracts.
Anne Mayer explained it is expected with the assumption of the managing agency
responsibilities of RCA that there will be a need to implement new contracts under that
single signature authority. If RCTC had not assumed RCA it probably would have been
recommended to just hold the $1.5 million but there is another agency that has come on
board with its own individual contracts. She expects that there will be an increased use
of her single signature authority because of the RCA managing agency contract.
Commissioner Gregory expressed appreciation for the explanation and stated he wanted
to ensure there was a thought process going into it. He asked regarding the electronic
signature policy, if RCTC is looking at having an electronic signature for the Per Diem
forms.
Matt Wallace stated he could go into the electronic signature policy and explain what it
can and cannot be used for and certainly the Per Diem forms could be executed
electronically and referred to Lisa Mobley, Clerk of the Board to update the
Commissioners. Lisa Mobley responded they are looking into a more efficient per diem
process.
Commissioner Chuck Washington asked after Anne Mayer’s comment to Commissioner
Gregory with the merger of RCTC and RCA the need for higher authorization limits, how
much bigger is RCTC’s overall budget by adding RCA if there is a percentage in the increase
in the size.
Anne Mayer replied percentage wise it is not very much. RCA’s budget estimate is in the
$40-$45 million range compared to RCTC’s budget, which the latest adjustments were in
the $1 billion range. It is a very small percentage budget wise and where there will be a
need for joint contracts is in outreach, legislative affairs and most significantly in the right
of way acquisition arena.
Commissioner Washington stated budgets are not necessarily connected to the authority
needed to process as they have very large contracts that need to be processed but are
not necessarily connected with their overall budget.
3

RCTC Budget and Implementation Committee Minutes
January 25, 2021
Page 4
Anne Mayer stated where it is anticipated in the upcoming months is in the land
acquisition side. She explained part of the first six months effort here is in doing an
assessment of exactly where the resources are needed and what kind of resources are
needed.
Theresia Trevino, Chief Financial Officer, stated the RCTC and RCA budgets are separate
and the actual impact to RCTC’s budget, for the additional staff and some of the contracts
that Anne Mayer was referring to for the six months the estimate was around $2 million.
She stated with regard to amending some of the existing contracts or needing to enter
into new contracts that is one of the other justifications for the increase in the threshold.
M/S/C (Washington/Gregory) to:
1) Approve the revised Riverside County Transportation Commission (RCTC)
and Western Riverside County Regional Conservation Agency (RCA)
Procurement Policy Manual (PPM) for the procurement and contracting
activities undertaken by the agencies, pursuant to legal counsel review
as to conformance to state and federal law;
2) Adopt Resolution No. 21-001, “Resolution of the Riverside County
Transportation Commission Regarding the Revised Procurement Policy
Manual”;
3) Approve the Electronic Signature Use Policy for the use of electronic
signatures in lieu of manual signatures, pursuant to legal counsel review;
4) Adopt Resolution No. 21-002, “Resolution of the Riverside County
Transportation Commission Adopting the Electronic Signature Use
Policy”; and
5) Forward to the Commission for final action.
8. STATE AND FEDERAL LEGISLATIVE UPDATE
David Knudsen, Legislative Affairs Manager, provided an update for the state and federal
legislative activities.
M/S/C to:
1) Receive and file an update on state and federal legislation; and
2) Forward to the Commission for final action.
4

RCTC Budget and Implementation Committee Minutes
January 25, 2021
Page 5
9. ELECTION OF OFFICERS FOR THE BUDGET AND IMPLEMENTATION COMMITTEE
Chair White, stated this item is for the Budget and Implementation Committee to conduct
an election of the officers for 2021.
At this time, Chair White opened nominations for the Chair position.
Commissioner Raymond Gregory, seconded by Commissioner Chuck Washington,
nominated Chair White for the Chair position for 2021.
No other nominations were received. The Chair closed the nominations. Chair White was
elected as the Budget and Implementation Committee’s Chair for 2021.
At this time, Chair White opened nominations for the Vice Chair position for 2021.
Commissioner Karen Spiegel, seconded by Commissioner Scott Matas, nominated
Commissioner Raymond Gregory as Vice Chair for 2021.
No other nominations were received. The Chair closed the nominations. Commissioner
Raymond Gregory was elected as the Budget and Implementation Committee’s Vice Chair
for 2021.
10. ITEM(S) PULLED FROM CONSENT CALENDAR AGENDA
There were no items pulled from the consent calendar.
11. COMMISSIONERS / EXECUTIVE DIRECTOR REPORT
11A. Anne Mayer announced:
• Congratulated Chair White and Vice Chair Gregory for being nominated for
2021
• Recognized the new Commissioners that have joined their first RCTC
meeting, and welcomed Commissioners Molina, Lock Dawson, Delgado
10B. Commissioner Spiegel stated the governor has lifted the stay-at-home orders as
of this morning, there is a write up in the California Department of Public Health,
and Riverside County will revert to the purple tier and look at moving forward.
She asked that residents continue to take this seriously and wear a mask, social
distance, wash your hands and be safe.
10C. Commissioner Washington reiterated that the county is back in the purple tier and
to continue social distancing and mask wearing. He stated the county has been
5

RCTC Budget and Implementation Committee Minutes
January 25, 2021
Page 6
managing the vaccinations and are shifting how this is being done because what
they have been doing is not working. It made the problem much worse when the
governor announced a larger group of eligible constituents of 65 and older for a
vaccination. They are working on this issue and are aware of the problems and
this morning the Board of Supervisors are meeting to strategize how they improve
that system and possibly a new appointment structure.
10D. Chair White stated they went in detail at the last city council meeting and there
are a lot of 55+ in the city of Beaumont and the surrounding areas and one issue
of big concern is for those that are 65+ that are eligible not being as technology
savvy as they need to be, and the city has tried to open their doors to reach out
to those that need help getting appointments. He suggested to Commissioner
Washington when they have their meeting, if there is a way to help facilitate so
that volunteers can work with the 65+ community in getting their vaccination
appointments
Commissioner Washington replied that is certainly an issue they have talked about
and on Saturday he joined five of his staff members and they attempted to get
appointments as they had a short list of people that had called his office and they
got five appointments, although it was very hard to get those appointments. The
Office on Aging has been assisting seniors through the 211 call system. There is a
back log of seniors that they will work through to get them before they open up
anymore appointment windows, but the problem is the opening to the band width
of getting those appointments is very narrow and then adding to that someone
who is not very tech savvy makes it nearly impossible for them to navigate through
that. They will be changing the system and stated to Chair White that he will pass
on his desire to be apart of a volunteer effort.
12. ADJOURNMENT
There being no further business for consideration by the Budget and Implementation
Committee, the meeting was adjourned at 10:05 a.m.
Respectfully submitted,
Lisa Mobley
Clerk of the Board
6

AGENDA ITEM 6B


Agenda Item 6B
RIVERSIDE COUNTY TRANSPORTATION COMMISSION
DATE: February 22, 2021
TO: Budget and Implementation Committee
FROM: Michele Cisneros, Deputy Director of Finance
THROUGH: Theresia Trevino, Chief Financial Officer
SUBJECT: Quarterly Sales Tax Analysis
STAFF RECOMMENDATION:
This item is for the Committee to:
1) Receive and file the sales tax analysis for Quarter 3, 2020 (3Q 2020); and
2) Forward to the Commission for final action.
BACKGROUND INFORMATION:
At its December 2007 meeting, the Commission awarded an agreement with MuniServices, LLC
(MuniServices), an Avenu Company, for quarterly sales tax reporting services plus additional fees
contingent on additional sales tax revenues generated from the transactions and use tax (sales
tax) audit services. As part of the recurring contracts process in June 2018, the Commission
approved a five-year extension through June 30, 2023. The services performed under this
agreement pertain to only the Measure A sales tax revenues.
Since the commencement of these services, MuniServices submitted audits, which reported
findings and submitted to the California Department of Tax and Fee Administration (CDTFA), for
review and determination of errors in sales tax reporting related to 852 businesses. Through
2Q 2020, the CDTFA approved $12,002,098 of these accounts for a cumulative sales tax recovery
of $6,728,779. If CDTFA concurs with the error(s) for the remaining claims, the Commission will
receive additional revenues; however, the magnitude of the value of the remaining findings was
not available. It is important to note that while the recoveries of additional revenues will be
tangible, it will not be sufficient to alter the overall trend of sales tax revenues.
MuniServices provided the Commission with the Quarterly Sales Tax Digest Summary report for
3Q 2020. Most of the 3Q 2020 Measure A sales tax revenues were received in the fourth quarter
of calendar year 2020, during October 2020 through December 2020, due to a lag in the sales tax
calendar. The summary section of the 3Q 2020 report is attached and includes an overview of
California’s economic outlook, local results, historical cash collections analysis by quarter, top 25
sales/use tax contributors, historical sales tax amounts, annual sales tax by business category,
and five-year economic trend (general retail).
7

Agenda Item 6B
Taxable transactions for the top 25 contributors in Riverside County generated 26.8 percent of
taxable sales for the benchmark year ended 3Q 2020, slightly higher than the 23.2 percent for
the benchmark year ended 3Q 2019. The top 100 tax contributors generated 41.2 percent for
the benchmark year ended 3Q 2020, slightly higher than the 37.4 percent for the benchmark year
ended 3Q 2019.
In the Economic Category Analysis below, four of the six categories experienced new highs in the
3Q 2020 benchmark year compared to the prior eight benchmark years. The food products
category was down due to a warehouse club chain, included under general retail category,
shifting food sales from grocery retailers. The transportation category was down due to declines
in fuel sales.
An analysis of sales tax performance through 3Q 2020 is attached and illustrates fairly consistent
cycles for sales tax performance for most of the economic categories since 3Q 2015 – with the
exception of COVID-19 impacts in 3Q 2020 for some categories.
For five of the top 10 segments (miscellaneous retail, auto sales-new, department stores, building
materials-wholesale, and building materials-retail) during the past eight benchmark year
quarters, sales tax receipts reached a new high point in 3Q 2020. The segments represent
42.8 percent of the total sales tax receipts. The service stations segment representing 6.2 percent
was lower than the last three benchmark year quarters since 3Q 2017. The restaurants, food
markets, heavy industry, and apparel store segments are lower than the 3Q 2019 benchmark
year quarter due to an automobile manufacturer’s end for new order incentives; a warehouse
club chain, included under department stores, shifting food sales from grocery retailers; and
impacts of the COVID-19 pandemic.
The top 10 segments represent 71.3 percent of the total sales tax receipts. For the other
21 segments representing 28.7 percent of the total sales tax receipts, 12 segments representing
14.1 percent of the total sales tax receipts reached new high points in the benchmark year
3Q 2020. In the Economic Segment Analysis below, auto sales – new has been in the top
economic segments beginning in 2014. Department stores and restaurants had been in the top
% of Total / % Change
RCTC State Wide Orange County
San
Bernardino
County
S.F. Bay AreaSacramento
Valley
Central
ValleySouth Coast North Coast
Central
Coast
General Retail 30.2 / 11.6 26.2 / -13.5 26.2 / -18.1 25.7 / -9.6 23.4 / -21.9 26.3 / -4.8 32.0 / 4.2 26.4 / -15.9 27.7 / -2 26.0 / -20.6
Food Products 15.8 / -9.3 19.9 / -18.4 19.8 / -18.7 15.8 / -11.2 20.7 / -24.3 16.3 / -11.2 15.2 / -9.5 21.6 / -19.1 22.9 / -0.5 30.4 / -22.4
Transportation 22.8 / -2.1 23.6 / -12.2 24.3 / -10.9 25.5 / -11.6 21.1 / -20.3 27.8 / -6.2 23.4 / -11.3 23.6 / -11 25.8 / -3.3 23.3 / -8.4
Construction 11.1 / 6.4 10.8 / -3.3 9.2 / -7.0 9.4 / -9.6 11.5 / -6.8 13.3 / 1.8 11.5 / 0.0 9.6 / -3.5 14.1 / 7.4 9.3 / 0.3
Business to Business 16.0 / 0.2 18.0 / -11.1 19.3 / -23.4 20.1 / -11.6 22.0 / -8.9 15.1 / -3.3 16.8 / -5.2 17.5 / -15.4 8.4 / -11.2 10.4 / -5.2
Miscellaneous 4.1 / 25.7 1.5 / -10.0 1.7 / -15.9 3.4 / 1.4 1.3 / -20.2 1.2 / -14 1.1 / 23.2 1.2 / -18.7 1.1 / -3 0.8 / -33.1
Total 100.0 / 2.7 100.0 / -12.8 100.0 / -16.7 100.0 / -10.5 100.0 / -18.0 100 / -5.4 100.0 / -3.9 100.0 / -14.4 100.0 / -1.6 100.0 / -15.6
General Retail: Apparel Stores, Department Stores, Furniture/Appliances, Drug Stores, Recreation Products, Florist/Nursery, and Misc. Retail
Food Products: Restaurants, Food Markets, Liquor Stores, and Food Processing Equipment
Construction: Building Materials Retail and Building Materials Wholesale
Transportation: Auto Parts/Repair, Auto Sales - New, Auto Sales - Used, Service Stations, and Misc. Vehicle Sales
Business to Business: Office Equip., Electronic Equip., Business Services, Energy Sales, Chemical Products, Heavy Industry, Light Industry, Leasing,
Biotechnology, I.T. Infrastructure, and Green Energy
Miscellaneous: Health & Government, Miscellaneous Other, and Closed Account Adjustments
ECONOMIC CATEGORY ANALYSIS
8

Agenda Item 6B
economic segments since 2014 but have been replaced with miscellaneous – retail and
miscellaneous – other beginning in the 3Q 2020 benchmark year quarter. Miscellaneous – retail
and miscellaneous – other include online and communication retailers.
Information regarding sales tax comparison by city and change in economic segments (two
highest gains and two highest losses) from 3Q 2019 to 3Q 2020 is attached.
In early March 2020, the federal government as well as the California Governor issues emergency
declarations related to the COVID-19 pandemic. Further, on March 19, 2020 the Governor issued
an executive stay at home order to protect the health and well-being of all Californians and to
establish consistency across the state to slow the spread of COVID-19. The County of Riverside
also issued a directive to county residents supporting the Governor’s executive order. COVID-19
and the related “stay at home” orders have negatively impacted the local, regional, state, and
federal economies; the magnitude and duration of these impacts is uncertain. Additionally, the
Governor issued an executive order to allow businesses with under $1 million in tax liability to
delay their first quarter sales and use tax filings until the end of July 2020. Another state program
allows small businesses to defer up to $50,000 of their sales and use tax liabilities for the first and
second quarters until July 31, 2021, provided that the owed amount is paid in 12 equal
installments over the following year. The sales taxes due to RCTC are not waived but may be
delayed. Staff will monitor sales tax receipts and other available economic data to determine the
need for any adjustments to the revenue projections. Staff will utilize the forecast scenarios with
the complete report and receipt trends in assessing such projections.
Attachments:
1) Sales Tax Digest Summary 3Q 2020
2) Sales Tax Performance Analysis by Quarter 3Q 2020
3) Quarterly Sales Tax Comparison by City for 3Q 2020 to 3Q 2019
RCTC State Wide Orange County
San
Bernardino
County
S.F. Bay AreaSacramento
Valley
Central
ValleySouth Coast North Coast
Central
Coast
Largest SegmentMiscellaneous
RetailRestaurants Auto Sales - New
Department
StoresRestaurants
Auto Sales -
New
Department
StoresRestaurants Restaurants Restaurants
% of Total / % Change 4.7 / 38.6 13.2 / -24.6 13.3 / -5.7 11.3 / 0.7 13.5 / -31.9 11.9 / -2.9 12.1 / -0.5 14.8 / -25.2 16.9 / -4.4 19.9 / -29.5
2nd Largest Segment Auto Sales - NewAuto Sales -
New
Department
StoresRestaurants
Auto Sales -
New
Department
StoresRestaurants
Auto Sales -
New
Department
Stores
Auto Sales -
New
% of Total / % Change 1.5 / 2.0 11.0 / -8.4 9.3 / -9.9 10.3 / -12.6 10.9 / -18.4 11.5 / 6.2 9.4 / -14.5 11.6 / -5.4 11.2 / -0.7 13.0 / 3.8
3rd Largest SegmentMiscellaneous
Other
Department
Stores
Miscellaneous
Retail
Auto Sales -
New
Department
StoresRestaurants
Auto Sales -
New
Department
Stores
Auto Sales -
New
Food
Markets
% of Total / % Change 1.2 / 56.0 9.3 / -6.1 7.0 / -26.2 8.6 / -8.6 7.3 / -13.5 10.3 / -16.9 9.1 / -9.2 8.9 / -8.9 9.1 / 3.0 8.4 / -5.3
ECONOMIC SEGMENT ANALYSIS
9


RiversideCountyTransportationCommissionSalesTaxDigestSummary
CollectionsthroughDecember2020SalesthroughSeptember2020(2020Q3)
www.avenuinsights.com (800) 800‐8181 Page1
CALIFORNIA’S ECONOMIC OUTLOOK California sales tax receipts increased by 1.1% over the same quarter from the previous year, with Northern California reporting a 1.5% increase compared to a ‐1.1% decrease for Southern California. Receipts for the RCTC increased by 13.8% over the same periods.
U.S. real GDP grew at a record‐high 33.1% in the third quarter of 2020. The growth was driven by personal consumption expenditures (PCE) increasing by .5% from September. The $63.5 billion increase in PCE for October reflected increases of $13.2 billion in spending for goods and $50.3 billion in spending for services. (CDTFA Finance Bulletin, November 2020)
California's unemployment rate improved to 11.0% in September, a .4% decrease from previous month. California’s labor force is still 839,000 fewer in September than in February of this year. The total labor force currently is 1,870,900. The U.S. unemployment rate declined for the sixth consecutive month to 6.9% in October. The U.S. labor force participation rate rose by 0.3% to 61.7%, and civilian employment rose to 149.8 million in October. (CDTFA Finance Bulletin, November 2020)
LOCAL RESULTS Net Cash Receipts Analysis Local Collections $55,393,097 Less: Cost of Administration $(429,420) Net 3Q2020 Receipts $54,963,677 Net 3Q2019 Receipts $48,312,978 Actual Percentage Change 13.8%
Business Activity Performance Analysis Local Collections – Economic Basis 3Q2020 $53,317,965 Local Collections – Economic Basis 3Q2019 $48,307,838 Quarter over Quarter Change $5,010,127 Quarter over Quarter Percentage Change 10.4% Avenu Insights & Analytics’ On‐Going Audit Results Total Recovered Since Inception $12,002,098
ATTACHMENT 1
10

RCTC
www.avenuinsights.com (800)800‐8181 Page2
$‐
$100
$200
$300
$400
$500
$600
$‐
$10,000
$20,000
$30,000
$40,000
$50,000
$60,000
2Q2018 3Q2018 4Q2018 1Q2019 2Q2019 3Q2019 4Q2019 1Q2020 2Q2020 3Q2020
(in thousands of $)
Net Receipts CDTFA Admin Fees Due
HISTORICAL CASH COLLECTIONS ANALYSIS BY QUARTER TOP 25 SALES/USE TAX CONTRIBUTORS The following list identifies RCTC’s Top 25 Sales/Use Tax contributors. The list is in alphabetical order and represents sales from August 2019 to September 2020. The Top 25 Sales/Use Tax contributors generate 26.8% of RCTC’s total sales and use tax revenue.
ALBERTSON’S JACK IN THE BOX RESTAURANTS AMAZON.COM ‐ EC KOHL'S DEPARTMENT STORES AMAZON.COM SERVICES ‐ EC LOWE’S HOME CENTERS ARCO AM/PM MINI MARTS MCDONALD'S RESTAURANTS BEST BUY STORES RALPH'S GROCERY COMPANY CARMAX THE AUTO SUPERSTORE ROSS STORES CHEVRON SERVICE STATIONS SAM'S CLUB CIRCLE K FOOD STORES SHELL SERVICE STATIONS COSTCO WHOLESALE STATER BROS MARKETS DEPARTMENT OF MOTOR VEHICLES TARGET STORES EBAY – EC VERIZON WIRELESS FERGUSON ENTERPRISES WAL MART STORES HOME DEPOT
11

RCTC
www.avenuinsights.com (800)800‐8181 Page3
$0
$5,000
$10,000
$15,000
$20,000
$25,000
3Q2020
High
Low
51,467
51,949
52,853
52,958
53,930
54,868
57,229
57,956
58,006
61,230
33,581
34,127
34,577
34,697
35,076
35,301
35,578
34,974
32,503
32,002
45,976
46,763
47,201
47,051
47,355
47,135
47,647
47,275
45,537
46,129
19,848
20,146
20,669
20,724
20,971
21,166
21,084
21,528
21,876
22,520
30,544
30,688
31,111
31,275
31,697
32,419
32,411
32,658
32,267
32,475
5,700
5,781
5,883
5,954
6,162
6,524
6,862
7,251
7,438
8,204
$ 0 $ 20,000 $ 40,000 $ 60,000 $ 80,000 $ 100,000 $ 120,000 $ 140,000 $ 160,000 $ 180,000 $ 200,000
2Q2018
3Q2018
4Q2018
1Q2019
2Q2019
3Q2019
4Q2019
1Q2020
2Q2020
3Q2020
(in thousands of $)
General Retail Food Products Transportation Construction Business To Business Miscellaneous
HISTORICAL SALES TAX AMOUNTS ANNUAL SALES TAX BY BUSINESS CATEGORY
The following chart shows the sales tax level from annual sales through September 2020, the highs, and the lows for the top ten segments over the last two years in thousands of $.
12

RCTC
www.avenuinsights.com (800)800‐8181 Page4
$0
$2,000
$4,000
$6,000
$8,000
$10,000
$12,000
$14,000
$16,000
$18,000
$20,0004Q2015
1Q2016
2Q2016
3Q2016
4Q2016
1Q2017
2Q2017
3Q2017
4Q2017
1Q2018
2Q2018
3Q2018
4Q2018
1Q2019
2Q2019
3Q2019
4Q2019
1Q2020
2Q2020
3Q2020
(in thousands of $)
FIVE‐YEAR ECONOMIC TREND: General Retail
13

RCTC: Sales Tax Performance Analysis by Quarter
TOTALConfidential Economic
TOTAL
2020Q3 QoQ %∆ QoQ $∆ YoY %∆ YoY $∆$53,317,965 10.4% $5,010,127 2.7% $5,247,525
GENERAL RETAIL2020Q3 QoQ %∆ QoQ $∆ YoY %∆ YoY $∆
$15,958,014 25.3% $3,224,365 11.6% $6,361,934
29.9%
FOOD PRODUCTS2020Q3 QoQ %∆ QoQ $∆ YoY %∆ YoY $∆
$7,722,113 ‐6.1% ‐$501,144 ‐9.3% ‐$3,298,680% of Total: 14.5%
TRANSPORTATION
2020Q3 QoQ %∆ QoQ $∆ YoY %∆ YoY $∆$12,569,693 4.9% $591,303 ‐2.1% ‐$1,006,596% of Total: 23.6%
CONSTRUCTION
2020Q3 QoQ %∆ QoQ $∆ YoY %∆ YoY $∆$6,100,559 11.8% $644,428 6.4% $1,354,120
% of Total: 11.4%
BUSINESS TO BUSINESS2020Q3 QoQ %∆ QoQ $∆ YoY %∆ YoY $∆
$8,369,262 2.5% $208,077 0.2% $55,956
% of Total: 15.7%
Q4 Q1 Q2 Q3
TOTAL CATEGORY
% of 2020Q3 Total:
QoQ = 20Q3 / 19Q3 YoY = YE 20Q3 / YE 19Q3
$0
$2,000,000
$4,000,000
$6,000,000
$8,000,000
$10,000,000
$12,000,000
$14,000,000
$16,000,000
$18,000,000
$20,000,000
$0
$10,000,000
$20,000,000
$30,000,000
$40,000,000
$50,000,000
$60,000,000
Avenu Insights & Analytics
ATTACHMENT 2
14

RCTC: Quarterly Comparison of 2019Q3 and 2020Q3 (July through September Sales)
General R
etail
Food
Products
Transportation
Construction
Business
To
Bus
Miscellaneous
Jul ‐ Sep 2020 (2020Q3)
Jul ‐ Sep 2019 (2019Q3) % Chg Gain Gain Decline Decline
BANNING 8.9% ‐3.4% 10.4% 67.2% ‐17.3% ‐2.1% 645,937 604,187 6.9% Auto Sales ‐ New Misc. Vehicle Sales Service Stations Restaurants
BEAUMONT 12.9% 20.7% 11.2% 11.5% 294.9% 11.7% 1,548,998 1,186,096 30.6% Light Industry Business Services Service Stations Heavy IndustryBLYTHE 106.5% 5.3% ‐3.6% 49.0% 43.7% ‐70.5% 388,954 330,815 17.6% Miscellaneous Retail Heavy Industry Service Stations Miscellaneous OtherCALIMESA 17.7% 35.6% ‐23.7% 24.2% ‐54.0% ‐59.3% 225,188 219,570 2.6% Food Markets Restaurants Service Stations Light IndustryCANYON LAKE 17.7% ‐4.3% ‐62.0% ‐98.6% 2.1% ‐51.4% 71,902 103,154 ‐30.3% Service Stations Food Markets Auto Parts/Repair Restaurants
CATHEDRAL CITY 18.5% ‐3.2% 14.8% 5.2% ‐3.9% 7.1% 2,318,543 2,105,133 10.1% Auto Sales ‐ New Misc. Vehicle Sales Service Stations Restaurants
COACHELLA 14.3% 18.8% ‐12.4% ‐48.2% ‐47.3% 113.3% 753,771 790,284 ‐4.6% Food Markets Restaurants Service Stations Energy SalesCORONA 0.6% ‐6.3% ‐14.0% 6.7% ‐4.7% ‐37.0% 9,551,912 9,820,613 ‐2.7% Bldg.Matls‐Whsle Heavy Industry Service Stations Office Equipment
COUNTY OF RIVERSIDE ‐14.0% ‐4.6% ‐10.0% 14.1% ‐7.4% ‐24.2% 6,566,943 7,005,052 ‐6.3% Bldg.Matls‐Whsle Recreation Products Apparel Stores Service StationsDESERT HOT SPRINGS ‐1.0% 17.1% ‐8.5% 55.1% 51.2% 2.1% 398,180 383,244 3.9% Drug Stores Food Markets Service Stations Department StoresEASTVALE 7.0% 6.0% ‐8.8% ‐0.9% 124.1% ‐15.9% 2,247,314 2,112,951 6.4% Light Industry Department Stores Service Stations Miscellaneous RetailHEMET 9.5% 1.9% 11.7% 17.4% 6.0% ‐1.8% 3,160,766 2,885,955 9.5% Auto Sales ‐ New Bldg.Matls‐Retail Service Stations Light IndustryINDIAN WELLS 21.8% ‐67.8% 0.0% 0.2% ‐50.6% ‐99.3% 58,463 120,601 ‐51.5% Miscellaneous Retail Drug Stores Restaurants Miscellaneous OtherINDIO 14.1% ‐2.9% 1.6% 11.4% 0.7% 1.4% 2,563,870 2,465,359 4.0% Auto Sales ‐ New Department Stores Service Stations Electronic Equipment
JURUPA VALLEY 53.6% ‐2.2% ‐24.8% 18.8% 2.9% ‐0.7% 4,339,555 4,023,828 7.8% Department Stores Miscellaneous Retail Auto Parts/Repair Leasing
LA QUINTA 15.1% ‐16.6% ‐7.0% 17.1% 3.9% 175.6% 1,713,478 1,646,260 4.1% Department Stores Furniture/Appliance Restaurants Auto Sales ‐ NewLAKE ELSINORE 24.2% 5.1% 13.4% 23.5% 27.6% ‐10.4% 2,630,038 2,243,991 17.2% Auto Sales ‐ New Drug Stores Service Stations Heavy IndustryMENIFEE 5.9% 0.7% ‐1.4% 14.8% ‐36.3% ‐42.4% 1,952,166 1,942,072 0.5% Bldg.Matls‐Retail Department Stores Heavy Industry Service StationsMORENO VALLEY 1.1% 0.7% 10.4% 11.8% 26.4% 26.1% 4,814,329 4,535,947 6.1% Auto Sales ‐ New Bldg.Matls‐Retail Apparel Stores Service StationsMURRIETA 1.4% ‐8.2% 14.4% 16.2% 34.2% ‐27.0% 4,395,372 4,112,869 6.9% Misc. Vehicle Sales Auto Sales ‐ Used Service Stations Restaurants
NORCO 3.5% ‐4.6% 7.6% 31.8% 20.6% ‐17.0% 1,770,369 1,659,873 6.7% Auto Sales ‐ Used Bldg.Matls‐Whsle Service Stations Restaurants
PALM DESERT ‐5.2% ‐29.8% 11.0% 7.1% 15.2% 111.9% 3,274,729 3,459,556 ‐5.3% Auto Sales ‐ Used Miscellaneous Other Restaurants Apparel StoresPALM SPRINGS 8.1% ‐24.6% ‐0.3% 10.9% 3.3% ‐50.1% 2,522,836 2,663,215 ‐5.3% Auto Sales ‐ New Light Industry Restaurants Service StationsPERRIS 56.0% 5.3% ‐19.5% 1.0% 9.8% ‐53.5% 4,582,261 5,464,720 ‐16.1% Miscellaneous Retail Light Industry Miscellaneous Other Auto Sales ‐ NewRANCHO MIRAGE 2.3% ‐35.0% ‐29.6% ‐4.6% ‐9.4% ‐23.9% 939,411 1,165,975 ‐19.4% Furniture/Appliance Food Markets Restaurants Auto Sales ‐ NewRIVERSIDE ‐6.8% ‐8.5% 4.8% 8.0% 11.0% ‐9.7% 14,903,494 14,695,195 1.4% Auto Sales ‐ New Heavy Industry Restaurants Service StationsSAN JACINTO 20.4% 6.1% ‐13.4% 14.8% 31.1% ‐11.1% 757,842 712,401 6.4% Department Stores Restaurants Service Stations Food Markets
TEMECULA ‐12.8% ‐12.2% 5.9% 12.3% ‐13.3% ‐38.9% 7,843,837 8,311,255 ‐5.6% Auto Sales ‐ New Misc. Vehicle Sales Restaurants Apparel StoresWILDOMAR 3.9% 8.7% 1.3% 15.6% 193.9% ‐47.5% 465,600 412,123 13.0% Office Equipment Food Markets Green Energy Service Stations
RIVERSIDE COUNTY
Non‐Confidential Avenu Insights & Analytics
ATTACHMENT 3
15

AGENDA ITEM 6C


Agenda Item 6C
RIVERSIDE COUNTY TRANSPORTATION COMMISSION
DATE: February 22, 2021
TO: Budget and Implementation Committee
FROM: Megan Kavand, Senior Financial Analyst
Michele Cisneros, Deputy Finance Director
THROUGH: Theresia Trevino, Chief Financial Officer
SUBJECT: Quarterly Investment Report
STAFF RECOMMENDATION:
This item is for the Committee to:
1) Receive and file the Quarterly Investment Report for the quarter ended December 31,
2020; and
2) Forward to the Commission for final action.
BACKGROUND INFORMATION:
Prior to 2013, the Commission’s quarterly investment reports had generally reflected
investments primarily concentrated in the Riverside County Pooled Investment Fund as well as
investments in mutual funds for sales tax revenue bonds debt service payments and in the state
Local Agency Investment Fund. As a result of significant project financings such as the State
Route 91 Corridor Improvement Project (91 Project or 91 CIP) and the Interstate 15 Express Lanes
Project (I-15 ELP), the Commission engaged MetLife Investment Management, LLC, formerly
Logan Circle Partners, L.P. (MetLife), as the investment manager for the bond proceeds and other
required funds. Additionally, the Commission engaged Payden & Rygel Investment Management
(Payden & Rygel) to make specific investments for Commission operating funds. The Commission
approved initial agreements with the investment managers in May 2013 following a competitive
procurement and has extended the agreements through the annual recurring contracts process.
MetLife invested the debt proceeds and subsequent other required contributions for the 91
Project and I-15 ELP in separate accounts of the Short-Term Actively Managed Program (STAMP).
The Commission completed the 91 Project financing in 2013 and the I-15 ELP project and 91
Project completion financing (2017 Financing) in July 2017. Consistent with financing
expectations, the Commission expended all of the 91 Project debt proceeds and equity
contributions, except for the toll revenue bonds debt service reserve, and subsequent to
commencement of operations, established other required accounts. The Commission continues
to expend the 2017 Financing bond proceeds on the I-15 ELP and funded required reserve
accounts.
16

Agenda Item 6C
The quarterly investment report for the second quarter of FY 2020/21, as required by state law
and Commission policy, reflects the investment activities resulting from the 91 Project,
2017 Financing, and available operating cash. As of December 31, 2020, the Commission’s cash
and investments was comprised of the following:
CASH AND INVESTMENTS PORTFOLIO AMOUNTS
Operating $ 588,848,755
Trust 100,548,499
Commission-managed 109,202,311
STAMP for 91 CIP 65,927,821
STAMP for 2017 Financing 49,557,893
Total $ 914,085,279
The quarterly investment report includes the following information:
• Investment Portfolio Report;
• 91 CIP STAMP Portfolio by Investment Category;
• 91 CIP STAMP Portfolio by Account;
• 91 CIP STAMP Portfolio Transaction Report by Account;
• 91 CIP STAMP Portfolio Summary of investments by credit rating, industry group, asset
class, security type, and market sector;
• 91 CIP STAMP Portfolio Toll Revenue Series A & Series B Reserve Fund Summary of
investments by credit rating, industry group, asset class, security type, and market sector;
• 91 CIP STAMP Portfolio Residual Fund Required Retained Balance Summary of
investments by credit rating, industry group, asset class, security type, and market sector;
• 91 CIP STAMP Portfolio TIFIA Reserve Fund Summary of investments by credit rating,
industry group, asset class, security type, and market sector;
• 2017 Financing STAMP Portfolio by Investment Category;
• 2017 Financing STAMP Portfolio by Account;
• 2017 Financing STAMP Portfolio Transaction Report by Account;
• 2017 Financing STAMP Portfolio Summary of investments by credit rating, industry group,
asset class, security type, and market sector;
• 2017 Financing STAMP Portfolio I-15 ELP Sales Tax Senior Lien TIFIA Project Fund
Summary of investments by credit rating, industry group, asset class, security type, and
market sector;
• 2017 Financing STAMP Portfolio Ramp Up Fund Summary of investments by credit rating,
industry group, asset class, security type, and market sector;
• MetLife Short Duration Fourth Quarter 2020 Review;
• Payden & Rygel Operating Portfolio by Investment Category;
• Payden & Rygel Operating Portfolio Transaction Report;
• Payden & Rygel Operating Portfolio Fourth Quarter 2020 Review; and
• County of Riverside Investment Report for December 2020.
17

Agenda Item 6C
The Commission’s investments were in full compliance with the Commission’s investment policy
adopted on August 12, 2020, and investments securities permitted under the indenture for the
Commission’s sales tax revenue bonds and the master indentures for the Commission’s toll
revenue bonds. Additionally, the Commission has adequate cash flows for the next six months.
Attachments:
1) Investment Portfolio Report
2) 91 CIP STAMP Portfolio by Investment Category
3) 91 CIP STAMP Portfolio by Account
4) 91 CIP STAMP Portfolio Transaction Report by Account
5) 91 CIP STAMP Portfolio Summary of Investments
6) 91 CIP STAMP Portfolio Toll Revenue Series A & Series B Reserve Fund Summary of
Investments
7) 91 CIP STAMP Portfolio Residual Fund Required Retained Balance Summary of
Investments
8) 91 CIP STAMP Portfolio TIFIA Reserve Fund Summary of Investments
9) 2017 Financing STAMP Portfolio by Investment Category
10) 2017 Financing STAMP Portfolio by Account
11) 2017 Financing STAMP Portfolio Transaction Report by Account
12) 2017 Financing STAMP Portfolio Summary of Investments
13) 2017 Financing STAMP Portfolio I-15 ELP Sales Tax Senior Lien TIFIA Project Fund
Summary of Investments
14) 2017 Financing STAMP Portfolio Ramp Up Fund Summary of Investments
15) Payden & Rygel Operating Portfolio by Investment Category
16) Payden & Rygel Operating Portfolio Transaction Report
17) MetLife Short Duration Quarterly Review
18) Payden & Rygel Operating Portfolio Quarterly Review
19) County of Riverside Investment Report
18


Riverside County Transportation Commission
Investment Portfolio Report
Period Ended: December 31, 2020
FAIR VALUE
RATING
MOODYS / S&P
COUPON
RATE
PAR
VALUE
PURCHASE
DATE
MATURITY
DATE
YIELD TO
MATURITY
PURCHASE
COST
MARKET
VALUE
UNREALIZED
GAIN (LOSS)
OPERATING FUNDS
City National Bank Deposits 5,710,153 A3/BBB+ N/A N/A
County Treasurer's Pooled Investment Fund 579,226,009 Aaa-bf/AAA-V1 N/A 0.45%
Local Agency Investment Fund (LAIF) 3,912,593 N/A N/A N/A
Subtotal Operating Funds 588,848,755
FUNDS HELD IN TRUST
County Treasurer's Pooled Investment Fund:
Local Transportation Fund 100,548,499 Aaa-bf/AAA-V1 N/A 0.45%
Subtotal Funds Held in Trust 100,548,499
COMMISSION MANAGED PORTFOLIO
US Bank Payden & Rygel Operating 55,652,848
First American Government Obligation Fund 53,549,463 N/A N/A N/A
Subtotal Commission Managed Portfolio 109,202,311
STAMP PORTFOLIO for 91 CIP
Series A & Series B Reserve Fund 17,923,645
Residual Fund Required Retained Balance 26,959,940
TIFIA Reserve Fund 21,044,236
Subtotal STAMP Portfolio - 91 CIP 65,927,821
STAMP PORTFOLIO for 2017 Financing
Sales Tax I15 ELP Project Revenue Fund 41,064,037
Ramp Up Fund 8,493,857
Subtotal STAMP Portfolio - 2017 Financing 49,557,893
TOTAL All Cash and Investments 914,085,279$
See attached report for details
See attached report for details
See attached report for details
See attached report for details
See attached report for details
See attached report for details
1.96% 2.95% 2.30%4.49%
11.94% 11.00%
64.42%
$‐
$100,000,000
$200,000,000
$300,000,000
$400,000,000
$500,000,000
$600,000,000
$700,000,000
STAMP Portfolio for 91 CIP Reserve
STAMP Portfolio for 91 CIP Residual Fund
STAMP Portfolio for 91 CIP TIFIA ReserveFund
STAMP Portfolio for 2017 Financing I15 ELPProject Revenue Fund
STAMP Portfolio for 2017 Financing Ramp UpFund
Commission Managed Portfolio
Trust Funds
Operating Funds
Nature of Investments5.86% Mutual
Funds
74.99% County Pool/Cash
0.43% LAIF
18.65% Fixed Income
0.07% Money Market Funds
ATTACHMENT 1
19

Source
Account Account Identifier
Security Type
Category Issuer Final Maturity Trade Date Current Face Value Original Cost
Next Call
Date Base Market Value
Base Net Total
Unrealized
Gain/Loss Coupon Yield
Summarized
Credit Rating
256350023 MIM-Sr Lien Reserve Fund-1 3130AFFX0 Agency Federal Home Loan Banks 11/16/2028 09/11/2019 185,000.00 205,766.25 --- 221,237.80 18,205.78 3.250 0.690 AAA
256350023 MIM-Sr Lien Reserve Fund-1 3135G0V75 Agency Federal National Mortgage Association 07/02/2024 12/21/2020 425,000.00 447,567.08 --- 447,486.75 80.43 1.750 0.232 AAA
256350023 MIM-Sr Lien Reserve Fund-1 3135G05G4 Agency Federal National Mortgage Association 07/10/2023 --- 400,000.00 399,976.00 --- 400,956.00 935.81 0.250 0.155 AAA
256350023 MIM-Sr Lien Reserve Fund-1 3134GWGB6 Agency Freddie Mac 07/28/2023 07/22/2020 200,000.00 200,000.00 01/28/2021 200,044.00 44.00 0.450 0.156 AAA
256350023 MIM-Sr Lien Reserve Fund-1 3134GWND4 Agency Freddie Mac 08/12/2025 08/14/2020 300,000.00 299,580.00 08/12/2021 298,608.00 (1,002.93) 0.600 0.702 AAA
256350023 MIM-Sr Lien Reserve Fund-1 3137EAEV7 Agency Freddie Mac 08/24/2023 08/19/2020 400,000.00 399,592.00 --- 400,788.00 1,147.14 0.250 0.175 AAA
256350023 MIM-Sr Lien Reserve Fund-1 3134GWTL0 Agency Freddie Mac 09/28/2023 09/23/2020 290,000.00 289,956.50 09/28/2021 290,049.30 89.01 0.300 0.277 AAA
256350023 MIM-Sr Lien Reserve Fund-1 3134GXDT8 Agency Freddie Mac 11/24/2023 11/19/2020 145,000.00 145,000.00 05/24/2021 145,062.35 62.35 0.350 0.242 AAA
256350021 MIM-RCTC 2013 Residual Fund 3134GV6H6 Agency Freddie Mac 10/20/2022 07/22/2020 400,000.00 399,960.00 07/20/2021 400,340.00 372.14 0.320 0.166 AAA
256350021 MIM-RCTC 2013 Residual Fund 3134GWGB6 Agency Freddie Mac 07/28/2023 07/22/2020 300,000.00 300,000.00 01/28/2021 300,066.00 66.00 0.450 0.156 AAA
256350021 MIM-RCTC 2013 Residual Fund 3134GWTL0 Agency Freddie Mac 09/28/2023 09/23/2020 270,000.00 269,959.50 09/28/2021 270,045.90 82.87 0.300 0.277 AAA
256350021 MIM-RCTC 2013 Residual Fund 3134GWY42 Agency Freddie Mac 10/13/2023 10/07/2020 300,000.00 299,850.00 10/13/2021 299,991.00 130.05 0.300 0.301 AAA
256350021 MIM-RCTC 2013 Residual Fund 3136G46A6 Agency Federal National Mortgage Association 10/27/2023 10/20/2020 415,000.00 414,896.25 10/27/2021 415,012.45 109.95 0.300 0.296 AAA
256350018 MIM-RCTC 91 TIFIA Reserve 3137EADB2 Agency Freddie Mac 01/13/2022 06/06/2019 500,000.00 505,766.50 --- 511,560.00 9,233.97 2.375 0.135 AAA
256350018 MIM-RCTC 91 TIFIA Reserve 3137EAEC9 Agency Freddie Mac 08/12/2021 04/29/2020 270,000.00 273,044.52 --- 271,657.80 199.69 1.125 0.124 AAA
256350018 MIM-RCTC 91 TIFIA Reserve 3130AFFX0 Agency Federal Home Loan Banks 11/16/2028 09/11/2019 200,000.00 222,450.00 --- 239,176.00 19,681.92 3.250 0.690 AAA
256350018 MIM-RCTC 91 TIFIA Reserve 3135G0V75 Agency Federal National Mortgage Association 07/02/2024 12/21/2020 100,000.00 105,309.90 --- 105,291.00 18.93 1.750 0.232 AAA
256350018 MIM-RCTC 91 TIFIA Reserve 3135G05G4 Agency Federal National Mortgage Association 07/10/2023 07/20/2020 425,000.00 424,328.50 --- 426,015.75 1,586.98 0.250 0.155 AAA
256350018 MIM-RCTC 91 TIFIA Reserve 3134GWGB6 Agency Freddie Mac 07/28/2023 07/22/2020 225,000.00 225,000.00 01/28/2021 225,049.50 49.50 0.450 0.156 AAA
256350018 MIM-RCTC 91 TIFIA Reserve 3134GWND4 Agency Freddie Mac 08/12/2025 08/14/2020 325,000.00 324,545.00 08/12/2021 323,492.00 (1,086.50) 0.600 0.702 AAA
256350018 MIM-RCTC 91 TIFIA Reserve 3137EAEV7 Agency Freddie Mac 08/24/2023 08/19/2020 425,000.00 424,566.50 --- 425,837.25 1,218.83 0.250 0.175 AAA
256350018 MIM-RCTC 91 TIFIA Reserve 3134GWTL0 Agency Freddie Mac 09/28/2023 09/23/2020 315,000.00 314,952.75 09/28/2021 315,053.55 96.68 0.300 0.277 AAA
256350018 MIM-RCTC 91 TIFIA Reserve 3134GXDT8 Agency Freddie Mac 11/24/2023 11/19/2020 160,000.00 160,000.00 05/24/2021 160,068.80 68.80 0.350 0.242 AAA
256350023 MIM-Sr Lien Reserve Fund-1 38377REV3 Agency CMO Government National Mortgage Association 10/20/2039 07/01/2019 31,497.29 32,122.32 --- 32,099.52 329.73 3.500 -0.027 AAA
256350023 MIM-Sr Lien Reserve Fund-1 38377RVK8 Agency CMO Government National Mortgage Association 04/20/2039 --- 57,606.17 58,755.47 --- 59,275.02 1,300.17 3.000 0.842 AAA
256350023 MIM-Sr Lien Reserve Fund-1 3137ABFH9 Agency CMO Freddie Mac 06/25/2021 07/22/2019 57,541.55 59,022.80 --- 58,033.53 161.60 3.989 1.251 AAA
256350023 MIM-Sr Lien Reserve Fund-1 38375XCM4 Agency CMO Government National Mortgage Association 11/16/2037 05/14/2019 30,914.74 31,790.26 --- 31,865.99 511.21 5.000 0.638 AAA
256350023 MIM-Sr Lien Reserve Fund-1 3137ATRW4 Agency CMO Freddie Mac 05/25/2022 --- 282,110.00 278,085.13 --- 288,575.96 8,119.40 2.373 0.400 AAA
256350023 MIM-Sr Lien Reserve Fund-1 3137AUPE3 Agency CMO Freddie Mac 06/25/2022 --- 150,000.00 151,611.80 --- 153,963.00 3,692.08 2.396 0.321 AAA
256350023 MIM-Sr Lien Reserve Fund-1 3136A72D3 Agency CMO Federal National Mortgage Association 04/25/2022 07/03/2013 169,367.31 160,898.94 --- 172,283.82 4,022.26 2.482 0.404 AAA
256350023 MIM-Sr Lien Reserve Fund-1 3136A5KR6 Agency CMO Federal National Mortgage Association 10/25/2022 01/25/2019 6,137.55 6,053.16 --- 6,137.49 19.09 1.750 0.817 AAA
256350023 MIM-Sr Lien Reserve Fund-1 3137AXHP1 Agency CMO Freddie Mac 09/25/2022 09/29/2017 140,000.00 142,089.06 --- 144,225.20 3,658.84 2.573 0.602 AAA
256350023 MIM-Sr Lien Reserve Fund-1 38378B7F0 Agency CMO Government National Mortgage Association 12/16/2042 --- 450,000.00 427,324.22 --- 466,249.50 25,897.23 2.273 1.180 AAA
256350023 MIM-Sr Lien Reserve Fund-1 38378CRT6 Agency CMO Government National Mortgage Association 10/20/2040 05/22/2014 24,424.05 23,584.47 --- 24,936.71 832.35 2.000 0.216 AAA
256350023 MIM-Sr Lien Reserve Fund-1 38378HXH4 Agency CMO Government National Mortgage Association 09/16/2027 03/08/2019 9,887.13 9,588.86 --- 9,993.02 339.98 1.250 0.615 AAA
256350023 MIM-Sr Lien Reserve Fund-1 3137B1UG5 Agency CMO Freddie Mac 01/25/2023 --- 240,000.00 250,336.72 --- 248,952.00 950.34 2.637 0.586 AAA
256350023 MIM-Sr Lien Reserve Fund-1 38377JZ89 Agency CMO Government National Mortgage Association 10/20/2039 --- 28,305.74 29,076.67 --- 29,045.09 477.01 3.500 -0.616 AAA
256350023 MIM-Sr Lien Reserve Fund-1 38378TAF7 Agency CMO Government National Mortgage Association 07/20/2041 07/05/2013 76,994.38 77,005.99 --- 79,360.42 2,424.20 2.500 0.742 AAA
256350023 MIM-Sr Lien Reserve Fund-1 38376TTT9 Agency CMO Government National Mortgage Association 11/20/2039 01/29/2020 30,448.86 31,162.51 --- 31,770.04 624.54 3.000 0.528 AAA
256350023 MIM-Sr Lien Reserve Fund-1 3137B4HD1 Agency CMO Freddie Mac 12/15/2042 03/20/2019 24,413.90 25,214.98 --- 25,901.43 825.30 4.500 0.767 AAA
256350023 MIM-Sr Lien Reserve Fund-1 38378FRB8 Agency CMO Government National Mortgage Association 07/20/2042 12/30/2019 147,560.96 145,393.66 --- 151,081.77 5,570.25 2.000 1.120 AAA
256350023 MIM-Sr Lien Reserve Fund-1 3137BDKF2 Agency CMO Freddie Mac 09/15/2040 11/13/2019 37,092.26 37,947.12 --- 37,927.95 341.67 3.500 0.509 AAA
256350023 MIM-Sr Lien Reserve Fund-1 3137A5FP4 Agency CMO Freddie Mac 01/15/2021 --- 38,323.44 38,327.77 --- 38,309.26 (14.18) 2.500 1.055 AAA
256350023 MIM-Sr Lien Reserve Fund-1 38376T5Z1 Agency CMO Government National Mortgage Association 01/16/2039 01/26/2015 46,287.29 48,358.65 --- 48,248.02 875.55 3.000 0.802 AAA
256350023 MIM-Sr Lien Reserve Fund-1 38376WA62 Agency CMO Government National Mortgage Association 10/20/2039 --- 121,536.13 124,593.49 --- 129,635.30 5,353.19 4.000 1.041 AAA
256350023 MIM-Sr Lien Reserve Fund-1 38377YTL4 Agency CMO Government National Mortgage Association 05/20/2040 12/16/2020 23,215.54 23,516.63 --- 23,638.76 108.43 2.000 0.590 AAA
256350023 MIM-Sr Lien Reserve Fund-1 38378JZD7 Agency CMO Government National Mortgage Association 12/20/2040 10/16/2019 27,560.26 27,215.76 --- 27,887.95 601.11 1.500 0.608 AAA
256350023 MIM-Sr Lien Reserve Fund-1 38377QKH9 Agency CMO Government National Mortgage Association 08/20/2040 08/20/2019 27,590.76 28,091.91 --- 28,763.64 802.79 3.000 -0.436 AAA
256350023 MIM-Sr Lien Reserve Fund-1 38380AZ34 Agency CMO Government National Mortgage Association 04/20/2046 11/28/2016 91,828.98 94,400.91 --- 97,190.87 3,351.71 3.000 1.557 AAA
256350023 MIM-Sr Lien Reserve Fund-1 3137ARVU7 Agency CMO Freddie Mac 08/15/2038 06/30/2020 140,220.36 142,170.30 --- 141,283.23 (247.22) 3.000 0.579 AAA
256350023 MIM-Sr Lien Reserve Fund-1 38378VC45 Agency CMO Government National Mortgage Association 12/16/2041 11/23/2018 88,826.31 85,620.24 --- 91,302.79 4,722.82 2.250 0.591 AAA
256350023 MIM-Sr Lien Reserve Fund-1 38377JM59 Agency CMO Government National Mortgage Association 10/20/2039 11/21/2018 31,027.93 30,252.23 --- 31,471.94 798.16 2.500 0.206 AAA
256350023 MIM-Sr Lien Reserve Fund-1 3137B5A60 Agency CMO Freddie Mac 10/15/2028 03/20/2019 13,758.93 13,604.15 --- 14,208.02 569.22 2.500 0.312 AAA
256350023 MIM-Sr Lien Reserve Fund-1 3136ADFF1 Agency CMO Federal National Mortgage Association 04/25/2023 06/10/2019 60,204.10 59,338.66 --- 60,546.66 918.95 1.500 0.739 AAA
256350023 MIM-Sr Lien Reserve Fund-1 38379JM99 Agency CMO Government National Mortgage Association 02/16/2041 08/28/2019 18,031.30 18,147.52 --- 18,233.61 160.48 2.500 -0.121 AAA
256350023 MIM-Sr Lien Reserve Fund-1 38378AU90 Agency CMO Government National Mortgage Association 10/20/2026 04/28/2020 86,155.75 88,632.73 --- 88,175.24 23.13 3.000 0.522 AAA
256350021 MIM-RCTC 2013 Residual Fund 38377REV3 Agency CMO Government National Mortgage Association 10/20/2039 07/01/2019 67,494.20 68,833.53 --- 68,784.68 706.56 3.500 -0.027 AAA
256350021 MIM-RCTC 2013 Residual Fund 3137ABFH9 Agency CMO Freddie Mac 06/25/2021 03/15/2019 118,535.60 120,748.89 --- 119,549.08 597.80 3.989 1.251 AAA
256350021 MIM-RCTC 2013 Residual Fund 3137ADTJ6 Agency CMO Freddie Mac 04/25/2021 03/11/2020 361,583.52 368,984.69 --- 362,708.04 (209.78) 3.871 1.003 AAA
256350021 MIM-RCTC 2013 Residual Fund 3137AH6C7 Agency CMO Freddie Mac 07/25/2021 03/11/2020 32,123.26 32,745.65 --- 32,469.55 107.61 3.230 0.468 AAA
256350021 MIM-RCTC 2013 Residual Fund 31394GUX9 Agency CMO Freddie Mac 08/15/2023 07/02/2019 17,056.14 17,781.02 --- 17,809.00 277.83 5.500 1.043 AAA
256350021 MIM-RCTC 2013 Residual Fund 31397LUK3 Agency CMO Federal National Mortgage Association 06/25/2023 10/10/2018 49,779.81 50,783.19 --- 50,851.57 678.82 4.500 0.962 AAA
256350021 MIM-RCTC 2013 Residual Fund 3137ATRW4 Agency CMO Freddie Mac 05/25/2022 08/19/2019 100,000.00 101,109.38 --- 102,292.00 1,835.92 2.373 0.400 AAA
256350021 MIM-RCTC 2013 Residual Fund 3136A72D3 Agency CMO Federal National Mortgage Association 04/25/2022 07/26/2019 23,582.78 23,720.81 --- 23,988.88 319.41 2.482 0.404 AAA
256350021 MIM-RCTC 2013 Residual Fund 3136A5KR6 Agency CMO Federal National Mortgage Association 10/25/2022 --- 20,520.12 20,403.06 --- 20,519.92 27.51 1.750 0.817 AAA
256350021 MIM-RCTC 2013 Residual Fund 3137AYCE9 Agency CMO Freddie Mac 10/25/2022 08/13/2019 360,000.00 367,790.63 --- 372,254.40 8,155.14 2.682 0.582 AAA
256350021 MIM-RCTC 2013 Residual Fund 3137A2PV7 Agency CMO Freddie Mac 09/15/2022 06/03/2019 19,410.65 19,070.96 --- 19,544.00 347.12 1.500 0.848 AAA
256350021 MIM-RCTC 2013 Residual Fund 3137GAUY1 Agency CMO Freddie Mac 10/15/2022 08/15/2019 100,783.14 99,743.81 --- 101,435.21 1,346.52 1.500 0.840 AAA
256350021 MIM-RCTC 2013 Residual Fund 3137A5FP4 Agency CMO Freddie Mac 01/15/2021 01/30/2018 13,699.88 13,734.13 --- 13,694.81 (5.07) 2.500 1.055 AAA
256350021 MIM-RCTC 2013 Residual Fund 38378PPK8 Agency CMO Government National Mortgage Association 12/20/2038 01/08/2020 55,250.49 55,641.13 --- 56,308.54 817.62 2.500 -0.136 AAA
256350018 MIM-RCTC 91 TIFIA Reserve 38377REV3 Agency CMO Government National Mortgage Association 10/20/2039 07/01/2019 33,747.10 34,416.77 --- 34,392.34 353.28 3.500 -0.027 AAA
256350018 MIM-RCTC 91 TIFIA Reserve 3137ABFH9 Agency CMO Freddie Mac 06/25/2021 --- 85,736.92 87,903.36 --- 86,469.97 276.12 3.989 1.251 AAA
256350018 MIM-RCTC 91 TIFIA Reserve 3137AH6C7 Agency CMO Freddie Mac 07/25/2021 06/07/2019 281,078.51 286,052.28 --- 284,108.54 1,829.69 3.230 0.468 AAA
256350018 MIM-RCTC 91 TIFIA Reserve 38376V2E6 Agency CMO Government National Mortgage Association 07/16/2039 08/06/2019 82,512.63 85,864.70 --- 87,626.76 2,393.01 4.000 0.541 AAA
91 CIP STAMP Portfolio by Investment Category for quarter ended December 31, 2020
Page 2 of 38
ATTACHMENT 2
20

Source
Account Account Identifier
Security Type
Category Issuer Final Maturity Trade Date Current Face Value Original Cost
Next Call
Date Base Market Value
Base Net Total
Unrealized
Gain/Loss Coupon Yield
Summarized
Credit Rating
91 CIP STAMP Portfolio by Investment Category for quarter ended December 31, 2020
256350018 MIM-RCTC 91 TIFIA Reserve 38378BSZ3 Agency CMO Government National Mortgage Association 04/16/2040 06/25/2019 70,772.58 70,374.49 --- 71,190.14 655.93 2.141 0.959 AAA
256350018 MIM-RCTC 91 TIFIA Reserve 3137ATRW4 Agency CMO Freddie Mac 05/25/2022 06/28/2019 300,000.00 302,496.09 --- 306,876.00 5,979.54 2.373 0.400 AAA
256350018 MIM-RCTC 91 TIFIA Reserve 3137AUPE3 Agency CMO Freddie Mac 06/25/2022 06/28/2019 200,000.00 201,773.44 --- 205,284.00 4,593.29 2.396 0.321 AAA
256350018 MIM-RCTC 91 TIFIA Reserve 3136A5KR6 Agency CMO Federal National Mortgage Association 10/25/2022 06/10/2019 18,486.60 18,347.95 --- 18,486.42 42.68 1.750 0.817 AAA
256350018 MIM-RCTC 91 TIFIA Reserve 3137AXHP1 Agency CMO Freddie Mac 09/25/2022 06/28/2019 150,000.00 152,232.42 --- 154,527.00 3,466.98 2.573 0.602 AAA
256350018 MIM-RCTC 91 TIFIA Reserve 3137B1UG5 Agency CMO Freddie Mac 01/25/2023 06/25/2019 200,000.00 204,101.56 --- 207,460.00 5,283.03 2.637 0.586 AAA
256350018 MIM-RCTC 91 TIFIA Reserve 38377JZ89 Agency CMO Government National Mortgage Association 10/20/2039 01/28/2020 32,660.48 33,374.92 --- 33,513.57 370.29 3.500 -0.616 AAA
256350018 MIM-RCTC 91 TIFIA Reserve 38378TAF7 Agency CMO Government National Mortgage Association 07/20/2041 07/05/2019 83,410.58 83,566.98 --- 85,973.79 2,469.19 2.500 0.742 AAA
256350018 MIM-RCTC 91 TIFIA Reserve 3136AGFQ0 Agency CMO Federal National Mortgage Association 12/25/2038 06/18/2019 54,309.43 54,994.66 --- 54,749.33 270.45 3.500 0.765 AAA
256350018 MIM-RCTC 91 TIFIA Reserve 38376TTT9 Agency CMO Government National Mortgage Association 11/20/2039 01/29/2020 33,096.59 33,872.29 --- 34,532.65 678.86 3.000 0.528 AAA
256350018 MIM-RCTC 91 TIFIA Reserve 3137B6DF5 Agency CMO Freddie Mac 11/15/2026 06/18/2019 121,274.35 120,014.23 --- 124,250.42 3,919.50 2.000 0.366 AAA
256350018 MIM-RCTC 91 TIFIA Reserve 38378FRB8 Agency CMO Government National Mortgage Association 07/20/2042 12/30/2019 155,758.79 153,471.09 --- 159,475.20 5,879.71 2.000 1.120 AAA
256350018 MIM-RCTC 91 TIFIA Reserve 3137BDKF2 Agency CMO Freddie Mac 09/15/2040 --- 42,951.98 43,852.08 --- 43,919.69 511.86 3.500 0.509 AAA
256350018 MIM-RCTC 91 TIFIA Reserve 38376WA62 Agency CMO Government National Mortgage Association 10/20/2039 12/17/2019 67,582.65 70,898.42 --- 72,086.36 1,420.81 4.000 1.041 AAA
256350018 MIM-RCTC 91 TIFIA Reserve 38377YTL4 Agency CMO Government National Mortgage Association 05/20/2040 06/17/2019 91,399.80 90,285.86 --- 93,066.02 2,655.23 2.000 0.590 AAA
256350018 MIM-RCTC 91 TIFIA Reserve 38378JZD7 Agency CMO Government National Mortgage Association 12/20/2040 10/16/2019 29,282.77 28,916.74 --- 29,630.95 638.68 1.500 0.608 AAA
256350018 MIM-RCTC 91 TIFIA Reserve 38377QKH9 Agency CMO Government National Mortgage Association 08/20/2040 08/20/2019 29,768.97 30,309.70 --- 31,034.45 866.16 3.000 -0.436 AAA
256350018 MIM-RCTC 91 TIFIA Reserve 38378WUY7 Agency CMO Government National Mortgage Association 06/20/2041 06/12/2019 55,924.80 56,012.18 --- 56,418.62 507.50 2.500 -0.064 AAA
256350018 MIM-RCTC 91 TIFIA Reserve 3137B45W2 Agency CMO Freddie Mac 09/15/2030 12/30/2020 124,444.53 125,688.98 --- 126,206.66 517.69 2.750 0.662 AAA
256350018 MIM-RCTC 91 TIFIA Reserve 3137B5A60 Agency CMO Freddie Mac 10/15/2028 02/07/2020 12,562.50 12,680.28 --- 12,972.54 304.20 2.500 0.312 AAA
256350018 MIM-RCTC 91 TIFIA Reserve 3136ADFF1 Agency CMO Federal National Mortgage Association 04/25/2023 06/10/2019 63,745.51 62,829.17 --- 64,108.22 973.00 1.500 0.739 AAA
256350018 MIM-RCTC 91 TIFIA Reserve 3137AS7D0 Agency CMO Freddie Mac 04/15/2039 06/14/2019 36,974.15 36,696.84 --- 37,042.92 158.63 2.000 0.758 AAA
256350018 MIM-RCTC 91 TIFIA Reserve 3137B3HX9 Agency CMO Freddie Mac 07/15/2038 06/20/2019 0.00 0.00 --- (0.00) (0.00) 0.609 0.522 AAA
256350018 MIM-RCTC 91 TIFIA Reserve 3136AGZA3 Agency CMO Federal National Mortgage Association 09/25/2030 06/25/2019 15,046.13 15,146.64 --- 15,316.36 226.18 3.000 0.443 AAA
256350018 MIM-RCTC 91 TIFIA Reserve 38379JM99 Agency CMO Government National Mortgage Association 02/16/2041 08/28/2019 19,418.32 19,543.48 --- 19,636.20 172.82 2.500 -0.121 AAA
256350018 MIM-RCTC 91 TIFIA Reserve 38377RED3 Agency CMO Government National Mortgage Association 12/16/2025 12/11/2019 137,573.09 138,669.38 --- 141,294.45 2,804.77 2.500 0.685 AAA
256350018 MIM-RCTC 91 TIFIA Reserve 38378AU90 Agency CMO Government National Mortgage Association 10/20/2026 04/28/2020 93,683.92 96,377.34 --- 95,879.87 25.15 3.000 0.522 AAA
256350018 MIM-RCTC 91 TIFIA Reserve 38378PZN1 Agency CMO Government National Mortgage Association 03/16/2039 12/30/2020 114,240.64 114,437.00 --- 114,655.33 218.33 2.500 0.214 AAA
256350023 MIM-Sr Lien Reserve Fund-1 31417YKF3 Agency MBS Federal National Mortgage Association 01/01/2030 --- 89,897.74 94,208.64 --- 98,253.73 5,324.29 4.500 0.330 AAA
256350023 MIM-Sr Lien Reserve Fund-1 36202F2H8 Agency MBS Government National Mortgage Association 01/20/2027 --- 94,426.03 97,326.08 --- 99,048.18 2,732.97 3.000 0.500 AAA
256350023 MIM-Sr Lien Reserve Fund-1 36178NB99 Agency MBS Government National Mortgage Association 08/15/2027 10/11/2019 25,945.02 26,232.85 --- 27,050.53 839.91 2.500 0.565 AAA
256350023 MIM-Sr Lien Reserve Fund-1 31418AM39 Agency MBS Federal National Mortgage Association 12/01/2027 09/22/2020 48,642.60 50,785.92 --- 50,843.19 64.41 2.500 0.464 AAA
256350023 MIM-Sr Lien Reserve Fund-1 36179MKL3 Agency MBS Government National Mortgage Association 08/20/2027 05/28/2020 89,093.75 92,824.54 --- 92,277.96 (443.23) 2.500 0.842 AAA
256350023 MIM-Sr Lien Reserve Fund-1 3136AC7J4 Agency MBS Federal National Mortgage Association 03/25/2023 --- 44,213.01 43,618.11 --- 45,917.42 1,961.04 2.532 0.472 AAA
256350023 MIM-Sr Lien Reserve Fund-1 3137B1U75 Agency MBS Freddie Mac 01/25/2023 08/29/2016 338,323.26 351,605.09 --- 347,796.31 6,360.44 2.522 0.421 AAA
256350023 MIM-Sr Lien Reserve Fund-1 38378KWU9 Agency MBS Government National Mortgage Association 11/16/2041 --- 89,526.35 85,070.54 --- 90,210.33 3,193.03 1.400 0.862 AAA
256350023 MIM-Sr Lien Reserve Fund-1 38378KXW4 Agency MBS Government National Mortgage Association 02/16/2037 12/11/2014 64,152.40 63,841.66 --- 64,545.01 489.77 1.705 0.902 AAA
256350023 MIM-Sr Lien Reserve Fund-1 36202F3H7 Agency MBS Government National Mortgage Association 02/20/2027 06/30/2020 58,771.99 61,637.12 --- 61,792.28 243.81 3.000 0.384 AAA
256350023 MIM-Sr Lien Reserve Fund-1 3138X0ZY7 Agency MBS Federal National Mortgage Association 07/01/2028 08/31/2020 40,862.35 42,937.39 --- 42,717.50 (162.09) 2.500 0.612 AAA
256350023 MIM-Sr Lien Reserve Fund-1 3137B1BS0 Agency MBS Freddie Mac 11/25/2022 07/31/2019 360,000.00 363,360.94 --- 371,746.80 10,095.46 2.510 0.583 AAA
256350023 MIM-Sr Lien Reserve Fund-1 3138L1W62 Agency MBS Federal National Mortgage Association 12/01/2022 02/21/2019 160,632.79 159,679.03 --- 160,512.32 547.01 2.500 2.461 AAA
256350023 MIM-Sr Lien Reserve Fund-1 3138EKXL4 Agency MBS Federal National Mortgage Association 03/01/2023 --- 192,176.35 189,444.66 --- 196,950.01 5,005.61 2.325 1.035 AAA
256350023 MIM-Sr Lien Reserve Fund-1 3136AHAE0 Agency MBS Federal National Mortgage Association 04/25/2023 10/28/2016 32,071.72 32,763.27 --- 32,336.64 (116.77) 2.548 1.911 AAA
256350023 MIM-Sr Lien Reserve Fund-1 36179MZV5 Agency MBS Government National Mortgage Association 02/20/2028 04/28/2020 65,016.62 67,800.14 --- 67,996.98 290.24 2.500 0.492 AAA
256350023 MIM-Sr Lien Reserve Fund-1 38378B6A2 Agency MBS Government National Mortgage Association 11/16/2052 01/22/2015 101,427.09 98,229.75 --- 103,530.69 3,569.83 1.826 1.068 AAA
256350023 MIM-Sr Lien Reserve Fund-1 3136A7MN9 Agency MBS Federal National Mortgage Association 05/25/2022 08/29/2016 207,879.80 213,823.87 --- 212,218.25 2,986.95 2.349 0.156 AAA
256350023 MIM-Sr Lien Reserve Fund-1 3137AWQG3 Agency MBS Freddie Mac 04/25/2022 08/19/2020 61,522.66 62,060.98 --- 61,967.46 8.23 1.583 0.394 AAA
256350023 MIM-Sr Lien Reserve Fund-1 38378KSL4 Agency MBS Government National Mortgage Association 12/16/2046 --- 425,000.00 415,829.11 --- 451,133.25 31,674.11 2.798 1.745 AAA
256350023 MIM-Sr Lien Reserve Fund-1 38378KRS0 Agency MBS Government National Mortgage Association 07/16/2043 05/08/2015 450,000.00 434,460.94 --- 465,196.50 20,984.18 2.389 1.134 AAA
256350023 MIM-Sr Lien Reserve Fund-1 38378XP62 Agency MBS Government National Mortgage Association 05/16/2055 05/14/2015 157,589.36 159,534.60 --- 165,431.01 6,235.81 2.500 1.299 AAA
256350023 MIM-Sr Lien Reserve Fund-1 38379KDN5 Agency MBS Government National Mortgage Association 09/16/2055 08/05/2015 66,473.77 64,775.57 --- 70,158.41 3,727.87 2.291 1.509 AAA
256350023 MIM-Sr Lien Reserve Fund-1 36179M4J6 Agency MBS Government National Mortgage Association 03/20/2028 11/20/2019 33,670.58 34,075.68 --- 35,214.72 1,172.00 2.500 0.508 AAA
256350023 MIM-Sr Lien Reserve Fund-1 36179NKP2 Agency MBS Government National Mortgage Association 08/20/2028 04/28/2020 73,160.20 76,292.37 --- 76,518.26 279.50 2.500 0.567 AAA
256350023 MIM-Sr Lien Reserve Fund-1 36202FA30 Agency MBS Government National Mortgage Association 09/20/2024 10/23/2019 25,088.25 26,138.82 --- 26,747.33 852.05 4.500 -0.491 AAA
256350023 MIM-Sr Lien Reserve Fund-1 3128MMUL5 Agency MBS Freddie Mac 02/01/2031 06/22/2020 118,661.31 124,223.55 --- 124,059.21 (279.74) 2.500 0.814 AAA
256350023 MIM-Sr Lien Reserve Fund-1 36179MEK2 Agency MBS Government National Mortgage Association 06/20/2027 04/28/2020 85,225.68 88,874.40 --- 88,943.22 263.37 2.500 0.468 AAA
256350023 MIM-Sr Lien Reserve Fund-1 36179NAJ7 Agency MBS Government National Mortgage Association 04/20/2028 06/30/2020 33,596.04 35,459.57 --- 35,328.92 (74.38) 3.000 0.668 AAA
256350023 MIM-Sr Lien Reserve Fund-1 3138EJPZ5 Agency MBS Federal National Mortgage Association 07/01/2022 08/29/2016 184,587.35 196,059.16 --- 188,461.84 81.62 2.996 1.332 AAA
256350023 MIM-Sr Lien Reserve Fund-1 3137BYPQ7 Agency MBS Freddie Mac 04/25/2024 11/30/2020 226,127.27 241,408.52 --- 241,682.57 641.47 2.905 0.596 AAA
256350023 MIM-Sr Lien Reserve Fund-1 3620ARB67 Agency MBS Government National Mortgage Association 05/15/2025 06/10/2019 67,393.13 69,846.66 --- 71,525.00 2,324.44 4.000 -0.288 AAA
256350023 MIM-Sr Lien Reserve Fund-1 3137BVZ74 Agency MBS Freddie Mac 08/25/2026 07/09/2020 263,444.51 282,122.32 --- 281,827.67 2,010.20 3.045 0.389 AAA
256350023 MIM-Sr Lien Reserve Fund-1 36179TF83 Agency MBS Government National Mortgage Association 09/20/2032 10/26/2020 83,442.40 88,787.93 --- 88,638.36 (388.57) 3.500 1.105 AAA
256350023 MIM-Sr Lien Reserve Fund-1 3137FBAB2 Agency MBS Freddie Mac 08/25/2027 09/22/2020 120,000.00 131,714.06 --- 131,776.80 1,026.32 3.038 -0.246 AAA
256350023 MIM-Sr Lien Reserve Fund-1 3137FBAJ5 Agency MBS Freddie Mac 08/25/2027 06/26/2019 200,000.00 211,593.75 --- 229,026.00 19,525.24 3.281 0.908 AAA
256350023 MIM-Sr Lien Reserve Fund-1 36179MU32 Agency MBS Government National Mortgage Association 12/20/2027 06/22/2020 88,579.76 93,340.92 --- 93,141.61 (157.02) 3.000 0.617 AAA
256350023 MIM-Sr Lien Reserve Fund-1 3138LFGP7 Agency MBS Federal National Mortgage Association 10/01/2028 08/07/2019 274,229.42 283,559.65 --- 301,581.06 18,766.71 2.550 1.164 AAA
256350023 MIM-Sr Lien Reserve Fund-1 3137F4D41 Agency MBS Freddie Mac 01/25/2028 04/01/2019 35,000.00 36,714.84 --- 41,038.55 4,647.81 3.600 1.001 AAA
256350023 MIM-Sr Lien Reserve Fund-1 3128MENS6 Agency MBS Freddie Mac 01/01/2029 10/01/2020 33,927.55 35,507.31 --- 35,470.24 (3.58) 2.500 0.571 AAA
256350023 MIM-Sr Lien Reserve Fund-1 31381QB54 Agency MBS Federal National Mortgage Association 03/01/2021 11/07/2018 125,588.76 128,188.84 --- 125,530.99 (2.35) 4.410 3.300 AAA
256350023 MIM-Sr Lien Reserve Fund-1 3132A9T64 Agency MBS Freddie Mac 10/01/2032 08/14/2020 157,812.88 166,319.98 --- 165,692.48 (1,087.72) 3.000 1.107 AAA
256350023 MIM-Sr Lien Reserve Fund-1 3140JAU97 Agency MBS Federal National Mortgage Association 05/01/2023 05/20/2020 62,659.63 65,146.44 --- 64,351.44 (893.55) 2.614 1.077 AAA
256350023 MIM-Sr Lien Reserve Fund-1 36179RHM4 Agency MBS Government National Mortgage Association 07/20/2030 10/27/2020 77,847.46 82,469.66 --- 82,685.68 171.58 3.500 0.869 AAA
256350023 MIM-Sr Lien Reserve Fund-1 3137FNAD2 Agency MBS Freddie Mac 11/25/2028 08/01/2019 131,744.44 134,373.80 --- 143,464.43 9,690.67 2.631 0.567 AAA
256350023 MIM-Sr Lien Reserve Fund-1 36179MU24 Agency MBS Government National Mortgage Association 12/20/2027 04/28/2020 49,634.05 51,759.00 --- 51,802.06 113.92 2.500 0.549 AAA
Page 3 of 38
21

Source
Account Account Identifier
Security Type
Category Issuer Final Maturity Trade Date Current Face Value Original Cost
Next Call
Date Base Market Value
Base Net Total
Unrealized
Gain/Loss Coupon Yield
Summarized
Credit Rating
91 CIP STAMP Portfolio by Investment Category for quarter ended December 31, 2020
256350023 MIM-Sr Lien Reserve Fund-1 3137FPJF3 Agency MBS Freddie Mac 06/25/2029 01/08/2020 181,459.08 182,281.32 --- 195,277.19 13,176.13 2.258 0.412 AAA
256350023 MIM-Sr Lien Reserve Fund-1 3137FQ3Y7 Agency MBS Freddie Mac 07/25/2029 01/08/2020 181,693.28 181,757.16 --- 194,519.01 12,809.84 2.190 0.664 AAA
256350023 MIM-Sr Lien Reserve Fund-1 3132CJAJ2 Agency MBS Freddie Mac 09/01/2029 01/28/2020 73,531.76 75,617.08 --- 77,119.37 1,625.87 3.000 0.539 AAA
256350023 MIM-Sr Lien Reserve Fund-1 36179NHK7 Agency MBS Government National Mortgage Association 07/20/2028 03/31/2020 157,076.52 163,850.44 --- 165,183.24 1,746.42 3.000 0.715 AAA
256350023 MIM-Sr Lien Reserve Fund-1 36179RFD6 Agency MBS Government National Mortgage Association 06/20/2030 05/01/2020 20,333.92 21,338.09 --- 21,385.99 26.89 3.000 0.999 AAA
256350023 MIM-Sr Lien Reserve Fund-1 36176XE21 Agency MBS Government National Mortgage Association 03/15/2027 06/22/2020 152,028.47 159,297.33 --- 159,493.07 74.81 3.000 0.414 AAA
256350023 MIM-Sr Lien Reserve Fund-1 3620ARZE4 Agency MBS Government National Mortgage Association 02/15/2026 06/22/2020 85,572.67 89,530.40 --- 89,755.46 212.41 3.000 0.136 AAA
256350023 MIM-Sr Lien Reserve Fund-1 3132A85Y1 Agency MBS Freddie Mac 09/01/2032 08/12/2020 226,163.31 238,354.93 --- 236,342.92 (1,977.52) 2.500 0.819 AAA
256350023 MIM-Sr Lien Reserve Fund-1 3137FMD66 Agency MBS Freddie Mac 05/25/2026 08/18/2020 89,886.50 94,549.36 --- 94,588.46 (668.70) 2.283 0.715 AAA
256350023 MIM-Sr Lien Reserve Fund-1 3137FWHY9 Agency MBS Freddie Mac 09/25/2030 09/15/2020 197,208.03 196,221.99 --- 195,013.11 (1,226.06) 0.826 0.999 AAA
256350023 MIM-Sr Lien Reserve Fund-1 3132AEFC5 Agency MBS Freddie Mac 11/01/2030 10/14/2020 431,103.92 464,042.95 --- 467,247.67 3,584.18 3.500 -0.245 AAA
256350023 MIM-Sr Lien Reserve Fund-1 3140J6FU6 Agency MBS Federal National Mortgage Association 10/01/2032 11/03/2020 96,617.73 103,139.42 --- 103,286.29 185.18 3.000 0.447 AAA
256350021 MIM-RCTC 2013 Residual Fund 31381RLL6 Agency MBS Federal National Mortgage Association 07/01/2021 11/02/2018 51,049.81 51,807.59 --- 51,170.28 38.74 3.840 3.024 AAA
256350021 MIM-RCTC 2013 Residual Fund 36202F2H8 Agency MBS Government National Mortgage Association 01/20/2027 12/12/2019 64,514.68 66,107.39 --- 67,672.67 1,735.19 3.000 0.500 AAA
256350021 MIM-RCTC 2013 Residual Fund 36178NB99 Agency MBS Government National Mortgage Association 08/15/2027 10/11/2019 86,483.40 87,442.83 --- 90,168.45 2,799.72 2.500 0.565 AAA
256350021 MIM-RCTC 2013 Residual Fund 3137APP61 Agency MBS Freddie Mac 01/25/2022 09/06/2019 13,438.87 13,658.30 --- 13,719.88 191.83 2.789 0.313 AAA
256350021 MIM-RCTC 2013 Residual Fund 38378KW47 Agency MBS Government National Mortgage Association 08/16/2035 06/13/2019 42,014.98 41,778.64 --- 42,151.10 235.53 2.150 0.827 AAA
256350021 MIM-RCTC 2013 Residual Fund 3132G5AV1 Agency MBS Freddie Mac 07/01/2028 10/11/2019 55,729.27 56,774.20 --- 58,518.52 1,867.34 3.000 0.947 AAA
256350021 MIM-RCTC 2013 Residual Fund 3138L1W62 Agency MBS Federal National Mortgage Association 12/01/2022 02/21/2019 122,836.84 122,107.50 --- 122,744.71 418.30 2.500 2.461 AAA
256350021 MIM-RCTC 2013 Residual Fund 3138EKXL4 Agency MBS Federal National Mortgage Association 03/01/2023 08/21/2019 41,551.64 42,019.10 --- 42,583.79 595.34 2.325 1.035 AAA
256350021 MIM-RCTC 2013 Residual Fund 31381RZ23 Agency MBS Federal National Mortgage Association 08/01/2021 11/02/2018 58,741.69 59,613.64 --- 59,021.89 211.10 3.840 2.467 AAA
256350021 MIM-RCTC 2013 Residual Fund 3137AXHN6 Agency MBS Freddie Mac 02/25/2022 01/25/2018 8,281.80 8,167.93 --- 8,318.65 71.91 1.749 0.452 AAA
256350021 MIM-RCTC 2013 Residual Fund 3136AMM48 Agency MBS Federal National Mortgage Association 07/25/2022 08/01/2019 322,612.01 324,426.70 --- 327,131.80 3,843.85 2.509 0.803 AAA
256350021 MIM-RCTC 2013 Residual Fund 3137AWQG3 Agency MBS Freddie Mac 04/25/2022 --- 25,634.44 25,157.80 --- 25,819.78 384.83 1.583 0.394 AAA
256350021 MIM-RCTC 2013 Residual Fund 31397UPF0 Agency MBS Federal National Mortgage Association 06/25/2021 03/15/2019 62,646.08 63,546.61 --- 63,081.47 370.25 3.763 0.294 AAA
256350021 MIM-RCTC 2013 Residual Fund 36179M4J6 Agency MBS Government National Mortgage Association 03/20/2028 11/20/2019 112,235.28 113,585.61 --- 117,382.38 3,906.66 2.500 0.508 AAA
256350021 MIM-RCTC 2013 Residual Fund 3137B1UF7 Agency MBS Freddie Mac 09/25/2022 01/25/2018 8,061.34 7,942.94 --- 8,138.73 127.21 1.785 0.424 AAA
256350021 MIM-RCTC 2013 Residual Fund 36179Q2A8 Agency MBS Government National Mortgage Association 02/20/2030 04/30/2020 286,206.67 302,663.56 --- 301,890.80 (773.04) 3.000 0.857 AAA
256350021 MIM-RCTC 2013 Residual Fund 3620ARB67 Agency MBS Government National Mortgage Association 05/15/2025 06/10/2019 44,142.50 45,749.56 --- 46,848.87 1,522.51 4.000 -0.288 AAA
256350021 MIM-RCTC 2013 Residual Fund 31418CQM9 Agency MBS Federal National Mortgage Association 10/01/2027 --- 99,472.77 103,770.94 --- 104,384.74 808.32 3.000 0.490 AAA
256350021 MIM-RCTC 2013 Residual Fund 3140J6DU8 Agency MBS Federal National Mortgage Association 08/01/2031 07/26/2019 150,990.47 152,004.94 --- 157,765.41 5,920.64 2.500 0.572 AAA
256350021 MIM-RCTC 2013 Residual Fund 3138L2GH4 Agency MBS Federal National Mortgage Association 07/01/2021 --- 121,059.43 118,496.06 --- 121,162.33 740.06 1.870 1.526 AAA
256350021 MIM-RCTC 2013 Residual Fund 31381QB54 Agency MBS Federal National Mortgage Association 03/01/2021 11/07/2018 96,284.72 98,278.12 --- 96,240.43 (1.80) 4.410 3.300 AAA
256350021 MIM-RCTC 2013 Residual Fund 3137BFE80 Agency MBS Freddie Mac 08/25/2024 07/15/2020 291,499.82 304,389.57 --- 303,999.33 1,122.44 2.720 0.273 AAA
256350021 MIM-RCTC 2013 Residual Fund 3622A2GC0 Agency MBS Government National Mortgage Association 03/15/2028 04/30/2020 200,671.85 208,761.43 --- 209,194.38 701.80 2.500 0.552 AAA
256350021 MIM-RCTC 2013 Residual Fund 36179RFD6 Agency MBS Government National Mortgage Association 06/20/2030 05/01/2020 54,223.77 56,901.07 --- 57,029.31 72.22 3.000 0.999 AAA
256350021 MIM-RCTC 2013 Residual Fund 3137BJP56 Agency MBS Freddie Mac 01/25/2025 07/23/2020 43,422.29 45,276.22 --- 45,153.97 62.93 2.697 0.509 AAA
256350021 MIM-RCTC 2013 Residual Fund 3132A85Y1 Agency MBS Freddie Mac 09/01/2032 08/12/2020 306,714.63 323,248.46 --- 320,519.85 (2,681.84) 2.500 0.819 AAA
256350021 MIM-RCTC 2013 Residual Fund 3140J8ME0 Agency MBS Federal National Mortgage Association 12/01/2032 12/30/2020 99,966.95 106,652.25 --- 106,761.70 109.45 3.000 0.458 AAA
256350021 MIM-RCTC 2013 Residual Fund 3132AEFC5 Agency MBS Freddie Mac 11/01/2030 10/14/2020 179,909.50 193,655.73 --- 194,993.12 1,495.75 3.500 -0.245 AAA
256350021 MIM-RCTC 2013 Residual Fund 3140J7Q32 Agency MBS Federal National Mortgage Association 10/01/2031 10/20/2020 46,393.05 49,959.52 --- 50,750.29 778.23 3.500 -0.526 AAA
256350018 MIM-RCTC 91 TIFIA Reserve 3620AFYR2 Agency MBS Government National Mortgage Association 12/15/2024 06/12/2019 65,711.17 67,849.35 --- 69,747.81 2,482.28 4.000 -0.491 AAA
256350018 MIM-RCTC 91 TIFIA Reserve 36297GCD0 Agency MBS Government National Mortgage Association 02/15/2025 06/12/2019 70,659.76 73,632.45 --- 74,000.55 1,307.10 4.500 1.110 AAA
256350018 MIM-RCTC 91 TIFIA Reserve 31417YKF3 Agency MBS Federal National Mortgage Association 01/01/2030 --- 51,171.88 55,930.17 --- 55,928.31 169.43 4.500 0.330 AAA
256350018 MIM-RCTC 91 TIFIA Reserve 36202F2H8 Agency MBS Government National Mortgage Association 01/20/2027 12/12/2019 146,624.27 150,244.06 --- 153,801.53 3,943.62 3.000 0.500 AAA
256350018 MIM-RCTC 91 TIFIA Reserve 36178NB99 Agency MBS Government National Mortgage Association 08/15/2027 10/11/2019 34,593.36 34,977.13 --- 36,067.38 1,119.88 2.500 0.565 AAA
256350018 MIM-RCTC 91 TIFIA Reserve 3138EJRP5 Agency MBS Federal National Mortgage Association 06/01/2021 06/18/2019 57,330.57 59,060.03 --- 57,311.08 (436.91) 4.379 3.934 AAA
256350018 MIM-RCTC 91 TIFIA Reserve 31418AM39 Agency MBS Federal National Mortgage Association 12/01/2027 09/22/2020 52,613.42 54,931.71 --- 54,993.65 69.66 2.500 0.464 AAA
256350018 MIM-RCTC 91 TIFIA Reserve 3137B1U75 Agency MBS Freddie Mac 01/25/2023 06/27/2019 333,871.64 337,092.98 --- 343,220.04 7,893.04 2.522 0.421 AAA
256350018 MIM-RCTC 91 TIFIA Reserve 38378KWU9 Agency MBS Government National Mortgage Association 11/16/2041 --- 54,936.63 52,527.11 --- 55,356.34 2,303.09 1.400 0.862 AAA
256350018 MIM-RCTC 91 TIFIA Reserve 38378KW47 Agency MBS Government National Mortgage Association 08/16/2035 06/13/2019 108,713.75 108,102.24 --- 109,065.98 609.43 2.150 0.827 AAA
256350018 MIM-RCTC 91 TIFIA Reserve 3138X0ZY7 Agency MBS Federal National Mortgage Association 07/01/2028 08/31/2020 44,948.59 47,231.13 --- 46,989.25 (178.29) 2.500 0.612 AAA
256350018 MIM-RCTC 91 TIFIA Reserve 3137B1BS0 Agency MBS Freddie Mac 11/25/2022 --- 645,000.00 652,086.14 --- 666,046.35 17,542.99 2.510 0.583 AAA
256350018 MIM-RCTC 91 TIFIA Reserve 3137B7YX1 Agency MBS Freddie Mac 04/25/2023 12/23/2020 164,154.19 168,232.40 --- 168,253.12 (100.02) 2.592 0.142 AAA
256350018 MIM-RCTC 91 TIFIA Reserve 3138EKXL4 Agency MBS Federal National Mortgage Association 03/01/2023 08/21/2019 38,954.67 39,392.91 --- 39,922.30 558.13 2.325 1.035 AAA
256350018 MIM-RCTC 91 TIFIA Reserve 3136AHAE0 Agency MBS Federal National Mortgage Association 04/25/2023 06/28/2019 38,360.30 38,714.36 --- 38,677.15 (118.96) 2.548 1.911 AAA
256350018 MIM-RCTC 91 TIFIA Reserve 36179MZV5 Agency MBS Government National Mortgage Association 02/20/2028 04/28/2020 70,526.50 73,545.92 --- 73,759.43 314.83 2.500 0.492 AAA
256350018 MIM-RCTC 91 TIFIA Reserve 3136A7MN9 Agency MBS Federal National Mortgage Association 05/25/2022 08/22/2019 114,333.88 115,258.38 --- 116,720.03 1,845.82 2.349 0.156 AAA
256350018 MIM-RCTC 91 TIFIA Reserve 3137AWQG3 Agency MBS Freddie Mac 04/25/2022 06/07/2019 164,060.42 162,240.37 --- 165,246.57 2,166.91 1.583 0.394 AAA
256350018 MIM-RCTC 91 TIFIA Reserve 31397UPF0 Agency MBS Federal National Mortgage Association 06/25/2021 06/10/2019 125,292.15 127,347.72 --- 126,162.93 631.02 3.763 0.294 AAA
256350018 MIM-RCTC 91 TIFIA Reserve 3137BJQ71 Agency MBS Freddie Mac 05/25/2025 10/30/2019 200,000.00 206,296.88 --- 215,986.00 11,014.76 2.770 0.874 AAA
256350018 MIM-RCTC 91 TIFIA Reserve 3137BLAC2 Agency MBS Freddie Mac 06/25/2025 --- 150,000.00 159,648.05 --- 166,992.00 9,293.28 3.284 0.577 AAA
256350018 MIM-RCTC 91 TIFIA Reserve 36179M4J6 Agency MBS Government National Mortgage Association 03/20/2028 11/20/2019 134,682.33 136,302.73 --- 140,858.86 4,688.00 2.500 0.508 AAA
256350018 MIM-RCTC 91 TIFIA Reserve 36179NKP2 Agency MBS Government National Mortgage Association 08/20/2028 04/28/2020 73,160.20 76,292.37 --- 76,518.26 279.50 2.500 0.567 AAA
256350018 MIM-RCTC 91 TIFIA Reserve 36202FA30 Agency MBS Government National Mortgage Association 09/20/2024 10/23/2019 27,269.83 28,411.76 --- 29,073.19 926.13 4.500 -0.491 AAA
256350018 MIM-RCTC 91 TIFIA Reserve 3128MMUL5 Agency MBS Freddie Mac 02/01/2031 06/22/2020 122,616.68 128,364.34 --- 128,194.52 (289.07) 2.500 0.814 AAA
256350018 MIM-RCTC 91 TIFIA Reserve 3137BM6P6 Agency MBS Freddie Mac 08/25/2022 06/28/2019 200,000.00 205,437.50 --- 206,626.00 4,106.07 3.090 0.662 AAA
256350018 MIM-RCTC 91 TIFIA Reserve 36179MEK2 Agency MBS Government National Mortgage Association 06/20/2027 04/28/2020 92,327.81 96,280.60 --- 96,355.15 285.31 2.500 0.468 AAA
256350018 MIM-RCTC 91 TIFIA Reserve 36179NAJ7 Agency MBS Government National Mortgage Association 04/20/2028 06/30/2020 36,320.04 38,334.67 --- 38,193.43 (80.40) 3.000 0.668 AAA
256350018 MIM-RCTC 91 TIFIA Reserve 3138EJPZ5 Agency MBS Federal National Mortgage Association 07/01/2022 07/22/2019 207,660.77 211,448.95 --- 212,019.57 1,565.74 2.996 1.332 AAA
256350018 MIM-RCTC 91 TIFIA Reserve 3137BSRZ8 Agency MBS Freddie Mac 09/25/2022 06/28/2019 87,058.33 88,775.69 --- 89,804.15 1,258.46 2.838 0.656 AAA
256350018 MIM-RCTC 91 TIFIA Reserve 3138L2QG5 Agency MBS Federal National Mortgage Association 01/01/2028 09/09/2019 253,268.51 268,751.54 --- 282,341.20 14,253.51 3.010 1.336 AAA
256350018 MIM-RCTC 91 TIFIA Reserve 3137BYPQ7 Agency MBS Freddie Mac 04/25/2024 11/30/2020 226,127.27 241,408.53 --- 241,682.57 641.46 2.905 0.596 AAA
256350018 MIM-RCTC 91 TIFIA Reserve 3620ARB67 Agency MBS Government National Mortgage Association 05/15/2025 06/10/2019 134,786.26 139,693.33 --- 143,050.01 4,648.88 4.000 -0.288 AAA
Page 4 of 38
22

Source
Account Account Identifier
Security Type
Category Issuer Final Maturity Trade Date Current Face Value Original Cost
Next Call
Date Base Market Value
Base Net Total
Unrealized
Gain/Loss Coupon Yield
Summarized
Credit Rating
91 CIP STAMP Portfolio by Investment Category for quarter ended December 31, 2020
256350018 MIM-RCTC 91 TIFIA Reserve 3137BVZ74 Agency MBS Freddie Mac 08/25/2026 07/09/2020 307,351.93 329,142.71 --- 328,798.95 2,345.23 3.045 0.389 AAA
256350018 MIM-RCTC 91 TIFIA Reserve 36179TF83 Agency MBS Government National Mortgage Association 09/20/2032 10/26/2020 93,872.69 99,886.42 --- 99,718.15 (437.16) 3.500 1.105 AAA
256350018 MIM-RCTC 91 TIFIA Reserve 3137FBAB2 Agency MBS Freddie Mac 08/25/2027 09/22/2020 130,000.00 142,690.23 --- 142,758.20 1,111.85 3.038 -0.246 AAA
256350018 MIM-RCTC 91 TIFIA Reserve 38378NWU3 Agency MBS Government National Mortgage Association 06/16/2048 06/27/2019 0.00 0.00 --- (0.00) (0.00) 2.682 1.133 AAA
256350018 MIM-RCTC 91 TIFIA Reserve 3137FBAJ5 Agency MBS Freddie Mac 08/25/2027 06/26/2019 200,000.00 211,593.75 --- 229,026.00 19,525.24 3.281 0.908 AAA
256350018 MIM-RCTC 91 TIFIA Reserve 36179MU32 Agency MBS Government National Mortgage Association 12/20/2027 06/22/2020 95,961.41 101,119.33 --- 100,903.42 (170.10) 3.000 0.617 AAA
256350018 MIM-RCTC 91 TIFIA Reserve 3138LFGP7 Agency MBS Federal National Mortgage Association 10/01/2028 08/07/2019 299,159.37 309,337.80 --- 328,997.52 20,472.78 2.550 1.164 AAA
256350018 MIM-RCTC 91 TIFIA Reserve 3620C4SU5 Agency MBS Government National Mortgage Association 09/15/2025 06/12/2019 66,925.47 69,401.19 --- 71,025.32 2,249.84 4.000 0.085 AAA
256350018 MIM-RCTC 91 TIFIA Reserve 3137F4D41 Agency MBS Freddie Mac 01/25/2028 06/27/2019 150,000.00 163,248.05 --- 175,879.50 14,841.39 3.600 1.001 AAA
256350018 MIM-RCTC 91 TIFIA Reserve 3137F4CY6 Agency MBS Freddie Mac 09/25/2024 06/28/2019 190,000.00 195,907.81 --- 203,503.30 9,365.24 2.920 0.861 AAA
256350018 MIM-RCTC 91 TIFIA Reserve 3128MENS6 Agency MBS Freddie Mac 01/01/2029 10/01/2020 42,409.45 44,384.12 --- 44,337.81 (4.46) 2.500 0.571 AAA
256350018 MIM-RCTC 91 TIFIA Reserve 3137BP4K2 Agency MBS Freddie Mac 03/25/2026 09/09/2019 200,000.00 210,125.00 --- 220,142.00 12,033.59 2.849 0.815 AAA
256350018 MIM-RCTC 91 TIFIA Reserve 3620A9T35 Agency MBS Government National Mortgage Association 11/15/2024 06/13/2019 109,031.08 112,583.11 --- 115,722.32 4,086.01 4.000 -0.632 AAA
256350018 MIM-RCTC 91 TIFIA Reserve 3137FL6P4 Agency MBS Freddie Mac 01/25/2029 09/09/2019 275,000.00 307,108.40 --- 325,578.00 22,694.40 3.563 1.115 AAA
256350018 MIM-RCTC 91 TIFIA Reserve 3132A9T64 Agency MBS Freddie Mac 10/01/2032 08/14/2020 169,952.34 179,113.83 --- 178,438.06 (1,171.39) 3.000 1.107 AAA
256350018 MIM-RCTC 91 TIFIA Reserve 3140JAU97 Agency MBS Federal National Mortgage Association 05/01/2023 05/20/2020 68,355.96 71,068.84 --- 70,201.57 (974.78) 2.614 1.077 AAA
256350018 MIM-RCTC 91 TIFIA Reserve 31419AM53 Agency MBS Federal National Mortgage Association 08/01/2024 06/28/2019 49,753.09 51,587.73 --- 51,197.42 491.74 5.500 0.745 AAA
256350018 MIM-RCTC 91 TIFIA Reserve 36179RHM4 Agency MBS Government National Mortgage Association 07/20/2030 10/27/2020 90,822.04 96,214.60 --- 96,466.63 200.19 3.500 0.869 AAA
256350018 MIM-RCTC 91 TIFIA Reserve 3137FNAD2 Agency MBS Freddie Mac 11/25/2028 08/01/2019 146,382.71 149,304.22 --- 159,404.92 10,767.42 2.631 0.567 AAA
256350018 MIM-RCTC 91 TIFIA Reserve 36179MU24 Agency MBS Government National Mortgage Association 12/20/2027 04/28/2020 53,770.22 56,072.26 --- 56,118.90 123.41 2.500 0.549 AAA
256350018 MIM-RCTC 91 TIFIA Reserve 3137FPJF3 Agency MBS Freddie Mac 06/25/2029 01/08/2020 196,171.98 197,060.88 --- 211,110.48 14,244.47 2.258 0.412 AAA
256350018 MIM-RCTC 91 TIFIA Reserve 3137FQ3Y7 Agency MBS Freddie Mac 07/25/2029 01/08/2020 196,425.17 196,494.22 --- 210,290.82 13,848.48 2.190 0.664 AAA
256350018 MIM-RCTC 91 TIFIA Reserve 3132CJAJ2 Agency MBS Freddie Mac 09/01/2029 01/28/2020 79,925.82 82,192.48 --- 83,825.41 1,767.26 3.000 0.539 AAA
256350018 MIM-RCTC 91 TIFIA Reserve 36179RFD6 Agency MBS Government National Mortgage Association 06/20/2030 05/01/2020 20,333.92 21,337.90 --- 21,385.99 27.09 3.000 0.999 AAA
256350018 MIM-RCTC 91 TIFIA Reserve 36176XE21 Agency MBS Government National Mortgage Association 03/15/2027 06/22/2020 165,330.95 173,235.85 --- 173,448.70 81.34 3.000 0.414 AAA
256350018 MIM-RCTC 91 TIFIA Reserve 3620ARZE4 Agency MBS Government National Mortgage Association 02/15/2026 06/22/2020 94,580.31 98,954.65 --- 99,203.39 234.77 3.000 0.136 AAA
256350018 MIM-RCTC 91 TIFIA Reserve 3132A85Y1 Agency MBS Freddie Mac 09/01/2032 08/12/2020 244,752.07 257,945.75 --- 255,768.36 (2,140.07) 2.500 0.819 AAA
256350018 MIM-RCTC 91 TIFIA Reserve 3137FMD66 Agency MBS Freddie Mac 05/25/2026 08/18/2020 89,886.50 94,549.36 --- 94,588.46 (668.70) 2.283 0.715 AAA
256350018 MIM-RCTC 91 TIFIA Reserve 3137FWHY9 Agency MBS Freddie Mac 09/25/2030 09/15/2020 197,208.03 196,221.99 --- 195,013.11 (1,226.06) 0.826 0.999 AAA
256350018 MIM-RCTC 91 TIFIA Reserve 3132AEFC5 Agency MBS Freddie Mac 11/01/2030 10/14/2020 465,049.10 500,581.76 --- 504,038.82 3,866.40 3.500 -0.245 AAA
256350018 MIM-RCTC 91 TIFIA Reserve 3140J6FU6 Agency MBS Federal National Mortgage Association 10/01/2032 11/03/2020 106,279.50 113,453.37 --- 113,614.91 203.69 3.000 0.447 AAA
256350021 MIM-RCTC 2013 Residual Fund 17305EFM2 Asset Backed Citibank Credit Card Issuance Trust - 2014-A1 01/23/2023 12/11/2019 200,000.00 202,210.16 --- 200,264.00 154.63 2.880 0.474 AAA
256350021 MIM-RCTC 2013 Residual Fund 87165LBB6 Asset Backed Synchrony Credit Card Master Note Trust 2016-2 05/17/2021 08/02/2019 160,000.00 160,387.50 --- 161,124.80 1,041.68 2.210 0.345 AAA
256350021 MIM-RCTC 2013 Residual Fund 65478HAD0 Asset Backed Nissan Auto Receivables 2017-C Owner Trust 04/18/2022 09/25/2018 11,343.69 11,166.89 --- 11,372.96 47.58 2.120 0.448 AAA
256350021 MIM-RCTC 2013 Residual Fund 17305EGK5 Asset Backed Citibank Credit Card Issuance Trust 01/20/2021 07/19/2019 100,000.00 100,625.00 --- 100,123.00 101.14 2.490 0.150 AAA
256350021 MIM-RCTC 2013 Residual Fund 65478DAD9 Asset Backed Nissan Auto Receivables 2018-A Owner Trust 05/16/2022 06/29/2018 19,309.70 19,210.13 --- 19,385.01 86.78 2.650 0.834 AAA
256350021 MIM-RCTC 2013 Residual Fund 12596EAC8 Asset Backed CNH Equipment Trust 2018-B 11/15/2023 12/05/2019 134,332.54 136,525.94 --- 136,898.29 1,457.70 3.190 0.536 AAA
256350021 MIM-RCTC 2013 Residual Fund 38013FAD3 Asset Backed GM Financial Consumer Automobile Receivables Trust 2018-4 10/16/2023 07/24/2019 50,150.85 51,069.63 --- 51,095.19 609.62 3.210 0.090 AAA
256350021 MIM-RCTC 2013 Residual Fund 31680YAB3 Asset Backed Fifth Third Auto Trust 2019-1 05/16/2022 04/30/2019 1,189.73 1,189.66 --- 1,190.79 1.06 2.660 0.346 AAA
256350021 MIM-RCTC 2013 Residual Fund 65478LAB5 Asset Backed Nissan Auto Lease Trust 2019-B 10/15/2021 07/16/2019 11,642.79 11,641.77 --- 11,654.90 12.19 2.270 0.162 AAA
256350021 MIM-RCTC 2013 Residual Fund 477870AB5 Asset Backed John Deere Owner Trust 2019-B 05/16/2022 07/16/2019 20,781.08 20,781.00 --- 20,823.26 42.19 2.280 0.438 AAA
256350021 MIM-RCTC 2013 Residual Fund 14315PAB1 Asset Backed Carmax Auto Owner Trust 2019-3 12/15/2022 07/24/2019 40,746.83 40,745.00 --- 40,934.27 187.89 2.210 0.563 AAA
256350021 MIM-RCTC 2013 Residual Fund 14041NFU0 Asset Backed Capital One Multi-Asset Execution Trust, Series 2019-2 09/15/2022 03/13/2020 100,000.00 100,312.50 --- 102,427.00 2,212.16 1.720 0.293 AAA
256350021 MIM-RCTC 2013 Residual Fund 26209AAE1 Asset Backed Drive Auto Receivables Trust 2019-4 01/16/2024 09/09/2019 80,000.00 79,989.10 --- 80,820.80 825.16 2.230 1.001 AAA
256350021 MIM-RCTC 2013 Residual Fund 14315XAC2 Asset Backed Carmax Auto Owner Trust 2020-1 12/16/2024 01/14/2020 60,000.00 59,988.23 --- 61,551.60 1,559.65 1.890 0.573 AAA
256350021 MIM-RCTC 2013 Residual Fund 34528QHK3 Asset Backed Ford Credit Floorplan Master Owner Trust A, Series 2020-1 09/15/2025 09/15/2020 225,000.00 224,986.86 --- 226,593.00 1,604.90 0.700 0.437 AAA
256350021 MIM-RCTC 2013 Residual Fund 362569AH8 Asset Backed GM Financial Automobile Leasing Trust 2020-3 10/20/2021 09/22/2020 282,003.71 282,003.71 --- 282,003.71 0.00 0.178 0.185 AAA
256350021 MIM-RCTC 2013 Residual Fund 43813KAA0 Asset Backed Honda Auto Receivables 2020-3 Owner Trust 10/18/2021 09/22/2020 338,938.83 338,938.83 --- 338,938.83 0.00 0.189 0.190 AAA
256350021 MIM-RCTC 2013 Residual Fund 65602VS72 CD NORINCHUKIN BANK (NEW YORK BRANCH) 01/27/2021 11/02/2020 450,000.00 450,063.51 --- 450,054.00 34.57 0.300 0.140 AAA
256350021 MIM-RCTC 2013 Residual Fund 637432MV4 Corporate National Rural Utilities Cooperative Finance Corporation 11/15/2023 12/23/2020 165,000.00 178,234.65 08/15/2023 177,969.00 (210.38) 3.400 0.385 A
256350021 MIM-RCTC 2013 Residual Fund 172967LC3 Corporate Citigroup Inc. 12/08/2021 --- 450,000.00 449,617.50 11/08/2021 459,724.50 9,860.27 2.900 0.360 A
256350021 MIM-RCTC 2013 Residual Fund 61746BEE2 Corporate Morgan Stanley 01/20/2022 06/12/2020 200,000.00 200,870.00 01/20/2021 200,102.00 25.63 1.398 0.479 A
256350021 MIM-RCTC 2013 Residual Fund 0258M0EH8 Corporate American Express Credit Corporation 03/03/2022 06/12/2020 270,000.00 270,459.00 01/31/2022 271,674.00 1,368.77 0.932 0.394 A
256350021 MIM-RCTC 2013 Residual Fund 95000U2B8 Corporate Wells Fargo & Company 07/22/2022 --- 485,000.00 498,441.60 --- 502,033.20 5,164.89 2.625 0.363 A
256350021 MIM-RCTC 2013 Residual Fund 06051GHC6 Corporate Bank of America Corporation 12/20/2023 10/09/2020 185,000.00 194,412.80 12/20/2022 194,714.35 1,227.37 3.004 0.327 A
256350021 MIM-RCTC 2013 Residual Fund 46647PAY2 Corporate JPMorgan Chase & Co. 12/05/2024 11/05/2020 245,000.00 270,261.95 12/05/2023 269,899.35 830.06 4.023 0.521 A
256350021 MIM-RCTC 2013 Residual Fund 14913Q2X6 Corporate Caterpillar Financial Services Corporation 05/17/2021 05/14/2019 120,000.00 120,000.00 --- 120,159.60 159.60 0.612 0.317 A
256350021 MIM-RCTC 2013 Residual Fund 86787EBD8 Corporate Truist Bank 05/17/2022 05/14/2019 50,000.00 50,000.00 04/17/2022 50,304.00 304.00 0.812 0.385 A
256350021 MIM-RCTC 2013 Residual Fund 025816CD9 Corporate American Express Company 05/20/2022 12/30/2020 150,000.00 154,734.00 04/19/2022 154,747.50 13.50 2.750 0.309 A
256350021 MIM-RCTC 2013 Residual Fund 025816CE7 Corporate American Express Company 05/20/2022 05/15/2019 100,000.00 100,000.00 04/19/2022 100,635.00 635.00 0.844 0.396 A
256350021 MIM-RCTC 2013 Residual Fund 05531FBJ1 Corporate Truist Financial Corporation 03/16/2023 09/09/2019 165,000.00 164,877.90 02/13/2023 171,279.90 6,357.88 2.200 0.393 A
256350021 MIM-RCTC 2013 Residual Fund 17308CC46 Corporate Citigroup Inc. 11/04/2022 10/28/2019 195,000.00 195,000.00 11/04/2021 198,116.10 3,116.10 2.312 0.414 A
256350021 MIM-RCTC 2013 Residual Fund 69353RFU7 Corporate PNC Bank, National Association 02/24/2023 02/20/2020 250,000.00 250,000.00 02/24/2022 250,452.50 452.50 0.530 0.426 A
256350021 MIM-RCTC 2013 Residual Fund 14913R2D8 Corporate Caterpillar Financial Services Corporation 07/07/2023 07/06/2020 200,000.00 199,888.00 --- 201,676.00 1,770.18 0.650 0.315 A
256350021 MIM-RCTC 2013 Residual Fund 438516CC8 Corporate Honeywell International Inc. 08/19/2022 08/17/2020 265,000.00 265,000.00 08/19/2021 265,424.00 424.00 0.483 0.230 A
256350021 MIM-RCTC 2013 Residual Fund 06051GJH3 Corporate Bank of America Corporation 10/24/2024 11/05/2020 205,000.00 205,604.75 10/24/2023 206,914.70 1,339.56 0.810 0.591 A
256350021 MIM-RCTC 2013 Residual Fund 6174468T9 Corporate Morgan Stanley 11/10/2023 11/09/2020 380,000.00 380,000.00 11/10/2022 380,881.60 881.60 0.560 0.512 A
256350021 MIM-RCTC 2013 Residual Fund 38141GXL3 Corporate The Goldman Sachs Group, Inc. 11/17/2023 --- 485,000.00 486,140.00 11/17/2022 486,964.25 824.25 0.627 0.509 A
256350021 MIM-RCTC 2013 Residual Fund 863667BB6 Corporate Stryker Corporation 12/01/2023 11/18/2020 160,000.00 159,860.80 12/01/2021 160,252.80 387.10 0.600 0.427 A
256350021 MIM-RCTC 2013 Residual Fund CCYUSD Currency UNITED STATES OF AMERICA 12/31/2020 --- 0.00 (1,125,143.21) --- (1,125,143.21) 0.00 0.000 0.000 AAA
256350018 MIM-RCTC 91 TIFIA Reserve CCYUSD Currency UNITED STATES OF AMERICA 12/31/2020 --- 0.00 0.01 --- 0.01 0.00 0.000 0.000 AAA
256350018 MIM-RCTC 91 TIFIA Reserve CCYUSD Currency UNITED STATES OF AMERICA 12/31/2020 --- 0.00 (240,195.73) --- (240,195.73) 0.00 0.000 0.000 AAA
256350023 MIM-Sr Lien Reserve Fund-1 31846V401 MM Fund First American Funds, Inc. - Government Obligations Fund 12/31/2020 --- 0.00 123,176.02 --- 123,176.02 0.00 0.010 0.010 AAA
256350021 MIM-RCTC 2013 Residual Fund 31846V401 MM Fund First American Funds, Inc. - Government Obligations Fund 12/31/2020 --- 0.00 1,146,183.68 --- 1,146,183.68 0.00 0.010 0.010 AAA
Page 5 of 38
23

Source
Account Account Identifier
Security Type
Category Issuer Final Maturity Trade Date Current Face Value Original Cost
Next Call
Date Base Market Value
Base Net Total
Unrealized
Gain/Loss Coupon Yield
Summarized
Credit Rating
91 CIP STAMP Portfolio by Investment Category for quarter ended December 31, 2020
256350018 MIM-RCTC 91 TIFIA Reserve 31846V401 MM Fund First American Funds, Inc. - Government Obligations Fund 12/31/2020 --- 0.00 310,684.49 --- 310,684.49 0.00 0.010 0.010 AAA
256350021 MIM-RCTC 2013 Residual Fund 64971QWL3 Muni New York City Transitional Finance Authority 08/01/2023 07/07/2020 155,000.00 168,936.50 --- 163,512.60 184.84 2.710 0.565 AAA
256350021 MIM-RCTC 2013 Residual Fund 072024WW8 Muni Bay Area Toll Authority 04/01/2022 09/20/2019 95,000.00 95,000.00 --- 97,004.50 2,004.50 2.128 0.433 AA
256350021 MIM-RCTC 2013 Residual Fund 783186TZ2 Muni Rutgers, The State University of New Jersey 05/01/2022 10/18/2019 105,000.00 105,000.00 --- 106,564.50 1,564.50 2.057 0.930 AA
256350021 MIM-RCTC 2013 Residual Fund 283062DK0 Muni El Dorado Irrigation District 03/01/2022 06/16/2020 155,000.00 155,000.00 --- 155,754.85 754.85 0.739 0.320 AA
256350021 MIM-RCTC 2013 Residual Fund 650036AS5 Muni The New York State Urban Development Corporation 03/15/2024 06/18/2020 180,000.00 180,000.00 --- 181,443.60 1,443.60 0.965 0.711 AA
256350021 MIM-RCTC 2013 Residual Fund 194740PF7 Muni Collin County Texas 02/15/2024 06/25/2020 175,000.00 175,000.00 --- 176,842.75 1,842.75 0.867 0.526 AAA
256350021 MIM-RCTC 2013 Residual Fund 916544ES4 Muni Upper Santa Clara Valley Joint Powers Authority 08/01/2023 07/16/2020 170,000.00 170,000.00 --- 170,578.00 578.00 0.680 0.547 AA
256350021 MIM-RCTC 2013 Residual Fund 4581X0CZ9 Non-US Gov Inter-American Development Bank 09/14/2022 09/30/2019 650,000.00 652,067.00 --- 667,387.50 16,184.11 1.750 0.176 AAA
256350023 MIM-Sr Lien Reserve Fund-1 9128285W6 TIPS United States Department of The Treasury 01/15/2029 08/26/2019 128,902.50 139,076.12 --- 151,473.33 13,854.51 0.875 -1.193 AAA
256350021 MIM-RCTC 2013 Residual Fund 9128286N5 TIPS United States Department of The Treasury 04/15/2024 --- 253,975.32 258,722.97 --- 272,231.07 14,891.37 0.500 -1.623 AAA
256350018 MIM-RCTC 91 TIFIA Reserve 9128285W6 TIPS United States Department of The Treasury 01/15/2029 --- 154,683.00 163,583.78 --- 181,767.99 19,500.39 0.875 -1.193 AAA
256350023 MIM-Sr Lien Reserve Fund-1 912828G38 US Gov United States Department of The Treasury 11/15/2024 04/18/2017 1,350,000.00 1,369,037.11 --- 1,454,314.50 94,213.74 2.250 0.244 AAA
256350023 MIM-Sr Lien Reserve Fund-1 912828XB1 US Gov United States Department of The Treasury 05/15/2025 --- 1,250,000.00 1,278,552.74 --- 1,349,125.00 80,984.96 2.125 0.298 AAA
256350023 MIM-Sr Lien Reserve Fund-1 912828L57 US Gov United States Department of The Treasury 09/30/2022 07/14/2017 225,000.00 223,198.24 --- 231,354.00 6,976.88 1.750 0.131 AAA
256350023 MIM-Sr Lien Reserve Fund-1 912828YK0 US Gov United States Department of The Treasury 10/15/2022 --- 670,000.00 664,428.32 --- 684,920.90 18,455.05 1.375 0.128 AAA
256350023 MIM-Sr Lien Reserve Fund-1 91282CAE1 US Gov United States Department of The Treasury 08/15/2030 12/04/2020 90,000.00 87,148.83 --- 87,750.00 582.03 0.625 0.897 AAA
256350023 MIM-Sr Lien Reserve Fund-1 91282CAM3 US Gov United States Department of The Treasury 09/30/2025 10/30/2020 425,000.00 422,376.95 --- 423,389.25 920.73 0.250 0.331 AAA
256350023 MIM-Sr Lien Reserve Fund-1 91282CAP6 US Gov United States Department of The Treasury 10/15/2023 11/09/2020 20,000.00 19,936.72 --- 19,986.00 46.31 0.125 0.150 AAA
256350021 MIM-RCTC 2013 Residual Fund 912828B58 US Gov United States Department of The Treasury 01/31/2021 --- 1,730,000.00 1,727,976.96 --- 1,732,525.80 2,368.83 2.125 0.388 AAA
256350021 MIM-RCTC 2013 Residual Fund 912828J43 US Gov United States Department of The Treasury 02/28/2022 12/30/2019 125,000.00 125,463.87 --- 127,363.75 2,112.77 1.750 0.122 AAA
256350021 MIM-RCTC 2013 Residual Fund 912828L57 US Gov United States Department of The Treasury 09/30/2022 --- 2,150,000.00 2,158,926.57 --- 2,210,716.00 54,944.67 1.750 0.131 AAA
256350021 MIM-RCTC 2013 Residual Fund 912828T67 US Gov United States Department of The Treasury 10/31/2021 12/09/2019 480,000.00 476,306.25 --- 484,464.00 6,095.95 1.250 0.131 AAA
256350021 MIM-RCTC 2013 Residual Fund 9128285Y2 US Gov United States Department of The Treasury 01/31/2021 --- 1,425,000.00 1,425,611.74 --- 1,425,114.00 (22.51) 0.210 0.120 AAA
256350021 MIM-RCTC 2013 Residual Fund 9128286U9 US Gov United States Department of The Treasury 05/15/2022 --- 420,000.00 425,850.01 --- 431,482.80 7,935.18 2.125 0.131 AAA
256350021 MIM-RCTC 2013 Residual Fund 912828YK0 US Gov United States Department of The Treasury 10/15/2022 --- 1,820,000.00 1,830,721.10 --- 1,860,531.40 28,408.55 1.375 0.128 AAA
256350021 MIM-RCTC 2013 Residual Fund 912828ZD5 US Gov United States Department of The Treasury 03/15/2023 --- 1,560,000.00 1,572,206.84 --- 1,572,682.80 1,317.41 0.500 0.131 AAA
256350021 MIM-RCTC 2013 Residual Fund 912828ZP8 US Gov United States Department of The Treasury 05/15/2023 11/09/2020 810,000.00 808,354.69 --- 809,781.30 1,336.28 0.125 0.136 AAA
256350021 MIM-RCTC 2013 Residual Fund 91282CAP6 US Gov United States Department of The Treasury 10/15/2023 12/31/2020 350,000.00 349,753.91 --- 349,755.00 1.09 0.125 0.150 AAA
256350018 MIM-RCTC 91 TIFIA Reserve 912828B58 US Gov United States Department of The Treasury 01/31/2021 06/26/2019 1,190,000.00 1,194,973.83 --- 1,191,737.40 1,479.97 2.125 0.388 AAA
256350018 MIM-RCTC 91 TIFIA Reserve 912828XB1 US Gov United States Department of The Treasury 05/15/2025 --- 710,000.00 744,402.74 --- 766,303.00 26,318.40 2.125 0.298 AAA
256350018 MIM-RCTC 91 TIFIA Reserve 912828L57 US Gov United States Department of The Treasury 09/30/2022 09/10/2019 1,000,000.00 1,006,210.94 --- 1,028,240.00 24,650.30 1.750 0.131 AAA
256350018 MIM-RCTC 91 TIFIA Reserve 9128285Y2 US Gov United States Department of The Treasury 01/31/2021 11/30/2020 175,000.00 175,034.09 --- 175,014.00 (2.77) 0.210 0.120 AAA
256350018 MIM-RCTC 91 TIFIA Reserve 912828YK0 US Gov United States Department of The Treasury 10/15/2022 --- 750,000.00 763,253.90 --- 766,702.50 6,575.59 1.375 0.128 AAA
256350018 MIM-RCTC 91 TIFIA Reserve 91282CAE1 US Gov United States Department of The Treasury 08/15/2030 12/04/2020 110,000.00 106,515.23 --- 107,250.00 711.38 0.625 0.897 AAA
256350018 MIM-RCTC 91 TIFIA Reserve 91282CAM3 US Gov United States Department of The Treasury 09/30/2025 10/30/2020 700,000.00 695,679.69 --- 697,347.00 1,516.50 0.250 0.331 AAA
256350018 MIM-RCTC 91 TIFIA Reserve 91282CAP6 US Gov United States Department of The Treasury 10/15/2023 11/09/2020 675,000.00 672,864.26 --- 674,527.50 1,563.16 0.125 0.150 AAA
256350021 MIM-RCTC 2013 Residual Fund 658886DZ6 VRDN North Dakota Housing Finance Agency 07/01/2038 06/29/2018 100,000.00 100,000.00 --- 100,000.00 0.00 0.110 0.110 AA
256350021 MIM-RCTC 2013 Residual Fund 196480CW5 VRDN Colorado Housing and Finance Authority, Inc. 10/01/2051 03/19/2020 460,000.00 460,000.00 01/23/2021 460,000.00 0.00 0.130 0.130 AAA
63,690,490.76 64,920,323.87 65,927,820.73 1,145,224.64
Page 6 of 38
24

Source
Account Account Identifier
Security Type
Category Issuer Final Maturity Trade Date Current Face Value Original Cost
Next Call
Date Base Market Value
Base Net Total
Unrealized Gain/Loss Coupon Yield
Summarized
Credit Rating
256350018 MIM-RCTC 91 TIFIA Reserve 3137EADB2 Agency Freddie Mac 01/13/2022 06/06/2019 500,000.00 505,766.50 --- 511,560.00 9,233.97 2.375 0.135 AAA
256350018 MIM-RCTC 91 TIFIA Reserve 3137EAEC9 Agency Freddie Mac 08/12/2021 04/29/2020 270,000.00 273,044.52 --- 271,657.80 199.69 1.125 0.124 AAA
256350018 MIM-RCTC 91 TIFIA Reserve 3130AFFX0 Agency Federal Home Loan Banks 11/16/2028 09/11/2019 200,000.00 222,450.00 --- 239,176.00 19,681.92 3.250 0.690 AAA
256350018 MIM-RCTC 91 TIFIA Reserve 3135G0V75 Agency Federal National Mortgage Association 07/02/2024 12/21/2020 100,000.00 105,309.90 --- 105,291.00 18.93 1.750 0.232 AAA
256350018 MIM-RCTC 91 TIFIA Reserve 3135G05G4 Agency Federal National Mortgage Association 07/10/2023 07/20/2020 425,000.00 424,328.50 --- 426,015.75 1,586.98 0.250 0.155 AAA
256350018 MIM-RCTC 91 TIFIA Reserve 3134GWGB6 Agency Freddie Mac 07/28/2023 07/22/2020 225,000.00 225,000.00 01/28/2021 225,049.50 49.50 0.450 0.156 AAA
256350018 MIM-RCTC 91 TIFIA Reserve 3134GWND4 Agency Freddie Mac 08/12/2025 08/14/2020 325,000.00 324,545.00 08/12/2021 323,492.00 (1,086.50) 0.600 0.702 AAA
256350018 MIM-RCTC 91 TIFIA Reserve 3137EAEV7 Agency Freddie Mac 08/24/2023 08/19/2020 425,000.00 424,566.50 --- 425,837.25 1,218.83 0.250 0.175 AAA
256350018 MIM-RCTC 91 TIFIA Reserve 3134GWTL0 Agency Freddie Mac 09/28/2023 09/23/2020 315,000.00 314,952.75 09/28/2021 315,053.55 96.68 0.300 0.277 AAA
256350018 MIM-RCTC 91 TIFIA Reserve 3134GXDT8 Agency Freddie Mac 11/24/2023 11/19/2020 160,000.00 160,000.00 05/24/2021 160,068.80 68.80 0.350 0.242 AAA
256350018 MIM-RCTC 91 TIFIA Reserve 38377REV3 Agency CMO Government National Mortgage Association 10/20/2039 07/01/2019 33,747.10 34,416.77 --- 34,392.34 353.28 3.500 -0.027 AAA
256350018 MIM-RCTC 91 TIFIA Reserve 3137ABFH9 Agency CMO Freddie Mac 06/25/2021 --- 85,736.92 87,903.36 --- 86,469.97 276.12 3.989 1.251 AAA
256350018 MIM-RCTC 91 TIFIA Reserve 3137AH6C7 Agency CMO Freddie Mac 07/25/2021 06/07/2019 281,078.51 286,052.28 --- 284,108.54 1,829.69 3.230 0.468 AAA
256350018 MIM-RCTC 91 TIFIA Reserve 38376V2E6 Agency CMO Government National Mortgage Association 07/16/2039 08/06/2019 82,512.63 85,864.70 --- 87,626.76 2,393.01 4.000 0.541 AAA
256350018 MIM-RCTC 91 TIFIA Reserve 38378BSZ3 Agency CMO Government National Mortgage Association 04/16/2040 06/25/2019 70,772.58 70,374.49 --- 71,190.14 655.93 2.141 0.959 AAA
256350018 MIM-RCTC 91 TIFIA Reserve 3137ATRW4 Agency CMO Freddie Mac 05/25/2022 06/28/2019 300,000.00 302,496.09 --- 306,876.00 5,979.54 2.373 0.400 AAA
256350018 MIM-RCTC 91 TIFIA Reserve 3137AUPE3 Agency CMO Freddie Mac 06/25/2022 06/28/2019 200,000.00 201,773.44 --- 205,284.00 4,593.29 2.396 0.321 AAA
256350018 MIM-RCTC 91 TIFIA Reserve 3136A5KR6 Agency CMO Federal National Mortgage Association 10/25/2022 06/10/2019 18,486.60 18,347.95 --- 18,486.42 42.68 1.750 0.817 AAA
256350018 MIM-RCTC 91 TIFIA Reserve 3137AXHP1 Agency CMO Freddie Mac 09/25/2022 06/28/2019 150,000.00 152,232.42 --- 154,527.00 3,466.98 2.573 0.602 AAA
256350018 MIM-RCTC 91 TIFIA Reserve 3137B1UG5 Agency CMO Freddie Mac 01/25/2023 06/25/2019 200,000.00 204,101.56 --- 207,460.00 5,283.03 2.637 0.586 AAA
256350018 MIM-RCTC 91 TIFIA Reserve 38377JZ89 Agency CMO Government National Mortgage Association 10/20/2039 01/28/2020 32,660.48 33,374.92 --- 33,513.57 370.29 3.500 -0.616 AAA
256350018 MIM-RCTC 91 TIFIA Reserve 38378TAF7 Agency CMO Government National Mortgage Association 07/20/2041 07/05/2019 83,410.58 83,566.98 --- 85,973.79 2,469.19 2.500 0.742 AAA
256350018 MIM-RCTC 91 TIFIA Reserve 3136AGFQ0 Agency CMO Federal National Mortgage Association 12/25/2038 06/18/2019 54,309.43 54,994.66 --- 54,749.33 270.45 3.500 0.765 AAA
256350018 MIM-RCTC 91 TIFIA Reserve 38376TTT9 Agency CMO Government National Mortgage Association 11/20/2039 01/29/2020 33,096.59 33,872.29 --- 34,532.65 678.86 3.000 0.528 AAA
256350018 MIM-RCTC 91 TIFIA Reserve 3137B6DF5 Agency CMO Freddie Mac 11/15/2026 06/18/2019 121,274.35 120,014.23 --- 124,250.42 3,919.50 2.000 0.366 AAA
256350018 MIM-RCTC 91 TIFIA Reserve 38378FRB8 Agency CMO Government National Mortgage Association 07/20/2042 12/30/2019 155,758.79 153,471.09 --- 159,475.20 5,879.71 2.000 1.120 AAA
256350018 MIM-RCTC 91 TIFIA Reserve 3137BDKF2 Agency CMO Freddie Mac 09/15/2040 --- 42,951.98 43,852.08 --- 43,919.69 511.86 3.500 0.509 AAA
256350018 MIM-RCTC 91 TIFIA Reserve 38376WA62 Agency CMO Government National Mortgage Association 10/20/2039 12/17/2019 67,582.65 70,898.42 --- 72,086.36 1,420.81 4.000 1.041 AAA
256350018 MIM-RCTC 91 TIFIA Reserve 38377YTL4 Agency CMO Government National Mortgage Association 05/20/2040 06/17/2019 91,399.80 90,285.86 --- 93,066.02 2,655.23 2.000 0.590 AAA
256350018 MIM-RCTC 91 TIFIA Reserve 38378JZD7 Agency CMO Government National Mortgage Association 12/20/2040 10/16/2019 29,282.77 28,916.74 --- 29,630.95 638.68 1.500 0.608 AAA
256350018 MIM-RCTC 91 TIFIA Reserve 38377QKH9 Agency CMO Government National Mortgage Association 08/20/2040 08/20/2019 29,768.97 30,309.70 --- 31,034.45 866.16 3.000 -0.436 AAA
256350018 MIM-RCTC 91 TIFIA Reserve 38378WUY7 Agency CMO Government National Mortgage Association 06/20/2041 06/12/2019 55,924.80 56,012.18 --- 56,418.62 507.50 2.500 -0.064 AAA
256350018 MIM-RCTC 91 TIFIA Reserve 3137B45W2 Agency CMO Freddie Mac 09/15/2030 12/30/2020 124,444.53 125,688.98 --- 126,206.66 517.69 2.750 0.662 AAA
256350018 MIM-RCTC 91 TIFIA Reserve 3137B5A60 Agency CMO Freddie Mac 10/15/2028 02/07/2020 12,562.50 12,680.28 --- 12,972.54 304.20 2.500 0.312 AAA
256350018 MIM-RCTC 91 TIFIA Reserve 3136ADFF1 Agency CMO Federal National Mortgage Association 04/25/2023 06/10/2019 63,745.51 62,829.17 --- 64,108.22 973.00 1.500 0.739 AAA
256350018 MIM-RCTC 91 TIFIA Reserve 3137AS7D0 Agency CMO Freddie Mac 04/15/2039 06/14/2019 36,974.15 36,696.84 --- 37,042.92 158.63 2.000 0.758 AAA
256350018 MIM-RCTC 91 TIFIA Reserve 3137B3HX9 Agency CMO Freddie Mac 07/15/2038 06/20/2019 0.00 0.00 --- (0.00) (0.00) 0.609 0.522 AAA
256350018 MIM-RCTC 91 TIFIA Reserve 3136AGZA3 Agency CMO Federal National Mortgage Association 09/25/2030 06/25/2019 15,046.13 15,146.64 --- 15,316.36 226.18 3.000 0.443 AAA
256350018 MIM-RCTC 91 TIFIA Reserve 38379JM99 Agency CMO Government National Mortgage Association 02/16/2041 08/28/2019 19,418.32 19,543.48 --- 19,636.20 172.82 2.500 -0.121 AAA
256350018 MIM-RCTC 91 TIFIA Reserve 38377RED3 Agency CMO Government National Mortgage Association 12/16/2025 12/11/2019 137,573.09 138,669.38 --- 141,294.45 2,804.77 2.500 0.685 AAA
256350018 MIM-RCTC 91 TIFIA Reserve 38378AU90 Agency CMO Government National Mortgage Association 10/20/2026 04/28/2020 93,683.92 96,377.34 --- 95,879.87 25.15 3.000 0.522 AAA
256350018 MIM-RCTC 91 TIFIA Reserve 38378PZN1 Agency CMO Government National Mortgage Association 03/16/2039 12/30/2020 114,240.64 114,437.00 --- 114,655.33 218.33 2.500 0.214 AAA
256350018 MIM-RCTC 91 TIFIA Reserve 3620AFYR2 Agency MBS Government National Mortgage Association 12/15/2024 06/12/2019 65,711.17 67,849.35 --- 69,747.81 2,482.28 4.000 -0.491 AAA
256350018 MIM-RCTC 91 TIFIA Reserve 36297GCD0 Agency MBS Government National Mortgage Association 02/15/2025 06/12/2019 70,659.76 73,632.45 --- 74,000.55 1,307.10 4.500 1.110 AAA
256350018 MIM-RCTC 91 TIFIA Reserve 31417YKF3 Agency MBS Federal National Mortgage Association 01/01/2030 --- 51,171.88 55,930.17 --- 55,928.31 169.43 4.500 0.330 AAA
256350018 MIM-RCTC 91 TIFIA Reserve 36202F2H8 Agency MBS Government National Mortgage Association 01/20/2027 12/12/2019 146,624.27 150,244.06 --- 153,801.53 3,943.62 3.000 0.500 AAA
256350018 MIM-RCTC 91 TIFIA Reserve 36178NB99 Agency MBS Government National Mortgage Association 08/15/2027 10/11/2019 34,593.36 34,977.13 --- 36,067.38 1,119.88 2.500 0.565 AAA
256350018 MIM-RCTC 91 TIFIA Reserve 3138EJRP5 Agency MBS Federal National Mortgage Association 06/01/2021 06/18/2019 57,330.57 59,060.03 --- 57,311.08 (436.91) 4.379 3.934 AAA
256350018 MIM-RCTC 91 TIFIA Reserve 31418AM39 Agency MBS Federal National Mortgage Association 12/01/2027 09/22/2020 52,613.42 54,931.71 --- 54,993.65 69.66 2.500 0.464 AAA
256350018 MIM-RCTC 91 TIFIA Reserve 3137B1U75 Agency MBS Freddie Mac 01/25/2023 06/27/2019 333,871.64 337,092.98 --- 343,220.04 7,893.04 2.522 0.421 AAA
256350018 MIM-RCTC 91 TIFIA Reserve 38378KWU9 Agency MBS Government National Mortgage Association 11/16/2041 --- 54,936.63 52,527.11 --- 55,356.34 2,303.09 1.400 0.862 AAA
256350018 MIM-RCTC 91 TIFIA Reserve 38378KW47 Agency MBS Government National Mortgage Association 08/16/2035 06/13/2019 108,713.75 108,102.24 --- 109,065.98 609.43 2.150 0.827 AAA
256350018 MIM-RCTC 91 TIFIA Reserve 3138X0ZY7 Agency MBS Federal National Mortgage Association 07/01/2028 08/31/2020 44,948.59 47,231.13 --- 46,989.25 (178.29) 2.500 0.612 AAA
256350018 MIM-RCTC 91 TIFIA Reserve 3137B1BS0 Agency MBS Freddie Mac 11/25/2022 --- 645,000.00 652,086.14 --- 666,046.35 17,542.99 2.510 0.583 AAA
256350018 MIM-RCTC 91 TIFIA Reserve 3137B7YX1 Agency MBS Freddie Mac 04/25/2023 12/23/2020 164,154.19 168,232.40 --- 168,253.12 (100.02) 2.592 0.142 AAA
256350018 MIM-RCTC 91 TIFIA Reserve 3138EKXL4 Agency MBS Federal National Mortgage Association 03/01/2023 08/21/2019 38,954.67 39,392.91 --- 39,922.30 558.13 2.325 1.035 AAA
256350018 MIM-RCTC 91 TIFIA Reserve 3136AHAE0 Agency MBS Federal National Mortgage Association 04/25/2023 06/28/2019 38,360.30 38,714.36 --- 38,677.15 (118.96) 2.548 1.911 AAA
256350018 MIM-RCTC 91 TIFIA Reserve 36179MZV5 Agency MBS Government National Mortgage Association 02/20/2028 04/28/2020 70,526.50 73,545.92 --- 73,759.43 314.83 2.500 0.492 AAA
256350018 MIM-RCTC 91 TIFIA Reserve 3136A7MN9 Agency MBS Federal National Mortgage Association 05/25/2022 08/22/2019 114,333.88 115,258.38 --- 116,720.03 1,845.82 2.349 0.156 AAA
256350018 MIM-RCTC 91 TIFIA Reserve 3137AWQG3 Agency MBS Freddie Mac 04/25/2022 06/07/2019 164,060.42 162,240.37 --- 165,246.57 2,166.91 1.583 0.394 AAA
256350018 MIM-RCTC 91 TIFIA Reserve 31397UPF0 Agency MBS Federal National Mortgage Association 06/25/2021 06/10/2019 125,292.15 127,347.72 --- 126,162.93 631.02 3.763 0.294 AAA
256350018 MIM-RCTC 91 TIFIA Reserve 3137BJQ71 Agency MBS Freddie Mac 05/25/2025 10/30/2019 200,000.00 206,296.88 --- 215,986.00 11,014.76 2.770 0.874 AAA
256350018 MIM-RCTC 91 TIFIA Reserve 3137BLAC2 Agency MBS Freddie Mac 06/25/2025 --- 150,000.00 159,648.05 --- 166,992.00 9,293.28 3.284 0.577 AAA
256350018 MIM-RCTC 91 TIFIA Reserve 36179M4J6 Agency MBS Government National Mortgage Association 03/20/2028 11/20/2019 134,682.33 136,302.73 --- 140,858.86 4,688.00 2.500 0.508 AAA
256350018 MIM-RCTC 91 TIFIA Reserve 36179NKP2 Agency MBS Government National Mortgage Association 08/20/2028 04/28/2020 73,160.20 76,292.37 --- 76,518.26 279.50 2.500 0.567 AAA
256350018 MIM-RCTC 91 TIFIA Reserve 36202FA30 Agency MBS Government National Mortgage Association 09/20/2024 10/23/2019 27,269.83 28,411.76 --- 29,073.19 926.13 4.500 -0.491 AAA
256350018 MIM-RCTC 91 TIFIA Reserve 3128MMUL5 Agency MBS Freddie Mac 02/01/2031 06/22/2020 122,616.68 128,364.34 --- 128,194.52 (289.07) 2.500 0.814 AAA
256350018 MIM-RCTC 91 TIFIA Reserve 3137BM6P6 Agency MBS Freddie Mac 08/25/2022 06/28/2019 200,000.00 205,437.50 --- 206,626.00 4,106.07 3.090 0.662 AAA
256350018 MIM-RCTC 91 TIFIA Reserve 36179MEK2 Agency MBS Government National Mortgage Association 06/20/2027 04/28/2020 92,327.81 96,280.60 --- 96,355.15 285.31 2.500 0.468 AAA
256350018 MIM-RCTC 91 TIFIA Reserve 36179NAJ7 Agency MBS Government National Mortgage Association 04/20/2028 06/30/2020 36,320.04 38,334.67 --- 38,193.43 (80.40) 3.000 0.668 AAA
256350018 MIM-RCTC 91 TIFIA Reserve 3138EJPZ5 Agency MBS Federal National Mortgage Association 07/01/2022 07/22/2019 207,660.77 211,448.95 --- 212,019.57 1,565.74 2.996 1.332 AAA
256350018 MIM-RCTC 91 TIFIA Reserve 3137BSRZ8 Agency MBS Freddie Mac 09/25/2022 06/28/2019 87,058.33 88,775.69 --- 89,804.15 1,258.46 2.838 0.656 AAA
256350018 MIM-RCTC 91 TIFIA Reserve 3138L2QG5 Agency MBS Federal National Mortgage Association 01/01/2028 09/09/2019 253,268.51 268,751.54 --- 282,341.20 14,253.51 3.010 1.336 AAA
256350018 MIM-RCTC 91 TIFIA Reserve 3137BYPQ7 Agency MBS Freddie Mac 04/25/2024 11/30/2020 226,127.27 241,408.53 --- 241,682.57 641.46 2.905 0.596 AAA
256350018 MIM-RCTC 91 TIFIA Reserve 3620ARB67 Agency MBS Government National Mortgage Association 05/15/2025 06/10/2019 134,786.26 139,693.33 --- 143,050.01 4,648.88 4.000 -0.288 AAA
91 CIP STAMP Portfolio by Account for quarter ended December 31, 2020
Page 7 of 38
ATTACHMENT 3
25

Source
Account Account Identifier
Security Type
Category Issuer Final Maturity Trade Date Current Face Value Original Cost
Next Call
Date Base Market Value
Base Net Total
Unrealized Gain/Loss Coupon Yield
Summarized
Credit Rating
91 CIP STAMP Portfolio by Account for quarter ended December 31, 2020
256350018 MIM-RCTC 91 TIFIA Reserve 3137BVZ74 Agency MBS Freddie Mac 08/25/2026 07/09/2020 307,351.93 329,142.71 --- 328,798.95 2,345.23 3.045 0.389 AAA
256350018 MIM-RCTC 91 TIFIA Reserve 36179TF83 Agency MBS Government National Mortgage Association 09/20/2032 10/26/2020 93,872.69 99,886.42 --- 99,718.15 (437.16) 3.500 1.105 AAA
256350018 MIM-RCTC 91 TIFIA Reserve 3137FBAB2 Agency MBS Freddie Mac 08/25/2027 09/22/2020 130,000.00 142,690.23 --- 142,758.20 1,111.85 3.038 -0.246 AAA
256350018 MIM-RCTC 91 TIFIA Reserve 38378NWU3 Agency MBS Government National Mortgage Association 06/16/2048 06/27/2019 0.00 0.00 --- (0.00) (0.00) 2.682 1.133 AAA
256350018 MIM-RCTC 91 TIFIA Reserve 3137FBAJ5 Agency MBS Freddie Mac 08/25/2027 06/26/2019 200,000.00 211,593.75 --- 229,026.00 19,525.24 3.281 0.908 AAA
256350018 MIM-RCTC 91 TIFIA Reserve 36179MU32 Agency MBS Government National Mortgage Association 12/20/2027 06/22/2020 95,961.41 101,119.33 --- 100,903.42 (170.10) 3.000 0.617 AAA
256350018 MIM-RCTC 91 TIFIA Reserve 3138LFGP7 Agency MBS Federal National Mortgage Association 10/01/2028 08/07/2019 299,159.37 309,337.80 --- 328,997.52 20,472.78 2.550 1.164 AAA
256350018 MIM-RCTC 91 TIFIA Reserve 3620C4SU5 Agency MBS Government National Mortgage Association 09/15/2025 06/12/2019 66,925.47 69,401.19 --- 71,025.32 2,249.84 4.000 0.085 AAA
256350018 MIM-RCTC 91 TIFIA Reserve 3137F4D41 Agency MBS Freddie Mac 01/25/2028 06/27/2019 150,000.00 163,248.05 --- 175,879.50 14,841.39 3.600 1.001 AAA
256350018 MIM-RCTC 91 TIFIA Reserve 3137F4CY6 Agency MBS Freddie Mac 09/25/2024 06/28/2019 190,000.00 195,907.81 --- 203,503.30 9,365.24 2.920 0.861 AAA
256350018 MIM-RCTC 91 TIFIA Reserve 3128MENS6 Agency MBS Freddie Mac 01/01/2029 10/01/2020 42,409.45 44,384.12 --- 44,337.81 (4.46) 2.500 0.571 AAA
256350018 MIM-RCTC 91 TIFIA Reserve 3137BP4K2 Agency MBS Freddie Mac 03/25/2026 09/09/2019 200,000.00 210,125.00 --- 220,142.00 12,033.59 2.849 0.815 AAA
256350018 MIM-RCTC 91 TIFIA Reserve 3620A9T35 Agency MBS Government National Mortgage Association 11/15/2024 06/13/2019 109,031.08 112,583.11 --- 115,722.32 4,086.01 4.000 -0.632 AAA
256350018 MIM-RCTC 91 TIFIA Reserve 3137FL6P4 Agency MBS Freddie Mac 01/25/2029 09/09/2019 275,000.00 307,108.40 --- 325,578.00 22,694.40 3.563 1.115 AAA
256350018 MIM-RCTC 91 TIFIA Reserve 3132A9T64 Agency MBS Freddie Mac 10/01/2032 08/14/2020 169,952.34 179,113.83 --- 178,438.06 (1,171.39) 3.000 1.107 AAA
256350018 MIM-RCTC 91 TIFIA Reserve 3140JAU97 Agency MBS Federal National Mortgage Association 05/01/2023 05/20/2020 68,355.96 71,068.84 --- 70,201.57 (974.78) 2.614 1.077 AAA
256350018 MIM-RCTC 91 TIFIA Reserve 31419AM53 Agency MBS Federal National Mortgage Association 08/01/2024 06/28/2019 49,753.09 51,587.73 --- 51,197.42 491.74 5.500 0.745 AAA
256350018 MIM-RCTC 91 TIFIA Reserve 36179RHM4 Agency MBS Government National Mortgage Association 07/20/2030 10/27/2020 90,822.04 96,214.60 --- 96,466.63 200.19 3.500 0.869 AAA
256350018 MIM-RCTC 91 TIFIA Reserve 3137FNAD2 Agency MBS Freddie Mac 11/25/2028 08/01/2019 146,382.71 149,304.22 --- 159,404.92 10,767.42 2.631 0.567 AAA
256350018 MIM-RCTC 91 TIFIA Reserve 36179MU24 Agency MBS Government National Mortgage Association 12/20/2027 04/28/2020 53,770.22 56,072.26 --- 56,118.90 123.41 2.500 0.549 AAA
256350018 MIM-RCTC 91 TIFIA Reserve 3137FPJF3 Agency MBS Freddie Mac 06/25/2029 01/08/2020 196,171.98 197,060.88 --- 211,110.48 14,244.47 2.258 0.412 AAA
256350018 MIM-RCTC 91 TIFIA Reserve 3137FQ3Y7 Agency MBS Freddie Mac 07/25/2029 01/08/2020 196,425.17 196,494.22 --- 210,290.82 13,848.48 2.190 0.664 AAA
256350018 MIM-RCTC 91 TIFIA Reserve 3132CJAJ2 Agency MBS Freddie Mac 09/01/2029 01/28/2020 79,925.82 82,192.48 --- 83,825.41 1,767.26 3.000 0.539 AAA
256350018 MIM-RCTC 91 TIFIA Reserve 36179RFD6 Agency MBS Government National Mortgage Association 06/20/2030 05/01/2020 20,333.92 21,337.90 --- 21,385.99 27.09 3.000 0.999 AAA
256350018 MIM-RCTC 91 TIFIA Reserve 36176XE21 Agency MBS Government National Mortgage Association 03/15/2027 06/22/2020 165,330.95 173,235.85 --- 173,448.70 81.34 3.000 0.414 AAA
256350018 MIM-RCTC 91 TIFIA Reserve 3620ARZE4 Agency MBS Government National Mortgage Association 02/15/2026 06/22/2020 94,580.31 98,954.65 --- 99,203.39 234.77 3.000 0.136 AAA
256350018 MIM-RCTC 91 TIFIA Reserve 3132A85Y1 Agency MBS Freddie Mac 09/01/2032 08/12/2020 244,752.07 257,945.75 --- 255,768.36 (2,140.07) 2.500 0.819 AAA
256350018 MIM-RCTC 91 TIFIA Reserve 3137FMD66 Agency MBS Freddie Mac 05/25/2026 08/18/2020 89,886.50 94,549.36 --- 94,588.46 (668.70) 2.283 0.715 AAA
256350018 MIM-RCTC 91 TIFIA Reserve 3137FWHY9 Agency MBS Freddie Mac 09/25/2030 09/15/2020 197,208.03 196,221.99 --- 195,013.11 (1,226.06) 0.826 0.999 AAA
256350018 MIM-RCTC 91 TIFIA Reserve 3132AEFC5 Agency MBS Freddie Mac 11/01/2030 10/14/2020 465,049.10 500,581.76 --- 504,038.82 3,866.40 3.500 -0.245 AAA
256350018 MIM-RCTC 91 TIFIA Reserve 3140J6FU6 Agency MBS Federal National Mortgage Association 10/01/2032 11/03/2020 106,279.50 113,453.37 --- 113,614.91 203.69 3.000 0.447 AAA
256350018 MIM-RCTC 91 TIFIA Reserve CCYUSD Currency UNITED STATES OF AMERICA 12/31/2020 --- - 0.01 --- 0.01 - 0.000 0.000 AAA
256350018 MIM-RCTC 91 TIFIA Reserve CCYUSD Currency UNITED STATES OF AMERICA 12/31/2020 --- - (240,195.73) --- (240,195.73) - 0.000 0.000 AAA
256350018 MIM-RCTC 91 TIFIA Reserve 31846V401 MM Fund First American Funds, Inc. - Government Obligations Fund 12/31/2020 --- - 310,684.49 --- 310,684.49 - 0.010 0.010 AAA
256350018 MIM-RCTC 91 TIFIA Reserve 9128285W6 TIPS United States Department of The Treasury 01/15/2029 --- 154,683.00 163,583.78 --- 181,767.99 19,500.39 0.875 -1.193 AAA
256350018 MIM-RCTC 91 TIFIA Reserve 912828B58 US Gov United States Department of The Treasury 01/31/2021 06/26/2019 1,190,000.00 1,194,973.83 --- 1,191,737.40 1,479.97 2.125 0.388 AAA
256350018 MIM-RCTC 91 TIFIA Reserve 912828XB1 US Gov United States Department of The Treasury 05/15/2025 --- 710,000.00 744,402.74 --- 766,303.00 26,318.40 2.125 0.298 AAA
256350018 MIM-RCTC 91 TIFIA Reserve 912828L57 US Gov United States Department of The Treasury 09/30/2022 09/10/2019 1,000,000.00 1,006,210.94 --- 1,028,240.00 24,650.30 1.750 0.131 AAA
256350018 MIM-RCTC 91 TIFIA Reserve 9128285Y2 US Gov United States Department of The Treasury 01/31/2021 11/30/2020 175,000.00 175,034.09 --- 175,014.00 (2.77) 0.210 0.120 AAA
256350018 MIM-RCTC 91 TIFIA Reserve 912828YK0 US Gov United States Department of The Treasury 10/15/2022 --- 750,000.00 763,253.90 --- 766,702.50 6,575.59 1.375 0.128 AAA
256350018 MIM-RCTC 91 TIFIA Reserve 91282CAE1 US Gov United States Department of The Treasury 08/15/2030 12/04/2020 110,000.00 106,515.23 --- 107,250.00 711.38 0.625 0.897 AAA
256350018 MIM-RCTC 91 TIFIA Reserve 91282CAM3 US Gov United States Department of The Treasury 09/30/2025 10/30/2020 700,000.00 695,679.69 --- 697,347.00 1,516.50 0.250 0.331 AAA
256350018 MIM-RCTC 91 TIFIA Reserve 91282CAP6 US Gov United States Department of The Treasury 10/15/2023 11/09/2020 675,000.00 672,864.26 --- 674,527.50 1,563.16 0.125 0.150 AAA
20,168,953.62 20,713,933.33 21,044,235.72 406,348.07
256350021 MIM-RCTC 2013 Residual Fund 3134GV6H6 Agency Freddie Mac 10/20/2022 07/22/2020 400,000.00 399,960.00 07/20/2021 400,340.00 372.14 0.320 0.166 AAA
256350021 MIM-RCTC 2013 Residual Fund 3134GWGB6 Agency Freddie Mac 07/28/2023 07/22/2020 300,000.00 300,000.00 01/28/2021 300,066.00 66.00 0.450 0.156 AAA
256350021 MIM-RCTC 2013 Residual Fund 3134GWTL0 Agency Freddie Mac 09/28/2023 09/23/2020 270,000.00 269,959.50 09/28/2021 270,045.90 82.87 0.300 0.277 AAA
256350021 MIM-RCTC 2013 Residual Fund 3134GWY42 Agency Freddie Mac 10/13/2023 10/07/2020 300,000.00 299,850.00 10/13/2021 299,991.00 130.05 0.300 0.301 AAA
256350021 MIM-RCTC 2013 Residual Fund 3136G46A6 Agency Federal National Mortgage Association 10/27/2023 10/20/2020 415,000.00 414,896.25 10/27/2021 415,012.45 109.95 0.300 0.296 AAA
256350021 MIM-RCTC 2013 Residual Fund 38377REV3 Agency CMO Government National Mortgage Association 10/20/2039 07/01/2019 67,494.20 68,833.53 --- 68,784.68 706.56 3.500 -0.027 AAA
256350021 MIM-RCTC 2013 Residual Fund 3137ABFH9 Agency CMO Freddie Mac 06/25/2021 03/15/2019 118,535.60 120,748.89 --- 119,549.08 597.80 3.989 1.251 AAA
256350021 MIM-RCTC 2013 Residual Fund 3137ADTJ6 Agency CMO Freddie Mac 04/25/2021 03/11/2020 361,583.52 368,984.69 --- 362,708.04 (209.78) 3.871 1.003 AAA
256350021 MIM-RCTC 2013 Residual Fund 3137AH6C7 Agency CMO Freddie Mac 07/25/2021 03/11/2020 32,123.26 32,745.65 --- 32,469.55 107.61 3.230 0.468 AAA
256350021 MIM-RCTC 2013 Residual Fund 31394GUX9 Agency CMO Freddie Mac 08/15/2023 07/02/2019 17,056.14 17,781.02 --- 17,809.00 277.83 5.500 1.043 AAA
256350021 MIM-RCTC 2013 Residual Fund 31397LUK3 Agency CMO Federal National Mortgage Association 06/25/2023 10/10/2018 49,779.81 50,783.19 --- 50,851.57 678.82 4.500 0.962 AAA
256350021 MIM-RCTC 2013 Residual Fund 3137ATRW4 Agency CMO Freddie Mac 05/25/2022 08/19/2019 100,000.00 101,109.38 --- 102,292.00 1,835.92 2.373 0.400 AAA
256350021 MIM-RCTC 2013 Residual Fund 3136A72D3 Agency CMO Federal National Mortgage Association 04/25/2022 07/26/2019 23,582.78 23,720.81 --- 23,988.88 319.41 2.482 0.404 AAA
256350021 MIM-RCTC 2013 Residual Fund 3136A5KR6 Agency CMO Federal National Mortgage Association 10/25/2022 --- 20,520.12 20,403.06 --- 20,519.92 27.51 1.750 0.817 AAA
256350021 MIM-RCTC 2013 Residual Fund 3137AYCE9 Agency CMO Freddie Mac 10/25/2022 08/13/2019 360,000.00 367,790.63 --- 372,254.40 8,155.14 2.682 0.582 AAA
256350021 MIM-RCTC 2013 Residual Fund 3137A2PV7 Agency CMO Freddie Mac 09/15/2022 06/03/2019 19,410.65 19,070.96 --- 19,544.00 347.12 1.500 0.848 AAA
256350021 MIM-RCTC 2013 Residual Fund 3137GAUY1 Agency CMO Freddie Mac 10/15/2022 08/15/2019 100,783.14 99,743.81 --- 101,435.21 1,346.52 1.500 0.840 AAA
256350021 MIM-RCTC 2013 Residual Fund 3137A5FP4 Agency CMO Freddie Mac 01/15/2021 01/30/2018 13,699.88 13,734.13 --- 13,694.81 (5.07) 2.500 1.055 AAA
256350021 MIM-RCTC 2013 Residual Fund 38378PPK8 Agency CMO Government National Mortgage Association 12/20/2038 01/08/2020 55,250.49 55,641.13 --- 56,308.54 817.62 2.500 -0.136 AAA
256350021 MIM-RCTC 2013 Residual Fund 31381RLL6 Agency MBS Federal National Mortgage Association 07/01/2021 11/02/2018 51,049.81 51,807.59 --- 51,170.28 38.74 3.840 3.024 AAA
256350021 MIM-RCTC 2013 Residual Fund 36202F2H8 Agency MBS Government National Mortgage Association 01/20/2027 12/12/2019 64,514.68 66,107.39 --- 67,672.67 1,735.19 3.000 0.500 AAA
256350021 MIM-RCTC 2013 Residual Fund 36178NB99 Agency MBS Government National Mortgage Association 08/15/2027 10/11/2019 86,483.40 87,442.83 --- 90,168.45 2,799.72 2.500 0.565 AAA
256350021 MIM-RCTC 2013 Residual Fund 3137APP61 Agency MBS Freddie Mac 01/25/2022 09/06/2019 13,438.87 13,658.30 --- 13,719.88 191.83 2.789 0.313 AAA
256350021 MIM-RCTC 2013 Residual Fund 38378KW47 Agency MBS Government National Mortgage Association 08/16/2035 06/13/2019 42,014.98 41,778.64 --- 42,151.10 235.53 2.150 0.827 AAA
256350021 MIM-RCTC 2013 Residual Fund 3132G5AV1 Agency MBS Freddie Mac 07/01/2028 10/11/2019 55,729.27 56,774.20 --- 58,518.52 1,867.34 3.000 0.947 AAA
256350021 MIM-RCTC 2013 Residual Fund 3138L1W62 Agency MBS Federal National Mortgage Association 12/01/2022 02/21/2019 122,836.84 122,107.50 --- 122,744.71 418.30 2.500 2.461 AAA
256350021 MIM-RCTC 2013 Residual Fund 3138EKXL4 Agency MBS Federal National Mortgage Association 03/01/2023 08/21/2019 41,551.64 42,019.10 --- 42,583.79 595.34 2.325 1.035 AAA
256350021 MIM-RCTC 2013 Residual Fund 31381RZ23 Agency MBS Federal National Mortgage Association 08/01/2021 11/02/2018 58,741.69 59,613.64 --- 59,021.89 211.10 3.840 2.467 AAA
256350021 MIM-RCTC 2013 Residual Fund 3137AXHN6 Agency MBS Freddie Mac 02/25/2022 01/25/2018 8,281.80 8,167.93 --- 8,318.65 71.91 1.749 0.452 AAA
256350021 MIM-RCTC 2013 Residual Fund 3136AMM48 Agency MBS Federal National Mortgage Association 07/25/2022 08/01/2019 322,612.01 324,426.70 --- 327,131.80 3,843.85 2.509 0.803 AAA
256350021 MIM-RCTC 2013 Residual Fund 3137AWQG3 Agency MBS Freddie Mac 04/25/2022 --- 25,634.44 25,157.80 --- 25,819.78 384.83 1.583 0.394 AAA
256350021 MIM-RCTC 2013 Residual Fund 31397UPF0 Agency MBS Federal National Mortgage Association 06/25/2021 03/15/2019 62,646.08 63,546.61 --- 63,081.47 370.25 3.763 0.294 AAA
Page 8 of 38
26

Source
Account Account Identifier
Security Type
Category Issuer Final Maturity Trade Date Current Face Value Original Cost
Next Call
Date Base Market Value
Base Net Total
Unrealized Gain/Loss Coupon Yield
Summarized
Credit Rating
91 CIP STAMP Portfolio by Account for quarter ended December 31, 2020
256350021 MIM-RCTC 2013 Residual Fund 36179M4J6 Agency MBS Government National Mortgage Association 03/20/2028 11/20/2019 112,235.28 113,585.61 --- 117,382.38 3,906.66 2.500 0.508 AAA
256350021 MIM-RCTC 2013 Residual Fund 3137B1UF7 Agency MBS Freddie Mac 09/25/2022 01/25/2018 8,061.34 7,942.94 --- 8,138.73 127.21 1.785 0.424 AAA
256350021 MIM-RCTC 2013 Residual Fund 36179Q2A8 Agency MBS Government National Mortgage Association 02/20/2030 04/30/2020 286,206.67 302,663.56 --- 301,890.80 (773.04) 3.000 0.857 AAA
256350021 MIM-RCTC 2013 Residual Fund 3620ARB67 Agency MBS Government National Mortgage Association 05/15/2025 06/10/2019 44,142.50 45,749.56 --- 46,848.87 1,522.51 4.000 -0.288 AAA
256350021 MIM-RCTC 2013 Residual Fund 31418CQM9 Agency MBS Federal National Mortgage Association 10/01/2027 --- 99,472.77 103,770.94 --- 104,384.74 808.32 3.000 0.490 AAA
256350021 MIM-RCTC 2013 Residual Fund 3140J6DU8 Agency MBS Federal National Mortgage Association 08/01/2031 07/26/2019 150,990.47 152,004.94 --- 157,765.41 5,920.64 2.500 0.572 AAA
256350021 MIM-RCTC 2013 Residual Fund 3138L2GH4 Agency MBS Federal National Mortgage Association 07/01/2021 --- 121,059.43 118,496.06 --- 121,162.33 740.06 1.870 1.526 AAA
256350021 MIM-RCTC 2013 Residual Fund 31381QB54 Agency MBS Federal National Mortgage Association 03/01/2021 11/07/2018 96,284.72 98,278.12 --- 96,240.43 (1.80) 4.410 3.300 AAA
256350021 MIM-RCTC 2013 Residual Fund 3137BFE80 Agency MBS Freddie Mac 08/25/2024 07/15/2020 291,499.82 304,389.57 --- 303,999.33 1,122.44 2.720 0.273 AAA
256350021 MIM-RCTC 2013 Residual Fund 3622A2GC0 Agency MBS Government National Mortgage Association 03/15/2028 04/30/2020 200,671.85 208,761.43 --- 209,194.38 701.80 2.500 0.552 AAA
256350021 MIM-RCTC 2013 Residual Fund 36179RFD6 Agency MBS Government National Mortgage Association 06/20/2030 05/01/2020 54,223.77 56,901.07 --- 57,029.31 72.22 3.000 0.999 AAA
256350021 MIM-RCTC 2013 Residual Fund 3137BJP56 Agency MBS Freddie Mac 01/25/2025 07/23/2020 43,422.29 45,276.22 --- 45,153.97 62.93 2.697 0.509 AAA
256350021 MIM-RCTC 2013 Residual Fund 3132A85Y1 Agency MBS Freddie Mac 09/01/2032 08/12/2020 306,714.63 323,248.46 --- 320,519.85 (2,681.84) 2.500 0.819 AAA
256350021 MIM-RCTC 2013 Residual Fund 3140J8ME0 Agency MBS Federal National Mortgage Association 12/01/2032 12/30/2020 99,966.95 106,652.25 --- 106,761.70 109.45 3.000 0.458 AAA
256350021 MIM-RCTC 2013 Residual Fund 3132AEFC5 Agency MBS Freddie Mac 11/01/2030 10/14/2020 179,909.50 193,655.73 --- 194,993.12 1,495.75 3.500 -0.245 AAA
256350021 MIM-RCTC 2013 Residual Fund 3140J7Q32 Agency MBS Federal National Mortgage Association 10/01/2031 10/20/2020 46,393.05 49,959.52 --- 50,750.29 778.23 3.500 -0.526 AAA
256350021 MIM-RCTC 2013 Residual Fund 17305EFM2 Asset Backed Citibank Credit Card Issuance Trust - 2014-A1 01/23/2023 12/11/2019 200,000.00 202,210.16 --- 200,264.00 154.63 2.880 0.474 AAA
256350021 MIM-RCTC 2013 Residual Fund 87165LBB6 Asset Backed Synchrony Credit Card Master Note Trust 2016-2 05/17/2021 08/02/2019 160,000.00 160,387.50 --- 161,124.80 1,041.68 2.210 0.345 AAA
256350021 MIM-RCTC 2013 Residual Fund 65478HAD0 Asset Backed Nissan Auto Receivables 2017-C Owner Trust 04/18/2022 09/25/2018 11,343.69 11,166.89 --- 11,372.96 47.58 2.120 0.448 AAA
256350021 MIM-RCTC 2013 Residual Fund 17305EGK5 Asset Backed Citibank Credit Card Issuance Trust 01/20/2021 07/19/2019 100,000.00 100,625.00 --- 100,123.00 101.14 2.490 0.150 AAA
256350021 MIM-RCTC 2013 Residual Fund 65478DAD9 Asset Backed Nissan Auto Receivables 2018-A Owner Trust 05/16/2022 06/29/2018 19,309.70 19,210.13 --- 19,385.01 86.78 2.650 0.834 AAA
256350021 MIM-RCTC 2013 Residual Fund 12596EAC8 Asset Backed CNH Equipment Trust 2018-B 11/15/2023 12/05/2019 134,332.54 136,525.94 --- 136,898.29 1,457.70 3.190 0.536 AAA
256350021 MIM-RCTC 2013 Residual Fund 38013FAD3 Asset Backed GM Financial Consumer Automobile Receivables Trust 2018-4 10/16/2023 07/24/2019 50,150.85 51,069.63 --- 51,095.19 609.62 3.210 0.090 AAA
256350021 MIM-RCTC 2013 Residual Fund 31680YAB3 Asset Backed Fifth Third Auto Trust 2019-1 05/16/2022 04/30/2019 1,189.73 1,189.66 --- 1,190.79 1.06 2.660 0.346 AAA
256350021 MIM-RCTC 2013 Residual Fund 65478LAB5 Asset Backed Nissan Auto Lease Trust 2019-B 10/15/2021 07/16/2019 11,642.79 11,641.77 --- 11,654.90 12.19 2.270 0.162 AAA
256350021 MIM-RCTC 2013 Residual Fund 477870AB5 Asset Backed John Deere Owner Trust 2019-B 05/16/2022 07/16/2019 20,781.08 20,781.00 --- 20,823.26 42.19 2.280 0.438 AAA
256350021 MIM-RCTC 2013 Residual Fund 14315PAB1 Asset Backed Carmax Auto Owner Trust 2019-3 12/15/2022 07/24/2019 40,746.83 40,745.00 --- 40,934.27 187.89 2.210 0.563 AAA
256350021 MIM-RCTC 2013 Residual Fund 14041NFU0 Asset Backed Capital One Multi-Asset Execution Trust, Series 2019-2 09/15/2022 03/13/2020 100,000.00 100,312.50 --- 102,427.00 2,212.16 1.720 0.293 AAA
256350021 MIM-RCTC 2013 Residual Fund 26209AAE1 Asset Backed Drive Auto Receivables Trust 2019-4 01/16/2024 09/09/2019 80,000.00 79,989.10 --- 80,820.80 825.16 2.230 1.001 AAA
256350021 MIM-RCTC 2013 Residual Fund 14315XAC2 Asset Backed Carmax Auto Owner Trust 2020-1 12/16/2024 01/14/2020 60,000.00 59,988.23 --- 61,551.60 1,559.65 1.890 0.573 AAA
256350021 MIM-RCTC 2013 Residual Fund 34528QHK3 Asset Backed Ford Credit Floorplan Master Owner Trust A, Series 2020-1 09/15/2025 09/15/2020 225,000.00 224,986.86 --- 226,593.00 1,604.90 0.700 0.437 AAA
256350021 MIM-RCTC 2013 Residual Fund 362569AH8 Asset Backed GM Financial Automobile Leasing Trust 2020-3 10/20/2021 09/22/2020 282,003.71 282,003.71 --- 282,003.71 - 0.178 0.185 AAA
256350021 MIM-RCTC 2013 Residual Fund 43813KAA0 Asset Backed Honda Auto Receivables 2020-3 Owner Trust 10/18/2021 09/22/2020 338,938.83 338,938.83 --- 338,938.83 0.00 0.189 0.190 AAA
256350021 MIM-RCTC 2013 Residual Fund 65602VS72 CD NORINCHUKIN BANK (NEW YORK BRANCH) 01/27/2021 11/02/2020 450,000.00 450,063.51 --- 450,054.00 34.57 0.300 0.140 AAA
256350021 MIM-RCTC 2013 Residual Fund 637432MV4 Corporate National Rural Utilities Cooperative Finance Corporation 11/15/2023 12/23/2020 165,000.00 178,234.65 08/15/2023 177,969.00 (210.38) 3.400 0.385 A
256350021 MIM-RCTC 2013 Residual Fund 172967LC3 Corporate Citigroup Inc. 12/08/2021 --- 450,000.00 449,617.50 11/08/2021 459,724.50 9,860.27 2.900 0.360 A
256350021 MIM-RCTC 2013 Residual Fund 61746BEE2 Corporate Morgan Stanley 01/20/2022 06/12/2020 200,000.00 200,870.00 01/20/2021 200,102.00 25.63 1.398 0.479 A
256350021 MIM-RCTC 2013 Residual Fund 0258M0EH8 Corporate American Express Credit Corporation 03/03/2022 06/12/2020 270,000.00 270,459.00 01/31/2022 271,674.00 1,368.77 0.932 0.394 A
256350021 MIM-RCTC 2013 Residual Fund 95000U2B8 Corporate Wells Fargo & Company 07/22/2022 --- 485,000.00 498,441.60 --- 502,033.20 5,164.89 2.625 0.363 A
256350021 MIM-RCTC 2013 Residual Fund 06051GHC6 Corporate Bank of America Corporation 12/20/2023 10/09/2020 185,000.00 194,412.80 12/20/2022 194,714.35 1,227.37 3.004 0.327 A
256350021 MIM-RCTC 2013 Residual Fund 46647PAY2 Corporate JPMorgan Chase & Co. 12/05/2024 11/05/2020 245,000.00 270,261.95 12/05/2023 269,899.35 830.06 4.023 0.521 A
256350021 MIM-RCTC 2013 Residual Fund 14913Q2X6 Corporate Caterpillar Financial Services Corporation 05/17/2021 05/14/2019 120,000.00 120,000.00 --- 120,159.60 159.60 0.612 0.317 A
256350021 MIM-RCTC 2013 Residual Fund 86787EBD8 Corporate Truist Bank 05/17/2022 05/14/2019 50,000.00 50,000.00 04/17/2022 50,304.00 304.00 0.812 0.385 A
256350021 MIM-RCTC 2013 Residual Fund 025816CD9 Corporate American Express Company 05/20/2022 12/30/2020 150,000.00 154,734.00 04/19/2022 154,747.50 13.50 2.750 0.309 A
256350021 MIM-RCTC 2013 Residual Fund 025816CE7 Corporate American Express Company 05/20/2022 05/15/2019 100,000.00 100,000.00 04/19/2022 100,635.00 635.00 0.844 0.396 A
256350021 MIM-RCTC 2013 Residual Fund 05531FBJ1 Corporate Truist Financial Corporation 03/16/2023 09/09/2019 165,000.00 164,877.90 02/13/2023 171,279.90 6,357.88 2.200 0.393 A
256350021 MIM-RCTC 2013 Residual Fund 17308CC46 Corporate Citigroup Inc. 11/04/2022 10/28/2019 195,000.00 195,000.00 11/04/2021 198,116.10 3,116.10 2.312 0.414 A
256350021 MIM-RCTC 2013 Residual Fund 69353RFU7 Corporate PNC Bank, National Association 02/24/2023 02/20/2020 250,000.00 250,000.00 02/24/2022 250,452.50 452.50 0.530 0.426 A
256350021 MIM-RCTC 2013 Residual Fund 14913R2D8 Corporate Caterpillar Financial Services Corporation 07/07/2023 07/06/2020 200,000.00 199,888.00 --- 201,676.00 1,770.18 0.650 0.315 A
256350021 MIM-RCTC 2013 Residual Fund 438516CC8 Corporate Honeywell International Inc. 08/19/2022 08/17/2020 265,000.00 265,000.00 08/19/2021 265,424.00 424.00 0.483 0.230 A
256350021 MIM-RCTC 2013 Residual Fund 06051GJH3 Corporate Bank of America Corporation 10/24/2024 11/05/2020 205,000.00 205,604.75 10/24/2023 206,914.70 1,339.56 0.810 0.591 A
256350021 MIM-RCTC 2013 Residual Fund 6174468T9 Corporate Morgan Stanley 11/10/2023 11/09/2020 380,000.00 380,000.00 11/10/2022 380,881.60 881.60 0.560 0.512 A
256350021 MIM-RCTC 2013 Residual Fund 38141GXL3 Corporate The Goldman Sachs Group, Inc. 11/17/2023 --- 485,000.00 486,140.00 11/17/2022 486,964.25 824.25 0.627 0.509 A
256350021 MIM-RCTC 2013 Residual Fund 863667BB6 Corporate Stryker Corporation 12/01/2023 11/18/2020 160,000.00 159,860.80 12/01/2021 160,252.80 387.10 0.600 0.427 A
256350021 MIM-RCTC 2013 Residual Fund CCYUSD Currency UNITED STATES OF AMERICA 12/31/2020 --- - (1,125,143.21) --- (1,125,143.21) - 0.000 0.000 AAA
256350021 MIM-RCTC 2013 Residual Fund 31846V401 MM Fund First American Funds, Inc. - Government Obligations Fund 12/31/2020 --- - 1,146,183.68 --- 1,146,183.68 - 0.010 0.010 AAA
256350021 MIM-RCTC 2013 Residual Fund 64971QWL3 Muni New York City Transitional Finance Authority 08/01/2023 07/07/2020 155,000.00 168,936.50 --- 163,512.60 184.84 2.710 0.565 AAA
256350021 MIM-RCTC 2013 Residual Fund 072024WW8 Muni Bay Area Toll Authority 04/01/2022 09/20/2019 95,000.00 95,000.00 --- 97,004.50 2,004.50 2.128 0.433 AA
256350021 MIM-RCTC 2013 Residual Fund 783186TZ2 Muni Rutgers, The State University of New Jersey 05/01/2022 10/18/2019 105,000.00 105,000.00 --- 106,564.50 1,564.50 2.057 0.930 AA
256350021 MIM-RCTC 2013 Residual Fund 283062DK0 Muni El Dorado Irrigation District 03/01/2022 06/16/2020 155,000.00 155,000.00 --- 155,754.85 754.85 0.739 0.320 AA
256350021 MIM-RCTC 2013 Residual Fund 650036AS5 Muni The New York State Urban Development Corporation 03/15/2024 06/18/2020 180,000.00 180,000.00 --- 181,443.60 1,443.60 0.965 0.711 AA
256350021 MIM-RCTC 2013 Residual Fund 194740PF7 Muni Collin County Texas 02/15/2024 06/25/2020 175,000.00 175,000.00 --- 176,842.75 1,842.75 0.867 0.526 AAA
256350021 MIM-RCTC 2013 Residual Fund 916544ES4 Muni Upper Santa Clara Valley Joint Powers Authority 08/01/2023 07/16/2020 170,000.00 170,000.00 --- 170,578.00 578.00 0.680 0.547 AA
256350021 MIM-RCTC 2013 Residual Fund 4581X0CZ9 Non-US Gov Inter-American Development Bank 09/14/2022 09/30/2019 650,000.00 652,067.00 --- 667,387.50 16,184.11 1.750 0.176 AAA
256350021 MIM-RCTC 2013 Residual Fund 9128286N5 TIPS United States Department of The Treasury 04/15/2024 --- 253,975.32 258,722.97 --- 272,231.07 14,891.37 0.500 -1.623 AAA
256350021 MIM-RCTC 2013 Residual Fund 912828B58 US Gov United States Department of The Treasury 01/31/2021 --- 1,730,000.00 1,727,976.96 --- 1,732,525.80 2,368.83 2.125 0.388 AAA
256350021 MIM-RCTC 2013 Residual Fund 912828J43 US Gov United States Department of The Treasury 02/28/2022 12/30/2019 125,000.00 125,463.87 --- 127,363.75 2,112.77 1.750 0.122 AAA
256350021 MIM-RCTC 2013 Residual Fund 912828L57 US Gov United States Department of The Treasury 09/30/2022 --- 2,150,000.00 2,158,926.57 --- 2,210,716.00 54,944.67 1.750 0.131 AAA
256350021 MIM-RCTC 2013 Residual Fund 912828T67 US Gov United States Department of The Treasury 10/31/2021 12/09/2019 480,000.00 476,306.25 --- 484,464.00 6,095.95 1.250 0.131 AAA
256350021 MIM-RCTC 2013 Residual Fund 9128285Y2 US Gov United States Department of The Treasury 01/31/2021 --- 1,425,000.00 1,425,611.74 --- 1,425,114.00 (22.51) 0.210 0.120 AAA
256350021 MIM-RCTC 2013 Residual Fund 9128286U9 US Gov United States Department of The Treasury 05/15/2022 --- 420,000.00 425,850.01 --- 431,482.80 7,935.18 2.125 0.131 AAA
256350021 MIM-RCTC 2013 Residual Fund 912828YK0 US Gov United States Department of The Treasury 10/15/2022 --- 1,820,000.00 1,830,721.10 --- 1,860,531.40 28,408.55 1.375 0.128 AAA
256350021 MIM-RCTC 2013 Residual Fund 912828ZD5 US Gov United States Department of The Treasury 03/15/2023 --- 1,560,000.00 1,572,206.84 --- 1,572,682.80 1,317.41 0.500 0.131 AAA
256350021 MIM-RCTC 2013 Residual Fund 912828ZP8 US Gov United States Department of The Treasury 05/15/2023 11/09/2020 810,000.00 808,354.69 --- 809,781.30 1,336.28 0.125 0.136 AAA
256350021 MIM-RCTC 2013 Residual Fund 91282CAP6 US Gov United States Department of The Treasury 10/15/2023 12/31/2020 350,000.00 349,753.91 --- 349,755.00 1.09 0.125 0.150 AAA
Page 9 of 38
27

Source
Account Account Identifier
Security Type
Category Issuer Final Maturity Trade Date Current Face Value Original Cost
Next Call
Date Base Market Value
Base Net Total
Unrealized Gain/Loss Coupon Yield
Summarized
Credit Rating
91 CIP STAMP Portfolio by Account for quarter ended December 31, 2020
256350021 MIM-RCTC 2013 Residual Fund 658886DZ6 VRDN North Dakota Housing Finance Agency 07/01/2038 06/29/2018 100,000.00 100,000.00 --- 100,000.00 - 0.110 0.110 AA
256350021 MIM-RCTC 2013 Residual Fund 196480CW5 VRDN Colorado Housing and Finance Authority, Inc. 10/01/2051 03/19/2020 460,000.00 460,000.00 01/23/2021 460,000.00 - 0.130 0.130 AAA
26,501,025.18 26,766,878.05 26,959,940.10 231,297.03
256350023 MIM-Sr Lien Reserve Fund-1 3130AFFX0 Agency Federal Home Loan Banks 11/16/2028 09/11/2019 185,000.00 205,766.25 --- 221,237.80 18,205.78 3.250 0.690 AAA
256350023 MIM-Sr Lien Reserve Fund-1 3135G0V75 Agency Federal National Mortgage Association 07/02/2024 12/21/2020 425,000.00 447,567.08 --- 447,486.75 80.43 1.750 0.232 AAA
256350023 MIM-Sr Lien Reserve Fund-1 3135G05G4 Agency Federal National Mortgage Association 07/10/2023 --- 400,000.00 399,976.00 --- 400,956.00 935.81 0.250 0.155 AAA
256350023 MIM-Sr Lien Reserve Fund-1 3134GWGB6 Agency Freddie Mac 07/28/2023 07/22/2020 200,000.00 200,000.00 01/28/2021 200,044.00 44.00 0.450 0.156 AAA
256350023 MIM-Sr Lien Reserve Fund-1 3134GWND4 Agency Freddie Mac 08/12/2025 08/14/2020 300,000.00 299,580.00 08/12/2021 298,608.00 (1,002.93) 0.600 0.702 AAA
256350023 MIM-Sr Lien Reserve Fund-1 3137EAEV7 Agency Freddie Mac 08/24/2023 08/19/2020 400,000.00 399,592.00 --- 400,788.00 1,147.14 0.250 0.175 AAA
256350023 MIM-Sr Lien Reserve Fund-1 3134GWTL0 Agency Freddie Mac 09/28/2023 09/23/2020 290,000.00 289,956.50 09/28/2021 290,049.30 89.01 0.300 0.277 AAA
256350023 MIM-Sr Lien Reserve Fund-1 3134GXDT8 Agency Freddie Mac 11/24/2023 11/19/2020 145,000.00 145,000.00 05/24/2021 145,062.35 62.35 0.350 0.242 AAA
256350023 MIM-Sr Lien Reserve Fund-1 38377REV3 Agency CMO Government National Mortgage Association 10/20/2039 07/01/2019 31,497.29 32,122.32 --- 32,099.52 329.73 3.500 -0.027 AAA
256350023 MIM-Sr Lien Reserve Fund-1 38377RVK8 Agency CMO Government National Mortgage Association 04/20/2039 --- 57,606.17 58,755.47 --- 59,275.02 1,300.17 3.000 0.842 AAA
256350023 MIM-Sr Lien Reserve Fund-1 3137ABFH9 Agency CMO Freddie Mac 06/25/2021 07/22/2019 57,541.55 59,022.80 --- 58,033.53 161.60 3.989 1.251 AAA
256350023 MIM-Sr Lien Reserve Fund-1 38375XCM4 Agency CMO Government National Mortgage Association 11/16/2037 05/14/2019 30,914.74 31,790.26 --- 31,865.99 511.21 5.000 0.638 AAA
256350023 MIM-Sr Lien Reserve Fund-1 3137ATRW4 Agency CMO Freddie Mac 05/25/2022 --- 282,110.00 278,085.13 --- 288,575.96 8,119.40 2.373 0.400 AAA
256350023 MIM-Sr Lien Reserve Fund-1 3137AUPE3 Agency CMO Freddie Mac 06/25/2022 --- 150,000.00 151,611.80 --- 153,963.00 3,692.08 2.396 0.321 AAA
256350023 MIM-Sr Lien Reserve Fund-1 3136A72D3 Agency CMO Federal National Mortgage Association 04/25/2022 07/03/2013 169,367.31 160,898.94 --- 172,283.82 4,022.26 2.482 0.404 AAA
256350023 MIM-Sr Lien Reserve Fund-1 3136A5KR6 Agency CMO Federal National Mortgage Association 10/25/2022 01/25/2019 6,137.55 6,053.16 --- 6,137.49 19.09 1.750 0.817 AAA
256350023 MIM-Sr Lien Reserve Fund-1 3137AXHP1 Agency CMO Freddie Mac 09/25/2022 09/29/2017 140,000.00 142,089.06 --- 144,225.20 3,658.84 2.573 0.602 AAA
256350023 MIM-Sr Lien Reserve Fund-1 38378B7F0 Agency CMO Government National Mortgage Association 12/16/2042 --- 450,000.00 427,324.22 --- 466,249.50 25,897.23 2.273 1.180 AAA
256350023 MIM-Sr Lien Reserve Fund-1 38378CRT6 Agency CMO Government National Mortgage Association 10/20/2040 05/22/2014 24,424.05 23,584.47 --- 24,936.71 832.35 2.000 0.216 AAA
256350023 MIM-Sr Lien Reserve Fund-1 38378HXH4 Agency CMO Government National Mortgage Association 09/16/2027 03/08/2019 9,887.13 9,588.86 --- 9,993.02 339.98 1.250 0.615 AAA
256350023 MIM-Sr Lien Reserve Fund-1 3137B1UG5 Agency CMO Freddie Mac 01/25/2023 --- 240,000.00 250,336.72 --- 248,952.00 950.34 2.637 0.586 AAA
256350023 MIM-Sr Lien Reserve Fund-1 38377JZ89 Agency CMO Government National Mortgage Association 10/20/2039 --- 28,305.74 29,076.67 --- 29,045.09 477.01 3.500 -0.616 AAA
256350023 MIM-Sr Lien Reserve Fund-1 38378TAF7 Agency CMO Government National Mortgage Association 07/20/2041 07/05/2013 76,994.38 77,005.99 --- 79,360.42 2,424.20 2.500 0.742 AAA
256350023 MIM-Sr Lien Reserve Fund-1 38376TTT9 Agency CMO Government National Mortgage Association 11/20/2039 01/29/2020 30,448.86 31,162.51 --- 31,770.04 624.54 3.000 0.528 AAA
256350023 MIM-Sr Lien Reserve Fund-1 3137B4HD1 Agency CMO Freddie Mac 12/15/2042 03/20/2019 24,413.90 25,214.98 --- 25,901.43 825.30 4.500 0.767 AAA
256350023 MIM-Sr Lien Reserve Fund-1 38378FRB8 Agency CMO Government National Mortgage Association 07/20/2042 12/30/2019 147,560.96 145,393.66 --- 151,081.77 5,570.25 2.000 1.120 AAA
256350023 MIM-Sr Lien Reserve Fund-1 3137BDKF2 Agency CMO Freddie Mac 09/15/2040 11/13/2019 37,092.26 37,947.12 --- 37,927.95 341.67 3.500 0.509 AAA
256350023 MIM-Sr Lien Reserve Fund-1 3137A5FP4 Agency CMO Freddie Mac 01/15/2021 --- 38,323.44 38,327.77 --- 38,309.26 (14.18) 2.500 1.055 AAA
256350023 MIM-Sr Lien Reserve Fund-1 38376T5Z1 Agency CMO Government National Mortgage Association 01/16/2039 01/26/2015 46,287.29 48,358.65 --- 48,248.02 875.55 3.000 0.802 AAA
256350023 MIM-Sr Lien Reserve Fund-1 38376WA62 Agency CMO Government National Mortgage Association 10/20/2039 --- 121,536.13 124,593.49 --- 129,635.30 5,353.19 4.000 1.041 AAA
256350023 MIM-Sr Lien Reserve Fund-1 38377YTL4 Agency CMO Government National Mortgage Association 05/20/2040 12/16/2020 23,215.54 23,516.63 --- 23,638.76 108.43 2.000 0.590 AAA
256350023 MIM-Sr Lien Reserve Fund-1 38378JZD7 Agency CMO Government National Mortgage Association 12/20/2040 10/16/2019 27,560.26 27,215.76 --- 27,887.95 601.11 1.500 0.608 AAA
256350023 MIM-Sr Lien Reserve Fund-1 38377QKH9 Agency CMO Government National Mortgage Association 08/20/2040 08/20/2019 27,590.76 28,091.91 --- 28,763.64 802.79 3.000 -0.436 AAA
256350023 MIM-Sr Lien Reserve Fund-1 38380AZ34 Agency CMO Government National Mortgage Association 04/20/2046 11/28/2016 91,828.98 94,400.91 --- 97,190.87 3,351.71 3.000 1.557 AAA
256350023 MIM-Sr Lien Reserve Fund-1 3137ARVU7 Agency CMO Freddie Mac 08/15/2038 06/30/2020 140,220.36 142,170.30 --- 141,283.23 (247.22) 3.000 0.579 AAA
256350023 MIM-Sr Lien Reserve Fund-1 38378VC45 Agency CMO Government National Mortgage Association 12/16/2041 11/23/2018 88,826.31 85,620.24 --- 91,302.79 4,722.82 2.250 0.591 AAA
256350023 MIM-Sr Lien Reserve Fund-1 38377JM59 Agency CMO Government National Mortgage Association 10/20/2039 11/21/2018 31,027.93 30,252.23 --- 31,471.94 798.16 2.500 0.206 AAA
256350023 MIM-Sr Lien Reserve Fund-1 3137B5A60 Agency CMO Freddie Mac 10/15/2028 03/20/2019 13,758.93 13,604.15 --- 14,208.02 569.22 2.500 0.312 AAA
256350023 MIM-Sr Lien Reserve Fund-1 3136ADFF1 Agency CMO Federal National Mortgage Association 04/25/2023 06/10/2019 60,204.10 59,338.66 --- 60,546.66 918.95 1.500 0.739 AAA
256350023 MIM-Sr Lien Reserve Fund-1 38379JM99 Agency CMO Government National Mortgage Association 02/16/2041 08/28/2019 18,031.30 18,147.52 --- 18,233.61 160.48 2.500 -0.121 AAA
256350023 MIM-Sr Lien Reserve Fund-1 38378AU90 Agency CMO Government National Mortgage Association 10/20/2026 04/28/2020 86,155.75 88,632.73 --- 88,175.24 23.13 3.000 0.522 AAA
256350023 MIM-Sr Lien Reserve Fund-1 31417YKF3 Agency MBS Federal National Mortgage Association 01/01/2030 --- 89,897.74 94,208.64 --- 98,253.73 5,324.29 4.500 0.330 AAA
256350023 MIM-Sr Lien Reserve Fund-1 36202F2H8 Agency MBS Government National Mortgage Association 01/20/2027 --- 94,426.03 97,326.08 --- 99,048.18 2,732.97 3.000 0.500 AAA
256350023 MIM-Sr Lien Reserve Fund-1 36178NB99 Agency MBS Government National Mortgage Association 08/15/2027 10/11/2019 25,945.02 26,232.85 --- 27,050.53 839.91 2.500 0.565 AAA
256350023 MIM-Sr Lien Reserve Fund-1 31418AM39 Agency MBS Federal National Mortgage Association 12/01/2027 09/22/2020 48,642.60 50,785.92 --- 50,843.19 64.41 2.500 0.464 AAA
256350023 MIM-Sr Lien Reserve Fund-1 36179MKL3 Agency MBS Government National Mortgage Association 08/20/2027 05/28/2020 89,093.75 92,824.54 --- 92,277.96 (443.23) 2.500 0.842 AAA
256350023 MIM-Sr Lien Reserve Fund-1 3136AC7J4 Agency MBS Federal National Mortgage Association 03/25/2023 --- 44,213.01 43,618.11 --- 45,917.42 1,961.04 2.532 0.472 AAA
256350023 MIM-Sr Lien Reserve Fund-1 3137B1U75 Agency MBS Freddie Mac 01/25/2023 08/29/2016 338,323.26 351,605.09 --- 347,796.31 6,360.44 2.522 0.421 AAA
256350023 MIM-Sr Lien Reserve Fund-1 38378KWU9 Agency MBS Government National Mortgage Association 11/16/2041 --- 89,526.35 85,070.54 --- 90,210.33 3,193.03 1.400 0.862 AAA
256350023 MIM-Sr Lien Reserve Fund-1 38378KXW4 Agency MBS Government National Mortgage Association 02/16/2037 12/11/2014 64,152.40 63,841.66 --- 64,545.01 489.77 1.705 0.902 AAA
256350023 MIM-Sr Lien Reserve Fund-1 36202F3H7 Agency MBS Government National Mortgage Association 02/20/2027 06/30/2020 58,771.99 61,637.12 --- 61,792.28 243.81 3.000 0.384 AAA
256350023 MIM-Sr Lien Reserve Fund-1 3138X0ZY7 Agency MBS Federal National Mortgage Association 07/01/2028 08/31/2020 40,862.35 42,937.39 --- 42,717.50 (162.09) 2.500 0.612 AAA
256350023 MIM-Sr Lien Reserve Fund-1 3137B1BS0 Agency MBS Freddie Mac 11/25/2022 07/31/2019 360,000.00 363,360.94 --- 371,746.80 10,095.46 2.510 0.583 AAA
256350023 MIM-Sr Lien Reserve Fund-1 3138L1W62 Agency MBS Federal National Mortgage Association 12/01/2022 02/21/2019 160,632.79 159,679.03 --- 160,512.32 547.01 2.500 2.461 AAA
256350023 MIM-Sr Lien Reserve Fund-1 3138EKXL4 Agency MBS Federal National Mortgage Association 03/01/2023 --- 192,176.35 189,444.66 --- 196,950.01 5,005.61 2.325 1.035 AAA
256350023 MIM-Sr Lien Reserve Fund-1 3136AHAE0 Agency MBS Federal National Mortgage Association 04/25/2023 10/28/2016 32,071.72 32,763.27 --- 32,336.64 (116.77) 2.548 1.911 AAA
256350023 MIM-Sr Lien Reserve Fund-1 36179MZV5 Agency MBS Government National Mortgage Association 02/20/2028 04/28/2020 65,016.62 67,800.14 --- 67,996.98 290.24 2.500 0.492 AAA
256350023 MIM-Sr Lien Reserve Fund-1 38378B6A2 Agency MBS Government National Mortgage Association 11/16/2052 01/22/2015 101,427.09 98,229.75 --- 103,530.69 3,569.83 1.826 1.068 AAA
256350023 MIM-Sr Lien Reserve Fund-1 3136A7MN9 Agency MBS Federal National Mortgage Association 05/25/2022 08/29/2016 207,879.80 213,823.87 --- 212,218.25 2,986.95 2.349 0.156 AAA
256350023 MIM-Sr Lien Reserve Fund-1 3137AWQG3 Agency MBS Freddie Mac 04/25/2022 08/19/2020 61,522.66 62,060.98 --- 61,967.46 8.23 1.583 0.394 AAA
256350023 MIM-Sr Lien Reserve Fund-1 38378KSL4 Agency MBS Government National Mortgage Association 12/16/2046 --- 425,000.00 415,829.11 --- 451,133.25 31,674.11 2.798 1.745 AAA
256350023 MIM-Sr Lien Reserve Fund-1 38378KRS0 Agency MBS Government National Mortgage Association 07/16/2043 05/08/2015 450,000.00 434,460.94 --- 465,196.50 20,984.18 2.389 1.134 AAA
256350023 MIM-Sr Lien Reserve Fund-1 38378XP62 Agency MBS Government National Mortgage Association 05/16/2055 05/14/2015 157,589.36 159,534.60 --- 165,431.01 6,235.81 2.500 1.299 AAA
256350023 MIM-Sr Lien Reserve Fund-1 38379KDN5 Agency MBS Government National Mortgage Association 09/16/2055 08/05/2015 66,473.77 64,775.57 --- 70,158.41 3,727.87 2.291 1.509 AAA
256350023 MIM-Sr Lien Reserve Fund-1 36179M4J6 Agency MBS Government National Mortgage Association 03/20/2028 11/20/2019 33,670.58 34,075.68 --- 35,214.72 1,172.00 2.500 0.508 AAA
256350023 MIM-Sr Lien Reserve Fund-1 36179NKP2 Agency MBS Government National Mortgage Association 08/20/2028 04/28/2020 73,160.20 76,292.37 --- 76,518.26 279.50 2.500 0.567 AAA
256350023 MIM-Sr Lien Reserve Fund-1 36202FA30 Agency MBS Government National Mortgage Association 09/20/2024 10/23/2019 25,088.25 26,138.82 --- 26,747.33 852.05 4.500 -0.491 AAA
256350023 MIM-Sr Lien Reserve Fund-1 3128MMUL5 Agency MBS Freddie Mac 02/01/2031 06/22/2020 118,661.31 124,223.55 --- 124,059.21 (279.74) 2.500 0.814 AAA
256350023 MIM-Sr Lien Reserve Fund-1 36179MEK2 Agency MBS Government National Mortgage Association 06/20/2027 04/28/2020 85,225.68 88,874.40 --- 88,943.22 263.37 2.500 0.468 AAA
256350023 MIM-Sr Lien Reserve Fund-1 36179NAJ7 Agency MBS Government National Mortgage Association 04/20/2028 06/30/2020 33,596.04 35,459.57 --- 35,328.92 (74.38) 3.000 0.668 AAA
256350023 MIM-Sr Lien Reserve Fund-1 3138EJPZ5 Agency MBS Federal National Mortgage Association 07/01/2022 08/29/2016 184,587.35 196,059.16 --- 188,461.84 81.62 2.996 1.332 AAA
256350023 MIM-Sr Lien Reserve Fund-1 3137BYPQ7 Agency MBS Freddie Mac 04/25/2024 11/30/2020 226,127.27 241,408.52 --- 241,682.57 641.47 2.905 0.596 AAA
256350023 MIM-Sr Lien Reserve Fund-1 3620ARB67 Agency MBS Government National Mortgage Association 05/15/2025 06/10/2019 67,393.13 69,846.66 --- 71,525.00 2,324.44 4.000 -0.288 AAA
256350023 MIM-Sr Lien Reserve Fund-1 3137BVZ74 Agency MBS Freddie Mac 08/25/2026 07/09/2020 263,444.51 282,122.32 --- 281,827.67 2,010.20 3.045 0.389 AAA
256350023 MIM-Sr Lien Reserve Fund-1 36179TF83 Agency MBS Government National Mortgage Association 09/20/2032 10/26/2020 83,442.40 88,787.93 --- 88,638.36 (388.57) 3.500 1.105 AAA
256350023 MIM-Sr Lien Reserve Fund-1 3137FBAB2 Agency MBS Freddie Mac 08/25/2027 09/22/2020 120,000.00 131,714.06 --- 131,776.80 1,026.32 3.038 -0.246 AAA
Page 10 of 38
28

Source
Account Account Identifier
Security Type
Category Issuer Final Maturity Trade Date Current Face Value Original Cost
Next Call
Date Base Market Value
Base Net Total
Unrealized Gain/Loss Coupon Yield
Summarized
Credit Rating
91 CIP STAMP Portfolio by Account for quarter ended December 31, 2020
256350023 MIM-Sr Lien Reserve Fund-1 3137FBAJ5 Agency MBS Freddie Mac 08/25/2027 06/26/2019 200,000.00 211,593.75 --- 229,026.00 19,525.24 3.281 0.908 AAA
256350023 MIM-Sr Lien Reserve Fund-1 36179MU32 Agency MBS Government National Mortgage Association 12/20/2027 06/22/2020 88,579.76 93,340.92 --- 93,141.61 (157.02) 3.000 0.617 AAA
256350023 MIM-Sr Lien Reserve Fund-1 3138LFGP7 Agency MBS Federal National Mortgage Association 10/01/2028 08/07/2019 274,229.42 283,559.65 --- 301,581.06 18,766.71 2.550 1.164 AAA
256350023 MIM-Sr Lien Reserve Fund-1 3137F4D41 Agency MBS Freddie Mac 01/25/2028 04/01/2019 35,000.00 36,714.84 --- 41,038.55 4,647.81 3.600 1.001 AAA
256350023 MIM-Sr Lien Reserve Fund-1 3128MENS6 Agency MBS Freddie Mac 01/01/2029 10/01/2020 33,927.55 35,507.31 --- 35,470.24 (3.58) 2.500 0.571 AAA
256350023 MIM-Sr Lien Reserve Fund-1 31381QB54 Agency MBS Federal National Mortgage Association 03/01/2021 11/07/2018 125,588.76 128,188.84 --- 125,530.99 (2.35) 4.410 3.300 AAA
256350023 MIM-Sr Lien Reserve Fund-1 3132A9T64 Agency MBS Freddie Mac 10/01/2032 08/14/2020 157,812.88 166,319.98 --- 165,692.48 (1,087.72) 3.000 1.107 AAA
256350023 MIM-Sr Lien Reserve Fund-1 3140JAU97 Agency MBS Federal National Mortgage Association 05/01/2023 05/20/2020 62,659.63 65,146.44 --- 64,351.44 (893.55) 2.614 1.077 AAA
256350023 MIM-Sr Lien Reserve Fund-1 36179RHM4 Agency MBS Government National Mortgage Association 07/20/2030 10/27/2020 77,847.46 82,469.66 --- 82,685.68 171.58 3.500 0.869 AAA
256350023 MIM-Sr Lien Reserve Fund-1 3137FNAD2 Agency MBS Freddie Mac 11/25/2028 08/01/2019 131,744.44 134,373.80 --- 143,464.43 9,690.67 2.631 0.567 AAA
256350023 MIM-Sr Lien Reserve Fund-1 36179MU24 Agency MBS Government National Mortgage Association 12/20/2027 04/28/2020 49,634.05 51,759.00 --- 51,802.06 113.92 2.500 0.549 AAA
256350023 MIM-Sr Lien Reserve Fund-1 3137FPJF3 Agency MBS Freddie Mac 06/25/2029 01/08/2020 181,459.08 182,281.32 --- 195,277.19 13,176.13 2.258 0.412 AAA
256350023 MIM-Sr Lien Reserve Fund-1 3137FQ3Y7 Agency MBS Freddie Mac 07/25/2029 01/08/2020 181,693.28 181,757.16 --- 194,519.01 12,809.84 2.190 0.664 AAA
256350023 MIM-Sr Lien Reserve Fund-1 3132CJAJ2 Agency MBS Freddie Mac 09/01/2029 01/28/2020 73,531.76 75,617.08 --- 77,119.37 1,625.87 3.000 0.539 AAA
256350023 MIM-Sr Lien Reserve Fund-1 36179NHK7 Agency MBS Government National Mortgage Association 07/20/2028 03/31/2020 157,076.52 163,850.44 --- 165,183.24 1,746.42 3.000 0.715 AAA
256350023 MIM-Sr Lien Reserve Fund-1 36179RFD6 Agency MBS Government National Mortgage Association 06/20/2030 05/01/2020 20,333.92 21,338.09 --- 21,385.99 26.89 3.000 0.999 AAA
256350023 MIM-Sr Lien Reserve Fund-1 36176XE21 Agency MBS Government National Mortgage Association 03/15/2027 06/22/2020 152,028.47 159,297.33 --- 159,493.07 74.81 3.000 0.414 AAA
256350023 MIM-Sr Lien Reserve Fund-1 3620ARZE4 Agency MBS Government National Mortgage Association 02/15/2026 06/22/2020 85,572.67 89,530.40 --- 89,755.46 212.41 3.000 0.136 AAA
256350023 MIM-Sr Lien Reserve Fund-1 3132A85Y1 Agency MBS Freddie Mac 09/01/2032 08/12/2020 226,163.31 238,354.93 --- 236,342.92 (1,977.52) 2.500 0.819 AAA
256350023 MIM-Sr Lien Reserve Fund-1 3137FMD66 Agency MBS Freddie Mac 05/25/2026 08/18/2020 89,886.50 94,549.36 --- 94,588.46 (668.70) 2.283 0.715 AAA
256350023 MIM-Sr Lien Reserve Fund-1 3137FWHY9 Agency MBS Freddie Mac 09/25/2030 09/15/2020 197,208.03 196,221.99 --- 195,013.11 (1,226.06) 0.826 0.999 AAA
256350023 MIM-Sr Lien Reserve Fund-1 3132AEFC5 Agency MBS Freddie Mac 11/01/2030 10/14/2020 431,103.92 464,042.95 --- 467,247.67 3,584.18 3.500 -0.245 AAA
256350023 MIM-Sr Lien Reserve Fund-1 3140J6FU6 Agency MBS Federal National Mortgage Association 10/01/2032 11/03/2020 96,617.73 103,139.42 --- 103,286.29 185.18 3.000 0.447 AAA
256350023 MIM-Sr Lien Reserve Fund-1 31846V401 MM Fund First American Funds, Inc. - Government Obligations Fund 12/31/2020 --- - 123,176.02 --- 123,176.02 - 0.010 0.010 AAA
256350023 MIM-Sr Lien Reserve Fund-1 9128285W6 TIPS United States Department of The Treasury 01/15/2029 08/26/2019 128,902.50 139,076.12 --- 151,473.33 13,854.51 0.875 -1.193 AAA
256350023 MIM-Sr Lien Reserve Fund-1 912828G38 US Gov United States Department of The Treasury 11/15/2024 04/18/2017 1,350,000.00 1,369,037.11 --- 1,454,314.50 94,213.74 2.250 0.244 AAA
256350023 MIM-Sr Lien Reserve Fund-1 912828XB1 US Gov United States Department of The Treasury 05/15/2025 --- 1,250,000.00 1,278,552.74 --- 1,349,125.00 80,984.96 2.125 0.298 AAA
256350023 MIM-Sr Lien Reserve Fund-1 912828L57 US Gov United States Department of The Treasury 09/30/2022 07/14/2017 225,000.00 223,198.24 --- 231,354.00 6,976.88 1.750 0.131 AAA
256350023 MIM-Sr Lien Reserve Fund-1 912828YK0 US Gov United States Department of The Treasury 10/15/2022 --- 670,000.00 664,428.32 --- 684,920.90 18,455.05 1.375 0.128 AAA
256350023 MIM-Sr Lien Reserve Fund-1 91282CAE1 US Gov United States Department of The Treasury 08/15/2030 12/04/2020 90,000.00 87,148.83 --- 87,750.00 582.03 0.625 0.897 AAA
256350023 MIM-Sr Lien Reserve Fund-1 91282CAM3 US Gov United States Department of The Treasury 09/30/2025 10/30/2020 425,000.00 422,376.95 --- 423,389.25 920.73 0.250 0.331 AAA
256350023 MIM-Sr Lien Reserve Fund-1 91282CAP6 US Gov United States Department of The Treasury 10/15/2023 11/09/2020 20,000.00 19,936.72 --- 19,986.00 46.31 0.125 0.150 AAA
17,020,511.96 17,439,512.49 17,923,644.91 507,579.54
Page 11 of 38
29

Source
Account Account Identifier Description
Beginning Base
Market Value Base Purchases Base Sales
Base Maturities and
Redemptions Base Paydowns
Net Total Realized
Gain/Loss
Base
Amortization/Ac
cretion
Base Change In Net
Unrealized
Gain/Loss Ending Base Market Value
Ending Accrued
Income Balance
256350018 MIM-RCTC 91 TIFIA Reserve 31846V401 FIRST AMER:GVT OBLG D 147,703.99 3,303,917.50 (3,140,937.00) - - 0.26 - - 310,684.49 -
256350018 MIM-RCTC 91 TIFIA Reserve CCYUSD Cash - - - - - - - - 0.01 -
256350018 MIM-RCTC 91 TIFIA Reserve CCYUSD Payable - - - - - - - - (240,195.73) -
256350018 MIM-RCTC 91 TIFIA Reserve 3137EADB2 FEDERAL HOME LOAN MORTGAGE CORP 514,435.00 - - - - - (555.38) (2,319.62) 511,560.00 5,541.67
256350018 MIM-RCTC 91 TIFIA Reserve 3136ADFF1 FNR 2013-36 KC 77,676.16 - - - (13,451.26) 138.28 61.51 (316.46) 64,108.22 79.68
256350018 MIM-RCTC 91 TIFIA Reserve 3136A5KR6 FNR 2012-31 AD 56,941.77 - - - (38,363.08) 123.80 35.73 (251.80) 18,486.42 26.96
256350018 MIM-RCTC 91 TIFIA Reserve 3620ARB67 GN 737261 158,293.06 - - - (14,422.94) (389.43) (78.90) (351.79) 143,050.01 449.29
256350018 MIM-RCTC 91 TIFIA Reserve 3620AFYR2 GN 728920 75,409.66 - - - (5,405.87) (130.55) (59.32) (66.10) 69,747.81 219.04
256350018 MIM-RCTC 91 TIFIA Reserve 36297GCD0 GN 711168 79,271.67 - - - (5,166.39) (151.98) (76.15) 123.40 74,000.55 264.97
256350018 MIM-RCTC 91 TIFIA Reserve 3620A9T35 GN 723370 127,232.74 - - - (10,963.58) (268.72) (113.14) (164.98) 115,722.32 363.44
256350018 MIM-RCTC 91 TIFIA Reserve 3620C4SU5 GN 748531 78,885.60 - - - (7,420.56) (206.93) (26.96) (205.83) 71,025.32 223.08
256350018 MIM-RCTC 91 TIFIA Reserve 38378KW47 GNR 2013-138 A 124,460.31 - - - (15,298.87) 36.02 32.17 (163.65) 109,065.98 194.78
256350018 MIM-RCTC 91 TIFIA Reserve 3137AS7D0 FHR 4084 TC 80,021.78 - - - (42,723.26) 165.14 93.84 (514.57) 37,042.92 61.62
256350018 MIM-RCTC 91 TIFIA Reserve 3137B6DF5 FHR 4272 YG 139,372.03 - - - (14,685.10) 114.76 26.55 (577.82) 124,250.42 202.12
256350018 MIM-RCTC 91 TIFIA Reserve 3137FGZN8 FHMS K-I02 A 22,659.99 - - - (22,665.86) 33.68 29.78 (57.59) - -
256350018 MIM-RCTC 91 TIFIA Reserve 31397ALN1 FHR 3196 FA 36,915.05 - - - (36,909.49) 11.12 38.96 (55.63) - -
256350018 MIM-RCTC 91 TIFIA Reserve 3136AGFQ0 FNR 2013-92 A 87,014.08 - - - (31,758.77) (179.06) (245.78) (81.14) 54,749.33 158.40
256350018 MIM-RCTC 91 TIFIA Reserve 3137B3HX9 FHR 4231 FB 54,035.51 - (50,607.82) - (3,347.31) 516.82 21.16 (618.36) (0.00) -
256350018 MIM-RCTC 91 TIFIA Reserve 38377YTL4 GNR 2011-136 GA 123,710.91 - - - (30,103.42) 364.43 116.06 (1,021.96) 93,066.02 152.33
256350018 MIM-RCTC 91 TIFIA Reserve 38378WUY7 GNR 2013-124 CP 82,353.50 - - - (25,476.31) (4.63) (37.61) (416.34) 56,418.62 116.51
256350018 MIM-RCTC 91 TIFIA Reserve 912828L99 UNITED STATES TREASURY 1,051,092.00 - (425,264.78) (625,000.00) - 348.13 302.75 (1,478.10) - -
256350018 MIM-RCTC 91 TIFIA Reserve 38378BSZ3 GNR 2012-053 A 73,639.22 - - - (2,452.18) 8.35 14.45 (19.70) 71,190.14 126.28
256350018 MIM-RCTC 91 TIFIA Reserve 9128285W6 UNITED STATES TREASURY 143,453.83 - (131,385.96) - - 13,121.61 262.91 (13,334.53) 12,117.87 41.68
256350018 MIM-RCTC 91 TIFIA Reserve 3137B1UG5 FHMS K-027 A2 208,354.00 - - - - - (322.57) (571.43) 207,460.00 439.50
256350018 MIM-RCTC 91 TIFIA Reserve 3137AWQG3 FHMS K-023 A1 195,475.40 - - - (29,886.67) 195.73 148.62 (686.51) 165,246.57 216.42
256350018 MIM-RCTC 91 TIFIA Reserve 3137BDKF2 FHR 4384 LA 17,044.49 - - - (3,373.01) (35.30) (27.28) (31.56) 13,577.33 38.73
256350018 MIM-RCTC 91 TIFIA Reserve 3136AGZA3 FNR 2013-101 A 18,790.51 - - - (3,342.95) (12.47) (16.27) (102.46) 15,316.36 37.62
256350018 MIM-RCTC 91 TIFIA Reserve 38378CNY9 GNR 2012-007 MD 17,776.24 - - - (17,773.57) (0.80) (1.41) (0.46) - -
256350018 MIM-RCTC 91 TIFIA Reserve 912828V49 UNITED STATES TREASURY 342,242.09 - (344,347.69) - - 29,974.96 1,366.85 (29,236.22) - -
256350018 MIM-RCTC 91 TIFIA Reserve 3137B1BS0 FHMS K-026 A2 259,210.00 - - - - - (288.83) (763.67) 258,157.50 522.92
256350018 MIM-RCTC 91 TIFIA Reserve 3137F4D41 FHMS K-074 A2 175,623.00 - - - - - (384.55) 641.05 175,879.50 450.00
256350018 MIM-RCTC 91 TIFIA Reserve 3137B1U75 FHMS K-S01 A2 364,975.22 - - - (19,947.66) (96.28) (270.34) (1,440.90) 343,220.04 701.69
256350018 MIM-RCTC 91 TIFIA Reserve 3137BM6P6 FHMS K-721 A2 207,688.00 - - - - - (504.43) (557.57) 206,626.00 515.00
256350018 MIM-RCTC 91 TIFIA Reserve 3137AUPE3 FHMS K-021 A2 205,722.00 - - - - - (183.71) (254.29) 205,284.00 399.33
256350018 MIM-RCTC 91 TIFIA Reserve 3137ATRW4 FHMS K-020 A2 307,911.00 - - - - - (274.17) (760.83) 306,876.00 593.25
256350018 MIM-RCTC 91 TIFIA Reserve 3137AXHP1 FHMS K-024 A2 155,673.00 - - - - - (198.81) (947.19) 154,527.00 321.63
256350018 MIM-RCTC 91 TIFIA Reserve 3137F4CY6 FHMS K-BX1 A1 204,274.70 - - - - - (302.66) (468.74) 203,503.30 462.33
256350018 MIM-RCTC 91 TIFIA Reserve 3137FBAJ5 FHMS K-IR3 A2 229,610.00 - - - - - (366.30) (217.70) 229,026.00 546.83
256350018 MIM-RCTC 91 TIFIA Reserve 31419AM53 FN AE0379 65,171.55 - - - (13,268.18) (275.48) (135.56) (294.90) 51,197.42 228.04
256350018 MIM-RCTC 91 TIFIA Reserve 3136AHAE0 FNA 2013-M14 APT 47,484.96 - - - (7,700.91) (94.67) (36.05) (976.16) 38,677.15 81.45
256350018 MIM-RCTC 91 TIFIA Reserve 3138EJPZ5 FN AL2239 214,662.40 - - - (1,466.05) (20.25) (303.00) (853.54) 212,019.57 535.74
256350018 MIM-RCTC 91 TIFIA Reserve 38378KWU9 GNR 2013-096 A 20,636.96 - - - (246.20) 9.21 48.76 53.63 20,502.35 23.74
256350018 MIM-RCTC 91 TIFIA Reserve 3137BSRZ8 FHMS K-J09 A2 123,202.61 - - - (31,878.03) (526.68) 1.89 (995.64) 89,804.15 205.89
256350018 MIM-RCTC 91 TIFIA Reserve 3137B1BS0 FHMS K-026 A2 409,551.80 - - - - - (338.05) (1,324.90) 407,888.85 826.21
256350018 MIM-RCTC 91 TIFIA Reserve 38378KWU9 GNR 2013-096 A 35,082.83 - - - (418.54) 14.61 75.19 99.89 34,853.99 40.35
256350018 MIM-RCTC 91 TIFIA Reserve 38377REV3 GNR 2010-158 HA 45,717.09 - - - (10,789.33) (127.33) (131.08) (277.01) 34,392.34 98.43
256350018 MIM-RCTC 91 TIFIA Reserve 38378NWU3 GNR 2014-017 AM (0.00) - - - - (0.00) - - (0.00) -
256350018 MIM-RCTC 91 TIFIA Reserve 38378TAF7 GNR 2013-071 GA 93,054.97 - - - (6,575.85) (8.62) (18.85) (477.86) 85,973.79 173.77
256350018 MIM-RCTC 91 TIFIA Reserve 3137FNAD2 FHMS K-095 A1 160,252.80 - - - (465.75) (7.57) (161.72) (212.84) 159,404.92 320.94
256350018 MIM-RCTC 91 TIFIA Reserve 9128285W6 UNITED STATES TREASURY 167,362.80 - - - - - 517.00 1,770.32 169,650.13 583.56
256350018 MIM-RCTC 91 TIFIA Reserve 3138LFGP7 FN AN2905 331,605.00 - - - (840.63) (26.14) (66.75) (1,673.96) 328,997.52 656.90
256350018 MIM-RCTC 91 TIFIA Reserve 3137BDKF2 FHR 4384 LA 38,090.68 - - - (7,537.94) (98.86) (73.08) (38.44) 30,342.35 86.55
256350018 MIM-RCTC 91 TIFIA Reserve 38377QKH9 GNR 2011-018 PG 36,942.47 - - - (5,622.29) (85.29) (69.34) (131.09) 31,034.45 74.42
256350018 MIM-RCTC 91 TIFIA Reserve 3138EKXL4 FN AL3382 40,348.11 - - - (261.67) (2.64) (6.24) (155.26) 39,922.30 77.99
256350018 MIM-RCTC 91 TIFIA Reserve 3136A7MN9 FNA 2012-M8 A2 127,760.63 - - - (10,493.30) (50.46) (101.62) (395.21) 116,720.03 223.85
256350018 MIM-RCTC 91 TIFIA Reserve 38376V2E6 GNR 2010-019 UA 95,784.65 - - - (7,508.85) (255.24) (128.21) (265.59) 87,626.76 275.04
256350018 MIM-RCTC 91 TIFIA Reserve 3137FL6P4 FHMS K-089 A2 325,820.00 - - - - - (836.68) 594.68 325,578.00 816.52
256350018 MIM-RCTC 91 TIFIA Reserve 3137BP4K2 FHMS K-IR1 A2 221,502.00 - - - - - (408.17) (951.83) 220,142.00 474.83
256350018 MIM-RCTC 91 TIFIA Reserve 3138L2QG5 FN AM2254 285,523.35 - - - (2,334.01) (135.84) (36.19) (676.10) 282,341.20 656.46
256350018 MIM-RCTC 91 TIFIA Reserve 912828L57 UNITED STATES TREASURY 1,032,340.00 - - - - - (513.25) (3,586.75) 1,028,240.00 4,471.15
256350018 MIM-RCTC 91 TIFIA Reserve 3138LFP51 FN AN3143 217,809.47 - - - (196,929.09) (7,014.55) - (13,865.84) - -
256350018 MIM-RCTC 91 TIFIA Reserve 3130AFFX0 FEDERAL HOME LOAN BANKS 240,064.00 - - - - - (577.26) (310.74) 239,176.00 812.50
256350018 MIM-RCTC 91 TIFIA Reserve 912828XB1 UNITED STATES TREASURY 488,673.00 - - - - - (522.64) (2,465.36) 485,685.00 1,241.54
256350018 MIM-RCTC 91 TIFIA Reserve 38379JM99 GNR 2015-045 AG 26,869.05 - - - (7,003.94) (24.78) (29.13) (175.01) 19,636.20 40.45
256350018 MIM-RCTC 91 TIFIA Reserve 62888VAA6 NGN 2010-R1 1A 13,549.93 - - - (13,551.27) (0.02) 0.08 1.27 - -
256350018 MIM-RCTC 91 TIFIA Reserve 36178NB99 GN AB2764 39,710.32 - - - (3,425.14) (35.75) (10.76) (171.29) 36,067.38 72.07
256350018 MIM-RCTC 91 TIFIA Reserve 38378JZD7 GNR 2013-047 EC 32,833.32 - - - (3,140.39) 32.44 18.53 (112.95) 29,630.95 36.60
256350018 MIM-RCTC 91 TIFIA Reserve 36202FA30 G2 004526 34,057.83 - - - (4,710.26) (154.26) (33.22) (86.90) 29,073.19 102.26
256350018 MIM-RCTC 91 TIFIA Reserve 3137A6B27 FHMS K-010 A2 690.61 - - - (690.95) 0.01 - 0.33 - -
256350018 MIM-RCTC 91 TIFIA Reserve 3137BJQ71 FHMS K-PLB A 216,936.00 - - - - - (288.98) (661.02) 215,986.00 461.67
256350018 MIM-RCTC 91 TIFIA Reserve 3137BLAC2 FHMS K-048 A2 66,909.00 - - - - - (171.07) 58.87 66,796.80 164.20
256350018 MIM-RCTC 91 TIFIA Reserve 36179M4J6 G2 MA0825 155,429.68 - - - (14,078.41) (154.85) (5.76) (331.80) 140,858.86 280.59
256350018 MIM-RCTC 91 TIFIA Reserve 3137BLAC2 FHMS K-048 A2 100,363.50 - - - - - (273.61) 105.31 100,195.20 246.30
256350018 MIM-RCTC 91 TIFIA Reserve 3138NJAE8 FN FN0004 13,036.30 - - - (13,039.95) (13.11) (6.50) 23.26 - -
256350018 MIM-RCTC 91 TIFIA Reserve 912828YK0 UNITED STATES TREASURY 230,703.75 - - - - - 127.21 (820.21) 230,010.75 662.95
256350018 MIM-RCTC 91 TIFIA Reserve 36202F2H8 G2 005276 170,115.88 - - - (16,069.54) (355.16) (41.55) 151.89 153,801.53 366.56
256350018 MIM-RCTC 91 TIFIA Reserve 38377RED3 GNR 2010-158 EC 156,549.31 - - - (14,734.46) (102.47) (60.47) (357.46) 141,294.45 286.61
256350018 MIM-RCTC 91 TIFIA Reserve 38376WA62 GNR 2010-015 PD 79,362.80 - - - (6,706.92) (325.10) (225.31) (19.12) 72,086.36 225.28
256350018 MIM-RCTC 91 TIFIA Reserve 38378FRB8 GNR 2013-005 JE 171,352.77 - - - (11,328.25) 160.30 57.69 (767.31) 159,475.20 259.60
256350018 MIM-RCTC 91 TIFIA Reserve 3137FPJF3 FHMS K-099 A1 212,621.76 - - - (968.35) (3.68) (67.57) (471.69) 211,110.48 369.13
256350018 MIM-RCTC 91 TIFIA Reserve 38377JZ89 GNR 2010-117 GK 44,179.26 - - - (10,137.29) (183.20) (147.22) (197.98) 33,513.57 95.26
256350018 MIM-RCTC 91 TIFIA Reserve 3137FQ3Y7 FHMS K-101 A1 212,053.56 - - - (922.07) (0.14) (16.13) (824.40) 210,290.82 358.48
256350018 MIM-RCTC 91 TIFIA Reserve 3132CJAJ2 FH SA0009 92,843.65 - - - (8,561.60) (231.70) (48.89) (176.06) 83,825.41 199.81
256350018 MIM-RCTC 91 TIFIA Reserve 912828B58 UNITED STATES TREASURY 1,197,901.60 - - - - - (789.44) (5,374.76) 1,191,737.40 10,582.27
91 CIP STAMP Portfolio Transaction Report by Account
Quarter ended December 31, 2020
Page 12 of 38
ATTACHMENT 4
30

Source
Account Account Identifier Description
Beginning Base
Market Value Base Purchases Base Sales
Base Maturities and
Redemptions Base Paydowns
Net Total Realized
Gain/Loss
Base
Amortization/Ac
cretion
Base Change In Net
Unrealized
Gain/Loss Ending Base Market Value
Ending Accrued
Income Balance
91 CIP STAMP Portfolio Transaction Report by Account
Quarter ended December 31, 2020
256350018 MIM-RCTC 91 TIFIA Reserve 31417YKF3 FN MA0293 25,190.21 - - - (1,692.33) (115.73) (15.65) (247.06) 23,119.43 79.32
256350018 MIM-RCTC 91 TIFIA Reserve 3137B5A60 FHR 4257 EK 15,611.92 - - - (2,543.23) (20.80) 1.26 (76.61) 12,972.54 26.17
256350018 MIM-RCTC 91 TIFIA Reserve 38376TTT9 GNR 2010-006 AB 40,298.06 - - - (5,531.95) (124.08) 14.43 (123.80) 34,532.65 82.74
256350018 MIM-RCTC 91 TIFIA Reserve 36179RFD6 G2 MA2864 23,528.75 - - - (2,109.04) (104.76) 10.62 60.41 21,385.99 50.83
256350018 MIM-RCTC 91 TIFIA Reserve 36179NKP2 G2 MA1202 83,929.42 - - - (7,332.20) (307.68) (14.50) 243.22 76,518.26 152.42
256350018 MIM-RCTC 91 TIFIA Reserve 36179MU24 G2 MA0601 61,652.17 - - - (5,367.99) (222.42) (23.03) 80.17 56,118.90 112.02
256350018 MIM-RCTC 91 TIFIA Reserve 36179MZV5 G2 MA0756 80,202.53 - - - (6,405.65) (267.14) (45.77) 275.46 73,759.43 146.93
256350018 MIM-RCTC 91 TIFIA Reserve 36179MEK2 G2 MA0138 104,949.37 - - - (8,339.18) (342.26) (83.83) 171.05 96,355.15 192.35
256350018 MIM-RCTC 91 TIFIA Reserve 3140JAU97 FN BM6007 80,550.46 - - - (9,710.43) (392.58) (89.83) (156.05) 70,201.57 153.87
256350018 MIM-RCTC 91 TIFIA Reserve 38378AU90 GNR 2011-158 CA 112,373.95 - - - (15,873.30) (396.16) (237.75) 13.13 95,879.87 234.21
256350018 MIM-RCTC 91 TIFIA Reserve 912828YK0 UNITED STATES TREASURY 538,308.75 - - - - - (1,558.46) (58.54) 536,691.75 1,546.88
256350018 MIM-RCTC 91 TIFIA Reserve 3138EJRP5 FN AL2293 82,853.34 - - - (24,867.65) (205.26) (230.50) (238.85) 57,311.08 216.18
256350018 MIM-RCTC 91 TIFIA Reserve 31381Q6B7 FN 468066 180,493.38 - - - (177,490.25) (1,483.45) (239.30) (1,280.37) - -
256350018 MIM-RCTC 91 TIFIA Reserve 36179MU32 G2 MA0602 108,872.33 - - - (7,910.52) (429.50) (136.95) 508.06 100,903.42 239.90
256350018 MIM-RCTC 91 TIFIA Reserve 3128MMUL5 FH G18586 141,877.91 - - - (12,880.66) (609.67) 33.20 (226.27) 128,194.52 255.45
256350018 MIM-RCTC 91 TIFIA Reserve 3620ARZE4 GN 737941 106,394.20 - - - (6,732.07) (330.00) (307.66) 178.92 99,203.39 236.45
256350018 MIM-RCTC 91 TIFIA Reserve 36176XE21 GN 778953 193,498.74 - - - (18,925.49) (931.29) (172.59) (20.67) 173,448.70 413.33
256350018 MIM-RCTC 91 TIFIA Reserve 31397UPF0 FNA 2011-M1 A3 173,618.90 - - - (46,461.51) (182.88) (340.61) (470.97) 126,162.93 392.90
256350018 MIM-RCTC 91 TIFIA Reserve 3137ABFH9 FHMS K-AIV A2 82,204.47 - - - (34,391.34) (296.91) (153.13) (355.92) 47,007.16 154.93
256350018 MIM-RCTC 91 TIFIA Reserve 3137ABFH9 FHMS K-AIV A2 69,011.16 - - - (28,871.74) (244.72) (126.21) (305.68) 39,462.80 130.07
256350018 MIM-RCTC 91 TIFIA Reserve 912828XB1 UNITED STATES TREASURY 162,891.00 - - - - - (686.33) (309.67) 161,895.00 413.85
256350018 MIM-RCTC 91 TIFIA Reserve 36179NAJ7 G2 MA0909 41,570.59 - - - (3,338.99) (181.52) (34.17) 177.51 38,193.43 90.80
256350018 MIM-RCTC 91 TIFIA Reserve 3135G05G4 FEDERAL NATIONAL MORTGAGE ASSOCIATION 424,910.75 - - - - - 56.25 1,048.75 426,015.75 504.69
256350018 MIM-RCTC 91 TIFIA Reserve 3134GWGB6 FEDERAL HOME LOAN MORTGAGE CORP 225,078.75 - - - - - - (29.25) 225,049.50 430.31
256350018 MIM-RCTC 91 TIFIA Reserve 3137AH6C7 FHMS K-015 A2 334,744.30 - - - (48,115.58) (245.94) (674.09) (1,600.15) 284,108.54 756.57
256350018 MIM-RCTC 91 TIFIA Reserve 3137BVZ74 FHMS K-063 A1 335,005.63 - - - (4,914.45) (322.73) (1,556.50) 587.00 328,798.95 779.91
256350018 MIM-RCTC 91 TIFIA Reserve 3135G03F8 FEDERAL NATIONAL MORTGAGE ASSOCIATION 260,130.00 - - (260,000.00) - - (79.89) (50.11) - -
256350018 MIM-RCTC 91 TIFIA Reserve 3137EAEC9 FEDERAL HOME LOAN MORTGAGE CORP 272,286.90 - - - - - (592.98) (36.12) 271,657.80 1,172.81
256350018 MIM-RCTC 91 TIFIA Reserve 3132A85Y1 FH ZS8063 277,012.02 - - - (19,829.89) (1,072.82) (148.26) (192.69) 255,768.36 509.90
256350018 MIM-RCTC 91 TIFIA Reserve 3132A9T64 FH ZS8673 200,753.90 - - - (21,276.45) (1,173.99) 249.82 (115.21) 178,438.06 424.88
256350018 MIM-RCTC 91 TIFIA Reserve 3134GWND4 FEDERAL HOME LOAN MORTGAGE CORP 324,337.00 - - - - - 22.50 (867.50) 323,492.00 752.92
256350018 MIM-RCTC 91 TIFIA Reserve 3137EAEV7 FEDERAL HOME LOAN MORTGAGE CORP 425,289.00 - - - - - 35.91 512.34 425,837.25 383.68
256350018 MIM-RCTC 91 TIFIA Reserve 3137FMD66 FHMS K-J24 A1 121,752.96 - - - (25,480.88) (1,263.79) 809.47 (1,229.31) 94,588.46 171.01
256350018 MIM-RCTC 91 TIFIA Reserve 31381R5T7 FN 468958 103,306.84 - - - (101,000.00) (1,084.90) - (1,221.94) - -
256350018 MIM-RCTC 91 TIFIA Reserve 3138X0ZY7 FN AU1658 50,881.51 - - - (3,662.77) (183.13) (46.89) 0.53 46,989.25 93.64
256350018 MIM-RCTC 91 TIFIA Reserve 3137FWHY9 FHMR 2020-P003 A1 200,000.00 - - - (2,791.97) 13.84 16.76 (2,225.53) 195,013.11 135.81
256350018 MIM-RCTC 91 TIFIA Reserve 31418AM39 FN MA1277 60,077.24 - - - (4,788.88) (212.50) (47.74) (34.47) 54,993.65 109.61
256350018 MIM-RCTC 91 TIFIA Reserve 3137FBAB2 FHMS K-IR3 A1 142,537.20 - - - - - (982.60) 1,203.60 142,758.20 329.12
256350018 MIM-RCTC 91 TIFIA Reserve 3134GWTL0 FEDERAL HOME LOAN MORTGAGE CORP 314,804.70 - - - - - 3.99 244.86 315,053.55 244.13
256350018 MIM-RCTC 91 TIFIA Reserve 31417YKF3 FN MA0293 35,747.53 - - - (2,401.60) (248.96) (6.37) (281.73) 32,808.88 112.57
256350018 MIM-RCTC 91 TIFIA Reserve 3128MENS6 FH G15601 - 46,608.69 - - (2,125.59) (98.29) (42.55) (4.46) 44,337.81 88.35
256350018 MIM-RCTC 91 TIFIA Reserve 3132AEFC5 FH ZT1963 - 523,473.08 - - (21,266.43) (1,648.92) (385.30) 3,866.40 504,038.82 1,356.39
256350018 MIM-RCTC 91 TIFIA Reserve 912828XB1 UNITED STATES TREASURY - 118,984.77 - - - - (381.24) 119.47 118,723.00 303.49
256350018 MIM-RCTC 91 TIFIA Reserve 36179RHM4 G2 MA2936 - 101,000.86 - - (4,518.00) (275.21) 58.79 200.19 96,466.63 264.90
256350018 MIM-RCTC 91 TIFIA Reserve 36179TF83 G2 MA4691 - 108,052.00 - - (7,673.96) (504.01) 281.27 (437.16) 99,718.15 273.80
256350018 MIM-RCTC 91 TIFIA Reserve 91282CAM3 UNITED STATES TREASURY - 695,679.69 - - - - 150.81 1,516.50 697,347.00 447.12
256350018 MIM-RCTC 91 TIFIA Reserve 3140J6FU6 FN BM1978 - 115,983.39 - - (2,370.04) (160.27) (41.86) 203.69 113,614.91 265.70
256350018 MIM-RCTC 91 TIFIA Reserve 91282CAP6 UNITED STATES TREASURY - 672,864.26 - - - - 100.08 1,563.16 674,527.50 180.80
256350018 MIM-RCTC 91 TIFIA Reserve 3134GXDT8 FEDERAL HOME LOAN MORTGAGE CORP - 160,000.00 - - - - - 68.80 160,068.80 57.56
256350018 MIM-RCTC 91 TIFIA Reserve 9128285Y2 UNITED STATES TREASURY - 175,034.09 - - - - (17.32) (2.77) 175,014.00 61.33
256350018 MIM-RCTC 91 TIFIA Reserve 91282CAE1 UNITED STATES TREASURY - 106,515.23 - - - - 23.40 711.38 107,250.00 259.68
256350018 MIM-RCTC 91 TIFIA Reserve 3135G0V75 FEDERAL NATIONAL MORTGAGE ASSOCIATION - 105,309.90 - - - - (37.83) 18.93 105,291.00 870.14
256350018 MIM-RCTC 91 TIFIA Reserve 3137B7YX1 FHMS K-037 A1 - 168,232.40 - - - - 120.74 (100.02) 168,253.12 354.57
256350018 MIM-RCTC 91 TIFIA Reserve 3137BYPQ7 FHMS K-726 A2 - 241,408.53 - - - - (367.42) 641.46 241,682.57 547.42
256350018 MIM-RCTC 91 TIFIA Reserve 3137B45W2 FHR 4243 LH - 125,688.98 - - - - - 517.69 126,206.66 38.02
256350018 MIM-RCTC 91 TIFIA Reserve 38378PZN1 GNR 2014-010 B - 114,437.00 - - - - - 218.33 114,655.33 31.73
20,995,999.37 6,883,190.36 (4,092,543.25) (885,000.00) (1,527,335.53) 17,909.26 (15,532.07) (92,256.44) 21,044,235.72 58,897.23
256350021 MIM-RCTC 2013 Residual Fund 31846V401 FIRST AMER:GVT OBLG D 427,995.83 11,907,545.44 (11,189,357.59) - - 1.02 - - 1,146,183.68 -
256350021 MIM-RCTC 2013 Residual Fund CCYUSD Payable (275,082.12) - - - - - - - (1,125,143.21) -
256350021 MIM-RCTC 2013 Residual Fund 3137AXHN6 FHMS K-024 A1 10,848.50 - - - (2,504.36) 96.23 312.85 (434.56) 8,318.65 12.07
256350021 MIM-RCTC 2013 Residual Fund 3137B1UF7 FHMS K-027 A1 9,437.69 - - - (1,276.15) 8.52 6.34 (37.66) 8,138.73 11.99
256350021 MIM-RCTC 2013 Residual Fund 912828UH1 UNITED STATES TREASURY 34,707.61 - (34,922.89) - - 1,275.30 177.21 (1,237.23) - -
256350021 MIM-RCTC 2013 Residual Fund 38378AWX5 GNR 2011-157 QA 601.65 - - - (601.71) (0.05) 0.32 (0.21) - -
256350021 MIM-RCTC 2013 Residual Fund 3137AWQG3 FHMS K-023 A1 18,325.82 - - - (2,801.87) 24.10 19.14 (75.32) 15,491.87 20.29
256350021 MIM-RCTC 2013 Residual Fund 912828L57 UNITED STATES TREASURY 103,234.00 - - - - - 229.78 (639.78) 102,824.00 447.12
256350021 MIM-RCTC 2013 Residual Fund 658886DZ6 NORTH DAKOTA ST HSG FIN AGY MTG REV 100,000.00 - - - - - - - 100,000.00 70.60
256350021 MIM-RCTC 2013 Residual Fund 65478DAD9 NAROT 2018-A A3 33,792.61 - - - (14,263.34) 11.22 7.24 (162.73) 19,385.01 22.74
256350021 MIM-RCTC 2013 Residual Fund 912828UH1 UNITED STATES TREASURY 69,415.21 - (69,845.77) - - 2,856.50 380.58 (2,806.52) - -
256350021 MIM-RCTC 2013 Residual Fund 65478HAD0 NAROT 2017-C A3 21,952.37 - - - (10,509.68) 24.48 19.16 (113.37) 11,372.96 10.69
256350021 MIM-RCTC 2013 Residual Fund 31397LUK3 FNR 2008-45 DB 66,782.29 - - - (15,452.56) (130.83) (43.13) (304.19) 50,851.57 186.67
256350021 MIM-RCTC 2013 Residual Fund 3136A5KR6 FNR 2012-31 AD 29,040.30 - - - (19,565.17) 91.56 31.39 (170.02) 9,428.07 13.75
256350021 MIM-RCTC 2013 Residual Fund 3138L1W62 FN AM1568 123,377.50 - - - (633.27) 2.79 40.74 (43.04) 122,744.71 264.44
256350021 MIM-RCTC 2013 Residual Fund 47789JAB2 JDOT 2019 A2 13,530.59 - - - (13,504.52) 0.02 0.03 (26.12) - -
256350021 MIM-RCTC 2013 Residual Fund 172967LC3 CITIGROUP INC 256,812.50 - - - - - 15.06 (1,425.06) 255,402.50 463.19
256350021 MIM-RCTC 2013 Residual Fund 172967LC3 CITIGROUP INC 205,450.00 - - - - - 20.86 (1,148.86) 204,322.00 370.56
256350021 MIM-RCTC 2013 Residual Fund 31680YAB3 FITAT 2019-1 A2A 30,486.48 - - - (29,205.56) 0.10 0.09 (90.33) 1,190.79 1.41
256350021 MIM-RCTC 2013 Residual Fund 3138L8H23 FN AM7448 66,709.14 - - - (66,733.17) 172.56 6.79 (155.32) - -
256350021 MIM-RCTC 2013 Residual Fund 86787EBD8 TRUIST BANK 50,326.00 - - - - - - (22.00) 50,304.00 50.75
256350021 MIM-RCTC 2013 Residual Fund 025816CE7 AMERICAN EXPRESS CO 100,602.00 - - - - - - 33.00 100,635.00 98.47
256350021 MIM-RCTC 2013 Residual Fund 3137AWQG3 FHMS K-023 A1 12,217.21 - - - (1,867.92) 15.88 12.58 (49.85) 10,327.91 13.53
256350021 MIM-RCTC 2013 Residual Fund 3620ARB67 GN 737261 51,840.97 - - - (4,723.52) (127.53) (25.84) (115.21) 46,848.87 147.14
256350021 MIM-RCTC 2013 Residual Fund 38378KW47 GNR 2013-138 A 48,100.60 - - - (5,912.61) 13.92 12.43 (63.25) 42,151.10 75.28
256350021 MIM-RCTC 2013 Residual Fund 3137A2PV7 FHR 3760 BA 21,844.74 - - - (2,275.14) 26.70 22.83 (75.14) 19,544.00 24.26
Page 13 of 38
31
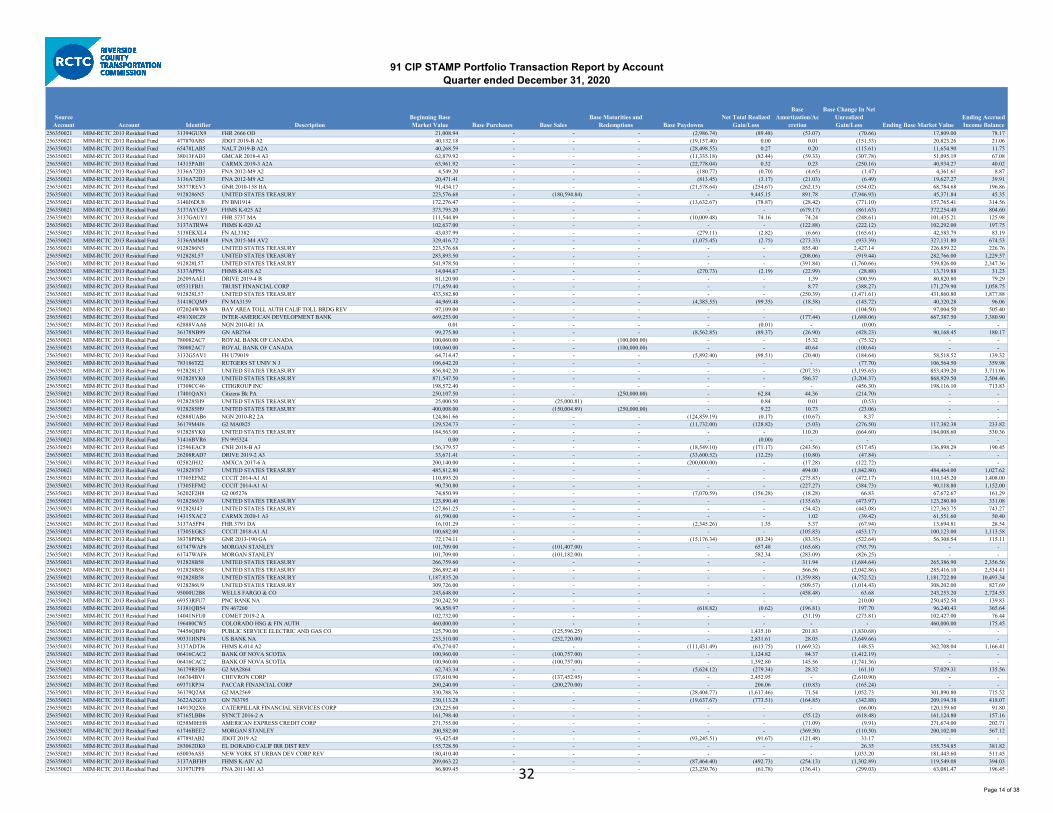
Source
Account Account Identifier Description
Beginning Base
Market Value Base Purchases Base Sales
Base Maturities and
Redemptions Base Paydowns
Net Total Realized
Gain/Loss
Base
Amortization/Ac
cretion
Base Change In Net
Unrealized
Gain/Loss Ending Base Market Value
Ending Accrued
Income Balance
91 CIP STAMP Portfolio Transaction Report by Account
Quarter ended December 31, 2020
256350021 MIM-RCTC 2013 Residual Fund 31394GUX9 FHR 2666 OD 21,008.94 - - - (2,986.74) (89.48) (53.07) (70.66) 17,809.00 78.17
256350021 MIM-RCTC 2013 Residual Fund 477870AB5 JDOT 2019-B A2 40,132.18 - - - (19,157.40) 0.00 0.01 (151.53) 20,823.26 21.06
256350021 MIM-RCTC 2013 Residual Fund 65478LAB5 NALT 2019-B A2A 40,268.59 - - - (28,498.55) 0.27 0.20 (115.61) 11,654.90 11.75
256350021 MIM-RCTC 2013 Residual Fund 38013FAD3 GMCAR 2018-4 A3 62,879.92 - - - (11,335.18) (82.44) (59.33) (307.78) 51,095.19 67.08
256350021 MIM-RCTC 2013 Residual Fund 14315PAB1 CARMX 2019-3 A2A 63,961.92 - - - (22,778.04) 0.32 0.23 (250.16) 40,934.27 40.02
256350021 MIM-RCTC 2013 Residual Fund 3136A72D3 FNA 2012-M9 A2 4,549.20 - - - (180.77) (0.70) (4.65) (1.47) 4,361.61 8.87
256350021 MIM-RCTC 2013 Residual Fund 3136A72D3 FNA 2012-M9 A2 20,471.41 - - - (813.45) (3.17) (21.03) (6.49) 19,627.27 39.91
256350021 MIM-RCTC 2013 Residual Fund 38377REV3 GNR 2010-158 HA 91,434.17 - - - (21,578.64) (254.67) (262.15) (554.02) 68,784.68 196.86
256350021 MIM-RCTC 2013 Residual Fund 9128286N5 UNITED STATES TREASURY 223,576.68 - (180,594.84) - - 9,445.15 891.78 (7,946.93) 45,371.84 45.35
256350021 MIM-RCTC 2013 Residual Fund 3140J6DU8 FN BM1914 172,276.47 - - - (13,632.67) (78.87) (28.42) (771.10) 157,765.41 314.56
256350021 MIM-RCTC 2013 Residual Fund 3137AYCE9 FHMS K-025 A2 373,795.20 - - - - - (679.17) (861.63) 372,254.40 804.60
256350021 MIM-RCTC 2013 Residual Fund 3137GAUY1 FHR 3737 MA 111,544.89 - - - (10,009.48) 74.16 74.24 (248.61) 101,435.21 125.98
256350021 MIM-RCTC 2013 Residual Fund 3137ATRW4 FHMS K-020 A2 102,637.00 - - - - - (122.88) (222.12) 102,292.00 197.75
256350021 MIM-RCTC 2013 Residual Fund 3138EKXL4 FN AL3382 43,037.99 - - - (279.11) (2.82) (6.66) (165.61) 42,583.79 83.19
256350021 MIM-RCTC 2013 Residual Fund 3136AMM48 FNA 2015-M4 AV2 329,416.72 - - - (1,075.45) (2.75) (273.33) (933.39) 327,131.80 674.53
256350021 MIM-RCTC 2013 Residual Fund 9128286N5 UNITED STATES TREASURY 223,576.68 - - - - - 855.40 2,427.14 226,859.22 226.76
256350021 MIM-RCTC 2013 Residual Fund 912828L57 UNITED STATES TREASURY 283,893.50 - - - - - (208.06) (919.44) 282,766.00 1,229.57
256350021 MIM-RCTC 2013 Residual Fund 912828L57 UNITED STATES TREASURY 541,978.50 - - - - - (391.84) (1,760.66) 539,826.00 2,347.36
256350021 MIM-RCTC 2013 Residual Fund 3137APP61 FHMS K-018 A2 14,044.67 - - - (270.73) (2.19) (22.99) (28.88) 13,719.88 31.23
256350021 MIM-RCTC 2013 Residual Fund 26209AAE1 DRIVE 2019-4 B 81,120.00 - - - - - 1.39 (300.59) 80,820.80 79.29
256350021 MIM-RCTC 2013 Residual Fund 05531FBJ1 TRUIST FINANCIAL CORP 171,659.40 - - - - - 8.77 (388.27) 171,279.90 1,058.75
256350021 MIM-RCTC 2013 Residual Fund 912828L57 UNITED STATES TREASURY 433,582.80 - - - - - (250.39) (1,471.61) 431,860.80 1,877.88
256350021 MIM-RCTC 2013 Residual Fund 31418CQM9 FN MA3159 44,969.48 - - - (4,385.55) (99.35) (18.58) (145.72) 40,320.28 96.06
256350021 MIM-RCTC 2013 Residual Fund 072024WW8 BAY AREA TOLL AUTH CALIF TOLL BRDG REV 97,109.00 - - - - - - (104.50) 97,004.50 505.40
256350021 MIM-RCTC 2013 Residual Fund 4581X0CZ9 INTER-AMERICAN DEVELOPMENT BANK 669,253.00 - - - - - (177.44) (1,688.06) 667,387.50 3,380.90
256350021 MIM-RCTC 2013 Residual Fund 62888VAA6 NGN 2010-R1 1A 0.01 - - - - (0.01) - (0.00) - -
256350021 MIM-RCTC 2013 Residual Fund 36178NB99 GN AB2764 99,275.80 - - - (8,562.85) (89.37) (26.90) (428.23) 90,168.45 180.17
256350021 MIM-RCTC 2013 Residual Fund 780082AC7 ROYAL BANK OF CANADA 100,060.00 - - (100,000.00) - - 15.32 (75.32) - -
256350021 MIM-RCTC 2013 Residual Fund 780082AC7 ROYAL BANK OF CANADA 100,060.00 - - (100,000.00) - - 40.64 (100.64) - -
256350021 MIM-RCTC 2013 Residual Fund 3132G5AV1 FH U79019 64,714.47 - - - (5,892.40) (98.51) (20.40) (184.64) 58,518.52 139.32
256350021 MIM-RCTC 2013 Residual Fund 783186TZ2 RUTGERS ST UNIV N J 106,642.20 - - - - - - (77.70) 106,564.50 359.98
256350021 MIM-RCTC 2013 Residual Fund 912828L57 UNITED STATES TREASURY 856,842.20 - - - - - (207.35) (3,195.65) 853,439.20 3,711.06
256350021 MIM-RCTC 2013 Residual Fund 912828YK0 UNITED STATES TREASURY 871,547.50 - - - - - 586.37 (3,204.37) 868,929.50 2,504.46
256350021 MIM-RCTC 2013 Residual Fund 17308CC46 CITIGROUP INC 198,572.40 - - - - - - (456.30) 198,116.10 713.83
256350021 MIM-RCTC 2013 Residual Fund 17401QAN1 Citizens Bk PA 250,107.50 - - (250,000.00) - 62.84 44.36 (214.70) - -
256350021 MIM-RCTC 2013 Residual Fund 9128285H9 UNITED STATES TREASURY 25,000.50 - (25,000.81) - - 0.84 0.01 (0.53) - -
256350021 MIM-RCTC 2013 Residual Fund 9128285H9 UNITED STATES TREASURY 400,008.00 - (150,004.89) (250,000.00) - 9.22 10.73 (23.06) - -
256350021 MIM-RCTC 2013 Residual Fund 62888UAB6 NGN 2010-R2 2A 124,861.66 - - - (124,859.19) (0.17) (10.67) 8.37 - -
256350021 MIM-RCTC 2013 Residual Fund 36179M4J6 G2 MA0825 129,524.73 - - - (11,732.00) (128.82) (5.03) (276.50) 117,382.38 233.82
256350021 MIM-RCTC 2013 Residual Fund 912828YK0 UNITED STATES TREASURY 184,563.00 - - - - - 110.20 (664.60) 184,008.60 530.36
256350021 MIM-RCTC 2013 Residual Fund 31416BVR6 FN 995324 0.00 - - - - (0.00) - - - -
256350021 MIM-RCTC 2013 Residual Fund 12596EAC8 CNH 2018-B A3 156,379.57 - - - (18,549.10) (171.17) (243.56) (517.45) 136,898.29 190.45
256350021 MIM-RCTC 2013 Residual Fund 26208RAD7 DRIVE 2019-2 A3 33,671.41 - - - (33,600.52) (12.25) (10.80) (47.84) - -
256350021 MIM-RCTC 2013 Residual Fund 02582JHJ2 AMXCA 2017-6 A 200,140.00 - - - (200,000.00) - (17.28) (122.72) - -
256350021 MIM-RCTC 2013 Residual Fund 912828T67 UNITED STATES TREASURY 485,812.80 - - - - - 494.00 (1,842.80) 484,464.00 1,027.62
256350021 MIM-RCTC 2013 Residual Fund 17305EFM2 CCCIT 2014-A1 A1 110,893.20 - - - - - (275.83) (472.17) 110,145.20 1,408.00
256350021 MIM-RCTC 2013 Residual Fund 17305EFM2 CCCIT 2014-A1 A1 90,730.80 - - - - - (227.27) (384.73) 90,118.80 1,152.00
256350021 MIM-RCTC 2013 Residual Fund 36202F2H8 G2 005276 74,850.99 - - - (7,070.59) (156.28) (18.28) 66.83 67,672.67 161.29
256350021 MIM-RCTC 2013 Residual Fund 9128286U9 UNITED STATES TREASURY 123,890.40 - - - - - (135.63) (473.97) 123,280.80 331.08
256350021 MIM-RCTC 2013 Residual Fund 912828J43 UNITED STATES TREASURY 127,861.25 - - - - - (54.42) (443.08) 127,363.75 743.27
256350021 MIM-RCTC 2013 Residual Fund 14315XAC2 CARMX 2020-1 A3 61,590.00 - - - - - 1.02 (39.42) 61,551.60 50.40
256350021 MIM-RCTC 2013 Residual Fund 3137A5FP4 FHR 3791 DA 16,101.29 - - - (2,345.26) 1.35 5.37 (67.94) 13,694.81 28.54
256350021 MIM-RCTC 2013 Residual Fund 17305EGK5 CCCIT 2018-A1 A1 100,682.00 - - - - - (105.83) (453.17) 100,123.00 1,113.58
256350021 MIM-RCTC 2013 Residual Fund 38378PPK8 GNR 2013-190 GA 72,174.11 - - - (15,176.34) (83.24) (83.35) (522.64) 56,308.54 115.11
256350021 MIM-RCTC 2013 Residual Fund 61747WAF6 MORGAN STANLEY 101,709.00 - (101,407.00) - - 657.48 (165.68) (793.79) - -
256350021 MIM-RCTC 2013 Residual Fund 61747WAF6 MORGAN STANLEY 101,709.00 - (101,182.00) - - 582.34 (283.09) (826.25) - -
256350021 MIM-RCTC 2013 Residual Fund 912828B58 UNITED STATES TREASURY 266,759.60 - - - - - 311.94 (1,684.64) 265,386.90 2,356.56
256350021 MIM-RCTC 2013 Residual Fund 912828B58 UNITED STATES TREASURY 286,892.40 - - - - - 566.56 (2,042.86) 285,416.10 2,534.41
256350021 MIM-RCTC 2013 Residual Fund 912828B58 UNITED STATES TREASURY 1,187,835.20 - - - - - (1,359.88) (4,752.52) 1,181,722.80 10,493.34
256350021 MIM-RCTC 2013 Residual Fund 9128286U9 UNITED STATES TREASURY 309,726.00 - - - - - (509.57) (1,014.43) 308,202.00 827.69
256350021 MIM-RCTC 2013 Residual Fund 95000U2B8 WELLS FARGO & CO 243,648.00 - - - - - (458.48) 63.68 243,253.20 2,724.53
256350021 MIM-RCTC 2013 Residual Fund 69353RFU7 PNC BANK NA 250,242.50 - - - - - - 210.00 250,452.50 139.83
256350021 MIM-RCTC 2013 Residual Fund 31381QB54 FN 467260 96,858.97 - - - (618.82) (0.62) (196.81) 197.70 96,240.43 365.64
256350021 MIM-RCTC 2013 Residual Fund 14041NFU0 COMET 2019-2 A 102,732.00 - - - - - (31.19) (273.81) 102,427.00 76.44
256350021 MIM-RCTC 2013 Residual Fund 196480CW5 COLORADO HSG & FIN AUTH 460,000.00 - - - - - - - 460,000.00 175.45
256350021 MIM-RCTC 2013 Residual Fund 74456QBP0 PUBLIC SERVICE ELECTRIC AND GAS CO 125,790.00 - (125,596.25) - - 1,435.10 201.83 (1,830.68) - -
256350021 MIM-RCTC 2013 Residual Fund 90331HNP4 US BANK NA 253,510.00 - (252,720.00) - - 2,831.61 28.05 (3,649.66) - -
256350021 MIM-RCTC 2013 Residual Fund 3137ADTJ6 FHMS K-014 A2 476,274.07 - - - (111,431.49) (613.75) (1,669.32) 148.53 362,708.04 1,166.41
256350021 MIM-RCTC 2013 Residual Fund 06416CAC2 BANK OF NOVA SCOTIA 100,960.00 - (100,757.00) - - 1,124.82 84.37 (1,412.19) - -
256350021 MIM-RCTC 2013 Residual Fund 06416CAC2 BANK OF NOVA SCOTIA 100,960.00 - (100,757.00) - - 1,392.80 145.56 (1,741.36) - -
256350021 MIM-RCTC 2013 Residual Fund 36179RFD6 G2 MA2864 62,743.34 - - - (5,624.12) (279.34) 28.32 161.10 57,029.31 135.56
256350021 MIM-RCTC 2013 Residual Fund 166764BV1 CHEVRON CORP 137,610.90 - (137,452.95) - - 2,452.95 - (2,610.90) - -
256350021 MIM-RCTC 2013 Residual Fund 69371RP34 PACCAR FINANCIAL CORP 200,240.00 - (200,270.00) - - 206.06 (10.83) (165.24) - -
256350021 MIM-RCTC 2013 Residual Fund 36179Q2A8 G2 MA2569 330,788.76 - - - (28,404.77) (1,617.46) 71.54 1,052.73 301,890.80 715.52
256350021 MIM-RCTC 2013 Residual Fund 3622A2GC0 GN 783795 230,113.28 - - - (19,637.67) (773.51) (164.85) (342.88) 209,194.38 418.07
256350021 MIM-RCTC 2013 Residual Fund 14913Q2X6 CATERPILLAR FINANCIAL SERVICES CORP 120,225.60 - - - - - - (66.00) 120,159.60 91.80
256350021 MIM-RCTC 2013 Residual Fund 87165LBB6 SYNCT 2016-2 A 161,798.40 - - - - - (55.12) (618.48) 161,124.80 157.16
256350021 MIM-RCTC 2013 Residual Fund 0258M0EH8 AMERICAN EXPRESS CREDIT CORP 271,755.00 - - - - - (71.09) (9.91) 271,674.00 202.71
256350021 MIM-RCTC 2013 Residual Fund 61746BEE2 MORGAN STANLEY 200,582.00 - - - - - (369.50) (110.50) 200,102.00 567.12
256350021 MIM-RCTC 2013 Residual Fund 47789JAB2 JDOT 2019 A2 93,425.48 - - - (93,245.51) (91.67) (121.48) 33.17 - -
256350021 MIM-RCTC 2013 Residual Fund 283062DK0 EL DORADO CALIF IRR DIST REV 155,728.50 - - - - - - 26.35 155,754.85 381.82
256350021 MIM-RCTC 2013 Residual Fund 650036AS5 NEW YORK ST URBAN DEV CORP REV 180,410.40 - - - - - - 1,033.20 181,443.60 511.45
256350021 MIM-RCTC 2013 Residual Fund 3137ABFH9 FHMS K-AIV A2 209,063.22 - - - (87,464.40) (492.73) (254.13) (1,302.89) 119,549.08 394.03
256350021 MIM-RCTC 2013 Residual Fund 31397UPF0 FNA 2011-M1 A3 86,809.45 - - - (23,230.76) (61.78) (136.41) (299.03) 63,081.47 196.45
Page 14 of 38
32

Source
Account Account Identifier Description
Beginning Base
Market Value Base Purchases Base Sales
Base Maturities and
Redemptions Base Paydowns
Net Total Realized
Gain/Loss
Base
Amortization/Ac
cretion
Base Change In Net
Unrealized
Gain/Loss Ending Base Market Value
Ending Accrued
Income Balance
91 CIP STAMP Portfolio Transaction Report by Account
Quarter ended December 31, 2020
256350021 MIM-RCTC 2013 Residual Fund 194740PF7 COLLIN CNTY TEX 176,298.50 - - - - - - 544.25 176,842.75 640.62
256350021 MIM-RCTC 2013 Residual Fund 3138L2GH4 FN AM1999 89,160.00 - - - (630.11) 5.18 197.22 (994.05) 87,738.24 141.16
256350021 MIM-RCTC 2013 Residual Fund 3138L2GH4 FN AM1999 33,965.72 - - - (240.04) 0.66 20.82 (323.06) 33,424.09 53.78
256350021 MIM-RCTC 2013 Residual Fund 31381RLL6 FN 468431 51,878.90 - - - (294.59) (0.55) (50.90) (362.58) 51,170.28 168.80
256350021 MIM-RCTC 2013 Residual Fund 14913R2D8 CATERPILLAR FINANCIAL SERVICES CORP 200,952.00 - - - - - 9.26 714.74 201,676.00 624.72
256350021 MIM-RCTC 2013 Residual Fund 64971QWL3 NEW YORK N Y CITY TRANSITIONAL FIN AUTH REV 163,884.60 - - - - - (798.52) 426.52 163,512.60 1,750.21
256350021 MIM-RCTC 2013 Residual Fund 916544ES4 UPPER SANTA CLARA VY JT PWRS AUTH CALIF REV 170,178.50 - - - - - - 399.50 170,578.00 507.36
256350021 MIM-RCTC 2013 Residual Fund 3134GV6H6 FEDERAL HOME LOAN MORTGAGE CORP 400,228.00 - - - - - 4.46 107.54 400,340.00 572.44
256350021 MIM-RCTC 2013 Residual Fund 3134GWGB6 FEDERAL HOME LOAN MORTGAGE CORP 300,105.00 - - - - - - (39.00) 300,066.00 573.75
256350021 MIM-RCTC 2013 Residual Fund 3137BJP56 FHMS K-046 A1 47,821.09 - - - (2,512.27) (101.81) (133.16) 80.12 45,153.97 97.59
256350021 MIM-RCTC 2013 Residual Fund 3137AH6C7 FHMS K-015 A2 38,256.49 - - - (5,498.93) (48.90) (134.03) (105.08) 32,469.55 86.47
256350021 MIM-RCTC 2013 Residual Fund 3137BFE80 FHMS K-041 A1 321,144.00 - - - (16,936.60) (698.12) (958.72) 1,448.77 303,999.33 660.73
256350021 MIM-RCTC 2013 Residual Fund 9128285H9 UNITED STATES TREASURY 1,000,020.00 - - (1,000,000.00) - - (41.66) 21.66 - -
256350021 MIM-RCTC 2013 Residual Fund 31381RZ23 FN 468861 59,864.76 - - - (368.24) (0.87) (120.18) (353.59) 59,021.89 194.24
256350021 MIM-RCTC 2013 Residual Fund 3135G03F8 FEDERAL NATIONAL MORTGAGE ASSOCIATION 325,162.50 - - (325,000.00) - - (99.87) (62.63) - -
256350021 MIM-RCTC 2013 Residual Fund 3132A85Y1 FH ZS8063 347,141.65 - - - (24,850.11) (1,344.42) (185.79) (241.48) 320,519.85 638.99
256350021 MIM-RCTC 2013 Residual Fund 31418CQM9 FN MA3159 71,451.52 - - - (6,968.16) (372.84) (49.40) 3.34 64,064.46 152.62
256350021 MIM-RCTC 2013 Residual Fund 438516CC8 HONEYWELL INTERNATIONAL INC 265,437.25 - - - - - - (13.25) 265,424.00 469.32
256350021 MIM-RCTC 2013 Residual Fund 9128285Y2 UNITED STATES TREASURY 2,300,736.00 - (1,150,293.66) - - (11.29) (480.89) 141.84 1,150,092.00 403.02
256350021 MIM-RCTC 2013 Residual Fund 3136A5KR6 FNR 2012-31 AD 34,165.06 - - - (23,017.84) (17.21) (15.65) (22.51) 11,091.85 16.18
256350021 MIM-RCTC 2013 Residual Fund 34528QHK3 FORDF 2020-1 A1 225,589.50 - - - - - 1.09 1,002.41 226,593.00 70.00
256350021 MIM-RCTC 2013 Residual Fund 43813KAA0 HAROT 2020-3 A1 609,993.90 - - - (271,061.18) 0.01 - 6.10 338,938.83 24.88
256350021 MIM-RCTC 2013 Residual Fund 362569AH8 GMALT 2020-3 A1 675,000.00 - - - (392,996.30) 0.01 - - 282,003.71 15.35
256350021 MIM-RCTC 2013 Residual Fund 3134GWTL0 FEDERAL HOME LOAN MORTGAGE CORP 269,832.60 - - - - - 3.42 209.88 270,045.90 209.25
256350021 MIM-RCTC 2013 Residual Fund 02665JMF4 American Honda Finance Corporation 499,835.00 - - (500,000.00) - - 281.25 (116.25) - -
256350021 MIM-RCTC 2013 Residual Fund 9128285H9 UNITED STATES TREASURY 275,005.50 - - (275,000.00) - - (11.22) 5.72 - -
256350021 MIM-RCTC 2013 Residual Fund 3134GWY42 FEDERAL HOME LOAN MORTGAGE CORP - 299,850.00 - - - - 10.95 130.05 299,991.00 195.00
256350021 MIM-RCTC 2013 Residual Fund 06051GHC6 BANK OF AMERICA CORP - 194,412.80 - - - - (925.82) 1,227.37 194,714.35 169.81
256350021 MIM-RCTC 2013 Residual Fund 3132AEFC5 FH ZT1963 - 202,511.49 - - (8,227.15) (637.91) (149.06) 1,495.75 194,993.12 524.74
256350021 MIM-RCTC 2013 Residual Fund 3136G46A6 FEDERAL NATIONAL MORTGAGE ASSOCIATION - 414,896.25 - - - - 6.25 109.95 415,012.45 221.33
256350021 MIM-RCTC 2013 Residual Fund 3140J7Q32 FEDERAL NATIONAL MORTGAGE ASSOCIATION - 52,709.91 - - (2,554.05) (200.07) 16.26 778.23 50,750.29 135.31
256350021 MIM-RCTC 2013 Residual Fund 912828YK0 UNITED STATES TREASURY - 808,885.94 - - - - (1,762.66) 470.02 807,593.30 2,327.68
256350021 MIM-RCTC 2013 Residual Fund 912828ZD5 UNITED STATES TREASURY - 539,325.98 - - - - (302.35) 325.92 539,349.55 798.07
256350021 MIM-RCTC 2013 Residual Fund 912828ZD5 UNITED STATES TREASURY - 554,318.36 - - - - (301.79) 454.93 554,471.50 820.44
256350021 MIM-RCTC 2013 Residual Fund 65602VS72 NORINCHUKIN BANK (NEW YORK BRANCH) - 450,063.51 - - - - (44.08) 34.57 450,054.00 588.75
256350021 MIM-RCTC 2013 Residual Fund 912828ZD5 UNITED STATES TREASURY - 478,562.50 - - - - (237.31) 536.56 478,861.75 708.56
256350021 MIM-RCTC 2013 Residual Fund 46647PAY2 JPMORGAN CHASE & CO - 270,261.95 - - - - (1,192.66) 830.06 269,899.35 711.85
256350021 MIM-RCTC 2013 Residual Fund 06051GJH3 BANK OF AMERICA CORP - 205,604.75 - - - - (29.61) 1,339.56 206,914.70 322.88
256350021 MIM-RCTC 2013 Residual Fund 912828ZP8 UNITED STATES TREASURY - 808,354.69 - - - - 90.33 1,336.28 809,781.30 131.46
256350021 MIM-RCTC 2013 Residual Fund 6174468T9 MORGAN STANLEY - 380,000.00 - - - - - 881.60 380,881.60 283.73
256350021 MIM-RCTC 2013 Residual Fund 38141GXL3 GOLDMAN SACHS GROUP INC - 235,000.00 - - - - - 951.75 235,951.75 171.90
256350021 MIM-RCTC 2013 Residual Fund 863667BB6 STRYKER CORP - 159,860.80 - - - - 4.90 387.10 160,252.80 101.33
256350021 MIM-RCTC 2013 Residual Fund 9128285Y2 UNITED STATES TREASURY - 275,053.57 - - - - (27.22) (4.35) 275,022.00 96.37
256350021 MIM-RCTC 2013 Residual Fund 637432MV4 NATIONAL RURAL UTILITIES COOPERATIVE FINANCE CORP - 178,234.65 - - - - (55.27) (210.38) 177,969.00 716.83
256350021 MIM-RCTC 2013 Residual Fund 025816CD9 AMERICAN EXPRESS CO - 154,734.00 - - - - - 13.50 154,747.50 504.17
256350021 MIM-RCTC 2013 Residual Fund 38141GXL3 GOLDMAN SACHS GROUP INC - 251,140.00 - - - - - (127.50) 251,012.50 195.94
256350021 MIM-RCTC 2013 Residual Fund 95000U2B8 WELLS FARGO & CO - 258,962.50 - - - - - (182.50) 258,780.00 2,953.13
256350021 MIM-RCTC 2013 Residual Fund 3140J8ME0 FN BM3956 - 106,652.25 - - - - - 109.45 106,761.70 149.95
256350021 MIM-RCTC 2013 Residual Fund 91282CAP6 UNITED STATES TREASURY - 349,753.91 - - - - - 1.09 349,755.00 97.36
26,921,094.71 19,536,695.25 (13,920,162.65) (2,800,000.00) (1,882,413.67) 15,924.58 (11,516.95) (49,619.07) 26,959,940.10 76,172.21
256350023 MIM-Sr Lien Reserve Fund-1 31846V401 FIRST AMER:GVT OBLG D 40,622.74 3,550,826.36 (3,468,273.08) - - 0.02 - - 123,176.02 -
256350023 MIM-Sr Lien Reserve Fund-1 3136A72D3 FNA 2012-M9 A2 179,693.57 - - - (7,140.30) 49.67 83.42 (402.55) 172,283.82 350.31
256350023 MIM-Sr Lien Reserve Fund-1 3137AUPE3 FHMS K-021 A2 6,171.66 - - - - - 11.32 (24.46) 6,158.52 11.98
256350023 MIM-Sr Lien Reserve Fund-1 3137AUPE3 FHMS K-021 A2 148,119.84 - - - - - (104.26) (211.10) 147,804.48 287.52
256350023 MIM-Sr Lien Reserve Fund-1 38379KDN5 GNR 2015-029 AD 81,457.23 - - - (10,523.76) 35.81 198.16 (1,009.03) 70,158.41 126.89
256350023 MIM-Sr Lien Reserve Fund-1 36202F2H8 G2 005276 88,460.26 - - - (8,356.16) (204.53) (3.23) 80.45 79,976.80 190.61
256350023 MIM-Sr Lien Reserve Fund-1 38378XP62 GNR 2014-166 PL 213,662.01 - - - (45,861.46) (447.69) 67.02 (1,988.87) 165,431.01 328.31
256350023 MIM-Sr Lien Reserve Fund-1 912828L57 UNITED STATES TREASURY 851,680.50 - (850,102.67) - - 28,281.27 171.45 (30,030.55) - -
256350023 MIM-Sr Lien Reserve Fund-1 912828L57 UNITED STATES TREASURY 567,787.00 - (334,429.68) - - 10,355.56 190.85 (12,549.72) 231,354.00 1,006.01
256350023 MIM-Sr Lien Reserve Fund-1 38378KWU9 GNR 2013-096 A 30,955.44 - - - (369.30) 3.13 6.03 158.23 30,753.52 35.61
256350023 MIM-Sr Lien Reserve Fund-1 38378KWU9 GNR 2013-096 A 8,254.78 - - - (98.48) 0.68 1.55 42.41 8,200.94 9.50
256350023 MIM-Sr Lien Reserve Fund-1 3138EJPZ5 FN AL2239 190,811.03 - - - (1,303.15) (27.78) (410.50) (607.76) 188,461.84 476.21
256350023 MIM-Sr Lien Reserve Fund-1 3137EADB2 FEDERAL HOME LOAN MORTGAGE CORP 565,878.50 - (563,662.00) - - 16,655.90 452.34 (19,324.74) - -
256350023 MIM-Sr Lien Reserve Fund-1 3137EADB2 FEDERAL HOME LOAN MORTGAGE CORP 205,774.00 - (204,968.00) - - 3,357.25 (245.39) (3,917.86) - -
256350023 MIM-Sr Lien Reserve Fund-1 3137EADB2 FEDERAL HOME LOAN MORTGAGE CORP 205,774.00 - (204,968.00) - - 3,731.25 (188.20) (4,349.06) - -
256350023 MIM-Sr Lien Reserve Fund-1 3136A7MN9 FNA 2012-M8 A2 232,292.06 - - - (19,078.73) (132.38) (293.44) (569.26) 212,218.25 406.99
256350023 MIM-Sr Lien Reserve Fund-1 912828G38 UNITED STATES TREASURY 1,462,117.50 - - - - - (630.91) (7,172.09) 1,454,314.50 3,943.72
256350023 MIM-Sr Lien Reserve Fund-1 31417YKF3 FN MA0293 52,191.39 - - - (3,506.33) (115.22) 83.57 (752.45) 47,900.96 164.35
256350023 MIM-Sr Lien Reserve Fund-1 38378KRS0 GNR 2013-078 AG 464,175.00 - - - - - 225.52 795.98 465,196.50 895.72
256350023 MIM-Sr Lien Reserve Fund-1 38377JZ89 GNR 2010-117 GK 23,562.27 - - - (5,406.55) (45.95) (70.18) (165.68) 17,873.90 50.81
256350023 MIM-Sr Lien Reserve Fund-1 38378KXW4 GNR 2013-105 A 69,834.09 - - - (5,342.55) 8.08 3.89 41.49 64,545.01 91.15
256350023 MIM-Sr Lien Reserve Fund-1 912828V49 UNITED STATES TREASURY 265,532.66 - (266,926.67) - - 25,740.92 1,120.48 (25,467.39) - -
256350023 MIM-Sr Lien Reserve Fund-1 912828V49 UNITED STATES TREASURY 64,907.98 - (65,588.50) - - 5,975.73 275.25 (5,570.47) - -
256350023 MIM-Sr Lien Reserve Fund-1 3138EKXL4 FN AL3382 174,841.81 - - - (1,133.88) 0.85 170.41 (882.56) 172,996.63 337.96
256350023 MIM-Sr Lien Reserve Fund-1 38378KSL4 GNR 2013-074 AL 239,744.25 - - - - - (149.94) (759.06) 238,835.25 524.64
256350023 MIM-Sr Lien Reserve Fund-1 38378KSL4 GNR 2013-074 AL 213,106.00 - - - - - (9.41) (798.60) 212,298.00 466.35
256350023 MIM-Sr Lien Reserve Fund-1 38376T5Z1 GNR 2010-004 PD 52,433.17 - - - (3,669.05) (90.11) (69.06) (356.93) 48,248.02 115.72
256350023 MIM-Sr Lien Reserve Fund-1 38378TAF7 GNR 2013-071 GA 85,896.90 - - - (6,070.02) 4.20 (5.76) (464.90) 79,360.42 160.41
256350023 MIM-Sr Lien Reserve Fund-1 38380AZ34 GNR 2016-147 DA 110,840.30 - - - (13,300.68) (314.89) (133.74) 99.88 97,190.87 229.57
256350023 MIM-Sr Lien Reserve Fund-1 3136AHAE0 FNA 2013-M14 APT 39,700.54 - - - (6,438.46) (85.90) (46.44) (793.09) 32,336.64 68.10
256350023 MIM-Sr Lien Reserve Fund-1 38378CRT6 GNR 2012-013 EG 29,689.17 - - - (4,580.89) 73.88 120.44 (365.88) 24,936.71 40.71
256350023 MIM-Sr Lien Reserve Fund-1 38376WA62 GNR 2010-015 PD 23,808.84 - - - (2,012.08) (121.65) (237.94) 188.73 21,625.91 67.58
256350023 MIM-Sr Lien Reserve Fund-1 912828XB1 UNITED STATES TREASURY 1,058,791.50 - - - - - (650.99) (5,823.01) 1,052,317.50 2,690.00
Page 15 of 38
33

Source
Account Account Identifier Description
Beginning Base
Market Value Base Purchases Base Sales
Base Maturities and
Redemptions Base Paydowns
Net Total Realized
Gain/Loss
Base
Amortization/Ac
cretion
Base Change In Net
Unrealized
Gain/Loss Ending Base Market Value
Ending Accrued
Income Balance
91 CIP STAMP Portfolio Transaction Report by Account
Quarter ended December 31, 2020
256350023 MIM-Sr Lien Reserve Fund-1 38378B6A2 GNR 2013-012 AB 103,608.46 - - - (644.18) 9.41 33.59 523.40 103,530.69 154.34
256350023 MIM-Sr Lien Reserve Fund-1 38377RVK8 GNR 2010-166 GP 33,084.00 - - - (2,916.53) (25.11) (34.83) (137.01) 29,970.52 72.82
256350023 MIM-Sr Lien Reserve Fund-1 38377RVK8 GNR 2010-166 GP 19,850.40 - - - (1,749.92) (28.08) (35.63) (54.46) 17,982.31 43.69
256350023 MIM-Sr Lien Reserve Fund-1 3137AXHP1 FHMS K-024 A2 145,294.80 - - - - - (121.55) (948.05) 144,225.20 300.18
256350023 MIM-Sr Lien Reserve Fund-1 3137B1U75 FHMS K-S01 A2 369,841.55 - - - (20,213.63) (205.39) (536.30) (1,089.93) 347,796.31 711.04
256350023 MIM-Sr Lien Reserve Fund-1 3137ATRW4 FHMS K-020 A2 128,296.25 - - - - - (0.12) (431.13) 127,865.00 247.19
256350023 MIM-Sr Lien Reserve Fund-1 38378B7F0 GNR 2013-033 B 206,904.00 - - - - - 237.36 80.64 207,222.00 378.83
256350023 MIM-Sr Lien Reserve Fund-1 38378B7F0 GNR 2013-033 B 258,630.00 - - - - - 701.24 (303.74) 259,027.50 473.54
256350023 MIM-Sr Lien Reserve Fund-1 CCYUSD Receivable 0.71 - - - - - - - - -
256350023 MIM-Sr Lien Reserve Fund-1 38376WA62 GNR 2010-015 PD 23,279.75 - - - (1,967.36) (62.77) (92.87) (11.42) 21,145.33 66.08
256350023 MIM-Sr Lien Reserve Fund-1 3136AC7J4 FNA 2013-M6 2A 39,863.87 - - - (2,100.80) 16.44 30.13 (240.84) 37,568.79 76.33
256350023 MIM-Sr Lien Reserve Fund-1 3138EKXL4 FN AL3382 13,449.37 - - - (87.22) 1.16 29.58 (85.46) 13,307.43 26.00
256350023 MIM-Sr Lien Reserve Fund-1 38377RVK8 GNR 2010-166 GP 12,498.40 - - - (1,101.80) 11.37 10.15 (95.93) 11,322.19 27.51
256350023 MIM-Sr Lien Reserve Fund-1 38378AWX5 GNR 2011-157 QA 1,804.95 - - - (1,805.23) (0.04) 1.61 (1.28) - -
256350023 MIM-Sr Lien Reserve Fund-1 3137ATRW4 FHMS K-020 A2 161,252.99 - - - - - 241.00 (783.03) 160,710.96 310.69
256350023 MIM-Sr Lien Reserve Fund-1 3138EKXL4 FN AL3382 10,759.50 - - - (69.78) 1.21 28.11 (73.09) 10,645.95 20.80
256350023 MIM-Sr Lien Reserve Fund-1 38378KWU9 GNR 2013-096 A 30,955.44 - - - (369.30) 15.89 58.30 93.19 30,753.52 35.61
256350023 MIM-Sr Lien Reserve Fund-1 36202F2H8 G2 005276 21,094.37 - - - (1,992.62) (0.68) (0.23) (29.44) 19,071.39 45.45
256350023 MIM-Sr Lien Reserve Fund-1 38379HLE3 GNR 2014-184 WK 14,261.08 - - - (14,163.62) 25.02 (0.40) (122.08) - -
256350023 MIM-Sr Lien Reserve Fund-1 38378VC45 GNR 2013-116 MA 103,605.39 - - - (11,909.12) 318.48 222.85 (934.81) 91,302.79 166.55
256350023 MIM-Sr Lien Reserve Fund-1 38377JM59 GNR 2010-111 PE 41,274.34 - - - (9,572.05) 136.57 128.47 (495.39) 31,471.94 64.64
256350023 MIM-Sr Lien Reserve Fund-1 912828XB1 UNITED STATES TREASURY 162,891.00 - - - - - 184.86 (1,180.86) 161,895.00 413.85
256350023 MIM-Sr Lien Reserve Fund-1 38376WA62 GNR 2010-015 PD 95,632.18 - - - (8,081.84) (134.45) (168.75) (383.07) 86,864.06 271.46
256350023 MIM-Sr Lien Reserve Fund-1 3136A5KR6 FNR 2012-31 AD 18,904.67 - - - (12,736.55) 59.62 20.43 (110.68) 6,137.49 8.95
256350023 MIM-Sr Lien Reserve Fund-1 31417YKF3 FN MA0293 54,862.81 - - - (3,685.80) (117.67) 20.30 (726.87) 50,352.77 172.76
256350023 MIM-Sr Lien Reserve Fund-1 3138L1W62 FN AM1568 161,339.80 - - - (828.10) 3.62 53.28 (56.29) 160,512.32 345.81
256350023 MIM-Sr Lien Reserve Fund-1 38378HXH4 GNR 2012-119 KB 11,008.25 - - - (1,007.81) 24.58 11.14 (43.13) 9,993.02 10.30
256350023 MIM-Sr Lien Reserve Fund-1 3137B5A60 FHR 4257 EK 17,098.77 - - - (2,785.44) 23.81 (0.87) (128.25) 14,208.02 28.66
256350023 MIM-Sr Lien Reserve Fund-1 3137B4HD1 FHR 4247 AK 28,609.44 - - - (2,489.34) (69.71) (32.90) (116.06) 25,901.43 91.55
256350023 MIM-Sr Lien Reserve Fund-1 3137F4D41 FHMS K-074 A2 35,124.60 - - - - - (42.92) 94.22 35,175.90 90.00
256350023 MIM-Sr Lien Reserve Fund-1 3137F4D41 FHMS K-074 A2 5,854.10 - - - - - (6.10) 14.65 5,862.65 15.00
256350023 MIM-Sr Lien Reserve Fund-1 38375XCM4 GNR 2008-047 PC 39,810.36 - - - (7,384.71) (125.10) (113.59) (320.97) 31,865.99 128.81
256350023 MIM-Sr Lien Reserve Fund-1 9128285W6 UNITED STATES TREASURY 119,544.86 - (119,441.78) - - 13,995.46 218.28 (14,316.83) - -
256350023 MIM-Sr Lien Reserve Fund-1 38378KWU9 GNR 2013-096 A 20,636.96 - - - (246.20) 11.53 55.39 44.67 20,502.35 23.74
256350023 MIM-Sr Lien Reserve Fund-1 3136ADFF1 FNR 2013-36 KC 73,360.82 - - - (12,703.96) 130.59 58.09 (298.88) 60,546.66 75.26
256350023 MIM-Sr Lien Reserve Fund-1 3620ARB67 GN 737261 79,146.53 - - - (7,211.47) (194.71) (39.45) (175.89) 71,525.00 224.64
256350023 MIM-Sr Lien Reserve Fund-1 3137FBAJ5 FHMS K-IR3 A2 229,610.00 - - - - - (366.30) (217.70) 229,026.00 546.83
256350023 MIM-Sr Lien Reserve Fund-1 38377REV3 GNR 2010-158 HA 42,669.28 - - - (10,070.03) (118.85) (122.34) (258.54) 32,099.52 91.87
256350023 MIM-Sr Lien Reserve Fund-1 3137B1BS0 FHMS K-026 A2 373,262.40 - - - - - (308.09) (1,207.51) 371,746.80 753.00
256350023 MIM-Sr Lien Reserve Fund-1 3137FNAD2 FHMS K-095 A1 144,227.52 - - - (419.18) (6.81) (145.55) (191.55) 143,464.43 288.85
256350023 MIM-Sr Lien Reserve Fund-1 3138LFGP7 FN AN2905 303,971.25 - - - (770.58) (23.96) (61.18) (1,534.47) 301,581.06 602.16
256350023 MIM-Sr Lien Reserve Fund-1 38377QKH9 GNR 2011-018 PG 34,239.37 - - - (5,210.91) (79.05) (64.27) (121.50) 28,763.64 68.98
256350023 MIM-Sr Lien Reserve Fund-1 9128285W6 UNITED STATES TREASURY 179,317.29 - (29,860.44) - - 2,367.37 433.26 (784.15) 151,473.33 521.04
256350023 MIM-Sr Lien Reserve Fund-1 3130AFFX0 FEDERAL HOME LOAN BANKS 222,059.20 - - - - - (533.97) (287.43) 221,237.80 751.56
256350023 MIM-Sr Lien Reserve Fund-1 38379JM99 GNR 2015-045 AG 24,949.84 - - - (6,503.66) (23.01) (27.05) (162.51) 18,233.61 37.57
256350023 MIM-Sr Lien Reserve Fund-1 62888VAA6 NGN 2010-R1 1A 54,952.49 - - - (54,957.99) 0.00 (0.09) 5.59 - -
256350023 MIM-Sr Lien Reserve Fund-1 36178NB99 GN AB2764 29,782.73 - - - (2,568.85) (26.82) (8.07) (128.47) 27,050.53 54.05
256350023 MIM-Sr Lien Reserve Fund-1 38378JZD7 GNR 2013-047 EC 30,901.95 - - - (2,955.66) 30.53 17.44 (106.31) 27,887.95 34.45
256350023 MIM-Sr Lien Reserve Fund-1 36202FA30 G2 004526 31,333.21 - - - (4,333.43) (141.93) (30.57) (79.95) 26,747.33 94.08
256350023 MIM-Sr Lien Reserve Fund-1 3137BDKF2 FHR 4384 LA 47,613.35 - - - (9,422.42) (142.79) (97.41) (22.79) 37,927.95 108.19
256350023 MIM-Sr Lien Reserve Fund-1 36179M4J6 G2 MA0825 38,857.42 - - - (3,519.61) (38.70) (1.44) (82.95) 35,214.72 70.15
256350023 MIM-Sr Lien Reserve Fund-1 3138NJAE8 FN FN0004 7,821.78 - - - (7,823.97) 0.26 (1.18) 3.11 - -
256350023 MIM-Sr Lien Reserve Fund-1 3138NJAE8 FN FN0004 5,214.52 - - - (5,215.98) (5.24) (2.60) 9.30 - -
256350023 MIM-Sr Lien Reserve Fund-1 912828YK0 UNITED STATES TREASURY 210,196.75 - - - - - 115.91 (747.31) 209,565.35 604.02
256350023 MIM-Sr Lien Reserve Fund-1 912828YK0 UNITED STATES TREASURY 476,787.75 - - - - - 376.27 (1,808.47) 475,355.55 1,370.09
256350023 MIM-Sr Lien Reserve Fund-1 3137A5FP4 FHR 3791 DA 26,934.10 - - - (3,923.13) 2.25 8.99 (113.66) 22,908.55 47.74
256350023 MIM-Sr Lien Reserve Fund-1 3137A5FP4 FHR 3791 DA 18,106.96 - - - (2,637.39) 3.34 21.59 (93.78) 15,400.71 32.10
256350023 MIM-Sr Lien Reserve Fund-1 38378FRB8 GNR 2013-005 JE 162,334.21 - - - (10,732.02) 151.85 54.65 (726.92) 151,081.77 245.93
256350023 MIM-Sr Lien Reserve Fund-1 3137FPJF3 FHMS K-099 A1 196,675.13 - - - (895.72) (3.40) (62.50) (436.31) 195,277.19 341.45
256350023 MIM-Sr Lien Reserve Fund-1 3137FQ3Y7 FHMS K-101 A1 196,149.55 - - - (852.92) (0.13) (14.92) (762.57) 194,519.01 331.59
256350023 MIM-Sr Lien Reserve Fund-1 38377JZ89 GNR 2010-117 GK 14,726.42 - - - (3,379.10) (61.07) (49.07) (65.99) 11,171.18 31.75
256350023 MIM-Sr Lien Reserve Fund-1 3132CJAJ2 FH SA0009 85,416.16 - - - (7,876.66) (213.18) (44.98) (161.98) 77,119.37 183.83
256350023 MIM-Sr Lien Reserve Fund-1 38378CNY9 GNR 2012-007 MD 9,776.93 - - - (9,775.47) (5.85) (0.59) 4.98 - -
256350023 MIM-Sr Lien Reserve Fund-1 38376TTT9 GNR 2010-006 AB 37,074.21 - - - (5,089.38) (114.17) 13.27 (113.90) 31,770.04 76.12
256350023 MIM-Sr Lien Reserve Fund-1 31381QB54 FN 467260 126,337.78 - - - (807.16) (0.80) (256.71) 257.87 125,530.99 476.92
256350023 MIM-Sr Lien Reserve Fund-1 36179NHK7 G2 MA1134 179,562.68 - - - (14,221.05) (578.36) (80.37) 500.34 165,183.24 392.69
256350023 MIM-Sr Lien Reserve Fund-1 36179RFD6 G2 MA2864 23,528.75 - - - (2,109.04) (104.78) 10.62 60.43 21,385.99 50.83
256350023 MIM-Sr Lien Reserve Fund-1 36179MU24 G2 MA0601 56,909.69 - - - (4,955.06) (205.31) (21.26) 74.01 51,802.06 103.40
256350023 MIM-Sr Lien Reserve Fund-1 36179MZV5 G2 MA0756 73,936.71 - - - (5,905.21) (246.27) (42.19) 253.94 67,996.98 135.45
256350023 MIM-Sr Lien Reserve Fund-1 36179NKP2 G2 MA1202 83,929.42 - - - (7,332.20) (307.68) (14.50) 243.22 76,518.26 152.42
256350023 MIM-Sr Lien Reserve Fund-1 36179MEK2 G2 MA0138 96,876.34 - - - (7,697.70) (315.94) (77.38) 157.89 88,943.22 177.55
256350023 MIM-Sr Lien Reserve Fund-1 3137FGZN8 FHMS K-I02 A 23,566.39 - - - (23,572.51) 70.71 62.39 (126.97) - -
256350023 MIM-Sr Lien Reserve Fund-1 3137B1UG5 FHMS K-027 A2 145,847.80 - - - - - (588.33) (37.47) 145,222.00 307.65
256350023 MIM-Sr Lien Reserve Fund-1 3140JAU97 FN BM6007 73,837.92 - - - (8,901.23) (359.86) (82.34) (143.05) 64,351.44 141.04
256350023 MIM-Sr Lien Reserve Fund-1 38378AU90 GNR 2011-158 CA 103,343.90 - - - (14,597.78) (364.31) (218.64) 12.07 88,175.24 215.39
256350023 MIM-Sr Lien Reserve Fund-1 31381Q6B7 FN 468066 180,493.38 - - - (177,490.24) (2,258.67) (339.45) (405.02) - -
256350023 MIM-Sr Lien Reserve Fund-1 36179MKL3 G2 MA0299 101,018.01 - - - (8,548.77) (350.83) (61.09) 220.65 92,277.96 185.61
256350023 MIM-Sr Lien Reserve Fund-1 3128MMUL5 FH G18586 137,301.20 - - - (12,465.14) (590.02) 32.13 (218.97) 124,059.21 247.21
256350023 MIM-Sr Lien Reserve Fund-1 3620ARZE4 GN 737941 96,261.43 - - - (6,090.91) (298.58) (278.36) 161.88 89,755.46 213.93
256350023 MIM-Sr Lien Reserve Fund-1 36179MU32 G2 MA0602 100,497.53 - - - (7,302.03) (396.45) (126.42) 468.98 93,141.61 221.45
256350023 MIM-Sr Lien Reserve Fund-1 36176XE21 GN 778953 177,929.89 - - - (17,402.75) (856.36) (158.70) (19.01) 159,493.07 380.07
256350023 MIM-Sr Lien Reserve Fund-1 3137ABFH9 FHMS K-AIV A2 101,487.00 - - - (42,458.46) (391.61) (201.98) (401.42) 58,033.53 191.28
256350023 MIM-Sr Lien Reserve Fund-1 3137ARVU7 FHR 4073 AJ 200,741.82 - - - (58,537.85) (675.48) (449.00) 203.73 141,283.23 350.55
256350023 MIM-Sr Lien Reserve Fund-1 36179NAJ7 G2 MA0909 38,452.80 - - - (3,088.57) (167.90) (31.61) 164.20 35,328.92 83.99
256350023 MIM-Sr Lien Reserve Fund-1 36202F3H7 G2 005300 67,897.23 - - - (6,011.13) (287.74) (64.23) 258.15 61,792.28 146.93
256350023 MIM-Sr Lien Reserve Fund-1 3137B1UG5 FHMS K-027 A2 104,177.00 - - - - - (501.46) 54.46 103,730.00 219.75
256350023 MIM-Sr Lien Reserve Fund-1 3135G05G4 FEDERAL NATIONAL MORTGAGE ASSOCIATION 199,958.00 - - - - - 26.47 493.53 200,478.00 237.50
Page 16 of 38
34

Source
Account Account Identifier Description
Beginning Base
Market Value Base Purchases Base Sales
Base Maturities and
Redemptions Base Paydowns
Net Total Realized
Gain/Loss
Base
Amortization/Ac
cretion
Base Change In Net
Unrealized
Gain/Loss Ending Base Market Value
Ending Accrued
Income Balance
91 CIP STAMP Portfolio Transaction Report by Account
Quarter ended December 31, 2020
256350023 MIM-Sr Lien Reserve Fund-1 3134GWGB6 FEDERAL HOME LOAN MORTGAGE CORP 200,070.00 - - - - - - (26.00) 200,044.00 382.50
256350023 MIM-Sr Lien Reserve Fund-1 3137BVZ74 FHMS K-063 A1 287,147.68 - - - (4,212.39) (276.62) (1,334.14) 503.14 281,827.67 668.49
256350023 MIM-Sr Lien Reserve Fund-1 3135G03F8 FEDERAL NATIONAL MORTGAGE ASSOCIATION 240,120.00 - - (240,000.00) - - (73.75) (46.25) - -
256350023 MIM-Sr Lien Reserve Fund-1 3136AC7J4 FNA 2013-M6 2A 8,858.64 - - - (466.85) 0.00 - (43.17) 8,348.63 16.96
256350023 MIM-Sr Lien Reserve Fund-1 3132A85Y1 FH ZS8063 255,973.14 - - - (18,323.82) (991.34) (137.00) (178.06) 236,342.92 471.17
256350023 MIM-Sr Lien Reserve Fund-1 3132A9T64 FH ZS8673 186,414.33 - - - (19,756.70) (1,090.14) 231.97 (106.99) 165,692.48 394.53
256350023 MIM-Sr Lien Reserve Fund-1 3134GWND4 FEDERAL HOME LOAN MORTGAGE CORP 299,388.00 - - - - - 20.77 (800.77) 298,608.00 695.00
256350023 MIM-Sr Lien Reserve Fund-1 3137EAEV7 FEDERAL HOME LOAN MORTGAGE CORP 400,272.00 - - - - - 33.80 482.20 400,788.00 361.11
256350023 MIM-Sr Lien Reserve Fund-1 3137AWQG3 FHMS K-023 A1 73,303.27 - - - (11,207.50) (90.15) (92.68) 54.52 61,967.46 81.16
256350023 MIM-Sr Lien Reserve Fund-1 3137FMD66 FHMS K-J24 A1 121,752.96 - - - (25,480.88) (1,263.79) 809.47 (1,229.31) 94,588.46 171.01
256350023 MIM-Sr Lien Reserve Fund-1 31381R5T7 FN 468958 132,969.20 - - - (130,000.00) (643.89) - (2,325.31) - -
256350023 MIM-Sr Lien Reserve Fund-1 3138X0ZY7 FN AU1658 46,255.91 - - - (3,329.79) (166.48) (42.62) 0.48 42,717.50 85.13
256350023 MIM-Sr Lien Reserve Fund-1 3137FWHY9 FHMR 2020-P003 A1 200,000.00 - - - (2,791.97) 13.84 16.76 (2,225.53) 195,013.11 135.81
256350023 MIM-Sr Lien Reserve Fund-1 31418AM39 FN MA1277 55,543.11 - - - (4,427.45) (196.46) (44.14) (31.87) 50,843.19 101.34
256350023 MIM-Sr Lien Reserve Fund-1 3137FBAB2 FHMS K-IR3 A1 131,572.80 - - - - - (907.02) 1,111.02 131,776.80 303.80
256350023 MIM-Sr Lien Reserve Fund-1 3134GWTL0 FEDERAL HOME LOAN MORTGAGE CORP 289,820.20 - - - - - 3.67 225.43 290,049.30 224.75
256350023 MIM-Sr Lien Reserve Fund-1 3128MENS6 FH G15601 - 37,286.96 - - (1,700.48) (78.62) (34.04) (3.58) 35,470.24 70.68
256350023 MIM-Sr Lien Reserve Fund-1 3132AEFC5 FH ZT1963 - 485,263.37 - - (19,714.13) (1,528.57) (357.18) 3,584.18 467,247.67 1,257.39
256350023 MIM-Sr Lien Reserve Fund-1 912828XB1 UNITED STATES TREASURY - 135,209.96 - - - - (433.23) 135.77 134,912.50 344.87
256350023 MIM-Sr Lien Reserve Fund-1 36179TF83 G2 MA4691 - 96,046.22 - - (6,821.30) (448.00) 250.02 (388.57) 88,638.36 243.37
256350023 MIM-Sr Lien Reserve Fund-1 36179RHM4 G2 MA2936 - 86,572.17 - - (3,872.58) (235.89) 50.39 171.58 82,685.68 227.06
256350023 MIM-Sr Lien Reserve Fund-1 91282CAM3 UNITED STATES TREASURY - 422,376.95 - - - - 91.57 920.73 423,389.25 271.46
256350023 MIM-Sr Lien Reserve Fund-1 3140J6FU6 FN BM1978 - 105,439.43 - - (2,154.58) (145.70) (38.05) 185.18 103,286.29 241.54
256350023 MIM-Sr Lien Reserve Fund-1 91282CAP6 UNITED STATES TREASURY - 19,936.72 - - - - 2.97 46.31 19,986.00 5.36
256350023 MIM-Sr Lien Reserve Fund-1 3134GXDT8 FEDERAL HOME LOAN MORTGAGE CORP - 145,000.00 - - - - - 62.35 145,062.35 52.16
256350023 MIM-Sr Lien Reserve Fund-1 9128285Y2 UNITED STATES TREASURY - 150,029.22 (150,018.49) - - (0.67) (10.06) - - -
256350023 MIM-Sr Lien Reserve Fund-1 91282CAE1 UNITED STATES TREASURY - 87,148.83 - - - - 19.14 582.03 87,750.00 212.47
256350023 MIM-Sr Lien Reserve Fund-1 38377YTL4 GNR 2011-136 GA - 23,516.63 - - - - 13.70 108.43 23,638.76 38.69
256350023 MIM-Sr Lien Reserve Fund-1 3135G05G4 FEDERAL NATIONAL MORTGAGE ASSOCIATION - 200,292.00 - - - - (3.00) 189.00 200,478.00 237.50
256350023 MIM-Sr Lien Reserve Fund-1 3135G0V75 FEDERAL NATIONAL MORTGAGE ASSOCIATION - 447,567.08 - - - - (160.76) 80.43 447,486.75 3,698.09
256350023 MIM-Sr Lien Reserve Fund-1 3137BYPQ7 FHMS K-726 A2 - 241,408.52 - - - - (367.42) 641.47 241,682.57 547.42
19,370,318.43 6,233,920.43 (6,258,239.31) (240,000.00) (1,116,705.48) 92,231.08 (5,804.13) (152,075.37) 17,923,644.91 41,658.63
Page 17 of 38
35

*Negative cash reflects securities in transit at month end
91 CIP STAMP Portfolio Summary of Investments for quarter ended December 31, 2020
Credit Rating Industry Group
Asset Class Security Type Market Sector
ATTACHMENT 5
36

*Negative cash reflects securities in transit at month end
91 CIP STAMP Portfolio
Series A & Series B Reserve Fund Summary of Investments for quarter ended December 31, 2020
Credit Rating Industry Group
Asset Class Security Type Market Sector
ATTACHMENT 6
37

*Negative cash reflects securities in transit at month end
91 CIP STAMP Portfolio
Residual Fund Required Retained Balance Summary of Investments for quarter ended December 31, 2020
Credit Rating Industry Group
Asset Class Security Type Market Sector
ATTACHMENT 7
38

*Negative cash reflects securities in transit at month end
91 CIP STAMP Portfolio
TIFIA Reserve Fund Summary of Investments for quarter ended December 31, 2020
Credit Rating Industry Group
Asset Class Security Type Market Sector
ATTACHMENT 8
39

Source
Account Account Identifier
Security Type
Category Issuer Final Maturity Trade Date Current Face Value Original Cost Next Call Date Base Market Value
Base Net Total
Unrealized
Gain/Loss Coupon Yield
Summarized
Credit Rating
240907004 MIM-RCTC Toll Revenue: - I-15 3134GV6H6 Agency Freddie Mac 10/20/2022 07/20/2020 500,000.00 499,850.00 07/20/2021 500,425.00 545.31 0.320 0.166 AAA
240907004 MIM-RCTC Toll Revenue: - I-15 3135G05F6 Agency Federal National Mortgage Association 07/08/2022 11/03/2020 1,250,000.00 1,252,443.00 --- 1,252,300.00 110.48 0.270 0.151 AAA
240907004 MIM-RCTC Toll Revenue: - I-15 3134GWEH5 Agency Freddie Mac 07/27/2022 07/27/2020 750,000.00 749,850.00 07/27/2021 750,322.50 440.53 0.280 0.205 AAA
240907004 MIM-RCTC Toll Revenue: - I-15 3134GWHG4 Agency Freddie Mac 08/04/2023 07/30/2020 1,000,000.00 1,000,000.00 02/04/2021 1,000,230.00 230.00 0.450 0.199 AAA
240907004 MIM-RCTC Toll Revenue: - I-15 3133EL7F5 Agency Federal Farm Credit Banks Funding Corporation 09/15/2022 09/16/2020 1,000,000.00 999,300.00 03/15/2021 999,640.00 237.40 0.180 0.201 AAA
240907004 MIM-RCTC Toll Revenue: - I-15 3134GXJF2 Agency Freddie Mac 12/30/2022 12/15/2020 405,000.00 404,989.88 06/30/2021 404,959.50 (30.41) 0.200 0.205 AAA
240907020 RCTC I-15 Prj RAMP UP RESERVE 3137EADB2 Agency Freddie Mac 01/13/2022 09/30/2019 400,000.00 406,425.20 --- 409,248.00 6,310.48 2.375 0.135 AAA
240907020 RCTC I-15 Prj RAMP UP RESERVE 3134GV6H6 Agency Freddie Mac 10/20/2022 07/22/2020 125,000.00 124,987.50 07/20/2021 125,106.25 116.29 0.320 0.166 AAA
240907020 RCTC I-15 Prj RAMP UP RESERVE 3135G05F6 Agency Federal National Mortgage Association 07/08/2022 11/03/2020 100,000.00 100,195.44 --- 100,184.00 8.84 0.270 0.151 AAA
240907020 RCTC I-15 Prj RAMP UP RESERVE 3134GWGB6 Agency Freddie Mac 07/28/2023 07/22/2020 100,000.00 100,000.00 01/28/2021 100,022.00 22.00 0.450 0.156 AAA
240907020 RCTC I-15 Prj RAMP UP RESERVE 3137EAEV7 Agency Freddie Mac 08/24/2023 08/19/2020 175,000.00 174,821.50 --- 175,344.75 501.87 0.250 0.175 AAA
240907020 RCTC I-15 Prj RAMP UP RESERVE 3133EL7F5 Agency Federal Farm Credit Banks Funding Corporation 09/15/2022 09/15/2020 200,000.00 199,880.00 03/15/2021 199,928.00 30.41 0.180 0.201 AAA
240907020 RCTC I-15 Prj RAMP UP RESERVE 3134GWTL0 Agency Freddie Mac 09/28/2023 09/23/2020 85,000.00 84,987.25 09/28/2021 85,014.45 26.09 0.300 0.277 AAA
240907020 RCTC I-15 Prj RAMP UP RESERVE 3134GWY42 Agency Freddie Mac 10/13/2023 10/07/2020 100,000.00 99,950.00 10/13/2021 99,997.00 43.35 0.300 0.301 AAA
240907020 RCTC I-15 Prj RAMP UP RESERVE 3136G46A6 Agency Federal National Mortgage Association 10/27/2023 10/20/2020 130,000.00 129,967.50 10/27/2021 130,003.90 34.44 0.300 0.296 AAA
240907020 RCTC I-15 Prj RAMP UP RESERVE 3134GXDT8 Agency Freddie Mac 11/24/2023 --- 135,000.00 135,035.00 05/24/2021 135,058.05 23.05 0.350 0.242 AAA
240907020 RCTC I-15 Prj RAMP UP RESERVE 38377REV3 Agency CMO Government National Mortgage Association 10/20/2039 07/01/2019 14,623.74 14,913.93 --- 14,903.35 153.09 3.500 -0.027 AAA
240907020 RCTC I-15 Prj RAMP UP RESERVE 3137A6Z47 Agency CMO Freddie Mac 01/15/2041 08/31/2020 37,377.13 39,327.75 --- 39,407.83 (159.39) 4.500 1.079 AAA
240907020 RCTC I-15 Prj RAMP UP RESERVE 3137AH6C7 Agency CMO Freddie Mac 07/25/2021 11/29/2018 80,308.15 80,452.45 --- 81,173.87 837.94 3.230 0.468 AAA
240907020 RCTC I-15 Prj RAMP UP RESERVE 38376V2E6 Agency CMO Government National Mortgage Association 07/16/2039 08/06/2019 16,044.12 16,695.92 --- 17,038.54 465.31 4.000 0.541 AAA
240907020 RCTC I-15 Prj RAMP UP RESERVE 3137AJMF8 Agency CMO Freddie Mac 10/25/2021 11/29/2018 91,007.79 90,705.62 --- 92,335.59 1,539.51 2.968 0.438 AAA
240907020 RCTC I-15 Prj RAMP UP RESERVE 38375XCM4 Agency CMO Government National Mortgage Association 11/16/2037 05/14/2019 13,613.83 13,999.38 --- 14,032.73 225.12 5.000 0.638 AAA
240907020 RCTC I-15 Prj RAMP UP RESERVE 383742C76 Agency CMO Government National Mortgage Association 08/16/2037 01/31/2018 38,968.56 39,942.78 --- 39,989.54 553.99 4.000 1.615 AAA
240907020 RCTC I-15 Prj RAMP UP RESERVE 3137ATRW4 Agency CMO Freddie Mac 05/25/2022 09/26/2018 100,000.00 97,238.28 --- 102,292.00 3,410.76 2.373 0.400 AAA
240907020 RCTC I-15 Prj RAMP UP RESERVE 3137ASR97 Agency CMO Freddie Mac 01/25/2022 02/27/2018 3,841.65 3,755.21 --- 3,847.06 21.66 1.573 0.422 AAA
240907020 RCTC I-15 Prj RAMP UP RESERVE 3136A72D3 Agency CMO Federal National Mortgage Association 04/25/2022 07/26/2019 10,719.45 10,782.17 --- 10,904.04 145.20 2.482 0.404 AAA
240907020 RCTC I-15 Prj RAMP UP RESERVE 3137AYCE9 Agency CMO Freddie Mac 10/25/2022 08/13/2019 100,000.00 102,164.06 --- 103,404.00 2,265.32 2.682 0.582 AAA
240907020 RCTC I-15 Prj RAMP UP RESERVE 38378HXH4 Agency CMO Government National Mortgage Association 09/16/2027 03/08/2019 4,494.15 4,260.63 --- 4,542.28 231.74 1.250 0.615 AAA
240907020 RCTC I-15 Prj RAMP UP RESERVE 31392J6N4 Agency CMO Federal National Mortgage Association 04/25/2023 12/05/2017 180,383.76 196,236.04 --- 187,142.74 (400.16) 5.500 1.056 AAA
240907020 RCTC I-15 Prj RAMP UP RESERVE 3137B84S3 Agency CMO Freddie Mac 02/15/2029 01/31/2018 54,358.34 53,678.86 --- 55,267.76 1,320.55 2.000 0.696 AAA
240907020 RCTC I-15 Prj RAMP UP RESERVE 3137A5FP4 Agency CMO Freddie Mac 01/15/2021 01/30/2018 23,494.77 23,553.51 --- 23,486.08 (8.69) 2.500 1.055 AAA
240907020 RCTC I-15 Prj RAMP UP RESERVE 38378JZD7 Agency CMO Government National Mortgage Association 12/20/2040 10/16/2019 12,057.61 11,906.90 --- 12,200.98 262.98 1.500 0.608 AAA
240907020 RCTC I-15 Prj RAMP UP RESERVE 38377QKH9 Agency CMO Government National Mortgage Association 08/20/2040 08/20/2019 12,343.23 12,567.44 --- 12,867.94 359.14 3.000 -0.436 AAA
240907020 RCTC I-15 Prj RAMP UP RESERVE 3137B45W2 Agency CMO Freddie Mac 09/15/2030 12/30/2020 93,333.39 94,266.73 --- 94,654.99 388.26 2.750 0.662 AAA
240907020 RCTC I-15 Prj RAMP UP RESERVE 3137ARVU7 Agency CMO Freddie Mac 08/15/2038 06/30/2020 61,957.83 62,819.43 --- 62,427.47 (109.24) 3.000 0.579 AAA
240907020 RCTC I-15 Prj RAMP UP RESERVE 38378VC45 Agency CMO Government National Mortgage Association 12/16/2041 11/23/2018 39,818.69 38,381.49 --- 40,928.84 2,117.13 2.250 0.591 AAA
240907020 RCTC I-15 Prj RAMP UP RESERVE 38377JM59 Agency CMO Government National Mortgage Association 10/20/2039 11/21/2018 13,940.08 13,591.58 --- 14,139.56 358.59 2.500 0.206 AAA
240907020 RCTC I-15 Prj RAMP UP RESERVE 3137ARBX3 Agency CMO Freddie Mac 03/15/2039 03/14/2019 11,603.49 11,438.51 --- 11,609.99 111.75 0.509 0.344 AAA
240907020 RCTC I-15 Prj RAMP UP RESERVE 38379JM99 Agency CMO Government National Mortgage Association 02/16/2041 08/28/2019 7,859.80 7,910.45 --- 7,947.98 69.95 2.500 -0.121 AAA
240907020 RCTC I-15 Prj RAMP UP RESERVE 38378PZN1 Agency CMO Government National Mortgage Association 03/16/2039 12/30/2020 46,177.51 46,256.88 --- 46,345.14 88.26 2.500 0.214 AAA
240907004 MIM-RCTC Toll Revenue: - I-15 31416BTW8 Agency MBS Federal National Mortgage Association 01/01/2024 09/03/2019 207,771.27 216,731.42 --- 216,933.99 3,050.28 5.500 0.396 AAA
240907004 MIM-RCTC Toll Revenue: - I-15 3137B36H6 Agency MBS Freddie Mac 10/25/2022 --- 102,278.18 104,030.94 --- 103,771.44 26.65 2.839 0.213 AAA
240907004 MIM-RCTC Toll Revenue: - I-15 3137B7YX1 Agency MBS Freddie Mac 04/25/2023 --- 435,008.62 444,723.17 --- 445,870.78 3,049.42 2.592 0.142 AAA
240907004 MIM-RCTC Toll Revenue: - I-15 3137BFDQ1 Agency MBS Freddie Mac 09/25/2021 08/19/2020 115,397.79 117,381.51 --- 116,872.57 325.01 2.991 0.405 AAA
240907004 MIM-RCTC Toll Revenue: - I-15 3137FQXG3 Agency MBS Freddie Mac 07/25/2024 01/16/2020 886,072.71 886,072.71 --- 887,685.36 1,612.65 0.480 0.329 AAA
240907020 RCTC I-15 Prj RAMP UP RESERVE 3620A9WV9 Agency MBS Government National Mortgage Association 12/15/2024 05/23/2018 6,617.97 6,762.74 --- 6,950.72 246.85 4.000 0.212 AAA
240907020 RCTC I-15 Prj RAMP UP RESERVE 31381RLL6 Agency MBS Federal National Mortgage Association 07/01/2021 11/02/2018 44,008.45 44,661.72 --- 44,112.31 33.39 3.840 3.024 AAA
240907020 RCTC I-15 Prj RAMP UP RESERVE 36202F2H8 Agency MBS Government National Mortgage Association 01/20/2027 12/12/2019 23,459.88 24,039.05 --- 24,608.24 630.98 3.000 0.500 AAA
240907020 RCTC I-15 Prj RAMP UP RESERVE 36178NB99 Agency MBS Government National Mortgage Association 08/15/2027 10/11/2019 25,945.02 26,232.85 --- 27,050.53 839.91 2.500 0.565 AAA
240907020 RCTC I-15 Prj RAMP UP RESERVE 3136AC7J4 Agency MBS Federal National Mortgage Association 03/25/2023 02/21/2018 30,145.23 29,649.48 --- 31,307.33 1,375.95 2.532 0.472 AAA
240907020 RCTC I-15 Prj RAMP UP RESERVE 31418AU48 Agency MBS Federal National Mortgage Association 07/01/2023 05/21/2019 0.00 0.00 --- (0.00) (0.00) 2.500 0.044 AAA
240907020 RCTC I-15 Prj RAMP UP RESERVE 3137B1U75 Agency MBS Freddie Mac 01/25/2023 02/27/2018 106,838.92 105,027.68 --- 109,830.41 3,767.23 2.522 0.421 AAA
240907020 RCTC I-15 Prj RAMP UP RESERVE 38378KWU9 Agency MBS Government National Mortgage Association 11/16/2041 05/03/2019 20,346.90 19,087.93 --- 20,502.35 1,071.73 1.400 0.862 AAA
240907020 RCTC I-15 Prj RAMP UP RESERVE 3137B3NW4 Agency MBS Freddie Mac 09/25/2022 09/26/2018 48,971.93 48,551.08 --- 49,939.13 1,210.09 2.778 0.343 AAA
240907020 RCTC I-15 Prj RAMP UP RESERVE 36202F3H7 Agency MBS Government National Mortgage Association 02/20/2027 06/30/2020 25,995.30 27,262.58 --- 27,331.20 107.84 3.000 0.384 AAA
240907020 RCTC I-15 Prj RAMP UP RESERVE 38378KW47 Agency MBS Government National Mortgage Association 08/16/2035 06/13/2019 21,007.49 20,889.32 --- 21,075.55 117.76 2.150 0.827 AAA
240907020 RCTC I-15 Prj RAMP UP RESERVE 3138X0ZY7 Agency MBS Federal National Mortgage Association 07/01/2028 08/31/2020 108,966.26 114,499.71 --- 113,913.33 (432.24) 2.500 0.612 AAA
240907020 RCTC I-15 Prj RAMP UP RESERVE 3137AXHN6 Agency MBS Freddie Mac 02/25/2022 01/25/2018 19,748.91 19,477.36 --- 19,836.79 171.49 1.749 0.452 AAA
240907020 RCTC I-15 Prj RAMP UP RESERVE 3136AMM48 Agency MBS Federal National Mortgage Association 07/25/2022 09/26/2018 76,812.38 75,664.46 --- 77,888.52 1,494.08 2.509 0.803 AAA
240907020 RCTC I-15 Prj RAMP UP RESERVE 36179M4J6 Agency MBS Government National Mortgage Association 03/20/2028 11/20/2019 22,447.06 22,717.12 --- 23,476.48 781.33 2.500 0.508 AAA
240907020 RCTC I-15 Prj RAMP UP RESERVE 36202FA30 Agency MBS Government National Mortgage Association 09/20/2024 10/23/2019 11,271.53 11,743.53 --- 12,016.91 382.80 4.500 -0.491 AAA
240907020 RCTC I-15 Prj RAMP UP RESERVE 3137B1UF7 Agency MBS Freddie Mac 09/25/2022 01/25/2018 17,274.31 17,020.60 --- 17,440.15 272.60 1.785 0.424 AAA
240907020 RCTC I-15 Prj RAMP UP RESERVE 36179Q2A8 Agency MBS Government National Mortgage Association 02/20/2030 04/30/2020 90,746.09 95,963.99 --- 95,718.98 (245.10) 3.000 0.857 AAA
240907020 RCTC I-15 Prj RAMP UP RESERVE 3137BQBY2 Agency MBS Freddie Mac 03/25/2022 08/16/2019 55,705.46 56,064.50 --- 56,803.97 957.48 2.183 0.312 AAA
240907020 RCTC I-15 Prj RAMP UP RESERVE 36179NAJ7 Agency MBS Government National Mortgage Association 04/20/2028 06/30/2020 14,528.02 15,333.86 --- 15,277.37 (32.15) 3.000 0.668 AAA
240907020 RCTC I-15 Prj RAMP UP RESERVE 3138EJPZ5 Agency MBS Federal National Mortgage Association 07/01/2022 07/22/2019 23,073.41 23,494.33 --- 23,557.72 173.97 2.996 1.332 AAA
240907020 RCTC I-15 Prj RAMP UP RESERVE 3620ARB67 Agency MBS Government National Mortgage Association 05/15/2025 05/23/2018 14,826.48 15,178.62 --- 15,735.50 697.75 4.000 -0.288 AAA
240907020 RCTC I-15 Prj RAMP UP RESERVE 31418CQM9 Agency MBS Federal National Mortgage Association 10/01/2027 --- 89,653.58 94,049.86 --- 94,080.67 151.99 3.000 0.490 AAA
240907020 RCTC I-15 Prj RAMP UP RESERVE 3140J6DU8 Agency MBS Federal National Mortgage Association 08/01/2031 07/26/2019 58,447.92 58,840.62 --- 61,070.48 2,291.86 2.500 0.572 AAA
240907020 RCTC I-15 Prj RAMP UP RESERVE 3138L2GH4 Agency MBS Federal National Mortgage Association 07/01/2021 07/26/2019 20,872.32 20,759.80 --- 20,890.06 62.41 1.870 1.526 AAA
240907020 RCTC I-15 Prj RAMP UP RESERVE 3136A96F0 Agency MBS Federal National Mortgage Association 11/25/2022 02/27/2018 43,463.68 42,127.52 --- 44,496.81 1,547.36 2.184 0.278 AAA
240907020 RCTC I-15 Prj RAMP UP RESERVE 3128MENS6 Agency MBS Freddie Mac 01/01/2029 10/01/2020 16,963.78 17,753.66 --- 17,735.13 (1.79) 2.500 0.571 AAA
240907020 RCTC I-15 Prj RAMP UP RESERVE 31381QB54 Agency MBS Federal National Mortgage Association 03/01/2021 11/07/2018 54,421.80 55,548.50 --- 54,396.76 (1.02) 4.410 3.300 AAA
240907020 RCTC I-15 Prj RAMP UP RESERVE 3132A9QE0 Agency MBS Freddie Mac 02/01/2030 04/29/2020 106,092.46 111,131.84 --- 110,867.68 (279.29) 2.500 0.736 AAA
240907020 RCTC I-15 Prj RAMP UP RESERVE 3132A9SM0 Agency MBS Freddie Mac 10/01/2031 04/29/2020 64,089.51 67,113.73 --- 66,992.13 (130.60) 2.500 0.865 AAA
240907020 RCTC I-15 Prj RAMP UP RESERVE 3137BFE80 Agency MBS Freddie Mac 08/25/2024 07/15/2020 87,449.94 91,316.87 --- 91,199.80 336.73 2.720 0.273 AAA
240907020 RCTC I-15 Prj RAMP UP RESERVE 3132CJAJ2 Agency MBS Freddie Mac 09/01/2029 01/28/2020 31,970.33 32,876.99 --- 33,530.16 706.90 3.000 0.539 AAA
240907020 RCTC I-15 Prj RAMP UP RESERVE 36179NHK7 Agency MBS Government National Mortgage Association 07/20/2028 03/31/2020 104,717.68 109,233.63 --- 110,122.16 1,164.28 3.000 0.715 AAA
240907020 RCTC I-15 Prj RAMP UP RESERVE 3622A2GC0 Agency MBS Government National Mortgage Association 03/15/2028 04/30/2020 63,122.14 65,666.74 --- 65,802.93 220.76 2.500 0.552 AAA
240907020 RCTC I-15 Prj RAMP UP RESERVE 36179RFD6 Agency MBS Government National Mortgage Association 06/20/2030 05/01/2020 20,333.92 21,337.90 --- 21,385.99 27.09 3.000 0.999 AAA
2017 Financing STAMP Portfolio by Investment Category for quarter ended December 31, 2020
Page 22 of 38
ATTACHMENT 9
40
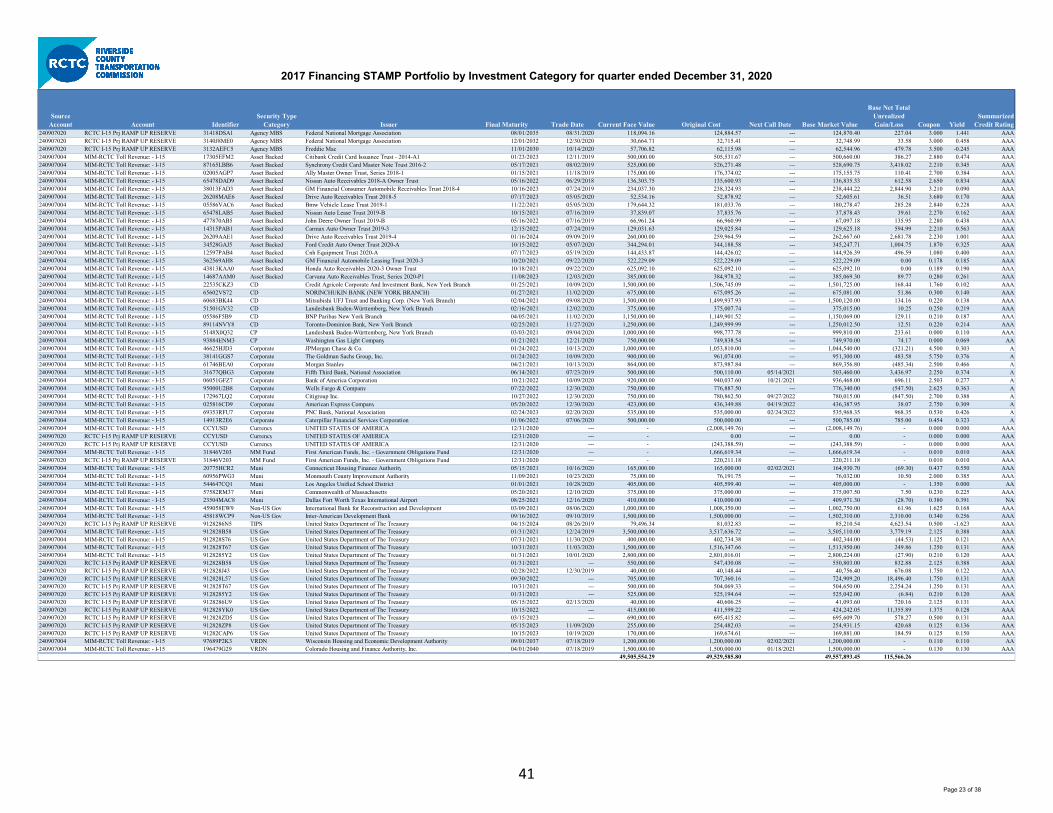
Source
Account Account Identifier
Security Type
Category Issuer Final Maturity Trade Date Current Face Value Original Cost Next Call Date Base Market Value
Base Net Total
Unrealized
Gain/Loss Coupon Yield
Summarized
Credit Rating
2017 Financing STAMP Portfolio by Investment Category for quarter ended December 31, 2020
240907020 RCTC I-15 Prj RAMP UP RESERVE 31418DSA1 Agency MBS Federal National Mortgage Association 08/01/2035 08/31/2020 118,094.16 124,884.57 --- 124,870.40 227.04 3.000 1.441 AAA
240907020 RCTC I-15 Prj RAMP UP RESERVE 3140J8ME0 Agency MBS Federal National Mortgage Association 12/01/2032 12/30/2020 30,664.71 32,715.41 --- 32,748.99 33.58 3.000 0.458 AAA
240907020 RCTC I-15 Prj RAMP UP RESERVE 3132AEFC5 Agency MBS Freddie Mac 11/01/2030 10/14/2020 57,706.82 62,115.98 --- 62,544.96 479.78 3.500 -0.245 AAA
240907004 MIM-RCTC Toll Revenue: - I-15 17305EFM2 Asset Backed Citibank Credit Card Issuance Trust - 2014-A1 01/23/2023 12/11/2019 500,000.00 505,531.67 --- 500,660.00 386.27 2.880 0.474 AAA
240907004 MIM-RCTC Toll Revenue: - I-15 87165LBB6 Asset Backed Synchrony Credit Card Master Note Trust 2016-2 05/17/2021 08/02/2019 525,000.00 526,271.48 --- 528,690.75 3,418.02 2.210 0.345 AAA
240907004 MIM-RCTC Toll Revenue: - I-15 02005AGP7 Asset Backed Ally Master Owner Trust, Series 2018-1 01/15/2021 11/18/2019 175,000.00 176,374.02 --- 175,155.75 110.41 2.700 0.384 AAA
240907004 MIM-RCTC Toll Revenue: - I-15 65478DAD9 Asset Backed Nissan Auto Receivables 2018-A Owner Trust 05/16/2022 06/29/2018 136,303.75 135,600.93 --- 136,835.33 612.58 2.650 0.834 AAA
240907004 MIM-RCTC Toll Revenue: - I-15 38013FAD3 Asset Backed GM Financial Consumer Automobile Receivables Trust 2018-4 10/16/2023 07/24/2019 234,037.30 238,324.93 --- 238,444.22 2,844.90 3.210 0.090 AAA
240907004 MIM-RCTC Toll Revenue: - I-15 26208MAE6 Asset Backed Drive Auto Receivables Trust 2018-5 07/17/2023 05/05/2020 52,534.16 52,878.92 --- 52,605.61 36.51 3.680 0.170 AAA
240907004 MIM-RCTC Toll Revenue: - I-15 05586VAC6 Asset Backed Bmw Vehicle Lease Trust 2019-1 11/22/2021 05/05/2020 179,644.32 181,033.76 --- 180,278.47 285.28 2.840 0.228 AAA
240907004 MIM-RCTC Toll Revenue: - I-15 65478LAB5 Asset Backed Nissan Auto Lease Trust 2019-B 10/15/2021 07/16/2019 37,839.07 37,835.76 --- 37,878.43 39.61 2.270 0.162 AAA
240907004 MIM-RCTC Toll Revenue: - I-15 477870AB5 Asset Backed John Deere Owner Trust 2019-B 05/16/2022 07/16/2019 66,961.24 66,960.99 --- 67,097.18 135.95 2.280 0.438 AAA
240907004 MIM-RCTC Toll Revenue: - I-15 14315PAB1 Asset Backed Carmax Auto Owner Trust 2019-3 12/15/2022 07/24/2019 129,031.63 129,025.84 --- 129,625.18 594.99 2.210 0.563 AAA
240907004 MIM-RCTC Toll Revenue: - I-15 26209AAE1 Asset Backed Drive Auto Receivables Trust 2019-4 01/16/2024 09/09/2019 260,000.00 259,964.59 --- 262,667.60 2,681.78 2.230 1.001 AAA
240907004 MIM-RCTC Toll Revenue: - I-15 34528GAJ5 Asset Backed Ford Credit Auto Owner Trust 2020-A 10/15/2022 05/07/2020 344,294.01 344,188.58 --- 345,247.71 1,004.75 1.870 0.325 AAA
240907004 MIM-RCTC Toll Revenue: - I-15 12597PAB4 Asset Backed Cnh Equipment Trust 2020-A 07/17/2023 05/19/2020 144,433.87 144,426.02 --- 144,926.39 496.59 1.080 0.400 AAA
240907004 MIM-RCTC Toll Revenue: - I-15 362569AH8 Asset Backed GM Financial Automobile Leasing Trust 2020-3 10/20/2021 09/22/2020 522,229.09 522,229.09 --- 522,229.09 0.00 0.178 0.185 AAA
240907004 MIM-RCTC Toll Revenue: - I-15 43813KAA0 Asset Backed Honda Auto Receivables 2020-3 Owner Trust 10/18/2021 09/22/2020 625,092.10 625,092.10 --- 625,092.10 0.00 0.189 0.190 AAA
240907004 MIM-RCTC Toll Revenue: - I-15 14687AAM0 Asset Backed Carvana Auto Receivables Trust, Series 2020-P1 11/08/2023 12/03/2020 385,000.00 384,978.32 --- 385,069.30 89.77 0.280 0.261 AAA
240907004 MIM-RCTC Toll Revenue: - I-15 22535CKZ3 CD Credit Agricole Corporate And Investment Bank, New York Branch 01/25/2021 10/09/2020 1,500,000.00 1,506,745.09 --- 1,501,725.00 168.44 1.760 0.102 AAA
240907004 MIM-RCTC Toll Revenue: - I-15 65602VS72 CD NORINCHUKIN BANK (NEW YORK BRANCH) 01/27/2021 11/02/2020 675,000.00 675,095.26 --- 675,081.00 51.86 0.300 0.140 AAA
240907004 MIM-RCTC Toll Revenue: - I-15 60683BK44 CD Mitsubishi UFJ Trust and Banking Corp. (New York Branch) 02/04/2021 09/08/2020 1,500,000.00 1,499,937.93 --- 1,500,120.00 134.16 0.220 0.138 AAA
240907004 MIM-RCTC Toll Revenue: - I-15 51501GV32 CD Landesbank Baden-Württemberg, New York Branch 02/16/2021 12/02/2020 375,000.00 375,007.74 --- 375,015.00 10.25 0.250 0.219 AAA
240907004 MIM-RCTC Toll Revenue: - I-15 05586F5B9 CD BNP Paribas New York Branch 04/05/2021 11/02/2020 1,150,000.00 1,149,901.52 --- 1,150,069.00 129.11 0.210 0.187 AAA
240907004 MIM-RCTC Toll Revenue: - I-15 89114NVY8 CD Toronto-Dominion Bank, New York Branch 02/25/2021 11/27/2020 1,250,000.00 1,249,999.99 --- 1,250,012.50 12.51 0.220 0.214 AAA
240907004 MIM-RCTC Toll Revenue: - I-15 5148X0Q32 CP Landesbank Baden-Württemberg, New York Branch 03/03/2021 09/04/2020 1,000,000.00 998,777.78 --- 999,810.00 233.61 0.000 0.110 AAA
240907004 MIM-RCTC Toll Revenue: - I-15 93884ENM3 CP Washington Gas Light Company 01/21/2021 12/21/2020 750,000.00 749,838.54 --- 749,970.00 74.17 0.000 0.069 AA
240907004 MIM-RCTC Toll Revenue: - I-15 46625HJD3 Corporate JPMorgan Chase & Co. 01/24/2022 10/13/2020 1,000,000.00 1,053,810.00 --- 1,044,540.00 (321.21) 4.500 0.303 A
240907004 MIM-RCTC Toll Revenue: - I-15 38141GGS7 Corporate The Goldman Sachs Group, Inc. 01/24/2022 10/09/2020 900,000.00 961,074.00 --- 951,300.00 483.58 5.750 0.376 A
240907004 MIM-RCTC Toll Revenue: - I-15 61746BEA0 Corporate Morgan Stanley 04/21/2021 10/13/2020 864,000.00 873,987.84 --- 869,356.80 (485.34) 2.500 0.466 A
240907004 MIM-RCTC Toll Revenue: - I-15 31677QBG3 Corporate Fifth Third Bank, National Association 06/14/2021 07/23/2019 500,000.00 500,110.00 05/14/2021 503,460.00 3,436.97 2.250 0.374 A
240907004 MIM-RCTC Toll Revenue: - I-15 06051GFZ7 Corporate Bank of America Corporation 10/21/2022 10/09/2020 920,000.00 940,037.60 10/21/2021 936,468.00 696.11 2.503 0.277 A
240907004 MIM-RCTC Toll Revenue: - I-15 95000U2B8 Corporate Wells Fargo & Company 07/22/2022 12/30/2020 750,000.00 776,887.50 --- 776,340.00 (547.50) 2.625 0.363 A
240907004 MIM-RCTC Toll Revenue: - I-15 172967LQ2 Corporate Citigroup Inc. 10/27/2022 12/30/2020 750,000.00 780,862.50 09/27/2022 780,015.00 (847.50) 2.700 0.388 A
240907004 MIM-RCTC Toll Revenue: - I-15 025816CD9 Corporate American Express Company 05/20/2022 12/30/2020 423,000.00 436,349.88 04/19/2022 436,387.95 38.07 2.750 0.309 A
240907004 MIM-RCTC Toll Revenue: - I-15 69353RFU7 Corporate PNC Bank, National Association 02/24/2023 02/20/2020 535,000.00 535,000.00 02/24/2022 535,968.35 968.35 0.530 0.426 A
240907004 MIM-RCTC Toll Revenue: - I-15 14913R2E6 Corporate Caterpillar Financial Services Corporation 01/06/2022 07/06/2020 500,000.00 500,000.00 --- 500,785.00 785.00 0.454 0.323 A
240907004 MIM-RCTC Toll Revenue: - I-15 CCYUSD Currency UNITED STATES OF AMERICA 12/31/2020 --- - (2,008,149.76) --- (2,008,149.76) - 0.000 0.000 AAA
240907020 RCTC I-15 Prj RAMP UP RESERVE CCYUSD Currency UNITED STATES OF AMERICA 12/31/2020 --- - 0.00 --- 0.00 - 0.000 0.000 AAA
240907020 RCTC I-15 Prj RAMP UP RESERVE CCYUSD Currency UNITED STATES OF AMERICA 12/31/2020 --- - (243,388.59) --- (243,388.59) - 0.000 0.000 AAA
240907004 MIM-RCTC Toll Revenue: - I-15 31846V203 MM Fund First American Funds, Inc. - Government Obligations Fund 12/31/2020 --- - 1,666,619.34 --- 1,666,619.34 - 0.010 0.010 AAA
240907020 RCTC I-15 Prj RAMP UP RESERVE 31846V203 MM Fund First American Funds, Inc. - Government Obligations Fund 12/31/2020 --- - 220,211.18 --- 220,211.18 - 0.010 0.010 AAA
240907004 MIM-RCTC Toll Revenue: - I-15 20775HCR2 Muni Connecticut Housing Finance Authority 05/15/2021 10/16/2020 165,000.00 165,000.00 02/02/2021 164,930.70 (69.30) 0.437 0.550 AAA
240907004 MIM-RCTC Toll Revenue: - I-15 60956PWG3 Muni Monmouth County Improvement Authority 11/09/2021 10/23/2020 75,000.00 76,191.75 --- 76,032.00 10.50 2.000 0.385 AAA
240907004 MIM-RCTC Toll Revenue: - I-15 544647CQ1 Muni Los Angeles Unified School District 01/01/2021 10/28/2020 405,000.00 405,599.40 --- 405,000.00 - 1.350 0.000 AA
240907004 MIM-RCTC Toll Revenue: - I-15 57582RM37 Muni Commonwealth of Massachusetts 05/20/2021 12/10/2020 375,000.00 375,000.00 --- 375,007.50 7.50 0.230 0.225 AAA
240907004 MIM-RCTC Toll Revenue: - I-15 23504MAC8 Muni Dallas Fort Worth Texas International Airport 08/25/2021 12/16/2020 410,000.00 410,000.00 --- 409,971.30 (28.70) 0.380 0.391 NA
240907004 MIM-RCTC Toll Revenue: - I-15 459058EW9 Non-US Gov International Bank for Reconstruction and Development 03/09/2021 08/06/2020 1,000,000.00 1,008,350.00 --- 1,002,750.00 61.96 1.625 0.168 AAA
240907004 MIM-RCTC Toll Revenue: - I-15 45818WCP9 Non-US Gov Inter-American Development Bank 09/16/2022 09/10/2019 1,500,000.00 1,500,000.00 --- 1,502,310.00 2,310.00 0.340 0.256 AAA
240907020 RCTC I-15 Prj RAMP UP RESERVE 9128286N5 TIPS United States Department of The Treasury 04/15/2024 08/26/2019 79,496.34 81,032.83 --- 85,210.54 4,623.54 0.500 -1.623 AAA
240907004 MIM-RCTC Toll Revenue: - I-15 912828B58 US Gov United States Department of The Treasury 01/31/2021 12/24/2019 3,500,000.00 3,517,636.72 --- 3,505,110.00 3,779.19 2.125 0.388 AAA
240907004 MIM-RCTC Toll Revenue: - I-15 912828S76 US Gov United States Department of The Treasury 07/31/2021 11/30/2020 400,000.00 402,734.38 --- 402,344.00 (44.53) 1.125 0.121 AAA
240907004 MIM-RCTC Toll Revenue: - I-15 912828T67 US Gov United States Department of The Treasury 10/31/2021 11/03/2020 1,500,000.00 1,516,347.66 --- 1,513,950.00 249.86 1.250 0.131 AAA
240907004 MIM-RCTC Toll Revenue: - I-15 9128285Y2 US Gov United States Department of The Treasury 01/31/2021 10/01/2020 2,800,000.00 2,801,016.01 --- 2,800,224.00 (27.90) 0.210 0.120 AAA
240907020 RCTC I-15 Prj RAMP UP RESERVE 912828B58 US Gov United States Department of The Treasury 01/31/2021 --- 550,000.00 547,430.08 --- 550,803.00 832.88 2.125 0.388 AAA
240907020 RCTC I-15 Prj RAMP UP RESERVE 912828J43 US Gov United States Department of The Treasury 02/28/2022 12/30/2019 40,000.00 40,148.44 --- 40,756.40 676.08 1.750 0.122 AAA
240907020 RCTC I-15 Prj RAMP UP RESERVE 912828L57 US Gov United States Department of The Treasury 09/30/2022 --- 705,000.00 707,360.16 --- 724,909.20 18,496.40 1.750 0.131 AAA
240907020 RCTC I-15 Prj RAMP UP RESERVE 912828T67 US Gov United States Department of The Treasury 10/31/2021 --- 500,000.00 504,069.33 --- 504,650.00 2,254.24 1.250 0.131 AAA
240907020 RCTC I-15 Prj RAMP UP RESERVE 9128285Y2 US Gov United States Department of The Treasury 01/31/2021 --- 525,000.00 525,194.64 --- 525,042.00 (6.84) 0.210 0.120 AAA
240907020 RCTC I-15 Prj RAMP UP RESERVE 9128286U9 US Gov United States Department of The Treasury 05/15/2022 02/13/2020 40,000.00 40,606.25 --- 41,093.60 720.16 2.125 0.131 AAA
240907020 RCTC I-15 Prj RAMP UP RESERVE 912828YK0 US Gov United States Department of The Treasury 10/15/2022 --- 415,000.00 411,599.22 --- 424,242.05 11,355.89 1.375 0.128 AAA
240907020 RCTC I-15 Prj RAMP UP RESERVE 912828ZD5 US Gov United States Department of The Treasury 03/15/2023 --- 690,000.00 695,415.82 --- 695,609.70 578.27 0.500 0.131 AAA
240907020 RCTC I-15 Prj RAMP UP RESERVE 912828ZP8 US Gov United States Department of The Treasury 05/15/2023 11/09/2020 255,000.00 254,482.03 --- 254,931.15 420.68 0.125 0.136 AAA
240907020 RCTC I-15 Prj RAMP UP RESERVE 91282CAP6 US Gov United States Department of The Treasury 10/15/2023 10/19/2020 170,000.00 169,674.61 --- 169,881.00 184.59 0.125 0.150 AAA
240907004 MIM-RCTC Toll Revenue: - I-15 97689P2K3 VRDN Wisconsin Housing and Economic Development Authority 09/01/2037 07/18/2019 1,200,000.00 1,200,000.00 02/02/2021 1,200,000.00 - 0.110 0.110 AA
240907004 MIM-RCTC Toll Revenue: - I-15 196479G29 VRDN Colorado Housing and Finance Authority, Inc. 04/01/2040 07/18/2019 1,500,000.00 1,500,000.00 01/18/2021 1,500,000.00 - 0.130 0.130 AAA
49,505,554.29 49,529,585.80 49,557,893.45 115,566.26
Page 23 of 38
41

Source
Account Account Identifier
Security Type
Category Issuer Final Maturity Trade Date Current Face Value Original Cost
Next Call
Date Base Market Value
Base Net Total
Unrealized Gain/Loss Coupon Yield
Summarized
Credit Rating
240907004 MIM-RCTC Toll Revenue: - I-15 3134GV6H6 Agency Freddie Mac 10/20/2022 07/20/2020 500,000.00 499,850.00 07/20/2021 500,425.00 545.31 0.320 0.166 AAA
240907004 MIM-RCTC Toll Revenue: - I-15 3135G05F6 Agency Federal National Mortgage Association 07/08/2022 11/03/2020 1,250,000.00 1,252,443.00 --- 1,252,300.00 110.48 0.270 0.151 AAA
240907004 MIM-RCTC Toll Revenue: - I-15 3134GWEH5 Agency Freddie Mac 07/27/2022 07/27/2020 750,000.00 749,850.00 07/27/2021 750,322.50 440.53 0.280 0.205 AAA
240907004 MIM-RCTC Toll Revenue: - I-15 3134GWHG4 Agency Freddie Mac 08/04/2023 07/30/2020 1,000,000.00 1,000,000.00 02/04/2021 1,000,230.00 230.00 0.450 0.199 AAA
240907004 MIM-RCTC Toll Revenue: - I-15 3133EL7F5 Agency Federal Farm Credit Banks Funding Corporation 09/15/2022 09/16/2020 1,000,000.00 999,300.00 03/15/2021 999,640.00 237.40 0.180 0.201 AAA
240907004 MIM-RCTC Toll Revenue: - I-15 3134GXJF2 Agency Freddie Mac 12/30/2022 12/15/2020 405,000.00 404,989.88 06/30/2021 404,959.50 (30.41) 0.200 0.205 AAA
240907004 MIM-RCTC Toll Revenue: - I-15 31416BTW8 Agency MBS Federal National Mortgage Association 01/01/2024 09/03/2019 207,771.27 216,731.42 --- 216,933.99 3,050.28 5.500 0.396 AAA
240907004 MIM-RCTC Toll Revenue: - I-15 3137B36H6 Agency MBS Freddie Mac 10/25/2022 --- 102,278.18 104,030.94 --- 103,771.44 26.65 2.839 0.213 AAA
240907004 MIM-RCTC Toll Revenue: - I-15 3137B7YX1 Agency MBS Freddie Mac 04/25/2023 --- 435,008.62 444,723.17 --- 445,870.78 3,049.42 2.592 0.142 AAA
240907004 MIM-RCTC Toll Revenue: - I-15 3137BFDQ1 Agency MBS Freddie Mac 09/25/2021 08/19/2020 115,397.79 117,381.51 --- 116,872.57 325.01 2.991 0.405 AAA
240907004 MIM-RCTC Toll Revenue: - I-15 3137FQXG3 Agency MBS Freddie Mac 07/25/2024 01/16/2020 886,072.71 886,072.71 --- 887,685.36 1,612.65 0.480 0.329 AAA
240907004 MIM-RCTC Toll Revenue: - I-15 17305EFM2 Asset Backed Citibank Credit Card Issuance Trust - 2014-A1 01/23/2023 12/11/2019 500,000.00 505,531.67 --- 500,660.00 386.27 2.880 0.474 AAA
240907004 MIM-RCTC Toll Revenue: - I-15 87165LBB6 Asset Backed Synchrony Credit Card Master Note Trust 2016-2 05/17/2021 08/02/2019 525,000.00 526,271.48 --- 528,690.75 3,418.02 2.210 0.345 AAA
240907004 MIM-RCTC Toll Revenue: - I-15 02005AGP7 Asset Backed Ally Master Owner Trust, Series 2018-1 01/15/2021 11/18/2019 175,000.00 176,374.02 --- 175,155.75 110.41 2.700 0.384 AAA
240907004 MIM-RCTC Toll Revenue: - I-15 65478DAD9 Asset Backed Nissan Auto Receivables 2018-A Owner Trust 05/16/2022 06/29/2018 136,303.75 135,600.93 --- 136,835.33 612.58 2.650 0.834 AAA
240907004 MIM-RCTC Toll Revenue: - I-15 38013FAD3 Asset Backed GM Financial Consumer Automobile Receivables Trust 2018-4 10/16/2023 07/24/2019 234,037.30 238,324.93 --- 238,444.22 2,844.90 3.210 0.090 AAA
240907004 MIM-RCTC Toll Revenue: - I-15 26208MAE6 Asset Backed Drive Auto Receivables Trust 2018-5 07/17/2023 05/05/2020 52,534.16 52,878.92 --- 52,605.61 36.51 3.680 0.170 AAA
240907004 MIM-RCTC Toll Revenue: - I-15 05586VAC6 Asset Backed Bmw Vehicle Lease Trust 2019-1 11/22/2021 05/05/2020 179,644.32 181,033.76 --- 180,278.47 285.28 2.840 0.228 AAA
240907004 MIM-RCTC Toll Revenue: - I-15 65478LAB5 Asset Backed Nissan Auto Lease Trust 2019-B 10/15/2021 07/16/2019 37,839.07 37,835.76 --- 37,878.43 39.61 2.270 0.162 AAA
240907004 MIM-RCTC Toll Revenue: - I-15 477870AB5 Asset Backed John Deere Owner Trust 2019-B 05/16/2022 07/16/2019 66,961.24 66,960.99 --- 67,097.18 135.95 2.280 0.438 AAA
240907004 MIM-RCTC Toll Revenue: - I-15 14315PAB1 Asset Backed Carmax Auto Owner Trust 2019-3 12/15/2022 07/24/2019 129,031.63 129,025.84 --- 129,625.18 594.99 2.210 0.563 AAA
240907004 MIM-RCTC Toll Revenue: - I-15 26209AAE1 Asset Backed Drive Auto Receivables Trust 2019-4 01/16/2024 09/09/2019 260,000.00 259,964.59 --- 262,667.60 2,681.78 2.230 1.001 AAA
240907004 MIM-RCTC Toll Revenue: - I-15 34528GAJ5 Asset Backed Ford Credit Auto Owner Trust 2020-A 10/15/2022 05/07/2020 344,294.01 344,188.58 --- 345,247.71 1,004.75 1.870 0.325 AAA
240907004 MIM-RCTC Toll Revenue: - I-15 12597PAB4 Asset Backed Cnh Equipment Trust 2020-A 07/17/2023 05/19/2020 144,433.87 144,426.02 --- 144,926.39 496.59 1.080 0.400 AAA
240907004 MIM-RCTC Toll Revenue: - I-15 362569AH8 Asset Backed GM Financial Automobile Leasing Trust 2020-3 10/20/2021 09/22/2020 522,229.09 522,229.09 --- 522,229.09 0.00 0.178 0.185 AAA
240907004 MIM-RCTC Toll Revenue: - I-15 43813KAA0 Asset Backed Honda Auto Receivables 2020-3 Owner Trust 10/18/2021 09/22/2020 625,092.10 625,092.10 --- 625,092.10 0.00 0.189 0.190 AAA
240907004 MIM-RCTC Toll Revenue: - I-15 14687AAM0 Asset Backed Carvana Auto Receivables Trust, Series 2020-P1 11/08/2023 12/03/2020 385,000.00 384,978.32 --- 385,069.30 89.77 0.280 0.261 AAA
240907004 MIM-RCTC Toll Revenue: - I-15 22535CKZ3 CD Credit Agricole Corporate And Investment Bank, New York Branc 01/25/2021 10/09/2020 1,500,000.00 1,506,745.09 --- 1,501,725.00 168.44 1.760 0.102 AAA
240907004 MIM-RCTC Toll Revenue: - I-15 65602VS72 CD NORINCHUKIN BANK (NEW YORK BRANCH) 01/27/2021 11/02/2020 675,000.00 675,095.26 --- 675,081.00 51.86 0.300 0.140 AAA
240907004 MIM-RCTC Toll Revenue: - I-15 60683BK44 CD Mitsubishi UFJ Trust and Banking Corp. (New York Branch) 02/04/2021 09/08/2020 1,500,000.00 1,499,937.93 --- 1,500,120.00 134.16 0.220 0.138 AAA
240907004 MIM-RCTC Toll Revenue: - I-15 51501GV32 CD Landesbank Baden-Württemberg, New York Branch 02/16/2021 12/02/2020 375,000.00 375,007.74 --- 375,015.00 10.25 0.250 0.219 AAA
240907004 MIM-RCTC Toll Revenue: - I-15 05586F5B9 CD BNP Paribas New York Branch 04/05/2021 11/02/2020 1,150,000.00 1,149,901.52 --- 1,150,069.00 129.11 0.210 0.187 AAA
240907004 MIM-RCTC Toll Revenue: - I-15 89114NVY8 CD Toronto-Dominion Bank, New York Branch 02/25/2021 11/27/2020 1,250,000.00 1,249,999.99 --- 1,250,012.50 12.51 0.220 0.214 AAA
240907004 MIM-RCTC Toll Revenue: - I-15 46625HJD3 Corporate JPMorgan Chase & Co. 01/24/2022 10/13/2020 1,000,000.00 1,053,810.00 --- 1,044,540.00 (321.21) 4.500 0.303 A
240907004 MIM-RCTC Toll Revenue: - I-15 38141GGS7 Corporate The Goldman Sachs Group, Inc. 01/24/2022 10/09/2020 900,000.00 961,074.00 --- 951,300.00 483.58 5.750 0.376 A
240907004 MIM-RCTC Toll Revenue: - I-15 61746BEA0 Corporate Morgan Stanley 04/21/2021 10/13/2020 864,000.00 873,987.84 --- 869,356.80 (485.34) 2.500 0.466 A
240907004 MIM-RCTC Toll Revenue: - I-15 31677QBG3 Corporate Fifth Third Bank, National Association 06/14/2021 07/23/2019 500,000.00 500,110.00 05/14/2021 503,460.00 3,436.97 2.250 0.374 A
240907004 MIM-RCTC Toll Revenue: - I-15 06051GFZ7 Corporate Bank of America Corporation 10/21/2022 10/09/2020 920,000.00 940,037.60 10/21/2021 936,468.00 696.11 2.503 0.277 A
240907004 MIM-RCTC Toll Revenue: - I-15 95000U2B8 Corporate Wells Fargo & Company 07/22/2022 12/30/2020 750,000.00 776,887.50 --- 776,340.00 (547.50) 2.625 0.363 A
240907004 MIM-RCTC Toll Revenue: - I-15 172967LQ2 Corporate Citigroup Inc. 10/27/2022 12/30/2020 750,000.00 780,862.50 09/27/2022 780,015.00 (847.50) 2.700 0.388 A
240907004 MIM-RCTC Toll Revenue: - I-15 025816CD9 Corporate American Express Company 05/20/2022 12/30/2020 423,000.00 436,349.88 04/19/2022 436,387.95 38.07 2.750 0.309 A
240907004 MIM-RCTC Toll Revenue: - I-15 69353RFU7 Corporate PNC Bank, National Association 02/24/2023 02/20/2020 535,000.00 535,000.00 02/24/2022 535,968.35 968.35 0.530 0.426 A
240907004 MIM-RCTC Toll Revenue: - I-15 14913R2E6 Corporate Caterpillar Financial Services Corporation 01/06/2022 07/06/2020 500,000.00 500,000.00 --- 500,785.00 785.00 0.454 0.323 A
240907004 MIM-RCTC Toll Revenue: - I-15 5148X0Q32 CP Landesbank Baden-Württemberg, New York Branch 03/03/2021 09/04/2020 1,000,000.00 998,777.78 --- 999,810.00 233.61 0.000 0.110 AAA
240907004 MIM-RCTC Toll Revenue: - I-15 93884ENM3 CP Washington Gas Light Company 01/21/2021 12/21/2020 750,000.00 749,838.54 --- 749,970.00 74.17 0.000 0.069 AA
240907004 MIM-RCTC Toll Revenue: - I-15 CCYUSD Currency UNITED STATES OF AMERICA 12/31/2020 --- - (2,008,149.76) --- (2,008,149.76) - 0.000 0.000 AAA
240907004 MIM-RCTC Toll Revenue: - I-15 31846V203 MM Fund First American Funds, Inc. - Government Obligations Fund 12/31/2020 --- - 1,666,619.34 --- 1,666,619.34 - 0.010 0.010 AAA
240907004 MIM-RCTC Toll Revenue: - I-15 20775HCR2 Muni Connecticut Housing Finance Authority 05/15/2021 10/16/2020 165,000.00 165,000.00 02/02/2021 164,930.70 (69.30) 0.437 0.550 AAA
240907004 MIM-RCTC Toll Revenue: - I-15 60956PWG3 Muni Monmouth County Improvement Authority 11/09/2021 10/23/2020 75,000.00 76,191.75 --- 76,032.00 10.50 2.000 0.385 AAA
240907004 MIM-RCTC Toll Revenue: - I-15 544647CQ1 Muni Los Angeles Unified School District 01/01/2021 10/28/2020 405,000.00 405,599.40 --- 405,000.00 - 1.350 0.000 AA
240907004 MIM-RCTC Toll Revenue: - I-15 57582RM37 Muni Commonwealth of Massachusetts 05/20/2021 12/10/2020 375,000.00 375,000.00 --- 375,007.50 7.50 0.230 0.225 AAA
240907004 MIM-RCTC Toll Revenue: - I-15 23504MAC8 Muni Dallas Fort Worth Texas International Airport 08/25/2021 12/16/2020 410,000.00 410,000.00 --- 409,971.30 (28.70) 0.380 0.391 NA
240907004 MIM-RCTC Toll Revenue: - I-15 459058EW9 Non-US Gov International Bank for Reconstruction and Development 03/09/2021 08/06/2020 1,000,000.00 1,008,350.00 --- 1,002,750.00 61.96 1.625 0.168 AAA
240907004 MIM-RCTC Toll Revenue: - I-15 45818WCP9 Non-US Gov Inter-American Development Bank 09/16/2022 09/10/2019 1,500,000.00 1,500,000.00 --- 1,502,310.00 2,310.00 0.340 0.256 AAA
240907004 MIM-RCTC Toll Revenue: - I-15 912828B58 US Gov United States Department of The Treasury 01/31/2021 12/24/2019 3,500,000.00 3,517,636.72 --- 3,505,110.00 3,779.19 2.125 0.388 AAA
240907004 MIM-RCTC Toll Revenue: - I-15 912828S76 US Gov United States Department of The Treasury 07/31/2021 11/30/2020 400,000.00 402,734.38 --- 402,344.00 (44.53) 1.125 0.121 AAA
240907004 MIM-RCTC Toll Revenue: - I-15 912828T67 US Gov United States Department of The Treasury 10/31/2021 11/03/2020 1,500,000.00 1,516,347.66 --- 1,513,950.00 249.86 1.250 0.131 AAA
240907004 MIM-RCTC Toll Revenue: - I-15 9128285Y2 US Gov United States Department of The Treasury 01/31/2021 10/01/2020 2,800,000.00 2,801,016.01 --- 2,800,224.00 (27.90) 0.210 0.120 AAA
240907004 MIM-RCTC Toll Revenue: - I-15 97689P2K3 VRDN Wisconsin Housing and Economic Development Authority 09/01/2037 07/18/2019 1,200,000.00 1,200,000.00 02/02/2021 1,200,000.00 - 0.110 0.110 AA
240907004 MIM-RCTC Toll Revenue: - I-15 196479G29 VRDN Colorado Housing and Finance Authority, Inc. 04/01/2040 07/18/2019 1,500,000.00 1,500,000.00 01/18/2021 1,500,000.00 - 0.130 0.130 AAA
41,140,929.11 41,105,858.31 41,064,036.91 33,603.92
240907020 RCTC I-15 Prj RAMP UP RESERVE 3137EADB2 Agency Freddie Mac 01/13/2022 09/30/2019 400,000.00 406,425.20 --- 409,248.00 6,310.48 2.375 0.135 AAA
240907020 RCTC I-15 Prj RAMP UP RESERVE 3134GV6H6 Agency Freddie Mac 10/20/2022 07/22/2020 125,000.00 124,987.50 07/20/2021 125,106.25 116.29 0.320 0.166 AAA
240907020 RCTC I-15 Prj RAMP UP RESERVE 3135G05F6 Agency Federal National Mortgage Association 07/08/2022 11/03/2020 100,000.00 100,195.44 --- 100,184.00 8.84 0.270 0.151 AAA
240907020 RCTC I-15 Prj RAMP UP RESERVE 3134GWGB6 Agency Freddie Mac 07/28/2023 07/22/2020 100,000.00 100,000.00 01/28/2021 100,022.00 22.00 0.450 0.156 AAA
240907020 RCTC I-15 Prj RAMP UP RESERVE 3137EAEV7 Agency Freddie Mac 08/24/2023 08/19/2020 175,000.00 174,821.50 --- 175,344.75 501.87 0.250 0.175 AAA
240907020 RCTC I-15 Prj RAMP UP RESERVE 3133EL7F5 Agency Federal Farm Credit Banks Funding Corporation 09/15/2022 09/15/2020 200,000.00 199,880.00 03/15/2021 199,928.00 30.41 0.180 0.201 AAA
240907020 RCTC I-15 Prj RAMP UP RESERVE 3134GWTL0 Agency Freddie Mac 09/28/2023 09/23/2020 85,000.00 84,987.25 09/28/2021 85,014.45 26.09 0.300 0.277 AAA
240907020 RCTC I-15 Prj RAMP UP RESERVE 3134GWY42 Agency Freddie Mac 10/13/2023 10/07/2020 100,000.00 99,950.00 10/13/2021 99,997.00 43.35 0.300 0.301 AAA
240907020 RCTC I-15 Prj RAMP UP RESERVE 3136G46A6 Agency Federal National Mortgage Association 10/27/2023 10/20/2020 130,000.00 129,967.50 10/27/2021 130,003.90 34.44 0.300 0.296 AAA
240907020 RCTC I-15 Prj RAMP UP RESERVE 3134GXDT8 Agency Freddie Mac 11/24/2023 --- 135,000.00 135,035.00 05/24/2021 135,058.05 23.05 0.350 0.242 AAA
240907020 RCTC I-15 Prj RAMP UP RESERVE 38377REV3 Agency CMO Government National Mortgage Association 10/20/2039 07/01/2019 14,623.74 14,913.93 --- 14,903.35 153.09 3.500 -0.027 AAA
240907020 RCTC I-15 Prj RAMP UP RESERVE 3137A6Z47 Agency CMO Freddie Mac 01/15/2041 08/31/2020 37,377.13 39,327.75 --- 39,407.83 (159.39) 4.500 1.079 AAA
240907020 RCTC I-15 Prj RAMP UP RESERVE 3137AH6C7 Agency CMO Freddie Mac 07/25/2021 11/29/2018 80,308.15 80,452.45 --- 81,173.87 837.94 3.230 0.468 AAA
240907020 RCTC I-15 Prj RAMP UP RESERVE 38376V2E6 Agency CMO Government National Mortgage Association 07/16/2039 08/06/2019 16,044.12 16,695.92 --- 17,038.54 465.31 4.000 0.541 AAA
240907020 RCTC I-15 Prj RAMP UP RESERVE 3137AJMF8 Agency CMO Freddie Mac 10/25/2021 11/29/2018 91,007.79 90,705.62 --- 92,335.59 1,539.51 2.968 0.438 AAA
240907020 RCTC I-15 Prj RAMP UP RESERVE 38375XCM4 Agency CMO Government National Mortgage Association 11/16/2037 05/14/2019 13,613.83 13,999.38 --- 14,032.73 225.12 5.000 0.638 AAA
240907020 RCTC I-15 Prj RAMP UP RESERVE 383742C76 Agency CMO Government National Mortgage Association 08/16/2037 01/31/2018 38,968.56 39,942.78 --- 39,989.54 553.99 4.000 1.615 AAA
240907020 RCTC I-15 Prj RAMP UP RESERVE 3137ATRW4 Agency CMO Freddie Mac 05/25/2022 09/26/2018 100,000.00 97,238.28 --- 102,292.00 3,410.76 2.373 0.400 AAA
240907020 RCTC I-15 Prj RAMP UP RESERVE 3137ASR97 Agency CMO Freddie Mac 01/25/2022 02/27/2018 3,841.65 3,755.21 --- 3,847.06 21.66 1.573 0.422 AAA
240907020 RCTC I-15 Prj RAMP UP RESERVE 3136A72D3 Agency CMO Federal National Mortgage Association 04/25/2022 07/26/2019 10,719.45 10,782.17 --- 10,904.04 145.20 2.482 0.404 AAA
240907020 RCTC I-15 Prj RAMP UP RESERVE 3137AYCE9 Agency CMO Freddie Mac 10/25/2022 08/13/2019 100,000.00 102,164.06 --- 103,404.00 2,265.32 2.682 0.582 AAA
240907020 RCTC I-15 Prj RAMP UP RESERVE 38378HXH4 Agency CMO Government National Mortgage Association 09/16/2027 03/08/2019 4,494.15 4,260.63 --- 4,542.28 231.74 1.250 0.615 AAA
240907020 RCTC I-15 Prj RAMP UP RESERVE 31392J6N4 Agency CMO Federal National Mortgage Association 04/25/2023 12/05/2017 180,383.76 196,236.04 --- 187,142.74 (400.16) 5.500 1.056 AAA
2017 Financing STAMP Portfolio by Account for quarter ended December 31, 2020
Page 24 of 38
ATTACHMENT 10
42

Source
Account Account Identifier
Security Type
Category Issuer Final Maturity Trade Date Current Face Value Original Cost
Next Call
Date Base Market Value
Base Net Total
Unrealized Gain/Loss Coupon Yield
Summarized
Credit Rating
2017 Financing STAMP Portfolio by Account for quarter ended December 31, 2020
240907020 RCTC I-15 Prj RAMP UP RESERVE 3137B84S3 Agency CMO Freddie Mac 02/15/2029 01/31/2018 54,358.34 53,678.86 --- 55,267.76 1,320.55 2.000 0.696 AAA
240907020 RCTC I-15 Prj RAMP UP RESERVE 3137A5FP4 Agency CMO Freddie Mac 01/15/2021 01/30/2018 23,494.77 23,553.51 --- 23,486.08 (8.69) 2.500 1.055 AAA
240907020 RCTC I-15 Prj RAMP UP RESERVE 38378JZD7 Agency CMO Government National Mortgage Association 12/20/2040 10/16/2019 12,057.61 11,906.90 --- 12,200.98 262.98 1.500 0.608 AAA
240907020 RCTC I-15 Prj RAMP UP RESERVE 38377QKH9 Agency CMO Government National Mortgage Association 08/20/2040 08/20/2019 12,343.23 12,567.44 --- 12,867.94 359.14 3.000 -0.436 AAA
240907020 RCTC I-15 Prj RAMP UP RESERVE 3137B45W2 Agency CMO Freddie Mac 09/15/2030 12/30/2020 93,333.39 94,266.73 --- 94,654.99 388.26 2.750 0.662 AAA
240907020 RCTC I-15 Prj RAMP UP RESERVE 3137ARVU7 Agency CMO Freddie Mac 08/15/2038 06/30/2020 61,957.83 62,819.43 --- 62,427.47 (109.24) 3.000 0.579 AAA
240907020 RCTC I-15 Prj RAMP UP RESERVE 38378VC45 Agency CMO Government National Mortgage Association 12/16/2041 11/23/2018 39,818.69 38,381.49 --- 40,928.84 2,117.13 2.250 0.591 AAA
240907020 RCTC I-15 Prj RAMP UP RESERVE 38377JM59 Agency CMO Government National Mortgage Association 10/20/2039 11/21/2018 13,940.08 13,591.58 --- 14,139.56 358.59 2.500 0.206 AAA
240907020 RCTC I-15 Prj RAMP UP RESERVE 3137ARBX3 Agency CMO Freddie Mac 03/15/2039 03/14/2019 11,603.49 11,438.51 --- 11,609.99 111.75 0.509 0.344 AAA
240907020 RCTC I-15 Prj RAMP UP RESERVE 38379JM99 Agency CMO Government National Mortgage Association 02/16/2041 08/28/2019 7,859.80 7,910.45 --- 7,947.98 69.95 2.500 -0.121 AAA
240907020 RCTC I-15 Prj RAMP UP RESERVE 38378PZN1 Agency CMO Government National Mortgage Association 03/16/2039 12/30/2020 46,177.51 46,256.88 --- 46,345.14 88.26 2.500 0.214 AAA
240907020 RCTC I-15 Prj RAMP UP RESERVE 3620A9WV9 Agency MBS Government National Mortgage Association 12/15/2024 05/23/2018 6,617.97 6,762.74 --- 6,950.72 246.85 4.000 0.212 AAA
240907020 RCTC I-15 Prj RAMP UP RESERVE 31381RLL6 Agency MBS Federal National Mortgage Association 07/01/2021 11/02/2018 44,008.45 44,661.72 --- 44,112.31 33.39 3.840 3.024 AAA
240907020 RCTC I-15 Prj RAMP UP RESERVE 36202F2H8 Agency MBS Government National Mortgage Association 01/20/2027 12/12/2019 23,459.88 24,039.05 --- 24,608.24 630.98 3.000 0.500 AAA
240907020 RCTC I-15 Prj RAMP UP RESERVE 36178NB99 Agency MBS Government National Mortgage Association 08/15/2027 10/11/2019 25,945.02 26,232.85 --- 27,050.53 839.91 2.500 0.565 AAA
240907020 RCTC I-15 Prj RAMP UP RESERVE 3136AC7J4 Agency MBS Federal National Mortgage Association 03/25/2023 02/21/2018 30,145.23 29,649.48 --- 31,307.33 1,375.95 2.532 0.472 AAA
240907020 RCTC I-15 Prj RAMP UP RESERVE 31418AU48 Agency MBS Federal National Mortgage Association 07/01/2023 05/21/2019 0.00 0.00 --- (0.00) (0.00) 2.500 0.044 AAA
240907020 RCTC I-15 Prj RAMP UP RESERVE 3137B1U75 Agency MBS Freddie Mac 01/25/2023 02/27/2018 106,838.92 105,027.68 --- 109,830.41 3,767.23 2.522 0.421 AAA
240907020 RCTC I-15 Prj RAMP UP RESERVE 38378KWU9 Agency MBS Government National Mortgage Association 11/16/2041 05/03/2019 20,346.90 19,087.93 --- 20,502.35 1,071.73 1.400 0.862 AAA
240907020 RCTC I-15 Prj RAMP UP RESERVE 3137B3NW4 Agency MBS Freddie Mac 09/25/2022 09/26/2018 48,971.93 48,551.08 --- 49,939.13 1,210.09 2.778 0.343 AAA
240907020 RCTC I-15 Prj RAMP UP RESERVE 36202F3H7 Agency MBS Government National Mortgage Association 02/20/2027 06/30/2020 25,995.30 27,262.58 --- 27,331.20 107.84 3.000 0.384 AAA
240907020 RCTC I-15 Prj RAMP UP RESERVE 38378KW47 Agency MBS Government National Mortgage Association 08/16/2035 06/13/2019 21,007.49 20,889.32 --- 21,075.55 117.76 2.150 0.827 AAA
240907020 RCTC I-15 Prj RAMP UP RESERVE 3138X0ZY7 Agency MBS Federal National Mortgage Association 07/01/2028 08/31/2020 108,966.26 114,499.71 --- 113,913.33 (432.24) 2.500 0.612 AAA
240907020 RCTC I-15 Prj RAMP UP RESERVE 3137AXHN6 Agency MBS Freddie Mac 02/25/2022 01/25/2018 19,748.91 19,477.36 --- 19,836.79 171.49 1.749 0.452 AAA
240907020 RCTC I-15 Prj RAMP UP RESERVE 3136AMM48 Agency MBS Federal National Mortgage Association 07/25/2022 09/26/2018 76,812.38 75,664.46 --- 77,888.52 1,494.08 2.509 0.803 AAA
240907020 RCTC I-15 Prj RAMP UP RESERVE 36179M4J6 Agency MBS Government National Mortgage Association 03/20/2028 11/20/2019 22,447.06 22,717.12 --- 23,476.48 781.33 2.500 0.508 AAA
240907020 RCTC I-15 Prj RAMP UP RESERVE 36202FA30 Agency MBS Government National Mortgage Association 09/20/2024 10/23/2019 11,271.53 11,743.53 --- 12,016.91 382.80 4.500 -0.491 AAA
240907020 RCTC I-15 Prj RAMP UP RESERVE 3137B1UF7 Agency MBS Freddie Mac 09/25/2022 01/25/2018 17,274.31 17,020.60 --- 17,440.15 272.60 1.785 0.424 AAA
240907020 RCTC I-15 Prj RAMP UP RESERVE 36179Q2A8 Agency MBS Government National Mortgage Association 02/20/2030 04/30/2020 90,746.09 95,963.99 --- 95,718.98 (245.10) 3.000 0.857 AAA
240907020 RCTC I-15 Prj RAMP UP RESERVE 3137BQBY2 Agency MBS Freddie Mac 03/25/2022 08/16/2019 55,705.46 56,064.50 --- 56,803.97 957.48 2.183 0.312 AAA
240907020 RCTC I-15 Prj RAMP UP RESERVE 36179NAJ7 Agency MBS Government National Mortgage Association 04/20/2028 06/30/2020 14,528.02 15,333.86 --- 15,277.37 (32.15) 3.000 0.668 AAA
240907020 RCTC I-15 Prj RAMP UP RESERVE 3138EJPZ5 Agency MBS Federal National Mortgage Association 07/01/2022 07/22/2019 23,073.41 23,494.33 --- 23,557.72 173.97 2.996 1.332 AAA
240907020 RCTC I-15 Prj RAMP UP RESERVE 3620ARB67 Agency MBS Government National Mortgage Association 05/15/2025 05/23/2018 14,826.48 15,178.62 --- 15,735.50 697.75 4.000 -0.288 AAA
240907020 RCTC I-15 Prj RAMP UP RESERVE 31418CQM9 Agency MBS Federal National Mortgage Association 10/01/2027 --- 89,653.58 94,049.86 --- 94,080.67 151.99 3.000 0.490 AAA
240907020 RCTC I-15 Prj RAMP UP RESERVE 3140J6DU8 Agency MBS Federal National Mortgage Association 08/01/2031 07/26/2019 58,447.92 58,840.62 --- 61,070.48 2,291.86 2.500 0.572 AAA
240907020 RCTC I-15 Prj RAMP UP RESERVE 3138L2GH4 Agency MBS Federal National Mortgage Association 07/01/2021 07/26/2019 20,872.32 20,759.80 --- 20,890.06 62.41 1.870 1.526 AAA
240907020 RCTC I-15 Prj RAMP UP RESERVE 3136A96F0 Agency MBS Federal National Mortgage Association 11/25/2022 02/27/2018 43,463.68 42,127.52 --- 44,496.81 1,547.36 2.184 0.278 AAA
240907020 RCTC I-15 Prj RAMP UP RESERVE 3128MENS6 Agency MBS Freddie Mac 01/01/2029 10/01/2020 16,963.78 17,753.66 --- 17,735.13 (1.79) 2.500 0.571 AAA
240907020 RCTC I-15 Prj RAMP UP RESERVE 31381QB54 Agency MBS Federal National Mortgage Association 03/01/2021 11/07/2018 54,421.80 55,548.50 --- 54,396.76 (1.02) 4.410 3.300 AAA
240907020 RCTC I-15 Prj RAMP UP RESERVE 3132A9QE0 Agency MBS Freddie Mac 02/01/2030 04/29/2020 106,092.46 111,131.84 --- 110,867.68 (279.29) 2.500 0.736 AAA
240907020 RCTC I-15 Prj RAMP UP RESERVE 3132A9SM0 Agency MBS Freddie Mac 10/01/2031 04/29/2020 64,089.51 67,113.73 --- 66,992.13 (130.60) 2.500 0.865 AAA
240907020 RCTC I-15 Prj RAMP UP RESERVE 3137BFE80 Agency MBS Freddie Mac 08/25/2024 07/15/2020 87,449.94 91,316.87 --- 91,199.80 336.73 2.720 0.273 AAA
240907020 RCTC I-15 Prj RAMP UP RESERVE 3132CJAJ2 Agency MBS Freddie Mac 09/01/2029 01/28/2020 31,970.33 32,876.99 --- 33,530.16 706.90 3.000 0.539 AAA
240907020 RCTC I-15 Prj RAMP UP RESERVE 36179NHK7 Agency MBS Government National Mortgage Association 07/20/2028 03/31/2020 104,717.68 109,233.63 --- 110,122.16 1,164.28 3.000 0.715 AAA
240907020 RCTC I-15 Prj RAMP UP RESERVE 3622A2GC0 Agency MBS Government National Mortgage Association 03/15/2028 04/30/2020 63,122.14 65,666.74 --- 65,802.93 220.76 2.500 0.552 AAA
240907020 RCTC I-15 Prj RAMP UP RESERVE 36179RFD6 Agency MBS Government National Mortgage Association 06/20/2030 05/01/2020 20,333.92 21,337.90 --- 21,385.99 27.09 3.000 0.999 AAA
240907020 RCTC I-15 Prj RAMP UP RESERVE 31418DSA1 Agency MBS Federal National Mortgage Association 08/01/2035 08/31/2020 118,094.16 124,884.57 --- 124,870.40 227.04 3.000 1.441 AAA
240907020 RCTC I-15 Prj RAMP UP RESERVE 3140J8ME0 Agency MBS Federal National Mortgage Association 12/01/2032 12/30/2020 30,664.71 32,715.41 --- 32,748.99 33.58 3.000 0.458 AAA
240907020 RCTC I-15 Prj RAMP UP RESERVE 3132AEFC5 Agency MBS Freddie Mac 11/01/2030 10/14/2020 57,706.82 62,115.98 --- 62,544.96 479.78 3.500 -0.245 AAA
240907020 RCTC I-15 Prj RAMP UP RESERVE CCYUSD Currency UNITED STATES OF AMERICA 12/31/2020 --- - 0.00 --- 0.00 - 0.000 0.000 AAA
240907020 RCTC I-15 Prj RAMP UP RESERVE CCYUSD Currency UNITED STATES OF AMERICA 12/31/2020 --- - (243,388.59) --- (243,388.59) - 0.000 0.000 AAA
240907020 RCTC I-15 Prj RAMP UP RESERVE 31846V203 MM Fund First American Funds, Inc. - Government Obligations Fund 12/31/2020 --- - 220,211.18 --- 220,211.18 - 0.010 0.010 AAA
240907020 RCTC I-15 Prj RAMP UP RESERVE 9128286N5 TIPS United States Department of The Treasury 04/15/2024 08/26/2019 79,496.34 81,032.83 --- 85,210.54 4,623.54 0.500 -1.623 AAA
240907020 RCTC I-15 Prj RAMP UP RESERVE 912828B58 US Gov United States Department of The Treasury 01/31/2021 --- 550,000.00 547,430.08 --- 550,803.00 832.88 2.125 0.388 AAA
240907020 RCTC I-15 Prj RAMP UP RESERVE 912828J43 US Gov United States Department of The Treasury 02/28/2022 12/30/2019 40,000.00 40,148.44 --- 40,756.40 676.08 1.750 0.122 AAA
240907020 RCTC I-15 Prj RAMP UP RESERVE 912828L57 US Gov United States Department of The Treasury 09/30/2022 --- 705,000.00 707,360.16 --- 724,909.20 18,496.40 1.750 0.131 AAA
240907020 RCTC I-15 Prj RAMP UP RESERVE 912828T67 US Gov United States Department of The Treasury 10/31/2021 --- 500,000.00 504,069.33 --- 504,650.00 2,254.24 1.250 0.131 AAA
240907020 RCTC I-15 Prj RAMP UP RESERVE 9128285Y2 US Gov United States Department of The Treasury 01/31/2021 --- 525,000.00 525,194.64 --- 525,042.00 (6.84) 0.210 0.120 AAA
240907020 RCTC I-15 Prj RAMP UP RESERVE 9128286U9 US Gov United States Department of The Treasury 05/15/2022 02/13/2020 40,000.00 40,606.25 --- 41,093.60 720.16 2.125 0.131 AAA
240907020 RCTC I-15 Prj RAMP UP RESERVE 912828YK0 US Gov United States Department of The Treasury 10/15/2022 --- 415,000.00 411,599.22 --- 424,242.05 11,355.89 1.375 0.128 AAA
240907020 RCTC I-15 Prj RAMP UP RESERVE 912828ZD5 US Gov United States Department of The Treasury 03/15/2023 --- 690,000.00 695,415.82 --- 695,609.70 578.27 0.500 0.131 AAA
240907020 RCTC I-15 Prj RAMP UP RESERVE 912828ZP8 US Gov United States Department of The Treasury 05/15/2023 11/09/2020 255,000.00 254,482.03 --- 254,931.15 420.68 0.125 0.136 AAA
240907020 RCTC I-15 Prj RAMP UP RESERVE 91282CAP6 US Gov United States Department of The Treasury 10/15/2023 10/19/2020 170,000.00 169,674.61 --- 169,881.00 184.59 0.125 0.150 AAA
8,364,625.17 8,423,727.50 8,493,856.54 81,962.33
Page 25 of 38
43

Source
Account Account Identifier Description
Beginning Base
Market Value Base Purchases Base Sales
Base Maturities and
Redemptions Base Paydowns
Net Total Realized
Gain/Loss
Base
Amortization/A
ccretion
Base Change In
Net Unrealized
Gain/Loss
Ending Base
Market Value
Ending Accrued
Income Balance
240907004 MIM-RCTC Toll Revenue: - I-15 31846V203 FIRST AMER:GVT OBLG Y 159,096.34 25,781,690.06 (24,274,167.06) - - 0.69 - - 1,666,619.34 -
240907004 MIM-RCTC Toll Revenue: - I-15 CCYUSD Receivable 4.82 - - - - - - - - -
240907004 MIM-RCTC Toll Revenue: - I-15 CCYUSD Payable - - - - - - - - (2,008,149.76) -
240907004 MIM-RCTC Toll Revenue: - I-15 97689P2K3 WISCONSIN HSG & ECONOMIC DEV AUTH HOME OWNERSHIP R 1,200,000.00 - - - - - - - 1,200,000.00 460.33
240907004 MIM-RCTC Toll Revenue: - I-15 31416BTW8 FN 995265 248,943.09 - - - (38,750.69) (1,170.64) (376.65) (962.53) 207,682.59 911.67
240907004 MIM-RCTC Toll Revenue: - I-15 31416BTW8 FN 995265 11,089.38 - - - (1,726.18) (52.15) (16.78) (42.88) 9,251.40 40.61
240907004 MIM-RCTC Toll Revenue: - I-15 62888VAA6 NGN 2010-R1 1A 211,529.47 - - - (211,550.63) 0.00 (0.36) 21.52 - -
240907004 MIM-RCTC Toll Revenue: - I-15 62888UAB6 NGN 2010-R2 2A 187,292.50 - - - (187,288.78) (0.26) (16.01) 12.55 - -
240907004 MIM-RCTC Toll Revenue: - I-15 46625HJD3 JPMORGAN CHASE & CO - 1,053,810.00 - - - - (8,948.79) (321.21) 1,044,540.00 19,625.00
240907004 MIM-RCTC Toll Revenue: - I-15 38141GGS7 GOLDMAN SACHS GROUP INC - 961,074.00 - - - - (10,257.58) 483.58 951,300.00 22,568.75
240907004 MIM-RCTC Toll Revenue: - I-15 3137B36H6 FHMS K-029 A1 12,601.16 - - - (2,088.46) (20.96) (22.26) (22.69) 10,446.79 24.36
240907004 MIM-RCTC Toll Revenue: - I-15 3137B36H6 FHMS K-029 A1 112,570.32 - - - (18,656.87) (319.78) (319.10) 50.07 93,324.65 217.61
240907004 MIM-RCTC Toll Revenue: - I-15 17305EFM2 CCCIT 2014-A1 A1 196,583.40 - - - - - (488.97) (837.03) 195,257.40 2,496.00
240907004 MIM-RCTC Toll Revenue: - I-15 17305EFM2 CCCIT 2014-A1 A1 307,476.60 - - - - - (770.20) (1,303.80) 305,402.60 3,904.00
240907004 MIM-RCTC Toll Revenue: - I-15 912828B58 UNITED STATES TREASURY 3,523,240.00 - - - - - (4,081.16) (14,048.84) 3,505,110.00 31,124.32
240907004 MIM-RCTC Toll Revenue: - I-15 3137B7YX1 FHMS K-037 A1 418,878.80 - (69,809.09) - (38,749.94) 3,358.21 (375.46) (2,034.24) 311,268.28 655.96
240907004 MIM-RCTC Toll Revenue: - I-15 3137B7YX1 FHMS K-037 A1 - 69,809.09 - - - - (158.47) (2,349.38) 67,301.25 141.83
240907004 MIM-RCTC Toll Revenue: - I-15 3137B7YX1 FHMS K-037 A1 - 67,385.30 - - - - (65.73) (18.32) 67,301.25 141.83
240907004 MIM-RCTC Toll Revenue: - I-15 3137BFDQ1 FHMS K-717 A2 117,969.66 - - - (515.57) (6.91) (594.66) 20.05 116,872.57 287.63
240907004 MIM-RCTC Toll Revenue: - I-15 459058EW9 INTERNATIONAL BANK FOR RECONSTRUCTION AND DEVELOPM 1,006,140.00 - - - - - (3,691.04) 301.04 1,002,750.00 5,055.56
240907004 MIM-RCTC Toll Revenue: - I-15 61746BEA0 MORGAN STANLEY - 873,987.84 - - - - (4,145.70) (485.34) 869,356.80 4,200.00
240907004 MIM-RCTC Toll Revenue: - I-15 87165LBB6 SYNCT 2016-2 A 530,901.00 - - - - - (180.86) (2,029.39) 528,690.75 515.67
240907004 MIM-RCTC Toll Revenue: - I-15 31677QBG3 FIFTH THIRD BANK NA (OHIO) 506,065.00 - - - - - (17.38) (2,587.62) 503,460.00 531.25
240907004 MIM-RCTC Toll Revenue: - I-15 912828S76 UNITED STATES TREASURY - 402,734.38 - - - - (345.85) (44.53) 402,344.00 1,883.15
240907004 MIM-RCTC Toll Revenue: - I-15 06051GFZ7 BANK OF AMERICA CORP - 940,037.60 - - - - (4,265.71) 696.11 936,468.00 4,477.59
240907004 MIM-RCTC Toll Revenue: - I-15 912828T67 UNITED STATES TREASURY - 1,516,347.66 - - - - (2,647.52) 249.86 1,513,950.00 3,211.33
240907004 MIM-RCTC Toll Revenue: - I-15 95000U2B8 WELLS FARGO & CO - 776,887.50 - - - - - (547.50) 776,340.00 8,859.38
240907004 MIM-RCTC Toll Revenue: - I-15 172967LQ2 CITIGROUP INC - 780,862.50 - - - - - (847.50) 780,015.00 3,768.75
240907004 MIM-RCTC Toll Revenue: - I-15 02005AGP7 AMOT 2018-1 A2 176,142.75 - - - - - (301.96) (685.04) 175,155.75 210.00
240907004 MIM-RCTC Toll Revenue: - I-15 65478DAD9 NAROT 2018-A A3 238,536.10 - - - (100,682.46) 79.27 51.10 (1,148.67) 136,835.33 160.54
240907004 MIM-RCTC Toll Revenue: - I-15 38013FAD3 GMCAR 2018-4 A3 293,439.64 - - - (52,897.52) (384.72) (276.87) (1,436.31) 238,444.22 313.02
240907004 MIM-RCTC Toll Revenue: - I-15 9128285H9 UNITED STATES TREASURY 5,300,106.00 - (4,400,010.74) (900,000.00) - 11.09 6.03 (112.39) - -
240907004 MIM-RCTC Toll Revenue: - I-15 26208MAE6 DRIVE 2018-5 B 239,563.38 - - - (185,685.66) (241.62) (337.80) (692.70) 52,605.61 85.92
240907004 MIM-RCTC Toll Revenue: - I-15 9128285Y2 UNITED STATES TREASURY 1,000,320.00 - (1,000,094.68) - - (0.00) (277.95) 52.64 - -
240907004 MIM-RCTC Toll Revenue: - I-15 9128285Y2 UNITED STATES TREASURY - 3,001,088.58 (200,018.94) - - 0.34 (818.08) (27.90) 2,800,224.00 981.26
240907004 MIM-RCTC Toll Revenue: - I-15 47789JAB2 JDOT 2019 A2 68,297.25 - - - (68,165.68) 0.11 0.16 (131.84) - -
240907004 MIM-RCTC Toll Revenue: - I-15 05586VAC6 BMWLT 2019-1 A3 324,829.05 - - - (142,949.15) (341.46) (360.25) (899.72) 180,278.47 155.89
240907004 MIM-RCTC Toll Revenue: - I-15 025816CD9 AMERICAN EXPRESS CO - 436,349.88 - - - - - 38.07 436,387.95 1,421.75
240907004 MIM-RCTC Toll Revenue: - I-15 65478LAB5 NALT 2019-B A2A 130,872.92 - - - (92,620.28) 0.87 0.65 (375.73) 37,878.43 38.18
240907004 MIM-RCTC Toll Revenue: - I-15 477870AB5 JDOT 2019-B A2 129,314.81 - - - (61,729.42) 0.02 0.02 (488.26) 67,097.18 67.85
240907004 MIM-RCTC Toll Revenue: - I-15 196479G29 COLORADO HSG & FIN AUTH 1,500,000.00 - - - - - - - 1,500,000.00 572.13
240907004 MIM-RCTC Toll Revenue: - I-15 14315PAB1 CARMX 2019-3 A2A 202,546.07 - - - (72,130.44) 1.00 0.72 (792.17) 129,625.18 126.74
240907004 MIM-RCTC Toll Revenue: - I-15 26209AAE1 DRIVE 2019-4 B 263,640.00 - - - - - 4.53 (976.93) 262,667.60 257.69
240907004 MIM-RCTC Toll Revenue: - I-15 45818WCP9 INTER-AMERICAN DEVELOPMENT BANK 1,499,700.00 - - - - - - 2,610.00 1,502,310.00 227.54
240907004 MIM-RCTC Toll Revenue: - I-15 59447TXK4 MICHIGAN FIN AUTH REV 255,471.75 - - (255,000.00) - - - (471.75) - -
240907004 MIM-RCTC Toll Revenue: - I-15 59447TXK4 MICHIGAN FIN AUTH REV 110,203.50 - - (110,000.00) - - (232.80) 29.30 - -
240907004 MIM-RCTC Toll Revenue: - I-15 3137FQXG3 FHMS K-I05 A 937,517.90 - - - (49,555.21) (0.01) - (277.32) 887,685.36 10,076.46
240907004 MIM-RCTC Toll Revenue: - I-15 22535CKZ3 Credit Agricole Corporate And Investment Bank, New - 1,506,745.09 - - - - (5,188.53) 168.44 1,501,725.00 24,933.33
240907004 MIM-RCTC Toll Revenue: - I-15 64971XBF4 NEW YORK CITY TRANSITIONAL FINANCE AUTHORITY 273,882.60 - - (273,882.60) - 2,741.37 - (2,741.37) - -
240907004 MIM-RCTC Toll Revenue: - I-15 69353RFU7 PNC BANK NA 535,518.95 - - - - - - 449.40 535,968.35 299.24
240907004 MIM-RCTC Toll Revenue: - I-15 9127962J7 UNITED STATES TREASURY 1,500,000.00 - - (1,500,000.00) - - - - - -
240907004 MIM-RCTC Toll Revenue: - I-15 30231GBL5 EXXON MOBIL CORP 539,999.25 - (539,915.25) - - 14,915.25 - (14,999.25) - -
240907004 MIM-RCTC Toll Revenue: - I-15 38611TCS4 GRAND PARKWAY TRANSN CORP TEX SYS TOLL REV 555,000.00 - - (555,000.00) - - - - - -
240907004 MIM-RCTC Toll Revenue: - I-15 89239RAA4 TAOT 2020-B A1 124,703.16 - - - (124,655.80) 0.01 - (47.37) - -
240907004 MIM-RCTC Toll Revenue: - I-15 9127964G1 UNITED STATES TREASURY 2,999,970.00 - - (3,000,000.00) - - 39.58 (9.58) - -
240907004 MIM-RCTC Toll Revenue: - I-15 9127964H9 UNITED STATES TREASURY 2,999,940.00 - - (3,000,000.00) - - 90.50 (30.50) - -
240907004 MIM-RCTC Toll Revenue: - I-15 9127964H9 UNITED STATES TREASURY 1,499,970.00 - - (1,500,000.00) - - 47.50 (17.50) - -
240907004 MIM-RCTC Toll Revenue: - I-15 34528GAJ5 FORDO 2020-A A2 484,402.14 - - - (138,543.73) 23.60 16.44 (650.74) 345,247.71 157.61
240907004 MIM-RCTC Toll Revenue: - I-15 12597PAB4 CNH 2020-A A2 155,824.60 - - - (10,566.13) 0.29 1.43 (333.81) 144,926.39 69.33
240907004 MIM-RCTC Toll Revenue: - I-15 67777JAA6 OHIOHEALTH CORP 460,055.20 - - (460,000.00) - - - (55.20) - -
240907004 MIM-RCTC Toll Revenue: - I-15 9127964K2 UNITED STATES TREASURY 499,970.00 - - (500,000.00) - - 31.60 (1.60) - -
240907004 MIM-RCTC Toll Revenue: - I-15 9127964K2 UNITED STATES TREASURY 1,999,880.00 - - (2,000,000.00) - - 140.83 (20.83) - -
240907004 MIM-RCTC Toll Revenue: - I-15 9127964Q9 UNITED STATES TREASURY - 3,999,751.11 - (4,000,000.00) - - 248.89 - - -
240907004 MIM-RCTC Toll Revenue: - I-15 3134GVG36 FEDERAL HOME LOAN MORTGAGE CORP 375,131.25 - - (375,000.00) - - (73.38) (57.87) - -
240907004 MIM-RCTC Toll Revenue: - I-15 36259PAA4 GMALT 2020-2 A1 213,755.26 - - - (213,755.27) 0.01 - - - -
240907004 MIM-RCTC Toll Revenue: - I-15 83050PLC1 Skandinaviska Enskilda Banken AB (publ.) 1,400,000.00 - - (1,400,000.00) - - - - - -
240907004 MIM-RCTC Toll Revenue: - I-15 14913R2E6 CATERPILLAR FINANCIAL SERVICES CORP 500,445.00 - - - - - - 340.00 500,785.00 547.98
240907004 MIM-RCTC Toll Revenue: - I-15 87030JK99 Aktiebolaget Svensk Exportkredit (publ) 699,986.00 - - (700,000.00) - - 23.33 (9.33) - -
240907004 MIM-RCTC Toll Revenue: - I-15 3134GV6H6 FEDERAL HOME LOAN MORTGAGE CORP 500,285.00 - - - - - 16.66 123.34 500,425.00 715.56
240907004 MIM-RCTC Toll Revenue: - I-15 3135G05F6 FEDERAL NATIONAL MORTGAGE ASSOCIATION - 1,252,443.00 - - - - (253.48) 110.48 1,252,300.00 781.60
240907004 MIM-RCTC Toll Revenue: - I-15 80285RAA6 SDART 2020-2 A1 242,633.38 - - - (242,633.38) 0.00 - 0.00 - -
240907004 MIM-RCTC Toll Revenue: - I-15 3134GWEH5 FEDERAL HOME LOAN MORTGAGE CORP 749,887.50 - - - - - 18.73 416.27 750,322.50 898.33
240907004 MIM-RCTC Toll Revenue: - I-15 14918ELK5 Catholic Health Initiatives 749,857.50 - - (750,000.00) - - 816.67 (674.17) - -
240907004 MIM-RCTC Toll Revenue: - I-15 65602VS72 NORINCHUKIN BANK (NEW YORK BRANCH) - 675,095.26 - - - - (66.12) 51.86 675,081.00 883.13
240907004 MIM-RCTC Toll Revenue: - I-15 3134GWHG4 FEDERAL HOME LOAN MORTGAGE CORP 998,980.00 - - - - - - 1,250.00 1,000,230.00 1,837.50
240907004 MIM-RCTC Toll Revenue: - I-15 60683BK44 Mitsubishi UFJ Trust and Banking Corp. (New York B 1,500,090.00 - - - - - 38.33 (8.33) 1,500,120.00 1,109.17
240907004 MIM-RCTC Toll Revenue: - I-15 5148X0Q32 Landesbank Baden-Württemberg, New York Branch 999,150.00 - - - - - 638.89 21.11 999,810.00 -
240907004 MIM-RCTC Toll Revenue: - I-15 3133EL7F5 FEDERAL FARM CREDIT BANKS FUNDING CORP 999,610.00 - - - - - 89.05 (59.05) 999,640.00 530.00
240907004 MIM-RCTC Toll Revenue: - I-15 51501GE80 Landesbank Baden-Württemberg, New York Branch 400,004.00 - - (400,000.00) - - 0.56 (4.56) - -
240907004 MIM-RCTC Toll Revenue: - I-15 362569AH8 GMALT 2020-3 A1 1,250,000.00 - - - (727,770.91) 0.00 - 0.00 522,229.09 28.43
240907004 MIM-RCTC Toll Revenue: - I-15 43813KAA0 HAROT 2020-3 A1 1,124,988.75 - - - (499,907.91) 0.01 - 11.25 625,092.10 45.89
240907004 MIM-RCTC Toll Revenue: - I-15 02665JMF4 American Honda Finance Corporation 999,670.00 - - (1,000,000.00) - - 562.50 (232.50) - -
240907004 MIM-RCTC Toll Revenue: - I-15 51501GV32 Landesbank Baden-Württemberg, New York Branch - 375,007.74 - - - - (2.99) 10.25 375,015.00 203.13
240907004 MIM-RCTC Toll Revenue: - I-15 20775HCR2 CONNECTICUT ST HSG FIN AUTH HSG MTG FIN PROG - 165,000.00 - - - - - (69.30) 164,930.70 112.16
240907004 MIM-RCTC Toll Revenue: - I-15 60956PWG3 MONMOUTH CNTY N J IMPT AUTH REV - 76,191.75 - - - - (170.25) 10.50 76,032.00 212.50
240907004 MIM-RCTC Toll Revenue: - I-15 544647CQ1 LOS ANGELES CALIF UNI SCH DIST - 405,599.40 - - - - (599.40) - 405,000.00 774.56
2017 Financing STAMP Portfolio Transaction Report by Account
Quarter ended December 31, 2020
Page 26 of 38
ATTACHMENT 11
44

Source
Account Account Identifier Description
Beginning Base
Market Value Base Purchases Base Sales
Base Maturities and
Redemptions Base Paydowns
Net Total Realized
Gain/Loss
Base
Amortization/A
ccretion
Base Change In
Net Unrealized
Gain/Loss
Ending Base
Market Value
Ending Accrued
Income Balance
2017 Financing STAMP Portfolio Transaction Report by Account
Quarter ended December 31, 2020
240907004 MIM-RCTC Toll Revenue: - I-15 05586F5B9 BNP Paribas New York Branch - 1,149,901.52 - - - - 38.37 129.11 1,150,069.00 590.33
240907004 MIM-RCTC Toll Revenue: - I-15 43357LMF6 Hitachi Capital America Corp. - 649,863.86 - (650,000.00) - - 136.14 - - -
240907004 MIM-RCTC Toll Revenue: - I-15 93884ENM3 Washington Gas Light Company - 749,838.54 - - - - 57.29 74.17 749,970.00 -
240907004 MIM-RCTC Toll Revenue: - I-15 89114NVY8 Toronto-Dominion Bank, New York Branch - 1,249,999.99 - - - - 0.00 12.51 1,250,012.50 282.64
240907004 MIM-RCTC Toll Revenue: - I-15 14687AAM0 CRVNA 2020-P1 A2 - 384,978.32 - - - - 1.21 89.77 385,069.30 62.88
240907004 MIM-RCTC Toll Revenue: - I-15 57582RM37 MASSACHUSETTS (COMMONWEALTH OF) - 375,000.00 - - - - - 7.50 375,007.50 35.94
240907004 MIM-RCTC Toll Revenue: - I-15 3134GXJF2 FEDERAL HOME LOAN MORTGAGE CORP - 404,989.88 - - - - 0.03 (30.41) 404,959.50 2.25
240907004 MIM-RCTC Toll Revenue: - I-15 23504MAC8 DALLAS FORT WORTH TEXAS INTERNATIONAL AIRPORT - 410,000.00 - - - - - (28.70) 409,971.30 64.92
49,754,472.19 50,492,469.85 (30,484,015.76) (23,328,882.60) (3,283,576.06) 18,593.66 (47,628.35) (49,240.74) 41,064,036.91 164,975.94
240907020 RCTC I-15 Prj RAMP UP RESERVE 31846V203 FIRST AMER:GVT OBLG Y 56,999.38 1,206,836.37 (1,043,624.57) - - 0.13 - - 220,211.18 -
240907020 RCTC I-15 Prj RAMP UP RESERVE CCYUSD Cash - - - - - - - - 0.00 -
240907020 RCTC I-15 Prj RAMP UP RESERVE CCYUSD Payable - - - - - - - - (243,388.59) -
240907020 RCTC I-15 Prj RAMP UP RESERVE 3620A9WV9 GN 723460 7,860.47 - - - (850.48) (11.05) (1.67) (46.54) 6,950.72 22.06
240907020 RCTC I-15 Prj RAMP UP RESERVE 62888VAA6 NGN 2010-R1 1A 0.01 - - - - (0.01) - (0.00) - -
240907020 RCTC I-15 Prj RAMP UP RESERVE 38377REV3 GNR 2010-158 HA 19,810.74 - - - (4,675.37) (55.18) (56.80) (120.04) 14,903.35 42.65
240907020 RCTC I-15 Prj RAMP UP RESERVE 3137A6Z47 FHR 3806 P 51,975.83 - - - (12,183.14) (623.42) 253.28 (14.71) 39,407.83 140.16
240907020 RCTC I-15 Prj RAMP UP RESERVE 3138NJAE8 FN FN0004 13,905.38 - - - (13,909.25) 0.43 (2.09) 5.53 - -
240907020 RCTC I-15 Prj RAMP UP RESERVE 31381RLL6 FN 468431 44,723.19 - - - (253.96) (0.47) (43.88) (312.57) 44,112.31 145.52
240907020 RCTC I-15 Prj RAMP UP RESERVE 3137AH6C7 FHMS K-015 A2 95,641.23 - - - (13,747.31) (5.69) (15.60) (698.76) 81,173.87 216.16
240907020 RCTC I-15 Prj RAMP UP RESERVE 38376V2E6 GNR 2010-019 UA 18,624.79 - - - (1,460.05) (49.63) (24.93) (51.64) 17,038.54 53.48
240907020 RCTC I-15 Prj RAMP UP RESERVE 3137AJMF8 FHMS 2011-K016 A2 93,462.55 - - - (555.74) 1.35 11.87 (584.43) 92,335.59 225.06
240907020 RCTC I-15 Prj RAMP UP RESERVE 3137EADB2 FEDERAL HOME LOAN MORTGAGE CORP 411,548.00 - - - - - (702.72) (1,597.28) 409,248.00 4,433.33
240907020 RCTC I-15 Prj RAMP UP RESERVE 38375XCM4 GNR 2008-047 PC 17,531.17 - - - (3,251.98) (55.09) (50.02) (141.35) 14,032.73 56.72
240907020 RCTC I-15 Prj RAMP UP RESERVE 36202F2H8 G2 005276 27,218.54 - - - (2,571.12) (56.83) (6.65) 24.30 24,608.24 58.65
240907020 RCTC I-15 Prj RAMP UP RESERVE 383742C76 GNR 2008-032 PA 45,382.70 - - - (4,997.12) (68.77) (78.41) (248.86) 39,989.54 129.90
240907020 RCTC I-15 Prj RAMP UP RESERVE 36178NB99 GN AB2764 29,782.73 - - - (2,568.85) (26.82) (8.07) (128.47) 27,050.53 54.05
240907020 RCTC I-15 Prj RAMP UP RESERVE 38376YPU9 GNR 2010-050 EA 2,892.62 - - - (2,893.29) 6.71 0.17 (6.22) - -
240907020 RCTC I-15 Prj RAMP UP RESERVE 3137ATRW4 FHMS K-020 A2 102,637.00 - - - - - 191.19 (536.19) 102,292.00 197.75
240907020 RCTC I-15 Prj RAMP UP RESERVE 3137ASR97 FHMS K-020 A1 8,889.15 - - - (5,014.03) 32.99 13.64 (74.68) 3,847.06 5.04
240907020 RCTC I-15 Prj RAMP UP RESERVE 3136A72D3 FNA 2012-M9 A2 2,274.60 - - - (90.38) (0.35) (2.33) (0.73) 2,180.81 4.43
240907020 RCTC I-15 Prj RAMP UP RESERVE 3136A72D3 FNA 2012-M9 A2 9,098.41 - - - (361.53) (1.42) (9.35) (2.89) 8,723.23 17.74
240907020 RCTC I-15 Prj RAMP UP RESERVE 912828UH1 UNITED STATES TREASURY 86,769.02 - (87,077.20) - - 3,002.93 398.34 (3,093.08) - -
240907020 RCTC I-15 Prj RAMP UP RESERVE 3137AYCE9 FHMS K-025 A2 103,832.00 - - - - - (188.66) (239.34) 103,404.00 223.50
240907020 RCTC I-15 Prj RAMP UP RESERVE 3136AC7J4 FNA 2013-M6 2A 33,219.89 - - - (1,750.67) 13.70 25.11 (200.70) 31,307.33 63.61
240907020 RCTC I-15 Prj RAMP UP RESERVE 38378HXH4 GNR 2012-119 KB 5,003.75 - - - (458.09) 19.27 8.70 (31.35) 4,542.28 4.68
240907020 RCTC I-15 Prj RAMP UP RESERVE 31418AU48 FN MA1502 (0.00) - - - - (0.00) - - (0.00) -
240907020 RCTC I-15 Prj RAMP UP RESERVE 3137B1U75 FHMS K-S01 A2 116,792.07 - - - (6,383.25) 49.33 83.72 (711.46) 109,830.41 224.54
240907020 RCTC I-15 Prj RAMP UP RESERVE 38378KWU9 GNR 2013-096 A 20,636.96 - - - (246.20) 11.53 55.39 44.67 20,502.35 23.74
240907020 RCTC I-15 Prj RAMP UP RESERVE 3137B3NW4 FHMS K-031 A1 57,077.84 - - - (6,866.31) 35.97 21.48 (329.85) 49,939.13 113.37
240907020 RCTC I-15 Prj RAMP UP RESERVE 31392J6N4 FNR 0323B EQ 228,370.22 - - - (38,718.44) (1,658.79) (979.27) 129.02 187,142.74 826.76
240907020 RCTC I-15 Prj RAMP UP RESERVE 36202F3H7 G2 005300 30,031.47 - - - (2,658.76) (127.28) (28.41) 114.18 27,331.20 64.99
240907020 RCTC I-15 Prj RAMP UP RESERVE 38378KW47 GNR 2013-138 A 24,050.30 - - - (2,956.31) 6.97 6.22 (31.62) 21,075.55 37.64
240907020 RCTC I-15 Prj RAMP UP RESERVE 3138X0ZY7 FN AU1658 123,349.10 - - - (8,879.44) (443.96) (113.66) 1.29 113,913.33 227.01
240907020 RCTC I-15 Prj RAMP UP RESERVE 912828B58 UNITED STATES TREASURY 322,124.80 - - - - - 378.24 (2,035.84) 320,467.20 2,845.65
240907020 RCTC I-15 Prj RAMP UP RESERVE 912828B58 UNITED STATES TREASURY 130,863.20 - - - - - (146.92) (526.48) 130,189.80 1,156.05
240907020 RCTC I-15 Prj RAMP UP RESERVE 912828B58 UNITED STATES TREASURY 100,664.00 - - - - - (139.69) (378.31) 100,146.00 889.27
240907020 RCTC I-15 Prj RAMP UP RESERVE 3137B84S3 FHR 4305 CT 63,407.70 - - - (7,993.75) 62.69 22.99 (231.88) 55,267.76 90.60
240907020 RCTC I-15 Prj RAMP UP RESERVE 3137AXHN6 FHMS K-024 A1 25,869.50 - - - (5,971.92) 229.46 746.02 (1,036.27) 19,836.79 28.78
240907020 RCTC I-15 Prj RAMP UP RESERVE 3137A5FP4 FHR 3791 DA 27,613.11 - - - (4,022.03) 2.31 9.22 (116.52) 23,486.08 48.95
240907020 RCTC I-15 Prj RAMP UP RESERVE 912828J43 UNITED STATES TREASURY 40,915.60 - - - - - (17.42) (141.78) 40,756.40 237.85
240907020 RCTC I-15 Prj RAMP UP RESERVE 3136AMM48 FNA 2015-M4 AV2 78,432.55 - - - (256.06) 1.58 66.83 (356.38) 77,888.52 160.60
240907020 RCTC I-15 Prj RAMP UP RESERVE 36179M4J6 G2 MA0825 25,904.95 - - - (2,346.40) (25.81) (0.96) (55.30) 23,476.48 46.76
240907020 RCTC I-15 Prj RAMP UP RESERVE 912828L57 UNITED STATES TREASURY 10,323.40 - - - - - (7.46) (33.54) 10,282.40 44.71
240907020 RCTC I-15 Prj RAMP UP RESERVE 912828L57 UNITED STATES TREASURY 61,940.40 - - - - - (35.77) (210.23) 61,694.40 268.27
240907020 RCTC I-15 Prj RAMP UP RESERVE 912828L57 UNITED STATES TREASURY 655,535.90 - - - - - (158.64) (2,444.86) 652,932.40 2,839.18
240907020 RCTC I-15 Prj RAMP UP RESERVE 38378JZD7 GNR 2013-047 EC 13,519.60 - - - (1,293.10) 13.36 7.63 (46.51) 12,200.98 15.07
240907020 RCTC I-15 Prj RAMP UP RESERVE 36202FA30 G2 004526 14,077.23 - - - (1,946.91) (63.76) (13.73) (35.92) 12,016.91 42.27
240907020 RCTC I-15 Prj RAMP UP RESERVE 38377QKH9 GNR 2011-018 PG 15,317.61 - - - (2,331.19) (35.37) (28.75) (54.35) 12,867.94 30.86
240907020 RCTC I-15 Prj RAMP UP RESERVE 3137B1UF7 FHMS K-027 A1 20,223.62 - - - (2,734.61) 18.25 13.59 (80.70) 17,440.15 25.70
240907020 RCTC I-15 Prj RAMP UP RESERVE 36179Q2A8 G2 MA2569 104,881.51 - - - (9,006.16) (512.84) 22.68 333.78 95,718.98 226.87
240907020 RCTC I-15 Prj RAMP UP RESERVE 3137BQBY2 FHMS K-722 A1 58,737.24 - - - (1,659.05) (5.05) (43.30) (225.86) 56,803.97 101.34
240907020 RCTC I-15 Prj RAMP UP RESERVE 36179NAJ7 G2 MA0909 16,628.24 - - - (1,335.60) (72.60) (13.67) 71.01 15,277.37 36.32
240907020 RCTC I-15 Prj RAMP UP RESERVE 3138EJPZ5 FN AL2239 23,851.37 - - - (162.90) (2.24) (33.67) (94.84) 23,557.72 59.53
240907020 RCTC I-15 Prj RAMP UP RESERVE 912828T67 UNITED STATES TREASURY 166,998.15 - - - - - 169.81 (633.46) 166,534.50 353.25
240907020 RCTC I-15 Prj RAMP UP RESERVE 912828T67 UNITED STATES TREASURY 339,056.85 - - - - - (901.15) (40.20) 338,115.50 717.20
240907020 RCTC I-15 Prj RAMP UP RESERVE 3620ARB67 GN 737261 17,412.23 - - - (1,586.53) (22.38) (1.23) (66.59) 15,735.50 49.42
240907020 RCTC I-15 Prj RAMP UP RESERVE 3137B45W2 FHR 4243 LH - 94,266.73 - - - - - 388.26 94,654.99 28.52
240907020 RCTC I-15 Prj RAMP UP RESERVE 31418CQM9 FN MA3159 17,488.13 - - - (1,705.49) (38.64) (7.23) (56.67) 15,680.11 37.36
240907020 RCTC I-15 Prj RAMP UP RESERVE 31418CQM9 FN MA3159 87,440.67 - - - (8,527.46) (452.61) (57.43) (2.62) 78,400.56 186.78
240907020 RCTC I-15 Prj RAMP UP RESERVE 3140J6DU8 FN BM1914 66,687.67 - - - (5,277.16) (30.53) (11.00) (298.49) 61,070.48 121.77
240907020 RCTC I-15 Prj RAMP UP RESERVE 3138L2GH4 FN AM1999 21,228.57 - - - (150.03) 0.42 13.01 (201.91) 20,890.06 33.61
240907020 RCTC I-15 Prj RAMP UP RESERVE 38378AWX5 GNR 2011-157 QA 3,008.25 - - - (3,008.73) (0.06) 1.58 (1.04) - -
240907020 RCTC I-15 Prj RAMP UP RESERVE 3136A96F0 FNA 2012-M17 A2 45,946.78 - - - (1,449.20) 19.22 73.13 (93.11) 44,496.81 79.10
240907020 RCTC I-15 Prj RAMP UP RESERVE 3137ARVU7 FHR 4073 AJ 88,699.87 - - - (25,865.56) (298.47) (198.39) 90.02 62,427.47 154.89
240907020 RCTC I-15 Prj RAMP UP RESERVE 3128MENS6 FH G15601 - 18,643.48 - - (850.24) (39.31) (17.02) (1.79) 17,735.13 35.34
240907020 RCTC I-15 Prj RAMP UP RESERVE 3137FGZN8 FHMS K-I02 A 3,399.00 - - - (3,399.87) 5.04 4.47 (8.64) - -
240907020 RCTC I-15 Prj RAMP UP RESERVE 38379HLE3 GNR 2014-184 WK 10,186.49 - - - (10,116.83) 17.83 (0.28) (87.20) - -
240907020 RCTC I-15 Prj RAMP UP RESERVE 9128285H9 UNITED STATES TREASURY 415,008.30 - (365,005.70) (50,000.00) - 5.87 0.33 (8.80) - -
240907020 RCTC I-15 Prj RAMP UP RESERVE 9128285H9 UNITED STATES TREASURY 550,011.00 - - (550,000.00) - - (22.91) 11.91 - -
240907020 RCTC I-15 Prj RAMP UP RESERVE 31381QB54 FN 467260 54,746.37 - - - (349.77) (0.35) (111.24) 111.75 54,396.76 206.67
240907020 RCTC I-15 Prj RAMP UP RESERVE 38378VC45 GNR 2013-116 MA 46,443.80 - - - (5,338.57) 142.77 99.90 (419.05) 40,928.84 74.66
240907020 RCTC I-15 Prj RAMP UP RESERVE 38377JM59 GNR 2010-111 PE 18,543.54 - - - (4,300.48) 61.35 57.72 (222.57) 14,139.56 29.04
240907020 RCTC I-15 Prj RAMP UP RESERVE 9128285Y2 UNITED STATES TREASURY 350,112.00 - (250,063.19) - - (2.27) (61.31) 22.77 100,008.00 35.05
240907020 RCTC I-15 Prj RAMP UP RESERVE 9128285Y2 UNITED STATES TREASURY 350,112.00 - - - - - (98.35) 14.35 350,028.00 122.66
240907020 RCTC I-15 Prj RAMP UP RESERVE 9128285Y2 UNITED STATES TREASURY - 75,014.61 - - - - (7.42) (1.19) 75,006.00 26.28
Page 27 of 38
45

Source
Account Account Identifier Description
Beginning Base
Market Value Base Purchases Base Sales
Base Maturities and
Redemptions Base Paydowns
Net Total Realized
Gain/Loss
Base
Amortization/A
ccretion
Base Change In
Net Unrealized
Gain/Loss
Ending Base
Market Value
Ending Accrued
Income Balance
2017 Financing STAMP Portfolio Transaction Report by Account
Quarter ended December 31, 2020
240907020 RCTC I-15 Prj RAMP UP RESERVE 3137ARBX3 FHR 4061 CF 19,431.56 - - - (7,811.37) 114.49 113.93 (238.62) 11,609.99 2.62
240907020 RCTC I-15 Prj RAMP UP RESERVE 9128286N5 UNITED STATES TREASURY 87,249.44 - (87,675.86) - - 4,294.64 240.61 (4,108.82) - -
240907020 RCTC I-15 Prj RAMP UP RESERVE 9128286N5 UNITED STATES TREASURY 87,249.44 - (3,303.56) - - 163.87 333.76 767.04 85,210.54 85.17
240907020 RCTC I-15 Prj RAMP UP RESERVE 3132A9QE0 FH ZS8553 124,046.37 - - - (12,554.30) (588.44) 51.88 (87.84) 110,867.68 221.03
240907020 RCTC I-15 Prj RAMP UP RESERVE 3132A9SM0 FH ZS8624 74,095.25 - - - (6,687.02) (313.54) 14.87 (117.43) 66,992.13 133.52
240907020 RCTC I-15 Prj RAMP UP RESERVE 9128286U9 UNITED STATES TREASURY 41,296.80 - - - - - (67.94) (135.26) 41,093.60 110.36
240907020 RCTC I-15 Prj RAMP UP RESERVE 3137BFE80 FHMS K-041 A1 96,343.20 - - - (5,080.98) (209.44) (287.62) 434.63 91,199.80 198.22
240907020 RCTC I-15 Prj RAMP UP RESERVE 38379JM99 GNR 2015-045 AG 10,875.57 - - - (2,834.93) (10.03) (11.79) (70.84) 7,947.98 16.37
240907020 RCTC I-15 Prj RAMP UP RESERVE 912828YK0 UNITED STATES TREASURY 235,830.50 - - - - - 158.66 (867.06) 235,122.10 677.68
240907020 RCTC I-15 Prj RAMP UP RESERVE 912828YK0 UNITED STATES TREASURY 189,689.75 - - - - - 135.76 (705.56) 189,119.95 545.09
240907020 RCTC I-15 Prj RAMP UP RESERVE 3132CJAJ2 FH SA0009 37,137.46 - - - (3,424.64) (92.68) (19.55) (70.42) 33,530.16 79.93
240907020 RCTC I-15 Prj RAMP UP RESERVE 912828ZD5 UNITED STATES TREASURY - 171,354.69 - - - - (104.87) 132.28 171,382.10 253.59
240907020 RCTC I-15 Prj RAMP UP RESERVE 912828ZD5 UNITED STATES TREASURY - 171,374.61 - - - - (96.07) 103.56 171,382.10 253.59
240907020 RCTC I-15 Prj RAMP UP RESERVE 912828ZD5 UNITED STATES TREASURY - 176,374.02 - - - - (96.02) 144.75 176,422.75 261.05
240907020 RCTC I-15 Prj RAMP UP RESERVE 912828ZD5 UNITED STATES TREASURY - 176,312.50 - - - - (87.43) 197.68 176,422.75 261.05
240907020 RCTC I-15 Prj RAMP UP RESERVE 36179NHK7 G2 MA1134 119,708.45 - - - (9,480.71) (385.56) (53.58) 333.56 110,122.16 261.79
240907020 RCTC I-15 Prj RAMP UP RESERVE 3135G03F8 FEDERAL NATIONAL MORTGAGE ASSOCIATION 100,050.00 - - (100,000.00) - - (30.73) (19.27) - -
240907020 RCTC I-15 Prj RAMP UP RESERVE 3622A2GC0 GN 783795 72,383.06 - - - (6,177.11) (243.31) (51.85) (107.85) 65,802.93 131.50
240907020 RCTC I-15 Prj RAMP UP RESERVE 36179RFD6 G2 MA2864 23,528.75 - - - (2,109.04) (104.76) 10.62 60.41 21,385.99 50.83
240907020 RCTC I-15 Prj RAMP UP RESERVE 912828ZP8 UNITED STATES TREASURY - 254,482.03 - - - - 28.44 420.68 254,931.15 41.38
240907020 RCTC I-15 Prj RAMP UP RESERVE 3134GV6H6 FEDERAL HOME LOAN MORTGAGE CORP 125,071.25 - - - - - 1.40 33.60 125,106.25 178.89
240907020 RCTC I-15 Prj RAMP UP RESERVE 3135G05F6 FEDERAL NATIONAL MORTGAGE ASSOCIATION - 100,195.44 - - - - (20.28) 8.84 100,184.00 62.53
240907020 RCTC I-15 Prj RAMP UP RESERVE 3134GWGB6 FEDERAL HOME LOAN MORTGAGE CORP 100,035.00 - - - - - - (13.00) 100,022.00 191.25
240907020 RCTC I-15 Prj RAMP UP RESERVE 3137EAEV7 FEDERAL HOME LOAN MORTGAGE CORP 175,119.00 - - - - - 14.79 210.96 175,344.75 157.99
240907020 RCTC I-15 Prj RAMP UP RESERVE 31418DSA1 FN MA4112 129,191.77 - - - (4,111.14) (231.57) (185.61) 206.94 124,870.40 295.24
240907020 RCTC I-15 Prj RAMP UP RESERVE 3133EL7F5 FEDERAL FARM CREDIT BANKS FUNDING CORP 199,922.00 - - - - - 15.27 (9.27) 199,928.00 106.00
240907020 RCTC I-15 Prj RAMP UP RESERVE 3140J8ME0 FN BM3956 - 32,715.41 - - - - - 33.58 32,748.99 46.00
240907020 RCTC I-15 Prj RAMP UP RESERVE 3134GWTL0 FEDERAL HOME LOAN MORTGAGE CORP 84,947.30 - - - - - 1.08 66.07 85,014.45 65.88
240907020 RCTC I-15 Prj RAMP UP RESERVE 91282CAP6 UNITED STATES TREASURY - 169,674.61 - - - - 21.80 184.59 169,881.00 45.54
240907020 RCTC I-15 Prj RAMP UP RESERVE 3134GWY42 FEDERAL HOME LOAN MORTGAGE CORP - 99,950.00 - - - - 3.65 43.35 99,997.00 65.00
240907020 RCTC I-15 Prj RAMP UP RESERVE 3132AEFC5 FH ZT1963 - 64,956.51 - - (2,638.90) (204.61) (47.81) 479.78 62,544.96 168.31
240907020 RCTC I-15 Prj RAMP UP RESERVE 3136G46A6 FEDERAL NATIONAL MORTGAGE ASSOCIATION - 129,967.50 - - - - 1.96 34.44 130,003.90 69.33
240907020 RCTC I-15 Prj RAMP UP RESERVE 3134GXDT8 FEDERAL HOME LOAN MORTGAGE CORP - 65,000.00 - - - - - 27.95 65,027.95 23.38
240907020 RCTC I-15 Prj RAMP UP RESERVE 3134GXDT8 FEDERAL HOME LOAN MORTGAGE CORP - 70,035.00 - - - - - (4.90) 70,030.10 27.22
240907020 RCTC I-15 Prj RAMP UP RESERVE 38378PZN1 GNR 2014-010 B - 46,256.88 - - - - - 88.26 46,345.14 12.83
8,485,954.19 3,123,410.40 (1,836,750.08) (700,000.00) (314,196.81) 1,163.48 (1,703.91) (20,632.01) 8,493,856.54 24,198.91
Page 28 of 38
46

*Negative cash reflects securities in transit at month end
2017 Financing STAMP Portfolio Summary of Investments for quarter ended December 31, 2020
Credit Rating Industry Group
Asset Class Security Type Market Sector
ATTACHMENT 12
47

*Negative cash reflects securities in transit at month end
2017 Financing STAMP Portfolio
Sales Tax I15 ELP Project Revenue Fund Summary of Investments for quarter ended December 31, 2020
Credit Rating Industry Group
Asset Class Security Type Market Sector
ATTACHMENT 13
48

*Negative cash reflects securities in transit at month end
2017 Financing STAMP Portfolio
Ramp Up Fund Summary of Investments for quarter ended December 31, 2020
Credit Rating Industry Group
Asset Class Security Type Market Sector
ATTACHMENT 14
49

Account Number: 001050990415 Name: RIVERSIDE COUNTY TRANS COMM
CUSIP Security Type Category Issuer Final Maturity Trade Date
Next Call
Date Original Cost
Base Market
Value
Unrealized
Gain/Loss
Accrued
Income Coupon Yield
Credit
Rating
3130AGWK7 Agencies F H L B DEB 1.500% 8/15/24 08/15/2024 08/16/2019 149,647.50 157,132.50 7,485.00 850.00 1.500 1.437373631 AA+
3134GWAR7 Agencies F H L M C M T N 0.750% 7/21/25 07/21/2025 07/21/2020 01/21/2021 500,000.00 500,150.00 150.00 1,666.67 0.750 0.750000000 N/A
3134GXDZ4 Agencies F H L M C M T N 0.450% 11/25/24 11/25/2024 11/25/2020 11/25/2022 300,000.00 300,075.00 75.00 135.00 0.450 0.450027002 N/A
3135G04Q3 Agencies F N M A 0.250% 5/22/23 05/22/2023 05/22/2020 588,224.10 591,392.40 3,168.30 159.79 0.250 0.249416366 AA+
3135G05G4 Agencies F N M A 0.250% 7/10/23 07/10/2023 07/10/2020 508,903.50 511,218.90 2,315.40 605.63 0.250 0.249538354 AA+
3135G0W33 Agencies F N M A 1.375% 9/06/22 09/06/2022 09/06/2019 89,686.80 91,915.20 2,228.40 395.31 1.380 1.348700343 AA+
3137EAEQ8 Agencies F H L M C 0.375% 4/20/23 04/20/2023 04/20/2020 558,600.00 562,833.60 4,233.60 414.17 0.380 0.372989586 AA+
3137EAES4 Agencies F H L M C M T N 0.250% 6/26/23 06/26/2023 06/26/2020 538,423.20 541,171.80 2,748.60 18.75 0.250 0.249481079 AA+
3137EAEV7 Agencies F H L M C M T N 0.250% 8/24/23 08/24/2023 08/21/2020 519,469.60 521,024.40 1,554.80 469.44 0.250 0.249608115 AA+
3137EAEW5 Agencies F H L M C 0.250% 9/08/23 09/08/2023 09/04/2020 379,874.60 380,737.20 862.60 308.75 0.250 0.249595655 AA+
3137EAEY1 Agencies F H L M C M T N 0.125% 10/16/23 10/16/2023 10/16/2020 418,433.40 419,714.40 1,281.00 109.38 0.130 0.125237952 AA+
911759MU9 Agencies U S DEPT HSG & URB 2.570% 8/01/21 08/01/2021 03/28/2019 100,000.00 101,335.00 1,335.00 1,070.83 2.570 2.541057357 N/A
05588CAC6 Asset-Backed BMW VEHICLE OWNER 1.920% 1/25/24 01/25/2024 09/18/2019 329,955.65 335,032.50 5,076.85 105.60 1.920 1.894182295 AAA
14043MAC5 Asset-Backed CAPTIAL ONE PRIME 1.600% 11/15/24 11/15/2024 02/19/2020 289,938.35 295,608.60 5,670.25 206.22 1.600 1.570536731 AAA
26208VAD8 Asset-Backed DRIVE AUTO 0.830% 5/15/24 05/15/2024 06/17/2020 89,996.56 90,449.10 452.54 33.20 0.830 0.825829561 AAA
41284WAC4 Asset-Backed HARLEY DAVIDSON 2.340% 2/15/24 02/15/2024 06/26/2019 589,954.33 597,734.90 7,780.57 613.60 2.340 2.309787973 N/A
43815NAC8 Asset-Backed HONDA AUTO 1.780% 8/15/23 08/15/2023 08/27/2019 249,997.93 254,080.00 4,082.07 197.78 1.780 1.753245474 AAA
47789JAD8 Asset-Backed JOHN DEERE OWNER 2.910% 7/17/23 07/17/2023 03/13/2019 230,291.74 234,728.37 4,436.63 297.88 2.910 2.859107880 N/A
47789KAC7 Asset-Backed JOHN DEERE OWNER 1.100% 8/15/24 08/15/2024 03/11/2020 429,973.73 435,396.50 5,422.77 210.22 1.100 1.086312463 N/A
58769TAD7 Asset-Backed MERCEDES BENZ 1.940% 3/15/24 03/15/2024 09/25/2019 269,962.82 274,841.10 4,878.28 232.80 1.940 1.910483037 AAA
58770FAC6 Asset-Backed MERCEDES BENZ AUTO 1.840% 12/15/22 12/15/2022 01/29/2020 139,981.55 141,955.80 1,974.25 114.49 1.840 1.816171826 AAA
80285WAD9 Asset-Backed SANTANDER DRIVE 0.00001% 7/15/24 07/15/2024 09/23/2020 329,968.45 330,811.80 843.35 0.00 0.520 0.000009976 N/A
89238UAD2 Asset-Backed TOYOTA AUTO 1.910% 9/15/23 09/15/2023 08/14/2019 249,997.95 253,932.50 3,934.55 212.22 1.910 1.882552386 AAA
023135AJ5 Credit AMAZON COM INC 2.500% 11/29/22 11/29/2022 11/29/2012 08/29/2022 311,158.09 311,556.00 397.91 666.67 2.500 2.415505614 AA-
023135BP0 Credit AMAZON COM INC SR NT 0.400% 6/03/23 06/03/2023 06/03/2020 269,622.00 271,517.40 1,895.40 84.00 0.400 0.398247710 AA-
037833DL1 Credit APPLE INC 1.700% 9/11/22 09/11/2022 09/11/2019 524,910.75 538,266.75 13,356.00 2,727.08 1.700 1.660172463 AA+
037833DV9 Credit APPLE INC 0.750% 5/11/23 05/11/2023 05/11/2020 194,469.60 197,326.35 2,856.75 203.13 0.750 0.740806590 AA+
06050TMJ8 Credit BANK OF AMERICA MTN 3.335% 1/25/23 01/25/2023 01/25/2019 01/25/2022 520,000.00 536,889.60 16,889.60 7,514.87 3.340 3.239845731 A+
06406FAA1 Credit BANK OF NY MTN 2.500% 4/15/21 04/15/2021 02/19/2016 03/15/2021 450,360.89 452,029.50 1,668.61 2,375.00 2.500 2.494437405 A
06406RAK3 Credit BANK OF NY MTN 1.950% 8/23/22 08/23/2022 08/23/2019 99,968.00 102,859.00 2,891.00 693.33 1.950 1.898050362 A
06406RAM9 Credit BANK OF NY MTN 1.850% 1/27/23 01/27/2023 01/28/2020 01/02/2023 299,790.00 309,375.00 9,585.00 2,374.17 1.850 1.795349559 A
084670BQ0 Credit BERKSHIRE HATHAWAY 2.200% 3/15/21 03/15/2021 03/15/2016 02/15/2021 466,436.01 472,022.07 5,586.06 3,051.03 2.200 2.196134803 AA
144141DC9 Credit PROG ENERGY CAROLINA 2.800% 5/15/22 05/15/2022 05/18/2012 02/15/2022 251,702.70 256,902.50 5,199.80 894.44 2.800 2.729869649 A
166756AJ5 Credit CHEVRON USA INC 0.426% 8/11/23 08/11/2023 08/12/2020 115,000.00 115,580.75 580.75 189.16 0.430 0.424662314 AA
166764AU4 Credit CHEVRON CORP 0.78113% 3/03/22 03/03/2022 03/03/2015 501,501.87 502,600.00 1,098.13 314.62 0.760 0.777491341 AA
17325FAQ1 Credit CITIBANK NA 3.400% 7/23/21 07/23/2021 07/23/2018 06/23/2021 251,243.28 253,682.50 2,439.22 3,730.56 3.400 3.359683794 A+
17325FAY4 Credit CITIBANK NA 2.844% 5/20/22 05/20/2022 05/22/2019 05/20/2021 510,379.83 514,845.00 4,465.17 1,651.89 2.840 2.823473349 A+
250847EJ5 Credit DETROIT EDISON CO 2.650% 6/15/22 06/15/2022 06/22/2012 181,501.54 184,903.20 3,401.66 212.00 2.650 2.585643337 A
30231GAV4 Credit EXXON MOBIL 2.222% 3/01/21 03/01/2021 03/03/2016 495,685.00 500,715.00 5,030.00 3,703.33 2.220 2.221466848 AA
30231GBB7 Credit EXXON MOBIL 1.902% 8/16/22 08/16/2022 08/16/2019 300,000.00 308,631.00 8,631.00 2,139.75 1.900 1.853963798 AA
46647PBB1 Credit JPMORGAN CHASE CO 3.207% 4/01/23 04/01/2023 03/22/2019 04/01/2022 1,050,000.00 1,088,125.50 38,125.50 8,418.38 3.210 3.107076422 A-
654106AH6 Credit NIKE INC SR NT 2.400% 3/27/25 03/27/2025 03/27/2020 02/27/2025 19,972.80 21,553.80 1,581.00 125.33 2.400 2.238785086 AA-
693304AP2 Credit PECO ENERGY CO 2.375% 9/15/22 09/15/2022 09/17/2012 06/15/2022 120,687.12 123,616.80 2,929.68 839.17 2.380 2.310805814 A
717081EM1 Credit PFIZER INC 3.000% 9/15/21 09/15/2021 09/07/2018 249,662.50 254,952.50 5,290.00 2,208.33 3.000 2.953104697 A+
90331HPA5 Credit US BANK NA MTN 3.000% 2/04/21 02/04/2021 02/04/2019 01/04/2021 269,781.30 270,000.00 218.70 3,307.50 3.000 3.000000000 N/R
90331HPF4 Credit US BANK NA MTN 1.950% 1/09/23 01/09/2023 12/09/2019 12/09/2022 549,538.00 567,391.00 17,853.00 5,124.17 1.950 1.889956095 AA-
931142EJ8 Credit WALMART INC 3.125% 6/23/21 06/23/2021 06/27/2018 129,993.50 131,782.30 1,788.80 90.28 3.130 3.091335358 AA
94988J5T0 Credit WELLS FARGO MTN 3.625% 10/22/21 10/22/2021 10/23/2018 09/21/2021 529,941.70 542,582.20 12,640.50 3,682.40 3.630 3.551484275 A+
94988J6A0 Credit WELLS FARGO MTN 2.082% 9/09/22 09/09/2022 09/11/2019 09/09/2021 550,000.00 556,286.50 6,286.50 3,626.15 2.080 2.060631254 A+
3136AKQM8 Mortgage-Backed F N M A GTD REMIC 3.056% 6/25/24 06/25/2024 07/01/2014 435,201.43 437,260.76 2,059.33 1,040.43 3.060 2.865393992 N/A
3136B1XP4 Mortgage-Backed F N M A GTD REMIC 3.560% 9/25/21 09/25/2021 04/01/2018 80,366.43 80,408.92 42.49 237.41 3.560 3.528595500 N/A
3137ATRW4 Mortgage-Backed F H L M C MULTICLASS 2.373% 5/25/22 05/25/2022 09/01/2012 190,517.13 194,354.80 3,837.67 375.73 2.370 2.324374094 N/A
3137B1U75 Mortgage-Backed F H L M C MLTCL MTG 2.522% 1/25/23 01/25/2023 05/07/2013 142,859.36 146,440.55 3,581.19 299.39 2.520 2.458066101 N/A
3137B36J2 Mortgage-Backed F H L M C MLTCL MT 3.320% 2/25/23 02/25/2023 07/01/2013 493,258.64 507,604.80 14,346.16 1,328.00 3.320 3.160039215 N/A
3137B4WB8 Mortgage-Backed F H L M C MLTCL MTG 3.060% 7/25/23 07/25/2023 10/01/2013 508,315.35 520,429.00 12,113.65 1,249.50 3.060 2.883011899 N/A
010831DN2 Taxable Muni ALAMEDA CNTY CA JT 2.866% 6/01/21 06/01/2021 04/24/2018 255,000.00 257,519.40 2,519.40 609.02 2.870 2.844439151 AA+
010831DQ5 Taxable Muni ALAMEDA CNTY CA 3.095% 6/01/23 06/01/2023 04/24/2018 134,242.96 138,023.60 3,780.64 335.29 3.100 2.921216812 AA+
Payden & Rygel Operating Portfolio by Investment Category for Quarter ended December 31, 2020
ATTACHMENT 15
50

Account Number: 001050990415 Name: RIVERSIDE COUNTY TRANS COMM
CUSIP Security Type Category Issuer Final Maturity Trade Date
Next Call
Date Original Cost
Base Market
Value
Unrealized
Gain/Loss
Accrued
Income Coupon Yield
Credit
Rating
Payden & Rygel Operating Portfolio by Investment Category for Quarter ended December 31, 2020
072024WN8 Taxable Muni BAY AREA CA TOLL 2.184% 4/01/23 04/01/2023 09/26/2019 680,000.00 706,785.20 26,785.20 3,712.80 2.180 2.103924629 AA
088006JW2 Taxable Muni BEVERLY HILLS CA 0.373% 6/01/22 06/01/2022 10/15/2020 330,000.00 330,425.70 425.70 102.57 0.370 0.372366976 AA+
13032UUZ9 Taxable Muni CALIFORNIA ST HLTH 1.893% 6/01/22 06/01/2022 11/25/2019 520,000.00 531,450.40 11,450.40 820.30 1.890 1.854119122 AA-
13063BFS6 Taxable Muni CALIFORNIA ST BUILD 6.650% 3/01/22 03/01/2022 04/01/2010 444,519.41 442,522.75 -1,996.66 9,420.83 6.650 6.423879444 AA-
13063DGA0 Taxable Muni CALIFORNIA ST 2.800% 4/01/21 04/01/2021 04/25/2018 500,000.00 503,105.00 3,105.00 3,500.00 2.800 2.789650397 AA-
13066YTY5 Taxable Muni CALIFORNIA ST DEPT 1.713% 5/01/21 05/01/2021 09/28/2016 80,813.58 82,029.95 1,216.37 233.07 1.710 1.707263594 AA+
13066YTZ2 Taxable Muni CALIFORNIA ST DEPT 2.000% 5/01/22 05/01/2022 09/28/2016 300,665.32 306,927.00 6,261.68 1,000.00 2.000 1.957253582 AA+
13077DMJ8 Taxable Muni CALIFORNIA ST UNIV 0.475% 11/01/23 11/01/2023 09/17/2020 150,000.00 150,280.50 280.50 205.83 0.480 0.473399908 AA-
20772JKP6 Taxable Muni CONNECTICUT ST 2.401% 10/15/21 10/15/2021 11/16/2012 120,073.52 121,774.80 1,701.28 608.25 2.400 2.364515525 A
20772KGM5 Taxable Muni CONNECTICUT ST SER A 2.921% 4/15/23 04/15/2023 04/11/2019 301,026.67 316,878.00 15,851.33 1,849.97 2.920 2.761992114 A
20772KJU4 Taxable Muni CONNECTICUT ST 2.500% 7/01/22 07/01/2022 06/11/2020 121,480.10 123,806.40 2,326.30 1,666.67 2.500 2.423278987 A
212204JC6 Taxable Muni CONTRA COSTA CA 1.652% 8/01/22 08/01/2022 09/12/2019 300,000.00 306,105.00 6,105.00 2,065.00 1.650 1.620306799 AA+
3582326S0 Taxable Muni FRESNO CALIF UNI CA 0.719% 8/01/24 08/01/2024 09/30/2020 150,000.00 150,480.00 480.00 272.62 0.720 0.717049625 N/A
365298Y28 Taxable Muni GARDEN GROVE CA 1.875% 8/01/21 08/01/2021 10/16/2019 300,000.00 302,712.00 2,712.00 2,343.75 1.880 1.860765147 AA-
378460YB9 Taxable Muni GLENDALE CA 1.041% 9/01/22 09/01/2022 06/02/2020 330,000.00 334,233.90 4,233.90 1,145.10 1.040 1.028747616 N/A
419792YL4 Taxable Muni HAWAII ST SER FX 2.770% 1/01/22 01/01/2022 02/21/2019 190,000.00 194,607.50 4,607.50 2,631.50 2.770 2.708198901 AA+
544290JC4 Taxable Muni LOS ALTOS CA SCH 2.143% 8/01/23 08/01/2023 10/17/2019 390,000.00 390,140.40 140.40 3,482.38 2.140 2.132465620 SP-1+
54438CYJ5 Taxable Muni LOS ANGELES CA 0.673% 8/01/24 08/01/2024 11/10/2020 170,000.00 171,472.20 1,472.20 162.08 0.670 0.668560757 AA+
544587Y28 Taxable Muni LOS ANGELES CA 0.515% 11/01/22 11/01/2022 08/20/2020 325,000.00 325,406.25 406.25 609.06 0.520 0.514177316 AA-
56052AE77 Taxable Muni MAINE ST 1.250% 6/01/22 06/01/2022 06/24/2020 251,781.81 252,617.50 835.69 260.42 1.250 1.237329743 AA
57582RF76 Taxable Muni MASSACHUSETTS ST 0.386% 7/01/22 07/01/2022 07/09/2020 210,000.00 210,541.80 541.80 387.29 0.390 0.385198787 AA
62451FKF6 Taxable Muni MOUNTAIN VIEW CA 1.043% 9/01/22 09/01/2022 05/19/2020 250,000.00 252,632.50 2,632.50 1,607.96 1.040 1.032284883 AA+
76913CAX7 Taxable Muni RIVERSIDE CNTY CA 2.363% 2/15/23 02/15/2023 05/06/2020 170,000.00 176,308.70 6,308.70 1,517.57 2.360 2.281218323 AA
786134WD4 Taxable Muni SACRAMENTO CNTY CA 0.629% 12/01/22 12/01/2022 07/14/2020 280,000.00 281,072.40 1,072.40 146.77 0.630 0.626487784 AA
796720ME7 Taxable Muni SAN BERNARDINO CA 1.883% 8/01/22 08/01/2022 12/12/2019 435,000.00 446,049.00 11,049.00 3,412.94 1.880 1.838346562 AA
796720NP1 Taxable Muni SAN BERNARDINO CA 0.729% 8/01/23 08/01/2023 07/07/2020 150,000.00 151,660.50 1,660.50 455.63 0.730 0.721189518 AA
797299LT9 Taxable Muni SAN DIEGO CA PUBLIC 2.994% 10/15/21 10/15/2021 06/21/2018 200,000.00 203,972.00 3,972.00 1,264.13 2.990 2.942245895 AA-
79730CJG0 Taxable Muni SAN DEIGO CA PUB 1.327% 8/01/23 08/01/2023 05/11/2020 80,000.00 81,758.40 1,758.40 442.33 1.330 1.299311668 N/A
79730WAY6 Taxable Muni SAN DIEGO CA 3.250% 9/01/22 09/01/2022 01/28/2016 255,247.22 261,302.50 6,055.28 2,708.33 3.250 3.106094636 AA
79770GGP5 Taxable Muni SAN FRANCISCO CA 2.375% 8/01/22 08/01/2022 11/30/2017 404,322.98 411,392.00 7,069.02 3,958.33 2.380 2.312155611 AA-
801096AP3 Taxable Muni SANTA ANA CA CMNTY 3.346% 9/01/21 09/01/2021 11/08/2018 240,000.00 244,869.60 4,869.60 2,676.80 3.350 3.287999686 AA
80136PCY7 Taxable Muni SANTA BARBARA CA 3.300% 12/01/21 12/01/2021 11/28/2018 125,000.00 128,171.25 3,171.25 343.75 3.300 3.226058734 AA
80168FMA1 Taxable Muni SANTA CLARA VLY CA 2.387% 6/01/21 06/01/2021 03/30/2016 397,756.00 403,568.00 5,812.00 795.67 2.390 2.370736746 N/A
835569GP3 Taxable Muni SONOMA CNTY CA 1.969% 8/01/22 08/01/2022 11/12/2019 420,000.00 429,563.40 9,563.40 3,445.75 1.970 1.923020578 AA
842475P58 Taxable Muni SOUTHERN CALIF CA 0.527% 7/01/23 07/01/2023 09/24/2020 370,000.00 370,858.40 858.40 525.39 0.530 0.525696273 AA-
91412G2S3 Taxable Muni UNIV OF CALIFORNIA 2.112% 5/15/21 05/15/2021 09/28/2017 140,000.00 140,903.00 903.00 377.81 2.110 2.101743492 AA-
91412HDJ9 Taxable Muni UNIV OF CA 3.283% 5/15/22 05/15/2022 06/05/2018 285,412.25 296,297.40 10,885.15 1,195.56 3.280 3.165100024 AA-
91412HFK4 Taxable Muni UNIVERSITY CALIF CA 0.628% 5/15/23 05/15/2023 07/16/2020 230,000.00 231,455.90 1,455.90 184.56 0.630 0.624006359 AA
916544ER6 Taxable Muni UPPER SANTA CLARA CA 0.525% 8/01/22 08/01/2022 07/23/2020 330,000.00 330,630.30 630.30 760.38 0.530 0.523267983 AA
91282CAK7 Treasuries U S TREASURY NT 0.125% 9/15/23 09/15/2023 09/15/2020 4,615,978.43 4,616,766.00 855.95 1,722.93 0.130 0.125107593 N/A
91282CAP6 Treasuries U S TREASURY NT 0.125% 10/15/23 10/15/2023 10/15/2020 4,061,573.83 4,067,151.00 5,577.17 1,090.18 0.130 0.125141410 N/A
91282CAW1 Treasuries U S TREASURY NT 0.250% 11/15/23 11/15/2023 11/15/2020 5,580,719.95 5,585,651.70 4,931.75 1,807.94 0.250 0.249493528 N/A
91282CAX9 Treasuries U S TREASURY NT 0.125% 11/30/22 11/30/2022 11/30/2020 7,945,835.45 7,945,953.40 117.95 873.08 0.130 0.124985002 N/A
91282CBA8 Treasuries U S TREASURY NT 0.125% 12/15/23 12/15/2023 12/15/2020 2,227,212.50 2,227,390.90 178.40 130.19 0.130 0.125185274 N/A
31846V203 FIRST AM GOVT OB FD CL Y 521,861.90 521,861.90 0.00 1.39 0.005986000
55,185,630.46 55,652,848.02 467,285.94 141,774.10
51
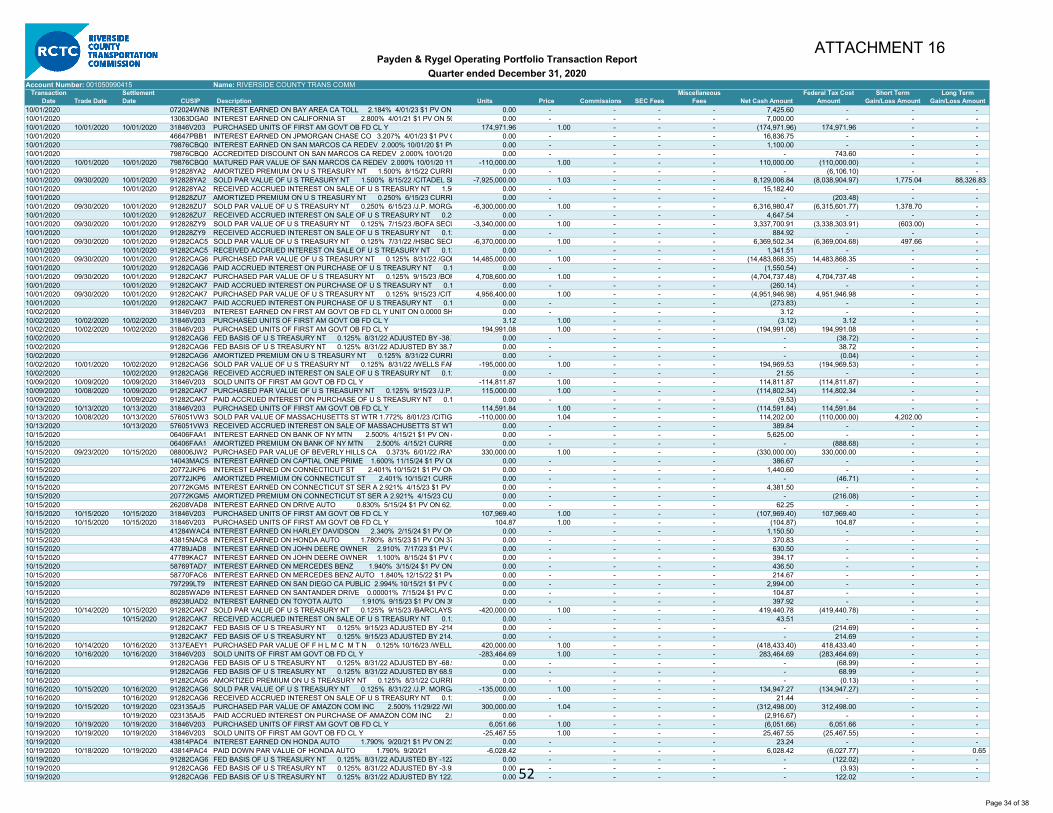
Account Number: 001050990415 Name: RIVERSIDE COUNTY TRANS COMMTransaction
Date Trade Date
Settlement
Date CUSIP Description Units Price Commissions SEC Fees
Miscellaneous
Fees Net Cash Amount
Federal Tax Cost
Amount
Short Term
Gain/Loss Amount
Long Term
Gain/Loss Amount
10/01/2020 072024WN8 INTEREST EARNED ON BAY AREA CA TOLL 2.184% 4/01/23 $1 PV ON 0.00 - - - - 7,425.60 - - -
10/01/2020 13063DGA0 INTEREST EARNED ON CALIFORNIA ST 2.800% 4/01/21 $1 PV ON 50 0.00 - - - - 7,000.00 - - -
10/01/2020 10/01/2020 10/01/2020 31846V203 PURCHASED UNITS OF FIRST AM GOVT OB FD CL Y 174,971.96 1.00 - - - (174,971.96) 174,971.96 - -
10/01/2020 46647PBB1 INTEREST EARNED ON JPMORGAN CHASE CO 3.207% 4/01/23 $1 PV O 0.00 - - - - 16,836.75 - - -
10/01/2020 79876CBQ0 INTEREST EARNED ON SAN MARCOS CA REDEV 2.000% 10/01/20 $1 PV 0.00 - - - - 1,100.00 - - -
10/01/2020 79876CBQ0 ACCREDITED DISCOUNT ON SAN MARCOS CA REDEV 2.000% 10/01/20 0.00 - - - - - 743.60 - -
10/01/2020 10/01/2020 10/01/2020 79876CBQ0 MATURED PAR VALUE OF SAN MARCOS CA REDEV 2.000% 10/01/20 11 -110,000.00 1.00 - - - 110,000.00 (110,000.00) - -
10/01/2020 912828YA2 AMORTIZED PREMIUM ON U S TREASURY NT 1.500% 8/15/22 CURRE 0.00 - - - - - (6,106.10) - -
10/01/2020 09/30/2020 10/01/2020 912828YA2 SOLD PAR VALUE OF U S TREASURY NT 1.500% 8/15/22 /CITADEL SE -7,925,000.00 1.03 - - - 8,129,006.84 (8,038,904.97) 1,775.04 88,326.83
10/01/2020 10/01/2020 912828YA2 RECEIVED ACCRUED INTEREST ON SALE OF U S TREASURY NT 1.50 0.00 - - - - 15,182.40 - - -
10/01/2020 912828ZU7 AMORTIZED PREMIUM ON U S TREASURY NT 0.250% 6/15/23 CURRE 0.00 - - - - - (203.48) - -
10/01/2020 09/30/2020 10/01/2020 912828ZU7 SOLD PAR VALUE OF U S TREASURY NT 0.250% 6/15/23 /J.P. MORGA -6,300,000.00 1.00 - - - 6,316,980.47 (6,315,601.77) 1,378.70 -
10/01/2020 10/01/2020 912828ZU7 RECEIVED ACCRUED INTEREST ON SALE OF U S TREASURY NT 0.25 0.00 - - - - 4,647.54 - - -
10/01/2020 09/30/2020 10/01/2020 912828ZY9 SOLD PAR VALUE OF U S TREASURY NT 0.125% 7/15/23 /BOFA SECU -3,340,000.00 1.00 - - - 3,337,700.91 (3,338,303.91) (603.00) -
10/01/2020 10/01/2020 912828ZY9 RECEIVED ACCRUED INTEREST ON SALE OF U S TREASURY NT 0.12 0.00 - - - - 884.92 - - -
10/01/2020 09/30/2020 10/01/2020 91282CAC5 SOLD PAR VALUE OF U S TREASURY NT 0.125% 7/31/22 /HSBC SECU -6,370,000.00 1.00 - - - 6,369,502.34 (6,369,004.68) 497.66 -
10/01/2020 10/01/2020 91282CAC5 RECEIVED ACCRUED INTEREST ON SALE OF U S TREASURY NT 0.12 0.00 - - - - 1,341.51 - - -
10/01/2020 09/30/2020 10/01/2020 91282CAG6 PURCHASED PAR VALUE OF U S TREASURY NT 0.125% 8/31/22 /GOL 14,485,000.00 1.00 - - - (14,483,868.35) 14,483,868.35 - -
10/01/2020 10/01/2020 91282CAG6 PAID ACCRUED INTEREST ON PURCHASE OF U S TREASURY NT 0.1 0.00 - - - - (1,550.54) - - -
10/01/2020 09/30/2020 10/01/2020 91282CAK7 PURCHASED PAR VALUE OF U S TREASURY NT 0.125% 9/15/23 /BOF 4,708,600.00 1.00 - - - (4,704,737.48) 4,704,737.48 - -
10/01/2020 10/01/2020 91282CAK7 PAID ACCRUED INTEREST ON PURCHASE OF U S TREASURY NT 0.1 0.00 - - - - (260.14) - - -
10/01/2020 09/30/2020 10/01/2020 91282CAK7 PURCHASED PAR VALUE OF U S TREASURY NT 0.125% 9/15/23 /CIT 4,956,400.00 1.00 - - - (4,951,946.98) 4,951,946.98 - -
10/01/2020 10/01/2020 91282CAK7 PAID ACCRUED INTEREST ON PURCHASE OF U S TREASURY NT 0.1 0.00 - - - - (273.83) - - -
10/02/2020 31846V203 INTEREST EARNED ON FIRST AM GOVT OB FD CL Y UNIT ON 0.0000 SH 0.00 - - - - 3.12 - - -
10/02/2020 10/02/2020 10/02/2020 31846V203 PURCHASED UNITS OF FIRST AM GOVT OB FD CL Y 3.12 1.00 - - - (3.12) 3.12 - -
10/02/2020 10/02/2020 10/02/2020 31846V203 PURCHASED UNITS OF FIRST AM GOVT OB FD CL Y 194,991.08 1.00 - - - (194,991.08) 194,991.08 - -
10/02/2020 91282CAG6 FED BASIS OF U S TREASURY NT 0.125% 8/31/22 ADJUSTED BY -38.7 0.00 - - - - - (38.72) - -
10/02/2020 91282CAG6 FED BASIS OF U S TREASURY NT 0.125% 8/31/22 ADJUSTED BY 38.7 0.00 - - - - - 38.72 - -
10/02/2020 91282CAG6 AMORTIZED PREMIUM ON U S TREASURY NT 0.125% 8/31/22 CURRE 0.00 - - - - - (0.04) - -
10/02/2020 10/01/2020 10/02/2020 91282CAG6 SOLD PAR VALUE OF U S TREASURY NT 0.125% 8/31/22 /WELLS FAR -195,000.00 1.00 - - - 194,969.53 (194,969.53) - -
10/02/2020 10/02/2020 91282CAG6 RECEIVED ACCRUED INTEREST ON SALE OF U S TREASURY NT 0.12 0.00 - - - - 21.55 - - -
10/09/2020 10/09/2020 10/09/2020 31846V203 SOLD UNITS OF FIRST AM GOVT OB FD CL Y -114,811.87 1.00 - - - 114,811.87 (114,811.87) - -
10/09/2020 10/08/2020 10/09/2020 91282CAK7 PURCHASED PAR VALUE OF U S TREASURY NT 0.125% 9/15/23 /J.P. 115,000.00 1.00 - - - (114,802.34) 114,802.34 - -
10/09/2020 10/09/2020 91282CAK7 PAID ACCRUED INTEREST ON PURCHASE OF U S TREASURY NT 0.1 0.00 - - - - (9.53) - - -
10/13/2020 10/13/2020 10/13/2020 31846V203 PURCHASED UNITS OF FIRST AM GOVT OB FD CL Y 114,591.84 1.00 - - - (114,591.84) 114,591.84 - -
10/13/2020 10/08/2020 10/13/2020 576051VW3 SOLD PAR VALUE OF MASSACHUSETTS ST WTR 1.772% 8/01/23 /CITIG -110,000.00 1.04 - - - 114,202.00 (110,000.00) 4,202.00 -
10/13/2020 10/13/2020 576051VW3 RECEIVED ACCRUED INTEREST ON SALE OF MASSACHUSETTS ST WT 0.00 - - - - 389.84 - - -
10/15/2020 06406FAA1 INTEREST EARNED ON BANK OF NY MTN 2.500% 4/15/21 $1 PV ON 4 0.00 - - - - 5,625.00 - - -
10/15/2020 06406FAA1 AMORTIZED PREMIUM ON BANK OF NY MTN 2.500% 4/15/21 CURRE 0.00 - - - - - (888.68) - -
10/15/2020 09/23/2020 10/15/2020 088006JW2 PURCHASED PAR VALUE OF BEVERLY HILLS CA 0.373% 6/01/22 /RAY 330,000.00 1.00 - - - (330,000.00) 330,000.00 - -
10/15/2020 14043MAC5 INTEREST EARNED ON CAPTIAL ONE PRIME 1.600% 11/15/24 $1 PV ON 0.00 - - - - 386.67 - - -
10/15/2020 20772JKP6 INTEREST EARNED ON CONNECTICUT ST 2.401% 10/15/21 $1 PV ON 0.00 - - - - 1,440.60 - - -
10/15/2020 20772JKP6 AMORTIZED PREMIUM ON CONNECTICUT ST 2.401% 10/15/21 CURR 0.00 - - - - - (46.71) - -
10/15/2020 20772KGM5 INTEREST EARNED ON CONNECTICUT ST SER A 2.921% 4/15/23 $1 PV 0.00 - - - - 4,381.50 - - -
10/15/2020 20772KGM5 AMORTIZED PREMIUM ON CONNECTICUT ST SER A 2.921% 4/15/23 CU 0.00 - - - - - (216.08) - -
10/15/2020 26208VAD8 INTEREST EARNED ON DRIVE AUTO 0.830% 5/15/24 $1 PV ON 62. 0.00 - - - - 62.25 - - -
10/15/2020 10/15/2020 10/15/2020 31846V203 PURCHASED UNITS OF FIRST AM GOVT OB FD CL Y 107,969.40 1.00 - - - (107,969.40) 107,969.40 - -
10/15/2020 10/15/2020 10/15/2020 31846V203 PURCHASED UNITS OF FIRST AM GOVT OB FD CL Y 104.87 1.00 - - - (104.87) 104.87 - -
10/15/2020 41284WAC4 INTEREST EARNED ON HARLEY DAVIDSON 2.340% 2/15/24 $1 PV ON 0.00 - - - - 1,150.50 - - -
10/15/2020 43815NAC8 INTEREST EARNED ON HONDA AUTO 1.780% 8/15/23 $1 PV ON 37 0.00 - - - - 370.83 - - -
10/15/2020 47789JAD8 INTEREST EARNED ON JOHN DEERE OWNER 2.910% 7/17/23 $1 PV O 0.00 - - - - 630.50 - - -
10/15/2020 47789KAC7 INTEREST EARNED ON JOHN DEERE OWNER 1.100% 8/15/24 $1 PV O 0.00 - - - - 394.17 - - -
10/15/2020 58769TAD7 INTEREST EARNED ON MERCEDES BENZ 1.940% 3/15/24 $1 PV ON 0.00 - - - - 436.50 - - -
10/15/2020 58770FAC6 INTEREST EARNED ON MERCEDES BENZ AUTO 1.840% 12/15/22 $1 PV 0.00 - - - - 214.67 - - -
10/15/2020 797299LT9 INTEREST EARNED ON SAN DIEGO CA PUBLIC 2.994% 10/15/21 $1 PV O 0.00 - - - - 2,994.00 - - -
10/15/2020 80285WAD9 INTEREST EARNED ON SANTANDER DRIVE 0.00001% 7/15/24 $1 PV O 0.00 - - - - 104.87 - - -
10/15/2020 89238UAD2 INTEREST EARNED ON TOYOTA AUTO 1.910% 9/15/23 $1 PV ON 39 0.00 - - - - 397.92 - - -
10/15/2020 10/14/2020 10/15/2020 91282CAK7 SOLD PAR VALUE OF U S TREASURY NT 0.125% 9/15/23 /BARCLAYS -420,000.00 1.00 - - - 419,440.78 (419,440.78) - -
10/15/2020 10/15/2020 91282CAK7 RECEIVED ACCRUED INTEREST ON SALE OF U S TREASURY NT 0.12 0.00 - - - - 43.51 - - -
10/15/2020 91282CAK7 FED BASIS OF U S TREASURY NT 0.125% 9/15/23 ADJUSTED BY -214 0.00 - - - - - (214.69) - -
10/15/2020 91282CAK7 FED BASIS OF U S TREASURY NT 0.125% 9/15/23 ADJUSTED BY 214. 0.00 - - - - - 214.69 - -
10/16/2020 10/14/2020 10/16/2020 3137EAEY1 PURCHASED PAR VALUE OF F H L M C M T N 0.125% 10/16/23 /WELLS 420,000.00 1.00 - - - (418,433.40) 418,433.40 - -
10/16/2020 10/16/2020 10/16/2020 31846V203 SOLD UNITS OF FIRST AM GOVT OB FD CL Y -283,464.69 1.00 - - - 283,464.69 (283,464.69) - -
10/16/2020 91282CAG6 FED BASIS OF U S TREASURY NT 0.125% 8/31/22 ADJUSTED BY -68.9 0.00 - - - - - (68.99) - -
10/16/2020 91282CAG6 FED BASIS OF U S TREASURY NT 0.125% 8/31/22 ADJUSTED BY 68.9 0.00 - - - - - 68.99 - -
10/16/2020 91282CAG6 AMORTIZED PREMIUM ON U S TREASURY NT 0.125% 8/31/22 CURRE 0.00 - - - - - (0.13) - -
10/16/2020 10/15/2020 10/16/2020 91282CAG6 SOLD PAR VALUE OF U S TREASURY NT 0.125% 8/31/22 /J.P. MORGA -135,000.00 1.00 - - - 134,947.27 (134,947.27) - -
10/16/2020 10/16/2020 91282CAG6 RECEIVED ACCRUED INTEREST ON SALE OF U S TREASURY NT 0.12 0.00 - - - - 21.44 - - -
10/19/2020 10/15/2020 10/19/2020 023135AJ5 PURCHASED PAR VALUE OF AMAZON COM INC 2.500% 11/29/22 /WE 300,000.00 1.04 - - - (312,498.00) 312,498.00 - -
10/19/2020 10/19/2020 023135AJ5 PAID ACCRUED INTEREST ON PURCHASE OF AMAZON COM INC 2.5 0.00 - - - - (2,916.67) - - -
10/19/2020 10/19/2020 10/19/2020 31846V203 PURCHASED UNITS OF FIRST AM GOVT OB FD CL Y 6,051.66 1.00 - - - (6,051.66) 6,051.66 - -
10/19/2020 10/19/2020 10/19/2020 31846V203 SOLD UNITS OF FIRST AM GOVT OB FD CL Y -25,467.55 1.00 - - - 25,467.55 (25,467.55) - -
10/19/2020 43814PAC4 INTEREST EARNED ON HONDA AUTO 1.790% 9/20/21 $1 PV ON 23 0.00 - - - - 23.24 - - -
10/19/2020 10/18/2020 10/19/2020 43814PAC4 PAID DOWN PAR VALUE OF HONDA AUTO 1.790% 9/20/21 -6,028.42 - - - - 6,028.42 (6,027.77) - 0.65
10/19/2020 91282CAG6 FED BASIS OF U S TREASURY NT 0.125% 8/31/22 ADJUSTED BY -122 0.00 - - - - - (122.02) - -
10/19/2020 91282CAG6 FED BASIS OF U S TREASURY NT 0.125% 8/31/22 ADJUSTED BY -3.93 0.00 - - - - - (3.93) - -
10/19/2020 91282CAG6 FED BASIS OF U S TREASURY NT 0.125% 8/31/22 ADJUSTED BY 122. 0.00 - - - - - 122.02 - -
Payden & Rygel Operating Portfolio Transaction Report
Quarter ended December 31, 2020
Page 34 of 38
ATTACHMENT 16
52

Account Number: 001050990415 Name: RIVERSIDE COUNTY TRANS COMMTransaction
Date Trade Date
Settlement
Date CUSIP Description Units Price Commissions SEC Fees
Miscellaneous
Fees Net Cash Amount
Federal Tax Cost
Amount
Short Term
Gain/Loss Amount
Long Term
Gain/Loss Amount
Payden & Rygel Operating Portfolio Transaction Report
Quarter ended December 31, 2020
10/19/2020 91282CAG6 FED BASIS OF U S TREASURY NT 0.125% 8/31/22 ADJUSTED BY 3.93 0.00 - - - - - 3.93 - -
10/19/2020 91282CAG6 AMORTIZED PREMIUM ON U S TREASURY NT 0.125% 8/31/22 CURRE 0.00 - - - - - (0.02) - -
10/19/2020 10/16/2020 10/19/2020 91282CAG6 SOLD PAR VALUE OF U S TREASURY NT 0.125% 8/31/22 /CITADEL SE -290,000.00 1.00 - - - 289,898.05 (289,949.61) (51.56) -
10/19/2020 10/19/2020 91282CAG6 RECEIVED ACCRUED INTEREST ON SALE OF U S TREASURY NT 0.12 0.00 - - - - 49.07 - - -
10/20/2020 3137EAEQ8 INTEREST EARNED ON F H L M C 0.375% 4/20/23 $1 PV ON 56000 0.00 - - - - 1,050.00 - - -
10/20/2020 10/20/2020 10/20/2020 31846V203 PURCHASED UNITS OF FIRST AM GOVT OB FD CL Y 1,050.00 1.00 - - - (1,050.00) 1,050.00 - -
10/22/2020 10/22/2020 10/22/2020 31846V203 PURCHASED UNITS OF FIRST AM GOVT OB FD CL Y 9,606.25 1.00 - - - (9,606.25) 9,606.25 - -
10/22/2020 94988J5T0 INTEREST EARNED ON WELLS FARGO MTN 3.625% 10/22/21 $1 PV O 0.00 - - - - 9,606.25 - - -
10/26/2020 TRUST FEES COLLECTED CHARGED FOR PERIOD 09/01/2020 THRU 09 0.00 - - - - (578.58) - - -
10/26/2020 05588CAC6 INTEREST EARNED ON BMW VEHICLE OWNER 1.920% 1/25/24 $1 PV 0.00 - - - - 528.00 - - -
10/26/2020 3136AKQM8 INTEREST EARNED ON F N M A GTD REMIC 3.056% 6/25/24 $1 PV ON 0.00 - - - - 1,096.03 - - -
10/26/2020 3136AKQM8 AMORTIZED PREMIUM ON F N M A GTD REMIC 3.056% 6/25/24 CURRE 0.00 - - - - - (662.83) - -
10/26/2020 10/25/2020 10/26/2020 3136AKQM8 PAID DOWN PAR VALUE OF F N M A GTD REMIC 3.056% 6/25/24 -794.72 - - - - 794.72 (849.35) (54.63) -
10/26/2020 3136B1XP4 INTEREST EARNED ON F N M A GTD REMIC 3.560% 9/25/21 $1 PV ON 0.00 - - - - 281.74 - - -
10/26/2020 3136B1XP4 AMORTIZED PREMIUM ON F N M A GTD REMIC 3.560% 9/25/21 CURRE 0.00 - - - - - (45.56) - -
10/26/2020 10/25/2020 10/26/2020 3136B1XP4 PAID DOWN PAR VALUE OF F N M A GTD REMIC 3.560% 9/25/21 -5,085.04 - - - - 5,085.04 (5,112.28) - (27.24)
10/26/2020 3136B1XP4 INTEREST EARNED ON F N M A GTD REMIC 3.560% 9/25/21 $1 PV ON 0.00 - - - - 1.02 - - -
10/26/2020 3137ATRW4 INTEREST EARNED ON F H L M C MULTICLASS 2.373% 5/25/22 $1 PV ON 0.00 - - - - 375.73 - - -
10/26/2020 3137ATRW4 AMORTIZED PREMIUM ON F H L M C MULTICLASS 2.373% 5/25/22 CURR 0.00 - - - - - (30.48) - -
10/26/2020 3137B1U75 INTEREST EARNED ON F H L M C MLTCL MTG 2.522% 1/25/23 $1 PV ON 0.00 - - - - 317.27 - - -
10/26/2020 3137B1U75 AMORTIZED PREMIUM ON F H L M C MLTCL MTG 2.522% 1/25/23 CURR 0.00 - - - - - (17.18) - -
10/26/2020 10/25/2020 10/26/2020 3137B1U75 PAID DOWN PAR VALUE OF F H L M C MLTCL MTG 2.522% 1/25/23 -457.39 - - - - 457.39 (458.82) - (1.43)
10/26/2020 3137B36J2 INTEREST EARNED ON F H L M C MLTCL MT 3.320% 2/25/23 $1 PV ON 0.00 - - - - 1,326.52 - - -
10/26/2020 3137B36J2 AMORTIZED PREMIUM ON F H L M C MLTCL MT 3.320% 2/25/23 CURRE 0.00 - - - - - (506.70) - -
10/26/2020 3137B4WB8 INTEREST EARNED ON F H L M C MLTCL MTG 3.060% 7/25/23 $1 PV ON 0.00 - - - - 1,249.50 - - -
10/26/2020 3137B4WB8 AMORTIZED PREMIUM ON F H L M C MLTCL MTG 3.060% 7/25/23 CURR 0.00 - - - - - (587.66) - -
10/26/2020 3137FJYA1 INTEREST EARNED ON F H L M C MLTCL 3.454% 5/25/23 $1 PV ON 54 0.00 - - - - 54.01 - - -
10/26/2020 10/25/2020 10/26/2020 3137FJYA1 PAID DOWN PAR VALUE OF F H L M C MLTCL 3.454% 5/25/23 -709.56 - - - - 709.56 (709.54) - 0.02
10/26/2020 10/26/2020 10/26/2020 31846V203 PURCHASED UNITS OF FIRST AM GOVT OB FD CL Y 1,327.54 1.00 - - - (1,327.54) 1,327.54 - -
10/26/2020 10/26/2020 10/26/2020 31846V203 PURCHASED UNITS OF FIRST AM GOVT OB FD CL Y 10,370.41 1.00 - - - (10,370.41) 10,370.41 - -
11/02/2020 13066YTY5 INTEREST EARNED ON CALIFORNIA ST DEPT 1.713% 5/01/21 $1 PV ON 0.00 - - - - 942.15 - - -
11/02/2020 13066YTZ2 INTEREST EARNED ON CALIFORNIA ST DEPT 2.000% 5/01/22 $1 PV ON 0.00 - - - - 3,000.00 - - -
11/02/2020 13066YTZ2 AMORTIZED PREMIUM ON CALIFORNIA ST DEPT 2.000% 5/01/22 CURR 0.00 - - - - - (245.58) - -
11/02/2020 156549AA5 INTEREST EARNED ON CENTURY HOUSING CORP 3.824% 11/01/20 $1 P 0.00 - - - - 2,103.20 - - -
11/02/2020 11/01/2020 11/01/2020 156549AA5 MATURED PAR VALUE OF CENTURY HOUSING CORP 3.824% 11/01/20 1 -110,000.00 1.00 - - - 110,000.00 (110,000.00) - -
11/02/2020 11/02/2020 11/02/2020 31846V203 PURCHASED UNITS OF FIRST AM GOVT OB FD CL Y 122,083.10 1.00 - - - (122,083.10) 122,083.10 - -
11/02/2020 31846V203 INTEREST EARNED ON FIRST AM GOVT OB FD CL Y UNIT ON 0.0000 SH 0.00 - - - - 1.90 - - -
11/02/2020 11/02/2020 11/02/2020 31846V203 PURCHASED UNITS OF FIRST AM GOVT OB FD CL Y 942.15 1.00 - - - (942.15) 942.15 - -
11/02/2020 10/30/2020 11/02/2020 91282CAG6 SOLD PAR VALUE OF U S TREASURY NT 0.125% 8/31/22 /NATWEST M -3,900,000.00 1.00 - - - 3,898,019.53 (3,899,821.26) (1,801.73) -
11/02/2020 11/02/2020 91282CAG6 RECEIVED ACCRUED INTEREST ON SALE OF U S TREASURY NT 0.12 0.00 - - - - 848.41 - - -
11/02/2020 10/30/2020 11/02/2020 91282CAG6 SOLD PAR VALUE OF U S TREASURY NT 0.125% 8/31/22 /HSBC SECU -170,000.00 1.00 - - - 169,900.39 (169,986.72) (86.33) -
11/02/2020 11/02/2020 91282CAG6 RECEIVED ACCRUED INTEREST ON SALE OF U S TREASURY NT 0.12 0.00 - - - - 36.98 - - -
11/02/2020 10/30/2020 11/02/2020 91282CAP6 PURCHASED PAR VALUE OF U S TREASURY NT 0.125% 10/15/23 /CIT 4,070,000.00 1.00 - - - (4,061,573.83) 4,061,573.83 - -
11/02/2020 11/02/2020 91282CAP6 PAID ACCRUED INTEREST ON PURCHASE OF U S TREASURY NT 0.1 0.00 - - - - (251.58) - - -
11/03/2020 11/03/2020 11/03/2020 31846V203 PURCHASED UNITS OF FIRST AM GOVT OB FD CL Y 1.90 1.00 - - - (1.90) 1.90 - -
11/04/2020 13066YTY5 INTEREST EARNED ON CALIFORNIA ST DEPT 1.713% 5/01/21 $1 PV ON 0.00 - - - - (942.15) - - -
11/04/2020 13066YTY5 INTEREST EARNED ON CALIFORNIA ST DEPT 1.713% 5/01/21 $1 PV ON 0.00 - - - - 699.21 - - -
11/04/2020 11/04/2020 11/04/2020 31846V203 SOLD UNITS OF FIRST AM GOVT OB FD CL Y -242.94 1.00 - - - 242.94 (242.94) - -
11/09/2020 11/09/2020 11/09/2020 31846V203 SOLD UNITS OF FIRST AM GOVT OB FD CL Y -281,612.48 1.00 - - - 281,612.48 (281,612.48) - -
11/09/2020 91282CAK7 FED BASIS OF U S TREASURY NT 0.125% 9/15/23 ADJUSTED BY -202 0.00 - - - - - (202.53) - -
11/09/2020 91282CAK7 FED BASIS OF U S TREASURY NT 0.125% 9/15/23 ADJUSTED BY 202. 0.00 - - - - - 202.53 - -
11/09/2020 11/06/2020 11/09/2020 91282CAK7 SOLD PAR VALUE OF U S TREASURY NT 0.125% 9/15/23 /CITIGROUP -1,115,000.00 1.00 - - - 1,112,604.49 (1,114,010.40) (1,405.91) -
11/09/2020 11/09/2020 91282CAK7 RECEIVED ACCRUED INTEREST ON SALE OF U S TREASURY NT 0.12 0.00 - - - - 211.76 - - -
11/09/2020 11/06/2020 11/09/2020 91282CAN1 PURCHASED PAR VALUE OF U S TREASURY NT 0.125% 9/30/22 /CIT 1,395,000.00 1.00 - - - (1,394,237.11) 1,394,237.11 - -
11/09/2020 11/09/2020 91282CAN1 PAID ACCRUED INTEREST ON PURCHASE OF U S TREASURY NT 0.1 0.00 - - - - (191.62) - - -
11/10/2020 11/10/2020 11/10/2020 31846V203 PURCHASED UNITS OF FIRST AM GOVT OB FD CL Y 82,437.50 1.00 - - - (82,437.50) 82,437.50 - -
11/10/2020 11/10/2020 11/10/2020 478160CH5 MATURED PAR VALUE OF JOHNSON JOHNSON 1.950% 11/10/20 250, -250,000.00 1.00 - - - 250,000.00 (249,732.50) - 267.50
11/10/2020 478160CH5 INTEREST EARNED ON JOHNSON JOHNSON 1.950% 11/10/20 $1 PV O 0.00 - - - - 2,437.50 - - -
11/10/2020 10/30/2020 11/10/2020 54438CYJ5 PURCHASED PAR VALUE OF LOS ANGELES CA 0.673% 8/01/24 /BOF 170,000.00 1.00 - - - (170,000.00) 170,000.00 - -
11/12/2020 037833DV9 INTEREST EARNED ON APPLE INC 0.750% 5/11/23 $1 PV ON 1950 0.00 - - - - 731.25 - - -
11/12/2020 11/12/2020 11/12/2020 31846V203 PURCHASED UNITS OF FIRST AM GOVT OB FD CL Y 731.25 1.00 - - - (731.25) 731.25 - -
11/16/2020 14043MAC5 INTEREST EARNED ON CAPTIAL ONE PRIME 1.600% 11/15/24 $1 PV ON 0.00 - - - - 386.67 - - -
11/16/2020 144141DC9 INTEREST EARNED ON PROG ENERGY CAROLINA 2.800% 5/15/22 $1 PV 0.00 - - - - 3,500.00 - - -
11/16/2020 144141DC9 AMORTIZED PREMIUM ON PROG ENERGY CAROLINA 2.800% 5/15/22 C 0.00 - - - - - (742.26) - -
11/16/2020 26208VAD8 INTEREST EARNED ON DRIVE AUTO 0.830% 5/15/24 $1 PV ON 62. 0.00 - - - - 62.25 - - -
11/16/2020 11/16/2020 11/16/2020 31846V203 PURCHASED UNITS OF FIRST AM GOVT OB FD CL Y 27,708.73 1.00 - - - (27,708.73) 27,708.73 - -
11/16/2020 41284WAC4 INTEREST EARNED ON HARLEY DAVIDSON 2.340% 2/15/24 $1 PV ON 0.00 - - - - 1,150.50 - - -
11/16/2020 43815NAC8 INTEREST EARNED ON HONDA AUTO 1.780% 8/15/23 $1 PV ON 37 0.00 - - - - 370.83 - - -
11/16/2020 47789JAD8 INTEREST EARNED ON JOHN DEERE OWNER 2.910% 7/17/23 $1 PV O 0.00 - - - - 630.50 - - -
11/16/2020 11/15/2020 11/16/2020 47789JAD8 PAID DOWN PAR VALUE OF JOHN DEERE OWNER 2.910% 7/17/23 -13,387.59 - - - - 13,387.59 (13,385.94) - 1.65
11/16/2020 47789KAC7 INTEREST EARNED ON JOHN DEERE OWNER 1.100% 8/15/24 $1 PV O 0.00 - - - - 394.17 - - -
11/16/2020 58769TAD7 INTEREST EARNED ON MERCEDES BENZ 1.940% 3/15/24 $1 PV ON 0.00 - - - - 436.50 - - -
11/16/2020 58770FAC6 INTEREST EARNED ON MERCEDES BENZ AUTO 1.840% 12/15/22 $1 PV 0.00 - - - - 214.67 - - -
11/16/2020 80285WAD9 INTEREST EARNED ON SANTANDER DRIVE 0.00001% 7/15/24 $1 PV O 0.00 - - - - 143.00 - - -
11/16/2020 89238UAD2 INTEREST EARNED ON TOYOTA AUTO 1.910% 9/15/23 $1 PV ON 39 0.00 - - - - 397.92 - - -
11/16/2020 91412G2S3 INTEREST EARNED ON UNIV OF CALIFORNIA 2.112% 5/15/21 $1 PV ON 0.00 - - - - 1,478.40 - - -
11/16/2020 91412HDJ9 INTEREST EARNED ON UNIV OF CA 3.283% 5/15/22 $1 PV ON 2850 0.00 - - - - 4,678.28 - - -
Page 35 of 38
53

Account Number: 001050990415 Name: RIVERSIDE COUNTY TRANS COMMTransaction
Date Trade Date
Settlement
Date CUSIP Description Units Price Commissions SEC Fees
Miscellaneous
Fees Net Cash Amount
Federal Tax Cost
Amount
Short Term
Gain/Loss Amount
Long Term
Gain/Loss Amount
Payden & Rygel Operating Portfolio Transaction Report
Quarter ended December 31, 2020
11/16/2020 91412HDJ9 AMORTIZED PREMIUM ON UNIV OF CA 3.283% 5/15/22 CURRENT 0.00 - - - - - (147.18) - -
11/16/2020 91412HFK4 INTEREST EARNED ON UNIVERSITY CALIF CA 0.628% 5/15/23 $1 PV ON 0.00 - - - - 477.45 - - -
11/18/2020 11/18/2020 11/18/2020 31846V203 PURCHASED UNITS OF FIRST AM GOVT OB FD CL Y 5,729.19 1.00 - - - (5,729.19) 5,729.19 - -
11/18/2020 43814PAC4 INTEREST EARNED ON HONDA AUTO 1.78999% 9/20/21 $1 PV ON 1 0.00 - - - - 14.24 - - -
11/18/2020 11/18/2020 11/18/2020 43814PAC4 PAID DOWN PAR VALUE OF HONDA AUTO 1.78999% 9/20/21 -5,714.95 - - - - 5,714.95 (5,714.33) - 0.62
11/20/2020 17325FAY4 INTEREST EARNED ON CITIBANK NA 2.844% 5/20/22 $1 PV ON 510 0.00 - - - - 7,252.20 - - -
11/20/2020 17325FAY4 AMORTIZED PREMIUM ON CITIBANK NA 2.844% 5/20/22 CURRENT 0.00 - - - - - (494.25) - -
11/20/2020 11/20/2020 11/20/2020 31846V203 PURCHASED UNITS OF FIRST AM GOVT OB FD CL Y 7,252.20 1.00 - - - (7,252.20) 7,252.20 - -
11/23/2020 3135G04Q3 INTEREST EARNED ON F N M A 0.250% 5/22/23 $1 PV ON 590000 0.00 - - - - 737.50 - - -
11/23/2020 11/23/2020 11/23/2020 31846V203 PURCHASED UNITS OF FIRST AM GOVT OB FD CL Y 737.50 1.00 - - - (737.50) 737.50 - -
11/25/2020 TRUST FEES COLLECTED CHARGED FOR PERIOD 10/01/2020 THRU 10 0.00 - - - - (578.88) - - -
11/25/2020 05588CAC6 INTEREST EARNED ON BMW VEHICLE OWNER 1.920% 1/25/24 $1 PV 0.00 - - - - 528.00 - - -
11/25/2020 3136AKQM8 INTEREST EARNED ON F N M A GTD REMIC 3.056% 6/25/24 $1 PV ON 0.00 - - - - 494.83 - - -
11/25/2020 3136AKQM8 INTEREST EARNED ON F N M A GTD REMIC 3.056% 6/25/24 $1 PV ON 0.00 - - - - 1,094.00 - - -
11/25/2020 3136AKQM8 AMORTIZED PREMIUM ON F N M A GTD REMIC 3.056% 6/25/24 CURRE 0.00 - - - - - (683.66) - -
11/25/2020 11/25/2020 11/25/2020 3136AKQM8 PAID DOWN PAR VALUE OF F N M A GTD REMIC 3.056% 6/25/24 -18,506.99 - - - - 18,506.99 (19,749.71) (1,242.72) -
11/25/2020 3136B1XP4 INTEREST EARNED ON F N M A GTD REMIC 3.560% 9/25/21 $1 PV ON 0.00 - - - - 266.66 - - -
11/25/2020 3136B1XP4 AMORTIZED PREMIUM ON F N M A GTD REMIC 3.560% 9/25/21 CURRE 0.00 - - - - - (44.55) - -
11/25/2020 11/25/2020 11/25/2020 3136B1XP4 PAID DOWN PAR VALUE OF F N M A GTD REMIC 3.560% 9/25/21 -3,335.90 - - - - 3,335.90 (3,352.12) - (16.22)
11/25/2020 3136B1XP4 INTEREST EARNED ON F N M A GTD REMIC 3.560% 9/25/21 $1 PV ON 0.00 - - - - 0.65 - - -
11/25/2020 3137ATRW4 INTEREST EARNED ON F H L M C MULTICLASS 2.373% 5/25/22 $1 PV ON 0.00 - - - - 375.73 - - -
11/25/2020 3137ATRW4 AMORTIZED PREMIUM ON F H L M C MULTICLASS 2.373% 5/25/22 CURR 0.00 - - - - - (31.49) - -
11/25/2020 3137B1U75 INTEREST EARNED ON F H L M C MLTCL MTG 2.522% 1/25/23 $1 PV ON 0.00 - - - - 416.98 - - -
11/25/2020 3137B1U75 AMORTIZED PREMIUM ON F H L M C MLTCL MTG 2.522% 1/25/23 CURR 0.00 - - - - - (17.70) - -
11/25/2020 11/25/2020 11/25/2020 3137B1U75 PAID DOWN PAR VALUE OF F H L M C MLTCL MTG 2.522% 1/25/23 -7,610.08 - - - - 7,610.08 (7,632.92) - (22.84)
11/25/2020 3137B36J2 INTEREST EARNED ON F H L M C MLTCL MT 3.320% 2/25/23 $1 PV ON 0.00 - - - - 1,328.00 - - -
11/25/2020 3137B36J2 AMORTIZED PREMIUM ON F H L M C MLTCL MT 3.320% 2/25/23 CURRE 0.00 - - - - - (523.59) - -
11/25/2020 3137B4WB8 INTEREST EARNED ON F H L M C MLTCL MTG 3.060% 7/25/23 $1 PV ON 0.00 - - - - 1,249.50 - - -
11/25/2020 3137B4WB8 AMORTIZED PREMIUM ON F H L M C MLTCL MTG 3.060% 7/25/23 CURR 0.00 - - - - - (607.25) - -
11/25/2020 3137FJYA1 INTEREST EARNED ON F H L M C MLTCL 3.454% 5/25/23 $1 PV ON 51 0.00 - - - - 51.96 - - -
11/25/2020 11/25/2020 11/25/2020 3137FJYA1 PAID DOWN PAR VALUE OF F H L M C MLTCL 3.454% 5/25/23 -10,090.52 - - - - 10,090.52 (10,090.25) - 0.27
11/25/2020 11/25/2020 11/25/2020 31846V203 PURCHASED UNITS OF FIRST AM GOVT OB FD CL Y 495.48 1.00 - - - (495.48) 495.48 - -
11/25/2020 11/25/2020 11/25/2020 31846V203 PURCHASED UNITS OF FIRST AM GOVT OB FD CL Y 44,275.44 1.00 - - - (44,275.44) 44,275.44 - -
11/27/2020 3134GW2Q8 INTEREST EARNED ON F H L M C M T N 0.500% 2/27/24 $1 PV ON 200 0.00 - - - - 250.00 - - -
11/27/2020 11/27/2020 11/27/2020 3134GW2Q8 FULL CALL PAR VALUE OF F H L M C M T N 0.500% 2/27/24 /CALLS/ -200,000.00 1.00 - - - 200,000.00 (200,000.00) - -
11/27/2020 11/27/2020 11/27/2020 31846V203 PURCHASED UNITS OF FIRST AM GOVT OB FD CL Y 200,000.00 1.00 - - - (200,000.00) 200,000.00 - -
11/27/2020 11/27/2020 11/27/2020 31846V203 PURCHASED UNITS OF FIRST AM GOVT OB FD CL Y 250.00 1.00 - - - (250.00) 250.00 - -
11/30/2020 023135AJ5 INTEREST EARNED ON AMAZON COM INC 2.500% 11/29/22 $1 PV ON 0.00 - - - - 3,750.00 - - -
11/30/2020 023135AJ5 AMORTIZED PREMIUM ON AMAZON COM INC 2.500% 11/29/22 CURR 0.00 - - - - - (743.82) - -
11/30/2020 11/30/2020 11/30/2020 31846V203 PURCHASED UNITS OF FIRST AM GOVT OB FD CL Y 3,750.00 1.00 - - - (3,750.00) 3,750.00 - -
12/01/2020 010831DN2 INTEREST EARNED ON ALAMEDA CNTY CA JT 2.866% 6/01/21 $1 PV O 0.00 - - - - 3,654.15 - - -
12/01/2020 010831DQ5 INTEREST EARNED ON ALAMEDA CNTY CA 3.095% 6/01/23 $1 PV ON 0.00 - - - - 2,011.75 - - -
12/01/2020 010831DQ5 AMORTIZED PREMIUM ON ALAMEDA CNTY CA 3.095% 6/01/23 CURR 0.00 - - - - - (855.29) - -
12/01/2020 088006JW2 INTEREST EARNED ON BEVERLY HILLS CA 0.373% 6/01/22 $1 PV ON 0.00 - - - - 157.28 - - -
12/01/2020 13032UUZ9 INTEREST EARNED ON CALIFORNIA ST HLTH 1.893% 6/01/22 $1 PV ON 0.00 - - - - 4,921.80 - - -
12/01/2020 12/01/2020 12/01/2020 31846V203 PURCHASED UNITS OF FIRST AM GOVT OB FD CL Y 7,335.92 1.00 - - - (7,335.92) 7,335.92 - -
12/01/2020 31846V203 INTEREST EARNED ON FIRST AM GOVT OB FD CL Y UNIT ON 0.0000 SH 0.00 - - - - 1.65 - - -
12/01/2020 56052AE77 INTEREST EARNED ON MAINE ST 1.250% 6/01/22 $1 PV ON 25000 0.00 - - - - 1,362.85 - - -
12/01/2020 56052AE77 AMORTIZED PREMIUM ON MAINE ST 1.250% 6/01/22 CURRENT Y 0.00 - - - - - (543.91) - -
12/01/2020 786134WD4 INTEREST EARNED ON SACRAMENTO CNTY CA 0.629% 12/01/22 $1 PV 0.00 - - - - 670.23 - - -
12/01/2020 80136PCY7 INTEREST EARNED ON SANTA BARBARA CA 3.300% 12/01/21 $1 PV O 0.00 - - - - 2,062.50 - - -
12/01/2020 80168FMA1 INTEREST EARNED ON SANTA CLARA VLY CA 2.387% 6/01/21 $1 PV O 0.00 - - - - 4,774.00 - - -
12/01/2020 11/30/2020 12/01/2020 91282CAG6 SOLD PAR VALUE OF U S TREASURY NT 0.125% 8/31/22 /J.P. MORGA -5,570,000.00 1.00 - - - 5,567,606.64 (5,569,564.84) (1,958.20) -
12/01/2020 12/01/2020 91282CAG6 RECEIVED ACCRUED INTEREST ON SALE OF U S TREASURY NT 0.12 0.00 - - - - 1,769.48 - - -
12/01/2020 11/30/2020 12/01/2020 91282CAW1 PURCHASED PAR VALUE OF U S TREASURY NT 0.250% 11/15/23 /BO 1,463,700.00 1.00 - - - (1,466,615.96) 1,466,615.96 - -
12/01/2020 12/01/2020 91282CAW1 PAID ACCRUED INTEREST ON PURCHASE OF U S TREASURY NT 0.2 0.00 - - - - (161.73) - - -
12/01/2020 11/30/2020 12/01/2020 91282CAW1 PURCHASED PAR VALUE OF U S TREASURY NT 0.250% 11/15/23 /CIT 2,642,600.00 1.00 - - - (2,647,864.55) 2,647,864.55 - -
12/01/2020 12/01/2020 91282CAW1 PAID ACCRUED INTEREST ON PURCHASE OF U S TREASURY NT 0.2 0.00 - - - - (292.00) - - -
12/01/2020 11/30/2020 12/01/2020 91282CAW1 PURCHASED PAR VALUE OF U S TREASURY NT 0.250% 11/15/23 /NO 1,463,700.00 1.00 - - - (1,466,558.79) 1,466,558.79 - -
12/01/2020 12/01/2020 91282CAW1 PAID ACCRUED INTEREST ON PURCHASE OF U S TREASURY NT 0.2 0.00 - - - - (161.73) - - -
12/02/2020 12/02/2020 12/02/2020 31846V203 PURCHASED UNITS OF FIRST AM GOVT OB FD CL Y 1.65 1.00 - - - (1.65) 1.65 - -
12/03/2020 023135BP0 INTEREST EARNED ON AMAZON COM INC SR NT 0.400% 6/03/23 $1 PV 0.00 - - - - 540.00 - - -
12/03/2020 166764AU4 INTEREST EARNED ON CHEVRON CORP 0.78113% 3/03/22 $1 PV ON 0.00 - - - - 987.26 - - -
12/03/2020 166764AU4 AMORTIZED PREMIUM ON CHEVRON CORP 0.78113% 3/03/22 CURR 0.00 - - - - - (319.07) - -
12/03/2020 12/03/2020 12/03/2020 31846V203 SOLD UNITS OF FIRST AM GOVT OB FD CL Y -248,260.48 1.00 - - - 248,260.48 (248,260.48) - -
12/03/2020 12/02/2020 12/03/2020 91282CAX9 PURCHASED PAR VALUE OF U S TREASURY NT 0.125% 11/30/22 /BO 250,000.00 1.00 - - - (249,785.16) 249,785.16 - -
12/03/2020 12/03/2020 91282CAX9 PAID ACCRUED INTEREST ON PURCHASE OF U S TREASURY NT 0.1 0.00 - - - - (2.58) - - -
12/04/2020 12/03/2020 12/04/2020 3134GXDZ4 PURCHASED PAR VALUE OF F H L M C M T N 0.450% 11/25/24 /INTL F 300,000.00 1.00 - - - (300,000.00) 300,000.00 - -
12/04/2020 12/04/2020 3134GXDZ4 PAID ACCRUED INTEREST ON PURCHASE OF F H L M C M T N 0.450% 0.00 - - - - (33.75) - - -
12/04/2020 12/04/2020 12/04/2020 31846V203 SOLD UNITS OF FIRST AM GOVT OB FD CL Y -99.40 1.00 - - - 99.40 (99.40) - -
12/04/2020 12/03/2020 12/04/2020 91282CAG6 SOLD PAR VALUE OF U S TREASURY NT 0.125% 8/31/22 /BMO CAPIT -300,000.00 1.00 - - - 299,835.94 (299,976.56) (140.62) -
12/04/2020 12/04/2020 91282CAG6 RECEIVED ACCRUED INTEREST ON SALE OF U S TREASURY NT 0.12 0.00 - - - - 98.41 - - -
12/15/2020 14043MAC5 INTEREST EARNED ON CAPTIAL ONE PRIME 1.600% 11/15/24 $1 PV ON 0.00 - - - - 386.67 - - -
12/15/2020 250847EJ5 INTEREST EARNED ON DETROIT EDISON CO 2.650% 6/15/22 $1 PV ON 0.00 - - - - 2,385.00 - - -
12/15/2020 250847EJ5 AMORTIZED PREMIUM ON DETROIT EDISON CO 2.650% 6/15/22 CURR 0.00 - - - - - (504.95) - -
12/15/2020 26208VAD8 INTEREST EARNED ON DRIVE AUTO 0.830% 5/15/24 $1 PV ON 62. 0.00 - - - - 62.25 - - -
12/15/2020 12/15/2020 12/15/2020 31846V203 PURCHASED UNITS OF FIRST AM GOVT OB FD CL Y 143.00 1.00 - - - (143.00) 143.00 - -
Page 36 of 38
54

Account Number: 001050990415 Name: RIVERSIDE COUNTY TRANS COMMTransaction
Date Trade Date
Settlement
Date CUSIP Description Units Price Commissions SEC Fees
Miscellaneous
Fees Net Cash Amount
Federal Tax Cost
Amount
Short Term
Gain/Loss Amount
Long Term
Gain/Loss Amount
Payden & Rygel Operating Portfolio Transaction Report
Quarter ended December 31, 2020
12/15/2020 12/15/2020 12/15/2020 31846V203 SOLD UNITS OF FIRST AM GOVT OB FD CL Y -113,714.85 1.00 - - - 113,714.85 (113,714.85) - -
12/15/2020 41284WAC4 INTEREST EARNED ON HARLEY DAVIDSON 2.340% 2/15/24 $1 PV ON 0.00 - - - - 1,150.50 - - -
12/15/2020 43815NAC8 INTEREST EARNED ON HONDA AUTO 1.780% 8/15/23 $1 PV ON 37 0.00 - - - - 370.83 - - -
12/15/2020 47789JAD8 INTEREST EARNED ON JOHN DEERE OWNER 2.910% 7/17/23 $1 PV O 0.00 - - - - 598.04 - - -
12/15/2020 12/15/2020 12/15/2020 47789JAD8 PAID DOWN PAR VALUE OF JOHN DEERE OWNER 2.910% 7/17/23 -16,292.37 - - - - 16,292.37 (16,290.37) - 2.00
12/15/2020 47789KAC7 INTEREST EARNED ON JOHN DEERE OWNER 1.100% 8/15/24 $1 PV O 0.00 - - - - 394.17 - - -
12/15/2020 58769TAD7 INTEREST EARNED ON MERCEDES BENZ 1.940% 3/15/24 $1 PV ON 0.00 - - - - 436.50 - - -
12/15/2020 58770FAC6 INTEREST EARNED ON MERCEDES BENZ AUTO 1.840% 12/15/22 $1 PV 0.00 - - - - 214.67 - - -
12/15/2020 80285WAD9 INTEREST EARNED ON SANTANDER DRIVE 0.00001% 7/15/24 $1 PV O 0.00 - - - - 143.00 - - -
12/15/2020 89238UAD2 INTEREST EARNED ON TOYOTA AUTO 1.910% 9/15/23 $1 PV ON 39 0.00 - - - - 397.92 - - -
12/15/2020 12/14/2020 12/15/2020 91282CAK7 SOLD PAR VALUE OF U S TREASURY NT 0.125% 9/15/23 /BOFA SECU -1,395,000.00 1.00 - - - 1,393,910.16 (1,393,954.87) (44.71) -
12/15/2020 12/15/2020 91282CAK7 RECEIVED ACCRUED INTEREST ON SALE OF U S TREASURY NT 0.12 0.00 - - - - 438.35 - - -
12/15/2020 12/14/2020 12/15/2020 91282CAX9 PURCHASED PAR VALUE OF U S TREASURY NT 0.125% 11/30/22 /NA 2,035,000.00 1.00 - - - (2,035,397.46) 2,035,397.46 - -
12/15/2020 12/15/2020 91282CAX9 PAID ACCRUED INTEREST ON PURCHASE OF U S TREASURY NT 0.1 0.00 - - - - (104.82) - - -
12/15/2020 931142EA7 ACCREDITED DISCOUNT ON WALMART STORES INC 1.900% 12/15/20 M 0.00 - - - - - 10,240.00 - -
12/15/2020 12/15/2020 12/15/2020 931142EA7 MATURED PAR VALUE OF WALMART STORES INC 1.900% 12/15/20 500 -500,000.00 1.00 - - - 500,000.00 (500,000.00) - -
12/15/2020 931142EA7 INTEREST EARNED ON WALMART STORES INC 1.900% 12/15/20 $1 PV 0.00 - - - - 4,750.00 - - -
12/18/2020 12/18/2020 12/18/2020 31846V203 PURCHASED UNITS OF FIRST AM GOVT OB FD CL Y 3,839.96 1.00 - - - (3,839.96) 3,839.96 - -
12/18/2020 43814PAC4 INTEREST EARNED ON HONDA AUTO 1.78999% 9/20/21 $1 PV ON 5 0.00 - - - - 5.72 - - -
12/18/2020 12/18/2020 12/18/2020 43814PAC4 PAID DOWN PAR VALUE OF HONDA AUTO 1.78999% 9/20/21 CMO F -3,834.24 32.04 - - - 3,834.24 (3,833.82) - 0.42
12/23/2020 12/23/2020 12/23/2020 31846V203 PURCHASED UNITS OF FIRST AM GOVT OB FD CL Y 2,031.25 1.00 - - - (2,031.25) 2,031.25 - -
12/23/2020 931142EJ8 INTEREST EARNED ON WALMART INC 3.125% 6/23/21 $1 PV ON 13 0.00 - - - - 2,031.25 - - -
12/24/2020 TRUST FEES COLLECTED CHARGED FOR PERIOD 11/01/2020 THRU 11 0.00 - - - - (579.23) - - -
12/24/2020 12/24/2020 12/24/2020 31846V203 SOLD UNITS OF FIRST AM GOVT OB FD CL Y -579.23 1.00 - - - 579.23 (579.23) - -
12/28/2020 05588CAC6 INTEREST EARNED ON BMW VEHICLE OWNER 1.920% 1/25/24 $1 PV 0.00 - - - - 528.00 - - -
12/28/2020 3136AKQM8 INTEREST EARNED ON F N M A GTD REMIC 3.056% 6/25/24 $1 PV ON 0.00 - - - - 50.77 - - -
12/28/2020 3136AKQM8 INTEREST EARNED ON F N M A GTD REMIC 3.056% 6/25/24 $1 PV ON 0.00 - - - - 1,046.87 - - -
12/28/2020 3136AKQM8 AMORTIZED PREMIUM ON F N M A GTD REMIC 3.056% 6/25/24 CURRE 0.00 - - - - - (633.10) - -
12/28/2020 12/25/2020 12/28/2020 3136AKQM8 PAID DOWN PAR VALUE OF F N M A GTD REMIC 3.056% 6/25/24 -2,530.63 - - - - 2,530.63 (2,696.66) (166.03) -
12/28/2020 3136B1XP4 INTEREST EARNED ON F N M A GTD REMIC 3.560% 9/25/21 $1 PV ON 0.00 - - - - 256.76 - - -
12/28/2020 3136B1XP4 AMORTIZED PREMIUM ON F N M A GTD REMIC 3.560% 9/25/21 CURRE 0.00 - - - - - (41.52) - -
12/28/2020 12/25/2020 12/28/2020 3136B1XP4 PAID DOWN PAR VALUE OF F N M A GTD REMIC 3.560% 9/25/21 -6,523.84 - - - - 6,523.84 (6,552.42) - (28.58)
12/28/2020 3136B1XP4 INTEREST EARNED ON F N M A GTD REMIC 3.560% 9/25/21 $1 PV ON 0.00 - - - - 0.50 - - -
12/28/2020 3137ATRW4 INTEREST EARNED ON F H L M C MULTICLASS 2.373% 5/25/22 $1 PV ON 0.00 - - - - 375.73 - - -
12/28/2020 3137ATRW4 AMORTIZED PREMIUM ON F H L M C MULTICLASS 2.373% 5/25/22 CURR 0.00 - - - - - (30.48) - -
12/28/2020 3137B1U75 INTEREST EARNED ON F H L M C MLTCL MTG 2.522% 1/25/23 $1 PV ON 0.00 - - - - 300.32 - - -
12/28/2020 3137B1U75 AMORTIZED PREMIUM ON F H L M C MLTCL MTG 2.522% 1/25/23 CURR 0.00 - - - - - (16.26) - -
12/28/2020 12/25/2020 12/28/2020 3137B1U75 PAID DOWN PAR VALUE OF F H L M C MLTCL MTG 2.522% 1/25/23 -443.54 - - - - 443.54 (444.82) - (1.28)
12/28/2020 3137B36J2 INTEREST EARNED ON F H L M C MLTCL MT 3.320% 2/25/23 $1 PV ON 0.00 - - - - 1,326.52 - - -
12/28/2020 3137B36J2 AMORTIZED PREMIUM ON F H L M C MLTCL MT 3.320% 2/25/23 CURRE 0.00 - - - - - (506.70) - -
12/28/2020 3137B4WB8 INTEREST EARNED ON F H L M C MLTCL MTG 3.060% 7/25/23 $1 PV ON 0.00 - - - - 1,249.50 - - -
12/28/2020 3137B4WB8 AMORTIZED PREMIUM ON F H L M C MLTCL MTG 3.060% 7/25/23 CURR 0.00 - - - - - (587.66) - -
12/28/2020 3137EAES4 INTEREST EARNED ON F H L M C M T N 0.250% 6/26/23 $1 PV ON 540 0.00 - - - - 675.00 - - -
12/28/2020 3137FJYA1 INTEREST EARNED ON F H L M C MLTCL 3.454% 5/25/23 $1 PV ON 79 0.00 - - - - 510.54 - - -
12/28/2020 12/25/2020 12/28/2020 3137FJYA1 PAID DOWN PAR VALUE OF F H L M C MLTCL 3.454% 5/25/23 -7,962.90 0.00 - - - 7,962.90 (7,962.68) - 0.22
12/28/2020 12/28/2020 12/28/2020 31846V203 PURCHASED UNITS OF FIRST AM GOVT OB FD CL Y 9,851.23 1.00 - - - (9,851.23) 9,851.23 - -
12/28/2020 12/28/2020 12/28/2020 31846V203 PURCHASED UNITS OF FIRST AM GOVT OB FD CL Y 13,930.19 1.00 - - - (13,930.19) 13,930.19 - -
12/29/2020 3134GV4C9 ACCREDITED DISCOUNT ON F H L M C M T N 0.400% 12/29/22 CURRE 0.00 - - - - - 64.00 - -
12/29/2020 12/29/2020 12/29/2020 3134GV4C9 FULL CALL PAR VALUE OF F H L M C M T N 0.400% 12/29/22 /CALLS/ -320,000.00 1.00 - - - 320,000.00 (320,000.00) - -
12/29/2020 3134GV4C9 INTEREST EARNED ON F H L M C M T N 0.400% 12/29/22 $1 PV ON 32 0.00 - - - - 640.00 - - -
12/29/2020 12/29/2020 12/29/2020 31846V203 PURCHASED UNITS OF FIRST AM GOVT OB FD CL Y 320,640.00 1.00 - - - (320,640.00) 320,640.00 - -
12/29/2020 31846V203 CASH RECEIPT LONG-TERM CAPITAL GAIN DIV FIRST AM GOVT OB FD 0.00 - - - - 0.06 - - -
12/29/2020 31846V203 CASH RECEIPT SHORT-TERM CAPITAL GAIN DIV FIRST AM GOVT OB FD 0.00 - - - - 0.15 - - -
12/29/2020 12/29/2020 12/29/2020 31846V203 PURCHASED UNITS OF FIRST AM GOVT OB FD CL Y 0.06 1.00 - - - (0.06) 0.06 - -
12/30/2020 12/30/2020 12/30/2020 31846V203 PURCHASED UNITS OF FIRST AM GOVT OB FD CL Y 0.15 1.00 - - - (0.15) 0.15 - -
12/31/2020 010831DQ5 AMORTIZED PREMIUM ON ALAMEDA CNTY CA 3.095% 6/01/23 CURR 0.00 - - - - - (144.45) - -
12/31/2020 023135AJ5 AMORTIZED PREMIUM ON AMAZON COM INC 2.500% 11/29/22 CURR 0.00 - - - - - (596.09) - -
12/31/2020 06406FAA1 AMORTIZED PREMIUM ON BANK OF NY MTN 2.500% 4/15/21 CURRE 0.00 - - - - - (391.22) - -
12/31/2020 13063BFS6 AMORTIZED PREMIUM ON CALIFORNIA ST BUILD 6.650% 3/01/22 CURR 0.00 - - - - - (5,495.06) - -
12/31/2020 13066YTZ2 AMORTIZED PREMIUM ON CALIFORNIA ST DEPT 2.000% 5/01/22 CURR 0.00 - - - - - (85.01) - -
12/31/2020 144141DC9 AMORTIZED PREMIUM ON PROG ENERGY CAROLINA 2.800% 5/15/22 C 0.00 - - - - - (194.43) - -
12/31/2020 166764AU4 AMORTIZED PREMIUM ON CHEVRON CORP 0.78113% 3/03/22 CURR 0.00 - - - - - (103.26) - -
12/31/2020 17325FAQ1 AMORTIZED PREMIUM ON CITIBANK NA 3.400% 7/23/21 CURRENT 0.00 - - - - - (1,131.88) - -
12/31/2020 17325FAY4 AMORTIZED PREMIUM ON CITIBANK NA 2.844% 5/20/22 CURRENT 0.00 - - - - - (120.44) - -
12/31/2020 20772JKP6 AMORTIZED PREMIUM ON CONNECTICUT ST 2.401% 10/15/21 CURR 0.00 - - - - - (21.90) - -
12/31/2020 20772KGM5 AMORTIZED PREMIUM ON CONNECTICUT ST SER A 2.921% 4/15/23 CU 0.00 - - - - - (94.20) - -
12/31/2020 20772KJU4 AMORTIZED PREMIUM ON CONNECTICUT ST 2.500% 7/01/22 CURR 0.00 - - - - - (538.30) - -
12/31/2020 250847EJ5 AMORTIZED PREMIUM ON DETROIT EDISON CO 2.650% 6/15/22 CURR 0.00 - - - - - (45.90) - -
12/31/2020 3136AKQM8 AMORTIZED PREMIUM ON F N M A GTD REMIC 3.056% 6/25/24 CURRE 0.00 - - - - - (146.81) - -
12/31/2020 3136B1XP4 AMORTIZED PREMIUM ON F N M A GTD REMIC 3.560% 9/25/21 CURRE 0.00 - - - - - (8.96) - -
12/31/2020 3137ATRW4 AMORTIZED PREMIUM ON F H L M C MULTICLASS 2.373% 5/25/22 CURR 0.00 - - - - - (7.11) - -
12/31/2020 3137B1U75 AMORTIZED PREMIUM ON F H L M C MLTCL MTG 2.522% 1/25/23 CURR 0.00 - - - - - (3.78) - -
12/31/2020 3137B36J2 AMORTIZED PREMIUM ON F H L M C MLTCL MT 3.320% 2/25/23 CURRE 0.00 - - - - - (118.22) - -
12/31/2020 3137B4WB8 AMORTIZED PREMIUM ON F H L M C MLTCL MTG 3.060% 7/25/23 CURR 0.00 - - - - - (137.12) - -
12/31/2020 12/31/2020 12/31/2020 31846V203 PURCHASED UNITS OF FIRST AM GOVT OB FD CL Y 2,631.22 1.00 - - - (2,631.22) 2,631.22 - -
12/31/2020 56052AE77 AMORTIZED PREMIUM ON MAINE ST 1.250% 6/01/22 CURRENT Y 0.00 - - - - - (104.28) - -
12/31/2020 693304AP2 AMORTIZED PREMIUM ON PECO ENERGY CO 2.375% 9/15/22 CURR 0.00 - - - - - (138.30) - -
Page 37 of 38
55

Account Number: 001050990415 Name: RIVERSIDE COUNTY TRANS COMMTransaction
Date Trade Date
Settlement
Date CUSIP Description Units Price Commissions SEC Fees
Miscellaneous
Fees Net Cash Amount
Federal Tax Cost
Amount
Short Term
Gain/Loss Amount
Long Term
Gain/Loss Amount
Payden & Rygel Operating Portfolio Transaction Report
Quarter ended December 31, 2020
12/31/2020 79730WAY6 AMORTIZED PREMIUM ON SAN DIEGO CA 3.250% 9/01/22 CURREN 0.00 - - - - - (2,622.64) - -
12/31/2020 79770GGP5 AMORTIZED PREMIUM ON SAN FRANCISCO CA 2.375% 8/01/22 CURR 0.00 - - - - - (1,122.19) - -
12/31/2020 12/30/2020 12/31/2020 91282CAG6 SOLD PAR VALUE OF U S TREASURY NT 0.125% 8/31/22 /NOMURA S -4,265,000.00 1.00 - - - 4,265,000.00 (4,264,666.79) 333.21 -
12/31/2020 12/31/2020 91282CAG6 RECEIVED ACCRUED INTEREST ON SALE OF U S TREASURY NT 0.12 0.00 - - - - 1,796.72 - - -
12/31/2020 12/30/2020 12/31/2020 91282CAK7 SOLD PAR VALUE OF U S TREASURY NT 0.125% 9/15/23 /BOFA SECU -2,230,000.00 1.00 - - - 2,228,170.70 (2,228,170.70) - -
12/31/2020 12/31/2020 91282CAK7 RECEIVED ACCRUED INTEREST ON SALE OF U S TREASURY NT 0.12 0.00 - - - - 823.93 - - -
12/31/2020 12/30/2020 12/31/2020 91282CAN1 SOLD PAR VALUE OF U S TREASURY NT 0.125% 9/30/22 /J.P. MORGA -1,395,000.00 1.00 - - - 1,395,000.00 (1,394,237.11) 762.89 -
12/31/2020 12/31/2020 91282CAN1 RECEIVED ACCRUED INTEREST ON SALE OF U S TREASURY NT 0.12 0.00 - - - - 440.73 - - -
12/31/2020 91282CAW1 AMORTIZED PREMIUM ON U S TREASURY NT 0.250% 11/15/23 CURR 0.00 - - - - - (319.35) - -
12/31/2020 91282CAX9 AMORTIZED PREMIUM ON U S TREASURY NT 0.125% 11/30/22 CURR 0.00 - - - - - (10.45) - -
12/31/2020 12/30/2020 12/31/2020 91282CAX9 PURCHASED PAR VALUE OF U S TREASURY NT 0.125% 11/30/22 /NO 3,788,100.00 1.00 - - - (3,788,543.92) 3,788,543.92 - -
12/31/2020 12/31/2020 91282CAX9 PAID ACCRUED INTEREST ON PURCHASE OF U S TREASURY NT 0.1 0.00 - - - - (403.27) - - -
12/31/2020 12/30/2020 12/31/2020 91282CAX9 PURCHASED PAR VALUE OF U S TREASURY NT 0.125% 11/30/22 /NA 1,871,900.00 1.00 - - - (1,872,119.36) 1,872,119.36 - -
12/31/2020 12/31/2020 91282CAX9 PAID ACCRUED INTEREST ON PURCHASE OF U S TREASURY NT 0.1 0.00 - - - - (199.28) - - -
12/31/2020 12/30/2020 12/31/2020 91282CBA8 PURCHASED PAR VALUE OF U S TREASURY NT 0.125% 12/15/23 /GO 1,096,300.00 1.00 - - - (1,094,929.62) 1,094,929.62 - -
12/31/2020 12/31/2020 91282CBA8 PAID ACCRUED INTEREST ON PURCHASE OF U S TREASURY NT 0.1 0.00 - - - - (60.24) - - -
12/31/2020 12/30/2020 12/31/2020 91282CBA8 PURCHASED PAR VALUE OF U S TREASURY NT 0.125% 12/15/23 /J.P 1,133,700.00 1.00 - - - (1,132,282.88) 1,132,282.88 - -
12/31/2020 12/31/2020 91282CBA8 PAID ACCRUED INTEREST ON PURCHASE OF U S TREASURY NT 0.1 0.00 - - - - (62.29) - - -
12/31/2020 91412HDJ9 AMORTIZED PREMIUM ON UNIV OF CA 3.283% 5/15/22 CURRENT 0.00 - - - - - (45.12) - -
Total - - - 0.00 239,340.04 1,394.06 88,502.59
Page 38 of 38
56

Riverside County Transportation CommissionSHORT DURATION FIXED INCOME
JANUARY 27, 2021
ATTACHMENT 17
57

2
Table of Contents
MetLife Investment Management Overview01
Market Review02
Portfolio Review03
Appendix04
58

3
1. MetLife Investment Management Overview
59

4
MetLife Investment Management (MIM)1 manages Public Fixed Income, Private Capital and Real Estate assets for institutional investors worldwide by applying our deep asset class expertise to build tailored portfolio solutions. We also
leverage the broader resources and 150-year history of MetLife to skillfully navigate markets.
Overview
1.As of September 30, 2020, subsidiaries of MetLife, Inc. that provide investment management services to MetLife’s general account, separate accounts and/or unaffiliated/third party investors include Metropolitan Life Insurance Company, MetLife Investment Management, LLC, MetLife Investment Management Limited, MetLife Investments Limited, MetLife Investments Asia Limited, MetLife Latin America Asesorias e Inversiones Limitada, MetLife Asset Management Corp. (Japan), and MIM I LLC.
2.As of September 30, 2020. At estimated fair value. See Appendix – End Notes for additional information. 3.Illustration shown depicts locations of select MIM regional offices, chosen in MIM’s discretion; not a complete representation of MIM’s regional offices.
MIM Highlights
Total Assets Under Management of $651.1 billion2 as of September 30, 2020
Separate accounts, proprietary commingled funds and client-specific portfolio solutions
Experienced and tenured investment teams
Deep fundamental research
Leverages the broader resources of the MetLife enterprise
Global Presence1,3
Philadelphia Whippany
London
Santiago
Tokyo
Hong Kong S.A.R.
60

5
Short Duration Fixed Income TeamPortfolio Management
Name Responsibility Industry Experience (yrs)
Scott Pavlak, CFA Head of Short DurationFixed Income
33
Juan Peruyero Portfolio Manager 20
Portfolio Management Support
Name Sector Industry Experience (yrs)
David Wheeler, CFA Credit 34
Steve Kelly, CFA Credit 32
Kimberley Slough Municipals 27
John Palphreyman, CFA Structured Products 21
Phil Tran Treasuries, Agencies,Money Markets
17
Trading
Name Role # of Traders
Average Industry Experience (yrs)
Dana Cottrell Head of Investment Grade Trading
5 14
Thomas McClintic Head of High Yield Trading
3 18
Jason Valentino Head of Structured Products Trading
8 15
Research
Name Role # of Analysts
Average Industry Experience (yrs)
Brian Funk, CFA Head of Credit Research 23
Ian Bowman Sector Leader – Consumer & Healthcare 5 19
Park Benjamin, CFA Sector Leader – Energy, Basics, Materials 4 14
Scott O’Donnell Sector Leader – Financials 4 13
Richard Davis, CFA Sector Leader – Industrials 4 17
Zach Bauer, CFA Sector Leader – Telecom, Media, Technology
5 14
Susan Young Sector Leader – Utilities & Midstream 4 14
Brent Garrels Sector Leader – Special Situations 3 12
Joseph Gankiewicz, CFA Sector Leader – Municipals 4 24
Credit Strategy 2 15
Name Role# of
AnalystsAverage Industry Experience (yrs)
Francisco Paez, CFA Head of Structured Products Research 24
Loritta Cheng Sector Leader – ABS 2 17
Meena Pursnani Sector Leader – CMBS 2 23
Vivian Kim, CFA Sector Leader - RMBS 1 14
Angela Best Sector Leader – CLO 2 14
61

6
2. Market Review & Outlook
62

7
Current ThemesFiscal Stimulus / GrowthAn increase in fiscal stimulus is now expected to spur a meaningful increase in U.S. real GDP growth in 2021, however we continue to expect an uneven recovery as many small businesses are slow to reopen and consumers reluctant to return to their pre-Covid consumption patterns. Growth will be pulled forward by fiscal spending which will provide temporary support, not a long-term structural fix to the economy. Fiscal and monetary stimulus lines will continue to blur as coordinated efforts between Congress, the Treasury and Federal Reserve will move to address socio-economic issues. The U.S. federal deficit continues to expand coupled with a sharp increase in the national debt, both representing long-term challenges.
BusinessUneven access to capital as well as technology in the current environment continues to disproportionately benefit larger enterprises versus smaller and medium companies. We do however expect large corporations will work to trim costs (labor) in the face of profit margin pressures while small and midsize businesses continue to grapple with staffing challenges. Credit fundamentals for many large companies have begun their gradual repair, which may be slowed by higher costs, margin squeezes, and potential for liquidity buffers being redirected to M&A or increased shareholder payouts. Banking fundamentals continue to be strong, especially for issuers with capital markets businesses. The rollback of the prior administration’s regulatory changes may be marginally less business-friendly.
ConsumerAdditional stimulus will help support consumption and aid households in staying current on their financial obligations (e.g. rent, credit cards, auto loans). Post-coronavirus behavior remains altered as spending patterns have shifted and social distancing persists, which will negatively impact many of the service sectors until a vaccine is widely distributed and herd immunity is reached. Absent requirements that individuals get vaccinated, a reluctance to be inoculated serves as headwind to the consumer sector’s contribution to economic growth. The savings rate will likely remain elevated as high-income earners, who have a lower propensity to spend an incremental saved dollar, are less inclined to spend on services.
EmploymentThe recent drop in the unemployment rate was largely driven by a decline in the labor market’s participation rate and bears watching as it has negative longer-term implications for economic growth. Divergences persist across the economy with a disproportionate number of jobs lost in lower paying service sectors, especially leisure & hospitality and retail. Permanent job losses remain elevated, raising concerns arising from the potential for lasting damage due to diminished job skills and lower productivity growth unless recent trends are reversed. The loss of jobs in Industries that tend to pay less than the average hourly earnings rate (AHE) has skewed the distribution of earnings to high wage earners and biased the AHE number higher.
Monetary PolicyThe Fed’s focus on producing an uptick in inflation through using its policy toolkit takes precedence over seeking improvement in labor market measures. Given the close relationship between Chair Powell and incoming Treasury Secretary Yellen, we expect increasingly greater coordination between fiscal and monetary policy efforts to achieve economic policy goals. Over the near term, the bar for the Fed to taper its post-crisis QE program is high due to continued downside risks to the economy. U.S. monetary policy will not be tightened pre-emptively based on the Fed forecasting higher inflation above its target as it has done in past cycles. The Fed’s adoption of AIT (average inflation targeting) means old models of its reaction function should be discarded.
InflationU.S. inflation is expected to rise in the short run due to base effects but would not be reflective of underlying inflationary pressures. The focus of the Fed and in turn the market will shift to survey and market-based inflation expectation measures under the Federal Reserve’s Average Inflation Target framework. Lingering labor market slack and low nominal economic growth are expected to temper inflation longer term, however. The future demand outlook for services in a post-Covid environment is clouded and could be problematic. Based on the failure to reach inflation targets in other regions (e.g. Japan and the eurozone), the track record of employing easy monetary policy to drive inflation is not encouraging.
Residential / Commercial Real EstateLow mortgage rates along with tight single-family property inventories from the migration of urban dwellers keep inventories tight, supportive of mid-single digit home price appreciation. Originators continue to add processing capacity and have the ability toabsorb the impact of rising interest rates rather than passing them through to borrowers, thereby keeping mortgage rates low and prepayments elevated. Additional fiscal support will delay the expiration of forbearance programs. Supported by strength in industrial and multi-family properties, commercial real estate delinquencies have stabilized, but headwinds remain for retail, lodging and office properties. Overall, we feel benchmark commercial property price indices are likely to show modest declines.
InternationalGlobal central banks will likely maintain loose financial conditions in an ongoing attempt to generate growth and inflation as the coronavirus and potential mutations linger. More fiscal stimulus in the U.S. and an expanding budget deficit may limit the U.S. dollar’s ability to rebound. Geopolitical risks are expected to rise posing challenges on multiple fronts including an emboldened China (i.e. Taiwan, South China Sea, IP theft) as well as a more confrontational Iran and Russia, especially with a new U.S. president. While U.S. tariffs on Chinese imports are expected to remain in place, the incoming president is not expected to levy tariffs on European goods and should adopt a less isolationist approach. ESG and climate change will garner more attention, playing an increasingly larger role in driving international policy and business decisions.
The views present are MetLife Investment Management’s only, are subject to change, and may not reflect the manager’s current views.
63

8
17.8
-
2
4
6
8
10
12
14
16
18
20
2014 2015 2016 2017 2018 2019
Trilli
ons
($)
Source: Bloomberg
As of December 31, 2020
Global Negative-Yielding Debt
64

9
Source: Bloomberg
As of December 31, 2020
Yields
1.91
1.55 1.57
1.69
1.92
1.45
0.09
0.25
0.38
0.67
0.30
0.14 0.15
0.29
0.66
0.23
0.10 0.13
0.28
0.69
0.24
0.070.12
0.36
0.92
0.00%
0.50%
1.00%
1.50%
2.00%
3-MonthUSD LIBOR
U.S. Treasury3-Month
U.S. Treasury2-Year
U.S. Treasury5-Year
U.S. Treasury10-Year
12/31/2019 3/31/2020 6/30/2020 9/30/2020 12/31/2020
65

10
Yield Curves
Source: Bloomberg
5-Year Less 2-Year
10-Year Less 3-Month
As of December 31, 2020
24
-250
255075
100125150175
Basi
s Po
ints
5-Year Less 2-Year Fed Tightening Recession 5-Year Less 2-Year Avg.
85
-100-50
050
100150200250300350400
Basi
s Po
ints
10-Year Less 3-Month Fed Tightening Recession 10-Year Less 3-Month Avg.
66

11
Source: European Central Bank, Federal Reserve, Bank of Japan
As of December 31, 2020
Central Bank Assets
Central Bank 12/31/2008 12/31/2014 12/31/2018 12/31/2019 12/31/2020 1-Year % Change
European Central Bank $2,855 $2,601 $5,354 $5,261 $8,569 +63%
Federal Reserve $2,239 $4,498 $4,076 $4,174 $7,363 +76%
Bank of Japan $1,354 $2,506 $5,033 $5,276 $6,807 +29%
Total $6,448 $9,605 $14,463 $14,711 $22,739 +55%
02,0004,0006,0008,000
10,00012,00014,00016,00018,00020,00022,00024,000
2007 2008 2009 2010 2011 2012 2013 2014 2015 2016 2017 2018 2019 2020
Billio
ns ($
)
ECB FED BOJ
67

12
Source: Federal Reserve
As of December 31, 2020
Federal Reserve Projections
2021 2022 2023
Real GDP
September-19 Projection 1.9% 1.8% N/A
December-19 Projection 1.9% 1.8% N/A
June-20 Projection 5.0% 3.5% N/A
September-20 Projection 4.0% 3.0% 2.5%
December-20 Projection 4.2% 3.2% 2.4%
Unemployment Rate
September-19 Projection 3.8% 3.9% N/A
December-19 Projection 3.6% 3.7% N/A
June-20 Projection 6.5% 5.5% N/A
September-20 Projection 5.5% 4.6% 4.0%
December-20 Projection 5.0% 4.2% 3.7%
PCE Inflation
September-19 Projection 2.0% 2.0% N/A
December-19 Projection 2.0% 2.0% N/A
June-20 Projection 1.6% 1.7% N/A
September-20 Projection 1.7% 1.8% 2.0%
December-20 Projection 1.8% 1.9% 2.0%
68

13
1 Indicates estimatesSource: Congressional Budget Office
As of August 31, 2020
Congressional Budget Office
($ Billions) 1973 1983 1993 2003 2008 2009 2011 2013 2015 2017 2018 2019 20201 20211 20251
Revenues 231 601 1,154 1,782 2,524 2,105 2,304 2,775 3,250 3,316 3,330 3,463 3,296 3,256 4,334Outlays 246 808 1,409 2,160 2,983 3,518 3,603 3,455 3,688 3,982 4,109 4,447 6,606 5,066 5,507
Social Security 48 169 302 470 612 678 725 808 882 939 982 1,038 1,091 1,142 1,417Medicare 9 56 143 274 456 500 560 585 634 702 705 775 862 810 1,158Medicaid 5 19 76 161 201 251 275 265 350 375 389 409 466 537 545Income Security 14 64 117 196 261 350 404 340 301 293 285 303 1,132 499 364Retirement & Disability 12 45 68 100 129 138 144 153 161 163 163 170 173 179 197Defense 77 210 292 405 612 657 699 626 583 590 623 676 715 733 792Other 63 156 212 401 458 758 566 458 553 657 637 700 1,829 876 748
Net Interest 17 90 199 153 253 187 230 221 223 263 325 375 338 290 287Deficit (-) or Surplus Total -15 -208 -255 -378 -459 -1,413 -1,300 -680 -438 -665 -779 -984 -3,311 -1,810 -1,174
U.S. Deficit
01,0002,0003,0004,0005,0006,0007,000
1973
1974
1975
1976
1977
1978
1979
1980
1981
1982
1983
1984
1985
1986
1987
1988
1989
1990
1991
1992
1993
1994
1995
1996
1997
1998
1999
2000
2001
2002
2003
2004
2005
2006
2007
2008
2009
2010
2011
2012
2013
2014
2015
2016
2017
2018
2019
2020
(e)
2021
(e)
2022
(e)
2023
(e)
2024
(e)
2025
(e)
($) B
illion
s
Deficit (-) or Surplus Total Revenues Outlays
69

14
Source: Bureau of Labor Statistics
As of December 31, 2020
U.S. Labor
6.7%
61.5%
60.0%
61.0%
62.0%
63.0%
64.0%
65.0%
66.0%
67.0%
68.0%
3.0%
4.0%
5.0%
6.0%
7.0%
8.0%
9.0%
10.0%
11.0%
12.0%
13.0%
14.0%
15.0%
1996 1998 2000 2002 2004 2006 2008 2010 2012 2014 2016 2018 2020
U.S. Unemployment Rate (LHS) Participation Rate (RHS)
70

15
Source: Bureau of Labor Statistics
Labor ForceParticipation Rate
UnemploymentRate
Non-FarmPayroll
Current 61.5% 6.7% (140,000)
Average (2020) 61.7% 8.1% (781,167)
U.S. Average Hourly Earnings
As of December 31, 2020
U.S. Labor & Average Earnings
5.08%
2.0%
3.0%
4.0%
5.0%
6.0%
7.0%
8.0%
9.0%
2016 2017 2018 2019 2020
Year
ove
r Yea
r
71

16
Source: Bureau of Economic Analysis
As of November 30, 2020
Fed Inflation Target
100
102
104
106
108
110
112
114
116
118
120
2012 2013 2014 2015 2016 2017 2018 2019
Infla
tion
Inde
xed
to 1
00
Difference 2% Inflation Target PCE
72

17
Source: Federal Reserve
As of March 31, 2020
Common Inflation Expectations Index
1.97%
1.95%
1.98%
2.00%
2.03%
2.05%
2.08%
2.10%
2.13%
2.15%
1999 2000 2001 2002 2003 2004 2005 2006 2007 2008 2009 2010 2011 2012 2013 2014 2015 2016 2017 2018 2019 2020
Common Inflation Expectations Index Fed Target
73

18
Inflation
Source: Bureau of Economic Analysis, Bloomberg
PCE Core Breakdown As of November 30, 2020
5-Year TIPS Breakeven Rate As of December 31, 2020
1.62%1.38%
-0.54%
-0.06%
2.35%
1.92%
-2.00%
-1.00%
0.00%
1.00%
2.00%
3.00%
Dec-14 Jun-15 Dec-15 Jun-16 Dec-16 Jun-17 Dec-17 Jun-18 Dec-18 Jun-19 Dec-19 Jun-20Core PCE Core Goods Core Services
197
0
50
100
150
200
Dec-14 Jun-15 Dec-15 Jun-16 Dec-16 Jun-17 Dec-17 Jun-18 Dec-18 Jun-19 Dec-19 Jun-20 Dec-20
Basi
s Po
ints
74

19
Source: Bloomberg
As of December 31, 2020
Consumer Confidence
88.6
20
40
60
80
100
120
140
Dec-16 Jun-17 Dec-17 Jun-18 Dec-18 Jun-19 Dec-19 Jun-20 Dec-20
Expectations (60%) Current Conditions (40%) Consumer Confidence
75

20
ICE BofA Corporate 1-5 Year Index
OAS (bps) 2002 2003 2004 2005 2006 2007 2008 2009 2010 2011 2012 2013 2014 2015 2016 2017 2018 2019 2020
Corporate (1–5) 174 70 61 65 62 196 639 166 136 227 110 89 99 121 96 61 114 61 60
Financial (1–5) 165 51 50 57 56 212 663 204 158 308 126 93 96 104 100 60 116 63 62
Industrial (1–5) 176 86 73 75 69 181 624 135 116 164 96 85 103 134 92 61 112 59 57
Utility (1–5) 236 79 63 73 71 175 576 155 131 169 110 99 89 120 101 64 126 70 63
As of December 31, 2020
Past performance is not indicative of future results.Source: ICE Data Services
61
430
6050
100
150
200
250
300
350
400
450
Dec-18 Jun-19 Dec-19 Jun-20 Dec-20
Basi
s Po
ints
76

21
Short Duration Cross Sector Relative Value
Source: ICE Data Services, MetLife Investment ManagementPast performance is not indicative of future results.
As of December 31, 2020
77

22
3. Portfolio Review
78

23
Portfolio Performance1 - 2017 Toll Revenue I-15 Project FundAs of December 31, 2020
1.Past performance is not indicative of future results. The Since Inception performance returns of the portfolio is as of the first full month following the funding date. The performance benchmark shown for the Riverside County I-15 Express Lanes 2017 Toll Revenue Project Portfolio is the FTSE 6-Month U.S. Treasury Bill, which tracks the return of a six-month Treasury Bill to maturity and the FTSE 3-Month Treasury Bill, which tracks the return of a three-month Treasury Bill to maturity and is shown for discussion purposes only.
Portfolio Characteristics
9/30/20
Yield to Maturity 0.26%
Duration 0.26 Years
Average Quality (Moody’s) Aa1
Portfolio Market Value $49,786,774
12/31/20
Yield to Maturity 0.24%
Duration 0.36 Years
Average Quality (Moody’s) Aa2
Portfolio Market Value $41,202,646
Portfolio Performance (%)1
QTD YTD Since Inception Annualized (8/1/2017)
2017 Toll Revenue I-15 Project Fund (Gross of Fees) 0.07 1.05 1.75
2017 Toll Revenue I-15 Project Fund (Net of Fees) 0.05 0.95 1.65
FTSE 3-Month Treasury Bill 0.02 0.58 1.51
Asset Allocation9/30/20
Asset Allocation12/31/20
18%
10%
18%1%4%
11%
19%
4% 15%
Corporate
Municipal
Agency
RMBS
CMBS
ABS
Treasury
CP
CD
5%
8%
12%
1%3%
14%
43%
7%7%
Corporate
Municipal
Agency
RMBS
CMBS
ABS
Treasury
CP
CD
79
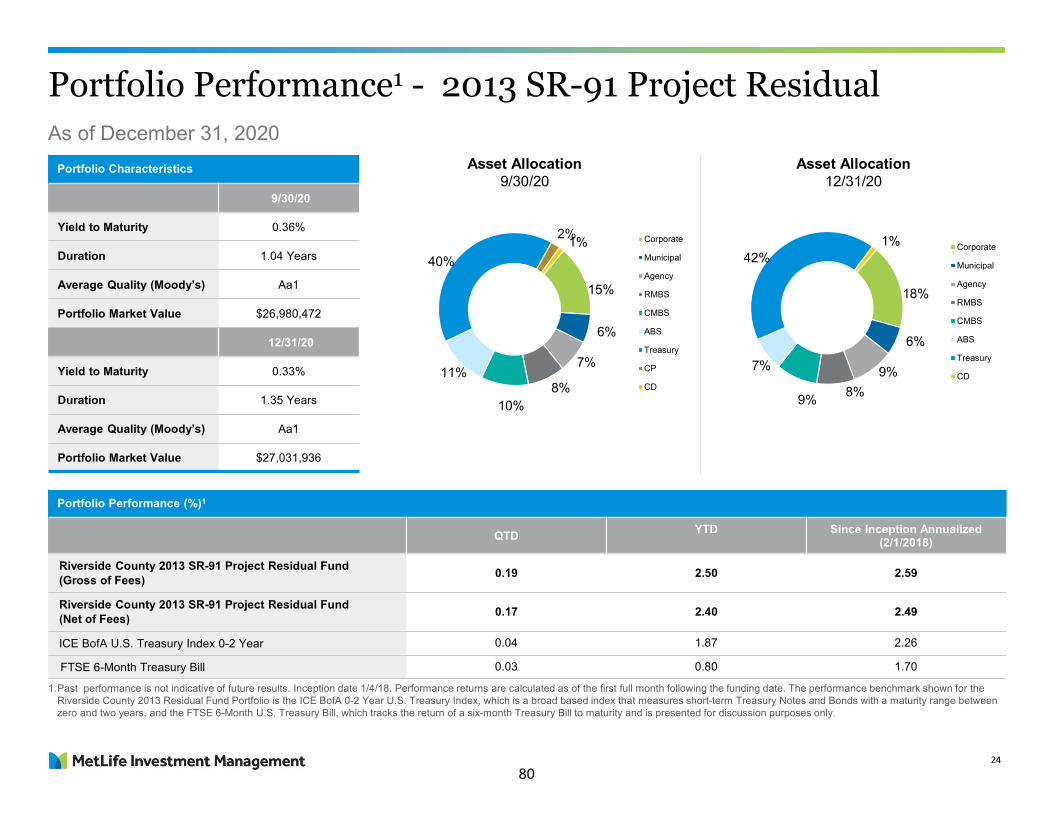
24
Portfolio Performance1 - 2013 SR-91 Project ResidualAs of December 31, 2020
1.Past performance is not indicative of future results. Inception date 1/4/18. Performance returns are calculated as of the first full month following the funding date. The performance benchmark shown for the Riverside County 2013 Residual Fund Portfolio is the ICE BofA 0-2 Year U.S. Treasury Index, which is a broad based index that measures short-term Treasury Notes and Bonds with a maturity range between zero and two years, and the FTSE 6-Month U.S. Treasury Bill, which tracks the return of a six-month Treasury Bill to maturity and is presented for discussion purposes only.
Portfolio Characteristics
9/30/20
Yield to Maturity 0.36%
Duration 1.04 Years
Average Quality (Moody’s) Aa1
Portfolio Market Value $26,980,472
12/31/20
Yield to Maturity 0.33%
Duration 1.35 Years
Average Quality (Moody’s) Aa1
Portfolio Market Value $27,031,936
Portfolio Performance (%)1
QTD YTD Since Inception Annualized (2/1/2018)
Riverside County 2013 SR-91 Project Residual Fund(Gross of Fees) 0.19 2.50 2.59
Riverside County 2013 SR-91 Project Residual Fund (Net of Fees) 0.17 2.40 2.49
ICE BofA U.S. Treasury Index 0-2 Year 0.04 1.87 2.26
FTSE 6-Month Treasury Bill 0.03 0.80 1.70
Asset Allocation9/30/20
Asset Allocation12/31/20
18%
6%
9%8%9%
7%
42%1% Corporate
Municipal
Agency
RMBS
CMBS
ABS
Treasury
CD
15%
6%
7%
8%10%
11%
40%
2%1% Corporate
Municipal
Agency
RMBS
CMBS
ABS
Treasury
CP
CD
80

25
Portfolio Performance1 - 2017 Toll Revenue I-15 Ramp Up ReserveAs of December 31, 2020
1.Past performance is not indicative of future results. Inception date 12/5/17. Performance returns are calculated as of the first full month following the funding date. Performance for periods greater than one year are annualized. The performance benchmark shown for the Riverside County I-15 Express Lanes Toll Revenue Reserve Portfolio is the ICE BofA 0-2 Year U.S. Treasury Index, which is a broad based index that measures short-term Treasury Notes and Bonds with a maturity range between zero and two years, and is presented for discussion purposes only.
Portfolio Characteristics
9/30/20
Yield to Maturity 0.34%
Duration 1.15 Years
Average Quality (Moody’s) Aaa
Portfolio Market Value $8,504,961
12/31/20
Yield to Maturity 0.32%
Duration 1.35 Years
Average Quality (Moody’s) Aaa
Portfolio Market Value $8,518,417
Asset Allocation9/30/20
Asset Allocation12/31/20
Portfolio Performance (%)1
QTD YTD Since Inception Annualized (1/1/2018)
2017 Toll Revenue I-15 Ramp Up Reserve (Gross of Fees) 0.16 2.30 2.56
2017 Toll Revenue I-15 Ramp Up Reserve (Net of Fees) 0.13 2.20 2.46
ICE BofA U.S. Treasury Index 0-2 Year 0.04 1.87 2.19
47%
18%
22%
13%
Treasury
Agency
RMBS
CMBS
50%
14%
22%
14%
Treasury
Agency
RMBS
CMBS
81

26
Portfolio Performance1 - Debt Reserve FundAs of December 31, 2020
1.Past performance is not indicative of future results. Performance returns for periods greater than one year are annualized. The performance benchmark shown for the Riverside County Debt Reserve Fund is the ICE BofA US Treasury 3-7 Year, which is a broad-based index consisting of U.S. Treasury securities with an outstanding par greater or equal to $1 billion and a maturity range from three to seven years, and the the ICE BofA 1-3 Year U.S. Treasury Index, which is a broad based index that measures short-term Treasury Notes and Bonds with a maturity range between one and three years, and is presented for discussion purposes only.
25%
13%
23%
39%
Treasury
Agency
RMBS
CMBS
Portfolio Characteristics
9/30/20
Yield to Maturity 0.62%
Duration 2.83 Years
Average Quality (Moody’s) Aaa
Portfolio Market Value $19,427,527
12/31/20
Yield to Maturity 0.62%
Duration 2.89 Years
Average Quality (Moody’s) Aaa
Portfolio Market Value $17,965,299
Asset Allocation9/31/20
Asset Allocation12/31/20
Portfolio Performance (%)1
QTD YTD Since Inception Annualized (8/1/2013)
Total Debt Service Fund (Gross of Fees) 0.21 4.91 2.74
Total Debt Service Fund (Net of Fees) 0.19 4.80 2.65
ICE BofA U.S. Treasury Index 1-3 Year 0.05 3.10 1.47
ICE BofA U.S. Treasury Index 3-7 Year -0.18 6.95 2.86
28%
15%20%
37%
Treasury
Agency
RMBS
CMBS
82

27
Portfolio Performance1 - 91 Subordinate Reserve AccountAs of December 31, 2020
1.Past performance is not indicative of future results. The performance benchmark shown for the Riverside County 91 Subordinate Reserve Account is the ICE BofA US Treasury 3-7 Year, which is a broad-based index consisting of U.S. Treasury securities with an outstanding par greater or equal to $1 billion and a maturity range from three to seven years, and the ICE BofA 1-3 Year U.S. Treasury Index, which is a broad based index that measures short-term Treasury Notes and Bonds with a maturity range between one and three years, and is presented for discussion purposes only.
27%
14%
23%
36%
Treasury
Agency
RMBS
CMBS
Portfolio Characteristics
9/30/20
Yield to Maturity 0.52%
Duration 2.42 Years
Average Quality (Moody’s) Aaa
Portfolio Market Value $21,051,648
12/31/20
Yield to Maturity 0.48%
Duration 2.45 Years
Average Quality (Moody’s) Aaa
Portfolio Market Value $21,103,782
Asset Allocation9/31/20
Asset Allocation12/30/20
Portfolio Performance (%)1
QTD YTD Since Inception Annualized (7/1/2019)
Total 91 Subordinate Reserve Fund (Gross of Fees) 0.25 4.19 3.55
Total 91 Subordinate Reserve Fund (Net of Fees) 0.22 4.09 3.45
ICE BofA U.S. Treasury Index 1-3 Year 0.05 3.10 2.80
ICE BofA U.S. Treasury Index 3-7 Year -0.18 6.95 5.40
26%
14%
21%
39%
Treasury
Agency
RMBS
CMBS
83
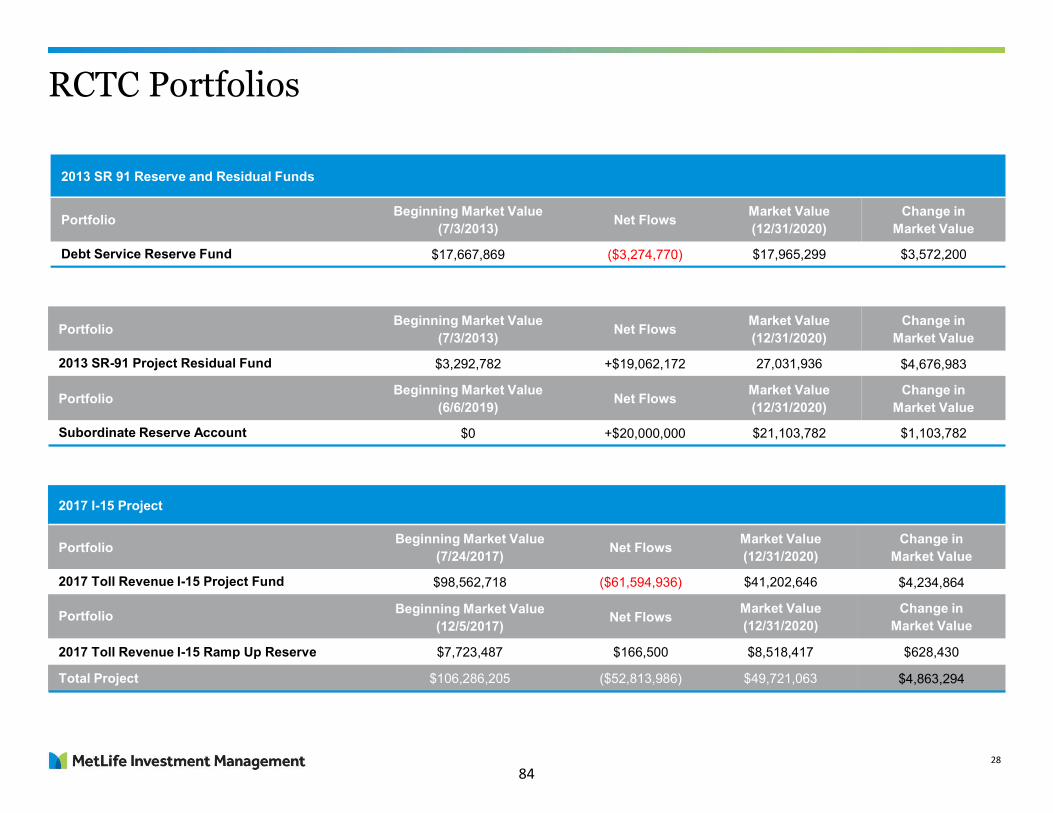
28
RCTC Portfolios
2017 I-15 Project
Portfolio Beginning Market Value (7/24/2017) Net Flows Market Value
(12/31/2020)Change in
Market Value
2017 Toll Revenue I-15 Project Fund $98,562,718 ($61,594,936) $41,202,646 $4,234,864
Portfolio Beginning Market Value (12/5/2017) Net Flows Market Value
(12/31/2020)Change in
Market Value
2017 Toll Revenue I-15 Ramp Up Reserve $7,723,487 $166,500 $8,518,417 $628,430
Total Project $106,286,205 ($52,813,986) $49,721,063 $4,863,294
2013 SR 91 Reserve and Residual Funds
Portfolio Beginning Market Value (7/3/2013) Net Flows Market Value
(12/31/2020)Change in
Market Value
Debt Service Reserve Fund $17,667,869 ($3,274,770) $17,965,299 $3,572,200
Portfolio Beginning Market Value (7/3/2013) Net Flows Market Value
(12/31/2020)Change in
Market Value
2013 SR-91 Project Residual Fund $3,292,782 +$19,062,172 27,031,936 $4,676,983
Portfolio Beginning Market Value (6/6/2019) Net Flows Market Value
(12/31/2020)Change in
Market Value
Subordinate Reserve Account $0 +$20,000,000 $21,103,782 $1,103,782
84

29
4. Appendix
85

30
Disclaimers
1.As of September 30, 2020, subsidiaries of MetLife, Inc. that provide investment management services to MetLife’s general account, separate accounts and/or unaffiliated/third party investors include Metropolitan Life Insurance Company, MetLife Investment Management, LLC, MetLife Investment Management Limited, MetLife Investments Limited, MetLife Investments Asia Limited, MetLife Latin America Asesorias e Inversiones Limitada, MetLife Asset Management Corp. (Japan), and MIM I LLC.
]
This material is intended for institutional investor, qualified investor and financial professional use only. Not suitable for use with general retail public.
Your capital is at risk. Investing in the strategies discussed herein are subject to various risks which must be considered prior to investing. These risks may include, but are not limited to Liquidity Risk, Interest Rate Risk, Credit Risk, Prepayment Risk, and Counterparty Risk For a more complete list please contact your sales representative.
Risk of loss An investment in the strategy described herein is speculative and there can be no assurance that the strategy’s investment objectives will be achieved. Investors must be prepared to bear the risk of a total loss of their investment.
This document is being provided to you at your specific request. This document has been prepared by MetLife Investment Management, LLC (formerly, MetLife Investment Advisors, LLC), a U.S. Securities Exchange Commission-registered investment adviser. MetLife Investment Management, LLC is a subsidiary of MetLife, Inc. and part of MIM.1 Registration with the SEC does not imply a certain level of skill or that the SEC has endorsed the investment advisor.
MetLife, Inc. provides investment management services to affiliates and unaffiliated/third party clients through various subsidiaries.1 MetLife Investment Management (“MIM”), MetLife, Inc.’s institutional investment management business, is responsible for investments in a range of asset sectors, public and privately sourced, including corporate and infrastructure private placement debt, real estate equity, commercial mortgage loans, customized index strategies, structured finance, emerging market debt, and high yield debt. The information contained herein is intended to provide you with an understanding of the depth and breadth of MIM’s investment management services and investment management experience. This document has been provided to you solely for informational purposes and does not constitute a recommendation regarding any investments or the provision of any investment advice, or constitute or form part of any advertisement of, offer for sale or subscription of, solicitation or invitation of any offer or recommendation to purchase or subscribe for any securities or investment advisory services. Unless otherwise specified, the information and opinions presented or contained in this document are provided as of the quarter end noted herein. It should be understood that subsequent developments may affect the information contained in this document materially, and MIM shall not have any obligation to update, revise or affirm. It is not MIM’s intention to provide, and you may not rely on this document as providing, a complete or comprehensive analysis of MIM’s investment portfolio, investment strategies or investment recommendations.
No money, securities or other consideration is being solicited. No invitation is made by this document or the information contained herein to enter into, or offer to enter into, any agreement to purchase, acquire, dispose of, subscribe for or underwrite any securities or structured products, and no offer is made of any shares in or debentures of a company for purchase or subscription. Prospective clients are encouraged to seek advice from their legal, tax and financial advisors prior to making any investment.
Confidentiality. By accepting receipt or reading any portion of this Presentation, you agree that you will treat the Presentation confidentially. This reminder should not be read to limit, in any way, the terms of any confidentiality agreement you or your organization may have in place with MetLife Investment Management, LLC. This document and the information contained herein is strictly confidential (and by receiving such information you agree to keep such information confidential) and are being furnished to you solely for your information and may not be used or relied upon by any other party, or for any other purpose, and may not, directly or indirectly, be forwarded, published, reproduced, disseminated or quoted to any other person for any purpose without the prior written consent of MIM. Any forwarding, publication, distribution or reproduction of this document in whole or in part is unauthorized. Any failure to comply with this restriction may constitute a violation of applicable securities laws.
Past performance is not indicative of future results. No representation is being made that any investment will or is likely to achieve profits or losses or that significant losses will be avoided. There can be no assurance that investments similar to those described in this document will be available in the future and no representation is made that future investments managed by MIM will have similar returns to those presented herein. All information has been presented in U.S. dollars. Actual returns may increase or decrease due to currency fluctuations.
No offer to purchase or sell securities. This Presentation does not constitute an offer to sell or a solicitation of an offer to buy any security and may not be relied upon in connection with the purchase or sale of any security.
No reliance, no update and use of information. You may not rely on this Presentation as the basis upon which to make an investment decision. To the extent that you rely on this Presentation in connection with any investment decision, you do so at your own risk. This Presentation is being provided in summary fashion and does not purport to be complete. The information in the Presentation is as of the date indicated on the cover of this document unless otherwise specified and MIM does not intend to update the information after its distribution, even in the event that the information becomes materially inaccurate. Certain information contained in this Presentation, includes performance and characteristics of MIM’s by independent third parties, or have been prepared internally and have not been audited or verified. Use of different methods for preparing, calculating or presenting information may lead to different results for the information presented, compared to publicly quoted information, and such differencesmay be material.
No tax, legal or accounting advice. This Presentation is not intended to provide, and should not be relied upon for, accounting, legal or tax advice or investment recommendations. Any statements of U.S. federal tax consequences contained in this Presentation were not intended to be used and cannot be used to avoid penalties under the U.S. Internal Revenue Code or to promote, market or recommend to another party any tax-related matters addressed herein.
86

31
Disclaimers (Cont’d)Forward-Looking Statements:This document may contain or incorporate by reference information that includes or is based upon forward-looking statements within the meaning of the Private Securities Litigation Reform Act of 1995. Forward-looking statements give expectations or forecasts of future events. These statements can be identified by the fact that they do not relate strictly to historical or current facts. They use words and terms such as “anticipate,” “estimate,” “expect,” “project,” “intend,” “plan,” “believe,” “will,” and other words and terms of similar meaning, or are tied to future periods in connection with a discussion of future performance. Forward-looking statements are based MIM’s assumptions and current expectations, which may be inaccurate, and on the current economic environment which may change. These statements are not guarantees of future performance. They involve a number of risks and uncertainties that are difficult to predict. Results could differ materially from those expressed or implied in the forward-looking statements. Risks, uncertainties and other factors that might cause such differences include, but are not limited to: (1) difficult conditions in the global capital markets; (2) changes in general economic conditions, including changes in interest rates or fiscal policies; (3) changes in the investment environment; (4) changed conditions in the securities or real estate markets; and (5) regulatory, tax and political changes. MIM does not undertake any obligation to publicly correct or update any forward-looking statement if it later becomes aware that such statement is not likely to be achieved.
87

32
End NotesExplanatory Note
The following information is relevant to an understanding of our assets under management ("AUM"). Our definitions may differ from those used by other companies.
Total Assets Under Management (“Total AUM”) is comprised of GA AUM plus Institutional Client AUM (each, as defined below).
General Account AUM (“GA AUM”) is used by MetLife to describe assets in its general account ("GA") investment portfolio which are actively managed and stated at estimated fair value. GA AUM is comprised of GA total investments and cash and cash equivalents, excluding policy loans, other invested assets, contractholder-directed equity securities and fair value option securities, as substantially all ofthese assets are not actively managed in MetLife’s GA investment portfolio. Mortgage loans (including commercial, agricultural and residential) and real estate and real estate joint ventures included in GA AUM (at net asset value, net of deduction for encumbering debt) have been adjusted from carrying value to estimated fair value. Classification of GA AUM by sector is based on the nature and characteristics of the underlying investments which can vary from how they are classified under GAAP. Accordingly, the underlying investments within certain real estate and real estate joint ventures that are primarily commercial mortgage loans (at net asset value, net of deduction for encumbering debt) have been reclassified to exclude them from real estate equity and include them as commercial mortgage loans.
Institutional Client AUM is comprised of SA AUM plus TP AUM (each, as defined below). MIM manages Institutional Client AUM in accordance with client guidelines contained in each investment contract (“Mandates”).
Separate Account AUM (“SA AUM”) is comprised of separate account investment portfolios of MetLife insurance companies, which are managed by MetLife and included in MetLife, Inc.’s consolidated financial statements at estimated fair value.
Third Party AUM (“TP AUM”) is comprised of non-proprietary assets managed by MetLife on behalf of unaffiliated/third party clients, which are stated at estimated fair value. Such non-proprietary assets are owned by unaffiliated/third-party clients and, accordingly, are not included in MetLife, Inc.’s consolidated financial statements.
Additional information about MetLife’s general account investment portfolio is available in MetLife, Inc.’s quarterly financial materials for the quarter ended March 31, 2020, which may be accessed through MetLife’s Investor Relations web page at https://investor.metlife.com.
L1020008606[exp0321][All States]
88

© 2019 MetLife Services and Solutions, LLC, New York, NY 10166 - All Rights Reserved.
89


PAYDEN.COMLOS ANGELES | BOSTON | LONDON | MILAN
4th Quarter 2020
QUARTERLY PORTFOLIO REVIEWQUARTERLY PORTFOLIO REVIEW
ATTACHMENT 18
90
RIVERSIDE COUNTY
TRANSPORTATION
COMMISSION

LETTER FROM THE CEO
January 2021
Dear Client,
A year ago, our letter focused on both the stock and bond markets’ opportunities and risks. There was a positive tone but a degree of caution in our outlook, given that we were embarking on the eleventh year of a record-long economic cycle.
In a surprise to almost everyone, a virus, not a financial imbalance, brought the economic expansion to a halt. The Federal Reserve and other central banks’ swift actions ensured only a brief financial market panic in March. Fiscal authorities also provided aid to businesses and households on an unprecedented scale. What happened in the ensuing nine months was amazing. Financial markets have more than fully recovered, and regions able to reopen saw sharp economic rebounds.
As we begin 2021, vaccine distribution is underway. Once the vaccine is more widely available, we expect areas of the economy that have suffered the greatest, like the service sector, to benefit the most. There will be some permanent changes in how investors worldwide assess lifestyles, etc., but we expect a robust recovery.
Putting all of these things together, the definition of “risk” has changed. Interest rates are likely to remain low for the foreseeable future even as the economy recovers, creating a very favorable backdrop for stocks and credit sectors in the bond market, including investment grade, high yield, and emerging market bonds.
As always, we emphasize portfolio liquidity and are in a position to make changes when warranted. We will keep in close contact and very much appreciate your confidence in us. Most importantly, please keep your family safe and healthy.
My very best wishes from all of us here for a happy new year.
Joan A. Payden
President & CEO
91

ECONOMIC REVIEW AND OUTLOOK
Nine months into the pandemic that shook the globe, a number of vaccines have been approved for emergency use authorization
and millions of people have received their first dose, yet cases continue their troubling ascent in the U.S. and Europe. Despite
a strong recovery in the third quarter, the “winter surge” has led to increasingly severe lockdowns and threatens a double-dip
in fourth quarter GDP data.
The global economy remained in expansionary territory as of November according to service sector Purchasing Managers’
Index (PMI) readings, despite surging Covid-19 cases. In fact, China, the U.S. and many emerging market economies posted
near-best readings in November. The service sector was particularly hard hit in April, due to the unique nature of the Covid-19
recession, but appears to be faring better during the “winter surge.” With the first vaccines being deployed, the global economy
is poised for a services-led recovery in 2021.
India
Eurozone
Russia
U.K.
Australia
Japan
World
China
U.S.
Brazil
Emerging Markets
0 10 20 30 40 50 60
Diffusion Index
Worst Reading Best Reading November 2020
Expanding ► ◄Contracting
Despite renewed shutdowns
in parts of the world, service
sector activity did not grind
to a halt like it did in April
Range of Service Sector Purchasing Managers’ Index Readings in 2020
Given the speed of recovery in the Covid-19 recession compared to other recessions, economists have been forced to
reconsider whether traditional theories still apply. Economists used to say that “unemployment rises like a rocket and
falls like a feather.” While the first part of the adage has held up (the U.S. unemployment rate peaked at 14.7% in April),
the latter portion has not. Unemployment has already fallen to 6.7% — a faster recovery than even the most optimistic
predicted. However, the headline figure is biased downward by a coincident rise in the number of people leaving the labor
force. As the economy recovers and discouraged workers reenter the labor force, the unemployment rate may tick up
slightly. Still, even with a winter stall, we predict a sub-5% unemployment rate by the end of 2021.
Source: J.P. Morgan, IHS Markit
92

Riverside County Transportation Commission2812
Portfolio Review and Market Update - 4th Quarter 2020
PORTFOLIO CHARACTERISTICS (As of 12/31/2020)
$55.8 millionPortfolio Market Value
AA+Weighted Average Credit Quality
1.90 yearsWeighted Average Duration
0.32%Weighted Average Yield to Maturity
DURATION DISTRIBUTION
0%
5%
10%
15%
20%
25%
30%
35%
40%
45%
0 - 1 1 - 2 2 - 3 3+
Years
SECTOR ALLOCATION
0%
5%
10%
15%
20%
25%
30%
35%
40%
45%
Treas
uries
IG C
orpo
rate
s
Rev
enue G
O
Agenc
ies
ABSM
BS
PORTFOLIO RETURNS - Periods Ending 12/31/2020
Since
Inception
(3/1/15)
2020
Trailing
3 Yr
4th
Quarter
RCTC Operating Portfolio 0.12% 3.35% 3.00% 1.90%
ICE BofA 1-3 Year US Treasury Index 0.05% 3.10% 2.74% 1.67%
Periods over one year are annualized
Payden & Rygel • 333 South Grand Avenue • Los Angeles, California 90071 • (213) 625-1900 • www.payden.com93

Portfolio Review and Market Update - 4th Quarter 20202812
MARKET THEMES
The last quarter of 2020 was generally positive for fixed income credit, capping an unprecedented year. President-elect Joe Biden’s victory, coupled with advanced vaccine progress, buoyed investor sentiment. Passage of a $2.3 trillion year-end spending bill and stimulus package, the second largest in U.S. history, and continued accommodative monetary policy globally, as well as the last-minute Brexit trade agreement between the U.K. and the EU, further supported the positive tone. This optimism was tempered, however, by a surge in Covid-19 cases with increased hospitalizations and a return to global restrictions on movement. Nevertheless, market volatility declined, and U.S. stocks reached record highs.
STRATEGY
The portfolio continues to hold a diversified mix of non-government sectors for income generation. We continue to diversify our credit exposure through corporates, asset-backed securities (ABS) and mortgage-backed securities (MBS) to maintain different sources of high-quality income.
n
We took advantage of attractive opportunities in corporate new issuance to add to and rotate our corporate exposure.
n
We believe short-dated credit yields remain attractive relative to Treasuries.n
INTEREST RATES
The Federal Reserve reiterated its commitment to keeping the Fed Funds rate in the 0.00-0.25% range, firmly pinning front-end rates near zero. Officials pledged to continue purchasing financial assets - $80 billion in U.S. Treasuries and $40 billion in agency MBS per month - until they see "substantial further progress" in employment and inflation objectives. They also extended emergency liquidity programs for commercial paper and other key financial markets through March 31 to maintain confidence and liquidity in financial markets.
U.S. Treasury yields with maturities inside of two years fell slightly over the quarter, with the three-month bill down 0.03% to 0.06% and the two-year yield lower by 0.01% to 0.12%. Longer Treasury yields moved higher and the slope between two- and five-year maturities steepened 0.09% closing at 0.24%.
n
LIBOR remained relatively stable. One-month LIBOR fell 0.01% to 0.14% while three-month LIBOR increased 0.01% to 0.24%.
n
SECTORS
Credit markets continued to perform strongly in the fourth quarter, as yields reached all-time lows. We anticipate volatility to remain relatively muted due to the Fed’s commitment to its asset purchases, which are broadly supportive for credit markets. Corporate and securitized sectors contributed positively to performance.
Short-dated corporate yield premiums narrowed by 30 basis points to close the year largely unchanged, driven tighter due to various factors such as bonds being tendered for liability management, Fed support and continued investor appetite for incremental yield over Treasuries.
n
Asset-backed yield premiums continued to narrow and ended the year modestly tighter, with most of the move taking place in the fourth quarter.
n
Payden & Rygel • 333 South Grand Avenue • Los Angeles, California 90071 • (213) 625-1900 • www.payden.com94

LOS ANGELES 333 South Grand Avenue Los Angeles, California 90071 213 625-1900
BOSTON 265 Franklin StreetBoston, Massachusetts 02110617 807-1990
LONDON1 Bartholmew LaneLondon EC2N 2AX UK+44 (0) 20-7621-3000
MILANCorso Matteotti, 120121 Milan, Italy+39 02 76067111
OUR STRATEGIES
Multi-Sector
Short Maturity Bonds
U.S. Core Bond
Absolute Return Fixed Income
Strategic Income
Global Fixed Income
Liability Driven Investing
For more information about Payden & Rygel’s strategies, contact us at a location listed below.
PAYDEN.COM
LOS ANGELES | BOSTON | LONDON | MILAN
OVER 35 YEARS OF INSPIRING
C O N F I D E N C E W I T H A N
UNWAVERING COMMITMENT
TO OUR CLIENTS’ NEEDS.
Available in:
Separate Accounts – Mutual Funds (U.S. and UCITS)
Collective Trusts (“CITs”) – Customized Solutions
Sector-Specific
Emerging Markets Debt
Government/Sovereign
High Yield Bonds & Loans
Inflation-Linked/TIPS
Investment Grade Corporate Bonds
Municipal Bonds (U.S.)
Securitized Bonds
Income-Focused Equities
Equity Income
95

County of RiversideTreasurer-Tax Collector's Pooled
Investment Fund
December 2020
A T T A C H M E N T 1 9
96

Contents
COUNTY OF RIVERSIDE TREASURER-TAX COLLECTOR 1
2| Treasurer-Tax Collector’s Pooled Investment Fund
3| Economy
4| Market Data
6| Portfolio Data
8| Compliance Report
9| Month End Holdings
Chair Jerome Powell during FOMC Press Conference December 16 2020—https://www.youtube.com/watch?v=b6J2tkhu9VU
97

COUNTY OF RIVERSIDE TREASURER-TAX COLLECTOR 2
The Treasurer’s Pooled Investment Fund is comprised of contributions from the county,
schools, special districts, and other discretionary depositors throughout the County of Riverside.
The primary objective of the treasurer shall be to safeguard the principal of the funds under the
Treasurer's control, meet the liquidity needs of the depositor, and to maximize a return on the
funds within the given parameters.
The Treasurer-Tax Collector and the Capital Markets team are committed to maintaining
the highest credit ratings. The Treasurer’s Pooled Investment Fund is currently rated Aaa-bf by
Moody’s Investor Service and AAAf/S1 by Fitch Ratings, two of the nation’s most trusted bond
credit rating services.
Since its inception, the Treasurer’s Pooled Investment Fund has been in full compliance
with the Treasurer’s Statement of Investment Policy, which is more restrictive than California
Treasurer’s Statement Capital Markets Team
Matt Jennings
Treasurer-Tax Collector
Giovane Pizano
Assistant Treasurer
Steve Faeth
Senior Investment Manager
Isela Licea
Assistant Investment Manager
Treasurer-Tax Collector’s Pooled Investment Fund
6-Month Pool Performance
As 2020 came to an end, the wave of
negative news surrounding Covid-19 was
tempered by the positive vaccine news and
a new round of fiscal stimulus. Global equity
markets propelled higher while fixed rate
markets remained bound to zero. The Treas-
urer-Tax Collector’s Pooled Investment Fund
(TPIF) remains focused on our top priorities of
safekeeping assets and providing sufficient
liquidity to meet the needs of our depositors.
The TPIF ended the month with a balance of
$9.6 billion, a new milestone.
December saw the highest infection and
hospitalization rates in the pandemic. Con-
sumers began to pull back from high con-
tact activities, negatively affecting restau-
rants, bars, entertainment venues and in-
person shopping. While another full lock-
down like the one this past spring is unlikely,
the economic impact could be significant.
Initial Jobless Claims climbed from 700k in
November to the 800K in December; con-
firming the economic impact from the resur-
gence of Covid-19.
Retail sales missed expectations and fore-
shadowed the impending air pocket for the
consumption of Durable Goods, which will
also have implications for the rebound in
manufacturing. Every major category of
Durable Goods consumption, except gro-
ceries, declined in November with motor
vehicle spending down 3.6%, furnishings off
0.6%, recreational goods down .3%, other
durables off 2.2%, clothing down 3.9% and
gasoline down 2.3%
The U.S Food and Drug Administration
authorized the Pfizer-BioNTech and Moderna
Covid-19 vaccines. The vaccines were ap-
proved for use on December 11 and De-
cember 18th respectively, and lifted hopes
that an end date to the pandemic could be
reached in 2021.
On December 27, the President signed
into law the Consolidated Appropriations
Act, 2021. The new law is a $2.3 trillion
spending bill that combines $900 billion in
stimulus relief for the COVID-19 pandemic in
the United States with a $1.4 trillion omnibus
spending bill for the 2021 federal fiscal year.
On December 16th, the Federal Open
Market Committee (FOMC) held rates at
near-zero but messaged that it would not
begin reducing its asset purchase program
until “substantial further progress” has been
made in the economic recovery. The medi-
an expectation for real GDP in the U.S. is to
grow by 4.2% in 2021, compared to 4.0% as
projected in September. The FOMC’s medi-
an projection is for interest rates to remain in
the target range of 0% to 0.25% at least
through the end of 2023. However, five
members of the FOMC now see a case for
at least one rate hike by that point in time,
compared to just four in the September’s
forecast.
Housing remains a bright spot with starts
up 1.2% last month. Riverside County in par-
ticular has seen very strong housing activity
and price appreciation, with a year over
year increase of 17% for median single-
family residences. Most of the recent hous-
ing data showed builders and realtors strug-
gled to match supply with exceptionally
strong demand.
U.S. Treasury market yields were little
changed in December, with the 2-year yield
beginning the month at .15% and ending
at .12%. The 5-year yield began the month
at .36% and ended the month at .36%.
Matt Jennings
Treasurer-Tax Collector
Monthly Commentary More Stimulus…
98

COUNTY OF RIVERSIDE TREASURER-TAX COLLECTOR 3
Key Economic Indicators
Economy
Private Sector Average Hourly Earnings Y/Y
Nonfarm Payrolls Total M/M Change SA
Durable Goods Percent Chg. Y/Y
New Home Sales SAAR
99

COUNTY OF RIVERSIDE TREASURER-TAX COLLECTOR 4
U.S. Treasury Curve
The US Treasury Curve and its values are subject to frequent change and will be updated monthly with each issued TPIF
report.
Market Data
Fed Funds Target Rate (Upper Limit)
Federal Open Market Committee Meeting 12/16/2020
• The FOMC stated that the COVID-19 pandemic is causing tremendous human and economic hardship across the U.S.,
and will continue to weigh on economic activity, employment, and inflation in the near term, and poses considerable
risk to the economic outlook over the medium term.
• The FOMC maintained the Fed Funds Target Range of 0.0-0.25%
• The FOMC stated in their December statement that “it is committed to using its full range of tools to support the U.S.
economy in this challenging time, thereby promoting its maximum employment and price stability goals .”
100

* Values listed for commodities and stocks are in US dollars and are as of the final business day of each month.
COUNTY OF RIVERSIDE TREASURER-TAX COLLECTOR 5
U.S. Treasuries
Market Data cont’d
Commodities
Stocks
101

The County of Riverside’s Treasurer’s Pooled Investment Fund is currently rated AAA-bf by Moody’s Investor Service and
AAAf/S1 by Fitch Ratings.
Moody’s Asset Rating (000’s)
S&P Asset Rating (000’s)
COUNTY OF RIVERSIDE TREASURER-TAX COLLECTOR 6
Portfolio Data
Based on historic and current financial conditions within the County, the Pool is expected to maintain sufficient liquidity of
funds to cover County expenses for the next twelve months.
* Values listed in Cash Flow Table are in millions of USD.
12-Month Projected Cash Flow
Book MKT/Book % Book Yield
Aaa 8,526,683.58 100.17% 88.74% 0.34%
Aa 10,000.00 100.79% 0.10% 2.22%
Aa1 16,364.17 100.00% 0.17% 2.74%
Aa2 12,368.76 100.00% 0.13% 2.83%
Aa3 147,793.58 100.01% 1.54% 1.72%
NR 894,941.20 100.15% 9.31% 0.32%
Totals: 9,608,151.28 100.16% 100.00% 0.35%
Book MKT/Book % Book Yield
AAA 40,000.00 100.00% 0.42% 0.02%
AA+ 8,503,047.74 100.18% 88.50% 0.35%
AA 22,368.76 100.02% 0.23% 1.76%
AA- 147,793.58 100.01% 1.54% 1.72%
NR 894,941.20 100.15% 9.31% 0.32%
Totals: 9,608,151.28 100.16% 100.00% 0.35%
Month
Monthly
Receipts
Monthly
Disbursements Difference
Required
Matured
Investments Balance
Actual I
investments
Maturing
Available to
Invest > 1 Year
01/2021 60.57
01/2021 1,078.90 1,910.81 -831.91 771.34 - 2,120.53
02/2021 1,005.21 1,217.34 -212.13 212.13 - 1,000.00
03/2021 1,497.96 1,092.59 405.37 405.37 291.50
04/2021 2,103.36 1,289.52 813.84 1,219.21 226.17
05/2021 1,086.87 2,100.00 -1013.13 206.08 1,087.65
06/2021 1,044.31 1,802.91 -758.60 753.00 200.48 835.00
07/2021 1,034.19 1,472.64 -438.45 438.00 200.03 435.00
08/2021 965.41 1,004.62 -39.21 39.00 199.82 375.00
09/2021 1,146.18 1,214.91 -68.73 69.00 200.09 398.92
10/2021 1,249.55 1,343.18 -93.63 106.46 215.00
11/2021 1,371.49 1,197.65 173.84 280.30 10.00
12/2021 2,634.19 1,400.00 1234.19 1,514.49 13.50
TOTALS 16,217.62 17,046.17 (828.55) 2,282.47 4,592.90 7,008.27 7,325.68
23.76% 72.94% 76.24%
102

Asset Maturity Distribution (Par Value, 000’s)
Portfolio Data cont’d
TIMMI
The Treasurer’s Institutional Money Market Index (TIMMI) is a composite index of four AAA rated prime institutional money market funds.
Their average yield is compared to the yield of the Treasurer’s Pooled Investment Fund in the above graph.
Asset Allocation (000’s)
COUNTY OF RIVERSIDE TREASURER-TAX COLLECTOR 7
Assets (000's) Scheduled Par Scheduled Book Scheduled Market Mkt/Book Yield WAL(Yr) Mat(Yr) REPOS 315,000.00 315,000.00 315,000.00 100.00% 0.06% .011 .011
MMKT 40,000.00 40,000.00 40,000.00 100.00% 0.02% .003 .003
CALTRUST FND 4,015.94 4,023.98 4,023.98 100.00% 0.48% .003 .003
DDA/PASSBK 425,000.00 425,000.00 425,000.00 100.00% 0.15% .003 .003
US TREAS BILLS 3,930,000.00 3,928,109.18 3,928,922.10 100.02% 0.09% .341 .341
US TREAS BONDS 265,000.00 265,425.59 268,060.75 100.99% 0.85% 1.017 1.017
FHLMC BONDS 1,026,495.00 1,026,389.07 1,026,975.47 100.06% 0.57% .718 2.913
FNMA BONDS 764,251.00 764,832.78 768,335.79 100.46% 0.65% 1.427 3.343
FHLB DISC NOTES 533,766.00 533,574.49 533,696.52 100.02% 0.10% .157 .157
FHLB BONDS 694,925.00 694,559.47 697,315.99 100.40% 0.66% .592 1.131
FFCB DISC NOTES 150,000.00 149,855.28 149,960.00 100.07% 0.13% .275 .275
FFCB BONDS 825,203.00 825,029.39 829,318.18 100.52% 0.77% 1.136 2.109
FARMER MAC 155,000.00 154,941.20 155,824.15 100.57% 0.56% .630 .630
MUNI BONDS 115,525.00 115,059.15 115,059.15 100.00% 2.84% .660 .660
COMM PAPER 366,500.00 366,351.71 366,463.62 100.03% 0.12% .101 .101
Totals (000's): 9,610,680.94 9,608,151.28 9,623,955.69 100.16% 0.35% .533 1.043
103

Compliance Status: Full Compliance
The Treasurer’s Pooled Investment Fund was in full compliance with the County of Riverside’s Treasurer’s State-
ment of Investment Policy. The County’s Statement of Investment Policy is more restrictive than California Gov-
ernment Code 53646. The County’s Investment Policy is reviewed annually by the County of Riverside’s Over-
sight Committee and approved by the Board of Supervisors.
1 Money Market Mutual Funds maturity may be interpreted as a weighted average maturity not exceeding 60 days.
2 Or must have an investment advisor with no fewer than 5 years experience and with assets under management of $500,000,000 USD.
THIS COMPLETES THE REPORT REQUIREMENTS OF CALIFORNIA GOVERNMENT CODE 53646. COUNTY OF RIVERSIDE TREASURER-TAX COLLECTOR 8
Compliance Report
GOVERNMENT CODE COUNTY INVESTMENT POLICY
Investment Category
Maximum
Remaining
Maturity
Authorized %
Limit
S&P/
Moody's
Maximum
Remaining
Maturity
Authorized %
Limit
S&P/Moody's/
Fitch Actual %
MUNICIPAL BONDS (MUNI) 5 YEARS NO LIMIT NA 4 YEARS 15% AA-/Aa3/AA- 1.20%
U.S. TREASURIES 5 YEARS NO LIMIT NA 5 YEARS 100% NA 43.65%
LOCAL AGENCY
OBLIGATIONS (LAO) 5 YEARS NO LIMIT NA 3 YEARS 2.50%
INVESTMENT
GRADE 0.00%
FEDERAL AGENCIES 5 YEARS NO LIMIT AAA 5 YEARS 100% NA 43.18%
COMMERCIAL PAPER (CP) 270 DAYS 40% A1/P1 270 DAYS 40% A1/P1/F1 3.81%
CERTIFICATE & TIME DE-
POSITS (NCD & TCD) 5 YEARS 30% NA 1 YEAR
25%
Combined A1/P1/F1 0.0%
INT'L BANK FOR RECON-
STRUCTION AND DEVELOP-
MENT AND INT'L FINANCE
CORPORATION
NA NA NA 4 YEARS 20% AA/Aa/AA 0.00%
REPURCHASE
AGREEMENTS (REPO) 1 YEARS NO LIMIT NA 45 DAYS
40% max, 25%
in term repo
over 7 days
A1/P1/F1 3.28%
REVERSE REPOS 92 DAYS 20% NA 60 DAYS 10% NA 0.00%
MEDIUM TERM NOTES
(MTNO) 5 YEARS 30% A 3 YEARS 20% AA/Aa2/AA 0.00%
CALTRUST SHORT TERM
FUND NA NA NA
DAILY
LIQUIDITY 1.00% NA 0.04%
MONEY MARKET
MUTUAL FUNDS (MMF) 60 DAYS(1) 20% AAA/Aaa (2)
DAILY
LIQUIDITY 20%
AAA by 2 Of 3
RATINGS
AGC.
0.42%
LOCAL AGENCY
INVESTMENT FUND (LAIF) NA NA NA
DAILY
LIQUIDITY
Max
$50 million NA 0.00%
CASH/DEPOSIT AC-
COUNT NA NA NA NA NA NA 4.42%
104

Description Maturity
Date
Coupon Par
Value
Book
Value
Market
Price
Market
Value
Unrealized
Gain/Loss
JEFF BNY TRI-PARTY REPO 01/04/2021 .060 315,000,000.00 315,000,000.00 100.000000 315,000,000.00 0.00
.060 315,000,000.00 315,000,000.00 100.000000 315,000,000.00 0.00
FIDELITY GOV 01/01/2021 .010 1,000,000.00 1,000,000.00 100.000000 1,000,000.00 0.00
FEDERATED GOV 01/01/2021 .010 1,000,000.00 1,000,000.00 100.000000 1,000,000.00 0.00
WELLS FARGO GOV 01/01/2021 .025 1,000,000.00 1,000,000.00 100.000000 1,000,000.00 0.00
BLACKROCK GOV 01/01/2021 .020 36,000,000.00 36,000,000.00 100.000000 36,000,000.00 0.00
JP MORGAN 01/01/2021 .026 1,000,000.00 1,000,000.00 100.000000 1,000,000.00 0.00
.019 40,000,000.00 40,000,000.00 100.000000 40,000,000.00 0.00
CALTRUST SHT TERM FUND 01/01/2021 .495 4,015,944.14 4,023,976.03 100.200000 4,023,976.03 0.00
.495 4,015,944.14 4,023,976.03 100.200000 4,023,976.03 0.00
BANK OF THE WEST 01/01/2021 .150 425,000,000.00 425,000,000.00 100.000000 425,000,000.00 0.00
.150 425,000,000.00 425,000,000.00 100.000000 425,000,000.00 0.00
PACIFIC PREMIER BANK 01/01/2021 1.530 0.00 0.00 .000000 0.00 0.00
FIRST REPUBLIC BANK 01/01/2021 1.515 0.00 0.00 .000000 0.00 0.00
UB MANAGED RATE 01/01/2021 .030 0.00 0.00 .000000 0.00 0.00
.000 0.00 0.00 .000000 0.00 0.00
U.S. TREASURY BILL 02/25/2021 .172 50,000,000.00 49,935,211.11 99.990000 49,995,000.00 59,788.89
U.S. TREASURY BILL 02/25/2021 .167 50,000,000.00 49,938,070.83 99.990000 49,995,000.00 56,929.17
U.S. TREASURY BILL 02/25/2021 .180 50,000,000.00 49,935,000.00 99.990000 49,995,000.00 60,000.00
U.S. TREASURY BILL 02/25/2021 .178 50,000,000.00 49,937,381.94 99.990000 49,995,000.00 57,618.06
U.S. TREASURY BILL 05/20/2021 .140 50,000,000.00 49,939,722.22 99.969000 49,984,500.00 44,777.78
U.S. TREASURY BILL 06/17/2021 .128 50,000,000.00 49,945,458.33 99.962000 49,981,000.00 35,541.67
U.S. TREASURY BILL 01/12/2021 .100 35,000,000.00 34,985,902.78 99.999000 34,999,650.00 13,747.22
U.S. TREASURY BILL 05/20/2021 .108 50,000,000.00 49,959,650.00 99.969000 49,984,500.00 24,850.00
U.S. TREASURY BILL 01/26/2021 .115 35,000,000.00 34,982,781.94 99.997000 34,998,950.00 16,168.06
U.S. TREASURY BILL 05/20/2021 .107 50,000,000.00 49,962,725.00 99.969000 49,984,500.00 21,775.00
U.S. TREASURY BILL 06/17/2021 .115 50,000,000.00 49,955,437.50 99.962000 49,981,000.00 25,562.50
U.S. TREASURY BILL 02/18/2021 .110 50,000,000.00 49,975,511.11 99.992000 49,996,000.00 20,488.89
U.S. TREASURY BILL 02/25/2021 .111 50,000,000.00 49,974,254.17 99.990000 49,995,000.00 20,745.83
U.S. TREASURY BILL 04/22/2021 .110 50,000,000.00 49,966,388.89 99.976000 49,988,000.00 21,611.11
U.S. TREASURY BILL 01/21/2021 .110 50,000,000.00 49,980,444.44 99.998000 49,999,000.00 18,555.56
U.S. TREASURY BILL 01/21/2021 .110 50,000,000.00 49,980,444.44 99.998000 49,999,000.00 18,555.56
U.S. TREASURY BILL 05/20/2021 .093 50,000,000.00 49,970,965.28 99.969000 49,984,500.00 13,534.72
U.S. TREASURY BILL 06/17/2021 .098 30,000,000.00 29,979,931.25 99.962000 29,988,600.00 8,668.75
U.S. TREASURY BILL 05/20/2021 .093 50,000,000.00 49,971,970.83 99.969000 49,984,500.00 12,529.17
U.S. TREASURY BILL 01/26/2021 .100 50,000,000.00 49,985,833.33 99.997000 49,998,500.00 12,666.67
U.S. TREASURY BILL 01/12/2021 .090 25,000,000.00 24,994,812.50 99.999000 24,999,750.00 4,937.50
U.S. TREASURY BILL 02/18/2021 .100 25,000,000.00 24,991,666.67 99.992000 24,998,000.00 6,333.33
U.S. TREASURY BILL 02/04/2021 .096 30,000,000.00 29,991,643.75 99.995000 29,998,500.00 6,856.25
U.S. TREASURY BILL 02/09/2021 .093 50,000,000.00 49,986,437.50 99.996000 49,998,000.00 11,562.50
U.S. TREASURY BILL 01/19/2021 .081 25,000,000.00 24,995,275.00 99.998000 24,999,500.00 4,225.00
U.S. TREASURY BILL 01/14/2021 .083 25,000,000.00 24,995,504.17 99.999000 24,999,750.00 4,245.83
U.S. TREASURY BILL 02/09/2021 .093 25,000,000.00 24,993,319.44 99.996000 24,999,000.00 5,680.56
U.S. TREASURY BILL 01/19/2021 .081 50,000,000.00 49,990,775.00 99.998000 49,999,000.00 8,225.00
U.S. TREASURY BILL 01/28/2021 .088 50,000,000.00 49,988,940.97 99.996000 49,998,000.00 9,059.03
U.S. TREASURY BILL 02/02/2021 .087 50,000,000.00 49,988,400.00 99.994000 49,997,000.00 8,600.00
U.S. TREASURY BILL 02/11/2021 .090 50,000,000.00 49,986,860.42 99.994000 49,997,000.00 10,139.58
U.S. TREASURY BILL 08/12/2021 .096 50,000,000.00 49,962,400.00 99.947000 49,973,500.00 11,100.00
U.S. TREASURY BILL 07/15/2021 .088 50,000,000.00 49,969,375.00 99.955000 49,977,500.00 8,125.00
U.S. TREASURY BILL 02/23/2021 .095 50,000,000.00 49,986,145.83 99.991000 49,995,500.00 9,354.17
U.S. TREASURY BILL 01/05/2021 .086 30,000,000.00 29,996,454.17 100.000000 30,000,000.00 3,545.83
U.S. TREASURY BILL 05/20/2021 .100 50,000,000.00 49,974,722.00 99.969000 49,984,500.00 9,778.00
U.S. TREASURY BILL 05/20/2021 .085 30,000,000.00 29,987,108.33 99.969000 29,990,700.00 3,591.67
U.S. TREASURY BILL 01/12/2021 .059 25,000,000.00 24,997,846.88 99.999000 24,999,750.00 1,903.12
U.S. TREASURY BILL 01/19/2021 .071 30,000,000.00 29,996,686.67 99.998000 29,999,400.00 2,713.33
U.S. TREASURY BILL 09/09/2021 .092 50,000,000.00 49,963,200.00 99.940000 49,970,000.00 6,800.00
U.S. TREASURY BILL 05/27/2021 .088 50,000,000.00 49,978,368.06 99.969000 49,984,500.00 6,131.94
U.S. TREASURY BILL 01/07/2021 .070 100,000,000.00 99,992,611.11 100.000000 100,000,000.00 7,388.89
U.S. TREASURY BILL 01/26/2021 .073 150,000,000.00 149,982,662.50 99.997000 149,995,500.00 12,837.50
U.S. TREASURY BILL 10/07/2021 .101 100,000,000.00 99,913,458.33 99.931000 99,931,000.00 17,541.67
U.S. TREASURY BILL 05/04/2021 .086 50,000,000.00 49,981,950.00 99.972000 49,986,000.00 4,050.00
U.S. TREASURY BILL 03/16/2021 .085 50,000,000.00 49,987,840.28 99.986000 49,993,000.00 5,159.72
U.S. TREASURY BILL 06/03/2021 .092 50,000,000.00 49,977,379.17 99.966000 49,983,000.00 5,620.83
U.S. TREASURY BILL 05/27/2021 .087 50,000,000.00 49,979,337.50 99.969000 49,984,500.00 5,162.50
U.S. TREASURY BILL 09/09/2021 .085 100,000,000.00 99,934,833.33 99.940000 99,940,000.00 5,166.67
U.S. TREASURY BILL 05/11/2021 .090 50,000,000.00 49,980,536.11 99.971000 49,985,500.00 4,963.89
U.S. TREASURY BILL 06/03/2021 .085 25,000,000.00 24,989,552.08 99.966000 24,991,500.00 1,947.92
U.S. TREASURY BILL 05/04/2021 .085 25,000,000.00 24,991,322.92 99.972000 24,993,000.00 1,677.08
U.S. TREASURY BILL 05/11/2021 .087 25,000,000.00 24,990,695.83 99.971000 24,992,750.00 2,054.17
U.S. TREASURY BILL 06/03/2021 .085 40,000,000.00 39,983,244.00 99.966000 39,986,400.00 3,156.00
U.S. TREASURY BILL 08/12/2021 .074 150,000,000.00 149,924,662.50 99.947000 149,920,500.00 -4,162.50
U.S. TREASURY BILL 07/15/2021 .074 100,000,000.00 99,955,491.67 99.955000 99,955,000.00 -491.67
U.S. TREASURY BILL 02/09/2021 .075 50,000,000.00 49,994,166.50 99.996000 49,998,000.00 3,833.50
U.S. TREASURY BILL 07/15/2021 .075 100,000,000.00 99,956,191.67 99.955000 99,955,000.00 -1,191.67
U.S. TREASURY BILL 06/17/2021 .088 45,000,000.00 44,980,090.00 99.962000 44,982,900.00 2,810.00
U.S. TREASURY BILL 05/18/2021 .087 50,000,000.00 49,981,754.17 99.970000 49,985,000.00 3,245.83
U.S. TREASURY BILL 05/18/2021 .085 50,000,000.00 49,982,763.89 99.970000 49,985,000.00 2,236.11
U.S. TREASURY BILL 05/25/2021 .085 50,000,000.00 49,981,937.50 99.969000 49,984,500.00 2,562.50
U.S. TREASURY BILL 06/17/2021 .088 50,000,000.00 49,978,488.89 99.962000 49,981,000.00 2,511.11
U.S. TREASURY BILL 08/12/2021 .074 150,000,000.00 149,928,950.00 99.947000 149,920,500.00 -8,450.00
U.S. TREASURY BILL 07/15/2021 .071 50,000,000.00 49,980,025.00 99.955000 49,977,500.00 -2,525.00
U.S. TREASURY BILL 06/17/2021 .088 50,000,000.00 49,978,611.11 99.962000 49,981,000.00 2,388.89
U.S. TREASURY BILL 05/18/2021 .090 50,000,000.00 49,982,375.00 99.970000 49,985,000.00 2,625.00
U.S. TREASURY BILL 06/17/2021 .097 50,000,000.00 49,976,962.50 99.962000 49,981,000.00 4,037.50
U.S. TREASURY BILL 06/24/2021 .100 50,000,000.00 49,975,416.67 99.961000 49,980,500.00 5,083.33
U.S. TREASURY BILL 04/22/2021 .096 50,000,000.00 49,984,863.33 99.976000 49,988,000.00 3,136.67
U.S. TREASURY BILL 06/24/2021 .095 50,000,000.00 49,976,633.54 99.961000 49,980,500.00 3,866.46
U.S. TREASURY BILL 01/19/2021 .079 50,000,000.00 49,997,704.58 99.998000 49,999,000.00 1,295.42
U.S. TREASURY BILL 01/26/2021 .080 50,000,000.00 49,996,888.89 99.997000 49,998,500.00 1,611.11
U.S. TREASURY BILL 09/09/2021 .093 50,000,000.00 49,967,368.06 99.940000 49,970,000.00 2,631.94
1300: U.S. TREASURY BILL
9127964V8
912796F79
9127963H0
912796F95
1060: MMKT ACCTS-A/365-6
WFFXX
TFDXX
1170: MGD RATE-A/360
CASH
CASH
912796A66
912796A74
9127964C0
912796A41
912796F79
912796B32
912796A74
912796A82
CASH
912796UC1
912796B65
912796B73
912796A74
9127964D8
912796A82
912796A66
9127963W7
9127963H0
9127964L0
912796F95
912796G29
9127964L0
912796F95
912796B99
9127963S6
912796A82
912796A41
9127963V9
9127962Y4
912796A74
9127964B2
9127963T4
912796C80
.080 .071 .071
.093 .689 .690
.095 .479 .479
.079 .052 .052
.100 .479 .479
9127962Q1 .096 .306 .307
912796B32
.090 .377 .378
.097 .460 .460
.071 .536 .537
.088 .460 .460
.088 .460 .460
.074 .613 .614
.085 .378 .378
.085 .397 .397
.088 .460 .460
.087 .377 .378
.614
.075 .109 .110
.075 .536 .537
.339 .340
.085 .421 .422
.074 .536 .537
.074 .613
.087 .358 .359
.085 .689 .690
.085 .421 .422
.085
.091 .358 .359
.092 .421 .422
.087 .402 .403
.086 .339 .340
.085 .205 .205
.073 .071 .071
.101 .766 .767
.088 .402 .403
.070 .019 .019
.071 .052 .052
.092 .689 .690
.085 .383 .384
.059 .033 .033
.085 .014 .014
.100 .383 .384
.088 .536 .537
.090 .115
.095 .148 .148
.087 .090 .090
.115
.096 .613 .614
.081 .052 .052
.088 .077 .077
.083 .038 .038
.093 .109 .110
.093 .109 .110
.081 .052 .052
.100 .134 .134
.096 .096 .096
.100 .071 .071
.090 .033 .033
.098 .460 .460
.093 .383 .384
.110 .057 .058
.093 .383 .384
.110 .306 .307
.110 .057 .058
.110 .134 .134
.111 .153 .153
.383 .384
.115 .459 .460
9127962Y4
9127963H0
.107
.033 .033
.108 .383 .384
.115 .071 .071
.100
.153 .153
.140 .383 .384
.128 .459 .460
.178
.153 .153
.167 .153 .153
.180 .153 .153
.172
.000 .003
.000 .000 .000
.030
.000 .003
1.515 .000 .003
1.530
.003 .003.150
.150 .003 .003
.480 .003 .003
.480 .003 .003
.003 .003.026
.003 .003.019
.003 .003.025
.020 .003 .003
.003 .003
.010 .003 .003
.010
.011.060 .011
.060 .011 .011
Fund: 1 POOL FUND
1000: REPOS-A/360
Month End Portfolio Holdings
CUSIP
REPO
Yield
To Mat
Modified
Duration
Years To
Maturity
9127963H0
912796B73
9127962Y4
912796B73
912796A58
912796A33
9127963S6
9127963U1
912796XE4
9127962Y4
912796A82
9127963V9
9127962Q1
9127964D8
912796XE4
9127963H0
912796A66
912796XE4
9127962Y4
912796F87
912796XE4
9127962Y4
FRGXX
CLTR
912796A41
912796A33
9127963H0
9127964B2
9127963S6
9127964B2
GOFXX
OGVXX
1065: CLTR-A/365-6
1080: MGD RATE-A/365-6
CASH
9127962Y4
912796XE4
9127964L0
912796F87
9127963S6
9127963H0
COUNTY OF RIVERSIDE TREASURER-TAX COLLECTOR 9
105

Description Maturity
Date
Coupon Par
Value
Book
Value
Market
Price
Market
Value
Unrealized
Gain/Loss
Month End Portfolio Holdings
CUSIP Yield
To Mat
Modified
Duration
Years To
Maturity
U.S. TREASURY BILL 10/07/2021 .094 50,000,000.00 49,963,379.17 99.931000 49,965,500.00 2,120.83
.094 3,930,000,000.00 3,928,109,175.55 99.972573 3,928,922,100.00 812,924.45
U.S. TREASURY BOND 08/31/2021 1.500 25,000,000.00 24,906,250.00 100.922000 25,230,500.00 324,250.00
U.S. TREASURY BOND 08/31/2024 1.250 25,000,000.00 24,479,492.19 103.734000 25,933,500.00 1,454,007.81
U.S. TREASURY BOND 11/30/2024 1.500 25,000,000.00 24,705,078.13 104.863000 26,215,750.00 1,510,671.87
U.S. TREASURY BOND 01/15/2021 2.000 50,000,000.00 50,195,312.50 100.056000 50,028,000.00 -167,312.50
U.S. TREASURY BOND 06/30/2021 1.125 40,000,000.00 40,340,625.00 100.500000 40,200,000.00 -140,625.00
U.S. TREASURY BOND 04/30/2021 1.375 50,000,000.00 50,398,437.50 100.406000 50,203,000.00 -195,437.50
U.S. TREASURY BOND 06/30/2021 1.125 50,000,000.00 50,400,390.63 100.500000 50,250,000.00 -150,390.63
1.420 265,000,000.00 265,425,585.95 101.155000 268,060,750.00 2,635,164.05
FHLMC 5MoNc3Mo 05/10/2021 .091 25,000,000.00 25,000,000.00 99.990000 24,997,500.00 -2,500.00
.091 25,000,000.00 25,000,000.00 99.990000 24,997,500.00 -2,500.00
FHLMC 5YrNc3YrE 05/26/2023 3.000 15,000,000.00 15,000,000.00 101.118000 15,167,700.00 167,700.00
FHLMC 5YrNc2YrB 05/03/2024 2.600 10,000,000.00 10,000,000.00 100.712000 10,071,200.00 71,200.00
FHLMC 4.5YrNc1YrQ 07/22/2024 1.850 25,000,000.00 25,000,000.00 100.080000 25,020,000.00 20,000.00
FHLMC 5YrNc1YrB 02/18/2025 1.700 10,000,000.00 10,000,000.00 100.193000 10,019,300.00 19,300.00
FHLMC5YrNc1YrB 02/19/2025 1.800 5,785,000.00 5,785,000.00 100.154000 5,793,908.90 8,908.90
FHLMC 5YrNc1YrB 02/19/2025 1.770 5,000,000.00 5,000,000.00 100.192000 5,009,600.00 9,600.00
FHLMC 4YrNc1YrE 02/26/2024 1.600 10,000,000.00 9,998,000.00 100.174000 10,017,400.00 19,400.00
FHLMC 5YrNc1YrB 05/12/2025 .800 10,000,000.00 10,000,000.00 99.680000 9,968,000.00 -32,000.00
FLMC 3.25YrNc1YrB 08/18/2023 .450 10,000,000.00 10,000,000.00 100.035000 10,003,500.00 3,500.00
FHLMC 4YrNc1YrB 05/20/2024 .600 25,000,000.00 25,000,000.00 100.018000 25,004,500.00 4,500.00
FHLMC 5YrNc1YrQ 05/27/2025 .750 10,000,000.00 10,000,000.00 99.993000 9,999,300.00 -700.00
FHLMC 4YrNc1Q 05/28/2024 .600 15,000,000.00 15,000,000.00 100.018000 15,002,700.00 2,700.00
FHLMC 5YrNc1YrQ 05/28/2025 .730 10,000,000.00 10,000,000.00 100.020000 10,002,000.00 2,000.00
FHLMC 5YrNc1YrQ 05/28/2025 .730 5,000,000.00 5,000,000.00 100.020000 5,001,000.00 1,000.00
FHLMC 4YrNc2YrO 06/03/2024 .500 10,000,000.00 10,000,000.00 99.945000 9,994,500.00 -5,500.00
FHLMC 4.9YrNc11MoB 05/28/2025 .750 15,000,000.00 14,992,500.00 100.128000 15,019,200.00 26,700.00
FHLMC 5YrNc2YrB 06/09/2025 .650 15,000,000.00 15,000,000.00 100.524000 15,078,600.00 78,600.00
FHLMC 2.5YrNc1YrO 12/29/2022 .350 5,000,000.00 5,000,000.00 100.078000 5,003,900.00 3,900.00
FHLMC 5YrNc1YrQ 06/30/2025 .740 5,000,000.00 5,000,000.00 100.110000 5,005,500.00 5,500.00
FHLMC 4YrNc2YrO 07/01/2024 .500 5,000,000.00 5,000,000.00 99.993000 4,999,650.00 -350.00
FHLMC 4YrNc6MoB 07/08/2024 .625 20,000,000.00 20,000,000.00 100.004000 20,000,800.00 800.00
FHLMC 2YrNc6MoB 07/08/2022 .320 15,000,000.00 15,000,000.00 100.001000 15,000,150.00 150.00
FHLMC 2.5YrNc1YrB 01/13/2023 .320 15,000,000.00 15,000,000.00 100.006000 15,000,900.00 900.00
FHLMC 4YrNc1YrQ 07/15/2024 .570 5,000,000.00 5,000,000.00 100.051000 5,002,550.00 2,550.00
FHLMC 2YrNc1YrB 07/20/2022 .250 5,000,000.00 5,000,000.00 100.022000 5,001,100.00 1,100.00
FHLMC 2.5YrNc1YrB 10/20/2022 .320 15,000,000.00 15,000,000.00 100.085000 15,012,750.00 12,750.00
FHLMC 3.5YrNc1.5YrB 01/24/2024 .420 15,000,000.00 15,000,000.00 99.963000 14,994,450.00 -5,550.00
FHLMC 2YrNc1YrB 07/27/2022 .280 15,000,000.00 15,000,000.00 100.043000 15,006,450.00 6,450.00
FHLMC 2YrNc1YrB 07/28/2022 .250 5,000,000.00 5,000,000.00 100.027000 5,001,350.00 1,350.00
FHLMC 4YrNc6Mo 07/29/2024 .600 15,000,000.00 15,000,000.00 100.036000 15,005,400.00 5,400.00
FHLMC 4YrNc6MoB 07/29/2024 .600 15,000,000.00 15,000,000.00 100.036000 15,005,400.00 5,400.00
FHLMC 3.75YrNC9MB 04/29/2024 .500 15,000,000.00 15,000,000.00 100.008000 15,001,200.00 1,200.00
FHLMC 4YrNc6MoB 07/29/2024 .600 10,000,000.00 10,000,000.00 100.036000 10,003,600.00 3,600.00
FHLMC 3.5YrNc6MoB 01/29/2024 .500 15,000,000.00 15,000,000.00 100.003000 15,000,450.00 450.00
FHLMC 4YrNc6MoB 07/29/2024 .600 10,000,000.00 10,000,000.00 100.036000 10,003,600.00 3,600.00
FHLMC 4.5YrNc2YrB 01/29/2025 .510 15,000,000.00 15,000,000.00 99.645000 14,946,750.00 -53,250.00
FHLMC 3.5YrNc1YrB 02/12/2024 .375 20,000,000.00 20,000,000.00 99.862000 19,972,400.00 -27,600.00
FHLMC 5YrNc9MoQ 08/19/2025 .625 10,000,000.00 10,000,000.00 99.857000 9,985,700.00 -14,300.00
FHLMC 5YrNc3MoQ 08/19/2025 .700 10,000,000.00 10,000,000.00 100.086000 10,008,600.00 8,600.00
FHLMC 4YrNc1.5YrQ 09/10/2024 .400 10,000,000.00 10,000,000.00 99.768000 9,976,800.00 -23,200.00
FHLMC 4YrNc6MoQ 09/10/2024 .450 10,000,000.00 10,000,000.00 99.996000 9,999,600.00 -400.00
FHLMC 4YrNc1.5YrQ 09/10/2024 .400 10,000,000.00 10,000,000.00 99.768000 9,976,800.00 -23,200.00
FHLMC 4YrNc6MoQ 09/11/2024 .450 10,000,000.00 10,000,000.00 99.996000 9,999,600.00 -400.00
FHLMC 3YrNc1YrQ 09/14/2023 .320 10,000,000.00 10,000,000.00 100.005000 10,000,500.00 500.00
FHLMC 5YrNc2YrQ 09/15/2025 .540 10,000,000.00 10,000,000.00 99.619000 9,961,900.00 -38,100.00
FHLMC 5YrNc2YrQ 09/15/2025 .540 15,000,000.00 15,000,000.00 99.619000 14,942,850.00 -57,150.00
FHLMC 4.75YrNc2YrQ 06/16/2025 .500 5,000,000.00 5,000,000.00 99.675000 4,983,750.00 -16,250.00
FHLMC 4.5YrNc1YrQ 03/24/2025 .475 15,000,000.00 15,000,000.00 99.707000 14,956,050.00 -43,950.00
FHLMC 3.75YrNc1YrQ 06/24/2024 .410 10,000,000.00 10,000,000.00 99.961000 9,996,100.00 -3,900.00
FHLMC 5YrNC1.5YrB 03/28/2025 .500 10,000,000.00 10,000,000.00 99.699000 9,969,900.00 -30,100.00
FHLMC 5YrNC6mOB 09/30/2025 .600 5,000,000.00 5,000,000.00 99.657000 4,982,850.00 -17,150.00
FHLMC 3YrNc1YrQ 10/13/2023 .300 10,000,000.00 9,996,900.00 99.997000 9,999,700.00 2,800.00
FHLMC 3YrNC1YrB 10/13/2023 .300 10,000,000.00 10,000,000.00 99.978000 9,997,800.00 -2,200.00
FHLMC 5YrNC3MoB 10/27/2025 .625 10,000,000.00 10,000,000.00 99.736000 9,973,600.00 -26,400.00
FHLMC 5YrNc1YrQ 10/28/2025 .600 10,000,000.00 10,000,000.00 100.253000 10,025,300.00 25,300.00
FHLMC 5YrNc2YrQ 10/28/2025 .550 10,000,000.00 10,000,000.00 99.980000 9,998,000.00 -2,000.00
FHLMC 5Yr 09/23/2025 .375 10,000,000.00 9,941,100.00 99.834000 9,983,400.00 42,300.00
FHLMC 3Yr 11/06/2023 .250 10,000,000.00 9,991,000.00 100.085000 10,008,500.00 17,500.00
FHLMC 5YrNc1YrQ 11/12/2025 .600 5,000,000.00 5,000,000.00 100.265000 5,013,250.00 13,250.00
FHLMC 5YrNc1YrQ 11/12/2025 .600 5,000,000.00 5,000,000.00 100.265000 5,013,250.00 13,250.00
FHLMC 3YrNC2YrA 11/16/2023 .300 15,000,000.00 14,988,750.00 100.147000 15,022,050.00 33,300.00
FHLMC 5YrNC2YrA 11/17/2025 .560 5,000,000.00 5,000,000.00 100.062000 5,003,100.00 3,100.00
FHLMC 5YrNC2YrA 11/17/2025 .560 5,000,000.00 5,000,000.00 100.062000 5,003,100.00 3,100.00
FHLMC 2YrNc1YrQ 11/23/2022 .190 10,000,000.00 10,000,000.00 100.038000 10,003,800.00 3,800.00
FHLMC 3YrNc1YrQ 11/24/2023 .320 10,000,000.00 9,997,500.00 100.009000 10,000,900.00 3,400.00
FHLMC 2YrNc1YrQ 11/23/2022 .200 10,000,000.00 10,000,000.00 100.016000 10,001,600.00 1,600.00
FHLMC 2YrNc1YrQ 11/23/2022 .200 10,000,000.00 10,000,000.00 100.016000 10,001,600.00 1,600.00
FHLMC 3.5YrNc11MoQ 05/24/2024 .400 10,000,000.00 10,000,000.00 100.074000 10,007,400.00 7,400.00
FHLMC 3.5YrNc11MoQ 05/24/2024 .400 10,000,000.00 10,000,000.00 100.074000 10,007,400.00 7,400.00
FHLMC 2.5YrNC1YrB 06/01/2023 .250 10,000,000.00 9,997,500.00 100.020000 10,002,000.00 4,500.00
FHLMC 3YrNC11MoB 11/24/2023 .320 10,710,000.00 10,707,322.50 100.009000 10,710,963.90 3,641.40
FHLMC 2.5YrNC1YrB 06/01/2023 .250 10,000,000.00 9,995,000.00 100.020000 10,002,000.00 7,000.00
FHLMC 2.5YrNC1YrB 06/01/2023 .250 10,000,000.00 9,998,500.00 100.020000 10,002,000.00 3,500.00
FHLMC 3YrNc6MoQ 12/11/2023 .340 10,000,000.00 10,000,000.00 100.059000 10,005,900.00 5,900.00
FHLMC 2YrNc1YrQ 12/15/2022 .200 10,000,000.00 10,000,000.00 100.089000 10,008,900.00 8,900.00
FHLMC 2YrNC6MoB 12/30/2022 .200 10,000,000.00 10,000,000.00 99.990000 9,999,000.00 -1,000.00
FHLMC 2YrNC6MoB 12/30/2022 .200 10,000,000.00 10,000,000.00 99.990000 9,999,000.00 -1,000.00
FHLMC 5YrNC3MoB 12/30/2025 .700 10,000,000.00 10,000,000.00 100.009000 10,000,900.00 900.00
FHLMC 2.5YrNC1YrB 06/30/2023 .220 10,000,000.00 10,000,000.00 99.963000 9,996,300.00 -3,700.00
.614 851,495,000.00 851,389,072.50 100.020842 851,672,472.80 283,400.30
FHLMC 1.5Yr 09/23/2021 .410 25,000,000.00 25,000,000.00 100.203000 25,050,750.00 50,750.00
3134GW3Z7
3134GW3Y0
3137EAEZ8
3134GXBM5
1476: FHLMC-Var-SOFR-Q A/360
1310: U.S. TREASURY BOND
1410: FHLMC-Fxd-M 30/360
1425: FHLMC-Fxd-S 30/360
3134GWP91
3134GWDY9
3134GWL38
3134GXGQ1
3134GXJF2
3134GVHN1
3134GXCF9
3134GXHL1
3134GXEA8
3134GXEA8
3134GWAP1
3134GVWM
3134GWEF9
3134GWAL0
3134GVXL7
3134GV5J3
3134GWCM
3134GVB31
3134GV3A4
3134GV2S6
3134GWEF9
3134GVRV2
3134GVSJ8
3134GWEH5
3134GWP26
3137EAEX3
3134GV6H6
3134GWLU8
3134GWLW4
3134GWL79
3134GWN85
9128283Q1
3134GVVG0
912828YE4
912828S27
912828YC8
3134GVE95
3134GV2X5
3136G4XZ1
3134GWPK6
3134GWL79
3134GXEX8
3134GXHH0
.410 .726 .729
.618 3.320 3.372
.700 4.905 5.000
.220 2.494 2.496
.200 1.995 1.997
.200 1.995 1.997
.340 2.927 2.945
.200 1.951 1.956
.270 2.407 2.416
.256 2.407 2.416
.260 2.407 2.416
.328 2.881 2.899
.200 1.890 1.896
3.370 3.397
.400 3.370 3.397
.400
.190 1.890 1.896
.200 1.890 1.896
.328 2.881 2.899
.325 2.859 2.877
.560 4.802 4.882
4.825
.550 4.827
.560 4.802 4.882
.600 4.783 4.868
.497
4.751
.280 2.834 2.849
4.7324.675
3.482
.500 4.187 4.241
.600 4.783 4.868
.600
.310
4.744 4.827
.600 4.669 4.751
2.784
2.768 2.784
.300
.625 4.738
.400 3.657 3.696
.320 2.687
2.768
.540 4.633
.410 3.455
3.699
4.408 4.460
.475 4.178 4.230
4.710
.500
.540 4.633 4.710
.400 3.657 3.696
2.704
.450 3.655
.450 3.652 3.696
.625 4.550 4.636
.700 4.540 4.636
.510 4.022 4.082
.375 3.089 3.118
.500 3.044 3.079
.600 3.526 3.578
.500 3.297 3.329
.600 3.526 3.578
.600 3.526 3.578
.250 1.569 1.573
.600
1.795 1.803
.420 3.036 3.066
3.526 3.578
1.566 1.570.280
3.540
.320 1.512
.250 1.547 1.551
.320
.625 3.465 3.521
1.518
.320 2.022 2.036
.570 3.489
.740 4.418 4.499
.500 3.459 3.501
4.325 4.408
.650 4.367 4.441
.350 1.986 1.995
.760
.730 4.328 4.408
.500 3.388 3.425
.600 3.367 3.408
.730 4.328 4.408
.600 3.345 3.386
.750 4.323 4.405
.800 4.276 4.364
.450 2.608 2.630
1.770 3.944 4.140
3134GVCP1 1.605 3.046 3.156
3136G4UG6
1.700 3.948 4.137
1.800 3.941 4.140
2.600 3.166 3.340
1.850 3.401 3.559
3.000 2.296 2.400
.091 .358 .356
.091 .358 .356
3134GXHR8
.861 1.011 1.037
.121 .328 .329
912828S27 .125 .495 .496
912828Q78
1.605 .041 .041
.123 .495 .496
1.702 3.550 3.668
1.751 3.780 3.918
1.711 .657 .666
.094 .766 .767
.094 .340 .341
9127964V8
3134GXEX8
3134GWEF9
3134GXCF9
3134GXJF2
3134GWBX3
912828YV6
3134GXEX8
3134GVWM
3134GVCZ9
3134GV6B9
3134GV5R5
3134GSMF9
3134GWET9
3134GVZF8
3134GXCA0
3134GWEF9
3134GWN44
3134GWP42
3134GWL38
3134GWY42
3134GXFZ2
3134GXBM5
3134GW3X2
3134GWZB5
3134GWR32
3134GWTG1
3134GWT22
3134GTKG7
3134GVCR7
3134GU4E7
3134GVYX0
3134GXBL7
3135GA2Z3
3134GXDG6
3135GA2Z3
3134GXCA0
COUNTY OF RIVERSIDE TREASURER-TAX COLLECTOR 10
106

Description Maturity
Date
Coupon Par
Value
Book
Value
Market
Price
Market
Value
Unrealized
Gain/Loss
Month End Portfolio Holdings
CUSIP Yield
To Mat
Modified
Duration
Years To
Maturity
FHLMC 1.5Yr 09/23/2021 .410 25,000,000.00 25,000,000.00 100.203000 25,050,750.00 50,750.00
FHLMC 1.5Yr 09/23/2021 .410 25,000,000.00 25,000,000.00 100.203000 25,050,750.00 50,750.00
FHLMC 1.5Yr 09/23/2021 .410 25,000,000.00 25,000,000.00 100.203000 25,050,750.00 50,750.00
FHLMC 1.5Yr 09/23/2021 .410 25,000,000.00 25,000,000.00 100.203000 25,050,750.00 50,750.00
FHLMC 1.5Yr 09/30/2021 .410 25,000,000.00 25,000,000.00 100.207000 25,051,750.00 51,750.00
.410 150,000,000.00 150,000,000.00 100.203667 150,305,500.00 305,500.00
FNMA 4.83Yr 10/05/2022 2.000 15,000,000.00 14,782,200.00 103.263000 15,489,450.00 707,250.00
FNMA 5Yr 01/19/2023 2.375 10,000,000.00 9,944,100.00 104.580000 10,458,000.00 513,900.00
FNMA 4.41Yr 09/12/2023 2.875 30,000,000.00 30,670,500.00 107.150000 32,145,000.00 1,474,500.00
FNMA 5YrNc1YrB 02/19/2025 1.770 5,000,000.00 5,000,000.00 100.192000 5,009,600.00 9,600.00
FNMA 4.83Yr 01/07/2025 1.625 10,000,000.00 10,247,300.00 105.377000 10,537,700.00 290,400.00
FNMA 5YrNC1YrB 06/24/2025 .820 10,000,000.00 10,000,000.00 100.112000 10,011,200.00 11,200.00
FNMA 5YrNc2YrQ 06/30/2025 .650 5,000,000.00 5,000,000.00 100.011000 5,000,550.00 550.00
FNMA 5YrNc1Yr 06/30/2025 .700 10,000,000.00 10,000,000.00 100.083000 10,008,300.00 8,300.00
FNMA 5YrNc1YrQ 06/30/2025 .800 10,000,000.00 10,000,000.00 100.051000 10,005,100.00 5,100.00
FNMA 5YrNc1YrQ 07/07/2025 .740 14,900,000.00 14,900,000.00 100.022000 14,903,278.00 3,278.00
FNMA 3YrNC1YrB 07/07/2023 .420 15,000,000.00 15,000,000.00 99.983000 14,997,450.00 -2,550.00
FNMA 3YrNC1YrB 01/13/2023 .420 20,000,000.00 19,994,000.00 99.986000 19,997,200.00 3,200.00
FNMA 5YrNc1YrQ 07/15/2025 .730 15,000,000.00 15,000,000.00 100.009000 15,001,350.00 1,350.00
FNMA 3.75YrNc1YrB 04/22/2024 .500 15,000,000.00 15,000,000.00 99.606000 14,940,900.00 -59,100.00
FNMA 3YrNc1YrB 07/27/2023 .420 15,000,000.00 15,000,000.00 100.134000 15,020,100.00 20,100.00
FNMA 3YrNc1YrB 07/27/2023 .420 15,000,000.00 15,000,000.00 100.134000 15,020,100.00 20,100.00
FNMA 5YrNc1YrB 07/29/2025 .700 15,000,000.00 15,000,000.00 100.096000 15,014,400.00 14,400.00
FNMA 3.75YrNc1YrB 04/22/2024 .500 10,000,000.00 10,000,000.00 99.606000 9,960,600.00 -39,400.00
FNMA 5YrNc2YrB 07/29/2025 .600 10,000,000.00 10,000,000.00 100.109000 10,010,900.00 10,900.00
FNMA 5YrNc2YrB 07/29/2025 .600 10,000,000.00 10,000,000.00 100.109000 10,010,900.00 10,900.00
FNMA 4YrNc1YrB 07/30/2024 .520 9,400,000.00 9,400,000.00 99.854000 9,386,276.00 -13,724.00
FNMA 4YrNc1YrB 07/30/2024 .520 10,000,000.00 10,000,000.00 99.854000 9,985,400.00 -14,600.00
FNMA 4YrNc1YrB 07/30/2024 .520 10,100,000.00 10,100,000.00 99.854000 10,085,254.00 -14,746.00
FNMA 5YrNc1YrB 08/04/2025 .700 10,000,000.00 10,000,000.00 100.099000 10,009,900.00 9,900.00
FNMA 5YrNc1YrB 08/04/2025 .700 15,000,000.00 15,000,000.00 100.099000 15,014,850.00 14,850.00
FNMA 4YrNc2YrB 08/12/2024 .410 15,000,000.00 15,000,000.00 100.002000 15,000,300.00 300.00
FNMA 3YrNC1.5YrB 08/17/2023 .310 15,000,000.00 15,000,000.00 99.899000 14,984,850.00 -15,150.00
FNMA 5YrNc2Yr 08/19/2025 .550 15,000,000.00 15,000,000.00 99.745000 14,961,750.00 -38,250.00
FNMA 5YrNc1YrQ 08/27/2025 .650 8,650,000.00 8,650,000.00 100.008000 8,650,692.00 692.00
FNMA 5YrNc1YrQ 08/27/2025 .625 5,000,000.00 5,000,000.00 100.022000 5,001,100.00 1,100.00
FNMA 3.5YrNc1.5YrQ 02/28/2024 .375 10,000,000.00 10,000,000.00 100.141000 10,014,100.00 14,100.00
FNMA 4.9YrNc11MoQ 08/26/2025 .600 10,000,000.00 10,000,000.00 100.045000 10,004,500.00 4,500.00
FNMA 3.9YrNc1.9YrQ 08/19/2024 .450 3,701,000.00 3,701,000.00 99.962000 3,699,593.62 -1,406.38
FNMA 4YrNc2Yr 09/16/2024 .400 10,000,000.00 10,000,000.00 99.678000 9,967,800.00 -32,200.00
FNMA 3.5YrNC2YrA 03/28/2024 .320 10,000,000.00 10,000,000.00 99.758000 9,975,800.00 -24,200.00
FNMA 5YrNC1YrB 10/20/2025 .580 10,000,000.00 10,000,000.00 100.016000 10,001,600.00 1,600.00
FNMA 5YrNC2YrA 10/27/2025 .540 10,000,000.00 10,000,000.00 100.040000 10,004,000.00 4,000.00
FNMA 5YrNc2YrA 10/28/2025 .560 5,000,000.00 5,000,000.00 99.995000 4,999,750.00 -250.00
FNMA 5YrNc1YrQ 10/29/2025 .600 5,000,000.00 5,000,000.00 100.057000 5,002,850.00 2,850.00
FNMA 5YrNc1YrQ 10/29/2025 .600 10,000,000.00 10,000,000.00 100.057000 10,005,700.00 5,700.00
FNMA 5YrNc1YrQ 10/29/2025 .600 10,000,000.00 9,998,000.00 100.057000 10,005,700.00 7,700.00
FNMA 5YrNc2YrA 11/04/2025 .550 10,000,000.00 10,000,000.00 100.062000 10,006,200.00 6,200.00
FNMA 4.9YrNc11MoQ 10/20/2025 .580 10,000,000.00 9,996,500.00 100.016000 10,001,600.00 5,100.00
FNMA 3.5YrNc2YrQ 05/03/2024 .350 3,500,000.00 3,499,300.00 99.978000 3,499,230.00 -70.00
FNMA 5Yr 11/07/2025 .500 14,000,000.00 13,949,880.00 100.418000 14,058,520.00 108,640.00
FNMA 3YrNC2YrB 11/16/2023 .300 10,000,000.00 10,000,000.00 100.089000 10,008,900.00 8,900.00
FNMA 3.5YrNc2YrQ 05/17/2024 .350 10,000,000.00 10,000,000.00 100.072000 10,007,200.00 7,200.00
FNMA 3.5YrNc2YrQ 05/17/2024 .350 10,000,000.00 10,000,000.00 100.072000 10,007,200.00 7,200.00
FNMA 5YrNc2YrA 11/17/2025 .560 10,000,000.00 10,000,000.00 100.062000 10,006,200.00 6,200.00
FNMA 4YrNC2YrB 11/18/2024 .420 10,000,000.00 10,000,000.00 100.010000 10,001,000.00 1,000.00
FNMA 5YrNC2YrA 11/18/2025 .650 20,000,000.00 20,000,000.00 100.529000 20,105,800.00 105,800.00
FNMA 3.25YrNc2YrA 02/23/2024 .350 20,000,000.00 20,000,000.00 99.983000 19,996,600.00 -3,400.00
FNMA 3.75YrNc2YrA 08/23/2024 .420 15,000,000.00 15,000,000.00 100.064000 15,009,600.00 9,600.00
FNMA 5YrNc2YrA 11/25/2025 .600 15,000,000.00 15,000,000.00 100.084000 15,012,600.00 12,600.00
FNMA 2.9YrNc2YrQ 11/16/2023 .310 5,000,000.00 5,000,000.00 100.110000 5,005,500.00 5,500.00
FNMA 4.5YrNc1.5YrB 06/24/2025 .500 10,000,000.00 10,000,000.00 100.038000 10,003,800.00 3,800.00
.728 639,251,000.00 639,832,780.00 100.591754 643,033,793.62 3,201,013.62
FNMA 1.5Yr 09/16/2021 .250 25,000,000.00 25,000,000.00 100.099000 25,024,750.00 24,750.00
FNMA 1Yr 03/16/2021 .210 25,000,000.00 25,000,000.00 100.019000 25,004,750.00 4,750.00
FNMA 2Yr 03/16/2022 .310 25,000,000.00 25,000,000.00 100.230000 25,057,500.00 57,500.00
FNMA 2Yr 04/07/2022 .440 25,000,000.00 25,000,000.00 100.407000 25,101,750.00 101,750.00
FNMA 2Yr 04/15/2022 .480 25,000,000.00 25,000,000.00 100.453000 25,113,250.00 113,250.00
.338 125,000,000.00 125,000,000.00 100.241600 125,302,000.00 302,000.00
FHLB DISC NTE 02/16/2021 .165 50,000,000.00 49,945,687.50 99.990000 49,995,000.00 49,312.50
FHLB DISC NTE 01/13/2021 .140 23,766,000.00 23,749,363.80 99.998000 23,765,524.68 16,160.88
FHLB DISC NTE 03/17/2021 .110 50,000,000.00 49,972,347.22 99.982000 49,991,000.00 18,652.78
FHLB DISC NTE 01/29/2021 .090 75,000,000.00 74,983,687.50 99.995000 74,996,250.00 12,562.50
FHLB DISC NTE 02/05/2021 .090 50,000,000.00 49,988,625.00 99.993000 49,996,500.00 7,875.00
FHLB DISC NTE 02/10/2021 .092 50,000,000.00 49,988,500.00 99.992000 49,996,000.00 7,500.00
FHLB DISC NTE 03/12/2021 .085 50,000,000.00 49,988,194.44 99.983000 49,991,500.00 3,305.56
FHLB DISC NTE 06/09/2021 .090 30,000,000.00 29,986,350.00 99.957000 29,987,100.00 750.00
FHLB DISC NTE 06/09/2021 .090 25,000,000.00 24,988,625.00 99.957000 24,989,250.00 625.00
FHLB DISC NTE 02/22/2021 .075 25,000,000.00 24,996,197.92 99.989000 24,997,250.00 1,052.08
FHLB DISC NTE 02/17/2021 .075 25,000,000.00 24,996,458.33 99.990000 24,997,500.00 1,041.67
FHLB DISC NTE 02/05/2021 .072 55,000,000.00 54,993,840.00 99.993000 54,996,150.00 2,310.00
FHLB DISC NTE 02/17/2021 .075 25,000,000.00 24,996,614.58 99.990000 24,997,500.00 885.42
.097 533,766,000.00 533,574,491.29 99.986984 533,696,524.68 122,033.39
FHLB 5Yr 04/05/2021 1.375 5,000,000.00 4,996,350.00 100.338000 5,016,900.00 20,550.00
FHLB 4.5 Yr 06/10/2022 2.125 7,975,000.00 7,955,620.75 102.886000 8,205,158.50 249,537.75
FHLB 3Yr 01/25/2021 2.200 15,000,000.00 14,994,900.00 100.125000 15,018,750.00 23,850.00
FHLB 3Yr 03/12/2021 2.375 10,000,000.00 9,968,000.00 100.431000 10,043,100.00 75,100.00
FHLB 3Yr 03/12/2021 2.375 10,000,000.00 9,966,500.00 100.431000 10,043,100.00 76,600.00
FHLB 4.08Yr 03/11/2022 2.500 10,000,000.00 9,954,700.00 102.830000 10,283,000.00 328,300.00
FHLB 4.9Yr 03/10/2023 2.125 11,750,000.00 11,432,397.50 104.323000 12,257,952.50 825,555.00
FHLB 3Yr 05/07/2021 2.700 7,650,000.00 7,644,492.00 100.907000 7,719,385.50 74,893.50
FHLB 3Yr 05/07/2021 2.700 10,000,000.00 9,999,100.00 100.907000 10,090,700.00 91,600.00
FHLB 2.91Yr 03/11/2022 2.500 30,000,000.00 30,158,100.00 102.830000 30,849,000.00 690,900.00
3130A7PV1
313379Q69
1525: FNMA-Fxd-S 30/360
3136G4J38
3136G4K51
3136G4P31
3136G43H4
313378WG2
3130ADFW7
313385CE4
3135GA5A5
313385DD5
3130AE6U9
1576: FNMA-Var-SOFR-Q A/360
1700: FHLB-DISC NOTE
3135GA2Z3
3135GA4P3
3135G03B7
3135GA3Z2
3135GA2N0
3135G06A6
3134GVHN1
3135G0T94
3135G0U43
3136G4D75
3134GVHV3
3134GVHN1
3134GVHN1
3136G4ZC0
3135G0T78
3136G4H63
3135GA4R9
3136G4Q97
3136G43W1
3135G06A6
3135G06C2
3136G46S7
3136G46N8
3135GA3C3
3136G45C3
3135G06G3
3135GA3C3
3135G06E8
3135GAAZ4
3135G03J0
3135GA3N9
3136G42F9
3136G4B77
3135G06F5
1.163
1.161
.097 .156
.036
.110
.090 .079
.208
.131
.194
1.192
2.189
2.725 .343 .348
2.703 .343 .348
1.1922.619
2.484 .192 .195
2.212 .068
2.489 .192 .195
1.441
.068
2.182 1.411
.157
1.390 .258
.075 .131 .132
.260
.072 .098
.132
.090 .438 .438
.075 .145 .145
.195
.090 .438 .438
.099
.079
.092 .112 .112
.090 .098 .099
1.288
.208
.338 .932 .935
.165 .128 .129
.036
1.199 1.205
.440 1.262 1.266
1.283
.250 .706 .710
.210 .205 .205
2.859 2.877
.500 4.425 4.482
.714 3.743 3.808
.310
3.121 3.148
.420 3.611 3.647
.600 4.819 4.904
.350
3.843 3.885
.650 4.793 4.885
.420
3.378
.350 3.354 3.378
.560 4.802 4.882
.350 3.354
3.340
.573 4.781 4.855
.300 2.860 2.877
.356 3.315
4.830
.550 4.767 4.847
.587 4.724 4.805
.604 4.747
4.749 4.827
.600 4.747 4.830
.600 4.747 4.830
.560
3.220 3.241
.400
4.725 4.805
.540 4.749 4.825
.580
.320
4.572 4.655
.450 3.594 3.636
3.673 3.712
.600
4.568 4.658
.625 4.572 4.658
.375 3.147 3.162
.650
3.535
2.627
4.498 4.595
.700
.550 4.560 4.636
.310 2.612
3.535 3.581
.410 3.578 3.616
4.5954.498
.520
3.581
.600
3.278 3.310
4.498
.600
4.578
.520
4.498 4.578
3.278 3.310
2.570
.420 2.551
.500
.700 4.484 4.578
.420
.700 4.422
.432 2.019 2.036
2.570
.730 4.442 4.540
.500
4.418 4.518
.420 2.496 2.515
.740
4.499
.800 4.411 4.499
4.482
.650 4.428 4.499
.820 4.390
4.140
1.094 3.856 4.022
1.770 3.944
2.052
2.333 2.564 2.699
2.495 1.967
.410 .730 .732
2.322 1.712 1.762
.410 .726 .729
.410 .749 .748
.410 .726 .729
.410 .726 .729
.410 .726 .729
2.551
3.535
.700
.520
2.716 2.111
2.308
3.581
.310
.085
.075
.480
.140
313385BM7
313385BS4
313385GR1
313385GR1
3136G4WN9
3136G4ZC0
3134GVHN1
3136G4XK4
3135G0X24
3136G4XU2
3136G4B28
3136G4WH2
3136G4YJ6
3136G4C27
3130A0XD7
3130AE6U9
3135G05H2
3136G4YU1
3136G4F32
3135G02K8
313378WG2
313382AX1
3136G4XR9
3136G4UG6
3135G06C2
3135GA2P5
3136G4Z97
3136G4X40
3136G4B51
313385CY0
313385BZ8
3130A0XD7
3136G4B28
3136G4B77
3136G4B51
3136G4B28
3135G02H5
3135G02F9
313385BY1
313385AN6
313385BE5
313385BZ8
313385BM7
1725: FHLB-Fxd-S 30/360
COUNTY OF RIVERSIDE TREASURER-TAX COLLECTOR 11
107

Description Maturity
Date
Coupon Par
Value
Book
Value
Market
Price
Market
Value
Unrealized
Gain/Loss
Month End Portfolio Holdings
CUSIP Yield
To Mat
Modified
Duration
Years To
Maturity
FHLB 5YrNc2YrQ 10/29/2024 1.800 25,000,000.00 25,000,000.00 100.863000 25,215,750.00 215,750.00
FHLB 5YrNc1Yr 02/12/2025 1.750 7,250,000.00 7,250,000.00 100.109000 7,257,902.50 7,902.50
FHLB 5YrNc1YrA 03/24/2025 1.300 10,000,000.00 10,000,000.00 100.149000 10,014,900.00 14,900.00
FHLB 4YrNc1Yr 03/25/2024 1.550 10,300,000.00 10,300,000.00 100.212000 10,321,836.00 21,836.00
FHLB 7Mo 01/29/2021 .160 50,000,000.00 49,996,250.00 100.003000 50,001,500.00 5,250.00
FHLB 9Mo 06/04/2021 .120 50,000,000.00 49,999,500.00 99.999000 49,999,500.00 0.00
FHLB 9Mo 06/08/2021 .120 50,000,000.00 49,999,500.00 99.999000 49,999,500.00 0.00
FHLB 4.25YrNc3MoA 12/09/2024 .500 10,000,000.00 10,000,000.00 100.000000 10,000,000.00 0.00
FHLB 10Mo 07/16/2021 .115 25,000,000.00 25,000,000.00 99.998000 24,999,500.00 -500.00
FHLB 9Mo 07/15/2021 .120 50,000,000.00 50,000,000.00 100.006000 50,003,000.00 3,000.00
FHLB 2 Yr 10/21/2022 .125 10,000,000.00 9,989,900.00 100.000000 10,000,000.00 10,100.00
FHLB 8Mo 07/21/2021 .110 50,000,000.00 50,000,000.00 100.004000 50,002,000.00 2,000.00
FHLB 6Mo 05/10/2021 .110 50,000,000.00 50,000,000.00 100.003000 50,001,500.00 1,500.00
FHLB 3YrNc1YrA 12/22/2023 .190 15,000,000.00 14,979,900.00 99.845000 14,976,750.00 -3,150.00
FHLB 3YrNc6MoB 12/28/2023 .250 10,000,000.00 10,000,000.00 100.005000 10,000,500.00 500.00
FHLB 3.25YrNc6MoA 03/28/2024 .270 15,000,000.00 15,000,000.00 99.961000 14,994,150.00 -5,850.00
FHLB 3.5YrNc1YrB 06/28/2024 .260 15,000,000.00 15,000,000.00 100.032000 15,004,800.00 4,800.00
FHLB 3.5YrNc1YrB 06/28/2024 .260 10,000,000.00 10,000,000.00 100.032000 10,003,200.00 3,200.00
FHLB 3.25YrNc6MoA 03/28/2024 .270 15,000,000.00 14,995,500.00 99.961000 14,994,150.00 -1,350.00
.722 594,925,000.00 594,580,710.25 100.402149 597,317,485.00 2,736,774.75
FHLB 1.16Yr 05/03/2021 .138 25,000,000.00 24,978,764.50 100.018000 25,004,500.00 25,735.50
.138 25,000,000.00 24,978,764.50 100.018000 25,004,500.00 25,735.50
FHLB 1.25Yr 05/26/2021 .142 75,000,000.00 75,000,000.00 99.992000 74,994,000.00 -6,000.00
.142 75,000,000.00 75,000,000.00 99.992000 74,994,000.00 -6,000.00
FFCB DISC NOTE 05/14/2021 .150 50,000,000.00 49,937,291.67 99.964000 49,982,000.00 44,708.33
FFCB DISC NOTE 01/06/2021 .130 50,000,000.00 49,969,486.11 100.000000 50,000,000.00 30,513.89
FFCB DISC NOTE 06/10/2021 .120 50,000,000.00 49,948,500.00 99.956000 49,978,000.00 29,500.00
.133 150,000,000.00 149,855,277.78 99.973333 149,960,000.00 104,722.22
FFCB 4Yr 01/12/2022 2.200 10,000,000.00 9,938,000.00 102.124000 10,212,400.00 274,400.00
FFCB 3Yr 03/01/2021 2.500 10,000,000.00 9,999,700.00 100.398000 10,039,800.00 40,100.00
FFCB 2.8Yr 02/12/2021 2.350 15,000,000.00 14,948,670.00 100.240000 15,036,000.00 87,330.00
FFCB 5Yr 04/11/2023 2.700 10,000,000.00 9,990,300.00 105.680000 10,568,000.00 577,700.00
FFCB 3Yr 05/10/2021 2.700 10,000,000.00 9,986,600.00 100.945000 10,094,500.00 107,900.00
FFCB 5Yr 10/02/2023 3.050 10,000,000.00 9,979,300.00 107.703000 10,770,300.00 791,000.00
FFCB 2.9Yr 11/15/2021 3.050 10,000,000.00 10,035,700.00 102.557000 10,255,700.00 220,000.00
FFCB 5YrNc2YrA 06/21/2024 2.220 10,000,000.00 10,000,000.00 100.792000 10,079,200.00 79,200.00
FFCB 3Yr 09/06/2022 1.500 14,435,000.00 14,422,874.60 102.277000 14,763,684.95 340,810.35
FFCB 5YrNc2YrA 10/28/2024 1.820 10,000,000.00 10,000,000.00 101.051000 10,105,100.00 105,100.00
FFCB 4.9Yr 09/17/2024 1.600 6,128,000.00 6,107,471.20 105.064000 6,438,321.92 330,850.72
FFCB 4.9Yr 09/10/2024 2.080 2,064,000.00 2,101,585.44 106.575000 2,199,708.00 98,122.56
FFCB 3YrNc1YrA 02/10/2023 1.600 10,000,000.00 10,000,000.00 100.136000 10,013,600.00 13,600.00
FFCB 3YrNc1YrA 02/10/2023 1.600 10,000,000.00 10,000,000.00 100.136000 10,013,600.00 13,600.00
FFCB 4YrNc1YrC 02/12/2024 1.690 5,000,000.00 5,000,000.00 100.164000 5,008,200.00 8,200.00
FFCB 3YrNc1YrA 02/10/2023 1.600 15,000,000.00 15,000,000.00 100.136000 15,020,400.00 20,400.00
FFCB 3.5YrNc1YrA 08/18/2023 1.640 10,000,000.00 10,000,000.00 100.190000 10,019,000.00 19,000.00
FFCB 4YrNc2YrA 02/28/2024 1.550 5,000,000.00 5,000,000.00 101.311000 5,065,550.00 65,550.00
FFCB 5YrNc1YrA 03/03/2025 1.640 10,000,000.00 10,000,000.00 100.215000 10,021,500.00 21,500.00
FFCB 5YrNc1YrA 03/17/2025 1.125 10,000,000.00 10,000,000.00 100.138000 10,013,800.00 13,800.00
FFCB 2YrNc1YrA 03/30/2022 1.000 25,000,000.00 25,000,000.00 100.145000 25,036,250.00 36,250.00
FFCB 2YrNc1YrA 03/30/2022 1.000 25,000,000.00 25,000,000.00 100.145000 25,036,250.00 36,250.00
FFCB 4YrNc1YrA 04/22/2024 .800 12,000,000.00 12,000,000.00 100.175000 12,021,000.00 21,000.00
FFCB 5YrNc2YrA 06/10/2025 .680 5,025,000.00 5,025,000.00 100.139000 5,031,984.75 6,984.75
FFCB 2YrNc6MoA 08/03/2022 .230 10,000,000.00 10,000,000.00 99.637000 9,963,700.00 -36,300.00
FFCB 3YrNc1YrA 08/10/2023 .320 15,945,000.00 15,945,000.00 99.987000 15,942,927.15 -2,072.85
FFCB 2.5YrNc3MoA 03/15/2023 .220 10,000,000.00 9,992,500.00 99.938000 9,993,800.00 1,300.00
FFCB 3YrNC2YrA 10/20/2023 .270 10,000,000.00 10,000,000.00 100.007000 10,000,700.00 700.00
FFCB 1.25YrNc6MoA 02/17/2022 .170 15,000,000.00 15,000,000.00 100.016000 15,002,400.00 2,400.00
FFCB 1.25YrNc6MoA 02/17/2022 .170 15,000,000.00 15,000,000.00 100.016000 15,002,400.00 2,400.00
FFCB 1.25YrNc6MoA 02/17/2022 .170 15,000,000.00 15,000,000.00 100.016000 15,002,400.00 2,400.00
FFCB 3YrNc1YrA 11/30/2023 .310 10,000,000.00 10,000,000.00 99.999000 9,999,900.00 -100.00
FFCB 3YrNc2YrA 12/08/2023 .280 9,931,000.00 9,935,667.57 100.016000 9,932,588.96 -3,078.61
FFCB 2.5YrNc6MoA 06/15/2023 .200 15,000,000.00 15,000,000.00 99.964000 14,994,600.00 -5,400.00
FFCB 2YrNc1YrA 12/15/2022 .160 10,000,000.00 10,000,000.00 99.996000 9,999,600.00 -400.00
FFCB 2YrNc1YrA 12/15/2022 .160 8,245,000.00 8,245,000.00 99.996000 8,244,670.20 -329.80
FFCB 3YrNc1YrA 12/21/2023 .210 10,000,000.00 9,992,500.00 99.871000 9,987,100.00 -5,400.00
FFCB 2.75YrNc6MoA 09/22/2023 .190 10,000,000.00 10,000,000.00 99.903000 9,990,300.00 -9,700.00
FFCB 4YrNc6MoA 12/23/2024 .320 5,000,000.00 5,000,000.00 99.840000 4,992,000.00 -8,000.00
FFCB 3YrNC1YrA 12/21/2023 .210 20,000,000.00 19,985,000.00 99.871000 19,974,200.00 -10,800.00
FFCB 4YrNc6MoA 12/23/2024 .320 15,000,000.00 15,000,000.00 99.840000 14,976,000.00 -24,000.00
FFCB 5YrNc6MoA 12/23/2025 .500 12,430,000.00 12,426,271.00 99.970000 12,426,271.00 0.00
FFCB 3 25YrNc6MoA 03/28/2024 270 10 000 000 00 10 000 000 00 99 961000 9 996 100 00 -3 900 00FFCB 4YrNc6MoA 12/23/2024 .320 10,000,000.00 9,992,500.00 99.840000 9,984,000.00 -8,500.00
FFCB 1.75YrNc6MoA 09/22/2022 .120 15,000,000.00 14,991,000.00 99.919000 14,987,850.00 -3,150.00
FFCB 3YrNC1YrA 12/28/2023 .210 15,000,000.00 14,988,750.00 99.895000 14,984,250.00 -4,500.00
.981 526,203,000.00 526,029,389.81 100.577459 529,241,606.93 3,212,217.12
FFCB 5Yr 05/25/2021 .418 10,000,000.00 10,000,000.00 100.109000 10,010,900.00 10,900.00
FFCB 5Yr 05/25/2021 .418 10,000,000.00 10,000,000.00 100.109000 10,010,900.00 10,900.00
FFCB 3.5Yr 10/04/2021 .177 15,000,000.00 15,000,000.00 100.018000 15,002,700.00 2,700.00
.315 35,000,000.00 35,000,000.00 100.070000 35,024,500.00 24,500.00
FFCB 2.3Yr 02/21/2023 .222 15,000,000.00 15,000,000.00 99.942000 14,991,300.00 -8,700.00
.222 15,000,000.00 15,000,000.00 99.942000 14,991,300.00 -8,700.00
FFCB 2Yr 09/24/2021 .230 15,000,000.00 15,000,000.00 100.070000 15,010,500.00 10,500.00
FFCB 3Yr 11/07/2022 .400 25,000,000.00 25,000,000.00 100.429000 25,107,250.00 107,250.00
FFCB 3Yr 11/07/2022 .400 25,000,000.00 25,000,000.00 100.429000 25,107,250.00 107,250.00
FFCB 3Yr 11/07/2022 .400 25,000,000.00 25,000,000.00 100.429000 25,107,250.00 107,250.00
FFCB 3Yr 11/07/2022 .400 15,000,000.00 15,000,000.00 100.429000 15,064,350.00 64,350.00
FFCB 3Yr 11/07/2022 .400 25,000,000.00 25,000,000.00 100.429000 25,107,250.00 107,250.00
FFCB 3Yr 12/09/2022 .410 9,000,000.00 9,000,000.00 100.468000 9,042,120.00 42,120.00
FFCB 3Yr 12/09/2022 .410 24,000,000.00 24,000,000.00 100.468000 24,112,320.00 112,320.00
FFCB 3Yr 12/09/2022 .410 24,000,000.00 24,000,000.00 100.468000 24,112,320.00 112,320.00
FFCB 3Yr 12/09/2022 .410 24,000,000.00 24,000,000.00 100.468000 24,112,320.00 112,320.00
3133ELCX0 .410 1.905 1.940
3133ELCX0 .410 1.905 1.940
3133EK6V3
3133ELCX0 .410 1.905 1.940
3133ELCX0 .410 1.905 1.940
3133EL3E2
3133EL7E8
3133EMGQ9
3133EMGQ9
3133EMLR1
3130AKKF2
1767: FHLB-Var-M A/360
1770: FHLB-Var-Q A/360
2.915
1.132
.170 1.126 1.132
3133EMGQ9 .170 1.126 1.132
3133EMDM1
.170 1.126
3133ELMJ0
1.688
.310
3133ELMD3
3133ELNF7
3133ELTC8
3133ELUX0
3130AKFS0
3130AKKP0
3130AKLB0
3130AK4H6
3130AK4K9
3130AKAR7
3130AKDH6
3130AKDG8
3133EH6X6
313313FP8
3133ELXC3
3133ELMD3
3130AKL79
3130AK3T1
3130AJF95
3130AKCP9
313313AF5
.400
.400
3133EKT63
.177
3133EK6V3
1935: FFCB-Var-SOFR-M A/360
3133EM7M8
1936: FFCB-Var-SOFR-Q A/360
.400
2.306 2.345
.400
.752 .759
.550
3133EK6V3 .400
2.980 2.992
.230
.222
.399 .397
.399
.552
3.949 3.981
.418
.397
.222
3133EJJE0
1.723
3 223 3 241
.315
1930: FFCB-Var-M A/360
1.7263133EMLF7 .155
3.949 3.981
3133EGCE3 .418
4.910 4.981
270
3133EMKW1 .235
1.000
3.949 3.981
3133EMLT7 .235
2.961 2.973
1.956
3133EMLP5 .320
3133EMLP5 .320
2.961 2.973
2.716 2.726
2.901
3133EMKW1 .235
3133EMLE0 .190
.1603133EMKH4
.160
2.922
1.952
.173
2.721
1.300
2.053
.500 3.894
.538
.079
.130
3.002
1.600
1.600
.402
2.5491.640
2.747
.142
.133
.874.852
2.277
3.095
.351
2.922
.356
2.182
2.602
1.600
1.640 3.996 4.173
1.550 3.063
2.630
3.162
3.118
2.112
1.690
2.053
2.053 2.112
1.682
1.820 3.668 3.827
2.112
1.672 3.715
3.6963.522
3.572
2.753
1.529 1.646
2.220 3.322 3.474
1.033
2.474 .116 .118
.162 .1642.501
2.365 1.002
.275
.016
.120 .440 .441
.016
.274
.150 .366 .367
.400
.142 .402 .400
.337
.341 .338 .337.338.341
1.258.742
3.493
.279 3.230 3.241
1.238
3.493
.260 3.474
2.992
.270 3.223 3.241
.260 3.474
.110 .356 .356
.235
.250 2.979
.537
2.964 2.975
.176 1.802 1.805
.110 .555 .553
.120
3.942
.115 .541 .540
.121 .424 .425
.121 .435 .436
.079
1.800 3.672 3.830
1.550 3.129 3.233
1.750 3.927 4.121
4.089 4.230
1.234
4.089
2.608
1.244
1.125 4.211
1.244
4.444
3.310
1.589
1.000 1.234
1.000
.800 3.254
1.584
3130AKLB0
.250 2.197 2.203
.270
.680 4.366
2.592
2.8032.789
3130AJ5F2
3130AKKF2
3130AJAX7
3133EJKN8
3130AJSN0
3130AKKF2
3133ELH80
3133ELUX0
3130AHG31
3133ELNJ9
3133ELQE7
3133EKRP3
3133EKM45
3133EJNS4
3133EJT74
3133EJD48
3133EK4B9
3130AJ2N8
313313GS1
1925: FFCB-Fxd-S 30/360
3130AJAS8
1900: FFCB-DISC NOTE
3133EKP75
3133EKQA7
3133ELMD3
3133EJEM7
3133EJCE7
3133EL2Q6
3133EMHL9
3133EMJQ6 .264
.320
.230
2.937
3133EMKG6 .200 2.448 2.455
3133EMKH4 1.956
.506
1.952
3133EGCE3
2.134 2.142
3133EMLP5 .339
2.134 2.142
.726 .732
1.816 1.852
1.816 1.852
3133EK6V3
3133EK6V3
1.816 1.852
1.816 1.852
1.816 1.852
COUNTY OF RIVERSIDE TREASURER-TAX COLLECTOR 12
108

Description Maturity
Date
Coupon Par
Value
Book
Value
Market
Price
Market
Value
Unrealized
Gain/Loss
Month End Portfolio Holdings
CUSIP Yield
To Mat
Modified
Duration
Years To
Maturity
FFCB 3Yr 12/09/2022 .410 14,000,000.00 14,000,000.00 100.468000 14,065,520.00 65,520.00
FFCB 3Yr 12/09/2022 .410 24,000,000.00 24,000,000.00 100.468000 24,112,320.00 112,320.00
.395 249,000,000.00 249,000,000.00 100.426012 250,060,770.00 1,060,770.00
FAMCA 4.9Yr 06/30/2023 2.850 10,000,000.00 9,947,900.00 106.556000 10,655,600.00 707,700.00
FAMCA 2.91Yr 07/23/2021 2.840 10,000,000.00 9,993,300.00 101.542000 10,154,200.00 160,900.00
2.845 20,000,000.00 19,941,200.00 104.049000 20,809,800.00 868,600.00
FAMCA 3Yr 04/23/2021 .198 25,000,000.00 25,000,000.00 100.013000 25,003,250.00 3,250.00
FAMCA 3Yr 05/10/2021 .169 10,000,000.00 10,000,000.00 99.991000 9,999,100.00 -900.00
FAMCA 1.6Yr 05/28/2021 .218 25,000,000.00 25,000,000.00 100.009000 25,002,250.00 2,250.00
FAMCA 1.5Yr 10/18/2021 .218 50,000,000.00 50,000,000.00 100.010000 50,005,000.00 5,000.00
.209 110,000,000.00 110,000,000.00 100.008727 110,009,600.00 9,600.00
FAMCA 1Yr 03/25/2021 .200 25,000,000.00 25,000,000.00 100.019000 25,004,750.00 4,750.00
.200 25,000,000.00 25,000,000.00 100.019000 25,004,750.00 4,750.00
STATE OF CALIFORNIA 04/01/2021 2.625 14,400,000.00 14,688,720.00 102.005000 14,688,720.00 0.00
RHODE ISLAND ST & PROV 04/01/2021 2.750 3,150,000.00 3,167,766.00 100.564000 3,167,766.00 0.00
STATE OF CALIFORNIA 04/01/2021 2.800 16,000,000.00 16,000,640.00 100.004000 16,000,640.00 0.00
STATE OF CALIFORNIA 04/01/2021 2.625 1,795,000.00 1,784,301.80 99.404000 1,784,301.80 0.00
STATE OF CALIFORNIA 04/01/2022 2.367 1,500,000.00 1,468,800.00 97.920000 1,468,800.00 0.00
CITY OF LOS ANGELES 09/01/2021 4.000 8,915,000.00 9,200,993.20 103.208000 9,200,993.20 0.00
STATE OF CALIFORNIA 04/01/2022 2.367 17,695,000.00 17,256,340.95 97.521000 17,256,340.95 0.00
STATE OF CALIFORNIA 04/01/2022 2.367 25,000,000.00 24,275,250.00 97.101000 24,275,250.00 0.00
STATE OF CALIFORNIA 04/01/2021 2.800 10,825,000.00 10,852,170.75 100.251000 10,852,170.75 0.00
STATE OF HAWAII 01/01/2021 3.250 12,745,000.00 12,864,165.75 100.935000 12,864,165.75 0.00
STATE OF HAWAII 01/01/2022 2.770 3,500,000.00 3,500,000.00 100.000000 3,500,000.00 0.00
2.750 115,525,000.00 115,059,148.45 99.596753 115,059,148.45 0.00
NATL SEC CLEARING CORP 01/04/2021 .120 25,000,000.00 24,989,583.33 99.999167 24,999,791.67 10,208.34
NATL SEC CLEARING CORP 01/04/2021 .120 20,000,000.00 19,991,733.33 99.999167 19,999,833.33 8,100.00
NATL SEC CLEARING CORP 01/29/2021 .120 50,000,000.00 49,976,500.00 99.992222 49,996,111.11 19,611.11
NATL SEC CLEARING CORP 01/15/2021 .120 35,000,000.00 34,985,766.67 99.996111 34,998,638.89 12,872.22
NATL SEC CLEARING CORP 02/26/2021 .120 50,000,000.00 49,977,666.67 99.984444 49,992,222.22 14,555.55
NATL SEC CLEARING CORP 01/28/2021 .110 50,000,000.00 49,984,722.22 99.992500 49,996,250.00 11,527.78
NATL SEC CLEARING CORP 02/10/2021 .110 25,000,000.00 24,991,520.83 99.988889 24,997,222.22 5,701.39
NATL SEC CLEARING CORP 01/05/2021 .120 25,000,000.00 24,994,083.33 99.998889 24,999,722.22 5,638.89
NATL SEC CLEARING CORP 01/15/2021 .130 25,000,000.00 24,992,777.78 99.996111 24,999,027.78 6,250.00
PROCTER & GAMBLE 03/31/2021 .130 61,500,000.00 61,467,353.75 99.975278 61,484,795.83 17,442.08
.120 366,500,000.00 366,351,707.91 99.990072 366,463,615.27 111,907.36
.366 9,610,680,944.14 9,608,151,280.02 100.138125 9,623,955,692.78 15,804,412.76
.366 9,610,680,944.14 9,608,151,280.02 100.138125 9,623,955,692.78 15,804,412.76Grand Total .355 1.030 1.045
.120 .100 .101Total Fund .355 1.030 1.045
63763PNF2 .130 .041 .041
74271TQX4 .130 .246 .247
63763PPA1 .110 .112 .112
63763PN54 .120 .014 .014
63763PPS2 .120 .156 .156
63763PNU9 .110 .077 .077
63763PNV7 .120 .079 .079
63763PNF2 .120 .041 .041
63763PN47 .120 .011 .011
63763PN47 .120 .011 .011
2.836 .634 .652
3020: COMMERCIAL PAPER
419792YK6 2.733 .003 .003
419792YL4 2.770 .969 1.003
13063DAD0 3.290 1.212 1.249
13063DGA0 2.680 .246 .249
544351MM8 2.919 .647 .668
13063DAD0 3.120 1.213 1.249
13063DAC2 2.850 .246 .249
13063DAD0 2.960 1.214 1.249
76222RWU2 2.551 .246 .249
13063DGA0 2.799 .246 .249
2350: MUNIS-S 30/360
13063DAC2 2.011 .247 .249
31422BWG1 .200 .230 .230
.200 .230 .230
.209 .559 .5571986: FMAC-Var-SOFR-Q A/360
31422BWC0 .218 .416 .405
31422BYJ3 .218 .795 .797
3132X0S77 .198 .310 .310
3132X0U90 .169 .357 .356
2.915 1.493 1.5511965: FMAC-Var-M A/360
3132X03B5 2.964 2.395 2.496
3132X04F5 2.864 .546 .559
.395 1.793 1.8271950: FMAC-Fxd-S 30/360
3133ELCX0 .410 1.905 1.940
3133ELCX0 .410 1.905 1.940
COUNTY OF RIVERSIDE TREASURER-TAX COLLECTOR 13
109

COUNTY OF RIVERSIDE TREASURER-TAX COLLECTOR
The Mission Inn, Downtown Riverside. Digital Image. The Mission Inn. http://www.missioninn.com/about-en.html.
110

COUNTY OF RIVERSIDE
TREASURER-TAX COLLECTOR
CAPITAL MARKETS
COUNTY ADMINISTRATIVE CENTER
4080 LEMON STREET,
4TH FLOOR,
RIVERSIDE, CA 92502-2205
WWW.COUNTYTREASURER.ORG
111

AGENDA ITEM 6D


Agenda Item 6D
RIVERSIDE COUNTY TRANSPORTATION COMMISSION
DATE: February 22, 2021
TO: Budget and Implementation Committee
FROM Marla Dye, Senior External Affairs Management Analyst
Cheryl Donahue, Public Affairs Manager
THROUGH: John Standiford, Deputy Executive Director
SUBJECT: Quarterly Public Engagement Metrics Report, October-December 2020
STAFF RECOMMENDATION:
This item is for the Committee to:
1) Receive and file the Quarterly Public Engagement Metrics Report for October-December
2020; and
2) Forward to the Commission for final action.
BACKGROUND INFORMATION:
Staff continues to measure public engagement activities and prepare Quarterly Public
Engagement Metrics Reports for the Commission, a practice that began in April 2018. This report
covers the fourth quarter of 2020, from October to December. The quarterly reports are a
data-driven approach to monitor the Commission’s progress toward public engagement goals, to
analyze the effectiveness of its efforts, and to provide transparency into how the Commission is
using its resources to engage with the public. This quarter’s report includes four sets of data:
1) Metrics for RCTC’s overall public engagement activities, including website use and access;
website top pages visited; email notifications; social media likes, engagement and reach;
and public sentiment
2) Metrics for RCTC’s 15 Express Lanes Project public engagement activities, including email
activity, website sessions, and social media
3) Metrics for the Route 60 Truck Lanes Project including email activity, website sessions,
and social media
4) Metrics for the I-15 Railroad Canyon Interchange Project including email activity, website
sessions, text messages, and social media.
5) Metrics for the I-215 Placentia Avenue Interchange Project including email activity,
website sessions, and social media.
Report highlights for this quarter follow and are included in a graphical format. The metrics
showed small inclines across platforms and mixed sentiment. The quarterly reports will continue
to expand to include metrics from new Commission construction projects, the 91 Corridor
Operations Project, and the 15/91 Express Lanes Connector.
112

Agenda Item 6D
RCTC Overall Public Engagement
1) Website
a. For the quarter, there were 39,928 website sessions, a 31 percent increase from
last quarter’s 30,456 sessions. There also were 29,526 unique users, a boost of 43
percent compared to the previous quarter’s 20,592 unique users.
b. Most visitors (38.7 percent) accessed the website using a direct search (keying in
rctc.org). Others (28.2 percent) used organic search engines, while others reached
the site via social media (27.2 percent), website referrals (3.8 percent) and display
advertisements (2 percent).
c. Website access via desktop versus mobile shifted slightly. During the quarter,
access was split evenly, 50 percent and 50 percent. During the previous quarter,
the ratio was 46 percent desktop versus 54 percent mobile.
d. The homepage continues to be the most frequently visited page, followed this
quarter by the News and Publications page and the Employment page.
2) Social Media
a. Facebook: At the end of the quarter, the Facebook page had 9,793 likes, a
1.4 percent increase over last quarter’s 9,662 likes. The page had 26,161 forms of
engagement, such as likes, comments and shares, a 32 percent boost from last
quarter’s 19,791 forms of engagement. Facebook also had 1,404,331 impressions.
This was a large increase – 187 percent – from last quarter’s 488,791 impressions.
b. Twitter: RCTC’s Twitter page showed a 1.7 percent rise in followers, from 1,293 to
1,315. Engagement increased by 138 percent, from 395 to 941. Impressions
increased by 79 percent from 38,344 to 68,611.
c. Instagram: Instagram page followers grew 14 percent, from 708 to
810. Engagement improved by a significant 184 percent, from 232 forms of
engagement to 660. Impressions grew 134 percent to 14,154, compared to last
quarter’s 6,046.
d. Overall, public sentiment was mostly positive, but with lower engagement levels.
Engagement was positive on posts related to RCTC projects and approval of the
15 Corridor Operations Project. Early November featured lower engagement.
3) RCTC’s The Point: RCTC continues to produce content for its online blog, The Point, and
distributes this information and other news via email to subscribers. RCTC’s subscribers
reduced 1 percent, from 3,898 to 3,849, largely due to updates to the contact list,
primarily because of job changes. Twenty-eight percent of subscribers opened The Point,
and 4 percent clicked on links to learn more.
15 Express Lanes Construction Public Engagement
1) Emails: Total email list sign-ups since the project began grew to 2,784. This is a .17 percent
increase over the 2,779 sign-ups received through the end of last quarter. There were
113

Agenda Item 6D
5 email inquiries this quarter, for a total of 183 since the project started. This is a 2.8
percent increase over the 178 inquiries received through the end of last quarter.
2) Website: Total website visits since project inception grew to 86,530, a 5.6 percent climb
from the 81,647 visits recorded through the end of last quarter.
3) Social Media: The project’s Facebook, Twitter, and Instagram accounts all showed gains.
The Facebook page grew to 2,743 likes from 2,712 likes last quarter, a 1.1 percent
increase. Twitter increased from 310 followers to 317, a 2.3 percent increase. Instagram
followers increased 3.2 percent from 527 to 544.
Route 60 Truck Lanes Construction Public Engagement
1) Emails: Total email list sign-ups since the project began grew to 322. This is a
2.2 percent increase over the 315 sign-ups received through the end of last quarter. There
also have been a total of 213 email inquiries, a 7.5 percent increase over the 199 inquiries
through the end of last quarter.
2) Website: Total website visits since grew to 17,232, an 8.9 percent increase from the
15,816 visits through the end of last quarter.
3) Social Media: The project’s Facebook, Twitter, and Instagram accounts all showed
increases. The Facebook page grew to 874 likes from 799 likes last quarter, an 9.3 percent
increase. Twitter increased from 76 followers to 84 followers, a 10.5 percent increase.
Instagram followers increased 20 percent from 197 to 237.
I-15 Railroad Canyon Interchange Public Engagement
1) Emails and Texts: Total email list sign-ups since the project began grew to 246. This is a 5
percent increase over the 234 sign-ups received through the end of last quarter. A total
of 467 people registered to receive texts, a 33 percent jump over the 351 sign-ups through
the end of last quarter. There were 4 email inquiries for a total of 25 since the project
started.
2) Website: Total website visits since project inception grew to 8,279, a 22 percent climb
from the 6,769 visits through the end of last quarter.
3) Social Media: The project’s Facebook, Twitter, and Instagram accounts all showed gains.
The Facebook page grew to 886 likes from 850 likes last quarter, a 4.2 percent increase.
Twitter increased from 30 followers to 32, a 6.6 percent increase. Instagram followers
increased 23.9 percent from 205 to 254.
I-215 Placentia Interchange Public Engagement
1) Emails: Email sign-ups during the first four months totaled 327. Four emails were sent to
the project team.
2) Website: Visits to the rctc.org/placentia webpage totaled 1,731 during the first four
months of project construction.
114

Agenda Item 6D
3) Social Media: This project does not have a designated social media account. The RCTC
social media accounts, @theRCTC, is being used for this project. Total social media post
engagements total 4,639 for this four-month period.
Attachments:
1) RCTC Overall Public Engagement Metrics
2) 15 Express Lanes Construction Public Engagement Metrics
3) Route 60 Truck Lanes Construction Public Engagement Metrics
4) I-15 Railroad Canyon Interchange Construction Public Engagement Metrics
5) I-215 Placentia Interchange Construction Public Engagement Metrics
115

Top Pages Visited
2
3
4
Desktop vs Mobile Users
50%50%Desktop Mobile
Facebook Twitter Instagram
Top Channels
Overall Social Media Sentiment Eblasts Web
Public Engagement Metrics: Q4 Oct - Dec 2020
Social Media
-2
0
1
2
3
4
5
- 1
10/1 10/8 10/15 10/22 11/5 11/12 11/26 12/2412/1712/3 12/1010/29 11/19 12/31
DifferencesAdvertising continued in Q4.
Subscribers3,849
AverageOpen 28%
AverageClick4%
39,928Number of Sessions
+31%29,526Number ofUnique Users
+43%
Impressions1,404,331
Followers9,793
Engagement26,161
Impressions68,611
Followers1,315
Engagement941
Impressions14,154
Followers810
Engagement660
+79%
+1.7%
+138%
+134%
+14%
+184%
+187%
+1.4%
+32%
News
Employment
Meetings and Agendas
Homepage is #1 most visited page
- 1%
10/22 (+) Positive trend following approval of new southbound, non-tolled I-15 lane11/10 (-) Lower engagement levels11/18 (+) Positive response to boosted posts about 91 COP and I-15 RRCYN Projects12/16 (+) Boost in response to ads announcing 71/91 Interchange funding
Direct (38.7%) - 11,500
Organic (28.2%) - 8,390
Social (27.2%) - 8,076
Referral (3.8%) - 1,117
Display (2%) - 586
ATTACHMENT 1
116

15 Express Lanes ProjectOutreach Metrics Oct 2016 – Dec 2020
Oct
– D
ec 2016
Jan –
Mar 2
017
Apr –
Jun 2
017
Jul –
Sep 2
017
Oct
– D
ec 2017
Jan –
Mar 2
018
Jul –
Sep 2
018
Apr –
Jun 2
018
Oct
– D
ec 2018
Jan –
Mar 2
019
Apr –
Jun 2
019
Jul –
Sep 2
019
Oct
– D
ec 2019
Jan –
Mar 2
020
Apr –
Jun 2
020
Jul -
Sep 2
020
Oct
- D
ec 2020
0
500
1000
1500
2000
2500
3000
Oct
– D
ec 2016
Jan –
Mar 2
017
Apr –
Jun 2
017
Jul –
Sep 2
017
Oct
– D
ec 2017
Jan –
Mar 2
018
Jul –
Sep 2
018
Apr –
Jun 2
018
Oct
– D
ec 2018
Jan –
Mar 2
019
Apr –
Jun 2
019
Jul –
Sep 2
019
Oct
– D
ec 2019
Jan –
Mar 2
020
Apr –
Jun 2
020
Jul -
Sep 2
020
Oct
- D
ec 2020
7
20
3240
48
62
77
104
132137
144
118
154162
171178
183
0
50
100
150
200
Facebook Page Likes
Instagram Followers (Account Opened 02/05/18)
Twitter Followers (Account Opened 02/05/18)
21127
195
932 979
1,297
1,477
1,665
2,030
2,219 2,269
1,933
2,3032,374
2,705 2,712 2,743
0
500
1000
1500
2000
2500
3000
Facebook Page Likes
Instagram Followers (Account Opened 02/05/18)
Twitter Followers (Account Opened 02/05/18)
181
176
293
20852
148
351
219
384
220
407
235
443
242
461
257
Oct
– D
ec 2016
Jan –
Mar 2
017
Apr –
Jun 2
017
Jul –
Sep 2
017
Oct
– D
ec 2017
Jan –
Mar 2
018
Jul –
Sep 2
018
Apr –
Jun 2
018
Oct
– D
ec 2018
Jan –
Mar 2
019
Apr –
Jun 2
019
Jul –
Sep 2
019
Oct
– D
ec 2019
Jan –
Mar 2
020
Jul -
Sep 2
020
Apr –
Jun 2
020
Oct
- D
ec 2020
Oct
– D
ec 2016
Jan –
Mar 2
017
Apr –
Jun 2
017
Jul –
Sep 2
017
Oct
– D
ec 2017
Jan –
Mar 2
018
Jul –
Sep 2
018
Apr –
Jun 2
018
Oct
– D
ec 2018
Jan –
Mar 2
019
Apr –
Jun 2
019
Jul –
Sep 2
019
Oct
– D
ec 2019
Jan –
Mar 2
020
Apr –
Jun 2
020
Jul -
Sep 2
020
Oct
- D
ec 2020
0
20000
40000
60000
80000
100000
8453,635
5,7808,813
11,05614,980
20,440
28,184
42,208
49,590
56,019
36,841
62,023
69,624
75,484
81,647
86,530
485
267
499
297
45114
703
1,240
1,401
1,706
1,915
2,301
2,522 2,577 2,622
2,426
2,648 2,701 2,732 2,779 2,784
527
310
544
317
*Text sign-ups began July 2018
Emails Received
Website Visits Social Media Likes/Follows
Email & Text* List Sign-Ups
ATTACHMENT 2
117

May 2019 - Dec 2020
State Route 60 Truck Lanes ProjectQuarterly “At-a-Glance” Metrics Report
Facebook Page Likes
Instagram Followers
Twitter Followers
May
– Jun 2
019
Nu
mb
er
of
Lik
es/
Fo
llo
ws
Facebook Page Likes
Instagram Followers
Twitter Followers
0
200
400
600
800
1000
Tota
l W
eb
site
vis
its
to D
ate
0
50
100
150
200
250
Nu
mb
er
of
Sig
n-U
ps
Nu
mb
er
of
Em
ail
s
0
5000
10000
15000
20000
0
50
100
150
200
250
300
350
1336 31
101 52142
62152
69175
76197 84
237
May
– Jun 2
019
Jul –
Sep 2
019
Oct
– D
ec 2019
May
– Jun 2
019
Jul –
Sep 2
019
Oct
– D
ec 2019
Jul –
Sep 2
019
Oct
– D
ec 2019
May
– Jun 2
019
Jul –
Sep 2
019
Oct
– D
ec 2019
67
144157
170187
199213
1,414
6,715
9,992
12,85014,318
15,81617,232
115
314
454
576
729799
874
Email & Text Sign-Ups
Website Sessions
Emails to Project Team
Social Media Likes/Follows
Jan –
Mar 2
020
Jan –
Mar 2
020
Jan –
Mar 2
020
Jan –
Mar 2
020
Apr -
Jun 2
020
Jan –
Mar 2
020
Apr -
Jun 2
020
Apr -
Jun 2
020
Apr -
Jun 2
020
61
263285 291 299
315 322
Jul -
Sep 2
020
Jul -
Sep 2
020
Jul -
Sep 2
020
Jul -
Sep 2
020
Oct
- D
ec 2020
Oct
- D
ec 2020
Oct
- D
ec 2020
Oct
- D
ec 2020
ATTACHMENT 3
118

Apr 2020 - Dec 2020
I-15 Railroad Canyon Road Interchange ProjectQuarterly “At-a-Glance” Metrics Report
Facebook Page Likes
Instagram Followers
Twitter Followers
Apr -
Jun 2
020
Nu
mb
er
of
Lik
es/
Fo
llo
ws
Facebook Page Likes
Instagram Followers
Twitter Followers
0
200
400
600
800
1000
Tota
l W
eb
site
vis
its
to D
ate
0
3
6
9
12
15
Nu
mb
er
of
Sig
n-U
ps
Nu
mb
er
of
Em
ail
s
0
2000
4000
6000
8000
10000
22138
Apr -
Jun 2
020
Apr -
Jun 2
020
194208
1
803
Email & Text Sign-Ups
Website Sessions
Emails to Project Team
Social Media Likes/Follows
Apr -
Jun 2
020
0
100
200
300
400
500
Text Sign-UpsEmail Sign-Ups
234351
10
4,230
6,769
30205
850
Jul -
Sep 2
020
Jul -
Sep 2
020
Jul -
Sep 2
020
Jul -
Sep 2
020
246457
14
8,279
32254
886
Oct
- D
ec 2020
Oct
- D
ec 2020
Oct
- D
ec 2020
Oct
- D
ec 2020
ATTACHMENT 4
119

Jul 2020 - Dec 2020
I-215 Placentia Interchange ProjectQuarterly “At-a-Glance” Metrics Report
Jul -
Sep 2
020
Nu
mb
er
of
Po
st E
ng
ag
em
en
ts
0
500
1000
1500
2000
2500
3000
Tota
l W
eb
site
vis
its
to D
ate
0.0
0.5
1.0
1.5
2.0
2.5
3.0
Nu
mb
er
of
Sig
n-U
ps
Nu
mb
er
of
Em
ail
s
0
300
600
900
1200
1500
Jul -
Sep 2
020
Jul -
Sep 2
020
155
1
2,016
Email Sign-Ups
Website Sessions
Emails to Project Team
Social Media Post Engagements
Jul -
Sep 2
020
0
50
100
150
200
250
300
350 3273
488
1,2432,623
Oct
- D
ec 2020
Oct
- D
ec 2020
Oct
- D
ec 2020
Oct
- D
ec 2020
ATTACHMENT 5
120


AGENDA ITEM 7


Agenda Item 7
RIVERSIDE COUNTY TRANSPORTATION COMMISSION
DATE: February 22, 2021
TO: Budget and Implementation Committee
FROM: Michele Cisneros, Deputy Director of Finance
Theresia Trevino, Chief Financial Officer
THROUGH: John Standiford, Deputy Executive Director
SUBJECT: Proposed Policy Goals and Objectives for Fiscal Year 2021/22 Budget
STAFF RECOMMENDATION:
This item is for the Commission to:
1) Review and approve the proposed Commission Policy Goals and Objectives for the
Fiscal Year 2021/22 Budget;
2) Review and approve the Fiscal Accountability Policies for the FY 2021/22 Budget; and
3) Forward to the Commission for final action.
BACKGROUND INFORMATION:
The initial step in the budget process is to develop policy goals and objectives for the next fiscal
year that are consistent with the Commission’s overall strategic direction. Most importantly, the
adoption of the Commission Policy Goals and Objectives and Fiscal Accountability Policies for the
annual fiscal year budget provides an opportunity to match the Commission’s spending priorities
in a manner that implements the promises made to the citizens of the county of Riverside in the
Measure A Expenditure Plan and fulfills other Commission responsibilities.
The Commission is driven by four core objectives for the people of Riverside County and the
transportation system upon, which they rely:
• Quality of life;
• Operational excellence;
• Connecting the economy; and
• Responsible partner.
Additionally, the fiscal accountability policies that promote fiduciary responsibility and
organizational excellence are summarized in six categories:
• Financial planning;
• Revenues;
• Expenditures/expenses;
121

Agenda Item 7
• Debt management;
• Cash management; and
• Accounting and financial reporting.
The Commission Policy Goals and Objectives will be linked to the individual department goals and
objectives included in the FY 2021/22 Budget, and the Fiscal Accountability Policies will guide the
development and monitoring of the FY 2021/22 Budget.
FISCAL IMPACT:
There is no fiscal impact related to the approval of the Commission Policy Goals and Objectives
and the Fiscal Accountability Policies for the FY 2021/22 Budget. The fiscal impact will be
determined upon adoption of the FY 2021/22 Budget at the June Commission meeting.
Attachment: Proposed Commission Policy Goals and Objectives and Fiscal Accountability Policies
for FY 2021/22
122

Policy Goals and Objectives
As approved at its March 10, 2021 meeting, the Commission is driven by four core mission
statements and underlying goals for the people of Riverside County and the transportation system
upon which they rely:
QUALITY OF LIFE
RCTC is focused on improving life for the people of Riverside County and empowering them to live
life at their pace.
Choice RCTC empowers the residents of Riverside County to choose how to get safely to where they are going.
Environmental
Stewardship
RCTC protects and preserves the County’s environment for our residents.
Mobility RCTC provides access, equity, and choice in transportation; RCTC is a mobility
partner.
Equity RCTC supports transportation services and projects that equitably benefit all residents, including those in rural, low income, and disadvantaged
communities.
Access
RCTC projects and programs are the connection to employment, housing,
schools, community institutions, parks, medical facilities, and shopping in the
region.
Goods Movement
RCTC facilitates the funding and delivery of projects that mitigate the impact
of increased goods movement flow through Riverside County and advocates
for a reasonable balance between the need to create jobs and to protect
public health.
OPERATIONAL EXCELLENCE
RCTC is a responsible and conservative steward of taxpayer dollars.
State of Good Repair RCTC invests in road safety and maintenance in its residents’ neighborhoods.
Promises Fulfilled Projects are completed on-time, on-budget; RCTC delivers on its promises as a
steward of Riverside County residents’ investment.
Efficiency RCTC operates its in an efficient and cost-effective manner.
Innovation Program and project delivery innovations drive results, savings, and greater
economic opportunities for Riverside County residents.
Information RCTC operations are transparent and easily accessible; customers get prompt,
reliable, quality service.
CONNECTING THE ECONOMY
RCTC is a driver of economic growth in Riverside County.
Workforce Mobility RCTC improves the economy by creating a robust workforce to workplace
system; RCTC fosters workforce development by improving transportation
access to major employment and education centers.
Population Growth
Since 1976, RCTC has been responsible for connecting our County’s economy
as the County’s population has quadrupled from 550,000 to almost 2.5 million
today. RCTC is sensitive to each geographic area’s unique needs.
Economic Impact
RCTC has invested over $4.3 billion in the County’s economy thanks to Measure
A and toll revenues, which has a multiplier impact in terms of jobs and
economic opportunity throughout Riverside County.
123
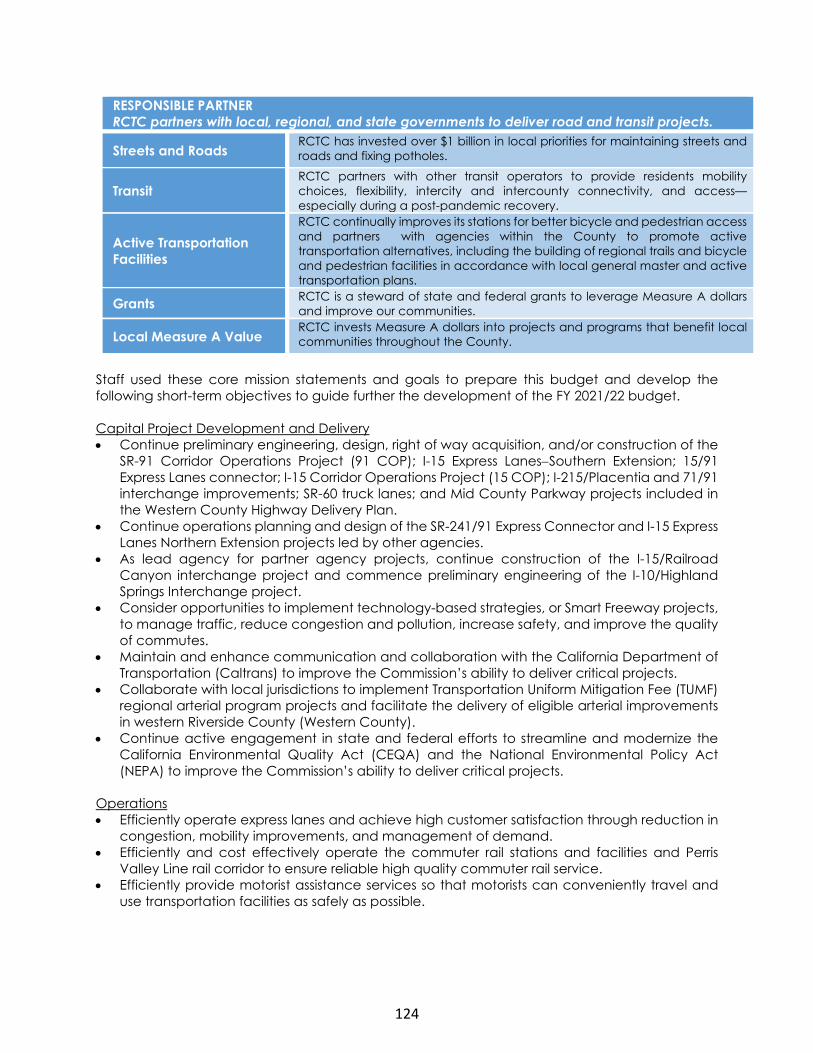
RESPONSIBLE PARTNER
RCTC partners with local, regional, and state governments to deliver road and transit projects.
Streets and Roads RCTC has invested over $1 billion in local priorities for maintaining streets and
roads and fixing potholes.
Transit RCTC partners with other transit operators to provide residents mobility
choices, flexibility, intercity and intercounty connectivity, and access—
especially during a post-pandemic recovery.
Active Transportation
Facilities
RCTC continually improves its stations for better bicycle and pedestrian access
and partners with agencies within the County to promote active
transportation alternatives, including the building of regional trails and bicycle
and pedestrian facilities in accordance with local general master and active
transportation plans.
Grants RCTC is a steward of state and federal grants to leverage Measure A dollars
and improve our communities.
Local Measure A Value RCTC invests Measure A dollars into projects and programs that benefit local
communities throughout the County.
Staff used these core mission statements and goals to prepare this budget and develop the
following short-term objectives to guide further the development of the FY 2021/22 budget.
Capital Project Development and Delivery
• Continue preliminary engineering, design, right of way acquisition, and/or construction of the
SR-91 Corridor Operations Project (91 COP); I-15 Express Lanes−Southern Extension; 15/91
Express Lanes connector; I-15 Corridor Operations Project (15 COP); I-215/Placentia and 71/91
interchange improvements; SR-60 truck lanes; and Mid County Parkway projects included in
the Western County Highway Delivery Plan.
• Continue operations planning and design of the SR-241/91 Express Connector and I-15 Express
Lanes Northern Extension projects led by other agencies.
• As lead agency for partner agency projects, continue construction of the I-15/Railroad
Canyon interchange project and commence preliminary engineering of the I-10/Highland
Springs Interchange project.
• Consider opportunities to implement technology-based strategies, or Smart Freeway projects,
to manage traffic, reduce congestion and pollution, increase safety, and improve the quality
of commutes.
• Maintain and enhance communication and collaboration with the California Department of
Transportation (Caltrans) to improve the Commission’s ability to deliver critical projects.
• Collaborate with local jurisdictions to implement Transportation Uniform Mitigation Fee (TUMF)
regional arterial program projects and facilitate the delivery of eligible arterial improvements
in western Riverside County (Western County).
• Continue active engagement in state and federal efforts to streamline and modernize the
California Environmental Quality Act (CEQA) and the National Environmental Policy Act
(NEPA) to improve the Commission’s ability to deliver critical projects.
Operations
• Efficiently operate express lanes and achieve high customer satisfaction through reduction in
congestion, mobility improvements, and management of demand. • Efficiently and cost effectively operate the commuter rail stations and facilities and Perris
Valley Line rail corridor to ensure reliable high quality commuter rail service. • Efficiently provide motorist assistance services so that motorists can conveniently travel and
use transportation facilities as safely as possible.
124

Regional Programs
• Maintain an active involvement in state and federal legislative matters to ensure that the
Commission receives proper consideration for transportation projects and funding.
• Monitor transit trends and the associated economic, social, and public health factors that
impact ridership and create barriers to transit growth.
• Subsidize reliable and cost-effective Metrolink commuter rail service to and from Riverside
County; SCRRA is the operator of Metrolink.
• Provide continued leadership in the planning and development of the Coachella Valley-San
Gorgonio Pass corridor rail service.
• Support innovative programs that provide transit assistance in hard to serve rural areas or for
riders with special transit needs.
• Promote cost controls and operating efficiency for transit operators.
• Maintain effective partnerships among commuters, employers, and government to increase
the efficiency of our transportation system by encouraging and promoting motorized and
non-motorized transportation alternatives such as vanpools.
Management Services
• Maintain close communication with Commissioners and educate policy makers on all issues
of importance to the Commission.
• Develop and execute a communications and public engagement strategy for the purposes
of education, information, and customer service.
• Maintain administrative program delivery costs below the policy threshold of 4% of Measure A
revenues; the FY 2021/22 Management Services budget is X.XX% of Measure A revenues.
• Maintain administrative salaries and benefits at less than 1% of Measure A revenues; the FY
2021/22 administrative salaries and benefits is .XX% of Measure A revenues.
• Maintain prudent cash reserves to provide some level of insulation for unplanned
expenditures.
• Maintain current strong bond ratings with rating agencies.
• Establish and maintain revenues and reserves generated from toll operations to be available
for debt service in accordance with toll supported debt agreements; maintenance, repair,
rehabilitation, administration and operations; and capital projects within the corridor.
Linking Commission and Departmental Mission Statements
The following matrix (Table 1) illustrates the linkage of the Commission’s core mission statements
described in this section to the individual departmental mission statements included in each
department’s section.
125

Table 1 – Relationship between Commission and Departmental Mission Statements
Department Quality
of Life
Operational
Excellence
Connecting
the Economy
Responsible
Partner
Management Services
Executive Management X X X X
Administration X
External Affairs X X X
Finance X
Regional Programs
Planning and Programming X X X X
Rail Maintenance and Operations X X X X
Public and Specialized Transit X X X X
Commuter Assistance X X X X
Motorist Assistance X X X X
Capital Project Development and Delivery X X X X
Toll Operations X X X X
126

Fiscal Accountability Policies As the steward of local, state, and federal resources, RCTC maintains financial policies that
promote fiduciary responsibility and organizational excellence.
Financial Planning
Balanced Budget RCTC adopts an annual budget in which operating and capital
expenditures and other financing uses are equal to or less than identified
revenues and other financing sources as well as available fund balances.
Administration Allocations from local and state sources and toll operations fund
administrative costs, including salaries and benefits.
o Administrative salaries and benefits cannot exceed 1% of Measure A
sales tax revenues.
o Administrative costs will not exceed 4% of Measure A sales tax revenues
(inclusive of the 1% salary limitation).
Retirement Benefits RCTC contributes 100% of the annual requirement related to its
proportionate share of the net pension liability and to the postretirement
health care benefits.
Capital Projects Multi-year capital projects are consistent with the strategic plan and
budgeted by fiscal year, based on best available estimates.
Reserves RCTC establishes and maintains reserves in accordance with Measure A
and TDA policies as well as debt agreements.
Revenues
Sales Tax RCTC prepares annual and mid-year revised revenue projections to ensure
use of current and relevant data; staff may adjust amounts during the
budget process to reflect the most current economic trends.
Tolls RCTC-adopted policies establish congestion pricing in order to optimize
throughput on toll facilities while generating revenue to meet all financial commitments related to:
o Debt issued to construct or repair any portion of the toll facility, payment
of debt service, and satisfaction of other covenants and obligations
related to indebtedness of the toll facility, including applicable reserves;
o Development, maintenance, repair, rehabilitation, improvement,
reconstruction, administration, and operation of the toll facilities,
including toll collection and enforcement and applicable reserves; and
o Projects within the corridor that generated the revenue.
Funding Sources RCTC uses local funding sources to maximize federal and state funding of
projects.
Sale of Properties RCTC returns proceeds from the disposition of excess properties to the
programs that provided the funding sources for the property acquisition.
Expenditures/Expenses
Priorities RCTC reviews established priorities for planning and programming of capital
projects annually.
Accountability RCTC compares actual expenditures/expenses to the budget on at least a
quarterly basis and appropriately notes, explains, and justifies significant
deviations.
Procurement RCTC ensures competitive, transparent, objective, and fair procurement
selection processes in accordance with policies adopted on February 10, 2021.
127

Capital and Intangible
Assets
On a government-wide basis, RCTC records capital and intangible assets at historical costs, estimated historical costs if purchased or constructed, or
estimated fair value at date of donation. RCTC maintains such assets in a
state of good repair and safeguards them from misuse and
misappropriation.
o RCTC generally does not capitalize infrastructure, which title will be
vested with Caltrans or other governmental agency.
o RCTC depreciates capital and amortizes intangible assets over the
estimated useful life or service concession term.
Debt Management
Debt Limitation Outstanding sales tax revenue debt cannot exceed $975 million, in
accordance with Measure K approved by a majority of the voters in
November 2010; RCTC can issue toll-supported debt for specific highway
projects based on amounts authorized by the Commission.
Management RCTC maintains and updates the Debt Management Policy, as adopted on March 11, 2020, and Interest Rate Swap Policy, as adopted July 12, 2006, for
matters related to sales tax revenue and toll-supported indebtedness.
Coverage RCTC maintains debt coverage ratios of 2.0x on all senior sales tax revenue
debt and 1.3x on all toll-supported debt.
Issuance RCTC issues debt for major capital projects including engineering, right of
way, construction, and design-build; RCTC will not finance operating
requirements except for initial toll operations. Costs of issuance, including
the standard underwriter’s discount, do not exceed 2% unless specifically
authorized.
Maturity All sales tax revenue debt matures prior to the termination of 2009 Measure
A on June 30, 2039; all toll-supported debt matures prior to the expiration of
toll facility agreements.
Cash Management
Management RCTC invests funds in order of priority (safety, liquidity, and yield) in
accordance with the Investment Policy, adopted on August 12, 2020, or
debt agreements.
Receipts Where possible, RCTC encourages receipt of funds by wire transfer to its
accounts.
Payments RCTC makes cash disbursements to local jurisdictions and
vendors/consultants in a timely manner.
Operating Balances RCTC maintains amounts in the bank operating account at the amount
necessary to meet monthly expenditures/expenses.
Accounting and Financial Reporting
Accounting System RCTC maintains an ERP system that integrates project and toll operations
accounting needs and improves accounting efficiency.
Reporting RCTC issues a Comprehensive Annual Financial Report (CAFR); separate
financial reports for the LTF, STA, Proposition 1B Rehabilitation and Security
Project Accounts, SB 1 SGR Program, Low Carbon Transit Operations
Program (LCTOP), and toll operations; and the State Controller’s
Transportation Planning Agency Financial Transactions Report and
Government Compensation in California Report.
Audits An independent accounting firm conducts an annual audit of the
Commission’s accounting books and records; RCTC obtains audits of
Measure A and TDA funding recipients for compliance and other matters in
a timely manner.
128

AGENDA ITEM 8


Agenda Item 8
RIVERSIDE COUNTY TRANSPORTATION COMMISSION
DATE: February 22, 2021
TO: Budget and Implementation Committee
FROM: Jillian Guizado, Planning and Programming Director
THROUGH: John Standiford, Deputy Executive Director
SUBJECT: County of Riverside Request for Additional Funds for the Salt Creek Trail
STAFF RECOMMENDATION:
This item is for the Committee to:
1) Approve federal Congestion Mitigation and Air Quality (CMAQ) funds in the additional
amount of $160,000 for a total amount of $5,844,203 to fully fund construction of the
Salt Creek Trail project; and
2) Forward to the Commission for final action.
BACKGROUND INFORMATION:
In 2014, the Commission approved a Multifunding Call for Projects consisting of federal CMAQ,
Surface Transportation Block Grant (STBG), and 2009 Measure A Western County Regional
Arterial funds. From that call for projects, the Salt Creek Trail project was approved for
$5,090,000 of CMAQ funds to construct a 4-mile segment in the city of Menifee and a 1-mile
segment in the city of Hemet. The original project called for a Class I bike path and a soft
pedestrian path was to be constructed along the north side of the Salt Creek flood control
channel and along Domenigoni Parkway (Attachment 1).
The County of Riverside (County) was, and continues to be, the lead agency for the project, and
was required to complete a lengthy and complex environmental process through the National
Environmental Protection Act. The project is located within a major creek which required
extensive biological and cultural studies. The project was originally an 8-mile segment; however,
a decision to remove a 3-mile segment was necessary to offset significantly increased costs for
offsite habitat restoration and environmental documentation.
Coordination efforts with private and public property owners including Riverside County Flood
Control & Water Conservation District, Caltrans, and the cities of Hemet and Menifee were also
undertaken. Approval of design review, maintenance agreements, and permits were required by
each of these agencies. In addition, reviews were required by Caltrans Headquarters and the
Federal Highway Administration as the trail crosses under Interstate 215 necessitating an
encroachment permit exception. The County also worked on securing a public trail easement as
a gift with no cost to the County.
129

Agenda Item 8
The Salt Creek Trail is an important regional active transportation project and benefits the cities
of Hemet and Menifee and many nearby communities. The ultimate length of the trail is planned
to be 16 miles and this first segment will serve as a catalyst for future extensions. As a regional
facility, this project provides significant greenhouse gas and public health benefits.
When the County opened bids for the construction phase of the project, the low bid was higher
than the engineer’s estimate. The total cost of construction was established as $5,684,203. The
County awarded the contract in December 2019. In the same month, the Commission approved
an increase in CMAQ funding for the project in the amount of $594,203.
DISCUSSION:
On December 16, 2020, the County reached substantial completion of the project and it was
opened to the public for use. During construction, the project experienced unexpected delays
and expenses related to burrowing owls, COVID-19, mitigation fees for off-site habitat
restoration, storm damage repair, and underestimated costs of a material and utility relocations.
In total, the project is over budget $478,055.
The County submitted a letter to the Commission on January 12, 2021 (Attachment 2) requesting
an increase in CMAQ funds on the project for approximately one-third of the overage. The
current and proposed funding contributions from each participating agency are summarized in
the table below.
Current and Proposed Funding Contributions for the Salt Creek Trail Project
Agency Current
Funding
Proposed Addt’l
Funding
Total Proposed
Funding
CMAQ (RCTC) $ 5,684,203 $ 160,000 $ 5,844,203
County Park District 1,737,000 157,000 1,894,000
County Transportation 242,610 161,055 403,665
E. Municipal Water District 40,650 0 40,650
Total Construction $ 7,704,463 $ 478,055 $ 8,182,518
Staff recommends increasing CMAQ funds for this project, bringing the total of CMAQ funding
for the Salt Creek Trail to $5,844,203. Currently, there are sufficient CMAQ funds to cover the
$160,000 shortfall without impacting other approved CMAQ projects. Given the regional benefit
and importance of the project, Commission approval of a portion of the cost increase is
appropriate and will assist in ongoing trail development without an impact to local funding.
Federal CMAQ funds are administered through Caltrans. Therefore, there is no fiscal impact to
the Commission’s budget.
Attachments:
1) Salt Creek Trail Map
2) January 12, 2021 Letter from County of Riverside
130

ATTACHMENT 1
131

COUNTY OF RIVERSIDE TRANSPORTATION AND
LAND MANAGEMENT AGENCY
Transportation Department
4080 Lemon Street, 8th Floor · Riverside, CA 92501 · (951) 955-6740
P.O. Box 1090 · Riverside, CA 92502-1090 · FAX (951) 955-3198
Mark Lancaster, P.E.
Director of Transportation
Mojahed Salama, P.E.
Deputy for Transportation/Capital Projects
Richard Lantis, P.L.S.
Deputy for Transportation/Planning and
Development
January 12, 2021
Ms. Anne Mayer Executive Director Riverside County Transportation Commission 4080 Lemon Street, 3rd Floor Riverside, CA 92501
Subject: Request for additional construction funds – Salt Creek Trail Project
Dear Ms. Mayer:
The County of Riverside is currently finalizing construction of the first phase of an ultimate 16-mile long Salt Creek Trail. The first phase improvements consisted of constructing a Class I paved bike path, with an adjacent soft-surfaced pedestrian path, for 4 miles along the north side of the Salt Creek flood control channel in the City of Menifee, and for 1 mile along the north side of Domenigoni Parkway in the City of Hemet.
The County substantially completed the construction of the trail and opened it for public use on December 16, 2020.
The project utilizes funding from the Congestion Mitigation Air Quality program (CMAQ), Riverside County Regional Park and Open-Space District (County Park District), Eastern Municipal Water District (EMWD), and County of Riverside -Transportation Department (County Transportation).
The purpose of this letter is to seek additional CMAQ funds to cover unexpected costs. Extra costs were incurred to protect birds in accordance with environmental regulatory agency permits, including the installation of noise barriers for nesting migratory birds, as well as the suspension of construction along a one-mile segment of the trail for 4 months as burrowing owl fledglings grew mature enough to leave nests. In addition, extra costs were incurred due to delays in the manufacturing and delivering of traffic signal poles due to the COVID pandemic, and an increase in the mitigation fees charged by the resource conservation district performing offsite habitat restoration. Other costs included an underestimated quality of aggregate base, the relocation of unknown utilities, and storm damage repair.
Additional costs, such as right-of-way payment to an affected property owner and increased construction management fees, are proposed to be funded through the County Park District and County Transportation.
Shown below are the project costs and proposed funding breakdown to cover current funding shortfalls.
ATTACHMENT 2
132

133


AGENDA ITEM 9

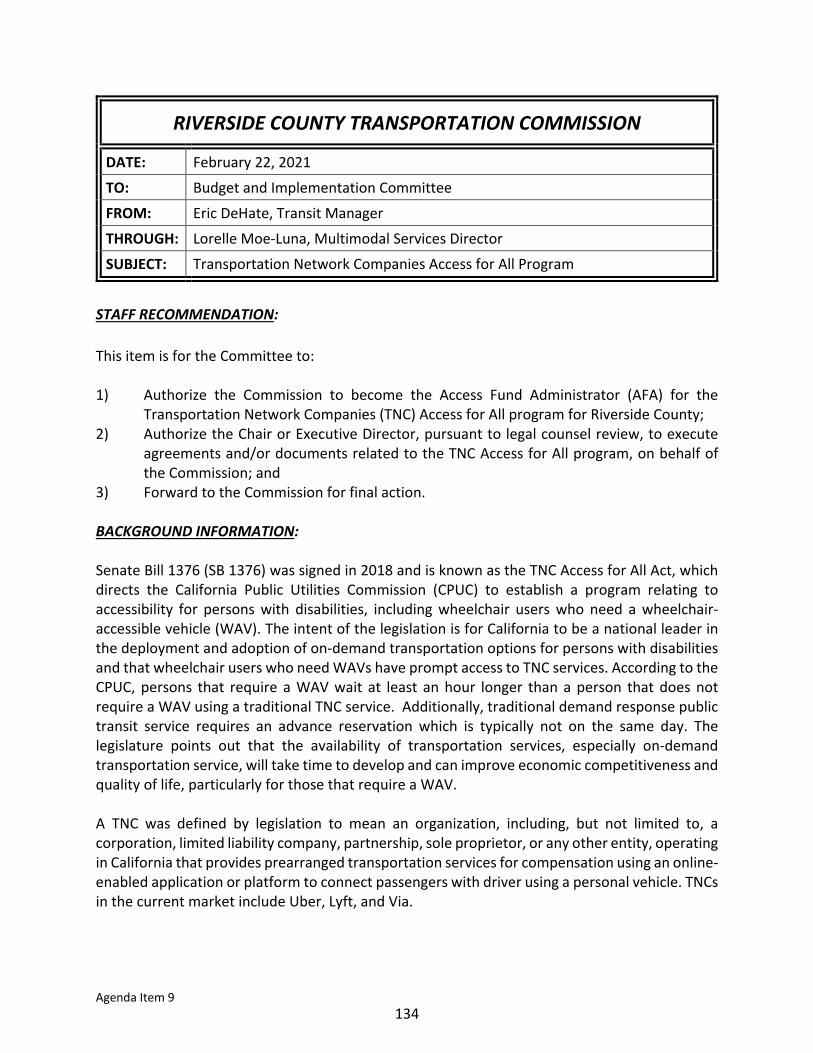
Agenda Item 9
RIVERSIDE COUNTY TRANSPORTATION COMMISSION
DATE: February 22, 2021
TO: Budget and Implementation Committee
FROM: Eric DeHate, Transit Manager
THROUGH: Lorelle Moe-Luna, Multimodal Services Director
SUBJECT: Transportation Network Companies Access for All Program
STAFF RECOMMENDATION:
This item is for the Committee to:
1) Authorize the Commission to become the Access Fund Administrator (AFA) for the
Transportation Network Companies (TNC) Access for All program for Riverside County;
2) Authorize the Chair or Executive Director, pursuant to legal counsel review, to execute
agreements and/or documents related to the TNC Access for All program, on behalf of
the Commission; and
3) Forward to the Commission for final action.
BACKGROUND INFORMATION:
Senate Bill 1376 (SB 1376) was signed in 2018 and is known as the TNC Access for All Act, which
directs the California Public Utilities Commission (CPUC) to establish a program relating to
accessibility for persons with disabilities, including wheelchair users who need a wheelchair-
accessible vehicle (WAV). The intent of the legislation is for California to be a national leader in
the deployment and adoption of on-demand transportation options for persons with disabilities
and that wheelchair users who need WAVs have prompt access to TNC services. According to the
CPUC, persons that require a WAV wait at least an hour longer than a person that does not
require a WAV using a traditional TNC service. Additionally, traditional demand response public
transit service requires an advance reservation which is typically not on the same day. The
legislature points out that the availability of transportation services, especially on-demand
transportation service, will take time to develop and can improve economic competitiveness and
quality of life, particularly for those that require a WAV.
A TNC was defined by legislation to mean an organization, including, but not limited to, a
corporation, limited liability company, partnership, sole proprietor, or any other entity, operating
in California that provides prearranged transportation services for compensation using an online-
enabled application or platform to connect passengers with driver using a personal vehicle. TNCs
in the current market include Uber, Lyft, and Via.
134

Agenda Item 9
The TNC Access for All program is funded by a $0.10 per trip charge that is collected by the TNCs
and remitted to the CPUC quarterly by each county for the Access Fund. Funding under this
program can fluctuate quarter to quarter depending on the number of trips traveled on TNCs.
CPUC has estimated that Riverside County may receive approximately $225,000 to $230,000
annually from the Access Fund. However, this may change over time because TNCs are allowed
to request offsets quarterly against these amounts if they can demonstrate that they have
improved WAV service in the respective county. The CPUC will establish service levels by county,
and a TNC may become exempt from collecting those fees if it can demonstrate for four
consecutive quarters that it can maintain that level of service.
The CPUC has defined eligible AFAs as Metropolitan Planning Organizations (MPOs) and Regional
Transportation Planning Agencies/County Transportation Commissions. If potential AFAs decide
not to administer the TNC Access for All Program for its county or counties, the CPUC would then
ask Caltrans to be the AFA for those jurisdictions.
The guidelines for this program are still under development. In the coming months, the CPUC
will be working with stakeholders to establish service level thresholds for each county and
determine what types of projects are eligible for funding, and whether the program can be
administered annually or on a multi-year basis.
DISCUSSION
Staff recommends that the Commission submit its intent to the CPUC to become the AFA for
Riverside County. In June 2021, CPUC staff will take a resolution to its board with
recommendations for AFAs by county. Commission staff has also been in coordination with the
Southern California Association of Governments, who is the MPO for Riverside County to notify
it of the Commission’s intent to serve as the AFA for Riverside County. Once an AFA is confirmed
for a county, it will be required to develop local procedures and guidelines to administer a
competitive WAV call for projects based on criteria developed by the CPUC considering the gaps
and needs for accessibility service in its county. The local administration process includes
developing an application and evaluation process, making awards to successful applicants,
annually certifying the disbursement of funds, and providing a consolidated quarterly report. An
AFA may seek up to 15 percent of the available funds to administer the program and may also
opt out by notifying the CPUC if it chooses.
Although guidance for this program is still under development by the CPUC, staff is confident it
can deliver another program that compliments the Measure A Specialized Transit Program and
recommends the Commission become the AFA for Riverside County.
There is a no fiscal impact for this item, and actions related to this program will be brought back
at a future Commission meeting.
135

AGENDA ITEM 10


Agenda Item 10
RIVERSIDE COUNTY TRANSPORTATION COMMISSION
DATE: February 22, 2021
TO: Budget and Implementation Committee
FROM: David Knudsen, Legislative Affairs Manager
THROUGH: John Standiford, Deputy Executive Director
SUBJECT: State and Federal Legislative Update
STAFF RECOMMENDATION:
This item is for the Committee to:
1) Receive and file an update on state and federal legislation; and
2) Forward to the Commission for final action.
DISCUSSION:
State Update
State Distribution of COVID-19 Federal Emergency Transportation Funding
The State is in the process of determining how to distribute approximately $912 million in federal
transportation funding California is expected to receive as part of the $900 billion Coronavirus
Response and Relief Supplemental Appropriations Act (CRRSAA) Congress passed in December
2020. As indicated in previous staff reports, CRRSAA provided $10 billion to state departments
of transportation via the Surface Transportation Block Grant (STBG) program. States may also
use funds for preventative and routine maintenance, operations, personnel, debt service, and
coverage for other revenue losses.
Officials in Sacramento are discussing the method by which these relief funds will be used and
distributed. The Self-Help Counties Coalition (SHCC) sent a letter on February 3, 2021, to
California State Transportation Secretary David Kim outlining the need to distribute the majority
of relief funds as locally as possible. In the letter, SHCC recommended using the existing STBG
formula so that funds are directed to priority projects in both urbanized and smaller metropolitan
areas. Other public stakeholder entities, including Caltrans, local government organizations, and
the California Transportation Commission (CTC), are discussing a distribution methodology for
the funds. There has been some discussion that the state will keep most of the funds to backfill
lost gas tax revenue.
136

Agenda Item 10
The CTC held a workshop on February 9, 2021, to gather recommendations from all stakeholder
groups. RCTC staff continues to participate in this process to advocate that the state distribute
the relief funds as local as possible. Staff will update the Commission as new details are available.
Federal Update
Congress continues to consider the Biden Administration’s proposed a $1.9 trillion COVID-19
relief package, the American Rescue Plan, and is currently developing legislation to implement
this proposal. House Transportation and Infrastructure Committee Chair Peter DeFazio (Oregon)
released details on February 9, 2021, regarding transportation funding in the proposal, which
includes:
• $50 billion for FEMA’s Disaster Relief Fund
• $30 billion for transit to assist with operating costs, including payroll and personal
protective equipment
• $8 billion for airports
• $3 billion for the Economic Development Administration
• $3 billion for aerospace manufacturing
• $1.5 billion for Amtrak
The American Rescue Plan also proposes $350 billion be made available for state and local
governments. The Plan does not include a specific allocation for state departments of
transportation or highway projects. Congress is utilizing the budget reconciliation process to fast
track the COVID-19 relief legislation to pass the bill by March 14, 2021.
Once Congress passes the COVID-19 relief legislation, the focus will turn to a federal economic
stimulus. Details of an economic stimulus plan have not yet been revealed but it is anticipated
that there will be an infrastructure component to the package. Staff have already started working
with congressional offices to answer questions about future transportation projects. Those
discussions will continue in the weeks ahead.
Staff is monitoring and participating in the process and will provide the Commission with updates
as details emerge.
Attachment: Self-Help County Coalition COVID-19 Relief Letter
137

SELF HELP COUNTY COALITION – 1121 L Street #700 Street, Sacramento Phone: (916) 514-9967 Fax (916) 914-2412
Alameda County Transportation Commission Contra Costa Transportation Authority Fresno County Transportation Authority Imperial County Transportation Commission Los Angeles County Metropolitan Transportation Authority Madera County Transportation Commission Transportation Authority Of Marin Merced County Association of Governments Transportation Agency for Monterey County Napa Valley Transportation Authority Orange County Transportation Authority Riverside County Transportation Commission Sacramento Transportation Authority Santa Barbara County Association of Governments San Benito County Governments San Bernardino County Transportation Authority Santa Clara Valley Transportation Authority Santa Cruz County Regional Transportation Commission
February 3, 2021 Secretary David Kim
California State Transportation Agency, Secretary 915 Capitol Mall, Suite 350B Sacramento, CA 95814 RE: Distribution of Federal H.R. 133 Highway Funds for California
Dear Secretary Kim: The Self-Help Counties Coalition is thankful for the partnership with the State of California as we collaboratively work together to ensure our state’s multi-modal
transportation infrastructure continues to be safe and reliable while putting thousands of Californians to work to assist with the economic recovery from the impacts of the COVID-19 pandemic. As you are aware, the Self-Help Counties Coalition represents a coalition of 25 counties (representing 80% of the state’s population) that generate over $5 billion annually through voter approved
transportation sales tax measures. These measures help our agencies to partner with the state on highway investments and to fund and deliver critical improvements like transit, rail, and bicycle and pedestrian projects that also help meet statewide goals like improving safety, reducing congestion and reducing greenhouse gas emissions. Similar to other traditional transportation funding sources, local sales tax revenues
have also been impacted by the COVID-19 pandemic. As part of the Coronavirus Response and Relief Supplemental Appropriations Act, H.R 133, which was signed into law on December 27, 2020, California will receive approximately $912 million of the $10 billion that is provided for states for activities
eligible under the Surface Transportation Block Grant (STBG) program, one of the most flexible federal transportation funding sources. Per H.R. 133, funds can also be used on preventative maintenance, routine maintenance, operations, and personnel. This funding can provide critical assistance to both the State and regions to backfill any revenue losses, and also help facilitate infrastructure improvements.
Similar to the 2009 American Recovery and Reinvestment Act (ARRA), the Self-Help Counties Coalition requests that the $912 million identified for California be apportioned to regional agencies through the existing STBG formula (consistent with the most recent STBG FFY 2020/21 Apportionment Estimate for Distribution
as published by the California Department of Transportation on October 29, 2020) which provides flexible funding to help deliver critical projects. H.R. 133 suballocates a portion of the stimulus funds to large urbanized areas which can be accommodated through the existing STBG formula.
Through the use of the existing STBG formula, we can ensure that these funds are directed to priority projects in those regions and that small metropolitan planning organizations benefit from the bill’s funds.
138

SELF HELP COUNTY COALITION – 1121 L Street #700 Street, Sacramento Phone: (916) 514-9967 Fax (916) 914-2412
Our member agencies and local partners have shovel-ready projects that can utilize funding
immediately. These projects address safety, reduce greenhouse gas emissions, equity and provide
multi-modal options for all users to help strengthen our transportation network.
By committing to the STBG process, these funds can be programmed quickly to priority projects
that align with federal and state priorities while meeting local needs. These projects will help put
thousands of Californians to work while providing equitable and sustainable traveling options for
all users.
We look forward to discussing the distribution of funding at the upcoming workshops discussed at
the January 27 California Transportation Commission (CTC) meeting.
If you have any questions, please contact me at (916) 290-2900
Thank you in advance for your consideration.
Keith N. Dunn
Executive Director
cc:
Ms. Ronda Paschal, Deputy Legislative Secretary, Governor Newsom
Mr. Mark Tollefson, Deputy Legislative Secretary, Governor Newsom
Ms. Elissa Konove, Undersecretary, California State Transportation Agency
Mr. Mitch Weiss, Executive Director, California Transportation Commission
Ms. Tanisha Taylor, Chief Deputy Director, California Transportation Commission
Mr. Toks Omishakin, Director, California Department of Transportation
139