Industry Report 2022 - SilverDoor Apartments
140
-
Upload
khangminh22 -
Category
Documents
-
view
0 -
download
0
Transcript of Industry Report 2022 - SilverDoor Apartments

1
C
M
Y
CM
MY
CY
CMY
K
cover_L_outlines.pdf 1 09/05/2022 16:46

2
C
M
Y
CM
MY
CY
CMY
K
SDA_ad_outlines_CMYK_FINAL.pdf 1 04/05/2022 16:22

3
DisclaimerWhilst every effort has been made to ensure accuracy, neither SilverDoor nor Travel Intelligence Network can be held responsible for any errors or omissions.
Confidentiality NoticeCopyright © 2022 by SilverDoor. All rights reserved. This document or any portion thereof may not be reproduced or used in any manner whatsoever without the express written permission of the Company. The information contained within is strictly confidential and/or protected by law. If you are not the intended recipient of this document you must not make any use of this information, copy, store, disclose or show it to any unauthorised person.
Global Serviced Apartment Industry Report 2022
In association with Frasers Hospitality, Oakwood, Oasis Corporate Housing
9th edition
Published by SilverDoor
Denver, Madrid, Lancaster, London, Hyderabad, Singapore www.silverdoorapartments.com
Compiled by Travel Intelligence Network www.the-tin.com
Designed by Creativo
www.creativodesign.co.uk
C
M
Y
CM
MY
CY
CMY
K
SDA_ad_outlines_CMYK_FINAL.pdf 1 04/05/2022 16:22

4
Contents
Page 5 Report methodology, editorial team
Page 6 Sources & acknowledgements
Page 7 Glossary of terms
Page 8 Introduction
Page 10 About SilverDoor and The Apartment Service
Page 12 Global lodging forecasts
Page 16 Commentary – a global perspective
Page 20 GSAIR survey results & analysis
Page 28 A changing market?
Page 38 Buyer, Supplier and Agent - different perspectives on the extended stay market
Page 44 Assessing performance - hotels vs extended stay
Page 48 Operator & supplier update - global supply, top 15 brands
Page 56 Alternative accommodation models
Page 60 Trends driving the extended stay sector
Page 70 Impact of Covid on the extended stay sector
Page 74 Is accreditation important?
Page 79 Investor outlook
Page 82 Regional reports - introduction
Page 84 Regional report, Africa
Page 90 Regional report, Asia
Page 96 Regional report, Australasia
Page 102 Regional report, Europe
Page 108 Regional report, LATAM
Page 114 Regional report, Middle East
Page 119 Regional report, USA & Canada
Page 128 Essential takeaways
Page 130 Sponsor profiles
Page 136 List of charts & tables

5
The 2022 edition of the Global Serviced Apartment Industry Report has been responsibly compiled
from a range of primary and secondary global sources, both in and closely aligned with the serviced
apartment sector.
We always strive to fill the Global Serviced Apartment Industry Report with data about the market.
As in previous editions, much of the data presented here comes from the survey undertaken especially
for this report.
The survey for this edition of the report was conducted during September and October 2021 amongst
6,000 corporates, 2,000 serviced apartment operators and 1,800 agents. Over seventy industry insiders
contributed through interviews or written comments between September 2021 and May 2022.
Wherever possible, the results of this year’s GSAIR survey have been compared with previous years’ to
highlight trends within the world of serviced apartments.
All other information sources are fully attributed and include other publicly available reports and research
around the serviced apartment sector or the wider hospitality industry. In all cases, we present the latest
figures available within the market.
Report methodology
Editorial teamMark Harris (Contributing Editor)Mark Harris joined the business travel industry in 1990, has been a Director of
Travel Intelligence Network since 2005 and was voted the business travel industry’s
Personality of the Year in 2006. As well as the Global Serviced Apartment Industry
Report, TIN’s output includes the Meetings Industry Report, 70+ white papers and over
100 blogs, The Serviced Apartment Awards and The People Awards. After lunch he is
chairman of the PitchingIn Northern Premier League and an FA councillor.
Charles McCrowCharles was the driving force behind The Apartment Service’s 40-year success until
its acquisition by SilverDoor’s parent company in 2021. With a background in property
development and construction, Charles is a long-standing member of several industry
bodies, a founder member of the UK’s Association of Serviced Apartment Providers
(ASAP) and a winner of the Serviced Apartment News Industry Inspiration and Lifetime
Achievement awards. Under his leadership the company has been at the forefront of
innovation in the sector.
Bard VosBard Vos has been at The Apartment Service since 1996, becoming Reservations
Manager in 1997 and then joining the marketing team in 2004 where he has been
involved in all the company’s marketing activities. Bard has written for every edition of
the Global Serviced Apartment Industry Report to date. Now, as part of the SilverDoor
team, he has again compiled the global serviced apartment listings.

6
Sources & acknowledgementsIndividual sources are shown in the footnotes at the bottom of each page of this report.
The editorial team would like to thank the following for their contributions to this edition of GSAIR.
Alexander Goransson, Euromonitor
Alex Neale, SilverDoor
Anton Kargaltsev, Forenom
Bard Vos, SilverDoor
Ben Subedar, AptsColombia
Burak Ünver, SMARTments business
Charles McCrow, Roomspace
Chris Miller, Convido
Daniel Blaauw, MUi STAYS
David Mansfield, Quest Apartment Hotels
Dean Schreiber, Oakwood
Deborah Heather, M-Assessment
Declan Fitzhenry, The CityStay Group
Dominic Sherry, Flying Butler Apartments
Elie Milky, Radisson Hotel Group
Evelyn Haran, PREM Group
Gavan James, Nomad Temporary Housing
George Sell, Serviced Apartment News
Hanish Vithal, SilverDoor
Jason Delany, Staycity Group
Jeff Tisdall, Accor
Jenni Määttä, Forenom
Johannes Kangas, Forenom
John Philipson, Cheval Residences
Julia Harnischfeger, JOYN Serviced Living
Kim Krollman, OWL
Lee Whiteing, Global Secure Accreditation
Lucky Nwosu, Suites by Rehoboth
Marcus Angell, Habicus Group
Marie Hickey, Savills
Mark Meehan, Travelport
Mark Skinner, The Highland Group
Martin Klima, SilverDoor
Martin Kubler, ME Hotel Consultancy
Mary Ann Passi, CHPA
Merilee Karr, UnderTheDoormat/STAA
Michal Rao, STR
Molly Johnson-Jones, Flexa
Moran Machtey, Gold Tree Hospitality
Nick Barton, edyn
Nick Grassick, PH Real Estate
Parker Stanberry, Oasis Collections
Pauline Houston, SilverDoor
Pilar Morais, CHI International
Rachel Angell, Domus Stay
Robert Alley, Roomzzz
Scott Sullivan, Enplus
Shabina Awan, SilverDoor
Sian Sayward, Inntel/beam
Steve Banks, Agiito
Steve Frey, Oasis Corporate Housing
Steve Lowy, Anglo Educational &
The Residence Apartments
Steve Reynolds, TRIPBAM
Stuart Winstone, SilverDoor
Tara Scrivener, Altovita
Tim Deuysen, Living Hotels by Derag
Toby Roberts, SilverDoor
Victoria Jackson, SilverDoor
Vivi Himmel, Altovita
Wayne Arthur, Staycity Group
Wesley Shelling, SilverDoor
Zed Sanjana, Veriu Group

7
Glossary of termsSeveral acronyms or abbreviations are used in this report. These are as follows.
ADR: Average Daily Rate.
APAC: Asia-Pacific (A-sia PAC-ific).1
ASAP: Association of Serviced Apartment Providers (UK).
BPS: Basis points are a unit of measurement used to quantify the change between
two percentages. A basis point is equal to one hundredth of one percent, or 0.01%.2
BTA: Business Travel Association (UK).
BTR: Build To Rent.
CHPA: Corporate Housing Providers Association (US).
Corporate housing: Residential apartments upgraded for short term rental and packaged together
with services such as cleaning, utility charges, local taxes telephone and TV.
There are two types of corporate housing; apartments let and maintained by the
operator on an on–going basis, and those rented specifically for a particular
housing requirement and length of time, after which they are handed back to
the owner. Corporate housing is also the term used in the US to describe
serviced apartments.
DE&I: Diversity, Equality, and Inclusion (also referred to as EDI).
ESG: Environmental, Sustainability, and Governance.
GDS: Global Distribution Systems (e.g. Amadeus, Travelport, Sabre).
Generation Z: Generation reaching adulthood in the second decade of the 21st century.
GBTA: Global Business Travel Association.
GSAIR: Global Serviced Apartment Industry Report.
Home Stay: Generic term for products like Airbnb and onefinestay. AKA home rental.
HSR: Hotel Supply Ratio (i.e. number of hotel rooms per ‘000 population).
MNC: Multi-National Company.
OBT: Online Booking Tool.
Occupancy: Percentage of occupied bedrooms in a hotel during a set period.
OTA: Online Travel Agent (e.g. Expedia, Hotels.com).
RevPAR: Revenue Per Available Room.
RMC: Relocation Management Company.
Short Term Rental: Furnished self-contained apartments that are rented for short periods of time,
usually by the month, as opposed to annual rentals in the unfurnished apartment
rental market.
SMEs: Small and Medium sized Enterprise.
STR: Short Term Rentals.
TMC: Travel Management Company (e.g. CWT, HRG etc).
USP: Unique Selling Point.
WTTC: World Travel & Tourism Council.
Yields: The annual return an investor is likely to see from an investment. It is calculated by
expressing a year’s rental income as a percentage of how much the property cost.
1. https://en.wikipedia.org/wiki/Asia-Pacific 2. https://www.ig.com/uk/glossary-trading-terms/basis-point-definition#:~:text=A%20basis%20point%20is%20a,one%20percent%2C%20or%200.01%25.

8
Introduction
For the first time, the SilverDoor Apartments
name proudly appears on the GSAIR cover
following the acquisition of The Apartment
Service by Habicus Group last year.
Of the brands and entities the group now
comprises, GSAIR is a shining jewel in the crown,
and we are fully committed to its continued
evolution in the coming years.
Throughout my 22 years in serviced apartments,
GSAIR has been the only regularly produced
publication that is purely data driven, providing a
true insight into the on-the-ground realities facing
our sector.
Few companies other than SilverDoor – bringing
together its extensive sector experience and
the additional intelligence incorporated through
the TAS acquisition – are equipped to gather
and analyse extended stay data on such a far-
reaching, truly global basis.
Hundreds of serviced apartment operators,
developers, and investors rely on this report for
business intelligence and rate and occupancy
benchmarking data. Quite simply, it’s become an
industry bible.
Power of the specialistThis year, SilverDoor will likely book upwards
of 1.5 million nights. Our job is to ensure that
the accommodation we source for our growing
number of clients meets their needs at the
best possible rates; we can do this because we
have over 3,000 serviced apartment operator
partnerships built on collaboration.
We don’t have any financial interest in the
properties we book, but we know exactly what
they can offer our clients because we update and
maintain what is arguably the sector’s largest
database of properties.
Most importantly, it is the long-term collaborative
relationships we have developed with operators
that gives the information we have accrued a
tangible, insight-driven value.
Welcome to this special ninth edition of the Global Serviced Apartment Industry Report.By Marcus Angell, Chairman, Habicus Group
Our collective insights indicate that the serviced
apartment sector is more diversified than it
should be, and we recognise that a period of
consolidation is necessary for the sector to evolve.
While we’ve led in consolidating the agency side,
it is the operator component which realistically
needs to slim down. This is another reason travel
and relocation decision makers place their trust
in us to source properties and manage their
bookings on their behalf.
Impact of pandemicThe data contained in this edition provides
reassurance that our sector is robust enough to
survive times of uncertainty. Furthermore, the
recent rapid growth in demand signifies that we
are still headed in the right direction.
The pandemic has been the single largest
disruptor during my time as a serviced apartment
agent. Unlike war, natural disasters, terrorism,
and financial crises which have resulted in a need
for movement and an increased demand for
accommodation, the Covid pandemic has been
the first to have the opposite effect on such a
global scale.
Consequently, the corporate world has had to
think harder about why they travel, to where and
how. The pandemic has brought into sharp focus
the benefits of extended stay in terms of personal
space, productivity, and sustainability.
Looking aheadDespite continuing challenges such as insufficient
stock capacity within the sector to meet demand,
or the frustrating differences in national and
regional regulatory requirements, the serviced
apartment sector has never had a better
opportunity to grow.

9

10
C
M
Y
CM
MY
CY
CMY
K
TAS_timeline-05_outlines_FINAL.pdf 1 04/05/2022 16:06
About SilverDoor and The Apartment Service

11
C
M
Y
CM
MY
CY
CMY
K
timeline-07_outlines_FINAL.pdf 1 04/05/2022 16:10

12
Global lodging forecast
By Alexander Goransson, Euromonitor
After two challenging years for the global travel
and tourism industry, Euromonitor International
forecasts that 2022 will be the year when
the industry finally starts to recover from the
pandemic which almost overnight wiped 75% off
global inbound tourism receipts.
The outlook for 2022 initially looked uncertain,
following the emergence of the Omicron variant
in late 2021, but at the time of writing in April
2022 for most regions the impact is less severe
than feared.
Despite the disruption caused by the pandemic,
consumer desire to travel remains undiminished.
Indeed, there is significant pent-up demand to
explore and discover new destinations, cultures,
and experiences. Staycations or “workcations” are
especially well placed to benefit from the recovery
and in turn short-term rentals are best positioned
to benefit from this growing segment.
Fig.1 Global Tourism Expenditure 2019-2021
Source: Euromonitor International, Travel 2022 edition.
3500
3000
2500
2000
1500
1000
500
0
US
$ b
illio
n
Domestic expenditure Inbound receipts
2019 2020 2021
One of the most immediate effects of the Covid
pandemic was a shift towards more domestic
travel, although this was driven more by necessity
than consumer interest. The growing importance
of domestic travel functioned as a cushion for the
global lodging industry whose value sales fell by
just over 50% in 2020 and remained depressed
in 2021.
Like all accommodation segments, short-term
rentals saw a sharp decline following the
lockdowns starting in 2020. However less
markedly so than for overall lodging with sales
declining by “just” 37%. The category held up best
in the key North American market, where sales in
2021 almost returned to pre-crisis levels,
in contrast to hotels.

13
Rapid recovery in the short term, but economic uncertainties may restrain mid-term growthWith the global spread of the Covid virus
increasingly under control more destinations are
lifting restrictions on inbound travel. Notably
Australia which re-opened its borders in late
February after sealing them for almost two years.
On the back of these developments, Euromonitor
International believes that 2022 will be the year
that international travel finally starts to recover
and with it demand for lodging. Nevertheless, the
question remains, how rapid will the recovery be?
We have developed a Travel Forecast Model
which generates a variety of forecast scenarios
based mostly on econometric drivers. The
recovery in lodging will be underpinned by the
recovery in inbound travel. Our travel forecast
model presents three scenarios for global
inbound tourism to recover from the pandemic.
Increasingly the recovery will be impacted less
by the spread of the virus but more by macro-
economic factors.
These include rising inflation, energy costs,
interest rates, the end of the recent stock-
market boom and the risk of recession. Not to be
overlooked is that Covid is still spreading in China
where at the time of writing (April 2022) Shanghai
is under strict lockdown. Russia s invasion of
Ukraine also represents a factor for uncertainty.
With travel restrictions being eased and, in many
destinations, removed completely, Euromonitor’s
Travel Forecast Model shows under all three
scenarios a rapid recovery through to 2024 driven
by the re-opening of the global tourism industry.
By 2024 global inbound tourism receipts are
forecast to have recovered to 80% of pre-
pandemic levels. From then onwards all three
scenarios show growth but at a lower rate
as macro-economic factors and consumer
confidence become the main impactor rather than
the pandemic. This is likely to restrain the mid-
term growth potential, with a complete recovery
not expected before 2026.
Fig.2 Hotels vs Short-Term Rentals Global Value Sales 2019-21
Source: Euromonitor International, Travel 2022 edition
700
600
500
400
300
200
100
0
US
$ b
illio
n
Hotels Short-Term Rentals
2019 2020 2021
Euromonitor International believes that 2022 will be the year that international travel finally starts to recover and with it demand for lodging

14
Asia Pacific and North America to drive Short-Term Rentals growthShort-term rentals showed their resilience during
the pandemic with sales impacted considerably
less than for hotels. Short-term rentals were also
able to better adapt to a growing demand for rural
destinations often in conjunction with increased
domestic travel.
Also, unlike hotels, in particular luxury and upscale
outlets, short-term rentals were less exposed
to the business travel segment which was hit
the most by the pandemic as potential business
travellers worked from home whilst discovering the
convenience of video conferencing over making
business trips.
In the post pandemic landscape short-term rentals
are forecast to be the most dynamic category with
sales outperforming global lodging and the key
hotels category, currently forecast to reach pre-
pandemic levels already this year, two years ahead
of hotels.
Notwithstanding the relatively robust performance
during the pandemic in 2020 and 2021 there
remains much untapped potential in short-term
rentals, where two regions stand-out as the main
drivers of growth.
In Asia-Pacific, short-term rentals value sales
are forecast to increase by 175% between 2021
and 2026, significantly outpacing hotels. In the
key Chinese market short-term rentals are a
perfect match for travellers increasingly seeking
experience-orientated accommodation, in contrast
to staying at standardised chained hotels. Chinese
travellers are demonstrating a growing interest
Fig.3 Global Inbound Tourism Receipts Recovery Scenarios
Source: Euromonitor International, Travel Forecast Model Note: Latest update 21 February 2022, before Russian invasion of Ukraine. Inbound receipts in US$ were at 2021 constant value prices
2000
1800
1600
1400
1200
1000
800
600
400
200
0
US
$ b
illio
n
C19 Pessimistic 2 C19 Pessimistic 1
2019 2020 2021 2022 2023 2024 2025 2026
Baseline
in lodging products, both hotels and short-term
rentals, which embrace unusual and locally inspired
design. Moreover, hotels and short-term rentals
that highlight their family-friendly or pet-friendly
features are welcomed by Chinese travellers.
Meanwhile in the North American market, short-
term rentals are forecast to grow at a slower rate
relative to hotels. This is in part due to them having
almost recovered to pre-pandemic levels in 2021,
unlike hotels, where the recovery will come later.
Euromonitor forecasts US$15bn additional sales
between 2021 and 2026 for short-term rentals in
North America, making the region the largest net
contributor to global growth.
The North American market is forecast to benefit
from the work-from-anywhere trend, with growth
driven by both longer stays and increased rentals
of whole properties especially in rural locations
rather than rooms in cities.
This is especially relevant in a region where
employees holiday time is limited, therefore short-
term rentals are better positioned than traditional
hotels to benefit from consumers combining leisure
travel with working from anywhere.
Opportunities in short-term rentals in Europe should
not be overlooked. Eastern Europe is forecast to be
the second fastest growing region after Asia Pacific,
up 133% between 2021 and 2026, however this is
exaggerated by coming from a low base.
Despite its relative maturity, Western Europe
will be the second largest contributor to global
growth with US$12bn additional sales during the
same period, but unlike the Asia Pacific and North
America, growth will be driven mostly by the
recovery rather than new sales.

15
Fig.4 Short Term Rentals sales by region 2021 vs. 2026
Source: Euromonitor International, Travel 2022 edition
50
60
40
30
20
10
0
US
$ b
illio
n
AsiaPacific
Australasia EasternEurope
LatinAmerica
Middle Eastand Africa
NorthAmerica
WesternEurope
2021 2026
Innovation essential to meet changing consumer preferencesCovid accelerated interest in, and evolution of,
the work-from-anywhere trend, as well as the
increased focus on health and wellbeing in a post-
crisis world.
As consumers’ priorities and preferences are also
changing, this in turn will lead to increased social
and environmental responsibility, re-evaluation of
consumption patterns and spending habits in the
new normal.
Saving on travel costs as well as embracing longer
staying guests will help to revive the industry,
overcome seasonality in the sector and address
over-tourism. Ultimately however the business
travel sector is reinventing itself through the
introduction of new practices and services aimed
at consumer segments such as millennials and
digital nomads.
Hotel players have been very proactive developing
new programmes and schemes to entice more
“bleisure” travellers. Hyatt for example launched
‘The Great Relocate Package’ while citizenMhotels
introduced a global subscription service tailored to
remote workers.
However, the global lodging industry will not
just have to rely on the recovery and “work from
anywhere” to drive longer term growth. To make
the most of the recovery lodging suppliers will
need to factor in sustainability and climate change.
Innovation will also be fundamental to tackle the
ever-increasing climate risks, together with the
demographic, social and technological shifts that
the pandemic has shown can have an overnight
impact on consumer behaviour. Ultimately,
transformation, creativity, climate awareness,
inclusion, diversity, and fun are the foundations for
the rebirth of travel. With innovation taking shape
in terms of digital, sustainable, and safe travel there
is much hope for a better long-term recovery.

16
Commentary - a global perspective
By Charles McCrow, CEO, Roomspace 3
This is the ninth edition of GSAIR. Created to shed
light on a sector of the lodging industry that many
didn’t understand or even know about, the report
has charted a period of incredible growth.
In the fifteen years since GSAIR first appeared, the
extended stay sector has grown from 454,000
units to 1,299,328 serviced apartments and 83,041
corporate housing units. In 2007, 77% of global
supply was in the USA; today, 48% lies outside its
borders.4
Remote working brings new challengesDue in part to the pandemic, we have just seen a
period of seismic change in how we work.
Remote working may have cast a cloud over other
hospitality segments, but serviced apartments
have proven an attractive option for those
needing to isolate or maintain a self-contained
lifestyle.
During the pandemic, organisations suddenly
had to grapple with several fresh issues from
homeworking to compliance with HR obligations,
sourcing financial support from government
and how to manage their businesses in the ‘new
normal.’
Businesses have had to consider productivity
amongst remote and office-based workers,
including whether the employees’ home working
environment is suitable and ensuring data is
secure and home networks are adequately
protected.
Each of these has been a contributing factor in
driving demand for accommodation with more
space, which is much easier to find outside of
city centres where new accommodation is being
churned out with efficient designs taking priority
over space, a top selling point for serviced
apartments.
Changing travel culturesThe pandemic has also changed how we stay.
Short stay trips have been replaced, by and
large, by fewer - but longer - stays. Occupancy
drops of up to 90% in city centre serviced
apartments between mid-2020 and mid-2021
were not matched in regional locations. Assignees
no longer take periodic journeys home mid-
assignment because they are moving – albeit
temporarily – with their families. Whether these
shifts are temporary or permanent is discussed
later in this report.
During the pandemic, there was a trend to
choosing regional locations over city centres,
due to restrictions on mobility, a desire to live
in different locations for new life experiences
and the opportunities for a healthier and rural
experience in regional locations. The trend is
enabled by the flexibility of remote working, the
lower cost of staying regionally and the chance to
have larger spaces.
With many meetings now taking place remotely,
travel is no longer a ‘must’ for their teams. Home
or remote working together with online meetings
finally have a place. By and large most businesses
can cope with reduced travel - except when an
assignee needs to stay on a project or work at
another location.
Many of these changes will be permanent. Social
interaction will never go back to the ‘2019 normal’
because, thanks to Covid, many have taken a
hard look at their lifestyles, work/life balance and
carbon footprints and assessed how society and
the environment are affected by a continued drive
for growth.
Quality of life doesn’t just come from wealth and
the desire (especially amongst younger workers)
not to lead a traditional commuter lifestyle.
Employers and governments worldwide are
assessing the impact of remote working on the
workforce, and the steps necessary to mitigate
them. In doing so, their focus has shifted to data
privacy and wellbeing.
3. Former owner of The Apartment Service, now merged with SilverDoor. Charles is now a consultant to GSAIR and SilverDoor4. GSAIR 2022

17
Will these changes last?These changes will take a while to settle down
and will ultimately depend on the usual mix of
politics, new world order, basic commodity supply
shortages and environmental climate changes.
Each of these has also been re-set since 2019.
Although organisations are thinking twice about
short business trips and are considering potential
health risks, damage to the environment and
time saved when traveling to and from a face-
to-face meeting. But that’s not to say that short
trips won’t disappear because face-to-face
engagement is still essential to do business.
The pandemic has grown awareness of, and a
willingness to use non-hotel accommodation
products such as serviced apartments and home
rentals. Thanks to the need to find spaces where
travellers can self-isolate, the home rental market
has boomed.
We also now have a growing collection of new IT
based services that offer both homeowners and
professional landlords the means to manage their
inventory and provide robust online booking,
channel distribution services and interactive guest
tools. The success of Airbnb and Uber in the last
five years suggests this change will be permanent.
The circular economyOver the past 15 years, the serviced apartment
industry has looked closely at quality and
cleanliness standards and data privacy as part of
an accelerated move towards contactless service.
Today, the biggest issue is sustainability and
ethical practices, a subject widely supported by
three quarters of business decision makers and
their customers.5
A well thought out plan to deliver organisation-
wide sustainability can sound like empty words
so meaningful action is vital. Those actions also
need to show that they are making a difference if
accusations of Greenwash (using sustainability as
a marketing tool) are to be avoided. Those that
deliver on their promises will be called out by
consumers.
Corporate cultures must change in terms of re-
using materials, recycling processes, choosing
ecologically friendly products, and reducing
waste. Most governments have set radical targets
for energy generation, use and conservation,
albeit too late and not ambitious enough.
Ultimately, only by adopting KPIs to monitor
cultural and operational decisions will change
come about.
Investor appetiteInterest in both the serviced apartment and rental
sectors amongst private and institutional property
investors is growing. So far, interest has focused
mainly on extended stay models in City Centre
locations. Developers are confident these new
brands will continue to outperform hotel markets
as they have since 2020.
Considering that extended stay in North America
continues to grow in market share, I estimate that
the sector outside of the USA could double or
even treble in the next few years.
Private rental sector investors are also stepping
up their activities. The current home ownership
rate in the US is slightly less than two-thirds of the
population, dropping down to only one third when
looking at Americans under the age of 346 and
will continue to decline.
This trend is likely to be matched in other
developed countries as home ownership becomes
more costly and populations become increasingly
mobile. By contrast, renting is an attractive option
because it doesn’t restrict residents’ mobility,
whilst a management company takes care of the
maintenance of communal areas.
Investors are also targeting individual unit owners
and build-to-rent (BTR). In the former, properties
managed by private or professional landlords are
marketed to guests via portals such as Booking.
com and Airbnb.
An eco-system of new services to manage private
inventories has sprung up, making this an easy
option despite resistance from neighbouring
owners, occupiers, local authorities, and pressure
groups looking to preserve the housing stock for
affordable rental options.
Growth is likely to come outside city centres,
where there are fewer regulatory restrictions,
5. Accenture6. https://policyadvice.net/insurance/insights/home-ownership-statistics/
Fig. 5 Future of Work
Source: The Conversation
Retaile
r
Design/manufacture
Recy
clin
g s
ecto
r
Re-u
se/repair/recycling Consumer/household
er/L
As
circulareconomy

18
and at the luxury end of the market. These options
will also be attractive to the corporate market due
to their higher standards and levels of support
services.
In the build-to-rent sector(BTR), new
developments are on the way to servicing
the needs and lifestyle changes of growing
populations, especially multi-family homes. The
new preference for living is suburban rather than
city centre where population density is higher and
lacks open spaces for outdoor activities.
Investors are aware of this investment opportunity
and are focusing on stays of 1 - 6 months or more
because they attract longer term renters plus a
premium for flexible lease terms. The benefit to
renters is the professional management services
that come with the option to reduce their length
of stays and fully equip their units to include
everything needed for a serviced rental by those
who don’t want to own anything, leaving them
free to move on - even internationally.
Even greater choice for corporates This combination of extended stay products,
corporate housing services, booming short
term rentals and home share markets adds
up to greater supply choice. Meanwhile, more
organisations are now diverging away from the
traditional sourcing of corporate accommodation
in favour of adopting more flexible policies that
give travellers and assignees more choice in where
they stay.
Although the latter approach is favoured by
travellers who are comfortable in making choices
that suit their lifestyle needs, this can compromise
employers’ Duty of Care. Employers must
therefore make it clear what travellers or renters
can (and cannot) do if they are to avoid more
accommodation choices outside of policy.
Herein lies a challenge. Operators, agents,
associations, and media alike have been trying
for years to clarify to accommodation buyers
(and themselves!) what the expression ‘serviced
apartment’ means.
Now, it is widely accepted that this is an
umbrella term covering many variations, and it is
differences that define each serviced apartment
offering. From aparthotel, to extended stay hotel
and corporate housing, to residences and family
rental housing, confusion persists - especially
between extended stay and residential options for
flexible stay rentals.
A comparison of licenses to stay in hotels and
residential tenancy agreements for long term
rentals, plus variations between city centre and
regional locations, highlights overlapping legal
and regulatory frameworks and partly explains
why clearly defined product types remain elusive.
Investors’ attention, driven by demand trends, will
inevitably focus on extended stay (and aparthotel)
brands due to the numbers involved. But the
opportunity presented by residential property
options like purpose built single and multiple
family renting communities, BTR, co-living and
residences are coming to the attention of buyers
who are keen to meet the needs of those intent on
new lifestyles.
Consolidation and exitsNothing stays the same for long, especially
nowadays, particularly when investors have an
ever-expanding array of strategic investment
choices.
Accelerated by the pandemic, business strategies
and goals have changed for those previously
divided between focussing their growth on
owning or managing their assets. This was the
case with my own business and drove the decision
to separate The Apartment Service agency from
the Executive Roomspace operating company.
These businesses had different stakeholder
interests and growth strategies with unique
destinies. The choice facing many accommodation
companies now is whether to include agency
services or focus on core activities - unless
you have significant resources to offer a global
service.
Trying to do both can be challenging unless
you have significant resources to offer a global
service. Larger institutional funds also seem to
prefer to separate property asset ownership from
operating businesses, i.e. Propco and Opco.
Smaller operators will find it hard to compete with
the funding that some of the larger operators
have for in-house systems and will rely on
external IT specialist companies to compete. The
option to unite, co-operate, merge, acquire or be
acquired are attractive ways in which to compete
effectively.
Long term rental companies are adapting their
offerings, bringing in IT not only for management
but also to add hospitality services and new
business models are emerging. We will see more
funding from the private rental sector to support
this growing thirst for more extended stay
opportunities which is seen as a leader for more
long-term corporate business.

19
Accreditation still not a ‘must have’This year’s GSAIR survey showed that many
corporates are yet to be convinced of the
importance of accreditation programmes. Only
40% see them as only ‘quite important’ whilst
40% are neutral or worse.
Effective accreditation schemes that enable
corporates to make safer, informed choices, are
harder to achieve because there are so many
types of operators and business models. Some
operators are large enough to inspire confidence
in their standards, but operators with less than
a few hundred units, who make up a larger
percentage of overall inventory, do not.
It is much harder to benchmark these operators
because accreditation goes beyond consistency
in cleanliness compliance and service levels.
Although guest satisfaction is based on comfort
and cleanliness, recommendation and familiarity
will always dominate.
Businesses that extensively use suppliers become
comfortable with them and place less credence
on accreditation badges. Neither grading nor
accreditation featured highly in the GSAIR survey
into corporate buyers’ selection criteria. In fact,
some prefer to book directly with the operators
rather than through third-party systems.7
Many TMCs and RMCs prefer to use specialist
apartment agencies who are better geared up
to manage the intricacies of longer stays such
as lease commitments, ongoing management of
guests and payments.
A common factor in responses from corporate
buyers, agents and operators alike was the need
for reliable and fast internet connections in all
accommodation solutions. Customer service is
also key to success – the rest follows on from
these two key elements.
You can read more about the results of this year’s
GSAIR survey in the next chapter.
ChallengesThe serviced apartment sector may have
favourable winds behind it, but there are still
plenty of challenges to overcome, from staff
shortages and supply chain issues to safety
compliance and increased competition from
private home rentals.
Future pandemics aside, demand levels should
remain strong despite less business travel. The
day of the Digital Nomad Temporary Housing
has arrived.
In the short term, or until the threat of further
pandemic outbreaks recedes, operators,
corporates and their agents will be working
through how to manage recurring outbreaks.
This makes it increasingly likely that many will
opt for safe and self-contained places they can
call home for longer stay away trips – a big
positive for our sector.
The day of the Digital Nomad Temporary Housing has arrived.
7. GSAIR survey 2022

20
GSAIR survey results and analysis
By Mark Harris
A combination of secure environment, less
vulnerability to staffing shortages and staying
open during lockdown has enabled serviced
apartments to bounce back faster than hotels,
post-pandemic.
As you will read throughout this report, the
demand trends now driving the serviced
apartment sector are longer, but less frequent
stays, risk management, environment,
sustainability, and governance.
Longer-term trendsHowever, behind these headlines are other,
longer-term trends which are tracked in the
surveys undertaken for each edition of GSAIR
to date.
Originally, the GSAIR survey was conducted
amongst extended stay operators and focussed
on regional and global supply trends, providing
insight not only into the growth of serviced
apartments, but also the challenges facing
operators.
For the 2013/14 edition of GSAIR, the survey was
expanded to include corporates and agents (mainly
TMCs and RMCs). This enabled us to explore
the purposes for which corporates use serviced
apartments (and why), how they are sourced, and
what the sector needs to do to increase its share of
corporate accommodation spend.
These, and other trends have subsequently been
tracked to provide year-on-year and longer-term
comparisons. The 2022 survey was conducted in
Q4 of 2021, with respondents asked to report on
the period 2020/21.
Fig.6 Is serviced apartment usage growing, reducing or staying the same?
Source: Euromonitor International, Travel 2022 edition
Agent
Corporate
Agent
Corporate
Agent
Corporate
Bu
sin
ess
travel
Ass
ign
men
tw
ork
Relo
cati
on
0.00% 10.00% 20.00% 30.00% 40.00% 50.00% 60.00% 70.00%
2021 2026
Serviced apartments more popular than everAs Fig.6 shows, serviced apartment usage is
growing, especially amongst TMCs and RMCs,
60% say usage is growing for relocation and
assignment work. Corporates say their serviced
apartment usage for business travel has remained
static, despite the pandemic decimating business
travel globally. 52% of corporates said their
usage of serviced apartments for relocation was
increasing.

21
The main factors when choosing between
serviced apartments and hotels are now traveller
preference, total cost of stay and traveller/
assignee wellbeing.
Pre-pandemic, the top three determining factors
were cost, price/quality comparison and location.
This shows how travellers are being empowered
to make their own choices by employers –
providing they receive guidance on what ‘doing
the right thing’ is.
Also unchanged since 2019 are travellers’ essential
requirements from a serviced apartment. As
Fig. 8 shows, these remain connectivity, cooking
facilities and 24/7 support.
Fig.7 How do you quantify the benefits of serviced apartments vs hotels
Traveller safety
Guest experience
Total cost of stay
Traveller/assigneepreference
Traveller wellbeing
Rate
Covid secureprotocols
0.00 0.50 1.00 1.50 2.00 2.50 3.00 3.50 4.00 4.50 5.00
Agent Corporate Average
Fig.8 What matters most in a serviced apartment?
In-house services/amenities
Manned reception
Quality assessmentpre-trip
Familyaccommodation
Shared occupancy
Connectivity(e.g.free WiFi)
24/7 support
Other
Cooking facilities
0 0.1 0.2 0.3 0.4 0.5 0.6 0.7 0.8 0.9
Agent Corporate Average
Traveller preference, total cost of stay and wellbeing

22
Distribution and accreditation
Fig.9 Corporate & Agent survey respondents - how are serviced apartments booked?
TMC/RMC
Online bookingtool
Via OTA (OnlineTravel Agency)
Via specialist agent
Other (please specify)
Direct with the apartment website(s)
Agent CorporateAggregated
5.00 10.00 15.00 20.00 25.00 30.00 35.00
Fig.10 Operator survey respondents - % of bookings by channel
Via RMC’s (RelocationManagement Companies)
Via TMC’s (TravelManagement Companies)
From OTA’s (e.g. ExpediaHotels.com)
Direct via yourwebsite
Via GDS
Via specialist servicedapartment agent
Direct email(not via website)
Telephone
0.00 5.00 10.00 15.00 20.00 25.00 30.00 35.00 40.00
As Figs.9 and 10 show, the distribution landscape
is highly fragmented. 28% of corporate bookings
are made via operators’ websites, making
the OTAs a surprisingly popular channel for
corporates, down from 38% in 2019. Operators
confirm this, estimating that they receive a quarter
of bookings via this channel. This suggests a
high degree of ad hoc sourcing on the part of
corporates.
After OTAs, the next most frequently used
distribution channel for corporates and agents
is online booking tools, which account for 28%
bookings, compared to 42% in 2019. This reflects
the impact of the pandemic when travellers
relied heavily on human support in sourcing
Covid-secure accommodation. The same applies
to TMCs, many of whom furloughed their staff
during lockdown. 28% of TMCs now source
serviced apartments through a specialist provider.
OTAs are making ground amongst corporates,
15% of whom now book extended stay through
this channel. Operators confirm that OTAs remain
the largest sole source of business, at 36%.
On the issue of accreditation schemes, many
corporates are yet to be convinced. Only 20%
see them as ‘very important’; 40% regard
accreditation schemes as only ‘quite important’
and a further 40% being neutral - or worse - on
the subject.
By contrast, amongst operators’ appetite for
accreditation remains undimmed. 77% regard an
industry-wide Code of Conduct as desirable; 55%
as feasible 75% say compliance certification is
desirable but fewer (67%) say it is feasible.

23
Fig.11 Factors impacting improved serviced apartment usage during pandemic
Dedicated, secureworkplace
Ability to isolate fromother guests
Safer option for travellers
ISAAP Quality & ComfortCertification
Ability to cost/eat privately
Common SenseCompliance Accreditation
Quality in TourismAccreditation
0 2 4 6 8 10 12 14
Agent Corporate Average
Although GSAIR normally focusses on longer
term industry trends, in this year’s survey we also
asked corporates, agents and operators how the
pandemic affected them.
Throughout this report, there is detailed testimony
from industry professionals on this topic. Overall,
their responses were as follows.
• Many operators saw business increase
because they offered a safer option for
travellers, dedicated, secure workplaces,
the ability to cook and eat privately.
• Serviced apartment room nights were less
affected than hotels due to fewer but longer
trips. 68% of operators say they took market
share from hotels in some or all locations.
• Extended stay rates still took a big hit. On
average, ADR was 42% of published rates.
• There was an up-swing in the use of home
rental products like Airbnb and onefinestay,
driven by traveller choice.
• Post-pandemic, serviced apartments will
be more popular than ever, providing
operators meet travellers’ and assignees’
essential requirements, namely connectivity,
cooking facilities, and 24/7 support.
• The biggest barriers to serviced
apartments taking a greater share of
corporate accommodation spend are a
shortage of supply in key locations,
inconsistent quality of existing supply,
and the level of on-site and in-apartment
amenities.

24
Fig.12 During the pandemic, by how much did your serviced apartment room nights increase/decrease
Aggregated Corporate Agent
35.00%
30.00%
25.00%
20.00%
15.00%
10.00%
5.00%
0.00%0-25%down
26-50%down
51-75%down
76-100%down
0-25%up
26-50%up
51-75%up
76-100%up
unchanged
15% of corporates’ volumes increased
Whilst 32% of corporates and agents reported
that their hotel volumes fell by over half, the
equivalent reduction in serviced apartments
volumes was just 19%.
Whilst 38% of operators reported that booking
volumes had fallen by more than half, 30% of
corporates said their serviced apartment room
night volumes fell by between 26 – 50% during
the pandemic.
15% of corporates said their serviced apartment
volumes increased because, compared to hotels,
extended stay products provided a more secure
place to live and work.
Respondents said this competitive advantage
will continue. 66% of corporates and agents are
confident that serviced apartments will be more
popular post-pandemic.
Respondents also confirmed the trend for longer
stays began during the pandemic. Stays of 1 –
3 months made up 45% of stays compared to
stays of 14 – 30 days which accounted for 25% of
stays. Stays of 7 – 14 days made up 16% of stays,
compared to 8% pre-pandemic.
17% of operators reported increases in length
of stay between 16 – 50 days, although 13%
reported decreases of 26 - 50%, reflecting tighter
restrictions in some regions than in others.
Fig.13 Operator optimism for future...
Average lengthof stay
Occupancy
RevPar
Achieved rentalrates (ADR)
6.20 6.40 6.60 6.80 7.00 7.20 7.40 7.60 7.80 8.00
Operator sentiments

25
Looking ahead, serviced apartment operators
are also positive. As Fig.13 shows, they are most
optimistic about occupancy and average daily
rate. This is corroborated by contemporaneous
research by Savills which showed 77% of
respondents expecting occupancy levels to
return to 2019 levels before the end of 2022.
81% of respondents believe serviced apartments
are better positioned to outperform the wider
hotel market.8
That same optimism is reflected in operators’
expansion plans, as Fig.14 shows. Since 2016/17,
8. https://www.savills.co.uk/insight-and-opinion/savills-news/316405-0/serviced-apartment-occupancy-could-fully-recover-in-the-next-6-18-month#:~:text=74.6%25%20of%20respondents%20expect%20occupancy,outperform%20the%20wider%20hotel%20market.
operators have reported the intention to open
more apartments in existing locations, with 68%
of operators citing this as their basis for upcoming
expansion - the highest yet.
56% of operators plan to open in new locations, a
third consecutive increase but less below the 62%
recorded in 2016/17.
In contrast, although 39% of operators plan to
launch new brands or products, and 56% plan
to introduce new guest amenities, both are the
lowest scores reported in the six years.
Fig.14 Operators intending to expand...
More guestservices/amenities
New brands/products
More apartmentsin new locations
More apartmentsin existing locations
0.00% 10.00% 20.00% 30.00% 40.00% 50.00% 60.00% 70.00% 80.00%
2022/23 2020/21 2018/19 2016/17
appartcity.com

26
Competitor presence is now operators’ top criteria
when choosing a new location, followed by
planning issues and the price of property, as Fig.15
shows.
Asked to rank each criterion from 1 – 5 in order
of importance, the importance of local corporate
demand and cost of property acquisition fell from
a mean of 3.3 and 2.9 to 1.6 and 1.8 respectively.
Competitor presence scored a mean 2.4 and
planning issues 2.1 compared to 2.1 and 1.8
respectively in 2020/21.
Then barriers to operators’ expansion plans reflect
minor change over those reported in previous
GSAIRs. Asked to quantify the degree of change
needed in each area, where 100 means a total
overhaul is needed, the overall picture is of a
need for greater regulation, especially around
the quality and security of serviced apartment
products, and in the harmonisation of agency
commission rates.
Interestingly, despite greater regulation being
a key change required to facilitate further
sector growth, fewer operators feel compliance
certification is desirable (75% compared to 80% in
2020/21). However, more believe such certification
is now more feasible (67% compared to 59% in
2020/21).
Fig.15 Operators survey respondents - key criteria when selecting a new location
Planning issues
Competitor presence
Local corporatedemand
Cost of propertyacquisition
0 0.5 1 1.5 2 2.5 3 3.5 4
2022/23 2020/21
Fig.16 Operators survey respondents - changes required (100 = complete overhaul)
Harmonised agencycommission rates
Relaxed planning/zoning laws
Tougher planning/zoning laws
Greater regulation ofproduct security
Greater regulation ofproduct quality
0 10.00 20.00 30.00 40.00 50.00 60.00
The results of the 2022 GSAIR survey show that, pandemic aside, much remains the same in terms of
consumption of extended stay accommodation and operators’ forward planning.
However, the survey helps to set the stage for the in-depth commentary you will read in the subsequent
pages of this report. The requirements of corporate travel or mobility managers, TMCs, RMCs and
travellers themselves are clear; operators failing to deliver do so at their peril.
Summary

27

28
A changing market?By Mark Harris
In his commentary earlier in this report, Charles
McCrow outlined some of the mega trends driving
the new normal. We invited some leading industry
professionals to share their thoughts on these
issues.
Changing travel culturesCovid supercharged some pre-existing changes
to travel culture and created new ones too. The
hiatus allowed corporates to re-assess why
and how they travel, and to adapt their travel
policies to reflect organisational Environmental,
Sustainability and Governance (ESG) objectives.
In autumn 2021, a Bloomberg survey found that
84% of large businesses in the U.S., Europe and
Asia planned to spend between 20 – 40% less on
travel post-pandemic. The Global Business Travel
Association estimated spending on corporate
trips could fall to $1.24 trillion by 2024 from a
pre-pandemic peak in 2019 of $1.43 trillion.9
The prognosis for business travel is unclear.
Some say the sector will recover to 2019 levels by
2024; others say sooner. But, when the bottom-
line savings realised by corporates through not
travelling during the lockdown, and the fact that
71% of people prefer working from home and 58%
believe they are more productive when do so, are
taken into consideration, the chances of volumes
returning to the old normal are equally remote.10
Changing travellers’ needsChanging traveller priorities have manifested
themselves in serviced apartment operators
providing more frequent and deeper cleans,
greater flexibility in cancellation policies, and
contactless check-in.
What else has changed? Declan Fitzhenry of
CityStay says the lead time between booking
and checking-in is the shortest he’s seen,
but questions whether this is a long-term
phenomenon. Instead he pinpoints sustainability
as a key factor in decision-making going forward.
“Clients are increasingly prepared to find different suppliers if existing ones don’t place emphasis on carbon emissions, waste management, or energy suppliers. This green ethos is being embedded into company values and is necessary for the next generation of workforce” says Declan.
“As operators in this space, we must adapt to that, adhere to those sustainability policies, and believe in them, otherwise it’s not going to work. We have
already seen some exits from the market and will see consolidation amongst those that aren’t prepared to adapt to those changing travel cultures.”
Robert Alley of Roomzzz Aparthotels agrees that
the long stay market has evolved. “Operators have established credible brand platforms, improved distribution, and created better service models for customer journeys. The sector standards for facilities like living space, kitchens and dining are not found in a conventional hotel room.”
Alley says that divergence, choice, and growth are
evident as the market expands and increases its
share of travel by appealing to different consumer
markets.“Independent spaces or purpose-built aparthotels, branded or unbranded, operators are each finding their own paths to success.”
9. https://www.bloomberg.com/news/features/2021-08-31/will-business-travel-come-back-data-show-air-hotel-travel-forever-changed 10. YouGov poll for The Times Jan 2022 - https://www.thetimes.co.uk/article/never-return-to-office-home-working-lockdown-mnqv0lzs7
citystayuk.com
citystayuk.com

29
More choice The extended stay sector now offers more
choice of accommodation than ever before. From
serviced apartments, corporate housing, short
term rentals and co-living, to home share and
buy-to-rent. Short-term rentals, and aparthotels
all saw higher occupancy during the pandemic
because, like serviced apartments, they offered
self-contained living spaces.
This trend predates but has been accelerated
by the pandemic. Although each product type
has distinct advantages and drawbacks, are
any of these options gaining traction amongst
corporates?
Alex Neale of SilverDoor highlights co-living as a
product now winning favour, “primarily due to the profile of the traveller, who is a bit younger and wants to engage more with their locations and the people in the same building.” Co-living has continued to grow as more people use it, whilst there’s a slightly different customer profile for spaces where the accommodation and the sleeping quarters are much smaller than you would expect in a hotel or serviced apartment.” “Co-living residents have a different mindset. They only need to think of themselves, their laptop, the Wi-Fi and, where they’re going to work. So, they’re more ready to engage with their environments.”
“Serviced apartments are still corporate clients’ preferred option because of the space and privacy unavailable in a hotel, although Alex confirms that other product types are being used, “depending on how you interpret ‘alternative accommodation.’ It’s down to what fits each client’s needs.”
“From an agent’s perspective, there’s no one-size-fits-all solution. Corporate housing and short-term rentals are terms that mean different things to different people. They cover such a broad range of products it must be even harder for clients to understand.“
Location trends During the pandemic, there was a move away from
stays in city centres in favour of suburban areas.
This came mainly from relocations and long-term
secondments, as SilverDoor’s Wesley Shelling
explains.
“Often the assignee was moving to another country and working from home. Here we saw a shift towards temporary living in a suburban location, especially among families who wanted to be closer to schools than their offices.”
The data also indicates that this shift in location was
a temporary trend, as the heat maps (which show a
proportionate spread of reservations over time) in
Figs 17 - 27 indicate.
StayCity.com

30
London
Fig.17 Booking hotspots - London and surrounding suburbs 2019
London
Fig.18 Booking hotspots - London and surrounding suburbs 2020

31
Fig.19 Booking hotspots - London and surrounding suburbs 2021
London
Fig.20 Booking hotspots - London and surrounding suburbs 2022
London

32
Fig.21 Booking hotspots - Manchester and surrounding suburbs 2019
Manchester
Fig.22 Booking hotspots - Manchester and surrounding suburbs 2020
Manchester

33
Fig.23 Booking hotspots - Manchester and surrounding suburbs 2021
Manchester
Fig.24 Booking hotspots - Manchester and surrounding suburbs 2022
Manchester

34
Fig.25 Booking hotspots - UK excluding London 2019 vs 2020
ManchesterManchester
LiverpoolLiverpool She�eldShe�eld
LeedsLeeds
EdinburghEdinburgh
GlasgowGlasgow
LondonLondon
BirminghamBirmingham
ENGLANDENGLAND
BristolBristol
Manchester
Liverpool She�eld
Leeds
Edinburgh
Glasgow
London
Birmingham
ENGLAND
Bristol
Fig.26 Booking hotspots - UK excluding London 2020 vs 2021
ManchesterManchester
LiverpoolLiverpool She�eldShe�eld
LeedsLeeds
EdinburghEdinburgh
GlasgowGlasgow
LondonLondon
BirminghamBirmingham
ENGLANDENGLAND
BristolBristol
Manchester
Liverpool She�eld
Leeds
Edinburgh
Glasgow
London
Birmingham
ENGLAND
Bristol

35
Fig.27 Booking hotspots - UK excluding London 2021 vs 2022
ManchesterManchester
LiverpoolLiverpool She�eldShe�eld
LeedsLeeds
EdinburghEdinburgh
GlasgowGlasgow
LondonLondon
BirminghamBirmingham
ENGLANDENGLAND
BristolBristol
Manchester
Liverpool She�eld
Leeds
Edinburgh
Glasgow
London
Birmingham
ENGLAND
Bristol
0121 295 1310
www.resharmonics.com
The leading software platform
for short stay and long stay
residential
All the tools to operate in one uniied platform
- Increase revenue
- Increase productivity
- Increase guest experience

36
Other demand factorsWesley points out that remote working is here to
stay. “A secondee may be travelling to the office just one or twice a week. Transient travel, as it recovers, goes mainly into city centres.”
“Many cities have a strong rental market anyway. It takes longer for an assignee to move out of temporary living and into long term accommodation, so we’re seeing demand for extensions and the average length of stay therefore increases.”
“We are operating in markets where the number of unoccupied units has not yet returned to pre-pandemic levels, although lots of new openings are taking place. Overall, we’re seeing remarkably high demand, resulting in a sharp increase in the average nightly rate globally.”
As Fig. 28 shows, supply, demand and rising
operating costs have impacted on rates. Other
than a natural drop in rates over the festive period,
2021 rates surpassed 2019’s.
Fig.28 Average nightly rate for London – 1 bed apartments (14-day rolling average)
Source: Euromonitor International, Travel 2022 edition.
150
Currency
GBP100
50
0
Ro
llin
g 1
4 d
ay A
vg
Rate
Avg nightly rate (in local currency) by date
Dates
July 2019 Jan 2020 July 2020 July 2021Jan 2021
Fig.29 Average nightly rate for London – 2 bed apartments (14-day rolling average)
Source: Euromonitor International, Travel 2022 edition.
400
300Currency
GBP
200
100
0
Ro
llin
g 1
4 d
ay A
vg
Rate
Avg nightly rate (in local currency) by date
Dates
July 2019 Jan 2020 July 2020 July 2021Jan 2021

37
Consolidation and exitsThe extended stay sector has seen exits, mergers
and acquisitions as consolidation continues in both
the agency and operating segments.
On the agency side, between 2020 and 2021
National Corporate Housing took on Bridgestreet’s
agency business, Oakwood’s agency arm moved
to Dwellworks and SilverDoor acquired The
Apartment Service.
This leaves the once-widespread hybrid agency/
operator model represented at any scale by
National Corporate Housing, Oasis Corporate
Housing and Synergy.
With the two biggest players (SilverDoor and
The Apartment Service) now merged, it seems
likely that further M&A activity in the agency
segment will probably be restricted to bigger
players acquiring niche businesses with a
complementary skillset.
SilverDoor’s Group CEO Stuart Winstone says
that, whilst in decline, there is a still a place for the
hybrid model. “To be able to do it properly, you must be a big player in the marketplace and have the financial backing. If not, the agency side will be constantly fighting for resources.”
CityStay’s Declan Fitzhenry agrees. “There is some vulnerability in the short-stay agency market. When times were good, there was enough business to sustain several agents in multiple markets. Following the SilverDoor/The Apartment Service acquisition, I see similar moves where agents have a global presence.”
“Hybrid agent/operators could also be at risk where they operate under one brand. From the buyer’s perspective, it raises confusion around who they are contracting with. You can be an operator and agent providing there are clear lines of demarcation in terms of branding and operating models.”
The Forenom Group operates across the Nordic
countries. In contrast to Declan Fitzhenry, Head of
Operations Anton Kargaltsev sees a rosy future for
the hybrid model.
“The hybrid concept gives an operator the best of both worlds, enabling expertise to be shared across concepts, creating novel approaches to tackle old problems. For traditional operators, the agency model can be an effective way to reach new markets with minimal investment.”
As for the operator segment, Stuart Winstone
believes that despite the pre-pandemic trends
towards aparthotels and smaller apartment
units, “We’ve always loved traditional serviced apartments’ space, full kitchens and washing machines but were concerned that that was declining a bit.”
“The pandemic demonstrated the value of longer stays in operators’ business mix. Several operators have really grasped this and have taken steps to ensure that larger, fully equipped apartments remain a core part of their portfolio.”
SilverDoor and TASWhy did SilverDoor buy The Apartment Service?
Stuart Winstone is candid. “TAS was one of our biggest rivals. It had been winning customers that SilverDoor wasn’t, so clearly it was doing something well.”
“When considering an acquisition, I’m looking for something that’s missing from or could improve Habicus Group. The Apartment Service was the clear leaders in Iberia and LATAM. APAC was important too because combining the TAS and SilverDoor teams out there made us the leading agent in the APAC region by far.”
“We are always keen to grow our supply chain. Despite a lot of crossovers in the two supply chains, there are unique relationships that TAS holds that we wanted to bring into the group to expand the breadth of options for our combined client base.”
The two brands were merged in April 2022.
“Customers told us that they only want single bids from the group, which is what we have done. When we acquired Citybase in 2016, it was quickly transitioned completely to leisure, leaving SilverDoor as our corporate-facing brand.”
Stuart and his team are now restructuring the
group into two core pillars, agency services and
consulting services. “The SilverDoor Apartments brand and our online booking tool Orbi will sit within agency services together with Domus Stay, which is a joint venture with Domus Nova, the bespoke luxury design-led London homes that we make available for short term stays.”
“The consultancy division is being re-branded and will be focusing on training services, consultancy for apartment operators, an administrator service for relocation management companies that want to offer a multi agent approach to service department sourcing, and GSAIR.”
Winstone believes his company is ideally placed
to deal with changing demand trends. “We’re already in a great place as the world’s number one independent agency. We want to retain that position and maintain our competitive advantage by investing in our technology.”
“Above all, we want to be closer to our customers all around the world. So look out for new office openings and new acquisitions where it complements the group as it is today.”

38
Buyer, Supplier and Agent - different perspectives on the extended stay marketBy Mark Harris
Perspective helps us to understand situations from other positions, to consider other opinions, experiences, and viewpoints, which in turn gives us all a better understanding. In this article, four industry professionals – a corporate buyer, a serviced apartment operator, a TMC and a specialist serviced apartment agent provide their perspectives on the sector post-pandemic.
BuyerClaire Bourke, Global Mobility Manager, Latham & WatkinsClaire Bourke is based at
the Bishopsgate office
of law form Latham &
Watkins. Founded in Los
Angeles in the 1930’s,
Latham & Watkins advises
clients across a wide
spectrum of transactional, litigation, corporate
and regulatory areas. The firm has 32 offices
worldwide.
My team manages cross-border short term
assignments and relocations for the firm’s 6,500
employees, from junior staff to partner level. Most
of our bookings are for 30 nights, which go into
our main hubs of London, New York, LA, Hong
Kong, and Singapore.
Our volumes in Hong Kong have dropped off since
the pandemic started as our clients exit Hong
Kong in favour of other hubs in the region, such as
Singapore.
Although serviced apartments make up a relatively
small percentage of the firm’s overall travel spend,
they account for a significant part of our overall
relocation spend. Especially when you consider
the cost of household goods like furniture and
white goods has quadrupled since the pandemic
began.
To counter this, we are having to extend stays,
even in places to where we can’t get people’s
goods. That means putting rental furniture
into properties assignees are renting. With any
assignment or relocation, the goalposts often
change, which puts pressure on my team of three.
That’s why we need our serviced apartment
providers to be flexible and fast responders,
particularly if we need to extend a stay at short
notice.
The value of an effective agentWe have worked with SilverDoor for some time.
They are responsive, which helps us to organise
better and quicker.
They understand what our people need and
communicate effectively. In the law, it’s about
time spent and everything is ‘on the clock,’ so we
need to get answers to our people as quickly as
possible.
SilverDoor also ensures that the accommodation
they source meets the quality standards we have
set in partnership with them. Any new suppliers
we trial whose product or service isn’t up to these
standards won’t be used again by us.
Legacy of the pandemicDuring the pandemic, we didn’t have enough
providers in our required locations. One vendor was
not enough so we had to approach other vendors
direct to find more available stock.
Pre-pandemic, we never had to pay for add-ons
like cleaning services because they were already
included in the overall cost of the apartment. During
and since the pandemic, we now have to bear these
extra costs too.
We no longer pay our invoices in advance of a
stay because things can change. For example,
sometimes a stay can be put back for months at a
time. Credit notes only complicate the process for
the firm internally.
We have relied heavily on our vendor partners over
the last couple of years. They have helped us out
then so, whilst we are seeking our additional partners,
we want to build deeper relationships with both
existing and new vendors. It’s a two-way street.

39
Understanding our needsWe shy away from Airbnb and its competitors
because they don’t offer the degree of flexibility
we need or have any real understanding of
corporate needs.
Instead, our serviced apartment programme is
mushrooming, thanks to a combination of more
colleagues using them and requesting them and
because the firm is growing exponentially, so we’re
hiring more people.
Brand isn’t that important to us, but we need our
vendors to have substantial stock and understand
our company culture. They need to know that
the people we move mainly want to be within a
fifteen-minute walk of the office. They also expect
an elevated level of service.
Room for improvement Although serviced apartments are increasingly
popular with our travellers, some aspects of the
industry need to change if it is to take market share
from hotels. In the US, pricing needs to be more
transparent. I just want one price and that’s it.
More operators need to provide the same level of
detail about their accommodation that SilverDoor
does, such as pictures of the apartment building
as well at the apartments themselves and a map
showing where the building is in relation to local
shop and transport.
Accurate invoicing is another bugbear for me, as
is the fact so few serviced apartment operators
seem to partner with car and taxi services.
We need more apartments in our locationsOver the next 12 – 24 months we will diversify
more in the US, so we will need more options
there and in locations like Tokyo. New York is a
real pressure point for us now due to shortage of
inventory and it’s insanely expensive.
We will grow our serviced apartments volumes
even further but focussing on those of a better
quality that provide a higher degree of personal
service.
SupplierDean Schreiber, CEO, OakwoodDean Schreiber is Chief
Executive Officer at
Oakwood Worldwide,
overseeing a global
portfolio encompassing
over 13,000 serviced
apartment and corporate
housing units across eight
brands. His key responsibilities include the growth
of the group globally.
It’s quite interesting where we are today. Before
Covid, we had a nice blend of short stays of a
month to long stays of twelve months or more.
Ever since, short stays have become longer whilst
the long stays have become shorter.
Now that folk are travelling again, that trend will
continue, although I predict relocation contracts
that involve companies moving entire families will
die down. Instead, assignments will be shorter
with assignees staying for three months or so
before returning home.
Short stays will get longer because people aren’t
going to come for just a few days anymore. When
I travel on business now, I stay longer and make
the trip really work for me. So, short, stay longer;
long stay shorter.
Focus on flexibilityOakwood was geared up for the pandemic well
before it hit. Our focus was already on flexibility in
changing pricing and producing creative solutions
to fit with the different demand trends, being
creative and still giving great customer service
despite a shortage of staff.
Staffing wasn’t a problem solved by throwing
more money at it. in many geographies, the staff
simply weren’t there. In others, the allowances
our staff were receiving to stay home outweighed
their salaries. In situations where we relied on
foreign workers for housekeeping or back-office
roles, it was hard to find people to fill those roles,
so we did the work ourselves.
Business or Leisure, the extended stay model is carving a greater share
than it’s ever seen before. Our greatest point of difference has become
the unique driver which allows operators to thrive across multiple markets.
A mainstream position against traditional hotels across all the distribution
channels with attractive brands will guarantee further success as the world
emerges from recent challenges to grow once more. Robert Alley, Roomzzz Aparthotels

40
Size (may) not matterThe million-dollar question right now is what type
of properties we bring on going forward. We’re
opening 20 properties in 2022, a lot of which were
planned pre-pandemic.
Right now, opening two or three-bedroom
apartment units would be taking a significant
risk because I don’t think those big family moves
are going to happen in our space. Instead, have
a one-bedroom apartment with one or two
interconnecting rooms. Room stock has got to be
flexible.
Competitive landscapeBrand is becoming more significant in the serviced
apartment sector. Previously, serviced apartments
were the poor relation to hotels, who had the
brands with which everyone was familiar.
Now, growth in demand is pacing well for serviced
apartments. We and our competitors all have more
properties these days so we can be effective with
our brands.
Brand is important because consumers want
reassurance. Airbnb spent a lot of money
marketing their platform, but people are gradually
shifting back to branded properties because they
are safe, clean, and efficient. There’s a sense of
comfort in staying at a branded property rather
than in somebody’s house, where you don’t know
who’s been there or what’s in the drawers.
Serviced apartments are mainstream nowAirbnb showed the world that there was an
alternative form of accommodation to hotels.
That’s interesting because people have been
renting out their spare room for centuries.
What it means is that serviced apartments are
mainstream now.
The trend for ‘alternative accommodation’
products is driven by wanderlust and a thirst
for new experiences. It has also been driven by
owners who have seen the returns on a serviced
apartment outweigh the returns on a hotel. We
get better GOP margins because of serviced
apartments’ low-cost operating costs, whilst we
can command higher rates because we provide
more space.
The serviced apartment model has also proven
resilient throughout economic downturns and
a pandemic. They come with a ready-made exit
strategy because owners can sell individual or
multiple units, or they can be converted into
residential apartments. That makes extended stay
an attractive proposition.
Choice fuelling demandA serviced apartment remains a foreign concept
to a lot of consumers. Those converted become
real advocates. Now, there’s even more choice out
there; it’s easier to come to market using digital
channels, which is the language Millennials and
Gen Z understand.
The key for our sector is getting three or four
emerging non-hotel brands in our space to be
recognised by consumers. The likes of Marriott
have 67 brands in house; that’s what consumers
are confused about. In contrast, we have one core
brand.
The extended stay sector needs to guard
against becoming complacent. To maintain the
competitive advantage given to us by Covid, we
need to expand our target audiences. We must be
innovative, price right and benchmark by revenue
per square foot instead of by average daily rate.
Every space in every apartment needs to be
profitable.
Agent (TMC/RMC)Steve Banks, Chief Commercial Officer, AgiitoSteve has worked in
corporate travel and
meetings for over 30
years, holding roles across
account management,
consultancy, business
development and his current role of Chief
Commercial Officer at Agiito, the UK’s 10th largest
travel management company.11
Serviced apartments are now being used more
by corporates, but they haven’t yet made it onto
accommodation RFPs to any significant degree.
Lots of corporates rolled their 2019 programmes
into 2020 and then 2021 because they didn’t know
what demand levels were going to be. Ever since
self-catering accommodation was re-opened by
government, we have seen serviced apartments
usage on the rise. Serviced apartments were felt to
be a safer option than hotels, so adoption amongst
corporates has grown.
At Agiito, we are sourcing serviced apartments
on an ad-hoc basis rather than negotiating
annual serviced apartment programmes for our
clients. That’s partly because most programmes
concentrate on shorter, transient trips whereas
serviced apartments lend themselves to
longer stays.
11. https://www.businesstravelnewseurope.com/Europes-leading-TMCs/2021/UK/Agiito

41
Typically for us that’s 14 days, of which there are
much fewer in most organisations. The volumes
simply aren’t big enough to justify inclusion in
hotel programmes.
We’ve got a lot of customers in the utilities,
transportation and infrastructure industries, whose
work is mainly on long stay projects. They’re often
working outside on long shifts. They’re returning
to the apartment at the end of the day, so they
want more of a home from home.
Back in 2018, serviced apartments represented
around 2% of clients’ accommodation spend. Now,
extended stay accounts for 5.3% of our clients’
aggregated accommodation spend. However,
whilst demand has doubled, extended stay
remains a relatively small market.
Understanding the difference between short- and long-term guestsWe’re fortunate with the partners we work with,
including SilverDoor, who have ready access to
inventory for large groups.
The advent of the Airbnb model has highlighted
the need for property operators to understand the
difference between short- and long-term guests.
With the latter, they need to react quickly when
plans change. It’s no good sending an e-mail and
hoping that a problem will be sorted the next day.
As a TMC, we rely on receiving commission but
not every apartment provider pays commission, so
that impacts both our commercial model and our
individual customer agreements.
Cost vs. SustainabilityEvery customer is different. We know sustainability
is a key factor, and carbon emissions from a
serviced apartment are reported to be lower than
modern traditional hotels. Cost remains important
though, and customers are pleasantly surprised
that an apartment doesn’t cost more than a hotel
room.
Pre-pandemic, apartments were the bastion of the
long stay traveller who wanted a home from home.
Then corporate decision makers and travellers
realized that serviced apartment providers
went over and above to promote a safe Covid
environment.
Suddenly they ticked a lot more boxes than hotel
rooms although, by closing off public areas and
restaurants, hotel guests were denied the use of
these facilities. Cost became less important and
was overtaken by wellness and the ability to work
in apartment.
As business travel recovers, we had already seen
an increase in short stay bookings into serviced
apartments so there will be an increase in volume,
but not at the pace we saw in 2021. Lots of Agiito
customers like being in a hotel with a restaurant,
and to be able to invoice that back as a whole so
they don’t have to recover expenses through the
company’s system.
Others don’t like not having a check-in desk, which
is fine for aparthotels but not those who require
the customer to locate and open a key box, for
example.
The next levelThe challenge for apartment providers is what else
can they do to increase market share.
They’ve hit a relatively low ceiling so they may
have to partner with local restaurants, invest in
leisure facilities or target short stay business. I
think the future potential for serviced apartments
is to achieve 10% share of the corporate
accommodation market.
Many serviced apartment providers have already
professionalized themselves in terms of their
marketing, the information they supply about the
rooms, what the bedroom looks like and what the
security access is. This has overcome some historic
obstacles because travellers know what to expect.
Accreditation helps endorse the product where it
has been independently verified. Clients, especially
those in banking, like accreditation because it
reassures them there is recourse if there was a
problem. SilverDoor have developed their own
quality control standards so effectively we have
de-risked ourselves.
We are a mature provider when it comes to
utilising serviced apartments. We were one of the
early adopters, so our knowledge of the sector
has been honed thanks to our partnerships with
SilverDoor and others.

42
Specialist serviced apartment agentMartin Klima, Chief Customer Officer, SilverDoor ApartmentsAs Chief Customer Officer,
Martin is responsible for
the overall strategy of the
Account Management
department across all
SilverDoor offices. He oversees the APAC and
Americas teams to nurture accounts worldwide.
Now that we’ve come out of the pandemic, clients
are focussing on their entire trip rather than just
on one element, such as the accommodation.
They want to know what the trip is going to look
like, from arriving to checking in, staying in the
apartment and that they, through SilverDoor, have
control of the entire process – even if we aren’t
involved in the travel element.
Inevitably, post-Covid, there’s a huge emphasis on
health, safety, cleanliness, and sustainability. As
their provider, they are looking to us to be able
to tick all these boxes. That means us managing
our supply chain effectively to provide them with
different accommodation options that tick the
boxes for them. All of this is under the magnifying
glass now.
Client prioritiesApart from the corporate fundamental of cost,
sustainability is another, usually because their
travel or mobility programmes are trying to meet
the targets set in the C-suite. Usually, however,
it comes down to money, although I’m seeing a
gradual realisation amongst corporates that they
can’t have everything.
For example, an option that ticks all the
sustainability boxes may be more expensive than
another that does not. That’s where we are going
into the unknown; will corporates be prepared to
pay more for an option that tickets every box and,
if so, how much more?
The degree to which traveller preference impacts
the client’s decision whether to choose a serviced
apartment over a hotel depends on the client
organisation and the type of programme they
have. Some allow travellers or assignees to make
those decisions, whilst others have much stricter
policies.
We always collaborate closely with the client to
build a programme that works for them because
we have understood their priorities in terms of
health and safety, cleanliness, Covid policies,
sustainability, and cost.
More choiceThere’s a genuine desire amongst some clients for
new accommodation models like short term rentals
and Airbnb-style home stay in their programmes,
providing they conform with the client’s priorities.
The difficulty lies in a lack of consistency between
products.
Some clients will say they want something with
a bit more character or a bit quirky. It’s hard to
manage that in a programme because the rates
can fluctuate, the quality might change or there
are other nuances which make it difficult to slot
them into a programme compared to a run-of-the-
mill serviced apartment which ticks all the boxes
but lacks character.
With serviced apartments, you know what you’re
going to get. That’s not to say that we don’t source
properties that are a bit different. They may be a
little tricker to deal with, but that’s what we are
there for.
Working with TMCsWe already partner with several TMCs and will
work with more in the future. It’s a matter of
working together efficiently because TMCs are
used to booking hotels, usually via the GDS which
lack the breadth of non-hotel content.
There’s a real need for more extended stay content
to be available online, but the reality is that our
world is different to hotels. We try and make life
as easy as possible for them. We also see large
corporations who select a TMC, and a specialist
serviced apartment agent to work in partnership.
They use the TMC for their air and land travel and
hotels and we plug into the TMC. Usually there’s a
policy in place that stays of five nights, or more are
automatically passed to SilverDoor for fulfilment.
Clients’ reactionsThe response from clients of both companies
to the merger of SilverDoor and The Apartment
Service has been very good. They see that
SilverDoor is ambitious and that we want to bolster
our position in the market to ensure that we’ve got
the best supply chain in the industry.
There was a lot of nervousness amongst clients
when BridgeStreet and Oakwood exited the
market during the pandemic. Clients were worried
other agencies might follow suit and how solid
we were as a company – especially considering
business travel effectively stopped during the
pandemic.
Going forward, we plan to continue to grow our
global footprint and to continue to improve on the
service we provide.

43
Apartments,
Hostels andAparthotels.
stay easy
Whe
reve
r the
jo
b ta
kes y
ou.
We are Forenom - the Nordic region’s leading corporate housing provider and one of the top serviced apartment brands in Europe.
Book online 24h a day with real-time availability to any of our 8000+ locations at forenom.com

44
Assessing performance - hotels vs extended stay
By Michal Rao MIH, STR
For more than 30 years, STR has served the
hotel industry through innovative benchmarking
and data insights that deliver market trend
transparency.
In 2019, STR became part of CoStar Group,
enhancing CoStar’s product line by adding
hospitality performance data into the wider real
estate reporting suite.
The industry self-categorises under numerous
monikers: aparthotel, extended stay, corporate
housing, and serviced apartments. Definitions
can vary considerably by region, company, or
association.
STR regards ‘serviced apartments’ as an umbrella
term for the sector comprising both aparthotels
and corporate housing. There are two ends of the
spectrum, with aparthotels having been derived
from the hotel sector and corporate housing from
the residential/real estate sector.
Data examined in this analysis comes from both
data sets. Data is labelled appropriately for the
sake of transparency and is reported through
September year-to-date unless otherwise noted.
Global accommodation overviewThe pandemic affected the hospitality industry
all around the world since its start in 2020. The
industry has come an exceptionally long way since
the initial lockdowns in Q2 2020. Most continents
started slowly recovering with restrictions eased
from late spring & summer throughout most of the
world in 2021.
Hotel performance year to date as measured by
revenue per available room varied by region due to
individual country travel Covid restrictions. We have
indexed November 2021 year to date performance
to pre-pandemic levels of 2019 (Fig. 30).
Two different reporting methodologies have been
used to report. Standard showing data reflecting
open & operating properties supplying data to STR.
Total Room Inventory takes room inventory of
temporarily closed hotels into account.
Collectively, these showed that:
• Europe is behind most continents as
Covid regulations in many countries
prevented overseas travel together with
consumer confidence for overseas
travel still being low (Figure 28).
Note the difference between Standard
and Total room inventory figures, indicating
temporary hotel closures were still high
in 2021.
• North America & Mainland China saw a
good recovery with both reaching over
75% of their 2019 RevPAR performance.
Domestic and local travel fuelling the
recovery in these regions with majority of
hotels reopened.
• Middle East also saw recovery of RevPAR
to 77% of 2019 levels with strong leisure
demand in summer and the postponed
Expo providing further boost from October.
• Australia & Oceania tracking ahead of
Europe; however, due to various restrictions
for travel within Australia internally and
for overseas travel, the region is still 40%
behind their 2019 performance.

45
Fig.30 RevPAR still has a way to go
RevPAR indexed to 2019, CC, USD, open hotels (standard) & total room inventory (TRI), Nov 2021 YTD
80
79
4875
36
58
7261
5158
57
55
76
40
60
7766
6362
70
Standard Total room inventory
North Amerericaee
Europe
Mainland ChinaMainlanMM
Asia AAsiaAAA(excl. Mainland China)e
Australia & Oceania
Southern AfricaSouth Americcaexcl. Venezuella
Central America Northern Africa
Middle EastMiddle East
Source: STR.2021 © CoStar Reality Information, Inc.
str
Fig.31 Barriers decline, but concerns regarding those unvaccinated increase
Potential hassle of quarantine
Fellow travellers not following the rules
Government legislation/restrictions
Unvaccinated fellow travellers
Last minute cancellations
Refund challenges due to cancellation
Experience will be negatively impacted
Lack of confidence in destination
Additional costs due to required testing
Concerned about my own health
Concerned about travelling (e.g. flying)
Concerned about cleanliness of accommodation
Travel insurance concerns
Financial reasons due to COVID-19
Current barriers to travel
Other
Source: STR.2021 © CoStar Reality Information, Inc.
str
Government Comfort Financial
66%
Response Jul 2021
61%
56%58%
69%54%
50%54%
47%48%
47%43%
47%41%
41%41%
37%39%
50%38%
41%35%
36%33%
23%23%
19%20%
4%3%

46
Serviced apartments overview Serviced apartments gained traction in many
markets around the world pre-pandemic, with
year-on-year percentage growth outpacing that of
hotels. Despite the pandemic, the pipeline of new
serviced apartments coming into various markets
is still strong.
In the UK, STR is tracking 147 new serviced
apartment projects (planning, final planning &
in construction), adding 11,823 new units to the
current portfolio of 25,208 units. That’s almost
50% of the existing supply in the pipeline, should
everything come into fruition. Out of the total
UK pipeline, 18 properties (1,602 units) are
scheduled to open throughout 2022. Germany
has approximately 10% of the current supply in the
pipeline, and Australia with a strong pipeline of
almost 3,000 units.
Covid had a mixed impact on performance
across the markets. Australia and United
Kingdom operators saw lesser declines than their
counterparts in Germany and Singapore (Fig.
32). The business model and product provided
enabled the serviced apartments to remain slightly
more resilient in the UK & Australia, providing
travellers and essential workers better options of
self-contained units when isolating or quarantining
before/after travel.
In the UK, we saw declines mainly due to lack of
corporate & leisure demand which is reflected
in the split decline of almost equal decline of
occupancy & ADR. Similarly to the UK, Germany
saw the declines split between the two KPIs, even
though occupancy suffered more than ADR.
Again, this was mainly caused by the lack of
international corporate demand.
Australia saw declines only in occupancy, due to
the limited demand lacking overseas travel, but
with slight uplift on ADR. Singapore’s performance
shows reverse of Australia, with major declines
in ADR, but only a small dip in occupancy. Like
in Australia, significant restriction on travel into
Singapore put pressure on the rate.
Fig.32 Mixed COVID impact across major serviced apartments markets
Source: STR. 2021 © CoStar Realty Information, Inc
-20%
-10%
0%
10%
-30%
-40%
-50%
-60%
-70%
-30%
-20%
-10%
0%
-40%
-50%
-60%Australia Germany Singapore United
Kingdom
Occupancy % change ADR % change RevPAR % change
-23%
-53%
-43%
-33%
Main KPIs, YE 2021, % change vs 2019, local currency
str
“Per square foot, apartments offer significantly more value for money when compared to even the larger suites on offer at comparable luxury hotels, with no compromise on service. At Cheval Gloucester Park, the lead-in apartment category offers 710 square feet of useable space, for a lead-in rate of £0.42 per square foot. By comparison, Cheval Gloucester Park’s hotel competitors offer average lead-in room rates per square foot of £1.70, a difference of more than 300%.”
John Philipson, Chief Operating Office, Cheval Collection

47
Diving deeper into the individual markets, all markets
worldwide follow a similar pattern (Fig. 4), except
Singapore, as previously discussed. Edinburgh
serviced apartments sector saw slightly lower
impact due to surge in staycations and some
short-haul international travel demand during
summer and autumn of 2021. The Covid pandemic
significantly impacted the Frankfurt market. Being
a prominent business & finance hub in Germany,
the lack of corporate travel & conference demand
put a strain on all parts of the hospitality sector,
including serviced apartments.
As expected, the major Australian cities saw a slightly
more significant impact than the country average.
The impact is brought on by the restrictions imposed
on inbound travel to Australia throughout most of
2021, while all three markets are corporate business
hubs as well as leisure destinations.
Fig.33 All Major markets following similar patterns
Source: STR. 2021 © CoStar Realty Information, Inc
-20%
-10%
0%
-30%
-40%
-50%
-60%
-70%
-80%
-90%
-30%
-20%
-10%
0%
-40%
-50%
-60%
-70%
-80%ACT &
Canberra AreaMelbourne Sydney Berlin Frankfurt Munich London Edinburgh Singapore
Occupancy % change ADR % change RevPAR % change
Main KPIs, YE 2021, % change vs 2019, local currency
str
-43%
-56%
-51%
-46%
-67%
-54%
-43%
-25%
-43%
“We recently acquired the Regent Hotel in Cambridge, which we converted into an aparthotel (Regent by CityStay) in December 2021. Right up until December, occupancy was exceptional in our serviced apartments, whilst the hotel struggled. Although ADR has been considerably stronger in the hotel, it has been operating around the 50-60% occupancy vs the 85+% occupancy in our apartments over the same period. This contrast could show the differences within the corporate and leisure markets, or that the type of accommodation yields different results.” Declan Fitzhenry, CityStay
STR conducted this analysis for publication in this report. STR was not remunerated in any way for
its analysis, and its participation in this analysis was not contingent upon developing or reporting
predetermined results.

48
Operator & supply update
By Bard Vos
Despite the pandemic, the world’s serviced
apartment industry continues to grow. Since our
last GSAIR, we estimate the number of serviced
apartment units globally has increased by 11% to
1,299,328.12 The sector’s rate of growth has slowed,
due to the pandemic, from 15% two years ago.
The growth rate for several locations served
by serviced apartments has also slowed during
the pandemic, from 18% in 2018/19 to 10% in
2021/2022. When aggregated with corporate
housing13, this means that global inventory has
reached 1,382,369 in 17,054 locations.
When GSAIR was first published back in 2008,
we identified 401,977 units in 6,722 locations,
so the serviced apartment market has grown by
almost 2.5 times in units and 1.5 times in locations.
Fig. 34 Global Serviced Apartment Supply by Total Units
Europe
The Americas
Middle East
Asia
Africa
Australasia
0 100,000 200,000 300,000 400,000 500,000 600,000 700,000
2020/21 2019/20 2019/18
12.The figure is calculated by aggregating returns from every major chain and brand, with a 10% uplift to account for independent operators or small brands of which SilverDoor may not be aware.13. There is no standard industry definition of corporate housing. They vary from a specific product to the American term for serviced apartments. Please refer to the Glossary at the start of the report for the definition on which our estimates of supply are based.

49
Fig. 35 Global Serviced Apartment Supply by Locations
Europe
The Americas
Middle East
Asia
Africa
Australasia
0 1,000 2,000 3,000 4,000 5,000 6,000 7,000 8,000 9,000
2020/21 2019/20 2019/18
Global supply The top 15 global suppliers chart shows minor
change from its pre-pandemic equivalent. Marriott
remains the largest player in the extended stay
hotel market with 171,672 units across their five
brands, of which Residence Inn has the largest
portfolio.
Hilton remains in second place with The Ascot
leapfrogging Intercontinental Hotel Group into
third spot.
Fig. 36 Top 15 Global Chains by Locations
1,000
1,200
1,400
1,600
800
600
400
200
0
Mar
riott (W
orld
wid
e)
Hilt
on W
orld
wid
e
Inte
rcon
tinen
tal H
otel G
roup
The
Asc
ott L
td (W
orld
wid
e) in
c..
Exten
ded S
tay
Am
erica
Cho
ice
Hot
els (U
SA)
Acc
or H
otels (W
orld
wid
e)
Pierre
& Vac
ance
s (E
urop
e)
Hya
tt H
ouse
In Tow
n Su
ites
Oak
woo
d
Frase
rs H
ospita
lity
(Wor
ldw
ide)
Appar
t’ City
Sone
sta
Stud
io 6
Haw
thor
n Su
ites
Nat
iona
l Cor
porat
e Hou
sing

50
Fig. 37 Top 15 Global Chains by Units
140,000
160,000
180,000
200,000
120,000
100,000
80,000
60,000
40,000
20,000
0
Mar
riott (W
orld
wid
e)
Hilt
on W
orld
wid
e
Inte
rcon
tinen
tal H
otel G
roup
The
Asc
ott L
td (W
orld
wid
e) in
c.
Exten
ded S
tay
Am
erica
Cho
ice
Hot
els (U
SA)
Acc
or H
otels (W
orld
wid
e)
Pierre
& Vac
ance
s (E
urop
e)
Hya
tt H
ouse
In Tow
n Su
ites
Oak
woo
d
Frase
rs H
ospita
lity
(Wor
ldw
ide)
Appar
t’ City
Sone
sta
Stud
io 6
Haw
thor
n Su
ites
Nat
iona
l Cor
porat
e Hou
sing
Top 15 chains Of the extended stay chains, Marriott’s Residence
Inn has the largest footprint, followed by Extended
Stay America and Staybridge Suites.
However, in terms rate of growth, Choice Hotels
USA leads the way with more apartment units
coming on stream compared with pre-pandemic,
followed by Accor (46%), IHG and Hyatt (both
42%) and Hilton (30%).
Choice, Accor and IHG have also extended their
footprints the most in terms of locations served.
Choice Hotels, Woodspring Suites

5114. Figures include pipeline to 2024 and therefore includes inventory in development and not yet open.
Fig. 38 Top 15 Global Chains with Brand Breakdown14
Locations Units
Accor Hotels Adagio 155 19,687
The Sebel 35 2,528
Suite Novotel 35 4,572
Breakfree 24 3,440
Mantra 82 15,869
Peppers 30 5,112
Pullman 2 290
SS Enseigne 1 62
Sofitel 1 182
Raffles 1 67
Fairmont 1 108
Swissotel 3 255
Total 370 52,172
The Ascott Ltd Ascott The Residence 70 15,459
Citadines 171 30,659
Somerset 111 22,089
Other Serviced Residences 51 9,289
Tujia Somerset 10 2,022
Quest Apartment Hotels 178 11,872
Lyf 17 3,222
Total 608 94,612
Extended Stay Hotels Extended Stay America/Canada 651 71,827
ESA – Premier Suites 24 2648
Total: 675 74,475
Frasers Hospitality Fraser Residence 17 2,314
Fraser Suites 27 4,460
Fraser Place 12 2,207
Modena Residence 7 1,533
Capri 12 2,655
Total 75 13,169
Intercontinental Hotel Group (IHG) Candlewood Suites 442 38,930
Staybridge Suites 464 50,737
Atwell Suites (from 2021) 19 1,877
Holiday Inn Club Vacations 28 8,679
Total 953 100,223
Marriott Marriott Executive Apartments 32 4,646
Residence Inn 884 109,324
Towne Place Suites (USA) 433 43,791
Protea Hotels – Africa 3 147
Element Hotels (Extended stay) 94 13,764
Total 1,446 171,672
Pierre et Vacances Pierre & Vacances 226 19,656
Maeva 53 4,500
Total 279 24,156
Choice Hotels Mainstay Suites 217 14,423
Suburban 86 8,918
Woodspring Suites 298 35,844
EverHome (new brand) 18 1,800
Total 619 60,985
TOTALS 5,025 591,464

52
Fig. 39 Top 15 Global Chains by Rate of Growth in Locations 2020/21 vs 2018/19
Accor Hotels (Worldwide)
Choice Hotels (USA)
Hilton Worldwide
Intercontinental Hotel Group(Worldwide)
Marriott (Worldwide)
Hyatt House
0% 10% 20% 30% 40% 50% 60%
New brandsNew extended stay brands have continued to be
launched throughout lockdown. Some are new
brands launched by existing operators, like edyn’s
new Cove brand, Oakwood’s Living, and Cheval’s
My Locanda announced but not due to open until
2024. Others are new entrants to the market, like
Domus Stay.
Domus Stay’s service covers everything from bijou
one-bedroom apartments to five-bedroom family
homes in the centre of Notting Hill. It launched in
spring 2021. Not exactly ideal timing, or so you’d
think.
Rachel Angell is Chief Operating Officer at Domus
Stay. “We are a joint venture between Domus Nova, a successful independent estate agency based in Westbourne Grove, and SilverDoor’s parent company Habicus Group. The idea came from existing demand for short let and for homeowners to place their properties with a company that understands property, how to take care of high-value assets and who can approach the market in that way.”
“Our clients are highly affluent, connected individuals who are used to the best of everything and delight in the detail of design, art, and culture. They know that where they choose to stay, reflects themselves.”
“We had known for some time that our clients were already starting to look at this model even before the pandemic hit. If you think about it, comparing the cost of a two or three-bedroom apartment with a similarly sized house, you’re getting much more value for money and much more privacy. Brand is critically important. It is the way that you present yourself to your customers” says Rachel.
Today’s customer is faced with a tsunami of
accommodations choices, such is the proliferation
of serviced apartment brands across hospitality.
The top 15 global suppliers operate 54 brands
between them.
The number of brands in the lodging sector is
growing, in part, because the big players have
moved to the “asset light” model meaning they
don’t own many of the hotels that bear their
names, so they franchise them instead.
With so many serviced apartment and other
accommodation brands out there, the challenge
for the brand owner remains that of differentiating
one brand from another. Those with deep enough
pockets can leverage their brands to amplify
competitive differences, but what about those
who are gradually building their brands without
the benefit of multi-million-dollar marketing
budgets?
Which begs the question, are brands important
in this space? Here, SilverDoor’s Victoria Jackson
provides her perspective.

53
Are Brands Important in Serviced Apartments?
By Victoria Jackson, SilverDoorBrands are universally
important. Connecting
with people’s emotions
is the key to developing
customers who are more
loyal, less price sensitive,
more likely to come
back repeatedly, and
recommend products
to their friends and family.
Customers who have developed a bond with
businesses are extremely valuable. They are
described as “fully connected customers” and
are over 50% more valuable, on average, than the
highly satisfied customer. These customers are a
company’s dream: individuals who purchase more
of your goods and services and are focused on
your external messaging.15
A study by Harvard Business Review found that
fully connected customers would typically be
prepared to pay over 40% more for a hotel room
stay. The same principle applies to a serviced
apartment.
In fact, when you factor in the length of stay, and
the increased amount of time a traveller typically
spends in an apartment, the more emotional the
purchase decision is likely to become. If a traveller
is staying for longer than one or two nights, the
emotional side of the brain comes into play, so
the accommodation must work harder to meet
the traveller’s needs for sleeping, working, eating,
relaxing and socialising.
Having a distinctive visual identity allows an
operator to create a thread that runs through all
elements of the user experience – the social media
grid, the booking confirmation, what they see
when they arrive at the property, and the in-house
touches within the apartment itself. The tone of an
operator’s communication and how it interacts with
its customers both contribute to brand identity.
Simply put: Repetition + Consistency = Familiarity = Emotional connection.
Creating emotional connection delivers value
because that’s what’s driving the bus when
we make our purchase decisions. Even on a
subconscious level, and even when we are
travelling on business.
Serviced Apartments are the fastest growing
sector in the hospitality industry16 and an
increasing proportion are branded. Why is this?
Serviced Apartments of days gone by tended to
be pretty generic, functional, and undistinctive.
One apartment was much like the next, with little
emphasis on identity, aesthetics, or inspirational
design.
However, there has undoubtedly been a shift in
demand. This may have something to do with
the new markets serviced apartments have been
exposed to over the last five years. A combination
of global hotel groups such as Marriott, Accor
and Hyatt launching extended-stay products on
a global scale, as well as Airbnb, has meant both
business and leisure travellers are increasingly
comfortable with the product and choosing from
the range of self-contained hotel alternatives.
Whilst it’s still relatively uncommon to be asked for
specific brands, here at SilverDoor in most cases
it is location and rate that drive the business we
place. The section of the corporate market where
it does matter is those travellers that are in control
of their own buying decisions. Normally that’s
SMEs or the C-suite.
Having said that, for many apartment operators,
their business comes from both corporate and
leisure guests and, if a serviced apartment wants
to draw on leisure business to fill the gaps, they
have needed to up their game.
This goes some way to explaining why staying in
a serviced apartment is becoming less functional
and more about lifestyle and identity. Of course,
the basics must be there, the beds need to be
comfortable, and the apartments need to be clean
and safe, but a brand that takes the time to build
its identity also gives you confidence that it will
value guest experience and great service.
Modern consumers have so much choice at their
fingertips that they need to be able to understand
who you are as a company, your history and
provenance, your values, and the story that you
are trying to tell.
People don’t buy what you sell, they buy how you
make them feel. The emerging cohort of branded
serviced apartments and aparthotels emphasise
modern, unique design, inspired by location and a
meaningful sense of place that echoes the qualities
of the brand itself, as well as the location, and
the city.
15. https://www.wesayhowhigh.com/blog/article/why-are-brands-so-important 16. https://servicedapartmentnews.com/news/industry-news/serviced-apartments-and-aparthotels-are-fastest-growing-seg-ment-in-uk-hospitality/

54
Why brands are importantA brand gives you a personality and identity and a
world where companies are jostling for position in
our minds and our social media feeds. Personality
is what makes a company stand out from the
crowd. Branding is a platform where companies
can differentiate their product, their service, their
vision, their way of dealing with customers.
Good branding also helps your target segments
recognise that what you offer is for them. If you’re
targeting families, then simple, clean, unfussy
apartments with clever design solutions, pull out
beds and sofa beds are going to appeal. If your
target is digital Nomad Temporary Housings, then
stylish communal areas, super-fast Wi-Fi, clever
technology and creating a sense of connection
and belonging is crucial.
Branding also speaks to a wider trend on
employee engagement that cannot be overlooked
in hospitality: attracting and retaining the best
talent means creating a brand that your staff
feel connected and engaged with. Millennial and
Gen Z employees are highly brand conscious17;
they want to work for companies with vision and
purpose, who are transparent about their values
and ethics.
Brand is often perceived as a service guarantee,
boosting familiarity and reassurance among
guests. This is important for corporate travellers
as well, despite the need to book within policy and
comply with budgets.
Whether it’s their own money or their company’s, if
someone has an enjoyable experience at a branded
aparthotel or apartment in one location, they
are more likely to choose that brand in another
location and become loyal, enthusiastic advocates.
These are customers that any business wanting to
grow should be nurturing and investing in.
“Effective brands transcend transactional relationships and forge emotional connections with consumers. This is best achieved through compelling story-telling: articulating a clear and engaging vision and value proposition, which speaks to your target audience and differentiates you from your competitors – while establishing a level of trust and loyalty.” Nick Barton – edyn Chief Commercial Officer
17. Forbes
staycove.com

55

56
Alternative accommodation modelsBy George Sell, Serviced Apartment News and Merilee Karr, STAA
These days, serviced apartments are not the only
alternatives to hotels. Home stay, or home rental
providers like Airbnb and onefinestay, short term
rentals, co-living spaces and build to rent (BTR)
properties are lining up alongside aparthotels and
serviced apartments to provide travellers and their
employers with unprecedented choice.
So wide is that choice, the term ‘alternative
accommodation’ is hard to define, but for the
purposes of this article, we are talking about
providers of short- and medium-stay rental
apartments who are targeting both business and
leisure travellers.
The units can be owned by individuals (and
offered by a property management company),
or by professional and increasingly often, by
institutional landlords.
It could be argued that the catalyst for the
majority of these has been Airbnb, which was
founded in 2008, and has a market capitalisation
of $96 billion at the time of writing.
Airbnb was initially viewed with deep suspicion
and even hostility by hotel operators, who were
irked by what they saw as an uneven playing field -
with Airbnb hosts not subject to the same levels of
regulation and duty of care as they were.
But in the serviced apartment space, the reaction
was generally different. Airbnb normalised
staying in an apartment rather than a hotel - it
inadvertently directed new guests to serviced
apartments. It was also a much cheaper platform
than the main OTAs to list short-term and weekend
inventory, an opportunity which many serviced
apartment operators have availed themselves of.
Corporate travellers, and those who book their
travel, have been wary of Airbnb and its peers
such as Vrbo, despite their constant efforts to
grow market share in the space. This generally
comes down to concerns over duty of care and
consistency of product.
Turning proThis is where the professionally managed short-
term rental space comes in, and it is a vibrant and
fast-growing space. It is organised, and it has its
own trade associations and accreditation schemes.
Merilee Karr is deeply immersed in this sector -
she is CEO and founder of management company
UnderTheDoormat and chair of the UK Short-
Term Accommodation Association, focussing
particularly on upcoming regulation changes
policy and standards within the sector.
“One of the things that is changing in our industry is the professionalisation of short-term rentals. Often our sector is epitomised by Airbnb, but that’s only a small part of the market. Much of the market is now made up of professional operators and brands that are offering a high-quality product that’s accredited in similar ways to a serviced apartment or a hotel.”
Vivi Himmel of agency AltoVita agrees that the
sector is more professional now. “What really matters are the basics. Well run properties with safety and security protocols in place. The companies must be legitimate, have hospitality expertise, the right insurances and comply to local regulations as well as having 24/7 support and a well-defined risk management procedure.”
“Covid gave a huge push towards a convergence between hotels, apartments and co-living into a model that cherishes design, functionality, locality and authenticity.” Moran Machtey, Co-founder & CEO of Gold Tree Hospitality (GTH)

57
Merilee Karr believes that the STR and serviced
apartment markets are non-competitive. “The market is growing and people who might not otherwise have travelled because there wasn’t an accommodation type that suited them, are now travelling because there are different options available.“
“That’s important because this is not a hotels and serviced apartments versus short-term rentals play. By working together and collaborating more we’re going to see the size of the market grow overall. I think there’s plenty of space for all these players to have a significant stake within it.”
Another hurdle to the sector has been the
bewilderingly differing regulatory approaches
to how it operates - in the US for example, rules
can be different from city to city in the same
state. Some European cities have cracked down
hard on the sector in response to over-tourism
and its negative effect on local housing markets.
In some countries the sector has been actively
discouraged, in others it’s pretty much been left
to do its own thing.
Market opening upIf it is to make serious inroads into the corporate
travel space, government backing and approval
is essential, and this is starting to happen in
territories which have been wary of alternative
providers until relatively recently. In January 2022,
UK prop tech firm Lavanda partnered with Abu
Dhabi developer Aldar to create Cloud Living, a
short-term leasing platform that provides flexible
stay options in homes within Aldar’s integrated
communities.
Cloud Living is targeting professionals, ex-
pats, and tourists, and will operate under a new
regulatory framework that has been developed
after collaboration and consultations between the
Department of Culture and Tourism – Abu Dhabi
and key stakeholders from the private sector,
including Aldar and Lavanda.
One of the more interesting group of providers in
the alternative space is what are often referred to
as the master lease operators. A master lease is an
arrangement whereby a branded service provider
promises to rent all available space in a building
from the landlord for a predetermined price,
before subleasing it to third parties. The brand
then takes control of the full tenant experience.
New playersThere were a lot of companies entering the
space pre-pandemic, often billing themselves as
proptech companies rather than operators, or at
the very least tech-enabled operators. They were
aiming to attract a professional audience who
had become accustomed to booking Airbnb for
leisure travel and wanted a similar but branded
experience for business travel.
What these companies had in common was
that they were set on a course of rapid growth,
attracted a huge amount of investment, seldom
made a profit, and in many cases didn’t survive the
pandemic.
Sonder, Lyric, Stay Alfred, Domio, Locale, The
Guild, and Sweet Inn all fit in to this group. Only
Sonder, Locale, Sweet Inn, and The Guild are still
trading as accommodation providers.
Aldar, The Arc Gate, Abu Dhabi
Aldar, The Arc Gate, Abu Dhabi

58
Lyric, despite raising a reported $180 million in
a series of funding rounds featuring the likes
of Airbnb as investors, has ceased operating
properties, and pivoted in to offering its
Wheelhouse software to other providers. Stay
Alfred, who raised at least $60 million, was a
victim of the pandemic-induced travel shut down
and ceased trading as early as May 2020.
Those that have survived the pandemic have had
mixed fortunes. Sonder, who raised a staggering
$310 million in investment, listed on the Nasdaq
exchange in January 2022 after merging with
special purpose acquisition company [SPAC]
Gores Metropoulos II. Its share price failed to
match the spectacular rise seen by Airbnb when
its IPO went live, but at the time of writing it has
stabilised at $10.15, 18 cents above its opening
price.
Taking a different stance from the self-styled tech
companies of the master lease world is London-
based Domus Stay, a joint venture between Domus
Nova, an independent estate. agency based in
Westbourne Grove, and Habicus Group.
COO Rachel Angell says “We’re a hospitality company primarily. The idea for the company came from Domus Nova and existing demand from their customers, for short lets, and for the opportunity for homeowners to rent their homes in this way, but with a safe pair of hands.”
“They wanted somebody that they could completely trust to understand property, who understands how to take care of high-value assets and who can approach the market in that way. We are not a tech player.”
BarriersSo what are the barriers that have prevented the
alternative sector from taking a bigger slice of the
corporate travel market, and how is it addressing
those barriers?
Merilee Karr was the first to contract with UK
government agencies to provide short term
rentals. “Our sector is disaggregated. There are a lot of companies but few large brands. Government said it would buy short-term rental products under two conditions. First, every provider had to come under one umbrella, which is why we created Trusted Stays as a dedicated distribution channel for short term rentals.”
“The second, and bigger hurdle was making sure that the cleanliness and guest security standards were in place to meet corporate and government duty of care obligations. If our sector is going to play in that world, we must deliver on that, which is why we partnered with Quality in Tourism. The accreditation scheme that we developed here in
the UK has been incredibly helpful, because it was backed by the Ministry of Housing Communities and local government.”
There was also a third barrier. “It’s critical to be on the systems that corporates and governments use to book, which means the GDS. We’re now live in the GDS world so that we’re able to offer accredited properties from our sector, via Trusted Stays and the GDS.”
DemandIs demand for non-traditional serviced apartments
growing? “To some extent” says SilverDoor’s Alex
Neale, citing the lack of on-site amenities at check-
in as a major shortcoming of most alternative
models.
“Demand for unique units or homes is coming from the leisure market, which has created awareness of those products, even though we don’t see any usage of Airbnb by SilverDoor clients.”
“Clients may mention Airbnb because they are familiar with the brand but when offered a serviced apartment instead, they see that they’re getting the facilities they wanted from Airbnb but in a more formalised, consistent product.”
Domus Stay
Domus Stay

59
RisksMost consumers are comfortable picking their
own accommodation, so when it comes to travelling
on business, it all comes down to how much
autonomy the company gives the individual to make
their own choices of accommodation. But there are
risks, as SilverDoor’s Shabina Awan explains.
“Self-sourced accommodation obviously comes with health, safety, and security risks. We find that clients listen to our advice and rationale, so they decide to stay where we have a verified product. For us as an agency, the challenges arise where a private landlord is running the property.”
“It may be a very professionally run rental, compliant from a health and safety perspective. Getting to the owner and the person responsible for maintaining the health and safety of this accommodation is critical.”
“Unless the property manager has total access to the product and full control of the maintenance of that product, problems can arise. In the case of home sharing scenarios. Sometimes, we’ve had to step in when customers have been let down by landlords suddenly turning up and wanting to use the property themselves. That doesn’t work in the corporate market.”
Major players join inThe success of the alternative sector has not gone
unnoticed by the major hospitality companies, and
some have been proactive in their approach to
getting involved.
Marriott got its foot in the door in 2018, when it
launched Tribute Portfolio Homes in conjunction
with the now-defunct property management
company Hostmaker. The venture was renamed
Homes & Villas by Marriott International (HVMI)
and significantly expanded the following year.
It works with a range of property management
companies internationally, which it says are
selected “based on their expertise, compliance with local regulations and service standards for both homeowners and guests.”
Marriott has also launched a pilot whereby guests
booking rentals on Homes & Villas by Marriott
International can use the amenities at nearby
Marriott hotels. Marriott loyalty program members
can also earn and redeem points by booking
properties directly on HVMI.
An even earlier adopter was Accor, which bought
London-based luxury home sharing company
onefinestay for $170 million (£117 million) in April
2016. onefinestay now offers around 5,000
properties worldwide, along with a range of
concierge services.
18. https://newsroom.hilton.com/hilton/news/hilton-hotels-resorts-survey-explores-how-young-business-travellers-prefer-to-work-and-relax
As the proportion of millennials in the corporate
traveller community increases, it’s hard not to see
an increasingly vital role for what we now call the
alternative sector but will most likely soon be seen
as a mainstream option.
People who have grown up with Airbnb are
used to choosing and booking their own
accommodation. They are also increasingly
resistant to rigid, narrow corporate travel
programmes. This is a group which blurs the
boundaries between business and leisure travel.
A survey by Hilton found that nearly 40% of
millennials will not take a job that doesn’t allow
them to travel for business18.
Travelport’s Mark Meehan, Group Vice President,
and Managing Director of Global Operations said:
“Millennial travellers in APAC are now heavily using digital channels in all stages of business travel. This high use, however, is being matched by increasing frustrations with existing offerings, which indicates corporate travel in the region is on the verge of leaving the digital age and entering a new era, in which sellers need to use digital channels to deliver value in more modern and sophisticated ways.”
BenefitsSo what are the benefits of short-term rentals?
“Our sector provides flexibility unlike any other asset type” says Merilee Karr. “We can bring on supply quickly, then turn it back into residential accommodation. That flexibility of supply coupled with rising demand, where there will always be peaks and troughs, will drive the short-term rental market.“
“Short term rentals scores over serviced apartments in three ways. First, authenticity. Each home has distinct characteristics. Second, there are many different price points. Third, you’ve got more flexibility, especially for different group types and sizes.”
Altovita’s Vivi Himmel says there’s a long way to
go before wholesale adoption is achieved. “The market is like a bell curve, with visionaries who want to use the best tech at one end making up less than 15% of the market. At the other end there are those who need persuading, so they need a more traditional product.”
“We need to strike a good balance between the delivery of quality services as well as technology that organisations can truly rely on. Automation doesn’t mean you remove the human touch, but it’s up to travellers to decide what they want. Millennials want self-check-in, whereas Baby Boomers like high-touch. So, if an operators can still offer both, why not?”

60
Trends driving the extended stay sectorBy Mark Harris
“It’s human nature to move, to travel, but not necessarily to stay in the same place. What the pandemic has shown is that people want space inside and out, especially after being shut in during lockdown. If you need to work from home, you can do that quite comfortably in an apartment without having to sit on the bed.” Steve Lowy, Anglo Educational & The Residence Apartments
Since its first edition, GSAIR has aimed to track
the trends driving the serviced apartment sector
and the wider extended stay market. In this ninth
edition, we are providing a deep dive into some of
the trends referenced by GSAIR contributors from
all over the world.
One of the consistent themes in this edition of
GSAIR is how the pandemic accelerated many
pre-existing demand trends, as well as creating
some new ones. Which will prove short lived, and
which could be here to stay?
Supply shortageAs well as being driven by a resurgence in
corporate demand, the serviced apartment
sector’s recovery post-pandemic is based on
a powerful performance during it, although
some operators were forced to cease trading
during lockdown because their revenue dried up,
reducing supply.19
Supply is slowly returning as corporate demand
builds back, and part of that shortfall is being
filled by alternative accommodation models. Data
for the final quarter of 2021 and the first in 2022,
shows that supply shortages drove prices up by
10% for one-bed apartments, 30% for two bed
apartments and 40% for three-bed, compared
to 2019.
In 2022, a combination of travel returning, pent-
up demand, spiralling energy costs and operators
dumping inventory amidst the escalating crisis in
Ukraine, has exacerbated the problem.
Environment Social & GovernanceEnvironmental, Social and Governance (ESG)
risk is a hot topic in boardrooms, with businesses
developing ESG strategies for many business
functions including corporate travel programmes.
This means reducing carbon footprint, using
renewable energy, reviewing third-party suppliers’
ESG-related practices, and prioritising employee
safety and well-being.
A three-step ESG campaign was launched
in January 2022 by the UK’s Business Travel
Association to help fulfil the United Nations’
COP26 goals. BTA Chief Executive Clive Wratten
said, “The entire industry needs to view ESG through a wider lens. We have always known that carbon offsetting alone is not enough, and that more must be done internationally and domestically to ensure that sustainability is intrinsically weaved throughout the travel supply chain from flights, to rail, to hotels and cars.”20
19. SilverDoor booking data20. https://travelweekly.co.uk/news/travel-agents/business-travel-association-plans-three-stage-esg-initiative

61
Sustainability
As ESG policies filter down to corporate travel
decisions, serviced apartment operators know
they need to demonstrate what they are doing
to satisfier clients’ objectives. 61% of operators
say sustainability will be a major influence on
corporate travel decisions in 2022.21
Business travel is professional services firm PwC’s
single largest source of carbon emissions. The
company has now set a new travel intensity target
to reduce emissions from business travel per
employee (FTE) by 33% in 2022.22
Fig.40 How business travel will change post-pandemic
65%
64%
48%
48%
38%
Tighter travel restrictions by role
More cost-conscious
More focus on the social and environmentalimpact of travel
More focus on positive traveller experience
Tighter travel restrictions by role seniority
31%
20%
14%
12%
6%
Shorter trips
More combined business/leisure trips
More employees travelling due to distributed workforce
Longer multi leg trips
Preference for rental accommodations vs. hotels/motels
How will business travel most likely change post-pandemic?
Source: Greenbiz
Operator initiatives
Partner perspectives“At Accor, we have committed to the elimination of single-use plastics from the guest experience by the end of 2022, and to a net zero carbon footprint by 2050. Building design, technology, material selection, use of green energy and close collaboration with our investment partners will be critical to achieving these ambitious yet essential objectives. Extended stay brands like Swissôtel Living with its focus on vitality and wellness, will be integral to our strategy.”Jeff Tisdall, extended stay SVP, Accor
“Serviced apartments are usually cleaned weekly, whilst hotels usually clean daily. We do not produce much waste, because we don’t consume as much cleaning supplies. Our energy costs are lower than hotels, working hours are more family-friendly and salaries are higher than the market average. There is an adage in Germany “Tue was gutes und rede darüber” (Do something good and talk about it) so it is time to talk about it, officially.” Burak Ünver, Managing Director, SMARTments business
“Our flexible service concept enables the repurposing of existing properties for accommodation. In addition, we are always looking for innovative ways to reuse empty buildings. Repurposed properties will play a significant role in our real estate strategy in the future as well. This naturally increases effective use and occupancy of buildings in real estate markets creating a positive environmental impact in society. Our goal is to continue this pattern through the life cycle of a property to minimise our overall ecological footprint.”By Johannes Kangas, CEO, Forenom Group
The challenge for corporates is to strike the right
balance between protecting the bottom line and
creating a set of policies that better reflect the
environmental and social aims of a responsible
business. The technologies to do so already exist
through sustainability tools to help travellers
compare the environmental cost of their travel
choices.
21. SilverDoor LinkedIn poll 202122. https://servicedapartmentnews.com/features/serviced-apartment-and-extended-stay-industry-trends-for-2022/

62
Most serviced apartment operators have already
embraced the sustainability agenda or plan to.
edyn, for example, has put sustainability at the
core of its customer proposition, as Nick Barton
explains.
“At edyn, we talk about Soulful Hospitality; environments that nourish and enliven the soul, because we believe that people want to try and do the right thing. It’s about being human about business.”
“edyn has always been focused on rooting itself in the communities that we build and operate. That usually means collaborating with local suppliers. We contract out all our food and beverage and work with local providers that can bring a sense of the local environment, as well as creating jobs and employment locally.”
Despite not being sustainability experts, CityStay’s
Declan Fitzhenry agrees there are easy wins
any operator can make. “Early next year, we’ll be opening an aparthotel, converted from a hotel. We are considering selecting contractors based on their sustainability credentials, ensuring sustainability runs through the whole project so we deliver something as carbon negatively as we can.”
Dublin-based Staycity’s strategy for a green future
is built around greenhouse gas emissions, health
and wellbeing, and waste management.23
CFO Wayne Arthur says the company has invested
around £40m in its sustainability roadmap.
“We commissioned a Danish company to conduct a review and help us work out what we would deliver on that road map. We’ve just appointed
a Sustainability Director and will be recruiting a small sustainability team. We’re aiming to achieve carbon-free construction of our apartments.”
Green financeAside from societal influences, the greatest
impetus for sustainability in extended stay is
coming from investors and asset management
companies, according to Deborah Heather from
M-Assessment.
“Projects that meet a lender or investor’s green criteria are likely to enjoy a lower cost of capital. The average ‘greenium’ on green finance products (lower interest and coupon rate payments), for borrowers and bond issuers, respectively) is between 15 and 25 basis points.24
Heather acknowledges that the extended stay
sector is in the earliest stages of its sustainability
journey but notes that no-one has produced a
definitive set of rules for serviced apartments to
adopt.
“The first thing operators should do is look at their Opex investment and decide what costs can be included in their P&L to put sustainability measures in place. The Capex piece is some way off in terms of having a robust pathway to make their buildings more sustainable.”
Investors’ role in driving the sustainability agenda is
confirmed by edyn’s Nick Barton. “We are a private equity owned business and we must do things the right way. That means being anti-bribery, anti-slavery and so on. We’re audited externally on that, which matters because guests want to know they’re dealing with an ethically and morally sound business.”
Fig. 41 Most companies have pledged to reduce emissions but only 1-in-3 have definite plans in place
Source: Deloitte Corporate Travel Survey 2021, N = 150 executives with oversight of business travel policy, spend, and strategy.
Deloitte Insights | deloitte.com/insights
31%Pledge to reduce carbon
emissions by specific amount
within specific time period 21%Timeline in place but
quantifying emission reductions
is a work in progress 11%Emission reduction
quantified but working
towards developing a timeline
17%Pledge to reduce but no
quantity or timeline
commitment
21%No sustainable
commitment
23. https://www.staycity.com/staygreen/24. AHV Associates - The Opportunity of the Horizon: Green Finance in Real Estate and Hospitality

63
Will corporates pay a greenium?As serviced apartments continue their
sustainability journey, the question remains
whether they are prepared to pay more for a
greener product and, if so, how much? Staycity
surveyed half a million customers on this issue,
2,000 of whom responded. “They told us that sustainability is important to them, but they don’t want to pay any more for it” says Wayne Arthur.
“The brands that don’t implement robust sustainability programmes will become stranded assets. That’s because our corporate clients are asking us for our sustainability plans and for evidence of what impacts those actions are having.”
Deborah Heather believes corporates will accept
some price increases. “The money markets’ focus on sustainability will mean operators and corporates gradually moving to the triple bottom line (TBL) which tracks performance by profit, people, and planet. That doesn’t mean there won’t always be those who search out the cheapest option.”
“New builds have a huge advantage because they don’t have the same problems operators of older buildings do, like leaks and energy inefficiency. If they are not prepared to, or can’t afford to invest in sustainability, then their market share is going to dry up sooner rather than later.”
Greenwash There is a thin dividing line between promoting
good practice and using sustainability as a
marketing tool. Those who stray do so at their peril
because Gen Z will call out those who greenwash.
Customers are savvier and the media are eager to
pounce on any cases of corporate hypocrisy. Press
is much more on this. “If you don’t do sustainability properly, then it’s not worth doing at all. And not telling the truth is the worst crime you could commit“, says Deborah Heather.
“This already happened in the cleaning piece. I’ve been calling it Cleanwashing. We’ve seen the global hotel brands do this and it’s done them no favours. Even Google has got Google Certified now, putting sustainability claims through a set of criteria using their algorithms. So they can help people find sustainable product. It’s a real opportunity.”
Sian Sayward is Governance Director at UK
trade association beam, formerly the HBAA.
She is adamant there is no ‘do nothing’ option.
“Sustainability is about so much more than just making sure we are recycling our plastic, with more and more organisations considering ESG as a more complete set of criteria to be measured or measure on, the serviced apartment sector has the same responsibility as the rest of industry.”
“This is not a flash in the pan trend, the roadmap to net zero will not be easy for our sector but there are great initiatives that can support organisations in their endeavours to become more sustainable, it will not be an easy task given the revenue lost to our sector during the pandemic, but as the UN Secretary-General Antonio Guterres said, ‘We need to turn the recovery into a real opportunity to do things right for the future.’”
Equality, Diversity & InclusionThe death of George Floyd in 2020 prompted
the hospitality industry to question existing
levels of diversity and inclusion. The reality is that
women and BAME (Black, Asian, and Minority
Ethnic) remain vastly underrepresented in areas,
which is unwelcome news for a sector that thrives
on multiculturalism.
There are worryingly high levels of concern about
the impact of racism in the workplace, with 28%
of Asian, 37% of Black and 39% of mixed ethnicity
respondents experiencing or witnessing racism in
their current place of work.25
In 2020, 53% of the UK’s Institute of Travel
Management buyers, managers and heads of
travel said they were “specifically addressing”
these issues in their company travel policy or
programme, but that figure fell to 32% in 2021.26
In 2021, the Global Business Travel Association
announced it had launched a Diversity, Equality,
and Inclusion (DE&I) committee. It followed
a similar initiative by the fledgling Travel and
Meetings Society in 2020. SilverDoor’s Pauline
Houston chairs that committee.
“I came into travel 27 years ago but, as my career progressed, travel was only diverse or inclusive up to a point. The higher you went, the less diversity
“Australia lags behind the rest of the world on anything to do with sustain-ability, Corporate Social Responsibility, Diversity, Equality, and Inclusion. I thought we were far more advanced than we are. As a business, we must recognise it isn’t an option anymore to just say, ‘we do sustainability.’” David Mansfield, Quest Apartment Hotels
25. Inside Hospitality Report 202226. https://skift.com/2021/12/16/travel-buyers-made-little-progress-on-diversity-and-equity-in-2021/

64
there was. Now, there are more opportunities regardless of gender, race, orientation, or physical ability.”
“I’m not pro-female or anti-male; I’m pro-everybody having an equal chance. Unfortunately, by creating opportunities for females we have marginalised males, so we have created a new inequality.”
Pauline concedes that, despite some
advancements, there’s a long way still to go as
an industry, “but I think there’s a willingness and an appetite to do it that didn’t exist a few years back. We’ve achieved equity, but not equality and inclusiveness.”
Many corporations used their downtime during
the pandemic to review how they engage with
their workforces, how they recruit, develop, and
retain their in-house teams. Employee retention is
hugely profitable because a happy employee is a
productive one.
“Customers apply a lot of pressure to suppliers because they want to understand your company culture” says Pauline Houston. “In SilverDoor we are applying that same pressure throughout the supply chain because we, and our clients, only want to work with companies that promote good DE&I practice. As more organisations adopt the same approach it becomes a domino effect.”
Pauline says that extended stay’s performance
on DE&I is in line with the rest of travel. “Although there are good and bad examples across the board, the number of good examples is growing. However, we must be careful that the actions we are taking collectively are not seen as a PR exercise. If your motivation is to get onto an RFP you wouldn’t normally be on, that will be quickly seen through.“
Fig. 42 DE&I – the business case
Source: Inside Hospitality Report 2022 https://skift.com/2021/12/16/travel-buyers-made-little-progress-on-diversity-and-equity-in-2021/ McKinsey
2014
Why diversity matters2
By gender diversity
+15% +21% +25% +35% +33% +36%
By ethnic diversity
Likelihood of financial outperformance, 1 0/0//
Deliveringthrough
diversity3
Diversitywins4
Why diversitymatters5
Deliveringthrough
diversity6
Diversitywins7
2019 2014 20172017 2019
Bottom quartile Top quartile
4754
45
55
44
55
43
58
44
59
43
59
Addressing past mistakesGBTA’s DE&I committee comprises subcommittees
that focus on specific topics such as age bias,
disability bias, racial, sexual orientation, gender
and cultural.
“We’re finding some corporations admitting they have got it wrong and who then explain what they are doing to address those mistakes Through a combination of providing materials and an engaging face-to-face environment we are helping those corporations looking for guidance,” Pauline says.
“I’m in the subcommittee for ageism, which we’ve split into those up to 29, the sandwich generation who are aged 30 to 45, and the more experienced generation of 45 to however old you want to be when you retire.”
“Generally, senior leaders come from the sandwich or more mature generations. When I came to SilverDoor, I found myself working with the younger generation, which has dispelled a lot
of myths you hear about the young not having enough life or work experience. That group has a lot to bring to the table because they see things through a distinct set of eyes.”
“In Australia, there are around 24 million people, of which more than five million have accessibility needs, whether whether they’re in a wheelchair, are hearing-impaired or whatever. As an accommodation sector, we don’t do enough to make it easy and effortless for that that individual to experience a stay in a property.” David Mansfield, Quest Apartment Hotels
27. https://www.mckinsey.com/featured-insights/diversity-and-inclusion/diversity-wins-how-inclusion-matters

65
Fig. 43 Business traveller anxieties during pandemic
Source: https://www.mckinsey.com/featured-insights/diversity-and-inclusion/diversity-wins-how-inclusion-matters McKinsey
Journey importance, % of respondents2
50
60
40
30
20
10
0
0 5 10 15 20 25
Using hotel amenities
Dining-in
Checking-in
Checking-out
Making a reservation
Overall exposure to guests
Staying in room
The health, safety and welfare of guests and staff
remains a key issue throughout the supply chain.
The implications for operators and agents have
been significant, both in the UK and further afield.
“It’s been vital for operators to maintain exacting standards of cleanliness and hygiene to ensure the safety of both guests and staff,” says Jason Delany,
Staycity Director of Brand, Product, and Marketing.
“Very early on, we put together a comprehensive video outlining the measures and systems we had introduced, how we were dealing with the health and safety issue from a housekeeping and personnel perspective, at check-in and check-out and throughout our public areas.”
Daniel Blaauw is director of MUi STAYS in South
Africa. “Here, hygiene requirements put a lot of financial pressure on hosts. Guests were asking not to be placed in a room that was stayed in at least 24 hours before, so hosts lost those nights of revenue.”
“From the guest’s perspective there has been a lot of anxiety involved in travel even for the least anxious person. Emerging variants, changing regulations and vaccination requirements cover a few of the guest worries when leaving the safety of their home. As a result, guests are waiting until the final hour to book, leaving little time for preparation. In times like these reputation goes a long way on both sides of the transaction.“
As Jenni Määttä, Director, Quality at Forenom
Group explains, “the cleaning sector has always experienced a lack of recognition for some reason. I want to make sure that people appreciate the work our service team does daily. What is important is that each working day runs smoothly and to plan. When your tools are up to the job, you can focus on what is essential.”
“At the same time, we perform hundreds of monthly quality inspections. We also collect feedback from our guests at different points during their stay and our cleaning staff can access their personal feedback on their mobile phones. This instant customer feedback allows us to find new development opportunities and thank our employees for a job well done!”
To provide their guests with a safe environment,
Oakwood launched Oakwood Clean360 in
June 2020, as CEO Dean Schreiber explains.
“Operational protocols include the option for contactless service and heightened sanitisation of key areas.”
In October 2020, the group partnered with
International SOS, a leading health and security
services company. International SOS’ global
medical consultancy helped Oakwood to assess
risk, reviewed and enhanced Oakwood’s hygiene
standards framework, and developed audit tools to
monitor compliance and implementation across Asia
Pacific, the United States, and the United Kingdom.
28. https://www.mckinsey.com/industries/travel-logistics-and-infrastructure/our-insights/make-it-better-not-just-safer-the-opportunity-to-rein-vent-travel

66
Smart technologyAs Jeff Tisdall of Accor confirms, innovation has
been an important theme within the serviced
apartment sector for many years as new
entrants, brand renovation projects and exciting
new service offerings have transformed the
competitive landscape, and the pandemic has
accelerated these trends too.
“We see three important catalysts,” says Jeff.
“A significant disruption in the way we work, the paramount importance of sustainability and wellness, and an unmet need amongst business travellers to live life uninterrupted. Remote work means working from home, but also from your ‘home away from home.’ That is why we are working hard to integrate flexible office solutions like Wojo and Working From across our 15 extended stay hotel brands.”
Kim Krollman of OWL Rentals says guests “need to access all their travel and accommodation information easily. They must be confident that that data is not being used for anything else.”
In-apartment, the pandemic has accelerated the
use of smart technology with greater adoption
of remote check-in and check-out, online
communication with guest team and keyless entry.
However, as Burak Ünver of SMARTments business
points out, investment might be better placed
into building smart building infrastructure for
better energy management than in creating ‘smart
rooms.’
“One of the most important points in digitalisation and automation is the PMS because, without the right PMS, you will never be able to use those smart technologies. Unfortunately, many of the well-known PMS provider are not running with the times because it is either extremely hard or too expensive to connect some of these old technologies with new interfaces.”
Smart bookingsMany serviced apartment operators have re-
focussed their distribution strategies on direct
bookings or consolidating third party channels.
The opportunity for extended stay operators to
establish a greater presence across the distribution
landscape has never been more apparent, says
Robert Alley of Roomzzz.
“Access to technology, agents, aggregators, meta-platforms, channel managers, the GDS and agile PMS systems has never been easier. The key to market penetration now lies in putting availability, content, and price into the hands of the traveller and the decision maker. Operators large and small cannot be left behind. New platforms and established travel partners are racing to build the most user-friendly and reliable platforms to gain share and win customers.”
CityStay’s Declan Fitzhenry admits that pre-
pandemic, his net wasn’t cast as wide as it ought
to have been, and that when hotels closed, he
was suddenly open to some new markets. “We’ve improved our distribution strategy but that is by approaching these new markets and taking time to understand them.”
IntegrationsTechnology integration has brought greater
flexibility, putting clients in total control at every
stage of the traveller journey, which is what
business travellers request in greater numbers
post-pandemic.
These advancements enable companies to
implement more dynamic travel policies, with real-
time changes via up-to-the-minute travel data. As
well as live booking, travel programmes can be
more agile, ensuring travellers’ safety and security
is maintained while still complying with agreed
SLAs.
All-in-one booking and travel management
platforms consolidate each phase of the booking
process, journey, and stay into one centralised and
data-secure space. Clients can receive up-to-date
market data, financial reporting capabilities, and
detailed travel analytics.
Martin Klima, Chief Customer Officer at SilverDoor
points out that the serviced apartment sector
is always compared to hotels in terms of the
technology powering distribution systems,
property management systems and so on. He
says the comparison is unfair because there are so
many niche serviced accommodation providers.
“Our challenge is to collate diverse content and present it in a consistent format to clients. Our platform enables clients to know what we’re booking for them and that compliance with their own programmes is being maintained.”
SilverDoor’s Chief Information & Technology
Officer Hanish Vithal thinks that his company’s
investment in technology to support long-stay,
investment in corporate housing programmes is
paying off.
“The whole check-in process is slicker and more built-in digital technology. The booking process for extended stay compares favourably with hotel technology that allows you to find an apartment, check availability, book and pay in one transaction. “Our online booking platform, aimed specifically at the global mobility industry has received great feedback since we launched it in 2018. It enables users to make instant online bookings across a global inventory of apartments and adds a lot of value to our TMC partners, for whom extended stay is now an important offering.”

67
OAK21_5204 Oakwood ConsultationReviewing_APAC A4_R4 OL.pdf 1 8/2/22 6:45 PM

68
Remote workingAlthough impossible to quantify, remote working
seems to be here to stay. A November 2021 survey
by YouGov for the BBC found that 70% of UK
office workers said they would never return to
offices “at the same rate” as before the pandemic.
In the same poll, 79% of business leaders agreed
that office workers would spend at least part of
their time working remotely.30
In response, some companies are hiring serviced
apartments for board meetings because they
offer kitchen facilities, private bathrooms, plenty
of space, quiet and privacy without any time limit
on use. Isolation may have its benefits, but it also
carries risks, especially around mental wellbeing.
However, remote working doesn’t always mean
working solo. Julia Harnischfeger is MD of
German-based JOYN Serviced Living.
“People enjoy having a space outside of their apartment to work in shared spaces. They may not be shared offices, but they are shared spaces. Some competitors are significantly reducing their shared community space in new developments, but it is central to our concept.”
As Nick Grassick: Partner, PH Real Estate and The
Concierge by PH Real Estate points out, “travellers don’t select accommodation based on the purpose of their stay anymore - it’s not leisure or business, but spaces that enable both. Why should I book an exceptional hotel with luxurious facilities, if it does not even offer a comfortable work desk and chair for when I need to work during my stay?”
Burak Ünver, Managing Director at SMARTments
business agrees that remote working is one of the
most important trends the global lodging industry
must counter.
“A report by German Travel Association DRV predicts that business journeys will decrease by 10-15% in the long term but that length of stay will increase. The importance of a good mixture of extended stay guests and short/mid stay guests is nothing new. Traditional hotels are trying get a piece of our pie, so shouldn t we do the same?”
Sustainability. Diversity, Cleanliness, Smart
technology in-apartment and managing every
stage of the trip. Each of these trends pre-dates
but has been accelerated by the pandemic. None
are likely to disappear soon.
“2022 will see the rise of the office as a ‘campus’ rather than simply a place to sit and work. With hybrid
and home working now the norm for many, this year will see a reimagining of the office space.” 29 Molly Johnson-Jones, Flexa
Partner perspective – Frasers Hospitality
Why the Hospitality Industry is Seeing a Surge in the Extended-stay MarketAt Frasers Hospitality, we have observed how prevailing hybrid work conditions have recalibrated the needs
of the business traveller. With the ease of remote working, executives seek a viable alternative to traditional
office settings and the work-from-home format that was dominant during the pandemic. With the option
to work from any place and travel whenever they choose the attraction of living and working in a safe and
comfortable setting with all the comforts of home, is sparking an interest in longer stays.
Our efforts to create a haven for our guests during the pandemic was rewarded with high occupancy rates
at those properties which remained open during the pandemic. Guests appreciated the exacting standards
of service, housekeeping options, the flexibility to cook in their own kitchens and the luxury of space that
allows them to isolate themselves in separate rooms when necessary.
We believe that this trend will continue, if not grow. Hybrid work is the new normal for organisations, which
are also planning trips with environmental sustainability in mind. This results in longer stays, combining
business and leisure, which have reduced emissions and maximise value for businesses.
In the longer term, the extended-stay industry must swiftly adapt to the changing needs of travellers
who require accommodation options to support their hybrid work or business trips. Larger rooms and
apartments with separate living and work areas are key. In-room kitchens are no longer a ‘nice to have’
but a must-have; flexibility is expected, and green credentials are essential. With the industry's most advanced technology platform, Oasis delivers the largest marketplace of over 14,000 fully vetted and professionally managed buildings to the largest clients in the world.
Loft Gustave: Paris Rental
oasiscorporatehousing.com | oasiscollections.com29. https://techround.co.uk/guides/predictions-for-the-future-of-work-in-2022/ 30. https://www.bbc.co.uk/news/business-58559179

69
With the industry's most advanced technology platform, Oasis delivers the largest marketplace of over 14,000 fully vetted and professionally managed buildings to the largest clients in the world.
Loft Gustave: Paris Rental
oasiscorporatehousing.com | oasiscollections.com

70
Impact of Covid on the extended stay sectorBy Mark Harris
What does success look like? In many respects, the
greatest achievement of the serviced apartment
sector was that most operators stayed open
during the Covid lockdown, whilst most hotels
closed.
As in previous global crises, serviced apartments
again proved their resilience, thanks to a
combination of trust and confidence in the
product and its operating standards; the sector’s
ability to react quickly, and the versatility of its
lean business model, reducing risk.
Serviced apartments led the hospitality sector in
mitigating the impact of the pandemic in terms
of isolating and social distancing. Helped by an
increase in average length of stay, housekeeping
was cut back, public spaces closed to non-
residents and room service was largely taken over
by Deliveroo. Operating costs were cut, and an
already lean business model made even leaner.
Fewer (transient) guests meant substantial
reductions in administration costs and
commissions to OTAs, plus lower payroll costs,
already between 12 - 15% of turnover compared to
28 - 30% in a traditional hotel.32
“At a time of mass disruption and demand shocks in the hospitality sector, it is the fundamentals of the core product, which have proven the sector’s resilience. Critically, operators have been able to actively target a diverse mix of guests with a long-stay requirement, in need of self-contained, safe, and secure accommodation, underpinned by accredited standard of hygiene.” 31 Knight Frank
“In 2020 we should have made EUR 11 million EBITDA and we lost EUR 12.4m. That’s a big hit, especially for a small company like ours.” Wayne Arthur, CFO, Staycity
Although these factors protected the sector,
serviced apartments were not immune to the
pandemic. In February 2021, London serviced
apartments, corporate housing and aparthotels
reported 56% occupancy33, down 9% year-on-
year. By comparison, London’s hotels reported
24% occupancy, down from 78% on a year-on-
year.34
Serviced apartments fared even better in other
global regions. Serviced apartment brands
operating in Asia-Pacific saw occupancy rates as
high as 80%, even during the height of the crisis.35
Remote working and the near obliteration of
face-to-face meetings may have decimated travel
volumes, but the average length of room nights
booked by business travellers rose by one night
between 2020 and 2021.36
“They are that rank-and-file everyday travel,” TRIPBAM CEO Steve Reynolds told Business Travel
News. “They want to stay in a different kind of place. If I’m going to be there two weeks, I’d rather stay in something that’s homely.”
31. https://www.knightfrank.com/london-report/2020-09-22-advantages-of-the-extended-stay-sector-proven-during-the-global-crisis- 32. Ibid 33.STR 34.https://www.businesstravelnewseurope.com/Accommodation/Serviced-apartments-place-in-post-pandemic-programmes 35. https://www.bworldonline.com/resilience-and-reinvention-in-the-serviced-apartment-landscape/ 36. TRIPBAM
“The pandemic made serviced apartments more attractive because people who didn’t understand it now do. Now, people who weren’t sure about it, are.” Elie Milky, Radisson

71
Changing traveller priorities/needs During the pandemic, everyone was forced to
isolate, for which serviced apartments are perfect.
Guests don’t have to mix with each other; they can
order their favourite food, they can eat, work, and
never set foot outside their front doors.
As demand rebounds, how have travellers and
assignees’ needs changed? Lucky Nwosu is Vice
President of Rehoboth Property International, a
property development company and operator of
serviced apartment brand Suites by Rehoboth.
“Clients have seen the advantages of staying in a serviced apartment, standards and expectations have been set. Guests are asking a lot more, not just in terms of the whole health and safety side of things, but the information they receive pre-arrival, the quality of check-in and then the amenities in each apartment. The market is slowly adjusting to that as well.”
Daniel Blaauw of South Africa-based MUi
STAYS says flexibility is crucial. “Our clients want accommodation that allows for an extension or cancellation if necessary. Previously there was a strict set of guidelines that laid out cancellation terms, these now need to be more flexible.”
“Previously large teams were travelling overseas and looking for several rooms in a specific area. Now, teams are largely consolidated and staying where each of them needs to be. There is still a drive towards the major cities in Africa, but clients are now more particular on the area of city they would like to stay in.”
In the corporate housing sector, project-based
working seems to have recovered quickly, as Steve
Frey of Oasis Corporate Housing confirms.
“People are going to wherever they need to be, are staying for as long as they need and going home again, rather than relocating their families. They are staying longer but they’re not having to spend ancillary funds on things like moving their household goods across the world.”
Amongst corporate clients, Frey says some things
are as they were pre-pandemic. “Customers are still asking how I can save them money? I mean, we’ve all lived in apartments. Have you ever had your rent go down next year? It doesn’t.” “The number one cost of what we deliver is rent. The only way that can be done now is from efficiencies through building technology. But once you’ve automated, there are no more efficiencies to create. So, the only way you can reduce cost is reduce length of stay, and we are seeing corporates do this to reduce spend.”
Fig. 44 Travel managers expect to implement new policies within 12 months
Source: World Economic Forum
100%of travel managers expecttheir company to implementnew guidelines or policies inthe next 12 months.
Real-time
updates on
potential risks
Require
vaccinations
before travel
Pre-trip
approval
Enhanced
duty of care
Allowing
booking on
supplier sites
Increased
flexibility on
how to travel
Mental
wellness
check
54% 51% 47% 47% 46% 40%31%
37. https://www.weforum.org/agenda/2021/08/business-travellers-demand-flexibility-Covid-19/

72
Fewer trips, longer staysPost-pandemic, there will be fewer business trips,
but many of those that take placer will be longer.
On average, 38% of company employees will
travel on business, compared with 40% pre-Covid.
Meanwhile 41% of companies expect to make
fewer business trips than before the pandemic.38
Sustainability considerations, coupled with a focus
on purposeful travel makes fewer trips logical.
Equally, after two years of relative inactivity the
need to win and service business also makes
it logical that those trips will be longer. There
are other factors driving this, including traveller
wellbeing and productivity.
“Many are combining work travel with leisure (workcations) or extending business trips to spend more time in the location, negating the need for multiple back-and-forth’s with more flights (which is more sustainable)” says Altovita’s Tara Scrivener.
Lucky Nwosu agrees. “Pre-pandemic, our average length of stay was probably around seven days. Now, it’s around 14 days.”
Guest amenitiesServiced apartment operators are always keen to
respond to guests’ changing interests and needs.
Some look for shared community amenities such
as fitness centres, pools, and lounges. Others are
more interested in individual apartment amenities,
such as natural light, larger kitchens, in-unit washer
and dryers, balconies, or terraces.
During the pandemic, outdoor spaces, reliable
(i.e. super-fast) Wi-Fi connectivity and extra space
for working all became must haves for guests,
travellers, and assignees alike. Extra space and
technology providing connectedness, convenience
and control are here to stay.
73% of renters say larger living spaces are
important, up 5% on 2020, which was before
many spent the pandemic year living, working,
and playing from home.39 As a result, developers
are reviewing apartment layout as they look to
enhance the work from home environment. That
includes spaces like islands for eating and working,
desk nooks, den plans and larger floor plans
overall.
Steve Lowy of Anglo-Educational & The Residence
Apartments thinks it will be some time before
serviced apartment users see any real changes.
“Physically, you won’t see much change over the next two or three years. Where you may see a significant difference, especially in corporate housing, is in furnishings and so forth. We have a large corporate that wants and is prepared to pay for office chairs.”
“If you think about it, why wouldn’t you want an office chair in an apartment you’re using to work in? Similarly, our newer buildings have five or six hundred meg Internet. It’s a better sales pitch than a swimming pool.”
Steve’s strategic thinking has evolved. “During the pandemic, the British government’s messaging wasn’t great. There was a point where we did not have an idea of what we could and couldn’t do. We had to produce our own rules around laundry drops. If the company, the agent, and the guest agreed that they wanted a re-clean, we had people on hand to do that.”
“The outside world was scary for other people, so helping people with prescriptions and food boxes and everything else showed we had that inbuilt flexibility. That flexibility is now a massive sales point, like having beds and cots and accepting pets. We had someone who even brought a snake.”
“We look at buildings differently. Two new ones in Hoxton and Tower Hill are new builds with built-in internet infrastructure, innovative technology that’s very hard to put into old buildings. In new builds our cost of delivery is much cheaper because they are easier to clean, fix and upkeep, so we’d rather take on new buildings rather than looking at old ones. That’s a big shift in business strategy.”
Greater focus on risk managementInevitably, Covid threw extra light onto the issue
of how risk is managed throughout the supply
chain. The main outcome of the pandemic has
been the proliferation of accreditation scheme, as
SilverDoor’s Quality Assurance and Compliance
Manager Toby Roberts explains.
“During the pandemic, there was a heightened effort around duty of care, which puts more stress on accreditation and third-party vetting. We are now seeing most RFPs ask for quality assurance information from operators via us. Some of the larger ones have specific lists of exactly what they require in terms of health and safety.”
Toby says that the numbers signing up for
one or more accreditation scheme have been
disappointing. “Many businesses have been struggling over the last few years and there is a fee involved in accreditation. This is preventing some operators gaining the credit they deserve for the lofty standards they maintain.”
There are a lot of new accreditations coming onto
the market post-Covid, which not only leaves
operators trying to distinguish the wheat from
chaff but raises issues around the actual quality
of some accreditations, some of which are self-
assessments. As Toby puts it, “it’s like marking your own homework. How much weight do they carry?”
38. https://www.fleetnews.co.uk/news/fleet-industry-news/2021/09/17/two-fifths-of-firms-expect-to-make-fewer-business-trips-post-pandemic 39. Assurant Inc. 2021 Multifamily Housing Renter Perspective Study

73
Launching a new brand in the pandemicLockdown didn’t stop several new brands launch
in what easily qualifies as difficult circumstances.
These included Stay & Co, Bob W, Your
Apartment, Stay, Capital Residencies, Charles
Hope Apartments and Gravity in the UK alone.
Cheval Collection launched a new urban lifestyle
serviced apartment brand, MY Locanda.
Daniel Johansson, Director of Development &
Acquisitions, Cheval Collection, said “The serviced apartment market continues to evolve, and we are thrilled to be launching MY Locanda and meeting growing demand from guests for stylish, design-led apartments where they can feel part of the local community.” “We have been developing MY Locanda for several years as the perfect partner to our existing set of brands. It is important for us to launch MY Locanda to underscore our commitment to this new and exciting phase in our growth and the evolution of the serviced apartment sector.”
Oakwood launched three new brands during 2020
and 2021, starting with Oakwood Beluxs, followed
by The Unlimited Collection by Oakwood and
Oakwood Living, the last in November 2021. CEO
Dean Schreiber explains the company’s thinking.
“The pandemic has altered guest expectations on traditional hospitality services, and there is enormous potential to benefit from this trend. With the emergence of a new generation of travellers and the desire for owners to reach this emerging market of consumers, Oakwood identified opportunities to provide for guests who value authentic engagement and personal lifestyle as much as service excellence.”
“With the extended stay sector fast becoming a preferred choice of accommodation amongst both owners and guests, the pandemic served to accelerate our plans for intended brand launches.”
London-based Domus Stay also launched mid-
pandemic. Rachel Angell is Chief Operating
Officer. “We originally planned to launch in summer 2020 but the pandemic happened. Ironically, this gave us time to focus on both the customer and homeowner experiences; to build a brand, which would stand out in a saturated market and present our proposition eloquently.”
“In the end, we launched in April 2021. We started welcoming guests from around June and effectively the phone really started bringing from August when international travel resumed. The major issue was that our core clients were simply not traveling so we had to think about things in a unique way.”
Maintaining competitive advantageLike it or not, the pandemic handed extended
stay a competitive advantage compared to hotels.
But how long will it last? Gavan James of Nomad
Temporary Housing sees challenges ahead.
“Providing you’re careful not to chase weekend stays or five-day stays in London, and you’ve gone after the long stay market, you’re well positioned. Above a 30 day stay, you’re golden because even in a time of crisis, those properties emptied out much slower than somebody who was chasing the leisure market.”
“Some VC-backed brands who have entered the market in the last three years went out and master-leased thousands of apartments in top European cities on long-term leases of five and ten years. They were going after the Airbnb traveller but caught a big cold because next to nobody travelled and they didn’t have the long-term renters to replace them.”
“Professionally managed properties like the Ascott and Frasers had the right balance of short and long term stays so they had better rates of resiliency.They didn’t trash their rental rates down to, £50 per night. To be competitive, they set limits and left apartments vacant rather than drop rates any further.”
OutlookIn what we used to call ‘normal times,’ the sleek
serviced apartment/aparthotel model, with
limited food & beverage offering and high-yield
accommodation business, would make a gross
operating profit 55% to 65% higher than a hotel.
In the new (make that latest…) normal,
performance may be well below budget, but
serviced apartments remain profitable and, with
so many lessons having been learned, sector
businesses have the tools to take that performance
to new heights.
Confidence in the extended stay product has been
supercharged, which should make decisions at
both ends of the supply chain better informed and
innovative operators in pole position to reap the
greatest rewards.
The evolution of the sector has also given a new
momentum, driven by greater empowerment
of customer to make their own accommodation
choices.

74
Is accreditation important?By Mark Harris
In February 2022, International Serviced
Accommodation Accreditation Process (ISAAP)
launched its Security Accreditation scheme for
serviced accommodation and corporate housing.
Audited by UK Government-regulated awarding
organisation SFJ Awards, the scheme enables
serviced apartment providers of all sizes to
demonstrate their commitment to high levels
of security. It also marked the latest move in an
increasingly crowded accreditation landscape.
The story really starts in 2003, when Quality
in Tourism was operating & delivering national
accreditation schemes for Visit Britain. Since them,
several milestones have been passed, notably
the launch of ASAP’s Quality Accreditation
Programme in 2014; The AA’s star rating scheme
for serviced accommodation followed in 2016.
Why accreditation?Although the pandemic brought into sharp focus
the importance of cleanliness standards, creating
consistent standards across the board has long
been a goal for travel and relocation managers
alike. Compliance and accreditation are an integral
part of corporate travel.
Decision makers want to know all reasonable
steps have been taken to ensure their employees
safety and welfare. So, independent assessment is
needed to evidence that operators and buildings
are legal and safe, whilst operators merit their
inclusion on any corporate’s programme.
Valid accreditation schemes can engender
credibility, trust, and confidence in smaller or
independent operators, helping to assure buyers
that they know what they are doing and that a
great guest experience awaits.
These schemes go beyond quality, legality, and
safety to include other benchmarks of service,
amenities, and company culture, to measures
that will support corporate ESG objectives.
These include sustainability accreditations such
as ISO14001, REST by QiT, and EcoSmart by
Greengage. Most are busy aligning themselves
with the UN’s 17 Sustainable Development Goals
(SDG) and climate change targets.40
The Global Healthcare Accreditation Programme
has launched new accreditation programs for
hotels looking to attract wellness and/or medical
travel guests. Both accreditation programs —
WellHotel for Well-being and WellHotel for Medical
Travel—focus on validating the programmes hotels
provide for these growing niche markets.41
Navigating the mazeSo far so good. Problems arise when multiple
accreditation schemes come onto the market.
In 2019, and in response to client feedback,
SilverDoor undertook a major global project
focusing on quality assurance and compliance.
Quality Assurance and Compliance Manager Toby
Roberts explains the rationale and main findings of
the project.
“Many of our major clients have detailed Health and Safety requirements. We wanted to give operators the means to highlight their compliance with these requirements, and for a wider range of accreditation bodies to be recognised.”
“While quality-led star ratings add value, clients primarily want assurance that the apartments their travellers choose are safe, clean, and adhere to the necessary legislations. Furthermore, property level accreditations are regarded as vastly superior to operator level evaluations and/or evaluations that don’t incorporate a physical inspection.”
As a result, SilverDoor created its own set of
minimum standards covering quality, compliance,
and service levels that all operators must adhere
to. There are over 70 H&S data points alone, with
additional documentation required where relevant.
Third-party screening services have been
introduced with a range of tools allowing
individuals and companies to be checked for
possible ‘red flags’ secluding charges and
convictions for money laundering, modern slavery
and so on. The agency also recognised two
accreditation schemes, Quality in Tourism (QiT)
and Common-Sense Compliance (CSC).
“By working closely with the accreditation organisations we know which operators are accredited and use this information internally to make sure the most compliant and safest properties are prioritised” says Toby.
40. https://sdgs.un.org/goals 41. https://www.hotelmanagement.net/operate/gha-program-launches-wellhotel-accreditation

75
Mandated or optional?Deborah Heather of M-Assessment used to run
the Visit England accreditation scheme. “I always think that when something isn’t mandatory the bad actors opt out and that’s what we’re finding now with accreditation in extended stay.”
“The risk is that the poor performers could dominate perceptions of the industry, especially, now customers are more aware of deposits, issues around getting their money back and cleanliness, than they were pre-pandemic.”
“There is a real blurring of lines between what a product was originally intended to be and what it becomes, and between what operators can and can’t do. Misleading the customer reflects badly on us all.”
In early 2022 it was announced that the British
government is to look at setting up a holiday lets
register for England, amid concern that a lack of
affordable homes is destroying communities.42
It promised a consultation that would also study
the effect of websites like Airbnb. In Scotland, a
licensing scheme is under consideration.
The research paper that prompted the
announcement (growth in short term lettings)
makes it clear that locations outside London could
be brought into line with the capital, where anyone
who wishes to use residential premises for short-
term accommodation for more than 90 nights in a
calendar year must seek planning permission from
their local planning authority.
Deborah has mixed feeling about developments at
Westminster and Holyrood. “It’s a hammer to crack a nut but it acts as an incentive to do the right thing because there’s a mixed bag of people and products, especially in the sharing economy. They think they can just make a little bit of money without having the knowledge of the compliance issues.”
“The good thing about registration schemes is people take it seriously. It makes it easier for a local authority to prosecute where operators are not meeting the requirements. Nobody wants to put anyone’s life at risk. However, whilst registration will make it better, it won’t solve all the problems.”
Corporate concernsLee Whiteing used to be Global Head of Travel
for HSBC Bank. Today, he is poacher-turned-
gamekeeper, working with Global Secure
Accreditation (GSA), new owners of ISAAP.
“When I was a travel manager, I was always concerned that many corporates did the absolute minimum to cover themselves. They asked a few questions in RFPs about safety and security but didn’t put much faith in the quality of the answers because there was a perception that some operators would supply responses that would get them onto the programme.”
“In terms of non-hotels, my biggest concerns were always around home rental products like Airbnb. They represented the biggest risk and, even today, lots of corporates are uncomfortable having them on their programmes. There are also concerns around mixed use buildings where there are serviced apartments, but some are privately owned, have separate landlords but no reception.”
As people start to travel again, corporates are up-
dating authorisation policies to determine who can
travel and who can’t. The introduction of ISO31030
has crystallised many of these issues. Introduced
in April 2021, ISO 31030 helps companies manage
business travel risks and may potentially be used
by courts as a benchmark in litigation.
Lee believes that serviced apartments agents and
aggregators need to inject some urgency into
their clients’ decision making. “It’s about the entire Journey from start to finish. It’s about the fact that the corporate entity is responsible for that individual when they’re traveling for business, from the minute they leave home to the minute they return.”
How existing schemes differEffectively, accreditation schemes differ in three
main respects.
• Those that are self-assessed or verified;
effectively marking their own homework,
or via third parties like QiT, CSC, ISAAP
or Bureau Veritas.
• Accreditation at a company level,
such as an ISAAP Quality assured
provider, or accreditation at building
level, such as ISAAP building or QiT Safe
Clean & Legal.
• Those that focus on Quality, Compliance,
Security or Sustainability.
So why has no single scheme emerged that
is practical for operators and has resonance
with corporates? Toby Roberts says, “one globally recognised scheme has its advantages, but multiple schemes create competition and
“The confidence clients get from consistency in accreditation schemes is strong, so we are guiding them through a maze of different offerings. It’s about ensuring the right match of assignees or travellers with accommodation product. We want a stay to start off happy and end happy.” Shabina Awan, SilverDoor
42. https://www.bbc.co.uk/news/uk-politics-59900299

76
continuous improvement. Accreditations within the UK and EU are relatively well known, but in the US, and APAC, fewer providers are accredited.” “Although demand for duty of care and sustainability is becoming more important to the corporate traveller, the uptake in accreditations has been lacking. More needs to be done in educating the travel buyers on the value of third-party certifications, the demand from them, supported by the agency community, will drive uptake by operators.”
What accreditation schemes should coverRoberts believes having multiple accreditation
types gives operators choice to undertake one
suited to their business. “It’s important that accreditations clearly define what they cover so corporates know what they are looking at. A consultation approach rather than purely a pass or fail is more valuable.”
Property level accreditations carry much more weight to our clients as they require annual site visits and inspections. We are often required to inspect properties for clients prior to their stay, so vetted accreditations carry a lot of weight with us.”
As Lee Whiteing points out, one of the challenges
with ISO 31030 is it might encourage more
entrants who will reduce accreditation to the
lowest common denominator by providing
a service they feel just about ticks each box,
thereby making it a numbers game. “So it’s up to corporates to make sure that the product they get covers their requirements, and needs, and gives them confidence.”
SecurityDuring the pandemic, a mini ecosystem of
suppliers sprung up, each offering operators
advice, help and accreditation that their
accommodation was a safe place to work and
visit. ASAP introduced a ‘Stay with Confidence
Promise’43 whilst CSC introduced a Covid ‘Safe
Place to Visit’ initiative.44
GSA, which acquired ISAAP in July 2021, was set
up by former senior Metropolitan Police officer
and Head of UK counterterrorism Bob Quick,
who was also responsible for the security of the
royal family, Prime Minister, cabinet and visiting
dignitaries. Lee Whiteing picks up the story.
“Bob spotted a gap in in the security of business travel that was highlighted by the Mumbai attacks. There are multiple layers of security across aviation and flying, but not in accommodation. GSA was set up to provide independently certified security and safety accreditation for hotels, extended stay, and other types of accommodation.”
“GSA does not accredit a hotel or a property. We gather the evidence and carry out the assessments and then present that information to SFJ Awards, who are OFQUAL recognized in the UK, and they give that accreditation. This avoids any conflict of interest because, at the end of the day, there is a cost attached to accreditation that the property must meet.”
“During the pandemic, we introduced Covid safe accreditation. Now, our standard accreditation includes pandemic (rather than Covid-specific) response, so we are ready for whatever might come. However, we still believe Safety and Security is a huge issue, even if it wasn’t top of everyone’s agenda when people weren’t travelling.”
“Our market is very much corporate travel managers and risk managers. We are not going to extended stay operators because we’d just be another company trying to sell a product which they may or may not buy. But if one of their major customers asks them to be accredited by an outside agency, and then four or five others do the same, that’s another matter.”
Relevance and regionality
“Personally, I don’t think a one-off certification has any value. You’ll always find something that gives you a label to put on a website.” Julia Harnischfeger, JOYN Serviced Living
Whilst most operators welcome any initiative that
improves the perception of serviced apartments
through enhanced standards, they are not yet
convinced the right solution has been found.
“Accreditation provides guests with assurance that we knew what we’re doing, providing the accreditation is up to date” says Steve Lowy of
Anglo-Educational & The Residence Apartments.
“We must be accredited for Education too. For us to deliver education, we’re accredited by the Quality Assurance Agency for Education. If we don’t get QAA accreditation, we can’t issue visas.”
“As a serviced accommodation provider, we’re accredited through ASAP, and the feedback is always helpful. It takes someone who stays in a lot of apartments to highlight areas for improvement. It also weeds out rogue operators.”
43. https://www.relocatemagazine.com/articles/serviced-apartments-serviced-apartment-visitors-can-now-stay-with-confidence-as-hygiene-guarantee-launched-for-sector 44. https://www.cs-compliance.co.uk/Covid-19-accreditation/

77
Kim Krollman of Owl.Rentals highlights the issue
of regionality and the internationalisation of
accreditation. “Nobody gets accredited for free. Ultimately, that means factoring accreditation fees into our rates, which is a real problem when inventory fluctuates as it does in the US. So you’ve got 50 apartments one week and 40 the next and they’re all in different buildings. Should the criteria be the same when the product in Montana is so different in New York or LA? “
Steve Frey at Oasis Corporate Housing agrees that
accreditation schemes have historically not taken
regional variations into account. “The first lesson I learned when we started to expand outside the US was just because you do something one way in one part of the world, it doesn’t mean that’s the way that it operates in other parts of the world.” “If you want to be successful in doing that, you need to recognize and respect the way business is done in each different part of the world. I think the accreditation schemes have fallen behind on that concept. I would like one that is more geographically focused.”
For Julia Harnischfeger at JOYN Serviced Living,
the question is who accredits the accreditation
schemes, and how. “We have seen initiatives pop up from different networks that are part of a serviced apartments in Germany. They produce certifications, but the content of these certifications makes no sense. There are food and beverage criteria that apply in a serviced apartment with no restaurant or bar. It shows so little understanding of our industry.”
“My issue with accreditation programmes is that they are always reactive. It could be two or three years before we see standardised industry sustainability practices. Anybody that operates within this space can’t wait for it to become part of an accreditation process.” Declan Fitzhenry, CityStay
Kim Krollman of Owl.Rentals highlights the issue
of regionality and the internationalisation of
accreditation. “Nobody gets accredited for free. Ultimately, that means factoring accreditation fees into our rates, which is a real problem when inventory fluctuates as it does in the US. So you’ve got 50 apartments one week and 40 the next and they’re all in different buildings. Should the criteria be the same when the product in Montana is so different in New York or LA? “
Challenges Inertia is, according to Lee Whiteing, the biggest
challenge accreditation providers face in driving
market share. “Accreditation isn’t top of anybody’s agenda because there’s a massive lack of awareness out there, especially amongst the TMCs and some specialist serviced apartment operators too.” “The general reaction of many people to accreditation is that it is common sense, and we should just do this. The barrier is that, due to the pandemic, corporate buyers have less influence over suppliers than they did two years ago because they haven’t been giving them any business. It’s going to take us some time to get back to that position.”
Despite evidence demand for serviced apartments
is outstripping supply right now, Lee believes that
corporate travel spend will lag well behind pre-
pandemic levels for some time to come.
“Accommodation providers are fighting for a share of a much smaller budget, so they will do whatever they can do to stand out from the crowd. Success for us will come when a global client, or group of clients, mandate every accommodation supplier, including hotels, to be accredited. That will then create the consistency of approach.”
How does the serviced apartment operator know
which scheme or schemes to adopt? Deborah
Heather says operators must put their research
in. “SilverDoor spent 18 months researching what we do, don’t do and came up with standards that apply to their bookings.”
”Some countries are more complex than others and each has different models, rules, and legislation. Some accreditation companies are also thinking purely in terms of tech, instead of a mix of tech and local representation.”
“For example, Portugal is much more interested in the responsible and sustainability pieces. So the middle of Lisbon, where they’ve got all sorts of restrictions in terms of what they can do. In terms of planning, is vastly different from one part of the city. In Southern Europe they are more interested in water conservation, whereas in northern Europe, they are more interested in energy matters.”
Deborah Heather, M-Assessment

78
There’s a lot of education to be done. Corporates
may have reviewed existing accreditation
schemes from a consumer’s perspective, but
trade associations like the BTA, ITM or GBTA are
probably best placed to lead an industry-wide
appraisal. What role should the TMC community
play, for example?
“The challenge is that in the average TMC, serviced apartments are probably only 5% of their clients’ accommodation, spend and TMC systems are basically legacy systems” says GSA’s Lee Whiteing.
Deborah Heather’s biggest hope is that
accreditation becomes widely recognised and
something to which operators aspire. “It did become a tick box exercise that wasn’t really giving operators value-for-money or any real feedback.”
“The next stage is to achieve real understanding of the impact of accreditation on operators’ bottom lines. Once we can quantify the Return On Investment, they will understand the positive impacts. Then, it’s about getting accreditation recognised and consumers to value third-party guarantees.”
StayCity.com
CorporateHousingFactory.com

79
Investor outlook
By Marie Hickey, Savills
One thing is clear, every part of the hospitality
sector has felt the pain of the pandemic as the
demand tap was effectively turned off. For
extended stay, however, the depth of that pain was
perhaps less marked with its recovery looking to
be outpacing that for hotels.
So, why have serviced apartments fared better?
Well, it has a lot to do with the longer staying
guests typically found in the sector and the more
attractive environment when it comes to the need
to social distance.
When European markets initially locked down
a notable share of guests remained, supported
in part by the fact that the environment better
facilitated home working. Post lockdowns, the
business and leisure demand that did return
tended to view extended stay more favourably
due to better social distancing potential, boosting
the operational recovery.
This relative operational resilience has helped
pique investor appetite on the back of mounting
transactional activity seen prior to the pandemic.
For example, European transaction volumes
reached €496.6 million in 2021 with the UK
remaining the biggest single market. While this
was down year-on-year this was on the back
of a strong 2020 where volumes were 8.4%
above those reported in 2019, with lack of stock
rather than lack of investor interest tempering
transaction volumes.
Sector maturity reflected in institutional investor activityOne of the strongest signs of sector maturity
has been institutional investor activity, which has
continued over the last 18 months. For example,
since 2018 institutional buyers (including cross
border acquisitions) have accounted for 56% share
of European serviced apartment acquisitions,
exceeding the 51% share reported for hotels.
Notable transactions in 2021 include Abrdn
(formerly Aberdeen Standard Investment)
acquiring Room2 Southampton for £10 million
reflecting a yield of 4.98%. This was a sale-and-
leaseback with the operator signing a 30-year
index-linked lease. Similarly, German buyer, Union
Investment, completed on the new Wilde by
Staycity Aldgate site for £51 million, also with a
30-year lease in place.
This institutional appetite for extended stay
reflects a continuation of the mounting activity
seen prior to the onset of the pandemic. In 2018,
which was a peak year for volumes totalling €1.2
billion, institutional buyers spent €722 million
representing a share of 60%.The following year
institutional market share increased to 77% of
volumes equating to €614 million. In contrast the
preceding years of 2016 and 2017 institutional
buyers only accounted for an average of 33% of
volumes.
The significant increase in activity amongst
institutional investors immediately prior to the
pandemic was driven, in part, by more leased
investments coming to the market and an appetite
to diversify hospitality investments.
These types of opportunities have been relatively
limited post 2019 and is one of the reasons why
recent institutional activity has been muted,
albeit operational uncertainty generated by the
pandemic has also come into play. Yet, while
they are buying fewer extended stay assets their
continued confidence in the sector has been
reflected in the pricing these buyers are paying to
secure assets.
Yield gap narrowing between extended stay and hotelsAs highlighted by the two transactions noted
above, indicative transaction yields for leased
extended stay opportunities are largely on a par
with those for hotels. For example, the 4.98% yield
on the Room2 Southampton is in line with the
sub-5% yields regularly achieved across traditional
leased hotel assets in the UK.
While the downward pressure on yields highlights
the growing investor appetite for extended stay
over recent years, what is more telling is the
shrinking yield gap to hotels. Back in 2016 the yield

80
spread in London for leased assets was between
100-125bps (basis points), shrinking to 50bps in
2020.
Looking ahead; stock availability remains an issue The pandemic has highlighted the relative
resilience of the extended stay sector to
downturns, and in turn raised its guest appeal,
which will no doubt help to boost investor
confidence going forward.
Fig.45 European extended stay transaction volumes 2010-21
Source: Euromonitor International, Travel 2022 edition
1,400€
1,200€
1,000€
800€
600€
400€
200€
-€
Serv
iced
ap
art
men
t in
vest
men
t vo
lum
es
2010 2011 2012 2013 2014 2015 2016 2017 2018 2019 2020 2021
UK Volumes Europe volumes (excl. UK) Total Europe volumes 10yr average
In addition extended stay’s typically leaner
operational model, meaning it has been more
insulated to the staff availability pressures seen
across the wider hospitality industry, has and will
continue to garner investor interest.
Perhaps the biggest challenge to investors will
continue to be the lack of purpose-built stock,
meaning opportunities to access the sector
currently lie within platform/operator investment,
future development, and repurposing projects. It is
this that could generate the greatest headwinds to
transactional activity in 2022.
Midsummer Mews, CityStay

81
Industry perspectives
“The rise in investment in build-to-rent properties will provide opportunities for Extended Stay. Funds are seeing BTR as a worthwhile place to put their money. At the same time I don’t see investment in aparthotels slowing down. Some VC-backed brands have seen this as an opportunity to accelerate their pipeline growth.”
“The more risk-averse investment companies may continue to look at hospitality with trepidation, but those more risk-tolerant have seen the closure of hotels, the folding of smaller local Regional providers, the coming out of buildings of major corporations and conversions from commercial into residential spaces. So there are opportunities still out there.”
“Sustainability will become a big part of investment decisions too. Running properties comes with some pretty uncertain, unsustainable overheads. If you can build it in a more sustainable way, then you’re going to reduce those overheads. So it suddenly becomes a more attractive proposition to an investor.”Declan Fitzhenry, CityStay
“It’s striking to me after 40 years in the industry that you need $200m – $300m to start a furnished apartment brand. Instead of sourcing an apartment to take a rental, or find the rental to fill your apartment, some brands are leasing thousands of apartments from developers, then furnishing them.”
“Some VC-backed brands have gone after some weird buildings in neighbourhoods I would not walk around after 6:00pm. They rent them because they had a developer willing to rent them. It could take the developer years to lease them entire building so, this brand with lots of money comes along and the lease is signed without either party thinking about whether people will want to stay there.” “Many of them go after the leisure traveller because chances are he or she won’t know that the building is on the wrong side of town. A Marriott Hotel in a business district survives because it has the Marriott hotel reservation system generating thousands of bookings.They fill the hotel with leisure business at weekend and price accordingly. During the week they do the same with business customers, which they do because there’s a conference on-site, a bar and room service.”Gavan James, Nomad Temporary Housing
“Operators are adopting asset-light model, giving them the flexibility to expand quickly and to have opco and propco under the same ownership, with an aligned vision.” 45 “In January 2022, Fortress Investment Group acquired a majority stake in Dublin-based PREM Group, which owns a significant number of the 38 properties it manages. In the US, Blackstone and Starwood Capital’s $6.3 billion acquisition of Extended Stay America sent out a statement. ESA owns most of its 650-odd hotels, making it the biggest owner/operator in the world.”
“Blackstone has continued its shopping spree, acquiring the 15-strong Condor Hospitality Trust portfolio. Service Properties Trust (SVC) is a major owner of extended stay hotels and has a significant stake in hotel company Sonesta. SVC re-branded over 200 hotels previously operated under the IHG and Marriott brands, as Sonesta Suites.”
“In Europe, Brookfield and edyn are reaping the benefits of aligned ownership, with the Locke brand opening an impressive six properties in 2021 – and having an even stronger pipeline for next year. Dutch pension fund APG is also getting in on the act and is busily acquiring properties for Amsterdam-based City ID and London-based The Other House to operate.”
“I don’t expect the likes of Marriott and Hilton to suddenly go on an asset shopping spree, but over the last two years, when landlord and tenant relationships have been tested like never before, the extended stay space is leading the way when it comes to exploiting the numerous benefits of close alignment between owner and operator, a trend I expect to gain momentum in 2022.” George Sell, Serviced Apartment News
45. https://servicedapartmentnews.com/features/serviced-apartment-and-extended-stay-industry-trends-for-2022/

82
Regional reports – introduction
Fig.46 Growth of serviced apartment locations by region 2018 - 2022
Europe
The Americas
Middle East
Asia
Africa
Australasia
0 1,000 2,000 3,000 4,000 5,000 6,000 7,000 8,000 9,000
2020/212021/22 2019/20 2019/18
Fig.47 Growth of serviced apartment locations by region 2018 - 2022
Europe
The Americas
Middle East
Asia
Africa
Australasia
0 1,000 2,000 3,000 4,000 5,000 6,000 7,000 8,000 9,000
2020/212021/22 2019/20 2019/18
In the fifteen years since GSAIR first appeared,
the extended stay sector has grown from 452,051
units to 1,299,328, an increase of almost 350% in
fourteen years.
Similarly, back in 2008, serviced apartments could
be found in 6,722 locations. Today, that figure has
risen to 17,054, nearly a four-fold increase.
In terms of regionality, the U.S. has maintained its
position as the largest market in terms of supply,
with Europe in second position.
As Figs 46 and 47 show, the pandemic has not
affected regional market shares significantly,
although both the US and Australasia both report
that growth in supply has slowed since our last GSAIR.
In this year’s report, we have again invited local
serviced apartment and corporate housing
operators to provide first-hand accounts of the
pandemic’s impact on their region, how travellers’
needs have changed, and the outlook for recovery.

83
C O V I D - S A F EA C C O M M O D A T I O N
F O C U S O NS U S T A I N A B I L I T Y
—Accommodation yourbusiness can depend on■ Quality, space and comfort■ Safety and compliance■ Exceptional customer service■ Over 40 locations to choose from
www.roomspace.com/promoTelephone: +44 (0) 208 944 3662or email [email protected]
Bringing a Human Touchto the Digital World
C
M
Y
CM
MY
CY
CMY
K
2022-01 Roomspace-GSAIR-Advert-Fullpage PRINT.pdf 1 21/01/2022 17:03

84
Regional report - Africa
By Daniel Blaauw, MUi STAYS
We have been keeping a close eye on the post
Covid resurgence in business travel to the
African continent. Much of the continent relies
on tourism and this sector is starting to show
increased demand now that travel restrictions are
slowly being lifted and with more carriers seeing
justification in reopening their routes to Africa.
In 2019, the hospitality sector accounted for
approximately 7% of Africa’s overall GDP and
contributed $169bn to its economy – about the
size of Ethiopia’s and Ghana’s GDP combined.46
International tourism inbound receipts in Africa
amounted to a total of $24.7bn in 2019 and the
average visitor spent $660.70. Western and
southern Africa accounted for 35% each of the
sub-Saharan region’s total travel and tourism
GDP while eastern Africa made up the remaining
30%. Southern Africa accounted for 49% of
international travel arrivals while eastern Africa
made up 28% and western Africa 23%.
Fig.48 Inbound air travel to Africa
40,000 110,000,000
Passenger carried by air transport, 2015-19
Pandemic impactThe Covid pandemic decimated businesses across
Africa’s hospitality supply chain. In July 2020,
the African Union estimated that the region lost
almost $55bn in travel and tourism revenues and
about two million jobs in the first three months of
the pandemic.
The International Monetary Fund estimated that
the real GDP among African countries dependent
on tourism shrank by 12% in 2020. African airlines
lost an estimated $10.21bn in passenger revenue
last year and are expected to lose $8.35bn this
year, according to the African Airlines Association.47
46. International Finance Corporation (IFC), part of the World Bank

85
“Africa has so much potential, it can just be difficult to fulfil it. in terms of international visitor numbers, South Africa, Egypt, Morocco, Kenya, Tanzania, Ethiopia, and Nigeria are the most significant markets in the region. Most visitors to East Africa are coming for leisure purposes. In West Africa – including Nigeria – it is mainly for business.” Trevor Ward, owner of Lagos-based W Hospitality Group
RecoveryDespite some westerners being put off by Africa’s
low vaccination rate - as of February 2022, just
11% of the African population had been vaccinated48
- military coups in Sudan, Mali, Guinea and Chad,
conflict in northern Ethiopia, plus escalating
violence in South Africa (where the murder rate
is higher than Mexico’s), hotel operators are
reporting that occupancy has started to pick up.
Made up of 55 countries and geographically huge,
many parts of Africa are safe. Africa is about to
see a wave of new airports constructed. Ethiopian
Airlines will build a new $5bn mega-airport in
Addis Ababa, located 39km south-east of the
city. With four runways, it would be bigger than
London Heathrow and serve as many as 120
million passengers a year.
Other countries are also planning major new
airports. In November 2021 there were 37 new
airport projects under construction or planned in
Africa, with an estimated value of $16.6bn.49
The $400m Kigali Bugesera International Airport
in Rwanda should be completed by the end of
2022, including a 30,000m2 passenger terminal
with capacity for 1.7 million passengers a year.
Qatar Airways has a 60% stake in the project.
There are also plans for a new $250m airport
at Ouagadougou, capital of Burkina Faso, co-
financed by Marseille Provence Airport.
By investing in infrastructure, the region’s lodging
sector should also benefit. African governments
are major consumers of transient accommodation
and conference space, but local coffers are
empty and with business travel volumes yet to
recover, the lodging sector’s recovery is likely to
be driven by executive relocation and temporary
accommodation demand going forward.
PwC predicts hotel room revenue for the five
markets will increase 7.4 % to R50.5 billion in 2022
from R35.2 billion in 2017.50
South African hotel room revenue is expected
to grow 5.6% in 2022. An additional 2,900
guestrooms will be added to the market’s
inventory over the next five years. Occupancy
rates will continue to grow over the next five
years, reaching 62.5% in 2022.
PwC expects Nigeria will be the fastest-growing
market over the next five years. Several new
hotels are scheduled to open during this period.
Kenya, Tanzania, and Mauritius are forecast to be
the next fastest growing markets with increases of
9.6%, 9.1% and 7.2%, respectively. However, South
Africa is projected to be the slowest growing
market with a 5.6% increase in rooms revenue.
“Along with the anticipation of an impending travel boom, the well-regarded EHL School of Hospitality has stated that Africa holds a “unique joker up its sleeve” because of its younger generations, which have been described as learning through innovation and pragmatism as opposed to simply receiving investments.”51 Forbes Magazine
Partnerships and investmentsIncreased interest in Africa is centred on the usual
locations such as Nigeria, Kenya, and South Africa
but coming into play are also those countries
aligned to Rand Merchant Banks’ report on where
to invest in Africa.
RMB’s report highlighted Egypt and Morocco
as #1 and #2 emerging destinations for foreign
investment in Africa. Ghana is also a location that
47. https://www.investmentmonitor.ai/sectors/tourism-business-activities/western-tourists-africa-business-travellers-Covid 48. https://news.un.org/en/story/2022/02/1111202 49. CAPA Airport Construction Database 50. https://www.hotelmanagement.net/reve-nue-management/africa-s-hotels-set-for-continued-growth-by-2022#:~:text=PwC%20predicts%20hotel%20room%20revenue,droughts%20and%20other%20regulatory%20changes. 51. https://www.borgenmagazine.com/africas-hotel-industry/
A legacy of the pandemic is a demand for greater
work flexibility and towards remote working. We
are seeing clients wanting residential options
which include amenities such as additional
rooms for working remotely, access to green
space, access to good healthcare and reliable,
high-speed digital connectivity topping their
considerations.

86
has received increased interest in 2021 sitting at
#6. Other locations to watch are Mauritius #7 and
Rwanda #4 according to Rand Merchant Banks
attractiveness rating report.
The COP26 summit in Scotland highlighted
the need for the ‘developed nations’ to provide
financial and technical assistance to the
developing world to assist with the global initiative
to reduce carbon emissions.
The African Green Economy is a large driver
of foreign investment across Africa. There is
an abundance of opportunities for the green
economy to grow particularly in the form of
sustainable energy creation.
We are noticing commitments to funding of
projects that are particularly focussed on the
utilization of solar, wind and hydroelectric
opportunities on the continent already.
There are many examples including…
• Angola is working with Sun Africa and the
US company Africa Global Shaffer and will
create what is set to be Africa’s largest
mini-grid energy project.52
• London-based Chariot is working with
the Mauritania Ministry of Petroleum,
Mines and Energy to development a green
hydrogen with the goal of producing the
cheapest green hydrogen in Africa.53
• The South African coal industry provides
work to more than 120,000 people and
has been relied upon for the country’s
electricity supply for decades. At 2021’s
COP26 Climate summit South
Africa announced that it has received
$8.5 billion in financing over the next
five years to support the transition
to green energy and away from coal.54
Part of this investment includes funding
provided by Amazon’s Jeff Bezos (see below).
Tech companies and Telecoms are also going to
be drivers of travel to the African continent.There
has been much media debate about the Ethiopian
cellular market, the bids invited for a stake in the
local operator Ethio Telecom and the awarding
of a license to the Vodafone and Safaricom
consortium.
With a population of over 110 million the Ethiopian
market is an exciting one for the tech companies
supplying cellular network infrastructure and the
devices that sit on cellular networks. The cellular
technology demand is continent wide, and we
expect to see a post Covid resurgence of travel
from the international suppliers to this industry.
In the broader tech space we are excited about
the commitment of the biggest players in the
industry to a presence in Africa.
• Google has committed to investing $1
billion in Africa over the next five years
including $50 million in Africa Based
start-ups.55
• Facebook (or Meta) has invested in Africa
submarine cable system as part of its
drive to add a billion new users to the
internet. They are also suggesting that
they will deploy their Bombyx, aerial fibre
deployment robot as part of their Africa
fibre rollout plan.56
• Amazon is committed to creating a
presence in Africa and Cape Town is
already seeing the new Amazon office
coming out of the ground. In addition
to their office and the economic benefit
that ought to bring Amazon is building
a 0-Megawatt solar project in the
Northern Cape province in South Africa.57
• At COP26, Jeff Bezos pledged 2 billion
dollars to land and forest restoration in Africa.58
Despite the pandemic, Africa has seen continued
demand from its more traditional sectors. The
mining and minerals sector has always been
a strong demand driving sector in Africa, the
bountiful mining opportunities keep foreign
mining companies coming back and while this
has slowed somewhat under the pandemic it is
still a major factor in the demand for temporary
accommodation.
Another more traditional sector which continues
to demand space is that of infrastructure
development. Growing economies across the
continent require infrastructure development and
use external assistance to satisfy that.
New supplyAfrican hotels will have more capacity than
they did pre-Covid. Close to 70% of the 219
hotel projects in the sub-Saharan region are on
schedule for completion, with only 18% held back
temporarily. Additionally, as of July 2020, there
were 21 new projects for nearly 3,000 new hotel
rooms in 15 African countries.59
In terms of temporary housing supply we
have noticed several adaptations following
the pandemic. The tourism sector was heavily
affected in Africa as with most countries, suppliers
involved in those sectors have had to look to new
or emerging markets to support them during
this time.
52. www.esi-africa.com 53. https://energycapitalpower.com/chariot-signs-mou-with-mauritanian-government-to-produce-and-export-green-hy-drogen/ 54. https://www.nytimes.com/2021/11/03/world/africa/south-africa-coal-renewables.html 55. https://www.reuters.com/technology/google-invest-1-billion-africa-over-five-years-2021-10-06/ 56. https://techcentral.co.za/facebook-eyes-next-billion-with-2africa-cable-fibre-ro-bots/203233/ 57. https://businesstech.co.za/news/energy/534702/amazon-has-built-a-new-solar-plant-in-south-africa/ 58. https://www.stand-ard.co.uk/news/uk/jeff-bezos-africa-boris-johnson-amazon-earth-b963876.html 59. https://www.borgenmagazine.com/africas-hotel-industry/

87
We have seen an increase in international hotel
groups offering self-catering and aparthotel
rooms. Business travellers are looking for longer
stays but still want the services of the hotel
and hotel chains are looking to supply suitable
accommodation.
During the pandemic, travel bans were announced
at short notice, with Covid forcing some guests
into extending or abandoning their stays. This
forced suppliers to be more understanding in
terms of cancellation policies.
Individual owners who rely on these stays for
their livelihood have been driven away from the
temporary accommodation sector. We are seeing
a rising trend in professional operator groups
who pool privately owned apartments and offer
a service of managing the property and securing
clients.
Extended stayAfrica has the smallest serviced apartment
inventory. At the end of 2021 there were 21,038
apartment units in 367 locations, an increase of
11.1% and 11.5% respectively. However, that growth
rate is exceeded only by Asia.60
There are several significant new extended stay
openings in Africa. The 62 room Hyatt House
Johannesburg Sandton is the brand’s long-
awaited debut in Africa. The Ascott Limited has
beefed up its presence in Africa after signing
two properties in Morocco. Citadines Racine
Casablanca and Citadines Connect Belvedere
Casablanca will add 183 rooms to Ascott’s existing
Middle East, Africa, and Turkey (MEAT) portfolio.61
Radisson Hotel Group has announced the signing
of Earl Heights Suites Hotel in Accra, Ghana,
the first Radisson Individuals property in Africa.
Located five kilometres from Kotoka International
Airport (KIA), the 58-key property will comprise
studios, one- and two-bedroom suites, and
will offer a restaurant, bar, spa, gym, pool,
convenience store and business centre.
Erwan Garnier is the senior director, Development
Africa for Radisson Hotel Group. “Our target in Africa is to have 150 hotels by 2025 and today we have 100 hotels open and under development. Additionally, we created new growth opportunities with serviced apartments, which was a booming business during Covid, and we can see the traction right now.”
“20% of the projects I am working on are either serviced apartments or hotels for long stay corporate guests. By providing security, hygiene, and hotel services, we can combine the best of
serviced apartments and hotels. We can provide the best of both worlds and we are seeing a lot of interest in this across Africa.”
Positive signsIn conclusion, while these trying times may have
caused hardship to the global serviced apartment
economy, it has forced the emergence of new
markets and perhaps reassessment of how the
sector could be improved.
Serviced apartment operators in Africa have
struggled with the implications of the pandemic,
on top of the extra costs incurred to ensure
guests’ health and safety. Demand is constantly
fluctuating based on the ongoing global situation
but there are still some positive trends.
The African property market is developing
at a fast pace with more properties aiming to
meet the needs of the international temporary
accommodation traveller but finding vetted
properties on the internet is not easy.
MyResidence.Africa gives our clients the comfort
of knowing that we have independently vetted
every property we offer and that compliance with
our standards is a considered business practise.
60. GSAIR Survey 202261. https://www.hospitality-interiors.net/news/articles/2021/09/1724338167-ascott-bolsters-african-footprint-two-citadines-signings62. https://businessday.ng/arts-and-life/article/beyond-being-the-fastest-growing-hotel-brand-in-africa-we-aim-to-be-the-global-market-leader/
MyResidence.Africa
MyResidence.Africa

88 Fig
.49
R
ate
s co
mp
ari
son
– A
fric
a 2
019
/20
vs.
20
21/
22
RA
TE
S I
N K
EY
CIT
IES
Th
ese
rat
es
are
ave
rag
e r
ates
an
d
may
vary
per
loca
tio
n, t
ime o
f ye
ar,
reg
ion
al p
rom
oti
on
s an
d s
peci
fic
len
gth
s o
f st
ay. R
ates
qu
ote
d a
re
base
d o
n a
n a
vera
ge 4
sta
r ex
ten
ded
st
ay p
rop
ert
y a
nd
exc
lud
e t
axe
s.
Exc
han
ge r
ates
use
d M
arc
h 2
022.
ST
UD
IOO
NE
BE
DR
OO
MT
WO
BE
DR
OO
M
20
19/2
0
rate
20
21/
22
rate
Yo
Y
vari
an
ce
20
19/2
0
rate
20
21/
22
rate
Yo
Y
vari
an
ce
20
19/2
0
rate
20
21/
22
rate
Yo
Y
vari
an
ce
Lo
cal
cu
rre
ncy
Lo
cal
cu
rre
ncy
US
$E
uro
%L
ocal
cu
rre
ncy
Lo
cal
cu
rre
ncy
US
$E
uro
%L
ocal
cu
rre
ncy
Lo
cal
cu
rre
ncy
US
$E
uro
%
AF
RIC
A
Cap
e T
ow
n (
ZA
R)
1-6
nig
hts
(n
igh
tly r
ate
)Z
AR
1,0
45
ZA
R 1
,16
5U
SD
76
EU
R 6
811
%Z
AR
1,125
ZA
R 1
,24
5U
SD
81
EU
R 7
211
%Z
AR
1,6
80
ZA
R 1
,70
0U
SD
111
EU
R 9
91%
7 n
igh
ts +
(w
ee
kly
rate
)Z
AR
6,5
00
ZA
R 6
,90
0U
SD
45
2E
UR
40
26
%Z
AR
6,7
00
ZA
R 7
,20
0U
SD
47
1E
UR
419
7%
ZA
R 1
0,10
0Z
AR
10
,30
0U
SD
674
EU
R 6
00
2%
On
e m
on
th +
(m
on
thly
rate
)Z
AR
13
,60
0Z
AR
14
,00
0U
SD
916
EU
R 8
153
%Z
AR
14
,00
0Z
AR
14
,30
0U
SD
93
6E
UR
83
32%
ZA
R 1
8,2
00
ZA
R 1
8,5
00
US
D 1
,210
EU
R 1
,077
2%
3 m
on
th +
(m
on
thly
rate
)Z
AR
12,6
00
ZA
R 1
3,10
0U
SD
857
EU
R 7
63
4%
ZA
R 1
3,6
00
ZA
R 1
3,8
00
US
D 9
03
EU
R 8
04
1%Z
AR
16
,80
0Z
AR
17,
00
0U
SD
1,112
EU
R 9
90
1%
Nair
ob
i (K
ES
)
1-6
nig
hts
(n
igh
tly r
ate
)K
ES
6,6
00
KE
S 5
,60
0U
SD
49
EU
R 4
3-1
5%
KE
S 9
,75
0K
ES
9,5
00
US
D 8
4E
UR
74
-3%
KE
S 1
1,6
00
KE
S 1
1,0
00
US
D 9
7E
UR
85
-5%
7 n
igh
ts +
(w
ee
kly
rate
)K
ES
3
3,8
00
KE
S
34
,00
0U
SD
29
9E
UR
26
41%
KE
S 6
1,0
00
KE
S
60
,00
0U
SD
528
EU
R 4
65
-2%
KE
S
65
,00
0K
ES
6
4,2
00
US
D 5
65
EU
R 4
98
-1%
On
e m
on
th +
(m
on
thly
rate
)K
ES
12
0,5
00
KE
S
123
,00
0U
SD
1,0
82
EU
R 9
54
2%
KE
S
181,0
00
KE
S
179
,00
0U
SD
1,5
75
EU
R 1
,38
9-1
%K
ES
20
9,0
00
KE
S
20
8,0
00
US
D 1
,83
0E
UR
1,6
140
%
3 m
on
th +
(m
on
thly
rate
)K
ES
11
6,0
00
KE
S
117,
00
0U
SD
1,0
29
EU
R 9
08
1%K
ES
17
0,0
00
KE
S
168
,50
0U
SD
1,4
83
EU
R 1
,30
7-1
%K
ES
19
8,5
00
KE
S
197,
90
0U
SD
1,7
41
EU
R 1
,53
50
%

89Eloise Hyland [email protected] +27 72 077 5979
www.LegacyHotels.com
Experience the most sought-after, inner city living Johannesburg has to
offer. Inspired and re-imagined, our residences evoke a rich feeling of
home, lifestyle and location. Ranging from fully-furnished luxury one, two,
and three bedroom apartments, our suites include all the amenities you
would need: fully-equipped kitchens, spacious living spaces, concierge
services, WiFi and priceless views across the golden Sandton skyline. A
stone’s throw to the city’s business hub and Nelson Mandela Square, our
residences are within close proximity to various transportation options and
can be easily reached via the Gautrain. Come and stay in the heart of
Sandton, in one of our sought-after Lifestyle mixed use developments.
LUXURY CITY LIVINGIN SANDTON
DAVINCIHOTEL & SUITES
MICHELANGELOTOWERS
RAPHAELPENTHOUSE SUITES
THELEONARDO
C
M
Y
CM
MY
CY
CMY
K
ai164568607413_Global Serviced Apartment_Advert_print Ready_2402022.pdf 1 2022/02/24 09:01
Fig
.49
R
ate
s co
mp
ari
son
– A
fric
a 2
019
/20
vs.
20
21/
22
RA
TE
S I
N K
EY
CIT
IES
Th
ese
rat
es
are
ave
rag
e r
ates
an
d
may
vary
per
loca
tio
n, t
ime o
f ye
ar,
reg
ion
al p
rom
oti
on
s an
d s
peci
fic
len
gth
s o
f st
ay. R
ates
qu
ote
d a
re
base
d o
n a
n a
vera
ge 4
sta
r ex
ten
ded
st
ay p
rop
ert
y a
nd
exc
lud
e t
axe
s.
Exc
han
ge r
ates
use
d M
arc
h 2
022.
ST
UD
IOO
NE
BE
DR
OO
MT
WO
BE
DR
OO
M
20
19/2
0
rate
20
21/
22
rate
Yo
Y
vari
an
ce
20
19/2
0
rate
20
21/
22
rate
Yo
Y
vari
an
ce
20
19/2
0
rate
20
21/
22
rate
Yo
Y
vari
an
ce
Lo
cal
cu
rre
ncy
Lo
cal
cu
rre
ncy
US
$E
uro
%L
ocal
cu
rre
ncy
Lo
cal
cu
rre
ncy
US
$E
uro
%L
ocal
cu
rre
ncy
Lo
cal
cu
rre
ncy
US
$E
uro
%
AF
RIC
A
Cap
e T
ow
n (
ZA
R)
1-6
nig
hts
(n
igh
tly r
ate
)Z
AR
1,0
45
ZA
R 1
,16
5U
SD
76
EU
R 6
811
%Z
AR
1,125
ZA
R 1
,24
5U
SD
81
EU
R 7
211
%Z
AR
1,6
80
ZA
R 1
,70
0U
SD
111
EU
R 9
91%
7 n
igh
ts +
(w
ee
kly
rate
)Z
AR
6,5
00
ZA
R 6
,90
0U
SD
45
2E
UR
40
26
%Z
AR
6,7
00
ZA
R 7
,20
0U
SD
47
1E
UR
419
7%
ZA
R 1
0,10
0Z
AR
10
,30
0U
SD
674
EU
R 6
00
2%
On
e m
on
th +
(m
on
thly
rate
)Z
AR
13
,60
0Z
AR
14
,00
0U
SD
916
EU
R 8
153
%Z
AR
14
,00
0Z
AR
14
,30
0U
SD
93
6E
UR
83
32%
ZA
R 1
8,2
00
ZA
R 1
8,5
00
US
D 1
,210
EU
R 1
,077
2%
3 m
on
th +
(m
on
thly
rate
)Z
AR
12,6
00
ZA
R 1
3,10
0U
SD
857
EU
R 7
63
4%
ZA
R 1
3,6
00
ZA
R 1
3,8
00
US
D 9
03
EU
R 8
04
1%Z
AR
16
,80
0Z
AR
17,
00
0U
SD
1,112
EU
R 9
90
1%
Nair
ob
i (K
ES
)
1-6
nig
hts
(n
igh
tly r
ate
)K
ES
6,6
00
KE
S 5
,60
0U
SD
49
EU
R 4
3-1
5%
KE
S 9
,75
0K
ES
9,5
00
US
D 8
4E
UR
74
-3%
KE
S 1
1,6
00
KE
S 1
1,0
00
US
D 9
7E
UR
85
-5%
7 n
igh
ts +
(w
ee
kly
rate
)K
ES
3
3,8
00
KE
S
34
,00
0U
SD
29
9E
UR
26
41%
KE
S 6
1,0
00
KE
S
60
,00
0U
SD
528
EU
R 4
65
-2%
KE
S
65
,00
0K
ES
6
4,2
00
US
D 5
65
EU
R 4
98
-1%
On
e m
on
th +
(m
on
thly
rate
)K
ES
12
0,5
00
KE
S
123
,00
0U
SD
1,0
82
EU
R 9
54
2%
KE
S
181,0
00
KE
S
179
,00
0U
SD
1,5
75
EU
R 1
,38
9-1
%K
ES
20
9,0
00
KE
S
20
8,0
00
US
D 1
,83
0E
UR
1,6
140
%
3 m
on
th +
(m
on
thly
rate
)K
ES
11
6,0
00
KE
S
117,
00
0U
SD
1,0
29
EU
R 9
08
1%K
ES
17
0,0
00
KE
S
168
,50
0U
SD
1,4
83
EU
R 1
,30
7-1
%K
ES
19
8,5
00
KE
S
197,
90
0U
SD
1,7
41
EU
R 1
,53
50
%

90
Regional report - AsiaBy Mark Harris
63. https://www.mckinsey.com/featured-insights/asia-pacific/five-windows-of-opportunity-for-postpandemic-asia 64. https://www.adb.org/news/videos/developing-asia-s-economic-outlook-asian-development-outlook-ado-2022 65. https://servicedapartmentnews.com/news/industry-news/hong-kong-serviced-apartment-sector-sees-rates-plummet/ 66. https://www.scmp.com/business/article/3159705/hong-kong-property-investment-grow-20-cent-next-year-led-hotels-serviced
Asia showed resilience in the face of Covid,
with GDP growth remaining stable through the
pandemic. Whilst the world economy shrank
by 3.2%, the International Monetary Fund (IMF)
forecast that Asia would grow by 7.5% in 2021 and
6.4% in 2022, compared with 6.0% and 4.9% for
the rest of the world.63
As of April 2022, developing Asia’s economies
were forecast to grow 5.2% in 2022 and 5.3% in
2023, thanks to a robust recovery in domestic
demand and continued expansion in exports.
However, uncertainties stemming from the
Russian invasion of Ukraine, the pandemic and
tightening by the United States Federal Reserve,
so this positive outlook could be at risk.64
Hong KongCovid hit Hong Kong hard. Serviced apartment
operators had to cut rates and offer incentives
to boost occupancy. Serviced apartment rents
in Hong Kong fell for seven straight quarters, for
a total of 14.5% up to the end of 2020. Average
rates fell 12.5% in 2020 alone.65
Pilar Morais is CEO of CHI Residences says that
the impact of the pandemic on the extended
stay sector in Hong Kong was “Devastating. Most operators didn’t want to take quarantine stays because they didn’t know how it affected their properties. After all, SARS had started in a hotel.”
“We created our own protocols so we were able to accommodate quarantine stays until the government decided that quarantined people could only stay in hotels. Still it wasn’t clear, so we had guests asking if they could stay with us? So we would call every governing body for three days non-stop. None could tell us if we could take these guests.”
“Eventually government decided that serviced apartments couldn’t take quarantine stays anymore, which killed all our business. Up to that point, we were still at 70% occupancy, compared to 85 - 90% pre-pandemic. After the rules were changed, occupancy fell to 30%. We still don’t know why the government discriminated against serviced apartments in this way.”
“Despite putting the case to government that serviced apartments make more sense because it’s much closer to being at home, most of it was ignored. Of course, it’s pure speculation that the Hong Kong hotels association is bigger and more influential than our non-existent serviced apartment association.”
“In Hong Kong, hotels pay more tax on a stay than serviced apartment operators, and even though a lot of hotels had to be coerced to be registered as a quarantine hotel, they did so because there were sweeteners from the government to support the scheme. As an SME we did not qualify for any of the stimulus packages available to corporations, so we had to be creative.”
“For me, the most difficult part was keeping our staff members happy. Everyone had to realise that the business had to survive if they wanted to keep their jobs. We didn’t do furloughs like a lot of industry colleagues around the world, but we staggered them. We made them finish outstanding leave that they had. Some were happy to because they felt safer being at home and not having to be on the frontline.”
“Our target market is different. We see a lot of expats, pilots, and westerners who are leaving Hong Kong. They end up trying to finish their leases and then stay in a serviced apartment until they leave. We’ve captured a lot of that. There’s also been a big focus on people renovating their homes.”
The prognosis for post-pandemic recovery is
good. Hong Kong will see property investment
grow by a fifth in 2022, with hotels and serviced
apartments set to become investors’ main
acquisition target. There will be 200 major
transactions in 2022, valued at around HK$100
billion (US$12.81 billion), the highest since 2018.66
Although she agrees the HK property market is
booming, Pilar doesn’t believe that Hong Kong
and China will fully re-open until October 2022 at

91
the earliest, when the presidential election takes
place. “Hopefully, things will then return to normal and corporate business, which normally equates to 60% of our business, will come back.”
There have been other, non-Covid related changes
to CHI’s customer demographics. “In the current political situation we are seeing some corporations moving part of their operations to Singapore. They won’t leave Hong Kong entirely because it’s their entry point into China.
Morais says the extended stay sector in the region
has lessons to learn from the pandemic. “As an industry, we became complacent. Our occupancy rates were the highest in the world. I budgeted my occupancy at 85 to 90% for ten years. The lesson is we must keep our fingers on the pulse of what is happening.”
“Despite the restrictions we are seeing a lot of investor interest. The focus is still on Singapore, whereas in Hong Kong, you’re getting more independent investors or older families investing in extended stay. Larger and international funds that previously didn’t invest in residential real estate are now interested in extended stay because it offers more stable returns.”
ChinaChina’s travel and tourism sector is predicted to
contribute CNY 11 trillion to China’s GDP in 2022,
just 5.2% below pre-pandemic levels, when travel
and tourism accounted for 11.6% of the country’s
economy. This is even more remarkable given that,
in 2020 the Chinese economy shrank by 59.9%.67
More than 87% of China has been fully vaccinated
by February 2022, with 14 million of the 16 million
hospitality jobs lost during the pandemic already
filled, although global stocks fell in April 2022
amid fears of new Covid lockdowns in China.68
During the pandemic, hotel performance ran
40 - 50% below pre-pandemic levels, but by
February 2022 STR was reporting that mainland
China’s hotel industry had surpassed its 2019
comparable in Lunar New Year average daily rate
despite substantially lower occupancy.
The country’s ADR reached CNY766.95 during
the 2022 new year holiday69, which was 9.6%
higher than the same festival period in 2019
(CNY699.47).70
A sense of optimism in the country’s hotel sector is
evidenced by Marriott’s plans, announced in March
2022, to open 50 new hotels in over 30 destinations
across China in 2022. China’s hotel construction
pipeline totals over 700,000 rooms across 3,693
properties. By comparison, the U.S. was at nearly
582,000 rooms across 4,814 projects.71
Property investment rose 3.7% year-on-year in the
first two months of 2022, reversing a 13.9% slump
in December72 but many believe less than 5% in
property investment signals waning willingness in
development and investment.73
Although detailed information about the extended
stay sector across China is sparse, Shanghai’s
serviced apartment market faces challenges.
“As borders reopened, the city experienced a notable decrease in vacancy rate as tenants stranded overseas returned to their leases or signed new contracts,” explains Chester Zhang,
director of Savills China research. “This didn’t last, however, as border controls tightened significantly in mid-November.” 74
JapanDuring the pandemic, the Japanese government
strictly controlled foreign admissions, so the
number of foreign arrivals fell from 33 million in
2019 to 4.5 million in 2020 to 3 million in 2021.
“The serviced apartment market in Japan, which relies mainly on those coming for business and long-term residents from overseas, was heavily impacted by the immigration restrictions,” says
Scott Sullivan of Enplus Inc Global Relocation
Services.
“Serviced apartment providers had no choice but to offer large discounts and launch promotions to stimulate domestic demand, Tokyo, with an estimated 4,500 apartments (the largest supply in Japan), was under a state of emergency for most of 2021.”
“To reduce the number of commuters using public transportation, the central and local governments encouraged home working, aiming for a 70% reduction of employees at the office. Non-essential and non-urgent inter-prefectural travel were also discouraged, resulting in significantly low occupancy rates for both hotels and serviced apartments throughout Japan. This has led some owners and/or developers to withdraw from their respective markets.” “With over 31 million visitors coming to Japan in 2019 and nearly zero in 2020/21, the tourism industry was one of those hit the hardest. The government’s Go To Travel initiative encouraged domestic travel in 2020 but was not enough to increase the occupancy of hotels reliant on foreign travellers.”
“Prestigious hotels, such as the Imperial Hotel, created a buzz when announcing a new monthly rate, starting a new trend for luxury and business hotels seeking to stabilise their revenue base by offering monthly hotels.”
67. World Travel & Tourism Council (WTTC) 68. https://www.theguardian.com/business/2022/apr/25/global-stocks-fall-amid-fears-of-new-Covid-lockdowns-in-china 69. 31st January – 6th February 70. https://www.hotel-online.com/press_releases/release/str-china-hotel-rates-higher-than-2019-level-during-lunar-new-year/ 71. https://skift.com/2022/02/14/u-s-and-china-developments-will-dominate-hotel-earnings-season/ 72. China National Bureau of Statistics (NBS) 73.https://www.globaltimes.cn/page/202203/1254951.shtml 74. Ibid

92
“Due to the Hotel Business Act, serviced apartments are seen as housing, restricting contracts to be over one month, preventing those without hotel licenses to provide solutions for 14-day quarantines. Currently, the Japan Tourism Agency is promoting “workcation,” but it has yet to improve the domestic accommodation environment.” “The serviced apartment industry in Tokyo was helped by the Tokyo 2020 Summer Olympic & Paralympic Games, held from July to September 2021. Although the Summer Games were held mostly without spectators, serviced apartments and hotels’ occupancy in the city centre increased due to event organisers, media, and sponsors coming to Japan. However, the government’s border security measures before and after the Olympics remained strict.”
CambodiaAs Cambodia recovers from the pandemic,
international businesses’ interest in growing their
presence in the capital has been reignited. An
estimated 60% of international travellers visited
Phnom Penh for business in 2019, with demand
for long-stays driven by single expatriates and
families.
The country’s Finance Ministry projected in
January 2022 that the Cambodian economy
would grow by about 5.6% because of new trade
deals, increased public spending, and a gradual
recovery in investor confidence.75 Meanwhile, the
2022 Management Report of the Law on Finance
in Cambodia highlighted a 4.1% continued growth
in the services industry as the hotel, restaurant
and tourism sectors push on with recovery plans.
Cambodia is an attractive location, having one of
the highest vaccination and booster rates globally
and few border restrictions. A new airport,
currently under construction in Phnom Penh, will
open in 2025 to support visitor arrivals.
The new airport will be capable of handling
13 million passengers a year in the first phase,
30 million passengers in the second phase that
is to be ready by 2030, and up to 50 million
passengers by 2050.
New supplyAs major brands dominate the hotel pipeline, it is
the international players who lead expansion of
the region’s serviced apartment portfolio which
stood at 189,160 units in 1,360 locations at the
end of 2021. This shows increases of 1.6% and 11.1%
respectively over 2020.76
In China, Oakwood has signed a strategic
partnership agreement with China Green
75. Focus Economics 76. GSAIR Survey 2022 77. https://www.travelweekly-asia.com/Travel-News/Serviced-Apartments/Ascott-hands-in-stel-lar-long-stay-lodging-figures-for-2021 78. https://www.businesstraveller.com/business-travel/2021/12/18/hilton-debuts-home-2-suites-brand-in-china/ 79. https://www.hospitalitynet.org/news/4108566.html 80. https://www.travelweekly-asia.com/Travel-News/Serviced-Apartments/Accor-signs-first-serviced-apartment-property-in-Singapore
Development Group, one of China’s biggest
state-owned enterprises for the management
of projects in China. The aim is to open 100
Oakwood Beluxs properties in China by 2030,
beginning with Dalian, Yantai, and Qingdao.
The Ascott added to its inventory in China,
Indonesia, Australia, Vietnam, and Thailand during
2021, with serviced apartments accounting for
more than 60% of new Ascott supply. These
include Ascott’s first Adoor-branded rental
housing property, Adoor Apartment Heda
Hangzhou (Xiasha) and its first lyf coliving
property in China, lyf Mid-Town Hangzhou.77
Hilton has debuted its extended-stay Home 2
Suites brand, with a property in the Chinese city
of Shenzhen. Home 2 Suites by Hilton Shenzhen
Bao’an is close to major transport hubs.
Hilton has partnered with Funyard, a subsidiary of
Country Garden, to develop over 1,000 properties
in China over the next 30 years, which includes
a pipeline of over 60 Home 2 Suites properties
in major business districts and transport hubs
of China’s first tier cities, provincial capitals, and
emerging markets.78
Oakwood has been highly active in the region,
Oakwood Apartments Azabu Tokyo was the first
of 20 new openings scheduled for 2022, along
with strategic partnerships to advance the fast-
growing brand’s frontiers into China’s tropical
southern resort island of Hainan as well as Dhaka,
Bangladesh. The property’s opening follows the
opening of Oakwood Hotel Oike Kyoto in
October 2021.79
Vietnam in particular saw a record signing
of some 3,000 units, including a partnership
with Sun Group for Ascott to manage the
country’s largest serviced residence integrated
development within the Tay Ho View Complex in
Hanoi. It is expected to offer 1,905 units across
three brands.
In 2022, Frasers Hospitality will open its first
property in the heart of Phnom Penh. By 2026,
Frasers Hospitality will have three properties in
key commercial districts. The 88-room Capri by
Fraser, Phnom Penh, Cambodia opens late 2022;
the 78-room Capri by Fraser, City Centre Phnom
Penh will follow two years later and the 200-room
Fraser Residence Sen Sok, Phnom Penh will be
completed in 2026.
Accor has signed a management agreement for
8 on Claymore Serviced Residences in Singapore.
The property will undergo a refurbishment of all
rooms and public areas by mid-2022 and joins
Accor’s network of 28 properties in Singapore
including the Raffles, Fairmont, Sofitel, Swissôtel,
Novotel, Mercure and ibis brands.80

93
Fig
.50
R
ate
s co
mp
ari
son
– A
sia 2
019
/20
vs.
20
21/
22
RA
TE
S I
N K
EY
CIT
IES
Th
ese
rat
es
are
ave
rag
e r
ates
an
d
may
vary
per
loca
tio
n, t
ime o
f ye
ar,
reg
ion
al p
rom
oti
on
s an
d s
peci
fic
len
gth
s o
f st
ay. R
ates
qu
ote
d a
re
base
d o
n a
n a
vera
ge 4
sta
r ex
ten
ded
st
ay p
rop
ert
y a
nd
exc
lud
e t
axe
s.
Exc
han
ge r
ates
use
d M
arc
h 2
022.
ST
UD
IOO
NE
BE
DR
OO
MT
WO
BE
DR
OO
M
20
19/2
0
rate
20
21/
22
rate
Yo
Y
vari
an
ce
20
19/2
0
rate
20
21/
22
rate
Yo
Y
vari
an
ce
20
19/2
0
rate
20
21/
22
rate
Yo
Y
vari
an
ce
Lo
cal
cu
rre
ncy
Lo
cal
cu
rre
ncy
US
$E
uro
Lo
cal
cu
rre
ncy
Lo
cal
cu
rre
ncy
US
$E
uro
Lo
cal
cu
rre
ncy
Lo
cal
cu
rre
ncy
US
$E
uro
%
AS
IA
Ban
galo
re (
INR
)
1-6
nig
hts
(n
igh
tly r
ate
)IN
R 3
,80
0IN
R 4
,60
0U
SD
66
EU
R 5
821%
INR
4,5
00
INR
5,0
00
US
D 6
6E
UR
58
11%
INR
6,4
00
INR
7,0
00
US
D 9
3E
UR
82
9%
7 n
igh
ts +
(w
ee
kly
rate
)IN
R 2
3,5
00
INR
24
,50
0U
SD
325
EU
R 2
87
4%
INR
24
,00
0IN
R 2
4,7
00
US
D 3
28
EU
R 2
89
3%
INR
39
,00
0IN
R 3
9,5
00
US
D 5
24
EU
R 4
62
1%
On
e m
on
th +
(m
on
thly
rate
)IN
R 6
0,0
00
INR
62,0
00
US
D 8
23
EU
R 7
25
3%
INR
75
,00
0IN
R 7
6,2
00
US
D 1
,012
EU
R 8
91
2%
INR
86
,90
0IN
R 8
7,5
00
US
D 1
,16
2E
UR
1,0
24
1%
3 m
on
th +
(m
on
thly
rate
)IN
R 5
5,0
00
INR
57,
50
0U
SD
76
3E
UR
673
5%
INR
67,
50
0IN
R 6
8,2
00
US
D 9
05
EU
R 7
98
1%IN
R 8
4,0
00
INR
84
,70
0U
SD
1,124
EU
R 9
91
1%
Mu
mb
ai
(IN
R)
1-6
nig
hts
(n
igh
tly r
ate
)IN
R 9
,10
0IN
R 7
,50
0U
SD
80
EU
R 7
0-1
8%
INR
11,0
00
INR
8,8
00
US
D 1
18E
UR
10
3-2
0%
INR
19
,00
0IN
R 1
3,0
00
US
D 1
73
EU
R 1
52
-32%
7 n
igh
ts +
(w
ee
kly
rate
)IN
R 5
4,9
00
INR
45
,00
0U
SD
54
4E
UR
48
0-1
8%
INR
77,
00
0IN
R 5
7,20
0U
SD
75
9E
UR
66
9-2
6%
INR
118
,10
0IN
R 9
5,0
00
US
D 1
,26
1E
UR
1,111
-20
%
On
e m
on
th +
(m
on
thly
rate
)IN
R
100
,90
0IN
R 7
7,0
00
US
D 9
56
EU
R 8
42
-24
%IN
R 1
11,0
00
INR
62,9
50
US
D 8
36
EU
R 7
37
-43
%IN
R
125
,40
0IN
R
103
,50
0U
SD
1,3
74E
UR
1,2
11-1
7%
3 m
on
th +
(m
on
thly
rate
)IN
R 9
5,4
50
INR
68
,00
0U
SD
90
3E
UR
79
6-2
9%
INR
10
7,0
00
INR
62,0
00
US
D 1
,00
2E
UR
725
-42%
INR
116
,80
0IN
R
100
,25
0U
SD
1,3
31
EU
R 1
,173
-14
%
Ho
ng
Ko
ng
(H
KD
)
1-6
nig
hts
(n
igh
tly r
ate
)H
KD
1,6
45
HK
D 1
,20
0U
SD
15
4E
UR
13
6-2
7%
HK
D 1
,69
0H
KD
1,6
28
US
D 2
09
EU
R 1
84
-4%
HK
D 1
,820
HK
D 2
,219
US
D 2
84
EU
R 2
51
22%
7 n
igh
ts +
(w
ee
kly
rate
)H
KD
9,3
00
HK
D 8
,20
0U
SD
1,0
51
EU
R 9
26
-12%
HK
D
10,4
00
HK
D 9
,30
0U
SD
1,19
2E
UR
1,0
50
-11%
HK
D 1
1,75
0H
KD
12,8
00
US
D 1
,64
0E
UR
1,4
46
9%
On
e m
on
th +
(m
on
thly
rate
)H
KD
3
1,0
00
HK
D
29
,025
US
D 3
,720
EU
R 3
,278
-6%
HK
D
38
,90
0H
KD
3
2,5
00
US
D 4
,16
5E
UR
3,6
71
-16
%H
KD
42,10
0H
KD
4
3,0
00
US
D 5
,511
EU
R 4
,85
62%
3 m
on
th +
(m
on
thly
rate
)H
KD
28
,50
0H
KD
27,
50
0U
SD
3,5
24
EU
R 3
,10
6-4
%H
KD
37,
100
HK
D
30
,00
0U
SD
3,8
45
EU
R 3
,38
8-1
9%
HK
D
38
,20
0H
KD
4
0,0
00
US
D 5
,126
EU
R 4
,517
5%
Sh
an
gh
ai
(CN
Y)
1-6
nig
hts
(n
igh
tly r
ate
)C
NY
1,7
50
CN
Y 1
,45
0U
SD
228
EU
R 2
01
-17%
CN
Y 1
,820
CN
Y 1
,75
0U
SD
275
EU
R 2
43
-4%
CN
Y 3
,00
0C
NY
2,3
00
US
D 3
62
EU
R 3
19-2
3%
7 n
igh
ts +
(w
ee
kly
rate
)C
NY
8,2
00
CN
Y 7
,80
0U
SD
1,2
27
EU
R 1
,08
3-5
%C
NY
12,5
00
CN
Y
10,8
00
US
D 1
,69
8E
UR
1,5
00
-14
%C
NY
16
,80
0C
NY
15
,20
0U
SD
2,3
91
EU
R 2
,111
-10
%
On
e m
on
th +
(m
on
thly
rate
)C
NY
3
1,4
00
CN
Y
29
,50
0U
SD
4,6
39
EU
R 4
,09
7-6
%C
NY
3
9,2
00
CN
Y
34
,20
0U
SD
5,3
79
EU
R 4
,75
0-1
3%
CN
Y
49
,00
0C
NY
37,
25
0U
SD
5,8
58
EU
R 5
,174
-24
%
3 m
on
th +
(m
on
thly
rate
)C
NY
3
0,0
00
CN
Y
27,
50
0U
SD
4,3
25
EU
R 3
,819
-8%
CN
Y
37,
40
0C
NY
3
2,7
00
US
D 5
,14
3E
UR
4,5
41
-13
%C
NY
4
5,2
00
CN
Y
34
,75
0U
SD
5,4
65
EU
R 4
,827
-23
%

94 Fig
.50
R
ate
s co
mp
ari
son
– A
sia 2
019
/20
vs.
20
21/
22
RA
TE
S I
N K
EY
CIT
IES
Th
ese
rat
es
are
ave
rag
e r
ates
an
d
may
vary
per
loca
tio
n, t
ime o
f ye
ar,
reg
ion
al p
rom
oti
on
s an
d s
peci
fic
len
gth
s o
f st
ay. R
ates
qu
ote
d
are
base
d o
n a
n a
vera
ge 4
sta
r ex
ten
ded
sta
y p
rop
ert
y a
nd
exc
lud
e
taxe
s. E
xch
an
ge r
ates
use
d M
arc
h
20
22.
ST
UD
IOO
NE
BE
DR
OO
MT
WO
BE
DR
OO
M
20
19/2
0
rate
20
21/
22
rate
Yo
Y
vari
an
ce
20
19/2
0
rate
20
21/
22
rate
Yo
Y
vari
an
ce
20
19/2
0
rate
20
21/
22
rate
Yo
Y
vari
an
ce
Lo
cal
cu
rre
ncy
Lo
cal
cu
rre
ncy
US
$E
uro
Lo
cal
cu
rre
ncy
Lo
cal
cu
rre
ncy
US
$E
uro
Lo
cal
cu
rre
ncy
Lo
cal
cu
rre
ncy
US
$E
uro
%
AS
IA C
ON
T...
Sin
gap
ore
(S
GD
)
1-6
nig
hts
(n
igh
tly r
ate
)S
GD
36
0S
GD
28
5U
SD
212
EU
R 1
87
-21%
SG
D 4
25
SG
D 3
00
US
D 2
23
EU
R 1
96
-29
%S
GD
575
SG
D 3
75
US
D 2
79
EU
R 2
46
-35
%
7 n
igh
ts +
(w
ee
kly
rate
)S
GD
1,9
00
SG
D 1
,70
0U
SD
1,2
64
EU
R 1
,113
-11%
SG
D 2
,520
SG
D 2
,00
0U
SD
1,4
87
EU
R 1
,310
-21%
SG
D 3
,50
0S
GD
2,9
00
US
D 2
,15
6E
UR
1,8
99
-17%
On
e m
on
th +
(m
on
thly
rate
)S
GD
7,7
00
SG
D 6
,30
0U
SD
4,6
85
EU
R 4
,126
-18
%S
GD
9,10
0S
GD
7,7
00
US
D 5
,726
EU
R 5
,024
-15
%S
GD
10
,00
0S
GD
7,7
00
US
D 5
,726
EU
R 5
,04
2-2
3%
3 m
on
th +
(m
on
thly
rate
)S
GD
6,9
00
SG
D 5
,80
0U
SD
4,3
13E
UR
3,7
98
-16
%S
GD
9,0
00
SG
D 7
,20
0U
SD
5,3
54
EU
R 4
,715
-20
%S
GD
9,5
00
SG
D 6
,90
0U
SD
5,13
1E
UR
4,5
18-2
7%
Tokyo
(JP
Y)
1-6
nig
hts
(n
igh
tly r
ate
)JP
Y 1
9,0
00
JP
Y 1
5,0
00
US
D 1
29
EU
R 1
14-2
1%JP
Y 2
4,5
00
JP
Y
26
,00
0U
SD
224
EU
R 1
98
6%
JP
Y
29
,00
0JP
Y
24
,00
0U
SD
20
7E
UR
18
3-1
7%
7 n
igh
ts +
(w
ee
kly
rate
)JP
Y 8
1,0
00
JP
Y 7
3,0
00
US
D 6
29
EU
R 5
56
-10
%JP
Y
101,
45
0JP
Y 1
12,5
00
US
D 9
69
EU
R 8
57
11%
JP
Y
125
,60
0JP
Y
112,8
00
US
D 9
72
EU
R 8
59
-10
%
On
e m
on
th +
(m
on
thly
rate
)JP
Y
212
,00
0JP
Y
189
,00
0U
SD
1,6
29
EU
R 1
,44
0-1
1%JP
Y
228
,50
0JP
Y
23
2,5
00
US
D 2
,00
4E
UR
1,7
71
2%
JP
Y
26
1,8
00
JP
Y
225
,10
0U
SD
1,9
40
EU
R 1
,714
-14
%
3 m
on
th +
(m
on
thly
rate
)JP
Y
20
8,0
00
JP
Y
187,
00
0U
SD
1,6
11E
UR
1,4
24
-10
%JP
Y
212
,00
0JP
Y
23
0,0
00
US
D 1
,98
2E
UR
1,7
51
8%
JP
Y
237,
50
0JP
Y
20
8,0
00
US
D 1
,79
3E
UR
1,5
84
-12%

95
HOTELS AND HOTEL RESIDENCES WITH A SENSE OF HOME. Prime locations, sophisticated design, thoughtful amenities, warm service—and residential touches that will change the way you travel, whether you’re staying for days, weeks, or months.
STAYAKA.COMNEW YORK LOS ANGELES WASHINGTON DC MIAMI PHILADELPHIA LONDON
THE WORLD’S MOST LIVEABLE HOTELS
Fig
.50
R
ate
s co
mp
ari
son
– A
sia 2
019
/20
vs.
20
21/
22
RA
TE
S I
N K
EY
CIT
IES
Th
ese
rat
es
are
ave
rag
e r
ates
an
d
may
vary
per
loca
tio
n, t
ime o
f ye
ar,
reg
ion
al p
rom
oti
on
s an
d s
peci
fic
len
gth
s o
f st
ay. R
ates
qu
ote
d
are
base
d o
n a
n a
vera
ge 4
sta
r ex
ten
ded
sta
y p
rop
ert
y a
nd
exc
lud
e
taxe
s. E
xch
an
ge r
ates
use
d M
arc
h
20
22.
ST
UD
IOO
NE
BE
DR
OO
MT
WO
BE
DR
OO
M
20
19/2
0
rate
20
21/
22
rate
Yo
Y
vari
an
ce
20
19/2
0
rate
20
21/
22
rate
Yo
Y
vari
an
ce
20
19/2
0
rate
20
21/
22
rate
Yo
Y
vari
an
ce
Lo
cal
cu
rre
ncy
Lo
cal
cu
rre
ncy
US
$E
uro
Lo
cal
cu
rre
ncy
Lo
cal
cu
rre
ncy
US
$E
uro
Lo
cal
cu
rre
ncy
Lo
cal
cu
rre
ncy
US
$E
uro
%
AS
IA C
ON
T...
Sin
gap
ore
(S
GD
)
1-6
nig
hts
(n
igh
tly r
ate
)S
GD
36
0S
GD
28
5U
SD
212
EU
R 1
87
-21%
SG
D 4
25
SG
D 3
00
US
D 2
23
EU
R 1
96
-29
%S
GD
575
SG
D 3
75
US
D 2
79
EU
R 2
46
-35
%
7 n
igh
ts +
(w
ee
kly
rate
)S
GD
1,9
00
SG
D 1
,70
0U
SD
1,2
64
EU
R 1
,113
-11%
SG
D 2
,520
SG
D 2
,00
0U
SD
1,4
87
EU
R 1
,310
-21%
SG
D 3
,50
0S
GD
2,9
00
US
D 2
,15
6E
UR
1,8
99
-17%
On
e m
on
th +
(m
on
thly
rate
)S
GD
7,7
00
SG
D 6
,30
0U
SD
4,6
85
EU
R 4
,126
-18
%S
GD
9,10
0S
GD
7,7
00
US
D 5
,726
EU
R 5
,024
-15
%S
GD
10
,00
0S
GD
7,7
00
US
D 5
,726
EU
R 5
,04
2-2
3%
3 m
on
th +
(m
on
thly
rate
)S
GD
6,9
00
SG
D 5
,80
0U
SD
4,3
13E
UR
3,7
98
-16
%S
GD
9,0
00
SG
D 7
,20
0U
SD
5,3
54
EU
R 4
,715
-20
%S
GD
9,5
00
SG
D 6
,90
0U
SD
5,13
1E
UR
4,5
18-2
7%
Tokyo
(JP
Y)
1-6
nig
hts
(n
igh
tly r
ate
)JP
Y 1
9,0
00
JP
Y 1
5,0
00
US
D 1
29
EU
R 1
14-2
1%JP
Y 2
4,5
00
JP
Y
26
,00
0U
SD
224
EU
R 1
98
6%
JP
Y
29
,00
0JP
Y
24
,00
0U
SD
20
7E
UR
18
3-1
7%
7 n
igh
ts +
(w
ee
kly
rate
)JP
Y 8
1,0
00
JP
Y 7
3,0
00
US
D 6
29
EU
R 5
56
-10
%JP
Y
101,
45
0JP
Y 1
12,5
00
US
D 9
69
EU
R 8
57
11%
JP
Y
125
,60
0JP
Y
112,8
00
US
D 9
72
EU
R 8
59
-10
%
On
e m
on
th +
(m
on
thly
rate
)JP
Y
212
,00
0JP
Y
189
,00
0U
SD
1,6
29
EU
R 1
,44
0-1
1%JP
Y
228
,50
0JP
Y
23
2,5
00
US
D 2
,00
4E
UR
1,7
71
2%
JP
Y
26
1,8
00
JP
Y
225
,10
0U
SD
1,9
40
EU
R 1
,714
-14
%
3 m
on
th +
(m
on
thly
rate
)JP
Y
20
8,0
00
JP
Y
187,
00
0U
SD
1,6
11E
UR
1,4
24
-10
%JP
Y
212
,00
0JP
Y
23
0,0
00
US
D 1
,98
2E
UR
1,7
51
8%
JP
Y
237,
50
0JP
Y
20
8,0
00
US
D 1
,79
3E
UR
1,5
84
-12%

96
Regional report - AustralasiaBy Mark Harris
Australia’s extended stay sector began its post-
pandemic recovery on Feb 7th 2022. This was
the day Prime Minister Scott Morrison announced
fully vaccinated travellers could visit without
quarantine from February 21st.
Travel was the first sector to be impacted by
government public health Covid responses.
Eight territories and six states, each operating
effectively as separate countries with different
border policies, created uncertainty and political
leadership variously described as “capricious” or
“opportunistic” at federal and state level. The New
Zealand border remained closed.
Impact of pandemicUncertainty functioned as a brake on employee
assignments, though some travel was allowed
under visa exemption rules. Lockdowns in Sydney
and Melbourne devastated their hotel markets.
Occupancy falling as low as 20% and placing
pressure on smaller markets such as Adelaide,
Canberra, Darwin, and Hobart dependent on
interstate travel demand.81
David Mansfield, Chief Operations Officer at
Quest Apartment Hotels explains the real effects
of the pandemic on his business.
“Quest has around 50 properties in Victoria and another 33 in the next state, New South Wales. Both states had different Covid rules, as did South Australia on the other side of Victoria. You never knew which borders were up or down at any one time or what the restrictions were. Borders would often shut at short notice, creating a major barrier to travel.”
“Although our revenues and bookings dropped significantly, of the 130 Quest properties in Australia, 45% are in regional locations. We saw the SME market had no choice but to continue doing business during lockdown, so there was a lot of domestically driven business within the state itself from road warriors.” “State governments actively supported local communities. The construction, mining, logistics and manufacturing sectors stayed open whilst the banking and accounting firms just stopped travelling. Central Business Districts (CBD) rely on that business, whereas serviced apartment
operators like Quest were able to generate decent revenues through our regional centres, despite Covid.”
“We had families needing urgent assistance because they were repatriated from overseas or relocating. Insurance companies, for example, needed immediate assistance. We answered the phone and could provide a safe place to stay. 70% of our 10,000 apartments in Australia have balconies, and during Covid these were in great demand amongst families dealing with the stress of relocation. We took the anguish out because they knew they had a home away from home.”
RecoveryIn the week following Morrison’s announcement,
international flight bookings to the country
increased 93%, although leisure travel accounted
for most of those bookings, according to data
from Travelport. At the time of writing (March
2022), three-quarters of international bookings to
Australia remain for leisure.82
However, Australian economic recovery is being
overshadowed by tensions with China over the
Solomon Islands. China intimates that Australia
is promoting US-led competition in the region,
whilst Australia fears the implications of a Chinese
military base in the Solomon Islands for its
national security.
This has prompted the creation of the AUKUS
alliance, a new three-way strategic defence pact
between Australia, the UK, and US.83 AUKUS is
ultimately intended to combat the growing threat
of China in the Indo-Pacific region. Civil unrest has
broken out in The Solomon Islands, prompting
an Australian police and military presence to be
established there.
Flashpoints like this, together with Chinese border
incursions in Indonesia and The Philippines,
not to mention a possible invasion of Taiwan -
overshadowed by Russia’s invasion of Ukraine
- are likely to continue, collectively heightening
uncertainty in the region, especially amongst
extended stay operators.
81. https://www2.deloitte.com/au/en/pages/consumer-industrial-products/articles/tourism-hotel-outlook.html 82. https://www.businesstravelnews.com/Global/Travelport-Australia-Travel-Demand-Surged-After-Reopening-Announcement 83. https://www.theguardian.com/politics/2021/sep/16/what-is-the-aukus-alliance-and-what-are-its-implications

97
Extended stay outlookThere are now 81,513 serviced apartment units in
1,302 locations across Australia and New Zealand,
an increase of 10.1% and 10.7% respectively.84
The Veriu Group has a portfolio encompassing
1,700 rooms and apartments operating or in
development across over 25 sites under the
combined Veriu Hotels & Suites and Punthill
Apartment Hotels brands.
CEO Zed Sanjana is in no doubt that the region’s
serviced apartment sector will recover quicker
than expected as pent-up demand for travel
creates an exponential increase in the flow of
inbound and outbound travellers.
“The future is ripe with opportunity for those businesses and operators who are willing to adapt and adopt a longer-term approach. It’s increasingly evident that operators are facing an ultimatum – either grow and benefit from scale or be swallowed up by the market or larger operators.”
“Certainly, at Veriu we’ve refused to let the pandemic hinder our commitment to keep growing our portfolio of hotels. The timeline may have shifted, but our ambitions and our determination to get there certainly haven’t.”
“For us, the growth opportunities lie in the integration of our hotels within mixed-use developments, and developers certainly have an appetite for it, with over 80% of the deals we’re involved with right now incorporating a mix of
retail, residential, BTR, office in co-existence with our accommodation offerings. In fact, mixed-use developments are already emerging as a clear cornerstone of our growth and development as a Group going forward.”
“We see them as integral to securing our position as one of the biggest players in the Australian market, and we’re confident that developers that we partner with will continue to enjoy the benefits driven by secured income and strong asset values.”
David Mansfield says Quest will be staying true
to its original business model. “After 30 years in a market, sometimes you can lose your focus. In the past, Quest went into locations with a studio apartment offer; no balcony and smaller living areas but none of the USPs of extended stay.”
“During the pandemic we decided to de-brand 10 properties that were not purpose-fit for extended stay. Whether the customer is corporate of leisure we must provide larger kitchenettes and laundry facilities in an apartment operated by a brand and run by a property manager.”
However, Mansfield says some things must change
at a regulatory level. “As a country, we must address the non-regulated accommodation sector, by which I mean the likes of Airbnb.
“It’s not fair that hotels and serviced apartment businesses pay taxes to comply with regulatory requirements, whereas Airbnb and others in that space are not subject to that same regulatory regime. There has been some change in New South Wales, Victoria, and South Australia, but as a country, we need to achieve a level playing field.”
Suburbia vs. city centre“Since the start of the pandemic, as a society we’ve transitioned from a global to national focus to a state-based focus and now, increasingly, to a focus on local government areas” says Zed.
“While we anticipate that CBD office occupancy rates will increase, they’re unlikely to reach pre-Covid levels any time soon. Instead, we’re seeing increasing decentralisation of activity out of our CBDs and into mixed-use developments located in suburban and regional hubs.”
“This marks the strengthening of a trend which was already beginning to emerge as the attraction and appeal of satellite CBDs like Sydney’s Parramatta, and more affordable regional cities like Newcastle and Geelong, continue to grow.”
“Typically, these hubs comprise mixed-use development, combining office and co-working spaces, with food and beverage, residential, and retail offerings. We believe that short or long-term accommodation is going to play an integral role in
84. GSAIR Survey 2022
Quest, City Walk, Canberra

98
servicing these commercial and office hubs and will also assist developers in attracting decent quality tenants, customers, and residential renters or buyers who see the benefits of a locally self-contained centre from an end-to-end amenity perspective.” “In terms of risk management, multi-use developments using serviced apartment accommodation as an anchor tenant in suburban locations where there is a lack of competing amenity is also proving more attractive to developers and investors than CBD locations where alternative amenity is already available and becoming increasingly cost prohibitive.”
Veriu, Quest Apartments & Hotels’ priority is not
being in CBD but in urban centres and regional
locations. “This was always our priority before the pandemic” says David Mansfield. “All the pandemic has done is turbocharge that direction off the back of a proven history of viable businesses.” “Our franchisees are part of their local communities which may only be 10,000 people. They play such a pivotal role because they own their business. They have skin in the game. One franchisee lived on the other side of the border to her property, so she had to navigate the arduous permit process to cross the New South Wales/Victoria border to get to her small business. She had to do this every day whilst managing the stresses of health orders or general regulatory requirements.”
New supply
New arrivals in 2021Development company The Switch opened its first project in Australia, a $70 million co-living concept in a 39-storey skyscraper in Perth’s CBD. It’s the first in a series of The Switch locations due across Australia, with Adelaide and Sydney later this year and Melbourne in 2023. The Switch estimates it will house more than 3,400 renters across Perth, Adelaide, Sydney, and Melbourne, with numbers growing to 12,000 across Australia and New Zealand by 2030. 85
Mondrian Residences Gold Coast, the first Mondrian Residences outside of North America, has broken sales records after developers Vitale Property Group sold more than AUD$231 million worth of apartments in six months.86
Despite the pandemic, around 3,700 new rooms
were added in 2021. In Melbourne, new brands
included the W Hotel, which opened in early
2021 and the Hyatt Centric, which came online in
December. The Marriott’s The Tasman opened in
Hobart, and Sofitel made its debut in Adelaide.87
A further 15,000 new rooms are scheduled to
open in coming years, with around 5,000 of these
expected to open in 2022. 60% of the new stock
is concentrated in Melbourne, the Gold Coast and
Sydney.88
The pace of recovery for hotels will vary across
the city markets. Brisbane, Perth, Gold Coast,
Canberra, and Darwin are expected to see
occupancy rates return to 2019 levels by 2023,
while Sydney and Melbourne will take a longer to
recover due to their high pre-pandemic occupancy
rates. But what about serviced apartments?
“Quest will continue to grow over the next 10 years” says David. “We’ve got over AUS$1 billion dollars of new properties signed and another 35 properties where we have entered into a formal agreement with developers who see the viability of our model and see how we performed over the last two years particularly.”
85. https://servicedapartmentnews.com/news/the-switch-launches-australias-first-coliving-skyscraper/86. https://servicedapartmentnews.com/news/industry-news/mondrian-residences-australian-debut-breaks-sales-records/. 87. https://www2.deloitte.com/au/en/pages/consumer-industrial-products/articles/tourism-hotel-outlook.html 88. Ibid
W Hotel, Melbourne

99
“There is a lot of new growth in the regional centres of Western Australia. In the past, growth was focussed mainly around coastal areas. We are also seeing significant growth opportunities on the Eastern side of Australia, particularly in Brisbane and Queensland.”
“There’s a significant amount of infrastructure going into Western Sydney with the western corridor and the new Badgerys Creek International Airport. South Australia has been a bit of a sleeping giant, but we see strong interest with Adelaide because we like what the state government is doing.”
Recovery imminentConvido Corporate Housing operates in Australia,
New Zealand, and The Philippines, with intent
to expand across the Asia/Pacific region. The
company is focused entirely on corporate housing
and a minimum stay of 28 days.
“Our clients are telling us that they have a backlog of international moves pending, while Australia also has severe skill shortages. When we can travel freely, we expect a surge, followed by a levelling off, potentially to a lower level than pre-pandemic” says Convido chairman Chris Miller.
“Business travel will of course return, but as the efficiency of video conferencing has become apparent (together with its shortcomings), some shorter business trips may be substituted with conference calls. It is possible that extended stay travel will grow, particularly in the short-term, to address skill shortages.”
“Prompted by supply-chain issues during the pandemic and Chinese politics, many multinationals will be re-evaluating their dependence on China for low-cost manufacturing. This will stimulate interest in establishing manufacturing capability in other countries in the region, with travel and accommodation implications.”
“Convido will continue focus on its specific market segment and grow its presence regionally. Global skills shortages mean that employee retention will become an even greater priority for our clients. The pressure is therefore on us to ensure that we deliver a fantastic product and service. “
Convido, Perth
Convido, Manilla
Convido, Melbourne

100Fig
.51
Rate
s co
mp
ari
son
– A
ust
rala
sia 2
019
/20
vs.
20
21/
22
RA
TE
S I
N K
EY
CIT
IES
Th
ese
rat
es
are
ave
rag
e r
ates
an
d
may
vary
per
loca
tio
n, t
ime o
f ye
ar,
reg
ion
al p
rom
oti
on
s an
d s
peci
fic
len
gth
s o
f st
ay. R
ates
qu
ote
d a
re
base
d o
n a
n a
vera
ge 4
sta
r ex
ten
ded
st
ay p
rop
ert
y a
nd
exc
lud
e t
axe
s.
Exc
han
ge r
ates
use
d M
arc
h 2
022.
ST
UD
IOO
NE
BE
DR
OO
MT
WO
BE
DR
OO
M
20
19/2
0
rate
20
21/
22
rate
Yo
Y
vari
an
ce
20
19/2
0
rate
20
21/
22
rate
Yo
Y
vari
an
ce
20
19/2
0
rate
20
21/
22
rate
Yo
Y
vari
an
ce
Lo
cal
cu
rre
ncy
Lo
cal
cu
rre
ncy
US
$E
uro
%L
ocal
cu
rre
ncy
Lo
cal
cu
rre
ncy
US
$E
uro
%L
ocal
cu
rre
ncy
Lo
cal
cu
rre
ncy
US
$E
uro
AU
ST
RA
LA
SIA
Au
ckla
nd
(N
ZD
)
1-6
nig
hts
(n
igh
tly r
ate
)N
ZD
175
NZ
D 1
62
US
D 1
08
EU
R 9
4-7
%N
ZD
215
NZ
D 1
90
US
D 1
26
EU
R 1
11-1
2%
NZ
D 2
55
NZ
D 2
30
US
D 1
53
EU
R 1
34
-10
%
7 n
igh
ts +
(w
ee
kly
rate
)N
ZD
1,0
80
NZ
D 1
,00
0U
SD
66
5E
UR
58
3-7
%N
ZD
1,4
00
NZ
D 1
,34
0U
SD
89
2E
UR
78
2-4
%N
ZD
1,5
25
NZ
D 1
,475
US
D 9
81
EU
R 8
61
-3%
On
e m
on
th +
(m
on
thly
rate
)N
ZD
3,15
0N
ZD
3,0
00
US
D 1
,99
6E
UR
1,7
50
-5%
NZ
D 4
,10
0N
ZD
3,5
75
US
D 2
,379
EU
R 2
,08
6-1
3%
NZ
D 5
,20
0N
ZD
5,0
00
US
D 3
,327
EU
R 2
,918
-4%
3 m
on
th +
(m
on
thly
rate
)N
ZD
2,9
50
NZ
D 2
,825
US
D 1
,88
0E
UR
1,6
48
-4%
NZ
D 3
,85
0N
ZD
3,3
00
US
D 2
,19
6E
UR
1,9
26
-14
%N
ZD
5,10
0N
ZD
4,9
50
US
D 3
,29
3E
UR
2,8
88
-3%
Can
be
rra (
AU
D)
1-6
nig
hts
(n
igh
tly r
ate
)A
UD
19
0A
UD
16
5U
SD
118
EU
R 1
04
-13
%A
UD
225
AU
D 1
90
US
D 1
36
EU
R 1
20
-16
%A
UD
310
AU
D 2
80
US
D 2
00
EU
R 1
77
-10
%
7 n
igh
ts +
(w
ee
kly
rate
)A
UD
1,10
0A
UD
98
0U
SD
69
9E
UR
617
-11%
AU
D 1
,420
AU
D 1
,10
0U
SD
78
5E
UR
69
2-2
3%
AU
D 1
,48
0A
UD
1,4
30
US
D 1
,020
EU
R 8
99
-3%
On
e m
on
th +
(m
on
thly
rate
)A
UD
3,4
00
AU
D 3
,00
0U
SD
2,14
0E
UR
1,8
87
-12%
AU
D 3
,75
0A
UD
3,4
00
US
D 2
,425
EU
R 2
,13
9-9
%A
UD
3,9
50
AU
D 3
,60
0U
SD
2,5
68
EU
R 2
,26
4-9
%
3 m
on
th +
(m
on
thly
rate
)A
UD
2,9
75
AU
D 2
,75
0U
SD
1,9
61
EU
R 1
,73
0-8
%A
UD
3,10
0A
UD
2,9
75
US
D 2
,122
EU
R 1
,87
1-4
%A
UD
3,4
90
AU
D 3
,15
0U
SD
2,2
47
EU
R 1
,98
1-1
0%
Me
lbo
urn
e (
AU
D)
1-6
nig
hts
(n
igh
tly r
ate
)A
UD
25
0A
UD
20
0U
SD
14
3E
UR
126
-20
%A
UD
29
5A
UD
25
0U
SD
178
EU
R 1
57
-15
%A
UD
39
0A
UD
320
US
D 2
28
EU
R 2
01
-18
%
7 n
igh
ts +
(w
ee
kly
rate
)A
UD
1,4
00
AU
D 1
,310
US
D 9
35
EU
R 8
24
-6%
AU
D 1
,725
AU
D 1
,40
0U
SD
99
9E
UR
88
1-1
9%
AU
D 2
,525
AU
D 2
,25
0U
SD
1,6
05
EU
R 1
,415
-11%
On
e m
on
th +
(m
on
thly
rate
)A
UD
4,2
50
AU
D 4
,00
0U
SD
2,8
54
EU
R 2
,516
-6%
AU
D 4
,75
0A
UD
4,2
50
US
D 3
,03
2E
UR
2,6
73
-11%
AU
D 4
,60
0A
UD
4,2
50
US
D 3
,03
2E
UR
2,6
73
-8%
3 m
on
th +
(m
on
thly
rate
)A
UD
4,0
00
AU
D 3
,85
0U
SD
2,7
47
EU
R 2
,422
-4%
AU
D 4
,50
0A
UD
4,0
00
US
D 2
,85
3E
UR
2,5
16-1
1%A
UD
4,4
00
AU
D 4
,00
0U
SD
2,8
53
EU
R 2
,516
-9%
Syd
ney (
AU
D)
1-6
nig
hts
(n
igh
tly r
ate
)A
UD
210
AU
D 2
10U
SD
15
0E
UR
13
20
%A
UD
23
5A
UD
20
0U
SD
14
3E
UR
126
-15
%A
UD
310
AU
D 3
25
US
D 2
32
EU
R 2
04
5%
7 n
igh
ts +
(w
ee
kly
rate
)A
UD
1,19
0A
UD
1,19
0U
SD
84
9E
UR
74
90
%A
UD
1,2
25
AU
D 1
,175
US
D 8
38
EU
R 7
39
-4%
AU
D 1
,375
AU
D 1
,40
0U
SD
99
8E
UR
88
12%
On
e m
on
th +
(m
on
thly
rate
)A
UD
3,4
50
AU
D 3
,45
0U
SD
2,4
61
EU
R 2
,170
0%
AU
D 3
,775
AU
D 3
,45
0U
SD
2,4
60
EU
R 2
,170
-9%
AU
D 3
,75
0A
UD
3,8
00
US
D 2
,710
EU
R 2
,39
01%
3 m
on
th +
(m
on
thly
rate
)A
UD
3,3
00
AU
D 3
,30
0U
SD
2,3
54
EU
R 2
,076
0%
AU
D 3
,410
AU
D 3
,30
0U
SD
2,3
53
EU
R 2
,076
-3%
AU
D 3
,60
0A
UD
3,6
75
US
D 2
,621
EU
R 2
,311
2%

101SUITESBYREHOBOTH.COM
Enjoy the comforts of home fusedwith the hospitality and luxuries of ahotel. Our selection of servicedresidences brings a blend of chill andplay in iconic London locations.
LONDONLIVE THE
EXPERIENCE
RELAX |
REFRESH
| RECHARGE
Fig
.51
Rate
s co
mp
ari
son
– A
ust
rala
sia 2
019
/20
vs.
20
21/
22
RA
TE
S I
N K
EY
CIT
IES
Th
ese
rat
es
are
ave
rag
e r
ates
an
d
may
vary
per
loca
tio
n, t
ime o
f ye
ar,
reg
ion
al p
rom
oti
on
s an
d s
peci
fic
len
gth
s o
f st
ay. R
ates
qu
ote
d a
re
base
d o
n a
n a
vera
ge 4
sta
r ex
ten
ded
st
ay p
rop
ert
y a
nd
exc
lud
e t
axe
s.
Exc
han
ge r
ates
use
d M
arc
h 2
022.
ST
UD
IOO
NE
BE
DR
OO
MT
WO
BE
DR
OO
M
20
19/2
0
rate
20
21/
22
rate
Yo
Y
vari
an
ce
20
19/2
0
rate
20
21/
22
rate
Yo
Y
vari
an
ce
20
19/2
0
rate
20
21/
22
rate
Yo
Y
vari
an
ce
Lo
cal
cu
rre
ncy
Lo
cal
cu
rre
ncy
US
$E
uro
%L
ocal
cu
rre
ncy
Lo
cal
cu
rre
ncy
US
$E
uro
%L
ocal
cu
rre
ncy
Lo
cal
cu
rre
ncy
US
$E
uro
AU
ST
RA
LA
SIA
Au
ckla
nd
(N
ZD
)
1-6
nig
hts
(n
igh
tly r
ate
)N
ZD
175
NZ
D 1
62
US
D 1
08
EU
R 9
4-7
%N
ZD
215
NZ
D 1
90
US
D 1
26
EU
R 1
11-1
2%
NZ
D 2
55
NZ
D 2
30
US
D 1
53
EU
R 1
34
-10
%
7 n
igh
ts +
(w
ee
kly
rate
)N
ZD
1,0
80
NZ
D 1
,00
0U
SD
66
5E
UR
58
3-7
%N
ZD
1,4
00
NZ
D 1
,34
0U
SD
89
2E
UR
78
2-4
%N
ZD
1,5
25
NZ
D 1
,475
US
D 9
81
EU
R 8
61
-3%
On
e m
on
th +
(m
on
thly
rate
)N
ZD
3,15
0N
ZD
3,0
00
US
D 1
,99
6E
UR
1,7
50
-5%
NZ
D 4
,10
0N
ZD
3,5
75
US
D 2
,379
EU
R 2
,08
6-1
3%
NZ
D 5
,20
0N
ZD
5,0
00
US
D 3
,327
EU
R 2
,918
-4%
3 m
on
th +
(m
on
thly
rate
)N
ZD
2,9
50
NZ
D 2
,825
US
D 1
,88
0E
UR
1,6
48
-4%
NZ
D 3
,85
0N
ZD
3,3
00
US
D 2
,19
6E
UR
1,9
26
-14
%N
ZD
5,10
0N
ZD
4,9
50
US
D 3
,29
3E
UR
2,8
88
-3%
Can
be
rra (
AU
D)
1-6
nig
hts
(n
igh
tly r
ate
)A
UD
19
0A
UD
16
5U
SD
118
EU
R 1
04
-13
%A
UD
225
AU
D 1
90
US
D 1
36
EU
R 1
20
-16
%A
UD
310
AU
D 2
80
US
D 2
00
EU
R 1
77
-10
%
7 n
igh
ts +
(w
ee
kly
rate
)A
UD
1,10
0A
UD
98
0U
SD
69
9E
UR
617
-11%
AU
D 1
,420
AU
D 1
,10
0U
SD
78
5E
UR
69
2-2
3%
AU
D 1
,48
0A
UD
1,4
30
US
D 1
,020
EU
R 8
99
-3%
On
e m
on
th +
(m
on
thly
rate
)A
UD
3,4
00
AU
D 3
,00
0U
SD
2,14
0E
UR
1,8
87
-12%
AU
D 3
,75
0A
UD
3,4
00
US
D 2
,425
EU
R 2
,13
9-9
%A
UD
3,9
50
AU
D 3
,60
0U
SD
2,5
68
EU
R 2
,26
4-9
%
3 m
on
th +
(m
on
thly
rate
)A
UD
2,9
75
AU
D 2
,75
0U
SD
1,9
61
EU
R 1
,73
0-8
%A
UD
3,10
0A
UD
2,9
75
US
D 2
,122
EU
R 1
,87
1-4
%A
UD
3,4
90
AU
D 3
,15
0U
SD
2,2
47
EU
R 1
,98
1-1
0%
Me
lbo
urn
e (
AU
D)
1-6
nig
hts
(n
igh
tly r
ate
)A
UD
25
0A
UD
20
0U
SD
14
3E
UR
126
-20
%A
UD
29
5A
UD
25
0U
SD
178
EU
R 1
57
-15
%A
UD
39
0A
UD
320
US
D 2
28
EU
R 2
01
-18
%
7 n
igh
ts +
(w
ee
kly
rate
)A
UD
1,4
00
AU
D 1
,310
US
D 9
35
EU
R 8
24
-6%
AU
D 1
,725
AU
D 1
,40
0U
SD
99
9E
UR
88
1-1
9%
AU
D 2
,525
AU
D 2
,25
0U
SD
1,6
05
EU
R 1
,415
-11%
On
e m
on
th +
(m
on
thly
rate
)A
UD
4,2
50
AU
D 4
,00
0U
SD
2,8
54
EU
R 2
,516
-6%
AU
D 4
,75
0A
UD
4,2
50
US
D 3
,03
2E
UR
2,6
73
-11%
AU
D 4
,60
0A
UD
4,2
50
US
D 3
,03
2E
UR
2,6
73
-8%
3 m
on
th +
(m
on
thly
rate
)A
UD
4,0
00
AU
D 3
,85
0U
SD
2,7
47
EU
R 2
,422
-4%
AU
D 4
,50
0A
UD
4,0
00
US
D 2
,85
3E
UR
2,5
16-1
1%A
UD
4,4
00
AU
D 4
,00
0U
SD
2,8
53
EU
R 2
,516
-9%
Syd
ney (
AU
D)
1-6
nig
hts
(n
igh
tly r
ate
)A
UD
210
AU
D 2
10U
SD
15
0E
UR
13
20
%A
UD
23
5A
UD
20
0U
SD
14
3E
UR
126
-15
%A
UD
310
AU
D 3
25
US
D 2
32
EU
R 2
04
5%
7 n
igh
ts +
(w
ee
kly
rate
)A
UD
1,19
0A
UD
1,19
0U
SD
84
9E
UR
74
90
%A
UD
1,2
25
AU
D 1
,175
US
D 8
38
EU
R 7
39
-4%
AU
D 1
,375
AU
D 1
,40
0U
SD
99
8E
UR
88
12%
On
e m
on
th +
(m
on
thly
rate
)A
UD
3,4
50
AU
D 3
,45
0U
SD
2,4
61
EU
R 2
,170
0%
AU
D 3
,775
AU
D 3
,45
0U
SD
2,4
60
EU
R 2
,170
-9%
AU
D 3
,75
0A
UD
3,8
00
US
D 2
,710
EU
R 2
,39
01%
3 m
on
th +
(m
on
thly
rate
)A
UD
3,3
00
AU
D 3
,30
0U
SD
2,3
54
EU
R 2
,076
0%
AU
D 3
,410
AU
D 3
,30
0U
SD
2,3
53
EU
R 2
,076
-3%
AU
D 3
,60
0A
UD
3,6
75
US
D 2
,621
EU
R 2
,311
2%

102
Regional report - Europe
By Mark Harris
Like most other regions, Europe’s serviced
apartment industry fared better than its hotel
counterpart despite demand from business travel
effectively disappearing.
A combination of longer, assignment-based
stays, a safer, more self-contained environment
ideally suited to remote working and the inherent
flexibility of the model meant that serviced
apartments lost less ground than hotels, and their
recovery is happening much faster.
Fig.52 Serviced apartment operational performance vs. hotels
Source: Savills research; ASAP;STR
-20%
0%
-40%
-60%
-80%
-100%London serviced
apartments
London hotels Regional serviced
apartments
Regional hotels
% diff to pre-Covid (as of Dec 2021) Covid period low (% diff to pre-Covid)
London & the UKAs Fig.52 shows, as of December 2021, London
serviced apartment RevPAR (revenue per
available room) was 18% below that seen the same
month in 2019, compared to 45% for London
hotels. Strong domestic demand saw regional
UK market outperform London, for both serviced
apartments and hotels.89
By the end of December 2021, Europe boasted
236,000 serviced apartment units in 4,619
locations, an increase of 11.5% and 11.3%
respectively over two years earlier. Europe
remains the second largest region for serviced
apartments, accounting for 18% of global supply.90
As Fig.53 shows, the future development pipeline
is concentrated across emerging destination and
regional cities.
31,566 new serviced apartment units have been
added since the end of 2019, with the UK and
Germany leading the way, followed by Ireland and
Austria.
The current pipeline, which includes some projects
delayed during the pandemic, will see supply rise
by 21% over the next three years. London remains
the biggest growth market by number of units with
just under 3,000 new units coming online, followed
by Munich, Istanbul, and Manchester.
In terms of percentage growth, Stuttgart and
Belfast will have 372% and 337% more units, albeit
from a lower base. This reflects a combination of
rising developer and investor awareness of the
sector and its operators, as well as appetite to
expand into relatively underserved markets.91
89. https://www.savills.co.uk/research_articles/229130/325759-090. GSAIR survey 202291. https://www.savills.co.uk/research_articles/229130/325759-0

103
Fig.53 Top 15 European cities by growth
Source: Savills research; ASAP;STR
2000
3000
2500
1500
1000
500
0
300%
450%
375%
225%
150%
75%
0
Lond
on
Pip
elin
e (u
nit
s)
Ch
ang
e o
n c
urr
ent
sto
ck le
vels
(%
)
Mun
ich
Istan
bul
Man
ches
ter
Belfas
t
Glasgow
Dusse
ldor
f
Dublin
Frank
furt
Stut
tgar
t
Copen
hagen
Live
rpoo
l
Birmingha
m
Lisb
on
Zurich
Pipeline % change in stock
New supplySignificant additions to serviced apartment supply
during the pandemic, and slated to open in 2022
include:
• Amsterdam – Cycas Hospitality opened
the 227-key Radisson Hotel & Suites,
Amsterdam South.
• Cambridge – The Regent Hotel being
relaunched as an aparthotel with co-living
space in 2022.
• Edinburgh – Cheval Old Town Chambers –
24 new apartments added.
• London – Cycas Hospitality opened the
54-unit Lincoln Suites in Holborn.
• London – The Other House to open in
South Kensington in late 2022. Sister
property Wellington Block to open in
Covent Garden in 2023.
• Sion, Switzerland – Cycas Hospitality
opened the 119-key Holiday Inn Express
& Suites.
• Strasbourg – 166-key Citadines
Eurometropole opened.
“European serviced apartment stock expansion is set to accelerate, with supply forecast to expand by 21.2% over the next three years.”
Marie Hickey, Director, Commercial Research, Savills
Fastest-growing brands
Our figures show that Pierre & Vacances are the
biggest brand in Europe with 24,156 units, followed
by Adagio with 19,050 and Appart’City with 11,800
serviced apartment units.92
Savills says that, based on committed pipeline,
Adagio Aparthotels, Staycity and edyn account for
22.9% of the total serviced apartment pipeline, an
average growth in stock of 45.1% up to 2025. For
edyn and Staycity, this expansion will be driven by
their core brands (Locke and Wilde), whilst Adagio
Aparthotels is the Adagio Access brand that
dominates future pipeline.93
Locke Apartments opened six new properties
in 2021 including the 180-key Turing Locke in
Cambridge, the 241-key Becket Lodge in Dublin
and the 103-key Buckle Street Lodge by Locke
in Aldgate, London. 2022 – 2024 will see further
openings outside the UK, in Berlin, Copenhagen,
Lisbon, and Munich.
edyn launched its tech-focused Cove brand, re-
branding eight SACO properties and opening a
162-key flagship Cove in London’s Canary Wharf.
Another Cove is scheduled to open in The Hague
92. GSAIR survey 202293. https://www.savills.co.uk/research_articles/229130/325759-0

104
during 2022, adding 121 apartments. In 2021
alone, Staycity opened in Bordeaux, Heidelberg,
Manchester, London Aldgate and a £203m, 249-
key Wilde Aparthotels by Staycity, at Paddington.
In terms of new entrants, Hyatt House, part of the
US-based Hyatt group, have added new sites in
Paris and Frankfurt, with the next property due to
open in London in 2022.
Private equity investment is also driving expansion.
In 2021, City ID acquired its first international site
in London. Fortress Investment Group acquired
a majority stake in operator PREM Group whilst
Finnish-based Bob W secured extra funding that
enabled the brand to expand into the UK and
Spain.
Germany’s Serviced Apartments Platform, part
of Vision Apartments, bought digital marketplace
Acomodeo, whose founder and CEO was honest
in his appraisal. “It has been a turbulent year,” said
Eric-Jan Krausch. “Due to refinancing needs in the middle of the corona crisis, we were dependent on new shareholders.” Serviced Apartments Platform
had previously invested in the company.
With up to 60% of current European stock
unbranded, there is still significant opportunity
for brand expansion. As we have already seen,
the lines between serviced apartments, BTR and
co-living are increasingly blurred, with investor
appetite for BTR growing, we may see more
serviced apartment operators move into BTR/
co-living management and or incorporate these
elements into their properties. In 2021, Ascott’s
co-living brand Lyf secured its first European site
in Paris through a joint venture with the Qatar
Investment Authority.
“Cheval Collection is actively looking to expand its footprint. A property in Frankfurt is our next scheduled property in the pipeline. When it comes to choosing a site, location is naturally the most important, but the configuration of the building is also key, in keeping with our USP of offering more space for customers’ money than our hotel competitors. We already have 11 residences and a Cheval Maison in London and Edinburgh and are always looking for new and interesting sites to develop properties.” John Philipson, Chief Operating Officer, Cheval Collection
Germany“Since the beginning of Covid 19, it seems like most weeks new players are discovering our sector. 3,100 new long-stay apartments were launched in Germany in 2021 with another 18,000 new units planned by 2024”94 says Burak Ünver,
Managing Director of SMARTments business.
“In 2021 I took part in one of the few live conferences which took place in Munich. Speakers from two huge, global lodging players in extended stay announced they want to launch and/or rebrand 5 to 10% of their capacities to long and extended stay units in the upcoming 3-5 years. My question is whether the extended stay sector is big enough to manage this?”
The past two years have clearly shown the
differences of concepts within the hospitality
sector with regards to type of property, service
level and location, says Tim Deuysen of Living
Hotels by Derag. Germany’s experiences during
the pandemic are remarkably similar to other
countries and outside of Europe, as he explains.
“In Germany, at some stages, leisure travel was not allowed. Business travellers had to provide an incredibly good reason for their trip next to testing certificates. While hotels of all types had to close their doors for many weeks and sometimes even months, properties with apartment room types could be operated. The travel market collapsed, but the (corporate) housing market was hardly affected at all.”
“We adjusted our sales strategy to offer rates that could compete with the corporate housing market. We also lowered our service level and established new distribution channels. As a result we still had to cope with revenue losses, but we kept the occupancy high and generated a solid and predictable cash flow.”
“Despite the ongoing crisis, new providers are still entering the market. We are seeing new concepts and new business ideas. Projects that had been planned as typical hotels, will try to alter their concepts to provide cooking facilities in the guest rooms to get a little bit more flexibility towards serviced apartments. Growth of the serviced apartment industry in the German speaking areas of Europe was already high. Now it will develop even bigger and faster.” Tim concludes.
IrelandPremier Suites operates 15 serviced apartment
locations across Ireland, United Kingdom,
Belgium, Holland, and Dublin. Here too, while
the suspension of international and domestic
travel stifled demand, those who needed
accommodation for essential work and travel
opted for serviced apartments.
94. SO!APART insight

105
As in other countries, the privacy, and facilities
of a self-catering apartment, alleviating the need
to engage with other guests, proved compelling.
Performance across the serviced apartment
sector was strong, as Chief Operating Officer
Evelyn Haran explains.
“In 2021, we saw our Dublin serviced apartments out-perform the hotel market. While hotels were operating at between 20% and 30% occupancy, our apartments achieved occupancies over 80%, albeit at a supressed rate. Each of our three locations (Leeson Street, Sandyford, and Ballsbridge) remained open throughout the pandemic and attracted business from sectors including construction, film production, finance, technology, and healthcare workers.”
“In 2022, we anticipate a rise in the bleisure market with guests opting to take a dual-purpose trip combining business and a holiday into one longer stay. There is increasing confidence in the serviced apartment sector in Dublin. In 2021, we saw the addition of 400 serviced apartment units into Dublin with an additional 730 in the pipeline for 2022.”
NordicsBy Johannes Kangas, CEO, Forenom GroupThe volume of bed nights fell by 29 % in the
Nordics between 2019 and 2020, which heavily
impacted the serviced apartment industry.
Sweden and Denmark experienced the smallest
drop in volume of just over 20 %, whereas Norway
and Finland both faced a bigger hit, with a
decrease of over 30% in volume.
In our region, serviced apartments performed
better than the accommodation market overall.
The pandemic affected us in five ways. First,
rates fell due to lower demand (especially for
short stays), which impacted ADR, length of
stay increased (relocation companies have been
booking for periods of a year or more), and
customers’ location requirements changed.
For instance, in Finland one large industrial
project in the south was completed, to be
replaced by another project starting in the north.
We expect to see a similar pattern in northern
Sweden where tens of billions of Krones will be
invested in housing and infrastructure during
upcoming years.
Demand in Finland and Denmark has been
strongest in the construction, infrastructure, and
energy sectors. In 2021, we saw business from
these markets grow by over 50% compared to
2020.
By comparison, in Sweden and Norway, serviced
apartment demand was dominated by the IT,
retail, insurance, oil, and cultural sectors pre-
pandemic. Today, there’s a more even balance
between the demand markets. Purchasing
patterns have also changed. For the first time, we
have received more direct bookings than from
the OTAs. Customers are also booking larger
apartments.
An ongoing challenge for the Nordic market is
fragmented regulation. Whilst the European Union
is trying to help serviced apartments grow, we
are hampered by planning, the rental market, and
taxation regulations.
Harmonisation of serviced apartments’ operating
models would be a positive development. As
an industry, we have an important mission to
educate decision makers on how our segment
creates value for society in a way that other
accommodation providers cannot.
Cheval Collection
Cheval Collection

106 Fig
.54
R
ate
s co
mp
ari
son
Eu
rop
e –
20
19/2
0 v
s 2
02
1/2
2
RA
TE
S I
N K
EY
CIT
IES
Th
ese
rat
es
are
ave
rag
e r
ates
an
d
may
vary
per
loca
tio
n, t
ime o
f ye
ar,
reg
ion
al p
rom
oti
on
s an
d s
peci
fic
len
gth
s o
f st
ay. R
ates
qu
ote
d a
re
base
d o
n a
n a
vera
ge 4
sta
r ex
ten
ded
st
ay p
rop
ert
y a
nd
exc
lud
e t
axe
s.
Exc
han
ge r
ates
use
d M
arc
h 2
022.
ST
UD
IOO
NE
BE
DR
OO
MT
WO
BE
DR
OO
M
20
19/2
0
rate
20
21/
22
rate
Yo
Y
vari
an
ce
20
19/2
0
rate
20
21/
22
rate
Yo
Y
vari
an
ce
20
19/2
0
rate
20
21/
22
rate
Yo
Y
vari
an
ce
Lo
cal
cu
rre
ncy
Lo
cal
cu
rre
ncy
US
$E
uro
%L
ocal
cu
rre
ncy
Lo
cal
cu
rre
ncy
US
$E
uro
%L
ocal
cu
rre
ncy
Lo
cal
cu
rre
ncy
US
$E
uro
EU
RO
PE
Am
ste
rdam
(E
UR
)
1-6
nig
hts
(n
igh
tly r
ate
)E
UR
18
0E
UR
15
0U
SD
17
1-1
7%
EU
R 2
30
EU
R 1
95
US
D 2
22
-15
%E
UR
28
0E
UR
220
US
D 2
51
-21%
7 n
igh
ts +
(w
ee
kly
rate
)E
UR
975
EU
R 9
25
US
D 1
,05
4-5
%E
UR
1,4
20
EU
R 1
,220
US
D 1
,38
9-1
4%
EU
R 1
,70
0E
UR
1,2
85
US
D 1
,46
3-2
4%
On
e m
on
th +
(m
on
thly
rate
)E
UR
3,7
00
EU
R 3
,575
US
D 4
,072
-3%
EU
R 5
,20
0E
UR
4,15
0U
SD
4,7
25
-20
%E
UR
5,7
75
EU
R 4
,275
US
D 4
,86
8-2
6%
3 m
on
th +
(m
on
thly
rate
)E
UR
3,3
00
EU
R 3
,210
US
D 3
,65
6-3
%E
UR
4,8
95
EU
R 3
,75
0U
SD
4,2
70
-23
%E
UR
5,5
25
EU
R 3
,90
0U
SD
4,4
41
-29
%
Bru
sse
ls (
EU
R)
1-6
nig
hts
(n
igh
tly r
ate
)E
UR
16
0E
UR
13
0U
SD
14
8-1
9%
EU
R 2
30
EU
R 1
60
US
D 1
82
-30
%E
UR
275
EU
R 2
00
US
D 2
28
-27%
7 n
igh
ts +
(w
ee
kly
rate
)E
UR
83
5E
UR
80
0U
SD
911
-4%
EU
R 1
,28
0E
UR
1,120
US
D 1
,275
-13
%E
UR
1,4
50
EU
R 1
,310
US
D 1
,49
2-1
0%
On
e m
on
th +
(m
on
thly
rate
)E
UR
3,5
00
EU
R 3
,20
0U
SD
3,6
45
-9%
EU
R 4
,35
0E
UR
4,0
00
US
D 4
,55
4-8
%E
UR
6,0
00
EU
R 5
,00
0U
SD
5,6
93
-17%
3 m
on
th +
(m
on
thly
rate
)E
UR
3,2
80
EU
R 3
,00
0U
SD
3,4
17-9
%E
UR
4,2
00
EU
R 3
,90
0U
SD
4,4
41
-7%
EU
R 5
,75
0E
UR
4,7
00
US
D 5
,35
1-1
8%
Fra
nkfu
rt (
EU
R)
1-6
nig
hts
(n
igh
tly r
ate
)E
UR
13
5E
UR
120
US
D 1
14-1
1%E
UR
20
0E
UR
16
0U
SD
15
9-2
0%
EU
R 2
45
EU
R 2
45
US
D 2
79
0%
7 n
igh
ts +
(w
ee
kly
rate
)E
UR
88
0E
UR
80
0U
SD
774
-9%
EU
R 1
,20
0E
UR
975
US
D 1
,08
2-1
9%
EU
R 1
,520
EU
R 1
,520
US
D 1
,73
10
%
On
e m
on
th +
(m
on
thly
rate
)E
UR
3,6
20
EU
R 3
,25
0U
SD
3,7
02
-10
%E
UR
4,5
00
EU
R 4
,10
0U
SD
4,6
68
-9%
EU
R 5
,45
0E
UR
5,4
50
US
D 6
,20
50
%
3 m
on
th +
(m
on
thly
rate
)E
UR
3,3
00
EU
R 3
,00
0U
SD
3,4
17-9
%E
UR
4,2
00
EU
R 3
,80
0U
SD
4,3
27
-10
%E
UR
5,15
0E
UR
5,15
0U
SD
5,8
63
0%
Lis
bo
n (
EU
R)
1-6
nig
hts
(n
igh
tly r
ate
)E
UR
125
EU
R 1
00
US
D 1
08
-20
%E
UR
18
5E
UR
15
0U
SD
14
2-1
9%
EU
R 2
35
EU
R 1
95
US
D 1
94
-17%
7 n
igh
ts +
(w
ee
kly
rate
)E
UR
75
0E
UR
65
0U
SD
74
0-1
3%
EU
R 1
,19
0E
UR
1,0
00
US
D 1
,13
9-1
6%
EU
R 1
,29
5E
UR
1,10
0U
SD
1,2
52
-15
%
On
e m
on
th +
(m
on
thly
rate
)E
UR
2,7
00
EU
R 2
,50
0U
SD
2,8
47
-7%
EU
R 4
,00
0E
UR
3,6
50
US
D 4
,15
6-9
%E
UR
4,5
90
EU
R 4
,20
0U
SD
4,7
82
-8%
3 m
on
th +
(m
on
thly
rate
)E
UR
2,4
00
EU
R 2
,30
0U
SD
2,6
19-4
%E
UR
3,6
50
EU
R 3
,30
0U
SD
3,7
57
-10
%E
UR
4,4
50
EU
R 4
,00
0U
SD
4,5
54
-10
%

107
RA
TE
S I
N K
EY
CIT
IES
Th
ese
rat
es
are
ave
rag
e r
ates
an
d
may
vary
per
loca
tio
n, t
ime o
f ye
ar,
reg
ion
al p
rom
oti
on
s an
d s
peci
fic
len
gth
s o
f st
ay. R
ates
qu
ote
d a
re
base
d o
n a
n a
vera
ge 4
sta
r ex
ten
ded
st
ay p
rop
ert
y a
nd
exc
lud
e t
axe
s.
Exc
han
ge r
ates
use
d M
arc
h 2
022.
ST
UD
IOO
NE
BE
DR
OO
MT
WO
BE
DR
OO
M
20
19/2
0
rate
20
21/
22
rate
Yo
Y
vari
an
ce
20
19/2
0
rate
20
21/
22
rate
Yo
Y
vari
an
ce
20
19/2
0
rate
20
21/
22
rate
Yo
Y
vari
an
ce
Lo
cal
cu
rre
ncy
Lo
cal
cu
rre
ncy
US
$E
uro
%L
ocal
cu
rre
ncy
Lo
cal
cu
rre
ncy
US
$E
uro
%L
ocal
cu
rre
ncy
Lo
cal
cu
rre
ncy
US
$E
uro
EU
RO
PE
CO
NT...
Lo
nd
on
(G
BP
)
1-6
nig
hts
(n
igh
tly r
ate
)G
BP
175
GB
P 1
50
US
D 2
03
EU
R 1
79
-14
%G
BP
24
0G
BP
19
0U
SD
257
EU
R 4
,226
-21%
GB
P 2
85
GB
P 2
65
US
D 3
59
EU
R 3
15-7
%
7 n
igh
ts +
(w
ee
kly
rate
)G
BP
1,2
00
GB
P 1
,10
0U
SD
1,4
90
EU
R 1
,30
9-8
%G
BP
1,6
20
GB
P 1
,48
0U
SD
2,0
05
EU
R 1
,76
1-9
%G
BP
1,9
00
GB
P 1
,86
5U
SD
2,5
27
EU
R 2
,220
-2%
On
e m
on
th +
(m
on
thly
rate
)G
BP
4,15
0G
BP
3,9
25
US
D 5
,318
EU
R 4
,67
1-5
%G
BP
5,5
00
GB
P 5
,00
0U
SD
6,7
74E
UR
5,9
51
-9%
GB
P 6
,90
0G
BP
6,6
00
US
D 8
,94
2E
UR
7,8
55
-4%
3 m
on
th +
(m
on
thly
rate
)G
BP
3,8
50
GB
P 3
,65
0U
SD
4,9
45
EU
R 4
,34
4-5
%G
BP
5,0
00
GB
P 4
,65
0U
SD
6,3
00
EU
R 5
,53
4-7
%G
BP
6,5
00
GB
P 6
,10
0U
SD
8,2
65
EU
R 7
,26
0-6
%
Mad
rid
(E
UR
)
1-6
nig
hts
(n
igh
tly r
ate
)E
UR
13
0E
UR
13
5U
SD
15
44
%E
UR
20
0E
UR
175
US
D 1
99
-13
%E
UR
210
EU
R 1
95
US
D 2
22
-7%
7 n
igh
ts +
(w
ee
kly
rate
)E
UR
75
0E
UR
76
5U
SD
87
12%
EU
R 1
,20
0E
UR
1,18
0U
SD
1,3
43
-2%
EU
R 1
,35
0E
UR
1,3
00
US
D 1
,48
0-4
%
On
e m
on
th +
(m
on
thly
rate
)E
UR
2,4
00
EU
R 2
,475
US
D 2
,818
3%
EU
R 3
,50
0E
UR
3,3
00
US
D 3
,757
-6%
EU
R 4
,00
0E
UR
3,8
25
US
D 4
,35
5-4
%
3 m
on
th +
(m
on
thly
rate
)E
UR
2,2
50
EU
R 2
,275
US
D 2
,59
01%
EU
R 3
,25
0E
UR
3,0
00
US
D 3
,416
-8%
EU
R 3
,85
0E
UR
3,6
80
US
D 4
,18
9-4
%
Mo
sco
w (
RU
B)
1-6
nig
hts
(n
igh
tly r
ate
)R
UB
6,4
50
RU
B 5
,50
0U
SD
73
EU
R 6
4-1
5%
RU
B 6
,80
0R
UB
6,0
00
US
D 8
0E
UR
70
-12%
RU
B 9
,00
0R
UB
8,10
0U
SD
10
8E
UR
95
-10
%
7 n
igh
ts +
(w
ee
kly
rate
)R
UB
3
4,0
00
RU
B
32,4
00
US
D 4
32
EU
R 3
79
-5%
RU
B
34
,50
0R
UB
3
3,9
00
US
D 4
52
EU
R 3
97
-2%
RU
B
50
,20
0R
UB
4
8,0
00
US
D 6
40
EU
R 5
62
-4%
On
e m
on
th +
(m
on
thly
rate
)R
UB
11
8,5
00
RU
B
116
,50
0U
SD
1,5
53
EU
R 1
,36
4-2
%R
UB
12
1,75
0R
UB
12
0,2
00
US
D 1
,60
2E
UR
1,4
07
-1%
RU
B
171,
50
0R
UB
16
5,0
00
US
D 2
,19
9E
UR
1,9
31
-4%
3 m
on
th +
(m
on
thly
rate
)R
UB
11
7,20
0R
UB
11
5,0
00
US
D 1
,53
3E
UR
1,3
46
-2%
RU
B
119
,00
0R
UB
11
7,0
00
US
D 1
,55
9E
UR
1,3
69
-2%
RU
B
167,
50
0R
UB
16
2,0
00
US
D 2
,15
8E
UR
1,8
96
-3%
Pari
s (E
UR
)
1-6
nig
hts
(n
igh
tly r
ate
)E
UR
210
EU
R 1
75
US
D 1
99
-17%
EU
R 3
00
EU
R 2
35
US
D 2
68
-22%
EU
R 4
35
EU
R 4
10U
SD
46
7-6
%
7 n
igh
ts +
(w
ee
kly
rate
)E
UR
1,2
90
EU
R 1
,20
0U
SD
1,3
66
-7%
EU
R 1
,90
0E
UR
1,5
80
US
D 1
,79
9-1
7%
EU
R 2
,85
0E
UR
2,7
75
US
D 3
,15
9-3
%
On
e m
on
th +
(m
on
thly
rate
)E
UR
3,8
50
EU
R 3
,60
0U
SD
4,0
99
-6%
EU
R 6
,25
0E
UR
5,7
50
US
D 6
,54
7-8
%E
UR
9,6
00
EU
R 9
,00
0U
SD
10
,24
6-6
%
3 m
on
th +
(m
on
thly
rate
)E
UR
3,6
75
EU
R 3
,40
0U
SD
3,8
71
-7%
EU
R 5
,85
0E
UR
5,3
25
US
D 6
,06
3-9
%E
UR
8,5
00
EU
R 8
,20
0U
SD
9,3
35
-4%
Fig
.54
R
ate
s co
mp
ari
son
Eu
rop
e –
20
19/2
0 v
s 2
02
1/2
2
RA
TE
S I
N K
EY
CIT
IES
Th
ese
rat
es
are
ave
rag
e r
ates
an
d
may
vary
per
loca
tio
n, t
ime o
f ye
ar,
reg
ion
al p
rom
oti
on
s an
d s
peci
fic
len
gth
s o
f st
ay. R
ates
qu
ote
d a
re
base
d o
n a
n a
vera
ge 4
sta
r ex
ten
ded
st
ay p
rop
ert
y a
nd
exc
lud
e t
axe
s.
Exc
han
ge r
ates
use
d M
arc
h 2
022.
ST
UD
IOO
NE
BE
DR
OO
MT
WO
BE
DR
OO
M
20
19/2
0
rate
20
21/
22
rate
Yo
Y
vari
an
ce
20
19/2
0
rate
20
21/
22
rate
Yo
Y
vari
an
ce
20
19/2
0
rate
20
21/
22
rate
Yo
Y
vari
an
ce
Lo
cal
cu
rre
ncy
Lo
cal
cu
rre
ncy
US
$E
uro
%L
ocal
cu
rre
ncy
Lo
cal
cu
rre
ncy
US
$E
uro
%L
ocal
cu
rre
ncy
Lo
cal
cu
rre
ncy
US
$E
uro
EU
RO
PE
Am
ste
rdam
(E
UR
)
1-6
nig
hts
(n
igh
tly r
ate
)E
UR
18
0E
UR
15
0U
SD
17
1-1
7%
EU
R 2
30
EU
R 1
95
US
D 2
22
-15
%E
UR
28
0E
UR
220
US
D 2
51
-21%
7 n
igh
ts +
(w
ee
kly
rate
)E
UR
975
EU
R 9
25
US
D 1
,05
4-5
%E
UR
1,4
20
EU
R 1
,220
US
D 1
,38
9-1
4%
EU
R 1
,70
0E
UR
1,2
85
US
D 1
,46
3-2
4%
On
e m
on
th +
(m
on
thly
rate
)E
UR
3,7
00
EU
R 3
,575
US
D 4
,072
-3%
EU
R 5
,20
0E
UR
4,15
0U
SD
4,7
25
-20
%E
UR
5,7
75
EU
R 4
,275
US
D 4
,86
8-2
6%
3 m
on
th +
(m
on
thly
rate
)E
UR
3,3
00
EU
R 3
,210
US
D 3
,65
6-3
%E
UR
4,8
95
EU
R 3
,75
0U
SD
4,2
70
-23
%E
UR
5,5
25
EU
R 3
,90
0U
SD
4,4
41
-29
%
Bru
sse
ls (
EU
R)
1-6
nig
hts
(n
igh
tly r
ate
)E
UR
16
0E
UR
13
0U
SD
14
8-1
9%
EU
R 2
30
EU
R 1
60
US
D 1
82
-30
%E
UR
275
EU
R 2
00
US
D 2
28
-27%
7 n
igh
ts +
(w
ee
kly
rate
)E
UR
83
5E
UR
80
0U
SD
911
-4%
EU
R 1
,28
0E
UR
1,120
US
D 1
,275
-13
%E
UR
1,4
50
EU
R 1
,310
US
D 1
,49
2-1
0%
On
e m
on
th +
(m
on
thly
rate
)E
UR
3,5
00
EU
R 3
,20
0U
SD
3,6
45
-9%
EU
R 4
,35
0E
UR
4,0
00
US
D 4
,55
4-8
%E
UR
6,0
00
EU
R 5
,00
0U
SD
5,6
93
-17%
3 m
on
th +
(m
on
thly
rate
)E
UR
3,2
80
EU
R 3
,00
0U
SD
3,4
17-9
%E
UR
4,2
00
EU
R 3
,90
0U
SD
4,4
41
-7%
EU
R 5
,75
0E
UR
4,7
00
US
D 5
,35
1-1
8%
Fra
nkfu
rt (
EU
R)
1-6
nig
hts
(n
igh
tly r
ate
)E
UR
13
5E
UR
120
US
D 1
14-1
1%E
UR
20
0E
UR
16
0U
SD
15
9-2
0%
EU
R 2
45
EU
R 2
45
US
D 2
79
0%
7 n
igh
ts +
(w
ee
kly
rate
)E
UR
88
0E
UR
80
0U
SD
774
-9%
EU
R 1
,20
0E
UR
975
US
D 1
,08
2-1
9%
EU
R 1
,520
EU
R 1
,520
US
D 1
,73
10
%
On
e m
on
th +
(m
on
thly
rate
)E
UR
3,6
20
EU
R 3
,25
0U
SD
3,7
02
-10
%E
UR
4,5
00
EU
R 4
,10
0U
SD
4,6
68
-9%
EU
R 5
,45
0E
UR
5,4
50
US
D 6
,20
50
%
3 m
on
th +
(m
on
thly
rate
)E
UR
3,3
00
EU
R 3
,00
0U
SD
3,4
17-9
%E
UR
4,2
00
EU
R 3
,80
0U
SD
4,3
27
-10
%E
UR
5,15
0E
UR
5,15
0U
SD
5,8
63
0%
Lis
bo
n (
EU
R)
1-6
nig
hts
(n
igh
tly r
ate
)E
UR
125
EU
R 1
00
US
D 1
08
-20
%E
UR
18
5E
UR
15
0U
SD
14
2-1
9%
EU
R 2
35
EU
R 1
95
US
D 1
94
-17%
7 n
igh
ts +
(w
ee
kly
rate
)E
UR
75
0E
UR
65
0U
SD
74
0-1
3%
EU
R 1
,19
0E
UR
1,0
00
US
D 1
,13
9-1
6%
EU
R 1
,29
5E
UR
1,10
0U
SD
1,2
52
-15
%
On
e m
on
th +
(m
on
thly
rate
)E
UR
2,7
00
EU
R 2
,50
0U
SD
2,8
47
-7%
EU
R 4
,00
0E
UR
3,6
50
US
D 4
,15
6-9
%E
UR
4,5
90
EU
R 4
,20
0U
SD
4,7
82
-8%
3 m
on
th +
(m
on
thly
rate
)E
UR
2,4
00
EU
R 2
,30
0U
SD
2,6
19-4
%E
UR
3,6
50
EU
R 3
,30
0U
SD
3,7
57
-10
%E
UR
4,4
50
EU
R 4
,00
0U
SD
4,5
54
-10
%

108
Regional report - LATAM
By Ben Subedar, AptsColombia
When AptsColombia started in 2008, there wasn’t
any dedicated corporate housing supply across
the region. There was a smattering of hotels with
suites or kitchens in them, furnished rental villas
in the countryside and housing reconditioned
from traditional rentals. There certainly wasn’t any
real supply in urban destinations, particularly in
Colombia.
In recent years, thanks to Airbnb and the
OTAs, we’ve seen more furnished apartments,
aparthotels and operators taking on units in
multifamily properties and decorating and
furnishing them as corporate or short-stay
apartments.
LATAM has gone quickly from having little supply
to stock that is short stay orientated. Corporate
housing supply has only started to come on
stream in the last two or three years.
Demand drivers Most of the demand is coming out of the
multinationals which are mainly based in the
States and Canada. There’s not a lot coming
from Europe or Asia. Our key clients are the big
consultancy firms, FMCG, tech and telecoms.
Oil and gas are a natural fit because those
resources are to be found across Latin America.
They tend to be based in the field, close to where
the refineries and wells are, but they still need
specific housing out in the countryside or in camp.
Demand is also being driven by bank mergers and
multinational retailers starting to open too.
Corporate housing is a barometer of growth
because we deal with companies trying to
establish themselves, so we’re involved at an early
stage of the growth cycle. Overseas companies
need help because it’s different from relocating to
California. Coming south of the border presents
several different challenges, not least
the language.
Corporations love the fact that true corporate
housing is not just aparthotels. Corporations
are now more receptive to corporate housing
because it is low contact, low traffic, sustainable
and self-provisioning. They tend to be bigger
than anything, you’d get in a purpose-built hotel,
so there’s more space for a home office or home
school.
Our clients are choosing units with three or more
bedrooms, fully equipped kitchens rather than
kitchenettes and private outdoor space wherever
they can.
Pre-pandemic, the construction pipeline focussed
on fitting the most residents into the smallest
space, so there were a lot of lofts or studio
conversions with mezzanine floors. The downside
was that many assignees were uncomfortable with
shared spaces, sleeping, doing their laundry, or
cooking in the same spaces. The downside is that
now, if a client wants the big units, they’re going
to have to pay for it.
Key markets
We operate in over 30 countries, from Mexico
all the way down to Patagonia and Argentina
through the Caribbean and Central America.
There are big differences between these markets,
from Mexico, Brazil, and Argentina with the
infrastructure to support serviced apartments,
hotels, and corporate housing, to smaller markets
like the Caribbean islands where supply is short
even if demand isn’t.
In Brazil, much of business travel was domestic
even before the pandemic. Despite being the
“The US is our #1 source market, followed by Western Europe. Argentina, and Brazil get some business from China, but it’s way from being a major source market. Intra-LATAM business is growing as companies expand their footprints. In terms of source industries, it’s a mix of oil, gas, and tech.” Parker Stanberry, Oasis

10995. https://www.hotelmanagement.net/development/le-latin-american-hotel-construction-pipeline-down-11-yoy
AC Hotels, Lima
largest economy in Latin America, and becoming
a travel tech hub, a large majority of the country’s
businesses are small-to-medium-sized companies,
rather than corporations. Many of these Brazilian
companies have already begun travelling on
business again post-pandemic.
In both Mexico and Brazil, we don’t see as much
of the Monday-through-Thursday travel, but we
are seeing longer, extended stays that are either
pure business or a mix of business and leisure in a
remote working setup. It’s not surprising then that
serviced apartment occupancy in both countries
averages above 90%.
In 2021 we had a lot of demand for tourism
destinations like Costa Rica, Ecuador, and Puerto
Rico. Corporate enquiries are also coming in for
outlying areas like Suriname, El Salvador, and the
Dominican Republic.
The countries closest to the US have a definite
advantage because the language barrier is not so
significant. In contrast, traditional markets
like Argentina, Chile, Peru, and Panama fell away
during the pandemic.
We are also seeing greater demand for secondary
and tertiary cities. In Mexico, 40% of our demand
is for outside Mexico City. Brazil is similar, where
São Paulo only makes up half of our business and
Rio 25%.
Whilst Rio, São Paulo and Mexico City remain
stable markets, other traditional markets like
Buenos Aires and Lima have seen demand fall
over the last couple of years as business travel
has fallen victim to the collapse of business travel.
Following the (allegedly) rigged election in 2018,
Venezuela is a pariah in the region. Formerly the
hub for the north of South America, multinationals
like Unilever and General Motors have moved to
other hubs to service that region.
Construction pipelineAccording to the Lodging Econometrics 2021
year-end Construction Pipeline Trend Report
for Latin America, the total hotel construction
pipeline at the end of 2021 stood at 563 hotels
and 101,523 rooms, an 11% decline year-on-year.95
Construction is centred on five countries;
Mexico with 207 hotels and 38,671 rooms. Brazil
- historically the largest construction pipeline
in the region - with 97 hotels and 15,901 rooms
(both record lows); Peru, with 32 hotels and 3,903
rooms, the Dominican Republic with 21 hotels
and 4,874 rooms, and Columbia with 19 hotels
and 2,913 rooms. Collectively, these five countries
account for 67% of projects and 65% of rooms in
the region’s total pipeline.
Hotel franchise companies with the largest
construction pipelines in Latin America are
Marriott International with 103 hotels and 16,200
rooms, Hilton with 102 hotels and 15,716 rooms,
Accor with 81 hotels and 10,281 rooms, IHG with
58 hotels and 6,686 rooms and Hyatt Hotels with
33 hotels and 8,192 rooms. These five companies
account for 67 percent of the projects in the total
construction pipeline at Q4 2021 and are forecast
to see the highest number of new hotel openings
in 2022 and 2023.

110
ColumbiaOver the last ten years there has been a significant boom in construction in the principal cities of the country including Bogotá, Medellin, Cali, Santa Marta, Cartagena, and Barranquilla, converting low rise residential houses to higher density multi-family residential buildings. The result has increased the supply of modern residential apartments in low- or high-rise buildings in urban and suburban safe locations near to business centres and retail / entertainment areas.
Larger more modern apartment buildings built within the last 10 years sometimes provide communal amenities such as gymnasiums, roof terraces with BBQs and even home theatre rooms. In cities with hotter climates, swimming pools and steam rooms may be available. However business centre facilities are not often to be found in apartment blocks. Colombia has a buoyant apartment market both for long and short stay furnished and unfurnished, which means that overseas executives can find what they are looking for in terms of location, style, and budget without having to sacrifice a great deal.
Fig.55 Colombia - Year on Year growth of Accommodations
Source: Euromonitor International, Travel 2022 edition.
200%
150%
100%
50%
0%
-50%
2011 2012 2013 2014 2015 2016 2017 2018 2019
Aparthotel Hotel Furnished Housing
Key trendsLike our colleagues in other global regions, stays
are getting longer so we are seeing more demand
for two or three bed apartments with better
kitchens and laundry facilities that enable remote
working and home schooling.
We are placing clients outside of downtown
hotspots so guests can stay closer to their
worksites and reduce travel time on public
transport. Secondary and tertiary cities are in
demand across the region.
Business is returning quickly post-Covid. To
stabilize the region, in 2021 the international
community and national governments in each Latin
American country announced a broad range of
social and economic support measures, including
easing bureaucratic labour laws, providing
emergency stimulus checks to the unemployed,
and shoring up local governments and businesses
with credit lines and emergency aid.
From a supply perspective, rates are rising due
to reduced inventory caused by a reduction in
capital investment in construction for long term
supply; repurposing of units to traditional rentals;
operators going out of business and, of course,
a recovery of the leisure market before the
corporate.
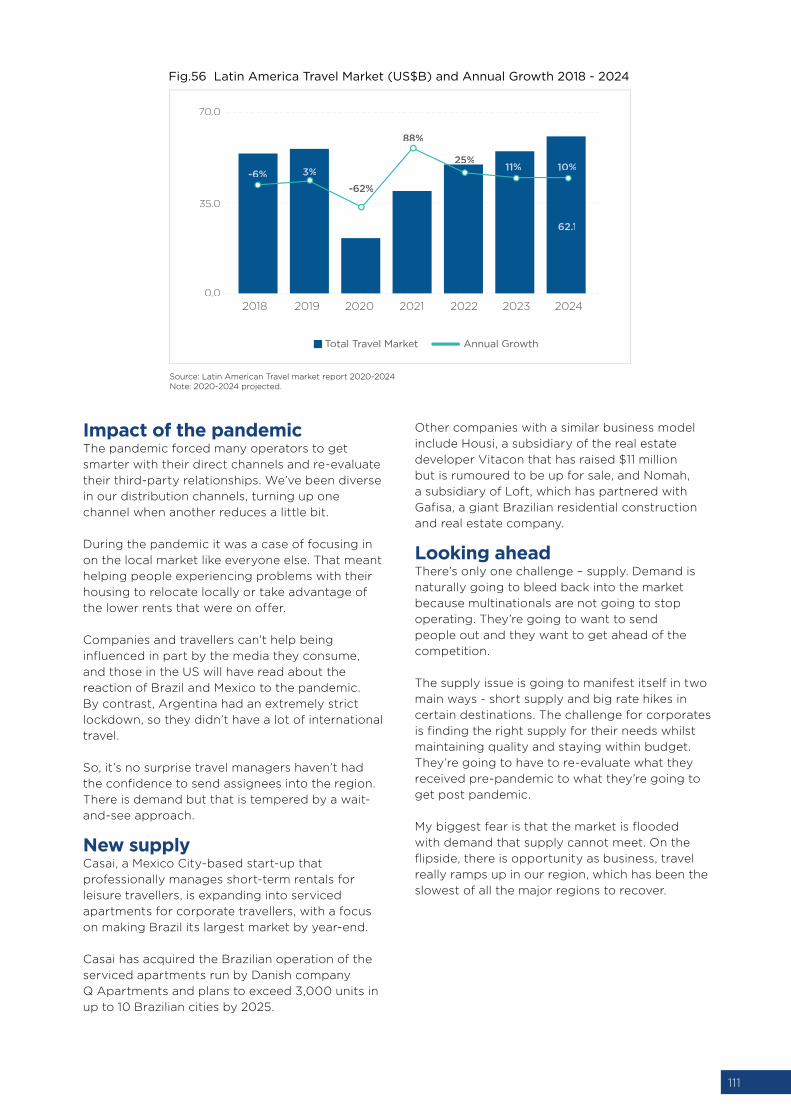
111
Impact of the pandemic The pandemic forced many operators to get
smarter with their direct channels and re-evaluate
their third-party relationships. We’ve been diverse
in our distribution channels, turning up one
channel when another reduces a little bit.
During the pandemic it was a case of focusing in
on the local market like everyone else. That meant
helping people experiencing problems with their
housing to relocate locally or take advantage of
the lower rents that were on offer.
Companies and travellers can’t help being
influenced in part by the media they consume,
and those in the US will have read about the
reaction of Brazil and Mexico to the pandemic.
By contrast, Argentina had an extremely strict
lockdown, so they didn’t have a lot of international
travel.
So, it’s no surprise travel managers haven’t had
the confidence to send assignees into the region.
There is demand but that is tempered by a wait-
and-see approach.
New supplyCasai, a Mexico City-based start-up that
professionally manages short-term rentals for
leisure travellers, is expanding into serviced
apartments for corporate travellers, with a focus
on making Brazil its largest market by year-end.
Casai has acquired the Brazilian operation of the
serviced apartments run by Danish company
Q Apartments and plans to exceed 3,000 units in
up to 10 Brazilian cities by 2025.
Other companies with a similar business model
include Housi, a subsidiary of the real estate
developer Vitacon that has raised $11 million
but is rumoured to be up for sale, and Nomah,
a subsidiary of Loft, which has partnered with
Gafisa, a giant Brazilian residential construction
and real estate company.
Looking ahead There’s only one challenge – supply. Demand is
naturally going to bleed back into the market
because multinationals are not going to stop
operating. They’re going to want to send
people out and they want to get ahead of the
competition.
The supply issue is going to manifest itself in two
main ways - short supply and big rate hikes in
certain destinations. The challenge for corporates
is finding the right supply for their needs whilst
maintaining quality and staying within budget.
They’re going to have to re-evaluate what they
received pre-pandemic to what they’re going to
get post pandemic.
My biggest fear is that the market is flooded
with demand that supply cannot meet. On the
flipside, there is opportunity as business, travel
really ramps up in our region, which has been the
slowest of all the major regions to recover.
Fig.56 Latin America Travel Market (US$B) and Annual Growth 2018 - 2024
Source: Latin American Travel market report 2020-2024Note: 2020-2024 projected.
70.0
35.0
0.0
2018 2019 2020 2021 2022 2023 2024
Total Travel Market Annual Growth
-6% 3%
-62%
88%
25%11% 10%
62.1

112
“The industry is so fragmented; I’m surprised there hasn’t been more consolidation and think there will be soon. The folks that went out of business in the pandemic were driven by Master Lease exposure. As things recover, some will be drawn back to that model because of the returns but it is also elevated risk and even more risky now.” “People are traveling for longer periods, want to combine a work trip with some fun experiences and have the flexibility to travel with family and friends. Even if it’s for work, they want a product that is more residential and home-like. There’s a ton of opportunity there and whilst seeing traditional residential developers embrace that creates competition for corporate housing operators, from a consumer perspective it’s a good thing.”
Parker Stanberry, Oasis
Q Apartments, Brazil
Q Apartments, Brazil

113Fig
.57
R
ate
s co
mp
ari
son
LA
TA
M 2
019
/20
vs.
20
21/
22
RA
TE
S I
N K
EY
CIT
IES
Th
ese
rat
es
are
ave
rag
e r
ates
an
d
may
vary
per
loca
tio
n, t
ime o
f ye
ar,
reg
ion
al p
rom
oti
on
s an
d s
peci
fic
len
gth
s o
f st
ay. R
ates
qu
ote
d
are
base
d o
n a
n a
vera
ge 4
sta
r ex
ten
ded
sta
y p
rop
ert
y a
nd
exc
lud
e
taxe
s. E
xch
an
ge r
ates
use
d M
arc
h
20
22.
ST
UD
IOO
NE
BE
DR
OO
MT
WO
BE
DR
OO
M
20
19/2
0
rate
20
21/
22
rate
Yo
Y
vari
an
ce
20
19/2
0
rate
20
21/
22
rate
Yo
Y
vari
an
ce
20
19/2
0
rate
20
21/
22
rate
Yo
Y
vari
an
ce
Lo
cal
cu
rre
ncy
Lo
cal
cu
rre
ncy
US
$E
uro
%L
ocal
cu
rre
ncy
Lo
cal
cu
rre
ncy
US
$E
uro
%L
ocal
cu
rre
ncy
Lo
cal
cu
rre
ncy
US
$E
uro
%
SO
UT
H A
ME
RIC
A
Bu
en
os
Air
es
(AR
S)
1-6
nig
hts
(n
igh
tly r
ate
)A
RS
2,8
59
AR
S 2
,75
0U
SD
27
EU
R 2
5-4
%A
RS
3,5
00
AR
S 3
,20
0U
SD
30
EU
R 2
7-9
%A
RS
4,0
00
AR
S 3
,70
0U
SD
35
EU
R 3
1-8
%
7 n
igh
ts +
(w
ee
kly
rate
)A
RS
19
,06
2A
RS
18
,20
0U
SD
18
0E
UR
16
2-5
%A
RS
22,0
00
AR
S
20
,00
0U
SD
18
9E
UR
16
6-9
%A
RS
23
,50
0A
RS
22,8
00
US
D 2
15E
UR
18
9-3
%
On
e m
on
th +
(m
on
thly
rate
)A
RS
8
2,6
03
AR
S
80
,00
0U
SD
78
0E
UR
70
1-3
%A
RS
83
,10
0A
RS
81,0
00
US
D 7
65
EU
R 6
71
-3%
AR
S
85
,00
0A
RS
84
,10
0U
SD
79
4E
UR
69
7-1
%
3 m
on
th +
(m
on
thly
rate
)A
RS
8
0,4
85
AR
S
79
,20
0U
SD
76
0E
UR
68
3-2
%A
RS
81,
20
0A
RS
8
0,0
00
US
D 7
55
EU
R 6
63
-1%
AR
S
82,5
00
AR
S
80
,00
0U
SD
75
5E
UR
66
3-3
%
Rio
de
Jan
eir
o (
BR
L)
1-6
nig
hts
(n
igh
tly r
ate
)B
RL
25
5B
RL
28
0U
SD
57
EU
R 5
110
%B
RL
325
BR
L 3
20
US
D 6
1E
UR
54
-2%
BR
L 4
00
BR
L 3
95
US
D 7
5E
UR
67
-1%
7 n
igh
ts +
(w
ee
kly
rate
)B
RL
1,3
00
BR
L 1
,34
0U
SD
25
5E
UR
227
3%
BR
L 1
,95
0B
RL
1,8
75
US
D 3
56
EU
R 3
18-4
%B
RL
2,2
50
BR
L 2
,125
US
D 4
04
EU
R 3
60
-6%
On
e m
on
th +
(m
on
thly
rate
)B
RL
4,5
00
BR
L 4
,49
0U
SD
85
3E
UR
76
10
%B
RL
5,9
00
BR
L 5
,20
0U
SD
912
EU
R 8
13-1
2%
BR
L 7
,40
0B
RL
7,0
00
US
D 1
,33
0E
UR
1,18
6-5
%
3 m
on
th +
(m
on
thly
rate
)B
RL
4,0
00
BR
L 4
,125
US
D 7
84
EU
R 6
99
3%
BR
L 5
,20
0B
RL
4,8
00
US
D 9
12E
UR
813
-8%
BR
L 6
,79
0B
RL
6,0
00
US
D 1
,14
0E
UR
1,0
17-1
2%
Sao
Pau
lo (
BR
L)
1-6
nig
hts
(n
igh
tly r
ate
)B
RL
28
0B
RL
325
US
D 6
7E
UR
59
16%
BR
L 3
85
BR
L 4
00
US
D 7
6E
UR
68
4%
BR
L 4
85
BR
L 4
50
US
D 8
6E
UR
76
-7%
7 n
igh
ts +
(w
ee
kly
rate
)B
RL
1,6
00
BR
L 1
,68
0U
SD
319
EU
R 2
85
5%
BR
L 2
,30
0B
RL
2,5
00
US
D 4
75
EU
R 4
24
9%
BR
L 3
,00
0B
RL
2,9
00
US
D 5
51
EU
R 4
92
-3%
On
e m
on
th +
(m
on
thly
rate
)B
RL
5,3
00
BR
L 5
,80
0U
SD
1,10
2E
UR
98
39
%B
RL
6,9
50
BR
L 7
,00
0U
SD
1,3
31
EU
R 1
,18
61%
BR
L 9
,225
BR
L 9
,00
0U
SD
1,7
11E
UR
1,5
26
-2%
3 m
on
th +
(m
on
thly
rate
)B
RL
4,9
00
BR
L 5
,30
0U
SD
1,0
08
EU
R 8
98
8%
BR
L 6
,20
0B
RL
6,5
00
US
D 1
,23
6E
UR
1,10
15
%B
RL
8,9
10B
RL
8,7
00
US
D 1
,65
4E
UR
1,4
75
-2%

114
Regional report - Middle East
By Martin Kubler, The Concierge
Just like most other markets around the world,
the serviced apartment industry in the six Gulf
Cooperation Council (GCC) countries, took a big
Covid hit in 2020 and early 2021, which put paid
to the ambitious growth plans of emirates like
Dubai and countries like Saudi Arabia.
For all the upheaval the pandemic caused in the
Gulf countries, they were also mostly among the
first to implement thorough vaccination strategies
and recovery strategies and rolled out Covid
vaccinations quickly and aggressively.
Consequently, most GCC countries saw life
return to relative normalcy earlier than many
other regions and resumed their earlier growth
strategies. Dubai had the postponed EXPO
2020 as a major recovery driver, while the
ongoing opening of Saudi Arabia’s tourism
market provided opportunities for the further
development of serviced apartments.
The following is an overview of the GCC
serviced apartment sector, focussing on market
segmentation, key supply characteristics,
performance, and the sector’s outlook in the
GCC market.
Market SegmentationTraditionally, demand for serviced apartments
across the GCC was mostly driven by business,
expat, and contractor travellers; segments which
were particularly hard hit by the pandemic.
These segments usually opted for longer stays
and preferred serviced apartments, because of
the reasonable rates, good infrastructure, space,
and overall comfort and convenience.
The exception was Saudi Arabia, where serviced
apartments previously already attracted many
short stay guests because of larger family
groups travelling internally for leisure or religious
purposes or travellers visiting friends and relatives.
The pandemic affected demand for serviced
apartments across the entire region. Travellers
who were unable to travel abroad, started to take
frequent staycations. Many preferred serviced
apartments over hotel accommodation because
the additional space made it easier to follow Covid
protocols, but also offered more privacy and
easier control of cleanliness.
Additionally, rather than dining out in nearby
restaurants or in hotels, where social distancing
rules were in place, serviced apartments offered
travellers the option of preparing their own meals
or ordering in.
Towards the end of pandemic-related restrictions,
key markets like Dubai, Saudi Arabia and Bahrain
saw their economic recoveries gathering speed,
which brought back some of the more traditional
serviced apartment segments, particularly in the
run-up to EXPO and for Saudi Arabia’s sprawling
Red Sea Project.
Existing SupplyPerhaps unsurprisingly, the UAE, particularly
Dubai and Saudi Arabia, and led by Jeddah
and Riyadh, has the most serviced apartments.
However, other countries and regions have seen
an uptick in demand, including the provinces
in Saudi Arabia’s south-western regions, Ras al
Khaimah in the UAE, and certain areas in Oman.
Traditionally seen as better value than hotels,
serviced apartments rates took a tumble in many
of the region’s key markets during the pandemic
and in the immediate aftermath. This was because
residential rental rates were exceptionally low and,
in cities like Dubai, Abu Dhabi, or Muscat, there
was an oversupply of residential properties.
The opening of EXPO 2020 saw residential rental
rates rise towards the end of 2021, which also had
positive effects on serviced apartment rates in
Dubai. While in other parts of the GCC pent-up
travel demand led to more travellers making use
of serviced apartments once travel restrictions
eased.
Over the past few years, the region has seen
a considerable increase in branded serviced
apartments operators, which continues at pace,
but this should not distract from the fact that
a very sizeable number of serviced apartments
in key destinations across the GCC remain

115
unbranded, instead carrying minor local brands,
and/or independently operated.
These apartments usually offer slightly lower rates
than their internationally flagged competitors,
which overall benefits the market, because unlike
the hotel landscape in major GCC cities, the
serviced apartment landscape was much slower
to adjust to the increased demand for affordable/
budget offerings. We have yet to see, for example,
the emergence of a budget, lifestyle-centric,
serviced apartment brand that mirrors popular
budget hotel brands like Rove Hotels.
Pandemic impact
“Many of our serviced apartments performed better than hotels include the Radisson BLUs in Dubai Marina and in Riyadh’s Diplomatic quarter. None of our serviced apartments lost money or closed for business over the course of the pandemic. Serviced apartments remain at the heart of our expansion drive, not only in the Middle East but across EMEA.” Elie Milky, the Radisson Group’s VP of Business Development for the Middle East
Covid has been a game changer for the global
hospitality industry, but serviced apartments
have emerged from the pandemic as one of the
winners, because they offer travellers safety,
cleanliness, privacy, and the ability to work and
live in comfort regardless of where their travels
take them.
Many of our customers haven’t travelled for a fair
while and now that markets are slowly opening
up again, we’re noticing considerable demand
for top-end service apartments, which also offer
traditional luxury hotel amenities. Guests feel they
deserve to splurge, yet also want to make sure
they have the privacy and space they got used to
during the pandemic.
Travellers had to choose between luxury hotels,
with the luxury amenities required to make a stay
special, and serviced apartments, which offered
the space and convenience, but often weren’t so
luxurious.
We’re now seeing guests asking for a combination
of both these stay options and requesting
for serviced apartments that are spacious,
convenient, but also let them add luxury hotel-
style services to customize their experience.
Radisson BLU, Riyadh Diplomatic quarter

116
Serviced apartment pipelineAlthough the pandemic-induced downturn did
temporarily slow down the traditionally highly
active serviced apartment pipeline across the
GCC region, things started to change half-way
through 2021 and, based on the current pipeline of
hotel and serviced apartment project completions
in the GCC, an estimated 75,900 rooms are
forecast to be added across the region in the
period 2021-24.
The planned openings are mainly located in Saudi
Arabia, Qatar, and the UAE, including phases five
and six at Jabal Omar, Makkah; the Jewel of the
Creek development in Dubai; and Qetaifan Island
North in Qatar, but also the ‘giga projects’ in Saudi
Arabia led by the Red Sea Project, Neom, Amaala,
Diriyah Gate and Al-Ula, to name but a few. The
figures also include a mega-project planned for
Oman, the Yenkit Hills development.
Sonder is expanding its presence in the Middle
East by adding two additional buildings to its
growing portfolio in Dubai, United Arab Emirates.
Through an agreement with Al Fattan Properties
LLC, Sonder will manage and operate two of
the three Al Fattan Towers in Downtown, with
views on Burj Khalifa, to be operated as Sonder
Downtown Towers.
Sonder is also exploring additional expansion into
the Palm Jumeirah, Dubai Marina, La Mer, City
Walk and DIFC areas of Dubai.96
Ascott opened the 81-unit Citadines Culture
Village Dubai, its third property in the emirate, in
2021, close to Dubai International Airport.97 The
company is also adding 461 units in Saudi Arabia,
including the waterfront district of Al Khobar, with
the opening of Citadines Al Aziziyah Al Khobar
and Somerset Downtown Al Khobar. In Oman,
Citadines Al Ghubrah Muscat will offer 96 units in
the heart of Muscat’s central business district.
Vacation RentalsThe pandemic-induced changes to travel patterns
and booking behaviours further closed the
gap between “vacation rentals” and “serviced
apartments” for many consumers. Many countries
in the GCC have introduced more flexible
residency and visa options, including special
schemes aimed at remote workers and digital
Nomad Temporary Housings, and apartments are,
of course, a popular choice with such guests.
The new breed of guest is often considerably
younger than the traditional serviced apartment
user and has likely grown up with “on demand”
services like Netflix, Doordash, and Airbnb. The
easy online booking experience coupled with
the substantial number of, often, quite different
properties draw many travellers to Airbnb and
similar services.
One of the main drawbacks of using vacation
rentals or holiday homes so far, not just in the
GCC, has been the lack of standards, varying
consistency, and the inability to get “hotel-like
services” like fine dining and recreation amenities.
Companies have identified this gap and are filling
it by adding hotel-style amenities and services to
their vacation rental or serviced apartments stay.
The increase in staycations meant that GCC
residents started to explore their own backyards
more, e.g. the more remote provinces in Saudi
Arabia, Hatta, or Ras al Khaimah in the UAE, or
off the beaten track locations in the mountains
of Oman - often few hotels or branded serviced
apartments existed in such locations, but
landlords were quick to catch on and added
properties to Airbnb or other vacation rental
platforms. On that account, such platforms can
be seen as an indicator of rising demand and
emerging destinations.
96. https://servicedapartmentnews.com/news/industry-news/sonder-to-expand-middle-east-presence/97. https://servicedapartmentnews.com/news/industry-news/ascott-to-add-6-000-units-in-mea-by-2025/
Doha

117
OutlookSeveral large events (e.g. the 2022 FIFA World
Cup in Qatar, but also F1 in Saudi Arabia and the
UAE) and mega projects (e.g. Red Sea Project
in KSA, Lusail City in Qatar) are likely to see
increasing demand for serviced apartments in
the main GCC markets.
Changing travel habits should benefit serviced
apartments in the region overall and make them
more sought after by leisure travellers, but also
by remote workers and digital Nomad Temporary
Housings, which may be attracted by the new
residency and visa options introduced by several
GCC countries.
It is likely that serviced apartments in the region
will continue to become “less corporate” and more
“lifestyle” and that we will see the emergence of
new-style medium and long stay options that take
the best from popular lifestyle hotel chains like
Rove Hotels and combine them with the best of
serviced apartment living.
Additionally, the new breed of serviced apartment
users will be looking for additional facilities and
services to bring more hotel-style comfort to their
serviced apartment experience, which could see
an increase in mixed use developments like, say,
the Levatio Hotel in Muscat, Oman, which offers
a hotel tower, a separate serviced apartments
tower, shared leisure and dining facilities, and a
direct connection to a shopping mall.
Similarly, the One&Only One Za’abeel is due
to launch in Dubai in Q2 2022, combining a
One&Only branded hotel, luxury residences,
serviced apartments, offices, and retail space.
If the past two years have taught us anything, of
course, it is that the travel and hospitality sectors
can be disrupted at short notice and that recovery
is often not a straight line, but somewhat of an up
and down.
Still, even if travel globally takes longer to
recover than anticipated, the serviced apartment
sector in the GCC countries seems to be on
an upward trajectory, because of the region’s
overall successful pandemic recovery strategies,
continued economic and societal opening, and
a renewed push to grow the non-oil sectors and
activities.
Levatio Hotel, Muscat

118 Fig
. 5
8
Rate
s co
mp
ari
son
Mid
dle
East
20
19/2
0 v
s. 2
02
1/2
2
RA
TE
S I
N K
EY
CIT
IES
Th
ese
rat
es
are
ave
rag
e r
ates
an
d
may
vary
per
loca
tio
n, t
ime o
f ye
ar,
reg
ion
al p
rom
oti
on
s an
d s
peci
fic
len
gth
s o
f st
ay. R
ates
qu
ote
d
are
base
d o
n a
n a
vera
ge 4
sta
r ex
ten
ded
sta
y p
rop
ert
y a
nd
exc
lud
e
taxe
s. E
xch
an
ge r
ates
use
d M
arc
h
20
22.
ST
UD
IOO
NE
BE
DR
OO
MT
WO
BE
DR
OO
M
20
19/2
0
rate
20
21/
22
rate
Yo
Y
vari
an
ce
20
19/2
0
rate
20
21/
22
rate
Yo
Y
vari
an
ce
20
19/2
0
rate
20
21/
22
rate
Yo
Y
vari
an
ce
Lo
cal
cu
rre
ncy
Lo
cal
cu
rre
ncy
US
$E
uro
%L
ocal
cu
rre
ncy
Lo
cal
cu
rre
ncy
US
$E
uro
%L
ocal
cu
rre
ncy
Lo
cal
cu
rre
ncy
US
$E
uro
%
MID
DL
E E
AS
T
Ab
u D
hab
i (A
ED
)
1-6
nig
hts
(n
igh
tly r
ate
)A
ED
58
0A
ED
55
0U
SD
15
0E
UR
13
2-5
%A
ED
80
0A
ED
60
0U
SD
16
3E
UR
14
3-2
5%
AE
D 1
,10
0A
ED
90
0U
SD
24
5E
UR
215
-18
%
7 n
igh
ts +
(w
ee
kly
rate
)A
ED
3,2
00
AE
D 3
,00
0U
SD
817
EU
R 7
17-6
%A
ED
3,8
20
AE
D 3
,50
0U
SD
95
3E
UR
837
-8%
AE
D 6
,00
0A
ED
5,5
00
US
D 1
,49
8E
UR
1,3
15-8
%
On
e m
on
th +
(m
on
thly
rate
)A
ED
10
,00
0A
ED
9,10
0U
SD
3,4
78
EU
R 2
,176
-9%
AE
D 1
5,2
00
AE
D 1
4,7
00
US
D 4
,00
3E
UR
3,5
15-3
%A
ED
25
,10
0A
ED
22,5
00
US
D 6
,127
EU
R 5
,38
0-1
0%
3 m
on
th +
(m
on
thly
rate
)A
ED
9,4
00
AE
D 8
,80
0U
SD
2,3
96
EU
R 2
,10
4-6
%A
ED
14
,10
0A
ED
14
,00
0U
SD
3,8
12E
UR
3,3
48
-1%
AE
D
22,0
00
AE
D
21,0
00
US
D 5
,718
EU
R 5
,021
-5%
Du
bai
(AE
D)
1-6
nig
hts
(n
igh
tly r
ate
)A
ED
64
0A
ED
775
US
D 2
11E
UR
18
521%
AE
D 8
00
AE
D 8
75
US
D 2
38
EU
R 2
09
9%
AE
D 1
,10
0A
ED
1,2
60
US
D 3
43
EU
R 3
01
15%
7 n
igh
ts +
(w
ee
kly
rate
)A
ED
3,6
90
AE
D 4
,00
0U
SD
1,0
89
EU
R 9
56
8%
AE
D 4
,30
0A
ED
4,5
00
US
D 1
,225
EU
R 1
,076
5%
AE
D 6
,90
0A
ED
7,8
00
US
D 2
,124
EU
R 1
,86
513
%
On
e m
on
th +
(m
on
thly
rate
)A
ED
12,8
00
AE
D 1
3,5
00
US
D 3
,676
EU
R 3
,228
5%
AE
D 2
1,8
00
AE
D
22,6
50
US
D 6
,16
7E
UR
5,4
164
%A
ED
25
,10
0A
ED
26
,20
0U
SD
7,13
4E
UR
6,2
65
4%
3 m
on
th +
(m
on
thly
rate
)A
ED
11,10
0A
ED
11,
60
0U
SD
3,15
9E
UR
2,7
745
%A
ED
20
,00
0A
ED
21,0
00
US
D 5
,718
EU
R 5
,022
5%
AE
D 2
3,10
0A
ED
24
,00
0U
SD
6,5
35
EU
R 5
,73
84
%
Do
ha (
QA
R)
1-6
nig
hts
(n
igh
tly r
ate
)Q
AR
720
QA
R 5
00
US
D 1
37
EU
R 1
21
-31%
QA
R 1
,00
0Q
AR
80
0U
SD
220
EU
R 1
93
-20
%Q
AR
1,3
50
QA
R 1
,00
0U
SD
275
EU
R 2
41
-26
%
7 n
igh
ts +
(w
ee
kly
rate
)Q
AR
4,0
00
QA
R 3
,00
0U
SD
824
EU
R 7
24
-25
%Q
AR
6,0
00
QA
R 5
,20
0U
SD
1,4
29
EU
R 1
,25
5-1
3%
QA
R 8
,50
0Q
AR
6,4
00
US
D 1
,75
8E
UR
1,5
44
-25
%
On
e m
on
th +
(m
on
thly
rate
)Q
AR
16
,50
0Q
AR
12
,50
0U
SD
3,4
34
EU
R 3
,016
-24
%Q
AR
25
,00
0Q
AR
21,0
00
US
D 5
,76
9E
UR
5,0
66
-16
%Q
AR
3
1,4
00
QA
R
27,
00
0U
SD
7,4
18E
UR
6,5
14-1
4%
3 m
on
th +
(m
on
thly
rate
)Q
AR
15
,20
0Q
AR
11,0
00
US
D 3
,022
EU
R 2
,65
4-2
8%
QA
R
23
,80
0Q
AR
20
,00
0U
SD
5,4
95
EU
R 4
,825
-16
%Q
AR
27,
90
0Q
AR
23
,50
0U
SD
6,4
56
EU
R 5
,670
-16
%

119
Regional report - USA & Canada
By Mark Skinner, The Highland Group
USAWhen compared with the same price category
of hotels, serviced apartments endured lower
revenue losses in 2020. Economy extended-stay
hotels were the top performing segment in 2020
and they are leading the recovery in 2021.
Mid-price extended-stay hotels are also among
the industry’s best performing segments with
monthly RevPAR exceeding its 2019 nominal
value since July of this year. Largely because of
a relatively high concentration of rooms in urban
markets, upscale extended-stay hotels have not
recovered RevPAR back to 2019, but monthly
performance indices generally increased in 2021
and third quarter 2021 demand reached a
record high.
Q3 2021 was exceptionally good for extended-
stay hotels with 14 new performance records
established. With record highs across many
metrics and declining supply growth, extended-
stay hotels in the USA are highly likely to set new
performance records during the near term.
2020Extended-stay hotels weathered the impact of the
Covid pandemic far better than the overall hotel
industry across all performance metrics. Like the
broader hotel industry, extended-stay hotels have
suffered the greatest revenue losses at higher
price points. However, when compared to hotels
of the same class, extended-stay hotels have
performed much better.
Fig
. 5
8
Rate
s co
mp
ari
son
Mid
dle
East
20
19/2
0 v
s. 2
02
1/2
2
RA
TE
S I
N K
EY
CIT
IES
Th
ese
rat
es
are
ave
rag
e r
ates
an
d
may
vary
per
loca
tio
n, t
ime o
f ye
ar,
reg
ion
al p
rom
oti
on
s an
d s
peci
fic
len
gth
s o
f st
ay. R
ates
qu
ote
d
are
base
d o
n a
n a
vera
ge 4
sta
r ex
ten
ded
sta
y p
rop
ert
y a
nd
exc
lud
e
taxe
s. E
xch
an
ge r
ates
use
d M
arc
h
20
22.
ST
UD
IOO
NE
BE
DR
OO
MT
WO
BE
DR
OO
M
20
19/2
0
rate
20
21/
22
rate
Yo
Y
vari
an
ce
20
19/2
0
rate
20
21/
22
rate
Yo
Y
vari
an
ce
20
19/2
0
rate
20
21/
22
rate
Yo
Y
vari
an
ce
Lo
cal
cu
rre
ncy
Lo
cal
cu
rre
ncy
US
$E
uro
%L
ocal
cu
rre
ncy
Lo
cal
cu
rre
ncy
US
$E
uro
%L
ocal
cu
rre
ncy
Lo
cal
cu
rre
ncy
US
$E
uro
%
MID
DL
E E
AS
T
Ab
u D
hab
i (A
ED
)
1-6
nig
hts
(n
igh
tly r
ate
)A
ED
58
0A
ED
55
0U
SD
15
0E
UR
13
2-5
%A
ED
80
0A
ED
60
0U
SD
16
3E
UR
14
3-2
5%
AE
D 1
,10
0A
ED
90
0U
SD
24
5E
UR
215
-18
%
7 n
igh
ts +
(w
ee
kly
rate
)A
ED
3,2
00
AE
D 3
,00
0U
SD
817
EU
R 7
17-6
%A
ED
3,8
20
AE
D 3
,50
0U
SD
95
3E
UR
837
-8%
AE
D 6
,00
0A
ED
5,5
00
US
D 1
,49
8E
UR
1,3
15-8
%
On
e m
on
th +
(m
on
thly
rate
)A
ED
10
,00
0A
ED
9,10
0U
SD
3,4
78
EU
R 2
,176
-9%
AE
D 1
5,2
00
AE
D 1
4,7
00
US
D 4
,00
3E
UR
3,5
15-3
%A
ED
25
,10
0A
ED
22,5
00
US
D 6
,127
EU
R 5
,38
0-1
0%
3 m
on
th +
(m
on
thly
rate
)A
ED
9,4
00
AE
D 8
,80
0U
SD
2,3
96
EU
R 2
,10
4-6
%A
ED
14
,10
0A
ED
14
,00
0U
SD
3,8
12E
UR
3,3
48
-1%
AE
D
22,0
00
AE
D
21,0
00
US
D 5
,718
EU
R 5
,021
-5%
Du
bai
(AE
D)
1-6
nig
hts
(n
igh
tly r
ate
)A
ED
64
0A
ED
775
US
D 2
11E
UR
18
521%
AE
D 8
00
AE
D 8
75
US
D 2
38
EU
R 2
09
9%
AE
D 1
,10
0A
ED
1,2
60
US
D 3
43
EU
R 3
01
15%
7 n
igh
ts +
(w
ee
kly
rate
)A
ED
3,6
90
AE
D 4
,00
0U
SD
1,0
89
EU
R 9
56
8%
AE
D 4
,30
0A
ED
4,5
00
US
D 1
,225
EU
R 1
,076
5%
AE
D 6
,90
0A
ED
7,8
00
US
D 2
,124
EU
R 1
,86
513
%
On
e m
on
th +
(m
on
thly
rate
)A
ED
12,8
00
AE
D 1
3,5
00
US
D 3
,676
EU
R 3
,228
5%
AE
D 2
1,8
00
AE
D
22,6
50
US
D 6
,16
7E
UR
5,4
164
%A
ED
25
,10
0A
ED
26
,20
0U
SD
7,13
4E
UR
6,2
65
4%
3 m
on
th +
(m
on
thly
rate
)A
ED
11,10
0A
ED
11,
60
0U
SD
3,15
9E
UR
2,7
745
%A
ED
20
,00
0A
ED
21,0
00
US
D 5
,718
EU
R 5
,022
5%
AE
D 2
3,10
0A
ED
24
,00
0U
SD
6,5
35
EU
R 5
,73
84
%
Do
ha (
QA
R)
1-6
nig
hts
(n
igh
tly r
ate
)Q
AR
720
QA
R 5
00
US
D 1
37
EU
R 1
21
-31%
QA
R 1
,00
0Q
AR
80
0U
SD
220
EU
R 1
93
-20
%Q
AR
1,3
50
QA
R 1
,00
0U
SD
275
EU
R 2
41
-26
%
7 n
igh
ts +
(w
ee
kly
rate
)Q
AR
4,0
00
QA
R 3
,00
0U
SD
824
EU
R 7
24
-25
%Q
AR
6,0
00
QA
R 5
,20
0U
SD
1,4
29
EU
R 1
,25
5-1
3%
QA
R 8
,50
0Q
AR
6,4
00
US
D 1
,75
8E
UR
1,5
44
-25
%
On
e m
on
th +
(m
on
thly
rate
)Q
AR
16
,50
0Q
AR
12
,50
0U
SD
3,4
34
EU
R 3
,016
-24
%Q
AR
25
,00
0Q
AR
21,0
00
US
D 5
,76
9E
UR
5,0
66
-16
%Q
AR
3
1,4
00
QA
R
27,
00
0U
SD
7,4
18E
UR
6,5
14-1
4%
3 m
on
th +
(m
on
thly
rate
)Q
AR
15
,20
0Q
AR
11,0
00
US
D 3
,022
EU
R 2
,65
4-2
8%
QA
R
23
,80
0Q
AR
20
,00
0U
SD
5,4
95
EU
R 4
,825
-16
%Q
AR
27,
90
0Q
AR
23
,50
0U
SD
6,4
56
EU
R 5
,670
-16
%
Fig. 59 Hotel Performance Metrics: 2020 vs 2019 (US$m) by region 2014 -2019
Segment Supply Demand Revenues Occupancy ADR RevPAR
All Upscale -2.7% -41.7% -52.2% -40.1% -18.0% -50.9%
Upscale Ex-Stay 3.0% -27.6% -39.9% -29.7% -17.0% -41.6%
All Mid-Price -0.7% -25.9% -34.6% -25.4% -11.8% -34.2%
Mid-Price Ex-Stay 5.4% -10.2% -21.8% -14.8% -13.0% -25.8%
All Economy -1.3% -18.2% -29.1% -17.1% -13.3% -28.2%
Economy Ex-Stay 2.5% -0.6% -3.1% -3.1% -2.5% -5.4%
All Hotels -3.6% -35.7% -49.4% -33.3% -21.3% -47.5%
All Ex-Stay 3.9% -15.8% -30.8% -18.9% -17.8% -33.4%
Sources: STR, The Highland Group
Extended-stay hotels in the USA are highly likely to set new performance records

120
Fig.60 Average Occupancy by Type of Hotel 2020
Source: Sources: STR, The Highland Group
80.0%
70.0%
60.0%
50.0%
40.0%
30.0%
20.0%
Upscale Ex-Stay Mid-Price Ex-Stay
Jan Feb Mar April May June July Aug Sept Oct Nov Dec
Economy Ex-Stay All Hotels
Collectively, extended-stay hotels began 2020
with a 12 – 13% occupancy premium over the all-
hotel average which is within the 10 to 15% range
reported over the last 20 years.
During contractionary periods, extended-stay’s
occupancy premium tends to widen and, at
17.8 %age points in 2020, it was the widest ever
reported. The occupancy premium peaked at 23
points in November 2020 and averaged 20 points
for the second half of the year.
Fig.61 Monthly RevPar Change by Type of Hotel 2019 v 2020
Source: Sources: STR, The Highland Group
0.0%
-10.0%
-20.0%
-30.0%
-40.0%
-50.0%
-60.0%
-70.0%
-80.0%
Upscale Ex-Stay Mid-Price Ex-Stay
Jan Feb Mar April May June July Aug Sept Oct Nov Dec
Economy Ex-Stay All Hotels
Corporatehousing.com

121
Upscale extended-stay hotels have a stronger
correlation with the overall hotel industry than
economy and mid-price segments. Although not
as deep, the trajectory of the upscale segment’s
early RevPAR losses was similar to the overall
hotel industry through August. Less aggressive
rate discounting was the main reason the
difference between upscale extended-stay
and all-hotel RevPAR declines widened during
early fall.
Fig.63 Monthly Room Revenue Change by Type of Hotel 2019 v 2020
Source: Sources: STR, The Highland Group
20.0%
0.0%
-20.0%
-40.0%
-60.0%
-80.0%
-100.0%
Upscale Ex-Stay Mid-Price Ex-Stay
Jan Feb Mar April May June July Aug Sept Oct Nov Dec
Economy Ex-Stay All Hotels
Fig.62 Monthly RevPAR Change by Type of Hotel 2019 v 2020
Segment Jan Feb Mar April May June July Aug Sep Oct Nov Dec
Upscale Ex-Stay 1.3% -0.9% -45.4% -68.5% -62.9% -59.4% -50.2% -44.8% -37.4% -38.1% -40.8% -41.2%
Mid-Price Ex-Stay 2.2% 1.1% -32.3% -52.4% -47.9% -41.8% -28.4% -24.3% -20.4% -22.1% -21.1% -15.0%
Economy Ex-Stay 1.1% -1.2% -9.1% -17.9% -11.4% -8.5% -5.7% -4.3% -1.4% -2.6% -2.4% -0.1%
All Hotels 2.3% 1.7% -51.8% -79.9% -71.0% -60.6% -52.0% -47.3% -46.0% -48.8% -52.7% -51.0%
Sources: STR, The Highland Group
Corporatehousingfactory.com Corporatehousingfactory.com

122
Economy extended-stay hotels quickly pared
down room revenue losses into single digits after
only two full months following the start of the
pandemic. In September 2020, it was the first and
only segment of the hotel industry to report a
month-on-month gain in room revenues. Following
a very slight contraction in October, economy
extended-stay hotel room revenues increased the
following two months.
2021At $10.61 billion, extended-stay room revenues year-
to-date are within 3% of the previous high set in 2019.
At $4.24 billion, extended-stay hotel room
revenues in Q3 2021 are the highest ever reported
across all three segments. Upscale extended-stay
hotels lost more revenue during the pandemic
than economy and mid-price segments and are
rebuilding faster. However, they remain about 12%
lower than in 2019.
Year-to-date occupancy for mid-price and upscale
extended-stay hotels remains below the typical
level since 2014. The economy segment, however,
set another new record through the third quarter.
Fig.64 Monthly Room Revenue Change by Type of Hotel 2019 v 2020
Segment Jan Feb Mar April May June July Aug Sep Oct Nov Dec
Upscale Ex-Stay 10.7% 8.7% -47.8% -68.7% -62.8% -57.5% -49.4% -43.7% -34.6% -35.3% -34.4% -40.2%
Mid-Price Ex-Stay 13.5% 11.5% -34.3% -52.6% -48.3% -42.2% -23.8% -17.5% -13.3% -15.2% -10.8% -7.5%
Economy Ex-Stay 4.8% 3.9% -8.1% -16.5% -10.0% -6.3% -3.5% -1.6% 1.2% -0.1% 0.2% 2.4%
All Hotels 4.4% 3.8% -50.9% -82.4% -74.2% -63.1% -53.9% -48.9% -47.4% -50.0% -53.5% -51.9%
Sources: STR, The Highland Group

123
Fig. 65 Extended-Stay Room Revenues ($ Billions) Year-to-Date Through the 3rd Quarter
US
$ b
illio
n
Source: The Highland Group
$12
$10
$8
$6
$4
$2
$-
2014 2015 2016 2017 2018 2019 2020 2021
The boost in summer season travel benefitted
upscale extended-stay hotel rates more than
lower priced segments, resulting in the widest
difference between the rate change in Q3
compared to year-to-date.
Fig.66 US Extended-Stay Hotel Average Occupancy - Year-to-Date Through the 3rd Quarter
Segment 2014 2015 2016 2017 2018 2019 2020 2021Change 20/21
Economy 79.7% 79.2% 77.4% 77.3% 78.7% 76.7% 74.0% 80.5% +8.8%
Mid-Price 74.9% 74.8% 74.4% 74.9% 75.0% 75.8% 63.2% 73.7% +16.6%
Upscale 79.6% 80.3% 79.8% 79.9% 80.0% 79.1% 53.9% 72.2% +34.1%
Total 77.8% 77.9% 77.2% 77.5% 77.8% 77.4% 61.4% 74.3% +21.0%
Sources: STR, The Highland Group
Fig.67 US Extended-Stay Hotel Average Rate - Year-to-Date Through the 3rd Quarter
Segment 2014 2015 2016 2017 2018 2019 2020 2021Change 20/21
Economy $35.95 $38.89 $40.70 $43.38 $45.98 $47.18 $45.74 $50.20 +9.7%
Mid-Price $71.77 $77.72 $81.94 $85.06 $88.79 $90.01 $78.07 $86.92 +11.3%
Upscale $127.73 $135.00 $138.82 $141.23 $143.61 $144.61 $122.86 $124.61 +1.4%
Total $86.17 $92.96 $97.08 $100.59 $103.91 $105.01 $86.86 $94.79 9.1%
Sources: STR, The Highland Group

124
RevPAR for economy extended-stay hotels set new Q3 and year-to-date records. The mid-price segment
set a new Q3 record but stayed about $4 below its 2019 level year-to-date.
The table following shows RevPAR recovery
indices for extended-stay hotels.
AnalysisThere has been a blurring of business and leisure
that includes longer stays, since employees can
work from anywhere. In January 2022, Airbnb
CEO Brian Chesky told investors that 2021 was
the company’s “best year in history.” He also
described how, over the past two years, average
stay increased by 15%. Stays of a week or more
now represent half of all nights booked, and long-
term stays of 28 nights, or more, have become
Airbnb’s fastest growing type of bookings.98
98. https://www.nbcnews.com/business/travel/extended-stay-hotels-play-long-game-rcna17365
Fig.68 US Extended-Stay Hotel REVPAR Year-to-Date Through the 3rd Quarter
Segment 2014 2015 2016 2017 2018 2019 2020 2021Change 20/21
Economy $28.64 $30.81 $31.52 $33.55 $36.20 $36.18 $33.84 $40.42 +19.5%
Mid-Price $53.79 $58.13 $60.98 $63.75 $66.60 $68.25 $49.37 $64.09 +29.8%
Upscale $101.64 $108.37 $110.78 $112.82 $114.91 $114.46 $66.16 $89.96 +36.0%
Total $67.02 $72.43 $74.98 $77.91 $80.84 $81.23 $53.34 $70.45 +32.1%
Sources: STR, The Highland Group
Fig.69 Extended-Stay Hotel RevPAR Recovery Index 2021 v 2019
Segment Jan Feb Mar April May June July Aug Sep Oct Average
Economy 104.7% 94.4% 102.2% 113.0% 111.7% 115.8% 117.9% 117.6% 121.7% 119.6% 111.9%
Mid-Price 83.8% 77.9% 80.8% 90.0% 89.9% 95.8% 104.6% 104.2% 111.4% 109.4% 94.8%
Upscale 62.5% 57.7% 68.7% 83.1% 78.4% 83.4% 91.9% 87.0% 87.1% 85.9% 78.6%
All Ex-Stay 73.7% 68.9% 75.6% 88.4% 85.1% 90.4% 98.7% 95.6% 98.1% 96.4% 87.1%
Sources: STR, The Highland Group
Fig.70 Extended-Stay Hotel Room Night Supply: November
Segment 2020 2021 Change
Economy 2,906,810 3,005,275 3.4%
Mid-Price 6,678,979 6,962,931 4.3%
Upscale 6,593,485 6,864,282 4.1%
Total 16,179,274 16,832,488 4.0%
Sources: STR, The Highland Group
125
Across North America and Canada, there are
now 665,350 serviced apartment units in 8,423
locations. This represents an increase of 11% and
10.7% respectively over 2020.99
A 4% increase in extended-stay room supply
in November tied with October as the lowest
monthly gain in 2021. The impact to supply
growth from reopening hotels closed during the
pandemic is effectively over. Early indications are
that mid-price and upscale supply growth should
be well below pre-pandemic levels during the near
term.
Extended-stay hotel occupancy gained more than
all hotels in November, increasing extended-stay
hotel’s occupancy premium to 16%. The premium
remains above its long-term average, where it has
stayed for the past two years.
Upscale extended-stay hotels endured the largest
fall in demand in 2020, but now are leading the
demand recovery. Extended-stay hotel demand
reached 12.3 million room nights in November
2021, 11% higher than November 2019.
New supplyAlthough extended-stay hotels still account for
less than 10% of the total lodging market, their
share has been growing. Most major hotel brands
are adding to their extended stay portfolios.
Wyndham Hotels & Resorts now has 50 properties
signed for the new economy extended-stay brand
with the working title Project Echo (Economy
Hotel Opportunity). Wyndham has awarded
contracts to develop 25 new-construction
projects each with its first two partners —
Richmond-based Sandpiper Hospitality and
Dallas-based Gulf Coast Hotel Management.
Meanwhile, In January, Blackstone Inc. and
Starwood Capital Group announced their
$1.5 billion acquisition of WoodSpring Suites’
100 properties. This followed Blackstone and
Starwood Capital’s purchase of Extended Stay
America’s 650 locations for more than $6 billion
for Extended Stay America.
Corporate housing perspective“Decreased inventory, increased demand, and costs, along with the emergence of the digital Nomad Temporary Housing all impacted the North American corporate housing industry. Today and for the near future, these changes will impact the industry.
With little to no vacancy in residential rental units in most major metropolitan areas, competition to lease quality vacant units is fierce. High-paying long-term renters leave little inventory for the industry. There is not enough new inventory to meet the current demand. Along with unit shortages, corporate housing providers are facing global supply chain delays. Providers and partners must manage the challenges of acquiring new furniture and household goods, navigating ever-uncertain logistics and ever-changing guest expectations. These delays and shortages increased the costs of these goods, necessitating that some costs get passed along to the client.
Another reality facing the industry is the emergence of the ‘digital Nomad Temporary Housing.’ The pandemic forced employees to work from home and technology made it possible. No longer tied to a physical location, today’s workforce wants to continue working and living from anywhere they choose. Along with uncertain business travel trends, the impact of the digital Nomad Temporary Housing on the industry continues into 2022, these ‘digital nomads’ represent a new target market for the industry. The corporate housing industry is recovering in North America, adapting, and evolving to today’s realities.” Mary Ann B. Passi, CAE, CEO, Corporate Housing Providers Association (CHPA)
99. GSAIR Survey 2022

126
Fig
.71
Rate
s co
mp
ari
son
US
A 2
019
/20
vs.
20
21/
22
RA
TE
S I
N K
EY
CIT
IES
Th
ese
rat
es
are
ave
rag
e r
ates
an
d
may
vary
per
loca
tio
n, t
ime o
f ye
ar,
reg
ion
al p
rom
oti
on
s an
d s
peci
fic
len
gth
s o
f st
ay. R
ates
qu
ote
d a
re
base
d o
n a
n a
vera
ge 4
sta
r ex
ten
ded
st
ay p
rop
ert
y a
nd
exc
lud
e t
axe
s.
Exc
han
ge r
ates
use
d M
arc
h 2
022.
ST
UD
IOO
NE
BE
DR
OO
MT
WO
BE
DR
OO
M
20
19/2
0
rate
20
21/
22
rate
Yo
Y
vari
an
ce
20
19/2
0
rate
20
21/
22
rate
Yo
Y
vari
an
ce
20
19/2
0
rate
20
21/
22
rate
Yo
Y
vari
an
ce
Lo
cal
cu
rre
ncy
Lo
cal
cu
rre
ncy
US
$E
uro
%L
ocal
cu
rre
ncy
Lo
cal
cu
rre
ncy
US
$E
uro
%L
ocal
cu
rre
ncy
Lo
cal
cu
rre
ncy
US
$E
uro
%
US
A/C
AN
AD
A
Bo
sto
n (
US
D)
1-6
nig
hts
(n
igh
tly r
ate
)U
SD
18
0U
SD
18
0E
UR
157
0%
US
D 1
80
210
EU
R 1
84
17%
US
D 1
80
US
D 2
15E
UR
18
819
%
7 n
igh
ts +
(w
ee
kly
rate
)U
SD
1,0
00
US
D 1
,00
0E
UR
874
0%
US
D 1
,00
011
50
EU
R 1
,00
615
%U
SD
1,0
00
US
D 1
,18
0E
UR
1,0
32
18%
On
e m
on
th +
(m
on
thly
rate
)U
SD
3,7
25
US
D 3
,725
EU
R 3
,25
80
%U
SD
3,7
25
38
25
EU
R 3
,34
53
%U
SD
3,7
25
US
D 3
,60
0E
UR
3,14
8-3
%
3 m
on
th +
(m
on
thly
rate
)U
SD
3,4
00
US
D 3
,40
0E
UR
2,9
73
0%
US
D 3
,40
03
50
0E
UR
3,0
61
3%
US
D 3
,40
0U
SD
3,2
00
EU
R 2
,79
9-6
%
New
Yo
rk (
US
D)
1-6
nig
hts
(n
igh
tly r
ate
)U
SD
26
0U
SD
28
9E
UR
25
311
%U
SD
29
03
20
EU
R 2
80
10%
US
D 2
95
US
D 3
40
EU
R 2
97
15%
7 n
igh
ts +
(w
ee
kly
rate
)U
SD
1,5
75
US
D 1
,70
0E
UR
1,4
87
8%
US
D 1
,575
170
0E
UR
1,4
87
8%
US
D 1
,575
US
D 1
,80
0E
UR
1,5
75
14%
On
e m
on
th +
(m
on
thly
rate
)U
SD
4,3
00
US
D 4
,40
0E
UR
3,8
49
2%
US
D 4
,30
04
40
0E
UR
3,8
50
2%
US
D 4
,30
0U
SD
4,5
00
EU
R 3
,937
5%
3 m
on
th +
(m
on
thly
rate
)U
SD
4,0
00
US
D 4
,10
0E
UR
3,5
87
3%
US
D 4
,00
04
20
0E
UR
3,6
75
5%
US
D 4
,00
0U
SD
4,2
00
EU
R 3
,675
5%
Toro
nto
(C
AD
)
1-6
nig
hts
(n
igh
tly r
ate
)C
AD
172
CA
D 1
25
US
D 9
9E
UR
86
-27%
CA
D 2
00
CA
D 1
75
US
D 1
38
EU
R 1
21
-13
%C
AD
25
5C
AD
210
US
D 1
66
EU
R 1
45
-18
%
7 n
igh
ts +
(w
ee
kly
rate
)C
AD
83
5C
AD
775
US
D 6
11E
UR
53
5-7
%C
AD
1,0
00
CA
D 9
10U
SD
717
EU
R 6
28
-9%
CA
D 1
,40
0C
AD
1,3
25
US
D 1
,04
5E
UR
914
-5%
On
e m
on
th +
(m
on
thly
rate
)C
AD
3,2
00
CA
D 2
,90
0U
SD
2,2
87
EU
R 2
,00
1-9
%C
AD
3,6
00
CA
D 3
,40
0U
SD
2,6
81
EU
R 2
,34
6-6
%C
AD
4,2
00
CA
D 4
,00
0U
SD
3,15
5E
UR
2,7
60
-5%
3 m
on
th +
(m
on
thly
rate
)C
AD
3,0
00
CA
D 2
,70
0U
SD
2,129
EU
R 1
,86
3-1
0%
CA
D 3
,15
0C
AD
3,0
00
US
D 2
,36
5E
UR
2,0
70
-5%
CA
D 4
,00
0C
AD
3,8
50
US
D 3
,03
6E
UR
2,6
56
-4%

127

128
Essential takeawaysBy Mark Harris
Overall, the serviced apartment sector has been
handed a major competitive advantage by the
pandemic.
Despite on-going challenges in terms of staffing,
changing international rules around traveller
movement, contrasting vaccination figures
between countries and the additional impetus
given to sustainability and travellers’ needs, the
extended stay sector rose magnificently to the
challenges of Covid.
The question now is whether the sector can
maintain that advantage in the face to hotels’
(and investors’) increasing focus on so-called
accommodation alternatives such as aparthotels,
short term rentals and co-living properties.
Not to mention serviced apartments.
Here are what we believe are the fifteen essential
takeaways from this year’s report.
1. Despite the curtailment of all but essential
trips during the pandemic, corporate usage
of serviced apartments for business travel,
assignment and relocation is still growing. But
is there a glass ceiling to that growth? Pre-
Covid projections of 10% and more100 conflict
with some corporate travel experts who say
4 – 5% of corporate accommodation budgets
is the most serviced apartments are likely to
achieve.
2. Nobody knows how long it will take business
travel to fully recover or surpass 2019 levels.
For the time being, stays will be longer but
less frequent, putting providers of longer-stay
products at a clear advantage.
3. Travellers’ and assignees’ needs have
undergone a cultural shift that began pre-
pandemic but has been accelerated during
lockdown when travel and mobility managers
were able to step back and review their
programmes.
4. Sustainability, ESG and personal safety now
head the priorities for both travellers and
their employers. The question is whether
corporates will be prepared to pay a premium
for their employees to ‘do the right thing’ and,
if so, what does that greenium look like?
5. Generation Z will make up the bulk of
travellers and assignees in this decade. They
want new experiences, a digital marketplace
accessible entirely by smartphone, less
human interaction with staff or other guests,
and total control of the sourcing process.
This asset-lite generation is content to work
remotely from serviced apartments anywhere
they wish.
6. Many operators have learned the benefits of
the asset-lite model and the need to balance
short with longer stay bookings. During the
pandemic, they also had to open their eyes
to new markets and new ways of reaching
potential customers. To exploit the leisure
market however, many operators will need to
re-tool their systems.
7. Most international markets have had similar
experiences during the pandemic; essential
trips for infrastructure and other critical
projects, although fewer in number and longer
in length of stay.
8. Location is still a key factor in the success of
any serviced apartment. But with some VC-
backed brands having exited the industry, is
there a risk that investors’ enthusiasm could
overshadow location and other key success
factors?
9. The trend to focus bookings away from city
centres and into suburban and even provincial
locations is a symptom of the Covid crisis. The
signs are that serviced apartment bookings
are already reverting to business hubs,
although remote working may prevent things
returning to the pre-pandemic normal.
10. Since Airbnb entered the market, £176
billion has been invested into the alternative
accommodation market. Future expansion will
be driven by investor interest in products like
co-living, which require fewer guest amenities
and are therefore cheaper to build. It could
be argued that co-living, whilst increasingly
popular with the corporate market, benefits
the investor most.
11. The lines between serviced apartments, short
term rentals, and co-living are increasingly
blurred. Investor interest in STR and co-living
could see serviced apartment operators
move into both sectors, either through new
products or by creating hybrid concepts
100. GSAIR 2020/21

129
12. The days of the hybrid agent/operator model
are nearly over, at least at scale. Corporates
and consumers alike want to know who they
are dealing with, whilst increasingly mature
operator distribution strategies are driving
direct bookings at the expense of certain
intermediaries that lack market-dominance in
their own right.
13. To leverage the corporate market, operators
will have to ensure their content is available
on all distribution platforms. In the battle for
corporate hearts and minds, the winners will
be those who bring together content from
all parts of the fragmented extended stay
sector into one consistent format, on a single
platform.
14. Accreditation is now defined by independent
verification. Increased competition means
that, to succeed, one or two schemes must
emerge as the programmes of choice for
guests and operators alike. That will require
some clear ROI modelling if operators are not
to play one off against the others.
15. The biggest threat to the extended stay
sector post-pandemic is complacency. Hotels
are already fighting back.
StaycityAparthotel, Paris, MarneLaVallee

130
Sponsor profiles
Appart’CityAppart’City is held by the Grand M Group holding company, specialising for the past 20 years in property,
and managing accommodation, aparthotels, and student housing.
Appart’City, today’s leading French urban aparthotel chain which counts more a hundred 2- to 4-star
aparthotels, benefits from strong complementary national presence and positioning. Its forms an
indisputably consistent network in France, Belgium, and Switzerland.
The company is also continuing its development with openings in France in 2022 and 2023.
LocationsFrance, Belgium, Switzerland
Amenities From studios to 2-bedroom accommodation, all our apartments are fully furnished and equipped.
The mini kitchens offer everything to be able to make great little meals or to reheat takeaways.
Our apartments also offer an office space with free 100% super-fast fibre optic broadband and TV with
Chromecast, a wardrobe and a bathroom with a bath or shower, including a hairdryer, soft towels, and
paraben free, environmentally friendly courtesy toiletries.
And we also have a wide range of hotel services*: 24/7 receptions, multi-function living areas, breakfasts,
bars, Comptoir City and Bistrot City restaurants, well-being areas, fitness rooms, conference rooms,
laundrettes, housekeeping, pets welcome, luggage stores, carparks, shuttle buses, and much more.
*Some services require a fee and are available at certain aparthotels
Points to noteThe comfort of an apartment, plus hotel services!
New OpeningsFrance, 2022 : Appart’City Confort St Germain en Laye 4*
France, 2023 : Appart’City Confort Paris Gare de Lyon 4*

131
Frasers HospitalityOwnershipFrasers Property Limited
Fraser Suites: Fraser Suites enjoys a highly desirable location in a key business district and reflects the
character of the host city with touches of understated elegance and relaxed formality.
Fraser Residence: Fraser Residence is a private sanctuary in a prime location. Contemporary and calm,
the tasteful serenity and tranquillity makes it a perfect haven for guests and their families.
Fraser Place: Fraser Place represents vibrant cosmopolitan living with its chic and stylish decor. Each
property is located in the energetic heart of the city, often moments from key business districts.
Capri by Fraser: Business hotel-residences that cater to the ‘always-on’ lifestyle needs of Millennial
travellers. From seamless connectivity to a gym that never closes and high-powered activities in between
spin cycles, Capri by Fraser keeps them engaged and on top of their game.
Modena by Fraser: A brand of serviced residences that focuses on travelling well with simplicity,
functionality, and holistic wellness at the heart of modern living. Comprehensive amenities are offered in a
relaxed and simple environment.
Malmaison: Boutique stylish hotels in iconic buildings and individually designed guest rooms with flair
and imagination for travellers who dare to be different.
Hotel du Vin: Classic and elegant hotels with trademark bistros for travellers looking to experience
quintessentially British hospitality.
LocationsLocated across 22 countries and 71 cities: Australia, Indonesia, Malaysia, Singapore, Thailand, Cambodia,
Vietnam, China, Japan, South Korea, France, Germany, Bahrain, Nigeria, Oman, Qatar, Saudi Arabia, Spain,
Switzerland, Turkey, UAE, United Kingdom
New Openings 2020-2021• Fraser Suites Akasaka, Tokyo
• Fraser Residence Chengdu
• Fraser Residence Hanoi
• Capri by Fraser, Leipzig / Germany
• Capri by Fraser, Bukit Bintang / Malaysia
• Modena by Fraser Hong Kong
• Malmaison York
New Openings 2022-2023• Fraser Suites Pazhou, Guangzhou
• Fraser Place Chengdu
• Fraser Residence Forte, Nanjing
• Fraser Residence Tianjin
• Fraser Residence Changsha
• Capri by Fraser, Phnom Penh / Cambodia
• Malmaison Manchester

132
OakwoodOwnershipMapletree Investments
Oakwood, a wholly owned subsidiary of Mapletree Investments, is a leading brand in hospitality
management. A global operator and pioneer of the concept of serviced apartments and extended stay
segment with 60 years of experience, Oakwood manages a collection of bespoke accommodation
options comprising elegantly furnished serviced apartments, hotels, and unfurnished multifamily homes.
The group’s current suite of eight brands ensures an accommodation option for every stage of life,
across all lifestyles:
• Oakwood Premier: Tailored luxury for the discerning traveller
• Oakwood Suites: Elegant living with discreet service for the jet-setting professional
• Oakwood Residence: Familiarity and community for families in a residential environment
• Oakwood Studios: Experiential stays for the global Nomad Temporary Housing
• The Unlimited Collection by Oakwood: Unique experiences for the curious traveller
• Oakwood Hotel & Apartments: Fuss-free living for the independent traveller
• Oakwood Beluxs: Contemporary charm for the cultured traveller
• Oakwood Living: Unfurnished homes for families and professionals seeking good living
in a multifamily community
LocationsAustralia, Bangladesh (pipeline), Cambodia (pipeline), China, India, Indonesia, Japan, Malaysia, Myanmar
(pipeline), Philippines (pipeline), Singapore, South Korea, Thailand, United States, Vietnam
OasisOwnership98% Steve Frey ; 2% Parker Stanberry
Oasis serves as a global temporary accommodation’s agency. The Oasis Collections brand delivers over
2000 hand-picked, curated, and fully managed homes to our clients. Both are powered by our industry
leading, proprietary technology that was developed in-house, Metis.
LocationsGlobal
Amenities Amenities vary by property.
Sponsor profiles
R

133
Suites by Rehoboth and M’nuchahOwnershipPrivate
Suites by RehobothAccommodation solution provider.
At Suites by Rehoboth, we aim to offer our guests a comfortable and affordable stay,
your perfect home away from home.
No matter how long you’re in town, we are on hand to make your accommodation
requirements effortless.
M’nuchahA place of rest, fused with creativity.
M’nuchah is a first of its kind Aparthotel for community and creatives. A resting place for
those looking to recharge, a sanctuary for those wanting to be inspired.
LocationsLondon
AmenitiesFully equipped kitchen and internal laundry, high speed Wi-Fi, parking, and pet friendly. Suites by
Rehoboth also offers a range of additional services, including concierge, car hire, chauffeur,
and personal shopper.
Points to noteSuites by Rehoboth - Est 2019 (3 months before lockdown)
M’nuchah opening March 2022
New OpeningsCamden, Canary Wharf, Maida Vale

134
StaycityOwnershipPrivately owned
Staycity Aparthotels – Stylish, comfortable aparthotels ranging from studio to one- and two-bed
apartments sleeping up to 6 people. All have fully equipped kitchens/kitchenettes. Currently operating in
14 European cities.
Wilde Aparthotels by Staycity – premium, design-led aparthotel brand for central locations in prime city
centres. Currently operating in London (Covent Garden, Tower Bridge and Paddington), Berlin, Edinburgh,
and Manchester (opening beginning of Feb 2022). Premium offer with luxury fixtures and soft furnishings
- Grohe rainfall shower, Hypnos mattresses, Smeg and Nespresso appliances.
LocationsBerlin, Bordeaux, Birmingham, Dublin, Edinburgh, Frankfurt, Heidelberg, Liverpool, London, Lyon,
Manchester, Marseille, Paris, York, Venice.
Amenities 24-hour reception, guest laundry room, Staycafé selling hot and cold food and drinks as well
as breakfast, guest parking, fully equipped gym, guest lounge.
Points to noteAmenities are subject to space. Most of the new openings are new-builds, giving more space for a larger
lounge area and Staycafé – breakfast, hot and cold drinks, snacks etc are popular. The lounge and café
can be used by non-residents.
Some sites have meeting rooms that can be hired for corporate meetings and small events.
Recent operational changes include the option of online check-in/check-out and electronic
communication with front-of-house team if preferred.
New OpeningsIn 2021 Staycity opened new properties in Bordeaux (Staycity Aparthotels brand), Dublin (Staycity),
Heidelberg (Staycity), London Tower Bridge (Wilde Aparthotels by Staycity) and London Paddington
(Wilde Aparthotels by Staycity).
In 2022 Staycity will open further sites in Manchester (Wilde), Dublin (two Staycity Aparthotels), Frankfurt
(Staycity) and Paris (Staycity).
Openings in the first half of 2022 will amount to over 1,100 apartments taking Staycity Group’s estate to
over 5,000 apartments by the Spring.
Sponsor profiles

135
TAKE A WALK ON THE WILDE SIDEWilde brings Inspired by the wit of Oscar Wilde, it’s where you will escape, , cook and
at STAYCITY.COM/WILDE
ESCAPE ORDINARY - Berlin - Edinburgh - London

136
List of tables Fig. Title See page
1. Global Tourism Expenditure 2019-2021 12
2. Hotels vs Short-Term Rentals Global Value Sales 2019-21 13
3. Global Inbound Tourism Receipts Recovery Scenarios 14
4. Short-Term Rentals sales by region 2021 vs 2026 15
5. Future of Work 17
6. GSAIR survey – is serviced apartment usage growing, reducing or the same 20
7. GSAIR survey – how do you quantify the benefits of serviced apartments 21
8. GSAIR survey – what matters to your travellers in a serviced apartment 21
9. GSAIR survey – how are serviced apartments booked 22
10. GSAIR survey – operators top booking channels 22
11. GSAIR survey - factors impacting serviced apartment use in the pandemic 23
12 GSAIR survey – did your serviced apartment use during the pandemic rise 24
13. GSAIR survey – operators’ optimism for the future 24
14. GSAIR survey – operators intending to expand 25
15. GSAIR survey – operators’ key criteria when selecting a new location 26
16. GSAIR survey – industry-wide changes operators most want to see 26
17. Booking hotspots - London and surrounding suburbs 2019 30
18. Booking hotspots - London and surrounding suburbs 2020 30
19. Booking hotspots - London and surrounding suburbs 2021 31
20. Booking hotspots - London and surrounding suburbs 2022 31
21. Booking hotspots - Manchester and surrounding suburbs 2019 32
22. Booking hotspots - Manchester and surrounding suburbs 2020 32
23. Booking hotspots - Manchester and surrounding suburbs 2021 33
24. Booking hotspots - Manchester and surrounding suburbs 2022 33
25. Booking hotspots - UK excluding London 2019 vs 2020 34
26. Booking hotspots - UK excluding London 2020 vs 2021 34
27. Booking hotspots - UK excluding London 2021 vs 2022 35
28. Average nightly rate for London (1 bed serviced apartments) 36
29. Average nightly rate for London (2 bed serviced apartments) 36
30. STR - RevPAR still has a way to go 45
31. STR - Barriers decline but concerns regarding unvaccinated increase 45
32. STR - Mixed Covid impact amongst major serviced apartment markets 46
33. STR - All major markets following same pattern. 47
34. Global serviced apartment supply by total units 48
35. Global serviced apartment supply by locations 49
36. Top 15 global chains by locations 49
37. Top 15 global chains by units 50
38. Top 15 global suppliers with brand breakdown 51
39. Top 15 global suppliers by rate of growth in locations 2020/21 vs 2018/19 52
40. How business travel will change post-pandemic 61
continued on page 138

137
Your Hotel AlternativeProviding short and long-stay accommodation
in Newcastle upon Tyne and across the UK
Please contact Claire and her team either via the website or call 0191 281 3129 or email [email protected]
www.week2week.co.uk
Best DealWe offer a cost effective hotel alternative up to 40% cheaper than hotel stays.
Peace of minDQuality accredited and regulated to ensure standards of safety, security and duty of care. We are on-hand 24:7 for guest support.
Well-beingBy ensuring your team are well rested in a home from home leads to higher productivity and better care.
BYoDEach apartment is set up for you to Bring Your Own Devices allowing flexibilitywhen working and relaxing.
SiMPle CHeCK-inWe provide a flexible and socially distanced check-in, local area recommendations and key exchange.
HOUSeKeePingWe arrange cleaning and supply fresh linen and towels. We cater for team changes too.
We follow strict Covid19 Protocol Housekeeping Measures

138
List of tables continued Fig. Title See page
41. Most companies have pledged to reduce emissions but only
1-in-3 have definite plans in place 62
42. DE&I – the business case 64
43. Business traveller anxieties during pandemic 65
44. Travel managers expect to implement new policies within 12 months 71
45. European extended stay transaction volumes 2010-Q321 80
46. Growth of serviced apartment locations by region 2018 - 2022 82
47. Growth of serviced apartment locations by region 2018 - 2022 82
48. Inbound air travel to Africa 2015 - 2019 84
49. Rates comparison – Africa 2019/20 vs 2021/22 88
50. Rates comparison – Asia 2019/20 vs 2021/22 93
51. Rates comparison – Australasia 2019/20 vs 2021/22 100
52. European serviced apartment operational performance vs. hotels 102
53. Top 15 European cities by growth 103
54. Rates comparison Europe – 2019/20 vs 2021/22 106
55. Columbia – growth of serviced apartments 110
56 Latin America travel market annual growth 2018 - 2024 111
57. Rates comparison LATAM 2019/20 vs 2021/22 113
58. Rates comparison Middle East 2019/20 vs 2021/22 118
59. US Hotel Performance Metrics: 2020 vs 2019 119
60. US Average Occupancy by Type of Hotel 2020 120
61. US Monthly RevPAR Change by Type of Hotel 2019 vs 2020 120
62. US Monthly RevPAR Change by Type of Hotel 2019 vs 2020 121
63. US Monthly Room Revenue Change by Type of Hotel 2019 vs 2020 121
64. US Monthly Room Revenue Change by Type of Hotel 2019 vs 2020 122
65. US Extended-Stay Room Revenues YTD inc Q3 2021 123
66. US Extended-Stay Hotel Average Occupancy -YTD inc Q3 2021 123
67. US Extended-Stay Hotel Average Rate YTD inc Q3 2021 123
68. US Extended-Stay Hotel RevPAR YTD inc Q3 2021 124
69. US Extended-Stay Hotel RevPAR Recovery Index 2021 vs 2019 124
70. US Extended stay room night supply November 2021 124
71. Rates comparison USA 2019/20 vs 2021/22 126

139
YOUR LUXURY APARTHOTEL IN THE CITY OF LONDON
Benefitting from the characteristics of both a luxury boutique hotel as well as the added amenities of longer stay residences, The Gate provides every guest with their perfect home within the City.
Every one of the 189 apartments at The Gate has been carefully designed to create a beautiful space that radiates style and is complete with carefully considered details that make each day feel luxurious. Make yourself at home with beautiful bathrooms, a fully equipped kitchen, state-of-the-art technology, and Hypnos beds so comfortable you’ll never want to leave.
The Gate | 41 White Church Lane | London | E1 7QREmail: [email protected] Telephone: +44 (0)20 8619 1178

140
C
M
Y
CM
MY
CY
CMY
K
GSAIR_ad_outlines_FINAL.pdf 1 04/05/2022 16:17