The Andalusian population from Huelva reveals a high diversification of Y-DNA paternal lineages from...
22
Annals of Human Biology, January–February 2010; 37(1): 86–107 ORIGINAL ARTICLE The Andalusian population from Huelva reveals a high diversification of Y-DNA paternal lineages from haplogroup E: Identifying human male movements within the Mediterranean space B. AMBROSIO 1 , J. M. DUGOUJON 2 , C. HERNÁNDEZ 1 , D. DE LA FUENTE 1 , A. GONZÁLEZ-MARTÍN 1 , C. A. FORTES-LIMA 1 , A. NOVELLETTO 3 , J. N. RODRÍGUEZ 4 & R. CALDERÓN 1 1 Departamento de Zoología y Antropología Física, Facultad de Biología, Universidad Complutense, Madrid 28040, Spain, 2 Laboratoire d’Anthropologie, FRE 2960, Centre National de la Recherche Scientifique (CNRS), Université Paul Sabatier, Toulouse 31073, France, 3 Dipartimento di Biologia, Università ‘Tor Vergata’, Rome 00133, Italy, and 4 Servicio de Hematología, Hospital Juan Ramón Jiménez, Huelva, 21005, Spain (Received 22 April 2009; accepted 28 July 2009) Abstract Background: Gene flow among human populations is generally interpreted in terms of complex patterns, with the observed gene frequencies being the consequence of the entire genetic and demographic histories of the population. Aims: This study performs a high-resolution analysis of the Y-chromosome haplogroup E in Western Andalusians (Huelva province). The genetic information presented here provides new insights into migration processes that took place throughout the Mediterranean space and tries to evaluate its impact on the current genetic composition of the most southwestern population of Spain. Subjects and methods: 167 unrelated males were previously typed for the presence/absence of the Y-chromosome Alu polymorphism (YAP). The group of YAP (+) Andalusians was genotyped for 16 Y-SNPs and also characterized for 16 Y-STR loci. Results: The distribution of E-M81 haplogroup, a Berber marker, was found at a frequency of 3% in our sample. The distribution of M81 frequencies in Iberia seems to be not concordant with the regions where Islamic rule was most intense and long-lasting. The study also showed that most of M78 derived allele (6.6%) led to the V13* subhaplogroup. We also found the most basal and rare paragroup M78* and others with V12 and V65 mutations. The lineage defined by M34 mutation, which is quite frequent in Jews, was detected as well. Conclusions: The haplogroup E among Western Andalusians revealed a complex admixture of genetic markers from the Mediterranean space, with interesting signatures of populations from the Middle East Correspondence: Prof. Rosario Calderón, Departamento de Zoología y Antropología Física, Facultad de Biología, Universidad Complutense, Ciudad Universitaria, 28040 Madrid, Spain. E-mail: [email protected] ISSN 0301-4460 print/ISSN 1464-5033 online ȑ 2009 Informa UK Ltd. DOI: 10.3109/03014460903229155
Transcript of The Andalusian population from Huelva reveals a high diversification of Y-DNA paternal lineages from...
Annals of Human Biology, January–February 2010; 37(1): 86–107
ORIGINAL ARTICLE
The Andalusian population from Huelva reveals a highdiversification of Y-DNA paternal lineages fromhaplogroup E: Identifying human male movements withinthe Mediterranean space
B. AMBROSIO1, J. M. DUGOUJON2, C. HERNÁNDEZ1,D. DE LA FUENTE1, A. GONZÁLEZ-MARTÍN1, C. A. FORTES-LIMA1,A. NOVELLETTO3, J. N. RODRÍGUEZ4 & R. CALDERÓN1
1Departamento de Zoología y Antropología Física, Facultad de Biología, Universidad Complutense,Madrid 28040, Spain, 2Laboratoire d’Anthropologie, FRE 2960, Centre National de la RechercheScientifique (CNRS), Université Paul Sabatier, Toulouse 31073, France, 3Dipartimento di Biologia,Università ‘Tor Vergata’, Rome 00133, Italy, and 4Servicio de Hematología, Hospital Juan RamónJiménez, Huelva, 21005, Spain
(Received 22 April 2009; accepted 28 July 2009)
AbstractBackground: Gene flow among human populations is generally interpreted in terms of complexpatterns, with the observed gene frequencies being the consequence of the entire genetic anddemographic histories of the population.Aims: This study performs a high-resolution analysis of the Y-chromosome haplogroup E in WesternAndalusians (Huelva province). The genetic information presented here provides new insights intomigration processes that took place throughout the Mediterranean space and tries to evaluate its impacton the current genetic composition of the most southwestern population of Spain.Subjects and methods: 167 unrelated males were previously typed for the presence/absence of theY-chromosome Alu polymorphism (YAP). The group of YAP (+) Andalusians was genotyped for 16Y-SNPs and also characterized for 16 Y-STR loci.Results: The distribution of E-M81 haplogroup, a Berber marker, was found at a frequency of 3% in oursample. The distribution of M81 frequencies in Iberia seems to be not concordant with the regionswhere Islamic rule was most intense and long-lasting. The study also showed that most of M78 derivedallele (6.6%) led to the V13* subhaplogroup. We also found the most basal and rare paragroup M78*and others with V12 and V65 mutations. The lineage defined byM34 mutation, which is quite frequentin Jews, was detected as well.Conclusions: The haplogroup E among Western Andalusians revealed a complex admixture of geneticmarkers from the Mediterranean space, with interesting signatures of populations from the Middle East
Correspondence: Prof. Rosario Calderón, Departamento de Zoología y Antropología Física, Facultad de Biología, UniversidadComplutense, Ciudad Universitaria, 28040 Madrid, Spain. E-mail: [email protected]
ISSN 0301-4460 print/ISSN 1464-5033 online � 2009 Informa UK Ltd.DOI: 10.3109/03014460903229155

and the Balkan Peninsula and a surprisingly low influence by Berber populations compared to otherareas of the Iberian Peninsula.
Keywords: Y-SNPs, genealogical history, Mediterranean gene pool, Iberia, human migrations, sourcepopulations
Introduction
Andalusia, a large and relatively densely populated region of southern Spain, has a longhistory shaped by migrations from different parts of the world at different times, including arelatively recent long Islamic settlement. Despite its implications for the peopling of theIberian Peninsula and its relevance to the evolution of modern Homo sapiens, the geneticcomposition of the Andalusian people has never been studied in depth.
Within Andalusia, the westernmost province of Huelva is of particular interest, due to itsgeographic position. It is located on the western fringe of Europe, bordering Portugal andthe Atlantic Ocean, and is also near the Strait of Gibraltar, which has served as both agenetic barrier and corridor at different times. Its population is of moderate size and hasexperienced a slow demographic growth. Furthermore, gene flow from contemporaryimmigrants has been minimal, and the main features of the autochthonous populationwere preserved.
The Y chromosome contains the largest non-recombining region (NRY) of the humangenome. It is a haploid locus harbouring a great deal of information that has found wideapplications in a range of fields such as human evolutionary, forensic, and medical genetics(Underhill et al. 2000; Shastry 2002; Jobling and Tyler-Smith 2003; Novelletto 2007; Camp-bell and Tishkoff 2008). Current knowledge of the Y-tree topology of the NRY region couldbe qualified as both refined and complex, and much has come from the ongoing identi-fication of new single-nucleotide polymorphisms (SNPs) and lineages in the humanpopulation (de Knijff 2000; Hammer et al. 2000; Underhill et al. 2001, Jobling andTyler-Smith 2003; Cruciani et al. 2004, 2006, 2007; Behar et al. 2006; Sims et al.2007; Karafet et al. 2008). The importance of the molecular and evolutionary characteristicsof SNPs becomes even more evident if we consider that the NRY region, just like themitochondrial DNA (mtDNA) genome, has a small effective population size (approximatelyone fourth that of autosomes) (Hartl and Clark 1989; Hammer et al. 1997) which enhancesthe signal of inter-population divergence.
Many recent studies on Y chromosome and mtDNA variation have largely focused on in-depth analyses of European, North African, andWestern Asian populations, all of which haveknownhistorical relationshipswithin theMediterraneanarea (Hammeretal.1997;Rosseretal.2000;Scozzari et al. 2001;Cruciani et al. 2002,2004, 2007;Seminoet al. 2004;Cinnio�glu et al.2004; Roewer et al. 2005; Torroni et al. 2006 among others). Research into these topics isproviding interesting insights into demographic changes, migratory patterns, and admixtureepisodes that have occurred during recent human evolution.
The polymorphic presence of an Alu element in the Y chromosome defines a deep-rootingclade – containing haplogroups D and E – of the phylogenetic tree of the Y-chromosomehaplogroups (see the human Y-chromosomal haplogroup tree at http://ycc.biosci.arizona.edu/ (Y-Chromosomal Consortium)). In a recently published paper, Karafet et al. (2008)reported that haplogroup E is characterized by a high number of mutations and is indeed oneof the most mutationally diverse of the 20 major Y-chromosome clades. These particularitiesmake it especially apt for investigating recent human migrations. Furthermore, many
Haplogroup E in Western Andalusia 87

populations around the world have already been studied in search of this haplogroup and cantherefore be used for comparison purposes. While haplogroup D seems to be confined toAsia, haplogroup E (mainly E1b1b1, formerly E3b, lineages), with its strong phylogeo-graphic structure, is more varied and appears to be highly frequent in Africa and moderatelyso in southern Europe and in other regions of the Mediterranean, including the Levant(Hammer et al. 1997, 2000; Underhill and Roseman 2001; Weale et al. 2003; Cruciani et al.2004, 2007; Sims et al. 2007). E1b1a (formerly E3a) lineages, in contrast, are associatedwith sub-Saharan Africa, and the Iberian Peninsula is one of the regions in the Mediter-ranean area in which the two major monophyletic E subclades, E1b1b1 and E1b1a, exist,albeit with varying frequencies between populations (Cruciani et al. 2004; Semino et al.2004; Beleza et al. 2005; Neto et al. 2007).
The aim of this study was to perform a high-resolution analysis of haplogroup E in theAndalusian population of Huelva and to compare the lineages observed with those in otherIberian, European, North African, and more distant Mediterranean populations. Thegenetic information presented here will provide a reliable background against which todiscuss new insights into migration processes that took place throughout the Mediterraneanspace – mainly during the period ranging from the protohistoric era, when the Tartessiancivilization flourished (from before 11th to 5th centuries BC), to the time of the rise and fallof Islamic rule – and to thus evaluate the impact of these processes on the current geneticcomposition of the most southwestern population of Spain.
Materials and methods
Population samples and geographical sampling
Blood samples were collected by venepuncture into EDTA tubes by a group of doctors andnurses from Hospital Juan Ramón Jiménez in Huelva city, accompanied by researchers (RCand BA) from Universidad Complutense de Madrid. Participants were asked about theorigins of their parents and grandparents and their genetic relationships with other donorscontributing to this study. The sampling strategy was designed to be as representative aspossible and to include individuals from throughout the province (not including the city ofHuelva) and municipalities whose population size had remained more or less constant overthe last 2 centuries (http://www.ine.es). The municipalities chosen for sampling wereAracena, El Repilado, El Cerro del Andévalo, La Puebla de Guzmán, Valverde del Camino,Villablanca, and Niebla (Figure 1). Between 2004 and 2007, seven field trips were made tocollect blood samples from 302 unrelated, healthy autochthonous males and females from45 demographic units located throughout the province. Written informed consent wasobtained from all individuals prior to their participation. Additional information on thegeography, history, demography, and archaeology of the Andalusian province of Huelva andits population can be found in Calderón et al. (2006) and references therein.
Laboratory analysis: Polymorphisms and haplotyping
Genomic DNA was extracted using a standard proteinase-K digestion followed by phenol–chloroform extraction and ethanol with some modifications. A total of 167 unrelated malesdescribed above were initially analysed for the presence/absence of the Y-chromosome Alupolymorphism (YAP) following the recommendations of Hammer et al. (1997). Following adescendent hierarchical order, we performed a high-resolution search of the Y-chromosomebinary E1b1b1 haplogroups, first characterizing the following Y-SNPs: M96, M35, M78,
88 B. Ambrosio et al.

M81, M123, M281 and V6. Individuals with the M78 derived state were also genotyped forthe binary markers V12, V13, V22, V27, V32 and V65 described in Cruciani et al. (2006,2007). Those individuals being positive for the M81 mutation were genotyped for internallineages: M107 and M165. Samples identified as M123 were also genotyped for M34.Binary markers that were genotyped but not detected in our sample of YAP (+) Andalusianmales were V32, V27, V22, M107, M165, M281 and V6.
To genotype the Y binary markers, we followed standard protocols already described inthe literature using the following methods: Polymerase-chain reaction (PCR)-restrictionfragment length polymorphism (RFLP) analysis, SNP multiplexing, and direct sequencing.Markers such as M96 and M35 were first amplified by duplex PCR and then by single baseextension using the SNaPshot multiplex kit (Applied Biosystems, Foster City, CA, USA)described by Brion et al. (2005). M78, V12, V13, V22, V27 and V32 were amplified usingpreviously published primers (Underhill et al. 2001, Cruciani et al. 2006) and theircorresponding allelic states were diagnosed by means of the restriction enzymes AciI(also for V13), BsgI, MmeI, PvuII and MnlI, respectively following the protocol givenin Cruciani et al. (2006). Other markers such as V65, M81, M107, M165, M123, M34,M281 and V6 were genotyped with published primers (Underhill et al. 2001, Cruciani et al.2004) by sequencing both strands (BigDye Terminator kit v.3.1) using an ABI Prism 3730DNA analyzer (Applied Biosystems).
Y chromosomes identified by the presence of biallelic polymorphisms (mutations) or SNPsare called haplogroups or subhaplogroups if they are defined by a terminal mutation within agiven haplogroup. We used the nomenclature system proposed by Karafet et al. (2008) andadopted by theYChromosomalConsortium tonamehaplogroups/subhaplogroupsdefinedby
N
S
ARACENA
EL REPILADO
EL CERRO DEL ANDÉVALO
Gua
dian
a riv
er
PUEBLA DE GUZMÀN
VILLABLANCA
Atlantic ocean
Po
rtu
gal
VALVERDE DEL CAMINO
NIEBLA
HUELVA
0 10 20 30 40 50 km
SEVILLA
France
Spain
Andalusia
Mediterranean sea
Por
tuga
l
Tint
o riv
er
Gua
dalq
uivi
r riv
er
Odi
el ri
ver
Figure 1. The geographic distribution of the municipalities sampled within the Huelva province (Andalusia, Spain).
Haplogroup E in Western Andalusia 89

the presence of a binary polymorphism. We also consulted information provided by theInternational Society of Genetic Genealogy (http://www.isogg.org/tree/).
Y-microsatellite (Y-STR) markers
All the samples from our group of YAP(+) Andalusian males were also characterized for 16short tandem repeat (STR) loci using the AmpFlSTRYfiler PCR amplification kit (AppliedBiosystems). The loci were DYS456[(AGAT)n], DYS389I/II[(TCTG)n(TCTA)n], DYS390[(TCTA)n(TCTG)n], DYS458[(GAAA)n], DYS19[(TAGA)n], DYS385a/b[(GAAA)n],DYS393[(AGAT)n], DYS391[(TCTA)n], DYS439[(AGAT)n], DYS635(Y GATA C4)[(TATC)n], DYS392[(TAT)n], Y GATA H4[(TAGA)n], DYS438[(TTTTC)n], DYS437[(TCTA)n], DYS448[(AGAGAT)n]. Alleles were detected using 5¢-labelled fluorescentprimers, an ABI3100 capillary sequencer (Applied Biosystems), internal size standards,and GeneMapper fragment analysis. In accordance with the recommendations of theInternational Society of Forensic Genetics (ISFG) (Gill et al. 2001), Y-STR alleles werenamed according to the number of variable repeats included. Alleles at DYS389II wereconsidered after subtracting the variation at DYS389I (Cooper et al. 1996).
Data analysis
Haplogroup and haplotype diversity, as described by Nei (1987, p. 187), as well as samplingvariancewere estimatedusingARLEQUINsoftware (version3.01) (Excoffier et al. 2005).Thecombination of alleles at multiple SNPs defines a NRY haplogroup of alleles whereas thecombinationatmultipleY-STRsonasingleYchromosomedefinesaY-STRhaplotype(deKnijff2000).E-M78andE-M81andtheirassociatedmicrosatellitehaplotypeswithfrequenciesof‡5ina set ofMediterranean population samples taken from the literature – four fromNorthernAfrica(Egypt (n = 2), Algeria, andTunisia); three fromSouthernEurope (Italy, Portugal and the studysample) and one fromWestern Eurasia (Turkey) – were used to infer mutational relationshipsbetween haplotype sequences based on fiveY-STR loci (DYS19,DYS390,DYS391,DYS392,DYS393). The phylogenetic pattern was visualized using the Reduced Median (RM) networkalgorithm (NETWORK 4.5 program; http://www.fluxus-engineering.com/) (Bandelt et al.1999). Microsatellites were weighted proportionally to the inverse of the repeat variance foreach haplogroup to reduce network reticulations.
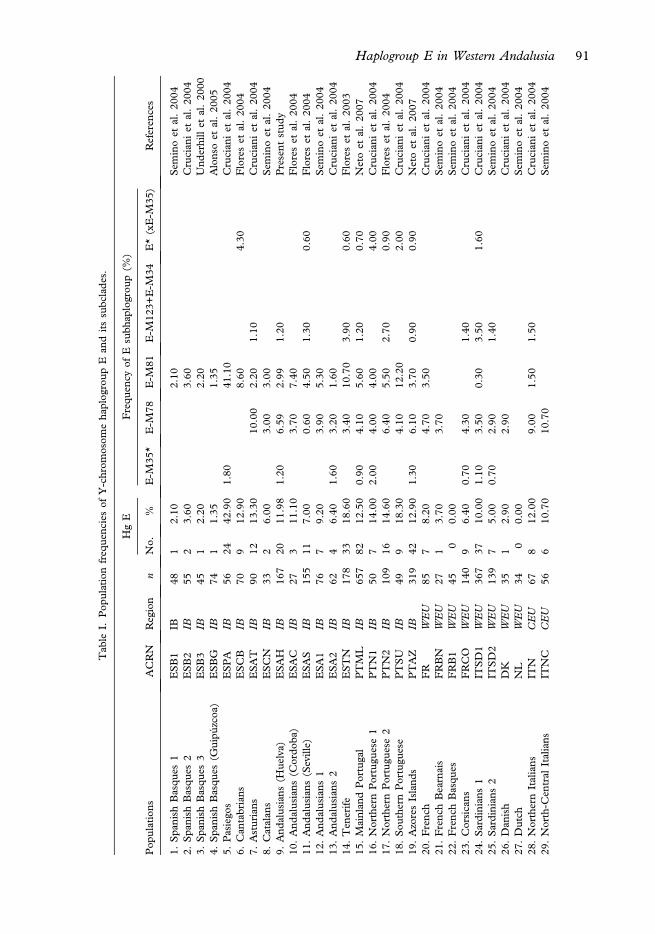
The geographical variation for E subhaplogroups was analysed by hierarchical clusteranalysis (HCA) using the statistical program SPAD (Système Portable Pour L’Analyse deDonnés; Lebart et al. 1984). HCA was performed on the basis of Euclidean distances andWard’s linkage algorithm, and analysis of variance was used to evaluate distances betweenclusters. We included data sets from 73 population samples in the literature: 52 from Europe(17 from the Iberian mainland and two from Iberian islands), 13 from North Africa(including eight from Morocco), four from the Middle East, and four from WesternAsia. Genetic information was based on population frequencies of the following E lineages:E-M35*, E-M78, E-M81, E-M123+E-M34 and E*(xE1b1b1), which contained lineageswith interesting geographic variation patterns. Populations were denoted by the first twoletters used in country code top-level domains for Internet addresses (http://www.iana.org/cctld/). The sample size for each population sample selected was ‡ 20. In the present state ofthe literature, sample sizes of several interesting populations are lower than 50 individuals,and thus the standard deviations can be high in relation to the sample frequencies. However,those samples have been included in Table I in accordance with the great majority of thepublished studies on the subject.
90 B. Ambrosio et al.
Tab
leI.
Pop
ulationfreq
uenc
iesof
Y-chrom
osom
eha
plog
roup
Ean
ditssubc
lade
s.
HgE
Frequ
ency
ofE
subh
aplogrou
p(%
)
Pop
ulations
ACRN
Region
nNo.
%E-M
35*
E-M
78E-M
81E-M
123+
E-M
34E*(xE-M
35)
Referen
ces
1.Spa
nish
Basqu
es1
ESB1
IB48
12.10
2.10
Sem
inoet
al.20
042.
Spa
nish
Basqu
es2
ESB2
IB55
23.60
3.60
Crucian
iet
al.20
043.
Spa
nish
Basqu
es3
ESB3
IB45
12.20
2.20
Und
erhillet
al.20
004.
Spa
nish
Basqu
es(G
uipú
zcoa
)ESBG
IB74
11.35
1.35
Alonsoet
al.20
055.
Pasiego
sESPA
IB56
2442
.90
1.80
41.10
Crucian
iet
al.20
046.
Can
tabrians
ESCB
IB70
912
.90
8.60
4.30
Floreset
al.20
047.
Asturians
ESAT
IB90
1213
.30
10.00
2.20
1.10
Crucian
iet
al.20
048.
Catalan
sESCN
IB33
26.00
3.00
3.00
Sem
inoet
al.20
049.
And
alusians
(Hue
lva)
ESAH
IB16
720
11.98
1.20
6.59
2.99
1.20
Present
stud
y10
.And
alusians
(Cordo
ba)
ESAC
IB27
311
.10
3.70
7.40
Floreset
al.20
0411
.And
alusians
(Seville)
ESAS
IB15
511
7.00
0.60
4.50
1.30
0.60
Floreset
al.20
0412
.And
alusians
1ESA1
IB76
79.20
3.90
5.30
Sem
inoet
al.20
0413
.And
alusians
2ESA2
IB62
46.40
1.60
3.20
1.60
Crucian
iet
al.20
0414
.Ten
erife
ESTN
IB17
833
18.60
3.40
10.70
3.90
0.60
Floreset
al.20
0315
.M
ainlan
dPortugal
PTM
LIB
657
8212
.50
0.90
4.10
5.60
1.20
0.70
Netoet
al.20
0716
.NorthernPortugu
ese1
PTN1
IB50
714
.00
2.00
4.00
4.00
4.00
Crucian
iet
al.20
0417
.NorthernPortugu
ese2
PTN2
IB10
916
14.60
6.40
5.50
2.70
0.90
Floreset
al.20
0418
.Sou
thernPortugu
ese
PTSU
IB49
918
.30
4.10
12.20
2.00
Crucian
iet
al.20
0419
.AzoresIsland
sPTAZ
IB31
942
12.90
1.30
6.10
3.70
0.90
0.90
Netoet
al.20
0720
.Frenc
hFR
WEU
857
8.20
4.70
3.50
Crucian
iet
al.20
0421
.Frenc
hBearnais
FRBN
WEU
271
3.70
3.70
Sem
inoet
al.20
0422
.Frenc
hBasqu
esFRB1
WEU
450
0.00
Sem
inoet
al.20
0423
.Corsicans
FRCO
WEU
140
96.40
0.70
4.30
1.40
Crucian
iet
al.20
0424
.Sardinian
s1
ITSD1
WEU
367
3710
.00
1.10
3.50
0.30
3.50
1.60
Crucian
iet
al.20
0425
.Sardinian
s2
ITSD2
WEU
139
75.00
0.70
2.90
1.40
Sem
inoet
al.20
0426
.Dan
ish
DK
WEU
351
2.90
2.90
Crucian
iet
al.20
0427
.Dutch
NL
WEU
340
0.00
Sem
inoet
al.20
0428
.NorthernItalians
ITN
CEU
678
12.00
9.00
1.50
1.50
Crucian
iet
al.20
0429
.North-C
entral
Italians
ITNC
CEU
566
10.70
10.70
Sem
inoet
al.20
04
Haplogroup E in Western Andalusia 91

Tab
leI(C
ontin
ued)
HgE
Frequ
ency
ofE
subh
aplogrou
p(%
)
Pop
ulations
ACRN
Region
nNo.
%E-M
35*
E-M
78E-M
81E-M
123+
E-M
34E*(xE-M
35)
Referen
ces
30.Cen
tral
Italians
ITC
CEU
8912
13.40
11.20
2.20
Crucian
iet
al.20
0431
.Sou
thernItalians
ITS
CEU
8712
13.80
11.50
2.30
Crucian
iet
al.20
0432
.Sou
thernItalians
(Calab
ria1)
ITCL1
CEU
8018
22.70
1.30
16.30
1.30
2.50
1.30
Sem
inoet
al.20
0433
.Sou
thernItalians
(Calab
ria2)
ITCL2
CEU
6816
23.50
1.50
5.90
13.20
2.90
Sem
inoet
al.20
0434
.Sou
thernItalians
(Apu
lia)
ITAP
CEU
8612
13.90
11.60
2.30
Sem
inoet
al.20
0435
.Sicilian
s1
ITSY1
CEU
136
2921
.30
14.00
0.70
6.60
Crucian
iet
al.20
0436
.Sicilian
s2
ITSY2
CEU
5515
27.30
5.50
12.70
5.50
3.60
Sem
inoet
al.20
0437
.M
ainlan
dCroatia
HRML
EEU
108
65.60
5.60
Peri� cic
etal.20
0538
.Herzego
vinian
sBA
EEU
141
128.50
8.50
Peri� cic
etal.20
0539
.Serbian
sRS
EEU
113
2421
.25
20.35
0.90
Peri� cic
etal.20
0540
.Maced
onians
MK
EEU
7919
24.06
24.06
Peri� cic
etal.20
0541
.Polish1
PL1
EEU
994
4.00
4.00
Sem
inoet
al.20
0442
.Polish2
PL2
EEU
381
2.60
2.60
Crucian
iet
al.20
0443
.Hun
garian
sHU
EEU
535
9.40
7.50
1.90
Sem
inoet
al.20
0444
.Eston
ians
EE
EEU
744
5.50
1.40
4.10
Crucian
iet
al.20
0445
.Russian
sRU
EEU
420
0.00
Crucian
iet
al.20
0446
.Ukrainian
UA
EEU
938
8.60
7.50
1.10
Sem
inoet
al.20
0447
.Geo
rgian
GE
EEU
410
0.00
Sem
inoet
al.20
0448
.Balkarian
(Sou
thernCau
casus)
RUBK
EEU
391
2.60
2.60
Sem
inoet
al.20
0449
.Bulgarian
sBG
EEU
116
2521
.60
20.70
0.90
Crucian
iet
al.20
0450
.Alban
ians
AL1
EEU
4411
25.00
25.00
Sem
inoet
al.20
0451
.NorthernGreeks(M
aced
onia)
GRMA
EEU
5912
20.30
18.60
1.70
Sem
inoet
al.20
0452
.Greeks
GR
EEU
8420
23.80
21.40
2.40
Sem
inoet
al.20
0453
.Turkish
(Edirne)
TRED
EAS
528
15.38
11.54
3.85
Cinnio� g
luet
al.20
0454
.Turkish
(Kars)
TRKA
EAS
8212
14.63
8.54
6.10
Cinnio� g
luet
al.20
0455
.Turkish
(Kon
ya)
TRKO
EAS
908
8.89
1.11
1.11
6.67
Cinnio� g
luet
al.20
0456
.Turkish
(Istan
bul)
TRIS
EAS
8113
16.05
7.41
4.94
3.70
Cinnio� g
luet
al.20
0457
.Iraq
iIQ
MDE
218
209.20
5.50
2.80
0.90
Sem
inoet
al.20
0458
.Leb
anese
LB
MDE
428
19.10
11.90
2.40
4.80
Sem
inoet
al.20
04
92 B. Ambrosio et al.

Tab
leI(C
ontin
ued)
HgE
Frequ
ency
ofE
subh
aplogrou
p(%
)
Pop
ulations
ACRN
Region
nNo.
%E-M
35*
E-M
78E-M
81E-M
123+
E-M
34E*(xE-M
35)
Referen
ces
59.Ashkena
zim
Jewish
ILA
MDE
7714
18.20
1.30
5.20
11.70
Sem
inoet
al.20
0460
.Sep
hardim
Jewish
ILS
MDE
4012
30.00
2.50
12.50
5.00
10.00
Sem
inoet
al.20
0461
.M
oroc
can(A
rabs)1
MAA1
NAF
5439
72.30
38.90
31.50
1.90
Crucian
iet
al.20
0462
.M
oroc
can(A
rabs)2
MAA2
NAF
4937
75.50
42.90
32.60
Sem
inoet
al.20
0463
.M
oroc
can(A
rabs)3
MAA3
NAF
4432
72.80
2.30
11.40
52.30
6.80
Sem
inoet
al.20
0464
.M
oyen
Atlas
(Berbe
rs)
MABA
NAF
6960
86.90
10.10
71.00
5.80
Crucian
iet
al.20
0465
.M
arrakesh
(Berbe
rs)
MABM
NAF
2926
89.50
3.40
6.90
72.40
3.40
3.40
Crucian
iet
al.20
0466
.M
oroc
co(B
erbe
rs)
MAB
NAF
6455
85.90
10.90
68.70
6.30
Sem
inoet
al.20
0467
.M
oroc
co(N
orth-
Cen
tral
Berbe
rs)
MABN
NAF
6355
87.30
7.90
1.60
65.10
12.70
Sem
inoet
al.20
04
68.M
oroc
co(Sou
thern
Berbe
rs)
MABS
NAF
4035
87.50
7.50
12.50
65.00
2.50
Sem
inoet
al.20
04
69.Sah
araw
ish
EH
NAF
2924
82.70
75.90
6.80
Sem
inoet
al.20
0470
.Algerians
DZ
NAF
3221
65.60
3.10
6.30
53.10
3.10
Sem
inoet
al.20
0471
.Tun
isians
TN
NAF
5832
55.10
3.40
15.50
27.60
5.20
3.40
Sem
inoet
al.20
0472
.NorthernEgyptians
EGN
NAF
218
38.20
28.60
4.80
4.80
Crucian
iet
al.20
0473
.Sou
thernEgyptians
EGS
NAF
346
17.60
17.60
Crucian
iet
al.20
04
Haplogroup E in Western Andalusia 93
Results
The clade E emerged as the second most common haplogroup in autochthonous Anda-lusians from Huelva, with a high frequency (12%, 20/167 individuals) in comparison toother Spanish populations. The corresponding value in neighbouring southern Portugal is18% (Cruciani et al. 2004). Most of the Y chromosomes analysed in the Andalusianpopulation from Huelva belongs to the R1b lineage (R-P25), with an incidence of 59.9%.
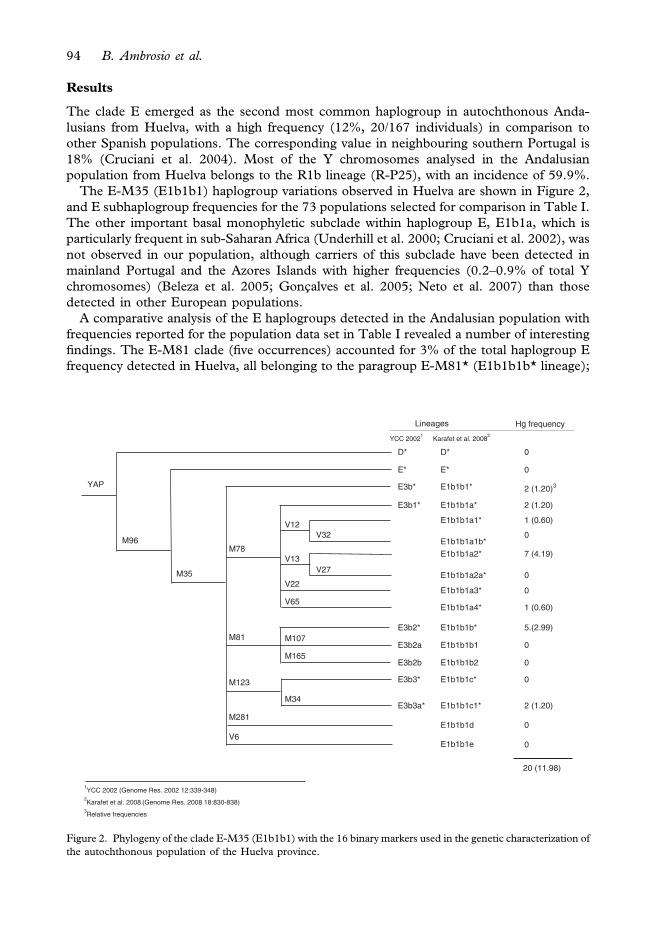
The E-M35 (E1b1b1) haplogroup variations observed in Huelva are shown in Figure 2,and E subhaplogroup frequencies for the 73 populations selected for comparison in Table I.The other important basal monophyletic subclade within haplogroup E, E1b1a, which isparticularly frequent in sub-Saharan Africa (Underhill et al. 2000; Cruciani et al. 2002), wasnot observed in our population, although carriers of this subclade have been detected inmainland Portugal and the Azores Islands with higher frequencies (0.2–0.9% of total Ychromosomes) (Beleza et al. 2005; Gonçalves et al. 2005; Neto et al. 2007) than thosedetected in other European populations.
A comparative analysis of the E haplogroups detected in the Andalusian population withfrequencies reported for the population data set in Table I revealed a number of interestingfindings. The E-M81 clade (five occurrences) accounted for 3% of the total haplogroup Efrequency detected in Huelva, all belonging to the paragroup E-M81* (E1b1b1b* lineage);
Lineages
YCC 20021
D* D*
E*
E1b1b1*
E1b1b1a*
E1b1b1a1*
E1b1b1a1b*
E1b1b1a2*
E1b1b1a2a*
E1b1b1a3*
E1b1b1a4*
E1b1b1b*
E1b1b1b1
E1b1b1b2
E1b1b1c*
E1b1b1c1*
E1b1b1d
E3b3a*
E3b3*
E3b2b
E3b2a
E3b2*
E1b1b1e
20 (11.98)
0
0
0
0
0
0
0
0
1 (0.60)
2 (1.20)
2 (1.20)3
0
0
Hg frequency
5.(2.99)
7 (4.19)
1 (0.60)
2 (1.20)
E*
E3b*
E3b1*
V12V32
V27V13
V22
V65
M107
M165
M34
M123
M81
M78
M35
M96
YAP
M281
V6
1YCC 2002 (Genome Res. 2002 12:339-348)
2Karafet et al. 2008
(Genome Res. 2008 18:830-838)
3Relative frequencies
Karafet et al. 20082
Figure 2. Phylogeny of the clade E-M35 (E1b1b1) with the 16 binary markers used in the genetic characterization ofthe autochthonous population of the Huelva province.
94 B. Ambrosio et al.

this frequency is similar to the mean value observed in Basques (Alonso et al. 2005) andlower than that reported for the majority of Spanish (Adams et al. 2008; Capelli et al. 2009),French (3.5%) and Portuguese populations (12% in mainland Portugal (Cruciani et al.2004) and 4% in the Azores Islands (Neto et al. 2007)). Phylogeographic analysis of theE-M81 lineages in Mediterranean populations has shown these lineages to be remarkablyfrequent in Berbers (80% in Mozabites; 65–73% in Berbers from Morocco) (Cruciani et al.2004; Semino et al. 2004) although their frequency declines sharply towards the north east(Egypt ffi5%). E-M81 lineages are practically absent in Eastern Europe (Peri�cic et al. 2005)and uncommon in Italy, with the exception of Sicily (5.5%) (Semino et al. 2004) where therewas an Islamic occupation that lasted for over two centuries (878–1091 AD). Presuming thatthe presence of E-M81 in southwestern Europe is a signature of a North-African gene poolshared also by Berbers, these migrants seem to have left a much smaller genetic imprint inthe male gene pool of Huelva than in other parts of Spain.
Our study also showed that most of the Y chromosomes carrying the E-M78-derived allelewere further classified into the E-V13 subhaplogroup (E1b1b1a2). The frequency of E-V13 inour study populationwas relatively high (seven occurrences, 4.2%of total) in comparisonwithother Iberian populations. In North Africa, this subhaplogroup shows a mean frequency of4.5%, as reported by Cruciani et al. (2007) (see Table I), and is indeed most common inAlbanians (32.30%),Macedonians,Greeks, andBulgarians (15–18%) (Peri�cic et al. 2005). Inour analysis of the subclade E-M78, we also found 2 (1.2%) Y chromosomes in themost basaland rare paragroup, E-M78*, one (0.60%) in E-V12, and, interestingly, a single occurrence ofE-V65 (0.60%). The average frequency of E-M78* has been estimated at 0.08% (Crucianiet al. 2007) (see Table I) and the highest values have been registered in Egyptians fromGurna(5.9%), followed byMoroccan Arabs (3.6%) and Sardinians (0.27%). No occurrences of thissubhaplogroup were found in any of the other 81 populations included in the analysisby Cruciani et al. (2007). The subhaplogroup E-V12 has also been found in high frequenciesin Egyptians (ranging from 44% in the south to 6% in the north) and in Berbers (3.5%) andMoroccan Jews (2%). The surprisingly high frequency observed in French Basques (6%, oneoccurrence) seems to be due to the small size of the sample. The frequency of the sub-haplogroup E-V65 in the sample from Huelva coincides with the mean frequency reportedby Cruciani et al. (2007) in Table I. E-V65 is relatively frequent in Arabs from northMorocco(29%) and Libya (20%) but less common in other groups from Morocco, and in Libyans,Egyptians, Sardinians, and Sicilians.
Finally, E-M34 (E1b1b1c1*), a lineage internal to the E-M123 haplogroup, was found in1.2% of the Huelvan sample (two occurrences). The E-M34 lineage has been found atrelatively high frequencies in Jews (10–12%) and in a sample from Calabria (13%). Thecorresponding frequencies reported for Turkey and Tunisia are between 5% and 6%.
It is worth noting that two individuals (1.2% of total) in our study sample were found tocarry the derived state at M35 but not at all other known SNPs further downstream (http://www.familytreedna.com/public/E3b/). The deep paragroup E-M35* (E1b1b1*, formerlyE3b*) is rare in Europe (~0.4%) but present in high frequencies in East Africa (8%-17%)(Cruciani et al. 2004). Other frequencies reported for this paragroup are 8% for MoroccanBerbers, 5.5% for Sicilians, 3% for Algerians and Tunisians, 2.5% for Sephardic Jews, and1.3% for Ashkenazi Jews (see references in Table I of present study).
Frequency and structure of Y-STR haplotypes associated with each E binary markersdetected in the study Andalusian population sample is shown in Table II. The analysisinitially revealed a high haplogroup diversity for the E-M35 clade (h = 0.8211 ± 0.06) beingthe subclade E-M78 that yielding a rather high level of SNP h (0.5906 ± 0.15). The subcladeE-M78 also revealed a high level of internal Y-STR diversity (H = 0.9818 ± 0.05), with a
Haplogroup E in Western Andalusia 95

Tab
leII.Distributionof
Y-chrom
osom
eha
plotyp
esam
ongthesubh
aplogrou
psE
foun
din
Hue
lva(Spa
in).
Hap
lotype
sHap
logrou
psDYS19
DYS38
9IDYS38
9II
DYS39
0DYS39
1DYS39
2DYS39
3DYS38
5a,b
DYS43
8DYS43
9Frequ
ency
H1
E1b
1b1*
-M
3514
1330
229
1114
12,13
1011
1H2
E1b
1b1*
-M
3514
1330
229
1114
13,13
1011
1H3
E1b
1b1a
*-M
7814
1432
2410
1113
18,21
1013
1H4
E1b
1b1a
*-M
7815
1431
2511
1113
16,20
1012
1H5
E1b
1b1a
1*-V12
1313
3124
1111
1316
,17
1012
1H6
E1b
1b1a
2*-V13
1313
3024
1011
1217
,19
1012
1H7
E1b
1b1a
2*-V13
1313
3024
1011
1316
,17
1014
1H8
E1b
1b1a
2*-V13
1313
3024
1011
1316
,18
1012
1H9
E1b
1b1a
2*-V13
1313
3024
1011
1316
,18
1013
2H10
E1b
1b1a
2*-V13
1313
3025
1011
1316
,18
1014
1H11
E1b
1b1a
2*-V13
1313
3123
1011
1317
,18
1012
1H12
E1b
1b1a
4-V65
1312
2924
1111
1316
,17
1010
1H13
E1b
1b1b
*-M
8113
1430
249
1113
13,14
1010
4H14
E1b
1b1b
*-M
8114
1430
249
1113
13,14
1010
1H15
E1b
1b1c
1*-M
3413
1330
2411
1113
15,16
1013
1H16
E1b
1b1c
1*-M
3413
1331
2410
1113
16,16
1012
1
96 B. Ambrosio et al.

mean variance of 0.3933 ± 0.24. Conversely, the haplotype variability within the sistersubclade E-M81 was much lower (0.4000 ± 0.24): Four of the five males carrying the M81marker had identical Y-haplotypes: DYS389I(14)-DYS389II(30)-DYS390(24)-DYS391(9)-DYS392(11)-DYS393(13)-DYS385a/b(13,14)-DYS438(10)-DYS439(10). This find-ing was accompanied by a very low mean variance in allele size (0.0444 ± 0.06). WithinE-M81* the fifth haplotype differed only in one mutational step at the DYS19 locus (13- to14–repeat alleles). Analysis of variance at single Y-microsatellite loci showed that theDYS390 locus yielded the highest value (0.70); the corresponding figure for DYS19 was0.33, with the 13–repeat allele being the most frequent (15 of the 20 YAP+ chromosomesdetected in the study sample). An in-depth analysis of the relationship betweenhaplogroup E frequency and associated haplogroup/haplotype diversities within and betweenlarge geographic areas in the Mediterranean would provide interesting insights into pop-ulation demographic histories.
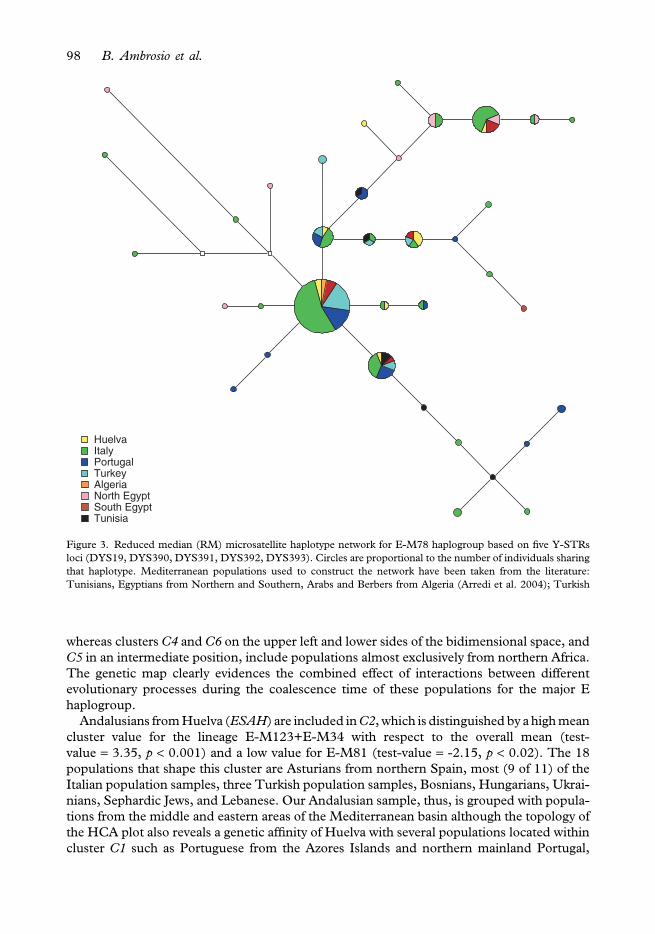
The RM network of E-M78microsatellite haplotypes in a group of Mediterranean samplesavailable in the literature is shown in Figure 3. The population data set included a total of 36distinct haplotypes. The structure of the haplotype network is highly diversified, which is to beexpected given the haplogroup substructure that it includes. The most common node (68 of160 Y chromosomes) is represented by the modal haplotype 13-24-10-11-13 (for the lociDYS19-DYS390-DYS391-DYS392-DYS393, respectively), shared by different populationsinmainland Italy, Turkey, and Portugal and to a lesser extent by southern Egyptians, AlgerianArabs, and Andalusians from Huelva (four chromosomes) (for more details see the legendto Figure 3). This node bears the highest number of connections with other haplotypes (n = 6),strongly suggesting that it is the root, which is in turn the modal haplotype of the network(Crandall andTempleton1993).The longest lineage is composedof sevennodes, separatedbysinglemutational differences. Huelvan Y-haplotypes fall into three nodes (one specific copy ineach), which contain, in varying combinations, most of the populations noted above and otherneighbouring Mediterranean groups. Within this lineage, the third node (represented by theY-STRhaplotype14-24-10-11-13) is representedbymales fromnorthernand southernEgypt,Italy, and Andalusia. We also detected one singleton (haplotypes represented by a singleindividual) in the study sample. Haplotypes showing high frequencies are expected to be goodindicators of when a particular mutation originated, whereas those with low frequencies (rarehaplotypes), usually represented by a single individual, point to a recent evolutionary origin.Indeed they occur preferentially at the tips of networks (Golding 1987; Excoffier andLanganey1989). An RM E-M81 network for the same samples was also constructed but is not shownhere. The most common node for E-M81 (61 of 126 chromosomes) is represented by themodal haplotype 13-24-9-11-13; this coincided with the four identical Y chromosomesdetected in Huelva and is shared – in variable frequencies – by most (n = 8) of the populationsamples analysed.
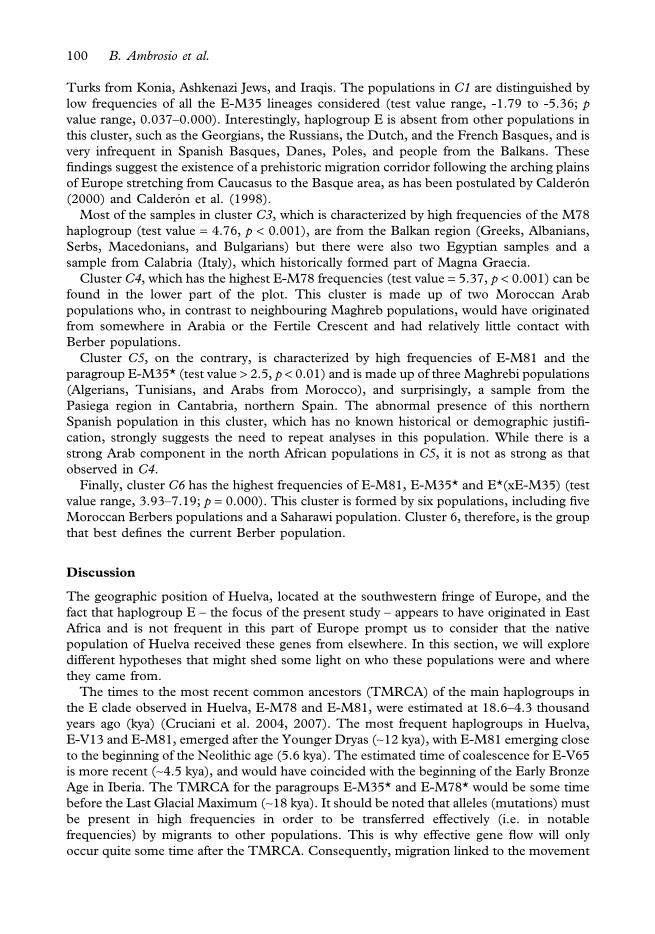
Figure 4 portrays the results of HCA based on frequencies of the E-M35 haplogroup andits main subclades within the data set of populations shown in Table I. Factors I and IIaccount for 97.81% of the variance, with a predominance of factor I (83.83%). Themultivariate analysis formed six distinct clusters, with E-M78 and E-M81 haplogroupscontributing significantly to the pattern observed. With the aim of giving more support to thenumber of clusters (six) suggested by the dendrogram, it is interesting to note that whencomputing the Inertia decomposition on the first two factors, the quotient (Inertia inter-clusters/Inertia Total) = 0.9565. Thus, this amount is highly coherent with the number ofmajor ramifications showed by the tree, and it demonstrates that with six clusters a highpercentage (96%) of the data variation is explained. Clusters C1, C2, and C3 on the right sideof the plot are formed by European, Middle Eastern, and western Eurasian populations,
Haplogroup E in Western Andalusia 97
whereas clusters C4 and C6 on the upper left and lower sides of the bidimensional space, andC5 in an intermediate position, include populations almost exclusively from northern Africa.The genetic map clearly evidences the combined effect of interactions between differentevolutionary processes during the coalescence time of these populations for the major Ehaplogroup.
Andalusians fromHuelva (ESAH) are included inC2, which is distinguished by a highmeancluster value for the lineage E-M123+E-M34 with respect to the overall mean (test-value = 3.35, p < 0.001) and a low value for E-M81 (test-value = -2.15, p < 0.02). The 18populations that shape this cluster are Asturians from northern Spain, most (9 of 11) of theItalian population samples, three Turkish population samples, Bosnians, Hungarians, Ukrai-nians, Sephardic Jews, and Lebanese. Our Andalusian sample, thus, is grouped with popula-tions from the middle and eastern areas of the Mediterranean basin although the topology ofthe HCA plot also reveals a genetic affinity of Huelva with several populations located withincluster C1 such as Portuguese from the Azores Islands and northern mainland Portugal,
HuelvaItalyPortugalTurkeyAlgeriaNorth EgyptSouth EgyptTunisia
Figure 3. Reduced median (RM) microsatellite haplotype network for E-M78 haplogroup based on five Y-STRsloci (DYS19, DYS390, DYS391, DYS392, DYS393). Circles are proportional to the number of individuals sharingthat haplotype. Mediterranean populations used to construct the network have been taken from the literature:Tunisians, Egyptians from Northern and Southern, Arabs and Berbers from Algeria (Arredi et al. 2004); Turkish
98 B. Ambrosio et al.

Andalusians (in general), Andalusians from Cordoba, and French. The genetic topology ofHuelva closely agrees with the results of an earlier analysis of GM immunoglobulin allotypeson the same population sample (Calderón et al. 2006).
Cluster C1 is the most numerous cluster, and contains mostly European populations,including 15 of the 17 population samples analysed in Spain. Also included in this cluster are
-22.5
-4 0 4
EGN
8Factor 1 - 83.83%
Factor 1 - 83.83%
M78
MAA1
MAA2
C4
AL1
MK
GRBG
RS
GRMA
EGS
ITSY1
LB
ITC
ESAT
ESAH
PTAZ
ESASESB2
ESB3
ESCN
ESB1 ESBG
EGN
AL1
MK
GRBG
RSGRMEG
ITCL1
ITSY1
TREDLBILSITSY2
ITNESAITC
TRKAIT BATRIS
UA
HRMLFR
PTN2ESAH
C2
C3
M123/M34
PTMLPTAZ
PTNITSD1 IL
ITCL
ITSD
ESBGFRBESB1ESB2
ESB3ESAS
ESCBE*(xE-M35)
M35 ESAC ESA1C1
ESTNPTSU
TRKESAGE
ITA IT
TRKO
ESA3
RUNL
FRB1PL2
RUBK GEITSD2
ITSD1PTN1
PL1EEFRBN
FRESA1PTML
ESAC
ESCB
ESTNPTSU
7.5
0
-7.5
-15.0
Factor 2-13.98%
-60 -45 -30 -15 0
PTN2
ITCL1
ITSY2 ILS
C3
C2
C1
ITN
TREDITAP
ITSITNC
TRKABA
HUUA
ILATRIS
ITCL2HRMLIQ
FRCODK
MAA3
DZ
ESPA
TN
C5
MABS
MAB
MABA
MABM
M81
C6
EHMABN
Factor 2-13.98%
10
0
-10
-20
-30
a.
b.
Figure 4. (a) Hierarchical cluster analysis (HCA) of 73 European, Western Asian, Middle Eastern and NorthernAfrican populations based on Y-chromosomal diversity of E-M35 subhaplogroups (M35, M78, M81, M123+M34and E*(xE-M35)). (b) A zoom plot of clusters C1, C2 and C3. Population codes are as in Table I.
Haplogroup E in Western Andalusia 99
Turks from Konia, Ashkenazi Jews, and Iraqis. The populations in C1 are distinguished bylow frequencies of all the E-M35 lineages considered (test value range, -1.79 to -5.36; pvalue range, 0.037–0.000). Interestingly, haplogroup E is absent from other populations inthis cluster, such as the Georgians, the Russians, the Dutch, and the French Basques, and isvery infrequent in Spanish Basques, Danes, Poles, and people from the Balkans. Thesefindings suggest the existence of a prehistoric migration corridor following the arching plainsof Europe stretching from Caucasus to the Basque area, as has been postulated by Calderón(2000) and Calderón et al. (1998).
Most of the samples in cluster C3, which is characterized by high frequencies of the M78haplogroup (test value = 4.76, p < 0.001), are from the Balkan region (Greeks, Albanians,Serbs, Macedonians, and Bulgarians) but there were also two Egyptian samples and asample from Calabria (Italy), which historically formed part of Magna Graecia.
Cluster C4, which has the highest E-M78 frequencies (test value = 5.37, p < 0.001) can befound in the lower part of the plot. This cluster is made up of two Moroccan Arabpopulations who, in contrast to neighbouring Maghreb populations, would have originatedfrom somewhere in Arabia or the Fertile Crescent and had relatively little contact withBerber populations.
Cluster C5, on the contrary, is characterized by high frequencies of E-M81 and theparagroup E-M35* (test value > 2.5, p < 0.01) and is made up of three Maghrebi populations(Algerians, Tunisians, and Arabs from Morocco), and surprisingly, a sample from thePasiega region in Cantabria, northern Spain. The abnormal presence of this northernSpanish population in this cluster, which has no known historical or demographic justifi-cation, strongly suggests the need to repeat analyses in this population. While there is astrong Arab component in the north African populations in C5, it is not as strong as thatobserved in C4.
Finally, cluster C6 has the highest frequencies of E-M81, E-M35* and E*(xE-M35) (testvalue range, 3.93–7.19; p = 0.000). This cluster is formed by six populations, including fiveMoroccan Berbers populations and a Saharawi population. Cluster 6, therefore, is the groupthat best defines the current Berber population.
Discussion
The geographic position of Huelva, located at the southwestern fringe of Europe, and thefact that haplogroup E – the focus of the present study – appears to have originated in EastAfrica and is not frequent in this part of Europe prompt us to consider that the nativepopulation of Huelva received these genes from elsewhere. In this section, we will exploredifferent hypotheses that might shed some light on who these populations were and wherethey came from.
The times to the most recent common ancestors (TMRCA) of the main haplogroups inthe E clade observed in Huelva, E-M78 and E-M81, were estimated at 18.6–4.3 thousandyears ago (kya) (Cruciani et al. 2004, 2007). The most frequent haplogroups in Huelva,E-V13 and E-M81, emerged after the Younger Dryas (~12 kya), with E-M81 emerging closeto the beginning of the Neolithic age (5.6 kya). The estimated time of coalescence for E-V65is more recent (~4.5 kya), and would have coincided with the beginning of the Early BronzeAge in Iberia. The TMRCA for the paragroups E-M35* and E-M78* would be some timebefore the Last Glacial Maximum (~18 kya). It should be noted that alleles (mutations) mustbe present in high frequencies in order to be transferred effectively (i.e. in notablefrequencies) by migrants to other populations. This is why effective gene flow will onlyoccur quite some time after the TMRCA. Consequently, migration linked to the movement
100 B. Ambrosio et al.

of males with E-M35 lineages should be situated within a relatively recent evolutionaryperiod. In this context, it should be noted that TMRCA estimates are dependent on manyassumptions about mutational processes and population structures (Hein et al. 2005).
The wide but non-homogeneous spatial distribution pattern of E-M81 chromosomes inIberia does not seem to be concordant with the regions in which Islamic occupation wasmost intense and prolonged (Lopez-Davalillo 2000; Martinez-Ruiz et al. 2003). This wouldstrengthen the hypothesis that migratory movements took place betweenMaghreb and Iberiaprior to the Islamic occupation, and those other important movements within the peninsulaoccurred later (Calderón 2006). The Islamic occupation of western Andalusia lasted from711 to 1262 and 5 years later Portugal and Castile (Spain) agreed on the southern borderdividing their kingdoms. The Berbers, who arrived in several waves, were the mostnumerous of all the migrant populations that arrived in Iberia during Islamic rule. It hasbeen estimated that around one-third of the 300 000 Berbers that arrived during these yearsdid so in the eighth century (Mackay 1977), a time when the total population of thepeninsula has been estimated at between 6 and 7 million (Dupaquier 1997). The Berberstended to settle in the mountainous areas of the peninsula and, interestingly, most of themwere men of reproductive age, many of whom came with their wives, also Berbers in manycases. Some of the descendants of these early occupiers were to return to Maghreb between1264 and 1609. There are several relevant historical contexts preceding the Islamicoccupation that are likely to have had a considerable impact on population dynamics inthe Mediterranean area and in the Iberian Peninsula in particular. These were (i) theexistence of a Berber gene flow associated with the Carthaginian period, which included aportion of north African natives; (ii) the establishment of the Roman Empire on both sides ofthe Strait of Gibraltar, which considerably improved communication and safety throughoutthe Empire; and (iii) the considerable and lasting difference in population sizes betweenEurope and North Africa (always higher in Europe), which would explain the low NorthAfrican contribution to the gene pool in Europe, although the Berbers did leave a geneticimprint in numerous locations in Europe due to the remarkably high frequency of E-M81 inthis population.
The levels of E-V13* detected in our study population could perhaps be explained bypossible contact with populations that would have travelled by sea from areas under Greekcontrol during the protohistoric period, when the Kingdom of Tartessos gained strategicimportance thanks to its extraordinarily rich deposits of copper, silver, and tin. Abundantremains of the Tartessian culture have been found in the area of Huelva, in particular,remains corresponding to the period after the eight century BC marked by intense contactswith civilizations from the eastern Mediterranean (Almagro-Basch et al. 1974; Fernandez-Jurado et al. 1997). Herodotus, in 1.163, reports that ‘the Phocaean were the first of theGreeks who performed long voyages, and it was they who made the Greeks acquainted withthe Adriatic and with Tyrrhenia, with Iberia, and the city of Tartessos. The vessel which theyused in their voyages was the long penteconter (50–oared ship). On their arrival at Tartessus,the King Arganthonius took a liking to them. He begged the Phocaeans to quit Ionia andsettle in whatever part of his country they liked’ (Placido 1999). The existence of traderelations across the Mediterranean Sea therefore seems to be a more plausible explanationfor this gene flow into Huelva than the theory of population movements following the long,winding river waters connecting the southern Balkans and north-central Europe as Peri�cicet al. (2005) and others have suggested. Nonetheless, a small proportion of the E-V13Y-chromosomes found in Huelva might have arrived much later, through the Visigoths, whotravelled to Hispania after 411 AD from the northern region of the Black Sea and theBalkans.
Haplogroup E in Western Andalusia 101

The presence of Y chromosomes E-M78* and E-V12* might be due to an Egyptian geneflow, which is supported by historical evidence. Around 742 AD, a large army led by theSyrian Balch arrived in the Iberian Peninsula to suppress a Berber rebellion against theArabs. The army was made up of several contingents (chunds) from different Islamizedregions of the Levant and Egypt. Following the defeat of the Berbers, the troops wereseparated according to their regions of origin and sent to different parts of the south of thepeninsula. Part of the Egyptian contingent settled in the district of Beja (today a Portuguesetown bordering Huelva; Ajbar Machmuâ, translated into Spanish by Lafuente Alcántara.Madrid 1867; Ibn-Al-Jatib cited in Dozy, Recherches, I3, 78 Leyden 1881).
The V65 marker detected should also be considered a signature of the Arabs. BecauseArabs also settled in Maghreb after the Islamic conquest of this region, the E-V65chromosomes in Huelva might have come directly from the Middle East, without necessarilyhaving passed through an intermediate North African reproductive stage. It has beenestimated that the first influx of Arabs into the Iberian Peninsula numbered 30 000–40000, a relatively small number and substantially inferior to that of the Berbers. This firstgroup of Arabs consisted of two rival tribes: The Qaysi, from the north of the ArabianPeninsula, who eventually settled in the province of Huelva, and the Yameni from the south.Arabs, unlike Berbers, settled mostly in cities, chose their wives from among the Visigothicnobility, avoiding marriage with Berbers. Many were rich and powerful and, interestingly,they practised polygamy, which would have had a multiplier effect on chromosome Ylineages. By way of example, the 10 emirs and caliphs that governed Cordoba between 756and 1013 had at least 143 sons (who did not die prematurely) who had male offspringranging from 40 to none (Vallvé 1977).
Following the Reconquista of western Andalusia, a considerable proportion of the Muslimpopulation, who had lived there for over 5 centuries, left these lands for Granada orMorocco. Later, during the 14th and 15th centuries, about 400 000 Muslims (»4.5% of thetotal population) abandoned the peninsula, and in 1609, with the passing of the decree toexpel Moriscos (Spanish Muslims), many were sent to North Africa (Morocco and Algeria),a region considerably less populated than the Iberian Peninsula (Lopez-Davalillo 2000).A portion of the present Moroccan and Algerian Arab and Berber male gene pool would thushave remained a long period of time in the Iberian Peninsula. As far as the E-M35 isconcerned, populations carrying this mutation from East Africa would presumably havemigrated to southwestern Andalusia after an intermediary settlement period alongsideMaghreb Berbers during the Islamic occupation. The frequencies of this mutation observedin Jewish populations could be the result of previous contact with populations from theMiddle East and West Africa or later links with Berbers in North Africa.
Finally, the Jewish settlements in Andalusia could explain the frequency of the E-M34subclade in Huelva. Tartessos is mentioned numerous times in ancient writing sources(see Myro 1999 for a list of citations), indicating the existence of close contact between bothextremes of the Mediterranean dating back many centuries. In Andalusia, there were Jewishcommunities at least as far back as the time of the Roman Empire (García Iglesias 1978).
Several requisites must be satisfied for a source population to contribute noticeably tofrequencies of a particular genetic marker in a recipient population. Firstly, the frequenciesof the marker in the source population and the size of the migrating population in relation tothat of the recipient population must be high enough in order not to excessively dilute thegene flow. When testing such a hypothesis, thus, it is necessary to analyse the demographicsizes of both populations and the relative and absolute frequencies of the marker in question.Because human genetic diversity mainly seems to consist of frequency clines (Serre andPääbo 2004), substantial initial differences in frequencies are generally found between
102 B. Ambrosio et al.

sources and recipients when populations are separated by large distances or abrupt barriers.Gene frequencies only reach high enough levels to produce an effective admixture (i.e. afrequency that lasts and is easy to detect) in the recipient population a long time after themutation event occurred in the source population. Occasional, motivated group migrationstherefore are more plausible and genetically effective than small persistent, gene flows.A recipient population can receive a particular gene directly from the source population orthrough intermediate populations which inherited it from the source group. In such a case,however, effective gene flow is seriously compromised by the time required for themovement to be completed and the mutation frequencies that would occur in the inter-mediate populations. This reduces the number of theoretically possible migrations to just afew plausible ones. Migrations that occur in several stages have several characteristics.Firstly, a considerable amount of time is required at each stage for admixture to occur and tohave an effect on the spread of gene in the next stage; and secondly, there is a progressivereduction of gene frequencies at each intermediate stage (population) governed by thedecreasing power law, fi = ki fo, where fo is the marker frequency in the original sourcepopulation, fi the marker frequency at each stage i, and k the roughly constant fraction ofmigrants at each stage. For example, with k = 0.25 and i = 3, f3 = 0.156 fo. Consequently, justa few stages are necessary to reduce gene frequency in the final recipient population to a levelof close to zero, regardless of the frequency of the marker in the original source population. Itwould therefore seem logical to reject hypotheses involving migrations that occur in severalstages because the final effect in the recipient population would be negligible.
Populations that have not experienced direct gene flow might have similar proportions of aparticular genetic marker if a source population, which might even be now extinct, had sentthe same proportion of migrants in two opposite directions but in what was considered asingle migratory movement. In such a case, an allele would have virtually travelled twice asfar as the distance covered by the migrants. The Mediterranean space is characterized byrelatively short distances and an absence of major geographic barriers (maximum sea spansare 3800 km from east to west and 900 km from north to south and the land distancefollowing the north African coastline is 5740 km) (Hofrichter 2004). This means that itcould be crossed without great difficulties by foot, horse, or rudimentary ships. The mainrestriction to human movement would have been the presence of hostile humans. Untilrecent times, sea travel would have been the most rapid and safest mode of transport.
Because we generally know less about ancient, prehistoric migratory processes than we doabout more recent processes, it is more difficult to reject hypotheses regarding earlierprocesses and discover caveats in later ones, particular when there are well documentedmigrations and information on what motivated the movement (trade, wars, matingsearches). Historic movements, however, must not be ignored, and relevant parametersrelating to known recent migrations must be estimated and added to hypotheses regardingthese movements.
Many of the genetic traits that characterize human populations everywhere are the result ofmigratory processes that have shaped the general peopling of the world. Basques, forexample, are different because they have not been effective gene sources and have aweak signature from East Asia (Calderón et al. 1998; Hellenthal et al. 2008) Berbers aredifferent because they lived in moderately small numbers in a long, narrow area bordered bythe sea and the desert and have a very high frequency of certain genetic markers (e.g.haplogroup E) which has been transmitted in low frequencies to many European popula-tions; and Andalusians from Huelva are different in that they have a considerable proportionof gene markers from the opposite Eastern edge of the Mediterranean.
Haplogroup E in Western Andalusia 103

Conclusions
Our analysis of the Y-chromosome haplogroup E in the native population of Huelva revealeda complex admixture of genetic markers from the Mediterranean space, with interestingsignatures of populations from the Middle East and the Balkan Peninsula and a surprisinglylow influence by Berber populations compared to other areas of the Iberian Peninsula. Theseparticular traits can, plausibly, be explained by protohistoric and other documentedhistorical movements against the backdrop of the Tartessian civilization, the rise and fallof the Roman Empire, and the different migrations associated with the expansion anddecline of Islam during the Middle Ages. We believe that an explanation based onprehistoric movements is less plausible. As a result of the magnitude of these migratorymovements, Huelva occupies a central position on the Mediterranean genetic map, despiteits location at the western edge of the Mediterranean Basin.
Acknowledgements
We express our sincere thanks to the people of Huelva who generously donated bloodsamples to contribute to this study, and also to Dr A. Fernández-Jurado from theHaematology Department and Dr E. Prado and Dr D. Fernández from the BloodTransfusion Center at Hospital Juan Ramón Jiménez in Huelva for their invaluable helpin organizing the fieldwork to collect samples, and to Dr P. Cuesta from ComplutenseComputer Center for his help with statistical analysis. This research was supported by grantsfrom the Spanish Ministry of Education and Science (Investigation ProjectsBOS2002-01677 and CGL2006-04749/BOS) awarded to RC and from the Italian Ministerodell’Istruzione, dell’Università e della Ricerca (MIUR-PRIN 2007) awarded to AN.
References
Adams SM, Bosch E, Balaresque PL, Ballereau SJ, Lee AC, Arroyo E, López-Parra AM, Aler M, Grifo MSG, BrionM, Carracedo A, Lavinha J, Martínez-Jarreta B, Quintana-Murci L, Picornell A, Ramon M, Skorecki K, BeharDM, Calafell F, Jobling MA. 2008. The genetic legacy of religious diversity and intolerance: Paternal lineages ofChristians, Jews, and Muslims in the Iberian Peninsula. Am J Hum Genet: 83:725–736.
Ajbar Machmuâ. 1867. Crónica anónima del siglo XI. Colección de obras arábigas de historia y geografía, vol. I.Madrid: Real Academia de la Historia.
Almagro-Basch M, del Amo M, Beltrán A. 1974. Huelva: Prehistoria y Antigüedad. Madrid: Editorial Nacional.Alonso S, Flores C, Cabrera V, Alonso A, Martín P, Albarrán C, Izagirre N, de la Rúa C, García O. 2005. The place
of the Basques in the European Y-chromosome diversity landscape. Eur J Hum Genet 13:1293–1302.Arredi B, Polonin ES, Paracchini S, Zerjal T, Fathallah DM, Makrelouf M, Pascali VL, Novelletto A, Tyler-Smith
C. 2004. A predominantly neolithic origin for Y-chromosomal DNA variation in North Africa. Am J HumGenet.75:338–345.
Bandelt, HJ, Forster P, Röhl A. 1999. Median-joining networks for inferring intraspecific phylogenies. Mol BiolEvol. 16:37–48.
Behar DM,Metspalu E, Kivisild T, Achilli A, Hadid Y, Tzur S, Pereira L, Amorim A, Quintana-Murci L, MajamaaK, Herrnstadt C, Howell N, Balanovsky O, Kutuev I, Pshenichnov A, Gurwitz D, Bonne-Tamir B, Torroni A,Villems R, Skoreck K. 2006. The matrilineal ancestry of Ashkenazi Jewry: Portrait of a recent founder event. Am JHum Genet 78:487–497.
Beleza S, Gusmão L, Amorim A, Carracedo A, Salas A. 2005. The genetic legacy of western Bantu migrations.Hum Genet 117:366–375.
Brion M, Sobrino B, Blanco-Verea A, Lareu MV, Carracedo A. 2005. Hierarchical analysis of 30 Y-chromosomeSNPs in European populations. Int J Legal Med 119:10–15.
Calderón R. 2000. Population and peopling in the Mediterranean world. Int J Anthropol 15:271–278.Calderón R. 2006. Gene flow in the Iberian Peninsula. Lecture at 15th Congress of the European Anthropological
Association (EAA). Man and Environment: Trends and Challenges in Anthropology, Budapest (Hungary).
104 B. Ambrosio et al.

.Calderón R, Vidales C, Peña JA, Perez-Miranda A, Dugoujon JM. 1998. Immunoglobulin allotypes (GM and KM)
in Basques from Spain: Approach to the origin of the Basque population. Hum Biol. 70:667–698.Calderón R, Ambrosio B, Guitard E, Gonzalez-Martin A, Aresti U, Dugoujon JM. 2006. The genetic position of
Andalusians from Huelva in relation to other European and North-African populations: A study based on GMand KM allotypes. Hum Biol 78:663–679.
Campbell MC, Tishkoff SA. 2008. African genetic diversity: Implications for human demographic history, modernhuman origins and complex disease mapping. Ann Rev Genom Hum Genet 9:403–333.
Capelli C, Onofri V, Brisighelli F, Boschi I, Scarnicci F, Masullo M, Ferri G, Tofanelli S, Tagliabracci A, GusmaoL, Amorim A, Gatto F, Kirin M, Merlitti D, Brion M, Verea AB, Romano V, Cali F, Pascali V. 2009. Moors andSaracens in Europe: Estimating the medieval North African male legacy in southern Europe. Eur J Hum Genet17:842-852.
Capelli C, Redhead N, Romano V, Calì F, Lefranc G, Delague V, Megarbane A, Felice AE, Pascali VL, NeophytouPI, Poulli Z, Novelletto A, Malaspina P, Terrenato L, Berebbi A, Fellous M, Thomas MG, Goldstein DB. 2006.Population structure in the Mediterranean basin: A Y chromosome perspective. Ann Hum Genet 70:207–225.
Cinnio�glu C, King R, Kivisild T, Kalfo�glu E, Atasoy S, Cavalleri GL, Lillie AS, Roseman CC, Lin AA, Prince K,Oefner PJ, Shen P, Semino O, Cavalli-Sforza LL, Underhill PA. 2004. Excavating Y-chromosome haplotypestrata in Anatolia. Hum Genet 114:127–148.
Cooper G, Amos W, Hoffman D, Rubinsztein DC. 1996. Network analysis of human Y microsatellite haplotypes.Hum Mol Genet 11:1759–1766.
Crandall KA, Templeton AR. 1993. Empirical test of some predictions from coalescent theory with applications tointraspecific phylogeny reconstruction. Genetics 134:959–969.
Cruciani F, Santolamazza P, Shen P, Macaulay V, Moral P, Olckers A, Modiano D, Holmes S, Destro-Bisol G,Coia V, Wallace DC, Oefner PJ, Torroni A, Cavalli-Sforza LL, Scozzari R, Underhill PA. 2002. A back migrationfrom Asia to Sub-Saharan Africa is supported by high-resolution analysis of human Y-chromosome haplotypes.Am J Hum Genet 70:1197–1214.
Cruciani F, La Fratta R, Santolamazza P, Sellitto D, Pascone R, Moral P, Watson E, Guida V, Colomb EB,Zaharova B, Lavinha J, Vona G, Aman R, Calì F, Akar N, Richards M, Torroni A, Novelletto A, Scozzari R.2004. Phylogeographic analysis of haplogroup E3b (E-M215) Y chromosomes reveals multiple migratory eventswithin and out of Africa. Am J Hum Genet 74:1014–1022.
Cruciani F, La Fratta R, Torroni A, Underhill PA, Scozzari R. 2006. Molecular dissection of the Y chromosomehaplogroup E-M78 (E3b1a): A posteriori evaluation of a microsatellite-network-based approach through six newbiallelic markers. Hum Mutat 27:831–832.
Cruciani F, La Fratta R, Trombetta B, Santolamazza P, Sellitto D, Colomb EB, Dugoujon JM, Crivellaro F,Benincasa T, Pascone R, Moral P, Watson E, Melegh B, Barbujani G, Fuselli S, Vona G, Zagradisnik B, AssumG, Brdicka R, Kozlov AI, Efremov GD, Coppa A, Novelletto A, Scozzari R. 2007. Tracing past human malemovements in northern/Eeastern Africa and Western Eurasia: New clues from Y-chromosomal haplogroupsE-M78 and J-M12. Mol Biol Evol 24:1300–1311.
de Knijff P. 2000. Messages through bottlenecks: On the combined use of slow and fast evolving polymorphicmarkers on the human Y chromosome. Am J Hum Genet 67:1055–1061.
Dupâquier J. 1997. Des origines aux prémices de la revolution démographique. In: Bardet JP and Dupâquier J, eds.Histoire des Populations de l’Europe (pp. 26–38). Paris: Librairie Arthème Fayard.
Excoffier L, Langaney A. 1989. Origin and differentiation of human mitochondrial DNA. Am J Hum Genet 44:73–85.
Excoffier L, Laval G, Schneider S. 2005. Arlequin (version 3.0): An integrated software package for populationgenetics data analysis. Evol Bioinform Online 1:47–50.
Fernandez-Jurado J, García-Sanz C, Bufete P. 1997. De Tartessos a Onuba. Huelva: Diputación de Huelva.García Iglesias L. 1978. Los judíos en la España Antigua. Madrid: Ediciones Cristiandad.Gill P, Brenner C, Brinkmann B, Budowle B, Carracedo A, Jobling MA, de Knijff P, Kayser M, Krawczak M, Mayr
WR, Morling N, Olaisen B, Pascali V, Prinz M, Roewer L, Schneider PM, Sajantila A, Tyler-Smith C. 2001.DNA Commission of the International Society of Forensic Genetics: Recommendations on forensic analysisusing Y-chromosome STRs. Forensic Sci Int 124:5–10.
Golding GB. 1987. The detection of deleterious selection using ancestors inferred from a phylogenetic history.Genet Res 49:71–82.
Gonçalves R, Freitas A, Branco M, Rosa A, Fernandes AT, Zhivotovsky LA, Underhill PA, Kivisild T, Brehm A.2005. Y-chromosome lineages from Portugal, Madeira and Açores record elements of Sephardim and Berberancestry. Ann Hum Genet 69:443–454.
Haplogroup E in Western Andalusia 105

HammerMF,SpurdleAB,KarafetT,BonnerMR,WoodET,NovellettoA,MalaspinaP,MitchellRJ,HoraiS, JenkinsT, Zegura SL. 1997. The geographic distribution of human Y chromosome variation. Genetics 145:787–805.
Hammer M, Redd AJ, Wood ET, Bonner MR, Jarjanazi H, Karafet T, Santachiara-Benerecetti S, Oppenheim A,Jobling MA, Jenkins T, Ostrer H, Bonne-Tamir B. 2000. Jewish and Middle Eastern non-Jewish populationsshare a common pool of Y-chromosome biallelic haplotypes. Proc Natl Acad Sci 97:6769–6774.
Hartl DL, Clark AG. 1989. Principles of populations genetics. Sunderland, MA: Sinauer Associates.Hein J, Schierup J, Wiuf C. 2005. Gene genealogies, variation and evolution. A primer in coalescent theory. Oxford:
Oxford University Press.Hellenthal G, Auton A, Daniel F. 2008. Inferring human colonization history using a copying model. PLOS
Genetics 4: doi:10.1371/journal.pgen.1000078.Hofrichter R. 2004. El mar Mediterráneo. Fauna, flora, ecología, vol. I. Barcelona: Ediciones Omega.Jobling MA, Tyler-Smith C. 2003. The human Y chromosome: An evolutionary marker comes of age. Nat Rev
Genet 4:598–612.Karafet TM, Mendez FL, Meilerman MB, Underhill PA, Zegura SL, Hammer MF. 2008. New binary
polymorphisms reshape and increase resolution of the human Y chromosomal haplogroup tree. Genome Res18:830–838.
Lebart L, Morineau A, Warwick KM. 1984. Multivariate descriptive statistical analysis: Correspondence analysisand related techniques for large matrices. New York: Wiley and Sons.
Lopez-Davalillo Larrea J 2000. Atlas histórico de España y Portugal. Desde el Paleolítico hasta el siglo XX. Madrid:Editorial Síntesis.
Mackay A. 1977. La España de la Edad Media: desde la frontera hasta el imperio 1000–1500. Madrid: EdicionesCátedra.
Martinez-Ruiz E, Maqueda C, Montero S, Ladero MA, Ladero MF, Olivera C, Cantera S. 2003. Atlas Histórico deEspaña I. Madrid: Ediciones Istmo.
Myro MM. 1999. Los enigmas de Tarteso: apéndices documentales. In: Alvar J and Blázquez JM, eds. Los enigmasde Tarteso (pp. 201–214). Madrid: Ediciones Cátedra.
Nei M. 1987. Molecular Evolutionary Genetics. New York: Columbia University Press.Neto D, Montie, R, Bettencourt C, Santos C, Prata MJ, LimaM. 2007. The African contribution to the present-day
population of the Azores Islands (Portugal): Analysis of the Y chromosome haplogroup E. Am J Hum Biol19:854–860.
Novelletto A. 2007. Y chromosome variation in Europe: Continental and local processes in the formation of theextant gene pool. Ann Hum Biol 34:139–172.
Peri�cicM, Lauc LB, Klaric IM, Rootsi S, Janicijevic B, Rudan i, Terzic R, Colak I, Kevesic A, Popovic D, SijacKi A,Behluli I, Dor�evic D, Efremovska L, Bajec DD, Stefanovic BD, Villens R, Rudan P. 2005. High-resolutionphylogenetic analysis of southeastern Europe traces major episodes of paternal gene flow among Slavicpopulations. Mol Biol Evol 22:1964–1975.
Placido D. 1999. La imagen griega de Tarteso. In: Alvar J and Blázquez JM, eds. Los enigmas de Tarteso (pp. 81–89).Madrid: Ediciones Cátedra.
Roewer L, Croucher PJ, Willuweit S, Lu TT, Kayser M, Lessig R, de Knijff P, Jobling MA, Tyler-Smith C,Krawczak M. 2005. Signature of recent historical events in the European Y-chromosomal STR haplotypedistribution. Hum Genet 116:279–291.
Rosser Z, Zerjal T, Hurles ME, Adojaan M, Alavantic D, Amorim A et al 2000. Y-chromosomal diversity in Europeis clinal and influenced primarily by geography, rather than by language. Am J Hum Genet. 67:1526–1543.
Scozzari R, Cruciani F, Pangrazio A, Santolamazza P, Vona G, Moral P, Latini V, Varesi L, Memmi MM, RomanoV, de Leo G, Gennarelli M, Jaruzelska J, Villems R, Parik J, Macaulay V, Torroni A. 2001. HumanY-chromosome variation in the Western Mediterranean area: Implications for the peopling of the region.Hum Immunol 62:871–884.
Semino O, Magri C, Benuzzi G, Lin AA, Al-Zahery N, Battaglia V, Maccioni L, Triantaphyllidis C, Shen P, OefnerPJ, Zhivotovsky LA, King R, Torroni A, Cavalli-Sforza LL, Underhill PA, Santachiara-Benerecetti AS. 2004.Origin, diffusion, and differentiation of Y-chromosome haplogroups E and J: Inferences on the neolithization ofEurope and later migratory events in the Mediterranean area. Am J Hum Genet 4:1023–1034.
Serre D, Pääbo S. 2004. Evidence for gradients of human genetic diversity within and among continents. GenomeRes 14:1679–1685.
Shastry BS. 2002. SNP alleles in human disease and evolution. J Hum Genet 47:561–566.Sims LM, Garvey D, Ballantyne J. 2007. Sub-populations within the major European and African derived
haplogroups R1b3 and E3a are differentiated by previously phylogenetically undefined Y-SNPs. Hum Mutat28:97.
106 B. Ambrosio et al.

Torroni A, Achilli A, Macaulay A, Richards M, Bandlet HJ. 2006. Harvesting the fruit of the of the human mtDNAtree. Trends Genet 22:339–345.
Underhill P, Shen P, Lin AA., Jin L, Passarino G, Yang WH, Kauffman E, Bonné-Tamir B, Bertranpetit J,Francalacci P, Ibrahim M, Jenkins T, Kidd JR, Mehdi SQ, Seielstad MT, Wells RS, Piazza A, Davis RW,Feldman MW, Cavalli-Sforza LL Oefner PJ. 2000. Y chromosome sequence variation and the history of humanpopulations. Nat Genet 26:358–361.
Underhill P, Passarino G, Lin AA, Shen P, Mirazón Lahr M, Foley RA, Oefner PJ, Cavalli-Sforza LL. 2001. Thephylogeography of Y chromosome binary haplotypes and the origins of modern human populations. Ann HumGenet 65:43–62.
Underhill PA, Roseman CC. 2001. The case for an African rather than an Asian origin of human Y-chromosomeYAP insertion. In: Jin L, Seielstad M and Xiao C, eds. Genetic, Linguistic and Archaeological Perspectives onHuman Diversity in Southeast Asia: Recent Advances in Human Biology. vol. 8 (pp. 43–56). River Edge, NewJersey: World Scientific.
Vallvé J. 1977. Sobre demografía y sociedad en Al-Andalus (siglos VIII–XI). Al-Andalus 42:323–340.Weale M, Shah T, Jones AL, Greenhalgh J, Wilson JF, Nymadawa P, Zeitlin D, Connell BA, Bradman N, Thomas
MG. 2003. Rare deep-rooting Y chromosome lineages in humans: Lessons for phylogeography. Genetics165:229–234.
Haplogroup E in Western Andalusia 107