The drawbacks of paternal obesity on the sperm biology, the ...
181
Université de Nice-Sophia Antipolis Ecole doctorale SVS ED85 Sciences-Vie-Santé THESE DE DOCTORAT Pour obtenir le grade de Docteur en biologie de l‘université de Nice-Sophia Antipolis Spécialité: Recherche clinique et thérapeutique Soutenue par: Georges RAAD The drawbacks of paternal obesity on the sperm biology, the preimplantation embryo morphokinetics, and its transgenerational impacts Directrice de thèse : Valérie GRANDJEAN Co-directrice de thèse : Mira HAZZOURI Soutenue le 14 Décembre 2016 Jury : Rapporteurs : Sophie ROUSSEAUX Roger MIEUSSET
-
Upload
khangminh22 -
Category
Documents
-
view
0 -
download
0
Transcript of The drawbacks of paternal obesity on the sperm biology, the ...

Université de Nice-Sophia Antipolis
Ecole doctorale SVS ED85
Sciences-Vie-Santé
THESE DE DOCTORAT
Pour obtenir le grade de
Docteur en biologie de l‘université de Nice-Sophia Antipolis
Spécialité: Recherche clinique et thérapeutique
Soutenue par: Georges RAAD
The drawbacks of paternal obesity on the sperm biology, the preimplantation
embryo morphokinetics, and its transgenerational impacts
Directrice de thèse : Valérie GRANDJEAN
Co-directrice de thèse : Mira HAZZOURI
Soutenue le 14 Décembre 2016
Jury :
Rapporteurs : Sophie ROUSSEAUX
Roger MIEUSSET

1

2
Table of Contents
THESIS ABSTRACT ................................................................................................................6
RESUME ...................................................................................................................................8
LIST OF FIGURES ................................................................................................................ 10
LIST OF TABLES .................................................................................................................. 13
CHAPTER1 THE DRAWBACKS OF OBESITY ON THE GLOMERULOPATHY,
TESTICULAR HOMEOSTASIS AND SPERM EPIGENOME .......................................... 14
I- THE BODY WEIGHT HOMEOSTASIS .................................................................................... 14
A- The human body homeostasis...................................................................................... 14
B- The body weight management ..................................................................................... 18
B. 1 The metabolic energy network ............................................................................. 18
B.1.1 The digestive system: intake, processing and distribution of foodstuffs ............. 18
B.1.2 Cells and molecules implicated in glucose homeostasis and energy management
19
a) Energy storing cells ...................................................................................... 20
a. 1 The white adipose tissue ........................................................................... 20
a. 2 The liver ................................................................................................... 22
b) Energy consuming cells ................................................................................ 23
B. 2 The control of food intake .................................................................................... 24
II- WEIGHT IMBALANCE: OBESITY COMPLICATIONS ............................................................... 25
A- The drawbacks of obesity on kidney homeostasis ........................................................ 28
A. 1 Kidney physiology .................................................................................................. 28
A. 1.1 Obesity-related glomerulopathy (ORG) ................................................................ 31
A. 1.1.a The effect of obesity on the glomerular histology .......................................... 31
A. 1.1.b Decline in renal function and obesity ............................................................ 31
a) Renal hemodynamics........................................................................................ 31
b) Hyperglycemia and hyperlipidemia: ................................................................. 33
B- The drawbacks of obesity on testicular homeostasis .................................................... 34
B. 1 Male reproductive system anatomy .......................................................................... 34
B.1.1 The effects of obesity on testicular anatomy, sexual function and seminal plasma
biochemistry ................................................................................................................... 36
B. 2 Testicular histology and physiology ......................................................................... 37
B.2.1 The interstitial compartment................................................................................. 38
a) Blood vessels ....................................................................................................... 38
b) Leydig cells ......................................................................................................... 38
b.1 Overview ...................................................................................................... 38
b.2 Steroidogenesis ............................................................................................. 39
b.3 The effect of obesity on Leydig cell physiology and androgen homeostasis... 40

3
c) Immune cells ....................................................................................................... 41
c.1 Phagocytosis, proliferation and physiology of Leydig cells ............................... 41
c.2 Immunoregulation and inflammation ................................................................ 42
c.3 The effect of obesity on testicular immune cells ............................................... 42
B.2.2 Tubular compartment ........................................................................................... 43
a) Peritubular cells ................................................................................................... 44
b) Sertoli cells .......................................................................................................... 45
b. 1 Overview ...................................................................................................... 45
b. 2 Cytological features ...................................................................................... 45
b. 3 Sertoli cell functions ..................................................................................... 45
b. 4 The effects of obesity on Sertoli cell functions .............................................. 49
c) Germ cells............................................................................................................ 52
c. 1 Spermatogonia .............................................................................................. 52
c. 2 The meiotic cells ........................................................................................... 54
c. 3 The spermiogenesis ....................................................................................... 55
c. 4 The impact of male obesity on sperm parameters and embryo development .. 58
III- EPIGENETIC INHERITANCE OF PATERNAL ACQUIRED OBESITY ............................................ 60
A- Epigenetic control of gene expression during spermatogenesis and early embryogenesis
60
A. 1 DNA methylation ................................................................................................. 60
A. 1.1 DNA methylation reprogramming in mouse germ cells and pre-implantation
embryos 62
A. 1.2 The drawbacks of abnormal DNA methylation profile in gametes ................. 63
A. 2 DNA hydroxymethylation and DNA demethylation ............................................. 65
A. 2.1 5-hmC dynamics during mouse spermatogenesis and embryo development .. 67
A. 3 Chromatin modifications ...................................................................................... 69
A. 3.1 Chromatin structure in somatic cells ............................................................. 69
A. 3.2 Chromatin remodelling during spermatogenesis ............................................ 72
a) Spermatogonia ................................................................................................. 72
b) Meiotic cells ..................................................................................................... 73
c) Spermatids and spermiogenesis ........................................................................ 74
c. 1 The incorporation of histones variants into the chromatin ............................. 74
c. 2 Histones hyperacetylation............................................................................. 74
c. 3 Replacement of histones by transition proteins ............................................. 75
c. 4 Replacement of TP by protamine.................................................................. 75
d) Sperm chromatin .............................................................................................. 76
d.1 Nucleoprotamine-bound sperm chromatin ..................................................... 77
d.2 Nucleosome-bound sperm chromatin ............................................................ 77
d.3 Matrix attachment regions (MARs) ............................................................... 78
A. 4 Sperm RNAs ........................................................................................................ 78

4
B- Transgenerational inheritance of paternal acquired obesity .......................................... 79
B. 1 Overview ............................................................................................................. 79
B. 2 Possible mechanims of intergenerational and transgenerational inheritance of
paternal acquired obesity ................................................................................................ 81
IV- RESEARCH AIMS .............................................................................................................. 84
V- BIBLIOGRAPHY ................................................................................................................ 85
CHAPTER 2 SELECTIVE PHYSIOLOGICAL AND MOLECULAR ALTERATIONS
IN THE MOTILE SPERM FROM OBESE MEN .............................................................. 109
I- ABSTRACT .................................................................................................................... 109
II- INTRODUCTION .............................................................................................................. 110
III- MATERIALS AND METHODS ........................................................................................... 112
a) Study population ....................................................................................................... 112
b) Anthropometric measurements .................................................................................. 112
c) Semen analysis.......................................................................................................... 112
d) Sperm isolation using swim-up technique.................................................................. 113
e) Sperm morphology evaluation ................................................................................... 113
f) Sperm membrane integrity assessment ...................................................................... 113
g) Sperm chromatin structure assessment ...................................................................... 113
h) Histone retention assessment ..................................................................................... 114
i) Sperm DNA extraction .............................................................................................. 114
j) Sperm Global DNA 5-methylcytosine (5-mC) and 5-hydroxymethylcytosine (5-hmC)
measurements .................................................................................................................. 114
k) Ovarian stimulation, oocytes retrieval, and ICSI ........................................................ 115
l) Embryo culture and evaluation of time-lapse images ................................................. 115
m) Statistical analysis ..................................................................................................... 115
IV- RESULTS .................................................................................................................... 117
a) Characteristics of the cohort ...................................................................................... 117
b) The effect of paternal obesity on the macroscopic semen parameters ......................... 117
c) Description of the motile sprem-enriched fraction according to the paternal BMI and
WC 117
d) Higher histones retention in motile sperm-enriched fraction of obese men................. 121
e) Altered sperm chromatin integrity in motile sperm-enriched fraction of obese men ... 122
f) Global DNA hyohydroxymethylation in the motile sperm of obese men ................... 123
g) The effect of paternal obesity on pre-implantation embryo morphokinetics ............... 124
h) The effect of paternal obesity on embryo quality ....................................................... 124
V- DISCUSSION .................................................................................................................. 129
VI- BIBLIOGRAPHY .......................................................................................................... 134

5
CHAPTER 3 INTERGENERATIONAL AND TRANSGENERATIONAL
INHERITANCE OF PATERNAL ACQUIRED OBESITY AND ITS ASSOCIATED
GLOMERULOPATHY AND SUBFERTILITY IN A MOUSE MODEL .......................... 141
I- ABSTRACT .................................................................................................................... 141
II- INTRODUCTION .............................................................................................................. 142
III- MATERIALS AND METHODS ............................................................................................ 144
a) Animals and experimental design .............................................................................. 144
b) Body measurements .................................................................................................. 145
c) Metabolic cage experiments ...................................................................................... 145
d) Renal histology and special stains ............................................................................. 145
e) Quantification of renal pathology .............................................................................. 145
f) Assessment of sperm count and motility.................................................................... 146
g) Evaluation of sperm morphology .............................................................................. 146
h) Sperm chromatin integrity ......................................................................................... 146
i) Statistical analysis ..................................................................................................... 146
IV- RESULTS .................................................................................................................... 147
1- Exacerbation of the overweight phenotype and the adipose tissue volume after seven
successive generations of HFD feeding ........................................................................... 147
2- Feeding five successive generations of male mice with a HFD negatively impacted the
body weight and the adipose tissue volume of the CD6 and the CD7 males ...................... 148
3- Progressive alterations in the body composition after seven successive generations of
HFD feeding .................................................................................................................... 148
4- The drawbacks of HFD feeding during 5 generations on the body composition of the
CD6 and CD7 males ........................................................................................................ 149
5- The amount of food intake in the different HFD and CD groups ................................ 149
6- The effect of the exposure to the same obesogenic environment during seven successive
generations on the water balance ...................................................................................... 151
7- Physiological adaptation of the kidney to the continuous HFD stress during several
generations ....................................................................................................................... 152
8- The effect of exposure to HFD during successive generations on glomerular histology
152
9- The impact of the continuous exposure to a HFD stress during several generations on
the conventional semen parameters .................................................................................. 155
10- The changes in the sperm chromatin integrity across HFD and CD generations ..... 157
V- DISCUSSION .................................................................................................................. 158
VI- CONCLUSION AND PERSPECTIVES ................................................................................ 161
VII- BIBLIOGRAPHY .......................................................................................................... 162
CHAPTER 4 FINAL DISCUSSION AND PERSPECTIVES ........................... 167
APPENDIX ............................................................................................................................ 172

6
Thesis abstract
The body weight homeostasis is defined as the balance between the energy intake and the energy
expenditure. This equilibrium is maintained due to the activity of different body systems such as
the neuroendocrine system and the gastrointestinal tract. Obesity is a medical condition resulting
from an excessive accumulation of adipose deposits. The pathological remodelling of the adipose
tissue in obese subjects may lead to the development of several health problems such as
hypertension, kidney disease, and type 2 diabetes. Unfortunately, the prevalence of obesity is
increasing worldwide and of particular interest among young men of reproductive age. The
impact of obesity on reproduction is well established in women; however it is not fully
elucidated in men. Furthermore, accumulated evidence suggests that information from paternal
environment such as acquired obesity remains in the sperm epigenome (non-coding RNAs,
chemical modifications of paternally inherited histones, and DNA modifications) and can
modulate the phenotype of the offspring. Therefore, a deeper comprehension of the drawbacks of
male excessive fatness on the sperm molecular composition is needed.
The first aim of this thesis was to assess the impact of obesity on the molecular composition and
on the physiology of the motile sperm. The semen samples were obtained from 96 men attending
the A-clinic fertility center, Lebanon. Patients were categorized into three groups according to
their body mass index (BMI) and waist circumference (WC): normal weight (18<BMI<24 kg/m2
and WC< 90 cm), overweight (25<BMI<29.9 kg/m2
and WC<102 cm), and obese (BMI>30
kg/m2 and WC >103 cm).We showed that the motile sperm of obese men had abnormal levels of
paternally inherited histones and hypomethylated/hypohydroxymethylated DNA as compared to
normal weight men. Subsequently, the embryos derived from the motile sperm of an obese father
had an altered morphokinetic patterns when compared to those derived from normal weight one.
Altogether, these results indicated that paternal obesity could affect the molecular composition of
the motile sperm nucleus and negatively impact the pre-implantation embryo morphokinetics.
The second aim of this thesis was to evaluate the adaptive and evolutionary potential of non-
genetic heritable mechanisms in experimentally controlled animal models. Using a high fat diet
(HFD)-induced obesity mouse model, we have examined how feeding male mice with a high fat
diet for multiple generations impacts the phenotype of the resulting mice.For that
purpose,C57BL/6 male mice were fed a high-fat diet (HFD) from weaning for up to 5 months
during 5 successive generations. The resulting male offspring were raised either on a control diet
(CD6 and CD7) or on a HFD (HFD6 and HFD7). Despite their genetic similarity, there was a
gradual increase in the body weight, in the adipose tissue volume, in the severity of obesity-
related glomerulopathy, and a significant decrease in the fertility status across HFD generations
as compared to controls. Although the CD6 and CD7 male mice had never encountered an
obesogenic environment, they had a heavier body weight and a larger adipose tissue, they

7
developed histological kidney lesions, and they had a reduced fertility potential when compared
to the control group. These findings indicated that at each generation the offspring might retain
residual effects of the paternal obesity within their cells that could be worsened when they were
re-exposed to the same obesogenic environment.
In conclusion, our findings might add more insights into the current knowledge on the epigenetic
signature transferred by the sperm of obese men to the oocyte during fertilization and into how
biological systems might respond and adapt to continuous exposure to a HFD stress.

8
Résumé
L'homéostasie du poids corporel est définie comme étant l'équilibre entre les apports et les
dépenses énergétiques. Cet équilibre est maintenu grâce à l'activité des différents systèmes du
corps tels que le système neuroendocrinien et le tractus gastro-intestinal. L'obésité est une
condition médicale résultant d'une accumulation excessive de dépôts adipeux. Le remodelage
pathologique du tissu adipeux chez les sujets obèses pourrait conduire à l'élaboration de plusieurs
problèmes de santé tels que l'hypertension, les maladies rénales et le diabète de type 2.
Malheureusement, la prévalence de l'obésité augmente dans le monde entier et en particulier chez
les jeunes hommes en âge de procréation. L'effet de l'obésité sur la reproduction est bien établi
chez les femmes; cependant, il n'a pas été complètement élucidé chez les hommes. En outre,
plusieurs études ont suggéré que les informations de l'environnement paternel comme l'obésité
acquise restent dans l‘épigénome du spermatozoïde (ARNs non codants, des modifications
chimiques des histones, et les modifications de l'ADN) et peuvent moduler le phénotype de la
descendance. Pour toutes ces raisons, une compréhension plus approfondie des effets de l‘obésité
sur la composition moléculaire des spermatozoïdes est nécessaire.
Le premier objectif de cette thèse était d'évaluer l'effet de l'obésité sur la composition
moléculaire et sur la physiologie des spermatozoïdes mobiles. Les échantillons de sperme ont été
obtenus à partir de 96 hommes s‘adressant au centre de fertilité ‗A-clinic‘, Liban. Les patients
ont été classés en trois groupes en fonction de leur indice de masse corporelle (IMC) et le tour de
taille (WC): poids normal (18 <IMC <24 kg/m2 et WC <90 cm), le surpoids (25 <IMC <29,9
kg/m2 et WC <102 cm), et obèses (IMC> 30 kg/m2 et WC> 103 cm). Nos résultats ont montré
qu‘il y a une rétention des histones plus élevée, et un ADN spermatique hypométhylé et
hypohydroxymethylé, dans les spermatozoïdes mobiles des hommes obèses par rapport à ceux
des hommes non-obeses. Par conséquent, les embryons issus de spermatozoïdes mobiles d'un
homme obèse avaient une cinétique de division embryonnaire altérer par rapport à ceux
provenant des spermatozoïdes d‘un homme de poids normal. En conclusion, ces résultats
indiquent que l'obésité paternelle peut avoir des effets négatifs sur la composition moléculaire
des spermatozoïdes et sur la morphocinétique embryonnaire précoce.
Le second objectif de cette thèse était d'étudier l‘évolution et/ou la régression des maladies liées
à l‘obésité chez les souris mâles après avoir été exposé pendant plusieurs générations a un
régime riche en graisses. Pour accomplir ce but, des souris mâles (C57BL/6) ont été nourris avec
un régime riche en graisses (HFD) à partir du sevrage jusqu'à 5 mois et pendant 5 générations
successives. La progéniture mâle de la sixième et la septième génération ont été soulevées, soit
sur un régime contrôle (CD6 et CD7) ou sur un HFD (HFD6 et HFD7). Tout en partant du même
fond génétique le phénotype des souris était diffèrent à chaque génération. Il y a eu une
augmentation progressive du poids corporel, du volume du tissu adipeux, de la sévérité de la
glomérulopathie, et une diminution graduelle de l'état de fertilité entre les générations HFD par

9
rapport aux souris contrôles. Bien que les souris mâles CD6 et CD7 avait jamais rencontré un
environnement obésogène, ils avaient un poids corporel plus élevé, un tissu adipeux plus
volumineux, ils ont développé des lésions rénales histologiques, et ils avaient un potentiel de
fertilité réduit par rapport au groupe de souris contrôles. Ces résultats indiquent que, à chaque
génération la progéniture pourrait conserver les effets résiduels de l'obésité paternelle dans leurs
cellules qui pourraient être aggravée quand ils ont été exposés de nouveau au même
environnement obésogène.
En conclusion, nos résultats ont montrés qu‘il pourrait y avoir une signature épigénétique
spécifique transférée par les spermatozoïdes des hommes obèses à l'ovocyte lors de la
fécondation. En plus, à l‘aide d‘un modèle murin on a pu démontrer comment les systèmes
biologiques pourraient réagir et s‘adapter à une exposition continue à un régime riche en
graisses.

10
List of figures
Chapter1 The drawbacks of obesity on the glomerulopathy, testicular homeostasis and
sperm epigenome
Figure 1: Cellular communication and homeostasis ................................................................... 14
Figure 2: Organization of the integration systems. ..................................................................... 17
Figure 3:The central role of pancreatic islets in the maintenance of the normal level of plasma
glucose ..................................................................................................................................... 20
Figure 4: The adipose tissue. ..................................................................................................... 21
Figure 5: Relation between the white adipose tissue and metabolism ......................................... 22
Figure 6:Regulation of glucose metabolism by the hepatocytes. ................................................ 27
Figure 7: A diagram showing the possible regulators of food intake and energy balance............ 24
Figure 8: The prevalence (%) of obesity among adults in different countries. ............................ 26
Figure 9: The high prevalence (%) of overweight and obese among young population aged 5-17
years in both developed and developing countries ..................................................................... 26
Figure 10: The central role of adipose tissue in the development of obesity-associated
complications. ........................................................................................................................... 27
Figure 11: Anatomy of the nephron. .......................................................................................... 30
Figure 12: Regulation of blood Na+ levels by the kidney . ........................................................ 30
Figure 13: Pathogenesis of obesity-related glomerulopathy. ...................................................... 32
Figure 14: Histological kidney sections ..................................................................................... 33
Figure 15: Sagittal view of testis and male pelvis ...................................................................... 34
Figure 16: Histological section of the human testis .................................................................... 37
Figure 17: Illustration of the testicular interstitial tissue............................................................. 38
Figure 18: Illustration of the cascade of events leading to male sexual hormone production by the
Leydig cell. ............................................................................................................................... 39
Figure 19: The high-energy diet overconsumption affects the reproductive axis at the central and
at the gonadal levels. ................................................................................................................. 41
Figure 20: Interstitial immune cells secrete stimulatory and inhibitory factors that may regulate
Leydig cell physiology. ............................................................................................................. 42
Figure 21: Organization of the seminiferous tubule. .................................................................. 43
Figure 22: Scheme illustrating the function of sometheperitubular cells (PT) secreted factors. ... 44
Figure 23: Schematic presentation of the metabolic coupling between Sertoli cells and the germ
cells. ......................................................................................................................................... 47
Figure 24: Steroids homeostasis in the seminiferous tubule. ...................................................... 48
Figure 25: Illustration showing the compartmentalization of the seminiferous epithelium by the
specialized junctions between the Sertoli cells. .......................................................................... 49
Figure 26: The drawbacks of excess high-energy diet consumption on testicular homeostasis ... 51
Figure 27: The cycle of mammalian germ cell development. . ................................................... 52

11
Figure 28: The role of retinoic acid in meiotic entry. ................................................................. 54
Figure 29: Illustration of the major events that occur during the meiotic division ..................... 56
Figure 30: The process of spermiogenesis ................................................................................. 58
Figure 31: Flow diagram of methionine-folic acid metabolism. ................................................ 60
Figure 32: The DNA methyltransferases functions. ................................................................... 61
Figure 33: The dynamics of DNA methylation during mouse gametogenesis and pre-
implantation embryos. . ............................................................................................................. 63
Figure 34: Regulation of gene expression by DNA methylation and demethylation. .................. 66
Figure 35: The cross-talk between the glucose metabolism and 5-hydroxymethylcytosine
formation in normal and cancer cells . ....................................................................................... 67
Figure 36: The dynamics of 5-hydroxymethylcytosine during mouse spermatogenesis and
embryo development. ................................................................................................................ 69
Figure 37: Chromatin structure. ................................................................................................. 70
Figure 38: The major steps of spermatid chromatin remodelling during spermiogenesis. . ......... 75
Figure 39: The structure of the sperm chromatin. ...................................................................... 76
Figure 40: Scheme showing different modes of non-genetic inheritance. ................................... 80
Figure 41: Pedigree pattern of acquired pathologies. ................................................................. 81
Figure 42: The impact of the lifestyle on the non-genetic paternal contribution to the
embryogenesis. ......................................................................................................................... 84
Chapter 2: Selective physiological and molecular alterations in motile sperm from obese
men
Figure 1: The study design. ..................................................................................................... 116
Figure 2: Cytological assessment of sperm membrane integrity and morphology. .................... 120
Figure 3: Sperm histones retention as assessed by the aniline blue staining (AB). .................... 121
Figure 4: Sperm chromatin integrity as assessed by the toluidine blue staining (TB). ............... 122
Figure 5: Assessment of the global sperm DNA methylation status. ........................................ 123
Figure 6: Assessment of the global sperm DNA hydroxymethylation status. ........................... 124
Figure 7: The different stages of pre-implatation embryo development. ................................... 128
Figure 8: Figure showing two blastocysts. ............................................................................... 129
Chapter 3: Intergenerational and transgenerational inheritance of paternal acquired
obesity and its associated glomerulopathy and subfertility in a mouse model
Figure 1: Two pedigrees showing the high fat diet (HFD) ...................................................... 144
Figure 2: The body weight and the adipose tissue volume of the different HFD and CD groups.
............................................................................................................................................... 147

12
Figure 3: Feeding male mice with a HFD during seven generations alters the glomerulus/capsule
ratio and increases the matrix accumulation............................................................................. 153
Figure 4: Quantitave analysis of the glomeruli in CD6 and CD7 males compared to the controls
at 16 weeks. ............................................................................................................................ 154
Figure 5: Pathological alterations in the kidney of mice on HFD (1-7) and control diet (CD6 and
CD7) at 16 weeks. ................................................................................................................... 154
Figure 6: Graphs showing the sperm concentrations of the different HFD (a) and CD (b)
generations. ............................................................................................................................. 155
Figure 7: Graphs showing the percentage of spermatozoa with progressive motility, non-
progressive motility, and the non-motile ones in the different HFD (a) and CD (b) generations.
............................................................................................................................................... 156
Figure 8: The normal sperm morphology percentage in the different HFD and CD groups. ..... 157
Figure 9: The mean percentage of TB positive cells in the different HFD (a) and CD groups (b).
............................................................................................................................................... 158

13
List of tables
Chapter 1 The drawbacks of obesity on the glomerulopathy, testicular homeostasis and
sperm epigenome
Table 1:The systems implicated in internal environment homeostasis in humans ....................... 15
Table 2: Table showing the classification of the overweight and obesity ................................... 25
Table 3: Table showing some of the sex gland secretions .......................................................... 35
Table 4: A summary of the phenotypes derived from DNMTs genes mutations. ....................... 64
Table 5: The biochemical properties of the histones . ................................................................ 71
Table 6: The different types and functions of the post-translational modifications of histones ... 71
Table 7: Table summarizing some of the epigenetic events that occur during spermatogonia
differentiation from type A undifferentiated to type A differentiated in a mouse model ............. 72
Table 8: A comparison between the epigenetic regulation in the embryonic stem cells and the
spermatogonia ........................................................................................................................... 73
Chapter 2: Selective physiological and molecular alterations in motile sperm from obese
men
Table 1: Characteristics of the study population according to the paternal BMI and WC.......... 118
Table 2: Comparison between the macroscopic semen parameters according to the paternal BMI
and WC levels. ........................................................................................................................ 119
Table 3: Comparison between the sperm parameters in the raw semen and in the motile-enriched
fraction post swim-up technique according to paternal BMI and WC levels . ........................... 120
Table 4: The diagnosis of female infertility according to the paternal BMI and WC. ............... 125
Table 5: The effect of obesity on the morphokinetic parameters of pre-implantation embryo
development ............................................................................................................................ 126
Table 6: The effect of paternal obesity on the fertilization rate and the embryo development on
day 4 and 5 of culture. ............................................................................................................. 127
Chapter 3: Intergenerational and transgenerational inheritance of paternal acquired
obesity and its associated glomerulopathy and subfertility in a mouse model
Table 1: Gross anatomy of the different HFD groups............................................................... 148
Table 2: Gross anatomy of the different CD groups. ................................................................ 149
Table 3: Calories intake, water balance, and kidney physiology of different HFD groups. ....... 150
Table 4: Calories intake, water balance, and kidney physiology of different CD groups. ......... 151

14
Chapter1 The drawbacks of obesity on the glomerulopathy, testicular
homeostasis and sperm epigenome
I- The body weight homeostasis
A- The human body homeostasis
The evolution from aquatic unicellular organisms to land multicellular ones requires groupings
of specialized cells into organs, which in turn are grouped into systems. To adapt and survive,
the individual cells of the human body (multicellular organism)still need a milieu similar to that
of the primordial sea. This medium is created by the extracellular body fluid. In this latter,
specialized organs assure continuous absorption of nutrients and excretion of waste products via
the urine and feces (Figure 1) (Despopoulos et al. 2003).
Figure 1:Cellular communication and homeostasis(A) Unicellular organisms can perform all
the necessary functions to live (Despopoulos, et al. 2003). (B) Multicellular organisms have
specialized organs to perform specific tasks to sustain their lives (extracted after permission from
www.santelvgar.blogspot.com).
In order to prevent depletion of essential elements and accumulation of toxic compounds, the
body has developed a physiologic process called homeostasis (from the Greek homeo- meaning
―same‖ and the Latin stasis- meaning ―standing‖). It is made up of physiologic auto-regulatory
A
B

15
mechanisms that maintain steady states of the body. The systems implicated in maintaining this
equilibrium are summarized in Table1 (Despopoulos et al. 2003).
Table 1:The systems implicated in internal environment homeostasis in humans
(Despopoulos et al. 2003)
Body systems Major organs Functions
Cardiovascular
system
- heart
- blood vessels
- Connects all the systems
together
- Exchanges compounds between
blood and intercellular spaces
- Regulates the body temperature
Digestive system
- Major organs:
mouth, oesophagus, stomach, small
and large intestine
- Secondary organs:
liver, pancreas, salivary glands and the
gall bladder
- absorbs
- Processes water, salts…
- Distributes
- Excretes waste and toxins
Respiratory system
- Upper respiratory tract:
nose, nasal cavity, pharynx and larynx
- Lower respiratory cavity:
trachea, bronchi, alveoli and the lungs
- Oxygen ( O2) intake
- Carbon dioxide ( CO2)
elimination
- Regulates the internal
environment
(Osmolality, pH, ion
concentrations…)
Excretory system
( urinary)
- Kidneys
- Ureters
- Bladder
- Urethra
- Excretes the excess of water,
salts, acids
- Excretes the waste, toxins and
foreign bodies
- Regulates the internal
environment
(Osmolality, pH, ion
concentrations…)
Apart from the local regulation in each organ, these body systems can communicate together and
with the external environment due to the coordinated control of regulatory systems. There are

16
three families of regulators: the nervous, endocrine and immune systems. The operation of these
systems and the integration of information among them are responsible for the integrity of the
organism or the homeostasis. This is accomplished by an intercellular communication that
implements:
- A detector that responds to a chemical or physical stimulus
- Components that integrate the signals coming from the detector
- Molecular mechanisms responsible for the transmission of information among cells of the
same system and / or different systems
The intercellular communication signals are mainly of physical or chemical origin. At the
fundamental level, the chemical signals are classified according to their site of secretion. The
signals secreted in the interstitial fluid are the local paracrine and autocrine factors (growth
factors as well as factors of the inflammatory reaction and cellular immunity), in addition to the
chemicals diffusing in the synaptic space, which are termed neurotransmitters. However, the
signals secreted in blood and using blood vessels to reach their cellular targets are the hormones
and the antibodies. So, the concept of hormones is based on a physiological definition
concerning the fluid compartment in which these signals are transported (Idelman et al. 2000).
According to the needs of the organism at any change in the internal or external environment, the
mechanisms of adaptation and regulations are triggered:
1-The nervous system monitors the changes in the internal environment by the sensory receptors.
It can regulate the altered parameters by controlling the effectors cells: cardiac muscle, gland
cells, and smooth muscles of the internal organs (stomach, intestine…) and of the blood vessels.
Moreover, the nervous system monitors the external milieu by controlling the skeletal muscles
(body movements) and by modulating the behavior (eating, learning, looking for sex…)(Figure
2A) (Despopoulos et al. 2003).
2-The endocrine system is involved in lipids, proteins, and carbohydrates metabolism. In
addition, it plays a crucial role in growth, fat stores, reproduction, thermoregulation, glucose
homeostasis and adaptation to the fluxes in the external conditions (Despopoulos et al. 2003).
The endocrine cell can function as a mechanoreceptor that is sensitive to the change in blood
volume for instance or as a chemoreceptor that is sensitive to the ionic concentration (Na+, K
+…)
or to the hormonal substance. Endocrine cells secrete hormones into the blood that can act on
distal target cells (Figure 2B) (Idelman et al. 2000).
3-The immune system is essentially involved in the defense of the body against external
aggressions or internal changes (viral or malignant transformations). Immune cells can secrete
molecules that regulate the activities of the neurons. In turn, these secreted molecules could be
regulated by the hormones and the neurotransmitters (Figure 2C) (Idelman et al. 2000).

17
Figure 2: Organization of the integration systems.
(A) Anatomy of the nervous system. (B)Scheme showing the main hormones of the endocrine
system, their site of secretion and their major target cells.(C) Interaction between the three
integration systems to establish the homeostasis of the internal milieu. TRH= thyroid releasing
hormone, TSH= thyroid stimulating hormone, PRH= prolactin releasing hormone, PRL=
prolactin, GnRH= gonadotropin releasing hormone, FSH= follicle stimulating hormone, LH=
luteinizing hormone, GHRH= growth hormone releasing hormone, GH= release hormone, CRH=
corticotropin releasing hormone, ACTH= adrenocorticotropic hormone, ADH= antidiuretic
hormone.

18
Nonetheless, a living being so complex and so organized, will eventually wear out and die.
Therefore, humans like the majority of the species depend on the reproductive system to
maintain their continuity. The copulation and the reproduction are assured by a group of female
genital organs (ovaries, fallopian tubes, uterus, and vagina) and male genital organs (testicles,
spermatic ducts, sex glands, and penis). Also, the physiology of the reproductive system is under
the control of the regulatory systems (Brooker et al. et al. 1998) .
B- The body weight management
The body weight is defined by the grand total of bones, organs, body fluids and adipose tissue.
The percentage of fat mass and free fat mass compartments is subject to continuous
modifications as a result of changes in reproductive status, growth, aging, fever and excessive
sport. Asserting body weight homeostasis is crucial to defend against extravagant weight
fluctuations(Gee et al. 2008).This equilibrium is managed by the metabolic energy network and
the control of food intake.
B. 1 The metabolic energy network
The energy is the ability of a system to perform work such as heart beating and respiration. The
animals pick up energy mainly from protein, carbohydrate and fat metabolisms. After
processing, the ingested foodstuffs could be transformed to energy-rich substances (adenosine
triphosphate = ATP) and heat. Once ATP is hydrolyzed energy is produced and may be used as a
fuel for cellular processes, muscle activity, ion transport, etc… An ideal diet should also provide
water, minerals, vitamins and roughage (indigestible plant fibers: cellulose…), which facilitate
the transit of food in the digestive tube.
The metabolic energy network is made up of a group of organs and cells involved in energy
consumption, energy storage and regulation of energy usage. The cardinal goal of this network is
to establish the metabolic homeostasis. On one hand, the supplied energy is used for different
cellular processes; whereas an excess in energy supply will activate a cascade of events to store
the energy in the white fat cells as triacylglycerol or in the liver cells as glycogen. On the other
hand, the metabolic network will mobilize the energy from its stores when the supply is reduced.
The main components of this network are (Despopoulos et al. 2003; Gee et al. 2008):
B.1.1 The digestive system: intake, processing and distribution of foodstuffs
Foodstuffs enter the body via the mouth where they are mixed with the saliva. Mammalian saliva
is a heterogeneous biological fluid, composed of water (H2O), solutes (low concentrations of
sodium (Na+) and chlorine (Cl
-) / high concentrations of potassium (K
+) and bicarbonate (HCO3
-

19
)) and proteins (mucins, α-amylase, lingual lipase, lysozyme, immunoglobulin A, growth factors
and KalliKrein). Saliva constituents reflect its crucial functions. At first, water and mucins
lubricate the food while eating thus facilitating its decomposition and swallowing. Besides that,
digestion of starch and triglycerides start in the mouth due to presence of the α-amylase and the
lingual lipase respectively. Saliva is a hypotonic solution with low NaCl concentration that
serves in maintaining the oral hygiene and rinsing the teeth and the taste receptors. Moreover, the
high HCO3- content regulates the pH and helps in protecting the tooth, the upper gastrointestinal
tract by buffering the oesophagus and neutralizing the acidity of gastric fluid during vomiting. In
addition, the growth factors can repair the damaged oral tissues. Saliva also defends against
different types of aggressors(Melvin et al. 2005; HETIZMAN et al. 2008; Ueda et al. 2013).
Next, the swallowed nutrients are transported via the oesophagus to the stomach where they are
transformed into a liquid form termed chyme. The latter is periodically ejected to the small
intestine, facilitating its decomposition by the pancreatic, hepatic and intestinal secretions. The
resulting products (amino acids, free fatty acids, and monosaccharaides) as well as water and
vitamins are absorbed in the mucosa of the small intestine. Then the waste products and the
excess of ions and water move down the large intestine; this organ serves as a last stop for fluid
and minerals absorption, and as a storage area for feces (Despopoulos et al. 2003).
B.1.2 Cells and molecules implicated in glucose homeostasis and energy management
Glucose is the essential carbon and energy source for the body. The ability of the organism to
eliminate the excessive amount of glucose from the bloodstream following a meal (glucose
tolerance) is of paramount importance. The failure in the establishment of glucose homeostasis in
the blood may lead to severe complications such as hypertension and kidney failure.
After a meal, the high level of glucose in blood stimulates insulin secretion from the β-cells of
the pancreas. The secreted insulin acts on the energy storage cells (adipocytes, skeletal muscle
cells, and hepatocytes) to stimulate the uptake of the glucose. However, in the fasted state, the
low level of glucose stimulates the secretion of glucagon from the pancreatic α-cells in order to
increase the concentration of plasma glucose (Figure3) (Schwartz et al. 2013).

20
Figure 3:The central role of pancreatic islets in the maintenance of the normal level of
plasma glucose (Schwartz et al. 2013).
a) Energy storing cells
a. 1 The white adipose tissue
The white adipose tissue is one of the essential elements of the metabolic energy network.
Grossly speaking, it is distributed throughout the body (Figure 4A, 4B). The white adipose
tissue contains adipocytes, pre-adipocytes, white blood cells, endothelial cells, and fibroblasts
(Wozniak et al. 2008). At the cytological level, the white adipocytes are spherical cells,
characterized by a single lipid droplet made up of triacylglycerols generated from the
metabolism of fat, carbohydrate, amino acids, and from the glucose uptake. Thus, the nutritional
status of the body could modify the amount of lipid in this droplet (Figure 4C) (Berridge et al.
2012).
Following a meal, the secreted insulin binds to its receptor on the adipocyte, facilitates the
glucose uptake from the blood, and drives lipogenesis in the white fat cells to store the energy. In
contrast, when the energy is needed to accomplish a physiological process, several hormones
(e.g. glucagon, adrenocorticotropic hormone (ACTH), and norepinephrine (NE)) drive lipolysis
and release fatty acids and glycerol into the blood (Figure 4C) (Berridge et al. 2012).
Moreover, the adipose tissue is also considered as an endocrine organ secreting hormones,
proteins, and cytokines. These molecules are important mediators of metabolism and
inflammation (Figure 5) (Wozniak et al. 2008).

21
Figure 4: The adipose tissue.
(A) In humans, the white adipose tissue is widely distributed in the body but mainly in
subcutaneous and intra-abdominal areas. However, the brown adipose tissue is abundant in new
born babies but in the adults it is present in cervical, supraclavicular, and paravertebral regions
(Bagchi et al. 2012). (B) Scheme showing the distribution of the two types of adipose tissue in a
mouse at 20 degree Celsius (Scale bar represents 2 cm) (Bagchi et al. 2012).(C) Illustration
showing the role of adipocytes in establishing the metabolic homeostasis (Berridge et al. 2012).

22
Figure 5: Relation between the white adipose tissue and metabolism
The white adipose tissue may regulate the metabolism by modulating the energy homeostasis,
the adipocyte differentiation, and insulin sensitivity. Moreover, the white adipose tissue plays an
important role in the inflammatory control, in protecting the cardiovascular system, and in
vascular inflammation(Wozniak et al. 2008).
a. 2 The liver
The hepatocytes or liver cells have various crucial functions in the body; of particular interest is
the maintenance of steady level of blood glucose (euglycaemia). After digestion, the nutrients are
absorbed in the intestine and then transported to the liver via the portal vein. Subsequently, this
hyperglycaemia induces hyperinsulinaemia that will stimulate the glucose uptake by the liver
cells. In the hepatocytes, the glucose is stored as glycogen. In contrast, when the energy is
required after fasting or due to stress, several hormones (e.g., ACTH, adrenaline, and glucagon)
drive the glycogenolysis and gluconeogenesis; thus increase the hepatic glucose production
(Figure 6)(Schwartz et al. 2013).
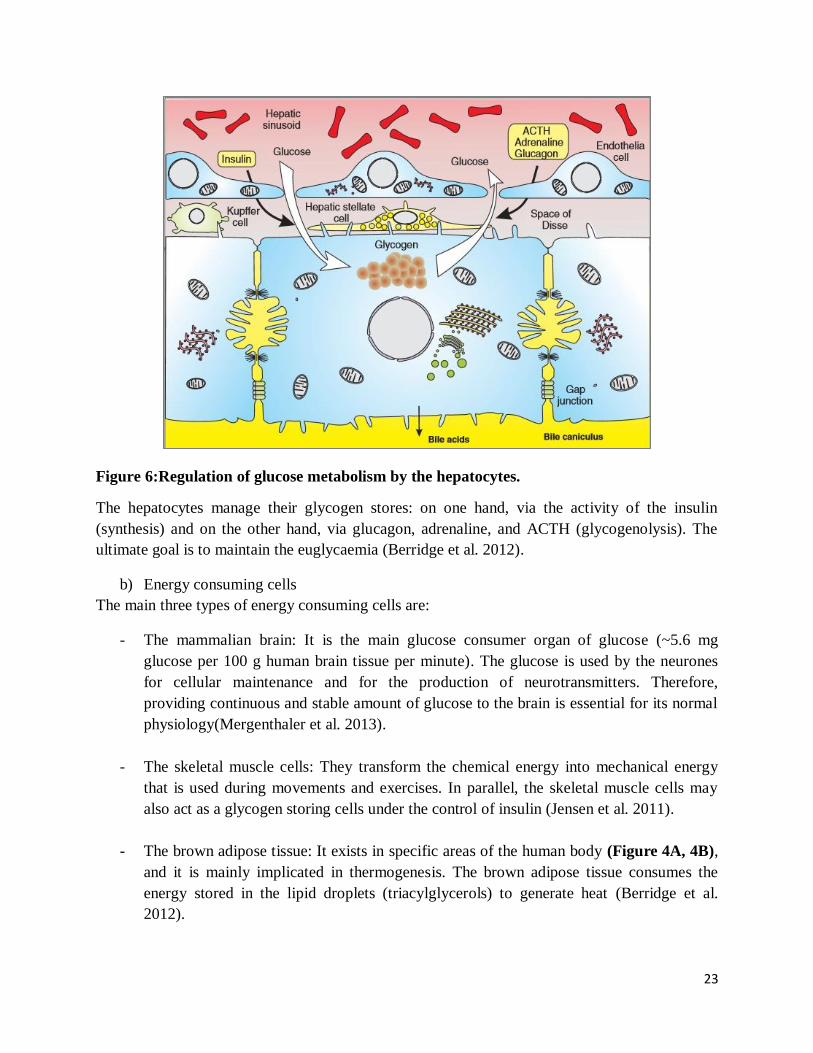
23
Figure 6:Regulation of glucose metabolism by the hepatocytes.
The hepatocytes manage their glycogen stores: on one hand, via the activity of the insulin
(synthesis) and on the other hand, via glucagon, adrenaline, and ACTH (glycogenolysis). The
ultimate goal is to maintain the euglycaemia (Berridge et al. 2012).
b) Energy consuming cells
The main three types of energy consuming cells are:
- The mammalian brain: It is the main glucose consumer organ of glucose (~5.6 mg
glucose per 100 g human brain tissue per minute). The glucose is used by the neurones
for cellular maintenance and for the production of neurotransmitters. Therefore,
providing continuous and stable amount of glucose to the brain is essential for its normal
physiology(Mergenthaler et al. 2013).
- The skeletal muscle cells: They transform the chemical energy into mechanical energy
that is used during movements and exercises. In parallel, the skeletal muscle cells may
also act as a glycogen storing cells under the control of insulin (Jensen et al. 2011).
- The brown adipose tissue: It exists in specific areas of the human body (Figure 4A, 4B),
and it is mainly implicated in thermogenesis. The brown adipose tissue consumes the
energy stored in the lipid droplets (triacylglycerols) to generate heat (Berridge et al.
2012).

24
B. 2 The control of food intake
Food intake brings to the body the energy needed to balance the amount of energy burned during
various cellular processes. In order to maintain this energy balance, the feeding and the satiety
are controlled by neuronal and endocrine signalling systems:
The feeding center in brain can respond to sensory stimulations (visual, taste, and smell)
initiating the food uptake. Following the entry of the foodstuffs to the gastrointestinal tract, the
stomach, the gut and the pancreas secrete hormones that may stimulate or inhibit the appetite;
here are some examples (Figure 7):
- Ghrelin is a hormone secreted mainly by the stomach before the meal, and stimulates the
feeding center in the brain
- Cholecystokinin (CCK), glucagon like-peptide 1 (GLP-1), and peptide YY (PYY) are
secreted in the gastrointestinal tract and transported via the blood to the brain, where they
act as satiety signals.
In parallel, the body fat mass and fat-free mass can also participate in the regulation of energy
intake. On one hand, the white adipocytes can ‗sense‘ the content of their lipid droplets and
secrete tonic hormones such as leptin (inhibits the feeding center in the brain) for long-term
regulation of the energy stores. On the other hand, the daily physiological demand of energy
(resting metabolic rate), body movements, and exercise can also regulate the food uptake to
balance the energy expenditure (Figure 7) (Stensel et al. 2010; Parker et al. 2014; Blundell et al.
2015; Moehelecke et al. 2015).
Figure 7: A diagram showing the possible regulators of food intake and energy
balance(Blundell et al. 2015).

25
II- Weight imbalance: obesity complications
An imbalance between the energy intake and energy expenditure results in body weight
fluctuations (e.g., gain or loss); the most common are overweight and obesity. Obesity is defined
by an excessive accumulation of adipose tissue either generalized or localized within the
body(Blundell et al. 2000; Proietto et al. 2004). Several ways could be used to assess the obesity
such as:(De Lorenzo et al. 2016):
a- The body mass index (BMI):
It is a ratio of the weight to the squared height (BMI = weight (Kg) / height (m2)) of an
individual, allowing to approximately determine the percentage of fat in the body. Based on this
ratio, the people could be divided into five categories: underweight, normal weight, overweight,
obese class I, obese class II, obese class III (Table 2).
Table 2: Table showing the classification of the overweight and obesity(De Lorenzo et al.
2016)
Categories Body mass index ( Kg/m2)
Underweight < 18.5
Normal weight 18.5-24.9
Overweight 25.0-29.9
class I obesity 30.0-34.9
class II obesity 35.0-39.9
Class III, extreme obesity ≥ 40
b- waist circumference (WC) :
The measurement of the waist circumference could be performed according to the National
Health and Nutrition Examination Survey (NHANES) (measurement at the top of iliac crest) or
according to the World Health Association (WHO) (midpoint between last palpable rib and top
iliac crest) (Pettitt et al. 2012). The WC indicates the amount and the distribution of the fat
within the body. Furthermore, a WC over 102 cm in men and over 88 cm in women indicates an
excess in sub-cutaneous truncal-abdominal fat, termed android obesity. The ―apple-shape‖ or
android obesity is more common among men(WHO 2008).
Obesity has exceeded the stage of dietary measures and has reached alerting level worldwide.
Recent reports revealed that the prevalence of obesity is high in different countries such as USA,
Saudi Arabia and Lebanon (Figure8and 9) (Nasreddine and Naja et al. 2012; AL-Quwaidhi et
al. 2014; Ogden et al. 2014; Vilet-Ostaptchouk et al. 2014). Moreover, the prevalence of obesity
among young population aged 5-17 years and among young men of reproductive age is very
high(Wu et al. 2006; Ng et al. 2014; McPherson et al. 2015).

26
Figure 8: The prevalence (%) of obesity among adults in different countries (Nasreddine
and Naja et al. 2012; AL-Quwaidhi et al. 2014; Ogden et al. 2014; Vilet-Ostaptchouk et al. 2014;
Julia et al. 2016).
Figure 9: The high prevalence (%) of overweight and obese among young population aged
5-17 years in both developed and developing countries(Wu et al. 2006).
When the body weight increases, histological changes occur in the white adipose tissue such as
an increase in the number and size of white adipocytes as well as in the number of infiltrated
white blood cells and apoptotic adipocytes. These modifications are accompanied with an altered
87%
10%
3%
normal overweight obese

27
secretion profile of the white adipose tissue (e.g., an increase in the levels of pro-inflammatory
cytokines (tumor necrosis factor, and interleukin 6), an increase in the level of the free fatty
acids, leptin, resistin, and decrease in the concentration of adiponectin) (Wozniak et al.
2008).Altogether, these alterations play a key role in the in the development of several
pathologies such as type 2 diabetes mellitus (T2DM), cardiovascular diseases, respiratory
diseases, and infertility (Golay et al. 2005; Fulleston et al. 2012). Of particular interest, obesity is
one of the leading factors for the high prevalence (8.5%) of diabetes in Lebanon (Costanian et al.
2014) (Figure 10).
Figure 10: The central role of adipose tissue in the development of obesity-associated
complications.
The expanded white adipose tissue (WAT) in obese subjects enhances the release of the
interleukin-6 and the tumor necrosis factor resulting in insulin resistance in the WAT.
Subsequently, the insulin resistance increases the lipolysis in the WAT. Moreover, the affected
WAT releases high levels of pro-inflammatory cytokines, free fatty acids and low levels of
adiponectin. These secretions promote insulin resistance and lipid accumulation in the muscle

28
cells. Also, they increase the production of glucose, lipid, and fibrinogen by the hepatocytes.
Subsequently, the high level of plasmatic glucose will increase the insulin production by the
pancreas leading to a hyperinsulinemia. This results in the loss of homeostasis in blood vessels
(Eckel et al. 2005; Wozniak et al. 2008; Gauthier et al. 2010).
In the following sections we will focus on the effect of obesity on the urogenital apparatus, but
mainly on the kidney and testicular homeostasis. This apparatus is characterized by a
topographic and embryologic relationship between its organs (Hinrichsen et al. 1986).
A- The drawbacks of obesity on kidney homeostasis
The increase in the prevalence of obesity parallels the increase in the chronic kidney disease
worldwide(Sharma et al. 2014). As mentioned earlier, obesity can lead to the development of
hypertension and type 2 diabetes which together account for approximately 70% of end-stage
renal disease(Griffin et al. 2008).
A. 1 Kidney physiology
The mammalian body contains 2 kidneys that are located in the retro-peritoneal region, on either
side of the vertebral column. They play a pivotal role in the urine formation, in the excretion of
metabolic waste products and toxic molecules, in the maintenance of Na+ homeostasis, in
osmoregulation, and also function as endocrine organs. At the histological level, each kidney is
made up of approximately one million nephrons. Nephron is the functional autonomous unit of
the kidney that has (Figure 11A) (Berridge et al. 2012):
- An afferent arteriole which branches and narrows into capillaries to form the glomerulus.
The endothelial cells of each capillary are surrounded by a basement membrane, and an
outermost layer of podocytes. These three layers form the healthy glomerular filtration
barrier. This filtration barrier helps to serially limit the escaping of serum large proteins
(e.g., albumin) from the capillary loop; an abnormal protein leakage from the capillaries
may lead to tubulointestinal injury and thus a decline in kidney function (Figure 11 A, 11
B)(Jefferson et al. 2008).
- Between the capillaries of the glomerulus there is a group of specialized cells termed
mesangial cells. They are multifunctional cells; they can contract/relax and thus regulate
the blood flow. They play a structural role in the kidney due to their contribution in the
secretion and degradation of the extracellular matrix (such as: fibronectin, collagen IV,
percalan, and laminin).
- The glomerulus is surrounded by a Bowman’s capsule. The space created between the
glomerulus and the Bowman‘s capsule is termed as Bowman’s space. The blood plasma
and all the small soluble molecules exit the capillaries and accumulate in the Bowman‘s
space; thus creating the primary urine filtrate.

29
- Then the primary urine flows into the nephron tubules. These tubules are surrounded by a
second capillary network. The latter is created from branches of the efferent arteriole that
leaves the glomerulus. This capillary network around the tubules is essential for
modifying the composition of the primary urine filtrate.
- The filtrated urine first enters the proximal convoluted tubule (PCT).It is responsible of
water and Na+
reabsorption from the urine. That‘s why the cells of the PTC contain
aquaporins, and a specialised plasma membrane suitable for isotonic fluid reabsorption.
- Next, the filtrate enters the thin descending part of loop of Henle. At this level, the water
is also reabsorbed by the aquaporin of the descending portion cells. Consequently, the
urine becomes highly concentrated.
- As the concentrated fluid move up the thick ascending loop of Henle (TALH) the cells
become tightly linked together; they can absorb sodium but they have less water
permeability. Fascinatingly, the close association between the TALH and the arterioles of
the glomerulus creates the juxtaglomerular apparatus (JGA). The cells of the TALH
facing the JGA are specialised cells termed macula densa. They can detect the
concentration of Na+ and Cl
- in the urine (Figure 12). When the concentration of Na
+ in
the TALH is too high it will draw water out of the body and decreases the blood pressure.
In order to maintain a steady blood pressure and to prevent dehydration, the kidney
activates auto-regulatory mechanisms:
A. The macula densa cells detect the high concentration of Na+
and release ATP. The
latter will stimulate the renin-producing granular cells. Consequently, these cells
secrete renin that will transform the angiotensinogen in the plasma into angiotensin I.
Furthermore, the angiotensin-converting enzyme (ACE) converts angiotensin I into
angiotensin II (Figure 12).
B. By itself, angiotensin II is a hormone that can perform various functions (Figure 12):
a) It stimulates the secretion of aldosterone by the adrenal gland. Aldosterone regulates
the reabsorption of Na+ by the distal convoluted tubules (DCT).
b) In addition, the angiotensin II may act on the brain to drive water uptake, and to
stimulate the secretion of the vasopressin which is responsible of water retention.
c) Plus, the angiotensin II and the ATP produced by the macula densa cells could act on
the smooth muscle cells to increase blood vessels constriction.
d) Moreover, angiotensin II inhibits the secretion of renin by the renin-producing
granular cells.

30
- The dilution of the urine continues in the DCT with Na+, Cl
-, and Ca
2+ reabsorption.
Finally, several DCT are connected to a collecting duct, where the cells of the upper
region of the duct continue to reabsorb the Na+. However, water reabsorption in
collecting ducts is only possible via the influence of the vasopressin (Berridge et al.
2012).
Figure 11: Anatomy of the nephron.(A)The structural organisation of the nephron (Berridge et
al. 2012).(B)The gross anatomy of normal healthy glomerulus (Jefferson et al. 2008).
Figure 12: Regulation of blood Na+ levels by the kidney (Berridge et al. 2012).

31
A. 1.1 Obesity-related glomerulopathy (ORG)
The increase in the BMI was shown to be associated with pathological changes in the glomeruli
histology and physiology(Griffin et al. 2008).
A. 1.1.a The effect of obesity on the glomerular histology(de Vires et al. 2014; Sharma et
al. 2014; D'Agati et al. 2016):
- Glomerulomegaly (glomerular hypertrophy) is characterized by the increase in the
glomerular diameter and/or volume measured on histological sections. The biopsy
samples from obese individuals may show an increase in the diameter of the glomerular
capillaries and the afferent arteriole. In response to the glomerulomegaly, the podocytes
may show a mal-adaptive response to obesity by increasing their size (hypertrophic
changes) and decreasing their density.
- Progressive glomerulosclerosis is defined as an increase in the extracellular matrix
deposition and/ or sclerosis (fibrosis) between the capillaries of the glomerulus leading to
their obliteration. The glomerulosclerosis occurs mainly at the glomerular vascular pole,
but also it could develop at any site of the glomerulus. In a mice model of diet-induced
obesity, histological sections of the kidney showed an increase in the thickness of the
glomerular basement membrane, a mesangial matrix expansion, and an increase in the
deposition of type IV collagen in the glomeruli. These findings indicate that the high fat
diet may induce glomerular sclerotic injury in mice (Deji et al. 2008).
- Tubular damage and interstitial fibrosis are also common features in obese patients.
A. 1.1.b Decline in renal function and obesity
a) Renal hemodynamics (Figure 13):
The glomerular filtration rate (GFR) is defined as the total fluid volume filtered by the glomeruli
of both kidneys per unit time (~ 180 L/day). Approximately, 99% of the GFR is reabsorbed by
the nephron tubules and 1% is excreted (urine output ~ 1to2 L/day). Moreover, some indicators
present in the plasma may help to measure the GFR. For instance, the creatinine could be used as
an indicator since it does not alter the renal function and it is freely filtered, not reabsorbed by
the tubules, and not metabolized by the kidney. However, glomerular hyperfiltration is an
abnormal increase in the GFR of the kidneys (Helal et al. 2012). Of particular interest, several
studies showed that obesity is generally associated with systemic hypertension, resulting in
glomerular afferent arteriole vasodilation. The high blood flow may augment the pressure inside
the capillaries which may lead to an increase in the GFR (Chagnac et al. 2000).

32
Moreover, this abnormal glomerular hyperfiltration in obese subjects is more likely correlated to
an increase in sodium concentration in the tubules (Strazzullo et al. 2001). To counterbalance the
loss of this high concentration of salt, the renin-angiotensin-aldosterone system is overactivated.
The level of aldosterone and angiotensin II were shown to be higher in obese subjects(Engeli et
al. 2004). On one hand, angiotensin II stimulates Na+
reabsorption in the PCT. On the other hand,
aldosterone and angiotensin II may induce efferent arteriole vasoconstriction which may increase
the pressure inside the capillary and thus promotes further glomerular hyperfiltration. BMI and
WC are independent predictors of sodium reabsorption in the PCT (D'Agati et al. 2016).
Secondary to the excessive reabsorption of salt in the PCT, the low levels of Na+ in the urine
could be detected by the macula densa of the TALH. Consequently, the tubuloglomerular
feedback is deactivated resulting in further afferent arteriole vasodilation and thus glomerular
hyperfiltration (D'Agati et al. 2016). Moreover, the glomerular hyperfiltration may affect the
protein handling in the glomeruli. Epidemiological and observational studies demonstrated that
the prevalence of proteinuria or macroalbuminuria is increased in obese patients (Valensi et al.
1996; Chen et al. 2004).
Figure 13: Pathogenesis of obesity-related glomerulopathy. The two major players in the
development of ORG are the hypertension and the lipid accumulation in the kidney (D'Agati et
al. 2016).

33
Altogether these hemodynamic changes in obese patients will lead to a glomerulomegaly with
capillary growth, podocytes hypertrophy, detachment and apoptosis. Consequently, these
histological lesions will develop the obesity-related glomerulosclerosis (D'Agati et al. 2016).
Furthermore, chronic and serious hypertension (e.g.,pre-eclampsia during pregnancy)may
increase the risk of renal failure and present small and condensed glomeruli, narrowed
Bowman‘s space, and occluded capillary lumen on histological sections of the kidney (Datta et
al. 2004; Siddiqui et al. 2011) (Figure 14).
Figure 14: Histological kidney sections. Histological kidney sections stained with
haematoxylin and eosin (upper panel) and with periodic acid Schiff (lower panel). These sections
show the small glomerulus and the narrowed Bowman‘s space in the kidney derived from
pregnant mice with pre-eclampsia (severe hypertension) (Siddiqui et al. 2011).
b) Hyperglycemia and hyperlipidemia:
In humans and mice, the adipose tissue increases the size and the number of its adipocytes as the
body weight increases (Guo et al. 2004; Wozniak et al. 2008). It can secrete adipokines such as
leptin, adiponectin, and resistin that could affect renal extracellular matrix, cellular hypertrophy
and fibrosis in rodents (D'Agati et al. 2016). Moreover, obesity in humans and rodents may lead
to the accumulation of lipids in the kidney ―fatty kidney‖ (mainly in mesangial cells and tubular
cells), resulting in inflammation, and fibrosis (Figure 13)(de Vires et al. 2014).
In addition, obesity may induce the development of type 2 diabetes leading to a hyperglycemia.
High glucose levels could activate several pathways in the kidney (e.g., hexokinase pathway,
polyol pathway) promoting an abnormal deposition of the extracellular matrix components such
as fibronectin and collagen I and IV in the glomerulus(Sharma et al. 2013; Reidy et al. 2014).
The diabetic-kidney disease (DKD) is a leading cause of the development of end-stage renal
disease. The DKD is characterized by: arteriole hyalinosis, basement membrane thickening,
mesangial cells hypertrophy, nodular glomerulosclerosis development, podocytes
hypertrophy/loss, albuminuria followed by a decline in the GFR, tubulointestinal inflammation
and fibrosis (Alsaad et al. 2006; Tervaert et al. 2010; Reidy et al. 2014).

34
B- The drawbacks of obesity on testicular homeostasis
Andrology (from Greek Andros, man), is a multifaceted medical specialty dealing with normal
and pathological aspects of male sexuality and reproductive health (Auger et al. 2009). Badly,
there is an increase in the prevalence of male obesity among young men suffering from
andrological disorders (Palmer et al. 2012) . The following section, will discuss in details the
impact of obesity on the reproductive health of males.
B. 1 Male reproductive system anatomy (Figure 15)
The testicles are twin oval-shaped gonads that produce male gametes (motile spermatozoa) and
sexual hormones. Testicular functions are thermodependent (~ 36oC) and sensitive to heat stress.
That‘s why they are localised outside the body in the scrotum. The scrotum is a suspended thin
skin sac, containing contracting muscles (dartos and cremaster) with minimal subcutaneous
adipose tissue. These features plus the testis vasculature play a major role in the testicular
thermoregulation, preventing hyperthermia and heat stress (Durairajanaygam et al. 2015).
Furthermore, each testicle is attached to an epididymis characterized by sausage-shaped
structure. The gametes mature as they pass through the epididymis and could be stored in it. The
epididymis is connected to the vas deferens where the spermatozoa are mixed with the seminal
vesicle secretions. Next, the spermatozoa are transported to the ureter due to the peristaltic
contraction of vas deferens. In the ureter, the male gametes are exposed to the prostatic and
Cooper gland secretions. The secretions of the different sex glands contribute to the complex
content of the seminal plasma (Table 3). Finally, the semen (spermatozoa + seminal plasma) is
ejaculated via the penile urethra (Caroppo et al. 2011).
Figure 15: Sagittal view of testis and male pelvis (Caroppo et al. 2011).

35
Table 3: Table showing some of the sex gland secretions
Sex gland Molecules Functions References
Seminal vesicles
Fructose
Present at high concentrations
(7.55-34.86 mM)
(Montagnon et
al. 1982)
Source of energy
(Owen et al.
2005)
Insulin
Its concentration in the semen is higher
than in serum (19 ± 3µU/ml vs.
7.53µU/ml respectively)
(Hicks et al.
1973)
(Paz et al.
1977)
Largely unknown
(Lampiao et
al. 2008)
May enhance sperm motility
(Lampiao et
al. 2008)
Prostaglandins
Immune tolerance of male gametes in
the female tract
(QUAYLE et
al. 1989)
Semenogelin
Gelatinous entrapment of ejaculated
spermatozoa, thus playing a major role
in semen coagulation
(Wang et al.
2015)
Fibronectin Gelatinous entrapment of ejaculated
spermatozoa, thus playing a major role
in semen coagulation
(Wang et al.
2015)
Prostate
Carnitine Metabolism of fatty acids and
antioxidant effect
(Abd-Allah et
al. 2009)
Calcium ions Regulation of sperm physiology and
modulation of oxidative stress
(Stru¨nker et
al. 2011)
Zinc Antioxidant, antibacterial, and
protection against heavy metals (lead)
(Dissanayake
et al. 2010)
Prostate-
specific antigen
(PSA)
Digestion of the gel formed after
ejaculation = liquefaction
(Wang et al.
2015)
Cooper gland Lubricating
fluid
Neutralize urine acidity and lubricate the
urethra
(Choughtai et
al. 2005)
By the sperm
itself
Glucose present in semen at a range of
concentrations ( 0.22-16.37 mM)
(Bakos et al.
2010)
Present endogenously within the sperm
as glycogen/ source of energy
(BALLESTER
et al. 2000)
Insulin Auto-regulation of glucose metabolism (Aquila et al.
2005)

36
B.1.1 The effects of obesity on testicular anatomy, sexual function and seminal plasma
biochemistry
The sedentary life style and the increase in calories intake by obese men could impair their
reproductive health. On one hand, male obesity may lead to the accumulation of scrotal fat; thus
inducing testicular hyperthermia. The excess of subcutaneous adipose tissue in the scrotum may
inhibit the sperm production by the testicles and increase the risk of infertility. However, surgical
removal of the scrotal fat in obese patients improves the sperm count, motility, and morphology
(Sahfik et al. 1981; Durairajanaygam et al. 2015). On the other hand, erectile dysfunction and
reduced libido are common conditions among obese men (Bacon et al. 2006; Larsen et al. 2007;
Traish et al. 2009). Interestingly, these functions could be restored after weight loss (Esposito et
al. 2004).
Furthermore, the sex accessory glands and the seminal plasma components could also be affected
by male obesity(Binder et al. 2015).The seminal plasma is an alkaline gelatinous fluid (pH ~
7.2), made up of seminal vesicle secretions (~60% of the total semen), and prostate gland
secretions (~20% of the total semen volume). Moreover, this biological fluid not only serves as a
transport and survival medium for spermatozoa, but also can modulate the female reproductive
tract; potentially influencing the embryo development and implantation. It was demonstrated in
mice, pigs, and humans, that seminal plasma induces a post-mating inflammatory response in the
female tract, facilitating the embryo implantation. In addition, several studies in mammals
highlighted the role of seminal plasma in regulating fetuses growth trajectory(Robertson et al.
2005; Lane et al. 2014). In a mice model of diet induced obesity, Binder and colleagues showed
that seminal vesicle proteins and metabolites are affected by obesity. Also, clinical data indicate
that obese men are at higher risk to have a reduced semen volume (Eisenberg et al. 2014) and an
altered seminal plasma biochemistry. The level of insulin, leptin, fructose, and interleukin 8 were
found to be higher in the semen of obese men; whereas the adiponectin, progranulin, and alpha-
glucosidase levels were lower (Martini et al. 2010; Lotti et al. 2011; Thomas et al. 2012;
Leisegang et al. 2014). Plus, men with type 2 diabetes had a higher level of nitric oxide (NO) in
the seminal plasma when compared to non-diabetic men. NO can lead to an oxidative stress at
high concentration, and its presence in the seminal plasma of diabetic men was posit ively
correlated to the presence of oxidized nucleoside of DNA (8-hydroxydeoxyguanosine (8-
OHdG)). Further, malondialdehyde (MDA) which is one of the oxidative stress markers was
detected at significantly higher level in the semen of men with type 2 diabetes when compared to
non-diabetic ones. Altogether, these data open the question on the drawbacks of this altered
seminal plasma composition in obese men on the spermatozoa, the uterine environment, and the
embryo development.
Besides these alterations, several scientific papers hot spotted the correlation between obesity
and prostate cancer. It was concluded that obese men are at greater risk to experience aggressive
prostate cancer specific mortality (Discacciat et al. 2012; Moller et al. 2014).

37
B. 2 Testicular histology and physiology
The human testis is divided by a group of septa into 250 to 300 lobules. Each lobule is composed
of interstitial tissue and one to three seminiferous tubules (figure 16: A and B).The interstitial
and the tubular compartments are histologically distinguishable from each other but are
physiologically connected. All the processes involved in the production of male gametes take
place in the tubular compartment, whereas the main function of the interstitial tissue is the
production of male sex hormones. The integrity of both compartments is crucial for sperm cells
(male gametes) differentiation (Weinbauer et al. 2010).
Figure 16: Histological section of the human testis(A)Histological section of entire human
testicle (Weinbauer et al. 2010). (B)Histological section of the human testis (x10) showing the
two testicular compartments (McLchlan et al. 2007).

38
B.2.1 The interstitial compartment (Weinbauer et al. 2010)
The interstitial compartment occupies approximately 12-15 % of the testicular volume. It is
composed of Leydig cells (200x106Leydig cells per testis), immune cells, blood vessels,
fibroblasts, and connective tissue (Figure 17).
Figure 17: Illustration of the testicular interstitial tissue.Spz= spermatozoa, PT = peritubular
cell, BTB= blood-testis barrier.
a) Blood vessels
The testicular interstitial tissue contains small arteries, capillaries and small veins. The
circulating nutrients, oxygen and hormones leave the blood vessels and diffuse into the
interstitial and tubular compartment. In contrary, the metabolic and cellular wastes are carried
away by the small veins(Jones et al. 2013). It was suggested that diabetes in men and rats may
increase the wall thickness of blood vessels, and modify the vascular density, thus altering the
testicular homeostasis (Villarroel-Espindola et al. 2015).
b) Leydig cells
b.1 Overview
Leydig cells were first described in 1850 by Franz Leydig. These cells secrete the most important
male steroid hormone called testosterone via steroidogenesis. The latter, is a group of enzymatic
reactions leading to the production of testosterone from cholesterol. Moreover, leydig cells
secrete insulin-like factor 3 (INSL3) which is a local regulator of testicular functions. At the
cytological level, Leydig cells are rich in smooth endoplasmic reticulum and mitochondria.
These two organelles are mainly implicated in steroid production. Lipid droplets are also present
in the cytoplasm and provide the starting materials for testosterone formation (Weinbauer et al.
2010).

39
b.2 Steroidogenesis
Leydig cells contain the machinery for androgen (testosterone) production. They have a direct
access to the blood vessels, permitting the uptake of the luteinizing hormone (LH) and
cholesterol from the circulation to produce male sexual hormone. The cascade of events leading
to the synthesis of testosterone is summarized in (Figure 18). The produced testosterone can
diffuse to the interstitial and tubular compartment to regulate the process of spermatogenesis.
Also, the testosterone is secreted into the blood. Testicular androgen plays important roles in
brain masculinization and sexual behavior, in modulating the larynx growth, in the stimulation of
erythropoietin synthesis in the kidney, in maturation of male sexual organs, hair growth, in
regulating the bone and muscle mass, and in protein synthesis in the liver.
Figure 18: Illustration of the cascade of events leading to male sexual hormone production
by the Leydig cell. The luteinizing hormone (LH) binds to its receptor (LHR) on the plasma
membrane of the Leydig cell and activates it. This will lead to the transformation of adenosine
triphosphate (ATP) to cyclic adenosine monophosphate (cAMP). cAMP can stimulate a
signaling cascade that will activate a group of genes involved in the steroidogenesis process.
Free cholesterol could be transported to the mitochondria after the synthesis of the
steroidogenesis acute regulatory protein (StAR). Inside this organelle, the cholesterol will be
transformed to pregnenolone via the activity of cytochrome P450 side chain cleavage (P450scc).
Pregnenolone is subsequently, transported to the smooth endoplasmic reticulum and metabolized
by several enzymes (3β-hydroxysteroiddehydrogenase (3β-HSD), steroid 17 alpha-
hydroxylase/17,20 lyase (P450c17), and 17β-hydroxysteroid dehydrogenase (17β-HSD)) to form
testosterone (Zirkin et al. 2000).

40
b.3 The effect of obesity on Leydig cell physiology and androgen homeostasis
The physiology of the testis is under the control of the endocrine system. Furthermore, the
hormone produced by the testis regulates the action of the hypothalamus-pituitary-testis axis. In
men with normal weight, the hypothalamus releases the gonadotropin-releasing hormone
(GnRH) that will bind to its receptor on the pituitary goandotrophs stimulating the release of LH
and follicle stimulating hormone (FSH).LH can stimulate the Leydig cells to produce
testosterone. The circulating testosterone is mainly bound to the albumin or to the sex hormone
binding globulin (SHBG) synthesized by the liver. The SHBG reduces the clearance rate of the
androgen and regulates their access to target tissues. In addition, the free circulating testosterone
can be transformed in the adipose tissue into oestrogen (E2) under the activity of an enzyme
called aromatase. High oestrogen level can reduce the GnRH secretion from the hypothalamus
(Michalakis et al. 2013).
In obese men, the excess fat mass and the hyperinsulinemia may lead to a decrease in the SHBG
production by the liver. This will increase the amount of free testosterone available for
conversion into E2 by the accumulated fat mass. In 2005, Pitteloud et al., demonstrated that
insulin resistance can also inhibit the testosterone secretion by Leydig cells. These
pathophysiological changes could explain the increase in E2 concentration and the decreased
level of testosterone and gonadotropins in obese men (Pitteloud et al. 2005; Michalakis et al.
2013) . In parallel, glucose and lipid homeostasis are essential for normal Leydig cell
functioning. Alteration in glucose levels and consumption of high amounts of unhealthy fats may
inhibit the testosterone production and induce Leydig cell apoptosis (Figure 19) (Amrolia et al.
1988; Lu et al. 2003; Rato et al. 2014).

41
Figure 19: The high-energy diet overconsumption affects the reproductive axis at the
central and at the gonadal levels. Solid lines represent stimulatory effects; dashed lines
represent inhibitory effects (Rato et al. 2014).
c) Immune cells (Weinbauer et al. 2010):
Interstitial immune cells play an important role in the testicular homeostasis. There is
approximately one macrophage for every 10-50 Leydig cells. The main functions of these
immune cells are:
c.1 Phagocytosis, proliferation and physiology of Leydig cells
Macrophages and monocytes are potential sources for regulatory factors such as interleukin-1
(IL-1) and tumour growth factor (TGF) that may modulate Leydig cell phagocytosis,
proliferation and differentiation. Interestingly, testicular macrophages can stimulate the steroid
production by Leydig cells via the secretion of 25-hydroxycholesterol.

42
c.2 Immunoregulation and inflammation
Inflammatory response against bacterial and viral infection can occur in the testicular interstitial
tissue. Interstitial leukocytes can secrete pro-inflammatory cytokines such as interleukin 6 (IL-6),
interferon gamma (IFN-ɤ), reactive oxygen species (ROS), and prostaglandins that could
negatively affect the spermatogenesis and the steroidogenesis (Figure 20). Likewise, testicular
mast cells could be activated and secrete a serine protease tryptase. This product can stimulate
the collagen production by interstitial fibroblast, resulting in fibrosis.
c.3 The effect of obesity on testicular immune cells
The mouse model of diet-induced obesity is a widely used model to mimic the acquired obesity
in humans. A recent study showed that mice on high fat diet (HFD) had an alteration in the testis
inflammatory profile. These obese mice had an increased level of pro-inflammatory cytokines
mRNA expression (TNF-a, MCP-1, and F4/80) in the testis. This pathogenic inflammation may
alter the testicular physiology (Zhang et al. 2015).
Figure 20: Interstitial immune cells secrete stimulatory and inhibitory factors that may
regulate Leydig cell physiology.(1) Reactive oxygen species (ROS), lipopolysaccharide (LPS),
interferon-γ (IFN-γ), leukemia inhibitory factor (LIF) can inhibit the Steroidogenic acute
regulatory protein (StAR) (2) 3β-hydroxysteroid dehydrogenase (3β-HSD) could be inhibited by:
ROS, and LPS (3) P450scc may be inhibited by: LPS (4)LPS, IL-6, IFN-β, and nitrite oxide
(NO) may inhibit P450c17 (5) 17β-hydroxysteroid dehydrogenase (17β-HSD) may be inhibited
by IL-6.(Hales et al. 2002).However, IL-1 and TGF can regulate the proliferation and

43
differentiation of leydig cells whereas 25-hydroxycholesterol may stimulate the testosterone
production.
B.2.2 Tubular compartment
The total number of seminiferous tubules is about 600 per testis and the length of each
seminiferous tubule is approximately 60 cm. Thus, the tubular compartment occupies
approximately 60 to 80 % of the testicular volume. The seminiferous tubule is made up of
peritubular tissue (basal membrane and peritubular cells) and germinal epithelium (Sertoli cells
and germinal cells) (Figure 21).
Figure 21: Organization of the seminiferous tubule.
RB: residual body, LS: late elongated spermatid, ES: elongating spermatid, P: pachytene
spermatocyte, JC: junctional complexes of the BTB, PT: peritubular cells, B: type B
spermatogonia, Ap: type A pale spermatogonia, SC: Sertoli cell, Ad: type A dark spermatogonia
(Weinbauer et al. 2010).

44
a) Peritubular cells
The wall of seminiferous tubule is covered by several layers of elongated cells. These peritubular
cells (PT) have the capacity to contract leading to the movement of fluid and sperm from the
tubule. This could be explained by the expression of several receptors for the regulators of cell
contractions by the PT such as endothelin, angiotensin, vasopressin, oxytocin, prostaglandins and
androgenic steroids. Moreover, adrenomedullin relaxant peptide secreted by Sertoli cells can
induce peritubular cell relaxation. Besides that, human and rodents PT cells secrete a wide range
of factors that can regulate Sertoli cell secretome, extracellular matrix composition, germ stem
cells regulation and modulate the inflammatory response (Figure 22) (Weinbauer et al. 2010).
However, a decrease in spermatogenic activity in the seminiferous tubule is associated to loss of
PT contractility and increase of collagen deposition in the peritubular wall. This fibrotic
remodelling is a hallmark of testicular dysfunction(Albrecht et al. 2009; Flenkenthaler et al.
2014) and might be induced by diabetes (Villarroel-Espindola et al. 2015).
Figure 22: Scheme illustrating the function of some the peritubular cells (PT) secreted
factors.
The tumour necrosis factor alpha (TNF-α) secreted by interstitial mast cells can stimulate the
secretion of immunomodulation factors such as nerve growth factor (NGF), monocyte
chemoattractant protein-1 (MCP-1), and interleukin-6 (IL-6) by the PTC. Moreover, the human
and rodent PT can secrete molecules implicated in extracellular matrix formation like fibronectin
and collagen. Importantly, the PT may modulate the secretion of transferrin (which transports
iron to the germ cells), inhibin, and androgen binding protein (which stimulates the seminiferous

45
epithelium and carries androgens to the epididymis) by the Sertoli cell. This modulation is
possible due to specific factors such as PMOdS (peritubular modifying substance), insulin-like
growth factor-1 (IGF-1), and bFGF secreted by the PT(Albrecht et al. 2009).Also, the analysis of
the PTC secretome showed an important presence of two chemokines (C−C motif chemokine 2
(CCL2) and stromal cell derived factor 1 (CXCL12)) that may play a role in germ stem cells
mobilization, migration, and homing.(Albrecht et al. 2009; Flenkenthaler et al. 2014)
b) Sertoli cells
b. 1 Overview
The Sertoli cells are the somatic cells of the seminiferous tubules, which are closely linked to
germ cells and enable their protection and development. They were first described by the Italian
scientist Enrico Sertoli in 1865. The normal testis contains 800 to 1200 x 106Sertoli cells, which
represents approximately 35 to 40 % of the germinal epithelium volume (Weinbauer et al. 2010).
b. 2 Cytological features
The Sertoli cell is a large pyramidal cell which extends over the entire height of the seminiferous
epithelium from basement membrane until the lumen of the tubule. Its nucleus is large,
triangular, and presenting visible nucleoli in testis biopsy slides. In the seminiferous epithelium,
the germ cells are surrounded by the ramifications of these Sertoli cells. Furthermore, the
cytoplasm is rich in smooth endoplasmic reticulum indicating the presence of steroid synthesis, a
well as rough endoplasmic reticulum which is a mark of protein synthesis. In addition, the
cytoplasm contains a developed Golgi apparatus implicated in the management of secretory
products, an important number of lysosomal granules involved in the process of phagocytosis in
addition to microtubules and intermediates filaments used by the Sertoli cells for shape
adaptation (Weinbauer et al. 2010).
b. 3 Sertoli cell functions
The Sertoli cells play a crucial role in the development of germ cells and in the regulation of
spermatogenesis. They receive the hormonal messages (FSH and testosterone) and the local
signals (autocrine and paracrine), allowing them to secrete other factors that modulate their own
functions, and those of germ cells and Leydig cells (Weinbauer et al. 2010).

46
The Sertoli cells perform several functions:
They are in charge of the final testicular volume. In adults, Sertoli cells are mitotically
inactive, so the number of these cells is created before puberty. They define the final
testicular volume. In addition, Sertoli cells have the capacity to support a fixed number of
germ cells. In men, each Sertoli cell is connected to approximately 30-50 germ cells
(Neto et al. 2016). This binding is under the control of testosterone. Low testosterone
levels in obese men may lead to retention and phagocytosis of spermatids and thus
decrease mature sperm count (O Mc Pherson et al. 2015).
They secrete the transferrin and the ferritin, which transport the iron to the germ
cells. Testicular iron homeostasis is essential for germ cells DNA synthesis and
mitochondriogensis (Leichtmann-Bardoogo et al. 2012). It was shown that transferrin
secretion by Sertoli cells is under the control of insulin, IL-1, IL-6, TNF-α,PMOdS,
bFGF, and IGF-1 (Huleihel et al. 2004, Dias et al. 2014).
They provide the energy substrates necessary for the germ cell survival. Sertoli cells
can uptake glucose via glucose transporters (GLUTs) under the control of androgens,
FSH and insulin. After this internalization, the glucose could be converted to pyruvate via
an enzyme called phosphofructokinase (PFK). On one hand, pyruvate could be converted
by pyruvate dehydrogenase (PDH) to acetyl-coenzyme A, which enters the mitochondria
to generate ATP. On the other hand, pyruvate could generate lactate via the activity of
lactate dehydrogenase (LDH). Since the germ cells cannot metabolize glucose they will
uptake the generated lactate by Sertoli cells. The monocarboxylate transporter (MCT)
will facilitate the lactate internalization in the germ cells in order to produce ATP (Figure
23)(Dias et al. 2014).

47
Figure 23: Schematic presentation of the metabolic coupling between Sertoli cells
and the germ cells. Abbreviations: GLUT1 and GLUT3, glucose transporter 1 and 3;
MCT2 and MCT4, monocarboxylate transporter 2 and 4; TCA, tricarboxylic acid; PFK,
phosphofructokinase; LDH, lactate dehydrogenase, PDH, pyruvate dehydrogenase(Dias
et al. 2014).
They secrete the seminiferous tubular fluid and they regulate its composition. This
fluid creates a suitable environment for spermatogenesis and for the transports of the
sperm cells in the testis. At the biochemical level, it is an acidic fluid, rich in water,
sodium (Na+), chloride (Cl
-), and potassium (K
+) (Rato et al. 2010). The other
constituents of the tubular fluid are bicarbonate, magnesium, inositol, carnitine,
glycerophosphorylchoine, amino acids, and several proteins. All together, these
compounds make the tubular fluid of unique composition in which the germ cells are
immersed.
They have the ability to eliminate the defective germ cells and the sperm residual
bodies by phagocytosis. This biological process is important to maintain a constant ratio
of germ cells to Sertoli cells, to eliminate the leakage of toxic compounds by
degenerating cells and residual bodies, and to supply energy to the Sertoli cells (Hai et al.
2014).

48
They play an important role in seminiferous tubule steroids homeostasis. Under the
influence of the circulating LH, the Leydig cells may produce testicular androgen
(testosterone). At first, the testosterone can be metabolized in the Sertoli cell by the
aromatase to produce estradiol (E2). The testosterone /E2 ratio may play an important
role in the spermatogenesis. Secondly, the testosterone is a precursor for the production
of a highly biologically active hormone dihydrotestosterone (DHT) by the 5 α-reductase
in the Sertoli cell. In addition, the testosterone and the PModS (secreted by the PT) can
stimulate the secretion of the androgen-binding protein (ABP) by the Sertoli cells. It is a
carrier protein that binds to testosterone and to DHT to regulate their bioavailabity in the
tubular fluid, and to control the process of spermatogenesis (Figure 24)(Jones et al.
2013).
Figure 24: Steroids homeostasis in the seminiferous tubule. Luteinizing hormone
(LH), Testosterone (T), Androgen-binding protein (ABP), dihydrotestosterone (DHT),
Estradiol (E2), peritubular cells (PTC), peritubular modifying substance (PModS).
Follicle stimulating hormone (FSH) regulates Sertoli cell physiology. The GnRH
hormone secreted by the hypothalamus can stimulate FSH and LH secretion by the
pituitary gland. The circulating FSH binds to its receptor on Sertoli cell and control
virtually all the functions related to spermatogenesis. Interestingly, FSH controls the
expression of crucial molecules for sperm production such as inhibin B (negative
regulator of FSH secretion), anti-mullerian hormone (AMH= function remains unclear in
adult testis), aromatase, androgen-binding protein (ABP), steroidogenesis-stimulating
protein (STP = stimulate steroid production in Leydig cells)….(Jones et al. 2013).

49
They secrete growth factors, cytokines and antioxidants. Glial cell-derived
neurotrophic factor (GNDF), TGF-α, TGF-β, EGF, jagged-1/2, Interleukin1 (IL-1), and
Interleukin 6 (IL-6) are Sertoli cells-derived growth factors and cytokines that regulate
germ cells differentiation (Hai et al. 2014; Neto et al. 2016). Moreover, Sertoli cells may
protect the germ cells from the oxidative stress via its antioxidants such as superoxide
dismutase, glutathione reductase, trasnferase, and peroxidase (Bauche et al. 1994).
They create the blood testis barrier. The blood testis barrier (BTB) is a structural
boundary between interstitial capillaries and the interior of the seminiferous tubules. It is
made up of specialized junctions between adjacent Sertoli cells dividing the seminiferous
epithelium into two compartments. The basal compartment where the early germ cells are
located and the adluminal compartment containing the later stages of maturing germ
cells. The functions of the BTB are to control the exchange of large molecules between
the metabolically separated compartments, to isolate and to prepare the special milieu for
germ cell differentiation, and to protect the germ cells from the immune system (Figure
25)(Wagner et al. 2008).
Figure 25: Illustration showing the compartmentalization of the seminiferous
epithelium by the specialized junctions between the Sertoli cells(Wagner et al. 2008).
b. 4The effects of obesity on Sertoli cell functions (Figure 26 ):
As mentioned earlier, the increase in the peripheral testosterone aromatization may modify
the testosterone/E2 ratio and thus inhibit LH and FSH secretion. Consequently, it affects
inhibin B and AMH secretion. It was shown in obese men, with a high BMI, that the
hormones involved in the regulation of Sertoli cells functions (FSH, inhibin B, AMH) were
lower when compared to non-obese individuals (Michalakis et al. 2013; O Mc Pherson et al.
2015; Neto et al. 2016).

50
Moreover, obesity may alter Sertoli cell metabolism and consequently will affect the germ
cells. On one hand, insulin stimulates several activities in the Sertoli cell, mainly
carbohydrate metabolism. Lactate is produced by Sertoli cell under the control of insulin; it
has an anti-apoptotic effect and it is the main energy source for germ cells. In a diabetic-like
environment with insulin resistance, insulin- deprived Sertoli cells may decrease lactate
production thus affecting spermatogenesis (Olivera et al. 2012). Recently, Rato and
collaborators showed that feeding rats with a high-energy diet may lead to an increase in the
expression of glucose transporters and glycolytic enzymes in Sertoli cell. Altogether, these
changes increased the level of lactate and subsequently the oxidative stress in these
cells(Rato et al. 2014). In addition, testicular biopsies from diabetic men showed
vacuolization of Sertoli cells that may alter testicular glucose homeostasis (Alves et al. 2012)
.
On the other hand, lipid metabolism plays an important role in the testicular tissue. Sertoli
cells can uptake fats by passive diffusion through the plasma membrane, by protein
facilitated transport, and from the phagocytosed cells. Sertoli cells may utilize the
internalized lipids to produce energy (ATP) or to generate polyunsaturated fatty acids
(PUFAs). The PUFAs are essential for germ cells plasma membrane fluidity and flexibility
and thus for fertilization. The excessive consumption of saturated fats present in the
unhealthy diets may lead to their accumulation in the testicular cells. This abnormal
accumulation of saturated fats affects the process of spermatogenesis and the physiology of
the mature sperm cells (Rato et al. 2014).
Another complication derived from obesity is the testicular oxidative stress. By definition,
oxidative stress is induced by the imbalance between the reactive oxygen species (ROS) and
the ROS scavengers. Interestingly, the process of spermatogenesis is associated with a high
rate of oxygen consumption and consequently important ROS production by the
mitochondria. The hyperglycaemia and hyperlipidemia may exacerbate this outcome. The
intracellular accumulation of lipids increases the rate of β-oxidation of the fatty acids.
However, when testicular mitochondria are overloaded, they will be stressed. Under this kind
of stress, the mitochondria reduce the ATP production and induce ROS overproduction. The
high level of free ROS may attack and affect the PUFAs on the sperm plasma membrane,
testicular proteins, mitochondrial and genomic DNA…In parallel, the high-energy diets may
reduce the testicular antioxidant system by reducing the expression of ROS-detoxifying
enzymes in the testis such as proliferators-activated receptor γ coactivator 1α(PGC-1α) and
sirtuin 3 ( SIRT3). Altogether, these findings reveal that overconsumption of food may
induce an oxidative stress in the testis and thus impairs sperm quality (Rato et al. 2014).
It‘s important to note that, the BTB can modulate to a certain extent the glucose and lipid
uptake regarding their availability in the blood (Alves et al. 2012). However, histological
analysis of the testis, from mice on high fat diet, showed that obesity may alter the BTB
integrity (Fan et al. 2015). So, obesity may bypass the BTB adaptive mechanisms to the

51
changing environment and affect its main functions in selective transport and permeability
(Alves et al. 2012).
Figure 26: The drawbacks of excess high-energy diet consumption on testicular
homeostasis (Rato et al. 2014).

52
c) Germ cells
Sexual reproduction requires the fusion of two haploid cells (containing 23 chromosomes each,
in humans) from two parents to generate a diploid single cell called zygote (containing 46
chromosomes). The zygote (from the Greek “zygotos”- meaning ―pairing‖) is a totipotent single
cell that has the potential to develop into a multicellular blastocyst. This latter is made up of 2
layers: the trophectoderm and the inner cell mass containing the embryonic stem cells (ESC).
Furthermore, the blastocyst may undergo gastrulation where a group of cells specializes into
primordial germ cells (PGC). Once the PGCs are specified, they migrate to the gonad and
differentiate into adult male germ cells (AGSC). The mature haploid sperm cells originate from
the multiplication, the cytoplasmic differentiation, and the nuclear remodelling of AGSC in a
process called spermatogenesis (Figure 27) (Ramathal et al. 2011). The spermatogenesis could
be divided into four phases:
a- The spermatogoniogenesis: this phase involves the proliferation (mitotic divisions) and
the differentiation of the germ stem cells (spermatogonia).
b- The resulting spermatogonia undergo two rounds of meiotic divisions resulting in
haploid germ cells (spermatids).
c- The spermiogenesis is a crucial phase where the round non-motile spermatid is
transformed to a flagellated sperm.
d- Finally, the sperm is released from the germinal epithelium into the tubular lumen by a
process called spermiation.
Figure 27: The cycle of mammalian germ cell development (Ramathal et al. 2011).
c. 1 Spermatogonia
Spermatogonia lie directly on the basement membrane of the seminiferous tubule. More
precisely, they belong to the basal compartment of the germinal epithelium created by the BTB.
The spermatogonia are the final germline stem cells rising from primordial germ cells (PGC).

53
They are characterized by a self-renewal capacity, and their commitment to spermatogenesis.
The spermatogonia are classified as:
- Dark type A (Ad): They just proliferate when there is a drastic decrease in the stock of
spermatogonia (Ehmechke et al. 2006).
- Pale type A (Ap):They renew themselves by mitosis to maintain the stock of
spermatogonia and they can differentiate into Type B spermatogonia. Ap spermatogonia
are analogous to the undifferentiated type A spermatogonia (Aundiff) in rodents.
- Type B spermatogonia: These are differentiated cells that divide by mitosis to produce
primary spermatocytes. The primary spermatocytes divide meiotically to give rise to
secondary spermatocytes and spermatids.
Regulation of spermatogonial self-renewal capacity and differentiation :
The germinal epithelium homeostasis is defined by the balance between germ cell proliferation
and differentiation. The transcription profile of the self-renewing spermatogonia (spermatogonia
stem cells (SSCs)) and those committed to spermatogenesis is distinct. The SSCs are
characterized by the high expression of receptors for the cytokines secreted by the interstitial
immune cells such as colony-stimulating 1 receptor (Csf1r), Interleukin 10 receptor (Il10r), and
the tumour necrosis factor receptor (Tnfr). Moreover, they selectively express proto-oncogenes
and tumor suppressors giving them a higher self-renewal capacity when compared to the
spermatogonia committed to spermatogenesis (Table7 and 8) (Hammoud et al. 2014).
In contrast, spermatogonial differentiation and meiosis initiation requires vitamin A/retinol.
Only, the spermatogonia devoted to gametogenesis can respond to the retinoic acid (RA)
(vitamin A metabolite). The circulating vitamin A is metabolized by two successive reactions:
retinol is converted to retinal by retinol dehydrogenases then the retinal is converted to RA by
retinaldehyde dehydrogenases (e.g., Aldh2). It was shown that the aldehyde dehydrogenases and
the retinoic acid receptor G (RARG) are overexpressed in differentiating spermatogonia,
indicating a putative role of RA in the male gametogenesis (Table7 and 8).
When the RA binds its receptors RARA/RARG, it can stimulate the transcription of Stra8
(stimulated by retinoic acid, overexpressed in differentiated spermatogonia), Rec8 (meiotic
recombination protein, provides the structural maintenance of the chromosomes), and other
genes implicated in meiosis. In parallel, RARs can activate the
PI3K/PDK1/AKT/mTORC1signalling pathway, leading to the translation of the repressed
mRNA such as KIT, SOHLH1, SOHLH2 (spermatogenesis and oogenesis specific basic helix-
loop-helix 1 and 2). Once activated SOHLH 1 and 2 induce the genes important for
spermatogonial differentiation.(Tabe7,Figure 28)(Suzuki et al. 2012; Hammoud et al. 2014;
Busada et al. 2015).

54
Figure 28: The role of retinoic acid in meiotic entry. Retinoic acid (RA) stimulates the
translation of the repressed mRNAs (KIT, SOHLH1, SOHLH2) in undifferentiated
spermatogonia and thus induces the differentiation of the spermatogonia. Moreover, RA may
activate the transcription of genes important for meiosis such as Stra8 and Rec8, etc… (Busada
et al. 2015).
The impact of obesity on spermatogonia:
Interleukin 6 (IL-6) is a cytokine secreted by adipose tissue and macrophages; it induces
inflammatory response at elevated concentrations. A recent study showed that a high level of IL-
6 was detected in the serum and testis of obese mice. This may decrease the level of a zinc finger
protein (Zfp637) in spermatogonia. The downregulation of Zfp637 reduces spermatogonial
differentiation (Huang et al. 2016). Furthermore, obesity may induce testicular hyperthermia and
the spermatogonia (Adark) are more vulnerable to heat stress due to their high mitotic activity
(Ivell et al. 2007; Durairajanaygam et al. 2015). Altogether, these data highlight the drawbacks
of obesity on spermatogonial survival and differentiation.
c. 2 The meiotic cells
The type B spermatogonia are diploid cells made up of 23 chromosomes, each with two
homologs: one is paternally and the other is maternally inherited. To avoid the doubling of
chromosome number at each generation, gametogenesis involves meiotic divisions which reduce
the 46 chromosomes to 23 chromosomes. As a result, the gametogenesis process produces
haploid gametes containing each a single homologue of each chromosome(Morgan et al.
2007).The first phase during meiotic divisions is the differentiation of type B spermatogonia into
pre-leptotene spermatocytes (leptotene from Greek leptos, thin + tainia, filament). This is a
phase of DNA synthesis with a replication of chromosomal filaments (2 x 46 chromosomes).
Following this step, the spermatocytes are transferred to the adluminal compartment of the BTB

55
and enter the prophase I with its five steps;leptotene, zygotene, pachytene, diplotene, and
diakinesis (Figure 29)(Harris et al. 2014):
- Leptotene: the duplicated chromosomes become visible under the form of irregular
filaments and close to each other.
- Zygotene (from Greek zygon, pairing + tainia, filament): the two homologous
chromosomes stick together via the synaptonemal complex. It is a group of proteins that
allows the pairing and the exchange between the homologous chromosomes.
- Pachytene (from Greek pachys, thick + tainia, filament): the duplicated homologous
chromosomes are shorter and thicker forming a tetrad. At this step, the exchange of
genetic materials between the homologous chromosomes occurs.
- Diplotene (from Greek diploos, two + tainia, filament): disintegration of the
synaptonemal, the homologous chromosomes are just bound at a specific points termed
chiasma.
- Diakinesis (from Greek meaning moving through): maximal condensation of the
chromosomes. At the end of this phase the nuclear envelope disappears.
At the end of the prophase I, every spermatocyte contain a new recombination of paternal and
maternal genetic materials. Following this phase, the spermatocytes enter into the metaphase I
where the chromosomes align at the metaphase plate. Next, each of the homologous
chromosomes will migrate to a pole of the cell during the anaphase I. The first round of meiosis
ends by a cytokinesis (cell division), giving rise to two spermatocytes II. The generated
spematocytes II undergo a second round of cell division with a short prophase II. During this
step, neither DNA replication nor a recombination of genetic materials occur. Afterwards, the
chromosomes of the spermatocytes II align at the metaphase II plate. Then they procede through
anaphase II where each of the 2 copies of the chromosomes migrates to a pole of cell. Finally,
the spermatocyte II undergos a cytoplasmic division resulting in two haploid spermatids (Figure
29)(Hartl et al. 2011).
c. 3 The spermiogenesis
The spermiogenesis is a complex phase of the male germline differentiation that represents the
transformation of spermatids into spermatozoa. It is a transition from a round motionless cell to a
flagellated, motile sperm. The sperm is a highly differentiated cell able to fertilize a female
gamete and to induce embryo development (Figure 30).

56
Figure 29: Illustration of the major events that occur during the meiotic division (Hartl et
al. 2011)

57
The propelling sperm flagellum formation starts in the round spermatid, when the centrosome
migrates to one pole of the cell, and nucleates the tubulin proteins into microtubules. The
microtubules form the motility apparatus of the sperm tail termed as axoneme. Mammalian
sperm flagellum is divided into three parts(Sharma et al. 2011):
a) The midpiece: The microtubules are surrounded by outer dense fibres (ODF) and
mitochondria. The mitochondria play a central role in mature sperm metabolism,
which can now metabolize different substrates (e.g., glucose, fructose, lactate, fatty
acid, amino acids). The produced energy (ATP) is utilised for sperm motility, and
various sperm functions (Boussouar et al. 2004; Dias et al. 2014).
b) The principle piece: The microtubules are just surrounded by a fibrous sheath
c) End piece: contains only a part of the microtubules
On the opposite side of the cell, the vesicles derived from the Golgi apparatus fuse together to
form a cap-like structure, covering 40 to 70% of the anterior sperm head; called acrosome. The
acrosome contains different hydrolytic enzymes playing an important role in the fertilization
process. Moreover, intracellular forces (from the sperm cytoskeleton) and extracellular forces
(from the Sertoli cells) interact to induce sperm head elongation. Altogether, these mechanisms
will lead to differentiation of a sperm with an oval head and propelling flagella (Kierszenbaum et
al. 2004; Krohmer et al. 2004).
One of the important spermatid cytodifferentiation features is the compaction of the nucleus.
This compaction protects the paternal DNA once ejaculated outside the body. The nuclear
compaction involves torsional stresses on the DNA that could be relieved by physiological
activity of the topoisomerase. An absence of proper DNA strand breaks repair will lead to DNA
fragmentation in the germ cells. In addition, oxidative stress and abortive apoptosis may also
lead to sperm DNA fragmentation. High levels of sperm DNA fragmentation can be responsible
of low fertilization rate, poor embryo quality, repeated failure of assisted reproductive
technology attempts, and miscarriages (Balhorn et al. 2011; Choucair et al. 2016).
At the end of spermiogenesis a shedding of the majority of the cytoplasm takes place.
Consequently there is a reduction in the mechanisms of defense against the oxidative stress. The
resulting mature sperm, is characterized by a tiny amount of cytoplasm and a fluid plasma
membrane rich in unsaturated fatty acids (plasmalogenes and sphingomyelins) facilitating the
flexibility and the functional ability of the sperm (Atiken et al. 1994; Saraswat et al. 2014).

58
Figure 30: The process of spermiogenesis. (A) Schematic representation of the main
morphological changes during spermiogenesis. (B) Gross anatomy of mature sperm (Boussouar
et al. 2004; Jones et al. 2014).
c. 4 The impact of male obesity on sperm parameters and embryo development
Several studies using rodent models of diet-induced obesity showed that male obesity decreases
sperm count, impairs sperm motility and morphology; whereas one study showed no difference
in sperm motility (O Mc Pherson et al. 2015). In addition, acquired obesity in rodent males
increases the oxidative stress in the testis, sperm, and seminal plasma (Bakos et al. 2011; Chen et
al. 2013; Duale et al. 2013; Zhao et al. 2014; Fullston et al. 2015); by itself oxidative stress in
Macaca mulatta, mice and bull sperm may alter the pre-implantation embryo development and
the health of the offspring (Burruel et al. 2014; Lane et al. 2014; De castro et al. 2015). Also, the
percentage of DNA damage in the spermatids (Palmer et al. 2011) and in the mature sperm was
found to be significantly higher in obese male mice compared to non-obese mice (Bakos et al.
2011; Chen et al. 2013; Duale et al. 2013; Fullston et al. 2013; Vendramini et al. 2014; Zhao et
al. 2014).At the functional level, it was demonstrated that obese male mice have a negative
contribution to the pre-implantation embryo development, including a higher percentage of one –
cell embryo block, delayed cell cycle progression, decreased blastocyst number, and altered
carbohydrates metabolism (Mitchell et al. 2010; Binder et al. 2012).
In parallel, different systematic reviews have been performed in humans to evaluate the effects
of male obesity on the sperm parameters, DNA fragmentation, mitochondrial membrane
potential, and fertility outcomes. Male obesity in humans is associated with high incidence of

59
oligozoospermia and azoospermia (Sermondade et al. 2012), reduction in the percentage of
normal sperm morphology, (MacDonald et al. 2013; Campbell et al. 2015), increased percentage
of sperm with DNA fragmentation, and abnormal mitochondrial membrane potential(Campbell
et al. 2015).Moreover, a study on 81 men indicates that sperm ROS production is positively
correlated to the BMI (Tunc et al. 2011). Regarding in vitro embryo development, three reports
were published; Bakos and colleagues high spotted the significant decrease in blastulation rate
with increasing BMI, whereas Colaci et al., and Schliep et al., didn‘t find any significant
difference between obese and non-obese men for the analyzed embryologic parameters (Bakos et
al. 2011; Colaci et al. 2012; Schliep et al. 2015).Furthermore, a recent meta-analysis showed that
paternal obesity may reduce the rate of live birth per assisted reproductive technology (ART)
cycle, and obese father have a 10% risk of facing a non-viable pregnancy(Campbell et al. 2015).

60
III- Epigenetic inheritance of paternal acquired obesity
A- Epigenetic control of gene expression during spermatogenesis and early
embryogenesis
Genetics is the study of heritable modification in the gene function due to a direct modification
in the gene structure such as single mutation, translocation, insertion, and inversion of the
nucleobases (cytosine, guanine, adenine, and thymine). In contrast, epigenetics (from Greek epi-
, above and beyond) can be defined as the mitotically or meiotically heritable changes in gene
expression without changes in the DNA sequence. This biological event occurs via DNA
methylation/hydroxymethylation, chromatin modifications, and non-coding RNAs activity
(Gunes et al. 2013; Moore et al. 2013). In fact, the majority of the cells in our body are
genetically homogenous, but each cell type has its own epigenetic signature and consequently its
own gene expression profile (Abdallah et al. 2009).
A. 1 DNA methylation
The chemical modification of the DNA by the addition of a methyl group to the cytosine
nucleobase at the position C-5was first discovered in 1948 by Rollin Hotchkiss. This chemical
reaction is catalyzed by a family of DNA methyltrasnferases (DNMT) that transfers the methyl
group from S-adenyl methionine (SAM) to the cytosine leading to 5-methylcytosine (5-mC)
formation(Moore et al. 2013). SAM is a product of the methionine (amino acid) – folic acid
(Vitamin B9) metabolism playing a major role in the cross-talk between food intake and DNA
methylation(Figure 31)(Zhang et al. 2015).
Figure 31: Flow diagram of methionine-folic acid metabolism.
This diagram shows the formation of the methyl-donor S-adenyl methionine (SAM) via the
methionine metabolism. The DNA methyltransferases (DNMT) can transfer the methyl-group
(X-) from SAM to the methyl acceptor molecules such as DNA, proteins, lipids, etc…MAT:

61
methionine adenosyltransferase, SAH: S-adenosylhomocysteine, DMG: dimethylglycine, MS:
methionine synthase, DHFR: dihydrofolatereductase, DHF: dihydrofolate, THF:
tetrahydrofolate. 5,10MTHF: 5,10-methylenetetrahydrofolate, TS: thymidylate synthase, dTMP:
deoxythymidine monophosphate, dUMP: deoxyuridine monophosphate, MTHFR:
methylenetetrahydrofolatereductase; 5-MTHF: 5-methyltetrahydrofolate(Zhang et al. 2015).
The DNMTs could be divided into three groups (Figure 32)(Smallwood et al. 2011; Moore et al.
2013):
- DNMT3 family is made up of 3 members DNMT3a, DNMT3b, and DNMT3L.
DNMT3A and DNMT3b catalyze the methylation of the unmodified cytosine, also
known as de novo methylation. However, DNMT3L does not have a catalytic activity,
but it can regulate the activity of other DNMT3 members.
- DNMT1 acts during DNA replication and copies the methylation profile on the new
synthesized DNA strand. Thus the role of DNMT1 is in the maintenance of DNA
methylation.
- DNMT2 is known to methylate several tRNAs.
Figure 32: The DNA methyltransferases functions. The Dnmt3a/3b catalyzes the transfer of
methyl group to the cytosine and thus induces a de novo methylation. During DNA replication,
The Dnmt1 is associated to the replication complex (RC). It can copy the methylation from the
parental DNA strand into the new synthesized strand. Moreover, Dnmt3a/3b can act as a
―checkpoint‖ and can remethylate the new synthesized strand in case of unwanted methylation
erasure(Chen et al. 2003).

62
The 5-mC is considered as an epigenetic mark since it is globally associated with gene
repression. Generally, The DNA methylation occurs on cytosine that precedes a guanine
nucleotide (CpG dinucleotide). The CpG dinucleotides are found mainly in clusters called the
CpG islets. The gene silencing by DNA methylation occurs via two ways: by inhibiting the
binding of transcriptional factors to the target sequence or by the direct binding between the 5-
mC and the transcription repressors (e.g., methyl-CpG binding protein 2 (MeCP2)). In contrast,
DNA methylation may activate the gene transcription; for example when it takes place on a
negative regulatory element of the target gene (Abdallah et al. 2009).Furthermore, the 5-mC is
found at a high level in the heterochromatin (gene-free DNA), whereas the euchromatin (gene-
rich DNA) contains a lower 5-mC level. In addition, DNA methylation contributes to the
transposons silencing, and to theX chromosome inactivation in female embryos. Interestingly,
the DNA methylation is in the core of the genomic imprinting process. This phenomenon allows
the mono-allelic expression of genes in a parent-of-origin specific manner. Alterations in the
imprinted genes may lead to several pathologies (e.g., cancers) and syndromes (such as
Beckwith-Wiedemann, Silver-Russel, Angelman, and Prader-Willi) (Balhorn et al. 2011).
A. 1.1 DNA methylation reprogramming in mouse germ cells and pre-implantation
embryos
Like all the somatic cells, each of the male and female gametes contains a specific DNA
methylation landscape. After fertilization, these marks should be erased and replaced in a manner
to generate a totipotent zygote at each generation. This phenomenon is termed as epigenetic
reprogramming (Figure 33).
At first, the primordial germ cells (PGCs) after their specification migrate to the gonadal ridge.
During this proliferation and migration phase their DNA methylation profile is erased.
Surprisingly, some genomic regions retain the 5-mC mark and escape this epigenetic
reprogramming; for example several retrotransposons, and some imprinted genes retained a low
levels of methylation. These findings high spot the possibility of epigenetic inheritance of
parental DNA methylation. Next, de novo DNA methylation of the pre-sperrmatogonia takes
place in the male gonad before birth and before the meiotic initiation. In contrast, the de novo
DNA methylation in the female gonad occurs after birth, in the oocytes arrested in the prophase I
of the meiosis. This chemical modification of the cytosine appears on unmethylated CG and on
imprinted genes in a sex-dependent manner. After fertilization, a second wave of DNA
demethylation arises. The mechanism by which the 5-mC is erased in paternal and maternal
pronuclei is not the same and it will be discussed in the next section. At this stage, not all the
genomic regions undergo DNA demethylation. The imprinted genes from the two parents
maintain their 5-mC profile as a legacy to the next generation(Smallwood et al. 2011).

63
Figure 33: The dynamics of DNA methylation during mouse gametogenesis and pre-
implantation embryos (Smallwood et al. 2011).
A. 1.2 The drawbacks of abnormal DNA methylation profile in gametes
In order to study the effects of abnormal DNA methylation on the gametes and embryos, several
targeted studies have been performed in mice models. In summary, it was shown that mutations
in the genes coding for the DNA methyltransferases enzymes may lead to dramatic changes in
the phenotype (Table 4)(Chan et al. 2011; Jenkins et al. 2012).Moreover, the alternative way to
study the impact of DNA hypomethylation on mouse sperm and embryos is the use of DNA
methylation inhibitor drugs (e.g., 5-azacytidine, and 5-aza-2-deoxycytidine).Okas et al.,
demonstrated that male mice treated with 5-aza-2‘-deoxycytidine suffer from reduced sperm
motility, reduced fertilization ability, and inability of the demethylated paternal genome to
support embryo development(Oakes et al. 2007). In humans, several studies have shown that
aberrant DNA methylation at some gene promoters (e.g., MTHFR: methylenetetrahydrofolate
reductase), at some imprinted genes, and at repetitive elements are associated with male
infertility, sperm defects and recurrent pregnancy loss (Navarro-costa et al. 2010; Wu et al. 2010;
El Hajj et al. 2011; Pacheco et al. 2011). Furthermore, it was shown that global sperm DNA
methylation was lower in patients with high seminal reactive oxygen species and with sperm
having high DNA fragmentation index, abnormal chromatin condensation, and with reduced
motility (Tunc et al. 2009; Montjean et al. 2015). Plus, advanced paternal age may differently
methylate gene promoters implicated in schizophrenia, and bipolar disorder in the sperm. So, it
does raise the risk of non-genetic transmission of neuropsychiatric disorders to the next
generation (Frans et al. 2008; Miller et al. 2010; Jenkins et al. 2014).

64
Table 4: A summary of the phenotypes derived from DNMTs genes mutations.
Target gene Phenotype Reference
DNMT1 complete or partial
loss of function in mice
- Delayed development
- Death at mid-gestation
- Abnormal biallelic expression of
imprinted genes
- Loss of X-chromosome inactivation
(Chan et al.
2011;
Jenkins et
al. 2012)
Deficiency of oocyte-specific
DNMT1 (DNMT1o) in mice
- Embryonic lethality
- Abnormal methylation at imprinted loci
DNMT1 mutations in humans
- Associated with some subtypes of
colorectal cancer
DNMT3a-deficient mice
- Survive to term
- Death after few weeks of birth
- Embryo are underdeveloped
- Normal global methylation profile
- Affected spermatogenesis
- Decreased methylation at H19 imprinted
locus
Conditional inactivation of
DNMT3a in mouse germ cells
- Infertility due to spermatogenic arrest
DNMT3b-deficient mice
- Mid-gestation lethality
- Demethylation of some genomic
sequences
DNMT3b mutations in
humans
- Autosomal recessive genetic disorders
with immunodeficiency, centromeric
instability, and facial anomalies
DNMT3L-deficient mice
- Male and female infertility
- Small testis
- Extensive chromosomal mispairing
- Abnormal methylation at specific
genomic sequences

65
A. 2 DNA hydroxymethylation and DNA demethylation
The 5-hydroxymethylcytosine (5-hmC) is an epigenetic mark first discovered in the T-even
bacteriophage. The 5-hmC is present in several tissues in vertebrate and it is involved in several
biological processes such as brain physiology, hematopoietic cells homeostasis, and cancer
pathogenesis(Tan et al. 2012). Furthermore, accumulation of 5-hmC was positively correlated to
an increase in the level of gene expression (Vasanthakumar et al. 2015).
The 5-hmC is generated by the oxidation of the 5-mC, a reaction catalyzed by the TET (ten-
eleven translocation) proteins. The TETs are a group of proteins having an enzymatic activity
(methylcytosinedeoxygenase) that depends on Fe (II) and α-ketoglutarate (α-KG or 2-
oxoglutarate). Subsequently, TETs oxidize 5-hmC sequentially to 5-formylcytosine (5-fC), and
5-carboxylcytosine (5-CaC). The 5-hmC, 5-fC, and 5-CaC can participate to the DNA
demethylation process which could occur by two ways (Figure 34)(Tan et al. 2012;
Vasanthakumar et al. 2015):
- Passive DNA demethylation:
During DNA replication, if the 5-mC is not copied to the new synthesized strand the
methylation will be passively erased. Moreover, the presence of 5-hmC, 5-fC, and 5-CaC
instead of 5-mC at the time of replication, may disrupt the maintenance of DNA
methylation catalyzed by DNMT1. Thus, the methylation could be passively diluted and
erased during replication.
- Active DNA demethylation:
It is a replication-independent way that requires enzymatic activity. On one hand, the
thymine DNA glycosylase (TDG)can recognize and excise the 5-fC and 5-CaC.
Following this step, a base-excision repair (BER) pathway converts the chemically
modified cytosine to cytosine. On the other hand, the 5-mC and the 5-hmC may undergo
a deamination process via an enzyme called activation-induced deaminase (AID).Then;
the deaminatedcytosine could be converted to cytosine also by the BER pathway-
mediated demethylation.

66
Figure 34: Regulation of gene expression by DNA methylation and demethylation.
DNA methylation takes place at the position C-5 of the cytosine. DNMTs transfer the methyl
group from SAM to the cytosine and thus induce cytosine methylation. DNA methylation is
generally associated with repressed gene transcription. In contrast, the TET enzymes oxidize the
5-mC sequentially to 5-hmC, 5-fC, and 5-CaC. These reactions require α-KG, succinate, Fe (II),
and oxygen. The 5-hmC is a positive regulator of gene expression and it is involved in passive
and/or active DNA demethylation pathway (Vasanthakumar et al. 2015).
As discussed above, some metabolites derived from nutrient intake and cellular metabolism may
regulate the TET functions. For instance, glucose could be metabolized inside the cell by several
pathways to produce different metabolites that can interfere with the 5-hydroxymethylcytosine
generation. On one hand, glucose metabolism through the glycolysis will generate the pyruvate.
This pyruvate will enter the Krebs cycle in the mitochondria to produce the α-KG which is the
co-factor/substrate that regulates the TET enzyme. Interestingly, the conversion of the isocitrate
to α-KG is catalyzed by the isocitrate dehydrogenase (IDH), but mutations in IDH 1 and 2 can
instead lead to the production of R-2-Hydroxymethylglutarate (R-2-HG). Consequently, R-2-HG
produced in several human cancers inhibits TET proteins leading to a decrease in 5-hmC in
cancer cells.
On the other hand, approximately 3% of the cellular glucose can enter the hexosamine
biosynthesis pathway (HBP). The end-product of the HBP is the uridinediphosphate N-
acetylglucosamine (UDP-GlcNAc). The latter, is transferred to the proteins and lipids via the
activity of the O-GlcNActransferase (OGT). In parallel, TETs have the ability to recruit the OGT
to the chromatin in order to modify it and to subsequently modify the gene expression. In
contrast, the OGT is overexpressed in some cancer types and this may alter the TET proteins
expression and decrease the level of 5-hmC(Figure 35)(Vasanthakumar et al. 2015).

67
Above that, Delatte et al. demonstrated that oxidative stress can also decrease the global 5-
hydroxymethylation pattern in vivo and in vitro. The data on SY5Y cell culture after their
exposure to oxidative stress and on colon epithelial cells from mice lacking glutathione
peroxidase enzyme (GPx1/2= major cellular antioxidant enzymes),show a global decrease in 5-
hmC and a local increase in 5-hmC on specific genomic loci involved in oxidative stress
response. Moreover, the depletion of TET1 in SY5Y cells sensitizes them to oxidative stress,
thus highlighting the protective role of TET1 against oxidative stress (Delatte et al. 2015).
Figure 35: The cross-talk between the glucose metabolism and 5-hydroxymethylcytosine
formation in normal and cancer cells (Vasanthakumar et al. 2015).
A. 2.1 5-hmC dynamics during mouse spermatogenesis and embryo development
The 5-hmC is present in mouse embryonic stem cells (mESCs) and in male germ cells. It may
play a role in embryo development. In contrast to the 5-mC,the global pattern of 5-hmC is
different between the mouse male germ cell types. The highest percentage of 5-hmC
accumulation is in the diploid germ cells (differentiating spermatogonia (0.097%) and
spermatogonia ready for meiotic DNA replication (0.083)). However, the haploid germ cells
have the lowest percentage ranging from 0.059% in preleptotene spermatocytes to 0.04% in
elongating spermatids. Surprisingly, the mouse spermatozoa have a higher percentage of 5-hmC
(0.061%) when compared to the other haploid germ cells (Figure 36 A). Altogether, these results
indicate that the 5-hmC represents a small but dynamic fraction during mouse spermatogenesis.
In parallel, the diploid germ cells exhibit an increase in TET enzymes expression (mainly Tet3)
and this expression drops in the haploid cells (Gan et al. 2013).The dynamics of 5-
hydroxymethylcytosine in mouse germ cells mirrors the level of gene expression in each cell

68
type. Haiyun Gan et al., found a positive correlation between 5-hmC accumulation and gene
activation. For instance, the protamines (1 and 2) and the transition protein 2 gene promoters are
highly hydroxymethylated and thus they are expressed in pachytene spermatocytes. In contrast,
the genes of PIWI- interacting RNAs (piRNAs) are highly hydroxymethylated in preleptotene
spermatocytes facilitating their expression in pachytene spermatocytes(Gan et al. 2013).
In humans, TET1-3 enzymes were shown to be expressed from pachytene spermatocytes stage
until the elongated spermatids stage. However, the 5-hmC was only detected in the elongated
spermatids(Ni et al. 2016). Defectively, malignant transformation in germ cells could affect the
DNA methylation/hydroxymethylation status, and the expression profile of TET1, TDG,
DNMT3B, and DNMT3L. For instance, some types of germ cell cancers present a global DNA
hypohydroxymethylation, and certain germ cells malignant transformation could be accompanied
by de novo DNA methylation and oxidation of 5-mC to 5-hmC , 5-fC, and 5-CaC (Nettersheim
et al. 2013). Variously, the mature human spermatozoa of fertile men, express the TET1-3
enzymes at the mRNA level and at the protein level. When the level of TETs mRNAs expression
has been compared between the sperm of fertile and infertile patients, it reveals that there is a
positive correlation between TET expression and sperm parameters (concentration, and
motility)(Ni et al. 2016).In addition, it has been shown that the human sperm present a strong
DNA methylation and weak DNA hydroxymethylation profile (Efimova et al. 2015).
Interestingly, the level of 5-hmC in human sperm is lower than that found in leukocytes and this
level increases significantly with advanced paternal age (Jenkins et al. 2013).
The Tet3 is not only expressed in male germ line but also in mouse oocytes and zygotes.
Interestingly, Xu and colleagues showed that 5-mC can be oxidized into 5-hmC exclusively in
the paternal pronulceus but not in the maternal one (Gu et al. 2011; Iqbal et al. 2011; Wossidlo et
al. 2011). In addition, the maternally expressed STELLA protein inhibits the DNA
demethylation and 5-hmC formation in the female pronuclei (Nakamura et al. 2007; Wossidlo et
al. 2011). So, this selective accumulation of the 5-hmC can play a role in the epigenetic
reprogramming after fertilization. Furthermore, the tet3 expression decreases rapidly during
embryo cleavage divisions, whereas the expression of the tet1 and tet2 increases in mESC after
blastocyst differentiation (Figure 36 B)(Tan et al. 2012). It is also important to note, that
homozygous mutation of tet3 in mice is lethal, highlighting the crucial role of 5-hmC in
development and organogenesis(Gu et al. 2011).
In line with the studies performed on mice, Efimova et al., demonstrated that human triploid
zygotes present a highly hydroxymethylated and hypomethylated paternal pronucleus but the
maternal pronucleus is hypermethylated with low levels of 5-hmC. At cleavages, these embryos
passively loose the 5-hmC from their chromosomes in a replication-dependent manner (Efimova
et al. 2015). Curiously, the downregulation of TET3 and TET2 enzymes in the sperm of infertile
men may significantly reduce the fertilization rate and the pregnancy rate respectively after
intracytoplasmic sperm injection (ICSI). Altogether, these studies accentuate the role of 5-hmC
and TET enzymes in epigenetic remodelling during development.

69
Figure 36: The dynamics of 5-hydroxymethylcytosine during mouse
spermatogenesis and embryo development.(A) A graph showing the content in 5-hmC
relative to cytosine (%) in mouse spermatogenic cells. (B) An illustration of Tet gene
expression, and 5-mC, and 5-hmC dynamics during pre-implantation embryo
development (Tan et al. 2012; Gan et al. 2013).
A. 3 Chromatin modifications
A. 3.1 Chromatin structure in somatic cells
The state in which the DNA is packed inside the nucleus of the cell is termed chromatin. The
first level of DNA packaging corresponds to the nucleosome; which is the fundamental unit of

70
the chromatin (Figure37 A). The nucleosome has a discoid structure of 10 nm in diameter and
itis made up of:
a) Four core histones (H3, H4, H2A, and H2B): each nucleosome contains 2 copies of
each histone type. The 8 histones form together the octameric histone core.
b) 147 base pairs (bp) of double helix DNA wrapped around the octameric histone core.
c) Linker proteins: The histone linker H1 and the other non-histone proteins bind to the
DNA while entering and exiting the nucleosome.
The nucleosomes are linked together by a linker DNA. They compact into a shorter thicker fiber
called the 30 nm-chromatin fiber (Figure B) (Füllgrabe et al. 2011).
Figure 37: Chromatin structure.(A) The chromatin is composed of repeating nucleosome
units. Each 10 nm-nucleosome is made up of an octameric histone core containing 2 copies of
the four core histones (H3, H4, H2A, and H2B). In addition, a DNA fragment is wrapped around
this octamer. The nucleosomes are linked by a linker DNA. The latter is connected to a linker
histone (H1) (Füllgrabe et al. 2011). (B) A side and a top view of the 30 nm-chromatin fiber
containing the compact form of the nucleosome fiber (Hartel et al. 2012).
The histones are basic proteins, positively charged with a molecular weight varying between 11
and 23 KDa (Table 5). The core histones have a globular structure with a protruding N-terminal
tail (histone tail)(TROPP et al. 2012). Furthermore, the amino acids residues of the histones tail
are subject to post-translational modifications (PTMs) by the histone- modifying enzymes (e.g.,
acetyltransferases, deacetylases, lysine methyltransferases, and etc…). The post-translational
modifications such as acetylation, methylation, phosphorylation, and ubiquitylation, may disrupt
the contact between the nucleosomes and/or recruit non-histones proteins (e.g. acetylation is
recognized by bromodomains) to the chromatin. Thus, PTMs play a cardinal role in the creation
of a global chromatin environment: silent heterochromatin and active euchromatin.

71
Grossly speaking, the heterochromatin condenses and protects the DNA during cell divisions,
helps in the maintenance of the inactive X chromosomes, etc…whereas; the euchromatinor open
chromatin regulates the flexibility and the biological tasks of the DNA (e.g., DNA repair,
replication, transcription) (Table 6) (Kouzarides et al. 2007).
Table 5: The biochemical properties of the histones(TROPP et al. 2012)
Histones Molecular
weight (KDa)
% lysine
( basic amino
acid, positively
charged)
% arginine
( basic amino
acid, positively
charged)
% lysine +
arginine
H1 ~ 21 29 1.5 30.5
H2A 14.5 11 9.5 20.5
H2B 13.7 16 6.5 22.5
H3 15.3 10 13.5 23.5
H4 11.3 11 14 25
Table 6: The different types and functions of the post-translational modifications of
histones (Kouzarides et al. 2007)
Chromatin
modifications
Residues modified Function regulated
Acetylation (-ac) Lysine ( K) Transcription, repair, replication,
condensation
Methylation (-me)
Lysine (K), mono, di,
or tri methylation
Transcription, repair
Arginine (R), mono,
or dimethylation
Transcription
Phosphorylation Serine (S) and
Threonine (T)
Transcription, repair, condensation
Ubiquitylation Lysine Transcription, repair
Sumoylation Lysine Transcription
ADP ribosylation Glutamic acid Transcription
Deimination Arginine Transcription
Prolineisomerisation Proline Transcription
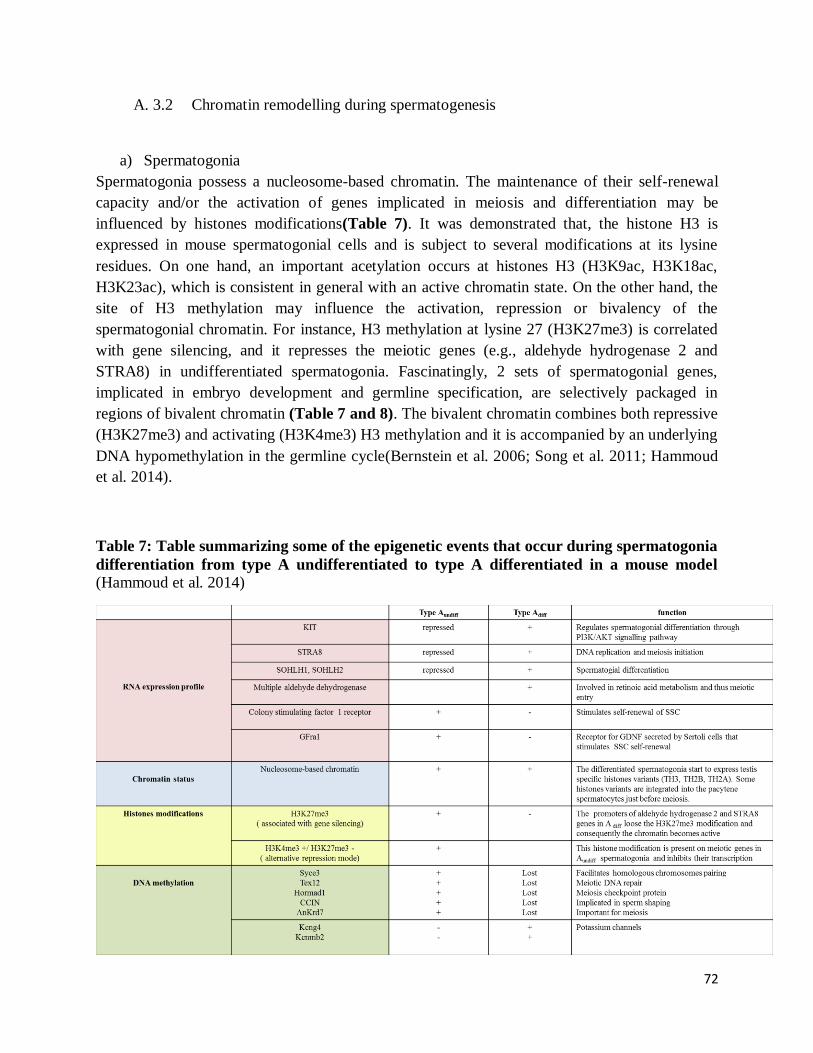
72
A. 3.2 Chromatin remodelling during spermatogenesis
a) Spermatogonia
Spermatogonia possess a nucleosome-based chromatin. The maintenance of their self-renewal
capacity and/or the activation of genes implicated in meiosis and differentiation may be
influenced by histones modifications(Table 7). It was demonstrated that, the histone H3 is
expressed in mouse spermatogonial cells and is subject to several modifications at its lysine
residues. On one hand, an important acetylation occurs at histones H3 (H3K9ac, H3K18ac,
H3K23ac), which is consistent in general with an active chromatin state. On the other hand, the
site of H3 methylation may influence the activation, repression or bivalency of the
spermatogonial chromatin. For instance, H3 methylation at lysine 27 (H3K27me3) is correlated
with gene silencing, and it represses the meiotic genes (e.g., aldehyde hydrogenase 2 and
STRA8) in undifferentiated spermatogonia. Fascinatingly, 2 sets of spermatogonial genes,
implicated in embryo development and germline specification, are selectively packaged in
regions of bivalent chromatin (Table 7 and 8). The bivalent chromatin combines both repressive
(H3K27me3) and activating (H3K4me3) H3 methylation and it is accompanied by an underlying
DNA hypomethylation in the germline cycle(Bernstein et al. 2006; Song et al. 2011; Hammoud
et al. 2014).
Table 7: Table summarizing some of the epigenetic events that occur during spermatogonia
differentiation from type A undifferentiated to type A differentiated in a mouse model
(Hammoud et al. 2014)

73
Table 8: A comparison between the epigenetic regulation in the embryonic stem cells and
the spermatogonia (Hammoud et al. 2014)
b) Meiotic cells
The differentiated spermatocytes also possess a nucleosome-based chromatin. The spermatocytes
undergo 2 phases of meiotic divisions where the exchange of genetic materials and segregation
of the chromosomes take place. During this step the transcription is globally silenced. This may
explain the low levels of H3K9ac, H3K18ac, H3K23ac, and H3K4me3 in the chromatin of
mouse germ cells from leptotene to pachytene stage. In mouse diplotene spermatocytes, the
chromatin is active once again and presents activating histone modifications such as H3K18ac,
H3K23ac, and H3K4me3. Furthermore, each diplotene spermatocyte will divide to give rise to
two spermatids. This cell division is under the control of histone H3 phosphorylation at serine 10
(H3S10phos). Interestingly, a set of transcribed genes (e.g., piRNAs) in spermatocytes and
spermatids present atypical promoters made up of low methylated CG content, high levels of 5-
hmC, H3K4me3, H3K9ac, and H3K27ac(Song et al. 2011; Hammoud et al. 2014).
The murine spermatogenesis is not only regulated by H3 modifications but also by histones H4
modifications. In addition, the H3 and H4 acetylation follow the same pattern during meiosis.
However, the H4me3 remains relatively high in pachytene spermatocytes chromatin. H4me3
may be a negative regulator of genes transcription at this level of differentiation (Shirakata et al.
2014).

74
c) Spermatids and spermiogenesis
The post-meiotic phase is characterized by fascinating cytodifferentiation and progressive
chromatin condensation with inactivation of the genome. The produced sperm is metabolically
active and transcriptionally quiescent until it enters the oocyte and combines with the maternal
genome. The chromatin remodelling during spermiogenesis involves the replacement of
nucleosome-based chromatin by nucleoprotamine- based chromatin. This replacement may occur
via the following mechanisms (Figure 38) :
c. 1 The incorporation of histones variants into the chromatin
Histones variants are histones counterpart which are also expressed in the germ cells of mice and
humans. Among these histone variants we can enumerate H2A variants ( in mice : H2AL1,
H2AL2, H2AL3/ in humans: H2A.Bbd), H2B variants (in mice:H2BL1, H2BL2, testis specific
H2B (TH2B)/ in humans : hTSH2B, H2BFWT), H3 variants ( H3.3, testis specific H3 (H3t) in
mice and H3T in humans), and testis specific H1 variants ( in mice: H1t, H1t2, Hils1/ in humans:
H1T, H1T2, HILS1). Some of these variants appear very early in spermatogenesis ( TH3 is
expressed in spermatogonia), and they are incorporated in the chromatin of pachytene
spermatocytes (TH2A, TH2B). It was shown that histone variants-containing nucleosomes may
create a less stable and open chromatin state; therefore, faciltating nucleosome disassembly and
histone displacement in germ cells(Gaucher et al. 2009; Balhorn et al. 2011; Montellier et al.
2013; Yuen et al. 2014).
c. 2 Histones hyperacetylation
The elongating spermatids hyperacetyle their histones in the absence of transcription and
replication. Furthermore, this acetylation mark is recognized by the double bromodomain factor
of the BET family (Brdt) that is expressed in mouse meiotic and post-meiotic germ cells. On one
hand, Brdt activates the expression of specific genes during meiosis; and on the other hand, Brdt
bromodomain (BD1) binds to hyperacetylated histones in elongating spermatids facilitating their
removal. It was shown that Brdt interacts with spermatoproteasomes to induce the removal and
degradation of hyperacetylated histones. This could explain how the histone acetylation mark
gradually disappears during the replacement of histones by non-histones proteins (Hazzouri et al.
2000; Gaucher et al. 2012; Qian et al. 2013).
Beside histone acetylation, cell metabolism and some chromatin modifying enzymes (e.g.,
sirtuins, and CREB-binding protein/EP/300) may also induce different histones modifications
such as, butyrylation, propionylation, crotonylation, and etc…(Rousseaux et al. 2014).Recently,
Goudarzi and colleagues demonstrated that H4K5/K8 acetyl/butyrylare enriched at specific
genes in spermatogenic cells. However, Brdt is not able to bind the butyrylated histones and
consequently the butyrylated histones can survive the wave of histones acetylation, removal and
degradation. It has been hypothesized, that this type of modification will create a less compact
structure in specific regions of the sperm chromatin (Goudarzi et al. 2016).

75
c. 3 Replacement of histones by transition proteins
At the mid-stage spermatids, the removed histones are replaced by transition proteins (TPs)
which remain in contact with the DNA for a short period. The predominant ones are TP1 and
TP2. The TP1 has a molecular weight of 6.2 KDa, containing ~ 20% arginine, ~ 20% lysine, and
lacks cysteine. However, the molecular weight of TP2 is 13 KDa, composed of ~ 10% arginine,
~ 10 % lysine, and 5% cysteine. So, TPs are smaller and more basic than histones. Their
biochemical properties allow them to compact the chromatin, to prepare for the termination of
the transcription, and to facilitate the DNA strand breaks repair(Yu et al. 2000; Balhorn et al.
2011).
c. 4 Replacement of TP by protamine
Elongating spermatids start to express small proteins (5-8 KDa) termed as protamine. In the late-
steps of spermiogenesis the protamines replace the TPs in the chromatin. The major two types of
protamines in humans are P1 and P2. They are characterized by the high content of positively
charged amino acids, arginine (~ 50 %), cysteine (~10-13%), and histidine (~ 5-15%). Due to
this unique composition, the protamines are highly basic and therefore, they strongly interact
with the negatively charged DNA to induce high level of chromatin compaction. Moreover,
disulphide bridges between the thiol (-SH) groups of the different cysteine add another level of
stabilization to the nucleoprotamine-based chromatin. This high level of condensation is
important to protect the sperm DNA during the transit in the female tract, to create a
hydrodynamic nucleus, and to control epigenetic reprogramming(Gusse et al. 1986; Aoki et al.
2003; Bjorndahl et al. 2010; Hammadeh et al. 2010; Balhorn et al. 2011).
Figure 38: The major steps of spermatid chromatin remodelling during
spermiogenesis(Gaucher et al. 2009).

76
d) Sperm chromatin
The mature sperm is charachterized by a highly packed chromatin, playing an important role in
fertility and embryo development. The sperm chromatin could be divided into 3 regions (Figure
39):
Figure 39: The structure of the sperm chromatin (Wared et al. 2010).

77
d.1 Nucleoprotamine-bound sperm chromatin
The majority of sperm DNA (negatively charged) is bound to the small basic protamines (
positively charged) causing DNA to compact into toroids. The toroids are packaged together side
to side into a highly condensed chromatin. Moreover, they are attached to the sperm nuclear
matrix by their linker region DNA. The vast majority of the DNA is hidden within the toroids,
and it is protected from nuclease digestion. As mentioned earlier, the cysteine residues of the
protamines can from disulfide bridges between them via the thiol (-SH) groups, increasing the
stability of this chromatin. At the functional level, this complex and highly compacted structure,
represses the transcription during spermiogenesis and protects the paternal genome during its
journey in the female tract. Moreover, paternal protamines are replaced in the first 2-4 hours
after fertilization by maternal histones, rendering the chromatin accessible to
transcription(Wared et al. 2010).
In contrast, a recent meta-analysis showed that abnormal sperm protamination was associated
with male infertility and sperm DNA damage. The normal ratio of P1-P2 is approxiamtely 1.
However, this ratio could be affected by several internal or external factors such as thermal stress
and cigarette smoking(Love et al. 1999; EVENSON et al. 2000; IUCHI et al. 2003; Hammadeh
et al. 2010; Ni et al. 2016).
d.2 Nucleosome-bound sperm chromatin
Even though the majority of histones are replaced by protamines, a small percentage from 5-10%
of the human sperm genome retains the paternal histones. In the mature sperm of mice and
humans the retained histones and their modifications (e.g., H3K4me3, H4K27me3) are not
randomely distributed, and they are not replaced by the maternal histones after fertilization.
Intrestingly, the retained nucleosomes were found at the promoters of different genes of
develpmental importance in the embryo ( such as Hox-, Fox-, Sox-, gata family genes and non-
coding RNAs ( micro-RNAs and long non-coding RNAs)). Moreover, the retained histones are
generally associated with an underlying DNA hypomethylation. Altogether, these findings
highlight the possible role of nucleosome-bound sperm chromatin as a paternally inherited
epigenetic regulator (Wared et al. 2010; Jenkins et al. 2012; Hammoud et al. 2014). In parallel,
several studies in mice have demonstrated that alterations in histone methylation and acetylation
status resulted in varying degree of fertility loss(FENIC et al. 2004; LEE et al. 2005; Okada et al.
2007; FENIC et al. 2008; GLASER et al. 2009). In addition, H3K4ac was showed to be erased in
the sperm of infertile men; whereas H4K12ac and H4K8ac were significantly higher in the sperm
of smokers(Kim et al. 2015; Vieweg et al. 2015). This will open the question on the drawbacks
of these alterations on embryogenesis and on the offspring.

78
d.3 Matrix attachment regions (MARs)
Sperm toroids and linker DNA sequences are attached to a proteinaceous structure, termed
nuclear matrix. Several researchers tried to identify the function (s) of this matrix and it was
suggested that it is important for post-fretilization events. After fertilization, MARs is required
for paternal DNA replication and may act as a checkpoint for sperm DNA integrity (Wared et al.
2010).
A. 4 Sperm RNAs
Mammalian sperm is a transcriptionally inactive cell, with a reduced cytoplasm. However, RNA
populations were detected in the sperm cells: microRNAs (miRNAs), endogenous small
interfering RNAs (endo-SiRNAs), Piwi-interacting RNAs (piRNAs). Those ncRNAs may
regulate the gene expression by several means. Interestingly, sperm ncRNAs could play an
important role in embryogenesis (Liu et al. 2012) and in inheritance (Rassoulzadegan et al. 2006;
Wagner et al. 2008; Grandjean et al. 2009).
For instance, the microinjection of mouse spermatozoa with an aberrant sperm-borne miRNA
and endo-SiRNA content into a mature mouse egg, can achieve fertilization but alter the
developmental potential of the embryo(Yuan et al. 2016). Also, the sperm-borne microRNA-34c
is only detected in spermatozoa and zygotes and it is not expressed in the oocytes. Microinject ion
of microRNA-34c inhibitor into the cytoplasm of fertilized mouse zygote alters the DNA
synthesis of the one-cell embryo and inhibits the first cleavage division(Liu et al. 2012).
Moreover, the changing environment such as psychological stress and tobacco intake may
modify the level of expression of these RNAs and induce behavioral and physiological changes
in the progeny(Lane et al. 2014; Bohacek et al. 2015). Microinjection of sperm RNAs derived
from male sperm exposed to postnatal trauma into the zygote, reproduces the paternal phenotype
in the offspring (Gapp et al. 2014). Furthermore, cardiac hypertrophy, abnormal adult growth,
and fur depigmentation may be induced by microinjection of miR-1, miR-124 and miR-221
respectively into a mouse fertilized oocytes (Rassoulzadegan et al. 2006; Wagner et al. 2008;
Grandjean et al. 2009).

79
B- Transgenerational inheritance of paternal acquired obesity
B. 1 Overview
Mendelian inheritance focuses on the heritable changes in the phenotype due to changes in the
primary DNA sequence (mutations). In contrast, heritable changes in the phenotype could be
associated to modifications in the epigenetic marks (epimutations) without any change in the
DNA sequence. This epigenetic inheritance may occur in two ways (Figure 40):
- Gametic epigenetic inheritance occurs via the gamete epigenome ( DNA chemical
modifications, histones modifications, and non-coding RNAs):increasing evidence
suggests that information from parental environment remains in the gamete epigenome
and could be transmitted to the offspring (wei et al. 2014).
- Non-gametic epigenetic inheritance involves the effects of enviromental exposure on the
adults that may modify the phenotype of the next generation. For instance, the uterine
exposure at the time of conception to the seminal fluid regulates the postnatal body
homeosatsis and the behaviorof the offspring. In addition, in-utero exposure of the
developing embryo to different molecules, or the exposure of the newborn to the milk
during lactaion may modulate the health of the offspring(Danxinger et al. 2012; Lane et
al. 2014; Vickers et al. 2014).
When studying such influence of ancestral enviroments on the future generations, it is important
to distinguish between the intergenerational and the transgenerational transmission. The
inheritance of the acquired phenotype by the immediately succeding generation (F1), coming
from the exposed gametes could be termed as ― intergenerational inheritance‖. However, the
apearance of the phenotype in the grandchildren and the next generations (F2, F3), coming from
the unexposed gametes may be termed as ―transgenerational inheritance‖ (Figure 40)(Dias et al.
2014; Terashima et al. 2015).
A new area of research in andrology, shed the light on the long term consequences of paternal
health, at the time of conception, on the health of the offspring. For example, paternal age,
smoking, and exposure to toxic chemicals may increase the risk of neuropsychiatric disorders,
metabolic alterations, respiratory tract infection, and cancer in the offspring (Sorahan et al. 1997;
Chang et al. 2006; Toschke et al. 2007; Fernandez-Gonzalez et al. 2008; Lin et al. 2008; Sung et
al. 2008; Sartorius et al. 2010). In addition, accumulating epidemiological studies in humans
suggest that paternal body mass index (BMI) may influence the health of the next generation
(Lane et al. 2014). As reported by G kaati et al., when paternal grandfather experienced a surfeit
of food at the age of 8-12 years old, the risk of grandson‘s death by T2DM had increased by 4
folds (Figure 41 A). Plus, the risk of death by cardiovascular complications was reduced when
there was low food availability during father‘s young age (Figure 41 B) (Kaati et al. 2002).
Moreover, a father born small for gestational age (SGA) had a higher risk of developing obesity

80
and giving birth to a (SGA) baby (Figure 41 C) (McCowan et al. 2011). Furthermore, the
incidence of obesity and diabetes in the grandchildren, coming from sons who were exposed in
utero to the Dutch famine, were very high (Veenend aal et al. 2013). Also, paternal obesity was
associated with hypo methylation of Insulin-like Growth Factor 2 (IGF2) gene in newborns‘
cord blood. By itself IGF2 has been linked to an increased risk of developing cancers (Soubry et
al. 2013).This finding, opened the possibility of the presence of an epigenetic pathway for the
transmission of this acquired pathology.
Figure 40: Scheme showing different modes of non-genetic inheritance.
(A) The exposed gametes from the paternal ancestor will lead to an intergenerational inheritance
in (F1). The inheritance of the phenotype by offspring (F2) generated from the F1 (unexposed
gametes) is termed as transgenerational inheritance. (B) In utero-exposure can lead to an
intergenerational inheritance in F1 and F2 since they are produced from exposed gametes,
whereas the persistance of the phenotype in F3 is termed as transgenerational inheritance. (C)A
peri-natal exposure (F1) may alter the phenotype and its exposed gametes will lead to an
intergenerational inheritance of the phenotype in F2. However, if the phenotype appears in the
F3 generation, it is called a transgenerational inheritance (Dias et al. 2014).

81
Figure 41: Pedigree pattern of acquired pathologies.
(A) The grandson‘s (III-1) risk of death by T2DM was increased by 4 folds when his
grandfather ( I-1) was exposed to a surfeit during his young age.(B) Low food availability during
father‘s young age ( I-1) has reduced the risk of death of his son (II-1) by cardiovascular
complications. (C) A father (I-1) born small for gestational age (SGA) had a high risk to become
obese and to give birth to a SGA infant (II-1) (Kaati et al. 2002; McCowan et al. 2011).
B. 2 Possible mechanims of intergenerational and transgenerational inheritance of
paternal acquired obesity
In order to understand the moclecular mechanisims underlying the above desribed results in
humans, animal models were developed. Ng Sheau-Fang and colleagues showed that male rats
fed on a high fat diet (HFD), gave birth to females (F1) intolerant to glucose with abnormal
insulin secretion. These metabolic alterations could be explained by the histopathological
changes in the pancreatic islets of these females. At the molecular level, a key islet gene Il13ra2
(interleukin 13 receptor subunit alpha 2) was hypomethylated and its messenger RNA was
upregulated in the pancreatic islets of the F1 offspring. Plus, transcriptomic analysis of the
retroperitoneal fat and the pancreas of the female offspring showed deregulation in genes
involved in mitochondrial and cellular stress response. Altogether, these findings indicate a
possible role of epigenetics in the intergenerational inheritance of the paternal acquired
phenotype (Ng et al. 2010; Ng et al. 2014) .
In the same context, a non-genetic prediabetes mouse model has been generated with injection of
low doses of streptozotocin which destroys the pancreatic β-cells. The generated prediabetic
male mice fathered offspring (F1) with glucose intolerance and insulin resistance. Excitingly, the
same phenotype was transmitted to the second generation (F2). In addition, the expression

82
pattern of 402 genes in the pancreas of these offspring was altered when compared to a control
group; among them the level of expression of phosphatidylinositol 3 kinase catalytic and
regulatory subunits (PiK3ca and PiIK3r1) was lower in the two subsequent generations of mice.
Of particular interest, the DNA methylation profile in the sperm of the treated father overlapped
with that of pancreatic islets in the offspring. Most interestingly, the PiK3ca and PiK3r1genes
were hypermethylated in the sperm and in the pancreas of the offspring (F1 and F2). These
results confirm the hypothesis that non-genetic metabolic alteration could be intergenerationally
and transgenerationally inherited via the DNA methylation(Wei et al. 2014).
In parallel, the model of diet-induced obesity in male mice (C57BL6) was used in different
publications trying to decipher the mystery behind this kind of inheritance. The male acquired
obesity in mice may result in fetal growth restriction characterized by reduced fetal and placental
weights. The fetal growth restriction is associated with an increased risk of developing obesity
and diabetes later in life. The molecular analysis of the placentas showed that peroxisome
proliferator-activated receptor alpha (Ppara) and caspase-12 (Casp12) mRNAs expression were
significantly deregulated in male placentas from obese fathers when compared to a normal
father, whereas the global DNA methylation was only increased in female placentas (Binder et
al. 2015).
Furthermore, the paternal acquired obesity in mice alters the total body weight and the glucose
homeostasis in the female offspring (F1) with a lesser severity in the males. These phenotypes
were also transmitted to the second generation (F2) but in a sex-specific manner. At the
epigenetic level, the elongated spermatids of the grandfather‘s testes were significantly
hypomethylated when detected by immunohistochemistry on testis sections. Moreover, 4
microRNAs were found to be deregulated in the testis and in the sperm of the obese grandfathers
(miR133b-3p, miR-304-5p, miR196a-5p, miR205); these miRNAs may be implicated in the
regulation of pre-implantation mouse embryo development (Fullston et al. 2013).
Fascinatingly, Grandjean and colleagues has showed that microinjection of testis or sperm RNAs
from obese male mice into the pronucleus of a naïve zygote induces metabolic disturbances in
the offspring. Deep sequencing analysis of these microinjected RNAs allows the identification of
13 miRNAs and 190 piRNAs differentially expressed in the testis of obese mice. Among these
RNAs, the miR19b was one of the most deregulated micro-RNAs. Microinjection of the miR-
19b into the pronucleus of a naïve zygote also induces alterations in the body weight of the
offspring. These results indicate that the testicular RNAs could be a vector of transmission of
paternal acquired obesity (Grandjean et al. 2015). In parallel, Binder et al. found an increase in
the level of expression of cytochrome c oxidase subunit IV isoform I (Cox4il) mRNA in sperm
cells of obese mice. Cox4il is a nuclear encoded gene, which may regulate the mitochondrial
function in the embryos, emphasizing the role of sperm RNAs in the regulation of embryo
development(Binder et al. 2015).
83
Not only the DNA methylation, and the sperm RNAs but also the sperm chromatin is considered
as a potential candidate. On one hand, Terashima et al. demonstrated that paternal acquired
obesity may alter the expression of 7 genes in the liver of the offspring. In addition, the sperm of
these obese fathers showed a higher H3 and H3K4me1 retention at specific genes implicated in
development and cell fate decision. On the other hand, the histone deacetylases (HDAC) class III
or Sirtuin (SIRT1-7) proteins are regulated by caloric intake. Of particular interest, SIRT6 is
expressed in the mouse elongating spermatids and could play the role of ADP-ribosyltransferase
and H3 deacetylase (H3K9 and H3K56). Palmer et al. found that the protein level of SIRT6 is
significantly decreased in the spermatids of male mice on high fat diet (HFD) when compared to
a control group. Consequently, the percentage of spermatids that stain positive to the H3K9ac
antibody was higher in the HFD group compared with those on control diet(Palmer et al. 2011).
Moreover, the offspring of male mice raised on a low protein diet overexpressed in their
hepatocytes genes involved in lipid metabolism. This low-protein diet was associated with a
decrease in the H3K27me3 retention in the sperm at the promoters of Maoa (Monoamine
oxidase) and Eftud1 (Elongation Factor Like GTPase 1) (Carone et al. 2010) . These findings
clearly show that sperm chromatin could be modulated by the dietary conditions and could
transfer epigenetic information to the next generation.
Interestingly, other physiological processes were showed to be affected by the paternal obesity.
For instance it may compromise the reproductive health of two subsequent generations of mice
(Fullston et al. 2012; Fullston et al. 2015), and it may increase the susceptibility of malignant
transformation in the mammary tissue of the female offspring (Fontelles et al. 2016).
In humans, a recent study showed that obesity can remodel the human sperm epigenome; thus,
playing a crucial role in the sperm-dependent non-genetic inheritance of acquired obesity.
Donkin et al. found that obese men have a different sperm DNA methylation profile for genes
implicated in the central nervous system function and metabolism when compared to normal
weight men. Plus, the sperm transcriptome analysis showed deregulation in the Piwi-interacting
RNAs (piRNAs) expression pattern in the sperm of obese patients (Donkin et al. 2016).
Besides the gametic pathway, the seminal plasma was hypothesized to participate in the
inheritance of the paternal obesity. On one hand, differences in the seminal plasma composition
between obese and non-obese mice were detected. Similar differences in the composition were
also seen in humans(Binder et al. 2015). On the other hand, the metabolism of embryos derived
from in vivo mating (where the seminal plasma may interfere) of an obese male mice and normal
female mice showed a higher glycolytic rate than normal (Binder et al. 2012). However, the
embryos derived from in vitro fertilization using sperm cells without seminal fluid from obese
male mice, and oocytes from normal female, showed normal glycolytic rate(Binder et al. 2012).
Inappropriate early increase in the glycolytic rate negatively impacts the embryo development
(Leese et al. 2002). Therefore, the suboptimal plasma composition associated with male obesity
may have drawbacks on the uterine environment, embryo physiology, and offspring
health(Binder et al. 2015).

84
To sum up, all these studies suggested that paternal life style could affect the seminal fluid and
the sperm epigenome (DNA modifications, chromatin composition, and RNAs content), thus
playing a possible role in the transfer of non-genetic information from one generation to another
(Figure 42).
Figure 42: The impact of the lifestyle on the non-genetic paternal contribution to the
embryogenesis(Lane et al. 2014).
IV- Research aims
Despite what is known about the drawbacks of male obesity on the reproductive system and on
the offspring health, several significant questions remained unanswered. The majority of the
studies in humans assessed the impact of obesity on the raw semen containing heterogenous
populations of sperm (motile and non-motile spermatozoa). Here we aimed to evaluate the effect
of paternal obesity on the molecular composition of the motile spermatozoa which are the only
able to fertilize the oocyte. Next, using this fraction of sperm we analyzed to which extent
paternal obesity influences the preimplantation embryo morphokinetics.
Furthermore, we intended to evaluate the adaptive and evolutionary potential of non-genetic
heritable mechanisms in experimentally controlled animal models. Using a high fat diet (HFD)-
induced obesity mouse model, we examined how feeding male mice with a high fat diet for
multiple generations impacts the phenotype of the resulting mice.We focused mainly on the
evolution of obesity-associated complications such as glomerulopathy and infertility.
These studies should add more insights into our current knowledge on the epigenetic signature
transferred by the sperm of obese men to the oocyte during fertilization and into how biological
systems respond and adapt to continuous exposure to a HFD stress.

85
V- Bibliography
1.Abd-Allah, Adel RA, et al. "Pro-inflammatory and oxidative stress pathways which
compromise sperm motility and survival may be altered by L-carnitine." Oxidative
medicine and cellular longevity 2.2 (2009): 73-81.
2.Abdalla, Hany, Yusuke Yoshizawa, and Shinichi Hochi. "Active demethylation of paternal
genome in mammalian zygotes." Journal of Reproduction and Development 55.4 (2009):
356-360.
3.Albrecht, Martin. "Insights into the nature of human testicular peritubular cells." Annals of
Anatomy-AnatomischerAnzeiger 191.6 (2009): 532-540.
4.Al-Quwaidhi, A. J., et al. "Trends and future projections of the prevalence of adultobesity
in SaudiArabia, 1992-2022/Tendances et projections de la prévalence de l'obésité chez
l'adulte en Arabie saoudite, 1992-2022." Eastern Mediterranean Health Journal 20.10
(2014): 589.
5.Alsaad, K. O., and A. M. Herzenberg. "Distinguishing diabetic nephropathy from other
causes of glomerulosclerosis: an update." Journal of clinical pathology 60.1 (2007): 18-
26.
6.G Alves, Marco, et al. "Impact of diabetes in blood-testis and blood-brain barriers:
resemblances and differences." Current diabetes reviews 8.6 (2012): 401-412.
7.Amrolia, P., et al. "An investigation of glucose uptake in relation to steroidogenesis in rat
testis and tumour Leydig cells." Biochemical Journal 249.3 (1988): 925-928.
8.Aoki, Vincent W., and Douglas T. Carrell. "Human protamines and the developing
spermatid: their structure, function, expression and relationship with male infertility."
Asian journal of andrology 5.4 (2003): 315-324.
9.Aquila, Saveria, et al. "Autocrine regulation of insulin secretion in human ejaculated
spermatozoa." Endocrinology 146.2 (2005): 552-557.
10.Aitken, John, and Helen Fisher. "Reactive oxygen species generation and human
spermatozoa: the balance of benefit and risk." Bioessays 16.4 (1994): 259-267.

86
11.Auger, J. (2009). Preface. In J. Auger, Exploration de la fonction de reproduction: versant
masculin (Vol. 42). Paris: Bioforma: formation continue des biologistes.
12.Bacon, Constance G., et al. "A prospective study of risk factors for erectile dysfunction."
The Journal of urology 176.1 (2006): 217-221.
13.Bagchi, Mandrita. Role of Vascular Endothelial Growth Factor Signaling in Brown
Adipocyte Survival, Proliferation and Function. Diss. 2013.
14.Bakos, Hassan Waleed. The Effect of Paternal Obesity on Sperm Function, Embryo
Development and Subsequent Pregnancy Outcomes. Diss. The University of Adelaide,
2010.
15.Bakos, Hassan W., et al. "Paternal body mass index is associated with decreased
blastocyst development and reduced live birth rates following assisted reproductive
technology." Fertility and sterility 95.5 (2011): 1700-1704.
16.Bakos, Hassan W., et al. "Paternal body mass index is associated with decreased
blastocyst development and reduced live birth rates following assisted reproductive
technology." Fertility and sterility 95.5 (2011): 1700-1704.
17.Bakos, H. W., et al. "The effect of paternal diet‐induced obesity on sperm function and
fertilization in a mouse model." International journal of andrology 34.5pt1 (2011): 402-
410.
18.Balhorn, Rod. "Sperm chromatin: an overview." Sperm Chromatin. Springer New York,
2011. 3-18.
19.Ballester, Joan, et al. "Evidence for a functional glycogen metabolism in mature
mammalian spermatozoa." Molecular reproduction and development 56.2 (2000): 207-
219.
20.Bauché, Françoise, Marie-Hélène Fouchard, and Bernard Jégou. "Antioxidant system in
rat testicular cells." FEBS letters 349.3 (1994): 392-396.
21.Bernstein, Bradley E., et al. "A bivalent chromatin structure marks key developmental
genes in embryonic stem cells." Cell 125.2 (2006): 315-326.

87
22.Berridge, Michael J. "Calcium signalling remodelling and disease." Biochemical Society
Transactions 40.2 (2012): 297-309.
23.Berridge, M.J. (2012) Cell Signalling Biology; doi:10.1042/csb0001007
24.Binder, Natalie K., Megan Mitchell, and David K. Gardner. "Parental diet-induced obesity
leads to retarded early mouse embryo development and altered carbohydrate utilisation
by the blastocyst." Reproduction, Fertility and Development 24.6 (2012): 804-812.
25.Binder, Natalie K., Natalie J. Hannan, and David K. Gardner. "Paternal diet-induced
obesity retards early mouse embryo development, mitochondrial activity and pregnancy
health." PLoS One 7.12 (2012): e52304.
26.Binder, Natalie K., et al. "Male obesity is associated with changed spermatozoa Cox4i1
mRNA level and altered seminal vesicle fluid composition in a mouse model." Molecular
human reproduction (2015): gav010.
27.Binder, Natalie K., et al. "Paternal obesity in a rodent model affects placental gene
expression in a sex-specific manner." Reproduction 149.5 (2015): 435-444.
28.Björndahl, Lars, and UlrikKvist. "Human sperm chromatin stabilization: a proposed
model including zinc bridges." Molecular human reproduction 16.1 (2010): 23-29.
29.Blundell, John E., and John Cooling. "Routes to obesity: phenotypes, food choices and
activity." British journal of nutrition 83.S1 (2000): S33-S38.
30.Blundell, J. E., et al. "The biology of appetite control: Do resting metabolic rate and fat-
free mass drive energy intake?." Physiology &behavior 152 (2015): 473-478.
31.Bohacek, Johannes, and Isabelle M. Mansuy. "Molecular insights into transgenerational
non-genetic inheritance of acquired behaviours." Nature Reviews Genetics (2015).
32.Boussouar, Fayçal, and Mohamed Benahmed. "Lactate and energy metabolism in male
germ cells." Trends in Endocrinology & Metabolism 15.7 (2004): 345-350.

88
33.Brooker, C. (1998). chapitre 20 la reproduction. In C. Brooker, Le corps humain: Étude,
structure et fonction (Vol. second edition). Bruxelles: de boeck.
34.Burruel, Victoria, et al. "Abnormal early cleavage events predict early embryo demise:
sperm oxidative stress and early abnormal cleavage." Scientific reports 4 (2014).
35.Busada, Jonathan T., and Christopher B. Geyer. "The role of retinoic acid (RA) in
spermatogonial differentiation." Biology of reproduction 94.1 (2016): 10.
36.Campbell, Jared M., et al. "Paternal obesity negatively affects male fertility and assisted
reproduction outcomes: a systematic review and meta-analysis." Reproductive
biomedicine online 31.5 (2015): 593-604.
37.Carone, Benjamin R., et al. "Paternally induced transgenerational environmental
reprogramming of metabolic gene expression in mammals." Cell 143.7 (2010): 1084-
1096.
38.Caroppo, Ettore. "Male reproductive medicine: anatomy and physiology." An Introduction
to Male Reproductive Medicine (2011): 1.
39.Chagnac, Avry, et al. "Glomerular hemodynamics in severe obesity." American Journal of
Physiology-Renal Physiology 278.5 (2000): F817-F822.
40.Chan, Donovan, and JacquettaTrasler. "The sperm epigenome." Sperm Chromatin.
Springer New York, 2011. 95-106.
41.Chang, Jeffrey S., et al. "Parental smoking and the risk of childhood leukemia." American
journal of epidemiology 163.12 (2006): 1091-1100.
42.Chen, Jing, et al. "The metabolic syndrome and chronic kidney disease in US adults."
Annals of internal medicine 140.3 (2004): 167-174.
43.Chen, Taiping, et al. "Establishment and maintenance of genomic methylation patterns in
mouse embryonic stem cells by Dnmt3a and Dnmt3b." Molecular and cellular biology
23.16 (2003): 5594-5605.

89
44.Chen, X. L., L. Z. Gong, and J. X. Xu. "Antioxidative activity and protective effect of
probiotics against high-fat diet-induced sperm damage in rats." animal 7.02 (2013): 287-
292.
45.Choucair, Fadi B., et al. "High level of DNA fragmentation in sperm of Lebanese infertile
men using Sperm Chromatin Dispersion test." Middle East Fertility Society Journal
(2016).
46.Chughtai, Bilal, et al. "A neglected gland: a review of Cowper's gland." International
journal of andrology 28.2 (2005): 74-77.
47.Colaci, Daniela S., et al. "Men's body mass index in relation to embryo quality and
clinical outcomes in couples undergoing in vitro fertilization." Fertility and sterility 98.5
(2012): 1193-1199.
48.Costanian, Christy, et al. "Prevalence, correlates and management of type 2 diabetes
mellitus in Lebanon: findings from a national population-based study." Diabetes research
and clinical practice 105.3 (2014): 408-415.
49.D'Agati, Vivette D., et al. "Obesity-related glomerulopathy: clinical and pathologic
characteristics and pathogenesis." Nature Reviews Nephrology (2016).
50.Daxinger, Lucia, and Emma Whitelaw. "Understanding transgenerational epigenetic
inheritance via the gametes in mammals." Nature Reviews Genetics 13.3 (2012): 153-
162.
51.Datta, B. (2004). Pathology of the kidney and urinary tract. In B. Datta, Textbook of
pathology (Vol. second edition). New delhi: JAYPEE BROTHERS.
52.de Castro, Letícia S., et al. "Sperm oxidative stress is detrimental to embryo development:
a dose-dependent study model and a New and more sensitive oxidative status evaluation."
Oxidative medicine and cellular longevity 2016 (2015).
53.De Lorenzo, Antonino, et al. "New obesity classification criteria as a tool for bariatric
surgery indication." World journal of gastroenterology 22.2 (2016): 681.
54.De Vries, Aiko PJ, et al. "Fatty kidney: emerging role of ectopic lipid in obesity-related
renal disease." The Lancet Diabetes & Endocrinology 2.5 (2014): 417-426.

90
55.Deji, Naoko, et al. "Structural and functional changes in the kidneys of high-fat diet-
induced obese mice." American Journal of Physiology-Renal Physiology 296.1 (2009):
F118-F126.
56.Delatte, Benjamin, et al. "Genome-wide hydroxymethylcytosine pattern changes in
response to oxidative stress." Scientific reports 5 (2015).
57.Despopoulos, A. (2003). Color atlas of physiology. Thieme.
58.Dias, Brian G., and Kerry J. Ressler. "Experimental evidence needed to demonstrate
inter‐and trans‐generational effects of ancestral experiences in mammals." BioEssays
36.10 (2014): 919-923.
59.Dias, Tânia R., et al. "Sperm glucose transport and metabolism in diabetic individuals."
Molecular and cellular endocrinology 396.1 (2014): 37-45.
60.Discacciati, A., N. Orsini, and A. Wolk. "Body mass index and incidence of localized and
advanced prostate cancer—a dose–response meta-analysis of prospective studies." Annals
of Oncology (2012): mdr603.
61.Dissanayake, D. M. A. B., et al. "Relationship between seminal plasma zinc and semen
quality in a subfertile population." Journal of human reproductive sciences 3.3 (2010):
124.
62.Donkin, Ida, et al. "Obesity and bariatric surgery drive epigenetic variation of
spermatozoa in humans." Cell metabolism 23.2 (2016): 369-378.
63.Duale, N., et al. "Impaired sperm chromatin integrity in obese mice." Andrology 2.2
(2014): 234-243.
64.Durairajanayagam, Damayanthi, Ashok Agarwal, and Chloe Ong. "Causes, effects and
molecular mechanisms of testicular heat stress." Reproductive biomedicine online 30.1
(2015): 14-27.
65.Eckel, Robert H., Scott M. Grundy, and Paul Z. Zimmet. "The metabolic syndrome." The
Lancet 365.9468 (2005): 1415-1428.
66.Efimova, Olga A., et al. "Chromosome hydroxymethylation patterns in human zygotes
and cleavage-stage embryos." Reproduction 149.3 (2015): 223-233.

91
67.Ehmcke, Jens, Joachim Wistuba, and Stefan Schlatt. "Spermatogonial stem cells:
questions, models and perspectives." Human Reproduction Update 12.3 (2006): 275-282.
68.Eisenberg, Michael L., et al. "The relationship between male BMI and waist
circumference on semen quality: data from the LIFE study." Human reproduction 29.2
(2014): 193-200.
69.El Hajj, N., et al. "Methylation status of imprinted genes and repetitive elements in sperm
DNA from infertile males." Sexual Development 5.2 (2011): 60-69.
70.Engeli, Stefan, et al. "Weight loss and the renin-angiotensin-aldosterone system."
Hypertension 45.3 (2005): 356-362.
71.Esposito, Katherine, et al. "Effect of lifestyle changes on erectile dysfunction in obese
men: a randomized controlled trial." Jama 291.24 (2004): 2978-2984.
72.Evenson, DONALD P., et al. "Characteristics of human sperm chromatin structure
following an episode of influenza and high fever: a case study." Journal of andrology
21.5 (2000): 739-746.
73.Fan, Yong, et al. "Diet-induced obesity in male C57BL/6 mice decreases fertility as a
consequence of disrupted blood-testis barrier." PloS one 10.4 (2015): e0120775.
74.Fenic, Irina, et al. "In Vivo Effects of Histone‐Deacetylase Inhibitor Trichostatin‐A on
Murine Spermatogenesis." Journal of andrology 25.5 (2004): 811-818.
75.Fenic, Irina, et al. "In Vivo Application of Histone Deacetylase Inhibitor Trichostatin‐A
Impairs Murine Male Meiosis." Journal of andrology 29.2 (2008): 172-185.
76.Fernández-Gonzalez, Raúl, et al. "Long-term effects of mouse intracytoplasmic sperm
injection with DNA-fragmented sperm on health and behavior of adult offspring."
Biology of Reproduction 78.4 (2008): 761-772.
77.Flenkenthaler, Florian, et al. "Secretome analysis of testicular peritubular cells: a window
into the human testicular microenvironment and the spermatogonial stem cell niche in
man." Journal of proteome research 13.3 (2014): 1259-1269.

92
78.Fontelles, Camile Castilho, et al. "Paternal overweight is associated with increased breast
cancer risk in daughters in a mouse model." Scientific Reports 6 (2016).
79.Frans, Emma M., et al. "Advancing paternal age and bipolar disorder." Archives of
general psychiatry 65.9 (2008): 1034-1040.
80.Füllgrabe, J., E. Kavanagh, and B. Joseph. "Histone onco-modifications." Oncogene 30.31
(2011): 3391-3403.
81.Fullston, T., et al. "Diet-induced paternal obesity in the absence of diabetes diminishes the
reproductive health of two subsequent generations of mice." Human reproduction 27.5
(2012): 1391-1400.
82.Fullston, T., et al. "Diet-induced paternal obesity in the absence of diabetes diminishes the
reproductive health of two subsequent generations of mice." Human reproduction 27.5
(2012): 1391-1400.
83.Fullston, Tod, et al. "Paternal obesity initiates metabolic disturbances in two generations
of mice with incomplete penetrance to the F2 generation and alters the transcriptional
profile of testis and sperm microRNA content." The FASEB Journal 27.10 (2013): 4226-
4243.
84.Fullston, Tod, et al. "Paternal obesity induces metabolic and sperm disturbances in male
offspring that are exacerbated by their exposure to an ―obesogenic‖ diet." Physiological
reports 3.3 (2015): e12336.
85.Fullston, Tod, et al. "Paternal obesity induces metabolic and sperm disturbances in male
offspring that are exacerbated by their exposure to an ―obesogenic‖ diet." Physiological
reports 3.3 (2015): e12336.
86.Gan, Haiyun, et al. "Dynamics of 5-hydroxymethylcytosine during mouse
spermatogenesis." Nature communications 4 (2013).
87.Gapp, Katharina, et al. "Implication of sperm RNAs in transgenerational inheritance of
the effects of early trauma in mice." Nature neuroscience 17.5 (2014): 667-669.
88.Gaucher, Jonathan, et al. "From meiosis to postmeiotic events: the secrets of histone
disappearance." FEBS journal 277.3 (2010): 599-604.

93
89.Gaucher, Jonathan, et al. "Bromodomain‐dependent stage‐specific male genome
programming by Brdt." The EMBO journal 31.19 (2012): 3809-3820.
90.Gauthier, Marie-Soleil, and Neil B. Ruderman. "Adipose tissue inflammation and insulin
resistance: all obese humans are not created equal." Biochemical Journal 430.2 (2010):
e1-e4.
91.Gee, M. (2008). Weight management. In K. a.-S. Mahan, Krause's food and nutrition
therapy (Vol. 12). SAUNDER ELSEVIER.
92.Glaser, Stefan, et al. "The histone 3 lysine 4 methyltransferase, Mll2, is only required
briefly in development and spermatogenesis." Epigenetics & chromatin 2.1 (2009): 1.
93.Golay, A., and J. Ybarra. "Link between obesity and type 2 diabetes." Best Practice &
Research Clinical Endocrinology & Metabolism 19.4 (2005): 649-663.
94.Goudarzi, Afsaneh, et al. "Dynamic Competing Histone H4 K5K8 Acetylation and
Butyrylation Are Hallmarks of Highly Active Gene Promoters." Molecular cell 62.2
(2016): 169-180.
95.Grandjean, Valérie, et al. "The miR-124-Sox9 paramutation: RNA-mediated epigenetic
control of embryonic and adult growth." Development 136.21 (2009): 3647-3655.
96.Grandjean, Valérie, et al. "RNA-mediated paternal heredity of diet-induced obesity and
metabolic disorders." Scientific reports 5 (2015).
97.Griffin, Karen A., Holly Kramer, and Anil K. Bidani. "Adverse renal consequences of
obesity." American Journal of Physiology-Renal Physiology 294.4 (2008): F685-F696.
98.Gu, Tian-Peng, et al. "The role of Tet3 DNA dioxygenase in epigenetic reprogramming
by oocytes." Nature 477.7366 (2011): 606-610.
99.Güneş, Sezgin, and Tuba Kulaç. "The role of epigenetics in spermatogenesis." Turkish
journal of urology 39.3 (2013): 181.

94
100.Guo, Kai-Ying, et al. "Effects of obesity on the relationship of leptin mRNA expression
and adipocyte size in anatomically distinct fat depots in mice." American Journal of
Physiology-Regulatory, Integrative and Comparative Physiology 287.1 (2004): R112-
R119.
101.Gusse, Michel, et al. "Purification and characterization of nuclear basic proteins of
human sperm." BiochimicaetBiophysicaActa (BBA)-General Subjects 884.1 (1986): 124-
134.
102.Hai, Yanan, et al. "The roles and regulation of Sertoli cells in fate determinations of
spermatogonial stem cells and spermatogenesis." Seminars in cell & developmental
biology. Vol. 29. Academic Press, 2014.
103.Hales, D. (2002). Testicular macrophage modulation of leydig cell steroidogenesis. 57.
104.Hammadeh, M. E., et al. "Protamine contents and P1/P2 ratio in human spermatozoa
from smokers and non-smokers." Human reproduction (2010): deq226.
105.Hammoud, Saher Sue, et al. "Chromatin and transcription transitions of mammalian
adult germline stem cells and spermatogenesis." Cell Stem Cell 15.2 (2014): 239-253.
106.Harris, Peter, Sue Nagy, and Nicholas Vardaxis. Mosby's Dictionary of Medicine,
Nursing and Health Professions-Australian & New Zealand Edition. Elsevier Health
Sciences, 2014.
107.Hartel, D.et al. (2012). Molecular organization of chromosomes. In Genetics: analysis of
genes and genomes (Vol. Eighth edition). Jons and Barlett learning.
108.Hartl, D. (2011). The chromosomal Basis of heredity. In D. Hartl, Essential genetics: A
genomics perespective. Sudbury: Jones and bartlett publisher.
109.Hazzouri, Mira, et al. "Regulated hyperacetylation of core histones during mouse
spermatogenesis: involvement of histone-deacetylases." European journal of cell biology
79.12 (2000): 950-960.
110.Helal, I. (2012). Glomerular hyperfiltration: definitions, mechanisms and clinical
implications. 8.
111.Heitzmann, Dirk, and Richard Warth. "Physiology and pathophysiology of potassium
channels in gastrointestinal epithelia." Physiological Reviews 88.3 (2008): 1119-1182. 112.Hicks, J. J. (1973). Insulin regulation of spermatozoa metabolism. 92 (833-839).
113.Hinrichsen, Klaus V. Slides on human embryology. Springer Science & Business Media,
1986.

95
114.Huang, Guizhen, et al. "IL-6 mediates differentiation disorder during spermatogenesis in
obesity-associated inflammation by affecting the expression of Zfp637 through the
SOCS3/STAT3 pathway." Scientific Reports 6 (2016).
115.Huleihel, Mahmoud, and EitanLunenfeld. "Regulation of spermatogenesis by
paracrine/autocrine testicular factors." Asian journal of andrology 6.3 (2004): 259-268.
116.Idelman, Simon, and Jean Verdetti. Endocrinologie et communications cellulaires. EDP
sciences, 2001.
117.Iqbal, Khursheed, et al. "Reprogramming of the paternal genome upon fertilization
involves genome-wide oxidation of 5-methylcytosine." Proceedings of the National
Academy of Sciences 108.9 (2011): 3642-3647.
118.Iuchi, Yoshihito, et al. "Concerted changes in the YB2/RYB-a protein and protamine 2
messenger RNA in the mouse testis under heat stress." Biology of reproduction 68.1
(2003): 129-135.
119.Ivell, Richard. "Lifestyle impact and the biology of the human scrotum." Reproductive
biology and endocrinology 5.1 (2007): 1
120.Jefferson, J. A., S. J. Shankland, and R. H. Pichler. "Proteinuria in diabetic kidney
disease: a mechanistic viewpoint." Kidney international 74.1 (2008): 22-36.
121.Jenkins, Timothy G., and Douglas T. Carrell. "The sperm epigenome and potential
implications for the developing embryo." Reproduction 143.6 (2012): 727-734.
122.Jenkins, Timothy G., et al. "Paternal aging and associated intraindividual alterations of
global sperm 5-methylcytosine and 5-hydroxymethylcytosine levels." Fertility and
sterility 100.4 (2013): 945-951.
123.Jenkins, Timothy G., et al. "Age-associated sperm DNA methylation alterations: possible
implications in offspring disease susceptibility." PLoS Genet 10.7 (2014): e1004458.
124.Jensen, Jørgen, et al. "The role of skeletal muscle glycogen breakdown for regulation of
insulin sensitivity by exercise." Frontiers in physiology 2 (2011): 112.

96
125.Jones, R. (2014). Transport of the sperm and ovum in the oviduct. In R. Jones, Human
reproductive biology (Vol. fourth edition). Colorado: Elsevier.
126.Jones, R. et al. (2013). Human reproductive biology. (p 102).
127.Julia, Chantal, and Serge Hercberg. "Épidémiologie de l‘obésité en France." Revue du
RhumatismeMonographies 83.1 (2016): 2-5.
128.Kaati, G. (2002). Cardiovascular and diabetes mortality determined by nutrition during
parents' and grandparents' slow growth period. 10 (11).
129.Kierszenbaum, Abraham L., and Laura L. Tres. "The acrosome-acroplaxome-manchette
complex and the shaping of the spermatid head." Archives of histology and cytology 67.4
(2004): 271-284.
130.Kim, Seul Ki, ByungChulJee, and Seok Hyun Kim. "Histone methylation and
acetylation in ejaculated human sperm: effects of swim-up and smoking." Fertility and
sterility 103.6 (2015): 1425-1431.
131.Kouzarides, Tony. "Chromatin modifications and their function." Cell 128.4 (2007):
693-705.
132.Krohmer, R. (2004). Glossary. In R. Krohmer, The reproductive system. New York:
Chelsea house publishers: an imprint of infobase publishing.
133.Vignera, Sandro, et al. "Negative effect of increased body weight on sperm conventional
and nonconventional flow cytometric sperm parameters." Journal of andrology 33.1
(2012): 53-58.
134.Lampiao, Fanuel, and Stefan S. Du Plessis. "Insulin and leptin enhance human sperm
motility, acrosome reaction and nitric oxide production." Asian journal of andrology 10.5
(2008): 799-807.
135.Lane, Michelle, et al. "Oxidative stress in mouse sperm impairs embryo development,
fetal growth and alters adiposity and glucose regulation in female offspring." PLoS One
9.7 (2014): e100832.
136.Lane, Michelle, et al. "Oxidative stress in mouse sperm impairs embryo development,
fetal growth and alters adiposity and glucose regulation in female offspring." PLoS One
9.7 (2014): e100832.

97
137.Lane, Michelle, Rebecca L. Robker, and Sarah A. Robertson. "Parenting from before
conception." Science 345.6198 (2014): 756-760.
138.Larsen, S. H., G. Wagner, and Berit Lilienthal Heitmann. "Sexual function and obesity."
International Journal of Obesity 31.8 (2007): 1189-1198.
139.Lee, Min Gyu, et al. "An essential role for CoREST in nucleosomal histone 3 lysine 4
demethylation." Nature 437.7057 (2005): 432-435.
140.Leese, Henry J. "Quiet please, do not disturb: a hypothesis of embryo metabolism and
viability." Bioessays 24.9 (2002): 845-849.
141.Leichtmann-Bardoogo, Yael, et al. "Compartmentalization and regulation of iron
metabolism proteins protect male germ cells from iron overload." American Journal of
Physiology-Endocrinology and Metabolism 302.12 (2012): E1519-E1530.
142.Leisegang, Kristian, et al. "Obesity is associated with increased seminal insulin and
leptin alongside reduced fertility parameters in a controlled male cohort." Reproductive
Biology and Endocrinology 12.1 (2014): 1.
143.Lin, Ching-Chun, et al. "Increased risk of death with congenital anomalies in the
offspring of male semiconductor workers." International journal of occupational and
environmental health (2013).
144.Liu, Wei-Min, et al. "Sperm-borne microRNA-34c is required for the first cleavage
division in mouse." Proceedings of the National Academy of Sciences 109.2 (2012): 490-
494.
145.Lotti, F., et al. "Elevated body mass index correlates with higher seminal plasma
interleukin 8 levels and ultrasonographic abnormalities of the prostate in men attending
an andrology clinic for infertility." Journal of endocrinological investigation 34.10
(2011): e336-e342.
146.Love, Charles C., and Robert M. Kenney. "Scrotal heat stress induces altered sperm
chromatin structure associated with a decrease in protamine disulfide bonding in the
stallion." Biology of reproduction 60.3 (1999): 615-620.

98
147.Lu, Zhao-Hui, et al. "Saturated free fatty acids, palmitic acid and stearic acid, induce
apoptosis by stimulation of ceramide generation in rat testicular Leydig cell."
Biochemical and biophysical research communications 303.4 (2003): 1002-1007.
148.Macdonald, A. A., A. W. Stewart, and C. M. Farquhar. "Body mass index in relation to
semen quality and reproductive hormones in New Zealand men: a cross-sectional study in
fertility clinics." Human Reproduction 28.12 (2013): 3178-3187.
149.Martini, Ana C., et al. "Overweight and seminal quality: a study of 794 patients."
Fertility and sterility 94.5 (2010): 1739-1743.
150.McCowan, Lesley ME, et al. "Paternal contribution to small for gestational age babies: a
multicenter prospective study." Obesity 19.5 (2011): 1035-1039.
151.McLachlan, R. I., et al. "Histological evaluation of the human testis—approaches to
optimizing the clinical value of the assessment: mini review." Human Reproduction 22.1
(2007): 2-16.
152.McPherson, Nicole O., and Michelle Lane. "Male obesity and subfertility, is it really
about increased adiposity?." Asian journal of andrology 17.3 (2014): 450-458.
153.Melvin, James E., et al. "Regulation of fluid and electrolyte secretion in salivary gland
acinar cells." Annu. Rev. Physiol. 67 (2005): 445-469.
154.Mergenthaler, Philipp, et al. "Sugar for the brain: the role of glucose in physiological and
pathological brain function." Trends in neurosciences 36.10 (2013): 587-597.
155.Michalakis, Konstantinos, et al. "The complex interaction between obesity, metabolic
syndrome and reproductive axis: a narrative review." Metabolism 62.4 (2013): 457-478.
156.Miller, Brian, et al. "Meta-analysis of paternal age and schizophrenia risk in male versus
female offspring." Schizophrenia bulletin 37.5 (2011): 1039-1047.
157.Mitchell, Megan, Hassan W. Bakos, and Michelle Lane. "Paternal diet-induced obesity
impairs embryo development and implantation in the mouse." Fertility and sterility 95.4
(2011): 1349-1353.

99
158.Moehlecke, Milene, et al. "Determinants of body weight regulation in humans." Archives
of endocrinology and metabolism AHEAD (2016): 0-0.
159.Møller, Henrik, et al. "Prostate cancer incidence, clinical stage and survival in relation to
obesity: a prospective cohort study in Denmark." International Journal of Cancer 136.8
(2015): 1940-1947.
160.Montagnon, D., A. Clavert, and C. Cranz. "Fructose, proteins and coagulation in human
seminal plasma." Andrologia 14.5 (1982): 434-439.
161.Montellier, Emilie, et al. "Chromatin-to-nucleoprotamine transition is controlled by the
histone H2B variant TH2B." Genes & development 27.15 (2013): 1680-1692.
162.Montjean, D., et al. "Sperm global DNA methylation level: association with semen
parameters and genome integrity." Andrology 3.2 (2015): 235-240.
163.Moore, Lisa D., Thuc Le, and Guoping Fan. "DNA methylation and its basic function."
Neuropsychopharmacology 38.1 (2013): 23-38.
164.Morgan, David Owen. The cell cycle: principles of control. New Science Press, 2007.
165.Nakamura, Toshinobu, et al. "PGC7/Stella protects against DNA demethylation in early
embryogenesis." Nature cell biology 9.1 (2007): 64-71.
166.Nasreddine, Lara, et al. "Trends in overweight and obesity in Lebanon: evidence from
two national cross-sectional surveys (1997 and 2009)." BMC public health 12.1 (2012):
1.
167.Navarro-Costa, Paulo, et al. "Incorrect DNA methylation of the DAZL promoter
CpGisland associates with defective human sperm." Human reproduction 25.10 (2010):
2647-2654.
168.Neto, Filipe Tenorio Lira, et al. "Spermatogenesis in humans and its affecting factors."
Seminars in cell & developmental biology. Academic Press, 2016.
169.Nettersheim, Daniel, et al. "Analysis of TET expression/activity and 5mC oxidation
during normal and malignant germ cell development." PLoS One 8.12 (2013): e82881.

100
170.Ng, Marie, et al. "Global, regional, and national prevalence of overweight and obesity in
children and adults during 1980–2013: a systematic analysis for the Global Burden of
Disease Study 2013." The Lancet 384.9945 (2014): 766-781.
171.Ng, Sheau-Fang, et al. "Chronic high-fat diet in fathers programs [bgr]-cell dysfunction
in female rat offspring." Nature 467.7318 (2010): 963-966.
172.Ng, Sheau-Fang, et al. "Paternal high-fat diet consumption induces common changes in
the transcriptomes of retroperitoneal adipose and pancreatic islet tissues in female rat
offspring." The FASEB Journal 28.4 (2014): 1830-1841.
173.Ni, Kai, et al. "TET enzymes are successively expressed during human spermatogenesis
and their expression level is pivotal for male fertility." Human Reproduction (2016):
dew096.
174.Ni, K., et al. "The impact of sperm protamine deficiency and sperm DNA damage on
human male fertility: a systematic review and meta‐analysis." Andrology (2016).
175.McPherson, Nicole O., and Michelle Lane. "Male obesity and subfertility, is it really
about increased adiposity?." Asian journal of andrology 17.3 (2014): 450-458.
176.Oakes, Christopher C., et al. "Adverse effects of 5-aza-2′-deoxycytidine on
spermatogenesis include reduced sperm function and selective inhibition of de novo
DNA methylation." Journal of Pharmacology and Experimental Therapeutics 322.3
(2007): 1171-1180.
177.Ogden, Cynthia L., et al. "Prevalence of childhood and adult obesity in the United States,
2011-2012." Jama 311.8 (2014): 806-814.
178.Okada, Yuki, et al. "Histone demethylase JHDM2A is critical for Tnp1 and Prm1
transcription and spermatogenesis." Nature 450.7166 (2007): 119-123.
179.Oliveira, P. F., et al. "Effect of insulin deprivation on metabolism and metabolism-
associated gene transcript levels of in vitro cultured human Sertoli cells."
BiochimicaetBiophysicaActa (BBA)-General Subjects 1820.2 (2012): 84-89.

101
180.Owen, Derek H., and David F. Katz. "A review of the physical and chemical properties
of human semen and the formulation of a semen simulant." Journal of andrology 26.4
(2005): 459-469.
181.Pacheco, Sara E., et al. "Integrative DNA methylation and gene expression analyses
identify DNA packaging and epigenetic regulatory genes associated with low motility
sperm." PLoS One 6.6 (2011): e20280.
182.Palmer, Nicole O., et al. "SIRT6 in mouse spermatogenesis is modulated by diet-induced
obesity." Reproduction, Fertility and Development 23.7 (2011): 929-939.
183.Palmer, Nicole O., et al. "Impact of obesity on male fertility, sperm function and
molecular composition." Spermatogenesis 2.4 (2012): 253-263.
184.Parker, Helen E., Fiona M. Gribble, and Frank Reimann. "The role of gut endocrine cells
in control of metabolism and appetite." Experimental physiology 99.9 (2014): 1116-1120.
185.Paz, Gedalia, et al. "Immunoreactive insulin in serum and seminal plasma of diabetic and
nondiabetic men and its role in the regulation of spermatozoal activity." Fertility and
sterility 28.8 (1977): 836-840.
186.Pettitt, David J., et al. "Comparison of two waist circumference measurement protocols:
the SEARCH for diabetes in youth study." Pediatric obesity 7.6 (2012): e81-e85.
187.Pitteloud, Nelly, et al. "Increasing insulin resistance is associated with a decrease in
Leydig cell testosterone secretion in men." The Journal of Clinical Endocrinology &
Metabolism 90.5 (2005): 2636-2641.
188.Proietto, Joseph, and Louise A. Baur. "10: Management of obesity." Medical journal of
Australia 180.9 (2004): 474-481.
189.Qian, Min-Xian, et al. "Acetylation-mediated proteasomal degradation of core histones
during DNA repair and spermatogenesis." Cell 153.5 (2013): 1012-1024.
190.Quayle, A. J., et al. "Immunosuppression by seminal prostaglandins." Clinical and
experimental immunology 75.3 (1989): 387.

102
191.Ramathal, Cyril, Paul Turek, and Renee ReijoPera. Embryonic stem cells and the germ
cell lineage. INTECH Open Access Publisher, 2011.
192.Ramathal, Cyril, Paul Turek, and Renee ReijoPera. Embryonic stem cells and the germ
cell lineage. INTECH Open Access Publisher, 2011.
193.Rassoulzadegan, Minoo, et al. "RNA-mediated non-mendelian inheritance of an
epigenetic change in the mouse." Nature 441.7092 (2006): 469-474.
194.Rato, Luís, et al. "Tubular fluid secretion in the seminiferous epithelium: ion transporters
and aquaporins in Sertoli cells." The Journal of membrane biology 236.2 (2010): 215-
224.
195.Rato, L., et al. "High‐energy diets: a threat for male fertility?." Obesity Reviews 15.12
(2014): 996-1007.
196.Rato, L., et al. "High‐energy diets may induce a pre‐diabetic state altering testicular
glycolytic metabolic profile and male reproductive parameters." Andrology 1.3 (2013):
495-504.
197.Reidy, Kimberly, et al. "Molecular mechanisms of diabetic kidney disease." The Journal
of clinical investigation 124.6 (2014): 2333-2340.
198.Robertson, Sarah A. "Seminal plasma and male factor signalling in the female
reproductive tract." Cell and tissue research 322.1 (2005): 43-52.
199.Rousseaux, Sophie, and Saadi Khochbin. "Histone acylation beyond acetylation: terra
incognita in chromatin biology." Cell J 17.1 (2015): 1-6.
200.Shafik, A., and S. Olfat. "Lipectomy in the treatment of scrotal lipomatosis." British
journal of urology 53.1 (1981): 55-61.
201.Saraswat, S., S. Kharche, and S. Jindal. "Impact of reactive oxygen species on
spermatozoa: a balancing act between beneficial and detrimental effects." Iran J
ApplAnimSci 4 (2014): 247-255.

103
202.Sartorius, Gideon A., and EberhardNieschlag. "Paternal age and reproduction." Human
reproduction update (2009): dmp027.
203.Schliep, Karen C., et al. "Effect of male and female body mass index on pregnancy and
live birth success after in vitro fertilization." Fertility and sterility 103.2 (2015): 388-395.
204.Schwartz, Michael W., et al. "Cooperation between brain and islet in glucose
homeostasis and diabetes." Nature 503.7474 (2013): 59-66.
205.Sermondade, N., et al. "BMI in relation to sperm count: an updated systematic review
and collaborative meta-analysis." Human reproduction update (2012): dms050.
206.Sharma, Kumar. "Obesity, oxidative stress, and fibrosis in chronic kidney disease."
Kidney international supplements 4.1 (2014): 113-117.
207.Sharma, Rakesh, and Ashok Agarwal. "Spermatogenesis: an overview." Sperm
Chromatin. Springer New York, 2011. 19-44.
208.Sharma, Virvikram, and P. L. Sharma. "Role of different molecular pathways in the
development of diabetes-induced nephropathy." Journal of Diabetes & Metabolism 2013
(2013).
209.Shirakata, Yoshiki, et al. "Histone h4 modification during mouse spermatogenesis." The
Journal of reproduction and development 60.5 (2014): 383.
210.Siddiqui, Athar H., et al. "Recombinant vascular endothelial growth factor 121
attenuates autoantibody-induced features of pre-eclampsia in pregnant mice." American
journal of hypertension 24.5 (2011): 606-612.
211.Smallwood, Sébastien A., and Gavin Kelsey. "De novo DNA methylation: a germ cell
perspective." Trends in Genetics 28.1 (2012): 33-42.
212.Song, Ning, et al. "Immunohistochemical analysis of histone H3 modifications in germ
cells during mouse spermatogenesis." Actahistochemicaetcytochemica 44.4 (2011): 183-
190.

104
213.Sorahan, T., et al. "Childhood cancer and parental use of tobacco: deaths from 1971 to
1976." British journal of cancer 76.11 (1997): 1525.
214.Soubry, Adelheid, et al. "Paternal obesity is associated with IGF2 hypomethylation in
newborns: results from a Newborn Epigenetics Study (NEST) cohort." BMC medicine
11.1 (2013): 1.
215.Stensel, David. "Exercise, appetite and appetite-regulating hormones: implications for
food intake and weight control." Annals of Nutrition and Metabolism 57.Suppl. 2 (2011):
36-42.
216.Strazzullo, Pasquale, et al. "Altered renal sodium handling in men with abdominal
adiposity: a link to hypertension." Journal of hypertension 19.12 (2001): 2157-2164.
217.Strünker, Timo, et al. "The CatSper channel mediates progesterone-induced Ca2+ influx
in human sperm." Nature 471.7338 (2011): 382-386.
218.Sung, Tzu‐I., Jung‐Der Wang, and Pau‐Chung Chen. "Increased risks of infant mortality
and of deaths due to congenital malformation in the offspring of male electronics
workers." Birth Defects Research Part A: Clinical and Molecular Teratology 85.2
(2009): 119-124.
219.Suzuki, Hitomi, et al. "SOHLH1 and SOHLH2 coordinate spermatogonial
differentiation." Developmental biology 361.2 (2012): 301-312.
220.Tan, Li, and YujiangGeno Shi. "Tet family proteins and 5-hydroxymethylcytosine in
development and disease." Development 139.11 (2012): 1895-1902.
221.Terashima, Minoru, et al. "Effect of high fat diet on paternal sperm histone distribution
and male offspring liver gene expression." Epigenetics 10.9 (2015): 861-871.
222.Tervaert, Thijs W. Cohen, et al. "Pathologic classification of diabetic nephropathy."
Journal of the American Society of Nephrology 21.4 (2010): 556-563.
223.Thomas, Stephanie, et al. "Seminal plasma adipokine levels are correlated with
functional characteristics of spermatozoa." Fertility and sterility 99.5 (2013): 1256-1263.

105
224.Toschke, Audre M., et al. "Paternal smoking is associated with a decreased prevalence of
type 1 diabetes mellitus among offspring in two national British birth cohort studies
(NCDS and BCS70)." Journal of perinatal medicine 35.1 (2007): 43-47.
225.Traish, Abdulmaged M., Robert J. Feeley, and Andre Guay. "Mechanisms of obesity and
related pathologies: androgen deficiency and endothelial dysfunction may be the link
between obesity and erectile dysfunction." FEBS journal 276.20 (2009): 5755-5767.
226.TROPP, B. (2012). Chromosome structure. In Molecular biology from genes to proteins
(Vol. fourth edition). Jones and Bartlett.
227.Tunc, Ozlem, and KeltonTremellen. "Oxidative DNA damage impairs global sperm
DNA methylation in infertile men." Journal of assisted reproduction and genetics 26.9-
10 (2009): 537-544.
228.Tunc, O., H. W. Bakos, and K. Tremellen. "Impact of body mass index on seminal
oxidative stress." Andrologia 43.2 (2011): 121-128.
229.Ueda, Hirotaka, et al. "The roles of salivary secretion, brain–gut peptides, and oral
hygiene in obesity." Obesity research & clinical practice 7.5 (2013): e321-e329.
230.Umul, M., et al. "Effect of increasing paternal body mass index on pregnancy and live
birth rates in couples undergoing intracytoplasmic sperm injection." Andrologia 47.3
(2015): 360-364.
231.Valensi, P., et al. "Microalbuminuria in obese patients with or without hypertension."
International journal of obesity and related metabolic disorders: journal of the
International Association for the Study of Obesity 20.6 (1996): 574-579.
232.Vasanthakumar, Aparna, and Lucy A. Godley. "5-hydroxymethylcytosine in cancer:
significance in diagnosis and therapy." Cancer genetics 208.5 (2015): 167-177.
233.Veenendaal, Marjolein VE, et al. "Transgenerational effects of prenatal exposure to the
1944–45 Dutch famine." BJOG: An International Journal of Obstetrics & Gynaecology
120.5 (2013): 548-554.
234.Vendramini, V., et al. "Reproductive Function of the Male Obese Zucker Rats Alteration
in Sperm Production and Sperm DNA Damage." Reproductive Sciences (2013):
1933719113493511.

106
235.Vickers, Mark H. "Early life nutrition, epigenetics and programming of later life
disease." Nutrients 6.6 (2014): 2165-2178.
236.Vieweg, Markus, et al. "Methylation analysis of histone H4K12ac-associated promoters
in sperm of healthy donors and subfertile patients." Clinical epigenetics 7.1 (2015): 1.
237.vanVliet-Ostaptchouk, Jana V., et al. "The prevalence of metabolic syndrome and
metabolically healthy obesity in Europe: a collaborative analysis of ten large cohort
studies." BMC endocrine disorders 14.1 (2014): 1.
238.VILLARROEL-ESPÍNDOLA, F., et al. "The Many Faces of Carbohydrate Metabolism
in Male Germ Cells: From Single Molecules to Active Polymers." Int. J. Med. Surg. Sci
2.4 (2015): 603-619.
239.Wagner, Kay D., et al. "RNA induction and inheritance of epigenetic cardiac
hypertrophy in the mouse." Developmental cell 14.6 (2008): 962-969.
240.Wagner, Márcia Santos, Simone MagagninWajner, and Ana Luiza Maia. "The role of
thyroid hormone in testicular development and function." Journal of Endocrinology
199.3 (2008): 351-365.
241.Wang, Zengjun, et al. "AB073. Semen liquefaction molecular pathways." Translational
Andrology and Urology 4.Suppl 1 (2015).
242.Ward, W. Steven. "Function of sperm chromatin structural elements in fertilization and
development." Molecular human reproduction 16.1 (2010): 30-36.
243.Wei, Yanchang, HeideSchatten, and Qing-Yuan Sun. "Environmental epigenetic
inheritance through gametes and implications for human reproduction." Human
reproduction update (2014): dmu061.
244.Wei, Yanchang, et al. "Paternally induced transgenerational inheritance of susceptibility
to diabetes in mammals." Proceedings of the National Academy of Sciences 111.5 (2014):
1873-1878.
245.Weinbauer, Gerhard F., et al. "Physiology of testicular function." Andrology. Springer
Berlin Heidelberg, 2010. 11-59.

107
246.Consultation, WHO Expert. "Waist circumference and waist-hip ratio." Report of a
WHO Expert Consultation. Geneva: World Health Organization (2008): 8-11.
247.Wossidlo, Mark, et al. "5-Hydroxymethylcytosine in the mammalian zygote is linked
with epigenetic reprogramming." Nature communications 2 (2011): 241.
248.Wozniak, Susan E., et al. "Adipose tissue: the new endocrine organ? A review article."
Digestive diseases and sciences 54.9 (2009): 1847-1856.
249.Wu, Q., and M. Suzuki. "Parental obesity and overweight affect the body‐fat
accumulation in the offspring: the possible effect of a high‐fat diet through epigenetic
inheritance." Obesity reviews 7.2 (2006): 201-208.
250.Wu, Wei, et al. "Idiopathic male infertility is strongly associated with aberrant promoter
methylation of methylenetetrahydrofolatereductase (MTHFR)." PLoS One 5.11 (2010):
e13884.
251.Yu, Y. Eugene, et al. "Abnormal spermatogenesis and reduced fertility in transition
nuclear protein 1-deficient mice." Proceedings of the National Academy of Sciences 97.9
(2000): 4683-4688.
252.Yuan, Shuiqiao, et al. "Sperm-borne miRNAs and endo-siRNAs are important for
fertilization and preimplantation embryonic development." Development 143.4 (2016):
635-647.
253.Yuen, Benjamin TK, et al. "Histone H3. 3 regulates dynamic chromatin states during
spermatogenesis." Development 141.18 (2014): 3483-3494.
254.Zhang, Donghong, et al. "Elevated homocysteine level and folate deficiency associated
with increased overall risk of carcinogenesis: meta-analysis of 83 case-control studies
involving 35,758 individuals." PloS one 10.5 (2015): e0123423.
255.Zhang, Erhong, et al. "GLP‐1 Receptor Agonist Exenatide Attenuates the Detrimental
Effects of Obesity on Inflammatory Profile in Testis and Sperm Quality in Mice."
American Journal of Reproductive Immunology 74.5 (2015): 457-466.

108
256.Zhao, Jian, et al. "Leptin level and oxidative stress contribute to obesity-induced low
testosterone in murine testicular tissue." Oxidative medicine and cellular longevity 2014
(2014).
257.Zirkin, Barry R., and Haolin Chen. "Regulation of Leydig cell steroidogenicfunction
during aging." Biology of reproduction 63.4 (2000): 977-981.

109
Chapter 2 Selective physiological and molecular alterations in the motile
sperm from obese men
I- Abstract
The prevalence of excessive weight or obesity is elevated among young men of reproductive age
and its impact on male reproduction is not entirely elucidated. Accumulated evidence suggests
that information from paternal environment such as acquired obesity remains in the male gamete
and can modulate the phenotype of the offspring. Here, we aimed to assess the drawbacks of
obesity on the molecular composition of the motile sperm and on the pre-implantation embryo
morphokinetics.
The semen samples were obtained from 96 men attending the A-clinic fertility center, Lebanon.
Patients were categorized into three groups according to their body mass index (BMI) and waist
circumference (WC): normal weight (18<BMI<24 kg/m2 and WC< 90 cm), overweight
(25<BMI<29.9 kg/m2 and WC<102 cm), and obese (BMI>30 kg/m
2 and WC >103 cm).
Our results showed that the motile sperm of obese men had higher levels of retained histones
(p<0.001), elevated percentage of decompacted chromatin (p<0.001), hypomethylated DNA
(p<0.05), and hypohydroxymethylated DNA (p<0.001) as compared to the motile spermatozoa
of normal weight men. In addition, the time of pronuclei appearance (p<0.001) and fading
(p<0.05) were significantly shorter in the zygotes derived from an obese father when compared
to a normal weight one. Subsequently, the embryonic cell cycles CC1 (p<0.05), CC2 (p<0.05),
and CC3 (p<0.05) were significantly delayed in the cleavage embryos of the obese group as
compared to the normal one. After the activation of the embryonic genome, there was a
significant reduction in the compaction rate (p<0.05), in the blastulation rate (p<0.05), and in the
quality of the trophectoderm layer of the blastocyst (p<0.04) in the obese group rather than the
normal ones.
In conclusion, we demonstrated that male obesity may affect the molecular composition of the
motile sperm and may alter the pre-implantation embryo morphokinetics.

110
II- Introduction
Obesity or excessive fatness has exceeded the stage of dietary measures and has reached alerting
levels worldwide (Nasreddine and Naja et al. 2012; AL-Quwaidhi et al. 2014; Ogden et al. 2014;
Vilet-Ostaptchouk et al. 2014).Moreover, it is one of the leading factors in the development of
several metabolic pathologies such as type 2 diabetes mellitus (T2DM), cardiovascular diseases,
respiratory diseases, hypertension, and infertility (Golay et al. 2005; Fulleston et al. 2012;
Costanian et al. 2014) .
Surprisingly, there is a tremendous increase in the prevalence of obesity in young men of
reproductive age (Ng et al. 2014; McPherson et al. 2015). Different systematic reviews have
summed up the effects of human male obesity on sperm parameters, DNA fragmentation,
mitochondrial membrane potential, and fertility outcomes. Male obesity in humans may increase
the incidence of oligozoospermia and azoospermia (Sermondade et al. 2012), reduce the
percentage of normal sperm morphology, (MacDonald et al. 2013; Campbell et al. 2015), and
increase the percentage of sperm with DNA fragmentation and altered mitochondrial membrane
potential(Campbell et al. 2015). Moreover, a study on 81 men has indicated that the production
of reactive oxygen species by the sperm is positively correlated to the BMI (Tunc et al. 2011).
Regarding the effect of paternal obesity on pre-implantation embryo development, three reports
have been published; Bakos and colleagues high spotted the significant decrease in blastulation
rate with increasing BMI, whereas Colaci et al., and Schliep et al., didn‘t find any significant
difference between obese and non-obese men for the analyzed embryologic parameters (Bakos et
al. 2011; Colaci et al. 2012; Schliep et al. 2015) . Furthermore, a recent meta-analysis showed
that paternal obesity may reduce the rate of live birth per assisted reproductive technology (ART)
cycle, and increase the risk of facing a non-viable pregnancy (Campbell et al. 2015).
Accumulated evidence suggests that information from paternal environment such as acquired
obesity remains in the male gamete and can modulate the phenotype of the offspring. This kind
of inheritance is independent of changes in the inherited DNA sequence(wei et al. 2014). As
reported by G kaati et al., the nutritional status of paternal grandfather may increase the risk of
health complications in the grandson (Kaati et al. 2002). Further, a father born small for
gestational age (SGA) has an elevated risk of developing obesity and giving birth to (SGA)
babies (McCowan et al. 2011).In addition, the incidence of obesity and diabetes in the
grandchildren, coming from sons who were exposed in utero to the Dutch famine, were very
high (Veenend aal et al. 2013).
Interestingly, it was shown in humans, and in rodent model of diet-induced obesity that excessive
fatness can remodel the sperm epigenome; thus, playing a crucial role in the sperm-dependent
non-genetic inheritance of acquired obesity (McPherson et al. 2015; Donkin et al. 2016). At the
molecular level, the sperm epigenome is made up of a protamine-rich chromatin that will be
replaced after fertilization by maternal histones (Wared et al. 2010), a small amount of paternally

111
inherited histones (1-10%), highly compacted DNA with possible chemical modifications, and a
small amount of RNAs (McPherson et al. 2015).
Acquired obesity in male mice, induces alterations in DNA methylation of phosphatidylinositol-
4,5-bisphosphate 3-kinase gene (PI3K), which is implicated in insulin signalling (Wei et al.
2014). It also increases the level of expression of cytochrome C oxidase subunit IV isoform I
(Cox4il) mRNA in sperm cells. Cox4il is a nuclear encoded gene that can regulate the
mitochondrial function in embryos (Binder et al. 2015). Moreover, Fullston and colleagues have
shown that the high fat diet (HFD) may induce a global DNA hypomethylation of late elongated
spermatids and can alter the sperm micro-RNAs (miRNAs) content (miR133b-3p, miR-304-5p,
miR196a-5p, miR205) in obese male mice. These miRNAs may be implicated in the regulation
of pre-implantation mouse embryo development (Fullston et al. 2013). Moreover, microinjection
of testis and sperm RNAs from obese mice into one cell mouse embryo has led to the
development of obesity and T2DM in the offspring (Grandjean et al. 2015); highlighting the role
of sperm RNAs in the inheritance of the paternal acquired obesity. Not only the DNA
methylation, and the sperm RNAs but also the sperm chromatin is considered as a potential
candidate; sperm cells from HFD-fed mice were found to have high histones retention and
particularly H3K4me1 retention at specific genes implicated in development and cell fate
decision (Terashima et al. 2015). In addition, Palmer et al, have found that the percentage of
spermatids that stains positive to the H3K9ac antibody was higher in the HFD male mice as
compared to those on control diet (Palmer et al. 2011).
In line with the studies performed on mice, La Vignera and colleagues have shown that obese
men had a higher percentage of sperm with decondensed chromatin when assessed by toluidine
blue staining (La Vignera et al. 2012). When compared to normal weight men, obese men‘s
sperm DNA has presented different methylation profile in imprinted regions (Soubry et al. 2016)
as well as in genes implicated in the function and metabolism of the central nervous system
(Donkin et al. 2016). Also, deregulation in sperm Piwi-interacting RNAs (piRNAs) expression
has been detected in obese subject (Donkin et al. 2016).
In the light of these results, we aimed to assess the quality of human sperm chromatin and the
underlying DNA methylation/hydroxymethylation status in obese men before and after swim-up
procedure. Next, we analyzed the effect of the motile-sperm enriched fraction derived from
obese father on the pre-implantation embryo morphokinetics.

112
III- Materials and Methods
a) Study population
Semen samples were obtained from a total of 96 men attending the A-clinic fertility center at
Mount Lebanon hospital - Hazmieh, Lebanon between January 2016 and October 2016. In -
person interviews were conducted to complete a questionnaire about the age, the length of the
sexual abstinence, current or previous disease status including urogenital ones, and habits such as
smoking and alcohol intake. All the patients suffering from andrological disorders or recent fever
as well as those undertaking any treatment that may alter the spermatogenesis or using a frozen
sperm cycle were excluded from the study (Figure 1). For the pre-implantation embryo
morphokinetics analysis, all the couples where the female partner was <38 years at the time of
oocyte collection (Bakos et al. 2011) and undergoing an intracytoplasmic sperm injection (ICSI)
cycle with a time-lapse embryo monitoring were included in the study. An informed consent was
obtained from each patient
b) Anthropometric measurements
Anthropometric measurements were performed by a trained staff. Weight was measured in
kilograms using a weighing scale. Height was measured in centimetres. The BMI was calculated
as weight in kilograms divided by the squared height in meters, and it was categorized as
follows: 18<BMI< 24.9kg/m2 (normal weight), 25<BMI<29.9 kg/m
2 (overweight) and BMI >30
kg/m2
(obese) (Einsenberg et al. 2014).
Abdominal fat accumulation might be a risk factor for several pathologies and it has drawbacks
on male fertility. Thus, waist circumference (WC) was measured with a standardized tape
measure, which was placed over the skin or light clothing while the participant was
standing. Two measurements were usually taken followed by a third one when the difference
between two measurements was 0.5 cm or above (Einsenberg et al. 2014).
c) Semen analysis
A semen sample was produced on-site by masturbation into a sterile plastic specimen cup. All
subjects underwent semen analysis. The semen parameters analyzed included liquefaction,
viscosity, seminal pH, sperm concentration (106 sperm/mL), total progressively motile sperm per
ejaculate, and sperm morphology according to the World Health Organization criteria(WHO
2010).Each sample was evaluated by 2 technicians, and readings were averaged between the two
evaluations after calculation of error.

113
d) Sperm isolation using swim-up technique
Motile-sperm enriched fraction was prepared using a swim-up technique which selects a
population of spermatozoa with the lowest DNA fragmentation rate (Volpes et al. 2016).At
first,1 ml of semen was placed in a tube and was overlaid by 1 ml of culture medium (Sperm
Medium, COOK medical, Australia). The tube was incubated for 45 min (37 °C and under 5%
CO2). The supernatant was aspirated and transferred to an empty tube.After the semen
processing using the swim-up technique, replicate measurements of sperm concentration, sperm
motility, and sperm morphology were performed on the supernatant according to the World
Health Organization criteria (WHO 2010).
e) Sperm morphology evaluation
In order to observe sperm morphology and vacuolization, dried smears were stained using the
Spermoscan Kit (RAL diagnostics). The staining was performed according to the manufacture
protocol. Briefly, the smears were fixed in the SPERMO FIX-RAL solution. Next, the sperm
cytoplasm was stained using the SPERMO EOSINE-RAL, and the nucleus was stained in the
SPERMO BLEU-RAL. On the dried stained smears at least 200 sperms were counted and
classified as normal or abnormal morphology according to Kruger‘s strict criteria. Head defects:
large or small, tapered, amorphous, vacuolated (more than two vacuoles or >20% of the head
area occupied by unstained vacuolar areas), small or large acrosomal areas. Mid-piece defects:
Bent, Cytoplasmic residues. Tail defects: Coiled, multiple(WHO 2010).
f) Sperm membrane integrity assessment
Sperm membrane integrity was assessed using the eosin-nigrosin staining. Briefly, stained
smears were evaluated under microscopy. The results were expressed as the percentage of
stained or pink sperm (altered head membrane)after examination of 200 sperms(WHO 2010).
g) Sperm chromatin structure assessment
Chromatin structure was assessed using the toluidine blue (TB) method. Thin smears were
prepared from the raw semen and from the motile-sperm enriched fraction on pre-cleaned
defatted slides and then air dried for 30 min. Next, dried smears were fixed with freshly prepared
96% ethanol:acetone (1:1) at 4°C for 30 min and air dried. Hydrolysis was performed with 0.1 N
HCl at 4°C for 5 min followed by three changes of distilled water, 2 min each. TB (0.05% in
50% McIlvain‘s citrate phosphate buffer at pH 3.5, Gurr-BDH Chemicals Ltd, Poole, UK) was
applied for 5 min. Next, slides were then rinsed briefly in distilled water then air dried and
evaluated at high magnification under immersion oil. The TB working solution was prepared

114
monthly from a stock solution of 1% TB in distilled water and stored at 4°C. The stock solution
can be stored at 4°C up to 1 year. Two hundred randomly selected sperms per sample were
examined under high magnification. The cells were classified into two groups: dark violet cells
(TB positive cells; abnormal chromatin structure) and, light blue cells (TB negative cells; normal
chromatin structure) (Tsarev et al. 2009).
h) Histone retention assessment
Nuclear maturity was evaluated using the aniline blue staining which discriminates between
lysine-rich histones and arginine/cysteine-rich protamine. Slides were prepared by smearing 5 µl
of either raw semen or motile-sperm enriched fraction on glass slides. The slides were air-dried
and fixed for 30 minutes in 3% glutaraldehyde in phosphate-buffered saline (PBS). The smear
was dried and stained for 5 minutes in 5% aqueous aniline blue solution (pH 3.5). Sperm heads
containing high percentage of histones stain blue and those with normal histones content do not
take up the stain. The percentage of spermatozoa stained with aniline blue was determined by
counting 200 spermatozoa per slide under bright field microscopy(Le Lannou et al. 1988).
i) Sperm DNA extraction
The sperm pellets prior to freezing were subject to an osmotic shock and flash freeze shock in
liquid nitrogen for cellular lysis. In order to characterize the DNA modifications in the motile-
sperm enriched fraction, the sperm derived from the supernatant of the swim-up technique was
selected for DNA extraction. Each sample was thawed on ice and sperm DNA was subsequently
extracted. Sperm DNA was extracted using a detergent-based lysis followed by an in-column
purification using the QIAamp® DNA Mini Kit (#51304; Qiagen, The Netherlands).Briefly,
thawed pellets were lysed-in Buffer RLT (#79216; Qiagen, The Netherlands) with β-
mercaptoethanol (2%) to a final volume of 500 µL. Lysates were combined with equal volumes
of Buffer AL and 100% ethanol, loaded onto the spin columns, and the columns were
centrifuged at 6000 × g for 1 min to bind DNA. Wash and elution steps followed the
manufacturer‘s protocol, including 3 separate 200 µL elutions to maximize yield. DNA yields
and quality were determined using the Nanodrop 2000 Spectrophotometer (#E112352; Thermo
Scientific, Somerset, NJ).
j) Sperm Global DNA 5-methylcytosine (5-mC) and 5-hydroxymethylcytosine (5-hmC)
measurements
We used Methylated DNA Quantification Kit (Colorimetric) (ab117128; abcam, USA) and
Hydroxymethylated DNA Quantification kit (Colorimetric) (ab117130; abcam, USA) for the
quantification of 5-mC and 5-hmC, respectively. These enzyme-linked immunosorbent assay
(ELISA) kits are highly sensitive and accurate. The assays were performed according to the
manufacturer's recommendations. Briefly, 100ng of genomic DNA were used for 5-mC or 5-

115
hmC quantification, respectively. It is important to note that each sample was run in duplicate.
After incubation with the input DNA, the wells were washed, and a capture antibody was applied
to each well, after which the wells were again washed and detection antibody applied. Use of
enhancer solution and development solution created a color change proportional to the quantity
of 5-mC or 5-hmC, and the samples were read on an automated plate reader at 450 nm
absorbance. The relative methylation and hydroxymethylation percentages were calculated
using a simple formula provided by the manufacturer.
k) Ovarian stimulation, oocytes retrieval, and ICSI
All the women in this study underwent a controlled ovarian stimulation with antagonist protocol.
Moreover, recombinant human chorionic gonadotrophin (hCG) was administered when at least
three follicles were >17mm. Oocytes retrieval was performed 36 hours post-hCG administration.
The collected oocytes were cultured for 3 hours in Global fertilization medium (Life Global,
Canada). ICSI was performed at 39 hours post hCG administration with sperm-motile enriched
fraction post swim-up technique. Then, the zygotes were placed inside a pre-equilibrated
embryoslide (Embryoslide, Vitrolife) containing 12 wells, each filled with 25 µl of Global
medium and overlaid with 1.2 ml of culture oil (Life Global, Canada). The pre-equilibration step
was performed overnight at 37 °C under 5% CO2 (Bellver et al. 2013).
l) Embryo culture and evaluation of time-lapse images
Embryoslides containing the zygotes were placed in the Embryoscope (Vitrolife) immediately
after ICSI and cultured for 5 days with 5% CO2 and at 37°C. Images were acquired for every
embryo each 10 min at seven different focal plans. Embryo quality and morphokinetics were
analyzed using the Embryo viewer software (Vitrolife). We determined the precise timing of
pronuclei appearance (tPNa), pronuclei fading (tPNf), duration of the embryonic first cell cycle
(CC1=time to 2 cells (t2)-tPNf), second embryonic cell cycle (CC2= time to 4 cells t4 – t2), and
third embryonic cell cycle (CC3= time to 8 cells – t4) (Bellver et al. 2013). Moreover, we
calculated the fertilization rate, compaction rate, and blastulation rate per cycle (Bakos et al.
2011). In order to assess the effect of paternal obesity on blastocyst quality, we used the Gardner
and Schoolcraft grading system using numerical grades for the degree of blastocyst expansion,
trophectoderm (TE), and inner cell mass (ICM) quality (Hardarson et al. 2012).
m) Statistical analysis
All the data were statistically analyzed and graphically represented using Microsoft Office Excel
software. The error bars represent the standard error of the mean (SEM). Two-tailed Student‘s t-
test was used for the analysis of statistical significance between two groups. Also, one-way
ANOVA was used for the analysis of statistical significance between several groups. A p value
<0.05 was considered statistically significant.

116
Figure 43: The study design.

117
IV- Results
a) Characteristics of the cohort
In this study, patients were characterized into three groups according to the paternal BMI and
WC (Table 1). There were no statistically significant differences in the paternal age, tobacco
intake, alcohol consumption, and abstinence days (p>0.05) across the groups (Table 1). In
parallel, there were no differences in the maternal BMI, age, and number of MII oocytes/per
cycle (p>0.05) (Table 4). For allthethree groups, the percentage of females with polycystic
ovary, endometriosis, and tubal/pelvic disease was similar (p>0.05) (Table 4).
b) The effect of paternal obesity on the macroscopic semen parameters
For all males, assessment of the macroscopic semen characteristics was performed prior to any
treatment (Table 2). The semen volume for the obese group was significantly lower than
overweight group (p<0.05). Moreover, there was a statistically significant delayed liquefaction in
the semen of the obese group when compared to the normal weight (p<0.05) and overweight
(p<0.05) groups. In addition, a significant increase in semen viscosity was detected in the obese
group when compared to the normal weight group (p<0.05). However, there was no effect of
paternal obesity neither on the appearance nor on the pH of this biological fluid.
c) Description of the motile sprem-enriched fraction according to the paternal BMI
and WC
Sperm parameters before and after swim-up are listed in Table 3 (Figure 1). When compared to
the normal weight group, the raw semen of the obese men had a statistically significant lower
sperm concentration (60.6x10⁶/ml ± 4.80 vs41 x10
6/ml ± 4.24) (p<0.05), lower percentage of
progressive motile sperm (PR) ( 33.1 ± 1.125 vs 22.57 ± 1.48) (p<0.001), lower percentage of
non-progressive motile sperm (30.6 ± 1.24 vs 26.12 ± 1.65) (p<0.05), higher percentage of non-
motile sperm ( 36.2 ± 1.64 vs 48.8 ± 2.73) (p<0.001), reduction in the percentage of sperm with
normal morphology ( 11 ± 0.85 vs 6.56 ± 1.40) (p<0.05), and higher percentage of vacuolated
sperm ( 13 ± 1.39 vs 23.75 ± 2.35) (p<0.05).
Moreover, The raw semen of the overweight group showed lower sperm concentration
(p<0.001), lower percentage of motile sperm (p<0.001), higher percentage of non-motile sperm
(p<0.001), higher percentage of sperm with altered membrane integrity (p<0.05), and lower
normal form (p<0.05) as compared to the normal weight group.
Furthermore, the motile sperm-enriched fraction from obese men had statistically significant
differences when compared to that of normal weight group. After capacitation, obese men‘s
spermatozoa showed lower percentage of progressive motile sperm (p<0.05), higher percentage
of non-progressive motile sperm (p<0.001), and higher percentage of sperm vacuolization
(p<0.01). It is important to note that post swim-up technique there is improvement in the
majority of the assessed parameters except of sperm vacuolization which had a dramatic
increase.

118
Table 1: Characteristics of the study population according to the paternal BMI and WC
Note: Results are expressed as mean ± SEM for the BMI, WC, Age, and abstinence; and as mean
percentage for the tobacco intake and alcohol consumption.
Superscripts a (p<0.05), b (p<0.01), c (p<0.001) denote statistically significant differences when
overweight and obese groups were compared to the normal weight group.
Superscripts d (p<0.05), e (p<0.01), f (p<0.001) denote statistically significant differences when
the overweight group was compared to the obese group.

119
Table 9: Comparison between the macroscopic semen parameters according to the
paternal BMI and WC levels
Note: Data expressed as mean ± SEM. Superscripts a (p<0.05), b (p<0.01), c (p<0.001) denote
statistically significant differences when overweight and obese groups were compared to the
normal weight group.
Superscripts d (p<0.05), e (p<0.01), f (p<0.001) denote statistically significant differences when
the overweight group was compared to the obese group.

120
Table 3: Comparison between the sperm parameters in the raw semen and in the motile-
enriched fraction post swim-up technique according to paternal BMI and WC levels .
Data expressed as mean ± SEM. Superscripts denote statistically significant differences: a
(p<0.05), b (p<0.01), c (p<0.001) when the overweight and obese were compared to normal
group; d (p<0.05), e(p<0.01), f (p<0.001) when the obese group was compared to overweight
one; g (p<0.05), h (p<0.01), i (p<0.001) when the motile-enriched fraction post swim-up was
compared to the raw semen.
Figure 2: Cytological assessment of sperm membrane integrity and morphology.
(A)Figure showing the status of the sperm membrane integrity as assessed by the eosin-nigrosin
staining. Unstained (white) spermatozoa has an intact membrane, stained (pink) spermatozoa has
a loss in the membrane integrity. (B) The arrow represents a spermatozoon with a vacuole
stained by the Spermoscan Kit. Scale bar= 20µm. Magnification x100.

121
d) Higher histones retention in motile sperm-enriched fraction of obese men
In the raw semen, the percentage of sperm with high histones retention (AB+) is significantly
higher in the overweight and obese groups in comparison to the normal weight group (p< 0.001).
Interestingly, when the percentage of AB+ cells before and after swim-up was compared, a
significant decrease (p<0.05) was observed in the normal weight group, whereas no difference
was seen in the overweight (p>0.05) and obese (p>0.05) groups. Consequently, the motile-
enriched fractions of obese and overweight men present a significantly higher percentage of AB+
cells when compared to that of the normal weight group (p<0.001) (Figure 3).
Figure 44: Sperm histones retention as assessed by the aniline blue staining (AB).
(A) Light blue sperm heads show normal histones retention (AB-) and abnormal dark blue sperm
heads show abnormal histones retention (AB+). Scale bar= 20µm. Magnification x100.
(B)Histogram presenting the percentage of AB+ cells in the raw semen, and in the motile-
enriched fraction post swim-up technique of the normal weight, overweight, and obese groups.
Superscripts denote statistically significant differences: a (p<0.05), b (p<0.01), c (p<0.001) when
the overweight and obese were compared to the normal group and g (p<0.05), h (p<0.01), i
(p<0.001) when the motile-enriched fraction post swim-up was compared to the raw semen.

122
e) Altered sperm chromatin integrity in motile sperm-enriched fraction of obese men
In the raw semen, the percentage of sperm with altered chromatin integrity (TB+) is significantly
higher in the overweight and obese groups when compared to the normal weight group (p<
0.001). The levels of TB+ cells were significantly decreased in the swim-up fraction of normal
weight men (p<0.05), whereas this decrease was not observed in the overweight and obese
groups (p>0.05). Therefore, the obese and overweight men‘s motile spermatozoa present a
significantly higher percentage of TB+ cells (p<0.001) (Figure 4).
Figure 4: Sperm chromatin integrity as assessed by the toluidine blue staining (TB).
(A) Light blue sperm heads show normal chromatin integrity (TB-) and abnormal dark purple
sperm heads show abnormal chromatin integrity (TB+).Scale bar= 20µm. Magnification x100.
(B)Histogram presenting the percentage of TB+ cells in the raw semen and in the motile-
enriched fraction post swim-up technique of the normal weight, overweight, and obese groups.
Superscripts denote statistically significant differences: a (p<0.05), b (p<0.01), c (p<0.001) when
the overweight and obese were compared to the normal group; g (p<0.05), h (p<0.01), i
(p<0.001) when the motile-enriched fraction post swim-up was compared to the raw semen.

123
f) Global DNA hypomethylation in the motile sperm of obese men
Analysis of the global methylation (5-methylcytosine) of sperm DNA showed a statistically
significant decrease in the methylation status of obese men‘s sperm DNA (p<0.05). Moreover,
the levels of 5-methylcytosine were negatively correlated with the percentage of the altered
chromatin structure (r = -0.4; p = 0.028)(figure 5).
Figure 5: Assessment of the global sperm DNA methylation status.
(A) Effect of paternal obesity on the global sperm DNA methylation status (5-methylcytosine). *
Statistically significant difference with a (p <0.05).
(B) Correlation between sperm altered chromatin integrity and the sperm DNA methylation
status. Statistically significant negative correlation (R=-0.4, p=0.028) was found between these 2
parameters.
g) Global DNA hyohydroxymethylation in the motile sperm of obese men
Global hydroxymethylation (5-hydroxymethylcytosine) of DNA extracted from spermatozoa
differed significantly between normal weight and obese men (p<0.001). Interestingly, the levels
of 5-hydroxymethylcytosine were negatively correlated with the percentage of sperm histones
retention (r = -0.32; p = 0.012)(figure 6).

124
Figure 45: Assessment of the global sperm DNA hydroxymethylation status.
(A) Effect of paternal obesity on the global sperm DNA hydroxymethylation status (5-
hydroxymethylcytosine).***
Statistically significant difference with a (p <0.001).(B)
Correlation between sperm histones retention and the underlying DNA
hydroxymethylation status. Statistically significant negative correlation (R=-0.32, p=0.012)
was found between these 2 parameters.
h) The effect of paternal obesity on pre-implantation embryo morphokinetics
The time of pronuclei appearance (tPNa) was significantly shorter in the zygotes generated from
obese men when compared to that of normal weight (p<0.001) and overweight (p<0.01) groups.
In addition, statistically significant differences were detected in the mean duration of pronuclei
fading (tPNf) between overweight and normal weight groups (p<0.05) and between obese and
normal weight groups (p<0.01) (Table 5). However, the duration of the first embryonic cell
cycle (CC1) was significantly longer in the overweight (p<0.05) and obese (p<0.05) groups in
comparison with the CC1 of the normal weight group. Moreover, the second embryonic cell
cycle (CC2) was significantly delayed in the obese group in comparison with the overweight
group (p<0.05). Also, the third embryonic cell cycle (CC3) was significantly delayed in the
obese group (p<0.05) (Table 5) (Figure 7).
i) The effect of paternal obesity on embryo quality
The embryo compaction rate and blastulation rate were significantly affected by paternal BMI
and WC (Table 6). To establish whether paternal obesity may affect the blastocyst quality, the
grade of day 5 blastocysts was scored as previously described by Schoolcraft and colleagues
(Balaban et al. 2011). There were no statistically significant differences in the blastocyst
expansion degree, neither in the inner cell mass (ICM) morphology across the groups. In
contrast, a significant decrease in the trophectoderm (TE) morphology was detected in the obese
group (p<0.05) (Table 6) (Figure 8).

125
Table 4: The diagnosis of female infertility according to the paternal BMI and WC
Note: Data expressed as mean ± SEM for BMI, age, and number of MII oocytes; Data expressed
as mean percentage for the polycystic ovary, endometriosis, tubal/pelvic disease, and others.
There is no statistically significant difference between groups (p>0.05).

126
Table 5: The effect of obesity on the morphokinetic parameters of pre-implantation
embryo development
Note: Data is expressed as mean ± SEM for the time of polar body extrusion (tPB), time of
pronuclei appearance (tPNa), time of pronuclei fading (tPNf), CC1 (duration of the first cell
cycle), CC2 (duration of the second cell cycle), CC3 (duration of the third cell cycle). t2-t8
(timing of 2 to 8 cell-stages).
Superscript a(p<0.05), b(p<0.01), c(p<0.001) for significant differences between the
overweight/obese group and the normal weight group.
Superscript d(p<0.05), e (p<0.01), f (p<0.001) for significant differences between the overweight
group and the obese group.

127
Table 10: The effect of paternal obesity on the fertilization rate and the embryo
development on day 4 and 5 of culture
Note: Data is expressed as mean ± SEM for the blastocyst expansion (from 1 to 4 according to
the degree of expansion), the TE (trophectoderm A=1, B=2, C=3), ICM (inner cell mass A=1,
B=2, C=3); and as mean percentage for the fertilization, compaction, and blastulation rate.
Superscript a(p<0.05), b(p<0.01), c(p<0.001) for significant differences between the
overweight/obese group and the normal weight group. Superscript d(p<0.05), e (p<0.01), f
(p<0.001) for significant differences between the overweight group and the obese group.

128
Figure 7: The different stages of pre-implatation embryo development.
(A) Fertilized oocyte presenting, two polar bodies, two pronuclei, a cytoplasmic halo, and
enclosed in the zona pellucida. (B) embryo with 2 blastomeres. (C) embryo with 4 blastomeres.
(D) embryo with 8 blastomeres. (E) embryo during compaction. Scale bar = 100 µm.

129
Figure 8: Figure showing two blastocysts.
(A) Normal expanded blastocyst with grade A inner cell mass (purple arrow) made up of many
cells which are tightly packed, and grade A trophectoderm (yellow arrow) containing many cells
forming a cohesive layer. (B)Expnaded blastocyst with grade A inner cell mass ( purple arrow)
and grade B trophectoderm (yellow arrow) characterized by the presence of only few cells
forming a loose epithelium. Scale bar = 100 µm.
V- Discussion
Recent years have witnessed extensive research on the long-term consequences of paternal
health(at the time of conception) on the development of diseases in the offspring. For instance,
paternal age, smoking, and exposure to toxic chemicals may increase the risk of neuropsychiatric
disorders, metabolic alterations, respiratory tract infection, and cancer in the offspring (Sorahan
et al. 1997; Chang et al. 2006; Toschke et al. 2007; Fernandez-Gonzalez et al. 2008; Lin et al.
2008; Sung et al. 2008; Sartorius et al. 2010). In addition, accumulating epidemiological studies
in humans suggest that paternal body mass index (BMI) may influence the health of the next
generation (Lane et al. 2014). Interestingly, it was demonstrated that epimutations may be
present in the sperm of obese men (Soubry et al. 2016), smokers (Kim et al. 2015; Vieweg et al.
2015)and in the sperm of aged fathers (Frans et al. 2008; Miller et al. 2010; Jenkins et al. 2014).
Hence, understanding the molecular mechanisms underlying the contribution of sperm
epigenome to early embryogenesisis and to body homeostasis later in life is of paramount
importance.

130
Here, we aimed to assess the chromatin composition in the motile sperm of obese men and its
impact on pre-implantation embryo morphokinetics. Sperm chromatin is highly packed playing a
crucial role in fertilization and embryo development. Approximately, 90% of the DNA is tightly
condensed by small basic protamins; thus, inhibiting any transcriptional activity and protecting
the sperm during the transit into the female tract(Wared et al. 2010). Moreover, a recent meta-
analysis showed that abnormal sperm protamination was associated with male infertility and
sperm DNA damage(Ni et al. 2016). In contrast, the remaining 10% of the DNA are bound to
histones controlling the activation of paternal genes implicated in early embryo development.
Fascinatingly, the paternal protamins are replaced by maternal histones 2-4 hours after
fertilization; whereas, the retained histones are paternally inherited and they are not replaced
(Wared et al. 2010).
The present study shows that the raw semen of obese and overweight men had a significantly
lower concentration of spermatozoa and lower percentage of progressive and non-progressive
motile sperm when compared to that of the normal weight men; whereas, the percentage of
gametes with impaired motility, abnormal morphology, and vacuolisation was significantly
higher.
In order to select the motile sperm able to fertilize the oocyte and to achieve embryo
development, the semen was processed using the swim-up technique. After the incubation
period, the assessment of the swim-up fraction showed an improvement in the majority of the
analyzed parameters (the three types of motility, and the membrane integrity), however the
spermatozoa were subject to a dramatic increase in the vacuolisation. In parallel, the comparison
between the swim-up fraction of the three groups showed a significant decrease in the
concentration and in the progressive motility, and a significant increase in the percentage of non-
progressive and vacuolised sperm in the obese group. These findings indicate that on one hand,
the swim-up technique may improve to a certain extent the percentage of motile sperm in obese
men prior to ART.On the other hand, longer exposure of the gametes to the seminal plasma of
obese patients during the semen processing significantly increases the sperm vacuolization.It has
been demonstrated that male obesity may alter the concentrations of someseminal fluid
components, raising the question of the possible effects on sperm physiology(Binder et al. 2015).
The drawbacks of sperm vacuoles on the embryo development and pregnancy outcome are still
debatabale. Some authors have considered them as cytologic variations without pathological
significance, but other scientists have shown that vacuoles are present in sperm with fragmented
DNA, impaired mitochondrial physiology, and abnormal karyotype (Garolla et al. 2015).
Furthermore, the evaluation of histone levels in the sperm chromatin of obese men was assessed
using the aniline blue staining. Our results indicate that the percentage of motile sperm with high
histones retention is significantly reduced in the swim-up fraction of the normal weight subjects
when compared to the raw semen. However, the percentage of sperm with abnormal histones
retention is significantly elevated in the raw semen of obese men and it is not reduced after the
swim-up procedure. These findings indicate that male obesity may increase the probability of

131
transfering abnormal levels of paternal histones to the new forming zygote. Our result is
consistent with the result in a mice model of diet-induced obesity where the sperm derived from
obese father presented higher level of histone (H3) retention at genes involved in development
and cell fate decisions. The offspring of these mice had alterations in the liver gene expression
(Terashima et al. 2015).
Moreover, the swim-up technique was able to select from the raw semen of normal weight men a
sperm population with a lower percentage of altered chromatin integrity. Unfortunately, obese
and overweight subjects had a statistically significant increase in the percentage of gametes with
altered chromatin integrity in the raw semen and in the swim-up fraction.The toluidine blue
protocol allowed the staining of the sperm histones and the phosphate residues of the DNA
fragments at the same time; thus helped in the assessment of the chromatin status(Tsarev et al.
2009). Our results showed that motile sperm of obese men had high levels of sperm DNA
fragmentation and decondensed chromatin which may be responsible of low fertilization rate,
poor embryo quality, repeated failure of assisted reproductive technology attempts, and
miscarriages (Balhorn et al. 2011; Choucair et al. 2016).These data are consistent with the
findings of a recent systematic review and meta-analysis where the authors concluded that obese
men had higher percentage of sperm DNA fragmentation and reduced fertility
potential(Campbell et al. 2015).
The motile sperm-enriched fraction post swim-up was selected for the quantification of global
DNA methylation and hydroxymethylation. The 5-mC is an epigenetic mark globally associated
with gene repression (Abdallah et al. 2009). The levels of 5-methylcytosine were significantly
lower in the sperm of obese patients than normal weight ones. Also, we found a negative
correlation between the sperm DNA methylation and the altered chromatin integrity. Several
studies showed that global sperm DNA methylation was lower in patients with high seminal
reactive oxygen species and with sperm having high DNA fragmentation index, abnormal
chromatin condensation, and with reduced motility (Tunc et al. 2009; Montjean et al. 2015). In
parallel, Okas et al., demonstrated that male mice treated with DNA methylation inhibitor drug,
suffered from reduced sperm motility and inability of the demethylated paternal genome to
support embryo development(Oakes et al. 2007).
In addition, we found that the DNA in the motile sperm of obese subjects was significantly
hypohydroxymethylated when compared to the normal weight group. Plus, the levels of sperm
histone retention were negatively correlated to the 5-hmC levels. The latter is also considered as
an epigenetic mark that can regulate gene expression, and it is generated from the oxidation of
the 5-mC. This reaction is catalyzed by the TET (ten-eleven translocation) proteins
(Vasanthakumar et al. 2015). Recently, it has been demonstrated that mature human spermatozoa
of fertile men, express the TET1-3 enzymes at the mRNA and protein levels. Also, a positive
correlation exists between TET expression profile and sperm parameters. Curiously, the
downregulation of TET3 and TET2 enzymes in the sperm of infertile men may reduce the
fertilization rate and the pregnancy rate respectively after ART(Ni et al. 2016). Interestingly,

132
some metabolites generated from cellular metabolism can regulate the TET functions. For
instance, altered glucose metabolism in cancer cells may inhibit the TET activity leading to a
decrease in DNA hydroxymethylation (Vasanthakumar et al. 2015). Moreover, Delatte et al.
demonstrated that oxidative stress could also decrease the global 5-hydroxymethylcytosine
pattern in vivo and in-vitro (Delatte et al. 2015). Since obesity may affect the testicular
metabolism and the oxidative stress status (Dias et al. 2014; Rato et al. 2013), it will be
important to study the molecular mechanisms by which the testis environment in obese patients
modifies the sperm global DNA hydroxymethylation pattern.
After fertilization, the incorporated sperm undergos biochemical modifications involving the
removal of sperm nuclear envelope, decondensation of the chromatin through the reduction of
the disulfide bonds between protamines, replacement of paternal protamines by maternal
histones, and formation of the pronuclar envelope(Swain et al. 2008). In humans, the DNA in the
paternal pronucleus (PN) is hypomethylated and highly hydroxymethylated; whereas the
maternal pronuleus is hypermethylated with low levels of 5-hmC (Efimova et al. 2015). Our
morphokinetic study showed an earlier PNappearance and earlier PN fading in the obese group
than in the normal weight one. On one hand, the abnormal level of histones, the decondensed
chromatin, and the hypomethylated DNA in the sperm of obese patients could be the cause of
early PN formation and fading. On the other hand, an early PN fading was shown to be
associated decreases live birth rate (Azzarello et al. 2012). Ourfinding is in line with the result of
a recent meta-analysis showing that paternal obesity may decrease the live birth rate per ART
cycle (Campbell et al. 2015).
Following the pronuclei fading, the fertilized oocyte undergoes rapid cell division termed
cleavage, transforming the unicellular zygote to a multicellular embryo. At the third day of
development, human embryos activate their embryonic genome and consequently the paternal
and maternal genome could be expressed. During the first three embryonic cell cycles, the
blastomeres are separated from each others. After that, the activation of the embryonic genome
intercellular junctions are established between them forming a compact embryo. Next, the
compacted embryo differentiate into a blastocyst containing an expanded blastocoel, an inner
cell mass that will give rise to the fetal tissues, and a trophectoderm layer which will develop
into the placenta (Hartshorne et al. 2000; Hardarson et al. 2012). Here, we show that paternal
obesity significantly delays the duration of early embryonic cell cycles, leading to a statistically
significant decrease in the compaction rate, blastulation rate, and in the quality of the
trophectoderm layer. Similar to other studies, delayed cleavage intervals are associated with
lower embryos developping to expanded blastocysts, and lower ability to implant in the
enometrium (Dal Canto et al. 2012). Recently, the paternal influence on the early embryonic
development prior to embryonic genome activation is more investigated. Simon and colleagues
demonstrated that sperm DNA fragmention might affect the embryo quality at all the
developmental stages and may reduce the pregnancy rate (Simon et al. 2014). In parallel, animal
studies on Macaca mulatta, mice and bull showed that male factors and specifically oxidative

133
stress in the sperm might alter the cleavage divisions of the pre-implantation embryo and the
health of the offspring (Burruel et al. 2014; Lane et al. 2014; De castro et al. 2015).Moreover,
male mice with acquired obesity might negatively impact the early cleavage divisions, the
carbohydrate metabolism in the blastocysts, the gene expression in the male placentas, global
DNA hypermethylation of the female placentas, and might result in a fetal growth restriction
(FGR) (Binder et al. 2012; Binder et al. 2012; Binder et al. 2015). The FGR increases the risk of
developing obesity, and its associated co-morbidities later in life (Kanaka-Gantenbein et al.
2010).
In conclusion, this study identified alterations in the levels of sperm nucleoproteins in the swim-
up fraction of obese men. Moreover, paternal obesity was found to hypomethylate and
hypohydroxymethylate the sperm DNA probably inducing epigenetic modifications in the
embryos and the offspring. Altogether, these differences resulted in an abnormal embryo
morphokinetic and reduced blastocyst quality.

134
VI- Bibliography
1. Abdalla, Hany, Yusuke Yoshizawa, and Shinichi Hochi."Active demethylation of
paternal genome in mammalian zygotes."Journal of Reproduction and Development 55.4
(2009): 356-360.
2. Al-Quwaidhi, A. J., et al. "Trends and future projections of the prevalence of adultobesity
in SaudiArabia, 1992-2022/Tendanceset projections de la prévalence de l'obésité chez
l'adulteenArabiesaoudite, 1992-2022." Eastern Mediterranean Health Journal 20.10
(2014): 589.
3. Azzarello, A., T. Hoest, and A. L. Mikkelsen. "The impact of pronuclei morphology and
dynamicity on live birth outcome after time-lapse culture."Human reproduction (2012):
des210.
4. Bakos, Hassan W., et al. "Paternal body mass index is associated with decreased
blastocyst development and reduced live birth rates following assisted reproductive
technology." Fertility and sterility 95.5 (2011): 1700-1704.
5. Balaban, Başak, et al. "The Istanbul consensus workshop on embryo assessment:
proceedings of an expert meeting." Human Reproduction 26.6 (2011): 1270-1283.
6. Balhorn, Rod. "Sperm chromatin: an overview." Sperm Chromatin.Springer New York,
2011.3-18.
7. Bartlett, Zane. A History of Cellular Senescence and Its Relation to Stem Cells in the
Twentieth and Twenty-First Centuries.Diss. ARIZONA STATE UNIVERSITY, 2015.
8. Bellver, J., et al. "Similar morphokinetic patterns in embryos derived from obese and
normoweight infertile women: a time-lapse study." Human Reproduction 28.3 (2013):
794-800.
9. Binder, Natalie K., et al. "Male obesity is associated with changed spermatozoa Cox4i1
mRNA level and altered seminal vesicle fluid composition in a mouse model."Molecular
human reproduction (2015): gav010.
10. Binder, Natalie K., et al. "Paternal obesity in a rodent model affects placental gene
expression in a sex-specific manner."Reproduction 149.5 (2015): 435-444.
11. Binder, Natalie K., Megan Mitchell, and David K. Gardner. "Parental diet-induced
obesity leads to retarded early mouse embryo development and altered carbohydrate
utilisation by the blastocyst." Reproduction, Fertility and Development 24.6 (2012): 804-
812.

135
12. Binder, Natalie K., Natalie J. Hannan, and David K. Gardner. "Paternal diet-induced
obesity retards early mouse embryo development, mitochondrial activity and pregnancy
health." PLoS One 7.12 (2012): e52304.
13. Burruel, Victoria, et al. "Abnormal early cleavage events predict early embryo demise:
sperm oxidative stress and early abnormal cleavage." Scientific reports 4 (2014).
14. Campbell, Jared M., et al. "Paternal obesity negatively affects male fertility and assisted
reproduction outcomes: a systematic review and meta-analysis." Reproductive
biomedicine online 31.5 (2015): 593-604.
15. Chang, Jeffrey S., et al. "Parental smoking and the risk of childhood leukemia." American
journal of epidemiology 163.12 (2006): 1091-1100.
16. Choucair, Fadi B., et al. "High level of DNA fragmentation in sperm of Lebanese
infertile men using Sperm Chromatin Dispersion test." Middle East Fertility Society
Journal (2016).
17. Colaci, Daniela S., et al. "Men's body mass index in relation to embryo quality and
clinical outcomes in couples undergoing in vitro fertilization." Fertility and sterility 98.5
(2012): 1193-1199.
18. Costanian, Christy, et al. "Prevalence, correlates and management of type 2 diabetes
mellitus in Lebanon: findings from a national population-based study." Diabetes research
and clinical practice 105.3 (2014): 408-415.
19. Dal Canto, Mariabeatrice, et al. "Cleavage kinetics analysis of human embryos predicts
development to blastocyst and implantation." Reproductive biomedicine online 25.5
(2012): 474-480.
20. de Castro, Letícia S., et al. "Sperm oxidative stress is detrimental to embryo
development: a dose-dependent study model and a New and more sensitive oxidative
status evaluation." Oxidative medicine and cellular longevity 2016 (2015).
21. Delatte, Benjamin, et al. "Genome-wide hydroxymethylcytosine pattern changes in
response to oxidative stress." Scientific reports 5 (2015).
22. Dias, Tânia R., et al. "Sperm glucose transport and metabolism in diabetic
individuals."Molecular and cellular endocrinology 396.1 (2014): 37-45.
23. Donkin, Ida, et al. "Obesity and bariatric surgery drive epigenetic variation of
spermatozoa in humans." Cell metabolism 23.2 (2016): 369-378.
24. Donkin, Ida, et al. "Obesity and bariatric surgery drive epigenetic variation of
spermatozoa in humans." Cell metabolism 23.2 (2016): 369-378.

136
25. Efimova, Olga A., et al. "Chromosome hydroxymethylation patterns in human zygotes
and cleavage-stage embryos." Reproduction 149.3 (2015): 223-233.
26. Eisenberg, Michael L., et al. "The relationship between male BMI and waist
circumference on semen quality: data from the LIFE study." Human reproduction 29.2
(2014): 193-200.
27. Fernández-Gonzalez, Raúl, et al. "Long-term effects of mouse intracytoplasmic sperm
injection with DNA-fragmented sperm on health and behavior of adult offspring."Biology
of Reproduction 78.4 (2008): 761-772.
28. Frans, Emma M., et al. "Advancing paternal age and bipolar disorder." Archives of
general psychiatry 65.9 (2008): 1034-1040.
29. Fullston, T., et al. "Diet-induced paternal obesity in the absence of diabetes diminishes
the reproductive health of two subsequent generations of mice." Human reproduction
27.5 (2012): 1391-1400.
30. Fullston, Tod, et al. "Paternal obesity initiates metabolic disturbances in two generations
of mice with incomplete penetrance to the F2 generation and alters the transcriptional
profile of testis and sperm microRNA content." The FASEB Journal 27.10 (2013): 4226-
4243.
31. Garolla, Andrea, et al. "Molecular karyotyping of single sperm with nuclear vacuoles
identifies more chromosomal abnormalities in patients with testiculopathy than fertile
controls: implications for ICSI." Human Reproduction (2015): dev202.
32. Golay, A., and J. Ybarra."Link between obesity and type 2 diabetes."Best Practice &
Research Clinical Endocrinology & Metabolism 19.4 (2005): 649-663.
33. Grandjean, Valérie, et al. "RNA-mediated paternal heredity of diet-induced obesity and
metabolic disorders." Scientific reports 5 (2015).
34. Hartshorne, Geraldine. "The embryo."Human Reproduction 15.suppl 4 (2000): 31-41.
35. Jenkins, Timothy G., et al. "Age-associated sperm DNA methylation alterations: possible
implications in offspring disease susceptibility." PLoS Genet 10.7 (2014): e1004458.
36. Kaati, Gunnar, Lars O. Bygren, and SorenEdvinsson. "Cardiovascular and diabetes
mortality determined by nutrition during parents' and grandparents' slow growth period."
European Journal of Human Genetics 10.11 (2002): 682-688.
37. Kanaka‐Gantenbein, Christina. "Fetal origins of adult diabetes."Annals of the New York
Academy of Sciences 1205.1 (2010): 99-105.

137
38. Kim, Seul Ki, ByungChulJee, and Seok Hyun Kim. "Histone methylation and acetylation
in ejaculated human sperm: effects of swim-up and smoking." Fertility and sterility 103.6
(2015): 1425-1431.
39. Lane, Michelle, et al. "Oxidative stress in mouse sperm impairs embryo development,
fetal growth and alters adiposity and glucose regulation in female offspring." PLoS One
9.7 (2014): e100832.
40. Lane, Michelle, Rebecca L. Robker, and Sarah A. Robertson."Parenting from before
conception."Science 345.6198 (2014): 756-760.
41. Le Lannou, D., and Y. Blanchard."Nuclear maturity and morphology of human
spermatozoa selected by Percoll density gradient centrifugation or swim-up
procedure."Journal of reproduction and fertility 84.2 (1988): 551-556.
42. Lin, Ching-Chun, et al. "Increased risk of death with congenital anomalies in the
offspring of male semiconductor workers."International journal of occupational and
environmental health (2013).
43. Macdonald, A. A., A. W. Stewart, and C. M. Farquhar. "Body mass index in relation to
semen quality and reproductive hormones in New Zealand men: a cross-sectional study in
fertility clinics." Human Reproduction 28.12 (2013): 3178-3187.
44. McCowan, Lesley ME, et al. "Paternal contribution to small for gestational age babies: a
multicenter prospective study." Obesity 19.5 (2011): 1035-1039.
45. McPherson, Nicole O., and Michelle Lane. "Male obesity and subfertility, is it really
about increased adiposity?." Asian journal of andrology 17.3 (2014): 450-458.
46. Miller, Brian, et al. "Meta-analysis of paternal age and schizophrenia risk in male versus
female offspring." Schizophrenia bulletin 37.5 (2011): 1039-1047.
47. Montjean, D., et al. "Sperm global DNA methylation level: association with semen
parameters and genome integrity." Andrology 3.2 (2015): 235-240.
48. Nasreddine, Lara, et al. "Trends in overweight and obesity in Lebanon: evidence from
two national cross-sectional surveys (1997 and 2009)." BMC public health 12.1 (2012):
1.
49. Ng, Marie, et al. "Global, regional, and national prevalence of overweight and obesity in
children and adults during 1980–2013: a systematic analysis for the Global Burden of
Disease Study 2013." The Lancet 384.9945 (2014): 766-781.
50. Ni, K., et al. "The impact of sperm protamine deficiency and sperm DNA damage on
human male fertility: a systematic review and meta‐analysis." Andrology (2016).

138
51. Oakes, Christopher C., et al. "Adverse effects of 5-aza-2′-deoxycytidine on
spermatogenesis include reduced sperm function and selective inhibition of de novo
DNA methylation." Journal of Pharmacology and Experimental Therapeutics 322.3
(2007): 1171-1180.
52. Ogden, Cynthia L., et al. "Prevalence of childhood and adult obesity in the United States,
2011-2012." Jama 311.8 (2014): 806-814.
53. Palmer, Nicole O., et al. "SIRT6 in mouse spermatogenesis is modulated by diet-induced
obesity." Reproduction, Fertility and Development 23.7 (2011): 929-939.
54. Rato, L., et al. "High‐energy diets may induce a pre‐diabetic state altering testicular
glycolytic metabolic profile and male reproductive parameters." Andrology 1.3 (2013):
495-504.
55. Schliep, Karen C., et al. "Effect of male and female body mass index on pregnancy and
live birth success after in vitro fertilization." Fertility and sterility 103.2 (2015): 388-395.
56. Sermondade, N., et al. "BMI in relation to sperm count: an updated systematic review
and collaborative meta-analysis." Human reproduction update (2012): dms050.
57. Simon, L., et al. "Paternal influence of sperm DNA integrity on early embryonic
development." Human Reproduction (2014): deu228.
58. Sorahan, T., et al. "Childhood cancer and parental use of tobacco: deaths from 1971 to
1976." British journal of cancer 76.11 (1997): 1525.
59. Soubry, Adelheid, et al. "Obesity-related DNA methylation at imprinted genes in human
sperm: Results from the TIEGER study." Clinical epigenetics 8.1 (2016): 1.
60. Soubry, Adelheid, et al. "Obesity-related DNA methylation at imprinted genes in human
sperm: Results from the TIEGER study." Clinical epigenetics 8.1 (2016): 1.
61. Sung, Tzu‐I., Jung‐Der Wang, and Pau‐Chung Chen. "Increased risks of infant mortality
and of deaths due to congenital malformation in the offspring of male electronics
workers."Birth Defects Research Part A: Clinical and Molecular Teratology 85.2 (2009):
119-124.
62. Swain, Jason E., and Thomas B. Pool."ART failure: oocyte contributions to unsuccessful
fertilization."Human Reproduction Update 14.5 (2008): 431-446.
63. Terashima, Minoru, et al. "Effect of high fat diet on paternal sperm histone distribution
and male offspring liver gene expression." Epigenetics 10.9 (2015): 861-871.

139
64. Toschke, Audre M., et al. "Paternal smoking is associated with a decreased prevalence of
type 1 diabetes mellitus among offspring in two national British birth cohort studies
(NCDS and BCS70)." Journal of perinatal medicine 35.1 (2007): 43-47.
65. Tsarev, I., et al. "Evaluation of male fertility potential by Toluidine Blue test for sperm
chromatin structure assessment." Human reproduction 24.7 (2009): 1569-1574.
66. Tunc, O., H. W. Bakos, and K. Tremellen."Impact of body mass index on seminal
oxidative stress."Andrologia 43.2 (2011): 121-128.
67. Tunc, Ozlem, and KeltonTremellen. "Oxidative DNA damage impairs global sperm DNA
methylation in infertile men." Journal of assisted reproduction and genetics 26.9-10
(2009): 537-544.
68. vanVliet-Ostaptchouk, Jana V., et al. "The prevalence of metabolic syndrome and
metabolically healthy obesity in Europe: a collaborative analysis of ten large cohort
studies." BMC endocrine disorders 14.1 (2014): 1.
69. Vasanthakumar, Aparna, and Lucy A. Godley. "5-hydroxymethylcytosine in cancer:
significance in diagnosis and therapy." Cancer genetics 208.5 (2015): 167-177.
70. Veenendaal, Marjolein VE, et al. "Transgenerational effects of prenatal exposure to the
1944–45 Dutch famine." BJOG: An International Journal of Obstetrics &Gynaecology
120.5 (2013): 548-554.
71. Vieweg, Markus, et al. "Methylation analysis of histone H4K12ac-associated promoters
in sperm of healthy donors and subfertile patients." Clinical epigenetics 7.1 (2015): 1.
72. Vignera, Sandro, et al. "Negative effect of increased body weight on sperm conventional
and nonconventional flow cytometric sperm parameters." Journal of andrology 33.1
(2012): 53-58.
73. Volpes, Aldo, et al. "The pellet swim-up is the best technique for sperm preparation
during in vitro fertilization procedures." Journal of assisted reproduction and genetics
(2016): 1-6.
74. Ward, W. Steven. "Function of sperm chromatin structural elements in fertilization and
development." Molecular human reproduction 16.1 (2010): 30-36.
75. Wei, Yanchang, et al. "Paternally induced transgenerational inheritance of susceptibility
to diabetes in mammals." Proceedings of the National Academy of Sciences 111.5 (2014):
1873-1878.
76. Wei, Yanchang, HeideSchatten, and Qing-Yuan Sun. "Environmental epigenetic
inheritance through gametes and implications for human
reproduction."Humanreproduction update (2014): dmu061.

140
77. World Health Organization."WHO laboratory manual for the examination and processing
of human semen." (2010).

141
Chapter 3 Intergenerational and transgenerational inheritance of
paternal acquired obesity and its associated glomerulopathy and subfertility
in a mouse model
I- Abstract
The widespread concern about obesity as a medical condition that is exceeding regular dietary
measures has stimulated the extension of perspectives of the related research. This is particularly
important given that obesity is associated with significant health problem such as development of
cardiovascular disease, kidney failure, and infertility. Whereas the impact of epigenetic
inheritance of obesity on offspring health is well established, the epigenetic adaptive evolution of
HFD has not been investigated. The aim of this study is to determine whether High Fat diet
feeding in male mice over several generations impacts the metabolic health of the progeny. For
that purpose, C57BL/6 male mice were fed a high-fat diet (HFD) from weaning for up to 5
months during 5 successive generations. The resulting male offspring were raised either on a
control diet (CD6 and CD7) or on a HFD (HFD6 and HFD7).
In effect, there was a gradual increase in the total body weight (p<0.001), in the adipose tissue
volume (p<0.001), and in the amount of kilocalories intake (p<0.001) across the HFD
generations compared to the controls. In parallel, kidney histological lesions increased
progressively from one HFD generation to the other. Thus, when compared to the control group,
the seven generations of HFD male mice showed significant increase in kidney‘s glomerular
area/bowman‘s capsule ratio (p<0.001) and glomerular nuclei (p<0.001), in addition to
glomerular extracellular matrix accumulation (p<0.001), and glomerular collagen deposition
(p<0.001). Accompanying these histological changes, HFD mice showed a significant increase in
water intake (p<0.05), in urine specific gravity (p<0.05), in proteinuria (p<0.01) and ketonuria
(p<0.001). In addition, the kidney failure seems to be more severe in the HFD7 compared to the
HFD1 group with a significant increase in the proteinuria levels (p<0.05) and in the glomerular
fibrosis (p<0.001).Although the CD6 and CD7 mice had never encountered an obesogenic
environment, they were heavier (p<0.001), and their kidney glomeruli were smaller (p<0.001)
with significant increase in the glomerular collagen deposition (p<0.01) as compared to controls.
The transmission of these health cues through the male line occurred most probably via the
spermatozoa. At the sperm level, there was a gradual decrease in the percentage of sperm with
progressive motility (p<0.001) and with normal morphology (p<0.05) across the HFD
generations. At the molecular level, there was a higher histone retention and/or fragmented DNA
in the sperm of mice on HFD as compared to controls (p<0.001) and mainly in HFD7 as
compared to the HFD1 male mice (p<0.001).
These findings indicated that at each generation the offspring might retain residual effects of the
paternal obesity within their cells that could be worsened when they were re-exposed to the same
obesogenic environment.

142
II- Introduction
The body weight fluctuations may result from an imbalance between the energy intake and the
energy expenditure. Obesity is the medical condition related to the increase in the body weight
due to excessive accumulation of adipose deposits (Blundell et al. 2000; Proietto et al. 2004).
The adipose tissue of obese subjects undergoes pathological remodelling that leads to
development of several health problems (e.g., hypertension, type 2 diabetes, kidney disease, and
infertility) (Golay et al. 2005; Wozniak et al. 2009; Fulleston et al. 2012). Unfortunately, the
prevalence of obesity and its associated health comorbidities are increasing worldwide
(Nasreddine et al. et al. 2012; AL-Quwaidhi et al. 2014; Ogden et al. 2014; Vilet-Ostaptchouk et
al. 2014) urging the need of innovative medical interventions. Of particular interest, the
prevalence of obesity is high among young men of reproductive age. The accumulating
epidemiological studies in humans suggest that paternal excessive fatness may influence the
health of the subsequent generations (Campbell et al. 2015, Lane et al. 2014).
In order to decipher the mystery behind this kind of inheritance, animal models of diet-induced
obesity were developed. It was shown that male rats fed on a high fat diet (HFD), gave birth to
female offspring with pancreatic islets dysfunction (Wei et al. 2014) and to male offspring with
tubular damage in the kidney (Chowdhury et al. 2016). Moreover, it was demonstrated that
paternal acquired obesity in male mice induced metabolic disturbances and reduced the fertility
potential in two subsequent generations of mice (Fullston et al. 2013, Fullston et al. 2012). In
addition, feeding male mice with a HFD altered the levels of gene expression in the liver of the
offspring (Terashima et al. 2015) and potentially increased the susceptibility of malignant
transformation in the mammary tissue of the female offspring (Fontelles et al 2016).
The transmission of this paternal acquired pathology occurred most probably via the
spermatozoa. On one hand, it was demonstrated that the conventional semen parameters and the
fertility status could be affected in the rodents on HFD as compared to those on control diet (Mc
Pherson, 2014). On the other hand, several authors highlighted the impact of paternal acquired
obesity on the molecular composition of the mice spermatozoa. For instance, sperm RNAs
content was found to be altered in obese mice as compared to non-obese ones (Fullston et al.
2013, Binder et al. 2015, and Grandjean et al. 2015). Interestingly, microinjection of testis RNAs
from the obese mice to normal zygotes induced metabolic alterations in the offspring, indicating
a possible role of sperm RNAs in the transmission of this paternal acquired phenotype
(Grandjean et al. 2015). Compared to the sperm of normal mice, higher sperm histone 3 (H3)
retention was found on the genes involved in cell fate decision and development in obese mice
(Terashima et al. 2015). Additionally, differentially methylated regions of sperm DNA were
found in obese and diabetic rodents as compared to normal ones (Ng et al. 2010).
Furthermore, eating habits such as feeding a high fat diet (HFD) can also be inherited across
generations (Wahlqvist et al. 2014, Fullston et al. 2015). Using animal models, it was
demonstrated that kidney failure could develop in the offspring sired by malnourished mothers

143
and this phenotype could be aggravated when the offspring were also reared on an unhealthy diet
(Lioyd, 2012; Cervantes-Rodrıguez, 2014). Also, the male offspring derived from an obese
father had an exacerbated metabolic and sperm disturbances when they were re-exposed to the
same paternal HFD (Fullston, 2015). Our proposal aims to evaluate the adaptive and
evolutionary potential of non-genetic heritable mechanisms in experimentally controlled animal
models. Using a high fat diet (HFD)-induced obesity mouse model, we have examined how
feeding male mice with a high fat diet for multiple generations impacts the phenotype of the
resulting mice. Moreover, we examined whether the accumulation of epigenetic marks with an
history of multiple induction could be maintained without the inducer (here the High Fat Diet).
In this study, we will focus on the evolution of obesity-associated complications such as
glomerulopathy and subfertility.

144
III- Materials and methods
a) Animals and experimental design
All the experiments were conducted in compliance with the relevant institutional and French
animal welfare laws, guidelines, and policies. All mice (C57BL/6 background) had free access to
food and water. They were maintained at 240C on a 14-h light, 10-h dark illumination cycle. The
male mice were divided into two groups (Figure 1):
- The first group (Figure 1A): male mice were fed a high-fat diet (HFD)(SAFE-U8954
version 35(4.035kcal/g metabolizable energy)from weaning for up to 5 months during 5
successive generations. The resulting offspring were raised either on a HFD (HFD 6 and
HFD 7) or on a control diet (SAFE-A04chow diet(2.791kcal/g metabolizable energy))
(CD6 and CD7). The diets were supplied by SAFE (scientific Animal Food and
Engineering, Villmoisson-sur-orge, France).
- The second group (Figure 1B): male mice were maintained on a control diet (CD) from 3
weeks old up to 5 months during several successive generations (CD a, b, c, d).
- All the males were mated with normal females sired by normal fathers both reared on
control diet.
All assessments of sperm function and kidney histological analysis were performed blinded to
the diet group. Also, they were performed by the same person throughout the study.
Figure 46: Two pedigrees showing the high fat diet (HFD) (A) and the control diet (CD a, b,
c, d) generations (B).

145
b) Body measurements
Body weight for individual males and the amount of remaining food were measured weekly. At
the completion of 16-week-period, mice were anesthetised and scanned using a SkyScan- 1178
X-ray micro-CT system. The same scanning parameters were used for all mice: 104 m of voxel
size, 49 kV, 0.5 mm thick aluminum filter, 0.9° of rotation step. The analysis of adipose tissue
volumes was performed using NRecon and CTAn software (Skyscan)(Beranger et al. 2014).
Moreover, the body composition was assessed at euthanasia by measuring all organs weights.
c) Metabolic cage experiments
Each male mouse was placed in a metabolic cage (Tecniplast, Hohenpeissenberg, Germany) with
free access to water and food (Control (n=21), HFD1 (n=12), HFD4 (n=7), HFD5 (n=6), HFD6
(n=11), HFD7 (n=9), CD6 (n=11), and CD7 (n=9)). After 12h, the excreted urine was collected
for urinalysis. The latter was performed using urine dipstick (Combur 10 test, Roche Diagnostics
Corporation) and the standard colorimetric assay was performed according to the manufacturer‘s
instructions (Sison et al. 2010).
d) Renal histology and special stains
Freshly dissected kidneys were washed in PBS 1X, fixed in formalin for 30 min at 40C,
embedded in paraffin, and sectioned at 4µm (Sison et al. 2010). The histological evaluation of
kidney glomeruli was performed using the periodic-acid-Schiff (PAS) stain. It is a special stain
where the glycol groups of the polysaccharides, mucins, and mucosubstances are oxidized by the
periodic acid (1%) to form aldehydes. The oxidized carbohydrates are then combined with
Schiff‘s reagent to form a colored ionic structure termed as magenta. The PAS is recommended
for renal biopsies diagnosis due to basement membrane and mesangial matrix staining. Briefly,
rehydrated tissue is incubated in periodic acid (1%) solution for 5 min, washed by tap water, and
then incubated for 30 min with Schiff‘s reagent (Kiernan et al. 2010). Moreover, picrosirius red
staining was performed to evaluate the amount of collagen deposition in the glomeruli. Sirius red
is a strongly acidic dye which strongly reacts with the highly basic collagen molecules. Shortly,
rehydrated tissue is stained in weigert‘s hematoxylin for 8 min, and then stained with the
picrosirius red stain for one hour and washed by tap water (Kumar et al. 2010).
e) Quantification of renal pathology
Renal histopathology quantifications were performed using the ImageJ software. From each
mouse (5-6 mice/generation), 30 glomeruli cut at their vascular poles were selected for the
morphometrical analysis (Deji et al. 2008). The glomerular area was selected using the freehand
tool from the ImageJ menu bar and the size of the selected area was obtained by selecting the
analyse/measure icons. Similar protocol was used to determine the Bowman‘s capsule size.
Moreover, the number of nuclei inside the glomeruli was obtained via an ImageJ plug-in (cell
_counter.jar) which counted nuclei as they were manually tagged on the image. Furthermore, the
assessment of the stained areas (PAS or Sirius red staining) was possible via the selection of
Image/type/8-bit followed by the selection of Image/adjust/threshold and then the calculation of
the area percentage (Rangan et al. 2007).

146
Semen analysis
f) Assessment of sperm count and motility
At 16 weeks of age, the vas deferens and caudal epididymis were collected into 1ml pre-warmed
G-MOPS medium (Vitrolife, AB, Gothenburg, Sweden). Spermatozoa were allowed to swim-out
from the punctured vas deferens and caudal epididymis for 10 min at 37 0C before any
assessment. Sperm concentration was determined according to the world health organization
manual for the examination of human semen (WHO 2010). In addition, sperm motility was
determined from duplicate measures of 200 spermatozoa under light microscopy using 40x
magnification and expressed as a percent of motile sperm for each sample (Fullston et al. 2015).
g) Evaluation of sperm morphology
From the sperm suspended in the G-MOPS medium, 10 µl was used to prepare a smear for the
morphological examination of mouse sperm. The slides were air dried and then fixed in a
methanol-acetone (3:1) solution for 1 min. Next, the slides were stained with hematoxylin and
eosin for few seconds at room temperature. For each mouse, at least 400 spermatozoa were
examined under light microscopy using 100x magnification. The cells were classified as normal
or abnormal (hook less, banana-like, amorphous, folded, short tail, two tail and two head)
morphology (Khan et al. 2015; McPherson et al. 2016).
h) Sperm chromatin integrity
To determine the status of sperm chromatin integrity the toluidine blue test was performed.
Toluidine blue is a basic dye that shifts from blue (TB-) to dark blue or violet (TB+) upon
binding to sperm histones and/or DNA phosphate residues (Tsarev et al. 2009). Spermatozoa
were smeared, air dried, and then fixed in ethanol-acetone (1:1) for half an hour. The smears
were then hydrolyzed in HCl (0.1%) for 5 minutes followed by wash in distilled water (3 times:
2 min each). Next, they were stained in toluidine blue 0.05% (prepared with McIlvaine buffer)
for 5 min and finally washed with tap water. At least 400 spermatozoa were counted under light
microscopy 100xunder immersion oil (Pourentezar et al. 2014).
i) Statistical analysis
All the data were statistically analyzed and graphically represented using Microsoft Office Excel
software. The error bars represent the standard error of the mean (SEM). Two-tailed Student‘s t-
test was used for the analysis of statistical significance between two groups. Also, one-way
ANOVA was used for the analysis of statistical significance between several groups. A p value
<0.05 was considered statistically significant.

147
IV- Results
1- Exacerbation of the overweight phenotype and the adipose tissue volume after seven
successive generations of HFD feeding
Since no significant differences was observed in the basic physiological parameters among male
mice on control diet (CD a, b, c, d) (Figure 1B), they were combined into one control group. All
the HFD generations fed the same ―western-like diet‖; however, the body weight and the adipose
tissue volume were gradually increased in the male offspring across generations under
continuous HFD stress (p<0.001)(Figure 2a, 2b). In addition, the HFD7 group had a significant
heavier body weight and larger adipose tissue when compared to the HFD1 group at 16 weeks of
age (p<0.001)(Figure 2a, 2b).
Figure 47: The body weight and the adipose tissue volume of the different HFD and CD
groups. (a) The body weight of the HFD groups. (b)The volume of the adipose tissue of the
seven high fat diet generations. (c) The body weight of the CD6 and CD7 males.(d) The adipose
tissue volume of the CD6 and CD7 males. Data is expressed as mean ± SEM (*p<0.05,
**p<0.01, ***p<0.001).

148
2- Feeding five successive generations of male mice with a HFD negatively impacted
the body weight and the adipose tissue volume of the CD6 and the CD7 males
The CD6 and CD7 males were on a control diet and they had never encountered an obesogenic
environment (Figure 1A). Interestingly, a male line exposed during five successive generations
to a HFD significantly increased the body weight and the adipose tissue volume in the CD6
males (p<0.001) (Figure 2c, 2d). Moreover, the CD7 males generated from unexposed gametes
of the CD6 had a heavier body weight and larger adipose tissue when compared to the control
group (p<0.001) (Figure 2c, 2d). There was no statistically significant difference between the
CD6 and CD7 males.
3- Progressive alterations in the body composition after seven successive generations of
HFD feeding
In parallel to the increase in the fatness, there was a significant gradual increase in the ratio of
gonadal fat pad/the total body weight across the HFD generations (p<0.01) (Table 1). In
addition, the ratio of the liver weight/total body weight became higher at each generation
(p<0.001). The latter was significantly elevated in the HFD7 group when compared to the HFD1
one (P<0.001) (Table 1). There was no statistically significant difference in the ratio of the
kidney/body weight and testis/body weight among the HFD generations.
Table 1: Gross anatomy of the different HFD groups
Data expressed as mean ± SEM. Superscripts denote statistically significant differences: a
(p<0.05), b (p<0.01), c (p<0.001) when the HFD groups were compared to the control one; d
(p<0.05), e(p<0.01), f (p<0.001) when the HFD groups were compared among each others; g
(p<0.05), h (p<0.01), i (p<0.001) when the HFD7 generation was compared to the HFD1
generation.

149
4- The drawbacks of HFD feeding during 5 generations on the body composition of the
CD6 and CD7 males
The control group, the CD6, and the CD7 fed the same control diet but they had different body
composition. The ratio of the gonadal fat pad/body weight was significantly higher in the CD6
and CD7 males as compared to the control group (p<0.001) (Table 2).
Furthermore, the kidney/body weight ratio was lower in the CD7 when compared to the control
group (p<0.01) and to the CD6 (p<0.01) (Table 2). However, there was no statistically
significant difference in the ratio of testis/total body weight and of the liver/total body weight
between groups (Table 2).
Table 2: Gross anatomy of the different CD groups.
Data expressed as mean ± SEM. Superscripts denote statistically significant differences: a
(p<0.05), b (p<0.01), c (p<0.001) when the CD6 and CD7 groups were compared to the control
one; d (p<0.05), e (p<0.01), f (p<0.001) when the CD6 generation was compared to the CD7
one.
5- The amount of food intake in the different HFD and CD groups
The experimental groups (HFD 1 to 7) experienced a significant increase in the daily consumed
kilocalories (Kcal) when compared to that of the control group (p<0.001). Also, the amount of
food intake was different between the experimental groups: for instance it was significantly
higher in the HFD7 than HFD1 (Table 3).
Remarkably, the CD7 male mice had a higher mean of daily consumed food than the control
group (p<0.001). Compared to the CD6, the CD7 males consumed a higher amount of
kilocalories (p<0.001)(Table 4).

150
Table 3: Calories intake, water balance, and kidney physiology of different HFD groups
Data expressed as mean ± SEM. Proteinuria, glucosuria, and Ketonuria were assessed by the
urine dipsticks ((protein: 0= negative, 1= 30 mg/dl, 2= 100 mg/dl), (Glucose: 0= normal, 1= 50
mg/dl, 2= 100 mg/dl), and (ketone: 0= negative, 1= 1+, 2= 2+)).
Superscripts denote statistically significant differences: a (p<0.05), b (p<0.01), c (p<0.001) when
the HFD groups were compared to the control one; d (p<0.05), e(p<0.01), f (p<0.001) when the
HFD groups were compared between them; g (p<0.05), h (p<0.01), i (p<0.001) when the HFD7
generation was compared to the HFD1 generation.

151
Table 4: Calories intake, water balance, and kidney physiology of different CD groups
Data expressed as mean ± SEM. Proteinuria, glucosuria, and Ketonuria were assessed by the
urine dipsticks ((protein: 0= negative, 1= 30 mg/dl, 2= 100 mg/dl), (Glucose: 0= normal, 1= 50
mg/dl, 2= 100 mg/dl), and (ketone: 0= negative, 1= 1+, 2= 2+)).Superscripts denote statistically
significant differences: a (p<0.05), b (p<0.01), c (p<0.001) when the CD6 and CD7 groups were
compared to the control one; d (p<0.05), e (p<0.01), f (p<0.001) when the CD6 generation was
compared to the CD7 one.
6- The effect of the exposure to the same obesogenic environment during seven
successive generations on the water balance
The seven groups of HFD had no statistically significant difference in the amount of urine
output, but they had a significant increase in the water intake compared to the control group
(P<0.001). Additionally, the amount of consumed water was not similar between the HFD
generations. The HFD7 group had a significant increase in the water uptake than the HFD1 male
mice (p<0.05) (Table 3). In contrast, feeding five successive generations of male mice with a
HFD increased the water intake and urine output in the CD6 male offspring (p<0.01). Moreover,
this phenotype was transmitted to the CD7 male mice. Interestingly, the volume of urine output
was significantly higher in CD7 group compared to CD6 one (p<0.01) (Table 4).

152
7- Physiological adaptation of the kidney to the continuous HFD stress during several
generations
The urinalysis of the HFD groups showed a statistically significant increase in the specific
gravity (p<0.05), in the ketonuria (p<0.001), in the proteinuria (p<0.001), and in the urine acidity
(p<0.001) when compared to the control group. Also, the HFD7 generation exhibited significant
increase in the proteinuria than the HFD1 male offspring (p<0.05). However, no statistically
significant difference was detected in the glucosuria among the generations of male mice
(Table3).
Although the CD6 and CD7 generations were maintained on a control diet, they had a significant
higher level of proteinuria (p<0.01) and ketonuria (p<0.001) than the control group. The urine
specific gravity and the glucosuria were not different between the CD6, CD7, and the control
mice (Table 4).
8- The effect of exposure to HFD during successive generations on glomerular
histology
Nephron is the functional autonomous unit of the kidney which is made up of a glomerulus
containing capillaries, podocytes, mesangial cells, and extracellular matrix. Moreover, the
glomerulus is surrounded by the capsule of Bowman and it is connected to the nephron tubules
which serve in urine filtration (Figure 3a)(Berridge et al. 2012). Our results showed that at
week 16 the HFD groups demonstrated an overall increase in the ratio of the glomerulus over the
Bowman‘s capsule as compared to the control group (p<0.001) (Figure 3b). In addition, the
HFD5, HFD6, and HFD7 had a statistically significant increase in the glomerulus/capsule ratio
in comparison to HFD1 and HFD4 (p<0.05) (Figure 3b). The changes in this ratio were
contributed by an accumulation of Periodic-Acid-Schiff (PAS)-positive matrix in the mesangium
(p<0.001) and an increase of nuclei number (p<0.001) in the HFD generations as compared to
the control group (Figure 3b, 3c). Interestingly, the nuclei number was also different between
the HFD groups (p<0.05) and was significantly increased in HFD 7 when compared to that of the
HFD 1 (p<0.001) (Figure 3b). Furthermore, there was an important increase in the glomerular
matrix because the collagen fibres were significantly increased in the glomeruli of the HFD
generations compared to the control group (p<0.001) and in the HFD 7 and HFD 6 compared to
the HFD 1, HFD4, and HFD5 (p<0.001) (Figure 5a, 5b).
Fascinatingly, the glomerulus/capsule ratio in the CD6 and CD7 male mice was significantly
higher rather than that in the mice of the control group (p<0.001) (Figure 4a). Also, the
mesangial matrix area was significantly larger in the CD6 and CD7 males compared to the
controls (p<0.001) (Figure 4c). The mesangial expansion was accompanied by an increase in
collagen deposition in the extracellular matrix of the CD6 and CD7 glomeruli compared to the
control group (p<0.01) (Figure 5c). However, the number of glomerular nuclei was not
statistically different between the controls, CD6, and CD7 (p>0.05) (Figure 4b).

153
Figure 48: Feeding male mice with a HFD during seven generations alters the
glomerulus/capsule ratio and increases the matrix accumulation.
(a) Periodic-acid-Schiff staining on kidney sections from mice on control diet, HFD1, and HFD7
at 16 weeks. The arrows indicate the different histological structure of the glomerulus. Scale
bar = 25 µm, original magnification x80. Quantitative analysis of the glomeruli (n=30
glomeruli/mice and 5 mice/group) demonstrates an increase in the glomerulus/corpuscle ratio
(b), in the glomerular nuclei (c), and in the mesangial area expansion (d). *p<0.05, **p<0.01,
***p<0.001.

154
Figure 4: Quantitative analysis of the glomeruli in CD6 and CD7 males compared to the
controls at 16 weeks. These graphs demonstrate an increase in the glomerulus/capsule ratio (a)
and in the mesangial expansion of CD6 and CD7 compared to controls (c). However, the number
of glomerular nuclei is not statistically different between groups (b). ***p<0.01, NS= no
significance.

155
Figure 49: Pathological alterations in the kidney of mice on HFD (1-7) and control diet
(CD6 and CD7) at 16 weeks.
(a) Picrosirius red staining on kidney sections from control, HFD1, and HFD7 mice. Scale bar =
25 µm, original magnification x80. Quantitative analysis for glomerular fibrosis in the HFD
generations (b) and the CD generations (CD6, CD7) (c).*p<0.05, ***p<0.01, ***p<0.001.
9- The impact of the continuous exposure to a HFD stress during several generations
on the conventional semen parameters
No significant difference was found in relation to sperm concentration between the different
HFD and control diet groups (control, CD6, CD7) (Figure 6a, 6b). In contrast, the percentage of
progressive motile spermatozoa was significantly decreased in the HFD groups compared with
controls (p<0.001), and in the HFD7 compared with HFD1 (p<0.01) (Figure 7a). Moreover,
HFD feeding during successive generations had significantly reduced the percentage of
progressive motile spermatozoa in the CD6 and CD7 male offspring (p<0.001). In addition, it
had significantly increased the percentage of non-motile spermatozoa in the CD6 and CD7
generations compared with offspring sired by control diet founder males (p<0.01) (Figure 7b).
Furthermore, the sperm morphology was assessed using haematoxylin and eosin staining.
Normal mice sperm is made up of a head with a definite shape characterized by a marked hook, a
rectangular mid-piece, and single unfolded tail (Mosuro et al. 2007)(Figure 8a). The percentage
of normal sperm morphology was significantly lower in the HFD groups when compared to
controls (p<0.05) (Figure 8b). Plus, the CD7 male mice generated from unexposed gametes had
a significant lower percentage of normal morphology compared with CD6 (p<0.01) and with
control group (p<0.001) (figure 8c).
Figure 50: Graphs showing the sperm concentrations of the different HFD (a) and CD (b)
generations. Data expressed as mean ± SEM. NS= No statistically significant difference was
detected between groups.

156
Figure 51: Graphs showing the percentage of spermatozoa with progressive motility, non-
progressive motility, and the non-motile ones in the different HFD (a) and CD (b)
generations. Data expressed as mean ± SEM (*p<0.05, **p<0.01, ***p<0.001).

157
Figure 52: The normal sperm morphology percentage in the different HFD and CD groups.
Figure illustrating the normal and abnormal mice sperm morphology (a). Two graphs showing
the percentage of spermatozoa with normal morphology in the different experimental groups (b,
c). Data expressed as mean ± SEM (*p<0.05, **p<0.01, ***p<0.001). Scale bar= 20µm.
Magnification x100.
10- The changes in the sperm chromatin integrity across HFD and CD generations
Toluidine blue (TB) is a basic dye that stains phosphate residues of sperm DNA with fragmented
ends and attaches with Lysine-rich histones, so it determines both DNA fragmentation and
chromatin packaging at the same time. When it binds to the substrate, the TB shifts from blue
(TB-) to dark blue or violet (TB+) (Tsarev et al. 2009). On one hand, the percentage of TB+ cells
was significantly increased in the HFD generations compared with the controls (p<0.001). On
the other hand, the level of TB+ cells had gradually increased across the HFD generations
(p<0.001) with an exception in the HFD4. The result of the HFD4 could be caused by the small
sample size in this group (Figure 9a). Moreover, the CD6 and CD7 male mice had statistically
significant increased levels of TB+ cells (p<0.001) compared to the control group (Figure 9b).

158
Figure 53: The mean percentage of TB positive cells in the different HFD (a) and CD
groups (b). Data expressed as mean ± SEM (*p<0.05, **p<0.01, ***p<0.001).
V- Discussion
Food choices and eating habits could be shared between elders and children. Therefore, exposure
to an obesogenic environment could be intergenerationally inherited (Wahlqvist et al. 2014). In
animal models, it was demonstrated that maternal malnutrition may increase the risk of obesity
and kidney failure in the next generation. Additionally, these health problems were worsened
when the offspring were also exposed to an unhealthy diet later in life (Lioyd et al. 2012;
Cervantes-Rodrıguez et al. 2014). This finding was termed as ―second-hit phenomenon‖. In
parallel, Fullston and colleagues showed that metabolic and sperm disturbances of the male mice
sired by an obese father were exacerbated when the offspring also fed a HFD (Fullston et al.
2015). Here we aimed to assess the impact of continuous exposure of male mice during seven
generations to a HFD stress on the phenotype of the resulting mice. We focused mainly on the
evolution of the glomerulopathy and the fertility status.
Despite their genetic similarity, the seven generations of male mice which were reared on a HFD
and sired by fathers that were also on a HFD had different phenotypes at each generation. Our
results showed that there was a gradual increase in the total body weight (p<0.001), in the ratio
of gonadal fat pad/total body weight (p<0.01), and in the ratio of the liver weight/total body
weight (p<0.001) across the HFD generations. Compared to the HFD1, the HFD7 male mice had
the poorest outcomes in the total body weight (p<0.001), in the adipose tissue volume (p<0.001),
and in the liver weight/total body weight (p<0.05). These findings indicated that at each
generation the offspring might retain residual effects of the paternal nutritional imbalance within
their cells that could be worsened when they were re-exposed to the same obesogenic
environment.

159
In parallel, the analysis of the feeding behavior showed a significant increase in the daily diet
consumption in the HFD generations when compared to the control group (p<0.001). Also, there
was a statistically significant increase in the amount of food intake among the different HFD
groups (p<0.001) and specifically in the HFD7 compared to the HFD1 males (p<0.05). It was
demonstrated in mice that offspring derived from an obese mother were hyperphagic compared
to those sired by a normal weight mother(Samuelsson et al. 2008). However, the impact of
paternal obesity on the control of food intake in the offspring was underestimated in the
literature. Our findings were in line with the results of a recent study performed on Drosophila
melanogaster where the authors showed that paternal obesity increased the food intake in the
offspring (Ost et al. 2014).
Furthermore, it was confirmed in several studies that feeding C57BL/6 mice with a HFD induced
obesity and helped in the development of its associated complications such as hypertension and
type 2 diabetes (Harris et al. 2014).The kidneys of these mice presented an abnormal lipid
accumulation, glomerular lesions and fibrosis, impaired sodium handling, and increased urinary
albumin excretion. Moreover, the mRNA expression levels of the renin, the angiotensin
converting-enzyme (ACE), and the angiotensinogen were up regulated in the kidney of mice on
HFD (Kume et al. 2007; Deji et al. 2008). These molecules may be implicated in the regulation
of blood pressure (Berridge et al. 2012). The obesity-related hypertension may induce glomerular
hemodynamic alterations resulting in an increase in the renal plasma flow and in the glomerular
filtration rate (Hall et al. 2003). The consecutive activation of the renin-angiotensin system
(RAS) helps in the sodium reabsorption by the tubules to reduce its excessive loss, induces
vasoconstriction of the renal afferent arteriole to regulate the filtration rate, acts on the brain to
increase water uptake, and stimulates water retention (Berridge et al. 2012). Prolonged obesity
may lead to a severe hypertension and consequently progressive loss of the renal function(Hall et
al. 2003). In order to assess the kidney physiology of the male mice that were exposed during
seven generations to a HFD, we analysed the hydration status and the urine biochemistry of these
animals. Compared to the controls, the HFD generations had an increase in the amount of water
uptake (p<0.001), in the urine specific gravity (ions concentration in the urine) (p<0.05), in the
urine acidity (p<0.001), in the proteinuria levels (p<0.001), and in the ketonuria levels (results
from fat degradation) (p<0.001). However, the HFD groups had no statistically significant
increase in the amount of urine output (p>0.05) and in the glucosuria levels (p>0.05) when
compared to the controls. In addition, the level of proteinuria was significantly higher in the
HFD7 than the HFD1 mice indicating a more severe glomerular lesion. At the histological level,
continuous exposure to a HFD stress significantly increased the glomerulus/capsule ratio
(p<0.001), the glomerular nuclei number (p<0.001), the extracellular matrix (p<0.001), and the
glomerular collagen deposition (p<0.001) across the HFD generations. The histological lesions
were exacerbated in the HFD7 mice when compared to the HFD1 group. Interestingly, the
presence of small and condensed glomeruli, narrowed Bowman‘s space, and occluded capillary
lumen on histological sections of the kidney was also found in mice with severe hypertension
(Siddiqui et al. 2011). Altogether, these findings indicated that, probably, the increased fatness

160
across the HFD generations had gradually increased the severity of the hypertension and
subsequently accentuated the kidney lesions.
Curiously, feeding five generations of male mice with a HFD had negative impacts on the two
subsequent generations of male mice (CD6 and CD7) which were reared on a control diet.
Although the CD6 and CD7 mice had never encountered an obesogenic environment, they had
an increase in the total body weight (p<0.001), in the adipose tissue volume (p<0.001), in the
ratio of gonadal fat pad/total body weight (p<0.001), and in the amount of calories intake
(p<0.001) when compared to controls. In addition, we aimed to assess the renal physiology in the
CD6 and CD7 generations. For this reason, we collected the urine and then the kidneys from
these animals. Compared to controls, the CD6 and CD7 male mice had an increase in the amount
of water intake (p<0.01), in the urine output (p<0.01), in the proteinuria (p<0.01), in the
ketonuria (p<0.001), in the glomerular/corpuscle ratio (p<0.001), in the mesangial area
(p<0.001), and in glomerular fibrosis (p<0.01). This was the first observation of paternal
transmission of kidney disease to the future generations and could explain the transgenerational
amplification of obesity and its associated complications worldwide in humans.
The transmission of these health cues through the male line occurred most probably via the
spermatozoa. Several studies showed that male mice with acquired obesity had a lower sperm
count, impaired sperm motility, lower percentage of spermatozoa with normal morphology, and
higher percentage of sperm with fragmented DNA (Bakos et al. 2011; Chen et al. 2013; Duale et
al. 2013; Fullston et al. 2013; Vendramini et al. 2014; Zhao et al. 2014; McPherson et al. 2015).
By itself, sperm DNA fragmentation could modulate the phenotype of the next generation since
microinjection of mice oocytes using DNA-fragmented mice sperm reduced the testicular weight
and the sperm count of the male offspring (Ramos-Ibeas et al. 2014). Here we demonstrated that
continuous feeding of male mice with a HFD did not significantly affect the sperm
concentration. However, the percentage of sperm with progressive motility was progressively
reduced in the HFD groups when compared to the controls (p<0.05). Moreover, the percentage
of sperm with higher histone retention and/or fragmented DNA (TB+ cells) was significantly
higher in the HFD groups rather than the controls (p<0.001). In general, mice sperm retain
approximately 2% of their histones and they are paternally inherited (Carone et al. 2014). In
contrast, Terashima et al. demonstrated that compared to normal weight mice the sperm of obese
mice had a higher H3 (histone 3) and H3K4me1 (monomethyl Histone H3 Lysine 4) retention at
specific genes implicated in development and cell fate decision. Of particular interest, the
generated offspring had alterations in the liver gene expression (Terashima et al. 2015). Also,
Palmer and colleagues showed that male obesity inhibited the metabolic sensing protein sirtuin 6
(SIRT6) in the spermatids. The latter may be involved in the chromatin remodelling and its
decreased levels resulted in a higher H3K9ac (acetylated histone 3 Lysine 4) retention in the
spermatids of obese males compared to non-obese ones. In summary, our findings were in line
with the results of several studies that highlighted the possible role of sperm chromatin in the
non-genetic inheritance of paternal acquired pathologies (Stuppia et al. 2015).

161
Fascinatingly, the percentages of sperm with abnormal morphology, reduced motility, and
altered chromatin integrity were also higher in the CD6 and CD7 groups compared to controls.
Our results were similar to previously published reports that demonstrated that paternal obesity
might reduce the reproductive health of the offspring (Fullston et al. 2012; Fullston et al. 2015).
VI- Conclusion and perspectives
In conclusion, this is the first observation of paternal transmission of kidney disease and
infertility after successive exposure during 7 generations to an obesogenic environment. It will
be interesting to compare the health status of males sired by obese fathers and those sired by
fathers that were exposed during five generations to an obesogenic environment.
Our study suggests a role for the male germ line to capture messages from our continuous
changing environmental exposures and to transfer this information to subsequent generations.
This could have significant implications for the transgenerational amplification of obesity and
related comorbidities worldwide in humans.

162
VII- Bibliography
1. Al-Quwaidhi, A. J., et al. "Trends and future projections of the prevalence of adult
obesity in Saudi Arabia, 1992-2022/Tendances et projections de la prévalence de l'obésité
chez l'adulte en Arabie saoudite, 1992-2022." Eastern Mediterranean Health
Journal 20.10 (2014): 589.
2. Bakos, H. W., et al. "The effect of paternal diet‐induced obesity on sperm function and
fertilization in a mouse model." International journal of andrology34.5pt1 (2011): 402-
410.
3. Beranger, Guillaume E., et al. "Oxytocin reverses ovariectomy-induced osteopenia and
body fat gain." Endocrinology 155.4 (2014): 1340-1352.
4. Berridge, Michael J. "Cellular processes." Cell signalling biology 10 (2014): csb0001011.
5. Binder, Natalie K., et al. "Male obesity is associated with changed spermatozoa Cox4i1
mRNA level and altered seminal vesicle fluid composition in a mouse model." Molecular
human reproduction (2015): gav010.
6. Blundell, John E., and John Cooling. "Routes to obesity: phenotypes, food choices and
activity." British journal of nutrition 83.S1 (2000): S33-S38.
7. Carone, Benjamin R., et al. "High-resolution mapping of chromatin packaging in mouse
embryonic stem cells and sperm." Developmental cell 30.1 (2014): 11-22.
8. Cervantes-Rodriguez, M., et al. "Sugared water consumption by adult offspring of
mothers fed a protein-restricted diet during pregnancy results in increased offspring
adiposity: the second hit effect." British Journal of Nutrition 111.04 (2014): 616-624.
9. Chen, X. L., L. Z. Gong, and J. X. Xu. "Antioxidative activity and protective effect of
probiotics against high-fat diet-induced sperm damage in rats."animal 7.02 (2013): 287-
292.
10. Chowdhury, Sabiha S., et al. "Paternal High Fat Diet in Rats Leads to Renal
Accumulation of Lipid and Tubular Changes in Adult Offspring." Nutrients 8.9 (2016):
521.
11. Deji, Naoko, et al. "Structural and functional changes in the kidneys of high-fat diet-
induced obese mice." American Journal of Physiology-Renal Physiology 296.1 (2009):
F118-F126.

163
12. Deji, Naoko, et al. "Structural and functional changes in the kidneys of high-fat diet-
induced obese mice." American Journal of Physiology-Renal Physiology 296.1 (2009):
F118-F126.
13. Duale, N., et al. "Impaired sperm chromatin integrity in obese mice."Andrology 2.2
(2014): 234-243.
14. Fontelles, Camile Castilho, et al. "Paternal overweight is associated with increased breast
cancer risk in daughters in a mouse model." Scientific Reports 6 (2016).
15. Fullston, T., et al. "Diet-induced paternal obesity in the absence of diabetes diminishes
the reproductive health of two subsequent generations of mice."Human reproduction 27.5
(2012): 1391-1400.
16. Fullston, T., et al. "Diet-induced paternal obesity in the absence of diabetes diminishes
the reproductive health of two subsequent generations of mice."Human reproduction 27.5
(2012): 1391-1400.
17. Fullston, Tod, et al. "Paternal obesity induces metabolic and sperm disturbances in male
offspring that are exacerbated by their exposure to an ―obesogenic‖ diet." Physiological
reports 3.3 (2015): e12336.
18. Fullston, Tod, et al. "Paternal obesity induces metabolic and sperm disturbances in male
offspring that are exacerbated by their exposure to an ―obesogenic‖ diet." Physiological
reports 3.3 (2015): e12336.
19. Fullston, Tod, et al. "Paternal obesity initiates metabolic disturbances in two generations
of mice with incomplete penetrance to the F2 generation and alters the transcriptional
profile of testis and sperm microRNA content." The FASEB Journal 27.10 (2013): 4226-
4243.
20. Golay, A., and J. Ybarra. "Link between obesity and type 2 diabetes." Best Practice &
Research Clinical Endocrinology & Metabolism 19.4 (2005): 649-663.
21. Grandjean, Valérie, et al. "RNA-mediated paternal heredity of diet-induced obesity and
metabolic disorders." Scientific reports 5 (2015).
22. Griffin, Karen A., Holly Kramer, and Anil K. Bidani. "Adverse renal consequences of
obesity." American Journal of Physiology-Renal Physiology 294.4 (2008): F685-F696.

164
23. Hall, John E. "The kidney, hypertension, and obesity." Hypertension 41.3 (2003): 625-
633.
24. Harris, Louise E., David G. Morgan, and Nina Balthasar. "Growth hormone secretagogue
receptor deficiency in mice protects against obesity‐induced hypertension." Physiological
reports 2.3 (2014).
25. Khan, Shahanshah, et al. "Radioprotective potential of melatonin against 60 Co γ-ray-
induced testicular injury in male C57BL/6 mice." Journal of biomedical science 22.1
(2015): 1.
26. Kiernan, John A. "On chemical reactions and staining mechanisms."Connection 19.3
(2010): 127.
27. Kumar, George L., and John A. Kiernan, eds. Education Guide-Special Stains and H &
E: Pathology. Dako North America, 2010.
28. Kume, Shinji, et al. "Role of altered renal lipid metabolism in the development of renal
injury induced by a high-fat diet." Journal of the American Society of Nephrology 18.10
(2007): 2715-2723.
29. Lane, Michelle, Rebecca L. Robker, and Sarah A. Robertson. "Parenting from before
conception." Science 345.6198 (2014): 756-760.
30. Lloyd, Louise J., et al. "Protein‐energy malnutrition during early gestation in sheep blunts
fetal renal vascular and nephron development and compromises adult renal function." The
Journal of physiology 590.2 (2012): 377-393.
31. McPherson, Nicole O., and Michelle Lane. "Male obesity and subfertility, is it really
about increased adiposity?." Asian journal of andrology 17.3 (2014): 450-458.
32. McPherson, Nicole O., and Michelle Lane. "Male obesity and subfertility, is it really
about increased adiposity?." Asian journal of andrology 17.3 (2014): 450-458.
33. McPherson, Nicole O., et al. "Paternal under-nutrition programs metabolic syndrome in
offspring which can be reversed by antioxidant/vitamin food fortification in
fathers." Scientific reports 6 (2016): 27010.
34. Nasreddine, Lara, et al. "Trends in overweight and obesity in Lebanon: evidence from
two national cross-sectional surveys (1997 and 2009)." BMC public health 12.1 (2012): 1.

165
35. Ng, Sheau-Fang, et al. "Chronic high-fat diet in fathers programs [bgr]-cell dysfunction
in female rat offspring." Nature 467.7318 (2010): 963-966.
36. Ogden, Cynthia L., et al. "Prevalence of childhood and adult obesity in the United States,
2011-2012." Jama 311.8 (2014): 806-814.
37. Öst, Anita, et al. "Paternal diet defines offspring chromatin state and intergenerational
obesity." Cell 159.6 (2014): 1352-1364.
38. Pourentezari, Majid, et al. "Effects of acrylamide on sperm parameters, chromatin
quality, and the level of blood testosterone in mice." International Journal of
Reproductive BioMedicine 12.5 (2014): 335-342.
39. Proietto, Joseph, and Louise A. Baur. "10: Management of obesity." Medical journal of
Australia 180.9 (2004): 474-481.
40. Ramos-Ibeas, Priscila, et al. "Intracytoplasmic sperm injection using DNA-fragmented
sperm in mice negatively affects embryo-derived embryonic stem cells, reduces the
fertility of male offspring and induces heritable changes in epialleles." PloS one 9.4
(2014): e95625.
41. Rangan, Gopala K., and Greg H. Tesch. "Quantification of renal pathology by image
analysis (Methods in Renal Research)." Nephrology 12.6 (2007): 553-558.
42. Samuelsson, Anne-Maj, et al. "Diet-induced obesity in female mice leads to offspring
hyperphagia, adiposity, hypertension, and insulin resistance A novel murine model of
developmental programming." Hypertension 51.2 (2008): 383-392.
43. Siddiqui, Athar H., et al. "Recombinant vascular endothelial growth factor 121 attenuates
autoantibody-induced features of pre-eclampsia in pregnant mice." American journal of
hypertension 24.5 (2011): 606-612.
44. Sison, Karen, et al. "Glomerular structure and function require paracrine, not autocrine,
VEGF–VEGFR-2 signaling." Journal of the American Society of Nephrology 21.10
(2010): 1691-1701.
45. Stuppia, Liborio, et al. "Epigenetics and male reproduction: the consequences of paternal
lifestyle on fertility, embryo development, and children lifetime health." Clinical
epigenetics 7.1 (2015): 1.

166
46. Terashima, Minoru, et al. "Effect of high fat diet on paternal sperm histone distribution
and male offspring liver gene expression." Epigenetics 10.9 (2015): 861-871.
47. Tsarev, I., et al. "Evaluation of male fertility potential by Toluidine Blue test for sperm
chromatin structure assessment." Human reproduction 24.7 (2009): 1569-1574.
48. van Vliet-Ostaptchouk, Jana V., et al. "The prevalence of metabolic syndrome and
metabolically healthy obesity in Europe: a collaborative analysis of ten large cohort
studies." BMC endocrine disorders 14.1 (2014): 1.
49. Vendramini, V., et al. "Reproductive Function of the Male Obese Zucker Rats Alteration
in Sperm Production and Sperm DNA Damage."Reproductive Sciences (2013):
1933719113493511.
50. Wahlqvist, Mark L., et al. "Dietary quality of elders and children is interdependent in
Taiwanese communities: a NAHSIT mapping study."Ecology of food and nutrition 53.1
(2014): 81-97.
51. World Health Organization. "WHO laboratory manual for the examination and
processing of human semen." (2010).
52. Wozniak, Susan E., et al. "Adipose tissue: the new endocrine organ? A review
article." Digestive diseases and sciences 54.9 (2009): 1847-1856.
53. Zhao, Jian, et al. "Leptin level and oxidative stress contribute to obesity-induced low
testosterone in murine testicular tissue." Oxidative medicine and cellular longevity 2014
(2014).

167
Chapter 4 Final discussion and perspectives
The spermatozoon was considered to be simply the carrier of the paternal genome to the oocyte.
However, emerging data indicate that the sperm also deliver different molecules to the oocyte
such as, soluble factors that can orchestrate the fertilization events (e.g., phospholipase C zeta),
paternally inherited histones, covalent modifications of the DNA, and sperm-borne RNAs which
play an essential role in the regulation of embryo development (Nomikos et al. 2011; Casas et al.
2014).
Impressively, several studies showed that the lifestyle and the exposure to some environmental
factors like smoke, alcohol, and ionizing radiations might affect the male reproduction by several
ways such as impairing the sperm production, modulating the sperm epigenome (non-coding
RNAs, histones modifications, and DNA modifications), altering the embryo development, and
predisposing the offspring to several pathologies later in life (Stuppia et al. 2015).
In particular, paternal obesity has recently attracted more attention given the prevalence of
obesity among men of reproductive age and its long-term consequences on the health of the
offspring (Schagdarsurengin et al. 2016). To-date, the impact of excessive weight on male
reproduction is neither fully investigated nor well understood. Within that context, the design of
this dissertation was planned to study the drawbacks of male excessive fatness on the sperm
molecular composition to advance a step in the comprehension of this medical condition.
The first aim of this thesis was to assess the chromatin composition in the motile sperm of obese
men and its effects on pre-implantation embryo morphokinetics. The semen samples were
obtained from 96 men attending the A-clinic fertility center, Lebanon. Patients were categorized
into three groups according to their body mass index (BMI) and waist circumference (WC):
normal weight (18<BMI<24 kg/m2 and WC< 90 cm), overweight (25<BMI<29.9 kg/m
2 and
WC<102 cm), and obese (BMI>30 kg/m2 and WC >103 cm).
Firstly, the impact of obesity on the conventional semen parameters was assessed. The raw
semen of obese men was more viscous and presented a delayed liquefaction when compared to
that of normal weight men. Abnormal viscosity and delayed liquefaction time were associated
with impaired sperm motility and quality (Stephanus du Plessis et al. 2013). Moreover, sperm
concentration, the percentage of spermatozoa with progressive motility, and the percentage of
sperm with normal morphology were reduced in the obese and overweight groups as compared
to the normal weight one. After the semen processing using the swim-up technique, the motile
sperm-enriched fraction of obese men presented a lower sperm concentration, a decreased
percentage of sperm with progressive motility, and an increased percentage of vacuolated
spermatozoa when compared to the normal weight group.

168
Since the morphology and motility do not exactly reflect the molecular composition of the
spermatozoa, we set out to evaluate their nuclear components. Interestingly, we found that the
motile sperm of obese men had higher levels of retained histones, elevated percentage of
decompacted chromatin, hypomethylated DNA and hypohydroxymethylated DNA as compared
to the motile spermatozoa of normal weight men. On one hand, these results indicated that the
sperm of obese men would deliver a higher load of histones to the zygotes, probably altering the
gene expression profile in the embryos and/or in the offspring later in life (Terashima et al.
2015). In order to understand the molecular mechanisms lying behind this finding, it will be
interesting to assess in the near future which types of histones modifications are present and if
they are randomly distributed in the sperm of obese men. On the other hand, the sperm of obese
men would deliver a hypomethylated and hypohydroxymethylated DNA to the new forming
zygote. It was demonstrated that altered metabolism in cancer cells (Vasanthakumar et al.
2015)and oxidative stress (Delatte et al. 2015) could generate a hypohydroxymethylated DNA,
that is why studying the molecular mechanisms by which the testis environment in obese patients
modifies the sperm global DNA hydroxymethylation pattern is of paramount importance.
Moreover, in depth epigenomic analysis of sperm DNA methylation/hydroxymethylation in
obese men (e.g. whole genome bisulfite sequencing (WGBS), and hydroxymethylated DNA
immunoprecipitation) may help in the identification of the genes involved in the transmission of
this paternal acquired pathology.
Recently, time-lapse technology has emerged in the reproductive medicine field resulting in a
better understanding of early embryo development (Kirkegaard et al. 2013). Our study showed
for the first time that human zygotes derived from obese fathers had earlier pronuclei appearance
(PNa) and fading (PNf) as compared to those derived from fathers with a normal weight.
Subsequently, the zygotes from the obese fathers underwent slower cleavage divisions and
presented lower blastulating potential as compared to embryos derived from fathers with normal
weight. Moreover, the trophectoderm layer quality of the blastocyst was impaired in the obese
group. Remarkably, it was demonstrated that an early PNf was associated with a decreased live
birth (Azzarello et al. 2012)and a slow embryo cleavage pattern was associated with lower
embryos developing to expanded blastocysts, and lower ability to implant in the enometrium
(Dal Canto et al. 2012). Altogether, these data indicated that male obesity could affect the
molecular composition of the motile sperm nucleus and negatively impacted the preimplantation
embryo morphkinetics.
In parallel, food choices and eating habits could be inherited across generations. Interestingly,
Fullston et al., showed that metabolic and sperm disorders in the male mice sired by fathers
reared on high fat diet (HFD) were aggravated when the offspring also fed the same diet
(Fullston et al. 2015). The second aim of this work was to assess how feeding male mice with a
HFD during 7 successive generations can impact the phenotype of the resulting mice.
All the mice had the same genetic background (C57BL/6), whereas the phenotype was different
between the HFD generations. Compared to the mice on control diet, there was a gradual

169
increase in the total body weight, in the adipose tissue volume, and in the amount of kilocalories
intake across the HFD generations. Moreover, histological lesions in the glomeruli were
accentuated from one generation to the other with the glomeruli getting smaller, more
condensed, and more fibrotic. This phenotype was also found in the kidney of mice with severe
hypertension (Siddiqui et al. 2011). Additionally, Deji and colleagues showed that mRNA
expression levels of the renin, angiotensin-converting enzyme, and angiotensinogen were up-
regulated in the kidneys of HFD mice as compared to controls (Deji et al. 2008); these molecules
are implicated in the blood pressure regulation (Berridge et al. 2012). Thus, studying the
expression levels of these molecules in the kidneys of the different HFD generations will likely
give insight into the mechanism underlying the increase in the severity of kidney failure in these
animals.
Furthermore, feeding male mice with a HFD during 5 successive generations increased the total
body weight and the volume of adipose tissue in two subsequent generations of mice (CD6 and
CD7) maintained on a control diet. Although they had never fed a HFD, obesity-related
glomerulopathy was developed in the kidney of the CD6 and CD7 male mice. Altogether, these
findings indicated that at each generation, the offspring might retain residual effects of the
paternal obesity within their cells that could be worsened when they were re-exposed to the same
obesogenic environment. In order to determine whether the accumulation of epigenetic marks
with a history of multiple induction could be maintained without the inducer (here the High Fat
Diet), we are planning to compare the fertility status, adiposity, and kidney physiology in CD2
(the grandsons of an exposed grandfather), and CD5 (the grandsons of grandfathers exposed
during three generations to a HFD), and CD7 progenies.
At the sperm level, the concentration of spermatozoa was not significantly different between the
HFD groups. However, the sperm motility and morphology were negatively affected by the
paternal obesity. Interestingly, the sperm progressive motility was gradually decreased across the
HFD generations and in the CD6 and CD7 male mice when compared to controls. At the
molecular level, the sperm of obese mice had higher levels of retained histones and/or
fragmented DNA as compared to the controls. Also, these molecular aberrations were
significantly higher in the HFD7 as compared to the HFD1 group, and in the CD6 and CD7 mice
as compared to the controls. In addition, deep sequencing analysis of testis and sperm RNAs
from obese mice allowed the identification of set of differentially expressed non-coding RNAs.
Moreover, Grandjean and colleagues has showed that offspring derived from microinjection of
testis or sperm RNAs from obese male mice into a naïve zygote had metabolic disturbances.
These results indicated that the testicular RNAs could be a vector of transmission of paternal
acquired obesity (Grandjean et al. 2015). Transcriptomic analysis of spermatozoa from different
HFD generations will help in identifying the level of expression of the sperm RNAs at each
generation and in understanding how paternal obesity can affect embryo development and
offsprings‘ health later in life.

170
In conclusion, we demonstrated that the motile sperm of obese men may transfer specific
epigenetic signatures to the oocytes during fertilization and may affect the early embryo
development before and after the embryonic genome activation. Moreover, using a mice model
of diet-induced obesity, we showed that paternal obesity might affect the body composition, the
kidney physiology, and the fertility status of the offspring and these phenotypes might be
worsened when the offspring were re-exposed to the same high fat diet. Future studies focusing
on the prevention of father-to-child transmission of the acquired obesity are a cardinal need.
Bibliography
1. Azzarello, A., T. Hoest, and A. L. Mikkelsen. "The impact of pronuclei morphology and
dynamicity on live birth outcome after time-lapse culture."Human reproduction (2012):
des210.
2. Berridge, Michael J. Cell signalling biology. Portland Press
(2007): 100.
3. Binder, Natalie K., et al. "Paternal obesity in a rodent model affects placental gene
expression in a sex-specific manner." Reproduction 149.5 (2015): 435-444.
4. Casas, Eduard, and Tanya Vavouri. "Sperm epigenomics: challenges and
opportunities." Frontiers in genetics 5 (2014): 330.
5. Dal Canto, Mariabeatrice, et al. "Cleavage kinetics analysis of human embryos predicts
development to blastocyst and implantation." Reproductive biomedicine online 25.5
(2012): 474-480.
6. Deji, Naoko, et al. "Structural and functional changes in the kidneys of high-fat diet-
induced obese mice." American Journal of Physiology-Renal Physiology 296.1 (2009):
F118-F126.
7. Delatte, Benjamin, et al. "Genome-wide hydroxymethylcytosine pattern changes in
response to oxidative stress." Scientific reports 5 (2015).
8. Fullston, Tod, et al. "Paternal obesity induces metabolic and sperm disturbances in male
offspring that are exacerbated by their exposure to an ―obesogenic‖ diet." Physiological
reports 3.3 (2015): e12336.
9. Gheorghe, Ciprian P., et al. "Gene expression in the placenta: maternal stress and
epigenetic responses." The International journal of developmental biology 54.2-3 (2010):
507.

171
10. Grandjean, Valérie, et al. "RNA-mediated paternal heredity of diet-induced obesity and
metabolic disorders." Scientific reports 5 (2015).
11. Kirkegaard, Kirstine, et al. "Time-lapse parameters as predictors of blastocyst
development and pregnancy outcome in embryos from good prognosis patients: a
prospective cohort study." Human Reproduction 28.10 (2013): 2643-2651.
12. Kume, Shinji, et al. "Role of altered renal lipid metabolism in the development of renal
injury induced by a high-fat diet." Journal of the American Society of Nephrology 18.10
(2007): 2715-2723.
13. Nasreddine, Lara, et al. "Trends in overweight and obesity in Lebanon: evidence from
two national cross-sectional surveys (1997 and 2009)." BMC public health 12.1 (2012): 1.
14. Nomikos, Michail, Karl Swann, and F. Anthony Lai. "Starting a new life: Sperm
PLC‐zeta mobilizes the Ca2+ signal that induces egg activation and embryo
development." Bioessays 34.2 (2012): 126-134.
15. Schagdarsurengin, Undraga, et al. "Developmental origins of male subfertility: role of
infection, inflammation, and environmental factors."Seminars in Immunopathology. Vol.
38. No. 6. Springer Berlin Heidelberg, 2016.
16. Siddiqui, Athar H., et al. "Recombinant vascular endothelial growth factor 121 attenuates
autoantibody-induced features of pre-eclampsia in pregnant mice." American journal of
hypertension 24.5 (2011): 606-612.
17. Du Plessis, Stefan Stephanus, Sheila Gokul, and Ashok Agarwal. "Semen hyperviscosity:
causes, consequences, and cures." Front Biosci (Elite Ed) 5 (2013): 224-231.
18. Stuppia, Liborio, et al. "Epigenetics and male reproduction: the consequences of paternal
lifestyle on fertility, embryo development, and children lifetime health." Clinical
epigenetics 7.1 (2015): 1.
19. Terashima, Minoru, et al. "Effect of high fat diet on paternal sperm histone distribution
and male offspring liver gene expression." Epigenetics 10.9 (2015): 861-871.
20. Vasanthakumar, Aparna, and Lucy A. Godley. "5-hydroxymethylcytosine in cancer:
significance in diagnosis and therapy." Cancer genetics 208.5 (2015): 167-177.

172
APPENDIX

ORIGINAL ARTICLE
High level of DNA fragmentation in sperm
of Lebanese infertile men using Sperm
Chromatin Dispersion test
Fadi B. Choucaira, Eliane G. Rachkidi
a, Georges C. Raad
a, Elias M. Saliba
a,
Nina S. Zeidan b, Rania A. Jounblat a, Imad F. Abou Jaoude c, Mira M. Hazzouri a,*
aLebanese University, Faculty of Sciences 2, Fanar, LebanonbLebanese University, Faculty of Public Health, Fanar, LebanoncAbou Jaoude Hospital, Department of Obstetrics and Gynecology, Lebanon
Received 4 June 2016; accepted 15 June 2016
KEYWORDS
Sperm DNA fragmentation;
Sperm chromatin dispersion
test;
Male infertility;
Nuclear quality
Abstract Assessment of male fertility has been based on routine semen analysis established by the
World Health Organization (WHO), evaluating sperm concentration, motility and morphology.
Actually, these parameters become less reliable markers to evaluate male fertility potential.
Therefore, a search for better markers has led to an increased focus on sperm chromatin integrity
testing in fertility work-up and assisted reproductive technologies (ART). In this study, we evaluate
sperm DNA fragmentation in 185 Lebanese infertile patients attending fertility clinics all over the
country, in comparison with 30 control men of proven fertility, using the sperm chromatin disper-
sion test (SCD).
Our results showed a significantly higher sperm DNA fragmentation in infertile group compared
to control group (20.62% vs 12.96%; p< 0.001). In addition, we found that sperm DNA fragmen-
tation is correlated with alterations in sperm parameters: count, motility and morphology.
Moreover, we showed that 28% of normozoospermic patients have high sperm DNA fragmenta-
tion. Also, a positive correlation was found between sperm DNA fragmentation and ART failure
in infertile group patients. Finally, sperm DNA fragmentation is suggested to be associated with
tobacco and environmental conditions.� 2016 Middle East Fertility Society. Production and hosting by Elsevier B.V. This is an open access article
under the CC BY-NC-ND license (http://creativecommons.org/licenses/by-nc-nd/4.0/).
1. Introduction
Infertility is recognized today as a public health issue.Approximately 9% of couples worldwide suffer from fertilityproblems, and 45% of them are due to the male partner (1).
Male fertility evaluation is based primarily on routine semenanalysis, assessing sperm count, motility and morphology
* Corresponding author.
E-mail address: [email protected] (M.M. Hazzouri).
Peer review under responsibility of Middle East Fertility Society.
Production and hosting by Elsevier
Middle East Fertility Society Journal (2016) xxx, xxx–xxx
Middle East Fertility Society
Middle East Fertility Society Journal
www.mefsjournal.orgwww.sciencedirect.com
http://dx.doi.org/10.1016/j.mefs.2016.06.0051110-5690 � 2016 Middle East Fertility Society. Production and hosting by Elsevier B.V.This is an open access article under the CC BY-NC-ND license (http://creativecommons.org/licenses/by-nc-nd/4.0/).
Please cite this article in press as: Choucair FB et al. High level of DNA fragmentation in sperm of Lebanese infertile men using Sperm Chromatin Dispersion test,Middle East Fertil Soc J (2016), http://dx.doi.org/10.1016/j.mefs.2016.06.005
(2). However, 15% of patients with male factor infertilityshowed a normal semen analysis (3), thus making it insufficientto predict male fertility potential. Consequently, science is
shifting toward analyzing the molecular aspects ofspermatozoa.
The status of sperm chromatin has a great importance,
specifically in intracytoplasmic sperm injection (ICSI), wherenatural sperm selection barriers are overridden and a singlesperm cell is selected based on its morphology, regardless of
its nuclear quality (4). Several studies have shown that malefertility could be affected by sperm DNA damage; therefore,an assessment of sperm DNA content may be a useful adjunctto the routine semen analysis for a better male fertility predic-
tion (5–7). Given the evidence supporting the presence ofhighly sperm DNA damage in infertile men compared to fertileones, it is consequently postulated that fertility potential of
infertile men is negatively affected (8–16).While high levels of sperm DNA damage often correlate
with poor semen parameters such as reduced count and motil-
ity or abnormal morphology (14,17–20), it is also found ininfertile men with normal semen parameters (21–23).
In addition to the association between sperm DNA damage
and male infertility, sperm DNA fragmentation was also cor-related with high sexual chromosomes aneuploidy risk in sper-matozoa of infertile men (24–27). High sperm DNAfragmentation was also linked to a low fertilization rate and
an altered embryo quality (13,20,28–36). Moreover, previousstudies have shown that a paternal effect can be responsiblefor repeated failure of ART attempts (37–39) and some evi-
dences suggest that abnormal integrity of sperm DNA possiblyincreases miscarriages (40–44).
Lebanon has been recognized for his contribution to infer-
tility treatments within the Middle East region but the nuclearsperm quality is still ignored by most of the Lebanese clini-cians. The present study aims to explore, for the first time in
Lebanon, the nuclear quality of spermatozoa in Lebaneseinfertile men, using the sperm chromatin dispersion test(SCD). A correlative relation between sperm DNA fragmenta-tion, male infertility, semen parameters, lifestyle factors and
ART failures will also be investigated. Moreover, the studywill match the introduction of a new technique into routinesemen analysis for male infertility diagnosis and ART outcome
prediction.
2. Materials and methods
2.1. Patients
This study included 30 fertile men (control group) and 185 menpresenting to different infertility clinics (infertile group) fromdifferent regions in Lebanon between 2010 and 2013. A
detailed medical history was obtained from the participants,including reproductive history and fertility evaluation, mainlysemen analysis, ART history and lifestyle factors (smoking,professional risk of exposure to heat stress or toxicants,
antioxidant treatment). We included in the study only maleswhose partners are clinically considered fertile, which havenormal reproductive history after gynecological exam and
endocrinological testings. It is interesting to mention that the
two groups were matched at the same age range; infertilegroup: 30–45 years old, control group: 30–50 years old.
The ethics committee of the Lebanese University approved
the study protocol.
2.2. Semen analysis
The semen samples of the two groups were collected by mas-turbation into a sterile container after 2–5 days of sexual absti-nence. After complete liquefaction of the sample, semen
analysis was performed according to World HealthOrganization guidelines (2).
2.3. Sperm Chromatin dispersion (SCD) test
The SCD test is based on the principle that when spermimmersed in an agarose matrix on a slide, treated with an acidsolution to denaturate DNA, and then lysed with a buffer to
remove membranes and proteins, the result is the formationof nucleoids with a central core and a peripheral halo of dis-persed DNA loops. The dispersion halos that are observed
in sperm nuclei with non-fragmented DNA after the removalof nuclear proteins are either minimally present or not pro-duced at all in sperm nuclei with fragmented DNA. The agar-
ose matrix allows working with unfixed sperm on a slide in asuspension-like environment. Nucleoids are visualized eitherwith fluorescent microscopy after staining with a DNA specificfluorochrome (DAPI), or with bright-field microscopy with
Wright’s staining solution.SCD test protocol:In this study, we performed the SCD test as proposed and
improved by Fernandez et al., in 2005 (45), using theHalosperm� kit (INDAS laboratories, Madrid, Spain).
In brief, an aliquot of a semen sample was diluted to 10 mil-
lion/mL in phosphate-buffered saline (PBS). Gelled aliquots oflow-melting point agarose in eppendorf tubes were provided inthe kit, each one to process a semen sample. Eppendorf tubes
were placed in a water bath at 90–100 �C for 5 min to fuse theagarose, and then in a water bath at 37 �C. After 5 min of incu-bation for temperature equilibration at 37 �C, 60 mL of thediluted semen sample was added to the eppendorf tube and
mixed with the fused agarose. Of the semen–agarose mix,20 lL was pipetted onto slides pre-coated with agarose, pro-vided in the kit, and covered with a 22 � 22 mm coverslip.
The slides were placed on a cold plate in the refrigerator(4 �C) for 5 min to allow the agarose to produce a microgelwith the sperm cells embedded within. The coverslips were
gently removed and the slides immediately immersed horizon-tally in an acid solution, previously prepared by mixing 80 lLof HCl from an eppendorf tube in the kit with 10 mL of dis-
tilled water, and incubated for 7 min. The slides were horizon-tally immersed in 10 mL of the lysing solution for 25 min.After washing 5 min in a tray with abundant distilled water,the slides were dehydrated in increasing concentrations of
ethanol (70%, 90%, and 100%) for 2 min each and then air-dried. For bright field microscopy slides were horizontallycovered with a mix of Wright’s staining solution (Merck,
Darmstadt, Germany) and PBS (Merck) (1:1) for 5–10 minwith continuous airflow. Slides were briefly washed in tapwater and allowed to dry.
2 F.B. Choucair et al.
Please cite this article in press as: Choucair FB et al. High level of DNA fragmentation in sperm of Lebanese infertile men using Sperm Chromatin Dispersion test,Middle East Fertil Soc J (2016), http://dx.doi.org/10.1016/j.mefs.2016.06.005

Four dispersion patterns were defined:
1. Sperm with large halo: the halo has a 2 times larger width
than that of the sperm core, with a darker spot (spermhead) in the middle.
2. Sperm with moderate halo: having a halo size between large
and small halos.3. Sperm with small halo: a very small, clear film, that has a
halo appearance, surrounds the sperm head.
4. Sperm with no halo.
Sperm DNA fragmentation percentage (SCD percentage)was calculated as the proportion of sperm with small and no
halos, to the total sperm count per slide. We assessed twoslides for every patient, and a total of 1000 sperms werecounted per slide.
2.4. Statistical analysis
We used a Wilcoxon Rank Sum test to determine the signifi-
cance of differences in sperm DNA fragmentation ratesobtained from the infertile group and sub-groups comparedto the control. The extent and significance of correlations
between semen analysis parameters, ART outcomes, lifestylefactors and sperm DNA fragmentation rates were determinedusing Spearman Rank Correlation test. The statistical testswere performed using Sigma Stat Version 3.5 software (Systat
Software, Erkrath, Germany). Comparisons were consideredto be statistically significant at p < 0.05.
3. Results
DNA fragmentation was evaluated by SCD test in sperm of185 Lebanese infertile men in comparison with a control fertile
group.
3.1. Sperm DNA fragmentation in Lebanese infertile men
Our results have shown a DNA fragmentation rate in sperm ofinfertile group significantly higher compared to the controlgroup. The rates were distributed between 3% and 78.80%
with a mean value of 20.62% (p< 0.001) (Fig. 1).
3.2. Sperm DNA fragmentation and semen analysisabnormalities
After finding a significant difference between fertile and infer-tile men, we suggested to divide the infertile group into sub-groups, based on semen analysis characteristics, notably
sperm count, morphology and motility.Seven sub-groups were established, and compared with the
control group.
The results showed a significantly higher SCD percentage,and therefore a high sperm DNA fragmentation in the sub-groups shows altered semen analysis.
A very strong significant difference was established betweenthe control group and the OAT (oligoasthenoteratozoospermic), OA (oligoasthenozoospermic) and O (oligozoospermic)infertile sub-groups (p 6 0.001). A lower significant difference
was also found in A (asthenozoospermic) and AT (asthenoter-
atozoospermic) infertile subgroups (p= 0.025, p = 0.002). No
significant difference was noted with T (teratozoospermic) andN (normozoospermic) sub-groups (p = 0.103, p = 0.269)(Table 1).
3.3. DNA fragmentation and sperm count, motility andmorphology
Sperm DNA fragmentation rate was also plotted with sperm
count, motility and morphology.A clear negative correlation was found between SCD per-
centage and sperm count, with a very significant p value
(<0.001) and a negative correlation coefficient(rho = �0.349) (Fig. 2A). A similar negative correlation wasalso shown between SCD percentage and sperm motility
(p< 0.001; rho = �0.331) (Fig. 2B). The sperm motility andcount decrease following a sharp slope when the DNA frag-mentation rate increases. Concerning abnormal sperm mor-phology, a positive correlation was found with sperm DNA
fragmentation and teratozoospermia (p = 0.003, rho =+0.222) (Fig. 2C).
3.4. Sperm DNA fragmentation and ART failure
In our infertile group, a positive correlation was noted betweenthe number of ART failures and sperm DNA fragmentation
rate (rho = +0.352, p< 0.001) (Fig. 3).
3.5. Sperm DNA fragmentation and lifestyle
An association between sperm DNA fragmentation and life-style was then tested.
Within the infertile group, patients were identified regard-ing their exposure to heat stress or toxicants in their work as
well as if they smoked or took antioxidant treatment. In everycategory two groups were obtained, and compared to eachother according to their SCD percentages.
Figure 1 Comparison of sperm DNA fragmentation between the
infertile group and the control group, measured by SCD test.
High level of DNA fragmentation 3
Please cite this article in press as: Choucair FB et al. High level of DNA fragmentation in sperm of Lebanese infertile men using Sperm Chromatin Dispersion test,Middle East Fertil Soc J (2016), http://dx.doi.org/10.1016/j.mefs.2016.06.005

The analysis has shown a trend of positive correlation
between smoking and sperm DNA fragmentation (rho =+0.050, p = 0.606). The same trend was also found betweenrisky profession and sperm DNA fragmentation (rho =
+0.059, p= 0.704). In contrast, a trend of negative correla-tion was noted between antioxidant treatment and spermDNA fragmentation (rho = �0.079, p= 0.531).
4. Discussion
In the present study, we investigated the incidence of sperm
DNA damage among 185 infertile men, attending Lebaneseinfertility clinics for infertility evaluation and treatment. Weaimed to understand the association between sperm DNAdamage, sperm characteristics, medical history and lifestyle
factors. Although several studies have reported that spermDNA damage could be associated with male infertility. Thepresent study attempts to clarify the association between sperm
DNA damage and specific categories of defects in the Lebaneseinfertile population.
Sperm DNA fragmentation levels measured by SpermChromatin Dispersion test (SCD), were compared between
two groups of Lebanese fertile and infertile men. The infertilemen group showed a significantly higher SCD percentage;thus, higher DNA fragmentation is compared to control.Indeed, these findings reveal that the average incidence of
sperm DNA damage in fertile patients is 12.96% whereaspatients from the infertile group show significantly higher levelof sperm DNA damage (20.78%). Given that, this could pro-
vide strong evidence for a negative effect of sperm DNA frag-mentation on male fertility potential.
Our result perfectly complies with previous studies that
have reported the association between defects in sperm chro-matin and male infertility (23,25,45,46).
The group of infertile men is divided into seven sub-groups
based on semen analysis phenotypes (O, A, T, OA, AT, OAT,and N). After comparing the sperm DNA fragmentation per-centages between infertile sub-groups and control, we foundhigh rates of sperm DNA damage associated with astheno-
zoospermia, and higher rates associated with oligozoospermia,
Table 1 Sperm DNA fragmentation comparison between control group and infertile sub-groups.
Groups comparison with
control
A
n= 43
AT
n= 19
N
n= 43
O
n= 22
OA
n = 27
OAT
n= 26
T n= 5 Control group (C)
n= 30
Mean ± SD 18.76% 25.23% 15.97% 23.31% 24.54% 24.64% 20.62% 12.96%
±12.95 ±12.93 ±10.01 ±10.67 ±11.22 ±11.91 ±10.37 ±6.82
Median 14.65 23.60 12.86 20.44 21.58 24.58 23.80 12.00
Low/high values 6.88 6.94 3.16 3.00 9.24 3.67 5.78 3.54
78.80 48.34 53.17 49.27 48.11 56.64 29.69 29.45
p values 0.025 0.0022 0.269 <0.001 <0.001 <0.001 0.103
C = control group; O = oligozoospermic; A = asthenozoospermic; T = teratozoospermic; N = normozoospermic.
Figure 2A Correlation between sperm DNA fragmentation
(SCD percentage) and Sperm Count.Figure 2B Correlation between sperm DNA fragmentation
(SCD percentage) and Sperm Motility.
4 F.B. Choucair et al.
Please cite this article in press as: Choucair FB et al. High level of DNA fragmentation in sperm of Lebanese infertile men using Sperm Chromatin Dispersion test,Middle East Fertil Soc J (2016), http://dx.doi.org/10.1016/j.mefs.2016.06.005

oligoasthenozoospermia, asthenoteratozoospermia and
oligoasthenoteratozoospermia. This finding was also reportedby previous studies (21,47) and would suggest that spermDNA fragmentation could be a promising predictive indexof sperm alteration gravity, and therefore it is an important
diagnostic tool for male fertility assessment.When comparing the control group with the group of tera-
tozoospermic infertile patients, there was no significant differ-
ence (C/T: p = 0.103). It should be mentioned that this specificgroup of infertile men (T) only comprises five patients withmoderated teratozoospermia, so a larger sample size will be
needed in order to rule out significance.
In our study, the normozoospermic group does not appearto be significantly different from the control group (C/N:p= 0.269). Within this group, the mean value of SCD percent-
age (15.97%) was higher than that of the control group(12.96%). Moreover, 28% of the normozoospermic infertilepatients present a higher SCD percentage. Previous studies
mentioned that around 10% of infertile patients with normalsemen analysis showed a high degree of sperm DNA fragmen-tation (22,48), which could perfectly explain cases of male
infertility, classified as idiopathic.Besides the inter-group DNA fragmentation comparison, it
was necessary to evaluate the association between DNA frag-mentation and semen analysis parameters. The SCD percent-
age was negatively associated with sperm count and spermmotility but positively associated with abnormal sperm mor-phology (6,13,14,16,20,21,46,47,49–53). This finding suggests
that an abnormal semen analysis reflects not only an alteredspermatogenesis, but a deep negative effect on sperm nuclearquality.
As for teratozoospermia, its association with sperm DNAdamage is much debated and has been the focus of manystudies (54–57). Our study showed high SCD percentage in
infertile men with teratozoospermia. This finding is extremelyimportant, because abnormal sperm shape anomalies areeasily noticed during clinical sperm processing and help toidentify spermatozoa possibly carrying fragmented DNA.
This result emphasizes the importance of sperm selection dur-ing ICSI as the damage carried by morphologically abnormalspermatozoa, could entail nuclear chromatin defect, and thus
may affect ART outcomes such as fertilization rate, embryocleavage, development, implantation and ongoing pregnancy(33).
Furthermore, the SCD percentage shows a positive correla-tion with failed ART attempts. ART cycles appear to fail moreoften with high sperm DNA fragmentation. Our finding is con-
sistent with results from previous studies (9,35,43,58–60).Moreover, normal females whose partner had high spermDNA fragmentation, suffered from recurrent pregnancy loss(RPL) (61,62).
The present study expanded into exploring the possiblecauses of sperm DNA fragmentation. While a number of stud-ies have been conducted regarding the association between life-
style factors and sperm quality (56,63–65), studies on theLebanese population are lacking.
Different lifestyle factors were studied. A trend of a positive
correlation was observed between smoking and sperm DNAfragmentation in the Lebanese population. Smoking seems tobe associated with increased sperm DNA fragmentation.Consequently, patients aiming to conceive should be encour-
aged to reduce or even stop smoking which has already showna deleterious effect on the motility of spermatozoa and itsDNA integrity (66,67).
The impact of heat stress and toxicants on male fertility canbe elucidated by the trend of a positive correlation betweensperm DNA fragmentation and risky professions. The occupa-
tions were classified as risky when the patient is exposed in hiswork, to toxicants, or heat. Many studies confirmed the nega-tive effect of heat stress (68–70), and exposure to toxicants
(64,71,72) on sperm DNA quality.It was denoted that high sperm DNA fragmentation after
tobacco, heat and toxicants exposures, will cause testicularoxidative stress which is detrimental to sperm function
Figure 2C Correlation between sperm DNA fragmentation
(SCD percentage) and Sperm Morphology.
Figure 3 Relation between SCD percentage and ART failure.
High level of DNA fragmentation 5
Please cite this article in press as: Choucair FB et al. High level of DNA fragmentation in sperm of Lebanese infertile men using Sperm Chromatin Dispersion test,Middle East Fertil Soc J (2016), http://dx.doi.org/10.1016/j.mefs.2016.06.005

(73,74). This will be considered as a significant contributingfactor to male infertility because it leads to germ cell apoptosisand dysfunction (75–77).
On the other hand, the antioxidant treatment was found tobe negatively correlated with SCD percentage. Thus, it is con-sidered useful in preventing damage to spermatozoa and
reducing DNA fragmentation levels (78–82). This could be apromising strategy in treating male infertility linked to nuclearsperm damage.
5. Conclusion
Our study is conducted in the Lebanese population to explore
sperm DNA fragmentation. The SCD percentage is a potentialdiscriminator between fertile and infertile patients. Moreover,sperm DNA fragmentation appears to be a powerful indicator
of semen quality and ART outcomes because normal semenanalysis is not sufficient to assess male fertility. We also sug-gested that tobacco, heat stress and toxicants exposure canaffect sperm DNA integrity and we proposed the use of antiox-
idants as a treatment. The present study may serve as a plat-form for future meta-analysis studies, with a larger samplesize and more variables to consider, in order to present a more
definitive clarification about the role of sperm DNA fragmen-tation in male infertility.
Declaration of interests
The authors report no declarations of interest.
Funding
This work was funded by the National Council for Scientific
Research – Lebanon (CNRS).
References
(1) Boivin J, Bunting L, Collins J, Nygren K. International estimates
of infertility prevalence and treatment-seeking: potential need and
demand for infertility medical care. Hum Reprod
2007;22:1506–12.
(2) Organization W. WHO laboratory manual for the examination
and processing of human semen. Geneva: World Health Organi-
zation; 2010.
(3) Agarwal A, Allamaneni S. Sperm DNA damage assessment: a test
whose time has come. Fertil Steril 2005;84:850–3.
(4) Seli E. Spermatozoal nuclear determinants of reproductive
outcome: implications for ART. Human Reprod Update
2005;11:337–49.
(5) Tarozzi N, Bizzaro D, Flamigni C, Borini A. Clinical relevance of
sperm DNA damage in assisted reproduction. Reprod BioMed
Online 2007;14:746–57.
(6) Evgeni E, Charalabopoulos K, Asimakopoulos B. Human sperm
DNA fragmentation and its correlation with conventional semen
parameters. J Reprod Infert 2014;15:2.
(7) Evgeni E, Lymberopoulos G, Gazouli M, Asimakopoulos B.
Conventional semen parameters and DNA fragmentation in
relation to fertility status in a Greek population. Euro J Obst
Gynecol Reprod Biol 2015;188:17–23.
(8) Kodama H, Yamaguchi R, Fukuda J, Kasai H, Tanaka T.
Increased oxidative deoxyribonucleic acid damage in the sperma-
tozoa of infertile male patients. Fertil Steril 1997;68:519–24.
(9) Evenson D. Utility of the sperm chromatin structure assay as a
diagnostic and prognostic tool in the human fertility clinic. Hum
Reprod 1999;14:1039–49.
(10) Spano M, Bonde JP, Hjøllund HI, Kolstad HA, Cordelli E, Leter
G. Danish first pregnancy planner study team. Sperm chromatin
damage impairs human fertility. Fertil Steril 2000;73:43–50.
(11) Zini A. Correlations between two markers of sperm DNA
integrity, DNA denaturation and DNA fragmentation, in fertile
and infertile men. Fertil Steril 2001;75:674–7.
(12) Saleh R, Agarwal A, Nada E, El-Tonsy M, Sharma R, Meyer A,
et al. Negative effects of increased sperm DNA damage in relation
to seminal oxidative stress in men with idiopathic and male factor
infertility. Fertil Steril 2003;79:1597–605.
(13) Velez de la Calle J, Muller A, Walschaerts M, Clavere J, Jimenez
C, Wittemer C, et al. Sperm deoxyribonucleic acid fragmentation
as assessed by the sperm chromatin dispersion test in assisted
reproductive technology programs: results of a large prospective
multicenter study. Fertil Steril 2008;90:1792–9.
(14) Zhang L, Qiu Y, Wang K, Wang Q, Tao G, Wang L.
Measurement of sperm DNA fragmentation using bright-field
microscopy: comparison between sperm chromatin dispersion test
and terminal uridine nick-end labeling assay. Fertil Steril
2010;94:1027–32.
(15) Chi H, Chung D, Choi S, Kim J, Kim G, Lee J, et al. Integrity of
human sperm DNA assessed by the neutral comet assay and its
relationship to semen parameters and clinical outcomes for the
IVF-ET program. Clin Exp Reprod Med 2011;38:10.
(16) Venkatesh S, Kumar R, Deka D, Deecaraman M, Dada R.
Analysis of sperm nuclear protein gene polymorphisms and DNA
integrity in infertile men. Syst Biol Reprod Med 2011:1–9.
(17) Irvine S, Twigg P, Gordon L, Fulton N, Milne A, Aitken R.
DNA integrity in human spermatozoa: relationships with semen
quality. J Androl 2000;21:33–44.
(18) Muratori M, Piomboni P, Baldi E, Filimberti E, Pecchioli P,
Moretti E, Gambera L, Baccetti B, Biagiotti R, Forti G, Maggi
M. Functional and ultrastructural features of DNA-fragmented
human sperm. J Androl 2000;21:903–12.
(19) Caglar GS, Koester F, Schoepper B, Asimakopoulos B, Nehls B,
Nikolettos N, Diedrich K, Al-Hasani S. Semen DNA fragmen-
tation index, evaluated with both TUNEL and Comet assay, and
the ICSI outcome. In Vivo 2007;21:1075–80.
(20) Fang L, Lou LJ, Ye YH, Jin F, Zhou J. A study on correlation
between sperm DNA fragmentation index and age of male,
various parameters of sperm and in vitro fertilization outcome.
Zhonghua yi xue yi chuan xue za zhi= Zhonghua yixue
yichuanxue zazhi= Chinese. J Med Genet 2011;28:432–5.
(21) Varshini J, Srinag B, Kalthur G, Krishnamurthy H, Kumar P,
Rao S, et al. Poor sperm quality and advancing age are associated
with increased sperm DNA damage in infertile men. Andrologia
2011;44:642–9.
(22) Mayorga-Torres B, Cardona-Maya W, Cadavid A, Camargo M.
Evaluation of sperm functional parameters in normozoospermic
infertile individuals. Actas Urologicas Espanolas (English Edi-
tion) 2013;37:221–7.
(23) Oleszczuk K, Augustinsson L, Bayat N, Giwercman A, Bungum
M. Prevalence of high DNA fragmentation index in male partners
of unexplained infertile couples. Andrology 2012;1:357–60.
(24) Muriel L, Goyanes V, Segrelles E, Gosalvez J, Alvarez J,
Fernandez J. Increased aneuploidy rate in sperm with fragmented
dna as determined by the sperm chromatin dispersion (SCD) test
and FISH analysis. J Androl 2006;28:38–49.
(25) Qiu Y, Wang L, Zhang L, Yang D, Zhang A, Yu J. Analysis of
sperm chromosomal abnormalities and sperm DNA fragmenta-
tion in infertile males. Zhonghua yi xue yi chuan xue za zhi=
Zhonghua yixue yichuanxue zazhi= Chinese. J Med Genet
2008;25:681–5.
(26) Perrin A, Basinko A, Douet-Guilbert N, Gueganic N, Le Bris M,
Amice V, et al. Aneuploidy and DNA fragmentation in sperm of
6 F.B. Choucair et al.
Please cite this article in press as: Choucair FB et al. High level of DNA fragmentation in sperm of Lebanese infertile men using Sperm Chromatin Dispersion test,Middle East Fertil Soc J (2016), http://dx.doi.org/10.1016/j.mefs.2016.06.005

carriers of a constitutional chromosomal abnormality. Cytogenet
Geno Res 2011;133:100–6.
(27) Younes B, Hazzouri K, Chaaban M, Karam W, Jaoude I, Attieh
J, et al. High frequency of sex chromosomal disomy in sperma-
tozoa of Lebanese infertile men. J Androl 2010;32:518–23.
(28) Tesarik J. Late, but not early, paternal effect on human embryo
development is related to sperm DNA fragmentation. Hum
Reprod 2004;19(3):611–5.
(29) Meseguer M, Santiso R, Garrido N, Gil-Salom M, Remohı J,
Fernandez J. Sperm DNA fragmentation levels in testicular sperm
samples from azoospermic males as assessed by the sperm
chromatin dispersion (SCD) test. Fertil Steril 2009;92:1638–45.
(30) Simon L, Castillo J, Oliva R, Lewis S. Relationships between
human sperm protamines, DNA damage and assisted reproduc-
tion outcomes. Reprod BioMed Online 2011;23:724–34.
(31) Avendano C, Oehninger S. DNA fragmentation in morpholog-
ically normal spermatozoa: how much should we be concerned in
the ICSI Era? J Androl 2010;32:356–63.
(32) Zini A, Jamal W, Cowan L, Al-Hathal N. Is sperm dna damage
associated with IVF embryo quality? A systematic review. J Assist
Reprod Genet 2011;28:391–7.
(33) Simon L, Murphy K, Shamsi M, Liu L, Emery B, Aston K, et al.
Paternal influence of sperm DNA integrity on early embryonic
development. Hum Reprod 2014;29:2402–12.
(34) Tandara M, Bajic A, Tandara L, Bilic-Zulle L, Sunj M, Kozina V,
et al. Sperm DNA integrity testing: big halo is a good predictor of
embryo quality and pregnancy after conventional IVF. Androl-
ogy 2014;2:678–86.
(35) Sivanarayana T, Ravi Krishna C, Jaya Prakash G, Krishna K,
Madan K, Sudhakar G, et al. Sperm DNA fragmentation assay
by sperm chromatin dispersion (SCD): correlation between DNA
fragmentation and outcome of intracytoplasmic sperm injection.
Reprod Med Biol 2013;13:87–94.
(36) Lazaros L, Vartholomatos G, Pamporaki C, Kosmas I, Takenaka
A, Makrydimas G, Sofikitis N, Stefos T, Zikopoulos K, Hatzi E,
Georgiou I. Sperm flow cytometric parameters are associated with
ICSI outcome. Reprod Biomed online 2013;26:611–8.
(37) Parinaud J, Mieusset R, Vieitez G, Labal B, Richoilley G.
Influence of sperm parameters on embryo quality. Fertil Steril
1993;60:888–92.
(38) Janny L, Menezo Y. Evidence for a strong paternal effect on
human preimplantation embryo development and blastocyst
formation. Mol Reprod Dev 1994;38:36–42.
(39) Shoukir Y, Chardonnens D, Campana A, Sakkas D. Blastocyst
development from supernumerary embryos after intracytoplasmic
sperm injection: a paternal influence? Hum Reprod
1998;13:1632–7.
(40) Carrell DT, Liu L, Peterson CM, Jones KP, Hatasaka HH,
Erickson L, Campbell B. Sperm DNA fragmentation is increased
in couples with unexplained recurrent pregnancy loss. Arch
Androl 2003;49:49–55.
(41) Borini A, Tarozzi N, Bizzaro D, Bonu M, Fava L, Flamigni C,
et al. Sperm DNA fragmentation: paternal effect on early post-
implantation embryo development in ART. Hum Reprod
2006;21:2876–81.
(42) Gil-Villa A, Cardona-Maya W, Agarwal A, Sharma R, Cadavid
A. Assessment of sperm factors possibly involved in early
recurrent pregnancy loss. Fertil Steril 2010;94:1465–72.
(43) Absalan F, Ghannadi A, Kazerooni M, Parifar R, Jamalzadeh F,
Amiri S. Value of sperm chromatin dispersion test in couples with
unexplained recurrent abortion. J Assist Reprod Genet
2011;29:11–4.
(44) AlKusayer G, Amily N, Abou-Setta A, Bedaiwy M. Live birth
rate following IVF/ICSI in patients with sperm DNA fragmen-
tation: a systematic review and meta-analysis. Fertil Steril
2014;102:e305.
(45) Fernandez JL, Muriel L, Goyanes V, Segrelles E, Gosalvez J,
Enciso M, LaFromboise M, De Jonge C. Simple determination of
human sperm DNA fragmentation with an improved sperm
chromatin dispersion test. Fertil Steril 2005;84:833–42.
(46) Shamsi M, Imam S, Dada R. Sperm DNA integrity assays:
diagnostic and prognostic challenges and implications in man-
agement of infertility. J Assist Reprod Genet 2011;28:1073–85.
(47) Belloc S, Benkhalifa M, Cohen-Bacrie M, Dalleac A, Chahine H,
Amar E, et al. Which isolated sperm abnormality is most related
to sperm DNA damage in men presenting for infertility evalua-
tion. J Assist Reprod Genet 2014;31:527–32.
(48) Khodair H, Omran T. Evaluation of reactive oxygen species
(ROS) and DNA integrity assessment in cases of idiopathic male
infertility. Egypt J Dermatol Venerol 2013;33:51.
(49) Trisini A, Singh N, Duty S, Hauser R. Relationship between
human semen parameters and deoxyribonucleic acid damage
assessed by the neutral comet assay. Fertil Steril 2004;82:1623–32.
(50) Cohen-Bacrie P, Belloc S, Menezo Y, Clement P, Hamidi J,
Benkhalifa M. Correlation between DNA damage and sperm
parameters: a prospective study of 1633 patients. Fertil Steril
2009;91:1801–5.
(51) Varghese A, Bragais F, Mukhopadhyay D, Kundu S, Pal M,
Bhattacharyya A, et al. Human sperm DNA integrity in normal
and abnormal semen samples and its correlation with sperm
characteristics. Andrologia 2009;41:207–15.
(52) Matsuura R, Takeuchi T, Yoshida A. Preparation and incubation
conditions affect the DNA integrity of ejaculated human
spermatozoa. Asian J Androl 2010;12:753–9.
(53) Curti G, Canepa M, Cantu L, Montes J. Diagnosis of male
infertility: a need of functional and chromatin evaluation. Actas
Urologicas Espanolas (English Edition) 2013;37:100–5.
(54) Avendano C, Franchi A, Taylor S, Morshedi M, Bocca S,
Oehninger S. Fragmentation of DNA in morphologically normal
human spermatozoa. Fertil Steril 2009;91:1077–84.
(55) Avendano C, Franchi A, Duran H, Oehninger S. DNA fragmen-
tation of normal spermatozoa negatively impacts embryo quality
and intracytoplasmic sperm injection outcome. Fertil Steril
2010;94:549–57.
(56) Elshal M, El-Sayed I, Elsaied M, El-Masry S, Kumosani T.
Sperm head defects and disturbances in spermatozoal chromatin
and DNA integrities in idiopathic infertile subjects: association
with cigarette smoking. Clin Biochem 2009;42:589–94.
(57) Mehdi M, Khantouche L, Ajina M, Saad A. Detection of DNA
fragmentation in human spermatozoa: correlation with semen
parameters. Andrologia 2009;41:383–6.
(58) Duran E. Sperm DNA quality predicts intrauterine insemination
outcome: a prospective cohort study. Hum Reprod
2002;17:3122–8.
(59) Speyer B, Pizzey A, Ranieri M, Joshi R, Delhanty J, Serhal P. Fall
in implantation rates following ICSI with sperm with high DNA
fragmentation. Hum Reprod 2010;25:1609–18.
(60) Jiang H, He R, Wang C, Zhu J. The relationship of sperm DNA
fragmentation index with the outcomes of in-vitro fertilisation-
embryo transfer and intracytoplasmic sperm injection. J Obstet
Gynaecol 2011;31:636–9.
(61) Ribas-Maynou J, Garcıa-Peiro A, Fernandez-Encinas A, Amen-
gual M, Prada E, Cortes P, et al. Double stranded sperm DNA
breaks, measured by Comet assay, are associated with unex-
plained recurrent miscarriage in couples without a female factor.
PLoS ONE 2012;7:e44679.
(62) Robinson L, Gallos I, Conner S, RajkhowaM, Miller D, Lewis S,
et al. The effect of sperm DNA fragmentation on miscarriage
rates: a systematic review and meta-analysis. Hum Reprod
2012;27:2908–17.
(63) Soares S, Melo M. Cigarette smoking and reproductive function.
Curr Opin Obstet Gynecol 2008;20:281–91.
(64) Calogero A, La Vignera S, Condorelli R, Perdichizzi A, Valenti
D, Asero P, et al. Environmental car exhaust pollution damages
human sperm chromatin and DNA. J Endocrinol Invest 2010;34:
e139–43.
High level of DNA fragmentation 7
Please cite this article in press as: Choucair FB et al. High level of DNA fragmentation in sperm of Lebanese infertile men using Sperm Chromatin Dispersion test,Middle East Fertil Soc J (2016), http://dx.doi.org/10.1016/j.mefs.2016.06.005

(65) Viloria T, Meseguer M, Martınez-Conejero J, O’Connor J,
Remohı J, Pellicer A, et al. Cigarette smoking affects specific
sperm oxidative defenses but does not cause oxidative DNA
damage in infertile men. Fertil Steril 2010;94:631–7.
(66) Sepaniak S, Forges T, Gerard H, Foliguet B, Bene M, Monnier-
Barbarino P. The influence of cigarette smoking on human sperm
quality and DNA fragmentation. Toxicology 2006;223:54–60.
(67) Anifandis G, Bounartzi T, Messini C, Dafopoulos K, Sotiriou S,
Messinis I. The impact of cigarette smoking and alcohol
consumption on sperm parameters and sperm DNA fragmenta-
tion (SDF) measured by Halosperm�. Arch Gynecol Obstet
2014;290:777–82.
(68) Paul C, Murray A, Spears N, Saunders P. A single, mild, transient
scrotal heat stress causes DNA damage, subfertility and impairs
formation of blastocysts in mice. Reproduction 2008;136
(1):73–84.
(69) Kanter M, Aktas C, Erboga M. Heat stress decreases testicular
germ cell proliferation and increases apoptosis in short term: an
immunohistochemical and ultrastructural study. Toxicol Ind
Health 2011;29(2):99–113.
(70) Santiso R, Tamayo M, Gosalvez J, Johnston S, Marino A,
Fernandez C, et al. DNA fragmentation dynamics allows the
assessment of cryptic sperm damage in human: evaluation of
exposure to ionizing radiation, hyperthermia, acidic pH and nitric
oxide. Mutat Res/Funda Mol Mech Mutag 2012;734:41–9.
(71) Gomes M, Goncalves A, Rocha E, Sa R, Alves A, Silva J, et al.
Effect of in vitro exposure to lead chloride on semen quality and
sperm DNA fragmentation. Zygote 2014;23:384–93.
(72) Hosseinpour E, Shahverdi A, Parivar K, Sedighi Gilani M, Nasr-
Esfahani M, Salman Yazdi R, et al. Sperm ubiquitination and
DNA fragmentation in men with occupational exposure and
varicocele. Andrologia 2013;46:423–9.
(73) Cocuzza M, Sikka S, Athayde K, Agarwal A. Clinical relevance
of oxidative stress and sperm chromatin damage in male
infertility: an evidence based analysis. Int Braz J Urol
2007;33:603–21.
(74) Tremellen K. Oxidative stress and male infertility–a clinical
perspective. Human Reprod Update 2008;14:243–58.
(75) Sakkas D, Mariethoz E, St. John J. Abnormal sperm parameters
in humans are indicative of an abortive apoptotic mechanism
linked to the fas-mediated pathway. Exp Cell Res 1999;251:350–5.
(76) Sakkas D. Nature of DNA damage in ejaculated human
spermatozoa and the possible involvement of apoptosis. Biol
Reprod 2002;66:1061–7.
(77) Novotny J, Aziz N, Rybar R, Brezinova J, Kopecka V,
Filipcikova R, Reruchova M, Oborna I. Relationship between
reactive oxygen species production in human semen and sperm
DNA damage assessed by Sperm Chromatin Structure Assay.
Biomed Papers 2013;157:383–6.
(78) Greco E. Reduction of the incidence of sperm DNA fragmenta-
tion by oral antioxidant treatment. J Androl 2005;26:349–53.
(79) Greco E. ICSI in cases of sperm DNA damage: beneficial effect of
oral antioxidant treatment. Hum Reprod 2005;20:2590–4.
(80) Menezo Y, Hazout A, Panteix G, Robert F, Rollet J, Cohen-
Bacrie P, et al. Antioxidants to reduce sperm DNA fragmenta-
tion: an unexpected adverse effect. Reprod BioMed Online
2007;14:418–21.
(81) Abad C, Amengual M, Gosalvez J, Coward K, Hannaoui N,
Benet J, et al. Effects of oral antioxidant treatment upon the
dynamics of human sperm DNA fragmentation and subpopula-
tions of sperm with highly degraded DNA. Andrologia
2012;45:211–6.
(82) Talevi R, Barbato V, Fiorentino I, Braun S, Longobardi S,
Gualtieri R. Protective effects of in vitro treatment with zinc, d-
aspartate and coenzyme q10 on human sperm motility, lipid
peroxidation and DNA fragmentation. Reprod Biol Endocrinol
2013;11:81.
8 F.B. Choucair et al.
Please cite this article in press as: Choucair FB et al. High level of DNA fragmentation in sperm of Lebanese infertile men using Sperm Chromatin Dispersion test,Middle East Fertil Soc J (2016), http://dx.doi.org/10.1016/j.mefs.2016.06.005