Conservation Strategy for the Grizzly Bear in the Northern ...
1
ARTICLE / DISCOVERIES SECTION
Title: Brown and polar bear Y chromosomes reveal extensive male-biased gene flow
within brother lineages
Authors and affiliations: Tobias Bidon1,*, Axel Janke1,2, Steven R. Fain3, Hans Geir Eiken4,
Snorre B. Hagen4, Urmas Saarma5, Björn M. Hallström1,6, Nicolas Lecomte7, Frank Hailer1,*
1 Biodiversity and Climate Research Centre (BiK-F), 60325 Frankfurt am Main, Germany
2 Goethe University Frankfurt, Institute for Ecology, Evolution & Diversity, 60439 Frankfurt am Main,
Germany
3 National Fish and Wildlife Forensic Laboratory, Ashland, OR 97520, USA
4 Bioforsk, Norwegian Institute for Agricultural and Environmental Research, 9925 Svanvik, Norway
5 Department of Zoology, Institute of Ecology and Earth Sciences, University of Tartu, 51014, Tartu,
Estonia
6 Science for Life Laboratory, School of Biotechnology, KTH, 104 50 Stockholm, Sweden
7 Canada Research Chair in Polar and Boreal Ecology, Department of Biology, University of Moncton,
E1A 3E9 Moncton, Canada
* Corresponding authors: Tobias Bidon & Frank Hailer, Biodiversity and Climate Research
Centre (BiK-F), Senckenberg Gesellschaft für Naturforschung, Senckenberganlage 25, 60325
Frankfurt am Main, Germany. E-mail: [email protected]; [email protected]
© The Author 2014. Published by Oxford University Press on behalf of the Society for Molecular Biology andEvolution. All rights reserved. For permissions, please e-mail: [email protected]
MBE Advance Access published March 25, 2014 by guest on M
arch 26, 2014http://m
be.oxfordjournals.org/D
ownloaded from
2
Abstract
Brown and polar bears have become prominent examples in phylogeography, but previous
phylogeographic studies relied largely on maternally inherited mitochondrial DNA (mtDNA)
or were geographically restricted. The male-specific Y chromosome, a natural counterpart to
mtDNA, has remained under-explored. Although this paternally inherited chromosome is
indispensable for comprehensive analyses of phylogeographic patterns, technical difficulties
and low variability have hampered its application in most mammals. We developed 13 novel
Y-chromosomal sequence and microsatellite markers from the polar bear genome, and
screened these in a broad geographic sample of 130 brown and polar bears. We also analyzed
a 390 kb-long Y-chromosomal scaffold using sequencing data from published male ursine
genomes. Y chromosome evidence support the emerging understanding that brown and polar
bears started to diverge no later than the Middle Pleistocene. Contrary to mtDNA patterns, we
found (i) brown and polar bears to be reciprocally monophyletic sister (or rather brother)
lineages, without signals of introgression, (ii) male-biased gene flow across continents and on
phylogeographic time scales, and (iii) male dispersal that links the Alaskan ABC-islands
population to mainland brown bears. Due to female philopatry, mtDNA provides a highly
structured estimate of population differentiation, while male-biased gene flow is a
homogenizing force for nuclear genetic variation. Our findings highlight the importance of
analyzing both maternally and paternally inherited loci for a comprehensive view of
phylogeographic history, and that mtDNA-based phylogeographic studies of many mammals
should be re-evaluated. Recent advances in sequencing technology render the analysis of Y
chromosomal variation feasible, even in non-model organisms.
by guest on March 26, 2014
http://mbe.oxfordjournals.org/
Dow
nloaded from

3
Introduction
Phylogeography describes the origin of genetic variation among closely related lineages,
tracing the geographic distribution of genetic variation through time and space (Avise 2000;
Hewitt 2000). Historically, phylogenetic and phylogeographic research has relied heavily on
mitochondrial DNA (mtDNA), with the brown bear (Ursus arctos) as an extensively studied
example (Taberlet et al. 1998; Purvis 2005; Davison et al. 2011). Advantages of analyzing
mtDNA include its high mutation rate, availability of markers, high copy number, lack of
recombination, and its haploid nature. However, the typically maternal inheritance of mtDNA
implies that signatures of male-mediated dispersal cannot be detected. An approach to further
investigate phylogeographic patterns is to analyze independently and bi-parentally inherited
autosomal loci in a multi-locus framework. However, recombination hampers inferences of
haplotypes over long genomic regions, limiting the resolution that is available from individual
autosomal loci.
The only other haploid fraction of the mammalian genome is the male-specific Y
chromosome. Due to its lack of recombination, except for the small pseudoautosomal regions,
haplotypes can be inferred over extended genomic regions, providing a high-resolution view
of patrilineal evolutionary history. Also, both mtDNA and the Y chromosome exhibit faster
lineage sorting than nuclear loci, facilitating the detection of population structuring (Avise
2000). The male-specific section of the Y chromosome therefore provides an essential
complement to data from maternally inherited mtDNA and bi-parentally inherited loci, giving
insight into the history of uniquely male-inherited lineages. Y-linked variation allows the
detection of potentially contrasting patterns of male and female gene flow (Chan et al. 2012).
This is particularly relevant in many mammals, where males typically disperse much farther
than females (Pusey 1987). Along with other loci, Y-linked variation has therefore provided a
by guest on March 26, 2014
http://mbe.oxfordjournals.org/
Dow
nloaded from
4
backbone for our understanding of phylogeography in humans (Hughes and Rozen 2012; Wei
et al. 2013), canids (Brown et al. 2011; Sacks et al. 2013), and domesticated animals
(Meadows et al. 2006; Lippold et al. 2011).
Despite these qualities, very little data is available from mammalian non-primate Y
chromosomes, in part because it has been disregarded from many genome sequencing projects
due to its repetitive nature (Willard 2003). In addition, other technical challenges, such as
avoiding co-amplification of homologous X-chromosomal regions, have hampered the
analysis of paternally inherited markers in natural populations (Greminger et al. 2010). The Y
chromosome thus represents an understudied part of the mammalian genome, with a large
potential to add valuable information to our understanding of phylogeography. In the era of
genomics it is now feasible to identify large regions on the Y chromosome and develop male-
specific markers for studies of evolutionary history.
Brown and polar (U. maritimus) bears have been model species in phylogeography
since the early 1990s (Cronin et al. 1991; Taberlet and Bouvet 1994; Kohn et al. 1995;
Paetkau et al. 1998; Taberlet et al. 1998; Hewitt 2000; Waits et al. 2000), in part because
these species are widely dispersing and provide the advantage of being distributed over large
parts of the Northern hemisphere. Polar bears exhibit low levels of population differentiation
at bi-parentally inherited and mitochondrial markers throughout their range (Paetkau et al.
1999; Cronin and MacNeil 2012; Miller et al. 2012; Campagna et al. 2013). Brown bears, in
contrast, show considerable phylogeographic structuring at mitochondrial markers (Davison
et al. 2011; Edwards et al. 2011; Hirata et al. 2013; Keis et al. 2013), and population
structuring can also be discerned at bi-parentally inherited microsatellites (Paetkau et al.
1997; Tammeleht et al. 2010; Kopatz et al. 2012). Most mtDNA clades are confined to certain
geographical regions and are not shared between continents, although one brown bear clade is
by guest on March 26, 2014
http://mbe.oxfordjournals.org/
Dow
nloaded from

5
widespread throughout Eurasia, and extends into North America (Korsten et al. 2009;
Davison et al. 2011). Surprisingly, all range-wide phylogeographic studies on brown bears
have so far relied on mtDNA. Studies of autosomal markers were regionally restricted to
either North America or Eurasia (Paetkau et al. 1997; Tammeleht et al. 2010; Kopatz et al.
2012; Cahill et al. 2013), and no phylogeographic study of Y chromosome markers in bears
exists. However, analysis of male-specific markers is crucial to understand bear evolution in
the light of their well-documented male-biased dispersal (McLellan and Hovey 2001;
Zedrosser et al. 2007).
With regard to bear phylogeny, reliance on mtDNA alone has proven problematic.
Polar bear mtDNA sequences are nested within the genetic diversity of brown bears, resulting
in a paraphyletic matrilineal relationship (Cronin et al. 1991; Lindqvist et al. 2010). Although
mtDNA is expected to attain reciprocal monophyly faster than nuclear loci (Avise 2000),
recent studies utilizing autosomal markers have shown that extant brown and polar bears
comprise distinct sister lineages at the species tree level, and that their divergence occurred
earlier than previously estimated (Hailer et al. 2012; Miller et al. 2012; Cahill et al. 2013).
Therefore, brown bear paraphyly for mtDNA is likely a consequence of past introgressive
hybridization with polar bears (Edwards et al. 2011; Hailer et al. 2012; Miller et al. 2012;
Hailer et al. 2013).
We mined a recently sequenced polar bear genome and developed 13 male-specific
markers to sequence 5.3 kb of the Y chromosome and to analyze microsatellite variation in a
broad geographic sample of 130 brown and polar bears from across Europe, Asia and North
America. We also analyzed a 390 kb-long genomic Y-chromosomal scaffold in available
brown, polar and American black bear genomes. These data allowed us to investigate (i)
whether introgression between brown and polar bears can be detected at Y chromosome
by guest on March 26, 2014
http://mbe.oxfordjournals.org/
Dow
nloaded from

6
markers, (ii) whether the male lineage shows less geographic structuring than the maternal
lineage, and (iii) the relative intraspecific clade depth of mtDNA and the Y chromosome.
Results
Y chromosome phylogeny and lack of introgression signals
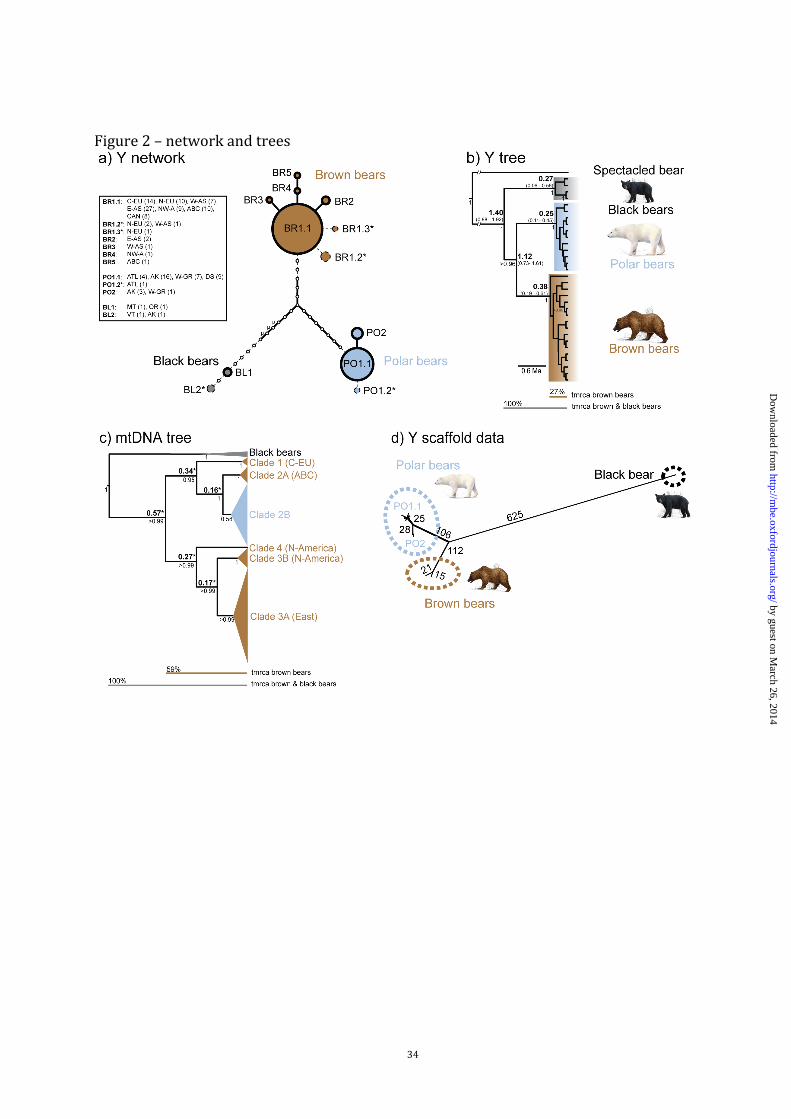
Male-specific sequence data revealed that brown and polar bears carry differentiated, species-
specific Y chromosomes, each exhibiting a closely related group of haplotypes (fig. 2A). The
clear separation and reciprocal monophyly of brown, polar, and American black bear (U.
americanus) Y chromosomes was further supported by Bayesian phylogenetic analyses (fig.
2B), with high statistical support (p > 0.95) for all major nodes.
In 3,078 bp of Y chromosome sequence analyzed in 90 brown, 40 polar bears and four
black bears (fig. 1, table 1), we found over 75% of the variable sites among species (3.1 kb
dataset, solid lines in fig. 2A). Only a small portion of sequence polymorphism was
intraspecific. We encountered eight haplotypes, five within brown, two within polar, and one
within black bears. These haplotypes were defined by a total of 21 segregating sites, ten of
which discriminate between brown and polar bears, nine between brown and black bears, and
13 between polar and black bears. Brown and polar bears each showed one abundant
haplotype that that was dominant in all populations across their ranges. Haplotype BR1.1 was
found in 94% of brown bears, and PO1.1 in 90% of polar bears (fig. 2A). Two haplotypes
found in brown bears from the ABC-islands (BR5) and the Alaskan mainland (BR4) formed a
joint lineage, indicative of a geographically informative clustering. Additional rare haplotypes
in brown bears were found in two individuals from Kamchatka (BR2) and in one individual
from the Ural Mountains (BR3). In polar bears, the rare haplotype PO2 was found in three
by guest on March 26, 2014
http://mbe.oxfordjournals.org/
Dow
nloaded from
7
individuals from Alaska and in one from Western Greenland (fig. 1). Results for four black
bear males are described in the Supplementary Material online.
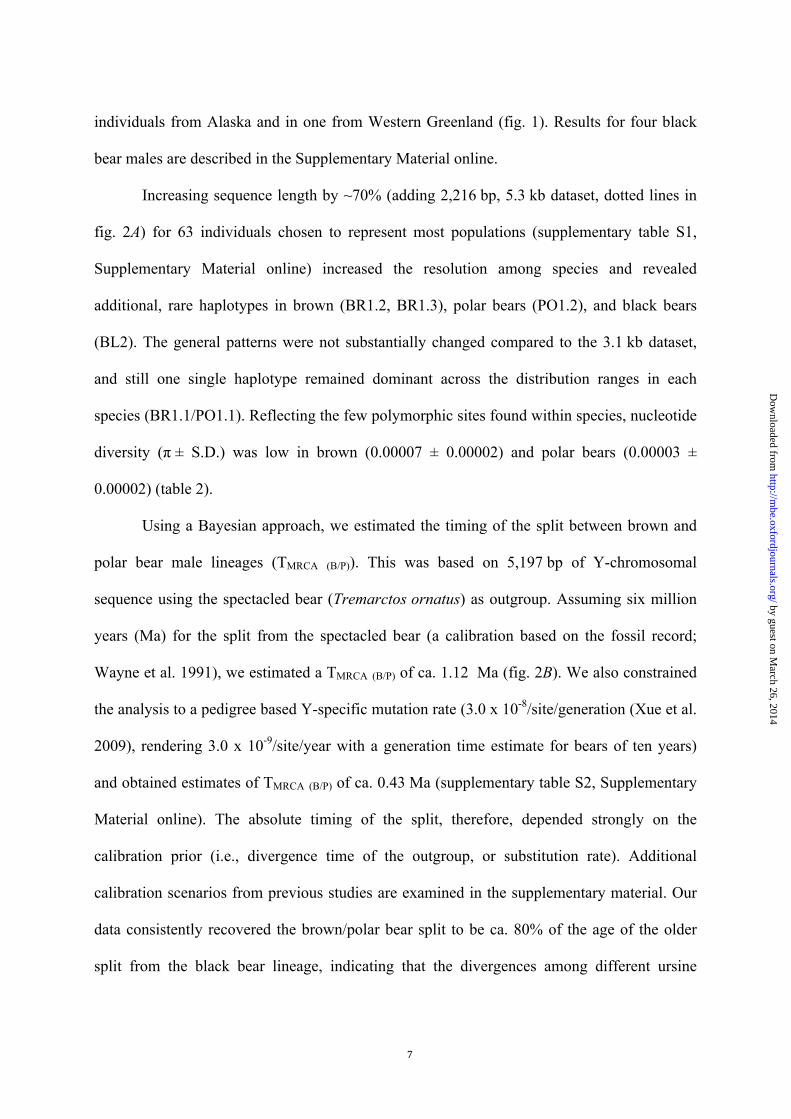
Increasing sequence length by ~70% (adding 2,216 bp, 5.3 kb dataset, dotted lines in
fig. 2A) for 63 individuals chosen to represent most populations (supplementary table S1,
Supplementary Material online) increased the resolution among species and revealed
additional, rare haplotypes in brown (BR1.2, BR1.3), polar bears (PO1.2), and black bears
(BL2). The general patterns were not substantially changed compared to the 3.1 kb dataset,
and still one single haplotype remained dominant across the distribution ranges in each
species (BR1.1/PO1.1). Reflecting the few polymorphic sites found within species, nucleotide
diversity (π ± S.D.) was low in brown (0.00007 ± 0.00002) and polar bears (0.00003 ±
0.00002) (table 2).
Using a Bayesian approach, we estimated the timing of the split between brown and
polar bear male lineages (TMRCA (B/P)). This was based on 5,197 bp of Y-chromosomal
sequence using the spectacled bear (Tremarctos ornatus) as outgroup. Assuming six million
years (Ma) for the split from the spectacled bear (a calibration based on the fossil record;
Wayne et al. 1991), we estimated a TMRCA (B/P) of ca. 1.12 Ma (fig. 2B). We also constrained
the analysis to a pedigree based Y-specific mutation rate (3.0 x 10⁻⁸/site/generation (Xue et al.
2009), rendering 3.0 x 10⁻⁹/site/year with a generation time estimate for bears of ten years)
and obtained estimates of TMRCA (B/P) of ca. 0.43 Ma (supplementary table S2, Supplementary
Material online). The absolute timing of the split, therefore, depended strongly on the
calibration prior (i.e., divergence time of the outgroup, or substitution rate). Additional
calibration scenarios from previous studies are examined in the supplementary material. Our
data consistently recovered the brown/polar bear split to be ca. 80% of the age of the older
split from the black bear lineage, indicating that the divergences among different ursine
by guest on March 26, 2014
http://mbe.oxfordjournals.org/
Dow
nloaded from

8
species occurred relatively shortly after each other. We note, however, that the design of our
Y sequence fragments targeted regions exhibiting nucleotide differences between one polar
and one brown bear individual, which could lead to an upward ascertainment bias with regard
to the magnitude of the brown/polar bear divergence (see below). Nevertheless, all variable
sites on the black bear branch (fig. 2A) were newly discovered in our sequencing data,
confirming the divergence of the black bear lineage with respect to brown and polar bears.
The findings of species-specific groups of haplotypes and the lack of haplotype
sharing among species (fig. 2A) revealed no signal of recent Y-chromosomal introgression. In
contrast, analysis of a 642 bp fragment of the mtDNA control region of the same samples
showed polar bears nested within the variation of all brown bears (fig. 2C), as expected for
this locus.
Y chromosome phylogeography of bears
On the Y chromosome, we found a maximum of three variable sites separating different
brown bear haplotypes (e.g. the difference between BR3 and BR5), but 14 substitutions
between brown and black bears (5.3 kb dataset, not counting sites in microsatellite-like
regions; see µ in fig. 2A). The intraspecific divergences relative to the outgroup obtained from
Bayesian analyses amounted to 27% for the Y-chromosomal data and 59% for mtDNA
control region data (fig. 2B and 2C). Similarly, estimates of mean (± S.E.) among-group
genetic distances from mtDNA control region sequences showed that divergence between two
major brown bear mtDNA clades (1 and 3a) (0.036 ± 0.007) amounted to 57-60% of the mean
distance between brown and black bears (0.064 ± 0.009 for clade 1, and 0.061 ± 0.009 for
clade 3a). Thus, a considerable reduction in phylogeographic structuring of the patriline was
by guest on March 26, 2014
http://mbe.oxfordjournals.org/
Dow
nloaded from

9
detected in comparison to the established matrilineal pattern, where deeply separated mtDNA
clades, most of which are region-specific, are found within brown bears.
This discrepancy in clade depth between the matri- and patriline was also obvious
when analyzing a ~390 kb Y-chromosomal scaffold (scaffold number 297) from 14 published
male bear genomes (Miller et al. 2012), along with the corresponding sequence from a male
brown bear from northern Norway (supplementary table S3, Supplementary Material online).
This alignment of two brown, 12 polar bears, and one black bear identified > 1,000 high-
quality variable sites, most of them distinguishing between the three bear species (fig. 2D). In
this dataset, the divergence between the two brown bear individuals (one from Norway, one
from the ABC islands) was ca. 5% of the divergence of these to one black bear individual (36
substitutions between the two brown bears, 752-758 substitutions between brown and black
bears), compared to ca. 20% between the divergence of all brown bears from the black bear
based on whole mitochondrial sequences (Lindqvist et al. 2010).
The shallow clade depth on the brown bear Y chromosome could result from
population expansion of one Y lineage that has replaced other clades. The pattern is also
consistent with positive selection favoring a particular Y-variant, and male-mediated gene
flow spreading this variant across the range. To disentangle the effects of background
selection, genetic hitchhiking, and recent population growth, we calculated four summary
statistics to test for deviations from neutral expectations. In brown bears, all estimates were
significant and negative (Tajima´s D = -1.94, p < 0.01; Fu and Li’s D* = -3.01, p < 0.05; F* =
-3.13, p < 0.05; Fu’s FS = 4.659, p < 0.01; table 2), consistent with all three
selective/demographic processes. The values calculated for polar bears were not significantly
different from neutral expectations (Tajima´s D = -1.16, p > 0.1; Fu and Li’s D* = -1.42, p >
0.05; F* = -1.52, p > 0.05, Fu’s FS = 0.649, p > 0.1; table 2). Haplotype configuration tests
by guest on March 26, 2014
http://mbe.oxfordjournals.org/
Dow
nloaded from
10
(Innan et al. 2005) did not allow us to distinguish between signals of population stasis (g = 0),
population growth (g = 2, g = 10) or selection in brown bears, because no tested scenario
differed significantly from neutral expectations (cumulative p > 0.05 for all tests).
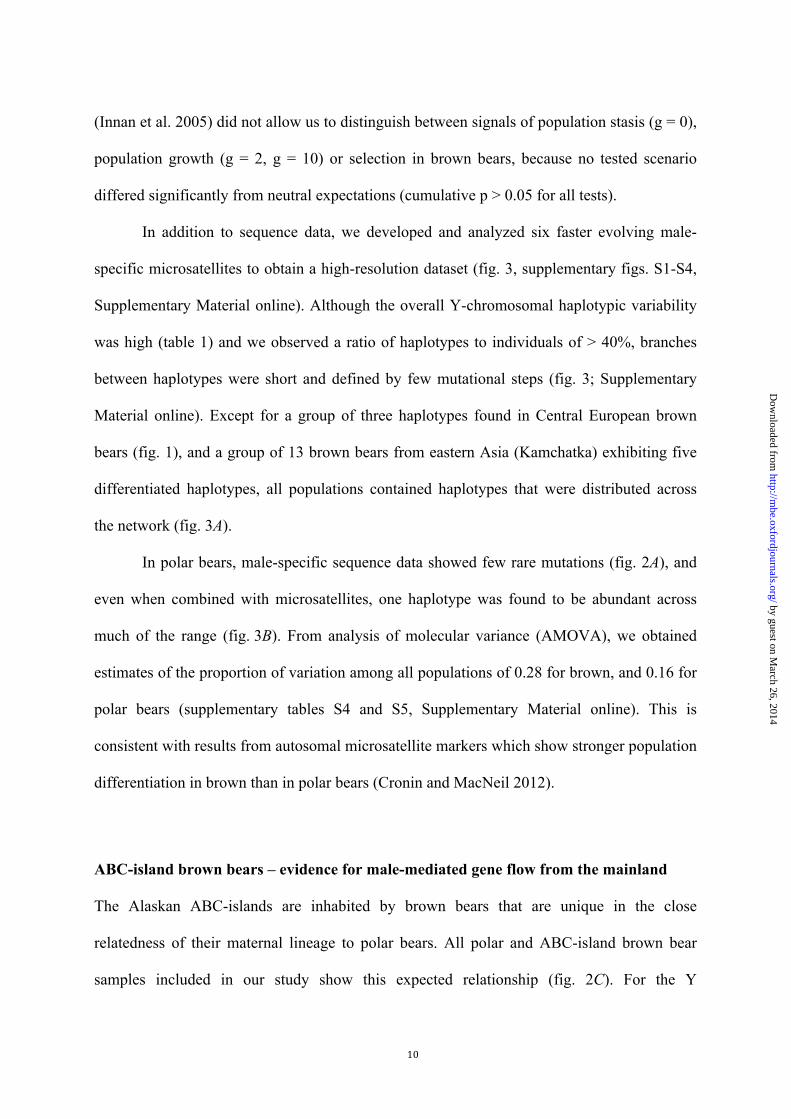
In addition to sequence data, we developed and analyzed six faster evolving male-
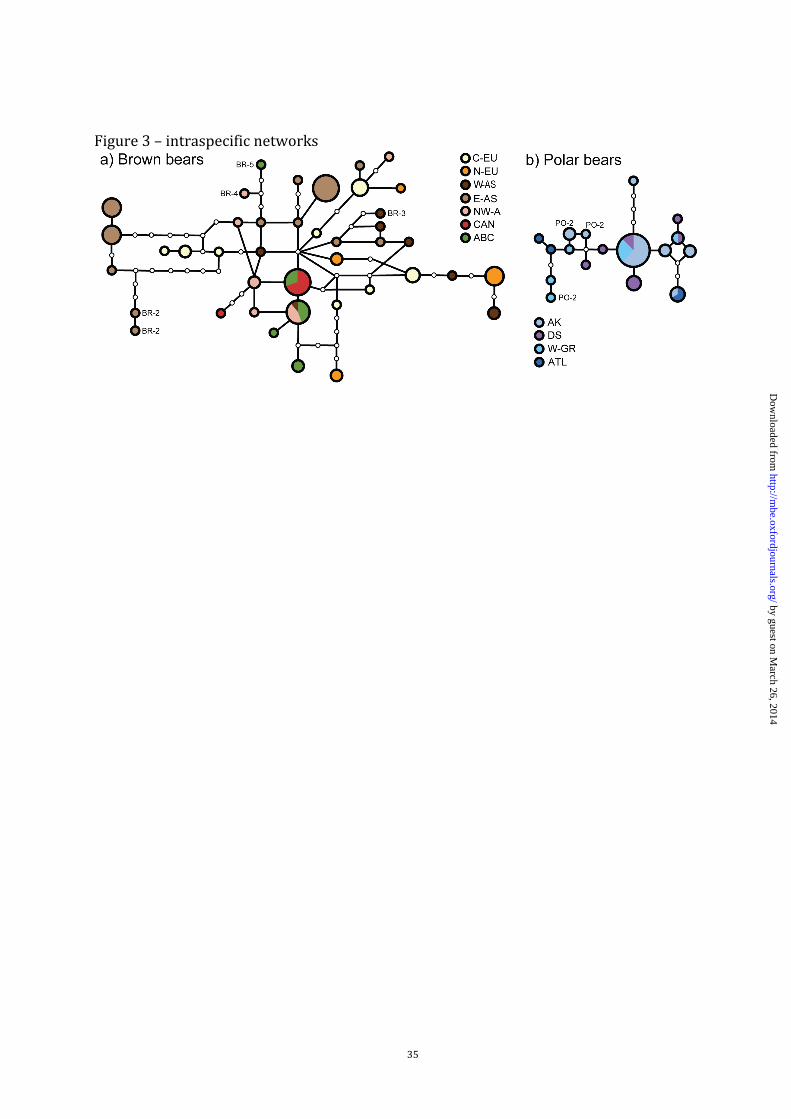
specific microsatellites to obtain a high-resolution dataset (fig. 3, supplementary figs. S1-S4,
Supplementary Material online). Although the overall Y-chromosomal haplotypic variability
was high (table 1) and we observed a ratio of haplotypes to individuals of > 40%, branches
between haplotypes were short and defined by few mutational steps (fig. 3; Supplementary
Material online). Except for a group of three haplotypes found in Central European brown
bears (fig. 1), and a group of 13 brown bears from eastern Asia (Kamchatka) exhibiting five
differentiated haplotypes, all populations contained haplotypes that were distributed across
the network (fig. 3A).
In polar bears, male-specific sequence data showed few rare mutations (fig. 2A), and
even when combined with microsatellites, one haplotype was found to be abundant across
much of the range (fig. 3B). From analysis of molecular variance (AMOVA), we obtained
estimates of the proportion of variation among all populations of 0.28 for brown, and 0.16 for
polar bears (supplementary tables S4 and S5, Supplementary Material online). This is
consistent with results from autosomal microsatellite markers which show stronger population
differentiation in brown than in polar bears (Cronin and MacNeil 2012).
ABC-island brown bears – evidence for male-mediated gene flow from the mainland
The Alaskan ABC-islands are inhabited by brown bears that are unique in the close
relatedness of their maternal lineage to polar bears. All polar and ABC-island brown bear
samples included in our study show this expected relationship (fig. 2C). For the Y
by guest on March 26, 2014
http://mbe.oxfordjournals.org/
Dow
nloaded from
11
chromosome, we found five haplotypes among eleven ABC-island brown bears (fig. 3A), all
clustering with brown rather than polar bears (fig. 2A). One haplotype was shared with
individuals from Canada, and another with individuals from northwest America and western
Asia (fig. 1). Non-significant differentiation from brown bears on the adjacent North
American mainland (ABC/NW-A: ΦST = 0.02, p > 0.05; supplementary table S4,
Supplementary Material online), but significant differentiation from all other populations
further confirmed the connectivity by male-mediated gene flow. This gene flow is evidently
substantial enough to maintain a high level of variability on the ABC-islands: we found five
haplotypes in eleven ABC-island individuals (Haplotype diversity HD = 0.82; table 1), which
is similarly high as the variability of all brown bears combined (HD = 0.96; table 1).
by guest on March 26, 2014
http://mbe.oxfordjournals.org/
Dow
nloaded from
12
Discussion
Phylogeographic research has relied heavily on maternally inherited mtDNA, but male-biased
dispersal in many mammals implies that mtDNA provides a highly structured (philopatric)
estimate of population differentiation compared to paternally and bi-parentally inherited loci.
Modern sequencing techniques now allow the generation of extensive genomic data, enabling
large-scale identification and analysis of sequences from the male-specific Y chromosome
(Bachtrog et al. 2011; Wei et al. 2013). This chromosome is especially interesting for
evolutionary studies because it allows the inference of high-resolution haplotypes from long
sequences, avoiding analytical challenges posed by interchromosomal recombination. Our
analysis of newly developed Y-linked markers in comparison to results from maternally
inherited mtDNA revealed a large impact of sex-biased gene flow on phylogeographic
structuring, and enabled us to examine phylogeny and introgression in brown and polar bears.
Speciation and introgression
The Y chromosome phylogeny of brown and polar bear lineages resembles the topology of
species trees reconstructed from bi-parentally inherited autosomal markers (Hailer et al. 2012;
Miller et al. 2012; Cronin et al. 2013), where the species constitute distinct sister (or rather
brother) lineages, with black bears clustering outside their variation (fig. 2B). This contrasts
with the pattern obtained from maternally inherited mitochondrial DNA, where polar bears
cluster within the variation of brown bears, rendering the latter paraphyletic (Cronin et al.
1991; Edwards et al. 2011) (fig. 2C).
The timing of the split between brown and polar bears has been the subject of recent
debates, with inferred dates ranging from ca. 160,000 to ca. 5 million years (Lindqvist et al.
2010; Edwards et al. 2011; Hailer et al. 2012; Miller et al. 2012; Cahill et al. 2013; but see Ho
by guest on March 26, 2014
http://mbe.oxfordjournals.org/
Dow
nloaded from

13
et al. 2008 and Davison et al. 2011 for even younger estimates depending on the calibration
method used). Compared to the mtDNA divergence estimate of ca. 160,000 years between
polar and brown bears (Lindqvist et al. 2010; Edwards et al. 2011; Hirata et al. 2013),
divergence times for the Y chromosome (>0.43 Ma, supplementary table S2, Supplementary
Material online) are much older, confirming earlier suggestions that mtDNA has been
introgressed (Hailer et al. 2012, 2013, Miller et al. 2012, Cahill et al. 2013). Compared to
divergence times estimated from autosomal data, our 1.12 Ma estimate for brown/polar bear
Y chromosomes (fig. 2B; scenario B in supplementary table S2, Supplementary Material
online) is older than a divergence time estimate from introns of ca. 0.34 to 0.93 Ma (Hailer et
al. 2012), but younger than the 4 to 5 Ma estimate by Miller et al. (2012) from genomic data.
When based on a rate calibration from human Y chromosomes (scenario D in supplementary
table S2, Supplementary Material online), our estimate of the Y chromosome divergence
(0.43 Ma) falls into the Middle Pleistocene, resembling the estimate of Hailer et al. (2012). In
summary, Y chromosome evidence support the emerging understanding of brown and polar
bears as distinct evolutionary lineages that started to diverge no later than the Middle
Pleistocene, at least several hundreds of thousands years ago.
Although incomplete lineage sorting can hamper definite conclusions, brown and
polar bears likely carry introgressed alleles at mtDNA and autosomal loci (Hailer et al. 2012;
Miller et al. 2012; Cahill et al. 2013). Current hybridization levels, however, appear to be low
(Cronin and MacNeil 2012; Hailer et al. 2012). Our findings of species-specific groups of Y
chromosome haplotypes and a lack of haplotype sharing among species revealed no signal of
patrilineal introgression. Reduced introgression of Y chromosomes has been reported
previously (e.g. Geraldes et al. 2008), and can arise from several mechanisms: random effects
of lineage sorting, sex-biased hybridization, reduced hybrid fitness of the heterogametic sex
by guest on March 26, 2014
http://mbe.oxfordjournals.org/
Dow
nloaded from

14
due to genomic incompatibilities (Haldane’s rule), or lower introgression rates at markers
exhibiting high intraspecific gene flow (Petit and Excoffier 2009).
Variability on the Y chromosome
Most variable sites on the Y chromosome in bears were found among species, while only
relatively little intraspecific sequence variation was encountered. The latter is compatible with
the generally low intraspecific variability observed on mammalian Y chromosomes, including
field voles, elephants, chamois and humans (Hellborg and Ellegren 2004; Roca et al. 2005;
Pérez et al. 2011; Wilson Sayres et al. 2014). Nakagome et al. (2008) compared Y, X, and
mtDNA phylogenies and variability in bears based on single representations per species. They
found a lower than expected Y-chromosomal substitution rate within Ursinae as compared to
the deeper nodes of the tree, possibly mirroring our findings of low variability on the Y
chromosomes of brown and polar bears. After applying a standard correction factor of four to
account for the smaller effective population size of the Y chromosome (but see Chesser and
Baker 1996), variability on the brown bear Y chromosome was ca. 10% of that on the
autosomes (data from Hailer et al. 2012). As shown for other mammals (Hellborg and
Ellegren 2004), this discrepancy between the Y chromosome and autosomes exists despite
higher male than female mutation rates. Low intraspecific variability on the Y chromosome
can be explained by its haploid and uni-parental inheritance, reproductive skew among males,
male-biased dispersal, demographic history, but also by selection - or a combination of these
(Chesser and Baker 1996; Charlesworth and Charlesworth 2000; Petit et al. 2002; Wilson
Sayres et al. 2014).
In polar bears, Y-linked variability patterns did not deviate significantly from neutral
expectations (table 2). In brown bears, the deviation was significant, with most of the applied
by guest on March 26, 2014
http://mbe.oxfordjournals.org/
Dow
nloaded from

15
tests showing an excess of rare mutations (table 2), consistent with population growth and/or
positive selection. However, haplotype configuration tests did not necessitate a history of
ongoing or recent positive selection on the Y chromosome in brown bears. Based on SNPs
from the nuclear genome, Miller et al. (2012) found a long-term decline in brown bear
effective population size, particularly since the Eemian interglacial. Genome-wide data thus
do not indicate recent population growth, reinforcing the particular evolutionary history of the
Y chromosome in brown bears.
Despite overall low levels of intraspecific variation on the Y chromosome, our
analysis of long scaffold sequences (fig. 2D) illustrates that application of modern genomic
techniques can nevertheless recover large numbers of polymorphic sites on the Y
chromosome, enabling high-resolution inferences.
Phylogeographic structuring
MtDNA control region data show pronounced phylogeographic structuring in brown
bears, with (i) deeply separated clades, and (ii) clades which are geographically restricted
(Davison et al. 2011) (fig. 2C). The Y chromosome is predicted to be a geographically
informative marker that shows differences among populations, because of strong genetic drift
in the patriline (Petit et al. 2002). However, we observed neither of the abovementioned
signals at paternally inherited markers: no deep intraspecific divergences were found, and,
over evolutionary time scales, male-biased gene flow has distributed genomic variation across
and among continents. Compared to mitochondrial control region data, brown bear Y
chromosomes showed shallow intraspecific divergences relative to the divergence from black
bears, with few substitutions differentiating among Y-chromosomal haplotypes. Despite
limited sample numbers, because to date only few male bear genomes have been sequenced,
by guest on March 26, 2014
http://mbe.oxfordjournals.org/
Dow
nloaded from
16
ascertainment bias-free scaffold data confirm the main conclusions from our sequence data.
First, patrilineal genomic divergences within brown and polar bears were considerably
shallower than for mtDNA. Second, the 390 kb dataset recovered the same two groups of
polar bear Y haplotypes that correspond to PO1.1 and PO2. Finally, brown bear sequences
were separated from each other by small genetic distances. Although increased sampling and
sequencing of longer fragments might recover additional clades, our conclusions are not
impacted by a strong ascertainment bias (Brumfield et al. 2003). On deeper phylogenetic
scales, however, we note that the divergence of the black bear Y chromosome was likely
underestimated in our 3.1 and 5.3 kb datasets.
The observed discrepancy between the matri- and patriline can be due to effects of
demography and selection on the Y chromosome. In addition, mtDNA can show signals of
mutational saturation (Ingman and Gyllensten 2001) and purging of slightly deleterious
mutations due to purifying selection (Subramanian et al. 2009), leading to a time dependency
of evolutionary rates for mitochondrial DNA (Ho et al. 2008). Whole mtDNA data from
Lindqvist et al. (2010) show, relative to the divergence from black bears, a shallower clade
depth in brown bears compared to data from the control region. However, our analysis of
longer sequences from Y scaffold data confirmed the weaker structuring of the patriline than
the matriline. Whichever the mechanism(s), a reduced phylogeographic structuring on the Y
compared to well differentiated mtDNA clades has also been found in other species, e.g.
shrews, chamois and gibbons (Lawson Handley et al. 2006; Pérez et al. 2011; Chan et al.
2012).
Despite known uncertainties with regard to absolute ages, our Bayesian phylogenetic
analyses suggested that the most basal divergence of brown bear Y haplotypes considerably
pre-dates the last glacial maximum, with plausible dates reaching into the Middle Pleistocene
by guest on March 26, 2014
http://mbe.oxfordjournals.org/
Dow
nloaded from
17
(95% highest posterior density: 0.19-0.61 Ma; fig. 2B). This suggests that one Y chromosome
lineage (BR1.1) has been maintained for a long time and at a high frequency throughout
Eurasia and North America. While selection may therefore have contributed to the shallow Y-
chromosomal clade depth within brown bears, our data are also consistent with a purely
demographic scenario, involving extensive male gene flow across large geographical
distances. Indeed, analysis of a 390 kb-long Y-chromosomal fragment showed that two brown
bears from populations as far away from each other as Norway and the Alaskan ABC islands
carried highly similar Y chromosomes (fig. 2D). This pattern in brown bears covers even
larger geographic areas (throughout Eurasia and North America) than analogous findings
from humans, where the Y-chromosomal lineage of Genghis Khan, founder of the Mongol
Empire, was spread across much of Asia (Zerjal et al. 2003).
Our discovery of distinct Y-chromosomal haplotypes on Kamchatka, mirrors previous
findings of distinct mtDNA lineages (Korsten et al. 2009), highlighting the complex
biogeography of this peninsula. Besides this clear signal from Kamchatka, brown bear
populations in general contained a mix of different Y chromosome lineages, with the most
closely related lineages of a given haplotype being located in a different geographic region.
This lack of pronounced patrilineal geographic structuring is an expected consequence of
male-mediated gene flow and contrasts strongly with the picture from mtDNA, where
populations tend to contain region-specific lineages (Davison et al. 2011).
In polar bears, we observed weak population structuring and no clear evidence of past
phylogeographic barriers on the Y chromosome. This is similar to patterns from maternally
and bi-parentally inherited markers (Paetkau et al. 1999; Cronin et al. 2006; Miller et al.
2012; Campagna et al. 2013), reflecting the large dispersal distances described for polar bears.
by guest on March 26, 2014
http://mbe.oxfordjournals.org/
Dow
nloaded from
18
Male-biased gene flow and the Alaskan ABC-island bears
We provide the first direct evidence for male-mediated gene flow between the mainland and
the Alaskan ABC-islands, which host a population of bears that has long been of interest to
evolutionary biologists, due to the close matrilineal relationship to extant polar bears – the
extant polar bear matriline is the sister lineage of the ABC clade (Cronin et al. 1991; Davison
et al. 2011). The absence of mainland brown bear mtDNA haplotypes on the ABC-islands,
and vice versa, shows that female-mediated gene flow is effectively zero. However, nuclear
microsatellites (Paetkau et al. 1998) and comparisons of autosomal versus X chromosome
variation (Cahill et al. 2013) demonstrated that ABC bears are not isolated from continental
brown bear populations, postulating that connectivity between the ABC-islands and the
mainland stems from male-mediated gene flow. We here show that male-mediated gene flow
is connecting the ABC-islands to the North American mainland, and that this gene flow is
substantial enough to maintain appreciable genetic variability in this island population. Cahill
and colleagues (2013) suggested an initial polar bear ancestry of ABC-island brown bears,
followed by extensive male-biased immigration of mainland brown bears. Based on this
scenario, the fact that we found no polar bear Y chromosomes on the ABC-islands indicates a
replacement of the original polar bear Y chromosomes.
Phylogeography: insights from matri- and patrilineal markers
Since its conception, the field of phylogeography has realized the importance of sampling
several statistically independent loci (reviewed in Avise 2000), but problems related to
discovering intraspecific variability on the Y chromosome (Hellborg and Ellegren 2004; Luo
et al. 2007) have long hampered the application of patrilineal markers in non-model species.
Nevertheless, some studies have revealed similar paternal and maternal structuring (Hellborg
by guest on March 26, 2014
http://mbe.oxfordjournals.org/
Dow
nloaded from
19
et al. 2005), while others recovered discordant signals (Boissinot and Boursot 1997; Roca et
al. 2005; Pidancier et al. 2006; Pérez et al. 2011). Inference of the mechanism(s) that could
have led to differences in genetic structuring between the matri- and patriline is generally not
straightforward, because the effects of demography and selection are difficult to disentangle
(Lawson Handley et al. 2006; Pidancier et al. 2006; Nakagome et al. 2008; Pérez et al. 2011),
even in humans (Wilson Sayres et al. 2014). Regardless whether demography or selection are
the ultimate cause, a weaker paternal than maternal structuring is indicative of gene flow
among populations, implying that mtDNA alone in such cases overestimates population
structuring.
Conclusions
Bears are a prominent and widely cited example in phylogeography, with range-wide signals
of pronounced population structuring reported for brown bear mtDNA (Davison et al. 2011).
We re-examined this paradigm using paternally inherited markers. In strong contrast to
mtDNA data, shallow divergences and lack of pronounced geographic structuring of brown
bear Y chromosomes were found. MtDNA-based inferences have thus overestimated
phylogeographic structuring, due to extensive male gene flow on regional and range-wide
scales. Nevertheless, various adaptive traits have been linked to mtDNA (Ballard and Rand
2005), and the mtDNA of an individual may have important consequences for its phenotype
and local adaptation. Phylogeographic structuring of the brown bear matriline into regional
assemblages could therefore be adaptively significant. Our findings highlight that
evolutionary patterns inferred from mtDNA, despite its popularity, are not representative of
the entire genome and that phylogeographic histories of many species may need to be re-
by guest on March 26, 2014
http://mbe.oxfordjournals.org/
Dow
nloaded from

20
evaluated. Y-chromosomal data is essential in any phylogeographic analyses of mammals -
even in presumably well-studied species such as bears.
by guest on March 26, 2014
http://mbe.oxfordjournals.org/
Dow
nloaded from
21
Methods
Identification of Y-chromosomal markers
A whole genome sequence assembly of a male polar bear (Li et al. 2011) was used to identify
putative Y-chromosomal scaffolds by searching for matches with the sequences of known Y-
linked genes (SMCY, ZFY, SRY, UBEY, RMBY). We identified five scaffolds from ~19 kb
to ~390 kb in length (scaffold numbers: 297, 318, 369, 579, 605). These scaffolds were
extracted and compared to the corresponding sequences in a male brown bear (accession
numbers: CBZK010000001 - CBZK010000005) in order to identify genomic regions
containing either variable sites, or microsatellite motifs, respectively, between the two
individuals. To decrease the possible ascertainment bias in the subsequent application of the
markers in samples from different species and populations, we did not type these variable
sites, but we designed and sequenced eleven PCR fragments around them with lengths of at
least 500 bp (529 - 1216 bp). All variable sites on the black bear branch, and most variable
sites within brown and polar bears, respectively, were newly discovered by this sequencing
approach (supplementary table S6, Supplementary Material online). All but three variable
sites between brown and polar bears, however, were known from the ascertainment panel. Y-
chromosomal sequences for each haplotype can be accessed at the EMBL data archive
(accession numbers: HG423284 - HG423309). The scaffold sequences were then mined for
di- and tetranucleotide microsatellites that exhibited at least five uninterrupted repeat units.
Primers for nine microsatellite markers are shown in supplementary table S9, Supplementary
Material online. Allele size data can be accessed at the DRYAD repository (DOI pending).
PCR fragments obtained from brown, polar, and black bears were then evaluated for
their male-specificity. This assessment resulted in seven sequence fragments and nine
by guest on March 26, 2014
http://mbe.oxfordjournals.org/
Dow
nloaded from
22
microsatellite markers that were ultimately used (supplementary tables S1 and S6,
Supplementary Material online). Male-specificity was ensured throughout all experiments by
consistently including female DNA controls. See supplementary tables S7 - S9
(Supplementary Material online) for details on PCR conditions, sequencing and fragment
analysis.
Sampling and DNA extraction
Tissue and DNA samples from 90 male brown and 40 male polar bears were included in this
study, covering large parts of their distribution ranges (fig. 1, table 1, supplementary table S1,
Supplementary Material online). For comparison, we also analyzed four American black bear
samples, covering their two previously described mitochondrial clades (supplementary fig. S4,
Supplementary Material online), and a male spectacled bear as outgroup for divergence time
estimations. All tissue samples originated from animals legally hunted for purposes other than
this study, or from zoo individuals. Individuals with unknown sex were tested as in Bidon et
al. (2013). DNA was extracted using a modified Puregene (Qiagen, Hilden, Germany) DNA
salt extraction protocol or DNeasy Tissue kit (Qiagen).
by guest on March 26, 2014
http://mbe.oxfordjournals.org/
Dow
nloaded from
23
Analysis of Y-chromosomal scaffold sequences
Genomic sequence data was used from 12 male polar bears, one male brown bear, and one
male black bear (Miller et al. 2012), plus one male brown bear from Northern Europe
(supplementary table S3, Supplementary Material online). Short reads were mapped to a
>390 kb long putative Y-linked scaffold from a male polar bear (Li et al. 2011) (scaffold 297).
Consensus sequences were determined for every individual using Geneious 6.1.6 (Biomatters,
Auckland, New Zealand), calling ´?´ for regions without coverage and `N´ for bases with a
Phred quality score <20. Consensus sequences of the 15 individuals were aligned and single
nucleotide variants determined in regions with coverage for all individuals. All variants were
manually checked in the alignment and we excluded all sites that contained
insertions/deletions or ambiguous bases. Additionally, variants within 5 nucleotides of
ambiguous sites (? and N, respectively), variants directly adjacent to each other, and variants
in microsatellite regions were excluded, in order to account for sequencing and alignment
errors.
Data analysis
PCR products were sequenced or subjected to fragment analysis (microsatellites). Sequences
were aligned and edited in Geneious 5.6.2 (Biomatters, Auckland, New Zealand) and allele
sizes were determined using Genemapper 4.0 (Applied Biosystems, Life Technologies GmbH,
Darmstadt, Germany). To infer phylogenetic relationships among haplotypes, networks were
estimated using statistical parsimony as implemented in TCS 1.21 (Clement et al. 2000), with
the connection limit set to 0.95 for sequence data, or fixed at 50 steps for microsatellite
haplotypes. For the combined analysis of sequence and allele size polymorphisms, data from
all Y-linked markers were combined into one compound haplotype per individual. A
by guest on March 26, 2014
http://mbe.oxfordjournals.org/
Dow
nloaded from
24
haplotype distance matrix was calculated from allele sizes with GenoDive 2.0b23 (Meirmans
and Van Tienderen 2004), assuming a strictly stepwise mutation model, with single repeat
unit changes counted as one mutational step. Analyses of polymorphic sites and other
summary statistics, nucleotide diversity π, tests for signals of demography and selection
(Tajima 1989; Fu and Li 1993; Fu 1997), and analysis of molecular variance (AMOVA) were
done in DnaSP v5.10 (Librado and Rozas 2009) and Arlequin 3.5 (Excoffier and Lischer
2010). Haplotype configuration tests were performed in haploconfig and haplofreq (Innan et
al. 2005), with theta-values obtained from the number of segregating sites (Watterson’s theta)
and nucleotide diversity (π), respectively, and simulating different population expansion
scenarios (θ = 1.38, 0.37; growth rate g = 0, 2, 10; a = 10,000; n = 44; s = 6). Different
weighting schemes were applied to sequence and microsatellite markers, as in Brown et al.
(2011). Estimates of mean (±S.E.) among-group distances were obtained in MEGA5 (Tamura
et al. 2011). SplitsTree4 (Huson and Bryant 2006) was used to calculate a NeighborNet
network for the 390 kb-long dataset. Bayesian phylogenetic analyses and divergence time
estimations were performed in Beast v1.7.4 (Drummond et al. 2012).
by guest on March 26, 2014
http://mbe.oxfordjournals.org/
Dow
nloaded from
25
Acknowledgements and funding information
This work was supported by Hesse’s "LOEWE Landes-Offensive zur Entwicklung
Wissenschaftlich-ökonomischer Exzellenz"; by the Arthur und Aenne Feindt-Stiftung; the
Estonian Research Council (IUT-2032, ESF-8525), and the European Union through the
European Regional Development Fund (Centre of Excellence FIBIR). Jón Baldur Hlíðberg
kindly provided the bear paintings. We thank N. Schreck, D. Herbert and C. Tobiassen for
assistance, U. Arnason, M. Bálint, E.W. Born, C. Nowak, M. Onucsán, K. Skírnisson and F.
Zachos for providing samples, and the editor and three anonymous reviewers for insightful
comments.
by guest on March 26, 2014
http://mbe.oxfordjournals.org/
Dow
nloaded from
26
Figure legends
Figure 1. Geographical distribution of analyzed bear samples. Circle area is proportional to
the number of individuals. Some sampling localities (italics) were combined into groups (see
table 1). Brown: brown bears; blue: polar bears; black: black bears.
Figure 2. Phylogenetic relationships of bears for Y-chromosomal and mitochondrial markers.
A: Parsimony network of Y chromosome sequences. Solid lines: variation in 3.1 kb, Dashed
lines: variation from additional 2.2 kb (total: 5.3 kb). Circle area is proportional to number of
individuals; small, open circles: inferred, intermediate haplotypes; lines represent single
mutational steps. Inset boxes: number of individuals per population. Asterisks: haplotypes
found only in the 5.3 kb dataset (individuals with these haplotypes have the respective
common haplotypes in the 3.1 kb dataset). Insertions/deletions of repeat units in
microsatellite-like regions counted as number of repeat unit changes (µ). Population
abbreviations as in table 1. B: Maximum clade credibility tree of Y chromosomal sequence
(5,197 bp), based on a divergence of the spectacled bear 6 Ma. Bold: median divergence in
Ma (95% highest posterior density intervals in brackets). Numbers below nodes: posterior
support >0.95. C: Maximum clade credibility tree of mtDNA control region data. Sampling
covers all major matrilineal brown bear clades (Davison et al. 2011) (collapsed into triangles),
and polar bears (clade 2B) are nested within brown bear variation. Asterisks: divergence
times obtained from complete mtDNA sequences (Hirata et al. 2013). Numbers below nodes:
posterior probabilities. Below (B) and (C), brown bear clade depth (relative to the divergence
from black bears) is indicated. D: NeighborNet network based on a ~390 kb Y-chromosomal
fragment from 12 polar bears, two brown bears, and one black bear. Numbers on branches
by guest on March 26, 2014
http://mbe.oxfordjournals.org/
Dow
nloaded from

27
denote numbers of variable sites. Within polar bears, two haplogroups were identified
corresponding to the haplotypes PO1.1 and PO2 in fig. 2A.
Figure 3. Statistical parsimony networks of Y chromosome haplotypes, inferred from
unweighted combination of 3.1 kb sequence data and six microsatellites, for (A) brown bears,
(B) polar bears. Rare haplotype names as in fig. 2A, population abbreviations as in table 1.
by guest on March 26, 2014
http://mbe.oxfordjournals.org/
Dow
nloaded from
28
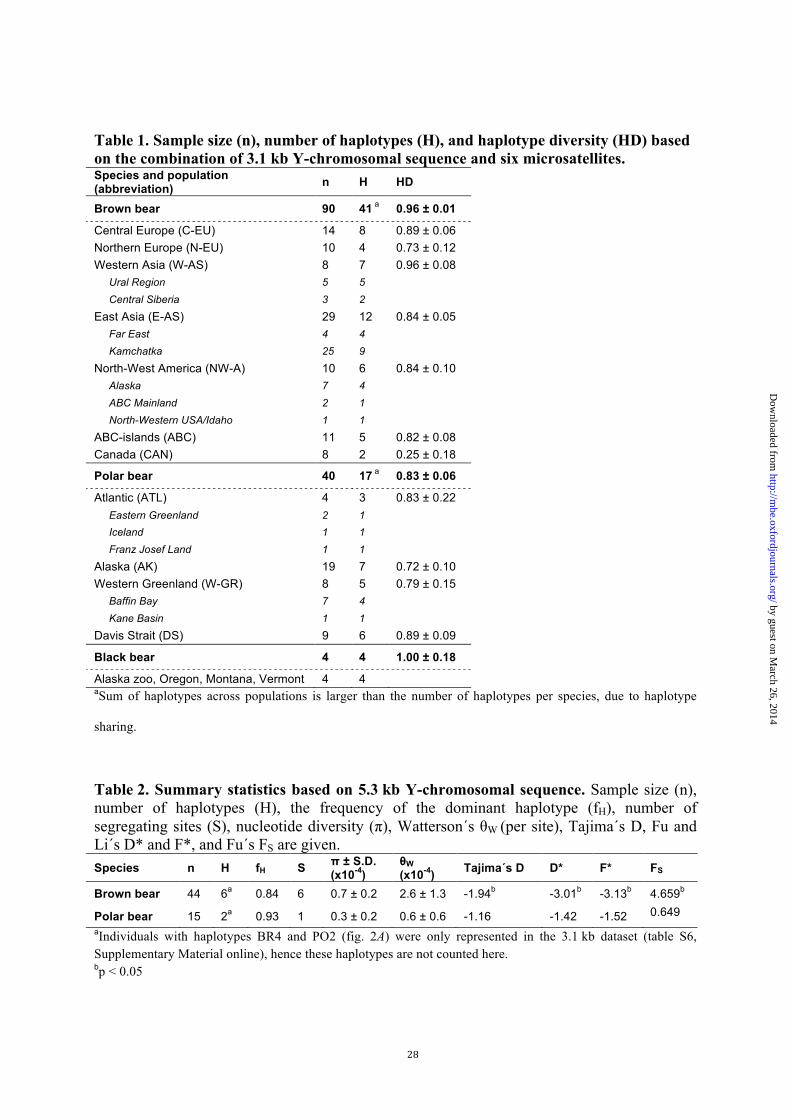
Table 1. Sample size (n), number of haplotypes (H), and haplotype diversity (HD) based on the combination of 3.1 kb Y-chromosomal sequence and six microsatellites. Species and population (abbreviation) n H HD
Brown bear 90 41 a 0.96 ± 0.01
Central Europe (C-EU) 14 8 0.89 ± 0.06 Northern Europe (N-EU) 10 4 0.73 ± 0.12 Western Asia (W-AS) 8 7 0.96 ± 0.08 Ural Region 5 5 Central Siberia 3 2
East Asia (E-AS) 29 12 0.84 ± 0.05 Far East 4 4 Kamchatka 25 9
North-West America (NW-A) 10 6 0.84 ± 0.10 Alaska 7 4 ABC Mainland 2 1 North-Western USA/Idaho 1 1
ABC-islands (ABC) 11 5 0.82 ± 0.08 Canada (CAN) 8 2 0.25 ± 0.18
Polar bear 40 17 a 0.83 ± 0.06
Atlantic (ATL) 4 3 0.83 ± 0.22 Eastern Greenland 2 1 Iceland 1 1 Franz Josef Land 1 1
Alaska (AK) 19 7 0.72 ± 0.10 Western Greenland (W-GR) 8 5 0.79 ± 0.15 Baffin Bay 7 4 Kane Basin 1 1
Davis Strait (DS) 9 6 0.89 ± 0.09
Black bear 4 4 1.00 ± 0.18
Alaska zoo, Oregon, Montana, Vermont 4 4 aSum of haplotypes across populations is larger than the number of haplotypes per species, due to haplotype
sharing.
Table 2. Summary statistics based on 5.3 kb Y-chromosomal sequence. Sample size (n), number of haplotypes (H), the frequency of the dominant haplotype (fH), number of segregating sites (S), nucleotide diversity (π), Watterson´s θW (per site), Tajima´s D, Fu and Li´s D* and F*, and Fu´s FS are given. Species n H fH S π ± S.D.
(x10-4) θW (x10-4) Tajima´s D D* F* FS
Brown bear 44 6a 0.84 6 0.7 ± 0.2 2.6 ± 1.3 -1.94b -3.01b -3.13b 4.659b
Polar bear 15 2a 0.93 1 0.3 ± 0.2 0.6 ± 0.6 -1.16 -1.42 -1.52 0.649 aIndividuals with haplotypes BR4 and PO2 (fig. 2A) were only represented in the 3.1 kb dataset (table S6, Supplementary Material online), hence these haplotypes are not counted here. bp < 0.05
by guest on March 26, 2014
http://mbe.oxfordjournals.org/
Dow
nloaded from
29
References
Avise JC. 2000. Phylogeography: the history and formation of species. Harvard University Press Bachtrog D, Kirkpatrick M, Mank JE, McDaniel SF, Pires JC, Rice W, Valenzuela N. 2011. Are all sex
chromosomes created equal? Trends Genet. 27:350–357. Ballard JWO, Rand DM. 2005. The Population Biology of Mitochondrial Dna and Its Phylogenetic Implications.
Annu. Rev. Ecol. Evol. Syst. 36:621–642. Bidon T, Frosch C, Eiken HG, Kutschera VE, Hagen SB, Aarnes SG, Fain SR, Janke A, Hailer F. 2013. A
sensitive and specific multiplex PCR approach for sex identification of ursine and tremarctine bears suitable for non-invasive samples. Mol. Ecol. Resour. 13:362–368.
Boissinot S, Boursot P. 1997. Discordant Phylogeographic Patterns Between the Y Chromosome and Mitochondrial DNA in the House Mouse: Selection on the Y Chromosome? Genetics 146:1019–1034.
Brown SK, Pedersen NC, Jafarishorijeh S, Bannasch DL, Ahrens KD, Wu J-T, Okon M, Sacks BN. 2011. Phylogenetic distinctiveness of Middle Eastern and Southeast Asian village dog Y chromosomes illuminates dog origins. PLoS One 6:e28496.
Brumfield RT, Beerli P, Nickerson DA, Edwards SV. 2003. The utility of single nucleotide polymorphisms in inferences of population history. Trends Ecol. Evol. 18:249–256.
Cahill JA, Green RE, Fulton TL, Stiller M, Jay F, Ovsyanikov N, Salamzade R, John J, Stirling I, Slatkin M, et al. 2013. Genomic Evidence for Island Population Conversion Resolves Conflicting Theories of Polar Bear Evolution.Nachman MW, editor. PLoS Genet. 9:e1003345.
Campagna L, Van Coeverden de Groot PJ, Saunders BL, Atkinson SN, Weber DS, Dyck MG, Boag PT, Lougheed SC. 2013. Extensive sampling of polar bears (Ursus maritimus) in the Northwest Passage (Canadian Arctic Archipelago) reveals population differentiation across multiple spatial and temporal scales. Ecol. Evol. 3:3152–3165.
Chan Y-C, Roos C, Inoue-Murayama M, Inoue E, Shih C-C, Vigilant L. 2012. A comparative analysis of Y chromosome and mtDNA phylogenies of the Hylobates gibbons. BMC Evol. Biol. 12:150.
Charlesworth B, Charlesworth D. 2000. The degeneration of Y chromosomes. Philos. Trans. R. Soc. Lond. B. Biol. Sci. 355:1563–1572.
Chesser RK, Baker RJ. 1996. Effective sizes and dynamics of uniparentally and diparentally inherited genes. Genetics 144:1225–1235.
Clement M, Posada D, Crandall KA. 2000. TCS: a computer program to estimate gene genealogies. Mol. Ecol. 9:1657–1660.
Cronin MA, Amstrup SC, Garner GW. 1991. Interspecific and intraspecific miochondrial DNA variation in North American bears (Ursus). Can. J. Zool. 69:2985–2992.
Cronin MA, Amstrup SC, Scribner KT. 2006. Microsatellite DNA and mitochondrial DNA variation in polar bears (Ursus maritimus) from the Beaufort and Chukchi seas, Alaska. Can. J. Zool. 660:655–660.
Cronin MA, MacNeil MD. 2012. Genetic relationships of extant brown bears (Ursus arctos) and polar bears (Ursus maritimus). J. Hered. 103:873–881.
Cronin MA, McDonough MM, Huynh HM, Baker RJ. 2013. Genetic relationships of North American bears (Ursus) inferred from amplified fragment length polymorphisms and mitochondrial DNA sequences. Can. J. Zool. 91:626–634.
Davison J, Ho SYW, Bray SC, Korsten M, Tammeleht E, Hindrikson M, Østbye K, Østbye E, Lauritzen S-E, Austin J, et al. 2011. Late-Quaternary biogeographic scenarios for the brown bear (Ursus arctos), a wild mammal model species. Quat. Sci. Rev. 30:418–430.
Drummond AJ, Suchard MA, Xie D, Rambaut A. 2012. Bayesian phylogenetics with BEAUti and the BEAST 1.7. Mol. Biol. Evol. 29:1969–1973.
Edwards CJ, Suchard MA, Lemey P, Welch JJ, Barnes I, Fulton TL, Barnett R, O´Conell TC, Coxon P, Monaghan N, et al. 2011. Ancient Hybridization and an Irish Origin for the Modern Polar Bear Matriline. Curr. Biol. 21:1251–1258.
Excoffier L, Lischer HEL. 2010. Arlequin suite ver 3.5: a new series of programs to perform population genetics analyses under Linux and Windows. Mol. Ecol. Resour. 10:564–567.
Fu Y-X. 1997. Statistical Tests of Neutrality of Mutations Against Population Growth, Hitchhiking and Background Selection. Genetics 147:915–925.
Fu YX, Li WH. 1993. Statistical tests of neutrality of mutations. Genetics 133:693–709.
by guest on March 26, 2014
http://mbe.oxfordjournals.org/
Dow
nloaded from
30
Geraldes A, Carneiro M, Delibes-Mateos M, Villafuerte R, Nachman MW, Ferrand N. 2008. Reduced introgression of the Y chromosome between subspecies of the European rabbit (Oryctolagus cuniculus) in the Iberian Peninsula. Mol. Ecol. 17:4489–4499.
Greminger MP, Krützen M, Schelling C, Pienkowska-Schelling A, Wandeler P. 2010. The quest for Y- chromosomal markers - methodological strategies for mammalian non-model organisms. Mol. Ecol. Resour. 10:409–420.
Hailer F, Kutschera VE, Hallström BM, Fain SR, Leonard JA, Arnason U, Janke A. 2013. Response to Comment on “Nuclear Genomic Sequences Reveal that Polar Bears Are an Old and Distinct Bear Lineage.” Science. 339:1522–1522.
Hailer F, Kutschera VE, Hallstrom BM, Klassert D, Fain SR, Leonard JA, Arnason U, Janke A. 2012. Nuclear Genomic Sequences Reveal that Polar Bears Are an Old and Distinct Bear Lineage. Science. 336:344–347.
Hellborg L, Ellegren H. 2004. Low levels of nucleotide diversity in mammalian Y chromosomes. Mol. Biol. Evol. 21:158–163.
Hellborg L, Gündüz I, Jaarola M. 2005. Analysis of sex-linked sequences supports a new mammal species in Europe. Mol. Ecol. 14:2025–2031.
Hewitt G. 2000. The genetic legacy of the Quaternary ice ages. Nature 405:907–913. Hirata D, Mano T, Abramov AV, Baryshnikov GF, Kosintsev PS, Vorobiev AA, Raichev EG, Tsunoda H,
Kaneko Y, Murata K, et al. 2013. Molecular phylogeography of the brown bear (Ursus arctos) in Northeastern Asia based on analyses of complete mitochondrial DNA sequences. Mol. Biol. Evol. 30:1644–1652.
Ho SYW, Saarma U, Barnett R, Haile J, Shapiro B. 2008. The effect of inappropriate calibration: three case studies in molecular ecology. PLoS One 3:e1615.
Hughes JF, Rozen S. 2012. Genomics and genetics of human and primate Y chromosomes. Annu. Rev. Genomics Hum. Genet. 13:83–108.
Huson DH, Bryant D. 2006. Application of phylogenetic networks in evolutionary studies. Mol. Biol. Evol. 23:254–267.
Ingman M, Gyllensten U. 2001. Analysis of the complete human mtDNA genome: methodology and inferences for human evolution. J. Hered. 92:454–461.
Innan H, Zhang K, Marjoram P, Tavaré S, Rosenberg NA. 2005. Statistical tests of the coalescent model based on the haplotype frequency distribution and the number of segregating sites. Genetics 169:1763–1777.
Keis M, Remm J, Ho SYW, Davison J, Tammeleht E, Tumanov IL, Saveljev AP, Männil P, Kojola I, Abramov AV, et al. 2013. Complete mitochondrial genomes and a novel spatial genetic method reveal cryptic phylogeographical structure and migration patterns among brown bears in north-western Eurasia. J. Biogeogr. 40:915–927.
Kohn M, Knauer F, Stoffella A, Schröder W, Pääbo S. 1995. Conservation genetics o the European brown bear - a study using excremental PCR of nuclear and mitochondrial sequences. Mol. Ecol. 4:95–103.
Kopatz A, Eiken HG, Hagen SB, Ruokonen M, Esparza-Salas R, Schregel J, Kojola I, Smith ME, Wartiainen I, Aspholm PE, et al. 2012. Connectivity and population subdivision at the fringe of a large brown bear (Ursus arctos) population in North Western Europe. Conserv. Genet. 13:681–692.
Korsten M, Ho SYW, Davison J, Pähn, B, Vulla E, Roht M, Tumanov IL, Kojola I, Andersone-Lilley Z, Ozolins J, et al. 2009. Sudden expansion of a single brown bear maternal lineage across northern continental Eurasia after the last ice age: a general demographic model for mammals? Mol. Ecol. 18:1963–1979.
Lawson Handley LJ, Berset-Brändli L, Perrin N. 2006. Disentangling reasons for low Y chromosome variation in the greater white-toothed shrew (Crocidura russula). Genetics 173:935–942.
Li B, Zhang G, Willerslev E, Wang J. 2011. Genomic data from the Polar Bear (Ursus maritimus). Gigascience:http://dx.doi.org/10.5524/100008.
Librado P, Rozas J. 2009. DnaSP v5: A software for comprehensive analysis of DNA polymorphism data. Bioinformatics 25:1451–1452.
Lindqvist C, Schuster SC, Sun Y, Talbot SL, Qi J, Ratan A, Tomsho LP, Kasson L, Zeyl E, Aars J, et al. 2010. Complete mitochondrial genome of a Pleistocene jawbone unveils the origin of polar bear. Proc. Natl. Acad. Sci. U. S. A. 107:5053–5057.
Lippold S, Knapp M, Kuznetsova T, Leonard JA, Benecke N, Ludwig A, Rasmussen M, Cooper A, Weinstock J, Willerslev E, et al. 2011. Discovery of lost diversity of paternal horse lineages using ancient DNA. Nat. Commun. 2:450.
Luo S-J, Johnson WE, David VA, Menotti-Raymon M, Stanyon R, Cai QX, Beck T, Yuhki N, Pecon-Slattery J, Smith, JLD, et al. 2007. Development of Y chromosome intraspecific polymorphic markers in the Felidae. J. Hered. 98:400–413.
by guest on March 26, 2014
http://mbe.oxfordjournals.org/
Dow
nloaded from

31
McLellan BN, Hovey FW. 2001. Natal dispersal of grizzly bears. Can. J. Zool. 79:838–844. Meadows JRS, Hanotte O, Drögemüller C, Calvo J, Godfrey R, Coltman D, Maddox JF, Marzanov N, Kantanen
J, Kijas JW. 2006. Globally dispersed Y chromosomal haplotypes in wild and domestic sheep. Anim. Genet. 37:444–453.
Meirmans PG, Van Tienderen PH. 2004. GENOTYPE and GENODIVE: two programs for the analysis of genetic diversity of asexual organisms. Mol. Ecol. Notes 4:792–794.
Miller W, Schuster SC, Welch AJ, Ratan A, Bedoya-Reina OC, Zhao F, Kim HL, Burhans RC, Drautz DI, Wittekindt NE, et al. 2012. Polar and brown bear genomes reveal ancient admixture and demographic footprints of past climate change. Proc. Natl. Acad. Sci. 109:E2382–E2390.
Nakagome S, Pecon-Slattery J, Masuda R. 2008. Unequal rates of Y chromosome gene divergence during speciation of the family Ursidae. Mol. Biol. Evol. 25:1344–1356.
Paetkau D, Amstrup SC, Born EW, Calvert W, Derocher AE, Garner GW, Messier F, Stirling I, Taylor MK, Wiig Ø, et al. 1999. Genetic structure of the world’s polar bear populations. Mol. Ecol. 8:1571–1584.
Paetkau D, Shields GF, Strobeck C. 1998. Gene flow between insular, coastal and interior populations of brown bears in Alaska. Mol. Ecol. 7:1283–1292.
Paetkau D, Waits LP, Clarkson PL, Craighead L, Strobeck C. 1997. An Empirical Evaluation of Genetic Distance Statistics Using Microsatellite Data From Bear (Ursidae) Populations. Genetics 147:1943–1957.
Pérez T, Hammer SE, Albornoz J, Domínguez A. 2011. Y-chromosome phylogeny in the evolutionary net of chamois (genus Rupicapra). BMC Evol. Biol. 11:272.
Petit E, Balloux F, Excoffier L. 2002. Mammalian population genetics: why not Y? Trends Ecol. Evol. 17:28–33. Petit RJ, Excoffier L. 2009. Gene flow and species delimitation. Trends Ecol. Evol. 24:386–393. Pidancier N, Jordan S, Luikart G, Taberlet P. 2006. Evolutionary history of the genus Capra (Mammalia,
Artiodactyla): discordance between mitochondrial DNA and Y-chromosome phylogenies. Mol. Phylogenet. Evol. 40:739–749.
Purvis A. 2005. Phylogeny and Conservation. Cambridge: Cambridge University Press Pusey A. 1987. Sex-biased dispersal and inbreeding avoidance in birds and mammals. Trends Ecol. Evol. 2:295–
299. Roca AL, Georgiadis N, O’Brien SJ. 2005. Cytonuclear genomic dissociation in African elephant species. Nat.
Genet. 37:96–100. Sacks BN, Brown SK, Stephens D, Pedersen NC, Wu J-T, Berry O. 2013. Y Chromosome Analysis of Dingoes
and Southeast Asian Village Dogs Suggests a Neolithic Continental Expansion from Southeast Asia Followed by Multiple Austronesian Dispersals. Mol. Biol. Evol. 30:1103–1118.
Subramanian S, Denver DR, Millar CD, Heupink T, Aschrafi A, Emslie SD, Baroni C, Lambert DM. 2009. High mitogenomic evolutionary rates and time dependency. Trends Genet. 25:482–486.
Taberlet P, Bouvet J. 1994. Mitochondrial DNA polymorphism, phylogeophraphy, and conservation genetics of the brown bear Ursus acrctos in Europe. Proc. R. Soc. B-Biological Sci. 255:195–200.
Taberlet P, Fumagalli L, Wust-Saucy A, Cosson J. 1998. Comparative phylogeography and postglacial colonization routes in Europe. Mol. Ecol. 7:453–464.
Tajima F. 1989. Statistical method for testing the neutral mutation hypothesis by DNA polymorphism. Genetics 123:585–595.
Tammeleht E, Remm J, Korsten M, Davison J, Tumanov I, Saveljev A, Männil P, Kojola I, Saarma U. 2010. Genetic structure in large, continuous mammal populations: the example of brown bears in northwestern Eurasia. Mol. Ecol. 19:5359–5370.
Tamura K, Peterson D, Peterson N, Stecher G, Nei M, Kumar S. 2011. MEGA5: molecular evolutionary genetics analysis using maximum likelihood, evolutionary distance, and maximum parsimony methods. Mol. Biol. Evol. 28:2731–2739.
Waits L, Taberlet P, Swenson JE, Sandegren F, Franzén R. 2000. Nuclear DNA microsatellite analysis of genetic diversity and gene flow in the Scandinavian brown bear (Ursus arctos). Mol. Ecol. 9:421–431.
Wayne RK, Van Valkenburgh B, O’Brien SJ. 1991. Molecular distance and divergence time in carnivores and primates. Mol. Biol. Evol. 8:297–319.
Wei W, Ayub Q, Chen Y, McCarthy S, Hou Y, Carbone I, Xue Y, Tyler-Smith C. 2013. A calibrated human Y-chromosomal phylogeny based on resequencing. Genome Res. 23:388–395.
Willard HF. 2003. Tales of the Y chromosome. Nature 423:810–813. Wilson Sayres MA, Lohmueller KE, Nielsen R. 2014. Natural selection reduced diversity on human y
chromosomes. PLoS Genet. 10:e1004064.
by guest on March 26, 2014
http://mbe.oxfordjournals.org/
Dow
nloaded from
32
Xue Y, Wang Q, Long Q, Ng BL, Swerdlow H, Burton J, Skuce C, Taylor R, Abdellah Z, Zhao Y, et al. 2009. Human Y chromosome base-substitution mutation rate measured by direct sequencing in a deep-rooting pedigree. Curr. Biol. 19:1453–1457.
Zedrosser A, Støen O-G, Sæbø S, Swenson JE. 2007. Should I stay or should I go? Natal dispersal in the brown bear. Anim. Behav. 74:369–376.
Zerjal T, Xue Y, Bertorelle G, Wells RS, Bao W, Zhu S, Qamar R, Ayub Q, Mohyuddin A, Fu S, et al. 2003. The genetic legacy of the Mongols. Am. J. Hum. Genet. 72:717–721.
by guest on March 26, 2014
http://mbe.oxfordjournals.org/
Dow
nloaded from
33
Figures
Figure 1 – map
by guest on March 26, 2014
http://mbe.oxfordjournals.org/
Dow
nloaded from
34
Figure 2 – network and trees
by guest on March 26, 2014
http://mbe.oxfordjournals.org/
Dow
nloaded from
35
Figure 3 – intraspecific networks
by guest on March 26, 2014
http://mbe.oxfordjournals.org/
Dow
nloaded from
Copyright © 2022 FDOKUMEN