
The AER Approach to Establishing the Cost of Equity
39
1 The AER Approach to Establishing the Cost of Equity – Analysis of the Method Used to Establish the Risk Free Rate and the Market Risk Premium Alan Gregory 1 Professor of Corporate Finance, Xfi Centre, University of Exeter Contact details: e-mail: [email protected] Telephone: +44 776 700 6730 1 Note that the views expressed in this report are entirely my own and should in no way be taken to reflect those of the Xfi Centre, University of Exeter.
-
Upload
khangminh22 -
Category
Documents
-
view
1 -
download
0
Transcript of The AER Approach to Establishing the Cost of Equity

1
The AER Approach to Establishing the Cost of Equity – Analysis of the
Method Used to Establish the Risk Free Rate and the Market Risk
Premium
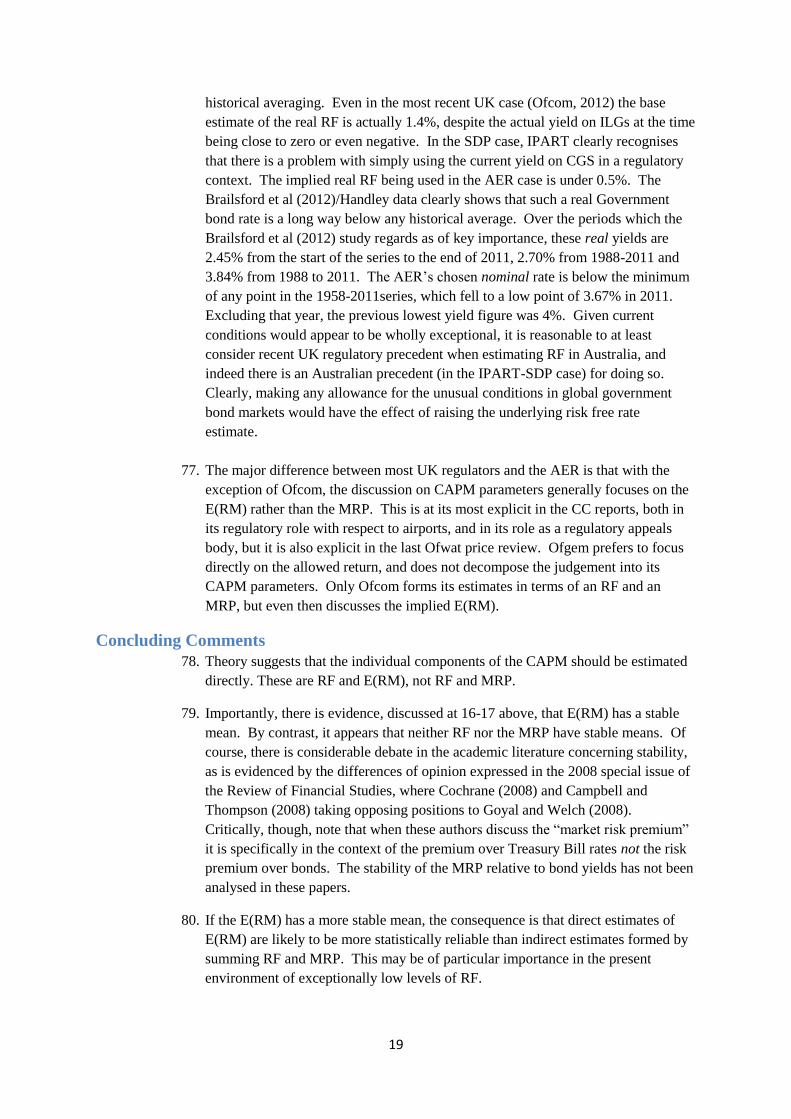
Alan Gregory1
Professor of Corporate Finance, Xfi Centre, University of Exeter
Contact details:
e-mail: [email protected]
Telephone: +44 776 700 6730
1 Note that the views expressed in this report are entirely my own and should in no way be taken to reflect those
of the Xfi Centre, University of Exeter.

2
The AER Approach to Establishing the Cost of Equity – Analysis of the
Method Used to Establish the Risk Free Rate and the Market Risk
Premium
Introduction
I have been asked to prepare an expert report which considers the following issues
arising from the AER’s recent decision in the Roma to Brisbane Pipeline Final
Decision and the Draft Decisions for the Gas Distributors (Envestra, Multinet and
SP AusNet) and APA GasNet (together, the Gas Businesses)2: (a) Is the AER’s
approach to estimating the cost of equity in these decisions consistent with the
approach adopted by the UK regulator, Ofgem and UK appeals body, the
Competition Commission?; (b) In light of the UK regulatory approach, is the
AER’s approach to estimating the cost of equity for the Gas Businesses likely to
result in a rate of return that satisfies the requirements of Rule 87(1) of the National
Gas Rules that: “The rate of return on capital is to be commensurate with
prevailing conditions in the market for funds and the risks involved in providing
reference services”; (c) In light of the recent Tribunal findings on the cost of capital,
the recent IPART Review of water prices for the Sydney Desalination Plant Pty
Ltd, and the implications of UK regulatory practice for Australia, how might the gas
businesses best estimate the cost of equity in order to satisfy the requirements of 87(1)
and 87(2) of the National Gas Rules? In answering this question, I have been asked
to explain the extent to which the UK regulatory approach, including the
regulator’s objectives, is likely to be relevant in Australia.
Executive Summary
1. In forming my views on the above question, I draw on theory and also contrast the
AER position with that in recent UK regulatory cases. I focus on those regulators
who make full use of the Capital Asset Pricing Model (CAPM) preferred by the
AER, and in particular recent appeals cases to the UK Competition Commission
(CC), which is the body to which regulatory pricing appeals are made in the UK.
2. The general summary of the UK process is that a number of different regulators set
prices for utilities based upon an expected return (the weighted average cost of
capital, WACC) applied to a Regulatory Asset Base (RAB). Prices are then set
using an RPI+/-x formula, which in effect governs the timing of the revenue
stream, though should not influence its present value. The final price determination
is made after conducting a “financeability” test, essentially a forecast of the
revenues and costs implied by the allowed WACC. This test is used to determine
whether the assumed levels of debt can be serviced whilst the debt remains at
investment grade. This is interpreted as an NPV-neutral adjustment, i.e. an
adjustment to the “glide path” of revenues rather than to the present value of
revenues.
2 I am aware that the report will also be used by Envestra for the AER’s review of Envestra’s Access
Arrangement for its Albury Distribution Network.

3
3. The relevant utilities and their regulators are: Electricity and Gas networks,
regulated by Ofgem; Regulated Airports (Heathrow, Gatwick and Stansted),
currently regulated by the CAA but with automatic referral to the CC; the
communications industry, where price regulation is concerned with access to BT
networks and mobile telephone termination charges, regulated by Ofcom; the water
industry, consisting of water only companies (WoCs) and water and sewerage
companies (WaSCs), regulated by Ofwat. In addition, Network Rail is regulated
by the Office of the Rail Regulator (ORR).
4. In summary, my view is that the AER is in error in its assessment of the cost of
equity capital for the Gas Businesses and has significantly under-estimated that
cost of equity.
5. It has made such an error because it has been inconsistent in its approach to
estimating the market risk premium (MRP) and in doing so has combined two
different measures of the risk free rate into its Capital Asset Pricing Model
(CAPM) estimate of the cost of equity. In my view, combining such different
measures is illogical and is therefore “unreasonable”, in the sense set out in
paragraphs 50-55 of the Australian Competition Tribunal’s Decision of 11th
January 2012.
6. In more detail, it has combined an MRP that has been largely derived from
historical observation with a current spot rate estimate of the risk free rate. In
doing so, it has assumed that the MRP is constant, and has made no allowance for
any possible inverse relationship between the risk free rate and the MRP. Other
regulators, both in the UK and in Australia (IPART) are aware of this potential
relationship and have made due allowance for it.
7. The AER could have adopted one of two consistent approaches that would have
avoided this error. It could either have estimated the expected return on the market
directly, and used this estimate with its preferred risk free rate in the CAPM. As I
explain below, this would have been in line with the approach recommended to UK
regulators in the Smithers’ Report, 2003.
8. Alternatively, it could have made allowance for the exceptional conditions in
global government bond markets, following the global financial crisis and
international quantitative easing programmes, and used an estimate of the risk free
rate determined largely from historically observed rates. This would then have
been consistent with its use of an MRP based largely on historically observed
MRPs.
A Comparison of the AER treatment of RF and MRP in the Case
Compared with Theory
9. I note that the AER judgement is delivered in nominal terms. In the Gas
Distribution and APA GasNet cases, the AER starts with the use of the current
yield on the ten year Commonwealth Government Securities (CGS) as the proxy
for the risk free rate (RF). This yield is 2.98%. The forecast inflation rate for the

4
period under consideration is 2.5% which implies the real risk free rate is 0.47%.3
Two questions arise with regard to this rate. First, is this an adequate proxy for RF
in the context of the CAPM? Second, is the RF proxy consistent with the other
elements used in the CAPM as applied in this case?
10. Second, the MRP is taken as 6% nominal. The implication is that the expected
return E(RM) on the Australian market in nominal terms is 8.98% nominal, or
6.32% in real terms.4
11. At this point it is worth emphasising exactly what asset pricing theory tells us that
the basic CAPM relationship is, in terms of deriving the expected return on any
asset (Ri):
(1)
12. The term in parentheses is often abbreviated to the “equity risk premium” or
“market risk premium”, but writing the equation out in its original form serves as a
reminder that the precise definition of MRP is the expected return on the market
(E[RM]) minus the risk free rate, RF. As Jenkinson (1993) points out, the
important point is that there is only one RF term on the right hand side of the
CAPM, not two.
13. A very common error, which has been discussed in recent UK regulatory appeals,
is to implicitly assume the two RF terms are different. An example would be
where a current estimate of the risk free rate (say the yield on a government bond)
is combined with an historically derived estimate of the MRP. In such a case, the
version of the CAPM being employed is actually:
(2)
14. This simply illustrates Jenkinson’s point that two different RF terms have been
employed, and there is no theoretical validity in such a model. In general, the
correct model to apply is:
(3)
Where E(Ri) and E(RM) denotes the expected return on the equity of firm i and the
market respectively.
15. A central question is how best to estimate the common components in (3), namely
RF and E(RM). As The Smithers & Co Report, 2003, (“The Smithers Report”)
makes clear, given the problem is to estimate expected returns, it is important that
in assessing long run averages of RM and RF, the data are treated consistently.
Second, if long run averages are to be used, then it is important to select a long
enough period so that expectations errors cancel out.
16. Clearly, if long run historical returns are the best guide to expected returns, RM
expectations could, in principle, be estimated by adding some historical estimate of
3 The precise calculation is that (1 + real rate) = (1 + nominal rate)/(1 + expected inflation rate)
4 See footnote 1.

5
the MRP to the estimate of RF, but only if the risk-free rate is stable over time,
implying that the market risk premium is also stable. Alternatively, RM
expectations can be estimated directly from the historical estimate of the RM series
itself. Doing so implies that it is the return on equities that is stable, and places no
constraint on the stability of either RF or MRP.
17. The Smithers Report is absolutely unequivocal on this point, and by examining the
international cross-section of realised returns from Dimson, Marsh and Staunton
(2001) shows that the return on equities is more stable than the MRP. The real risk
free rate does not have a stable mean, based on both the international evidence on
the cross-section of real risk free rates, and on a very long run analysis that uses
Siegel’s (1998) US data set. As the real RF is not stable, the authors conclude that
the MRP is less statistically reliable.5 Note that this has particularly serious
implications for Australia, as the evidence in Brailsford, Handley and Maheswaran
(2008, 2012), which the AER appear to rely on at pp 67-69 of the Roma to
Brisbane Pipeline case and which forms the basis of the Handley data cited at pp
106-107 of the SP AusNet Draft Decision, makes it clear that there are structural
changes in their bond series at several points. So if the problem of a non-stable
mean is found in the international data, it is not likely to be less of a problem in
Australia where the underlying bonds used to compute the series change through
time.
18. An updated illustration of the international cross-sectional data is provided in
Figure 1.6 The chart clearly shows that the volatility of the real MRP is greater
than the volatility of the real RM (precisely, the respective standard deviations are
1.66% and 1.26% respectively). As can be seen the “risk free” return shows
considerable cross-sectional volatility, a problem in part caused by inflation risk.
19. Fortunately, as The Smithers Report makes clear, the solution to this problem is
straightforward. As the return on equities series does appear to have a stable mean,
one can simply use that series directly to obtain estimates of E(RM) in the CAPM
(i.e. in [3] above).
20. Had the AER used this (statistically valid) approach in establishing the parameters
in its estimate, still using the data it draws upon in Table 2.2, then the Brailsford et
al (2008, 2012) data underlying Table 2.2 of The Roma Pipeline case (see footnote
146) and Table 4.3 is the APA Gasnet case, suitably updated, would have shown
that the arithmetic average of the real RM of 8.6% for the Australian market over
the period for which the authors regard reliable data as having been available
(1958-2011), assuming that gamma is 0.25.7 Coupled with the assumed inflation
rate of 2. 5% in the Gas Business cases, this implies a nominal estimate of the
expected return on the market of 11.31%, or 11.03% with zero adjustment for
imputation credits. This contrasts with the AER’s implied estimate of this same
5 See also the 2006 Smithers & Co report for Ofgem.
6 The figures underlying this chart are from Dimson, Marsh and Staunton (2012), Tables 2, 5 and 10.
7 The equivalent estimate of the real Government bond return over this period was 2.7% whilst the mean real
MRP was 5.90%. If γ= 0, i.e. the value of tax credits is assumed to be zero, the equivalent real RM is 8.33%
and the real MRP is 5.63%.

6
E(RM) of 8.98%, which represents a baseline cost of equity for the market of 233
basis points lower than would appear to be justified by the historical data series in
Brailsford et al (2012).
21. We can anchor this 1958-2005 estimate by using the most widely-cited
international evidence of Dimson, Marsh and Staunton (2012), henceforth DMS.
They show that for 1900-2011, the real mean realised RM for Australia is 8.9%
(arithmetic). 8 The mean long run real bond rate is 2.4% (arithmetic). Again
applying the forecast inflation rate of 2.5%, were one to use these historical
estimates of real RM as an estimate the expected RM, the arithmetic average
implies an E(RM) of 11.62%. Note that the DMS figures assume that the value of
imputation tax credits is zero.
22. As the Smithers Report makes clear, the appropriate way to derive a market risk
premium is to calculate it as the difference between the E(RM) and RF estimates.
At an RF of 2.98%, this implied MRP is 8.33% on an arithmetic average basis,
using the Brailsford et al (2011) data and a γ value of 0.25, and 8.64% using DMS
data and a γ value of zero. The APA GasNet proposed E(RM) estimate of 8.5% is
between these two estimates.
23. Note that the authors of the Smithers Report see a considerable advantage to
regulators in focusing on the relative stability of the market return: “The relatively
greater importance of the market return is fortunate for the regulators, since we
argue that there is considerably more uncertainty about the true historic risk-free
rate, and hence the equity premium, than there is about the market return itself.
The historic size of the equity premium is still the subject of considerable
puzzlement and controversy amongst academics; but this is largely due to the
historic behaviour of the risk-free rate (proxied by the short-term interest rate). In
contrast, we summarise a range of evidence that the equity return has, over
reasonably long samples, been fairly stable both over time, and across different
markets”
24. This is “fortunate” because the derivation of expected return from the CAPM given
by (3) above can be re-written as:
25. (4)
26. So provided the beta is greater than 0.5 (which is the case for most utilities in
general, and is the case here where the Gas Businesses’ beta is 0.8), then greater
weight is placed on the second component of (4), the E(RM), for which estimates
are less uncertain.
27. The appropriate proxy for the risk free rate is the subject of some debate. Both the
Smithers Report 2003 and the 2006 Smithers & Co report argue that the lack of
evidence for a stable mean lends some weight to the case for using current
estimates rather than historical averages. However, they then draw attention to the
8 Dimson, Marsh and Staunton (2012) Credit Suisse Global Investment Returns Sourcebook (Table 13, p.57)

7
need to take account of distortions to bond markets, and so anchor their RF
estimates using a “Taylor Rule”.9 This leads them to recommend a 2.5% real RF.
28. However, the conclusion of the Smithers Report10
with regard to regulatory
estimation using the CAPM is worth stressing:“we regard the standard approach
to building up the cost of equity, from estimates of the safe rate and the equity
premium, as problematic. We would recommend, instead, that estimates should be
derived from estimates of the aggregate equity return (the cost of equity for the
average firm), and the safe rate.”
29. This message has been heeded by UK regulators and is explicitly referred to in
recent regulatory cases and in regulatory appeals to the UK Competition
Commission (see below).
30. The question in this case is therefore whether the AER has consistently applied
version (3) of the CAPM in this case, or whether it has, however inadvertently,
committed the error described in (2). In this regard, I note that the AER at no point
discussed an expected RM. In effect, it simply assumes that adding an MRP to its
chosen RF will give the correct estimate of RM.
31. At 2.3.1 in the Roma to Brisbane Pipeline case the AER makes clear that its chosen
estimate for RF is an average of 10 year CGS yields for the period 25th June to 20
th
July 2012, whilst in the Gas Businesses Case the average is for the 20 business
days ended on the 10th of August. To consistently apply the CAPM it should,
therefore, have used an estimate of the expected RM on a reasonable basis, and
subtracted from that the same average of 10 year CGS yields. The evidence in
2.3.2 of the Roma to Brisbane Pipeline case and in the Gas Business cases suggest
that they have not done so. Table 2.2 in the Roma to Brisbane Pipeline case and,
for example, Table 4.3 (p.87) in the APA GasNet case shows estimates of the
historically derived MRP. For the reasons set out above, whilst it would have been
correct to use these historical data series to measure historic RM directly, it is not
valid to take an MRP from this historical data series and match it with an RF
derived from forward looking data.
32. Had they adopted the approach recommended in the Smither’s Report (2003), then
the estimated cost of equity for the firm (following 20 above) would have been
2.98% + 0.8 x (11.31% - 2.98%) = 9.64%.
33. It would, however, have been consistent to estimate the CAPM on the basis of both
an historical averages of RF and the MRP. Given that the estimates are made in
nominal terms, a consistent approach would have been to calculate the real return,
based upon the arithmetic means from the Brailsford et al (2012) updated data of a
2.7% real RF and a 5.9% MRP, then uplift these to allow for the compounding
effect of the estimated inflation rate.
9 To quote from a Federal Reserve working paper by Orphanides (2007)”Taylor rules are simple monetary
policy rules that prescribe how a central bank should adjust its interest rate policy instrument in a systematic manner in response to developments in inflation and macroeconomic activity.” See: http://www.federalreserve.gov/pubs/feds/2007/200718/200718pap.pdf 10
P.48

8
34. This would have resulted in a real cost of equity in the case of 2.7% + (0.8 x 5.9%)
= 7.42%, and a nominal cost of equity of 10.10%.11
35. Note that the consistently estimated approaches in 32 and 34 give cost of equity for
the firm that are within 46 basis points of each other, whilst both are clearly some
way in excess of the allowed cost of equity in this case of 7.78%.
36. The substantial point is that in not treating the historical data consistently, the AER
has either under-estimated the cost of capital implied by under-estimating the
MRP, or it has under-estimated the cost of capital by under-estimating the RF
component of (3). Either interpretation is equally valid, but the key point is that the
AER’s approach is producing an error as indicated by (2).
37. A curiosity is that the AER apparently recognise that the MRP and the RFR may be
negatively correlated at several points. For example, in Appendix B, pages 4-5 of
the Multinet case, the AER states “a flight to quality changes investor expectations
and perceptions of the relative value of a risk free asset and would not undermine
the risk-free nature of the asset”.12
It is making this point to underscore why it
believes that the current CGS yield is the appropriate measure of RF, but in doing
so it is blind to the corollary, which is that if investors’ perceptions of the relative
risk of the risk free asset changes, either equity prices themselves will fall,
implying an increase in the E(RM), or, if equity prices are unaffected, then E(RM)
will stay the same. The implication of either outcome must be that the MRP,
measured as the difference in expected return between the risk free asset and a
risky one, will increase. This possible linkage is explicitly recognised by other
regulators, both in the UK and in Australia, as I discuss further below.
38. Similarly, when discussing the spread between CGS yields and other debt yields, at
Appendix B, p7 of the Multinet case “The AER accepts that the spread between the
yield on CGS and other debt securities has increased since the onset of the GFC”.
It seems logically inconsistent to recognise that the MRP on corporate bonds has
increased, yet refuse to acknowledge that the MRP on equities has increased.
39. At p.103 (attachment 4) in the Multinet case, the AER acknowledges “a possible
negative relationship between the risk free rate and the MRP in certain
circumstances”. It then cites Associate Professor Lally as describing such a
relationship as “plausible” before observing Australia is not in depressed economic
conditions, which fails to acknowledge that Australia is part of a globally
integrated capital market (see also 43 below). He also fails to acknowledge that the
subsequent correction in the ten year MRP he speculates upon could be caused by
the RFR rising rather than the E(RM) falling. This observation highlights the
importance of consistent measurement approaches for the MRP and RF, which, as
already explained, is not achieved by combining a long term average MRP with a
current Rf. Lally’s dismissal of the importance of the relationship between MRP
and RF seems to be almost entirely speculative.
11
The equivalent cost of equity if γ is assumed to be zero is 9.88%. 12
Emphasis added.

9
40. There are other logical inconsistencies in the AER arguments in the Gas Business
cases. For example, at Appendix B, page 12 of the Multinet report, it argues
against using long run average historical estimates of the risk free rate, and states
“This is because...there is limited evidence that the cost of equity is stable though
time, a long run average is not consistent with the present value principle”.13
Yet
in using an MRP over the CGS yield, the AER assumes that the MRP is more
stable than the cost of equity itself. There is no evidence produced anywhere in the
cases to justify this position. At page 93 in Appendix B of the Multinet case, the
AER cites Goyal and Welch (2008) in apparent support of a stable MRP. There are
several problems here. First, Goyal and Welch (2008) do not compare the stability
of MRP with that of the return on the market. As noted in 17 and 18 above, when
this comparison is made in real terms, there is evidence that RM is more stable than
the MRP. Second, Goyal and Welch (2008) specifically examines the stability of a
risk premium measured relative to a short term Treasury Bill rate, not relative to a
ten year government bond rate. Third, Goyal and Welch’s findings are challenged
by two other papers in the same edition of Review of Financial Studies (Cochrane
[2008] and Campbell and Thompson [2008]). The AER has fixed on the Goyal and
Welch study to justify its position, but has apparently disregarded the criticisms of
their paper expressed in the other two studies published at the same time in the
same journal.
41. Furthermore, this issue is explicitly recognised in the recent IPART Review of
water prices for the Sydney Desalination Plant Pty Ltd (SDP), where at p.94 they
state; “We acknowledge the argument that there may be greater stability in the sum
of the market risk premium and the risk free rate (i.e,, the expected market return)
than in the individual components. In the current market circumstances, there is
some evidence, as SDP noted, to support the view that expectations for the market
risk premium have risen as bond yields have fallen.” Noting that it can be difficult
to estimate short term expectation of the MRP, they then say that “An alternative
approach is to look at the long term averages as a reference point for the sum of
the market risk premium and risk free rate”. They next go on to explain
“Therefore, to guide our decision-making on the point estimate for the WACC, we
estimated the long term averages of the risk free rate, inflation rate and the market
risk premium”.
13
Note that a discussion of the present value principle evidence on which the AER relies is the subject of a
separate expert witness report.

10
42. The fact that the AER choose to ignore this important evidence is extraordinary,
given that they themselves cite IPART’s recent decisions in support of their chosen
level of the MRP, for example at Table 4.29 of the SPAusNet Draft Decision. In
citing, inter alia, this IPART decision they justify the relevance of such recent
decisions with the following comment at p.110 of that document: “The AER
considers the decisions by other Australian regulators are relevant because the
MRP is an economy wide measure”. It would seem self evident that the risk free
rate is also an “economy wide measure” and it is highly misleading to cite one
piece of evidence from another regulator without fully acknowledging the context
in which that regulator reached its judgement. IPART correctly considered the
importance of historical averages in forming its assessment of the WACC. The
AER did not.
43. The potential under-estimation of the RF component is given emphasis by
considering that the ten-year bond rate itself has two components – an underlying
short term risk free rate (the Treasury Bill rate) and a maturity premium.
Historically, DMS Table 12 shows that the mean real maturity premium for
Australia has been 1.4% p.a.. The Global mean is 1.2%. Inflation uncertainty
means that it highly likely that investors would normally require a maturity
premium for holding longer maturity bonds. Despite recent market movements,
DMS (page 39) estimate a forward real maturity premium of around 1% p.a.,
globally. The implication is that both the short term risk free rate and the maturity
premium are at very low levels, highlighting the unusual conditions that prevail in
risk-free asset markets.
44. At Appendix B, page 96 in the Multinet case, the AER makes the statement that the
MRP is for a domestic CAPM, so that overseas evidence has limited relevance.
This will not be the case in globally integrated markets, since the risk free rate will
be determined by the International Fisher equilibrium relationships (with
appropriate adjustment for default risk), and the MRP should be related to the
relative systematic risk of the Australian market in the context of a global CAPM.
The Smithers Report specifically acknowledges the importance of international
evidence. In the case of the Gas Businesses, one cannot ignore the importance of
global financial forces. I return to this point in 51 below.
45. The AER discusses other regulatory cases in Australia, though not the IPART
Review referred to above. At 56-75 below, I set out some recent UK cases, not to
draw a contrast with the values of parameters (which one would expect to be
different for Australia, as indeed DMS show) but rather to show the way in which
the methodologies for setting the common components of the CAPM vary between
countries.
46. In its assessment of its judgement of the MRP, the AER cites survey evidence, for
example at p.111 of the SP AusNet Draft Decision. The surveys quoted suffer
from a number of problems. First, they are not all consistent with the period from
which the RF is derived. Clearly there has been downward pressure on
Government bond and Treasury Bill rates throughout that period. Second, it is
unclear whether these estimates relate to arithmetic or geometric means. Third, it
is unclear which measure of RF the MRP relates to. Finally, at least one of these

11
surveys refuses to accept that many academics recommend the separate calculation
of components rather than an MRP. This leads to some academics not responding
to the survey and a biased sample may result. But second, it highlights the fact that
according to theory and the empirical evidence discussed above, these surveys are
simply asking the wrong question, and so cannot be relied upon.
47. The AER’s consideration of the dividend growth model (DGM) estimates conflates
their use in two entirely separate contexts. In the US, the model is used at a firm
level, using analysts’ forecasts. Whether or not the US has “higher quality” data,
as suggested in footnote 173 of the Roma to Brisbane Pipeline report, this rather
misses the point that the use of DGM models in such a fashion suffers from a
potential problem of circularity. In the context in which the model is being
presented in Table 2.5 of the Roma to Brisbane Pipeline Report and Table B.4 of
the Multinet Report, it is clear that the DGM is being used to estimate a market-
wide cost of equity. Although the precise detail of the calculations are not given, it
seems clear that the way in which the MRP is being calculated is internally
consistent, in that a forward estimate of the E(RM) is being derived, from which is
subtracted some current estimate of RF. At page 37 of Appendix B, the AER
seems to entirely miss the point in saying “NERA’s DGM estimates also illustrated
this problem [the problem being that the MRP varies as the risk free rate
changes]......This difference was the result of the lower risk free rate”. But this, of
course, is exactly what one would expect if the E(RM) is stable but the risk free
rate is not.
48. Whilst the point about the difficulty of forward projection is well understood, one
way of objectifying such projections is to assume mean reversion in the dividend
yield. The approach is that of Fama and French (2002) and is described in detail
in the appendix. Briefly, the theory behind such a decomposition is that some
elements of historical return can be attributed to revision in expectations or higher
than expected realisations in firm cash flows. By considering only the mean
dividend yield and the historically achieved growth, it is possible to estimate what
future returns on the market would have expected at points in the past given mean
reversion in these parameters. Using the updated Brailsford et al (2012) data for
the period 1958-2011, assuming γ=0.25 once imputation credits start in 1988, and
applying the Fama and French (2002) methodology, the implied real expected
historical dividend yield and growth series would give an estimated real E(RM) of
8.14%.14
49. Uplifting this using the AER inflation forecast we obtain a nominal E(RM) of
11.03% which implies that the expected MRP at the AER risk free rate of 2.98% is
8.05% (7.62% assuming γ=0). As a way of anchoring this estimate, an alternative
calculation can be made using the approach in Dimson et al (2007), updated using
the 1900-2011 data series from DMS 2012. Their approach does not allow for any
imputation tax credit value, and uses a log decomposition approach, and gives an
arithmetic average implied MRP estimate of 7.45% to 7.97% (see Appendix for
detail). Whilst these two alternative estimates are derived from a completely
different estimation process, the range of these estimates is nonetheless consistent
14
See Appendix for details of the calculation.

12
with the Table B.2 estimates. The fact that these cross-checks agree suggests that
the DGM should not be so readily dismissed as a technique for establishing the
E(RM). Finally, it should be noted that Professor Lally’s comments, quoted at inter
alia, Appendix B p.37 of the SP AusNet case, seem at variance with the evidence
presented above which shows that globally, the E(RM) is more stable than the
MRP.
50. A number of further points are made from pages 81-84 in the Roma to Brisbane
Pipeline case and the Gas Business cases concerning the estimation of the common
parameters in the CAPM. These are fully addressed by the theoretical and
empirical discussion above, but to reiterate, besides the theoretical preference for
considering the E(RM) and RF components directly, rather than relying on an MRP
estimate (for example, the AER’s perspective at 4.3.4. in the Multinet case is that
MRP is regarded as “an input”, whereas theoretically this is not strictly the case),
there is evidence that RM is more stable than the MRP. These points have been
explicitly recognised in recent UK determinations (see below), and implicitly in the
IPART SDP case cited by the AER (as discussed above at 41-41), yet apparently
disregarded by the AER.
51. One further point needs to be made concerning the RF estimate. It needs to be
borne in mind that the objective is to find a proxy for the unobservable return on a
“pure” risk free asset. This cannot be simply assumed to be the return on a 10-year
CGS. As discussed at 43 above, this bond carries a maturity premium, which
historically has averaged 1.4% p.a.. It seems clear that current yield curves exhibit
a maturity premium well below historical averages, and there is a case for
considering the impact that mean reversion in this premium would have on the ten
year risk free rate estimate. Second, as a nominal instrument the return on such a
bond is subject to inflation risk. Third, there is a coupon reinvestment risk. Fourth,
insofar as the aim is to try and estimate a ten year RF that is consistent with the
AER’s objective of estimating a ten year MRP, at least some attention should be
paid to the impact of any distortions caused by pension fund funding rules and also
by the extraordinary actions of central banks in pursuing quantitative easing (QE).
Whilst QE has not been undertaken in Australia, it seems highly likely there will
have been spill-over effects on CGS yields from such policies being pursued in
other global markets. UK regulators have explicitly recognised the effects of such
distortions (see below). Of course, if the UK practice of separately estimating
components of the CAPM is followed, any uplift to RF has no impact on the cost of
equity for an average (beta equal to one) company. However, it would have a
material impact given that the AER’s approach is to add a fixed MRP to a spot RF
estimate, irrespective of what that spot estimate is.
52. As noted above, these issues have been considered in the recent IPART-SDP
Review. Of particular note is IPART’s decision to consider long term averages in
estimating the risk free rate, which in Table 9.5, p.95 of their review is shown to
give an estimated nominal RF (at an inflation rate of 2.5%) of 5.4%. It is clear that
the AER are aware of IPART’s views on this, given they cite their report, but they
simply ignore the importance of the points made in their draft decisions relating to
the Gas Businesses. As I set out below, the UK regulatory approach also makes

13
use of longer run historical averages of gilt and index-linked gilt rates when
establishing RF.
53. This issue is of particular importance given the highly unusual circumstances in
global financial markets at present. The implied real risk free rate in the AER’s
decision is, as noted above, only 0.47%, an exceptionally low figure. To set this in
context, the updated Brailsford et al (2012) data shows that the long run average
real yield on CGRs was 2.45%, with an average since 1958 of 2.7%, since 1988 of
3.84% and an average over the past ten and twenty years of 2.3% and 3.49%
respectively.
54. As I note above, consistency demands that if the CAPM is to be applied using
historical estimates, then the period over which the MRP is estimated should
directly match the period over which RF is estimated. To the extent that the 6%
MRP adopted by the AER is largely, but not exclusively, determined by the
historical evidence, it is difficult to be prescriptive about exactly which estimate of
RF is best combined with this in current market circumstances, but the pragmatic
solution of both IPART and UK regulators (described in detail below) is to use a
weighted average of the more recent historical averages and the current spot rate,
with the majority of the weight being on the former. Given considerable
uncertainty exists about both the “true” RF and MRP, such an approach is
reasonable, in contrast to the AER’s current position which is not.
55. Alternatively, one can accept a spot rate estimate of RF, but recognising that
E(RM) will not move in line with RF, employ a direct estimate of E(RM), as
described in 20 above. What is clearly invalid is to combine a current spot yield on
a CGR, determined in wholly exceptional market conditions, with a largely
historically determined MRP. This is the AER’s position in the Gas Businesses
case.
Recent determinations in the UK
56. Over the past five years, the following price determinations have been made:
2006 Gas and Electricity Transmission Networks (Ofgem). Due to expire in
March 2012, this has been extended for a further year due to the introduction
of the new RIIO (Revenue using Incentives to deliver Innovation and
Outputs) framework. RIIO would not appear to have any direct implications
for the process by which WACC is set.
2007 Gas Distribution Networks (Ofgem). Five year review.15
2007 CC/CAA London Heathrow and London Gatwick. Five year review.
On cost of capital, the CAA accepted the CC’s recommendations in full.16
2008 CC/CAA London Stansted. Five year review. On cost of capital, the
CAA accepted the CC’s recommendations in full.17
15
See: http://www.ofgem.gov.uk/Networks/GasDistr/GDPCR7-13/Documents1/final%20proposals.pdf 16
See: http://www.competition-commission.org.uk/assets/competitioncommission/docs/pdf/non-
inquiry/rep_pub/reports/2007/fulltext/532af.pdf 17
For CC report concerning cost of capital see: http://www.competition-
commission.org.uk/assets/competitioncommission/docs/pdf/non-
inquiry/rep_pub/reports/2008/fulltext/539al.pdf. For the CAA report see:
http://www.caa.co.uk/docs/5/ergdocs/081209StanstedProposals.pdf

14
2008 Network Rail (ORR).18
2009 Water Companies (Ofwat). 2010-15 price review.19
2009 BT Openreach (Ofcom)20
2009 Electricity Distribution (Ofgem)21
2011 Mobile Call Termination charges (Ofcom)22
2011 Transmission Networks (TPCR4) Roll-over (Ofgem), pending the
introduction of RIIO.23
2012 BT Local Loop Unbundling and Wholesale Line Rental (Ofcom)24
Recent Appeals to CC on Price Determination
57. The following price determination appeals have been referred to the CC:
2009 Hutchinson 3G UK v Ofcom and BT v Ofcom. Mobile Call
Termination. Note that there was no direct appeal on WACC in this case.25
2009 Sutton and East Surrey Water v Ofwat.26
2010 Bristol Water v Ofwat.27
2010 Carphone Warehouse Group v Ofcom. Wholesale Line Rental.28
2010 Carphone Warehouse Group v Ofcom. Local Loop Unbundling.29
2010 Cable and Wireless UK v Ofcom. Leased Lines Charge Control.30
2012 BT v Ofcom. Wholesale Broadband Access charge control.31
2012 BT v Ofcom; Everything Everywhere v Ofcom; Hutchinson 3G UK v
Ofcom and Vodafone v Ofcom. Wholesale Mobile Voice Call Termination.32
58. Note also that the Local Loop Unbundling (LLU) and Wholesale Line Rental
(WLR) Price Determination is currently the subject of a CC appeal by BT.
18
See: http://www.rail-reg.gov.uk/upload/pdf/368.pdf for ORR report and http://www.rail-
reg.gov.uk/upload/pdf/pr08-cepacoc-010408.pdf for the CEPA report. 19
See: http://www.ofwat.gov.uk/pricereview/pr09phase3/det_pr09_finalfull.pdf and
http://www.ofwat.gov.uk/pricereview/pr09phase3/rpt_com_20091126fdcoc.pdf 20
See: http://stakeholders.ofcom.org.uk/binaries/consultations/openreachframework/statement/annexes.pdf 21
See:
http://www.ofgem.gov.uk/Networks/ElecDist/PriceCntrls/DPCR5/Documents1/FP_5_Financial%20Issues.pdf 22
See: http://stakeholders.ofcom.org.uk/binaries/consultations/mtr/statement/MCT_statement.pdf 23
See: http://www.ofgem.gov.uk/Networks/Trans/PriceControls/TPCR4Roll-
over/Documents1/TPCR4_Rollover_Final_Proposals.pdf 24
See: http://stakeholders.ofcom.org.uk/binaries/consultations/wlr-cc-2011/statement/annexesMarch12.pdf 25
See: http://www.competition-commission.org.uk/assets/competitioncommission/docs/pdf/non-
inquiry/appeals/communications_act/mobile_phones_determination.pdf 26
For WACC detail see: http://www.competition-
commission.org.uk/assets/competitioncommission/docs/pdf/non-
inquiry/rep_pub/reports/2009/fulltext/549_appendices.pdf 27
For WACC detail see: http://www.competition-
commission.org.uk/assets/competitioncommission/docs/pdf/non-
inquiry/rep_pub/reports/2010/fulltext/558_appendices.pdf 28
See: http://www.competition-commission.org.uk/assets/competitioncommission/docs/appeals/carphone-
warehouse-group-plc-wholesale-line-rental-appeals/wlr_determination.pdf 29
See: http://www.competition-commission.org.uk/assets/competitioncommission/docs/appeals/carphone-
warehouse-group-plc-local-loop-unbundling-appeals/llu_determination.pdf 30
See: http://www.competition-commission.org.uk/assets/competitioncommission/docs/pdf/non-
inquiry/appeals/communications_act/final_determination_excised_version_for_publication.pdf 31
See: http://www.competition-commission.org.uk/assets/competitioncommission/docs/appeals/british-
telecommunications-plc-appeal/wba_determination.pdf 32
http://www.competition-commission.org.uk/assets/competitioncommission/docs/appeals/telecommunications-
price-control-appeals/final_determination.pdf

15
Basic methodology in the above cases
59. In general, all the above cases use some version of WACC (whether pre tax or
“vanilla”, and whether estimated in real or nominal terms), and all except Ofgem
and the ORR make full and detailed use of the CAPM. In the 2007 Gas
Distribution Networks review Ofgem states “We continue to take the view that the
allowed return on equity should reflect the balance of all risks that will be faced by
companies under the price control proposals, including both systematic and non-
systematic risk, to provide appropriate incentives to manage these risks effectively
and to invest efficiently in maintaining and developing their networks. We
therefore propose to continue our approach of basing the allowed rate of return on
equity on the estimated equilibrium level of total market returns”. This policy
seems to be continued in the 2011 “Roll Over” document, where the cost of equity
was left unchanged. They stated “Even though the risk-free rate has declined,
TPCR4 relied on a ‘total returns on equity’ approach, and it is generally accepted
that total returns are more stable than the individual components” (emphasis
added). In the 2009 Electricity Distribution Review they provide evidence on
equity and asset betas, and discuss the equity risk premium, saying they have
considered all this evidence, but ultimately they do not provide a disaggregated
cost of equity figure. The ORR in effect follows Ofgem but in a sub-analysis
estimated the cost of equity by assuming beta is one (a figure close to the adjusted
equity beta in the Ofgem report – see below). It justifies this approach by an
Annex on relative risk in which it finds that the most appropriate comparator for
the risk of the rail industry is the power industry.
60. A further common feature of the regulatory process in the UK is the use of a range
of estimates in arriving at the final allowed rate of return. The asymmetry of
consequences (the significant consumer detriment following a lack of investment
and innovation on the one hand, against consumer price detriment on the other) is
recognised, invariably leading to a point estimate of WACC towards the upper end
of the range, as the consequences of under-investment are judged to be more
important than those from price detriment.33
Some debate can be found on whether
the adjustment should be made to individual components or to the overall WACC,
but the preference seems to be for the latter.34
61. I note that this general approach is consistent with that in the recent IPART-SDP
Review.
33
A typical example is from the CC’s Stansted Airport price review at Appendix L, p.27, where the CC
observes “..that there were asymmetric consequences from setting returns too high and too low. Specifically,
there was a significant detriment to users if Stansted was deterred by inadequate financial returns from investing
in new facilities which more than outweighed the costs of setting returns too high and asking users to pay higher
charges than strictly necessary. 34
See: http://www.ofwat.gov.uk/pricereview/pr09phase3/rpt_com_20091126fdcoc.pdf pp. 102-107

16
Common components of the cost of equity – approaches to estimation
The Risk-Free rate
62. A common feature in UK regulatory practice throughout the past five years has
been an adjustment to market Gilt yields. This is actually a continuation of a long-
standing practice dating back to the 1990s where index-linked gilt yields (usually
the preferred base for estimation) were argued to be distorted by pension fund
liquidity requirements. Currently the argument is that a mix of such pension fund
activity coupled with the Bank of England’s “Quantitative Easing” programme is
such that market yields are not a reliable indicator of the optimal risk free rate for
regulatory purposes, bearing in mind the objectives of that process and the
asymmetric consequences of error in any cost of capital estimates discussed at 60
above. In the analysis below only the latest reports from each regulator are
discussed, as these are most relevant to current market conditions.
63. For the water industry, Europe Economics (Ofwat’s consultants) expressed some
reservations about this adjustment practice, pre-QE, although ended up in a
position where they still selected an RF above the then current index linked gilt
yields. They opted for a point estimate of 1.75% with a range estimate of 1.5% to
2.2%.
64. The ORR-CEPA report adopts a range estimate of 1.7% to 2.35%, whilst Ofgem
does not disaggregate the component elements of its cost of equity.
65. In the Stansted inquiry, the CC considered evidence from the forward rates implied
by the Index-Linked Gilt (ILG) curve. This led them to move away from the 10
year ILG yield used in the Heathrow/Gatwick study and to put greater emphasis on
shorter dated ILG rates. Even so, they opted for an RF of 2% despite the fact that
these ILG yields were all less than 2%.
66. In the Bristol Water appeal, the CC discusses the impact of the start of the Bank of
England’s QE programme on ILG rates, and discusses this plus “other distortions”.
At the outset, CC notes Ofwat’s position on RF (Appendix N, para 60) “Ofwat said
that its view was also consistent with the ten-year long-run historic UK index-
linked gilts of five- and ten-year maturity and consistent with recent regulatory
determinations.” (sic – this is clearly meant to refer to ten year average yields).
The CC then analyses the arguments for various RF proxies at length, noting that
“we continue to see merit in the argument that distortions (associated, for example,
with pension fund dynamics) continue to affect longer-dated index linked yields” at
Appendix N, para. 70. Noting that ILGs remain its preferred benchmark for RF it
presents evidence that ILG yields were below 1% across the yield curve and also
presents long run (5 year) averages. It is clear that these five year averages were all
below 1.5%. It ends by looking at international evidence, bearing in mind credit
risk, saying it was “unaware” of any evidence for the real RF exceeding 2%. It still
concluded that the range for RF was 1% to 2%, despite ILG yields being
considerably less than 1% at that time.
67. Ofcom is the only regulator to have set prices in the past two years, so its
judgement on the current value of RF is particularly relevant. In the 2011 Mobile

17
Termination case Ofcom explicitly recognises the problems caused by QE and
argue that more weight should be placed on long run averages. They adopt a
slightly different approach to RF estimation compared to the CC, using Bank of
England data on the implied real rate on gilts. It is worth considering the detail of
this calculation. At A8.39 in this case, Ofcom observes: “The currently high levels
of demand for UK gilts look unusual when viewed against long-term data, and we
are cautious about attaching too much weight to current very low real rates.” Then,
at A8.45: “While we would generally tend to give more weight to more recent rates
than averages over past years, we are mindful (as in past charge controls) that we
do not wish to give too much weight to a rate based on a period of unusual market
activity. Therefore we are minded at the present time to give greater weight than
usual to longer term averages“. In Table A8.5 they then set out a range of average
real yields ranging from 1 day through 1-6 months to 1-10 years on 5 and 10 year
gilts. The short run real yields range between -0.3% and 0% for the 5 year gilt and
0.5% to 0.8% for the 10 year gilts. The 10 year average yields for both are 1.7%.
Whilst the weighting given to these data points is not explicit, implicitly far greater
weight must be given to the 10 year average as their final estimate of the real RF is
1.5%. In the 2012 LLU/WLR determination this estimate of RF was reduced to
1.4%, but this determination is currently being appealed to the CC.
68. Note that in all the above cases the approach is consistent with some weight being
placed upon past observations. Whilst the weighting scheme is never made
explicit, simple calculations show that in recent cases, a weight well in excess of
50% is being placed on long run averages.
The equity risk premium (or expected return on the market)
69. There is a distinction between regulators who work directly with a market (or
equity) risk premium (MRP), and those who work with an expected return on the
market E(RM). In its Stansted Report, the CC sets out the case for the latter, and
this recommendation is accepted by the CAA. Indeed, the CC, at Appendix L
paragraph 79 of their report specifically say that they would not expect the Rm
term in the CAPM to be affected by changes in the short term interest rate,
concluding that “It would be illogical for us to have retained our previous range for
the [MRP] in the absence of any reason to believe that a lower risk-free rate had
translated into a lower cost of equity”. More recently, this is the approach adopted
in the Bristol Water appeal, where the CC emphasises the need for the RF used in
setting the CAPM cost of equity to be consistent with the RF used in deriving the
MRP, which, to add further emphasis, it explicitly chooses to set out as (E[RM] -
RF).
70. The Bristol Water case is particularly interesting, as the CC sets out in some detail
alternative approaches to estimating RM in Appendix N, where it discusses the
issue of geometric v arithmetic averages, which is also discussed in Stansted, but
here is taken to a new level by explicitly calculating simple return averages for
various holding periods, together with the Blume (1974) and Jacquier, Kane and
Marcus (2005) estimators for these holding periods. This analysis sets out the

18
results using both Dimson, Marsh and Staunton (DMS)35
and Barclays Capital
data.36
71. It then conducts an analysis of implied expected returns using what it terms the
“dividend yield model” following Fama and French (2002), Vivian (2007) and
Gregory (2007), and finally concludes with the forward Global MRP estimates
obtained in Dimson, Marsh and Staunton (2010). Finally, it examines data for the
implied return on equities produced in the Bank of England Q1 2010 report,
derived using analysts’ forecasts, which it notes are volatile and may suffer from
bias in analysts’ forecasts. It rejects the use of survey evidence in establishing the
E(RM)/MRP.
72. The detailed analysis for Ofwat, in its 2009 Price Review, is found in the appended
Europe Economics (EE) Report. Citing the Smithers & Co report, this also notes
that the RM has been more stable historically than the MRP itself. They draw
attention to the fact that this has implications given their preferred point estimate
for RF.
73. As noted above, Ofgem does not disaggregate the cost of equity calculation, but in
the 2009 Electricity Distribution Review say: “While we have not disaggregated
our cost of equity determination, we have included an additional premium in the
ERP to reflect the fact that there is perhaps greater uncertainty in the cost of equity
for DPCR5 than at GDPCR”. .
74. In the 2009 Openreach Price Review, Ofcom is clear that it places little weight on
either forward estimates of the risk premium, or on survey evidence, both of which
it regarded as “subjective”. They suggested a historical estimate based largely on
historical evidence from DMS. Ofcom are explicit that they put more weight on
arithmetic averages, rather than geometric ones, before they finally selected a broad
range. They then settled on the upper end of this range, because: “Our decision to
choose a point estimate at the top of our prior range is in response to increased
market volatility and turbulence, which is likely to lead to investors requiring
increased returns in exchange for holding equity rather than risk-free assets.” This
was challenged in the appeal to the CC by Carphone Warehouse (CW), but whilst
the CC expressed some sympathy with some of the arguments advanced by CW, it
noted that the combined effect of the RF and implied E(RM) estimate were not out
of line with CW’s own estimates.
75. In the 2011 Mobile Termination charge report, Ofcom cited the Bristol Water
Appeal analysis by the CC and explicitly linked its RF and MRP estimates with an
implied E(RM), before comparing this to the E(RM) used by the CC in the Bristol
Water case.
Comparison with the AER case
76. To summarise, a clear difference with UK regulatory practice with regard to RF is
that in the AER Case there is no attempt to estimate the RF using some form of
35
Note that throughout, DMS is used as the abbreviation of this widely-referenced source, although as it is an
annual publication, the precise data cited varies between reports. 36
Appendix N, Table 4.
19
historical averaging. Even in the most recent UK case (Ofcom, 2012) the base
estimate of the real RF is actually 1.4%, despite the actual yield on ILGs at the time
being close to zero or even negative. In the SDP case, IPART clearly recognises
that there is a problem with simply using the current yield on CGS in a regulatory
context. The implied real RF being used in the AER case is under 0.5%. The
Brailsford et al (2012)/Handley data clearly shows that such a real Government
bond rate is a long way below any historical average. Over the periods which the
Brailsford et al (2012) study regards as of key importance, these real yields are
2.45% from the start of the series to the end of 2011, 2.70% from 1988-2011 and
3.84% from 1988 to 2011. The AER’s chosen nominal rate is below the minimum
of any point in the 1958-2011series, which fell to a low point of 3.67% in 2011.
Excluding that year, the previous lowest yield figure was 4%. Given current
conditions would appear to be wholly exceptional, it is reasonable to at least
consider recent UK regulatory precedent when estimating RF in Australia, and
indeed there is an Australian precedent (in the IPART-SDP case) for doing so.
Clearly, making any allowance for the unusual conditions in global government
bond markets would have the effect of raising the underlying risk free rate
estimate.
77. The major difference between most UK regulators and the AER is that with the
exception of Ofcom, the discussion on CAPM parameters generally focuses on the
E(RM) rather than the MRP. This is at its most explicit in the CC reports, both in
its regulatory role with respect to airports, and in its role as a regulatory appeals
body, but it is also explicit in the last Ofwat price review. Ofgem prefers to focus
directly on the allowed return, and does not decompose the judgement into its
CAPM parameters. Only Ofcom forms its estimates in terms of an RF and an
MRP, but even then discusses the implied E(RM).
Concluding Comments
78. Theory suggests that the individual components of the CAPM should be estimated
directly. These are RF and E(RM), not RF and MRP.
79. Importantly, there is evidence, discussed at 16-17 above, that E(RM) has a stable
mean. By contrast, it appears that neither RF nor the MRP have stable means. Of
course, there is considerable debate in the academic literature concerning stability,
as is evidenced by the differences of opinion expressed in the 2008 special issue of
the Review of Financial Studies, where Cochrane (2008) and Campbell and
Thompson (2008) taking opposing positions to Goyal and Welch (2008).
Critically, though, note that when these authors discuss the “market risk premium”
it is specifically in the context of the premium over Treasury Bill rates not the risk
premium over bonds. The stability of the MRP relative to bond yields has not been
analysed in these papers.
80. If the E(RM) has a more stable mean, the consequence is that direct estimates of
E(RM) are likely to be more statistically reliable than indirect estimates formed by
summing RF and MRP. This may be of particular importance in the present
environment of exceptionally low levels of RF.

20
81. Thus the clear recommendation by prominent UK academics in reports
commissioned specifically for UK regulators (The Smithers Report and the follow-
up 2006 Smithers & Co Report) is that the CAPM should be implemented by
directly estimating the E(RM) and RF components, and specifically not by the
common practice of indirect estimation using an RF and MRP. It must also be
noted that the asymmetry of consequences that flow from mis-estimating the cost
of capital highlight the particular danger of under-estimating the cost of equity by
that the MRP remains stable in the presence of unusually low CGS yields.
82. It is clear that the UK regulators, and in particular the appeals body, the UK
Competition Commission, have heeded this advice.
83. Furthermore, it is clear that within Australia IPART have similarly recognised this
issue.
84. Applied to the case of the recent AER judgement, this advice would have a
material impact as the direct estimate of the E(RM) and RF components would
have resulted in a higher implicit market risk premium. This would be the case
whether either historical mean returns had been used to estimate E(RM), or a DGM
estimate was used, or some weighting of a combination of these estimates was
employed.
85. If one allows for the contentious debate concerning returns predictability and its
meaning, an alternative line of reasoning is that historical means may be an
efficient predictor of future returns (see, for example, Goyal and Welch, 2008).
86. Following this line of reasoning, the regulator could have used long term averages
of both RF and RM components to set the discount rate. As is set out above, recent
UK cases have acknowledged the particular difficulty in estimating an RF in
current market conditions, as has IPART. As is discussed at 52 and 53 above, it is
difficult to be prescriptive about which long run averages should be used in such an
approach, but if one chooses an MRP of 6% based largely on historical evidence, it
is important to give equal weight to the historical evidence on the RF component.
87. Whether one adopts a pure forward looking approach to estimating the CAPM
components (i.e. a direct forward estimate of E(RM) combined with a spot RF), or
an approach that uses historical evidence to determine an RF and an MRP, the
effect would be to raise the allowed rate of return significantly.
88. It seems clear that the AER’s approach has resulted in a likely significant under-
estimate of the cost of capital in the case of the Gas Businesses. UK regulatory
authorities have explicitly recognised that the consequences of an under-estimation
of the cost of capital will be under-investment in infrastructure, which implies a
long term consumer detriment.
89. It is clear that this recognition of possible consumer detriment is a feature of
Australian gas regulation. The Objective of the National Gas Law states “The
objective of this Law is to promote efficient investment in, and efficient operation
and use of, natural gas services for the long term interests of consumers of natural
gas with respect to price, quality, safety, reliability and security of supply of natural

21
gas.” My view is that, in contrast to the positions adopted by UK regulators and by
IPART, the AER has not considered the full implications of its proposed cost of
capital for the long term interests of consumers.
Statement by Alan Gregory
I am Professor of Corporate Finance at the Xfi Centre (Centre for Finance and Investment) at
the University of Exeter, and a former Director of the Centre. I was a reporting panel member
of the UK Competition Commission from 2001-2009, and am currently an External Advisor
to the UK Competition Commission’s Finance and Regulation Group. A summary CV is
attached setting out my qualifications and publications.
I confirm that I have made all the inquiries that I believe are desirable and appropriate and
that no matters of significance that I regard as relevant have, to my knowledge, been withheld
from the report.
Signed:
Alan Gregory 5th November 2012

22
References:
Blume, M.E. (1974), ‘Unbiased Estimators of Long-Run Expected Rates of Return’, Journal
of the American Statistical Association, 69 (347), Sept, 634-638.
Barclays Capital (2010), Equity Gilt Study 2010 Barclays Capital, London.
Brailsford, T., Handley, J.C. and Maheswaran, K. (2008) ‘Re-Examination of the Historical
Equity Risk Premium in Australia’, Accounting and Finance 48, 73–97.
Brailsford, T., Handley, J.C. and Maheswaran, K. (2012) ‘The historical equity risk premium
in Australia: post-GFC and 128 years of data’ Accounting & Finance. March, Vol. 52 Issue 1,
p237-247.
Campbell, J. And Thomson, S. (2008), ‘Predicting excess stock returns out of sample: Can
anything beat the historical average?’, Review of Financial Studies, 21(4): 1509-1531.
Cochrane, J. (2008), ‘The dog that did not bark: a defense of return predictability’, Review of
Financial Studies, 21(4): 1533-1575.
Dimson, E., Marsh, P. and Staunton, K. (2001), Global Investment Returns Yearbook, 2001,
London: ABN AMRO/ LBS.
Dimson, E. P. Marsh, and M. Staunton (2007) ‘The Worldwide Equity Premium: A Smaller
Puzzle’, http://ssrn.com/abstract=891620
Dimson, E., Marsh, P. and Staunton, K. (2010), Global Investment Returns Yearbook, 2010,
London: ABN AMRO/ LBS.
Dimson, E., Marsh, P. and Staunton, K. (2012), Global Investment Returns Yearbook, 2012,
London: ABN AMRO/ LBS.
Fama, E.F. and French, K.R. (2002), ‘The Equity Premium’, Journal of Finance, 57, April, pp
637-660.
Goyal, A. And Welch, I. (2008), ‘A comprehensive look at the empirical performance of
equity premium prediction’, Review of Financial Studies, 21(4): 1455-1508.
Gregory, A (2007), ‘Expected Cost of Equity and the Expected Risk Premium in the UK’,
University of Exeter Working Paper.
Jacquier, E, Kane, A and Marcus, A J, ‘Optimal estimation of the risk premium for the long
run and asset allocation: a case of compounded estimation risk’, Journal of Financial
Econometrics, 2005.
Jenkinson, T. (1993), ‘The cost of equity finance: conventional wisdom reconsidered’, Stock
Exchange Quarterly with Quality of Markets Review, Autumn pp. 23-27.
Vivian, A. (2007), ‘The UK Equity Premium: 1901-2004’, Journal of Business Finance and
Accounting, Vol. 34, 9&10, pp. 1496-1527.

23
Wright, S., Mason, R. and Miles, D. (2003), A Study into Certain Aspects of the Cost of
Capital for Regulated Utilities in the UK, Smithers & Co. Ltd, London.
Wright, S., Mason, R. Satchell, S., Hori, K. and Baskaya, M. (2006), Report on the Cost of
Capital provided to Ofgem, Smithers & Co. Ltd, London.

24
Figure 1: International real returns on equity, government bonds, and the market risk premium, 1900-2011.
Data are from Dimson, Marsh and Staunton (2012) Tables 2, 5 and 10. “Equity” shows the arithmetic mean real return on equities for each country “Bonds”
shows the arithmetic real return on government bonds for each country, and “MRP (bonds)” shows the arithmetic mean real market risk premium for equities
compared to bonds for each country.
-2
0
2
4
6
8
10
Equity
Bonds
MRP (bonds)

25
Appendix: Explanation of the Historical Expected Risk Premium Using the
Dividend Growth Model
The approach used to model historically expected risk premium is conceptually extremely simple, and
relies on the fact that in rational markets, the price of any equity must be the present value of the
future dividend stream. Two common approaches to the problem are the Fama and French (2002)
model, and the Dimson et al (2007) model.
The Fama and French 2002 Model
The model is developed in Fama and French (2002, hereafter FF) and has also been applied in Vivian
(2007) to the UK market. The interest is in the expected return, E(Rm), on a market-wide portfolio, so
expressing the standard dividend growth model in terms of returns rather than prices, and assuming
constant real growth in perpetuity, expected returns are given by:
tt
t
ttmt gE
P
DERE 1)( (A1)
where Dt+1 is the real dividend one period hence, and gt is the long run real growth in prices. The first
term on the right hand side of (A1) is the expected dividend yield on the market. Provided the real
dividend yield is stationary, long run real price growth will be equivalent to the long run real growth
in dividends. As in FF, the assumption is that real dividend growth (GDt) is simply a function of the
most recent period’s real dividend growth, where real dividends are defined by dt.(CPIt-1/CPIt), CPIt is
the level of the consumer price index at time t, dt is the nominal dividend at time t, and GDt = (dt/dt-1)
.(CPIt-1/CPIt). Given this simplifying assumption concerning dividend growth, we can estimate the
historical series of expectations as:
t
t
ttm DG
P
DR
1
, (A2)
Alternative specifications are possible. For example, Dimson et al (2002) use the full historical run of
data in any year to give an estimate of expected growth, although their approach has the different
objective of calculating unexpected dividend growth. Alternatively, one can use earnings growth as is
also done in FF. Here, I limit the analysis to dividend growth given earnings growth numbers are not
available in the Brailsford et al (2011)/Handley data sets.
FF view the (A2) estimate as the unconditional mean estimate and discuss the adjustment to such an
estimate needed to arrive at a simple annual rate for discounting purposes. An unconditional estimate
will usually imply a short run change in market prices so that the dividend yield reverts to its long run
mean value. As FF show, the estimation of an expected annual simple return requires that the
estimates formed from the mean dividend growth model of expected returns are uplifted by half the
difference between the variance of the price growth series and the variance of the dividend growth (or
earnings growth) model returns.37
37
If one believes that it is the risk premium that is stationary, then as these are historical estimates, the
appropriate risk free rate would be the historical real yield on CGRs.

26
Using the Brailsford et al (2011) data set, suitably updated, the real E(Rm) estimate for the period
1958-2011 is 7.63% assuming γ=0.25. As the standard deviation of the real dividend growth is
18.39% over this period, and that of the price growth series is 20.95%, the bias adjustment is 0.50%
resulting in a mean expected simple real E(Rm) of 8.14%.38
The Dimson et al (2007) model
This model takes a slightly different approach to FF, Their approach uses a logarithmic decomposition
of the historical risk premium does not allow for any imputation tax credit value, and uses a log
decomposition approach to analyse historically realised returns. The theory behind such a
decomposition is that some elements of historical return can be attributed to revision in expectations
or higher than expected realisations in firm cash flows. By considering only the mean dividend yield
and the historically achieved growth, it is possible to estimate what future returns on the market would
be assuming mean reversion in these parameters.39
In the 2012 Yearbook DMS provide updated estimates of the decomposition of the historical risk
premium.40
Australia appears to be rather different from global averages, and has a higher than
average geometric mean dividend yield (5.75%) and higher than average compound growth in the
dividend yield (0.99%). Summing these two components gives the implied geometric mean real
historically expected return of 6.74%. Dimson et al (2007) explain that the uplift required to convert
this expected geometric return to an arithmetic one is 1% to 1.5%, from which we might infer that the
real expected long run arithmetic mean return would be around 7.74% to 8.24%. Applying the usual
Fisher relationships to get the implied nominal E(RM) we have a nominal expected return of 10.43%
to 10.95%. At the AER’s preferred risk-free rate of 2.98%, this equates to an expected MRP of 7.45%
to 7.97%.
38
7.72% % if γ=0, i.e. if tax credits have zero value. 39
See Dimson, Marsh and Staunton (2007) 40
Dimson, Marsh and Staunton (2012) Credit Suisse Global Investment Returns Sourcebook (Table 11, p.31)

27
Summary CURRICULUM VITAE for Alan GREGORY
CURRENT POSITION: Chair in Corporate Finance, and Director, Xfi Centre for Finance and
Investment, University of Exeter Business School
DATE OF BIRTH: 19.3.1954
PLACE OF BIRTH: Mountain Ash, Wales
ACADEMIC AND PROFESSIONAL QUALIFICATIONS:
MSc in Accounting and Finance (London School of Economics and Political Science,
1983)
Fellow of the Chartered Institute of Management Accountants (CIMA) (qualified in 1974);
elected to associate membership 1978; elected to Fellowship 1986)
Certificate in Education (1978).
BACKGROUND:
Alan is Professor of Corporate Finance at the University of Exeter. His research interests are
in the general area of market-based empirical research. This interest includes risk pricing,
together with returns to, and valuation of, corporate social responsibility agenda. Related
work has focused on market reaction to directors’ trading activity, the success of initial public
offerings, and returns following mergers and acquisitions.
From September 2001 to September 2009 he was a Reporting Panel Member of the UK
Competition Commission where he was involved in a number of inquiries, including the two
potential European takeover bids for the London Stock Exchange, and most recently the
Groceries or “supermarkets” inquiry.
His consulting interests have covered investment portfolio analysis, company valuation and
cost of capital, particularly for regulatory purposes, and includes expert witness work. His
past clients include fund managers, stockbrokers, large accounting firms, HM Treasury,
Ofcom, and the Competition Commission. He is currently External Advisor to the UK
Competition Commission’s Finance and Regulation Group.
PUBLICATIONS:
Refereed journal articles since 2000:
‘Constructing and Testing Alternative Versions of the Fama-French and Carhart Models in
the UK’ (with Rajesh Tharyan and Angela Christidis) – forthcoming, Journal of Business
Finance and Accounting
‘Exploring the Valuation of Corporate Social Responsibility—A Comparison of Research
Methods’ (with Julie Whittaker) – forthcoming in Journal of Business Ethics.
‘Gender Diversity on Corporate Boards: What Can We Learn from Market Reaction to Insider
Trades’ (with Emma Jeanes, Rajesh Thrayan and Ian Tonks) – forthcoming in British Journal
of Management.

28
‘More Than Just Contrarians: Insider Trading in Glamour and Value Firms’ (with Rajesh
Tharyan and Ian Tonks) – forthcoming, European Financial Management
‘Expected Cost of Equity and the Expected Risk Premium in the UK’. Review of Behavioral
Finance, 3(1), pp. 1-26, June 2011
‘Stock Market Driven Acquisitions versus The Q Theory of Takeovers – The UK Evidence’
(with X. Bi) Journal of Business Finance and Accounting 38, 5 & 6, pp 628-656 (July 2011)
‘UK IPOs: Long Run Returns, Behavioural Timing and Pseudo Timing’ (with C. Guermat
and F. Al-Shawraweh), Journal of Business Finance and Accounting June/July 2010, 37(5-6),
pp 612–647.
‘Industry Cost of Capital: UK Evidence’, (A.Gregory and M. Michou), Journal of Business
Finance and Accounting, June/July 2009, pp 679–704.
‘Performance and Performance Persistence of Ethical Unit Trusts in the UK’ (A.Gregory and
J.Whittaker), Journal of Business Finance and Accounting, Sept/Oct 2007, pp 1327-1344.
‘The Long Run Abnormal Performance of UK Acquirers and the Free Cash Flow
Hypothesis’, (A. Gregory), Journal of Business Finance and Accounting, June 2005, pp. 777-
814.
‘A UK Test of an Inflation-Adjusted Ohlson Model’, (A.Gregory, W.Saleh and J.P.Tucker),
Journal of Business Finance and Accounting, April/May 2005, pp 487-534.
‘Foreign Acquisition by UK Limited Companies: Short and Long-Run Performance’ (Alan
Gregory and Steve McCorriston), Journal of Empirical Finance, 12, 2005, pp 99-125.
‘Contrarian Investment and Macroeconomic Risk in the UK’ (Alan Gregory, Richard Harris
and Maria Michou). Journal of Business Finance and Accounting, Jan/March, 2003, pp 213-
255.
‘Short-Run Returns around the Trades of Corporate Insiders on the London Stock Exchange’
(S. Friederich, A. Gregory, J. Matatko and I. Tonks). European Financial Management,
March 2002, pp.7-31.
‘An Analysis of Contrarian Investment Strategies in the UK’ (Alan Gregory, Richard Harris
and Maria Michou). Journal of Business Finance and Accounting, December 2001, pp 1193-
1228.
‘Discussion of Acquisition-Related Provision-Taking and Post-Acquisition Performance in
the UK Prior to FRS7’ (A. Gregory), Journal of Business Finance and Accounting,
(November / December 2000)
‘Testing the Robustness of Long-Term Under-performance of UK Initial Public Offerings’ (S.
Espenlaub, A. Gregory and I. Tonks), European Financial Management, September 2000.
‘Motives underlying the method of payment by UK acquirers: the influence of goodwill’ (A.
Gregory), Accounting & Business Research, Summer (2000)

29
Research Grants obtained since 2000:
£284,355 from ESRC for “Cost of Capital and Asset Pricing in the UK” (as Principal
Investogator; joint with Christina Dargenidou, Rajesh Tharyan and Penguo Wang). 2012-
2015.
£25,000 from ICAEW for £25,000 for “The valuation and long run returns of firms with
positive corporate social responsibility (CSR) indicators” (as Principal Investigaor; with Julie
Whittaker) 2011-13.
£78,000 from Leverhulme to investigate directors’ trading patterns around takeover
announcements (2008-2010, I was lead applicant – the bid was joint with Ian Tonks).
EXTERNAL AND PROFESSIONAL LINKS:
1. Appointed to REF Panel 19 as assessor for 2009-2014REF.
2. Member of the Competition Commission (2001-2009). External Advisor to the UK
Competition Commission’s Finance and Regulation Group, September 2009-date.
3. OECD Round Table panellist on Excessive Pricing and Role of Profitability Testing,
October 2011.
4. Member of the Editorial Board of Journal of Business Finance and Accounting.
5. Member of the Editorial Board of Accounting and Business Research.
6. Director, Exeter Enterprises Ltd (the University of Exeter consulting arm) until
August 2007.
7. Former member of CIMA’s Management and Professional Development Committee,
now CIMA Enterprises Advisory Board.
8. Former consultant to Her Majesty’s Treasury on the Government Profit Formula for
non-competitive contracts
9. Former consultant to various accounting firms and fund management companies on
areas related to cost of capital, risk and return, and equity portfolio construction.
10. External assessor on chair appointments at Edinburgh and Stirling Universities.
11. External examiner on numerous PhDs including Cass, University of Cambridge,
Lancaster Management School, Reading University and Manchester Business School.
12. Assessor on a number of AMBA accreditation panels.
PREVIOUS EMPLOYMENT:
Jan. 1996 - Sept 97: Professor of Business Studies, University of Wales,
Aberystwyth.
Sept. 1995- Dec. 96: Professor of Accounting, University of Glasgow
Sept. 1989-Sept. 95: Lecturer in Accounting and Finance, University of Exeter.
Sept. 1986-Aug. 89: Principal Lecturer in Accounting and Finance, City of London
Polytechnic.
Sept. 1983-Aug. 86: Senior Lecturer in Accounting, Brighton Polytechnic.
Apr. 1978-Aug. 83: Senior Lecturer in Accounting, Luton College of Higher
Education.

30
Sept. 1977-March 78: Lecturer II, South West London College.
Jan 1977-Aug. 77: Budgets Controller, Green Shield Stamps.
Jan 1976-Dec. 76: Manager, Western Region Settlement Accounts Section.
Aug. 1974-Jan 76: Assistant Development Accountant, British Rail Western
Region.
Aug. 1971-Aug. 74: Management Trainee, British Rail

Partner: Roxanne Smith +61 8239 7108
Email: [email protected]
Senior Associate: Christopher Beames +61 8239 7143
Email: [email protected]
Our Ref: A8059
Your Ref:
Doc ID: 62587101.1
25 October 2012 Mr Alan Gregory Professor of Corporate Finance Xfi Centre for Finance and Investment University of Exeter Business School
Dear Sir
Victorian Gas Access Arrangement Review 2013-2017: Envestra, Multinet SP AusNet and APA GasNet
Level 10, 211 Victoria Square
ADELAIDE SA 5000 T +61 8 8239 7111| F +61 8 8239 7100
www.jws.com.au
SYDNEY |PERTH |MELBOURNE |BRISBANE |ADELAIDE
Liability limited by a scheme approved under Professional Standards Legislation (Australia-wide except in Tasmania)
We act for Envestra Limited (Envestra), Multinet Gas (DB No. 1) Pty Ltd and Multinet Gas (DB No. 2) Pty Ltd (together, Multinet ) and SPI Networks (Gas) Pty Ltd (SP AusNet) in relation to the Australian Energy Regulator’s (AER) review of the Gas Access Arrangements for Victoria.
Envestra, Multinet and SP AusNet (the Distributors) as well as APA GasNet (Australia) Operations Pty Ltd (APA GasNet) (together the Gas Businesses) wish to jointly engage you to prepare an expert report in connection with the AER’s review of the Victorian Gas Access Arrangements. The report will also be used by Envestra for the AER’s review of Envestra’s Access Arrangement for its Albury Distribution Network.
This letter sets out the matters which the Gas Businesses wish you to address in your report and the requirements with which the report must comply.
Terms of Reference
The terms and conditions upon which each of the Gas Businesses provides access to their respective networks are subject to five yearly reviews by the AER.
The AER undertakes that review by considering the terms and conditions proposed by each of the Gas Businesses against criteria set out in the National Gas Law and National Gas Rules.

Professor Alan Gregory 2 25 October 2012
D o c I D : A8 0 5 9 - 6 2 5 8 7 1 0 1 . 1
Rule 76 of the National Gas Rules provides that the Gas Businesses’ total revenue for each regulatory year is to be determined using the building block approach, in which one of the building blocks is a return on the projected capital base for the year.
Rule 87(1) provides that the rate of return on capital is to be commensurate with prevailing conditions in the market for funds and the risks involved in providing reference services. Rule 87(2) provides that a well accepted approach incorporating the cost of equity and debt (such as the Weighted Average Cost of Capital (WACC )) is to be used along with a well accepted financial model (such as the Capital Asset Pricing Model (CAPM )) in determining the rate of return on capital.
The Gas Businesses are seeking expert assistance in respect of their proposed estimates of the cost of equity to be used in the calculation of the WACC (through the CAPM) and the approach of the AER in recent decisions and in the Gas Access Arrangement Review Draft decisions for the Distributors and APA GasNet.
In this context the Gas Businesses wish to engage you to prepare an expert report which considers the following issues arising from the AER’s recent decision in the Roma to Brisbane Pipeline Final Decision and the Draft Decisions for the Distributors and APA GasNet:
(a) Is the AER’s approach to estimating the cost of equity in these decisions consistent with the approach adopted by the UK regulator, Ofgem and UK appeals body, the Competition Commission?
(b) In light of the UK regulatory approach, is the AER’s approach to estimating the cost of equity for the Distributors and APA GasNet likely to result in a rate of return that satisfies the requirements of Rule 87(1) of the National Gas Rules that:
The rate of return on capital is to be commensurate with prevailing conditions in the market for funds and the risks involved in providing reference services.
(c) In light of the recent Tribunal findings on the cost of capital, the recent IPART Review of water prices for the Sydney Desalination Plant Pty Ltd, and the implications of UK regulatory practice for Australia, how might the Gas Businesses best estimate the cost of equity in order to satisfy the requirements of 87(1) and 87(2) of the National Gas Rules?
In answering these questions, please explain the extent to which the UK regulatory approach, including the regulator’s objectives, are likely to be relevant in Australia.
Use of Report
It is intended that your report will be included by each of the Gas Businesses in their respective responses to the AER’s Draft Decisions in respect of their access arrangement revision proposals for their Victorian networks (and in the case of Envestra, Albury network) for the access arrangement period from 1 January 2013 to 31 December 2017. The report may be provided by the AER to its own advisers. The report must be expressed so that it may be relied upon both by the Gas Businesses and by the AER.
The AER may ask queries in respect of the report and you will be required to assist each of the Gas Businesses in answering these queries. The report will be reviewed by the Gas Businesses’ legal advisers and will be used by them to provide legal advice to the Gas Businesses as to their respective rights and obligations under the National Gas Law and National Gas Rules.

Professor Alan Gregory 3 25 October 2012
D o c I D : A8 0 5 9 - 6 2 5 8 7 1 0 1 . 1
If any of the Gas Businesses choose to challenge any decision made by the AER, that appeal will be made to the Australian Competition Tribunal and the report will be considered by the Tribunal. The Gas Businesses may also seek review by a court and the report would be subject to consideration by such court. You should therefore be conscious that the report may be used in the resolution of a dispute between the AER and any or all of the Gas Businesses as to the appropriate level of the respective Distributor’s distribution tariffs. Due to this, the report will need to comply with the Federal Court requirements for expert reports, which are outlined below.
Compliance with the Code of Conduct for Expert Witnesses
Attached is a copy of the Federal Court’s Practice Note CM 7, entitled “Expert Witnesses in Proceedings in the Federal Court of Australia”, which comprises the guidelines for expert witnesses in the Federal Court of Australia (Expert Witness Guidelines).
Please read and familiarise yourself with the Expert Witness Guidelines and comply with them at all times in the course of your engagement by the Gas Businesses.
In particular, your report prepared for the Gas Businesses should contain a statement at the beginning of the report to the effect that the author of the report has read, understood and complied with the Expert Witness Guidelines.
Your report must also:
1 contain particulars of the training, study or experience by which the expert has acquired specialised knowledge;
2 identify the questions that the expert has been asked to address;
3 set out separately each of the factual findings or assumptions on which the expert’s opinion is based;
4 set out each of the expert’s opinions separately from the factual findings or assumptions;
5 set out the reasons for each of the expert’s opinions; and
6 otherwise comply with the Expert Witness Guidelines.
The expert is also required to state that each of the expert’s opinions is wholly or substantially based on the expert’s specialised knowledge.
It is also a requirement that the report be signed by the expert and include a declaration that “ [the expert] has made all the inquiries that [the expert] believes are desirable and appropriate and that no matters of significance that [the expert] regards as relevant have, to [the expert's] knowledge, been withheld from the report”.
Please also attach a copy of these terms of reference to the report.
Terms of Engagement
Your contract for the provision of the report will be directly with the Gas Businesses. You should forward to each of the Gas Businesses any terms you propose govern that contract as well as your fee proposal.
Please sign a counterpart of this letter and forward it to each of the Gas Businesses to confirm your acceptance of the engagement by the Gas Businesses.

Professor Alan Gregory 4 25 October 2012
D o c I D : A8 0 5 9 - 6 2 5 8 7 1 0 1 . 1
Yours faithfully
Enc: Federal Court of Australia Practice Note CM 7, “Expert Witnesses in Proceedings in the Federal Court of Australia”
…………………………………………………… Signed and acknowledged by Professor Alan Gregory Date …………………………………..

CREDIT SUI SSE February 2012
Research Institute Thought leadership from Credit Suisse Research
and the world's foremost experts ·

CREDIT SUISSE
Table 9: Worldwide equity risk premiums relative to bills, 1900-2011
Country
Australia
Belgium
Canada
Den marl<
Finland
France
Germany•
Ireland
Italy
Japan
The Netherlands
New Zealand
Norway
South Africa
Spain
Sweden
Switzerland
United Kingdom
United States
Europe
World ex-USA
world
Geometric Arithmetic Standard Standard Minimum Min Maximum Max mean% mean% error% dev.% return% year return% year
6.5
2.8
4.1
2.6
5.5
5.9
5.7
3.0
5.5
5.6
4.1
4.0
2.9
6.2
3.1
4.2
3.3
4.2
5.2
3.6
3.9
4.4
8.0
5 .4
5.5
4.4
9.2
8.5
9.6
5.3
9.5
8.8
6.4
5.6
5.7
8:2
5.3
6.5
5.0
5.9
7.2
5.7
5.7
5.8
1.7
2 .3
1.6
1.9
2.9
2.3
3.0
2.0
3.0
2.6
2.2
1.7
2.5
2.1
2.1
2.1
1.8
1.9
1.9
2.0
1.9
1.6
17.7
24.6
17.1
20.5
30.3
24.5
31.8
21.4
32.0
27.7
22.8
18.3
26.4
22.0
21.8
22.1
18.9
19.g
19.7
20.9
19.9
17.1
-44.4
-57.8
-34.7
-50.3
-53.3
-43.1
-44.7
-66.3
-48.6
-48.3
-51.4
-58.3
-55.0
-33.9
-39.3
-40.8
-37.0
-54.6
-44.1
-47.1
-44.0
-41 .2
2008
2008
2008
2008
2008
2008
2008
2008
1945
1920
2008
1987
2008
1g2o
2008
2008
1g74
1g74
1931
2008
2008
2008
49.2
130.4
49.1
95.3
159.2
85.7
131.4
72.0
150.3
108.6
126.7
g7,3
157.1
106.2
98.1
84.6
54.8
121.8
56.6
76.3
79.6
70.3
1983
1940
1933
1983
1999
1941
1949
1977
1946
1952
1940
1983
197g
1933
1986
1905
1985
1975
1933
1933
1933
1933
·For Germany, statistics are based on 110 years, excluding 1 g22- 23. Source: Elroy Dimson, Paul Marsh, and Mike Staunton, Triumph of the Optimists, Princeton University Press, 2002, and subsequent research.
Table 10: Worldwide risk premiums relative to bonds, 1900- 2011
Country Geometric Arithmetic Standard Standard Minimum Min Maximum Max mean% mean% error% dev. % return% year return% year
Australia
Belgium
Canada
Denmark
Finland
France
Germany'
Ireland
Italy
Japan
The Netherlands
New Zealand
Norway
South Africa
Spain
Sweden
Switzerland
United Kingdom
United States
Europe
World ex-USA
World
5.6
2.5
3.4
1.6
5.2
3.0
5.1
2.8
3.5
4.7
3.3
3.6
2.2
5.3
2.1
3.5
1.9
3.6
4.1
3.7
3.5
3.5
7.5
4.7
5 .0
3. 1
8.9
5.3
8 .5
4 .8
6.9
8.8
5 .6
5.2
5.2
7.1
4.1
5.8
3.4
5.0
6.2
5.0
4.7
4.8
1.9
2.0
1.7
1.7
2.9
2.2
2.7
1.9
2.8
3.1
2.1
1.7
2.6
1.8
2.0
2.1
1.7
1.6
1.9
1.6
1.5
1.5
19.9
21.4
18.4
17.5
30.4
22.9
28.5
19.8
29.6
32.8
22.3
18.2
28.0
19.6
20.8
22.4
17.6
17.2
20.5
16.7
15.6
15.6
-52.9
-60.3
-40.7
-54.3
-56.3
-49.2
-50.8
-66.6
-4g.o
-45.2
-55.6
-59.7
-57.8
-34.3
-42.7
-48.1
-40.6
-38.4
-50.1
-47.4
-47. 1
-47.9
2008
2008
2008
2008
2008
2008
2008
2008
2008
2008
2008
1987
2008
2008
2008
2008
2008
2008
2008
2008
2008
2008
66.3
84.4
48.6
74.9
173.1
84.3
116.6
83.2
152.2
193.0
107.6
72.7
192.1
70.9
69.1
87.5
52.2
80.8
57.2
67.9
51.7
38.3
1980
1940
1950
1972
1999
1946
1949
1972
1946
1948
1940
1983
1979
1979
1986
1905
1985
1975
1933
1923
1923
1954
• For Germany, statistics are based on 110 years, excluding 1922- 23. Source: Elroy Dim son, Paul Marsh, and Mike Staunton, Triumph of the Optimists, Princeton University Press, 2002, and subsequent research.
Credit Suisse Global Investment Returns Sourcebook 2012
February 2012
28

12
4
8
a.
30
CREDIT SUISSE
Table 11: Decomposition of the historical risk premium, 1900-2011 (% p.a.)
Geometric plus• plus plus minus equals
mean Growth rate Expansion Change in US real Equity
Country dividend of real in the the real interest premium for yield dividends P/ D ratio exchange rate rate US investors
Australia 5.75 0.99 0.40 0.10 0.92 6.35
Belgium 3.71 -1.48 0.21 0.67 0.92 2.14
Canada 4.37 0.67 0.59 0.06 0.92 4.78
Denmark 4.56 -0.96 1.26 0.53 0.92 4.45
Ftnland 4.76 0.23 0.01 0.12 0.92 4.17
France 3.83 -0 .75 -0.18 -0.08 0.92 1.85
Germany .. 3.66 -1 .27 0.51 0.27 0.92 2.20
Ireland 4.54 -1.29 0.51 0.28 0.92 3.06
Haly 4.05 -2.21 -0.07 0.17 0.92 0.92
Japan 5.20 -2.36 0.88 0.55 0.92 3.23
The Netherlands 4.93 -0.61 0.50 0.31 0.92 4.17
New Zealand 5.38 1.17 -0.79 -0.21 0.92 4.57
Norway 4.02 -0.07 0.13 0.33 0.92 3.47
South Africa 5.79 1.05 0.29 -0.75 0.92 5.43
Spain 4.20 -0.58 -0.17 0.09 0.92 2.57
Sweden 4.02 1.80 0.21 0.06 0 .92 5.20
Switzerland 3.47 0.47 0.17 0.90 0.92 4.10
Unfted Kingdom 4.62 0.45 0.10 -0.05 0.92 4.18
United States 4.22 1.31 0.57 0.00 0.92 5.22
Average 4.48 -0.18 0.27 0.18 0.92 3.79
Standard deviation 0.68 1.22 0.44 0.36 0.00 1.41
World (USD) 4. 10 0.79 0.41 0.00 0 .92 4.39
• Premtums are relative to bills. Summations and subtractions are geometric.·· For Germany, statistics are basec on 110 years, excluding 1922-23. Source: Elroy Dimson, Paul Marsh, and Mike Staunton, The Worldwide Equity Premium: A Smaller Puzzle, in R. Mehra (Ed.), Handbook of the Equity Risk Premium, Elsevier, 2008.
Growth rates varied a lot across countries, ranging from 1.8% in Sweden to - 2.4% in Japan. Real dividend growth was lower in the turbulent first half of the last century, when real dividends generally declined, and the real dividend growth rate on the world index was -0.9% per year. From 1900 to 1949, only three countries had positive real dividend growth, the USA, Australia, and New Zealand. But f rom 1950 to 2011 real dividend growth was positive everywhere except New Zealand . The real dividends on the world index grew by a far healthier 2.2% per year.
Chart 12: Real dividend growth around the world, 190Q-2011
7
6
5
4
3
2
0
-1
-2
-3
n ""' n n " II n
I .- I .- - ·~ I . ._ ..... ILb..
February 2012
~[~li '--
~ tr
Jap Ita Bel Ire Ger Den Fra Net Spa Nor Fin Eur UK Swi WxU Can Wid Aus SAf NZ US Swe
• Real equity retum • Real dividend growth • Change in price/dividend ratio
Source: Elroy Dimson, Paul Marsh, and Mike Staunton, Triumph of the Optimists, Princeton University Press, 200'.2, and subsequent research.
Credit Suisse Global Investment Retums Sourcebook 2012 31

CREDIT SUISSE
One view often expressed is that there is no particular reason to expect a bond maturity premium, since some investors will view short bonds as riskier than long bonds, while others will take the opposite view, depending on the profile of their liabilities . Bondholders with long-term horizons seeking to match long-term liabilities will view long bonds as the lower risk, since if they invest in short-term bills, they will need to reinvest on a regular basis, and there is uncertainty over the reinvestment rate. In contrast, investors with shorter-term horizons and liabilities will view long bonds as the more risky since there is uncertainty about the price at which they will be able to sell the bonds.
While these arguments are valid, they fail to take account of inflation uncertainty. We have seen that inflation has seriously affected long run investment performance, and that investors should be concerned with the purchasing power of their future wealth. At times of inflation uncertainty, short-term bonds become the lower risk investment even for investors with long-term (real) liabilities. A bond maturity premium is therefore required in order to compensate investors for the greater volatility and inflation risk of investing in long bonds. This is borne out by two key observations. First, the yield curve has historically on average been upward sloping; that is, long bonds have typically offered a higher yield to redemption than shorter dated bonds and bills. Second, real bond returns are far more volatile than real bill returns (compare Tables 4 and 5).
As was the case with the equity risk premium, we cannot easily measure investors' ex ante requirements or expectations relating to the maturity premium, but we can measure the bond maturity premiums actually achieved. Table 12 shows bond maturity premiums computed over the entire period from 1900 to 2011 for all 19 our indexes. The formula for the bond maturity premium is 1 + Long bond rate of return, divided by 1 + Treasury bill rate of return, minus 1. The second column of the table shows the geometric mean premiums that investors have earned. Chart 16 shows the same data pictorially, with the blue bars representing the geometric mean premiums. It shows that over the last 112 years, the bond maturity premium has been positive in every country (the premium for Germany excludes 1922- 23).
The premium for the European index is zero as it is measured from the perspective of a US investor, relative to US bills, i.e. US holders would have been as well off holding US bills as
Table 12: Worldwide bond maturity premiums, 1900-2011
Country Geometric Arithmetic Standard Standard Minimum Min Maximum Max mean% mean % error% dev.% return% year return% year
Australia 0.9 1.4 1.0 10.4 -23.3 1973 48.2 1932
Belgium 0.3 0.7 0.9 9.2 -19.6 1914 34.0 1958
Canada 0.7 1.0 0.8 8.3 -26.4 1915 24. 1 1982
Den marl< 1.0 1.3 0.8 8.8 -18.5 19g4 41 .1 1983
Finland 0.3 0.5 0.5 5.3 -17.4 1920 19.2 1993
France 2.8 3.1 0.7 7.8 -18.7 1994 23.4 1g27
Germany' 0.6 1.1 1.0 10.1 -38.6 1948 48.3 1g21
Ireland 0.3 0.9 1.1 11.4 -26.4 1974 37.2 1932
Italy 2.0 2.3 0.8 8.2 -17.5 1935 52.3 1944
Japan 0.9 1.8 1.3 13.6 -45.6 1953 63.0 1954
The Netherlands 0.9 1.1 0.7 7.4 -18.9 1939 25.2 1982
New Zealand 0.5 0.7 0.6 6.7 -25.2 1984 24.4 1991
Norway 0.6 1.0 0.8 8.3 -30.4 1918 37.3 1940
South Africa 0.8 1.1 0.7 7.7 -18.3 1994 30.4 1933
Spain 1.0 1.4 0.9 9.3 -27.0 1920 46.5 1942
Sweden 0 .7 1.0 0.8 8.3 -34.1 1939 24.5 1934
Switzerland 1.4 1.5 0.6 5.9 -13.9 1989 24.1 1922
United Kingdom 0.5 1.1 1.0 10.8 -26.6 1974 36.6 1932
United States 1.1 1.4 0.8 8.6 -15.0 2009 28 .2 2011
Europe 0.0 0.9 1.3 13.8 -40.2 1919 66.0 1933
World ex-USA 0.3 1.1 1.2 12.8 -36.4 1919 64.3 1933
World 0 .8 1.2 0.8 8.5 -20.4 1920 29.4 1933
• For Germany, statistics are based on 110 years, excluding 1922-23. Source: Elroy Dimson, Paul Marsh, and Mike Staunton, Triumph of the Optimists, Princeton University Press, 2002, and subsequent research.
Credit Suisse Global Investment Returns Sourcebook 2012
February 2012
38

12
56
CREDIT SUISSE February 20 12
CHAPTER5
Australia
The data for equities were provided by the author of Officer (1989) . He uses Lamberton's {1958a,b) data, linked over the period 1958- 7 4 to an accumulation index of 50 shares from the Australian Graduate School of Management (AGSM) and over 1 975-79 to the AGSM value-weighted accumulation index. Subsequently, we use the Australia All-Ordinary index. Brailsford, Handley and Maheswaran (2008) argue that pre-1958 dividends are overstated by Lamberton, but do not present alternative annual dividend estimates, and we continue to use Officer's dataset.
Bond returns are based on the yields on New South Wales government securities from 1 900-14. For the period 1915-49, the yields were on Commonwealth Government Securities of at least five years maturity. During 1 95~6, the basis is 1 0-year Commonwealth Government Bonds. From 1986, we use the JP Morgan Australian government bond index with maturity of over seven years.
For 1900--28, the short-term rate of interest is taken as the three-month time deposit rate. From 1929 onward, we use the treasury bill rate.
Inflation is based on the retail price index over 1 900-48 and thereafter on the consumer price mdex.
The switch in 1 966 from Australian pounds to Australian dollars has been incorporated in the Exchange Rate index history.
Table 13: Returns on Australian asset classes 190G-2011
Mean returns % p.a. Annual returns % Ten-year returns % p.a.
Return Asset GM AM SE so sc Lowest Highest Lowest Highest
Nom•nal Equities 11.3 12.9 1.8 18.5 -0.13 -40.4 2008 66.8 1983 1.7 1974 23.7 1986
Bonds 5.5 6.1 1.1 11.4 0.16 -19.1 1973 53.8 1932 -1.9 1920 17.3 1991
Bills 4.6 4.6 0.4 3.9 0.94 0.7 1951 17.3 1989 0.9 1957 14.3 1990
Inflation 3.9 4.0 0.5 5.2 0.54 -12.6 1921 19.3 1951 -2.2 1933 11.4 1983
Real Equities 7.2 8.9 1.7 18.2 -0.06 -42.5 2008 51.5 1983 -5.6 1978 17.1 1929
Bonds 1.6 2.4 1.2 13.2 0.29 -26.6 1951 62.2 1932 -8.4 1920 14.1 1934
Bills 0.7 0.8 0.5 5.4 0.59 -15.5 1951 18.5 1921 -6.7 1956 6.8 1993
Exchange rate 0.1 0.8 1.1 11.7 0.08 -39.9 1931 46.4 1933 -8.3 1947 7.6 2011
Prem•ums Equities vs. bills 6.5 8.0 1.7 17.7 -0.11 -44.4 2008 49.2 1983 -3.6 1978 14.8 1959
Equities vs. bonds 5.6 7.5 1.9 19.9 -0.07 -52.9 2008 66.3 1980 -4.4 1996 16.3 1959
Bonds vs. bills 0.9 1.4 1.0 10.4 0.09 -23.3 1973 48.2 1932 -6.6 1982 9.3 1940
GM=geometric mean; AM=arithmetic mean, SE=standard error of mean; SD=standard deviation; SC=serial correlation; Ten-year returns to end of given year
Soutte: Elroy Dimson, Paul Marsh and Mike Staunton, Triumph of the Optimists, Princeton University Press, 2002, and subsequent research.
Credit Suisse Global Investment Returns Sourcebook 2012
Current
year rank
102
14
42
54
101
13
49
54
101
109
10
57