The Active Risk Control (ARC) Toolkit: A New Approach to Designing Risk Control Interventions
26
The Active Risk Control (ARC) Toolkit: A New Approach to Designing Risk Control Interventions Author: Alan J. Card, PhD, MPH Acknowledgement: This publication is based on work supported by the American Society for Healthcare Risk Management. ---------------------------------------------------------------------------------------------------------------------- This is a pre-print draft version of the paper. The final and definitive version can be found in the Journal of Healthcare Risk Management. Please cite as: Card AJ. The Active Risk Control (ARC) Toolkit: A New Approach to Designing Risk Control Interventions. J Healthc Risk Manag 2014;33:5–14. ---------------------------------------------------------------------------------------------------------------------- ABSTRACT Current practice in healthcare risk management is supported by many tools for risk assessment (understanding problems), but none for risk control (solving problems). The results: a failure to improve safety, and a waste of the investment made in risk assessment. The Active Risk Control (ARC) Toolkit, available for free, fills this void with a systematic, structured approach to risk control. INTRODUCTION The purpose of risk management is not to conduct risk assessments. It is not even to understand the problems that risk assessments shed light on. The purpose of risk management is to improve outcomes by controlling risk. But this is not reflected in the tools and techniques that support current practice. As a result, healthcare risk management has traditionally focused on problems, instead of solutions. The Active Risk Control (ARC) Toolkit is intended to rebalance risk management practice by providing as much support for designing and managing risk control solutions as tools like root cause analysis (RCA) and failure mode and effects analysis (FMEA) have provided for
Transcript of The Active Risk Control (ARC) Toolkit: A New Approach to Designing Risk Control Interventions
The Active Risk Control (ARC) Toolkit: A New Approach to Designing Risk Control Interventions Author: Alan J. Card, PhD, MPH Acknowledgement: This publication is based on work supported by the American Society for Healthcare Risk Management.
---------------------------------------------------------------------------------------------------------------------- This is a pre-print draft version of the paper. The final and definitive version can be found in the Journal of Healthcare Risk Management. Please cite as:
Card AJ. The Active Risk Control (ARC) Toolkit: A New Approach to Designing Risk Control Interventions. J Healthc Risk Manag 2014;33:5–14.
----------------------------------------------------------------------------------------------------------------------
ABSTRACT
Current practice in healthcare risk management is supported by many tools for risk
assessment (understanding problems), but none for risk control (solving problems). The
results: a failure to improve safety, and a waste of the investment made in risk
assessment. The Active Risk Control (ARC) Toolkit, available for free, fills this void
with a systematic, structured approach to risk control.
INTRODUCTION
The purpose of risk management is not to conduct risk assessments. It is not even to
understand the problems that risk assessments shed light on. The purpose of risk
management is to improve outcomes by controlling risk. But this is not reflected in the
tools and techniques that support current practice. As a result, healthcare risk
management has traditionally focused on problems, instead of solutions. The Active Risk
Control (ARC) Toolkit is intended to rebalance risk management practice by providing as
much support for designing and managing risk control solutions as tools like root cause
analysis (RCA) and failure mode and effects analysis (FMEA) have provided for
identifying and assessing problems. This paper will introduce the ARC Toolkit and
describe user feedback from four different studies examining its use.
BACKGROUND
Since the advent of the modern patient safety movement, healthcare organizations have
adopted a number of risk management tools and techniques, including incident
reporting,1–5 the Global Trigger Tool,6,7 root cause analysis (RCA), 8–11 failure mode and
effects analysis (FMEA),12–15 and other risk assessment techniques.12–22 One feature all
of these approaches have in common is that they are problem-oriented; they help users to
understand what has gone wrong, or might go wrong. They provide no direct support for
solving the problems they uncover.17,23
That would not be a problem if healthcare organizations were well-equipped to translate
risk assessments into robust, well-designed, and well-managed solutions, but in general
they are not. Healthcare workers face significant challenges in developing (or even
recognizing) effective solutions in response to a risk assessment.11,24–33 Thus, while risk
assessments like root cause analysis may improve the quality and quantity of risks
identified,34 this does not necessarily lead to effective risk control.23 In fact, the solutions
that result from current practice tend to rely primarily on administrative controls, the
weakest rung on the hierarchy of risk controls.23 Despite the widespread adoption of
RCA and similar approaches, so far there is no evidence of systemic improvement in the
rate of patient harm over time.35
According to recent studies, the rate of patient harm in hospitals appears to hover
somewhere around 25-30%,35–37 with avoidable harm in hospitals contributing to an
estimated 400,000 deaths per year in the United States.7 If avoidable errors in all other
healthcare sectors combined (ambulatory care, long-term care, etc.) contribute to even
half as many deaths, avoidable harm from healthcare may be the leading cause of death in
the US.38 There is an urgent need for more effective practice in solving the systems-level
determinants of patient harm.
The Active Risk Control (ARC) Toolkit is designed to address this by walking users
through a structured process for designing and managing risk control interventions. The
adoption of structured risk assessment techniques has enabled an improvement in
healthcare organizations’ understanding of the systems-level problems that contribute to
patient harm.34 It is hoped that by providing an analogously structured approach to risk
control process, the ARC Toolkit will enable a similar improvement in the solutions
through which those problems are addressed.
THE ACTIVE RISK CONTROL TOOLKIT
The ARC Toolkit is available for free under a Creative Commons Attribution 3.0
Unported License, and comes in the form of an Excel workbook available at
www.activeriskcontrol.com (ASHRM will offer a PDF version of the Active Risk
Control Toolkit in Q2 2014 — available on the ASHRM website at www.ashrm.org). It
consists of five main components, each of which will be introduced below. The first is an
introduction to the Process for Active Risk Control. The second is the Background
Section. The third is the Generating Options for Active Risk Control (GO-ARC)
Technique. The fourth is made up of a series of Options Analysis worksheets, and the
final section consists of an Options Evaluation Matrix. Each of these is described below.
The Process for Active Risk Control
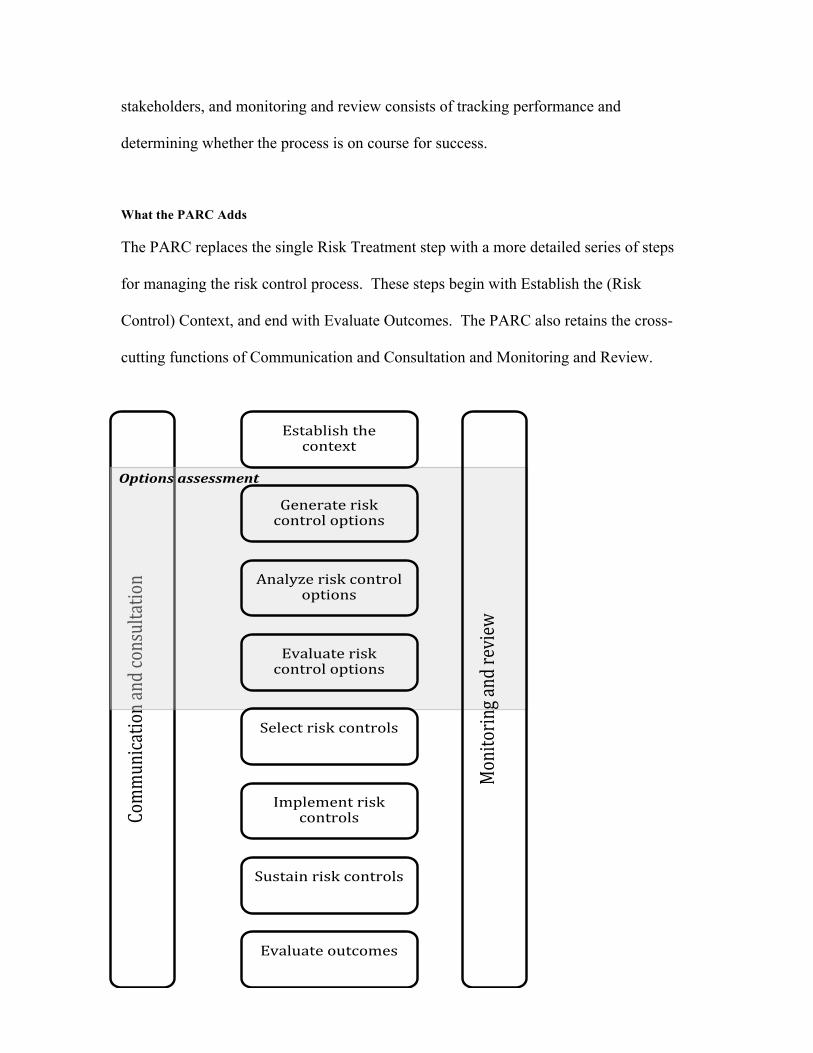
The ARC Toolkit is based on the Process for Active Risk Control (PARC), shown in
Exhibit 1, and begins with an introduction to the PARC. This is an extension of the risk
management process from ISO 31000,39 perhaps the most widely-used risk management
standard in the world today.
The ISO 31000 Approach
The ISO 31000 process consists of five steps and two cross-cutting functions. The five
steps are: 1. Establishing the Context, 2. Risk Identification, 3. Risk Analysis, 4. Risk
Evaluation, and 5. Risk Treatment. The two cross-cutting functions, which are intended
to take place across all of these steps are: 1. Communication and Consultation, and 2.
Monitoring and Review.39
Establishing the Context is primarily concerned with setting the terms of reference for the
risk management process (e.g., developing the risk management policy). Risk
assessment takes place through steps 2-4, in which risks are identified, analyzed, and
evaluated against the criteria described in the risk management policy. Risk treatment
(the solutions-focused component of the risk management process) is depicted as a single
step, and is not well defined or coherently described in the ISO 31000 standard.
Communication and consultation is characterized by an ongoing dialogue with
stakeholders, and monitoring and review consists of tracking performance and
determining whether the process is on course for success.
What the PARC Adds
The PARC replaces the single Risk Treatment step with a more detailed series of steps
for managing the risk control process. These steps begin with Establish the (Risk
Control) Context, and end with Evaluate Outcomes. The PARC also retains the cross-
cutting functions of Communication and Consultation and Monitoring and Review.
!
Comm
unication!and!consu
ltation!
Options(assessment(
Establish!the!context!
Generate!risk!control!options!
Analyze!risk!control!options!
Evaluate!risk!control!options!
Select!risk!controls!
Implement!risk!controls!
Sustain!risk!controls!
Evaluate!outcomes!
Monitoring!and!review!
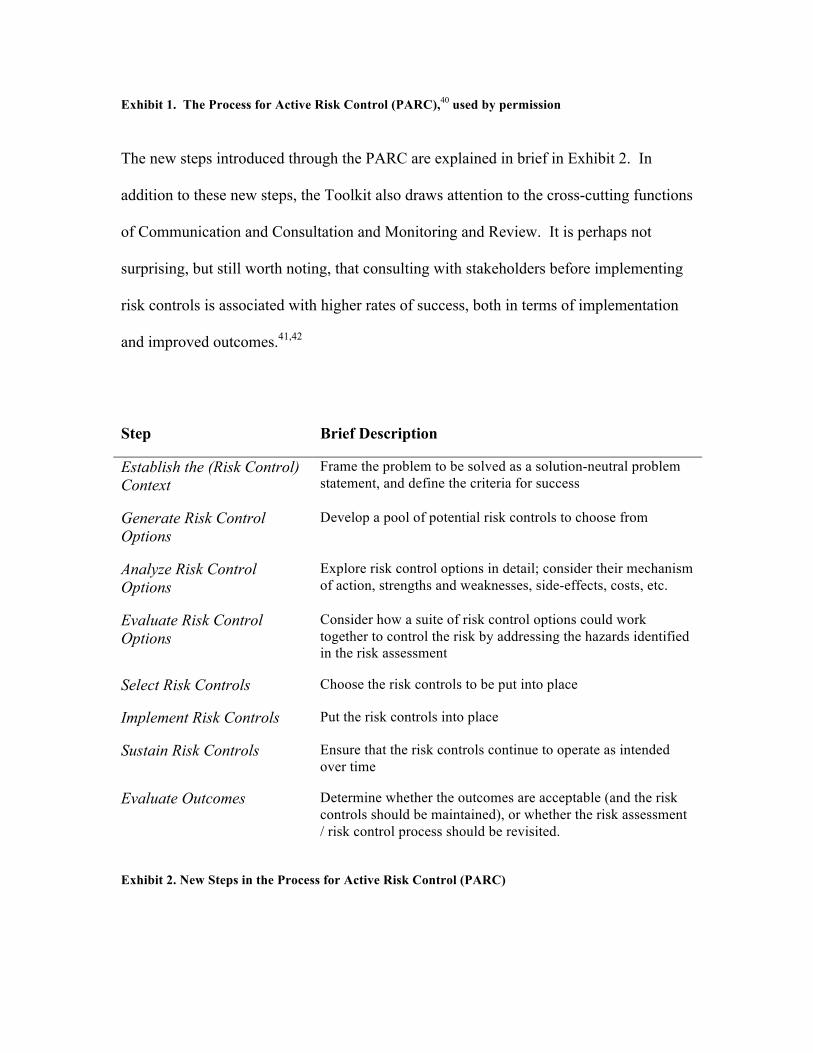
Exhibit 1. The Process for Active Risk Control (PARC),40 used by permission The new steps introduced through the PARC are explained in brief in Exhibit 2. In
addition to these new steps, the Toolkit also draws attention to the cross-cutting functions
of Communication and Consultation and Monitoring and Review. It is perhaps not
surprising, but still worth noting, that consulting with stakeholders before implementing
risk controls is associated with higher rates of success, both in terms of implementation
and improved outcomes.41,42
Step Brief Description
Establish the (Risk Control) Context
Frame the problem to be solved as a solution-neutral problem statement, and define the criteria for success
Generate Risk Control Options
Develop a pool of potential risk controls to choose from
Analyze Risk Control Options
Explore risk control options in detail; consider their mechanism of action, strengths and weaknesses, side-effects, costs, etc.
Evaluate Risk Control Options
Consider how a suite of risk control options could work together to control the risk by addressing the hazards identified in the risk assessment
Select Risk Controls Choose the risk controls to be put into place
Implement Risk Controls Put the risk controls into place
Sustain Risk Controls Ensure that the risk controls continue to operate as intended over time
Evaluate Outcomes Determine whether the outcomes are acceptable (and the risk controls should be maintained), or whether the risk assessment / risk control process should be revisited.
Exhibit 2. New Steps in the Process for Active Risk Control (PARC)
Background Section
The Background Section of the ARC Toolkit has two parts. The first is concerned with
framing the problem, and the second with defining success.
Problem Framing
Problem framing is a concept borrowed from the engineering design literature, in
recognition of the fact that risk control is a problem of designing and managing solutions.
A problem frame is simply a “standpoint from which a problematic situation can be
tackled.”43 The practice of problem framing is a key part of design thinking, and may be
one of the most applicable to problems of organizational change (such as risk control).43
Central to this process is the insight that the problem as initially presented may need to be
actively re-framed to allow for the most useful solutions to emerge.
This may occur through a variety of approaches, including framing the problem with
greater abstraction or with greater specificity. An example of abstraction would be to
move from a problem-as-presented of “a breakdown in handoff communication” to one
of “a lack of awareness about key aspects of the patient’s condition.” The first problem
can only be solved through improved handoff communication, but the second could
involve a wider array of solutions (e.g., posting a daily goals communication sheet in the
patient’s room, 44 redesigning the first page clinicians see about each patient in the
electronic health record system, etc.). An example of using greater specificity would be
reframe the problem of “patient falls” as “patient falls-with-injury.” This would allow for
a focus not only on preventing falls, but also on reducing the risk of injury for those who
do fall. Softer flooring materials, restrooms designed with fewer hard surfaces to bang
into (e.g., inset sinks), and padded clothing might then be among the options considered.
In all cases, the goal should be to develop a solution-neutral problem statement45 (i.e., a
definition of the problem that does not specify a preferred solution). For instance, a root
cause analysis of a patient fall might result in the identification of “failure to use a bed
alarm” as a hazard to be addressed, but this is simply a solution in disguise. The only
possible remedy would be use of a bed alarm. A solution-neutral problem statement
might read as “staff were not aware that the patient was out of bed.” Use of a bed alarm
is one way to address this, but additional options might include increasing the visibility of
patients to staff members, storing frequently used materials on site to reduce the number
of times staff members have to leave the floor to retrieve medication and supplies, etc.
Defining Success
This is simply a matter of explicitly defining the conditions under which the risk control
process would be considered a success, and how success will be measured. Where
feasible, this should be SMART: Specific, measurable, achievable, realistic, and time-
bounded. An example might be: “A 50% reduction in the rate of hospital-acquired
pressure ulcers within 6 months of implementation, as measured using existing tracking
mechanisms.” It may not always be possible to be this specific, perhaps because it is not
possible to collect the relevant data in a cost-effective way; in such cases, success may
defined in terms of reducing the assessed risk to a level as low as reasonably practicable
(ALARP).46
Whether explicitly stated or not, one component of the definition of success is always an
improvement in the organization’s risk profile. The impact of the risk control process
should result not only in an improvement for the risk of interest, but also in a reduction in
the negative risks held by the organization. In other words, it is important to ensure that
the cure is not worse than the disease.
The Generating Options for Active Risk Control (GO-ARC) Technique
This section of the Toolkit consists of the Generating Options for Active Risk Control
(GO-ARC) Technique, a structured brainstorming technique that assists users in
developing a stronger pool of risk control options to choose from. Users employ five
brainstorming prompts, each of which represents a different approach to controlling the
risk: Elimination of the hazard or the target; Design controls; Administrative controls;
Detection / situational awareness; and Preparedness. The first three represent a hierarchy
of risk controls. Complete elimination of the hazard (source of harm) or target (person or
entity at risk of harm) is the most robust response; design controls (things like physical
barriers, automation with forcing functions, or other approaches that don’t rely on people
to do the right thing) are the next most robust; and administrative controls (training,
policies, alarms, and other interventions that do rely on people to do the right thing) are
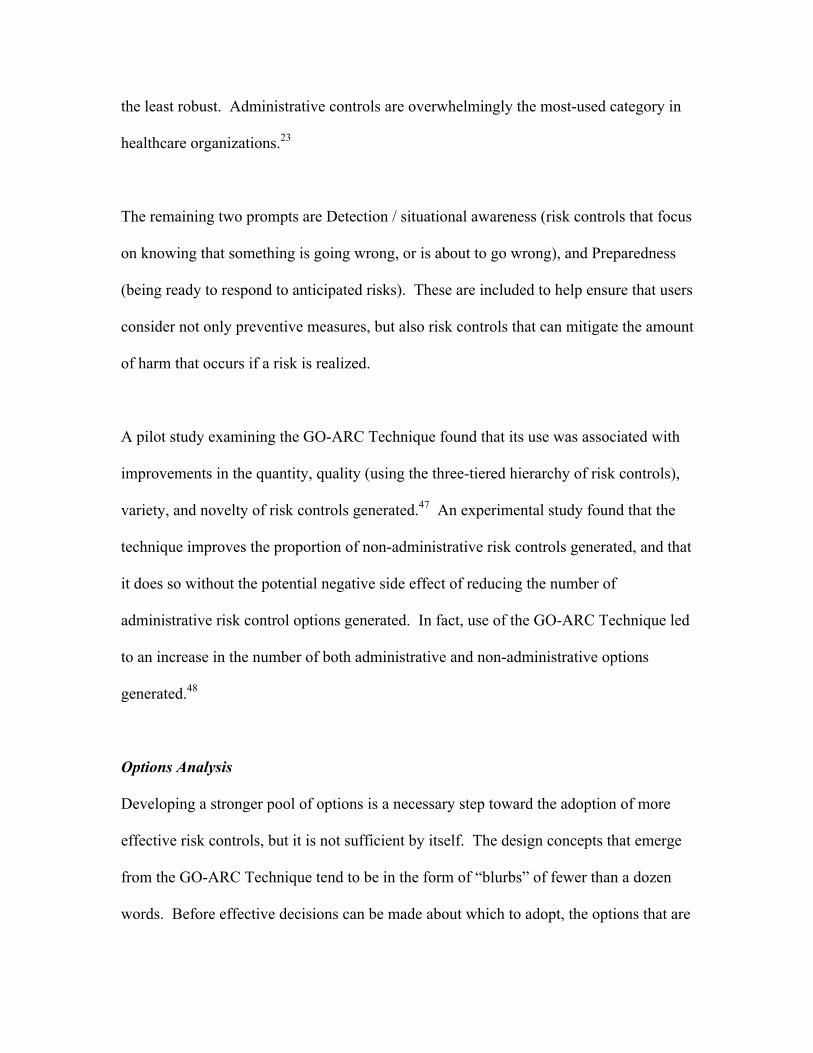
the least robust. Administrative controls are overwhelmingly the most-used category in
healthcare organizations.23
The remaining two prompts are Detection / situational awareness (risk controls that focus
on knowing that something is going wrong, or is about to go wrong), and Preparedness
(being ready to respond to anticipated risks). These are included to help ensure that users
consider not only preventive measures, but also risk controls that can mitigate the amount
of harm that occurs if a risk is realized.
A pilot study examining the GO-ARC Technique found that its use was associated with
improvements in the quantity, quality (using the three-tiered hierarchy of risk controls),
variety, and novelty of risk controls generated.47 An experimental study found that the
technique improves the proportion of non-administrative risk controls generated, and that
it does so without the potential negative side effect of reducing the number of
administrative risk control options generated. In fact, use of the GO-ARC Technique led
to an increase in the number of both administrative and non-administrative options
generated.48
Options Analysis
Developing a stronger pool of options is a necessary step toward the adoption of more
effective risk controls, but it is not sufficient by itself. The design concepts that emerge
from the GO-ARC Technique tend to be in the form of “blurbs” of fewer than a dozen
words. Before effective decisions can be made about which to adopt, the options that are
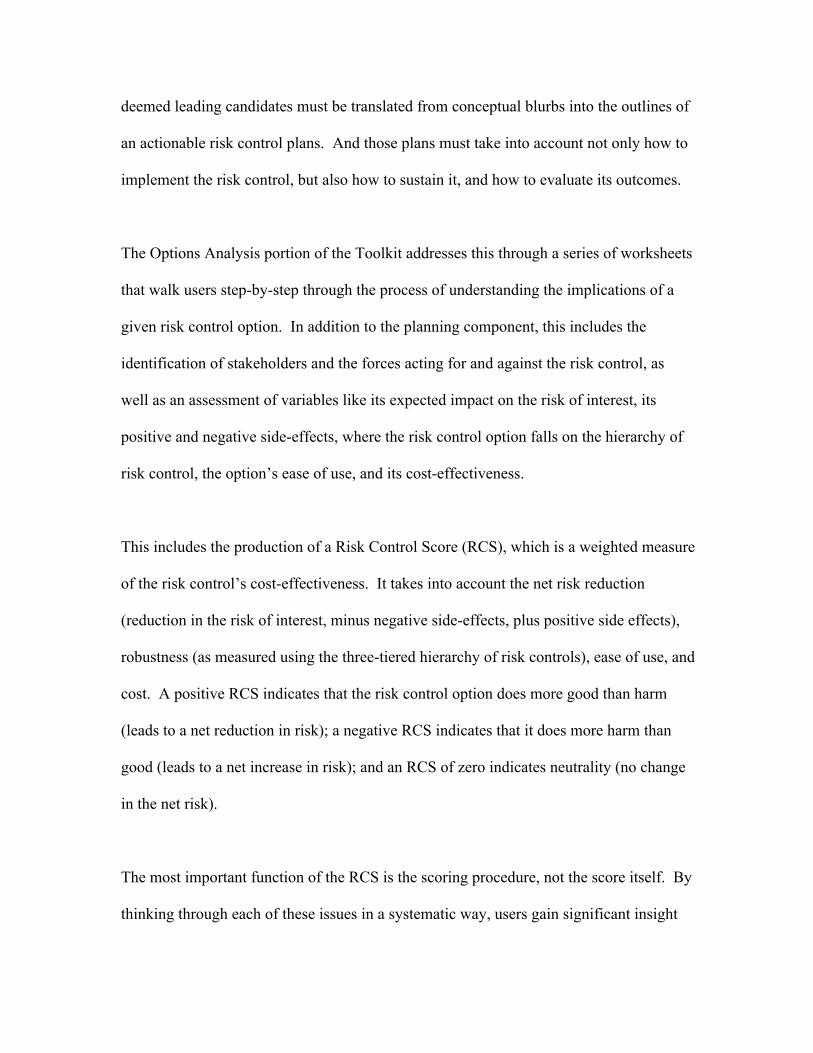
deemed leading candidates must be translated from conceptual blurbs into the outlines of
an actionable risk control plans. And those plans must take into account not only how to
implement the risk control, but also how to sustain it, and how to evaluate its outcomes.
The Options Analysis portion of the Toolkit addresses this through a series of worksheets
that walk users step-by-step through the process of understanding the implications of a
given risk control option. In addition to the planning component, this includes the
identification of stakeholders and the forces acting for and against the risk control, as
well as an assessment of variables like its expected impact on the risk of interest, its
positive and negative side-effects, where the risk control option falls on the hierarchy of
risk control, the option’s ease of use, and its cost-effectiveness.
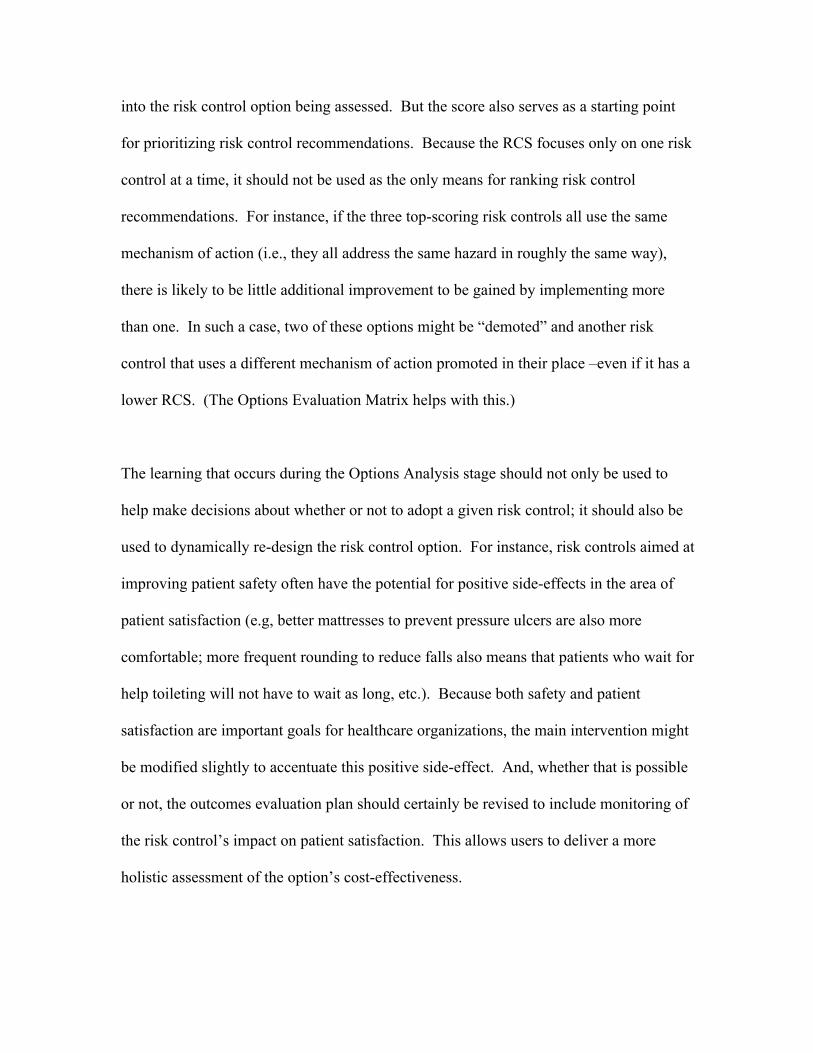
This includes the production of a Risk Control Score (RCS), which is a weighted measure
of the risk control’s cost-effectiveness. It takes into account the net risk reduction
(reduction in the risk of interest, minus negative side-effects, plus positive side effects),
robustness (as measured using the three-tiered hierarchy of risk controls), ease of use, and
cost. A positive RCS indicates that the risk control option does more good than harm
(leads to a net reduction in risk); a negative RCS indicates that it does more harm than
good (leads to a net increase in risk); and an RCS of zero indicates neutrality (no change
in the net risk).
The most important function of the RCS is the scoring procedure, not the score itself. By
thinking through each of these issues in a systematic way, users gain significant insight
into the risk control option being assessed. But the score also serves as a starting point
for prioritizing risk control recommendations. Because the RCS focuses only on one risk
control at a time, it should not be used as the only means for ranking risk control
recommendations. For instance, if the three top-scoring risk controls all use the same
mechanism of action (i.e., they all address the same hazard in roughly the same way),
there is likely to be little additional improvement to be gained by implementing more
than one. In such a case, two of these options might be “demoted” and another risk
control that uses a different mechanism of action promoted in their place –even if it has a
lower RCS. (The Options Evaluation Matrix helps with this.)
The learning that occurs during the Options Analysis stage should not only be used to
help make decisions about whether or not to adopt a given risk control; it should also be
used to dynamically re-design the risk control option. For instance, risk controls aimed at
improving patient safety often have the potential for positive side-effects in the area of
patient satisfaction (e.g, better mattresses to prevent pressure ulcers are also more
comfortable; more frequent rounding to reduce falls also means that patients who wait for
help toileting will not have to wait as long, etc.). Because both safety and patient
satisfaction are important goals for healthcare organizations, the main intervention might
be modified slightly to accentuate this positive side-effect. And, whether that is possible
or not, the outcomes evaluation plan should certainly be revised to include monitoring of
the risk control’s impact on patient satisfaction. This allows users to deliver a more
holistic assessment of the option’s cost-effectiveness.
Options Evaluation Matrix
Sometimes one risk control option is found that is so promising that no other options are
considered. But more often, a number of options are assessed. And, while the Options
Analysis Worksheets are very helpful for understanding how a risk control will work on
its own, they do not provide a clear picture of how a suite of risk control options might
work together as a system to reduce risk. This is where the Options Evaluation Matrix
comes in. It is a simple matrix in which risk control options (in rows) are compared
against the identified hazards (in columns) to present a picture of how well they address
the known causes and contributing factors that contribute to the risk of interest.
It is important to note that not all hazards are equally important, and that some hazards
are much more costly to address than others. The Options Evaluation Matrix should not
be taken to imply that all hazards must be addressed by one or more risk controls; rather,
the Matrix is intended to make it easy for users to ensure that they have not
unintentionally failed to address any hazards, and that they have provided a strong
enough response to those deemed most important.
Exhibit 3 shows a very simple example, with two risk control options and two hazards.
Note that an “X” is used to indicate that an option directly addresses a hazard, while a “/”
indicates that it indirectly, or only partially addresses the hazard. Surgical sponges that
dissolve harmlessly in the body, for instance, would not directly address the issue of
sponges being unintentionally left inside the surgical site, but it would make that hazard
less important. (In some cases, it might also lead to sponges being intentionally left in the
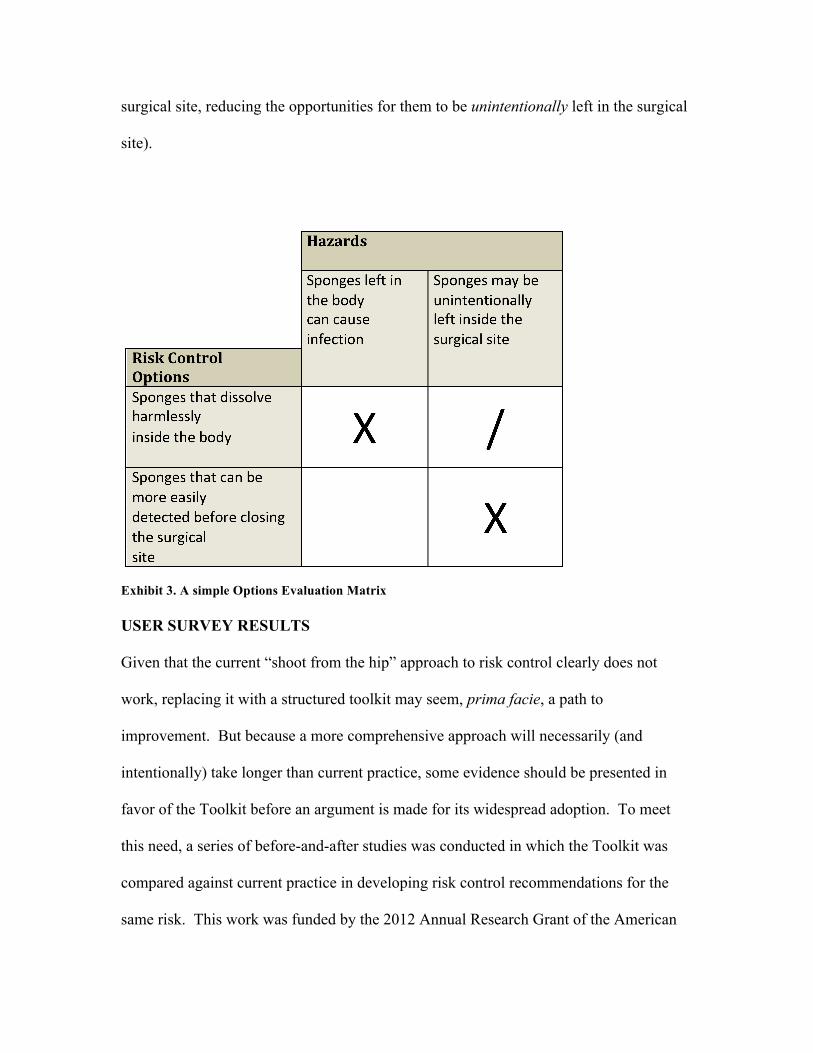
surgical site, reducing the opportunities for them to be unintentionally left in the surgical
site).
Exhibit 3. A simple Options Evaluation Matrix USER SURVEY RESULTS
Given that the current “shoot from the hip” approach to risk control clearly does not
work, replacing it with a structured toolkit may seem, prima facie, a path to
improvement. But because a more comprehensive approach will necessarily (and
intentionally) take longer than current practice, some evidence should be presented in
favor of the Toolkit before an argument is made for its widespread adoption. To meet
this need, a series of before-and-after studies was conducted in which the Toolkit was
compared against current practice in developing risk control recommendations for the
same risk. This work was funded by the 2012 Annual Research Grant of the American
Society for Healthcare Risk Management (ASHRM), and included four different
healthcare organizations: a hospital in the Midwest, a hospital in the Mississippi Valley
region, a hospital in the Mid-Atlantic region, and a university-affiliated ambulatory care
system in the Midwest. Two studies used the Toolkit to address an RCA and two used it
in response to a prospective risk assessment. The remainder of this paper will describe
the results of surveys conducted to gauge users’ assessment of the Toolkit’s impact on
risk control practice.
The survey was made up of three components: Likert scale-based acceptance models, an
assessment of user experience and training in RCA and prospective risk assessment, and
a structured questionnaire that allowed for open-ended responses.
Acceptance Models
The first section of the survey was made up of a series of 6-point Likert scales assessing
the constructs of Perceived Usefulness, Ease of Use, Acceptability of Direct Cost, and
Value, as well as Intention to Adopt. The first two are modified from the Technology
Acceptance Model,49,50 while the Value construct is modeled after the Value-Based
Adoption Model.51–53 Intention to Adopt is modified from Behavioral Intention, which
has been used in tests of both models.52,54 Acceptability of Direct Cost was measured as
part of the effort to build a conceptual bridge between these two acceptance models, but
the number of participants per site was not sufficient to support that analysis. The results
are shown in Exhibit 4.
Reliability
Cronbach’s alpha was measured for each scale (except Acceptability of Direct Cost,
which consisted of only one item, since the Toolkit it available free of cost). As Exhibit
4 shows, the results demonstrate very high reliability (i.e., internal consistency) for the
instrument.55 Cronbach’s alpha ranges from 0 to 1, and suggested acceptable values have
been reported as between 0.7 and 0.95,55 though values as low as 0.5 are still compatible
with validity.56 Each of the scales used in this study achieved a Cronbach’s alpha of 0.8
or higher.
Scores
As Exhibit 4 shows, users responded positively to the Toolkit. It scored above a 5 on a 6-
point scale for Perceived Usefulness, Acceptability of Direct Cost, Value, and Intention
to Adopt. Ease of Use scored a little lower, but was solidly in positive territory, with an
average score of 4.36, and a median score of 4.25. This may compare well with other
commonly used healthcare risk management tools, such as RCA and FMEA; though their
usability has not been assessed using this scale, there is plentiful evidence from the
literature that many users find them actively difficult.12,24,26,30,32,57
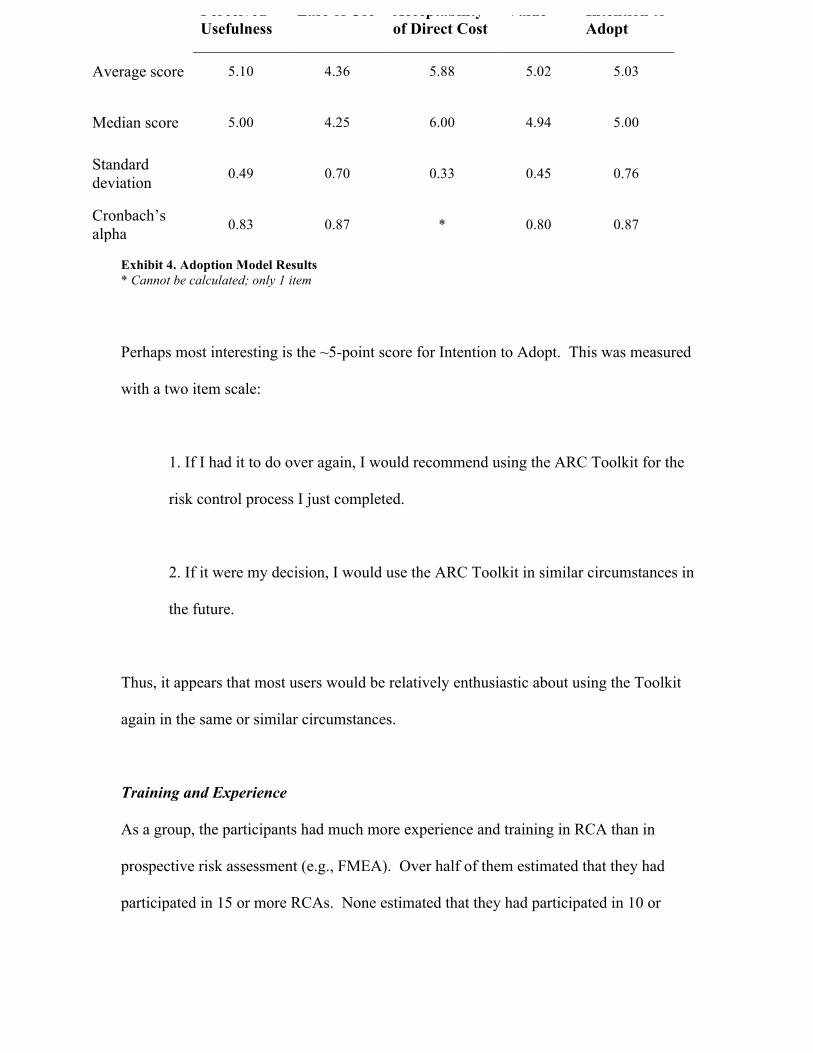
Exhibit 4. Adoption Model Results * Cannot be calculated; only 1 item
Perhaps most interesting is the ~5-point score for Intention to Adopt. This was measured
with a two item scale:
1. If I had it to do over again, I would recommend using the ARC Toolkit for the
risk control process I just completed.
2. If it were my decision, I would use the ARC Toolkit in similar circumstances in
the future.
Thus, it appears that most users would be relatively enthusiastic about using the Toolkit
again in the same or similar circumstances.
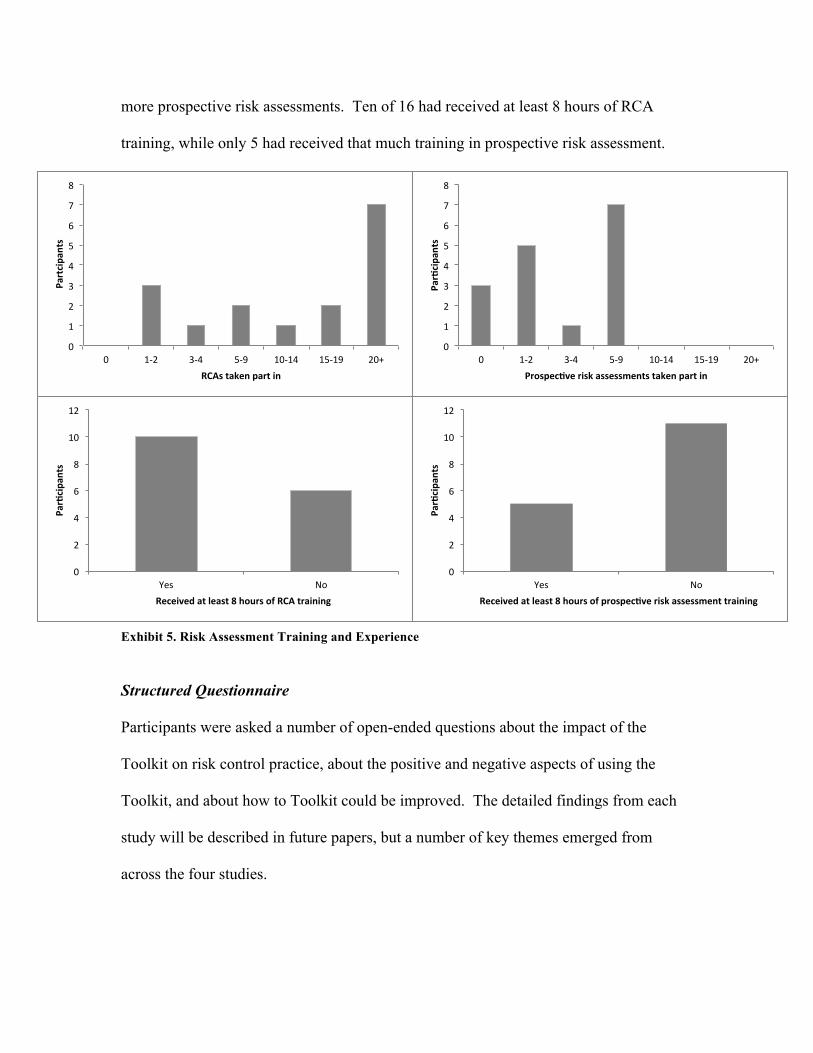
Training and Experience
As a group, the participants had much more experience and training in RCA than in
prospective risk assessment (e.g., FMEA). Over half of them estimated that they had
participated in 15 or more RCAs. None estimated that they had participated in 10 or
Perceived Usefulness
Ease of Use Acceptability of Direct Cost
Value Intention to Adopt
Average score 5.10 4.36 5.88 5.02 5.03
Median score 5.00 4.25 6.00 4.94 5.00
Standard deviation 0.49 0.70 0.33 0.45 0.76
Cronbach’s alpha 0.83 0.87 * 0.80 0.87
0"
1"
2"
3"
4"
5"
6"
7"
8"
0" 1+2" 3+4" 5+9" 10+14" 15+19" 20+"
!Partcipan
ts!
RCAs!taken!part!in!!
0"
1"
2"
3"
4"
5"
6"
7"
8"
0" 1+2" 3+4" 5+9" 10+14" 15+19" 20+"
Par0cipa
nts!
Prospec0ve!risk!assessments!taken!part!in!
0"
2"
4"
6"
8"
10"
12"
Yes" No"
Par0cipa
nts!
Received!at!least!8!hours!of!RCA!training!
0"
2"
4"
6"
8"
10"
12"
Yes" No"
Par0cipa
nts!
Received!at!least!8!hours!of!prospec0ve!risk!assessment!training!
more prospective risk assessments. Ten of 16 had received at least 8 hours of RCA
training, while only 5 had received that much training in prospective risk assessment.
Exhibit 5. Risk Assessment Training and Experience Structured Questionnaire
Participants were asked a number of open-ended questions about the impact of the
Toolkit on risk control practice, about the positive and negative aspects of using the
Toolkit, and about how to Toolkit could be improved. The detailed findings from each
study will be described in future papers, but a number of key themes emerged from
across the four studies.
Overall, participants appreciated the Toolkit’s structured and systematic approach, and
found the logic and flow of the Toolkit easy to understand. Users felt that it improved the
quality of their risk control process and helped them achieve better results. –And the
pathways to those better results were often not obvious; one of the key findings of the
survey was that users felt the Toolkit created important new insights that would not
otherwise have arisen. As one participant wrote, the Toolkit “always brings up things
you hadn't thought of –makes you look @ issues & solutions differently.”
Participants had an easy time with the general flow and logic of the using the Toolkit. A
few users suggested minor changes to some of the language used in the Toolkit, and these
changes have been made in the version linked to above. The only significant downside
identified by users was the fact that the Toolkit took longer than current practice. This is
not only unavoidable (given that the Toolkit replaces “shoot from the hip” with a
structured process), but also intentional. The lack of time spent on risk control is almost
certainly one of the reasons current practice fails so consistently. And, indeed, while
users noted the extra time required, not all of them felt it was a problem. As one user
wrote, the Toolkit: “takes more time but is also more in depth & provides improved
solutions that are more likely to be successful.” Some users also noted that they expected
to become faster with additional experience of using the Toolkit.
The average amount of time spent using the Toolkit in the four studies was 6.88 hours
(range: 6-8, standard deviation: 0.74). One reason that users may have perceived this as a
relatively long time was that the studies were generally scheduled to take place over the
course of one day. This is an artifact of the study, a result of the fact that the facilitator
traveled to each site for a limited time. When used locally, it is more likely that this time
will be split up over two or more shorter meetings, as with current practice in FMEA.
Nevertheless, future work will explore whether there are aspects of the Toolkit that could
be streamlined without significantly degrading its impact.
Limitations
The most important potential limitation for this study is the fact that the Toolkit’s
inventor served as the facilitator for the four studies. This could have had an impact both
on the effectiveness of the Toolkit (due to the facilitator’s greater knowledge of what the
Toolkit is intended to do), and on participants’ responses to the survey (due to social
desirability bias). The second issue was partially addressed by making the survey
anonymous, but the small number of participants per site may have reduced the
effectiveness of this approach. To address the fact that potential users might require
more knowledge of how to use the Toolkit, a train-the-trainer version has been
developed. This will allow facilitators to review the structure and function of the Toolkit
before setting out to use it in earnest. Like the spreadsheet-based version of the ARC
Toolkit, this is available for free at www.activeriskcontrol.com.
CONCLUSION
Risks assessments like root cause analysis, failure mode and effects analysis, etc., are
only useful if they result in effective solutions to the problems they uncover. While
improved practice in risk assessment has been supported through the adoption of a
structured tools,34 risk control (the solutions-focused component of the risk management
process) has not.17,23,34 And healthcare organizations generally lack the expertise to
design and manage effective risk control interventions without such support.30 As a
result, the improvements in risk assessment practice often result in little more than a
waste of resources that gives the illusion of improvement.
The Active Risk Control (ARC) Toolkit is designed to address this problem. It is built
around a new framework for risk control practice, the Process for Active Risk Control
(PARC), and supports users through a structured and systematic approach analogous to
the widely-adopted tools that have led to improvements in risk assessment. A survey of
early users of the Toolkit found that it improves the quality of the risk control process,
and that users are more confident in the strength of the risk control recommendations that
result. The Toolkit useful, valuable, free of cost, and reasonably easy to use, and most
respondents agree that they would use Toolkit again in the same or similar circumstances.
These findings agree with a previous pilot study of the Toolkit48,58 and provide further
support for its acceptability to risk managers and other users.
Evidence in favor of the Toolkit remains preliminary at this stage, and further research is
clearly required. But even the preliminary evidence in favor of the ARC Toolkit (both
from this paper and the earlier pilot study48,58) compares favorably with the
overwhelming evidence against current practice.7,11,23,24,26,28–33,35–37,59,60 Thus, from the
perspective of the “current best evidence,”61 it may be reasonable to recommend that
healthcare risk managers consider using the Toolkit in cases where it is clearly worth the
additional time investment to achieve stronger solutions (e.g., for prospective risk
assessments like FMEA, or in response to important risks that have not been adequately
controlled using current practice).
REFERENCES
1. Sari AB-A, Sheldon TA, Cracknell A, Turnbull A. Sensitivity of routine system for reporting patient safety incidents in an NHS hospital: retrospective patient case note review. BMJ. 2007;334(7584):79. doi:10.1136/bmj.39031.507153.AE.
2. Benn J, Koutantji M, Wallace L, et al. Feedback from incident reporting: information and action to improve patient safety. Qual Saf Health Care. 2009;18(1):11–21. doi:10.1136/qshc.2007.024166.
3. National Patient Safety Agency. National Framework for Reporting and Learning from Serious Incidents Requiring Investigation. 2010:44.
4. Dückers M, Faber M, Cruijsberg J, Grol R, Schoonhoven L, Wensing M. Safety and risk management interventions in hospitals: a systematic review of the literature. Med Care Res Rev. 2009;66(6 Suppl):90S–119S.
5. Woloshynowych M, Rogers S, Taylor-Adams S, Vincent C. The investigation and analysis of critical incidents and adverse events in healthcare. Heal Technol Assess. 2005;9(19):1–143, iii.
6. De Wet C, Bowie P. The preliminary development and testing of a global trigger tool to detect error and patient harm in primary-care records. Postgrad Med J. 2009;85(1002):176–80. doi:10.1136/pgmj.2008.075788.
7. James JT. A New, Evidence-based Estimate of Patient Harms Associated with Hospital Care. J Patient Saf. 2013;9(3):122–128.
8. The Joint Commission. Sentinel Events. Jt Comm. 2007:13.
9. Bagian JP, Lee C, Gosbee J, et al. Developing and deploying a patient safety program in a large health care delivery system: you can’t fix what you don't know about. Jt Comm J Qual Improv. 2001;27(10):522–532.
10. NPSA. Root Cause Analysis (RCA) Toolkit. 2004. Available at: http://www.npsa.nhs.uk/rcatoolkit/course/iindex.htm.
11. Taitz J, Genn K, Brooks V, et al. System-wide learning from root cause analysis: a report from the New South Wales Root Cause Analysis Review Committee. Qual Saf Healthc. 2010;19(6):e63. doi:10.1136/qshc.2008.032144.
12. Burgmeier J. Failure mode and effect analysis: an application in reducing risk in blood transfusion. Jt Comm J Qual Improv. 2002;28(6):331–9.
13. Ward J, Clarkson J, Buckle P, Berman J, Lim R, Jun T. Prospective Hazard Analysis: Tailoring Prospective Methods To A Healthcare Context.; 2010.
14. NPSA. Risk Assessment Programme Overview. London: NPSA; 2006:9.
15. VHA. VHA National Patient Safety Improvement Handbook. 2008:22.
16. Card AJ, Harrison H, Ward J, Clarkson PJ. Using prospective hazard analysis to assess an active shooter emergency operations plan. J Healthc Risk Manag. 2012;31(3):34–40.
17. Card AJ, Ward JR, Clarkson PJ. Beyond FMEA: The structured what-if technique (SWIFT). J Healthc Risk Manag. 2012;31(4):23–29.
18. Dowie R, Campbell H, Donohoe R, Clarke P. Event tree’ analysis of out-of-hospital cardiac arrest data: confirming the importance of bystander CPR. 2003;56(2):173–181.
19. Ekaette E, Lee RC, Cooke DL, Iftody S, Craighead P. Probabilistic Fault Tree Analysis of a Radiation Treatment System. Risk Anal. 2007;27(6):1395–1410.
20. Hyman WA, Johnson E. Fault tree analysis of clinical alarms. J Clin Eng. 2008;33(2):85–94.
21. Potts HWW, Keen J, Denby T, et al. Towards a better understanding of delivering e-health systems : a systematic review using the meta-narrative method and two case studies. Final Report. London; 2011.
22. Card AJ. A new tool for hazard analysis and force field analysis: The Lovebug Diagram. Clin Risk. 2013;00(00):00. doi:10.1177/1356262213510855.
23. Card AJ, Ward J, Clarkson PJ. Successful risk assessment may not always lead to successful risk control: A systematic literature review of risk control after root cause analysis. J Healthc Risk Manag. 2012;31(3):6–12. doi:10.1002/jhrm.20090.
24. Dixon-Woods M. Why is patient safety so hard? A selective review of ethnographic studies. J Health Serv Res Policy. 2010;15 Suppl 1(January):11–6. doi:10.1258/jhsrp.2009.009041.
25. Gosbee J, Anderson T. Human factors engineering design demonstrations can enlighten your RCA team. Qual Saf Heal Care. 2003;12(2):119–121. doi:10.1136/qhc.12.2.119.
26. Iedema R, Jorm C, Braithwaite J. Managing the scope and impact of root cause analysis recommendations. J Heal Organ Manag. 2008;22(6):569–585.
27. Grout JR. Mistake-proofing the design of health care processes. 2007. Available at: http://www.ahrq.gov/qual/mistakeproof/.
28. Lyons M, Woloshynowych M, Adams S, Vincent C. Error reduction in medicine: Final report to the Nuffield Trust. Nuffield Trust; 2005.
29. Morse RB, Pollack MM. Root Cause Analyses Performed in a Children’s Hospital: Events, Action Plan Strength, and Implementation Rates. J Healthc Qual. 2011;34(1):55–61.
30. Nicolini D, Waring J, Mengis J. The challenges of undertaking root cause analysis in health care: a qualitative study. J Health Serv Res Policy. 2011;16 Suppl 1(April):34–41. doi:10.1258/jhsrp.2010.010092.
31. Percarpio KB, Watts BV, Weeks WB. The effectiveness of root cause analysis: what does the literature tell us? Jt Comm J Qual Saf. 2008;34(7):391–8.
32. Wallace LM, Spurgeon P, Earll L. Evaluation of the NPSA 3 day root cause analysis training programme: Final report (Revised October 2006).; 2006.
33. Wu AW, Lipshutz AKM, Pronovost PJ. Effectiveness and efficiency of root cause analysis in medicine. JAMA. 2008;299(6):685–7. doi:10.1001/jama.299.6.685.
34. Bagian JP, Gosbee J, Lee CZ, Williams L, McKnight SD, Mannos DM. The Veterans Affairs root cause analysis system in action. Jt Comm J Qual Improv. 2002;28(10):531–545.
35. Landrigan CP, Parry GJ, Bones CB, Hackbarth AD, Goldmann DA, Sharek PJ. Temporal trends in rates of patient harm resulting from medical care. NEJM. 2010;363(22):2124–34. doi:10.1056/NEJMsa1004404.
36. HHS OIG. Adverse Events in Hospitals: Incidence Among Medicare Beneficiaries. Washington DC; 2010.
37. Unbeck M, Schildmeijer K, Henriksson P, et al. Is detection of adverse events affected by record review methodology? an evaluation of the “Harvard Medical Practice Study” method and the “Global Trigger Tool”. Patient Saf Surg. 2013;7(1):10.
38. Hoyert DL, Xu J. National Vital Statistics Reports Deaths: Preliminary Data for 2011. Natl Vital Stat Reports. 2012;61(6).
39. ISO. ISO 31000: Risk management — Principles and guidelines on implementation. Geneva; 2009.
40. Card AJ. The Active Risk Control (ARC) Toolkit. 1st ed. Davenport, FL: Evidence-Based Health Solutions, LLC; 2011:1–83.
41. Mills PD, Neily J, Luan DD, Stalhandske E, Weeks WB. Using Aggregate Root Cause Analysis to Reduce Falls and Related Injuries. Jt Comm J Qual Patient Saf. 2005;31(1):21–31.
42. Mills PD, Neily J, Kinney LM, Bagian J, Weeks WB. Effective interventions and implementation strategies to reduce adverse drug events in the Veterans Affairs (VA) system. Qual Saf Health Care. 2008;17(1):37–46. doi:10.1136/qshc.2006.021816.
43. Dorst K. The core of “design thinking” and its application. Des Stud. 2011;32(6):521–532. doi:10.1016/j.destud.2011.07.006.
44. Schwartz JM, Nelson KL, Saliski M, Hunt E a, Pronovost PJ. The daily goals communication sheet: a simple and novel tool for improved communication and care. Jt Comm J Qual Patient Saf. 2008;34(10):608–13, 561. Available at: http://www.ncbi.nlm.nih.gov/pubmed/18947121.
45. Wynn D, Clarkson J. Models of Designing. In: Clarkson J, Eckert C, eds. Design Process Improvement: A Review of Current Practice. London; 2004:1–18.
46. HSE. Policy and guidance on reducing risks as low as reasonably practicable in Design. ALARP Suite Guid. 2003. Available at: http://www.hse.gov.uk/risk/theory/alarp3.htm. Accessed May 27, 2012.
47. Card AJ, Ward JR, Clarkson PJ. Generating Options for Active Risk Control (GO-ARC): Introducing a Novel Technique. J Healthc Qual. 2013;00(00):[Epub ahead of print]. doi:10.1111/jhq.12017.
48. Card AJ. Contributions to active risk control in healthcare: Steps toward a rebalanced approach to healthcare risk management. 2013.
49. Davis FD. Perceived Usefulness, Perceived Ease of Use, and User Acceptance of Information Technology. Manag Inf Syst. 1989;13(3):319–340.
50. Davis F, Bagozzi R. User acceptance of computer technology: a comparison of two theoretical models. Manage Sci. 1989;35(8):982–1003.
51. Lin T, Lee C. Determinants of Enterprise 2.0 Adoption: A Value-based Adoption Model Approach. In: Information Society (i-Society), 2010. London: IEEE; 2010:12–18.
52. Kim H-W, Chan HC, Gupta S. Value-based Adoption of Mobile Internet: An empirical investigation. Decis Support Syst. 2007;43(1):111–126. doi:10.1016/j.dss.2005.05.009.
53. Chang T, Hsiao W. Consumers’ automotive purchase decisions: The significance of vehicle-based infotainment systems. African J Bus. 2011;5(11):4152–4163.
54. Venkatesh V, Davis FD. A Theoretical Extension of the Technology Acceptance Model: Four Longitudinal Field Studies. Manage Sci. 2000;46(2):186–204. doi:10.1287/mnsc.46.2.186.11926.
55. Tavakol M, Dennick R. Making sense of Cronbach’s alpha. Int J Med Educ. 2011;2:53–55. doi:10.5116/ijme.4dfb.8dfd.
56. Schmitt N. Uses and abuses of coefficient alpha. Psychol Assess. 1996;8(4):350–353. doi:10.1037//1040-3590.8.4.350.
57. Day S, Dalto J, Fox J, Turpin M. Failure mode and effects analysis as a performance improvement tool in trauma. J Trauma Nurs. 2006;13(3):111–117.
58. Card AJ. Active Risk Control (ARC): A New Approach to Bridge the Gap Between Risk Assessment and Robust Improvement. In: American Society for Healthcare Risk Management Annual Conference.; 2012.
59. HHS OIG. Adverse Events in Hospitals: Medicare’s Response to Alleged Serious Events, OEI-01-08-00590.; :ii.
60. Nicolini D, Waring J, Mengis J. Policy and practice in the use of root cause analysis to investigate clinical adverse events: Mind the gap. Soc Sci Med. 2011;73(2):217–25. doi:10.1016/j.socscimed.2011.05.010.
61. Card AJ, Ward JR, Clarkson PJ. Getting to Zero: Evidence-based healthcare risk management is key. J Healthc Risk Manag. 2012;32(2):20–27.