ENVIRONMENTAL HEALTH CARE TOOLKIT
128
E E N N V V I I R R O O N N M M E E N N T T A A L L H H E E A A L L T T H H C C A A R R E E T T O O O O L L K K I I T T 3 3 rd D D r r a a f f t t E E d d i i t t i i o o n n , , A A p p r r i i l l 2 2 0 0 1 1 0 0 Created By: Project Funded By NIEHS Grant R25ES014308 Environmental Health and Justice for Norton Sound, AK Project 505 W. Northern Lights Blvd, Suite 205 Anchorage, AK 99503 www.akaction.org Phone: (907) 222‐7714 Fax: (907) 222‐7715 E‐mail: [email protected]
-
Upload
khangminh22 -
Category
Documents
-
view
1 -
download
0
Transcript of ENVIRONMENTAL HEALTH CARE TOOLKIT

EENNVVIIRROONNMMEENNTTAALL HHEEAALLTTHH CCAARREE TTOOOOLLKKIITT
33rrdd DDrraafftt EEddiittiioonn,, AApprriill 22001100
Created By:
Project Funded By NIEHS Grant R25ES014308 Environmental Health and Justice for Norton Sound, AK Project
505 W. Northern Lights Blvd, Suite 205 Anchorage, AK 99503 www.akaction.org
Phone: (907) 222‐7714 Fax: (907) 222‐7715
E‐mail: [email protected]

EENNVVIIRROONNMMEENNTTAALL HHEEAALLTTHH CCAARREE TTOOOOLLKKIITT
Contents: Toolkit for Community Health Aides
Foreword o About Alaska Community Action on Toxics (ACAT) o Increasing Awareness of Environmental Health and Contaminants in Alaska o Importance of Traditional Subsistence Foods o Working Together: Collaboration with Community Health Aides
Introduction o What is Environmental Health? o Precautionary Principle o Contaminants in the North/Arctic Region o Why Do We Need to Assess Environmental Exposures? o What Is the Environmental Health Care Toolkit?
Environmental Health History and Assessment o Environmental Health History and Assessment Form
Resources for More Information o Non‐Governmental Organizations (NGOs) o Governmental Agencies o Publications and Other Materials (books, websites, online databases, etc.)
Environmental Health Care Fact Sheets: Reference guide of contaminants, exposure pathways, health outcomes, and prevention/reduction of exposure
o Benzene o Bisphenol‐A o Cyanide o Environmental Tobacco Smoke (ETS) o Mercury and Gold Mining o Mold o Pesticides o Petroleum Products and Products of Incomplete Combustion o Phthalates o Polybrominated Diphenyl Ethers (PBDEs) o Polychlorinated Biphenyls (PCBs) o Solvents o Triclosan o Uranium Mining
Reference Cards on prevention of exposure for patients Map of Villages and Federal Defense Facilities in the Norton Sound, Alaska Region Protecting Our Health in Alaska, a poster for clinics and homes

EENNVVIIRROONNMMEENNTTAALL HHEEAALLTTHH CCAARREE TTOOOOLLKKIITT
Foreword With our Environmental Health Care Toolkit, we would like to honor Annie Alowa and begin with her story. Annie Alowa was a former health aide from Savoonga, Alaska on St. Lawrence Island. After the military complex was built at Northeast Cape on St. Lawrence Island in 1952, she observed that her people began suffering from unusual numbers of miscarriages, cancers, diseases, and death. She noticed changes in the land and wildlife, and began to think these conditions were associated with contaminants from the military site at Northeast Cape. Annie brought her concerns to state and federal agencies in Alaska and then worked with Alaska Community Action on Toxics to develop solutions. The enclosed DVD contains a short film, I Will Fight Until I Melt (Whanga Pillugaghlleqaqa Kenlanga Ughullemnun), which demonstrates Annie’s concerns and presents a call for others to respond to her concerns about the impact of contaminants from the abandoned military base on human health. About Alaska Community Action on Toxics (ACAT) ACAT is a statewide organization established in 1997 and dedicated to achieving environmental health and justice. Our mission is to assure justice by advocating for environmental and community health. We believe that everyone has the right to clean air, clean water, and toxic‐free food. We work to stop the production and release of harmful chemicals by industry and military sources; ensure community right‐to‐know; achieve policies based on the precautionary principle; and support the rights and sovereignty of Indigenous peoples. ACAT’s programs include: Alaska Rural Environmental Justice, Environmental Health, Policy and Social Change, Alaska Youth and Community Outreach, and Wellness and Healing. A main focus of ACAT’s work has been to address Annie Alowa’s concerns about the impact of military contaminants on the human health of St. Lawrence Island’s Yupik People. This work has led to a broadening of concern about other Alaska villages troubled by toxics. In 2005, ACAT was awarded a grant from the National Institute of Environmental Health Sciences (NIEHS) to find effective ways to limit the release and research the human health effects of contaminants in the Norton Sound region. The grant provides funding to develop an environmental health care training curriculum that addresses the prevention of harm, diagnosis and treatment of human health effects associated with environmental contaminants affecting Arctic Indigenous Peoples. Increasing Awareness of Environmental Health and Contaminants in Alaska Understanding the impact of environmental exposures on human health is a growing part of the field of public health. When considering preventable causes of disease, the primary focus is often on behavioral and lifestyle factors such as diet, smoking, alcohol use, exercise, and UV exposure. However, exposures
Annie Alowa at Northeast Cape, St. Lawrence Island

EENNVVIIRROONNMMEENNTTAALL HHEEAALLTTHH CCAARREE TTOOOOLLKKIITT
to chemical contaminants at work, home, outside, and even in utero, are now recognized as important, and reducing exposure can prevent human diseases. Toxic chemicals from many sources are showing up in Alaska lands, waters, fish, and wildlife: hundreds of abandoned military sites, worldwide industrial pollutants carried north to the Arctic by wind and ocean currents, and waste sites full of fuels, plastics, and electronics contribute to exposures harmful to human health. More than 80,000 chemicals have been developed, distributed and released into the environment over the past 50 years. ACAT believes that every Alaskan has a right to know what contaminants are present in the air, water and soil in their environment, as well as in foods. If toxics are present and known to cause health problems, we believe ways to limit and avoid unnecessary exposure to those chemicals should be taken. Knowledge about these contaminants is the first step to reduce and prevent exposure. ACAT has developed this toolkit to increase the understanding of environmental contaminants found in the North and Arctic regions that affect human health. Designed for Community Health Aides, this toolkit provides facts about contaminants that may be present in the environment, known or suspected symptoms and their human health effects. We offer this information as an additional guide to assessment of a health problem, but we recognize that making a direct link between exposure and disease is often difficult. Importance of Traditional Subsistence Foods Despite the presence of contaminants in the Arctic environment, maintaining a traditional diet and continuing to engage in the harvest of traditional foods is essential to the physical, cultural, social, and economic well being of Arctic residents. Subsistence foods are extremely health protective and nutrient rich (containing critical nutrients such as folic acid, vitamin C, vitamin D, iron and zinc), high in protein, fat (particularly omega‐3 fatty acids) and antioxidants, and low in carbohydrates. In contrast, store‐bought, processed foods may have limited nutritional value and possibly also contain harmful chemicals such as pesticides, preservatives, genetically‐modified organisms (GMOs), and other substances that may be hazardous to health. Research shows that changes in diet from traditional foods to highly processed foods may have adverse health implications, including an increase in diabetes and heart disease among people of the Arctic, as well as possible declines in mental health and well being.1 Working Together: Collaboration with Community Health Aides In the spirit of Annie Alowa, ACAT seeks to establish continuing communication with Community Health Aides about health concerns related to environmental exposures. Working together will allow us to cover more ground than we could on our own and, ultimately, make a difference. If you would like to join in this collaborative effort to restore health and justice to our people, please contact ACAT by calling (907) 222‐7714 or emailing [email protected].
1 McGrath‐Hanna NK, Greene DM, Tavernier RJ, Bult‐Ito A. 2003. Diet and mental health in the Arctic: Is diet an important risk factor for mental health in circumpolar peoples?—A review. International Journal of Circumpolar Health 62(3): 228‐41.

EENNVVIIRROONNMMEENNTTAALL HHEEAALLTTHH CCAARREE TTOOOOLLKKIITT
Introduction What is Environmental Health? The World Health Organization defines environmental health as follows: “Environmental health addresses all the physical, chemical, and biological factors external to a person, and all the related factors impacting behaviours. It encompasses the assessment and control of those environmental factors that can potentially affect health. It is targeted towards preventing disease and creating health‐supportive environments.”2 Put simply, where we live and how we live affect our daily and long‐term health and add to our physical, mental and emotional well‐being. The effects of the environment on human health have been researched and well established. In fact, the World Health Organization estimates that poor environmental quality is responsible for a quarter to a third of all preventable ill health in the world.3 In many cases, we are unaware that we are being exposed to chemicals that may affect our health. We assume that the air, water and food that we live off of are safe to us, yet a growing amount of evidence shows chemicals in the environment may add to the large increase in negative health effects such as infertility, learning disabilities, cancer, and other diseases. It is becoming more and more clear that toxic chemicals in the environment may have adverse effects on your patients’ health. Both the physical and social environments affect environmental health. The physical environment is made up of air, water and soil. Exposures that come from the physical environment include chemical, biological and physical agents. The social environment means housing, transportation, urban development, land use, industry, and agriculture. Exposures that are caused by the social environment include work‐related stress, injury and violence.4 Each of us has the right to know which contaminants in the environment may cause health problems. Chemicals used when making plastics, electronics, skin care products, cleaning agents, and building materials, and chemicals from landfills, burn boxes and waste sites, often have not been studied for their human health effects and how dangerous they are on health. Precautionary Principle Although we are learning more about the health effects resulting from exposure to toxic chemicals, it is difficult to prove that there is a direct cause between exposure to a contaminant and a disease. People may be exposed differently to contaminants and have varying sensitivities. In our daily lives, we are exposed to many different chemicals, so it is difficult to know how chemical mixtures react together in our bodies. Some health problems from exposure to chemicals do not become known until years after a person was exposed. Although scientists recognize uncertainties about the health effects of chemicals, do not assume that environmental exposures are harmless.
2 World Health Organization (WHO). n.d. Environmental health. Available: http://www.who.int/topics/environmental _health/en [Accessed 19 March, 2008]. 3 World Health Organization (WHO). 1997. Fact sheet 170. Geneva, Switzerland: WHO. 4 United States Department of Health and Human Services. 2000, November. Healthy People 2010: Understanding and Improving Health. 2nd ed. Washington, DC: U.S. Government Printing Office.

EENNVVIIRROONNMMEENNTTAALL HHEEAALLTTHH CCAARREE TTOOOOLLKKIITT
The precautionary principle guides us to protect health by preventing exposures. A group of scientists developed a statement known as the Wingspread Statement on the Precautionary Principle: “When an activity raises threats of harm to human health or the environment, precautionary measures should be taken even if some cause and effect relationships are not fully established scientifically.” People in the health care profession know the phrase “first do no harm”—this is also another way of stating the precautionary principle. The precautionary principle protects people against danger or injury. The precautionary principle means that it is “better to be safe than sorry.” Contaminants in the North/Arctic Region Many villages in the North/Arctic are concerned about exposure to environmental contaminants from landfills, burn boxes, mining, formerly used defense sites, sewage, cigarette smoke, and dust. However, exposures can also happen from contact with certain household and work‐related chemical use, as well as household products such as toys, plastics, cleaners, and electrical equipment used in most homes. Why Do We Need to Assess Environmental Exposures? Exposures to toxic chemicals in the household and environment are very common, and these exposures can cause diseases and disabilities. As a Community Health Aide, you are the first person patients come to for health care. Recognizing, diagnosing, treating, and preventing symptoms of contaminant exposure and making sure there are no other causes of illness are the most important steps in providing the best care to your patients and, most of all, improving the health care of Northern/Arctic residents. What Is the Environmental Health Care Toolkit? The materials in this toolkit will give you information on how to recognize and prevent human health problems linked to contaminants in the environment. This toolkit also includes materials you can hand out to your patients so they can learn about ways to protect their health. ACAT has developed this Environmental Health Care Toolkit specifically for Community Health Aides in the North/Arctic region. The materials in this packet include:
1) An environmental health assessment form that will help you to diagnose your patients’ exposures and understand exposures more;
2) Resources for more information; 3) Fact sheets on environmental contaminants found in the North/Arctic, and symptoms and
diseases that have been linked to these exposures; 4) Suggestions for less harmful alternatives and other ways to lower exposure; 5) Map: Villages and Federal Defense Facilities in the Norton Sound Region, Alaska; and 6) A poster with useful information for clinics and homes.
We hope that, together, we can make people more aware of contaminants and human health, benefit patient care, and help improve life in the North/Arctic Region.

EENNVVIIRROONNMMEENNTTAALL HHEEAALLTTHH CCAARREE TTOOOOLLKKIITT
Environmental Health History and Assessment Screening your patient’s environmental health history is an important part of determining a correct diagnosis because the symptoms of environmental exposures are common and may seem like symptoms of a lot of other diseases and disabilities.5,6 Below is a list of questions that will help you determine if your patient may be affected by an environmental exposure:7,8,9,10
Environmental Health History And Assessment Form
General Housing
Where do you live and spend most of your time?
Indoor Home Environment
What is the major way that you heat the home or camp where you live now?
Have you ever smoked tobacco? For how long?
Yes No Not sure
See EnvironmentalTobacco Smoke fact sheet
Does anyone in your family smoke tobacco?
Yes No Not sure
See EnvironmentalTobacco Smoke fact sheet
Do visitors smoke tobacco in your home?
Yes No Not sure
See EnvironmentalTobacco Smoke fact sheet
Do you have areas of water damage or mold in your home?
Yes No Not sure
See Mold and Mildew fact sheet
Was the home you live in now built before 1978? If so, has it been tested for lead paint? If lead paint has been identified in your home, is it flaking?
Yes No Not sure
See Lead fact sheet
5 Agency for Toxic Substances and Disease Registry. United States Department of Health and Human Services, Public Health Service. 1993 Sep 1. Obtaining an exposure history. Atlanta, Georgia. American Family Physician, 48(3):483‐91. 6 Goldman RH, Peter JM. 1981 Dec 18. The occupational and environmental health history. JAMA, 246(24):2831‐6. 7 Adapted from National Environmental Education & Training Foundation (NEETF). The Screening Environmental History. Available: http://www.neefusa.org/pdf/screening.pdf [Accessed 25 June, 2007]. 8 Adapted from NEETF. Additional Categories and Questions to Supplement The Screening Environmental History. Available: http://www.neefusa.org/pdf/PEHIhistory.pdf [Accessed 25 June, 2007]. 9 Adapted from NEETF. Taking an Environmental History. Available: http://www.neefusa.org/pdf/EnvhistoryNEETF.pdf [Accessed 25 June, 2007]. 10 Adapted from Greater Boston Physicians for Social Responsibility (GBPSR). 2001, April. Out of Harm’s Way: Preventing Toxic Threats to Child Development. Health Care Provider Fact Sheet. Cambridge, MA: GBPSR.
EENNVVIIRROONNMMEENNTTAALL HHEEAALLTTHH CCAARREE TTOOOOLLKKIITT
Environmental Health History And Assessment Form
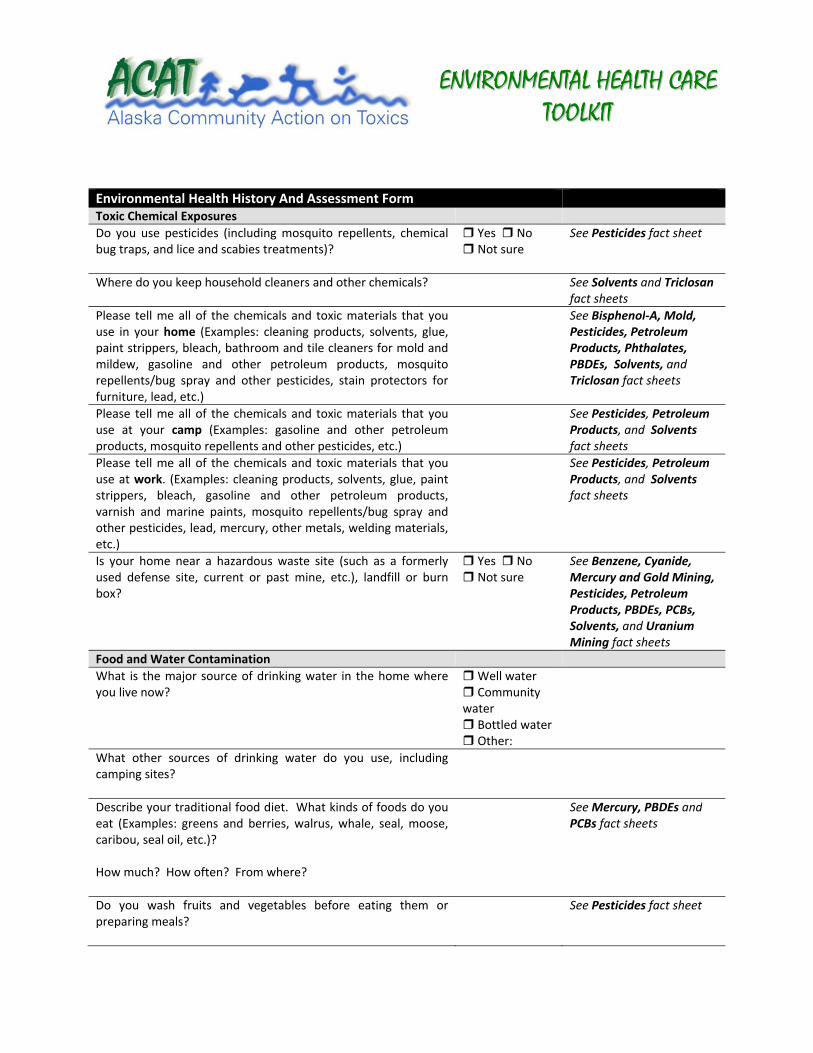
Toxic Chemical Exposures
Do you use pesticides (including mosquito repellents, chemical bug traps, and lice and scabies treatments)?
Yes No Not sure
See Pesticides fact sheet
Where do you keep household cleaners and other chemicals?
See Solvents and Triclosanfact sheets
Please tell me all of the chemicals and toxic materials that you use in your home (Examples: cleaning products, solvents, glue, paint strippers, bleach, bathroom and tile cleaners for mold and mildew, gasoline and other petroleum products, mosquito repellents/bug spray and other pesticides, stain protectors for furniture, lead, etc.)
See Bisphenol‐A, Mold, Pesticides, Petroleum Products, Phthalates, PBDEs, Solvents, and Triclosan fact sheets
Please tell me all of the chemicals and toxic materials that you use at your camp (Examples: gasoline and other petroleum products, mosquito repellents and other pesticides, etc.)
See Pesticides, Petroleum Products, and Solvents fact sheets
Please tell me all of the chemicals and toxic materials that you use at work. (Examples: cleaning products, solvents, glue, paint strippers, bleach, gasoline and other petroleum products, varnish and marine paints, mosquito repellents/bug spray and other pesticides, lead, mercury, other metals, welding materials, etc.)
See Pesticides, Petroleum Products, and Solvents fact sheets
Is your home near a hazardous waste site (such as a formerly used defense site, current or past mine, etc.), landfill or burn box?
Yes No Not sure
See Benzene, Cyanide, Mercury and Gold Mining, Pesticides, Petroleum Products, PBDEs, PCBs, Solvents, and Uranium Mining fact sheets
Food and Water Contamination
What is the major source of drinking water in the home where you live now?
Well water Community water Bottled water Other:
What other sources of drinking water do you use, including camping sites?
Describe your traditional food diet. What kinds of foods do you eat (Examples: greens and berries, walrus, whale, seal, moose, caribou, seal oil, etc.)? How much? How often? From where?
See Mercury, PBDEs andPCBs fact sheets
Do you wash fruits and vegetables before eating them or preparing meals?
See Pesticides fact sheet

EENNVVIIRROONNMMEENNTTAALL HHEEAALLTTHH CCAARREE TTOOOOLLKKIITT
Occupations and Hobbies
Where do you work?
Where do other adults in your household work?
Do any adults in your household work around toxic chemicals? (Examples: glues, solvents, polish, fuels, chemicals associated with mining and oil development, etc.)
Yes No Not sure
See Benzene, Cyanide, Mercury and Gold Mining, Pesticides, Petroleum Products, PBDEs, PCBs, Solvents, and Uranium Mining fact sheets
If so, do they shower and change clothes before returning home from work?
Yes No Not sure
Do you or any family member have arts, crafts, ceramics, or similar hobbies?
Yes No Not sure
See Solvents fact sheet
Health‐Related Questions
What symptoms do you have that might be related to an environmental exposure? When do you notice your symptoms the most? What causes the symptoms to start? What causes them to stop?
Yes No Not sure
Are family members, neighbors, and/or co‐workers having the same symptoms?
Yes No Not sure
Do you have symptoms that happen often like cough, headaches, fatigue, or unexplained pain?
Cough Headaches Fatigue Unexplained pain
Follow Up Questions
Are there environmental concerns in your village, job, child’s school, or child care setting?
Can you think of any way you might have been exposed to something harmful?


EENNVVIIRROONNMMEENNTTAALL HHEEAALLTTHH CCAARREE TTOOOOLLKKIITT
Resources for More Information Non‐Governmental Organizations (NGOs) (including Nonprofit Organizations, Grassroots Organizations, and Professional Associations)
Alaska Community Action on Toxics (ACAT) Mission/Background: Alaska Community Action on Toxics is a statewide organization established in 1997 and dedicated to achieving environmental health and justice. The organization’s mission is: to assure justice by advocating for environmental and community health. We believe that everyone has the right to clean air, clean water, and toxic‐free food. ACAT works to eliminate the production and release of harmful chemicals by industry and military sources; ensure community right‐to‐know; achieve policies based on the precautionary principle; and support the rights and sovereignty of Indigenous peoples. ACAT has four program areas: Military Toxics and Health; Northern Contaminants and Health; Pesticide Right‐to‐Know; and Water Quality Protection. Resources: The organization provides information on environmental contaminants throughout the state of Alaska. Resources include fact sheets on contaminants, detailed maps of toxic sites, conference call recordings on topics regarding health and the environment, various reports, searchable website database, and other resources upon request. Contact Information: Alaska Community Action on Toxics 505 West Northern Lights Blvd, Suite 205 Anchorage, AK 99503 Phone: 907‐222‐7714 Fax: 907‐222‐7715 Email: [email protected] www.akaction.org Alaska Native Science Commission Mission/Background: Alaska Native Science Commission (ANSC) was established in 1994 for the purpose of creating partnerships between the Native community with science and research sectors. It is a place where proposed research, ongoing and past research, and archives for research about the Native community culminate. The major goals of the commission are to integrate local and traditional knowledge into science and research, influence research priorities, incite Alaska Native involvement in the different levels of science, allow for the community to give and receive feedback on research activities, and ensure that Native people benefit economically from this professional field. Resources: The commission provides information, referral and networking services for researchers who are in need of active partners in the Native community as well as communities who are seeking researchers. This includes an online database for funded research projects within the state of Alaska, as well as newsletters, presentations, and reports made by the commission. They also provide several links to sources about the key issues their organization focuses on. Contact Information: Alaska Native Science Commission 429 L Street

EENNVVIIRROONNMMEENNTTAALL HHEEAALLTTHH CCAARREE TTOOOOLLKKIITT
Anchorage, AK 99501 Phone: 907‐258‐2672 Phone: 1‐877‐478‐2672 (Alaska only) Fax: 907‐258‐2652 Email: [email protected] www.nativescience.org www.nativeknowledge.org Association of Occupational and Environmental Clinics Mission/Background: 55 clinics across the United States and Canada that specialize in occupational and environmental health issues. Resources: Provides referrals to clinics for medical advice and care, conducts educational activities, and maintains a lending library. Contact Information: Association of Occupational and Environmental Clinics 1010 Vermont Ave, NW #513 Washington, DC 20005 Phone: 888‐347‐2632 Email: [email protected] www.aoec.org Breast Cancer Fund Mission/Background: The Breast Cancer Fund was founded in 1992 to advocate for and bring attention to the need for eliminating the preventable environmental causes of cancer. This foundation provides public education, advocates for policy change, holds outdoor challenges, and creates other innovative campaigns in order to reach out to the public and ensure that change is made to prevent the proliferation of breast cancer. Resources: The site provides information about their funds, events, linkages between the environment and cancer, information about breast cancer, and information about environmental health. They create reports, fact sheets, and other materials to educate the public about the linkage between breast cancer and the surrounding environment as well as how to reduce exposures to carcinogenic chemicals. They also follow closely with recent press coverage about the environmental causes of breast cancer. Contact Information: Breast Cancer Fund ‐ San Francisco (Main Office): 1388 Sutter Street, Suite 400 San Francisco, CA 94109‐5400 Phone: 415‐346‐8223 or toll‐free 866‐760‐8223 Fax: 415‐346‐2975 Email: [email protected] www.breastcancerfund.org

EENNVVIIRROONNMMEENNTTAALL HHEEAALLTTHH CCAARREE TTOOOOLLKKIITT
Breast Cancer Fund ‐ Seattle (For Washington/Northwest Inquiries): P.O. Box 15145 Seattle, WA 98115 Phone: 206‐524‐4405 Email: [email protected] Canadian Association of Physicians for the Environment (CAPE) Mission/Background: CAPE is a group of physicians, allied health care practitioners and citizens committed to a healthy and sustainable environment. CAPE aims to educate physicians on environmental issues and provide them with accurate information and a framework for thinking about environmental problems. Resources: Online resources include links related to health and the environment, documents published by CAPE (articles, briefing papers, brochures, fact sheets, media releases, presentations, statements, and summaries), CAPE newsletters, an archive of letters and articles from CAPE, and information on how to join the mailing list. Contact Information: The Canadian Association of Physicians for the Environment 130 Spadina Avenue, Suite 301 Toronto, Ontario Canada M5V 2L4 Phone: 416‐306‐2273 Fax: 416‐960‐9392 Email: [email protected] www.cape.ca/ Collaborative on Health and the Environment (CHE) Mission/Background: The Collaborative on Health and the Environment is a national non‐partisan partnership of individuals and organizations concerned with the role of the environment in human and ecosystem health. CHE seeks to raise the level of scientific and public dialogue about the role of environmental contaminants and other environmental factors in many of the common diseases, disorders, and conditions of our time. Resources: Monthly conference calls on environmental health issues, a searchable database (CHE Toxicant and Disease Database) that summarizes links between chemical contaminants and approximately 180 human diseases or conditions. Contact Information: The Collaborative on Health and the Environment c/o Commonweal PO Box 316 Bolinas, CA 94924 Email: [email protected] www.healthandenvironment.org Collaborative on Health and the Environment – Alaska (CHE‐AK) Mission/Background: The Collaborative on Health and the Environment – Alaska (CHE‐AK) formed as a regional group in December 2005 following the Alaska Conference on Health and the Environment. CHE‐AK invites

EENNVVIIRROONNMMEENNTTAALL HHEEAALLTTHH CCAARREE TTOOOOLLKKIITT
participation from health care professionals, researchers, health‐affected and patient groups, students, educators, advocacy organizations, and any individual concerned about protecting the health of current and future generations from environmental harm. Resources: Monthly conference calls on environmental health issues in Alaska Contact Information: Alaska Community Action on Toxics 505 West Northern Lights Blvd, Suite 205 Anchorage, Alaska 99503 Phone: 907‐222‐7714 Fax: 907‐222‐7715 Email: [email protected] http://akaction.org/che.htm Environmental Working Group Mission/Background: Environmental Working Group (EWG) is a non‐profit organization that was founded in 1993 by Ken Cook and Richard Wiles. The group seeks to protect public health and the environment by using public information to advocate for policies that shift subsidies and ensure that public health is protected. In 2002, the Environmental Working Group Action Fund was founded in order to advocate on Capitol Hill for these policy changes. Its major goals include seeking the protection for the most vulnerable members of the human population (children, infants, and unborn babies) from being exposed to toxic chemicals, as well as to enact policies that invest in conservation and sustainable development. Resources: The organization conducts its own research to build the knowledge of consumers as well as to strengthen their push toward national policy changes. The major categories of study include health, information on toxics, issues dealing with farming, and natural resources. Their press releases and news articles are also available online. Contact Information: Environmental Working Group, Headquarters 1436 U St. N.W., Suite 100 Washington, DC 20009 Phone: 202‐667‐6982 www.ewg.org Environmental Working Group, California Office 1904 Franklin St. Suite 703 Oakland, CA 94612 Phone: 510‐444‐0973 Greater Boston Physicians for Social Responsibility (GBPSR) Mission/Background: GBPSR is an affiliate of Physicians for Social Responsibility (PSR), a national organization of over 26,000 physicians, health care professionals and supporters. PSR was established in 1961 to address health consequences of weapons of mass destruction. Since then, its mission has been expanded to include health consequences of environmental pollution and degradation, and also the reduction of violence and its causes.

EENNVVIIRROONNMMEENNTTAALL HHEEAALLTTHH CCAARREE TTOOOOLLKKIITT
GBPSR has over 1000 members in Eastern Massachusetts who individually and collectively work on various issues relating to health, including quality and access to health care, environmental pollution, militarism and war, community and personal violence, and social justice and human rights. Resources: GBPSR offers online resources on the following projects: Generations at Risk, which addresses the association between reproductive health disorders and toxic chemicals; In Harm’s Way, which focuses on developmental disabilities and toxic chemicals; and the Pediatric Environmental Health Toolkit for health care providers on preventing exposures to toxic chemicals. Contact Information: Greater Boston Physicians for Social Responsibility 727 Massachusetts Avenue ‐ 2nd Floor Cambridge, MA 02139 Phone: 617‐497‐7440 Fax: 617‐876‐4277 E‐Mail: [email protected] http://www.psr.org/chapters/boston/ Natural Resources Defense Council Mission/Background: The Natural Resources Defense Council (NRDC) was founded in 1970 by law students and attorneys who were inspired by the environmental movement. It is an environmental action organization that uses law, science, and member support to advocate for the protection of wildlife, wild places, and safety for the environment and those that live in it. They work to restore the integrity of air, land, and water as well as to ensure that every human has the right to voice their opinions on decisions being made about the environment. Resources: This organization provides press releases, reports, papers, fact sheets, and information about legislation on some of the most pressing and recent environmental issues in the world. They also provide online newsletters and links to other environmental news outlets from across the nation and around the world. NRDC also has a collection of multimedia presentations produced by or for the organization. Contact Information: Natural Resources Defense Council, Headquarters 40 West 20th Street New York, NY 10011 Telephone: 212‐727‐2700 Fax: 212‐727‐1773 www.nrdc.org Washington Toxics Coalition Mission/Background: Washington Toxics Coalition (WTC) was founded in 1981 and seeks to protect public health and the environment by attending to a major root of the problem – toxic pollution. The organization promotes the use of alternatives, supports policy change, works to empower communities, and educates people about ways they can create a healthy environment for themselves. Resources: WTC provides access to recent press releases and press clips about toxics and provides ways for the public to educate themselves about buying safer consumer products, creating healthy homes and garden

EENNVVIIRROONNMMEENNTTAALL HHEEAALLTTHH CCAARREE TTOOOOLLKKIITT
environments, and promoting sustainable agriculture. They also provide fact sheets about healthy alternatives, their campaigns, and other general information as well as pesticide action kits. Contact Information: Washington Toxics Coalition 4649 Sunnyside Avenue N, Suite 540 Seattle, WA 98103 Phone: 206‐632‐1545 Email: [email protected] www.watoxics.org
Governmental Agencies
Agency for Toxic Substances and Disease Registry (ATSDR) Mission/Background: ATSDR is a federal public health agency of the U.S. Department of Health and Human Services based in Atlanta, Georgia. ATSDR uses science, takes responsive public health actions, and provides health information to prevent harmful exposures and diseases related to toxic substances. Resources: ATSDR provides information on toxic substances including ToxFAQs, a series of quick and easy to understand summaries on over 100 toxic substances. They also provide full toxicological profiles on over 250 substances. Contact Information: Agency for Toxic Substances and Disease Registry 1825 Century Blvd Atlanta, GA 30345 Phone: 800‐232‐4636 E‐mail: [email protected] www.atsdr.cdc.gov Alaska Department of Environmental Health Mission/Background: The Division of Environmental Health (EH) faces issues concerning safe drinking water, food, and sanitation practices. They delineate standards for business to adhere to in order to promote environmental protection and ensure that food and drinking water is safe for all Alaskans. Resources: The EH gives the public access to current environmental conservation regulations and any changes that occur to those regulations. It also lists public notices, statutes, press releases, and links to other divisions of the Alaska Department of Environmental Conservation. Contact Information: Alaska Department of Environmental Health Phone: 907‐269‐7644 Food Safety & Sanitation, Toll Free In‐State Phone: 1‐87‐SAFE‐FOOD Pesticide Control, Toll Free In‐State Phone: 800‐478‐2577 www.dec.state.ak.us/eh

EENNVVIIRROONNMMEENNTTAALL HHEEAALLTTHH CCAARREE TTOOOOLLKKIITT
Alaska Department of Environmental Conservation Mission/Background: The Alaska Department of Environmental Conservation (DEC) seeks to conserve, improve, and protect the natural resources and environment of the state of Alaska. Resources: The Alaska DEC gives public access to databases that span the whole department as well as its individual divisions. Public notices are also posted on their website along with DEC press releases, public service announcements, environmental headlines about Alaska, department regulations and state statutes pertaining to the department’s responsibilities. Contact Information: Alaska Department of Environmental Conservation www.dec.state.ak.us Centers for Disease Control and Prevention (CDC) Mission/Background: The CDC was founded in 1946 and has since been a leader in providing public health information. It works to prevent and control environmental health threats, infectious diseases, injuries, workplace hazards, and disabilities. It is recognized worldwide for conducting its own research and applying its findings to improve the daily lives of people around the world. It works through partnerships in order to maintain a health surveillance system which prevents disease outbreaks, enacts disease prevention strategies, and keep national health statistics up to date. Its four overarching health protection goals to become a better performance‐based agency include focusing its efforts on healthy people, places, preparedness, and global health. Resources: CDC conducts its own research, and the latest CDC news can be read on its website along with a list of major CDC event resources, press releases, and CDC publications. In addition to the research provided by the organization, the website has a list of tools and resources that are useful for the general public, educators, parents, and healthcare professionals. Contact Information: Centers for Disease Control and Prevention 1600 Clifton Rd Atlanta, GA 30333 Phone: 800‐311‐3435 www.cdc.gov National Institute of Environmental Health Sciences (NIEHS) Mission/Background: “The mission of the NIEHS is to reduce the burden of human illness and disability by understanding how the environment influences the development and progression of human disease. To have the greatest impact on preventing disease and improving human health, the NIEHS focuses on basic science, disease‐oriented research, global environmental health, and multidisciplinary training for researchers.” Resources: The NIEHS website provides numerous public reports on results of its research on health conditions related to or affected by environmental exposures, successful public health interventions and policies, environmental health care materials for health care providers, and other resources. Contact Information: National Institute of Environmental Health Sciences

EENNVVIIRROONNMMEENNTTAALL HHEEAALLTTHH CCAARREE TTOOOOLLKKIITT
P.O. Box 12233, MD NH‐10 Research Triangle Park, NC 27709‐2233 Phone: 919‐541‐0073 Fax: 919‐541‐4395 www.niehs.nih.gov Physicians for Social Responsibility (PSR) Mission/Background: PSR is a public policy organization with over 30,000 members representing the medical and public health professions and concerned citizens, working together for nuclear disarmament, a healthful environment, and an end to gun violence. Resources: Website provides helpful fact sheets, articles and reports dealing with environment and health. Contact Information: 1875 Connecticut Avenue, NW, Suite 1012 Washington, DC, 20009 Phone: 202‐667‐4260 Fax: 202‐667‐4201 Email: [email protected] www.psr.org
Publications and Other Materials (books, websites, online databases, etc.)
Environmental Health Perspectives (EHP) Resource: Published by the National Institute of Environmental Health Sciences (NIEHS), Environmental Health Perspectives is a monthly journal of peer‐reviewed research and news on the impact of the environment on human health. Articles are available online free of charge. Contact Information: Environmental Health Perspectives c/o Brogan & Partners 4011 Westchase Blvd, Suite 150 Raleigh, NC 27607 Phone: 866‐541‐3841 Fax: 919‐828‐5935 E‐mail: [email protected] www.ehponline.org In Harm’s Way: Toxic Threats to Child Development Resource: The In Harm’s Way report investigates how toxic chemicals contribute to neurological, learning, and behavioral disabilities in children. Toxic exposures are a preventable cause of harm the work along with the complex interactions of genetic, environmental, and social factors that have an influence on child development. Publishing Information: Author: Greater Boston Physicians for Social Responsibility (GBPSR)

EENNVVIIRROONNMMEENNTTAALL HHEEAALLTTHH CCAARREE TTOOOOLLKKIITT
Date: April 2001
Publisher: Greater Boston Physicians for Social Responsibility (GBPSR) Available to download at http://www.psr.org/chapters/boston/resources/in‐harms‐way.html
Is It In Us? Chemical Contamination in Our Bodies Resource: The Is It In Us? project conducted biomonitoring on 35 Americans across the nation, including Alaska, to investigate the levels of contamination in our bodies. This project investigated whether toxic pollution found in consumer products is also found in people. Contact Information: Email: [email protected] www.isitinus.org Nontoxic, Natural and Earthwise Resource: A book written by an internationally recognized consumer advocate who identifies safe and environmentally responsible products. Publishing Information: Author: Debra Lynn Dadd Date: September 1990 Publisher: G.P.Putnam’s Sons ISBN‐10: 0‐87477‐584‐1 www.putnam.com/putnam Our Stolen Future Mission/Background: A groundbreaking book and now also a website, which report scientific discoveries about endocrine disruption, bringing awareness of how common contaminants may interfere with the natural signals controlling development of the fetus. Resources: Website tracks recent developments relevant to contaminants and their effects on the endocrine system. Publishing Information: Title: Our Stolen Future: Are We Threatening Our Fertility, Intelligence, and Survival? Authors: Theo Colborn, Dianne Dumanoski and John Peter Meyers Date: March 1, 1997 Publisher: Plume ISBN‐10: 0452274141 ISBN‐13: 978‐0452274143 www.ourstolenfuture.org/aboutOSF.htm Contact Information: Email: [email protected] www.ourstolenfuture.org
EENNVVIIRROONNMMEENNTTAALL HHEEAALLTTHH CCAARREE TTOOOOLLKKIITT
Pediatric Environmental Health, 2nd Edition Resource: This handbook is an invaluable tool to help health care providers identify, treat and prevent pediatric environmental health hazards. Publishing Information: Editor Ruth A. Etzel, MD and Associate Editor Sophie J. Balk, MD Date: 2003 Publisher: American Academy of Pediatrics ISBN‐10: 1581101112 ISBN‐13: 978‐1581101119 www.aap.org/bst/showdetl.cfm?&DID=15&Product_ID=1697 Skin Deep: Cosmetic Safety Database Resource: This database on cosmetic safety is provided by the Environmental Working Group. It matches ingredients in more than 25,000 commercially available cosmetic and personal care products with 50 toxicity and regulatory databases, since the FDA does not require companies to test these products for safety. The database is searchable by product, brand, or ingredient of concern, and lists information about toxicity and health effects. Contact Information: www.cosmeticsdatabase.com Toxics A to Z: A Guide to Everyday Pollution Hazards Resource: A book written in two parts; part I has a vast amount of information on general issues concerning the hazards of toxics, and part II contains specific information about individual toxics. Publishing Information: Authors: John Harte, Cheryl Hodren, Richard Schneider, and Christine Shirley Date: September 9, 1991 Publisher: University of California Press ISBN‐10: 0‐520‐07224‐5

322 International Journal of Circumpolar Health 64:4 2005
ORIGINAL RESEARCH
POLYCHLORINATED BIPHENYLS IN SERUM OF THE SIBERIAN YUPIK PEOPLE FROM ST. LAWRENCE ISLAND, ALASKA
David O. Carpenter 1, Anthony P. DeCaprio 1, David O’Hehir 1, Farooq Akhtar 2, Glenn Johnson 1,3, Ronald J. Scrudato 1, Lucy Apatiki 4, Jane Kava 5, Jesse Gologergen 5, Pamela K. Miller 6, Lorraine Eckstein 6
1 Institute for Health and the Environment, University at Albany, Rensselaer, New York, USA2 Department of Biometry and Statistics, School of Public Health, University at Albany, Rensselaer, New York, USA3 University of Utah, Energy and Geoscience Institute, Dept. Civil and Environmental, Engineering,
University of Utah, Salt Lake City Utah, USA4 Native Village of Gambell, St. Lawrence Island, Alaska, USA5 Native Village of Savoonga, St. Lawrence Island, Alaska, USA6 Alaska Community Action on Toxics, Anchorage, Alaska USA
Received 28 January 2005, Accepted 17 June 2005
ABSTRACT
Objectives. To determine serum levels of polychlorinated biphenyls (PCBs) in Siberian Yupik
adults from St. Lawrence Island, Alaska, and to determine the relative contribution of atmo-
spheric transport of PCBs and local contamination to body burdens.
Study Design. Siberian Yupiks of various ages were recruited from three populations: residents of
the village of Gambell, residents of the village of Savoonga who did not have family hunting camps
near the Northeast Cape (NEC), a Formerly Used Defense Site (FUDS) known to be contaminated
with PCBs, and residents of Savoonga whose families had a hunting camp at the NEC.
Methods. Levels of PCBs were measured in serum samples from 130 people, ages 19-76. These
Alaska Natives follow a traditional diet high in marine mammals and fish, which bioconcentrate
organochlorine compounds that migrate to the Arctic via global air transport and ocean currents.
Results. The lipid-adjusted serum PCB levels of those members of families with hunting camps
at the NEC had a mean lipid-adjusted PCB concentration of 1,143 ppb, whereas other residents of
Savoonga had values of 847 ppb and residents of Gambell had values of 785 ppb.
Conclusions. Our observations suggest that atmospheric transport of PCBs contributes to levels
in the Yupik people, but that the abandoned military site at the NEC may also contribute to the
human body burden in those individuals who have either spent substantial time or consumed food
from there.
(Int J Circumpolar Health 2005; 64(4):322-335.)
Keywords: Alaska, Eskimos, FUDS, atmospheric transport

323International Journal of Circumpolar Health 64:4 2005
ORIGINAL RESEARCH
Abbreviations: AMAP - Arctic Monitoring and Assessment Programme NEC - Northeast Cape PCBs - Polychlorinated Biphenyls FUDS - Formerly Used Defense SiteUSACOE - United States Army Corps of EngineersQA/QC – Quality Assurance/Quality ControlANOVA – Analysis of VarianceSEM – Standard Error of the MeanATSDR – Agency for Toxic Substances Disease RegistryANCOVA – Analysis of Co-VarianceVIF – Variance Inflation Factorppb – Parts Per Billionppt – Parts Per Trillion
INTRODUCTION
Levels of PCBs are declining in most of the
developed world since the manufacture and
use of these substances has been curtailed (1,
2). This is also true for at least some Northern
dwelling communities (3). However, the polar
regions are reservoirs for atmospheric trans-
port of persistent toxic substances, which are
carried by air currents and then condense out of
the vapor phase in the cold of the polar regions
and are deposited in snow (4). This fact, plus
the high fat diet of many indigenous communi-
ties in the Arctic, raises concern that the intake
of organochlorine compounds, which include
PCBs, dioxins/furans and persistent organo-
chlorine pesticides, may pose serious health
risks to these populations (5, 6). The variety
of diseases known to be associated with expo-
sure to PCBs include cancer, immune suppres-
sion, neurobehavioral decrements, endocrine
disruption of sex steroid and thyroid function,
cardiovascular disease and diabetes (1, 7).
St. Lawrence Island, Alaska, is an island
104 miles long and averaging 20-30 miles
across. It is located 38 miles off the Russian
coast, about 150 miles below the Arctic Circle
and about 130 miles west of Nome, Alaska.
The population of St. Lawrence Island consists
of about 1,400 Siberian Yupiks, living in two
villages, Gambell and Savoonga. The Siberian
Yupik people follow a traditional life-style,
which includes significant consumption of
marine mammals and fish, bird eggs, as well
as local greens and berries. Storage of meats is
primarily either by drying in the brief summer,
freezing or fermenting in pits in the ground.
The villages have electricity and most homes
have indoor plumbing.
Two US military bases were constructed
on St. Lawrence Island because of its stra-
tegic location. The military established a base
at Gambell during World War II, and the Air
Force and Army came in the early 1950s and
operated there until the early 1980’s. Little is
known about activities at Gambell, since data
regarding activities there is still classified.
Gambell is built on coarse gravel, and fuels,
oils and other hydrocarbons that spilled have
settled in a layer above the permafrost, some
8-10 feet below the surface. There is no docu-
mented history of the use of PCBs at Gambell,
although some use is likely in generators,
transformers and paint.
The other military base was located at
the opposite end of the island, at the North-
east Cape (NEC) during the Cold War. While
there is no permanent settlement at the NEC,
the region has a number of hunting and fishing
camps where members of some Savoonga
families spend several months in the spring
and early summer to hunt seal, walrus and
whale, as well as to catch fish from the local
rivers and streams and near shore areas and
collect greens. When the military base at the

324 International Journal of Circumpolar Health 64:4 2005
ORIGINAL RESEARCH
NEC was closed in 1972, most of the supplies
and materials present at the site, including
buildings, heavy equipment and generating
facilities, as well as fuel containers, were
abandoned, or buried on-site.
In addition to abandoned buildings, radar
stations and air strips, the military left a
range of contaminants, including fuels, PCBs
and various trace metals, which had a severe
impact on the local environment. The military
complex established at the NEC is located
along the Bering Sea. The soils are typical
of tundra-covered areas, with numerous
wetlands, ephemeral ponds and small streams
draining from the granitic mountains. There
was a documented diesel fuel spill of 160,000
gallons in the late 1960s that killed fish and
other animals in the Suqitughneq (Suqi)
River. The area around the power generating
station and the soils and plants down-gradient
of the main complex are highly contaminated
with PCBs and volatile organics, as deter-
mined as a part of the ongoing remediation
of the site under the direction of the United
States Army Corps of Engineers (USACOE)
and their contractors. While a multi-million
dollar remediation of the NEC is currently
being conducted by the USACOE, significant
contamination remains (8).
The perception in the Yupik community is
that, in recent years, there has been a signifi-
cant increase in the levels of various diseases,
especially cancer and diabetes, and that this
has occurred particularly among those indi-
viduals who have spent significant time at the
NEC. The concern in the community is that
these increases in disease have resulted from
environmental contamination originating from
the former military sites. One woman, Annie
Alowa, whose family had a camp at the NEC
and who was dying of cancer, established contact
with the Alaska Community Action on Toxics,
an advocacy organization based in Anchorage.
This contact ultimately resulted in an NIEHS
Environmental Justice grant for St. Lawrence
Island, which has supported this project.
The residents of St. Lawrence Island have
at least two possible sources of exposure to
environmental contaminants. Certainly, the
abandoned military sites comprise one of
these. Although relatively localized, they are
in areas of human activity and food collection.
In addition, many organochlorines, including
PCBs, dioxins/furans and persistent pesti-
cides, travel to and concentrate in the polar
regions by vapor phase transport followed
by precipitation in the cold climate (global
distillation), or by ocean currents (9). These
lipophilic compounds then bioconcentrate in
the food chain and are ultimately consumed
by humans. Native Yupik people, whose diet
includes the significant consumption of marine
mammal fats, are susceptible to major expo-
sure via this route. In addition, the consump-
tion of polar bear is not uncommon among
the Yupik people and, since seal blubber is
a major food for the polar bear, PCB levels
in polar bear meat, fat and organs are much
higher than in the marine mammals.
At the request of the community, we initi-
ated a study of serum levels of PCBs in 2001.
We analyzed blood from residents of Gambell,
residents of Savoonga who did not have family
camps at the NEC, and residents of Savoonga
who did have such camps. The hypothesis to
be tested was that the results would allow us
to distinguish contributions to the PCB body
burden of global transport of these compounds
from those arising from proximity to the mili-
tary sites.

325International Journal of Circumpolar Health 64:4 2005
ORIGINAL RESEARCH
MATERIAL AND METHODS
Recruitment of the study populationThe study population consisted of 40 residents
of Gambell, 44 residents of Savoonga who
had spent little or no time at the NEC, and
46 residents of Savoonga whose families had
camps at the NEC and spent time there. Figure
1 shows a map of the island, and the rela-
tive distances between these sites. For those
with family camps at the NEC, the duration
of time spent there varied significantly, and
not all family members went there every year.
However, those who went frequently spent
several months at the camp, and returned with
food harvested from the vicinity of the NEC.
Food in this culture is traditionally shared
with the larger family members.
Subjects ages were between 19-75 years,
with approximately equal numbers of men and
women. Subjects were not randomly selected,
but individuals were recruited by Yupik staff
from willing participants balanced for age
and gender. This should not have resulted in
significant bias, given that diets and behaviors
are very uniform in this population. There
were no exclusion criteria. After signing an
informed consent, subjects filled out a brief
questionnaire (those who did not speak
English were interviewed) documenting resi-
dential history, occupational history and time
spent at the NEC. Subjects also provided an
8-hr fasting blood sample (two 10-ml speci-
mens, collected in glass specimen tubes).
Blood samples were obtained during August
2001, and between August and October in
2003. A few individuals who showed tran-
sient PCB congeners in their bloods in 2001
were asked to provide a second sample for
analysis in 2003. All results were reported
to the person who gave the blood by written
communication, and most subjects also had
private meetings with Dr. Carpenter during
the summer of 2004 to discuss their personal
blood results. The study was reviewed and
approved by the Institution Review Board
of the University at Albany. Detailed dietary
information is currently being collected
through other funding, but is not available at
present.
Serum PCBs were determined as previ-
ously described (10). In brief, serum was
Figure 1. Maps of St. Lawrence Island and vicinity, showing the location of the villages of Gambell and Savoonga and the FUDS site at NEC.

326 International Journal of Circumpolar Health 64:4 2005
ORIGINAL RESEARCH
separated from clotted cells and extracted
three times with diethylether/hexane. Polar
lipids and other interferents were removed
by adsorption onto Florisil, and 83 individual
PCB congeners and 18 congeners co-eluting as
pairs or triplets were identified and quantitated
by simultaneous parallel dual-column gas
chromatography with electron capture detec-
tion. Calibration was performed using a 1:1:1:1
mixture of Aroclors 1221, 1016, 1254 and
1260 (AccuStandard, Inc.), with internal stan-
dard-based quantitation. Values for individual
congeners that were below the method detec-
tion limit (MDL) were given a value of zero.
Total serum lipid concentration was deter-
mined by drying and weighing the residual of
a hexane extract. A rigorous QA/QC program
was applied as previously described (10).
Statistical proceduresTwo-way ANOVA and Multiple Regression
were used to analyze the data. For the regres-
sion model, the error terms were assumed to
be independent, normal random variables with
a mean of zero and with constant variance
(Homogeneity of Variance). If the model is
appropriate for the data at hand, the observed
residuals should then reflect the properties
assumed for error terms. The appropriateness
of linear function for the data was analyzed
from residual plots against the predictor
variable (age). The residuals fell within a
horizontal band around zero, displaying no
systematic tendencies to be positive or nega-
tive. This indicates that there is no pattern of
the residuals when plotted against the fitted
values. Whether a linear function is appro-
priate for the data being analyzed can be
studied from a residual plot against the fitted
values to test the linear regression assump-
tion that the variance of the error terms is
constant. If the error variance increases with
the predictor, this will give a megaphone-
type plot. In our case, the error variance was
constant, and we did not find any megaphone-
type structure when we plotted the residuals
against the fitted values.
RESULTS
The serum PCB levels of the 130 Yupik adults
of St. Lawrence Island, aged from 19 to 75
years, ranged from 0.6 to 17.8 ng/g (ppb) wet
weight, with a mean concentration of 4.6 ppb.
After lipid adjustment, the mean value was
933 ppb. Table I shows the mean level of total
PCBs (wet weight and lipid-adjusted) in serum
from female and male residents of Gambell,
residents of Savoonga that have family
hunting camps near the NEC, and residents of
Savoonga who rarely, if ever, go to the NEC.
The lowest PCB levels were found in residents
of Gambell, where the mean lipid-adjusted
PCB level was 785 ppb. In contrast, residents
of Savoonga had a mean lipid-adjusted serum
PCB concentration of 847 ppb, while resi-
dents of Savoonga who had spent time at the
NEC had the highest total serum PCB level of
1,143 ppb. In the two-way ANOVA, there is a
marginally statistically significant difference
between Gambell and NEC in serum PCB
values (p < 0.06, SEM = 1.26), but the NEC
levels were not significantly different from
those in Savoonga (p < 0.16). In all groups,
the mean levels were higher for males than
females. This result was statistically signifi-
cant (p < 0.0014, SEM = 2.25).
Figure 2 shows serum PCB level (wet
weight) plotted against age for each of the

327International Journal of Circumpolar Health 64:4 2005
ORIGINAL RESEARCH
three Yupik subgroups. Serum levels of PCBs
were generally positively correlated with
age, while there is obvious variability. This
is consistent with previous observations indi-
cating that levels generally increase with age
(1), but also may reflect a greater exposure to
these very persistent compounds in past years.
We have modeled this data by transforming it
to a log-normal distribution. When modeled
in a multiple regression analysis, we find that,
for each one year increase in age, there is a
predicted increase in serum PCB levels of
0.47 ppt wet weight after adjusting for all other
variables (residence site and sex).
Table I. Serum PCB levels (wet weight and lipid-adjusted in ppb) for female and male residents of Gambell, NE Cape and Savoonga. Gambell NE Cape Savoonga Female Male All Female Male All Female Male Alln 22 18 40 19 27 46 25 19 44Age (mean) 39 47 43 44 46 45 40 42 41
Wet Weight Total PCBMean 2.642 5.726 4.030 4.758 5.826 5.385 3.745 4.748 4.178Min 0.619 1.572 0.619 1.176 1.044 1.044 0.899 0.636 0.636Max 7.651 11.053 11.053 13.552 17.794 17.794 9.788 14.388 14.388Median 2.119 5.841 2.844 3.586 5.485 4.457 2.888 3.617 3.523
Lipid-Adjusted Total PCB Mean 628 977 785 859 1343 1143 794 918 847Min 124 291 124 295 218 218 166 138 138Max 2816 2632 2816 2222 4963 4963 1882 1845 1882Median 370 972 706 814 1088 878 760 822 773
Figure 2. Serum PCB (wet weight) as a function of age for residents of Gambell, Savoonga and those with family camps at the NEC. The data from each individual in the study is plotted, as well as the linear regression best fit for each of the three populations. For Gambell the R2 = 0.4696, for NEC R2 = 0.4713 and for Savoonga R2 = 0.5134.

328 International Journal of Circumpolar Health 64:4 2005
ORIGINAL RESEARCH
Analysis of covariance (ANCOVA) was
carried out by adding the term ”age” to the
model. The Pearson correlation between age
and serum PCB levels for females was 0.56
(p < 0.0001), while for males it was 0.63 (p
< 0.0001). For running ANCOVA we tested
the assumption that there should be no inter-
action between the continuous variable “age”
at different locations, and we found no signifi-
cant interaction, consistent with the selection
of age ranges to be nearly the same at the
three sites.
By use of the main effects model, using
age as a continuous variable and location and
sex as categorical variables, we found that the
overall F statistic for the model is significant
(p < 0.0001) and the adjusted R2 is 59% for the
full model. The means of serum PCB levels in
Gambell is marginally significantly different
from those at the NEC [p < 0.06 (CL = .025,
0.16)] with a Variance Inflation Factor (VIF)
of 1.3, indicating no multicolinearity between
predictors after adjusting for all other varia-
bles in the model. As in the two-way ANOVA,
there was not a significant difference between
the means from Savoonga and those from
the NEC. Serum PCBs from males were
significantly greater than those from females
[p < 0.0028 (CL = -0.43, -0.01), VIF = 1.31].
As above, age, as a continuous variable, was
significantly related to mean PCB levels
[p < 0.0001 (CL = 1.21, 1.71), VIF = 1.03].
In the model with two-way interaction
terms, the overall F is 20.10, with a p value of
0.0001 and an R2 of 61%. The model explains
about 61% of the variation in the data. The
other measure of the fit of the model is residual
analysis, where assumptions of homogeneity
of variance of error terms was not violated.
Age was found to be statistically significant
[β = 1.53, p < 0.0001, degree of freedom = 1,
SEM = 0.24, (CI = 1.06, 2.10), VIF = 4].
Table II lists each of the 101 PCB conge-
ners that were measured, the MDL for
each congener, as well as the average lipid-
adjusted level and the number of individuals
with levels above the MDL. The table also
provides this information among persons in
the age ranges 18-34, 35-50 and 51-75 years.
Figure 3a shows the median pattern of the
major PCB congeners detected in the Yupik
samples. The higher chlorinated, persistent
PCB congeners 153, 138(+163+164), 118,
170, and 180 dominate. Most of the congeners
detected are relatively persistent, although the
more labile PCBs 52, 95, 101(+90), and 110
are also present, consistent with recent and/
or ongoing exposure. Figure 3(b) shows PCB
patterns from three individual Yupik subjects,
each of whom has a similar overall pattern,
but with a greater contribution from lower
chlorinated congeners. Since, in general, the
lower chlorinated congeners are more tran-
sient, this is evidence of recent exposure.
Another striking anomaly (not shown in this
Figure, but seen in Figure 4) was the detec-
tion of PCB 22 (2,3,4’-triCB) from the NEC at
concentrations ranging from 86 to 375 ppt in
eight individuals. Four of these subjects had
serum levels of this congener >300 ppt, while
it was not detected in any of the subjects from
the other two locations. This labile congener
is not often noted in human samples, but has
been previously reported in environmental
media, such as soil and air at a PCB contami-
nated landfill (11, 12). The presence of this
congener in serum is also consistent with
recent PCB exposure.
Figure 4 shows results obtained from a
single individual (a 35-year-old male from

329International Journal of Circumpolar Health 64:4 2005
ORIGINAL RESEARCH
Table II. Presence of individual congeners (levels greater than the MDL) in Yupik bloods [lipid-adjusted, ng/g (ppb)] in the full population and in three age groups. Values for hexachlorobenzene (HCB), DDE and mirex are also presented. All age groups Age 18-34 Age 35-50 Age 51-75Structure IUPAC# MDL Average n Average n Average n Average n
TOTAL PCB 1031 130 496 37 912 57 1704 362 1 16.5 0 0 0 04 3 8.2 0 0 0 02/2+3 4+2 6.3 0 0 0 02/6 10 0.4 0 0 0 024 7 0.6 0 0 0 025 9 0.2 0 0 0 02/3 6 1.1 0 0 0 02/4 8 2.5 6.7 7 0 4.0 3 8.7 4HCB 0.8 102 130 65 37 93 57 155 3626/2 19 3.3 0 0 0 03/4 13 1.1 0 0 0 025/2 18 1.3 0 0 0 04/4 15 0.4 0 0 0 024/2 17 4.2 0 0 0 0236+26/3 24+27 0.2 2.4 1 0 2.4 1 026/4+23/2 32+16 2.7 0 0 0 0245 29 0.2 2.2 2 0 2.3 1 2.2 125/3 26 0.2 4.7 2 0 2.4 1 6.9 124/3 25 0.6 0 0 0 025/4 31 0.4 5.3 11 6.5 5 4.3 6 024/4 28 1.5 6.3 103 6.0 32 6.7 42 5.8 2934/2 33 0.8 0 0 0 025/26 53 0.8 1.5 3 0 1.6 1 1.4 224/26 51 1.0 0 0 0 023/4 22 0.4 65 7 100 1 61 1 59 5236/2 45 1.0 0 0 0 023/26 46 1.0 1.7 4 1.6 1 1.3 1 1.8 225/25 52 1.0 12 124 11 36 12 52 13 3624/25 49 2.3 8.8 17 15 2 7.8 12 8.4 324/24+236/3 47+59 1.3 9.8 63 7.5 13 11 27 9.5 2323/25 44 1.9 0 0 0 023/24 42 0.2 2.2 2 4.1 1 0.3 1 026/34 71 0.4 13 1 13 1 0 0236/4 64 0.2 0 0 0 023/23 40 16.1 0 0 0 0245/3 67 0.2 2.0 9 0.9 2 0.3 2 3.2 5235/4 63 0.2 1.4 7 1.1 1 1.2 2 1.6 4245/4 74 0.8 27 130 19 37 24 57 41 3625/34 70 1.1 6.7 56 7.7 30 5.6 25 8.1 124/34 66 0.8 4.4 102 4.7 30 3.8 41 4.9 31236/25 95 0.4 12 103 11 35 12 41 13 27236/24 91 0.4 6.8 4 7.8 3 3.5 1 023/34 56 0.2 5.1 10 1.2 1 4.5 5 6.8 4235/25 92 0.4 7.9 40 0 4.4 16 10 24236/23 84 0.6 6.3 38 14.3 1 2.5 15 8.6 22235/24+245/25 90+101 1.3 12 130 14 37 11 57 13 36
Table II continues to next page

330 International Journal of Circumpolar Health 64:4 2005
ORIGINAL RESEARCH
245/24 99 1.3 36 128 20 35 32 57 59 36235/23 83 0.8 3.6 33 2.8 3 1.9 11 4.6 19245/23 97 1.0 3.4 49 3.5 26 3.3 22 3.4 1234/25 87 1.7 7.8 125 7.6 37 6.4 53 10 35DDE+234/24 DDE+85 1.3 458 130 323 37 439 57 627 36236/236 136 0.8 10 35 4.9 4 4.9 13 15 18236/34 110 2.7 11 66 8.0 18 7.1 30 20 1834/34 77 1.3 2.7 4 0 0 2.7 42356/25 151 1.1 34 32 6.9 1 17.0 16 55 152346/25 144 0.4 1.8 34 1.0 6 1.5 11 2.3 172356/24+235/34 147+109 0.8 16 52 0 9.8 26 22 26345/24+236/245 123+149 1.9 9.0 80 11.2 37 7.5 38 5.2 5245/34 118 1.3 49 130 34 37 41 57 76 362356/23 134 1.7 8.2 30 8.9 1 12.6 12 5.0 172345/4 114 0.2 3.4 62 0.9 16 1.7 28 8.3 18235/245 146 4.2 35 127 23 34 31 57 55 36245/245 153 4.6 236 130 115 37 211 57 400 36234/236 132 4.4 6.8 5 7.4 3 5.9 2 0234/34 105 0.4 8.8 128 7.6 37 8.6 55 10 362345/25 141 1.1 3.1 27 4.3 6 3.0 13 2.3 82356/236 179 0.6 4.9 31 1.7 1 2.4 16 8.0 142345/24 137 0.4 6.0 120 2.9 28 5.4 57 9.5 352346/236 176 0.2 1.6 11 0.2 1 1.8 8 1.6 2234/235 130 0.2 4.9 62 2.3 3 3.4 25 6.3 34236/345+234/245+2356/34 164+163+138 2.1 115 130 60 37 104 57 189 362346/34 158 0.2 2.3 91 2.2 25 2.5 42 2.2 242345/23 129 0.2 1.0 33 0.7 16 1.8 11 0.4 62356/245 187 1.0 43 128 23 37 40 57 71 342346/245 183 0.6 12 123 3.1 35 7.8 55 29 33234/234 128 0.2 9.4 108 5.5 30 6.3 46 17 3223456/25 185 0.2 1.4 74 2.1 21 0.7 31 1.5 222345/236 174 1.1 4.5 61 4.3 17 4.3 27 5.0 172356/234 177 1.1 7.0 113 5.9 22 6.6 56 8.3 352346/234 171 1.0 14 75 9.9 12 13 43 20 202345/34 156 0.6 16 126 7.8 33 14 57 27 362346/2356 201 1.0 10 66 7.0 5 6.7 27 14 342345/235 172 0.4 8.8 113 6.0 22 7.5 56 13 352345/245 180 3.3 98 130 36 37 85 57 181 3623456/236 200 0.2 14 12 5.0 3 34 4 3.9 5MIREX 5.0 35 117 18 26 30 56 56 352345/234 170 1.9 26 129 11 36 23 57 47 3623456/34 190 0.4 5.9 128 5.3 35 4.8 57 8.4 362345/2356 199 0.4 28 129 14 37 25 57 47 3523456/245 203 0.6 11 126 4.3 34 11 57 18 352345/2346 196 0.4 4.2 112 2.7 20 3.5 57 6.2 3523456/234 195 0.4 5.2 97 3.3 12 4.0 51 7.5 342345/2345 194 0.6 29 78 14 4 21 39 39 3523456/2345 206 0.4 8.6 109 3.4 22 7.3 54 14 33
All age groups Age 18-34 Age 35-50 Age 51-75Structure IUPAC# MDL Average n Average n Average n Average n
Table II continues from previous page

331International Journal of Circumpolar Health 64:4 2005
ORIGINAL RESEARCH
B
A
Figure 3. Mean PCB congener pattern in blood from 59 Yupiks aged 35 and over, analyzed in 2001 (A), with data normalized as percentages of total PCBs, and congener patterns from three individuals with elevated levels of transient PCB congeners (B). The mean pattern is very similar to that reported for the average US population (19), but the three individuals shown in B demonstrate the presence of a much higher proportion of lower chlorinated, transient congeners, indicative of recent exposure.
Figure 4. PCB congener pattern in blood taken from one individual (male, age 35, from the NEC group) in 2001 (upper) and from a repeated blood sample in 2003 (lower). Note the decrease in serum levels over time, and the shift in the PCB congener pattern.

332 International Journal of Circumpolar Health 64:4 2005
ORIGINAL RESEARCH
the NEC group) who gave two blood samples,
one obtained in 2001 and the other in 2003.
His wet weight concentration was 5.7 ppb in
2001, but only 2.3 ppb in 2003, in spite of the
general tendency for levels to increase with
age. There was a decrease of between 34-36%
in each of the three most persistent conge-
ners (PCBs 138, 153 and 180) over this period
of time. However, his congener profile also
changed significantly over this period, with a
significant reduction in the percentage of tran-
sient PCB congeners. This suggests significant
recent exposure before the blood sample was
drawn in 2001, followed by significant metabo-
lism of the transient congeners. There was also
some reduction in the more persistent conge-
ners over time. This individual was selected
for repeat analysis because of his high blood
PCB 22 levels in 2001, but it was not present
in any significant amount in 2003.
DISCUSSION
While there have been a number of studies
of indigenous populations in many of the
northern countries, there has been relatively
little study in Alaska. The Arctic Monitoring
and Assessment Programme (AMAP) was
created in 1991 to begin monitoring human
health in the Arctic. Hansen (13) reported
lipid-adjusted levels of 14 PCB congeners and
DDE in maternal plasma of Arctic residents of
Canada, Greenland, Sweden, Norway, Iceland
and Russia. The PCB values ranged from 167
μg/kg (ppb lipid) in Canada, to 571 ppb in
Greenland. The AMAP (14) reported on PCB
levels in several different districts of Green-
land, finding an average total, lipid-adjusted
PCB level of 2,160 ppb. They noted signifi-
cant variation between different districts, with
greater levels on the east than west coast. Thus,
the level of PCBs in the Yupiks are within
the ranges reported for other Arctic people,
although there is considerable variation among
the various groups studied.
One of the few reports from Alaska is that
of Rubin et al. (15), who studied Alaska Native
women in samples collected between 1980
and 1987. The mean total PCB level (sum of
28 congeners) was 7.56 ppb (1,153 ppb lipid-
adjusted). They reported total PCB levels to
be higher in the northern and southwestern
parts of Alaska than in the interior or central
south, perhaps reflecting a greater consump-
tion of marine mammals in these regions. In
the northwestern part, (which would include
St. Lawrence Island, although residents here
were not subjects in the study), the mean total
PCB level was 9.48 ppb. Our PCB results are
somewhat lower than those reported by Rubin
et al. (15), perhaps reflecting a decrease in PCB
levels over time. However, our results indicate
that the Yupik people have significantly larger
body burdens of PCBs than the background
US and Canadian population.
PCB levels generally increase with age and,
in the Yupiks over the age of 30, the mean
PCB values were 7.5 ppb wet weight (1,506
ppb lipid-adjusted). The levels of PCBs in
individuals from the general US population
without unusual exposure was reported by the
ATSDR (1) to be 0.9-1.5 ppb (wet weight). On
average, fasting human serum contains about
0.6% fat, which means that a total PCB level
of 1.5 ppb wet weight is equivalent to 250 ppb
lipid. Thus, on average, the Yupik population
of St. Lawrence Island shows elevated levels of
total PCBs as compared to the general North
American background.

333International Journal of Circumpolar Health 64:4 2005
ORIGINAL RESEARCH
Another comparison population, which we
studied using identical analytical methods, is
a sample of 753 adult Mohawk Native Ameri-
cans from Akwesasne, located at the New
York, Ontario and Quebec junction. While
the Mohawks are traditionally fish eaters, the
local fish are contaminated with PCBs from
releases from aluminum foundries (16). Upon
advice from tribal leaders some, but not all,
of the Mohawks have reduced their consump-
tion of local fish. We found that the Mohawks
(30 years of age and older) had a mean PCB
concentration somewhat lower than that of the
Yupiks [3.2 ppb wet weight (706 ppb lipid-
adjusted)], but also peresented a much larger
range of values ( 0.29- 48.3 ppb) (17), probably
reflecting the greater variability in diet.
Our study is not without limitations. Subjects
were not randomly recruited, but were invited
to participate by the project staff on the Island
based on their age and whether, or not, their
families had camps at the NEC. We did not
obtain medical histories, nor information on
medications, such as lipid-lowering drugs, as
this was not a health effects study. We also do
not, at present, have detailed dietary histories
on the individuals studied. However, we do not
believe that the procedures used are likely to
have introduced significant bias in providing
a profile of serum PCB levels as a function of
age and residence.
The results provide some support for the
community belief that the FUDS at the NEC
contributes to the body burden of contami-
nants among those individuals who spend
significant time at camps near the site. The
mean serum PCB levels in those persons
whose families have camps at the NEC tended
to be higher than those of the other Yupiks,
although the overall difference did not quite
reach the level of statistical significance.
Although ingestion of food is a likely route
and source of exposure, it is not clear what is
the dominant exposure pathway among these
individuals. While detailed dietary informa-
tion is currently being gathered, it is not avail-
able at present. A number of the men were
employed at the military site during its opera-
tion and during the remediation of the site.
Insofar as is known, PCBs were used prima-
rily at the electrical generating facilities and
are also known to be associated with the paint
used at the sites. It is clear that contamination
from metals and polyaromatic hydrocarbons
has spread into the drainage basin of the Suqi
River and into the Suqi estuary (8), although
the extent of this spread is unclear. At present,
there is little data on the spread of PCBs. Some
fish collected from the Suqi River have shown
measurable levels of PCBs (8), but most fish
in the river are primarily anadromous, and
would not be expected to be highly contami-
nated. The marine mammals would also not be
expected to be contaminated from this site to
any great extent, since none of them remain at
the site for extended periods. Reindeer graze
in the vicinity, but they are highly mobile and
it is unlikely that they are the major source of
contamination. Other produce from the NEC
includes greens and berries. It is possible that
contaminated particulates, including signifi-
cant dust and suspended particles from the
recent remedial activities being conducted,
could contribute to the exposure if the produce
were not carefully washed.
The presence of relatively high levels of
transient, lower chlorinated congeners in a
subset of Yupiks is an indication of recent
exposure (18). From the data in Table II, one
can get a good indication of how transient a

334 International Journal of Circumpolar Health 64:4 2005
ORIGINAL RESEARCH
congener is by comparing levels in persons of
different ages. For the more persistent conge-
ners (PCBs 118, 138, 153, 180) the average
levels clearly increase with age, whereas there
is little, or no, age-dependence for the more
transient congeners. The rather high amounts
of PCB 22, a transient congener, in 8 of the 20
people with ties to the NEC is significant, as is
the fact that the highest levels of PCB 22 were
found in the youngest age group. However,
in spite of personal interviews with most of
the individuals with this congener, it was not
possible to determine a common source of
exposure. These individuals with PCB 22 were
primarily members of three families. Some,
while having spent significant periods of time
at the NEC, reported that they had not been
there for several years. However, all of them
reported that relatives and friends who did go
to the NEC brought back foodstuffs which
were shared, most commonly salmon berries,
greens, or reindeer. Thus, it is not certain that
this exposure was tied to the NEC FUDS, even
though no one in either of the other two groups
showed this transient congener.
There is also a FUDS at the community of
Gambell. While there is significant metal and
volatile organic contamination at Gambell,
there is little evidence for PCBs. The Gambell
geology and geography are significantly
different from those of the NEC. The FUDS
and community of Gambell is situated on a
highly permeable cobble spit and any spilled or
released contaminants quickly migrate to the
underlying permafrost, whereas at the NEC,
the relatively impermeable soils retain the
contaminants near the surface. It seems likely
that the major source of PCBs for the residents
of Gambell is global and regional atmospheric
transport of these substances, which then
bioconcentrate after depositing in the snow,
soils and water. The mean PCB concentration
of about 4 ppb (785 ng/g lipid) is somewhat
lower than the wet weight values reported for
Inuits of Greenland (13.3 ppb) (15), probably
secondary to the fact that the levels of contami-
nants in marine mammals in the north Atlantic
is greater than that in the north Pacific. The
predominant air currents in far Western Alaska
come primarily from Russia, Japan and China,
whereas the northern Atlantic receives sources
from the highly industrialized US, Canada and
Western Europe.
The levels of PCBs were non-significantly
greater at Savoonga than at Gambell, even
though the mean age of the subjects was 2
years higher in Gambell. It is likely that the
Yupik peoples tradition of sharing food is a
factor here. Those residents with camps at the
NEC live principally in Savoonga, and prob-
ably shared enough of the foods they brought
back to Savoonga to raise the levels of other
inhabitants.
In summary, our results suggest that the
former military site located at the NEC on St.
Lawrence Island may contribute to the PCB
exposure of the native residents, but that the
predominant source is global transport, depo-
sition and bioconcentration in foodstuffs.
AcknowledgementsThis study was supported by NIEHS Environ-
mental Justice Partnerships for Communica-
tions, grant #R25 ES 10459 ZES (Ronald J.
Scrudato, PI) and the Institute for Health and
the Environment at the University at Albany.
All human studies were approved by the
University at Albany’s Internal Review Board.

335International Journal of Circumpolar Health 64:4 2005
ORIGINAL RESEARCH
REFERENCES
1. ATSDR (Agency for Toxic Substances and Disease Registry). Toxicological Profile for Polychlorinated Biphenyls. ATSDR, Atlanta, Georgia. 2000; 765 pp.2. Smith D. Worldwide trends in DDT levels in human breast milk. Internat J Epidemiol 1999; 28: 179-188.3. Dallaire F, Dewailly E, Laliberte C, Muckle G, Ayotte P. Temporal trends of organochlorine concentra- tions in umbilical cord blood of newborns from the Lower North Shore of the St. Lawrence River (Que- bec, Canada). Environ Health Perspect 2002; 110: 835-838.4. Gregor DJ, Palmer M, Bailey R. Current PCB deposi- tion in snow in the Yukon territory. Proc 22nd Aquatic Toxicity Workshop, St. Andrews, New Brunswick. Canadian Technical Report of Fisheries and Aquatic Sciences, 1996; No. 2093: 62.5. Bjerregaard P, Dewailly E, Ayotte P, Pars T, Ferron L, Mulvad G. Exposure of Inuit in Greenland to organo- chlorines throughout the marine diet. J Toxicol Envi- ron Health A 2001; 62: 69-81.6. Kuhnlein HV, Receveur O, Muir DCG, Chan HM, Soueida R. Arctic women consume greater than ac- ceptable levels of organochlorines. J Nutr 1995; 125: 2501-2510.7. Carpenter DO. Polychlorinated biphenyls and human health. Int J Occup Med Environ Health 1998; 11: 291-303.8. Zamzow K. Contaminants in wildlife and people of St. Lawrence Island, Alaska. A report to the Com- munities of Savoonga and Gambell. Alaska Commu- nity Action on Toxics, Anchorage, AK, 2002; 109 pp.9. Hild CM. The next step in assessing Arctic human health. Sci Total Environ 1995; 160/161: 559-569.10. DeCaprio AP, Tarbell AM, Bott A, Wagemaker DL, Williams RL, O’Hehir CM. Routine analysis of 101 polychlorinated biphenyl congeners in human serum by parallel dual-column gas chromatography with
electron capture detection. J Anal Toxicol 2000; 24: 403-420.11. Hansen LG, Green D, Cochran J, Vermette S, Bush B. Chlorobiphenyl (PCB) composition of extracts of sub- surface soil, superficial dust and air from a contaminat- ed landfill. Fresenius J Anal Chem 1997; 357: 442-448.12. Hansen LG. Stepping backward to improve assess- ment of PCB congener toxicities. Environ Health Perspect 1998; 106: 171-189.13. Hansen JC. Environmental contaminants and human health in the Arctic. Toxicol Letts 2000; 112-113: 119-125.14. AMAP (Arctic Monitoring and Assessment Program). AMAP Report on Issues of Concern: Updated Infor- mation on Human Health, Persistent Organic Pollut- ants, Radioactivity, and Mercury in the Arctic. Oslo, Norway: Arctic Monitoring and Assessment Pro- gramme. AMAP Report 2000; 4. 15. Rubin CH, Lanier A, Socha M, Brock JW, Kieszak S, Zahm S. Exposure to persistent organochlorines among Alaska Native women. Int J Circumpolar Health 2001; 60: 157-169.16. Hwang SA, Fitzgerald EF, Bush B, Cook KSE. Expo- sure to PCBs from hazardous waste among Mohawk women and infants at Akwesasne. J Franklin Inst 1996; 333A: 17-23.17. DeCaprio AP, Johnson GW, Tarbell AM, et al. Poly- chlorinated biphenyl (PCB) exposure assessment by multivariate statistical analysis of serum congener profiles in an adult Native American population. En- viron Res 2005; 284-302.18. Hansen LG. Identification of steady state and episodic PCB congeners from multiple pathway exposures. In: Robertson LW and Hansen LG, eds. Recent Advances in Environmental Toxicology and Health Effects. The University Press of Kentucky 2001; 47-56.19. CDC. Second National Report on Human Exposure to Environmental chemicals. Department of Health and Human Services, Centers for Disease control and Prevention 2003; 251 pp.
David O. Carpenter, MDInstitute for Health and the EnvironmentUniversity at AlbanyOne University Place, A217Rensselaer, NY 12144, USATelephone: (518) 525-2660Fax: (518) 525-2665Email: [email protected]

Original Contribution
Adverse Birth Outcomes Associated with Open Dumpsites in Alaska NativeVillages
Susan Gilbreath and Philip H. Kass
From the Department of Population Health and Reproduction, University of California, Davis, CA.
Received for publication September 8, 2005; accepted for publication March 13, 2006.
This retrospective cohort study evaluated adverse birth outcomes in infants whose birth records indicatedmaternal residence in villages containing dumpsites potentially hazardous to health and environment. Birth recordsfrom 1997 to 2001 identified 10,073 eligible infants born to mothers in 197 Alaska Native villages. Outcomesincluded low or very low birth weight, preterm birth, and intrauterine growth retardation. Infants from mothers invillages with intermediate (odds ratio (OR) ¼ 1.73, 95% confidence interval (CI): 1.06, 2.84) and high (OR ¼ 2.06,95% CI: 1.28, 3.32) hazard dumpsites had a higher proportion of low birth weight infants than did infants frommothers in the referent category. More infants born to mothers from intermediate (OR ¼ 4.38, 95% CI: 2.20, 8.77)and high (OR ¼ 3.98, 95% CI: 1.93, 8.21) hazard villages suffered from intrauterine growth retardation. Onaverage, infants weighed 36 g less (95% CI: �71.2, �0.8) and 55.4 g less (95% CI: �95.3, �15.6) when bornto highly exposed mothers than did infants in the intermediate and low exposure groups, respectively, an effecteven larger in births to Alaska Native mothers only. No differences in incidence were detected across exposurelevels for other outcomes. This is the first study to evaluate adverse pregnancy outcomes associated with opendumpsites in Alaska Native villages.
Alaska; environmental exposure; ethnic groups; fetal growth retardation; hazardous waste; infant, low birthweight; pregnancy outcome; premature birth
Abbreviations: CI, confidence interval; IUGR, intrauterine growth retardation; OR, odds ratio.
Increased risks of adverse birth outcomes have been re-ported near individual landfill sites and in some multisitestudies (1–7). Outcomes such as low birth weight, pretermbirth, intrauterine growth retardation (IUGR), and other re-productive outcomes are considered to be sensitive indica-tors of potential health threats from environmental hazards(7–14). These studies have never been performed in ruralAlaska. Historically, Alaska has had one of the lowest lowbirth weight rates in the United States, but low birth weightrates have increased from 1990 to 1998 (15). Low birthweight rates are still lower than the national average with3.8 percent of singleton births to Alaska women classifiedas low and 0.9 percent classified as very low in 2000 (16).A recent study found no differences between Alaska Native
and non-Native birth weights (15). Alaska Native womenhad a slightly higher proportion of preterm births (11.8 per-cent) than did the overall state proportion of 10.1 percent in2000 (16).
In 2000, Alaska had 626,932 residents, 119,241 of whomwere Alaska Native (17). In this work, Alaska Native in-cludes any people indigenous to the Western Hemisphere:Alaska Native, Native mixed, Aleut, Eskimo, CanadianEskimo and Indian, andAmerican Indian (18).Many of theseAlaska Natives are dispersed throughout federally recog-nized tribal villages.
Solid waste management is severely deficient in many ofthese remote villages, comparable to what is found in de-veloping countries (19, 20). Over 95 percent of Alaska
Correspondence to Dr. Philip H. Kass, Department of Population Health and Reproduction, University of California, Davis, One Shields Avenue,
Davis, CA 95616 (e-mail: [email protected]).
1
American Journal of Epidemiology
Copyright ª 2006 by the Johns Hopkins Bloomberg School of Public Health
All rights reserved; printed in U.S.A.
DOI: 10.1093/aje/kwj241
American Journal of Epidemiology Advance Access published July 13, 2006

Native villages use open dumpsites for solid waste disposalrather than landfills. An open dumpsite is a solid waste sitethat is not maintained, contains uncovered wastes, and hasno boundaries (19). Open dumping can enable water andsoil contamination, disease transmission, fire danger, andinjury to site salvagers (21). In an attempt to reduce wastevolume, dump fires are set, or nonseparated wastes areburned in metal containers in approximately 75 percent ofvillages, releasing potentially toxic fumes (22).ManyAlaskaNatives have subsistence diets, and there are concerns aboutcontaminants getting into food and water supplies (23, 24).Many villages lack waste management services and are re-sponsible for disposing their own wastes, resulting in poten-tial exposures to hazardous wastes and disposal methods.Approximately 45 percent of villages do not have runningwater to homes, and villagers must haul their own waste-water (25), often discarded at or near open dumps, increas-ing risks of exposure to pathogens when disposing of trash(25–27).
Negative birth outcomes were selected to evaluate po-tential environmental hazards posed by these dumpsites.The purpose of the study was to determine if women liv-ing in villages with open dumpsites ranked high hazardhave a higher incidence of negative birth outcomes thando women living in villages with sites that have lower haz-ard rankings.
MATERIALS AND METHODS
This was a population-based study that utilized a retro-spective cohort design for the years 1997–2001. Birth rec-ords were obtained from the Alaska Bureau of VitalStatistics for all births to women living in federally recog-nized Alaska Native villages during 1997–2001. It is esti-mated that over 97 percent of births are electronicallyentered (18). Eligible pregnancies were those coded as livesingleton births without congenital anomalies, whose moth-ers’ residences were listed as a Native village. Additionally,the women had to reside in villages for which there existedan evaluation of the hazard potential of the communitydumpsite(s).
Negative birth outcomes included low birth weight (from1,500 to <2,500 g), very low birth weight (<1,500 g), pre-term birth (<37 weeks’ gestation), and IUGR (at least 37weeks’ gestation and <2,500 g (28)). Outcomes were notmutually exclusive, although low birth weight births wereexcluded from the analyses involving very low birth weightbirths, and preterm births were excluded from analyses in-volving IUGR.
Exposure information was the hazard ranking of thedumpsite of the village that was indicated on the birth cer-tificate as the mother’s residence. The Alaska Native TribalHealth Consortium ranks dumpsites on the basis of wastecontents, average rainfall, distance to drinking waster anddomestic water source, site drainage, potential to createleachate at site, accessibility and exposure to the publicand vectors, frequency of burning, and degree of public con-cern over the site (Appendix table 1) (20). Dump scoreswere categorized into high, intermediate, and low hazard
potential to health and environment. During the time periodof the study, 159 of the villages’ dumpsites had been scored,with 17 other sites being ranked as either high, intermediate,or low hazard. An additional 21 sites were ranked on thesame hazard point factors as above, by use of data from thesolid waste management database of the Central Council ofTlingit and Haida Indian Tribes of Alaska.
Covariate information was obtained from birth recordsand included gender, interpregnancy interval, parity, ade-quacy of prenatal care, smoking status, alcohol intake, race,mother’s age, and education. More information on the moth-ers’ villages was obtained from the state of Alaska Commu-nity Database (29). This included average family householdsize and income, percentage of population Alaska Native,percentage of population in poverty, and the land area of thevillage in square miles (1 square mile ¼ 2.6 km2). Addition-ally, information was gathered on whether the whole villagehad piped water, part of the village had piped water, or noneof the homes in the village were plumbed. Villages were alsocategorized into those that were isolated with restrictedhealth-care options, villages with qualified emergency carecenters, and regional centers with a qualified acute carefacility.
For data analysis, chi-square tests were used to determineif the distribution of covariates was homogenous across ex-posure groups. Crude odds ratios and 95 percent confidenceintervals were calculated for the effect of hazard rankingon each negative birth outcome. Crude odds ratios and 95percent confidence intervals were calculated for each co-variate on each negative birth outcome.
Logistic regression was used to determine adjusted oddsratios and 95 percent confidence intervals to quantify therelations between hazard potential and occurrences of lowbirth weight, very low birth weight, preterm birth, andIUGR. Because the outcomes of interest were rare, the oddsratios approximate the relative risks (30–32). Informationon gender (female vs. male), interpregnancy interval, parity(no previous pregnancies, one or two previous pregnancies,and three or more previous pregnancies), adequacy of pre-natal care, smoking status (did not smoke, smoked duringpregnancy), alcohol intake (did not drink, drank during preg-nancy), race (Caucasian, unknown and other, and AlaskaNative), mother’s age (under 20 and over 39 vs. 20–39years), mother’s education (less than 11 years, 12 years,and more than 12 years), year of birth, village health-careoptions (restricted, qualified emergency care center, andqualified acute care facility), and village water hookup (allhouseholds plumbed, some households plumbed, and nohouseholds plumbed) was used in models. Interpregnancyinterval was categorized into two pregnancy endpoints inless than 2 years, two endpoints in 2 years or more, and noprevious pregnancies. The Kessner Index (33) is a classifica-tion scheme of adequacy of prenatal care that accounts forthe gestational month when prenatal care began and thenumber of prenatal visits with respect to length of gestation.The Kessner Index was used to define adequacy of prenatalcare into categories of adequate, intermediate, inadequate,and unknown. The race of the baby was designated as thereported race of the mother in accordance with standardsfrom the National Center for Health Statistics. For the
2 Gilbreath and Kass

analysis on low birth weight, two different models wereconstructed. The first model included all records with birthweight information, while the second model adjusted forweeks of gestation.
Analyses of variance were used to compare mean birthweight (grams) and mean gestational length (days) in thethree exposure areas by use of the least significant differencefor multiple pairwise comparisons. Multivariate analysis ofcovariance was used to compare means for birth weight andgestation, while simultaneously adjusting for covariates.Birth weight and gestation were the outcome variables, withhazard ranking of the predictor variable and gender, inter-pregnancy interval, parity, adequacy of prenatal care, smok-ing status, alcohol intake, race, mother’s age (the mean ofeach 5-year age class), years of education (used continu-ously), village health-care options, and village water hookupused as covariates. The mean of years of mother’s educationwas used to replace missing values, and an additional cate-gorical dummy variable was added to adjust for the missingdata on education (34). The same analysis was performedagain, restricted to Alaska Native births and substituting therace covariate with the percentage of the village populationthat was Native, used continuously.
RESULTS
Of the 199 Alaska Native villages that reported birthsduring the study period, there were hazard rankings avail-able for 197. There were 10,073 births to mothers from thesevillages determined to be eligible.
Chi-square tests revealed that the distributions of gender,alcohol use, and year of birth were roughly equal throughoutexposure levels (table 1). The quality of prenatal care (p ¼0.04) and cigarette use (p ¼ 0.03) were less evenly distrib-uted (table 1). There were disparities (p < 0.001) in thedistributions of interpregnancy interval, parity, race, mater-nal age, maternal education level, type of health care, andwater hookup to households (table 1). Mothers in villageswith low hazard-ranked dumpsites tended to have had fewershort interpregnancy intervals and previous pregnancies,were more frequently Caucasian and between 20 and 39years of age, completed more years of education, more of-ten had access to acute care medical facilities, and weremore likely to have households in their villages completelyplumbed compared with mothers from villages with inter-mediate and higher hazard-ranked dumpsites. Other village-level covariates (villages’ size, percentage of population inpoverty, and so on) are not displayed because these factorsdid not add any additional information to the models.
Low birth weight
Among the 10,073 infants born between 1997 and 2001and included in the analyses, 10,056 had complete birthweight information in their records. A total of 353 (3.5 per-cent) of these infants were low birth weight (table 2). Allfactors except gender, year of birth, and type of health careavailable were associated with a change in risk for lowbirth weight.
Crude estimates revealed that mothers residing in villageswith intermediate hazard rankings were at a mildly in-creased risk for low birth weight births (odds ratio (OR) ¼1.73, 95 percent confidence interval (CI): 0.90, 1.84) com-pared with mothers residing in villages with low hazardrankings (table 3). Mothers residing in villages with highhazard rankings were 43 percent (95 percent CI: 1.12, 1.81)more likely to have low birth weight babies than were moth-ers who had low hazard-ranking villages listed on birth re-cords (table 3). Adjusted estimates detected an increasedrisk for mothers residing in villages with both intermediatehazard rankings (OR ¼ 1.73, 95 percent CI: 1.06, 2.84) andhigh hazard rankings (OR¼ 2.06, 95 percent CI: 1.28, 3.32)compared with the referent category. When weeks of gesta-tion were added to the model, risks for intermediate hazardand low hazard villages rose to 2.69 (95 percent CI: 1.50,4.84) and 2.20 (95 percent CI: 1.26, 3.85), respectively.
Very low birth weight
Of the 10,056 records that had complete birth weight in-formation, 9,766 records were used for the very low birthweight analyses. Sixty-three (0.7 percent) of these infantswere very low birth weight. Gender, parity, year of birth, andhealth-care options were not associated with a change in riskfor very low birth weight infants (table 2). Interpregnancyinterval, quality of prenatal care, cigarette use and alcoholintake, race, maternal education, and water hookup wereassociated with very low birth weight births.
Crude odds ratios revealed that mothers residing in vil-lages with intermediate (OR ¼ 1.28, 95 percent CI: 0.57,2.89) and high (OR ¼ 1.49, 95 percent CI: 0.87, 2.56) haz-ard rankings had slight increases in risk for very low birthweight births compared with mothers residing in villageswith low hazard rankings (table 3). Adjusted estimates de-tected no risks for mothers residing in villages with inter-mediate hazard rankings (OR ¼ 0.82, 95 percent CI: 0.25,2.75) and high hazard rankings with a risk estimate of unity(OR ¼ 1.02, 95 percent CI: 0.33, 3.12) compared with thereferent category.
Preterm birth
Of the qualified births, 10,054 records had complete ges-tational information. A total of 734 (7.0 percent) of theseinfants were born preterm. All factors except gender andyear of birth were associated with a change in risk for pre-term birth (table 2).
Crude odds ratios revealed that mothers residing in vil-lages with intermediate hazard rankings were at no appre-ciably different risk for preterm births (OR ¼ 0.89, 95percent CI: 0.68, 1.17) compared with mothers residing invillages with low hazard rankings. Mothers residing in vil-lages with high hazard rankings were 45 percent (95 percentCI: 1.24, 1.70) more likely to give birth prematurely thanwere mothers from low hazard-ranking villages (table 3).Adjusted estimates indicated slighty reduced risks for pre-term birth in mothers from intermediate hazard villages(OR ¼ 0.70, 95 percent CI: 0.48, 1.01), while mothers fromhigh hazard villages were at no increased risk (OR ¼ 1.09,
Birth Outcomes and Dumpsites in Alaska Villages 3

TABLE 1. The distribution and chi-square p values of individual-level and village-level characteristics
across villages with low, intermediate, and high hazard potential dumpsites, Alaska, 1997–2001
Covariates
Lowhazarddumpsite
(n ¼ 4,369)
Intermediatehazarddumpsite
(n ¼ 1,247)
Highhazarddumpsite
(n ¼ 4,457)p value
No. % No. % No. %
Individual-level characteristics
Gender of infant 0.63
Male 2,299 52.6 644 51.6 2,302 51.6
Female 2,070 47.4 603 48.4 2,155 48.4
Interpregnancy interval <0.001
>2 years 2,714 63.9 781 63.9 2,707 61.8
�2 years 413 9.7 170 13.9 648 14.8
No previous pregnancy 1,118 26.3 272 22.2 1,025 23.4
Parity <0.001
1 or 2 previous pregnancies 1,793 41.2 478 38.4 1,544 34.8
0 previous pregnancies 1,117 25.6 272 21.8 1,025 23.1
�3 previous pregnancies 1,445 33.2 496 39.8 1,872 42.2
Quality of prenatal care 0.04
Adequate 2,166 49.6 612 49.1 2,094 47
Intermediate 1,438 32.9 417 33.4 1,531 34.4
Inadequate 619 14.2 175 14 710 15.9
Unknown 146 3.3 43 3.4 122 2.7
Cigarette use during pregnancy 0.03
Did not report smoking 3,143 72.3 877 70.7 3,101 69.8
Reported smoking 1,203 27.7 363 29.3 1,341 30.2
Alcohol use during pregnancy 0.27
Did not report drinking 4,082 94.1 1,170 94.3 4,138 93.4
Reported drinking 256 5.9 71 5.7 294 6.6
Race <0.001
Caucasian 2,002 45.8 265 21.3 375 8.4
Not reported or other 216 4.9 15 1.2 53 1.2
Alaska Native 2,151 49.2 967 77.5 4,029 90.4
Maternal age <0.001
20–39 years 3,687 84.4 1,016 81.5 3,595 80.7
<20 years or �40 years 682 15.6 231 18.5 862 19.3
Maternal education <0.001
>12 years 1,554 36.4 210 17.5 618 14.3
12 years 1,933 45.3 693 57.6 2,774 64
<12 years 778 18.2 300 24.9 940 21.7
Year of birth 0.33
1997 866 19.8 251 20.1 946 21.2
1998 874 20 266 21.3 897 20.1
1999 902 20.6 226 18.1 902 20.2
2000 876 20.1 240 19.2 864 19.4
2001 851 19.5 264 21.2 848 19
Village-level characteristics
Available health care in village <0.001
Qualified acute care facility 3,957 90.6 239 19.2 155 3.5
Qualified emergency care center 210 4.8 188 15.1 960 21.5
Restricted health care options 202 4.6 820 65.8 3,342 75
Piped water to households in village <0.001
All households plumbed 3,586 82.1 160 12.8 1,097 24.6
Some households plumbed 748 17.1 726 58.2 1,695 38.0
No households plumbed 35 0.8 361 28.9 1,665 37.4
4 Gilbreath and Kass

TABLE 2. The distribution and risks associated with individual-level and village-level characteristics and outcomes of low and very
low birth weight, preterm birth, and intrauterine growth retardation, Alaska, 1997–2001y
Covariates
Lowbirth weight
(cases ¼ 353)
Very lowbirth weight(cases ¼ 63)
Pretermbirth
(cases ¼ 734)
Intrauterinegrowth retardation
(cases ¼ 98)
Oddsratio
95%confidenceinterval
Oddsratio
95%confidenceinterval
Oddsratio
95%confidenceinterval
Oddsratio
95%confidenceinterval
Individual-level characteristics
Gender of infant
Male 1 1 1 1
Female 1.19 0.96, 1.47 1.13 0.69, 1.85 0.89 0.76, 1.03 0.67* 0.44, 0.99
Interpregnancy interval
>2 years 1 1 1 1
�2 years 1.39* 1.03, 1.86 2.10** 1.59, 5.28 1.30** 1.07, 1.65 0.8 0.40, 1.62
No previous pregnancy 1.24 0.98, 1.57 1.03 0.59, 1.79 0.99 0.83, 1.19 1.2 0.76, 1.90
Parity
1 or 2 previous pregnancies 1 1 1 1
0 previous pregnancies 1.32* 1.01, 1.72 1.03 0.57, 1.86 1.08 0.89, 1.32 1.13 0.69, 1.86
�3 previous pregnancies 1.31* 1.03, 1.66 1.4 0.80, 2.45 1.29** 1.08, 1.53 0.86 0.53, 1.37
Quality of prenatal care
Adequate 1 1 1 1
Intermediate 1.42** 1.11, 1.82 0.91 0.48, 1.73 1.25** 1.05, 1.49 1.55 0.99, 2.44
Inadequate 2.12*** 1.60, 2.82 2.66** 1.45, 4.87 1.79*** 1.46, 2.19 1.65 0.93, 2.95
Unknown 2.44*** 1.48, 4.00 3.42** 1.29, 9.02 1.83** 1.25, 2.67 2.37 0.92, 6.08
Cigarette use during pregnancy
Did not report smoking 1 1 1 1
Reported smoking 1.79*** 1.45, 2.20 2.27*** 1.46, 3.09 1.60*** 1.38, 1.86 1.22* 1.04, 1.43
Alcohol use during pregnancy
Did not report drinking 1 1 1 1
Reported drinking 2.66*** 1.98, 3.67 4.01*** 2.30, 6.99 2.00*** 1.58, 2.53 1.12 0.93, 1.34
Race
Caucasian 1 1 1 1
Not reported or other 1.8 0.97, 3.40 1.19 0.15, 9.54 1.5 0.90, 2.51 1.43 0.50, 4.11
Alaska Native 1.66*** 1.26, 2.19 2.54** 1.21, 5.34 2.02*** 1.64, 2.48 0.96 0.61, 1.50
Maternal age
20–39 years 1 1 1 1
<20 years or �40 years 1.68*** 1.32, 2.15 1.49 0.83, 2.67 1.24* 1.03, 1.50 1.47 0.92, 2.35
Maternal education
>12 years 1 1 1 1
12 years 1.77*** 1.28, 2.38 2.50* 1.12, 5.60 1.43*** 1.16, 1.76 1.36 0.78, 2.36
<12 years 2.20*** 1.58, 3.07 3.15** 1.39, 7.13 1.93*** 1.54, 2.41 1.83 0.99, 3.41
Year of birth
1997 1 1 1 1
1998 0.94 0.67, 1.32 0.69 0.32, 1.50 0.96 0.76, 1.22 1.14 0.58, 2.23
1999 0.9 0.64, 1.27 0.51 0.22, 1.19 0.88 0.69, 1.12 1.26 0.65, 2.44
2000 1.03 0.74, 1.43 0.65 0.30, 1.44 1.02 0.81, 1.30 1.84 0.99, 3.41
2001 1.09 0.78, 1.51 1.19 0.60, 2.34 1.12 0.89, 1.41 1.07 0.53, 2.14
Village-level characteristics
Available health care in village
Qualified acute care facility 1 1 1 1
Qualified emergency care center 1 0.70, 1.41 1.07 0.45, 2.52 1.14 0.90, 1.46 0.76 0.40, 1.44
Restricted health care options 1.25 1.00, 1.57 1.67 0.97, 2.88 1.47*** 1.25, 1.73 0.86 0.56, 1.31
Piped water to households in village
All households plumbed 1 1 1 1
Some households plumbed 1.35* 1.06, 1.72 2.13** 1.21, 3.75 1.27** 1.07, 1.51 0.92 0.58, 1.50
No households plumbed 1.32* 1.00, 1.74 1.47 0.73, 2.93 1.41*** 1.17, 1.71 1.118 0.71, 2.00
* p < 0.05; **p < 0.01; ***p < 0.001.
y The number of records for each analysis varied from 9,766 to 10,056.
Birth Outcomes and Dumpsites in Alaska Villages 5

95 percent CI: 0.78, 1.51) compared with the referentcategory.
Intrauterine growth retardation
Of the qualified full-term births, 9,221 records had com-plete birth weight information. Ninety-eight (1.1 percent) ofthese infants were born with IUGR (table 2). Only male gen-der and smoking were significantly associated with IUGR,although quality of prenatal care, alcohol use, maternal age,maternal education of less than 12 years, and birth year in2000 also indicated IUGR.
Crude odds ratios revealed that mothers residing in vil-lages with intermediate hazard rankings were at an 80 per-cent increased risk for IUGR (OR ¼ 1.78, 95 percent CI:1.01, 3.14) compared with mothers residing in villages withlow hazard rankings. Mothers residing in villages with highhazard rankings had no appreciable difference in risk forIUGR (OR¼ 1.15, 95 percent CI: 0.73, 1.80) compared withmothers who had low hazard-ranking villages listed on birthrecords (table 3). Adjusted estimates detected a fourfold in-crease in risk for mothers residing in villages with interme-diate hazard rankings (OR¼ 3.99, 95 percent CI: 1.95, 8.15)
and a slightly lower estimate in the villages with high hazardrankings (OR ¼ 3.68, 95 percent CI: 1.72, 7.87) comparedwith the referent category.
Average birth weight and gestational length
The average birth weight was 3,569.9 g for infants born tomothers from low hazard villages, 3,565.5 g for those fromintermediate hazard villages, and 3,542.1 g for those fromhigh hazard areas (table 4). Infants in the high hazard vil-lages weighed, on average, 27.8 g less than did infants in thelow hazard villages (95 percent CI: �51.4, �4.1 g). Theaverage gestational length (days) is displayed in table 4for each hazard category. The gestational length was 273.4days for pregnancies in mothers from low hazard villages,272.5 days for those from intermediate hazard villages, and270.9 days for those from high hazard villages. Mothersfrom the intermediate hazard villages had pregnancies that,on average, lasted 0.9 days less than did mothers from lowhazard villages (95 percent CI: �1.7, �0.01 days). Mothersfrom the high hazard villages also had pregnancies lasting2.5 days less than did mothers from the low hazard villages(95 percent CI: �3.0, �1.9 days) and 1.6 days less than did
TABLE 3. Crude and adjusted odds ratios and 95% confidence intervals describing the relations between low, intermediate, and high
hazard exposure categories and incidence of low and very low birth weight, preterm birth, and intrauterine growth retardation, Alaska,
1997–2001
Outcome
Outcome notpresent
Outcomepresent
Oddsratio
(crude)
95%confidenceinterval
Oddsratio
(adjusted)y
95%confidenceintervalNo. % No. %
Low birth weight (n ¼ 10,056)
Low hazard dumpsite 4,236 42.1 126 2.9 1 1
Intermediate hazard dumpsite 1,199 11.9 46 3.7 1.29 0.90, 1.84 1.73* 1.06, 2.84
High hazard dumpsite 4,268 42.4 181 4.1 1.43** 1.12, 1.81 2.06** 1.28, 3.32
Low birth weight adjusted for gestation(n ¼ 10,037)
Low hazard dumpsite 4,227 42.1 125 2.9 1 1
Intermediate hazard dumpsite 1,198 11.9 46 3.7 1.52* 1.01, 2.32 2.69*** 1.50, 4.84
High hazard dumpsite 4,263 42.5 178 4 1.13 0.86, 1.48 2.20** 1.26, 3.85
Very low birth weight (n ¼ 9,766)
Low hazard dumpsite 4,236 43.4 22 0.5 1 1
Intermediate hazard dumpsite 1,199 12.3 8 0.7 1.28 0.57, 2.89 0.91 0.27, 3.10
High hazard dumpsite 4,268 43.7 33 0.8 1.49 0.87, 2.56 1.17 0.37, 3.67
Preterm birth (n ¼ 10,054)
Low hazard dumpsite 4,087 40.7 272 6.2 1 1
Intermediate hazard dumpsite 1,176 11.7 70 5.6 0.89 0.68, 1.17 0.77 0.52, 1.12
High hazard dumpsite 4,057 40.4 392 8.8 1.45*** 1.24, 1.70 1.24 0.89, 1.74
Intrauterine growth retardation(n ¼ 9,319)
Low hazard dumpsite 4,052 43.9 34 0.8 1 1
Intermediate hazard dumpsite 1,158 12.6 19 1.6 1.78* 1.01, 3.14 4.38*** 2.20, 8.77
High hazard dumpsite 4,011 43.5 45 1.1 1.15 0.73, 1.80 3.98*** 1.93, 8.21
* p < 0.05; **p < 0.01; ***p < 0.001.
y Adjusted for gender, interpregnancy interval, parity, adequacy of prenatal care, smoking status, alcohol intake, race, mother’s age and
education, health care options, piped water, and missing values.
6 Gilbreath and Kass

mothers in the intermediate hazard villages (95 percent CI:�2.4, �0.8 days).
The multivariate analysis revealed adjusted mean birthweights of 3,584.9 g, 3,565.5 g, and 3,529.5 g for births tomothers from low, intermediate, and high hazard villages,respectively (table 4). Infants born to mothers from highhazard villages weighed, on average, 36.0 g less than didinfants whose mothers were from intermediate hazard vil-
lages (95 percent CI:�71.2,�0.8 g) and 55.4 g less than didthose from low hazard villages (95 percent CI: �95.3,�15.6 g). The adjusted mean gestational length was 272.7days in low hazard villages, 272.8 days in intermediate haz-ard villages, and 271.6 days in high hazard villages. Mothersin the high hazard villages had pregnancies that, on average,lasted 1.2 days less than did mothers in intermediate hazardvillages (95 percent CI: �2.0, �0.3 days). Mothers in the
TABLE 4. Crude and adjusted average birth weights and gestational lengths, as well as mean differences, across low, intermediate,
and high hazard exposure categories, and 95% confidence intervals, Alaska, 1997–2001
Model No. Mean ContrastMean
difference95% confidence
interval
Births to all women
Weight (g)
Low hazard 4,362 3,569.90 Intermediate-low �4.3 �40.0, 31.3
Intermediate hazard 1,245 3,565.50 High-intermediate �23.4 �59.0, 12.1
High hazard 4,449 3,542.10 High-low �27.8* �51.4, �4.1
Gestation (days)
Low hazard 4,359 273.4 Intermediate-low �0.9* �1.7, 0.0
Intermediate hazard 1,246 272.5 High-intermediate �1.6*** �2.4, �0.8
High hazard 4,449 270.9 High-low �2.5*** �3.0, �1.9
Weight (adjustedy) (g)
Low hazard 4,350 3,584.90 Intermediate-low �19.4 �64.4, 25.6
Intermediate hazard 1,245 3,565.50 High-intermediate �36.0* �71.2, �0.8
High hazard 4,442 3,529.50 High-low �55.4** �95.3, �15.6
Gestation (adjustedy) (days)
Low hazard 4,350 272.7 Intermediate-low 0.1 �0.9, 1.2
Intermediate hazard 1,245 272.8 High-intermediate �1.2** �2.0, �0.3
High hazard 4,442 271.6 High-low �1.0* �2.0, �0.1
Births to Alaska Native women only
Weight (g)
Low hazard 2,092 3,587.60 Intermediate-low �26.5 �94.7, 41.7
Intermediate hazard 929 3,597.50 High-intermediate �55.6** �97.9, �13.3
High hazard 3,907 3,545.60 High-low �82.1** �142.4, �21.8
Gestation (days)
Low hazard 2,036 271.8 Intermediate-low �0.1 �1.7, 0.0
Intermediate hazard 913 271.5 High-intermediate �1.8** �2.2, �0.9
High hazard 3,845 269.8 High-low �1.9* �3.8, �0.1
Weight (adjustedz) (g)
Low hazard 2,031 3,616.80 Intermediate-low �29 �97.6, 39.7
Intermediate hazard 910 3,587.80 High-intermediate �48.4* �90.8, �5.9
High hazard 3,829 3,539.40 High-low �77.3** �138.1, �16.6
Gestation (adjustedz) (days)
Low hazard 2,031 271.8 Intermediate-low �0.2 �2.3, 1.8
Intermediate hazard 910 271.5 High-intermediate �1.7** �3.0, �0.4
High hazard 3,829 269.8 High-low �1.9* �3.7, �0.1
* p < 0.05; **p < 0.01; ***p < 0.001.
y Adjusted for gender, interpregnancy interval, parity, adequacy of prenatal care, smoking status, alcohol intake, race, mother’s age and
education, health care options, piped water, and missing values.
z Adjusted for gender, interpregnancy interval, parity, adequacy of prenatal care, smoking status, alcohol intake, percentage of village
population that is Alaska Native, mother’s age and education, health care options, piped water, and missing values.
Birth Outcomes and Dumpsites in Alaska Villages 7

high hazard villages also had pregnancies lasting, on aver-age, 1.0 day less than did mothers in the low hazard villages(95 percent CI: �2.0, �0.1).
Average birth weight and gestational length amongAlaska Native women only
There were 7,147 Alaska Native women in this study. Theaverage birth weights of infants born to Alaska Native moth-ers were 3,587.6 g, 3,597.5 g, and 3,545.6 g for mothersfrom low, intermediate, and high hazard villages, respec-tively (table 4). Infants in the high hazard villages weighed,on average, 82.1 g (95 percent CI: �142.4, �21.8 g) lessthan did infants in the low hazard villages and 55.6 g (95percent CI: �142.4, �21.8 g) less than did infants born tomothers from intermediate hazard villages. The gestationallength was 271.8 days for pregnancies in mothers from lowhazard villages, 271.5 days for those from intermediate haz-ard villages, and 269.8 days for those from high hazardvillages. Mothers from high hazard villages had pregnancieslasting, on average, 1.9 days less than did mothers from lowhazard villages (95 percent CI:�3.8,�0.1 days) and 1.8 daysless than did mothers from intermediate hazard villages (95percent CI: �2.2, �0.9 days).
The multivariate analysis revealed the adjusted meanbirth weights as 3,616.6 g, 3,587.8 g, and 3,539.4 g for birthsto mothers from low, intermediate, and high hazard villages,respectively (table 4). Infants born to mothers from highhazard villages weighed, on average, 48.4 g less than didinfants whose mothers were from intermediate hazard vil-lages (95 percent CI:�90.8,�5.9 g) and 77.3 g less than didthose from low hazard villages (95 percent CI: �138.1,�16.6 g). The adjusted mean gestational lengths were271.8 days in low hazard villages, 271.5 days in intermedi-ate hazard villages, and 269.8 days in high hazard villages.Mothers in the high hazard villages had pregnancies that,on average, lasted 1.9 days less than did mothers in inter-mediate hazard villages (95 percent CI: �3.7, �0.1). Moth-ers in the high hazard villages also had pregnancies lasting,on average, 1.7 days less than did mothers in the low hazardvillages (95 percent CI: �3.0, �0.4).
DISCUSSION
This work detected a meaningful increase in risk of lowbirth weight births to mothers who resided in villages withintermediate and high hazard dumpsites compared with vil-lages with low hazard sites. There was also an increase inrisk estimates with a higher level of exposure. Although thisapparent dose response disappeared when adjustment wasmade for gestation, the estimates of risk increased. The riskestimates were higher in the exposed group than in anothersimilarly sized study (4).
There was also a meaningful birth weight reduction de-tected when comparison was made of average birth weightsin infants born to mothers from high, intermediate, and lowhazard villages. There was evidence of dose-response group-ing of birth weights with respect to exposure level. Thesereductions are similar to those found in a comparable study
in California (35). When restricting the analyses of births toAlaska Native women, we found that the reductions in meanbirth weight were greater, although the infants weighedslightly more. However, even the difference in weight be-tween low and high hazard villages would be clinicallysignificant only for the smallest infants, and it was approx-imately one third of the 200-g reduction in weight predictedby smoking during pregnancy (36).
No dumpsite hazard effects were detected for very lowbirth weight babies. Table 3 shows that the covariates asso-ciated with low birth weight were the same as those asso-ciated with very low birth weight, but the effect estimateswere higher in the very low birth weight group. Very lowbirth weight infants comprised less than 1 percent of thestudy population, so any differences across exposure levelsmay have been difficult to detect. Additionally, no informa-tion was available on other potentially confounding vari-ables, such as drug use and maternal health status. Somerisk factors, such as structural abnormalities of reproductiveorgans, may affect the incidence of very low birth weightinfants more than that of moderately low birth weight in-fants (37).
This study also detected no excess risk of preterm births.In fact, births to mothers in intermediate hazard villagesbordered on being protected from preterm birth. Interest-ingly, the 7 percent preterm birth rate was lower than thatreported in Alaska. Other studies detecting decreases in lowbirth weight across environmental exposure levels have notfound differences with respect to very low birth weight orpreterm births (4, 35). The multivariate analysis of the co-variance predicted an approximate 1-day difference in meangestational length when comparison was made of births tomothers residing in high hazard villages with those to moth-ers residing in low hazard villages and 2 days when exam-ining only births to Alaska Native women. This would beclinically significant only in the most premature of infantsand apparently was not enough of a reduction to have aneffect on the incidence of preterm births.
Information about gestation was obtained from the calcu-lated gestation entered on the birth record. This variable isbased on the mothers’ estimate of the date of last mensesand could be subject to reporting errors. Gestation was es-timated in weeks but converted to days for analyses, soa reduction of 1 day should be interpreted cautiously. Riskfactors for preterm birth, such as urogenital infections andplacental abnormalities, were not adjusted for in the analy-ses and could differ across strata as the study populationwas not homogenous.
Women from intermediate and high hazard villageswere more likely to have babies afflicted with IUGR thanwerewomen from low hazard villages. Effect estimates wereslightly higher in babies from intermediate hazard villagesthan in those from high hazard villages. This is similar to thedecreases in length of gestation in the intermediate and highhazard villages compared with low hazard villages and theeffects observed when adjustment was made for gestation inthe low birth weight models. These results contrast with thedose response observed when we examined low birth weightand birth weight reduction. Possible explanations include thedifferent risk factors for low birth weight and preterm birth.
8 Gilbreath and Kass

Perhaps these inconsistencies could be reconciled witha more specific definition of exposure. The assumption be-hind this study was that women living in villages with in-termediate or high hazard dumpsites were all exposed tothese sites via proximity and waste disposal throughout theirpregnancies, although this is impossible to ascertain withthe current study design. Dumpsites were ranked in gener-ally the same time period as the study period, but the qualityof the dumpsites could have been labile. It is not knownwhat proportion of their pregnancies women spent in theirvillages. Women living in isolated villages in Alaska typi-cally spend the last 3–6 weeks in prematernal homes inregional centers that have access to hospitals. Approxi-mately 70 percent of the mothers who lived in high hazardvillages would have left those villages for prematernalhomes during the last portion of their pregnancies. Theseprematernal homes are located in villages that generallyhave lower hazard scores. Birth weight reductions are oftenassociated with factors that occur later in pregnancy (7, 38),although other research demonstrates that first trimester ex-posures can also affect birth weight (39).
Covariates were distributed differently throughout expo-sure levels. Hazard categories could have been surrogates forother factors affecting birth weight. For example, importantrisk factors such as underlying health conditions and occu-pational exposures were not adjusted for in the analyses.Another concern is that studies performed in other stateshave found that birth record information often does not cor-relate with information on patients’ medical records (40, 41).
Future studies examining the potential health effectsassociated with open dumpsites in Alaska Native villagesshould includemeasurements that are more precise in nature.Misclassification errors are inherent in studies with crudeexposure measurements. Several contaminants identified inand proximal to individual dumpsites (arsenic, lead, methylmercury, and several petroleum hydrocarbons) are associ-ated with negative birth outcomes (7, 42, 43). During exam-ination of the health effects associated with environmentalexposures from hazardous waste sites, it is always prefera-ble, although rarely possible, to identify direct pathways ofexposure. Other birth outcome studies with well-definedexposure routes have found more convincing associations(3, 5). Reproductive outcomes can be sensitive indicatorsof environmental insults, as the reproductive system oftenfails before other systems (7, 11, 44). The most importantaspect of this study is that it is the first to attempt to charac-terize the relation of these adverse pregnancy outcomesamong residents ofAlaskaNativevillages to open dumpsites.
ACKNOWLEDGMENTS
The authors would like to acknowledge Phillip Mitchellof the Alaska Bureau of Vital Statistics for providing birthrecord data, the Central Council of Tlingit and Haida IndianTribes of Alaska and the Alaska Native Tribal HealthConsortium for exposure information, and Zender Environ-mental Science and Planning Services.
Conflict of interest: none declared.
REFERENCES
1. Nordstrom S, Beckman L, Nordenson I. Occupational andenvironmental risks in and around a smelter in northern Swe-den. I. Variations in birth weight. Hereditas 1978;88:43–6.
2. Nordstrom S, Beckman L, Nordenson I. Occupational andenvironmental risks in and around a smelter in northern Swe-den. V. Spontaneous abortion among female employees anddecreased birth weight in their offspring. Hereditas 1979;90:291–6.
3. Vianna NJ, Polan AK. Incidence of low birth weight amongLove Canal residents. Science 1984;226:1217–19.
4. Goldberg MS, Goulet L, Riberdy H, et al. Low birth weightand preterm births among infants born to women living neara municipal solid waste landfill site in Montreal, Quebec.Environ Res 1995;69:37–50.
5. Berry M, Bove F. Birth weight reduction associated withresidence near a hazardous waste landfill. Environ HealthPerspect 1997;105:856–61.
6. Savitz DA, Bornschein RL, Amler RW, et al. Assessment ofreproductive disorders and birth defects in communities nearhazardous chemical sites. I. Birth defects and developmentaldisorders. Reprod Toxicol 1997;11:223–30.
7. Elliott P, Briggs D, Morris S, et al. Risk of adverse birth out-comes in populations living near landfill sites. BMJ 2001;323:363–8.
8. Amler RW. Assessment of reproductive disorders and birthdefects in communities near hazardous chemical sites: intro-duction. Reprod Toxicol 1997;11:221–2.
9. Bianchi F. Hazardous waste sites and reproductive health:a critical review. Presented at the 28th Conference of theEuropean Teratology Society, Ferrara, Italy, September 11–14,2000.
10. Johnson BL. A review of the effects of hazardous waste onreproductive health. Am J Obstet Gynecol 1999;181:S12–16.
11. Kipen HM. Assessment of reproductive health effects ofhazardous waste. Toxicol Ind Health 1996;12:211–24.
12. Newill VA. The susceptibility of the fetus and child to chem-ical pollutants. Nature and sources of pollutants. Pediatrics1974;53:785–8.
13. National Research Council. Environmental epidemiology.Vol 1. Public health and hazardous wastes. Washington, DC:National Academy of Sciences, 1991.
14. World Health Organization. Monitoring reproductive health:selecting a short list of national and global indicators. Geneva,Switzerland: World Health Organization Department ofReproductive Health and Research, 1999.
15. Mitchell P. Low birth weight births, 1990–1998. Alaska VitalSigns 1999;7:1–9.
16. Schoellhorn J, Wiens HN, Perham-Hester K. Alaska maternaland child health data book 2003. Anchorage, AK: Maternaland Child Health Epidemiology Unit, Section of MaternalChild and Family Health, Division of Public Health, Depart-ment of Health and Social Services, 2003.
17. US Census Bureau. Census 2000 summary file 1. Washington,DC: Bureau of the Census, 2002.
18. Crondahl J. Alaska Bureau of Vital Statistics 1997 annual re-port. Juneau, AK: Department of Health and Social Services,1998.
19. Association of Village Council Presidents. Solid solutionsin rural Alaska. Anchorage, AK: Environmental ProtectionAgency Tribal Program, 1996.
20. Indian Health Service. Report on the status of open dumpson Indian lands: 1998 report. Rockville, MD: IndianHealth Service, 1998. (http://www.oehe.ihs.gov/Solid_W/1998_ODReport/1998OpenDumpsReport.pdf).
Birth Outcomes and Dumpsites in Alaska Villages 9

21. Zender LE. Solid waste management on Indian reservations:limitations of conventional solid waste management engi-neering. (Dissertation). Davis, CA: University of California,1999:238.
22. Zender LE, Sebalo S, Gilbreath S. Conditions, risks, andcontributing factors in Alaska Native villages: a discussionwith case study. Presented at the Eighth Annual Alaska Waterand Wastewater Management Association Research and De-velopment Conference on Rural Sanitation, Fairbanks, Alaska,April 22, 2003.
23. Duffy LK, Rodgers T, Patton M. Regional health assessmentrelating to mercury content of fish caught in the Yukon-Kuskokwim Delta rivers system. Alaska Med 1998;40:75–7,89. Erratum in: Alaska Med 1999;41:15.
24. Egeland GM, Ponce RA, Middaugh JP. A public health per-spective on the evaluation of subsistence food safety. Int JCircumpolar Health 1998;57(suppl 1):572–5.
25. The Governor’s Council on Rural Sanitation. Rural sanitation2005 action plan. In: Healthy Alaskans 2010 Project. Vol III.Plans, references and acronyms. Juneau, AK: Director’sOffice, Division of Public Health, 1998. (http://www.hss.state.ak.us/dph/targets/ha2010/volume3/summaries/rural_san.htm).
26. Office of Technology Assessment. An Alaskan challenge:Native village sanitation. Washington, DC: US GovernmentPrinting Office, 1994. (http://govinfo.library.unt.edu/ota/Ota_1/DATA/1994/9401.PDF).
27. Zender L, Tchobanoglous G. Manual for assessment of opendumping on Indian lands. Portland, OR: Bureau of IndianAffairs, 1996.
28. Kiely JL, Brett KM, Yu S, et al. Low birth weight and intra-uterine growth retardation. In: Wilcox LS, Marks JS, eds. Fromdata to action: CDC’s public health surveillance for women,infants, and children. Atlanta, GA: Centers for Disease Controland Prevention, 1994. (http://www.cdc.gov/reproductivehealth/Products&Pubs/DatatoAction/pdf/birout3.pdf).
29. State of Alaska Department of Commerce, Community, andEconomic Development. Community database online. An-chorage, AK: Division of Community Advocacy, 2004. (http://www.dced.state.ak.us/dca/commdb/CF_COMDB.htm).
30. Breslow NE, Day NE, eds. Statistical methods in cancer re-search. Vol II. The design and analysis of cohort studies. Lyon,France: International Agency for Research on Cancer, 1987.(IARC scientific publication no. 82).
31. Christensen R. Log-linear models and logistic regression. NewYork, NY: Springer-Verlag, 1997.
32. Rothman KJ, Greenland S. Modern epidemiology. Philadel-phia, PA: Lippincott-Raven, 1998.
33. Kessner DM, Singer J, Kalk CE, et al. Infant death: an analysisby maternal risk and health care. In: Contrasts in health status.Washington, DC: National Academy Press, 1973.
34. Cohen J, Cohen P. Applied multiple regression/correlationanalysis for the behavioral scientist. New York, NY: Erlbaum,1983.
35. Kharrazi M, Von Behren J, SmithM, et al. A community-basedstudy of adverse pregnancy outcomes near a large hazardouswaste landfill in California. Toxicol Ind Health 1997;13:299–310.
36. Office of the Surgeon General. The health benefits of smokingcessation: a report of the Surgeon General. Rockville, MD:Office on Smoking and Health, US Public Health Service,1990. (DHHS publication no. (CDC) 90-8416) (http://profiles.nlm.nih.gov/NN/B/B/C/T/).
37. Newton ER. Preterm labor. eMedicine J [serial online] 2001.(http://www.emedicine.com/med/topic3245.htm).
38. Shaw GM, Schulman J, Frisch JD, et al. Congenital malfor-mations and birthweight in areas with potential environmentalcontamination. Arch Environ Health 1992;47:147–54.
39. Smith GC, Smith MF, McNayMB, et al. First-trimester growthand the risk of low birth weight. N Engl J Med 1998;339:1817–22.
40. Adams M. Validity of birth certificate data for the outcomeof the previous pregnancy. Am J Epidemiol 2001;154:883–8.
41. Gore DC, Chez RA, Remmel RJ, et al. Unreliable medicalinformation on birth certificates. J Reprod Med 2002;47:297–302.
42. Vrijheid M, Dolk H, Armstrong B, et al. Hazard potentialranking of hazardous waste landfill sites and risk of congenitalanomalies. Occup Environ Med 2002;59:768–76.
43. Lybarger JA, Spengler RF, Campolucci S, et al. Humanhealth studies of exposures to hazardous substances: approachand future directions. Environ Epidemiol Toxicol 2000;2:194–200.
44. Vrijheid M, Dolk H, Armstrong B, et al. Chromosomal con-genital anomalies and residence near hazardous waste landfillsites. Lancet 2002;359:320–2.
APPENDIX TABLE 1. Guidelines from the Indian Health Service for classifying the possible threat to health and the environment
posed by the solid waste site*
Hazard point factors High factors Moderate factors Low factors
Contents Site waste content � 2%hazardous waste by volume(30 points)
Site waste content containsspecial wastes (<2%hazardous waste by volume)(15 points)
Site waste content containsmunicipal waste only
Rainfall High rainfall (>25 inchesy peryear) (4 points)
Medium rainfall (25–10 inchesper year) (2 points)
Low rainfall (<10 inches year)
Distance to drinking water aquifer �50 feety (30 points) 51–100 feet (10 points) >600 feet
101–200 feet (8 points)
201–600 feet (4 points)
Site drainage Site drainage increases thelikelihood of ground or surfacewater contamination (8 points)
Effects of moderate drainage,limited ponding, and drainageare largely neutral (2 points)
Site drainage contributes toprotection of ground orsurface water
Potential to create leachateat site
High probability (4 points) Moderate probability (2 points) Low probability
Table continues
10 Gilbreath and Kass

APPENDIX TABLE 1. Continued
Hazard point factors High factors Moderate factors Low factors
Distance to domestic watersource
<1,000 feet (4 points) 1,000–5,000 feet (2 points) >5,000 feet
Site accessibility Unrestricted access withresidences nearby (<1 miley)(4 points)
Unrestricted access but remotefrom population (2 points)
Restricted, controlled access
Frequency of burning Frequent burning (weekly)(4 points)
Infrequent burning (monthly)(2 points)
Burning never occurs
Site materials’ exposure to publicand vectors
Surface materials, no cover,scavenging by public (4 points)
Materials in open trenches,limited scavenging (2 points)
Materials covered, noscavenging
Degree of public concern oversite aesthetics
Frequent expressions of publicconcern over site (4 points)
Little public concern, governmentawareness only (2 points)
No concern expressed by anyentity
Hazard score Points total 30 or more (high) Points total 14–29 (intermediate) Points total 13 or less (low)
* Based on the Report on the Status of Open Dumps on Indian Lands: 1998 Report (20).
yMetric equivalents: 1 inch ¼ 2.54 cm; 1 foot ¼ 30.48 cm; 1 mile ¼ 1.61 km.
Birth Outcomes and Dumpsites in Alaska Villages 11

133International Journal of Circumpolar Health 65:2 2006
ORIGINAL RESEARCH
FETAL AND NEONATAL DEATHS AND CONGENITAL ANOMALIES ASSOCIATED WITH OPEN DUMPSITES IN ALASKA NATIVE VILLAGES
Susan Gilbreath, Philip H. Kass
Department of Population Health and Reproduction, University of California, Davis, USA
Received 15 November 2005; Accepted 8 February 2006
ABSTRACT
Objective. To determine if women living in Alaska Native villages with open dumpsites ranked
as higher hazard have higher rates of adverse pregnancy outcomes than women living in villages
with sites that have lower hazard rankings. Adverse pregnancy outcomes examined included fetal
and neonatal death and congenital anomalies.
Study Design. A population-based retrospective cohort study.
Methods. Birth records from 1997-2001 were used to identify the 10 360 eligible infants born
to mothers who resided in 197 Alaska Native villages with dumpsite rankings. Exposure vari-
ables were derived from hazard rankings of dumpsites. Covariates were obtained from both birth
certificate information and village-specific characteristics.
Results. Neither crude, nor adjusted estimates detected a statistically significant difference in
rates between exposure levels, although adjusted estimates were positive in all congenital anomaly
categories, except gastrointestinal defects. Infants born to mothers residing in villages with high
hazard dumpsite contents were more likely (RR=4.27; 95% CI: 1.76, 10.36) to have anomalies
classified as other defects. Other hazard factors were not significant predictors for any of the
adverse outcomes examined.
Conclusions. This is the first study to evaluate fetal and neonatal deaths and congenital anomalies
associated with open dumpsites in Alaska Native villages. Problems with the study include a popu-
lation-based exposure measurement, small sample size, and biases related to birth record informa-
tion. Future studies should include more comprehensive registries of congenital anomalies.
(Int J Circumpolar Health 2006;65(2):133-147.)
Keywords: Alaska Native, dumpsites, hazardous waste, neonatal death, stillbirth, congenital
anomalies

134 International Journal of Circumpolar Health 65:2 2006
ORIGINAL RESEARCH
INTRODUCTION
Alaska has diverse cultures, severe tempera-
tures, vast landscapes, and sparse local
populations, which can affect public health.
The U.S. Census 2000 reported that Alaska
had 626 932 residents, 119 241 of whom
were Alaska Native (AN). In this work, AN
includes any people indigenous to the Western
Hemisphere: Alaska Native, Native mixed,
Aleut, Eskimo, Canadian Eskimo and Indian,
and American Indian. Many of these ANs
are dispersed throughout federally recog-
nized tribal villages. Solid waste management
(SWM) is severely deficient in many of these
remote villages, comparable to what is found
in developing countries (1,2). Over 95 percent
of AN villages use open dumpsites for solid
waste disposal. An open dumpsite is a solid
waste site that is not maintained, is unlined,
contains uncovered wastes, and with generally
no marked perimeter and open access (1).
The Alaska Native Tribal Health Consor-
tium (ANTHC) ranks dumpsites based on
hazard point factors that include: dumpsite
waste contents, average rainfall, distance to
drinking water aquifer and domestic water
source, site drainage, potential to create
leachate at site, accessibility and exposure to
the public and vectors, frequency of burning,
and degree of public concern over the site
(2). Of the 177 villages that have been scored
by ANTHC, 70 percent have been scored as
high hazard, 25 percent as moderate hazard,
and 5 percent as low hazard. Without access
to alternatives, all waste that is generated in
villages is discarded at the dumpsite, including
unknown quantities of hazardous waste from
households and industry. The Alaska Depart-
ment of Environmental Conservation (ADEC)
reports that the dumpsites include household
waste, as well as some commercial, construc-
tion and demolition waste (3). Open dumping
can present an environmental and health
threat through water and soil contamination,
disease transmission, fire danger, and injury
to site salvagers (4). In an attempt to reduce
waste volume and visual blight, dump fires
are set, or non-separated wastes are burned
in metal containers (i.e. “burn boxes”), in
approximately 75 percent of villages (5).
In 1997, over 45 percent of Alaska villages
did not have running water in their homes,
and inhabitants must haul their wastewater
in “honeybuckets”, because the tundra makes
the construction of latrines impractical (6).
Human wastes are often discarded at, or
near, open dumps, thereby increasing risks
of exposure to pathogens when disposing
of trash (6-8). Villagers hauling their solid
wastes, site salvagers, children, and house-
hold pets frequent dumpsites. Many ANs
have subsistence diets and there are concerns
about contaminants getting into food and
water supplies (9, 10).
Increased risks of adverse pregnancy
outcomes have been reported near some indi-
vidual landfill sites and in multi-site studies
(11-15). However, these studies have never
been performed in rural Alaska. Fetal and
neonatal deaths and congenital anomalies
(along with other reproductive outcomes)
are considered to be sensitive indicators of
potential health threats from environmental
hazards (14,16-22). These outcomes were
selected because they are associated with
reproductive health (22) and are readily avail-
able through records.
Alaska has a lower neonatal mortality rate
compared to the rest of the United States, but

135International Journal of Circumpolar Health 65:2 2006
ORIGINAL RESEARCH
the AN rate is higher than the rest of Alaska
(23). The AN fetal mortality rate is lower than
the rate of other Alaskans, but the congenital
anomaly rate is higher for ANs (23). No study
has examined differences in mortality rates and
congenital anomalies for Natives in relation to
potential hazards from open dumpsites.
Fetal and neonatal mortality rates and
the incidence of congenital anomalies were
selected to evaluate potential environmental
hazards posed by these dumpsites. This was
a population-based study that utilized a retro-
spective cohort design for the years 1997-2001.
The purpose of the study was to determine if
women living in villages with open dumpsites
that have higher hazard rankings would have
a higher incidence of these adverse pregnancy
outcomes than women living in villages with
sites that have lower hazard rankings. We also
examined whether the three factors that make
up the majority of a dumpsite score (dumpsite
contents, distance to drinking water aquifer,
and site drainage) were individually associ-
ated with the adverse pregnancy outcomes.
MATERIAL AND METHODS
Birth records were obtained from the Alaska
Bureau of Vital Statistics for all births to
women living in federally recognized Native
villages for the period 1997-2001. It is esti-
mated that over 97 percent of births and 99
percent of deaths are entered electronically
(24). Eligible pregnancies were those coded as
lasting at least 20 weeks, resulting in singleton
births, whose mothers’ residences were listed
as Native villages. Additionally, the women
had to reside in villages for which there
existed an evaluation of the hazard potential
of the community dumpsite(s). There were 10
360 births in 197 villages determined to be
eligible. Birth outcomes of interest included:
fetal death (defined in Alaska as occurring
in a pregnancy where the last menstrual date
subtracted from the date of delivery is at least
20 weeks (23), neonatal death (death to live-
born infants less than 28 days of age), and
congenital anomalies. Neonatal deaths that
were successfully linked with birth files were
included (greater than 98 percent of deaths
were linked with birth records by the Alaska
Bureau of Vital Statistics). Only when a birth
and a death both occurred within the state of
Alaska, and were entered electronically, was it
possible to link records. Neonatal deaths were
coded to the ICD-9 (international classifica-
tion of diseases, ninth revision) for deaths in
1997 and 1998, and to the ICD-10 thereafter.
Neonatal deaths resulting from unintentional
injuries were excluded. Cause of death for fetal
deaths is not specified on Alaskan fetal death
certificates, so fetal deaths that resulted from
maternal trauma and injuries could not be
excluded. Observable congenital anomalies are
coded into 22 categories (including no defects
and other defects) in Alaskan birth records.
For analytic purposes, these anomalies were
placed into five broader categories according
to anatomic similarity. Central nervous system
anomalies included: anencephalus, spina bifida
or meningocele, hydrocephalus, microceph-
alus, and other central nervous system defects.
Circulatory and respiratory anomalies included
all heart malformations and other circula-
tory or respiratory defects. Gastrointestinal
anomalies included: rectal atresia/stenosis,
tracheo-esophageal fistula/esophageal atresia,
omphalocele/gastroschisis, and other gastroin-
testinal defects. Urogenital anomalies include

136 International Journal of Circumpolar Health 65:2 2006
ORIGINAL RESEARCH
malformed genitalia, renal agenesis, and other
urogenital anomalies. Musculoskeletal and
integumental anomalies include cleft lip and
palate, polydactyly/syndactyly/adactyly, club-
foot, diaphragmatic hernia, and other muscu-
loskeletal or integumental defects. Anomalies
classified as chromosomal were not examined,
unless other defects were indicated on the
birth record.
Exposure information was the hazard
ranking of the dumpsite of the village indicated
on the birth certificate as the mother’s resi-
dence. Exposure information was ecological,
because it was not known that women expe-
rienced all, or any part, of their pregnancies
in the village of their residence. Dump scores
were categorized by ANTHC into high, inter-
mediate, and low hazard potential to health
and environment. During the time period of
the study, 159 of the villages’ dumpsites had
been scored, with 17 other sites being ranked
as either: high, intermediate, or low hazard.
Because of small numbers, intermediate and
low hazard ranked villages were collapsed
into a lower hazard category. An additional
21 sites were ranked on the same hazard point
factors as above, using data from the Central
Council of Tlingit and Haida Indian Tribes of
Alaska (CCTHITA) solid waste management
database.
Site contents, the distance of the site to a
drinking water aquifer, and site drainage
are the factors that weighed most heavily in
calculated hazard rankings (2). The ranking
system scored dumpsites that contained
greater than two percent hazardous waste
highest on content factors, sites that contained
special waste moderate scores, while sites that
contained only municipal waste did not affect
the overall hazard ranking. Sites that were less
than 50 feet from a drinking water aquifer
score maximum points in that category, sites
within 51 to 600 feet of an aquifer were given
moderate scores, while sites that were greater
than 600 feet from aquifers did not affect
scores. Site drainage that increased the likeli-
hood of ground or surface water contamina-
tion was considered a high factor, sites that
had moderate drainage, limited ponding, or
neutral effects, were considered moderate
factors. When dumpsite drainage contributed
to the protection of ground or surface water,
no points were added to the overall hazard
ranking for the site drainage category (2).
These factors were used as additional exposure
information for the pregnancies occurring in
the 180 villages that had detailed hazard point
factor rankings.
Covariate information was obtained from
birth records and included gender, parity,
adequacy of prenatal care, smoking status,
alcohol intake, race, mother’s age, and moth-
er’s education, year of birth, gestation, and
birth weight.
More information on the mothers’ residence
villages was obtained from the state of Alaska
Community Database (25). This included
average family household size and income,
percent of population Native, percent of popu-
lation in poverty, the population of the village
in the year 2000, and the land area of the
village in square miles. Additionally, informa-
tion was gathered on whether the whole village
had piped water, part of the village had piped
water, or none of the homes in the village were
plumbed. Villages were also categorized into
those that were isolated with restricted health-
care options, villages with qualified emer-
gency care centers, and regional centers with
a qualified acute care facility. Distributions

137International Journal of Circumpolar Health 65:2 2006
ORIGINAL RESEARCH
of the number and percent of births for each
covariate in lower and higher potential hazard
villages were calculated to determine if these
covariates were approximately equally distrib-
uted across each exposure category (Table I).
The same distributions were calculated for the
subset of pregnancies that occurred in villages
with specific exposure information on dump-
site contents, distance from a drinking water
aquifer, and site drainage (Table II). Per agree-
ment with the Alaska Bureau of Vital Statis-
tics, cells in tables with less than five observa-
tions are not displayed.
Data analysis
Chi-square tests were used to determine if the
distribution of covariates was homogeneous
across exposure groups. Fisher’s exact tests
were used when expected cell counts were less
than five. These tests were performed with all
data, and then again with the subset of data
with detailed hazard potential information.
Crude incidence rate ratios (RR) and 95
percent confidence intervals (95% CI) were
calculated for the effect of hazard ranking
on each separate birth outcome and on all
deaths combined and all congenital anomalies
combined. Fetal deaths were excluded from
the analyses for neonatal deaths, and neonatal
deaths were excluded from analyses of fetal
deaths. We tested homogeneity of the rate ratio
across strata of year of incidence and confirmed
the assumption of homogeneity by examining a
plot of standardized residuals (26).
Poisson regression (26) was used to model
the natural log of the incidence rates of deaths
and congenital anomalies as linear combi-
nations of the risk factors and covariates.
Adjusted incidence rate ratios and 95 percent
confidence intervals were calculated to quan-
tify the relationships between the hazard
potential of villages and occurrences of all
deaths, fetal and neonatal deaths, all congenital
anomalies, five anatomic categories of defects,
other defects, and multiple defects. Multiple
anomalies were counted under each outcome
and counted only once for the outcome of all
congenital anomalies combined.
Information on gender (female versus male),
parity (one or two previous pregnancies, three
or more previous pregnancies, and unknown),
adequacy of prenatal care, smoking status
(did not smoke, smoked during pregnancy,
and unknown), alcohol intake (did not drink,
drank during pregnancy, and unknown), race
(Caucasian, unknown and other, and Native),
mother’s age (under 20, 20 through 39, and 40
or more years), mother’s education (less than 11
years, 12 years, and more than 12 years), gesta-
tion and birth weight (in one variable), year of
birth, village healthcare options (restricted,
qualified emergency care center, and qualified
acute care facility), and village water hookup
(no households plumbed, some household
plumbed, and no households plumbed) were
used in models. The Kessner Index (27) is a
classification scheme of adequacy of prenatal
care that accounts for the gestational month
in which prenatal care began and the number
of prenatal visits with respect to the length of
gestation. The Kessner Index was used to define
the adequacy of prenatal care into categories
of adequate, intermediate, inadequate, and
unknown. The gestation/birth weight variable
was classified into four categories: term birth,
not low birth weight; preterm birth, not low
birth weight; preterm birth, low birth weight;
and insufficient information/ missing value.
Preterm birth was defined as gestation lasting

138 International Journal of Circumpolar Health 65:2 2006
ORIGINAL RESEARCH
less than 37 weeks, and low birth weight was
defined as less than 2500 grams.
All analyses were performed again, exam-
ining the subset of data that had complete
information for hazard point factors. The
three factors weighted the most in calculating
dump scores were used individually as predic-
tors for each outcome of interest. Villages that
received the maximum score on site contents
were categorized as “high” and contrasted
against those that received the median score
(categorized as moderate). Only two villages
representing 56 pregnancies received a “low”
score on contents, so these pregnancies were
excluded from analyses. In the next series of
models, distance to a drinking water aquifer
was categorized as within 50 feet, 50 to 600
feet, and greater than 600 feet. In the last series
of models, dumpsites receiving maximum
scores for site drainage were categorized as
“high”, those receiving median scores were
“moderate”, and those receiving no points
were “low”.
RESULTS
Chi-square tests revealed that the distribu-
tions of gender and year of birth were roughly
equal between exposure levels (Table I).
There were wide disparities (p < 0.001) in
the distribution of parity, quality of prenatal
care, cigarette and alcohol use, race, maternal
age, maternal education level, birth weight
and gestation, type of healthcare, and water
hookup to households (Table I). Mothers in
villages with low hazard ranked dumpsites
tended to have had fewer previous pregnan-
cies, better prenatal care, smoked and drank
less frequently, were more frequently Cauca-
sian, completed more years of education,
had fewer low birth weight and/or preterm
births, more often had access to acute care
medical facilities, and were more likely to
have households in their villages completely
plumbed, compared to mothers from villages
with higher hazard ranked dumpsites. Other
village level covariates are not displayed, as
they were not used in any analyses, because,
after adjusting for other factors listed on the
birth certificate, these factors did not add any
additional information to the model.
When examining the subset of villages
with detailed hazard information, chi-square
tests revealed the distributions of gender,
quality of prenatal care, reported cigarette
use during pregnancy, and year of birth,
were roughly equal between exposure levels
(Table II). Parity (p = 0.03), alcohol use (p
= 0.04), maternal education (p = 0.05), and
birth weight and gestation (p = 0.03) were less
evenly distributed. There were wide dispari-
ties (p < 0.001) in the distribution of race,
maternal age, type of healthcare, and water
hookup to households (Table II). Mothers
from villages with high hazard ranked dump-
sites were more often Native, more likely to
have qualified emergency care facilities rather
than acute care hospital facilities in their
villages, and more likely to have households
either all plumbed, or not plumbed in their
villages, than the mothers from villages with
low hazard ranked dumpsites.
As the incidences of all outcomes were
homogeneous throughout the study period,
incidence rates for the entire study period are
presented (Table III). The overall mortality
rate (fetal and neonatal deaths combined) for
the 10 360 infants born between 1997 and
2001 and included in the analyses, was 7.7

139International Journal of Circumpolar Health 65:2 2006
ORIGINAL RESEARCH
Table I. The distribution and chi-square results of individual maternal and village level characteristics across villages with lower and higher hazard potential dumpsites, Alaska, 1997-2001.Covariates Lower hazard dumpsite Higher hazard dumpsite (n = 5774) (n = 4586) Number Percent Number Percent p-valueMaternal characteristicsGender of infant 0.41 Male 3031 52.5 2370 51.7 Female 2743 47.5 2216 48.3Parity <0.001 1 or 2 previous pregnancies 2327 40.3 1588 34.6 0 previous pregnancies 1432 24.8 1053 23.0 3 or more previous pregnancies 1998 34.6 1925 42.0 Missing 17 0.3 20 0.4Quality of prenatal care <0.001 Adequate 3278 56.8 1731 37.7 Intermediate 1665 28.8 1798 39.2 Inadequate 633 11.0 934 20.4 Missing 198 3.4 123 2.7Cigarette use during pregnancy <0.001 Did not report smoking 4189 72.5 3117 68.0 Reported smoking 1560 27.0 1444 31.5 Missing 25 0.4 25 0.5Alcohol use during pregnancy 0.001 Did not report drinking 5418 93.8 4224 92.1 Reported drinking 316 5.5 332 7.2 Missing 40 0.7 30 0.7Race 0.001 Caucasian 2329 40.3 383 8.4 Not reported or other 240 4.2 55 1.2 Alaska Native 3205 55.5 4148 90.4Maternal Age <0.001 <20 years 777 13.5 785 17.1 20-39 years 4837 83.8 3691 80.5 40+ years 160 2.8 110 2.4Maternal education <0.001 More than 12 years 1808 31.3 626 13.7 12 years 2697 46.7 2846 62.1 Less than 12 years 1115 19.3 974 21.2 Missing 154 2.7 140 3.1Birth weight and gestation <0.001 Not low birth weight/term birth 5319 92.2 4101 89.5 Not low birth weight/preterm birth 236 4.1 265 5.8 Low birth weight/term birth 54 0.9 51 1.1 Low birth weight/preterm birth 140 2.4 146 3.2 Missing 20 0.3 19 0.4Year of birth 0.61 1997 1154 20.0 967 21.1 1998 1161 20.1 923 20.1 1999 1160 20.1 930 20.3 2000 1148 19.9 887 19.3 2001 1151 19.9 879 19.2Village level characteristicsAvailable healthcare in village <0.001 Qualified acute care facility 4303 74.5 136 3.0 Qualified emergency care center 405 7.0 992 21.6 Restricted healthcare options 1066 18.5 3458 75.4Piped water to households in village <0.001 All households plumbed 3861 66.9 1127 24.6 Some households plumbed 1509 26.1 1743 38.0 No households plumbed 404 7.0 1716 37.4

140 International Journal of Circumpolar Health 65:2 2006
ORIGINAL RESEARCH
Table II. The distribution and chi-square results of individual maternal and village level characteristics across the subset of villages with detailed hazard score information with lower and higher hazard potential dumpsites, Alaska, 1997-2001.Covariates Lower hazard dumpsite Higher hazard dumpsite (n = 966) (n = 4462) Number Percent Number Percent p-valueMaternal characteristicsGender of infant 0.85 Male 503 52.1 2308 51.7 Female 463 47.9 2154 48.3Parity 0.03 1 or 2 previous pregnancies 366 37.9 1536 34.4 0 previous pregnancies 198 20.5 1021 22.9 3 or more previous pregnancies 402 41.6 1885 42.2 Missing * 20 0.4Quality of prenatal care 0.16 Adequate 358 37.1 1690 37.9 Intermediate 402 41.6 1748 39.2 Inadequate 172 17.8 901 20.2 Missing 34 3.5 123 2.8Cigarette use during pregnancy 0.18 Did not report smoking 631 65.3 3052 68.4 Reported smoking 329 34.1 1386 31.1 Missing 6 0.6 24 0.5Alcohol use during pregnancy 0.04 Did not report drinking 901 93.3 4104 92.0 Reported drinking 54 5.6 329 7.4 Missing 11 1.1 29 0.6Race 0.001 Caucasian 117 12.1 373 8.4 Not reported or other 8 0.8 52 1.2 Alaska Native 841 87.1 4037 90.5Maternal Age 0.65 <20 years 153 15.8 760 17.0 20-39 years 788 81.6 3593 80.5 40+ years 25 2.6 109 2.4Maternal education 0.05 More than 12 years 119 12.3 610 13.7 12 years 570 59.0 2763 61.9 Less than 12 years 240 24.8 952 21.3 Missing 37 3.8 137 3.1Birth weight and gestation 0.03 Not low birth weight/term birth 897 92.9 3990 89.4 Not low birth weight/preterm birth 37 3.8 257 5.8 Low birth weight/term birth 9 0.9 50 1.1 Low birth weight/preterm birth 21 2.2 142 3.2 Missing * 23 0.5Year of birth 0.49 1997 194 20.1 937 21.0 1998 209 21.6 902 20.2 1999 177 18.3 907 20.3 2000 186 19.3 850 19.0 2001 200 20.7 866 19.4Village level characteristicsAvailable healthcare in village <0.001 Qualified acute care facility 118 12.2 136 3.0 Qualified emergency care center 89 9.2 973 21.8 Restricted healthcare options 759 78.6 3353 75.1Piped water to households in village <0.001 All households plumbed 126 13.0 1127 25.3 Some households plumbed 548 56.7 1743 39.1 No households plumbed 292 30.2 1592 35.7* Cell value less than 5

141International Journal of Circumpolar Health 65:2 2006
ORIGINAL RESEARCH
Table III. Incidence rates of neonatal and fetal deaths and congenital anomalies, in 197 Alaska Native villages, 1997-2001Outcome Outcome Number of Incidence present pregnancies (per 1000 births)Deaths All 80 10360 7.7 Fetal 47 10327 4.6 Neonatal 33 10313 3.2Congenital Anomalies All 261 10360 25.2 Central nervous system 15 10360 1.4 Circulatory/respiratory 23 10360 2.2 Urogenital 23 10360 2.2Musculoskeletal/integumental 82 10360 7.9Other 123 10360 11.9Multiple 19 10360 1.8
Table IV. Crude and adjusted rate ratios and 95% confidence intervals describing the relationships between lower and higher hazard exposure categories and incidence of fetal and neonatal death and congenital anomalies, Alaska, 1997-2001.Outcome Outcome Number Rate Rate ratio Rate ratio present per 1000 crude (95% CI) adjusted † (95% CI)DeathsAll deaths (n = 10360) Lower hazard dumpsite 44 5774 7.6 1.00 1.00 Higher hazard dumpsite 36 4586 7.9 1.03 (0.66, 1.60) 0.65 (0.34, 1.27)Fetal (n = 10327) Lower hazard dumpsite 28 5758 4.9 1.00 1.00 Higher hazard dumpsite 19 4569 4.2 0.85 (0.48, 1.53) 0.75 (0.28, 1.99)Neonatal (n = 10313) Lower hazard dumpsite 16 5746 2.8 1.00 1.00 Higher hazard dumpsite 17 4567 3.7 1.34 (0.68, 2.65) 0.55 (0.22, 1.38)Congenital AnomaliesAll (n = 10360) Lower hazard dumpsite 142 5774 24.6 1.00 1.00 Higher hazard dumpsite 119 4586 26.0 1.06 (0.83, 1.35) 1.37 (0.92, 2.04)Central nervous system Lower hazard dumpsite 6 5774 1.0 1.00 1.00 Higher hazard dumpsite 9 4586 2.0 1.89 (0.67, 5.31) 2.36 (0.37, 14.71)Circulatory/respiratory Lower hazard dumpsite 12 5774 2.1 1.00 1.00 Higher hazard dumpsite 11 4586 2.4 1.17 (0.51, 2.64) 1.42 (0.39, 5.42)Gastrointestinal Lower hazard dumpsite a 5774 1.00 1.00 Higher hazard dumpsite 6 4586 1.3 1.88 (0.53, 6.65) 0.58 (0.14, 2.40)Urogenital Lower hazard dumpsite 10 5774 1.7 1.00 1.00 Higher hazard dumpsite 13 4586 2.8 1.64 (0.72, 3.73) 2.71 (0.67, 10.95)Musculoskeletal/integumental Lower hazard dumpsite 41 5774 7.1 1.00 1.00 Higher hazard dumpsite 41 4586 8.9 1.26 (0.81, 1.94) 1.61 (0.79, 3.29)Other Lower hazard dumpsite 71 5774 12.3 1.00 1.00 Higher hazard dumpsite 52 4586 11.3 0.92 (0.65, 1.32) 1.38 (0.77, 2.39)Multiple Lower hazard dumpsite 9 5774 1.6 1.00 1.00 Higher hazard dumpsite 10 4586 2.2 1.40 (0.57, 3.44) 1.33 (0.34, 5.20)† Adjusted for gender, interpregnancy interval, parity, adequacy of prenatal care, smoking status, alcohol intake, race, mother’s age and education, healthcare options, piped water, and missing values.a Cell value less than 5

142 International Journal of Circumpolar Health 65:2 2006
ORIGINAL RESEARCH
Table V. Crude and adjusted rate ratios and 95% confidence intervals describing the relationships between site contents, distance from site to drinking water aquifers, and site drainage with incidence of fetal and neonatal death and congenital anomalies, Alaska, 1997-2001.Models Outcome Number Rate Rate ratio Rate ratio present per 1000 crude (95% CI) adjusted † (95% CI)
All deaths (n = 5428) Site contents (moderate) 38 5214 7.3 1.00 Site contents (high) a 12.7 1.74 (0.42, 7.20) 2.04 (0.48, 8.57) Distance to aquifer >600 ft 26 3892 6.7 1.00 Distance to aquifer 50-600 ft 9 1011 8.9 1.33 (0.62, 2.84) 1.28 (0.59, 2.79) Distance to aquifer <50 ft 5 525 9.5 1.43 (0.55, 3.71) 1.09 (0.41, 2.93) Site drainage (low) a 7.1 1.00 Site drainage (moderate) 26 3541 7.3 1.03 (0.21, 4.40) 0.95 (0.21, 4.40) Site drainage (high) 12 1606 7.5 1.05 (0.21, 5.35) 1.07 (0.21, 5.35)Fetal Site contents (moderate) 20 5196 3.9 1.00 Site contents (high) a 6.4 1.65 (0.22, 12.33) 3.08 (0.38, 25.27) Distance to aquifer >600 ft 15 3881 3.9 1.00 Distance to aquifer 50-600 ft 5 1007 5.0 1.28 (0.47, 3.53) 1.46 (0.51, 4.19) Distance to aquifer <50 ft a 1.9 0.50 (0.07, 3.76) 0.54 (0.07, 4.20) Site drainage (low) a 7.1 1.00 Site drainage (moderate) 13 3528 3.7 0.52 (0.12, 2.29) 0.57 (0.10, 3.39) Site drainage (high) 6 1600 3.8 0.53 (0.11, 2.61) 0.65 (0.09, 4.56)Neonatal Site contents (moderate) 18 5194 3.5 1.00 Site contents (high) a 6.4 1.84 (0.25, 13.77) 3.67 (0.45, 29.86) Distance to aquifer >600 ft 11 3877 2.8 1.00 Distance to aquifer 50-600 ft a 4.0 1.40 (0.45, 4.40) 1.80 (0.55, 5.92) Distance to aquifer <50 ft a 7.6 2.69 (0.86, 8.45) 2.77 (0.86, 8.98) Site drainage (moderate) 13 3528 3.7 1.00 Site drainage (high) 6 1600 3.8 1.02 (0.39, 2.68) 1.12 (0.42, 3.03)Congenital Anomalies (n = 5367)Musculoskeletal/integumental Site contents (moderate) 45 5214 8.6 1.00 Site contents (high) a 6.3 0.73 (0.10, 5.32) 0.75 (0.10, 5.47) Distance to aquifer >600 ft 32 3892 8.2 1.00 Distance to aquifer 50-600 ft 8 1011 7.9 0.96 (0.44, 2.09) 1.01 (0.46, 2.21) Distance to aquifer <50 ft 6 525 11.4 1.39 (0.58, 3.32) 1.37 (0.56, 3.35) Site drainage (low) 5 281 17.8 1.00 Site drainage (moderate) 27 3541 7.6 0.43 (0.17, 1.11) 0.39 (0.14, 1.08) Site drainage (high) 14 1606 8.7 0.49 (0.18, 1.36) 0.45 (0.15, 1.33)Other Site contents (moderate) 50 5214 9.6 1.00 Site contents (high) 6 158 38.0 3.96* (1.70, 9.24) 4.27* (1.76, 10.36) Distance to aquifer >600 ft 40 3892 10.3 1.00 Distance to aquifer 50-600 ft 12 1011 11.9 1.15 (0.61, 2.20) 1.15 (0.60, 2.20) Distance to aquifer <50 ft a 7.6 0.74 (0.27, 2.07) 0.72 (0.26, 2.02) Site drainage (low) a 10.7 1.00 Site drainage (moderate) 28 3541 7.9 0.74 (0.23, 2.44) 0.72 (0.22, 2.38) Site drainage (high) 25 1606 15.6 1.46 (0.44, 4.83) 1.43 (0.43, 4.77)† Adjusted for gender, interpregnancy interval, parity, adequacy of prenatal care, smoking status, alcohol intake, race, mother’s age and education, healthcare options, piped water, and missing values.a Cell value less than 5* p < 0.001CI = Confidence intervalft = feet (1 foot = 0,3048 metres)

143International Journal of Circumpolar Health 65:2 2006
ORIGINAL RESEARCH
per 1000 births, while the rate for fetal deaths
was 4.6 and neonatal deaths was 3.2 per 1000
births. The incidence rate for all congenital
anomalies combined was 25.2 per 1000
births. The category “other” defects had the
highest rate, with 11.9 per 1,000 births, where
musculoskeletal/integumental defects had the
highest incidence of a specific anomaly (7.9
per 1000). Incidence rates for other defects
ranged from 1.4 to 2.2 per 1000 births.
Crude estimates revealed that mothers
residing in villages with higher hazard rank-
ings were at no detectable increased risk for
all deaths combined, fetal deaths, or neonatal
deaths, compared to mothers residing in
villages with lower hazard rankings (Table
IV). Adjusted estimates failed to detect
significant differences at the 5 percent level
of confidence between exposure groups.
However, effect estimates were in a positive
direction for combined congenital anomalies,
central nervous system anomalies, circula-
tory and respiratory anomalies, urogenital
anomalies musculoskeletal and integumental
anomalies, other defects, and multiple defects
(Table IV). The outcome group including all
anomalies (RR = 1.37, 95% CI: 0.92, 2.02) had
the narrowest confidence intervals, embracing
fewer values below 1.00 than other outcomes.
There were 5428 births in villages with
detailed exposure rankings. Crude estimates
did not detect any significant difference in
death rates for infants born to mothers in
villages with high hazard site contents versus
infants born to mothers residing in villages
with moderate hazard site contents (Table
V). Adjusted estimates also failed to detect
significant differences for the two exposure
categories for all deaths (RR = 2.04; 95%
CI: 0.73, 1.80) fetal deaths (RR = 3.08; 95%
CI: 0.38, 25.27), and neonatal deaths (RR =
3.67; 95% CI: 0.45, 29.86). Neither crude,
nor adjusted estimates detected a significant
difference in incidences for all deaths, fetal
deaths, or neonatal deaths, when using the
distance of the dumpsite from the drinking
water aquifer as a predictor. In fact, estimates
for the moderately exposed group were higher
than estimates for the more heavily exposed
group for all deaths and fetal deaths (Table
V). Crude models detected no significant
differences in incidence of death across low,
moderate, and high site drainage exposure
groups when predicting deaths. Adjusted esti-
mates were close to unity for all deaths and
fetal deaths, and in a protective direction for
neonatal deaths.
When examining congenital anomalies,
there were only 5367 births in villages with
detailed exposure information available for
analyses. Only models examining risks for
musculoskeletal and integumental defects
and other defects converged. Crude estimates
predicting musculoskeletal and integumental
defects did not demonstrate any differences
when examining site contents, dumpsite
distance to drinking water aquifer, or site
drainage (Table V). Likewise, adjusted esti-
mates did not differ across exposure groups
for dumpsite contents, distance to a drinking
water aquifer, or site drainage. In fact, when
comparing moderate hazard site drainage to
low hazard site drainage, it was found to be
somewhat protective against defects (RR =
0.39; 95% CI: 0.14, 1.08). For the analysis
containing only other defects, the crude rate
ratio revealed infants born to mothers residing
in villages with high hazard site contents
had an increased rate for other defects (RR
= 3.96; 95% CI: 1.70, 5.32), compared to

144 International Journal of Circumpolar Health 65:2 2006
ORIGINAL RESEARCH
infants born to mothers residing in villages
with moderate hazard site contents. Adjusted
estimates also detected an increased rate (RR
= 4.27; 95% CI: 1.76, 10.36) for high hazard
site contents, compared to the referent cate-
gory. Neither crude, nor adjusted rate ratios
for other defects detected a significant differ-
ence with respect to dumpsite distance to a
drinking water aquifer and site drainage.
DISCUSSION
This work failed to detect a significant
increase in the rates of fetal, or neonatal
deaths, or all deaths combined, in infants
whose birth certificates indicated that their
mothers resided in villages with higher
hazard dumpsites, compared to villages
with lower hazard sites. Although 95 percent
confidence intervals included unity, adjusted
estimates suggested a protective effect
associated with residence in high hazard
villages.
Aside from gastrointestinal defects,
adjusted estimates for all categories of
congenital anomalies were in a positive
direction. However, all 95 percent confi-
dence intervals included values below one.
Estimates were slightly higher than, or
within range of, results reported in studies
with positive results for birth defects (11-15).
This study had a much smaller sample size
than these other studies with positive results,
and the 95 percent confidence intervals for
the largest category, which contained all
defects combined, included the fewest values
below one. This indicates that a study using
a larger sample size may be able to detect
meaningful associations between dump-
site hazard potential and the incidence of
congenital anomalies as significant.
In an attempt to define exposure more
finely, hazard factors that had the most influ-
ence on overall dumpsite scores were used
as individual predictors. Defining these
models resulted in a nearly 50 percent reduc-
tion in sample size. Only models predicting
all deaths, fetal deaths, neonatal deaths,
musculoskeletal and integumental defects,
and other defects, had enough cases in each
level of exposure for the statistical models
to converge. There was a four-fold increase
in the rate of other congenital defects in
infants born to mothers residing in villages
with dumpsites with high hazard dumpsite
contents, compared to mothers residing
in villages with moderate hazard dump-
site contents. Although confidence inter-
vals included one, high hazard dumpsite
contents also indicated an elevated rate for
fetal and neonatal deaths (individually and
combined). No patterns could be detected in
any models using distance of dumpsites to
drinking water aquifers and site drainage.
This could be because of no actual effect,
a small sample size, or because some AN
villages prefer to use rain catchment systems,
snowmelt, or untreated river water to obtain
drinking water, and other villages test and
treat water regularly.
The largest obstacle encountered with this
study is the definition of exposure. It is not
known what proportion of their pregnancies
women spent in their village of residence
indicated on the birth record. Although
the dumpsites were ranked in generally the
same time period as the study period, the
quality of the dumpsites could conceivably
have been labile during each pregnancy.

145International Journal of Circumpolar Health 65:2 2006
ORIGINAL RESEARCH
The available level of village healthcare was
adjusted for in the analyses, but informa-
tion on covariates, such as underlying health
conditions and occupational exposures, were
not. Covariates were distributed differently
between exposure levels. Other potentially
confounding factors not measured may have
been distributed differently. These covariates
could have differed between exposure groups.
Another concern is that studies performed
in other states have found that birth record
information often does not correlate with the
patients’ medical records (28,29). Although
this analysis has not been performed with
Alaskan records, results need to be inter-
preted cautiously.
Information on congenital anomalies was
gathered from birth records. This method
reduced complications associated with linking
records in different databases. Additionally,
birth defects occurring in stillborn infants
may be less likely to be reported to the Alaska
Birth Defects Registry (ABDR) (30), so using
birth certificate information might find more
cases with respect to defects in fetal deaths.
However, only birth defects apparent within
the first few days following birth are entered
on the birth certificate. The overall congenital
anomaly rate in our study was 25.2 per 1,000
births (excluding chromosomal abnormali-
ties). However, the rate of children with at
least one major congenital anomaly for 1996-
2000 was 52.6 per 1000 births as reported by
the ABDR. The ABDR rate includes chro-
mosomal defects, but, as these defects were
relatively uncommon, it is still approximately
twice the rate of the birth record rate in this
study. Defects are categorized into fairly broad
categories on birth records, rather than coded
to the ICD-10, which can make comparability
between studies difficult. Since the inception
of the ABDR in 1996, reporting rates and
early case ascertainment have improved, so
further studies may increase power by using
the registry rather than birth records when
defining cases.
ConclusionsFuture studies examining potential health
effects associated with open dumpsites in AN
villages should include exposure measure-
ments that are more precise. Studies with crude
exposure definitions sometimes provide infor-
mation indicating potential risks, but misclas-
sification bias is inherent. Several contami-
nants identified in, and proximal to, individual
dumpsites (arsenic, lead, methyl mercury, and
several petroleum hydrocarbons) are associ-
ated with negative birth outcomes (14,31,32).
In examining health effects associated with
environmental exposures from hazardous
waste sites, it is always preferable, though
rarely possible, to identify direct pathways
of exposure. Reproductive outcomes can be
sensitive indicators of environmental insults,
as the reproductive system often fails before
other systems (14,19,33). Other outcomes of
interest could include chromosomal abnor-
malities or DNA adducts. Sparse populations
and long incubation periods make the study of
cancers difficult, although this is an outcome
of great interest to ANs.
Although a substantial number of studies
have been conducted, risks to health from
dumpsites are difficult to quantify. Exposure
information is often poorly defined, and effects
of exposure to low levels of environmental
contaminants are not easy to quantify, either
singly or jointly. The most important aspect

146 International Journal of Circumpolar Health 65:2 2006
ORIGINAL RESEARCH
of this study is that it is the first to attempt to
characterize the relationship of infant deaths
and congenital anomalies to residents of AN
villages with respect to open dumpsites.
AcknowledgementsWe would like to acknowledge Phillip Mitchell
of the Alaska Bureau of Vital Statistics (ABVS)
for providing birth record data, the Central
Council of Tlingit and Haida Indian Tribes
of Alaska and Alaska Native Tribal Health
Consortium for exposure information, and
Zender Environmental Science and Planning
Services.
REFERENCES
1. Association of Village Council Presidents. Solid Solu-tions in Rural Alaska: Working Together to Reduce Waste in Our Communities. Bethel: Association of Village Council Presidents; 1996; 135 pages
2. Indian Health Service. Report on the Status of Open Dumps on Indian Lands. Rockland: Indian Health Ser-vice; 1998; 73 pages. Available at http://www.ihs.gov/publicinfo/publications. Accessed 16 September, 2005
3. State of Alaska Department of Environmental Con-servation. Division of Environmental Health Solid Waste Program. Anchorage, AK. Available at http://www.state.ak.us/dec/eh/sw/index.htm. Accessed 16 September, 2005
4. Zender L. Solid Waste Management on Indian Reser-vations: Limitations of Conventional Solid Waste Management Engineering [Doctor of Philosophy]. Davis: University of California, Davis; 1999; 190 pag-es. Available at http://www.zender-engr.net/diss_contents.htm. Accessed 16 September, 2005
5. Zender LE, Sebalo S, Gilbreath S. Conditions, risks, and contributing factors in Alaska Native Villages: A discussion with case study. Alaska Water and Waste-water Management Association International Re-search and Development Conference on Rural Sani-tation 2003; 10 pages. Available at http://www.ccthi-ta-swan.org/pdf/AWWMA.pdf Accessed 16 Septem-ber 2005
6. The Governor’s Council on Rural Sanitation. Rural Sanitation 2005 Action Plan. State of Alaska Depart-ment of Environmental Conservation Juneau; 1998; 87 pages
7. United States Congress, Office of Technology As-sessment. An Alaskan Challenge: Native Village Sani-tation, OTA-ENV-591 Washington, D.C.: Office of Technology Assessment, US Government Printing Office; 1994; 126 pages
8. Zender L, Tchobanoglous G. Manual for Assessment of Open Dumping on Indian Lands. Portland; 1996, 185 pages
9. Duffy LK, Rodgers T, Patton M. Regional health as-sessment relating to mercury content of fish caught in the Yukon-Kuskokwim Delta rivers system [pub-lished erratum appears in Alaska Med 1999 Jan-Mar; 41(1):15]. Alaska Med 1998;40(4):75-7, 89.
10. Egeland GM, Ponce RA, Middaugh JP. A public health perspective on the evaluation of subsistence food safety. Int J Circumpolar Health 1998;57 Suppl 1:572-575.
11. Geschwind SA, Stolwijk JA, Bracken M, Fitzgerald E, Stark A, Olsen C, et al. Risk of congenital malforma-tions associated with proximity to hazardous waste sites. Am J Epidemiol 1992;135(11):1197-1207.
12. Dolk H, Vrijheid M, Armstrong B, Abramsky L, Bian-chi F, Garne E, et al. Risk of congenital anomalies near hazardous-waste landfill sites in Europe: the EUROHAZCON study. Lancet 1998;352(9126):423-427.
13. Sosniak WA, Kaye WE, Gomez TM. Data linkage to explore the risk of low birthweight associated with maternal proximity to hazardous waste sites from the National Priorities List. Arch Environ Health 1994;49(4):251-255.
14. Elliott P, Briggs D, Morris S, de Hoogh C, Hurt C, Jensen TK, et al. Risk of adverse birth outcomes in populations living near landfill sites. BMJ 2001;323(7309):363-368.
15. Shaw GM, Schulman J, Frisch JD, Cummins SK, Har-ris JA. Congenital malformations and birthweight in areas with potential environmental contamination. Arch Environ Health 1992;47(2):147-154.
16. Amler RW. Assessment of reproductive disorders and birth defects in communities near hazardous chemical sites: Introduction. Reprod Toxicol 1997;11(2-3):221-222.
17. Bianchi F. Hazardous waste sites and reproductive health: A critical review. In: 28th Conference of Eu-ropean Teratology Society, Ferrara, Italy, September 11-14, 2000;
18. Johnson BL. A review of the effects of hazardous waste on reproductive health. Am J Obstet Gynecol 1999;181(1):S12-6.
19. Kipen HM. Assessment of reproductive health ef-fects of hazardous waste. Toxicol Ind Health 1996;12 (2):211-224.
20. Newill VA. The susceptibility of the fetus and child to chemical pollutants. Nature and sources of pollut-ants. Pediatrics 1974;53(5):785-788.
21. National Research Council. Environmental Epidemiol-ogy: Public health and hazardous waste. Washington, D.C.: National Academy Press; 1991; 312 pages. Avail-able at http://www.nap.edu/openbook.php?record_id=1802&page=1. Accessed 16 September, 2005

147International Journal of Circumpolar Health 65:2 2006
ORIGINAL RESEARCH
22. WHO. Monitoring reproductive health: Selecting a short list of national and global indicators. Geneva: World Health Organization Department of Repro-ductive Health and Research; 1997; 51 pages. Avail-able at http://www.who.int/reproductive-health/publications/hrp_97_26/HRP_97_26_table_of_con-tents.en.html. Accessed 16 September, 2005
23. Shattuck K, Matthews M. Fetal and infant deaths. In: Alaska Division of Public Health Bureau of Vital Sta-tistics 2000 Annual Report. Juneau: Research Unit of the Bureau of Vital Statistics; 2003; 12 pages. Avail-able at http://www.hss.state.ak.us/dph/bvs/publica-tions/ 2000ar.htm. Accessed 16 September, 2005
24. Crondahl J. Alaska Bureau of Vital Statistics 1997 An-nual Report, Introduction. Juneau: Research Unit of the Bureau of Vital Statistics; 1998; 3 pages. Available at http://www.hss.state.ak.us/dph/bvs/publications/1997ar.htm. Accessed 16 September, 2005
25. State of Alaska Department of Community and Eco-nomic Development. Division of Community Advo-cacy, Community Database Online, Anchorage, AK. 2004. Available at http://www.dced.state.ak.us/dca/commdb/CF_COMDB.htm. Accessed 16 September, 2005
26. Breslow NE, Day NE. Statistical Methods in Cancer Research: Volume II- The Analysis of Cohort Stud-ies: Lyon, International Agency for Research on Can-cer; 1987. (IARC Scientific publications: no 82);131-135.
27. Kessner DM, Singer J, Kalk CE, Schelsinger ER. In-fant Death: An Analysis by Maternal Risk and Health-care. Washington, D.C.: Institute of Medicine and National Academy of Sciences; 1973; 203 pages
28. Adams M. Validity of birth certificate data for the outcome of the previous pregnancy. Am J Epidemiol 2001;154(10):883-888.
29. Gore DC, Chez RA, Remmel RJ, Harahan M, Mock M, Yelverton R. Unreliable medical information on birth certificates. J Reprod Med 2002;47(4):297-302.
30. Allen L, Schoellhorn J. Surveillance update: The Alas-ka Birth Defects Registry: 1996-2002. Family Health Dataline. State of Alaska, Department of Health and Social Services, Section of Maternal, Child and Fam-ily Health Facilities Management 2003;9(1):1-6.
31. Vrijheid M, Dolk H, Armstrong B, Boschi G, Busby A, Jorgensen T, et al. Hazard potential ranking of hazardous waste landfill sites and risk of congenital anomalies. Occupational & Environmental Medicine 2002;59(11):768-776.
32. Lybarger JA, Spengler RF, Campolucci S, Kaye W, White M, Amler R. Human health studies of expo-sures to hazardous substances: Approach and future directions. Environmental Epidemiology & Toxicolo-gy 2000;2(2-3):194-200.
33. Vrijheid M, Dolk H, Armstrong B, Abramsky L, Bian-chi F, Fazarinc I, et al. Chromosomal congenital anomalies and residence near hazardous waste land-fill sites. Lancet 2002;359(9303):320-322.
Philip H. Kass, DVM, PhDDepartment of Population Health and ReproductionUniversity of California, DavisOne Shields Ave, Davis, CA 95616USAEmail: [email protected]

Body of Evidence:Reproductive Health and the Environment
IntroductionA growing number of health care providers report
a rise in patients seeking treatment for infertility and otherreproductive health issues(Luoma, 2005; Giudice 2006).Current research suggests that reproductive health maybe supported or compromised by several factors includ-ing age, genetics, nutritional health, stress, and pharma-ceutical use (Schettler et al., 1999). Mounting scientific evi-dence also suggests that chemicals and contaminantscommonly found in the human environment, drinking water,and food supply can influence human fertility and repro-duction, though in complex, often poorly understood ways.Several recent scientific discoveries about the effects ofenvironmental pollutants on human reproductive healthmerit the attention and concern of health care providerstreating patients with reproductive health issues (Giudiceet al., 2005).
This bulletin provides an introductory overview ofwhat role environmental exposures might play in fertilityand reproductive health, with a special focus on evidencedrawn from Alaska. This bulletin also provides resourcesand opportunities for further information about how clini-cians can respond.
Health Outcomes of Potential ConcernReproductive health outcomes with environmen-
tal links have been found in females and males of all ages.These issues are not only of concern to health care provid-ers in gynecology or obstetrics, who may have patientsstruggling to conceive, but also, to pediatricians observingyoung children with malformed genitalia or early-onset ordelayed menarche.
A host of symptoms or conditions are linked orsuspected to be linked to environmental exposures.These include, among females (see Buck et al., 2006;Giudice et al., 2005):
• Premature ovarian failure• Malformed reproductive organs• Early or delayed menarche• Infertility or compromised fertility• Recurrent pregnancy loss• Inability to carry baby to term, pregnancy com-
promise, birth defects, congenital abnormalities,and low birth weight
• Damage to fetal reproductive organs• Premature menopause• Uterine fibroids
Among males, key trends in reproductive health include(see Hauser 2006; Giudice et al., 2005):
• Undescended testes or malformed reproductiveorgans (e.g., cryptorchidism and hypospadias).
• Compromised sperm shape and quality, includ-ing issues of mobility, motility, and geneticintegrity.
• Testicular dysgenesis syndrome, or TDS, is asuspected cluster of effects (undescended ormalformed reproductive organs, testicularcancer, and decreased sperm quality) with ahypothesized common fetal origin (Skakkebæket al., 2001).Furthermore, after tracking a study group of Mas-
sachusetts men for twenty years, scientists observed anoverall decline in testosterone levels that were not attribut-able to aging or lifestyle (Travison et al., 2007), further sup-porting the possibility that environmental exposures areaffecting male reproductive health. More generally, thereare also rising rates of diseases or conditions known toaffect human fertility in which environmental exposuresmight also play some role in the etiology, including en-dometriosis, and ovarian, cervical, and testicular cancer(Giudice et al., 2005).
Sources of Environmental Exposures
Alaska Native peoples and others living in the cir-cumpolar region bear a disproportionate burden of envi-ronmental contaminants (AMAP 1997; 2004; Berner 1999;Chary 2000). Several known or suspected reproductivetoxicants, such as polychlorinated biphenyls (PCBs) andpesticides, have been detected in the Alaskan environ-ment and food system, as well as in the blood of someAlaska Native people (Berner 1999; Carpenter et al., 2005;
Alaska Community Action on Toxics505 West Northern Lights, #205
Anchorage, AK 99503phone: 907 222-7714 fax: 907 222-7715
BulletinVolume 1, Number 1
March 2007; Re-issued March [email protected]
http://www.akaction.org
Health & the Environmentfor Health Care Providers

2
Health and Environment Bulletin - Vol 1, Nbr 1
Middaugh et al., 2000) and other circumpolar populations(AMAP 1997).
These chemicals and contaminants originate fromboth local and remote sources. Many chemicals and heavymetals are produced or released into the environment byindustries located in the Lower 48 states and throughoutthe world, but because they are slow to degrade, and cantravel vast distances in air and water currents, they tend tocondense, concentrate, and then persist in the cold, north-ern climate. As a result, the circumpolar Arctic region hasbecome a hemispheric sink for many pollutants and chemi-cals that may pose reproductive risks (AMAP 2004;Tenenbaum 1998). Of particular concern are pesticides,which are used elsewhere but accumulate in Alaska due toglobal fate and transport from southern latitudes.
Local industries and formerly-used defense sitesare also current sources of exposure to heavy metals (e.g.,lead and mercury) and industrial chemicals (e.g., PCBs) inAlaska (Button 2002). Thus, PCB exposures may result notjust from global transport, but from formerly-used defensesites in Alaska as well (Carpenter et al., 2005).
These persistent pollutants enter the food chain,where they concentrate in the fatty tissues of predator spe-cies. As a result, many of these pollutants are found in thetraditional subsistence foods that sustain a significant por-tion of the Alaskan population (AMAP 2004; Berner 1999;Chary 2000; Middaugh et al., 2000). Though a route of ex-posure, traditional foods remain the best source of suste-nance for Alaska Native people as they are both nutrition-ally rich and culturally essential. Therefore, it is imperativethat health care providers support local, national, and inter-national initiatives to eliminate the use of chemicals knownto accumulate in foods.
Humans also are exposed by inhaling air or drink-ing water that is contaminated by these pollutants. Suchexposures can occur at home or on the job, outdoors aswell as indoors, as many chemicals can collect in house-hold air and dust (Rudel et al., 2003). In some cases, expo-sures can occur when substances containing reproductivetoxicants are absorbed into the skin, such as phthalates(pronounced ‘thal-lates’), which are commonly added toself-care and beauty products (Rudel et al., 2003).
While researchers document these compoundsin air, water, soil, foods, and consumer products, researchalso confirms that these substances enter the body. Ongo-ing population monitoring conducted by the U.S. Centersfor Disease Control and Prevention (CDC) reports that theaverage American carries detectable levels of various re-productive toxicants that are also present in the environ-ment (US CDC 2005). In general, many chemicals andpollutants, because of their chemical-physical character-istics, either build up in human systems or are ubiquitousso that, even if excreted by the body, constant re-exposuremaintains elevated body levels.
Many chemical compounds are detected at lev-els known or suspected to affect the reproductive system.
As scientists learn more about low-level effects of chemi-cal exposures and the unique vulnerabilities of some indi-viduals, the levels of current human burdens increasinglyhave flagged the attention of researchers and health careproviders (Giudice et al., 2005). More recently, the effectsof low-level exposures have garnered the attention ofpolicy-makers. In many instances, however, there remaindata gaps about whether and how low-level exposuresaffect the function of the human body (National ResearchCouncil 2006) and the reproductive system.
Researchers have not studied many compoundsfor their reproductive effects. A recent tabulation found thatless than 10% of the 100,000 chemicals currently registeredfor commercial use have been studied for their humanhealth effects, and only a fraction of those have been testedfor how thay affect reproductive health (Davis and Webster,2002).
Timing of Exposures
The timing of exposure strongly influences the ob-served outcomes. Exposures to pesticides such asalachlor, atrazine, and diazinon, for example, were found tocompromise sperm quality of human adult males (Swan etal., 2003b). Similarly, new research suggests links betweenmen’s exposures to a particular phthalate and lower spermconcentration and decreased mobility (Hauser et al., 2006).
Researchers also have found that exposures en-countered in utero can shape the subsequent reproduc-tive health of adults. Clinicians and scientists now knowthat the placenta does not shield the developing fetus fromchemicals or pollutants the mother encounters (Colborn etal., 1996). For example, some conditions and disease ofthe reproductive tract have origins in exposures encoun-tered during particular periods of fetal development(Giudice et al., 2005).
The effect of in utero exposures was first seenamong the children of women who were, beginning in the1940s, prescribed DES, a synthetic estrogen, to preventmiscarriage. Though not apparent at first, as exposed chil-dren reached puberty, a pattern of reproductive health prob-lems emerged. Follow-up research has confirmed a hostof outcomes in both the male and female children of womenwho took DES, including rare reproductive cancers andmalformed reproductive organs, menstrual irregularities,and infertility or sub-fertility, i.e., difficulty conceiving(Schrager and Potter 2004).
Today, DES serves as one model for how expo-sures during critical periods of fetal development can af-fect reproductive health in later life stages.
A body of evidence now demonstrates that manychemicals humans routinely encounter in the environmentcan mimic or interact with the endocrine system, and likeDES, can affect the fertility and reproductive health of off-spring, though through other biological mechanisms(Colborn et al., 1996; McLachlan 2001). Synthetic or hu-

3
Health and Environment Bulletin - Vol 1, Nbr 1
man-made substances can exhibit estrogenic, androgenic,or anti-estrogenic and anti-androgenic properties. That is,they can act like hormones, or block normal hormone func-tion, which in turn, affects reproductive development(Colborn et al., 1996).
So called ‘endocrine disruption’ of human repro-duction by environmental chemicals has been demon-strated in animals, but more recently in humans as well. A2003 study published in The Lancet found that women withhigher in utero exposures to DDT—a pesticide banned fromuse in the US, but still used in other countries and present incircumpolar ecosystems (van Oostdam et al., 2004;Simonetti et al., 2001)—took longer to conceive once theyreached reproductive maturity (Cohn et al., 2003). Re-searchers are also compiling evidence that phthalates en-countered in utero affect adult male fertility later in life (Latiniet al., 2006).
Environmental chemicals also interfere with the fer-tility of subsequent generations by altering how genes di-rect key biological processes. A recent study published inScience found that when pregnant female mice were ex-posed to two commonly used pesticides, vinclozolin andmethoxychlor, the exposures compromised the fertility ofmale offspring in three subsequent generations (Anway etal., 2005). This is the first study to find multi-generationaleffects. Although the study was performed on mice andinvolved exposures that are higher than humans might en-counter, it is biologically plausible that similar trends mightbe seen among humans since genetic processes areknown to be reasonably similar in both species (Anway etal., 2005).
Accumulating Evidence and Continued ResearchThough research is on-going, reproductive envi-
ronmental health researchers and clinicians agree there isalready a substantial body of evidence implicating low-level exposures as a likely contributor to trends currentlyseen in reproductive outcomes (Giudice et al., 2005).
Supporting evidence comes from a wide varietyof sources. Wildlife studies associate exposures to in-creased rates of malformed reproductive organs, infertil-ity, and overall population declines (Colborn et al., 1996;Guillette and Moore 2006). In humans, the most compellingevidence comes from observations of reproductive out-comes following acute, high-level, occupational exposures(Colborn et al., 1996). For example, over thirty years ago,researchers demonstrated decreased fertility in male farmworkers due to regular, occupational exposures to DBCP,an agricultural fumigant (Whorton et al., 1977; Slutsky et al.,1999).
Currently, researchers investigate what reproduc-tive risks are posed by routine, low-level exposures to en-vironmental chemicals. In addition, researchers also ex-amine the effects of multiple, simultaneous exposures,which better account for the reality that humans encounterreproductive toxicants in complex mixtures (Denham et al.,
2005). When substances interact, they may increase ormediate toxicological effects in unforeseen ways.
Compounds deemed high priority for research onreproductive effects include (Giudice et al., 2005):
• Commonly-used pesticides
• Chemical additives (used in production of plas-tics, e.g., Bisphenol A)
• Perfluorinated compounds (used in production ofstain-resistant, water-repellant, or non-stick sur-faces)
• Chemical additives to beauty and self-care prod-ucts
• Polybrominated diphenyl ethers (PBDEs) (usedas flame retardants in household upholstery andelectronics).
Many of these substances are what scientists call ‘emerg-ing concerns.’ They comprise a new class of persistent,bioaccumulative toxicants that have been studied far lessthan organochlorines such as PCBs and the pesticide, DDT.Research has already suggested some of these com-pounds are reproductive toxicants. For example, recentresearch found decreased sperm counts in male offspringof pregnant rats exposed to a single, low-dose of a ubiqui-tous brominated flame retardant. These effects were seenat levels already detected in samples of US women’sbreast milk (Kuriyama et al., 2005).
Though ongoing research focuses on the repro-ductive toxicity of these emergent chemicals, new scien-tific evidence also advances our understanding of the re-productive concerns posed by PCBs, DDT, and other or-ganochlorine exposures. Thus, these too, remain a prior-ity concern as scientists continue to identify significant re-productive outcomes, how they affect the reproductive sys-tem, and at what levels.
New Research in Alaska
Though scientific research about how environmen-tal factors affect human reproductive health in Alaska islimited, important trends can be inferred from studies con-ducted within the state.
For example, researchers recently documented ahigh rate of reproductive organ and testosterone-relatedproblems among male, Sitka black-tailed deer on KodiakIsland. The study, published in Environmental Health Per-spectives, argues that this unusual pattern is attributable toin utero exposures, when pregnant females ingested foodscontaining hormonally-active agents (Veeramachaneni etal., 2006).
Also in 2006, a team of UAA scientists examinedwhether exposure to perchlorate, which has many indus-trial and military applications, has reproductive effects on

4
Health and Environment Bulletin - Vol 1, Nbr 1
fish. Scientists suspect exposures are occurring in Alaskathrough imported produce and milk and possibly throughseepage from military sites where munitions are stored,many of which have yet to be tested (O’Malley 2006). TheUAA perchlorate-exposed fish exhibited altered patternsof sexual development and courtship behaviors. Also,exposed females developed both female and male re-productive organs and were capable of producing botheggs and sperm. This is the first study to demonstrate thatperchlorate exhibits androgenic properties and impactsreproductive health(Bernhardt et al., 2006).
The first human studies of environmental expo-sures and reproductive health outcomes were publishedlast year in The American Journal of Epidemiology andThe International Journal of Circumpolar Health. Research-ers examined the association between reproductive out-comes and open dumps located near many AlaskaNativevillages.1 They found that women from villages with opendump sites that were considered most hazardous deliv-ered babies who weighed less, were too small for theirgestational age, were born too early, or had higher rates ofsome birth defects than did women living in villages nearless dangerous dump sites (Gilbreath and Kass 2006a;2006b).
Though we know little about what exposure or com-bination of exposures contributed to these outcomes, orexactly how women were exposed, this research spotlightsthe role exposures could play in reproductive outcomesexperienced by women entering your clinic. It also sug-gests that some exposures relevant to reproductive healthoutcomes stem from local, rather than only global sources.
Relevant epidemiological studies of reproductivehealth outcomes among other circumpolar populations areongoing (e.g., Northern Contaminants Program, Canada;Project INUENDO in Greenland, Sweden, Ukraine, andPoland) as is research with populations who eat traditional,subsistence foods. One recent study conducted amongthe Mohawk of New York and Canada, who also rely onsubsistence foods, suggests exposure to certain types ofPCB congeners and lead was associated with changes inthe timing of girls’ menarche (Denham et al., 2005). As newstudies are published, they will contribute to our develop-ing understanding of how environmental factors may beinfluencing human reproduction and fertility in Alaska.
What Health Care Providers Can Do
1. Request and organize grand rounds or workshops on reproductive environmental health. 2. Share case studies at medical meetings. 3. Support research on birth defect trends with suspectedenvironmental links using data available through the AlaskaBirth Defects Registry. For more information on the AlaskaBirth Defects Registry: http://www.epi.hss.state.ak.us/mchepi/abdr/default.stm.
4. Routinely collect environmental and occupational his-tories. For more information and suggestions about con-ducting an environmental history, consult Schettler,Solomon, Valenti, and Huddle’s Generations at Risk: Re-productive Health and the Environment (1999), which in-cludes a primer for clinicians (Chapter 10). 5. Learn more about exposure sources and reproduc-tive toxicity of chemicals and environmental pollutants:
The Collaborative on Health and theEnvironment(www.healthandenvironment.org).
The Agency for Toxic Substancesand Disease Registry ToxFAQs program,available at www.atsdr.cdc.gov/toxfaq.html
The National Library of Medicine’s Hazardous Substances Data Bank(toxnet.nlm.nih.gov)
To investigate potential exposure outcomes common inAlaska, clinicians also could reference:
The Toxics Release Inventory maintained bythe Environmental Protection Agency, which re-ports major sources of toxics by zip code(www.epa.gov/tri).
Arctic Health, a resource portal maintained byUniversity of Alaska Anchorage and the NationalLibrary of Medicine (www.arctichealth.org).
Arctic Monitoring and AssessmentProgramme (www.amap.no).
Alaska Native Traditional Knowledge andNative Foods Database, run by the AlaskaNative Science Commission, the Institute ofSocial and Economic Research (ISER) and theUniversity of Alaska Anchorage.(www.nativescience.org/html/arctic_contaminants.html)
6. Join The Collaborative on Health and the Environment(CHE)- Alaska
“The Collaborative on Health and the Environment(CHE) is a national, non-partisan partnership of individualsand organizations concerned with the effects of environ-mental contaminants on human and ecosystem health. CHEseeks to raise the level of scientific and public dialogueabout the role of environmental contaminants and other
1 Hazard rankings of open dump sites determined by The Alaska Native Tribal Health Consortium.

5
Health and Environment Bulletin - Vol 1, Nbr 1
environmental factors in many of the common diseases,disorders, and conditions of our time. CHE promotes inter-disciplinary discussions, sharing of scientific evidence, out-reach and education, and an agenda to bring about sys-temic change in improving environmental public health. Un-derlying all of CHE‘s activities is a commitment to strong,uncompromised science. CHE believes truth emergesthrough discussion and that civility among CHE partners isa condition of honest dialogue and learning.” For moreinformation visit: www.healthandenvironment.org
CHE-Alaska formed as a regional group in De-cember 2005 following the Alaska Conference on Healthand the Environment and invites participation from healthcare professionals, researchers, health-affected individu-als and patient groups, students, advocacy organizations,and any other individual or group concerned about pro-tecting the health of current and future generations fromenvironmental harm. For more information, please visit:www.akaction.org
Additional Resources for Health Care Providers
American Academy of Pediatrics Committee on En-vironmental Health. Pediatric Environmental Health (2nd
Edition). Etzel RA (Ed.) Elk Grove Village, IL: AmericanAcademy of Pediatrics, 2003.
American College of Preventive Medicine Envi-ronmental Health Resource Centerhttp://www.acpm.org/education/environmentalhealth.htm
Association of Occupational and EnvironmentalHealth Clinics1010 Vermont Avenue, NW, Suite 513Washington, DC 20005Website: http://www.aoec.org/Phone: (888) 347-AOEC (2632)
Generations At Risk: Reproductive Health andthe Environment. Ted Schettler, MD, Gina Solomon,MD, Maria Valenti, and Annette Huddle. 1999. Cam-bridge, MA: MIT Press.
Project INUENDO—Human Fertility at Risk fromBiopersistent Organochlorines in the Environment. A re-search project supported by the European Commission.Examines couple fertility, semen quality and neonatal stud-ies of reproductive hormone profiles among four popula-tions in Greenland, Sweden, Poland and Ukraine. Website:http://www.inuendo.dk/
Physicians for Social ResponsibilityConducts trainings and workshops on environmental healthfor health care practitioners. Also, publishes ‘tool kits,’pocket-sized, quick reference charts, and fact sheets on
environmental health issues. Website: /www.psr.orgAlso, for more resources, see Greater Boston Physiciansfor Social Responsibility at http://psr.igc.org
University of California at San Francisco, NationalCenter of Excellence in Women’s Health, Programon Reproductive Health and the Environment.Website: www.ucsf.edu/coe/prhe.html
Vallombrosa Consensus Statement on Environ-mental Contaminants and Human Fertility Com-promise, October 2005.Availableat:www.healthandenvironment.org/infertility/vallombrosa_documents
Cited References
Anway, Matthew D., Andrea S. Cupp, Mehmet Uzumcu, andMichael K. Skinner. 2005. Epigenetic TrangenerationalActions of Endocrine Disruptors and Male Fertility. Sci-ence 308 (5727): 1466-1469.
Arctic Assessment Monitoring Programme. 1997. Artic Pol-lution Issues: A State of the Arctic Environmental Report.Arctic Monitoring and Assessment Programme (AMAP),Oslo, Norway. Available at: www.amap.no.
2004. AMAP Assessment 2002: Persistent Organic Pollut-ants Report—A State of the Arctic Environment Report. Arc-tic Monitoring and Assessment Programme (AMAP), Oslo,Norway. Available at: www.amap.no.Berner, J. 1999. Contaminants and Human Health. In: Alas-kan Pollution Issues. M. Bradley, ed. Anchorage, AK:Alaska Native Epidemiology Center.
Bernhardt, R.R., von Hippel, F.A., and Cresko, W.A. 2006.Perchlorate Induces Hermaphroditism in Threespine Stick-lebacks. Environmental Toxicology and Chemistry 25:2087-96.
Buck, G.M, C.D. Lynch, and M.A. Cooney. 2006. Environ-mental Influences on Female Fecundity and Fertility. Semi-nars in Reproductive Medicine 24: 147-155.
Button, Karen. 2002. It’s Your Right-to-Know YourCommunity’s Exposure to Toxics: An Alaskan’s Guide tothe Community Right-to-Know Law. Published by: AlaskaCommunity Action on Toxics. Available at: http://www.akaction.org/REPORTS/AT_RTK_09_10_02.pdf.
Carpenter, D.O., A. P. DeCaprio, D. O’Hehir, F. Akhtar, G.Johnson, R.J. Scrudato, L. Apatiki, J. Kava, J. Gologergen,P.K. Miller, and L.Eckstein. 2005. Polychlorinated Biphe-nyls in Serum of the Siberian Yupik People from St.Lawrence Island, Alaska. International Journal of Circum-

6
Health and Environment Bulletin - Vol 1, Nbr 1
polar Health 64(4): 322-335.
Chary, L.K. 2000. Persistent Organic Pollutants (POPs) inAlaska—What Does Science Tell Us? Circumpolar Con-servation Union with Alaska Community Action on Toxics.Report available at: www.circumpolar.org. Accessed 31October 2006.
Cohn, B.A., P.M. Cirillo, M.S. Wolff, P.J. Schwing, R.D. Cohen,R.I. Sholtz, A. Ferrara, R.E. Christianson, B.J. van den Berg,and P.K. Siiteri. 2003. DDT and DDE Exposure in Mothersand Time to Pregnancy in Daughters. The Lancet 361:2205-2206.
Colborn, T., Dumanoski, D., and Myers, J.P. 1996. OurStolen Future. New York: Penguin Books.
Davis, D.L. and Webster, P. 2002. The Social Context ofScience: Cancer and the Environment. Annals of TheAmerican Academy of Political and Social Science, 584:p. 13.
Denham, M., L.M. Schell, G. Deane, M.V. Gallo, J.Ravenscroft, A.P. DeCaprio, and the Akwesasne TaskForce on the Environment. 2005. Relationship of Lead,Mercury, Mirex, Dichlorodiphenyldichloro-ethylene,Hexachlorobenzene, and PCBs to Timing of Menarcheamong Akwesasne Mohawk Girls. Pediatrics 115: 127-134.
Gilbreath, S. and P.H. Kass. 2006a. Fetal and NeonatalDeaths and Congenital Abnormalities Associated withOpen Dump Sites in Alaska Native Villages. InternationalJournal of Circumpolar Health 65 (2): 133-147.
---- 2006b. Adverse Birth Outcomes Associated with OpenDumpsites in Alaska Native Villages. American Journalof Epidemiology 164 (6): 518-528.
Giudice, L.C., Swan, S.H., Myers, J.P. and Carlson, A. 2005.Vallombrosa Consensus Statement on EnvironmentalContaminants and Human Fertility Compromise.Available at: www.healthandenvironment.org/infertility/vallombrosa_documents.
Giudice, L.C. 2006. Infertility and the Environment: The Medi-cal Context. Seminars in Reproductive Medicine 24: 129-133.
Guillette, L.J. and B.C. Moore. 2006. Environmental Con-taminants, Fertility, and Multioocytic Follicles: A Lessonfrom Wildlife? Seminars in Reproductive Medicine 24: 133-141.
Hauser, Russ. 2006. The Environment and Male Fertility:
Recent Research on Emerging Chemicals and SemenQuality. Seminars in Reproductive Medicine 24: 156-167.
Hauser, R, JD Meeker, S Duty, MJ Silva and AM Calafat2006. Altered Semen Quality in Relation to Urinary Con-centrations of Phthalate Monoester and Oxidative Metabo-lites. Epidemiology 17: 682-691.
Kuriyama, SN, CE Talsness, K Grote and I Chahoud. 2005.Developmental Exposure to Low Dose PBDE 99: 1- Ef-fects on Male Fertility and Neurobehavior in Rat Offspring.Environmental Health Perspectives 113:149-154.
Latini, G., Del Vecchio, A., Massaro, M., Verrotti, A., andDe Felice, C., 2006. Phthalate exposure and maleinfertility. Toxicology 226 (2-3): 90-98.
Luoma, Jon R. 2005. Challenged Conceptions: Environ-mental Chemicals and Fertility (prepared following the work-shop Understanding Environmental Contaminants andHuman Fertility: Science and Strategy, Vallombrosa Re-treat Center, Menlo Park, CA). Stanford University Schoolof Medicine, Department of Women’s Health and The Col-laborative on Health and the Environment. Available at:w w w . h e a l t h a n d e n v i r o n m e n t . o r g / i n f e r t i l i t y /vallombrosa_documents.
McLachlan, J.A. 2001. Environmental Signaling: WhatEmbryos and Evolution Teach Us about EndocrineDisrupting Chemicals. Endocrine Reviews 22 (3): 319-341.
Middaugh, J., L. Verbrugge, L. Haars, M. Schloss, and G.Yett. 2000. Assessment of Exposure to POPs in 5 Aleutianand Pribilof Villages. State of Alaska Epidemiology Bulle-tin 4(1). State of Alaska, Section on Epidemiology. Anchor-age, AK.
National Research Council of the National Academies,Committee on Human Biomonitoring for EnvironmentalToxicants, Board of Environmental Studies and Toxicol-ogy. 2006. Human Biomonitoring for Environmental Chemi-cals. Washington, D.C.: National Academies Press.
O’Malley, J. 2006. UAA Scientists Find Pollutant IncreasesMasculinity in Fish. Anchorage Daily News. Published 16October 2006. Available at: http://www.adn.com/news/alaska/university/story/8311141p-8207375c.html
Rudel, R.A., D.E. Camann, J.D. Spengler, L.R. Korn, J.G.Brody. 2003. Phthalates, alkylphenols, pesticides, polybro-minated diphenyl ethers, and other endocrine-disruptingcompounds in indoor air and dust. Environmental Science& Technology, 37(20): 4543-4553.
Schettler, T., Solomon G., and Valeniti, M. 1999. Genera-

7
Health and Environment Bulletin - Vol 1, Nbr 1
tions at Risk: Reproductive Health and the Environment.Cambridge, MA: MIT Press
Schrager S, Potter BE. Diethylstilbestrol exposure. Am FamPhys 2004;69:2395–400.
Simonetti J., Berner J., Williams K. 2001. Effects of p.p-DDE on immature cells in culture at concentrations relevantto the Alaskan environment. Toxicol in Vitro: 15: 269-179.
Skakkebæk, NE, E Rajpert-De Meyts and KM Main. 2001.Testicular dysgenesis syndrome: an increasingly commondevelopmental disorder with environmental aspects. Hu-man Reproduction 16:972-978.
Slutsky, M., Levin, J.L. and Levy, B.S. 1999 Azoospermiaand oligospermia among a large cohort of DBCP applica-tors in 12 countries. International Journal of Occupationaland Environmental Health 5:116–122
Swan S.H., Brazil C., Drobnis E.Z., Liu F., Kruse R.L., HatchM., Redmon, J.B., Wang, C., Overstreet, J.W., and TheStudy for Future Families Research Group. 2003a. Geo-graphic differences in semen quality of fertile U.S. males.Environmental Health Perspectives 111:414-420. Availableonline: http://www.ehponline.org/members/2003/5927/5927.html.
Swan, S.H., Kruse, R.L., Liu, F., Barr, D. B., Brazil, C., Drobnis,E.Z., Redmon, J.B., Wang, C. Overstreet, J.W. and the Studyfor Future Families Research Group. 2003b. Semen Qual-ity in Relation to Biomarkers of Pesticide Exposure. Envi-ronmental Health Perspectives 111: 1478-1484. Availableonline: http://www.ehponline.org/members/2003/6417/6417.html.
Travison, TG, AB Araujo, AB O’Donnell, V Kupelian, JBMcKinlay. 2007. A population-level decline in serumtestosterone levels in American men. Journal of ClinicalEndocrinology and Metabolism 92:196–202.Tenenbaum, D.J. 1998. Northern Overexposure. Environ-mental Health Per-spectives 106 (2). Available online at:www.ehponline.org/qa/106-2focus/ focus.html.
U.S. Centers for Disease Control and Prevention. 2005.Third National Report on Human Exposure to Environmen-tal Chemicals. Atlanta, GA: Centers for Disease Control andPrevention, National Center for Environmental Health.
van Oostdam, J.C., E. Dewailly, A. Gilman, J.C. Hansen,J.O. Odland, V. Chashchin, J. Berner, J. Butler-Walker, B.J.Lagerkvist, K. Olafsdottir, L. Soininen, P. Bjerregard, V.Klopov, and J.P. Weber. 2004. Circumpolar Maternal BloodContaminant Survey, 1994-1997: Organochlorine Com-pounds. Science of the Total Environment 330: 55-70.
Veeramachaneni1, D.N.R., R.P. Amann, and J.P.Jacobson. 2006. Testis and Antler Dysgenesis in SitkaBlack-Tailed Deer on Kodiak Island, Alaska: Sequela ofEnvironmental Endocrine Disruption? EnvironmentalHealth Perspectives 114(suppl 1):51-59.
Whorton, D., Krauss, R.M., Marshall, S. and Milby, T.H. 1977.Infertility in male pesticide workers. Lancet, ii, 1259–1261.
This publication authored by: Rebecca GasiorAltman, Doctoral Candidate, Department of Sociol-ogy, Brown University
This publication has been peer-reviewed by:
Dr. Birgit Lenger, ND (Natural Health Center, LLC),Alaska Community Action on Toxics), Ruth A. Etzel,MD, PhD (George Washington University School ofPublic Health and Health Services); Pamela K. Miller,MEN, Vi Waghiyi, and Coleen Keane (Alaska Commu-nity Action on Toxics); Ted Schettler, MD., MPH (Sci-ence and Environmental Health Network), (AlaskaCommunity Action on Toxics), Rachel Morello-Frosch,PhD., MPH (Brown University), Phil Brown, PhD (BrownUniversity), Laura Senier, MA, MPH (Brown University),and the members of the Contested Illnesses ResearchGroup (Brown University). The author thanks these in-dividuals for their time and assistance.

8
prst stdU.S. Postage Paid
Anchorage, AKPermit #183
505 West Northern Lights, Suite 205Anchorage, AK 99503
The Collaborative on Health and the Environment (CHE) is a nationalnon-partisan partnership of individuals and organizations concernedwith the role of the environment in human and ecosystem health. CHEseeks to raise the level of scientific and public dialogue about the roleof environmental contaminants and other environmental factors in manyof the common diseases, disorders, and conditions of our time. CHEpromotes interdisciplinary discussions, sharing of scientific evidence,outreach and education, and an agenda to bring about systemic changein improving environmental public health. Underlying all of CHE’s activi-ties is a commitment to strong, uncompromised science. We believethat the truth emerges through discussion and that civility among CHEpartners is a condition of honest dialogue and learning. Visit us at:www.healthandenvironment.org.
The Collaborative on Health and the Environment - AlaskaThe Collaborative on Health and the Environment - AlaskaThe Collaborative on Health and the Environment - AlaskaThe Collaborative on Health and the Environment - AlaskaThe Collaborative on Health and the Environment - Alaska
Alaska Community Action on Toxics (ACAT) is a statewide environmental health and justice organization established in 1997. Our mission is to assurejustice by advocating for environmental and community health. We believe that everyone has the right to clean air, clean water, and toxic-free food.
We help communities implement effective strategies to limit their exposure to toxic substances and to protect and restore the ecosystems that sustainthem and their way of life.
We work to eliminate the production and release of harmful chemicals by industry and military sources, ensure the public’s right to know, achievepolicies based on the precautionary principle, and support the rights of Indigenous peoples.
CHE-Alaska formed as a regional group in December 2005 followingthe Alaska Conference on Health and the Environment. We inviteparticipation from health care professionals, researchers, health-affectedand patient groups, students, advocacy organizations, and any indi-vidual concerned about protecting the health of current and futuregenerations from environmental harm. Visit us at: www.akaction.org.

Diabetes: The Role of Persistent Toxic Chemicalsin this Complex Disease
Alaska Community Action on Toxics505 West Northern Lights, #205
Anchorage, AK 99503phone: 907 222-7714 fax: 907 222-7715
Health & the Environment BulletinVolume 1, Number 2
April [email protected]
http://www.akaction.org
While diabetes is rarely considered to be an environmen-tally-induced disease, there is increasingly strong evidencethat environmental exposure contributes to the incidenceof both Type I and Type II diabetes. Type I diabetes,which usually has onset in childhood, is an autoimmunedisease with loss of the pancreatic beta cells and second-ary lack of insulin. Type II diabetes, which usually hasadult onset, is associated with a cellular resistance to theactions of insulin (Zimmet et al., 2001). A study of the U. S. Air Force personnel who wereexposed to dioxin-contaminated Agent Orange on Viet-nam during the war found a highly significant relationshipbetween exposure to dioxin and onset and severity ofdiabetes in those individuals with the greatest exposure(Henrikson et al., 1997). This prompted a committee ofthe National Academy of Sciences’ Institute of Medicine(IOM, 2000) to conclude that there was suggestive evi-dence of an association between dioxin exposure and dia-betes. Pesatori et al., 1998 and Bertazzi et al., 1998 foundelevated diabetes in individuals exposed to dioxins atSeveso, Italy. A similar conclusion was drawn by Vena etal., 1998 from a study of phenoxyacid herbicides andchlorophenol production workers exposed to dioxins. Cranmer et al., 2000 studied a population of individu-als exposed to dioxin from a Superfund site, and demon-strated that plasma insulin concentrations were significantlyhigher in individuals with elevated dioxin levels. The sci-entists concluded that high serum dioxin levels are associ-ated with insulin resistance. Longnecker et al., 2001 studied 2,245 pregnantwomen, 44 of whom had diabetes. The mean serum PCBlevel in the women with diabetes (3.77 ppb) was 30%higher than the controls (2.79 ppb). The relationship of
PCB levels to the adjusted odds ratio (OR) for diabeteswas linear. Taking PCB levels < 2.50 ppb to have anodds ratio of 1.0, the OR was 2.9 for PCB levels 2.50-3.75, 4.4 for PCB levels 3.75-5.00 and 5.1 for PCBlevels greater than 5.0. All values were statistically sig-nificant, showing that increased exposure is associatedclearly with increased risk. Strong support for this relationship is also found in theFierens et al., 2003 population-based study which showedthat, after adjustment for age and other variables, that thetotal toxic equivalency factor (TEF) and 12-marker PCBconcentrations were 62% and 39% higher, respectivelythan in controls. The ORs were 5.1 (95% confidenceinterval (CI) = 1.18-21.7) for dioxins, 13.3 (95% CI =3.31-53.2) for coplanar PCBs and 7.6 (95% CI = 1.58-36.3) for 12 marker PCBs. Vasiliu et al., 2006 investigated a Michigan cohort thathad elevated exposure to polybrominated biphenyls(PBBs), and found a significant risk of diabetes with PCBconcentrations (OR 2.33, 95% CI = 1.25-4.34), but notwith PBB concentrations. The strongest evidence for the relationship betweenPCB and other organochlorine exposure and diabetes hascome from use of the US National Health and Examina-tion Survey data. Lee et al., 2006 studied PCB 153, twodioxin congeners and three pesticide levels in relation torisk of diabetes in 2,016 adults. For PCB 153, the ORfor individuals with serum levels in the greater than 90th
percentile was 6.8 (95% CI = 3.0-15.5), and the p fortrend was <0.001 with increasing concentration. Porta,2006 stated: “Another striking finding in Lee and co-work-ers’ study is that there was no association between obe-sity and diabetes in individuals with non-detectable levelsof persistent organic pollutants. Obesity was a risk factor
for Health Care Providers

2
Health and Environment Bulletin - Vol 1, Nbr 2
for diabetes only if people had blood concentrations ofthese pollutants above a certain level. This finding mightimply that virtually all the risk of diabetes conferred byobesity is attributable to persistent organic pollutants, andthat obesity is only a vehicle for such chemicals. Thispossibility is shocking. Rylander et al., 2005 also reported a significantly el-evated risk of diabetes in relation to concentrations ofPCB 153 in Swedish fisherman and their wives. Everett et al., 2007 independently analyzed similardata to that used by Lee et al., 2006 in determining dia-betes risk for exposure levels of PCB 126 in 2,090 per-sons. PCB 126 levels >83.8 pg/g showed an OR fordiabetes of 3.68 (95% CI=2.09-6.49) as compared toPCB 126 levels < 31.2 pg/g. The results of Lee et al.,2006 and Everett et al., 2007 are of particular interestbecause PCB 153 is not active at the dioxin receptor,whereas PCB 126 is. Therefore it may be that both di-oxin-like and non-dioxin-like PCBs increase risk of dia-betes. In a follow-up study, Lee et al., 2007 found that therelationship with diabetes was much greater for the sumof four dioxin-like PCB congeners that it was for the sumof three dioxins, the sum of three furans, the sum of fivenon-dioxin-like congeners or the sum of four organochlo-rine pesticides. Our research team, Codru et al., 2007, has recentlyreported that in a Native American population that is notparticularly highly exposed to PCBs and pesticides, thereis a significant relationship between tertiles of PCBs,hexachlorobenzene and DDE and risk of diabetes, iden-tified either on the basis of having been diagnosed by aphysician or by having a fasting blood glucose level of125 mg/ml or higher. For total PCBs, the chance that anindividual would have diabetes if their PCB levels werein the top tertile was 3.9 fold greater than that for indi-viduals whose PCBs levels were in the bottom tertile af-ter adjustment for gender, age, body mass index andsmoking. For the two pesticides, the risks were evenmore elevated. However for mirex, a different orga-nochlorine pesticide, there was no significant elevation inrisk of diabetes with exposure. When individual PCBcongeners were studied, the risk associated with PCB74 (a congener most associated with consumption ofcontaminated fish) was 4.9 fold for the highest to lowesttertile.
Animal studies are consistent with the evidence thatPCB and dioxin exposure increases risk of diabetes.Nishizume et al., 1995 showed that rats given Kanechlor-400 (a Japanese equivalent to Aroclor) showed depressedinsulin sensitivity which increased with the duration of PCBexposure, as well as disturbed glucose and lipid metabo-lism and elevated serum lipids. Stahl , 1995 reported thatdioxin alters enzyme activity related to glucose metabo-lism in rat liver cells. Several older studies have demon-strated morphological changes in the structure of the pan-creatic beta cells upon PCB exposure (Kimbrough et al.,1972; Wassermann et al., 1975). Boll et al., 1998 dem-onstrated that gluconeogenic enzymes in rat liver are al-tered upon PCB exposure.
CONCLUSION
Bertazzi PA, Bernucci I, Brambilla G, Consonni D, and Pesatori AC(1998) The Seveso studies on early and long-term ef-fects of dioxin exposure: a review. Environ HealthPerspect 106 (Suppl 2) 625-633.
Boll M, Webber LWD, Messner B and Stampfl A (1998) Polychlo-rinated biphenyls affect the activities of gluconeogenicand lipogenic enzymes in rat liver: is there an interfer-ence with regulatory hormone actions? Xenobiotica 28:479-492.
Codru, N, Schymura MUJ, Negoita S, The Akwesasne Task Forceon the Environment, Rej R and Carpenter DO (2007) Dia-betes in relation to serum levels of polychlorinated bi-phenyls (PCBs) and chlorinated pesticides in adult Na-tive Americans. Environ Health Perspect. In press.
Cranmer M, Louie S, Kennedy RH, Hern PA and Fonseca VA(2000) Exposure to 2,3,7,8-tetranchlorodibenzo-p-dioxin(TCDD) is associated with hyperinsulinemia and insulinresistance. Toxicol Sci 56: 431-436.
Everett CK, Frithsen, IL, Diaz VA, Koopman RJ, Simpson WM,and Mainous AG (2007) Association of a polychlori-nated dibenzo-p-dioxin, a polychlorinated biphenyl, andDDT with diabetes in the 1999-2002 National Health and
Cited References
Diabetes is a serious, life-threatening disease that isincreasing in frequency. It is usually ascribed to obe-sity and inactivity, along with genetic susceptibility.However, the growing body of evidence strongly in-dicates that exposure to persistent organic pollutantsis important, and indeed may be a very important fac-tor, in elevating risk for diabetes.

3
Health and Environment Bulletin - Vol 1, Nbr 2
Nutrition Examination Survey. Environ Res doi:10.1016/j.envres.2006.11.002.
Fierens S, Mairesse H, Heilier JF, deBurbure C, Focant JF, Eppe G,et al. Dioxin/polychlorinated bihpenyl body burden,mdiabetes and endometriosis: findings in a population-based study in Belgiuym. Biomarkers 2003; 3: 529-534.
Henriksen GL, Ketchum NS, Michalek JE, and Swaby JA (1997)Serum dioxin and diabetes mellitus in veterans of Op-eration Ranch Hand. Epidemiology 8: 252-258.
IOM (Institute of Medicine of the National Academies of Sci-ences) (2000) Veterans and Agent Orange: Herbicide/Dioxin Exposure and Type 2 Diabetes. The NationalAcademy Press, Washington, D.C.
IOM (Institute of Medicine of the National Academies of Sci-ences) (2003) Dioxins and dioxin-like compounds inthe food supply: Strategies to Decrease Exposure. TheNational Academies Press, Washington, D.C.IRAC (In-ternational Agency for Research on Cancer) (2004) IARCMonographs Programme on the Evaluation of Carcino-genic Risks to Humans. Available at http://www-cie.iarc.fr/.
Kimbrough RD, Linder RE and Gaines TB. (1972) Morphologicalchanges in livers of rats fed polychlorinated biphenyls.Arch Environ Health 25: 354-364.
Lee DH, Lee IK, Song K, Steffes M, Toscano W, Baker BA andJacobs DR (2006) A strong dose-response relation be-tween serum concentrations of persistent organic pol-lutants and diabetes. Diabetes Care 29: 1638-1644.
Lee D-H, Lee I-K, Steffest M and Jacobs DR (2007) Extendedanalyses of the association between serum concentra-tions of persistent organic pollutants and diabetes.Diabetes Care 30: 1596-1259
Longnecker MP, Klebanoff MA, Brock JW and Zhou H (2001)Polychlorinated biphenyl serum levels in pregnant sub-jects with diabetes. Diabetes Care 24: 1099-1101.
Nishizumi M and Higaki Y (1995) Effect of PCBs on insulin sensi-tivity in rats. Fukuoka Igaku Zasshi 86: 200-204.
Pesatori AC, Zocchetti C, Guercilena S, Consonni D, Turrini Dand Bertazzi PA (1998) Dioxin exposure and non-malig-nant health effects: a mortality study. Occup EnvironMed 55: 126-131.
Porta M (2006) Persistent organic pollutants and the burden ofdiabetes. Lancet 368: 558-559.
Rylander L, Rignell-Hydbom A and Hagmar L (2005) A cross-sectional study of the association between persistentorganochlorine pollutants and diabetes. Environmen-tal Health: A Global Access Science Source 4:28doi:10.1186/1476-069X-4-28.
Stahl BU (1995) 2,3,7,8-tetraclhlorodibenzo-p-dioxin blocks thephysiological regulation of hepatic phosphoenolpyru-
vate carboxykinase activity in primary rat hepatocytes.Toxicology 103: 45-52.
National Health and Nutrition Examination Survey (1999-2002).Cross-sectional associations of the serumconcentrations of persistent organic pollutants (POPs)with diabetes prevalence.
Vasiliu O, Cameron L, Gardiner J, DeGuire P and Karmaus W(2006) Polybrominated biphenyls, polychlorinatedbiphenyls, body weight and incidence of adult-onsetdiabetes mellitus. Epidemiology 17 : 352-359.
Vena J, Boffetta P, Becher H, Benn T, Bueno-de-Mesquita HB,Coggon D, et al. Exposure to dioxin and nonneoplasticmortality in the expanded IARC international cohortstudy of phenoxy herbicide and chlorophenol produc-tion workers and sprayers. Environ Health Perspect 1998:106 (Suppl 2): 645-653
Wassermann D, Wassermann M and Lemesch C (1975) Ultra-structure of beta-cells of the endocrine pancreas in ratsreceiving polychlorinated biphenyls. Environ PhysiolBiochem 5: 322-340.
Zimmet P, Albrti KGMM, Shaw J. Global and societal implica-tions of the diabetes epidemic. Nature 2001; 414: 782-787.
This publication authored by:
Dr. David O. Carpenter, DirectorInstitute for Health and EnvironmentSchool of Public HealthUniversity at Albany, SUNYProfessor: Environmental Health Sciences
and Biomedical Sciences

4
prst stdU.S. Postage Paid
Anchorage, AKPermit #183
505 West Northern Lights, Suite 205Anchorage, AK 99503
The Collaborative on Health and the Environment (CHE) is a nationalnon-partisan partnership of individuals and organizations concernedwith the role of the environment in human and ecosystem health. CHEseeks to raise the level of scientific and public dialogue about the roleof environmental contaminants and other environmental factors in manyof the common diseases, disorders, and conditions of our time. CHEpromotes interdisciplinary discussions, sharing of scientific evidence,outreach and education, and an agenda to bring about systemic changein improving environmental public health. Underlying all of CHE’s activi-ties is a commitment to strong, uncompromised science. We believethat the truth emerges through discussion and that civility among CHEpartners is a condition of honest dialogue and learning. Visit us at:www.healthandenvironment.org.
The Collaborative on Health and the Environment - AlaskaThe Collaborative on Health and the Environment - AlaskaThe Collaborative on Health and the Environment - AlaskaThe Collaborative on Health and the Environment - AlaskaThe Collaborative on Health and the Environment - Alaska
Alaska Community Action on Toxics (ACAT) is a statewide environmental health and justice organization established in 1997. Our mission is to assurejustice by advocating for environmental and community health. We believe that everyone has the right to clean air, clean water, and toxic-free food.
We help communities implement effective strategies to limit their exposure to toxic substances and to protect and restore the ecosystems that sustainthem and their way of life.
We work to eliminate the production and release of harmful chemicals by industry and military sources, ensure the public’s right to know, achievepolicies based on the precautionary principle, and support the rights of Indigenous peoples.
CHE-Alaska formed as a regional group in December 2005 followingthe Alaska Conference on Health and the Environment. We inviteparticipation from health care professionals, researchers, health-affectedand patient groups, students, advocacy organizations, and any indi-vidual concerned about protecting the health of current and futuregenerations from environmental harm. Visit us at: www.akaction.org.

505 W. Northern Lights, Suite 205 Anchorage, AK 99503 Phone: (907) 222-7714
Fax: (907) 222-7715 www.akaction.org
Benzene WHAT IS BENZENE? Benzene is a colorless liquid with a sweet odor. It evaporates into the air very quickly and dissolves slightly in water. It is highly flammable and is formed from both natural processes and human activities. Benzene is a natural part of crude oil, gasoline, and cigarette smoke. Natural sources of benzene also include volcanoes and forest fires. Industrial use includes adding benzene with other chemicals to make plastics, resins, and nylon and other synthetic fibers. Benzene is also used to make some types of rubber, lubricants, dyes, detergents, drugs, and pesticides.1 HOW ARE WE EXPOSED? We are exposed to benzene in the following ways: Outdoor air contains low levels of
benzene from tobacco smoke, automobile service stations, exhaust from motor vehicles, and industrial emissions. Air around hazardous waste sites or gas
stations contains higher levels of benzene. Vapors (or gases) from products that
contain benzene, such as glues, paints, furniture wax, and detergents, can also be a source of exposure. Working in industries that make or use
benzene may also result in exposure.
SYMPTOMS & HEALTH OUTCOMES Breathing high levels of benzene can
cause drowsiness, dizziness, rapid heart rate, headaches, tremors, confusion, unconsciousness, and even death.2,3 Eating or drinking foods containing high
levels of benzene can cause vomiting, irritation of the stomach, dizziness, sleepiness, convulsions, rapid heart rate, and even death.4,5 Long-term exposure to benzene has a
major effect on the blood. Benzene causes harmful effects on bone marrow and can decrease red blood cells leading to anemia.6 It can also cause excessive bleeding and can affect the immune system, increasing the chance for infection.7,8,9 Breathing high levels of benzene for
many months has been associated with irregular menstrual periods and a decrease in the size of ovaries.10 It is not known whether benzene affects fertility in men. Benzene has been determined to be
carcinogenic.11 Long-term exposure to high levels of benzene in the air can cause leukemia, particularly acute myelogenous leukemia (AML), a cancer of the blood-forming organs.12,13 Benzene can pass from the mother’s
blood to a fetus.14 Animal studies have shown low birth weights, delayed bone formation, and bone marrow damage when pregnant animals breathed benzene.15

FOLLOW UP ACTION Several tests can show if a patient has been exposed to benzene: Conduct a test to measure benzene in the
breath; this test must be done shortly after exposure. Benzene can also be measured in the
blood; however, since benzene disappears rapidly from the blood, this test is only useful for recent exposures.
If you think your patient may been exposed to benzene: Refer patient to a physician. Chronic exposure can be addressed by
treating the symptoms and informing patients about ways to limit future exposure to benzene (see “Reducing Your Exposure” section below).
REDUCING YOUR EXPOSURE You can prevent or minimize exposure to benzene in the following ways: Whenever possible, limit contact with gasoline and cigarette smoke. Families are
encouraged not to smoke in the home, in enclosed environments, or near children. Be aware of fumes from gasoline and from products that contain benzene such as
paints, glues, furniture wax, and some detergents. When using these products, make sure that you are in a well ventilated area, such as outdoors or next to an open window or vent.
Avoid idling vehicles in front of school doors or vent intakes. Keep the door between the garage (or other area where gasoline is stored) and the
home shut tightly to decrease the inhalation of benzene from gasoline.
1 Agency for Toxic Substances and Disease Registry (ATSDR). 2007. Toxicological profile for benzene [update]. Atlanta, GA: U.S. Department of Health and Human Services, Public Health Service. Available: http://www.atsdr.cdc.gov/toxprofiles/tp3.pdf. 2 Cronin HJ. 1924. Benzol poisoning in the rubber industry. Boston Medical and Surgical Journal, 191: 1164-1166. 3Greenburg L. 1926. Benzol poisoning as an industrial hazard. Public Health Rep, 41: 1357-1375. 4 Von Oetingen WF. 1940. Toxicity and potential dangers of aliphatic and aromatic hydrocarbons. Public Health Bulletin, 255: 66-97. 5 Thienes CH & Haley TJ. 1972. Clinical Toxicology. 5th Edition ed. Lea & Febiger, Philadelphia, PA. 6 Snyder, R. 2007. Benzene’s toxicity: A consolidated short review of human & animal studies by HA Khan. Human and Experimental Toxicology 26(9): 687-696. 7 Hunter CG & Blair D. 1972. Benzene: Pharmacokinetic studies in man. Ann Occup Hyg, 15: 193-199. 8 Hsieh GC, Sharma RP & Parker RDR. 1988. Subclinical effects of groundwater contaminants I: Alteration of humoral and cellular immunity by benzene in CD-1 mice. Arch Environ Contam Toxicol, 17: 151-158. 9 Huff JE et al. 1989. Multiple-site carcinogenicity of benzene in Fischer 344 rats and B6C3F1 mice. Environ Health Perspect, 82: 125-163. 10 Thurston et al. 2000. Petrochemical exposure & menstrual disturbances. American Journal of Industrial Medicine 38(5): 555-564. 11 Agency for Toxic Substances and Disease Registry (ATSDR). 2007. Toxicological profile for benzene [update]. Atlanta, GA: U.S. Department of Health and Human Services, Public Health Service. 12 Aksoy M, Dincol K, Akgun T, Erdem S & Dincol G. 1971. Haematological effects of chronic benzene poisoning in 217 workers. Br J Ind Med, 28: 296-302. 13 Yin S-N et al. 1989. A retrospective cohort study of leukemia and other cancers in benzene workers. Environ Health Perspect, 82: 207-213. 14 Dowty BJ, Laseter JL & Storer J. 1976. The transplacental migration and accumulation in blood of volatile organic constituents. Pediatr Res, 10: 696-701. 15 Tatrai E, Ungvary GY, Hudak A, Rodics K, Lorincz M & Barcza GY. 1980. Concentration dependence of the embryotoxic effects of benzene inhalation in CFY rats. J Hyg Epidemiol Microbiol Immunol, 24: 363-371.

505 W. Northern Lights, Suite 205 Anchorage, AK 99503 Phone: (907) 222-7714
Fax: (907) 222-7715 www.akaction.org
Bisphenol-A (BPA)
WHAT IS BISPHENOL-A? Bisphenol-A (BPA) is a high-volume production chemical used to make epoxy resin and polycarbonate plastic products, including some kinds of water bottles, baby bottles, and food storage and heating containers.1 It is also used in the lining of metal food cans and in dental sealants, and is an additive to certain plastics used in children’s toys.1,2 The chemical was first developed as a synthetic estrogen and was later polymerized to produce polycarbonate.3,4 Bisphenol-A mimics estrogen activity and is known as an “endocrine disruptor,” a chemical that interferes with the hormonal system in animals and humans and contributes to adverse health effects.1 New scientific evidence is emerging that demonstrates that exposure to bisphenol-A may affect multiple organs and systems within the bodies of animals and people. HOW ARE WE EXPOSED TO BISPHENOL-A? Humans are exposed to bisphenol-A on a daily basis through consumption of food and beverages contaminated with bisphenol-A, as well as environmental contamination. Polycarbonate plastic can become unstable over time and with use, allowing bisphenol-A to leach into material in contact with the plastic.4 Additionally, bisphenol-A is now found nearly everywhere in the environment and commonly found in dust particles, surface water and drinking water, as over 6 billion pounds are produced worldwide each year5 and the production of bisphenol-A releases
approximately 2 hundred thousand pounds of the chemical into the atmosphere annually.6 BISPHENOL-A IN OUR BODIES A recent study by scientists from the U.S. Centers for Disease Control and Prevention found that 92.6% of Americans now carry bisphenol-A in their urine at an average level of 2.6 µg/L.7 Although the United States Environmental Protection Agency (EPA) considers exposure to 50 µg/kg/day of bisphenol-A safe, this standard was set in 1993 and is based on studies from the 1980s.8 In a review of scientific literature on BPA conducted in 2005, researchers found numerous studies indicate a wide range of health effects from exposure to bisphenol-A at much lower doses (as low as 2 parts per billion in some studies) than considered “safe” by the EPA.9 In August 2007, over 30 scientific experts on bisphenol-A, known as the Chapel Hill panel, published a consensus statement in the peer-reviewed journal Reproductive Toxicology, stating significant evidence indicates adverse health effects occur in animals at levels within the range of exposure that is typical for humans living in developed countries.10 In 2007, the Canadian Government began several studies of the effects of bisphenol-A on human health and the environment. They found that newborns and infants up to 18 months of age were exposed to levels of BPA similar to exposure levels that showed

effects in laboratory animals.11 More recently, the US National Toxicology Program (NTP) Center for the Evaluation of Risks to Human Reproduction (CERHR) released the NTP-CERHR Monograph on the Potential Human Reproductive and Developmental Effects of Bisphenol-A which contributed significantly to the discussion of bisphenol-A’s health effects. This report identified evidence from animal studies which raised “some concern” that current exposure levels to bisphenol-A to human infants, fetuses, and children may result in developmental changes to the prostate gland and brain.12 Due to the panel’s concern about the effects of bisphenol-A on children under six, the NTP has teamed up with the CDC to investigate further the effects on bisphenol-A on young children, infants, and neonates.13 WHAT DOES EXPOSURE TO BISPHENOL-A MEAN FOR OUR HEALTH? While the majority of research on bisphenol-A has been conducted on animals and cell cultures, there is strong evidence that similar effects occur in humans. The Chapel Hill panel concluded in August 2007, “Based on existing data we are confident … the similar effects observed in wildlife and laboratory animals exposed to bisphenol-A predict that similar effects are also occurring in humans.” Moreover, research on estrogenic compounds all over the world is finding consistently that “animal studies of the effects of estrogenic substances are highly predictive of human impacts.”
14 Recent research has linked bisphenol-A to the following health effects: Endocrine disruption: As early as 1936, bisphenol-A was shown to be an environmental estrogen. Compared with natural estrogen, bisphenol-A is a less potent activator of the classic estrogen receptor, but in recent years it has been recognized that “BPA is equipotent with estradiol in its ability to activate responses
via recently discovered estrogen receptors associated with the cell membrane,” as found in several studies on cell culture and laboratory animals. In addition to being shown to attach to estrogen receptors, evidence suggests that bisphenol-A also can change endogenous hormone synthesis, hormone metabolism and
Ehormone concentrations in blood. xposure to bisphenol-A has been shown to cause changes in tissue enzymes and hormone receptors as well as interacting with other hormone- response systems. Recurrent miscarriage: Researchers found that women with a history of recurrent miscarriage had average blood serum levels of bisphenol-A at 2.59 ng/ml, more than three times higher than women with successful pregnancies,15 a finding predicted by previous animal studies.16 Altered mammary gland development: In a laboratory study, mammary gland development was significantly altered in mice exposed to 250 ng BPA/kg body weight/day of bisphenol-A,17 which is 2000 times lower than the EPA’s safety standard for bisphenol-A (0.5 mg/kg/day). Scientists suggest that this study’s implications for human health include increased susceptibility to breast cancer after perinatal exposure to bisphenol-A. Low doses of bisphenol-A have also been shown to decrease the effectiveness of chemotherapeutic agents used for breast cancer.18 Prostate cancer: Research using cell cultures showed that a concentration of bisphenol-A of 1 nM made

prostate cancer cells less responsive to the hormone treatment used to control prostatic adenocarcinomas into remission.19 Whether this cell culture impact also occurs in people is uncertain, but the concentration is lower than the average level of bisphenol-A found in Americans, as reported in 2008.7 Altered brain development and behavior: Scientists found that bisphenol-A exposure in the womb changes sexual differentiation of the brain and behavior in rats at only 30 µg/kg/day,20 lower than the dose considered safe by the EPA.8 For some behaviors tested, results suggest that bisphenol-A exposure was linked to both demasculinization of males and defeminization of females.
At doses considered safe by the EPA, bisphenol-A blocked the synapse of estradiol in the hippocampus and prefrontal cortex of rodents and non-human primates.21 This signaling pathway may play a critical role in mood and cognition for humans. Insulin resistance and cardiovascular diseases: A recent study in adult mice provided evidence of a link between bisphenol-A exposure and increased risk of type II diabetes, hypertension and dyslipidemia.22 In this study, scientists found that chronic exposure to low doses of bisphenol-A leads to insulin resistance in adult mice. Doses used in their experiments were 5 times lower than the dose considered safe by the EPA.8 Based on population-wide exposure data from 2003-2004, scientists examined links between urinary bisphenol-A levels and chronic diseases in adults between the ages of 18 and 74.23 They found high urinary levels of bisphenol-A are linked to cardiovascular diagnoses. Adults in this study who had high urinary levels of BPA were also more likely to have diabetes.
Developmental origins of adult health and disease: The 2007 “Chapel Hill Bisphenol A Expert Panel Consensus Statement: Integration of Mechanisms, Effects in Animals and Potential to Impact Human Health at Current Levels of Exposure” states that enough evidence exists to suggest that adverse health outcomes may not become apparent until after exposure during critical developmental periods has happened Especially of concern is that “these developmental effects are irreversible and can occur due to low-dose exposure during brief sensitive periods in development, even though no BPA may be detected when the damage or disease is expressed.”
.
,2
Disruption of hormone signaling pathways by BPA during critical periods of development also may lead to obesity.24 REGULATIONS FOR BISPHENOL-A Federal regulation of toxic chemicals is an important part of protecting public health. However, according to the Environmental Working Group, “The nation's system of regulations for industrial chemicals like [bisphenol-A] are embodied in the Toxic Substances Control Act, a law passed in 1976, and the only major environmental or public health statute that has never been updated.”25 Furthermore, “under this law, companies are not required to test chemicals for safety before they are sold, and are not required to track whether their products end up in people or the environment at unsafe levels.” To date, the U.S. Food and Drug Administration has not performed a standard toxicology study or determined an Acceptable Daily Intake (ADI) for bisphenol-A. 6 Policies are currently being considered on a federal level that prohibit the sale of products that contain bisphenol-A.27 On March 13, 2009, leaders from the House of Representatives and the Senate announced legislation which would ban the use of

bisphenol-A in all food and beverage containers.28 Several states have also introduced legislation which would limit the sale of bisphenol-A, especially in children’s products. In 2008, Maine enacted the Toxic Chemicals in Children’s Products Act which
will phase out the use of chemicals, including BPA, that have been scientifically proven to cause cancer, reproductive toxicity, developmental toxicity, or endocrine disruption.29 In March 2009, Canada became the first nation to restrict the use of bisphenol-A in children’s products.30
REDUCING YOUR EXPOSURE You can prevent or minimize exposure to bisphenol-A in the following ways:
Use glass, stainless steel, or polyethylene bottles (PETE, PET, or #1; HDPE or #2; LDPE or #4) instead of polycarbonate (PC or #7) bottles.24
Avoid using polycarbonate containers to store hot foods or to heat foods in microwaves, as bisphenol-A tends to leach faster with higher temperatures.25 Use glass or ceramic containers instead.
Cut back on consumption of canned foods to reduce exposure to bisphenol-A contamination from the interior coating of the container. Also, avoid canned foods with higher fat content, which may have higher levels of bisphenol-A.25
Before getting dental sealants, check with your dentist about the ingredients in the products they use, as some formulations may leach bisphenol-A.25
1 National Institute of Environmental Health Sciences (NIEHS). 2006. Endocrine Disruptors. Available: http://www.niehs.nih.gov/oc/factsheets/pdf/endocrine.pdf [Accessed 25 June 2007]. 2 Maffini MV, Rubin BS, Sonnenschein C, Soto AM. 2006. Endocrine disruptors and reproductive health: The case of bisphenol-A. Molecular and Cellular Endocrinology 254-255:179-186. 3 Colborn T, Dumanoski D, Myers JP. 1996. Our Stolen Future: Are We Threatening Our Fertility, Intelligence, and Survival?—A Scientific Detective Story. New York: Dutton. 4 Myers JP (Ed). Our Stolen Future: Background on BPA: What is it, how is it used and what does science say about exposure risks. Available: http://www.ourstolenfuture.org/NewScience/oncompounds/bisphenola/bpauses.htm [Accessed 9 July 2007]. 5 Susiarjo M, Hassold TJ, Freeman E, Hunt PA. 2007. Bisphenol A exposure in utero disrupts early oogenesis in the mouse. PLoS Genetics 3(1):63-70. 6 Markey CM, Michaelson CL, Sonnenschein C, Soto AM. 2001. Alkylphenols and bisphenol A as environmental estrogens. In: Metzler M (Ed.), The Handbook of Environmental Chemistry. Part L, Endocrine Disruptors—Part I, vol. 3. Springer-Verlag, Berlin Heidelberg, pp. 129–153. 7 Calafat AM, Ye X, Wong LY, Reidy JA, Needham LL. 2008. Exposure of the US population to bisphenol A and 4-tertiary-octylphenol: 2003-2004. Environmental Health Perspectives 116(1): 39-44. 8 United States Environmental Protection Agency (EPA), Integrated Risk Information System. 1993. Bisphenol A. CASRN 80-05-7. Available: http://www.epa.gov/iris/subst/0356.htm [Accessed 2 July 2007]. 9 vom Saal F, Hughes C. 2005. An extensive new literature concerning low-dose effects of bisphenol A shows the need for a new risk assessment. Environmental Health Perspectives, 113(8): 926-933. 10 vom Saal F, Akingbemi BT, Belcher SM, Birnbaum LS, Crain DA, Eriksen M, et al. 2007, Aug-Sep. Chapel Hill bisphenol A expert panel consensus statement: Integration of mechanisms, effects in animals and potential to impact human health at current levels of exposure. Reproductive Toxicology 24(2):131-8. 11 Government of Canada. 2008. Bisphenol A research and monitoring activities. Available: www.chemicalsubstanceschimiques.gc.ca/challenge-defi/BPA_Research_fs_e.html (Accessed 5 March 2009). 12 US National Toxicology Program (NTP) Center for the Evaluation of Risks to Human Reproduction (CERHR). 2008. NTP-CERHR Monograph on the Potential Human Reproductive and Developmental Effects of Bisphenol A. NIH Publication No. 08-5994. Research Triangle Park, NC: National Toxicology Program. Available: http://cerhr.niehs.nih.gov/chemicals/bisphenol/bisphenol.pdf [Accessed 18 March 2009]. 13 Bucher JR. 2009. Bisphenol A: Where to now? Environmental Health Perspectives 117(3): A96-A97.

14 Myers JP (Ed). Our Stolen Future: Scientists call for new risk assessment of bisphenol A and reveal industry biases in research. Available: http://www.ourstolenfuture.org/NewScience/oncompounds/bisphenola/2005/2005-0413vomsaalandhughes.htm [Accessed 10 September 2007]. 15 Sugiura-Ogasawara M, Ozaki Y, Sonta S, Makino T, Suzumori K. 2005. Exposure to bisphenol A is associated with recurrent miscarriage. Human Reproduction 20:2325-2329. 16 Hunt PA, Koehler KE, Susiarjo M, Hodges CA, Ilagan A, Voigt RC, et al. 2003. Bisphenol A exposure causes meiotic aneuploidy in the female mouse. Current Biology 13:546-553. 17 Muñoz-de-Toro M, Markey C, Wadia PR, Luque EH, Rubin BS, Sonnenschein C, Soto AM. 2005. Perinatal exposure to bisphenol A alters peripubertal mammary gland development in mice. Endocrinology 146:4138-4147. 18 Lapensee EW, Tuttle TR, Fox SR, Ben-Jonathan N. 2009. Bisphenol-A at low nanomolar doses confers chemoresistance in estrogen receptor-alpha-positive and negative breast cancer cells. Environmental Health Perspectives 117(2): 175-180. 19 Wetherill YB, Petre CE, Monk KR, Puga A, Knudsen KE. 2002. The xenoestrogen bisphenol A induces inappropriate androgen receptor activation and mitogenesis in prostatic adenocarcinoma cells. Molecular Cancer Therapeutics 1(7):515-24. 20 Kubo K, Arai O, Omura M, Wantanabe R, Ogata R, Aou S. 2003. Low dose effects of bisphenol A on sexual differentiation of the brain and behavior in rats. Neuroscience Research 45:345-356. 21 Leranth C, Hajszan T, Szigeti-Buck K, Bober J, MacLusky NJ. 2008. Bisphenol A prevents the synaptogenic response to estradiol in hippocampus and prefrontal cortex of ovariectomized nonhuman primates. Proceedings of the National Academy of Sciences of the United States of America 105(37): 14187-14191. 22 Alonso-Magdalena P, Morimoto S, Ripoll S, Fuentes E, Nadal A. 2006. The estrogenic effect of bisphenol-A disrupts the pancreatic ß-cell function in vivo and induces insulin resistance. Environmental Health Perspectives 114:106-112. 23 Lang IA, Galloway TS, Scarlett A, Henley WE, Depledge M, Wallace RB, et al. 2008. Association of urinary bisphenol A concentration with medical disorders and laboratory abnormalities in adults. Journal of the American Medical Association 300(11): 1303-1310. 24 Grun F, Blumberg B. 2007. Perturbed nuclear receptor signaling by environmental obesogens as emerging factors in the obesity crisis. Reviews in endocrine and metabolic disorders 8(2): 161-171. 25 Sutton R, Jackson J. Walker B, Tupper G, Horenstein B (eds.). 2007, July 12. Down the Drain: Sources of Hormone-Disrupting Chemicals in San Francisco Bay. Oakland, CA: Environmental Working Group. Available: http://www.ewg.org/reports/downthedrain [Accessed 10 September 2007]. 26 U.S. Food and Drug Administration. 2007. Cumulative Estimated Daily Intake/Acceptable Daily Intake Database. Available: http://www.cfsan.fda.gov/~dms/opa-edi.html [Accessed 10 September 2007]. 27 Lowell Center for Sustainable Production. 2009. US State level chemicals policy. Available: http://www.chemicalspolicy.org/usstatelevel.shtml [Accessed 18 March 2009]. 28 Kissinger M. 2009. US lawmakers move to ban BPA from food, beverage containers. Milwaukee Journal Sentinel. Available: www.jsonline.com/watchdog/watchdogreports/41215752.html [Accessed 24 March 2009]. 29 Maine Revised Statutes. 2008. Title 38, Chapter 16-D: Sections 1691-1699-B. Available: http://www.mainelegislature.org/legis/statutes/38/title38ch16-Dsec0.html [Accessed 18 March 2009]. 30 Health Canada. 2008. Government of Canada protects families with bisphenol A regulations. Available: www.hc-sc.gcca/ahc-asc/media/nr-cp/_2008/2008_167-eng.php [Accessed 5 March 2009].

505 W. Northern Lights, Suite 205 Anchorage, AK 99503 Phone: (907) 222-7714
Fax: (907) 222-7715 www.akaction.org
Cyanide WHAT IS CYANIDE? Cyanide can appear in several forms, such as a liquid, gas, powder, or as crystals/salts. It has a faint, bitter, almond-like odor. It can be found naturally in some foods, plants, and can be in the smoke of burning wood, paper, plastics and manmade fibers.1 Cyanide is used in industry, including gold and silver mining, electroplating, production of plastics, manmade fibers, colors and dyes, pesticides, developing photos and as a fumigant to get rid of pests in ships.1 The use of cyanide in gold mining is controversial. Some states, such as Montana, and some cities have entirely banned all the uses of cyanide in mining.2 Cyanide is toxic in small amounts. Cyanide in water and soil is a health hazard to people and animals.2 Mining can contaminate surface streams, wetlands, rivers, and groundwater downstream. Cyanide reacts to form other compounds that are toxic and persistent. Fish, plants and other living organisms are sensitive to the effects of cyanide and its associated compounds. HOW ARE WE EXPOSED? The three most common ways that people may be exposed to cyanide are: Fire from a burning building:
Inhaling smoke from a building fire is one of the most common ways that people can be poisoned by cyanide.
Hydrogen cyanide may be produced during fires when products such as wool, paper, cotton, silk, and plastics are burned. Cyanide-related industry: People
can be exposed to cyanide through breathing air, drinking water, touching soil, or eating foods contaminated with cyanide through industrial operations such as mining. Accidents during the transportation of cyanide for mining may also be a source of exposure. Tobacco use: Smoking tobacco is a
major source of cyanide exposure.3 SYMPTOMS & HEALTH PROBLEMS Cyanide is a poison if a person swallows it in water or food, breathes it in, or contacts it with skin:1 Swallowing cyanide: Depending on
the amount swallowed, the first signs of cyanide poisoning could be deep breathing and shortness of breath, followed by convulsions (seizures) and loss of consciousness.1 It can later cause apnea (a condition when a person stops breathing or breathes intermittently). Breathing: Inhalation of small amounts
of cyanide may cause headache, dizziness, weakness, and vomiting. Inhalation of larger amounts may cause gasping, irregular heartbeat, seizures, fainting, and rapid death.1 Skin contact: When cyanide comes in
contact with skin, the symptoms are the same as when it is inhaled.1 Long-term health effects of
exposure to cyanide: Survivors of

serious cyanide poisoning may develop heart and brain damage.3
FOLLOW UP ACTION If you think your patient may have been
exposed to cyanide, refer patient to a physician.
Reducing Your Exposure You can prevent or minimize exposure to cyanide in the following ways: Try to quit smoking. Avoid breathing in tobacco smoke whenever possible. Evacuate a burning building immediately; smoke from burning plastics contains
cyanide (and carbon monoxide). Do not burn plastics. Cyanide in smoke can arise from the burning of certain
plastics. Although it may be uncertain how far contaminants may spread around mine
sites, it is advisable to have water and traditional food sources close to, downstream or downwind of these sites tested for the possibility of harmful exposures. If you have concerns about the safety of your water or traditional foods, contact ACAT or visit our website at www.akaction.org.
1 Agency for Toxic Substances and Disease Registry (ATSDR). 2006. Toxicological Profile for Cyanide. Atlanta, GA: U.S. Department of Health and Human Services, Public Health Service. 2 Moran, RE. Report on Industrial Use of Cyanide. Erskineville, Australia: Mineral Policy Institute. Available: http://www.mpi.org.au/campaigns/cyanide/cyanide_chemistry [Accessed 13 February, 2008]. 3 Centers for Disease Control and Prevention. 2004, January 27. Facts about Cyanide. Available: http://emergency.cdc.gov/agent/cyanide/basics/facts.asp [Accessed 13 February, 2008].

505 W. Northern Lights, Suite 205 Anchorage, AK 99503 Phone: (907) 222-7714
Fax: (907) 222-7715 www.akaction.org
Environmental Tobacco Smoke (ETS)
WHAT IS ENVIRONMENTAL TOBACCO SMOKE (ETS)? Environmental tobacco smoke (ETS), or secondhand smoke, is released into the air from exhaled tobacco smoke and burning cigarettes, cigars, and pipes. Tobacco smoke contains over 4,000 chemicals, many which are poisonous.1 There is new evidence that people are exposed to chemicals from tobacco smoke long after a person has smoked in a given indoor area.2,3,4,5 Thirdhand smoke is a new term for tobacco toxins that remain and persist after a period of active smoking. These chemicals are deposited on surfaces such as tables, furniture, and floors, as well as in dust. Thirdhand smoke also volatizes and contaminates air for days, weeks, and even months after the smoking has ceased.2 HOW ARE WE EXPOSED? Smoking cigarettes Inhaling secondhand smoke Smoking indoors, which may increase
exposure, especially in poorly ventilated areas6 Inhalation of contaminated indoor air or
contact with surfaces contaminated with thirdhand smoke2
SYMPTOMS & HEALTH PROBLEMS Children exposed to secondhand smoke may experience the following short-term health effects:7 Upper and lower respiratory infections8
Otitis media with effusion, or fluid in the middle ear9,10,11 Sudden infant death syndrome
(SIDS)12,13,14 Worsening of asthma8,15,16,17 Bronchitis18,19 Pneumonia18,19 Impaired growth and
development20,21,22 Children exposed to secondhand smoke may experience the following long-term health effects:7
Reduced lung function23,24 Higher risk of asthma25 Higher risk of cancer8,26 The following health effects have been linked to exposure to secondhand smoke in adult non-smokers:7 Higher risk of lung cancer8 Higher risk of coronary heart
disease18,27 FOLLOW UP ACTION Refer to the Community Health Aide
Manual (CHAM) section, “Stopping Tobacco” for detailed information on helping patients quit smoking. Patients are more likely to quit with the advice and support of their health care providers.7 If the patient needs medications to quit
or is pregnant, breastfeeding, or a teenager, refer patient to a physician.

A new study shows that adults who are aware of the harms to children from thirdhand smoke are more likely to have a no-smoking rule in the home.2 Thus, incorporating the idea of thirdhand
smoke into tobacco counseling messages could discourage smoking in the home.
REDUCING YOUR EXPOSURE You can prevent or minimize exposure to tobacco and secondhand smoke in the following ways: Try to quit or cut back on smoking to improve your health and the health of your
loved ones. Avoid smoking around other people to reduce their exposure to secondhand
smoke. Avoid smoking indoors, especially in areas that are not well ventilated, to reduce
secondhand and thirdhand smoke. Non-smokers can reduce their exposure to secondhand smoke by avoiding indoor
areas where people smoke or by starting a no-smoking rule in their homes or workplaces.
Parents who smoke should cover their clothes with a clean jacket or shirt before picking up or holding a baby.
Both smokers and nonsmokers may reduce their risk of cancer in the following ways: Eat dark berries (such as blueberries and crowberries) and other foods high in
flavonoids daily. The National Cancer Institute reports that foods containing flavonoids (particularly onions and apples) may reduce lung cancer risk by nearly 50 percent.28 Freezing berries is even better, as it bursts the cell membrane and increases the body’s ability to absorb and use these nutrients.
Eat foods high in lutein, such as leafy greens (including kale and spinach), carrots, corn, red peppers, romaine lettuce, tomatoes, potatoes, and red, blue and purple fruits. Foods containing lutein are linked to a lower risk of lung, breast and colon cancers.29
Consider drinking green tea, which contains high amounts of antioxidants and is less processed than black tea.29 Many studies show that green tea protects against cancer development.30,31,32 Smokers who drink green tea have shown decreased oxidative DNA damage, which is a precursor to cancer.33 Green tea may also fight cancer in people who have already been diagnosed, for instance by preventing breast cancer from coming back34 and helping ovarian cancer survivors to live longer.35 When preparing green tea, steep for at least 5 minutes to make sure that a greater concentration of antioxidants are released, and avoid adding milk or cream which may inactivate the antioxidants.29
1 National Research Council. 1986. Environmental Tobacco Smoke: Measuring Exposures and Assessing Health Effects. Washington, DC: National Academies Press. 2 Winickoff JP, Friebely J, Tanski SE, Sherrod C, Matt GE, Hovell MF, et al. 2009, Jan. Beliefs about the health effects of “thirdhand” smoke and home smoking bans. Pediatrics 123(1): e74-e79. 3 Singer BC, Hodgson AT, Nazaroff WW. 2003. Gas-phase organics in environmental tobacco smoke: 2—exposure-relevant emission factors and indirect exposures from habitual smoking. Atmos Environ 37(39):5551–5561.

4 Matt GE, Quintana PJ, Hovell MF, et al. 2004. Households contaminated by environmental tobacco smoke: sources of infant exposures. Tob Control 13(1):29–37. 5 Singer BC, Hodgson AT, Guevarra KS, Hawley EL, Nazaroff WW. 2002. Gas-phase organics in environmental tobacco smoke: 1—effects of smoking rate, ventilation, and furnishing level on emission factors. Environ Sci Technol 36(5):846–853. 6 Greater Boston Physicians for Social Responsibility. Provider Reference Card. Available: http://psr.igc.org/toolkit/ref_guide.pdf [Accessed 22 June, 2007]. 7 Etzel RA, ed. 2003. Pediatric Environmental Health. 2nd ed. Elk Grove Village, IL: American Academy of Pediatrics. 8 US Environmental Protection Agency. 1992. Respiratory Health Effects of Passive Smoking: Lung Cancer and Other Disorders. Research Triangle Park, NC: US Environmental Protection Agency, Office of Research and Development, Office of Air and Radiation. EPA Publication 600/6-90/006F. 9 DiFranza JR, Lew RA. 1996. Morbidity and mortality in children associated with the use of tobacco products by other people. Pediatrics 97:560-568. 10 American Academy of Pediatrics Committee on Environmental Health. 1997. Environmental tobacco smoke: A hazard to children. Pediatrics 99:639-642. 11 Etzel RA, Pattishall EN, Haley NJ, Fletcher RH, Henderson FW. 1992. Passive smoking and middle ear effusion among children in day care. Pediatrics 90:228-232. 12 Mitchell EA, Ford RP, Stewart AW, et al. 1993. Smoking and sudden infant death syndrome. Pediatrics 91: 893-896. 13 Schoendorf KC, Kiely JL. 1992. Relationship of sudden infant death syndrome to maternal smoking during and after pregnancy. Pediatrics 90:905-908. 14 Klonoff-Cohen HS, Edelstein SL, Lefkowitz ES, et al. 1995. The effect of passive smoking and tobacco exposure through breast milk on sudden infant death syndrome. JAMA 273: 795-798. 15 Mannino DM, Moorman JE, Kingsley B, Rose D, Repace J. 2001. Health effects related to environmental tobacco smoke exposure in children in the United States: Data from the Third National Health and Nutrition Examination Survey. Arch Pediatr Adolesc Med 155:36-41. 16 Chilmonczyk BA, Salmun LK, Megathlin KN, et al. 1993. Association between exposure to environmental tobacco smoke and exacerbations of asthma in children. N Engl J Med 328:1665-1669. 17 Martinez FD, Cline M, Burrows B. 1992. Increased incidence of asthma in children of smoking mothers. Pediatrics 89:21-26. 18 California Environmental Protection Agency. 1997. Health Effects of Exposure to Environmental Tobacco Smoke. Sacramento, CA: California Environmental Protection Agency, Office of Environmental Health Hazard Assessment. 19 Davis RM. 1998. Exposure to environmental tobacco smoke: Identifying and protecting those at risk. JAMA 280:1947-1949. 20 British Medical Association (BMA) Board of Science and Education & Tobacco Control Resource Centre. 2004. Smoking and reproductive life: The impact of smoking on sexual, reproductive and child health. Available: www.tobacco-control.org/tcrc_Web_Site/Pages_tcrc/Resources/tcrc_Publications/Smoking&ReproductiveLife.pdf [Accessed April 9, 2009]. 21 Elwood PC, et al. 1987. Growth of children for 0-5 years: With special reference to mothers smoking in pregnancy. Ann Hum Biol 14: 543-57. 22 von Kries R, et al. 2002. Maternal smoking during pregnancy and childhood obesity. American Journal of Epidemiology 156: 954-61. 23 Berkey CS, Ware JH, Dockery DW, Ferris BG Jr, Speizer FE. 1986. Indoor air pollution and pulmonary function growth in preadolescent children. Am J Epidemiol 123:250-260. 24 Corbo GM, Agabiti N, Forastiere F, et al. 1996. Lung function in children and adolescents with occasional exposure to environmental tobacco smoke. Am J Respir Crit Care Med 154:695-700. 25 Larsson ML, Frisk M, Hallstrom J, Kiviloog J, Lundback B. 2001. Environmental tobacco smoke exposure during childhood is associated with increased prevalence of asthma in adults. Chest 120:711-717. 26 Sandler DP, Everson RB, Wilcox AJ, Browder JP. 1985. Cancer risk in adulthood from early life exposure to parents’ smoking. Am J Public Health 75:487-492. 27 Centers for Disease Control and Prevention, Office on Smoking and Health. 1986. The Health Consequences of Involuntary Smoking: A Report of the Surgeon General. Rockville, MD: Public Health Service. DHHS Publication (CDC) 87-8398. 28 Marchand L et al. 2000. Intake of flavenoids and lung cancer. Journal of the National Cancer Institute. 92:154-160. 29 Eldridge L, Borgeson D. 2007. Avoiding Cancer One Day at a Time” Practical Advice for Preventing Cancer. Edina, MN: Beaver’s Pond Press. 30 Sun CL. 2002. Urinary tea polyphenols in relation to gastric and esophageal cancers: A prospective study of men in Shanghai, China. Carcinogenesis 23:1497-1503. 31 Wu AH, et al. 2003. Green tea and risk of breast cancer in Asian Americans. International Journal of Cancer 106:574-579.

32 Zeegers MP, et al. 2001. Are coffee, tea and total fluid consumption associated with bladder cancer risk? Results from the Netherlands Cohort Study. Cancer Causes and Control 12:231-238. 33 Hakim IA, et al. 2004. Effect of a 4-month tea intervention on oxidative DNA damage among heavy smokers: Role of glutathione s-transferase genotypes. Cancer Epidemiology Biomarkers and Prevention 13:242-249. 34 Inoue M. 2001. Regular consumption of green tea and the risk of breast cancer reoccurrence: Follow-up study from the Hospital-based Epidemiologic Research Program at Aichi Cancer Center (HERPACC), Japan. Cancer Letters 167:175-182. 35 Zhang M, et al. 2004. Green Tea consumption enhances survival of epithelial ovarian cancer. International Journal of Cancer 112:465-469.

505 W. Northern Lights, Suite 205 Anchorage, AK 99503 Phone: (907) 222-7714
Fax: (907) 222-7715 www.akaction.org
Mercury and Gold Mining WHAT IS MERCURY? Mercury is a heavy metal that is found naturally in different forms in the environment. Major sources of mercury emissions in the United States come from coal-fired power plants, municipal and medical waste incinerators, and mining operations.1,2 The process of gold mining releases large amounts of mercury into the environment which results in mercury contamination. One way that mercury can be released into the environment from gold mining operations is from the use of cyanide to remove gold from the ore in which mercury is found. This process also removes mercury, which is then released into the environment.3 In the past, mercury itself was commonly used to remove gold, but in the United States this method has largely been replaced by cyanide removal methods (described above), with the exception of some recreational mining.2 Mercury can also be released into the environment from a number of other mining operations, such as heap leach operations, tailings facilities, waste rock piles, and ore processing methods involving heat.3 When mercury is present in water bodies and sediments, bacteria convert it into methylmercury, a compound that builds up through the food chain in fish, marine mammals, and humans.4 Mercury (in its elemental form) can also be found in medical equipment such as
sphygmomanometers (blood pressure meters), thermometers, and silver-colored dental amalgams used for fillings. Thermostats, fluorescent light bulbs, and some batteries may also contain mercury. These items may contaminate the environment if thrown away improperly in a landfill or incinerator. HOW ARE WE EXPOSED? Methylmercury: Methylmercury builds up in muscle tissue,
commonly causing exposure to happen from eating large, predatory fish, marine mammals, and wildlife at the top of the aquatic food chain such as polar bears.2,4,5 All species of wild Alaska salmon are very
low in mercury levels, so salmon is not a major source of mercury exposure.6 Methylmercury is also passed to fetuses
through the placenta and to nursing infants through breastmilk.4
Elemental Mercury: Exposure to elemental mercury usually
happens through inhalation of contaminated air near mines, hazardous waste sites, landfills, and other dump sites containing light bulbs, batteries, and medical waste.4 Mine workers may be exposed to mercury
by breathing mercury vapor.3 Exposure to elemental mercury may
happen in the home and other indoor areas due to broken fluorescent light bulbs.

Elemental mercury is only minimally absorbed after eating contaminated items or through the skin.4
SYMPTOMS & HEALTH OUTCOMES Mercury is a known mutagen (an agent
that changes, or mutates, genetic material) and teratogen (an agent that disrupts fetal or embryonic development) and a suspected carcinogen.2 While the EPA has not classified elemental mercury as a human carcinogen, based on “inadequate human and animal data,”7 it has determined that methylmercury is a possible human carcinogen.8 Methylmercury is highly toxic and is
linked to a variety of adverse health effects on the central nervous system, including visual and hearing impairment, tremors, and muscle spasms.4 One study found that prenatal
methylmercury exposure through mothers’ regular consumption of fish and marine mammals resulted in deficits in language, attention, and memory in children,9 even after researchers controlled for co-contamination by PCBs.10 (Please see the Polychlorinated Biphenyls [PCBs] fact sheet for more details.) There is strong evidence that mercury
exposure is linked to diseases such as cerebral palsy; impaired learning, memory, coordination, and attention span; mental retardation; hearing loss; dermatitis; psychiatric disturbances; seizures;11 and acute bronchitis and pneumonitis.12 Early signs of long-term exposure to
elemental mercury may include the following nonspecific symptoms of the central nervous system: insomnia, forgetfulness, loss of appetite, and mild
tremor. These symptoms may be misdiagnosed as psychiatric illness.4 The Alaska Mercury Biomonitoring
Program has tested over 350 women, including women from 6 villages in the Norton Sound region and Nome. According to their results, none of these women had hair mercury levels higher than the World Health Organization’s guideline of 14 parts per million, which is considered the lowest level linked to adverse health effects on the fetus.13,14
FOLLOW UP ACTION If you think your patient may have been
exposed to mercury, refer patient to a physician. Recommend breastfeeding to postpartum
patients.4 In communities at risk of chemical exposures, it is even more important that mothers breastfeed their babies because breast milk reduces the effects of the chemicals on infants and makes them healthier.15,16,17,18 Support eating traditional subsistence
foods, unless you have information that indicates mercury or other contamination. The Alaska Department of Department of
Health and Social Services, Division of Public Health (DPH) has offered the Statewide Maternal Hair Mercury Biomonitoring Program since 2002, which now provides free and confidential testing of mercury levels in hair for all Alaskan women of childbearing age (15-45 years old).13 Encourage women of child-bearing age to participate in the Alaska Mercury Biomonitoring Program. Information can be found online at http://www.epi.hss.state.ak.us/eh/biom.

REDUCING OUR EXPOSURE You can prevent or minimize exposure to mercury in the following ways: Eat fish with lower mercury levels, such as all species of wild Alaska salmon. The
Alaska Department of Department of Health and Social Services, Division of Public Health (DPH) recommends eating as much as you want of all species of wild Alaska salmon, as well as pacific cod, walleye pollock, black rockfish, pacific ocean perch, halibut under 20 pounds, lingcod under 30 inches length, and canned chunk light (not white) tuna.6
When eating ocean fish, consider eating smaller, younger fish whenever possible, as older fish tend to build up more mercury over time.5 The DPH recommends eating less of the following fish which are known to have high mercury levels: sablefish, halibut larger than 20 pounds, lingcod greater than 30 inches length, rougheye rockfish, yelloweye rockfish, salmon shark, and spiny dogfish. For detailed recommendations, see the DPH full report here: http://www.epi.alaska.gov/bulletins/docs/rr2007_04.pdf or call the DPH Section of Epidemiology at 907-269-8000.6
Do not burn products that may contain mercury, such as thermometers, thermostats, fluorescent light bulbs, and batteries.
o For instructions on recycling fluorescent light bulbs, please see the Solid Waste Alaska Network (SWAN) fact sheet here: http://www.ccthita-swan.org/pdf/fluorescent.pdf or call 800-344-1432, ext. 7184
o For information on recycling batteries, please see the Solid Waste Alaska Network (SWAN) webpage on battery recycling here: http://www.ccthita-swan.org/Tutorials/batt_recycle.cfm or call 800-344-1432, ext. 7184
For instructions on safe clean-up of broken fluorescent light bulbs, please see the ENERGY STAR fact sheet here: http://www.energystar.gov/ia/partners/promotions/ change_light/downloads/Fact_Sheet_Mercury.pdf or call the ENERGY STAR Hotline at 888-STAR-YES (888-782-7937).
In the event of spills, do not allow children or teens to play with liquid mercury. Although it is uncertain how far contaminants may spread around mine sites, it is
advisable to have water and traditional food sources close to, downstream or downwind of these sites tested for the possibility of harmful exposures. If you have concerns about the safety of your water or traditional foods, contact ACAT or visit our website at www.akaction.org.
1 Schettler T, Stein J, Reich F, Valenti M. 2000. In Harm’s Way: Toxic Threats to Child Development. Cambridge, MA: Greater Boston Physicians for Social Responsibility. 2 Eisler R. 2004. Mercury hazards from gold mining to humans, plants, and animals. Rev Environ Contam Toxicol 181: 139-198. 3 Breithaupt A. 2009, February. A Case for the Development of Mercury Regulations for Alaska’s Existing and Proposed Gold Mines. Anchorage: Alaskans for Responsible Mining. 4 Etzel RA, Balk SJ, eds. 2003. Pediatric Environmental Health. 2nd ed. Elk Grove Village, IL: American Academy of Pediatrics. 5 United States Geological Survey. 2000, October. Mercury in the Environment. Fact Sheet 146-00. Available: http://www.usgs.gov/themes/factsheet/146-00/ [Accessed 11 March 2009].

6 Verbrugge LA. 2007, October 15. Fish Consumption Advice for Alaskans. The Alaska Department of Department of Health and Social Services, Division of Public Health (DPH), Section of Epidemiology. Available: http://www.epi.alaska.gov/bulletins/docs/rr2007_04.pdf [Accessed April 9, 2009]. 7 United State Environmental Protection Agency (EPA), Integrated Risk Information System (IRIS). 2008, January 10. Mercury, elemental (CASRN 7439-97-6). Available: http://www.epa.gov/iris/subst/0370.htm [Accessed April 9, 2009]. 8 United State Environmental Protection Agency (EPA), Integrated Risk Information System (IRIS). 2008, January 10. Methylmercury (MeHg) (CASRN 22967-92-6). Available: http://www.epa.gov/iris/subst/0073.htm [Accessed April 9, 2009]. 9 Grandjean P, Weihe P, White RF, et al. 1997. Cognitive deficit in 7-year-old children with prenatal exposure to methylmercury. Neurotoxicol Teratol 6:417-428 10 Budtz-Jorgensen E, Keiding N, Grandjean P, White R, Weihe P. 1999. Methylmercury toxicity independent of PCB exposure. Environmental Health Perspectives 107(5): A236-7. 11 Collaborative on Health and the Environment. n.d. CHE toxicant and disease database. Available: http://database.healthandenvironment.org/index.cfm [Accessed 13 November, 2007]. 12 Jaffe KM, Shurtleff DB, Robertson WO. 1983. Survival after acute mercury vapor poisoning. Am J Dis Child 137:749-751. 13 Alaska Department of Health and Social Services, Division of Public Health (DPH). 2007, February 26. State of Alaska Epidemiology Bulletin: Alaska Mercury Biomonitoring Program Update, July 2002 - December 2006. Bulletin No. 4. 14 Joint FAO/WHO Expert Committee on Food Additives (JECFA). 2003. Summary and Conclusions, Sixty-first Meeting, Rome, Italy. Available at: http://www.who.int/entity/ipcs/food/jecfa/summaries/en/summary_61.pdf [Accessed January 9, 2009]. 15 Lanting CI, Patandin S, Weisglas-Kuperus N, Touwen BC, Boersma ER. 1998. Breastfeeding and neurological outcome at 42 months. Acta Paediatrica 87(12):1224–1229. 16 Patandan, S, Lanting CI, Mulder PG, Boersma ER, Sauer PJ, Weisglas-Kuperus N. (1999). Effects of environmental exposure to polychlorinated biphenyls dioxins on cognitive abilities in Dutch children at 42 months of age. Journal of Pediatrics 134(1):33–41. 17 Hooper K, She J. 2003, January. Lessons from the polybrominated diphenyl ethers (PBDEs): Precautionary principle, primary prevention, and the value of community-based body burden monitoring using breast milk. Environmental Health Perspectives, 111(1):109-114, p. 112. 18 Greater Boston Physicians for Social Responsibility (GBPSR). 2002, Fall. Out of Harm’s Way: Preventing Toxic Threats to Child Development. Why Breast-Feeding is Still Best for Baby. Available: http://www.psr.org/site/DocServer/BFeasyeng2pg.10.18.pdf?docID=5205.

Mold
REDUCING YOUR EXPOSURE You can prevent or minimize mold growth and subsequent exposure in the following ways: Keep indoor environments dry. Within 24 hours of a leak or flood, clean up all
water and remove water-damaged items.3 Keep indoor humidity levels between 30-40%.
Properly ventilate indoor environments.2 To remove mold growth: Wearing protective gloves and a dust mask, clean affected areas with soap and
water, then apply a solution of 1 part vinegar and 1 part water, and wipe clean.3 Make sure to ventilate the area by opening windows and turning on ceiling and
exhaust fans. Toxic mold removal may require professional help.
505 W. Northern Lights, Suite 205 Anchorage, AK 99503 Phone: (907) 222-7714
Fax: (907) 222-7715 www.akaction.org
WHAT IS MOLD? Mold is a type of fungus that grows in
moist areas on natural forms of material, including food, fabrics, carpets, upholstery, walls, and ceiling tiles.1 Mold usually will grow in damp environments such as basements, kitchens, bathrooms, air conditioning units, refrigerators, and potted plants.1,2 Sewage leaks can cause toxic molds or "black mold."
HOW ARE WE EXPOSED? Mold exposure occurs through
inhalation and skin contact with affected surfaces.3 Poor indoor ventilation and air quality
may cause mold exposures.2 SYMPTOMS & HEALTH PROBLEMS Mold exposure can lead to res-
piratory symptoms including rhinitis, sneezing, eye irritation, coughing and wheezing.3,4,5,6 Children and adults may experience
allergic reactions or worsening of asthma symptoms from mold exposure.2,7,8,9 Mycotoxins are toxic chemicals
produced by molds. Exposure to mycotoxins in the air is linked to pulmonary bleeding (bleeding in the lungs), sudden death in some reported infant cases, and organic dust toxic syndrome (ODTS) in some documented adult cases.1,3,10,11,12,13,14,15,16,17 ODTS is a general term for illness caused by inhaling bacterial endotoxins or fungal toxins, causing respiratory symptoms and fever a few hours after exposure.1,18 Mycotoxins are also associated with
some kinds of cancer.19 FOLLOW UP ACTION If you think your patient may have been
exposed to mold, report to Public Health Nurse (PHN) or refer patient to a physician.

1 Storey E, Dangman KH, Schenck P, DeBernardo RL, Yang CS, Bracker A, et al. 2004, September 30. Guidance for Clinicians on the Recognition and Management of Health Effects related to Mold Exposure and Moisture Indoors. Farmington, CT: University of Connecticut Health Center, Center for Indoor Environments and Health. 2 Greater Boston Physicians for Social Responsibility. Provider Reference Card. Available: http://psr.igc.org/toolkit/ref_guide.pdf [Accessed 22 June, 2007]. 3 Etzel RA, ed. 2003. Pediatric Environmental Health. 2nd ed. Elk Grove Village, IL: American Academy of Pediatrics. 4 Seuri M, Husman K, Kinnunen H, Reiman M, Kreus R, Kuronen P. 2000. An outbreak of respiratory diseases among workers at a water-damaged building—A case report. Indoor Air 10(3):138-45. 5 Lasley M, Shapiro G. 1999. Rhinitis and sinusitis in children. Pediatric Allergy and Immunology 19(2):437-452. 6 Virant FS. 2000. Allergic rhinitis. Immunology and Allergy Clinics of North America 20(2):1-16. 7 Etzel RA. 2003. How environmental exposures influence the development and exacerbation of asthma. Pediatrics 112(1):233-9. 8 Pope AM, Patterson R, Burge H, et al, eds. 1993. Indoor Allergens: Assessing and Controlling Adverse Health Effects. Institute of Medicine, Committee on the Health Effects of Indoor Allergens. Washington, DC: National Academy Press. 9 Institute of Medicine, Committee on the Assessment of Asthma and Indoor Air. 2000. Clearing the Air: Asthma and Indoor Air Exposures. Washington, DC: National Academy Press. 10 Yoshida K, Ando M, Sakata T, Araki S. 1989. Prevention of summer-type hypersensitivity pneumonitis: Effect of elimination of Trichosporon cutaneum from the patients’ homes. Archives of Environmental Health 44(5):317-22. 11 Etzel RA, Montana E, Sorenson WG, Kullman GJ, Allan TM, Dearborn DG. 1998. Acute pulmonary hemorrhage in infants associated with exposure to Stachybotrys atra and other fungi. Archives of Pediatrics & Adolescent Medicine 152(8):757-62. 12 Knapp JF Michael JG, Hegenbarth MA, Jones PE, Black PG. Case records of the Children’s Mercy Hospital, Case 02-1999: a 1-month-old infant with respiratory distress and shock. Pediatr Emerg Care 1999; 15: 288-293. 13 Flappan SM, Portnoy J, Jones P, Barnes C. Infant pulmonary hemorrhage in a suburban home with water damage and mold (Stachybotrys atra). Environ Health Perspect 1999;107:927-930. 14 Tripi PA, Modlin S, Sorenson WG, Dearborn DG. Acute pulmonary haemorrhage in an infant during induction of general anaesthesia. Pediatric Anaesthesia 2000; 10: 92-94. 15 Weiss A, Chidekel AS. Acute pulmonary hemorrhage in a Delaware infant after exposure to Stachybotrys atra. Del Med J 2002;74:363-368. 16 Novotny WE, Dixit A. Pulmonary hemorrhage in an infant following 2 weeks of fungal exposure. Arch Pediatr Adolesc Med 2000;154:271-275. 17 Habiba A. Acute idiopathic pulmonary haemorrhage in infancy: Case report and review of the literature. J Paediatr Child Health 2005;41:532-3. 18 Centers for Disease Control and Prevention (CDC). 1994. Request for Assistance in Preventing Organic Dust Toxic Syndrome. NIOSH Publication 94-102. Available: http://www.cdc.gov/nasd/docs/d001001-d001100/d001027/d001027.html [Accessed 13 February, 2008]. 19 Wray BB, O’Steen KG. Mycotoxin-producing fungi from house associated with leukemia. Arch Environ Health 1975; 30:571-573.

505 W. Northern Lights, Suite 205 Anchorage, AK 99503 Phone: (907) 222-7714
Fax: (907) 222-7715 www.akaction.org
Pesticides WHAT ARE PESTICIDES? Pesticides are a group of chemicals made for the purpose of killing or otherwise deterring “pest” species. The word pesticide may refer to insecticides, herbicides, fungicides, or other pest control methods.1 Because pesticides are made to be toxic, they inherently have adverse health effects on animals and humans—even at low levels—and can stay in the environment after the being applied. There are many different types of pesticides made for different results. HOW ARE WE EXPOSED? Because of the many types and uses of pesticides, there are many ways people can be exposed to these chemicals: Living or working near areas where
pesticides are used can be a risk factor for exposure. Wind and rain may move pesticides away
from where they were used, causing contamination of groundwater and/or soil.2,3 Using pesticides in your home or on your
land increases your exposure to these chemicals through inhalation, ingestion and absorption through skin. Use of insect repellents on the body
increases exposure to pesticides, because pesticides can enter the body through the skin.4 Eating contaminated foods can increase
exposure, as some pesticides are carried long distances from where they are made and used by air and ocean currents into
the north and known to build up in the fats of Arctic animals. Farmers and field workers can be exposed
to high levels of pesticides.5 SYMPTOMS & HEALTH OUTCOMES The health effects of pesticide exposure can be different based on the specific pesticide and the level of exposure. Different pesticides will result in a range of symptoms. Included here are the symptoms of pesticide exposure for a few of the most common pesticide groups, and specific pesticides within those groups. Organophosphates (e.g. Malathion): Organophosphate pesticides are among the most commonly used pesticides. Prenatal exposure to organophosphates has been linked to abnormal brain development that disrupts cognitive function and memory and persistent abnormal behavior.6,7,8 In humans, prenatal exposure has been linked to abnormal reflexes,9 delayed development, and an increase in attention deficits and hyperactivity.10,11 Malathion is an organophosphate insecticide commonly used to control insects in homes, outside, and in farming. Malathion is both acutely and chronically toxic to mammals.12 Studies of malathion in many animals have shown it binds to and is stored in fat.13 This means malathion may build up in the fats of animals, and people may be exposed by eating these animals. Current research suggests malathion could contribute to the

symptoms of both type 2 diabetes and atherosclerosis, or clogged arteries. Malathion has been found to disrupt lipid metabolism in rats. Rats treated with malathion had significantly increased low density lipoproteins and plasma triglycerides, in a way that suggests it may contribute to atherosclerosis.14 Malathion and other organophosphate pesticides have been found in breastmilk.15 Measurement of urinary malathion levels showed that malathion was found more often and at higher levels in children than in adults.16 Organochlorines (e.g. DDT and Endosulfan): Organochlorine pesticides are a family of agricultural pesticides that are known to break down slowly in the environment and accumulate in the fatty tissues of animals.17 Many studies have linked organochlorine pesticide exposure with consumption of contaminated animals, mostly fish and marine mammals.18,19,20 Many organochlorine pesticides are endocrine disruptors. Numerous studies have linked organochlorine pesticide exposures with cancers and other health effects. Exposure to DDT has been linked to pancreatic cancer and non-Hodgkin’s lymphoma.21,22 Endosulfan is an organochlorine pesticide that is increasingly used worldwide and is already building up in the environment.23 Endosulfan has been shown to compete with estradiol for binding with an estrogen receptor.24 Studies of toad tadpoles showed that levels of endosulfan found in the environment were enough to delay development, increase mouth and skeletal abnormalities, and increase mortality.25 Endosulfan exposure has been shown to act like estrogen and reduce the levels of testosterone and other hormones in rats.26,27 Endosulfan exposure has been linked to delayed sexual maturation in boys.28 Metabolites (breakdown products) of endosulfan have been found in placenta samples and umbilical cord blood,
suggesting endosulfan in the mothers’ body may enter developing fetuses.29 Pyrethroids (eg, Permethrin): Man-made pyrethroids are a type of insecticides made to copy the action of the natural plant insecticides called pyrethrins. Pyrethrins have relatively low toxicity for mammals compared to some pesticides.30 This has prompted the use of pyrethroids as a public health measure to control mosquito vector populations and used widely in farming, as well as for lice and flea treatments. Although pyrethroids are generally thought to be a relatively low-toxicity pesticide, they are still toxic to humans and produce many adverse health effects. Excessive pyrethroid exposure often results in temporary numbness and tingling in the exposed body part that goes away within several hours.31 In animals, exposure can cause a slight whole body tremor, twitching of the dorsal muscles, and even death.32 Permethrin also causes an increase in the metabolic rate which, along with tremor, causes hyperthermia and can lead to death.33 There is also evidence that permethrin is an endocrine disrupting chemical, meaning that it can interfere with the hormone system. One study found that permethrin had endocrine disrupting action on human endometrial cells and breast cancer cells.34 A later study confirmed that permethrin, as well as three other pyrethroids, increased the growth of human breast carcinoma cells.35 This suggests that pyrethroids may aid in the progression of some cancers. There is other evidence that the metabolic breakdown products of permethrin have greater endocrine disrupting potential than permethrin itself.36 Exposure to permethrin and cypermethrin (another pyrethroid) as well as organophosphates pesticides reduced healthy sperm concentrations in exposed men.37 There is evidence that the full range of pyrethroid toxicology is not

fully understood, and that precautions should be taken to limit human exposure. 33
DEET N,N′-Diethyl-m-toluamide, also known as DEET, is one of the most commonly used pesticides. In addition to direct exposure from insect repellant application, DEET is a common contaminant in surface waters.38 DEET can enter our bodies through the skin quickly and circulate in our bodies. “DEET exposures have been associated with death, toxic encephalopathy, acute manic psychosis, seizure, and cardiovascular and dermal toxicities.”
4
39 There is evidence that DEET exposure kills brain cells, and that DEET and malathion together may have greater effects regarding destruction of brain tissue.40 These toxic effects are especially prevalent in children, because they absorb DEET more easily through the skin and have a larger ratio of skin surface area to body mass as compared to adults.41 Excessive use and over-application of DEET with small children could cause harmful exposures.42 Carbamates (eg, Carbaryl): Carbamate pesticides are usually used in farming or in home lawns and gardens.
Carbamate pesticides work by targeting cholinesterase, the enzyme that breaks down acetylcholine, an important neural hormone. In insects, this causes a subsequent build up of acetylcholine, malfunction of the nervous system, and eventually death.43 In humans, carbamate pesticides can have a similar effect on the nervous system. In addition, carbamates seem to have negative effects on steroidal molecule metabolism, which may contribute to some cancers.44,45 Carbaryl exposure has been linked to higher risk for non-Hodgkins lymphoma.46 A significant increase in kidney and liver tumors was seen in rats exposed to carbaryl in the laboratory.47 Rats prenatally exposed to carbamates had impaired development of reflexes.48
FOLLOW UP ACTION If you think your patient may have been
exposed to pesticides, refer patient to a physician. Chronic exposure can be addressed by
treating the symptoms and informing patients about ways to limit future exposure to pesticides (see “Reducing Your Exposure” section below).

REDUCING YOUR EXPOSURE You can prevent or minimize exposure to pesticides in the following ways: Wash fruits and vegetables, including local berries and greens, before eating to
remove traces of pesticides. Safe alternatives can be used to solve nearly all pest problems without the need for
toxic chemicals. We recommend prevention and use of non-toxic alternatives first. For example:
o Citronella oil can be used instead of DEET to keep mosquitoes away. o Wear long-sleeved shirts made of thick fabric (such as denim or canvas) and
wear head nets and other nets to keep mosquitoes from landing on skin. o Install screen doors and windows to keep mosquitoes out. o Use mousetraps instead of poison bait. o Burning of alder branches at fish camp helps to keep them out of the area. o Peppering fish during processing and drying can keep flies away. o You can prevent pests from entering your home by sealing cracks in
windows, doors and baseboards. o Storing food properly and cleaning food or beverage spills will help to keep
out unwanted pests from your home. o Lice combs and mayonnaise or olive oil can be used instead of chemical
shampoos to treat head lice. If DEET has been used on children, make sure they bathe right away after they
come home from the outdoors. DEET should be washed off the skin, especially before reapplication.
If possible, reduce or eliminate the use of pesticides in and around your home or workplace.
If you are exposed to pesticides at work, take actions to reduce the amount of pesticide on your clothes and possessions when you go home. Consider leaving contaminated clothes and tools at work or outside, removing shoes and outerwear before entering your home, and bathing at work or soon after you return home.
Whenever possible, buy organic fruits and vegetables and other organic products to reduce your exposure.
Consider eating less fat, as some pesticides build up in the fat of animals. o Consider removing fat that you see on meat and fish whenever possible. o Consider eating leaner meats whenever possible. o Consider eating smaller amounts of dairy products; or, if available, choose
low fat or nonfat dairy products.
1 United States Environmental Protection Agency (EPA). 2009. About Pesticides. Available: http://www.epa.gov/ pesticides/about/index.htm [Accessed March 13, 2009]. 2 Bouman BA, Castaneda AR, Bhuiyan SI. 2002. Nitrate and pesticide contamination of groundwater under rice-based cropping systems: Past and current evidence from the Philippines. Agr. Ecosyst. Environ 2:185–199. 3 Shomar BH, Muller G, Yahya A. 2005. Occurrence of pesticides in groundwater and topsoil of the Gaza Strip. Water Air Soil Poll 171:237–251. 4 Selim S, Hartnagel RE, Osmitz TG, Gabriel KL, and Schoenig GP. 1995. Absorption, metabolism, and excretion of N,N-diethyl-m-toluamide following dermal application to human volunteers. Fundam. Appl. Toxicol. 25:95–100.

5 Bell EM, Sandler DP, Alavanja MC. 2006. High pesticide exposure events among farmers and spouses enrolled in the Agricultural Health Study. J Agric Saf Health 12:101–16. 6 Icenogle LM, Christopher NC, Blackwelder WP, et al. 2004. Behavioral alterations in adolescent and adult rats caused by a brief subtoxic exposure to chlorpyrifos during neurulation. Neurotoxicol Teratol. 26:95–101. 7 Qiao D, Seidler FJ, Tate CA, et al. 2003. Fetal chlorpyrifos exposure: Adverse effects on brain cell development and cholinergic biomarkers emerge postnatally and continue into adolescence and adulthood. Environ Health Perspect. 111:536 –544. 8 Lazarini CA, Lima RY, Guedes AP, et al. Prenatal exposure to dichlorvos: Physical and behavioral effects on rat offspring. Neurotoxicol Teratol. 2004;26:607–614. 9 Young JG, Eskenazi B, Gladstone EA, et al. 2005. Association between in utero organophosphate pesticide exposure and abnormal reflexes in neonates. Neurotoxicology. 26:199 –209. 10 Eskenazi B, Marks AR, Bradman A, et al. 2007. Organophosphate pesticide exposure and neurodevelopment in young Mexican-American children. Environ Health Perspect.115:792–798. 11 Grandjean P, Harari R, Barr DB, et al. 2006. Pesticide exposure and stunting as independent predictors of neurobehavioral deficits in Ecuadorian school children. Pediatrics. 117:e546–e556. 12 Abdollahi M, Jalali N, Sabzevari O, Nikfar S, Fallahpour M. 1999. Pesticide poisoning during an 18-month period (1995–1997) in Tehran, Iran. Iran. J. Med. Sci. 24:77–81. 13 Garcia-Repetto R., Martinez D, and Repetto M. 1995. Malathion and dichlorvos toxicokinetics after the oral administration of malathion and trichlorfon. Vet. Hum. Toxicol. 37a:306–309. 14 Lasram MM, Annabi AB, Elj NE, Selmi S, Kamoun A, El-Fazaa S, Gharbi N. 2009. Metabolic disorders of acute exposure to malathion in adult Wistar rats. J Hazard Mater. 163:2-3. 15 Sanghi et al., 2003 R. Sanghi, M.K. Pillai, T.R. Jayalekshmi and A. Nair. 2003. Organochlorine and organophosphorus pesticide residues in breast milk from Bhopal, Madhya Pradesh, India. Hum Exp Toxicol 22:73–76. 16 Babu NS, Malik JK, Rao GS. Aggarwal M, Ranganathan V. 2006. Effects of subchronic malathion exposure on the pharmacokinetic disposition of pefloxacin. Environmental Toxicology and Pharmacology 22:267-171. 17 Swackhamer D, Hites RA. 1988. Occurrence and bioaccumulation of organochlorine compounds in fish from Siskiwit lake, Isle Royale, Lake Superior. Environ. Sci. Technol. 22:543–548. 18 Fitzgerald E, Hwang SA, Deres DA, Bush B, Cook K, Worswick P. 2001. The association between local fish consumption and DDE, mirex, and HCB concentrations in the breast milk of Mohawk women at Akwesanse. J. Exposure Anal. Environ. Epidemio. 11:381–388. 19 Hagmar L, Rylander L, Dyremark E, Klasson-Wehler E, Erfurth EM. 2001. Plasma concentration of persistent organochlorine in relation of thyrotropin and thyroid hormone levels in women. Int. Arch. Occup. Environ. Health 74:184–188. 20 Mwevura OC, Othman, Mehe GL. 2002. Organochlorine pesticide residues in edible biota from the coastal area of Dar es Salaam city. J. Mar. Sci. 1:91–96. 21 Garabrant DH, Held J, Langholz B, Peters JM, Mack TM. 1992. DDT and related compounds and risk of pancreatic cancer. J. Natl. Cancer Inst.84:764–71. 22 Cantor KP, Blair A, Everett G, Gibson R, Burmeister LF. 1992. Pesticides and other agricultural risk factors for non-Hodgkin’s lymphoma among men in Iowa and Minnesota. Cancer Res.52:2447–55. 23 Pozo HT, Gouin K, Macdonald T, Hung AM, Cainey H, Peters J. A. 2006. Global pilot study for persistent organic pollutants (POPs) using PUF disk passive air samplers. Environ Pollut. 144(2)445-52. 24 Lemaire G, Mnif W, Mauvais P, Balaguer P, Rahmani R. 2006. Activation of alpha- and beta-estrogen receptors by persistent pesticides in reporter cell lines. Life Sci 79(12):1160-9. 25 Bernabò EBI, Berg C, Lundstedt-Enkel K, Bonacci A, Tripepi S. 2009. Environmentally relevant concentrations of endosulfan impair development, metamorphosis and behaviour in Bufo bufo tadpoles. Aquatic Toxicology 91(2)135-142. 26 Wade MG, Desaulniers D, Leingartner K, et al. 1997. Interactions between endosulfan and dieldrin on estrogen-mediated processes in vitro and in vivo. Reprod Toxicol 11(6):791-798. 27 Singh SK, Pandey RS. 1990. Effect of sub-chronic endosulfan exposures on plasma gonadotrophins, testosterone, testicular testosterone and enzymes of androgen biosynthesis in rat. Indian J Exp Biol. 28:953-956. 28 Saiyed H, Dewan A, Bhatnagar V, Shenoy U, Shenoy R, Rajmohan H, Patel K, Kashyap R, Kulkarni P, Rajan B, Lakkad B.Effect of endosulfan on male reproductive development.Environ Health Perspect. 2003;111(16):1958-62. 29 Cerillo I, Granada A, López-Espinosa M-J, Olmos B, Jiménez M, Caño A. 2005. Endosulfan and its metabolites in fertile women, placenta, cord blood, and human milk. Environ Res 98:233–239. 30 Vais H, Williamson MS, Devonshire AL, Usherwood PN. 2001. The molecular interactions of pyrethroid insecticides with insect and mammalian sodium channels. Pest Manag Sci 57:877–888. 31 Thiebault JJ, Bost J, Foulhoux P. 1985. Experimental intoxication by deltamethrin in the dog and its treatment, Collect Med Leg Toxicol Med 131:47–62. 32 Ray DE. 1982. The contrasting actions of two pyrethroids (deltamethrin and cismethrin) in the rat. Neurobehav Toxicol Teratol 4:801–804. 33 Ray DE, Fry JR. 2006. A reassessment of the neurotoxicity of pyrethroid insecticides. Pharmacology & Therapeutics 111: 174 – 193.

34 Garey J, Wolff MS. 1998. Estrogenic and antiprogestagenic activities of pyrethroid insecticides. Biochem. Biophys. Res. Commun 251:855–859. 35 Go V, Garey J, Wolff MS, Pogo BTG. 1999. Estrogenic potential of certain pyrethroid compounds in the MCF-7 human breast carcinoma cell line. Environ. Health Persp.107:173–177. 36 Tyler CR, Beresford N, van der Woning M, Sumpter JP, Thorpe K. 2000. Metabolism and environmental degradation of pyrethroid insecticides produce compounds with endocrine activities. Environ Toxicol Chem 19(4):801–9. 37 Perry MJ, Venners SA, Barr DB, Xub X. 2007. Environmental pyrethroid and organophosphorus insecticide exposures and sperm concentration. Reproductive Toxicology 23:113–118. 38 Vanderford BJ, Pearson RA, Rexing DJ, Snyder SA, 2003. Analysis of endocrine disruptors, pharmaceuticals, and personal care products in water using liquid chromatography/tandem mass spectrometry. Anal. Chem. 75(22):6265–6274. 39 Veltri JC, Osimitz TG, Bradford DC, Page BC. 1994. Retrospective analysis of calls to poison control centers resulting from exposure to the insect repellent N,N-diethyl-m-Toluamide (DEET) from 1985–1989. J. Toxicol. Clin. Toxicol. 32(1):1–16. 40 Abdel-Rahman, A. 2004. Neurological deficits induced by malathion, DEET, and permethrin, alone or in combination in adult rats. Pt. A. J. Toxicol. Environ. Health 67:331-356. 41 Braissoulis G. 2001. Toxic encephalopathy associated with use of DEET insect repellents: A case analysis of its toxicity in children. Human & Experimental Toxicology 20(1):8-14. 42 Antwi FB, Shama LM, Peterson RKD. 2008. Risk assessments for the insect repellents DEET and picaridin. Regulatory Toxicology and Pharmacology 51:31–36. 43 Fukuto TR. 1990. Mechanism of action of organophosphorus and carbamate insecticides. Environ Health Perspect. 87: 245–254. 44 Donovan MP, Schein LG, Thomas JA. 1978. Effects of pesticides on metabolism of steroid hormone by rodent liver microsomes. J Environ Pathol Toxicol. 2(2):447-54. 45 Cranmer JS, Avery DL, Grady, Kitay JI. 1978. Postnatal endocrine dysfunction resulting from prenatal exposure to Carbofuran, diazinon or chlordane. J. Environ. Pathol. Toxicol. 2:357–369. 46 Zheng, T et al. 2001 Agricultural exposure to carbamate pesticides and the risk of non-hodgkin lymphoma. J. Occup. Environ. Med. 43:641-649. 47 United States Environmental Protection Agency, Office of Pesticide Programs Health Effects Div. 2002. Carbaryl: Updated toxicology disciplinary chapter for the registration eligibility decision document. p.19. Available: http://docket.epa.gov/edkpub/do/EDKstaffinterndetailview?objectid=090007d4800c7657. [Accessed March 13, 2009]. 48 Rosenstein L, Chernoff N. 1978. Spontaneous and evoked EEG changes in perinatal rats following in utero exposure to Baygon. A preliminary investigation, Bull. Environ. Contam. Toxicol. 20:624–632.

505 W. Northern Lights, Suite 205 Anchorage, AK 99503 Phone: (907) 222-7714
Fax: (907) 222-7715 www.akaction.org
Petroleum Products and Products of Incomplete Combustion
WHAT ARE PETROLEUM PRODUCTS? Petroleum products come from crude oil, and their by-products contribute to air pollution and global warming.1 They are used as fuel for automobiles, airplanes, snow machines, ATVs, cooking stoves, generators, furnaces, and more. HOW ARE WE EXPOSED? Breathing vapors and exhaust of petroleum products is a major source of exposure. Petroleum products contribute to air pollution, a serious public health problem which kills about 70,000 Americans each year.2 Exposure to vapors can occur when filling fuel tanks for vehicles, stoves, or houses. Soil contaminated with petroleum products or fuel spills may also release toxic vapors. If a house or building is located over an area where there has been an oil spill, vapors can enter the building through cracks in the walls and floors, as well as places where pipes enter the building.3 People are exposed to exhaust from petroleum products through traffic, ATVs, snow machines, storing vehicles in a garage that is attached to a house, using stoves with no ventilation, and living near petroleum refineries or power plants.4 Drinking water contaminated by petroleum products is another source of exposure.5 When gasoline seeps into soil, it can contaminate groundwater used for drinking. Most chemicals in gasoline and other
petroleum products are removed during water treatment, but people who drink untreated water or water from private wells can be exposed. Other possible sources of exposure to petroleum products include: Accidental intake of petroleum products:6
children may swallow petroleum-based fuels by accident when, for example, they are stored in a familiar container such as a soda bottle; Touching petroleum products, soil or
water contaminated by petroleum products;6 Swimming in water contaminated by
petroleum products;6 Using fuel oils to wash paint or grease
from skin or equipment;72 Fixing gasoline or diesel engines;73 Cleaning up fuel spills without proper
protective equipment;7 Working in the oil and gas industry;7 Having served in the Persian Gulf War:
many veterans have reported exposures to diesel fuel and oil fires;8 Some people also inhale gasoline or diesel
fumes in order to become intoxicated. This is known as “huffing” or “sniffing” and is done more often by children and adolescents than adults.9,10 According to a 2004 study, gasoline was the most commonly abused volatile substance in the United States.9
SYMPTOMS & HEALTH OUTCOMES The health effects of exposure to petroleum products can differ based on the specific chemical and the level of exposure.

Different petroleum products will result in a range of symptoms. Included here are the symptoms of exposure for a few of the most commonly used petroleum products. Benzene Benzene is a petrochemical, meaning it is a refined product of oil. It is present in the environment in water, soil and air. Some of the major sources of benzene are car exhaust, paint, and glues. Cigarette smoke also contains benzene from the burning of tobacco.11 Exposure to benzene through food, water, and soil is not common, unless there is a local source of contamination. Approximately 95% of exposure to benzene is through inhalation.12 Acute exposure can cause dizziness, rapid heart rate, tremors and unconsciousness.11 Benzene is known to cause cancer. The most significant health risk to low level exposure to benzene is leukemia.12 However, research suggests that benzene can induce other diseases of the blood, such as anemia, and uncontrolled bleeding.13 Benzene may also cause reproductive effects such as irregular menstruation and birth defects.11 (Please see the Benzene fact sheet for more details.) Gasoline Gasoline is a complex mixture of volatile hydrocarbons derived by distillation from crude petroleum. More than 100 billion gallons of gasoline are used annually in the US. Gasoline combustion is an important contributor to air pollution around us and global warming.14 Severe ingestion can result in central
nervous system toxicity, visceral involvement, and inflammation of the lungs which can lead to respiratory arrest.15,16 Less serious nervous system effects
include dizziness and headaches, while more serious effects include coma and the inability to breathe.17
Long-term occupational exposure to gasoline vapors is linked to kidney and nasal cancer.18,19 It can also result in damage to the nervous system.20,17 Chronic exposure to combustion products
of gasoline is linked to an increased risk for cancer.21,22
Diesel Exhaust Diesel exhaust is produced by motor boats, heavy equipment, generators, trucks, buses, and trains.23 These engines release emissions that severely compromise air quality. Inhaling diesel exhaust particles (DEPs) can induce inflammation of the respiratory tract,24,25 and increase the incidence of wheezing, bronchitis, and asthma hospitalization.26 Allergic and inflammatory response to
DEPs may facilitate development of allergies to other irritants. Symptoms of existing asthma or allergic rhinitis (inflammation of the mucus membranes of the nose) may worsen with DEP exposure.14 Exposure to diesel exhaust also may cause
throat irritation, headache, dizziness, nausea, tiredness, and coughing.27 DEP exposure can also lead to a
decreased immune response to bacterial infection.28 Chronic inhalation of DEPs is linked to an
increased incidence of heart and lung diseases.29,30 There is an increased incidence of lung
cancer in those who have chronic or occupational exposure to diesel exhaust.31,32 Chronic exposure to diesel exhaust is also
linked to premature death.29 Kerosene Kerosene is used as a fuel in cooking stoves and heaters. Exposure to kerosene fuel and exhaust is linked to several adverse health effects.

Accidental intake of small amounts of kerosene may cause coughing, fever, vomiting, tachypnoea (rapid breathing), constipation, restlessness, drowsiness, abdominal pain, and diarrhea.33 Intake of large amounts of kerosene may cause convulsions, coma, or even death.34 Skin contact with kerosene for short
periods may cause itchy, red, sore, or peeling skin.35,36 Using kerosene to clean used gasoline
engine oil off skin may facilitate the passage of carcinogens from the oil to the lungs.37 Cooking on gas stoves indoors is linked to
an increase in asthma38 and acute respiratory infections in children.39
Polycyclic Aromatic Hydrocarbons Polycyclic Aromatic Hydrocarbons (PAHs) are a group of over 100 different chemicals that are formed during the incomplete combustion of oil, gas, coal, garbage, wood, tobacco, or charcoal broiled meat.40 They are also found in asphalt, roofing tar, moth balls, creosote wood preservatives, incense, pesticides, explosives, plastics, skin creams for psoriasis, and anti-dandruff shampoos that contain coal tar.41,4 Engine lubricating oils are known to accumulate carcinogenic PAHs while the engine is running.42 Health risks linked to exposure to PAHs include: Clogged arteries and heart disease: a
high occupational exposure to PAHs is related to a high risk of mortality from heart disease.43 Carcinogenicity: PAH exposure from coal
emissions increases the risk damage to DNA and lung cancer.44 There is a strong link between childhood cancer and prenatal or early postnatal exposure to PAHs.45,46 PAHs are linked to breast cancer,
laryngeal cancer, and leukemia.47,48,49
PAHs are toxic to the kidney and are linked to kidney cancer.50 Benzo[a]pyrene is a PAH and toxic to the
reproductive system.51 It is linked to decreased fetal growth52,53 and developmental delays.54
Carbon Monoxide Carbon monoxide, or CO, is an odorless, colorless gas which is found in combustion fumes from vehicles, stoves, wood, coal, lanterns, and heating systems.55,56 Inhaling CO can lead to sudden illness and death.56
ssure, heart rate, and spiratory rate.58
ess, seizures, oma, and cardiac arrest.59
an also lead to
uring all trimesters of
lems after the first
Common early signs and symptoms of carbon monoxide poisoning include headache, dizziness, fatigue, lethargy, weakness, drowsiness, nausea, vomiting,57 chest pain, shortness of breath, anxiousness, impaired judgment, and increased blood prere Late signs of carbon monoxide poisoning are cherry-red skin, hypotension, poor capillary refill, unconsciousnc Exposure to low levels of carbon monoxide over a long period of time cadverse health outcomes: Low birth weight is linked to chronic
exposure to CO.60,61 Increased exposure to CO during the first trimester of pregnancy is linked to lower birth weight.62 A recent study provided evidence that exposure to CO reduces fetal growth dpregnancy.63 Cardiovascular and hematological effects:
CO has been shown to increase the formation of blood clots.64 There is also evidence that links CO with an increased risk for a heart attacks, arrhythmias, and an increased risk of readmission to the hospital for heart probheart attack.65,66,67

REDUCING YOUR EXPOSURE You can prevent or minimize exposure to petroleum products in the following ways: Ventilation is one of the most effective ways to improve indoor air quality.7171 When
possible, open doors, windows, and vents to reduce the level of indoor air pollutants.
ntain additional vent
round children.
tightly closed and store them in places where people do place is cool,
ks and corrosion.
possible.72
g, or using the toilet if you have been handling nated with gasoline
that were built on fuel contaminated ground, seal the cracks in floors,
hale more gasoline vapors. Avoid leaving ATVs, snow machines, and other vehicles running near homes and
other places where people spend time.
rom air pollution is linked toworsening of acute asthma in children and
oleum products or carbon Exposure” section below).
Cook in well-ventilated areas and clean the chimney so that carbon monoxide, benzene, PAHs, and other chemicals in smoke can escape.
If possible, use gasoline containers specifically designed to store gasoline, which do not allow gasoline vapors to seep through the plastic, do not coholes, and contain spill-proof spouts. Avoid storing gasoline in plastic containersmade for other purposes, such as milk jugs or soda bottles.
Pour gasoline in well-ventilated areas or outdoors. Avoid using a Store petroleum products out of the reach of children in childproof containers. Also,
make sure that they are not stored in food or water containers. Store and use petroleum products as far away from your drinking water as possible. Keep petroleum products
not spend much time, such as in a garage or shed. The best storagedry, and well-ventilated.
If you have a fuel storage tank, inspect it for lea When trying to remove oil from hands, use non-toxic, water-based solvents instead
of kerosene and benzene whenever Wear gloves or use a barrier cream made to protect skin from petroleum products
when you are repairing vehicles.73 Wear protective clothing and equipment so that your skin is not exposed to gasoline.
If your skin is exposed to gasoline, wash it thoroughly. Wash your hands carefully before eating, smoking, drinkinpetroleum products. Wash clothing that has been contamiseparate from other clothing.
Install a carbon monoxide detector in your home and office. In houses
foundation, and areas around pipes to decrease fuel vapors entering the house from outside.
Do not let children pump gas into your vehicle. If they are small and stand at the same level as the gas pump, they will in
Respiratory effects: Higher exposure to carbon monoxide is related to more emergency room admissions for respiratory distress.68 Exposure to carbon monoxide f
The Agency for Toxic Substances and Disease Registry provides a more detailed explanation of the medical management of patients exposed to gasoline. Keeping yourself from being exposed to petroleum products while providing patient care is also important. This guide can be found at: www.atsdr.cdc.gov/MHMI/mmg72.html
adults.69,70 FOLLOW UP ACTION Acute exposure to petroleum products or
carbon monoxide is a medical emergency. If you think your patient may have been exposed to petr
Chronic exposure can be addressed by treating the symptoms and informing patients about ways to limit future exposure to petroleum products and carbon monoxide (see “Reducing Your
monoxide, refer patient to a physician immediately.

1 Environmental Protection Agency. 2002. In brief: The US greenhouse gas inventory. Available:
ent Department of the Environment, Water, Heritage and the Arts. 2004. Substance fact sheet:
Valdez oil spill. Cordova, AK: Dragonfly
a K
ency for Toxic Substances and Disease Registry. Toxic substance profiles: Benzene. Available:
ed. Elk Grove Village, IL: American Academy of Pediatrics.
rt study in Sweden. World
hevalier A, Crinquand-Calastreng A, Goldberg M. 2002. Leukemia in relation to occupational
5. Diesel exhaust particles induce the over-expression of tumor necrosis factor alpha
for studying effects of diesel exhaust on humans. International Archives of Occupational Environmental Health 66(2): 77-83.
http://yosemite.epa.gov/oar/globalwarming.nsf/UniqueKeyLookup/RAMR5CZKVE/$File/ghgbrochure.pdf [Accessed 18 March 2009]. 2 Harvard School of Public Health. 2000, March 2. Air Pollution Deadlier than Previously Thought [press release]. Available: http://www.hsph.harvard.edu/news/press-releases/archives/2000-releases/press03022000.html. 3 New York State Department of Health. 2006. Guidance for evaluating soil vapor intrusion in the State of New York. Available: http://www.health.state.ny.us/environmental/investigations/soil_gas/svi_guidance/docs/svi_main.pdf [Accessed 15 February 2009]. 4 Australian GovernmPolycyclic aromatic hydrocarbons. Available: http://www.npi.gov.au/database/substance-info/profiles/74.html [Accessed 9 January 2009]. 5 Environmental Protection Agency. 2009. Methyl tertiary butyl ether: Drinking water. Available: http://www.epa.gov/mtbe/water.htm [Accessed 18 March 2009]. 6 Agency for Toxic Substance and Disease Registry. 1995. Toxicological profile for automotive gasoline. Available: http://www.atsdr.cdc.gov/toxprofiles/tp72.html [Accessed 25 March 2009]. 7 Ott R. 2005. Sound truth and corporate myths: The legacy of the Exxon Sisters Press. 8 Stuart JA, Murr y M, Ursano RJ, Wright KM. 2002. The Department of Defense’s Persian Gulf War registry year 2000: An examination of veterans’ health status. Military Medicine 167(2): 121-128. 9 Spiller HA. 2004. Epidemiology of volatile substance abuse (VSA) cases reported to US Poison Centers. The American Journal of Drug & Alcohol Abuse 30(1): 155-165. 10 Anderson CE, Loomis GA. 2003. Recognition & prevention of inhalant abuse. American Family Physician 68(5): 869-874. 11 Aghttp://www.atsdr.cdc.gov/toxprofiles/phs3.html. 12 Duarte-Davidson R, Courage C, Rushton L, Levy L. 2001. Benzene in the environment: An assessment of the potential risks to the health of the population. Occup Environ Med 58:2-13. 13 Smith MT. 1996. The mechanism of benzene-induced leukemia: A hypothesis and speculations on the causes of leukemia, Environ Health Perspect 104(6):1219–1225. 14 Etzel RA, ed. 2003. Pediatric Environmental Health. 2nd
15 Takamiya M, Niitsu H, Saiqusa K, Kanetake J, Aoki Y. 2003. A case of acute gasoline intoxication at the scene ofwashing a petrol tank. Legal Medicine 5(3): 165-169. 16 Reese E, Kimbrough RD. 1993. Acute toxicity of gasoline and some additives. Environmental Health Perspectives 101(6): 115-131. 17 Hakkola M, Honkasalo ML, Pulkkinen P. 1997. Changes in neuropsychological symptoms & moods among tanker drivers exposed to gasoline during a work week. Occupational Medicine 47(6): 344-348. 18 Ji J, Granstrom C, Hemminki K. 2005. Occupational risk factors for kidney cancer: A cohoJournal of Urology 23(4): 271-278. 19 Lynge E, Andersen A, Nilsson R, Barlow L, Pukkala E, Nordlinder R, et al. 1997. Risk of cancer and exposure to gasoline vapors. American Journal of Epidemiology 145(5): 449-458. 20 Cairney S, Maruff P, Burns C, Currie B. 2002. The neurobehavioral consequences of petrol (gasoline) sniffing. Neuroscience& Biobehavioral Reviews 26(1): 81-89. 21 Patel AS, et al. 2004. Risk of cancer as a result of community exposure to gasoline vapors. Archives of Environmental Health 59(10): 497-503. 22 Guenel P, Imbernon E, Cexposures to benzene and other agents: A case-control study nested in a cohort of gas and electric utility workers. American Journal of Industrial Medicine 42(2): 87-97. 23 Greater Boston Physicians for Social Responsibility. Provider Reference Card. Available: http://psr.igc.org/toolkit/ref_guide.pdf [Accessed 22 June, 2007]. 24 Li YJ, Takizawa H, Azuma A, Kohyama T, Yamauchi Y, Takahashi S, et al. 2008. Disruption of Nrf2 enhances susceptibility to airway inflammatory responses induced by low-dose diesel exhaust particles in mice. Clinical Immunology 128(3): 336-373. 25 Kafoury RM, Madden MC. 200(TNF-alpha) gene in alveolar macrophages and failed to induce apoptosis through activation of nuclear factor kappa B (NF-kappaB). International Journal of Environmental Respiratory Public Health 2(1): 107-113. 26 Koike E, Hirano S, Furuyama A, Kobayashi T. 2004. cDNA microarray analysis of rat alveolar epithelial cells following exposure to organic extract of diesel exhaust particles. Toxicology and Applied Pharmacology 201(2): 178-185. 27 Rudell B, Sandstrom T, Hammerstrom U, Ledin ML, Horstedt P, Stjernberg N. 1994. Evaluation of an exposure setup

mental Health 67(3): 221-231.
HK, Lin Y. 2008. Diesel exhaust particles induce apoptosis via p53 and Mdm2
rm exposure to
ung cancer and vehicle exhaust in trucking
duate Medicine Journal 71(837): 419-
2008. A clinical decision rule for triage of
delphia) 46(3): 222-229.
ao YF. 1986. Prevalence of probable kerosene dermatoses among ball-bearing factory
JH, Roh JH, Burks D, Warshowsky D, Talaska G. 2000. Skin cleaning with kerosene facilitates passage of
2007. Effects of cooking fuels on acute respiratory infections in children in Tanzania.
xic Substance & Disease Registry (ATSDR). 1995. Toxicological Profile for Polycyclic Aromatic
drocarbons fact sheet. Available:
n content of
M, He X, Lan Q. 2009. Mitochondrial DNA content and lung cancer risk in Xuan
f Epidemiology and Community Health 59(9): 755-
trom, B; Johansson, C; Kyrklund, T, et al. 2002. Cancer risk assessment,
3):451–488.
h H, Ahrens W, Risch A, Schemezer P, Dietz A. 2005. Occupational exposure to polycyclic aromatic
O. 2005. Human CD34-positive hematopoietic
ood M, Nayyar T, Kopsombut P, et al. 2002. Alteration of pregnancy
yatt, RM, Jedrychowski W, Rauh V, Manchester D, Santella RM, et al. 1998. Recent developments in
28 Siegel PD, Saxena RK, Saxena QB, Ma JK, Ma JY, Yin XJ, et al. 2004. Effect of diesel exhaust particulate (DEP) on immune responses: Contributions of particulate versus organic soluble components. Journal of Toxicology and Environ29 Committee of the Environmental and Occupational Health Assembly of the American Thoracic Society. 1996. Health effects of outdoor air pollution. American Journal of Respiratory Critical Care Medicine 153(1): 3-50. 30 Yun YP, Lee JY, Ahn EK, Lee KH, Yoon in J774A.1 macrophage cell line. Toxicology in Vitro [electronic version]. 31 Beelen R, Hoek G, van den Brandt PA, Goldbohm RA, Fischer P, Schouten LJ, et al. 2008. Long tetraffic-related air pollution and lung cancer risk. Epidemiology 19(5): 702-710. 32 Garshick E, Laden F, Hart JE, Rosner B, Davis ME, Eisen EA. 2008. Lindustry workers. Environmental Health Perspectives 116(10): 1327-1332. 33 Nagi, NA, Abdulallah, ZA. 1995. Kerosene poisoning in children in Iraq. Postgra422. 34 Bond GR, Pieche S, Sonicki Z, Gamaluddin H, El Guindi M, Sakr M, et al. children under 5 years of age with hydrocarbon (kerosene) aspiration in developing countries. Clinical Toxicology (Phila35 Koschier, FJ. 1999. Toxicity of middle distillates from dermal exposure. Drug and Chemical Toxicology 22(1): 155-164. 36 Jee SH, Wang JD, Sun CC, Chworkers. Scandinavian Journal of Work, Environment and Health 12(1): 61-65. 37 Leecarcinogens to the lungs of animals treated with used gasoline engine oil. Applied Occupational and Environmental Hygiene 15(4): 362-369. 38 Belanger K, Triche EW. 2008. Indoor combustion and asthma. Immunology and Allergy Clinics of North America 28(3): 507-519. 39 Kilabuko JH, Nakai S. International Journal of Environmental Respiratory Public Health 4(4): 283-288. 40 Agency for ToHydrocarbons (PAHs). Atlanta, GA: US Department of Health & Human Services, Public Health Service. 41 Wisconsin Department of Health Services. 2008. Polycyclic Aromatic Hyhttp://dhs.wisconsin.gov/eh/chemfs/fs/PAH.htm [Accessed 19 January 2009]. 42 Carmicheal PL, Jacob J, Grimmer G, Phillips DH. 1990. Analysis of the polycyclic aromatic hydrocarbopetrol and diesel engine lubricating oils and determination of DNA adducts in topically treated mice by 32-P postlabling. Carcinogenesis 11(11): 2025-2032. 43Burstyn I, Kromhout H, Dartanen T, Svave O, Langard S, Ahrens W, et al. 2005. Polycyclic aromatic hydrocarbons and fatal ischemic heart disease. Epidemiology 16(6): 744-750. 44 Bonner MR, Shen M, Liu CS, Divita Wei, China. Lung Cancer 63(3): 331-334. 45 Knox E. 2005. Oil combustion and childhood cancers. Journal o760. 46 Bostrom, CE; Gerde, P; Hanberg, A; Jernsindicators, and guidelines for polycyclic aromatic hydrocarbons in the ambient air. Environmental Health Perspectives 110(S47 Jeffy BD, Chirmons RB, Romagnolo PF. 2002. Epigenetics of breast cancer: Polycyclic aromatic hydrocarbons as risk factors. Environmental and Molecular Mutagenesis 39(2-3): 235-244. 48 Becher H, Ramrothydrocarbons and laryngeal cancer risk. International Journal of Cancer 116(3): 451-457. 49 Van Grenvenynghe J, Bernard M, Langoet S, Le Berre C, Fest T, Fardel stem cells constitute targets for carcinogenic polycyclic aromatic hydrocarbons. Journal of Pharmacology and Experimental Therapeutics 314(2): 693-702. 50 Falahatpisheh MH, Donnelly KC, Ramos KS. 2001. Antagonistic interactions among nephrotoxic polycyclic aromatic hydrocarbons. Journal of Toxicology and Environmental Health 62(7): 543-560. 51 Archibong AE, Inyang F, Ramesh A, Greenwrelated hormones and fetal survival in F-344 rats exposed by inhalation to benzo(a)pyrene. Reproductive Toxicology 16(6):801–808. 52 Choi H, Jedrychowski W, Spengler J, Camann DE, Whyatt RM, Rauh V, et al. 2006. International studies of prenatal exposure to polycyclic aromatic hydrocarbons and fetal growth. Environmental Health Perspectives 114(11): 1744–1750. 53 Perera FP, Whmolecular epidemiology: A study of the effects of environmental polycyclic aromatic hydrocarbons on birth outcomes in Poland. American Journal of Epidemiology 147(3): 309–314.

oning.html [Accessed 19 February 2009]. y of Pediatrics.
s in Los Angeles
and birth weight in Sao Paulo,
aternal exposure to ambient air pollutants
S, Peters A, Aalto P, Bellander T, Berglind N, et Al. 2005. Ambient air pollution is associated with increased
t J, Zeger SL, Dominici F. 2000. The national morbidity, mortality, & air pollution study. Part II results. Health
retti G, Dalmasso P, Gregori D. 2007. Air pollution effects on the respiratory health of the resident adult
te asthma exacerbations and air pollutants in children living in
hma in a tropical
Indoor Air 14(Suppl 7): 102-118.
gine oil. Applied Occupational and Environmental
54 Perera FP, Rauh V, Whyatt RM, Tsai WY, Tang D, Diaz D, et al. 2006. Effect of prenatal exposure to airborne polycyclic aromatic hydrocarbons on neurodevelopment in the first 3 years of life among inner-city children. Environmental Health Perspectives 114(8): 1287–1292. 55 Katsouyanni K. 2003. Ambient air pollution and health. British Medical Bulletin 68(1): 143-156. 56 US National Library of Medicine and the National Institutes of Health. 2008. Carbon Monoxide Poisoning. Available: http://www.nlm.nih.gov/medlineplus/carbonmonoxidepois57 Etzel RA, ed. 2003. Pediatric Environmental Health. 2nd ed. Elk Grove Village, IL: American Academ58 Limmer D, O’Keefe M. 2007. Emergency care (10th ed). Upper Saddle River, NJ: Pearson Prentice Hall. 466-468. 59 Goldstein, M. 2008. Carbon monoxide poisoning. Journal of Emergency Nursing 34(6). 538-542.60 Lee BE, Ha EH, Park HS, Kim YJ, Hong YC, Kim H, Lee JT. 2003. Exposure to air pollution during different gestationalphases contributes to risks of low birth weight. Human Reproduction 18(3): 638-643. 61 Wilhelm M, Riz B. 2005. Local variations in CO and particulate air pollution and adverse birth outcomeCounty, CA, USA. Environmental Health Perspectives 113(9): 1212-1221. 62 Gouveia N, Bremner SA, Novaes HM. 2004. Association between ambient air pollutionBrazil. Journal of Epidemiology and Community Heath 58(1): 11-17. 63 Liu S, Krewswi D, Shi Y, Chen Y, Burnett RT. 2007. Association between mduring pregnancy and fetal growth restriction. Journal of Exposure Science and Environmental Epidemiology 17(5): 426-432. 64 Baccarelli A, Zanobetti A, Martinelli I, Grillo P, Hou L, Giacomini S, et al. 2007. Effects of exposure to air pollution on blood coagulation. Journal of Thrombosis and Haemostasis 5(2): 252-260. 65 von Klotrisk of hospital cardiac readmissions of myocardial infarction survivors in five European cities. Circulation 112(20): 3073-3079. 66 Schwartz J. 1999. Air pollution and hospital admission for heart disease in eight US counties. Epidemiology 10(1): 17-22. 67 SaneEffects Institute report no. 94. Cambridge, MA: HEI. 68 Migliapopulation in Turin, Italy. International Journal of Environmental Health Research 17(5): 369-379. 69 Thompson AJ, Shields MD, Patterson CC. 2001. AcuBelfast, Northern Ireland. Archives of Environmental Health, 56(3): 234-241. 70 Tsai SS, Cheng MH, Chiu HF, Wu TN, Yang CY. 2006. Air pollution and hospital admissions for astcity: Kaohsiung, Taiwan. Inhalation Toxicology, 18(8): 549-554. 71 Seppanen OA, Fisk WJ. 2004. Summary of human responses to ventilation. 72 Lee JH, Roh JH, Burks D, Warshowsky D, Talaska G. 2000. Skin cleaning with kerosene facilitates passage of carcinogens to the lungs of animals treated with used gasoline enHygiene 15(4): 362-369. 73 Drexelius RJ, Carwardine K, Jaeger M, & Talaska G. 1999. Barrier cream application reduces formation of DNA adducts in lung tissue of mice dermally exposed to used gasoline engine oil. Applied Occupational and Environmental Hygiene, 14(12): 838-844.

505 W. Northern Lights, Suite 205 Anchorage, AK 99503 Phone: (907) 222-7714
Fax: (907) 222-7715 www.akaction.org
Phthalates
WHAT ARE PHTHALATES? Phthalates are a group of industrial chemicals that add flexibility and resilience to many consumer products. Of particular concern are di-2-ethylhexyl (DEHP), benzylbutyl phthalate (BzBP), dibutyl phthalate (DBP), and very likely diethyl phthalate (DEP). DEHP and BzBP are primarily used as plasticizers in polyvinyl chloride (PVC)-based plastics, as well as other flexible plastics, and found in tablecloths, furniture, vinyl flooring, shower curtains, garden hoses, inflatable swimming pools, plastic clothing such as raincoats, children’s toys, automobile upholstery and tops, medical tubing, and blood storage bags.1,2 DEP and DBP are used in non-plastic consumer items as fixatives, detergents, lubricating oils, and solvents and can be found in carpets, paints, glue, insect repellents, time release capsules, and personal care products such as soap, shampoo, hair spray, nail polish, deodorants, and fragrances.2-6
PHTHALATES IN OUR BODIES In a nationwide assessment of the exposure of the U.S. population to phthalates, scientists from the Centers for Disease Control and Prevention (CDC) measured levels of urinary phthalate monoesters (breakdown products of phthalates) in 289 people and found phthalates at unexpectedly high levels in every person tested.7,8 According to this assessment, researchers determined that “from a public health perspective, these data provide evidence that phthalate
exposure is both higher and more common than previously suspected.”7 Though not representative of the population due to the small sample size, this study found that women of reproductive age (20 to 40 years) had substantially higher levels of DBP than the rest of the study group.7 In the 2005 CDC study, phthalates were once again widely detected in human urine samples with an increased sample size of over 2,500 Americans.3 Overall, the study indicated that, with the exception of MEP (mono-ethyl phthalate, the urinary metabolite of DEP), children age 6 to 11 years of age excreted higher concentrations of phthalate metabolites than the older age groups.1 In the same report, researchers found that women had higher levels of MEP, MBP (mono-butyl phthalate, a urinary metabolite of DBP), MBzP (mono-benzyl phthalate, the urinary metabolite of BzBP), and three urinary metabolites of DEHP: MEHP (mono-2-ethylhexyl phthalate), MEOHP (mono-(2-ethyl-5-oxohexyl) phthalate), and MEHHP (mono-(2ethyl-5-hydroxyhexyl) phthalate).1 In a more recent study, the phthalate monoesters MEHHP, MEOHP, and MEP were found to be present in 100% of 90 girls age 6 to 9, and MBP, MBzP, and MEHP were found in over 94%.10

HOW ARE WE EXPOSED TO PHTHALATES? There are multiple human exposure routes for phthalates including oral, inhalation, ingestion, dermal, and intravenous—through transfusions and other medical devices and procedures.1,2,5,6,8 Phthalates are easily released from the plastic products in which they are used as they are not part of the polymer chain which forms the
c.plasti 6 People are exposed to
phthalates through
direct contact with
consumer products
containing phthalates, consumption of contaminated water or food (as the phthalates in plastic packaging may leach into the food they hold), inhalation of contaminated air, and during the manufacturing and disposal of products containing phthalates.2,6,11 Individual phthalates have various routes of exposure:
The largest source of DEHP exposure for the general population is diet, followed by inhalation of contaminated indoor air.11 Exposures in food result from DEHP accumulating in foods and from the leaching of DEHP while processing, packaging, and storing.11 The single largest use of DEHP is as a plasticizer for poly-vinyl chloride plastic (PVC). DEHP can leach from PVC under certain circumstances, causing direct human exposures.3,4,10
DEP exposure results mainly from direct use consumer products containing fragrances and personal care products such as shampoos, scents, soap, lotions, and cosmetics, and from inhalation of air containing these chemicals.3,10 Exposure to DEP
is also found in products such as toothbrushes, tools, food packaging, insecticides, and aspirin.6
Exposure to DBP has been linked most commonly to cosmetics, mainly nail polish, but DBP is also found in pharmaceutical coatings, insecticides, and some printing inks.3,4,10
BzBP is an industrial solvent and found within adhesives, vinyl flooring, sealants, car-care products, and some personal care products such as hair spray. 3,4,10
WHAT DOES PHTHALATE EXPOSURE MEAN FOR OUR HEALTH? Evidence that exposure to phthalates has possible adverse health effects has been building over recent years. Phthalate exposure has been linked to the following health concerns: Reproductive and Developmental Effects: Phthalate exposure can begin in utero and in one study is strongly associated with a shorter pregnancy duration.12 Another study also found that prenatal phthalate exposure at environmental levels is associated with altered male reproductive development in humans, including shortened anogenital distance (signifying feminization), an increased likelihood of testicular maldescent, small and indistinct scrotum, and smaller penile size.13 Later research documented altered male reproductive hormone levels in baby boys most highly exposed to phthalates in their mother’s breast milk.14 Phthalate exposure has also been linked to lower sperm counts, reduced sperm motility, and damaged sperm in men.15
Respiratory System: Studies have shown concentrations of phthalates in house dust are associated with asthma and rhinitis in children.16 Exposure to PVC flooring containing

phthalates has also been linked to increased bronchial obstruction during the first two years.9 In adult men, exposure to certain phthalates has been linked to reduced lung capacity at magnitudes similar to those observed with tobacco smoke.17
REDUCING YOUR EXPOSURE Scientific evidence indicates that phthalates readily exit our bodies through urinary metabolites. Although people are continually exposed to phthalates because they are ubiquitous, you can minimize re-exposure to phthalates by: Avoid products containing PVC plastic:
Avoid the use of PVC/vinyl in building and home remodeling. Use safe alternatives such as those recommended by the Healthy Building Network (www.healthybuilding.net).
Purchase natural fibers, polyester, or nylon shower curtains instead of vinyl. Avoid plastics marked with the #3 symbol; these are likely to contain PVC. Check with your children’s toy manufactures to see if they have pledged to stop
using PVC. Toymakers Brio, Chicco, Early Start, Evenflo, Gerber, Lego, Prime Time, Sassy, and Tiny Love have already made the commitment.
Awareness of Household Products: Educate yourself as to whether the adhesives, caulk, grout, and sealants you use
contain phthalates. In the National Institutes of Health’s Household Products Database, you can search for phthalate as an ingredient. It can be found at www.householdproducts.nlm.nih.gov.
Phthalate-free Personal Care Products: Look at ingredient lists and avoid products listing “fragrance” or phthalates. Choose products from companies that have signed the Compact for Safe Cosmetics.
For a listing, check out: www.safecosmetics.org. Research the ingredients of your personal care products, beyond what is on the
ingredient label. Check out the Skin Deep Database at www.ewg.org/reports/skindeep2/index.php for a more complete listing.
Know What Is In Your Food: Grow and harvest your own food without using pesticides, or purchase organic foods
if possible.
Effects in Laboratory Animals: Depending on the exposure level, exposure to DEHP resulted in observed effects on the pituitary, thyroid, thymus, ovaries, testes, lung, kidneys, liver, and blood.11
REGULATIONS FOR PHTHALATES In the United States, federal regulation of phthalates fall under the Toxic Substances Control Act which was passed in 1976 and
has not been updated since.18 Though phthalates are considered a hazardous waste and are regulated as pollutants when released into the environment in the U.S., they remain basically unregulated in consumer products.18,19 Several states have tried and failed to pass laws banning phthalates in certain consumer products. However, in September, 2007 the California State Senate successfully passed a bill that would ban 6 phthalates in children’s toys beginning in 2009.20 On the global level, the European Union banned the use of six phthalates in children’s toys and products in 2005, and prior to that, fourteen counties had restricted or banned their use.21

1 Agency for Toxic Substances and Disease Registry (ATSDR). 2002. Public Health Statement Di(2-ethylhexyl)phthalate (DEHP). Atlanta, GA: U.S. Department of Health and Human Services, Public Health Service, Agency for Toxic Substances and Disease Registry. 2 Schettler, T. 2006. Human exposure to phthalates via consumer products. International Journal of Andrology 29:134-139. 3 Centers for Disease Control and Prevention (CDC). 2005. Third National Report on Human Exposure to Environmental Chemicals. Atlanta, GA: CDC. 4 Houlihan J, Brody C, Schwan B. 2002. Not Too Pretty. Environmental Working Group. Available: http://www.ewg.org/reports/nottoopretty 5 ATSDR. 2001. Toxicological Profile for Di-n-butyl Phthalate (DBP). Atlanta, GA: U.S. Department of Health and Human Services, Public Health Service, Agency for Toxic Substances and Disease Registry. Available: http://www.atsdr.cdc.gov/toxpro2.html 6 ATSDR. 1995. Toxicological Profile for Diethyl Phthalate (DEP). Atlanta, GA: U.S. Department of Health and Human Services, Public Health Service, Agency for Toxic Substances and Disease Registry. Available: http://www.atsdr.cdc.gov/toxpro2.html 7 Blount BC, Silva MJ, Caudill SP, Needham LL, Pirkle JL, Sampson EJ, et al. 2000. Levels of seven urinary phthalate metabolites in a human reference population. Environmental Health Perspectives 108(10):979-82. 8 CDC. 2001. National Report on Human Exposure to Environmental Chemicals. Atlanta, GA: CDC. 9 Kohn MC, Parham F, et al. 2000. Human exposure estimates for phthalates. Environmental Health Perspectives 108(10):A440-2. 10 Wolff MS, Teitelbaum SL, Windham G, Pinney SM, Britton JA, Chelimo C, et al. 2007. Pilot study of urinary biomarkers of phytoestrogens, phthalates, and phenols in girls. Environmental Health Perspectives 115(1):116-121. 11 Center for the Evaluation of Risks to Human Reproduction (CERHR). 2000. NTP-CERHR Expert Panel Report on Di(2-ethylhexyl)phthalate. U.S. Department of Health and Human Services, National Toxicology Program, Center for the Evaluation of Risks to Human Reproduction. Available: http://cerhr.niehs.nih.gov/ 12 Latini G, De Felice C, Presta G, Del Vecchio G, Paris I, Ruggieri F, et al. 2003. In utero exposure to di-(2-ethylhexyl)phthalate and duration of human pregnancy. Environmental Health Perspectives 111(14):1783-1785. 13 Swan SH, Maine KM, Liu F, Stewart SL, Kruse RL, Calafat AM, et al. 2005. Decrease in anogenital distance among male infants with prenatal phthalate exposure. Environmental Health Perspectives 113(8):1056-1061. 14 Main KM, Mortensen GK, et al. 2006. Human breast milk contamination with phthalates and alterations of endogenous reproductive hormones in infants three months of age. Environmental Health Perspectives 114(2):270-6. 15 Duty SM, Singh NP, et al. 2005. The relationship between environmental exposures to phthalates and DNA damage in human sperm using the neutral comet assay. Environmental Health Perspectives 111(9):1164-1169. 16 Bornehag C, Sundell J, Weschler CJ. 2004. The association between asthma and allergic symptoms in children and phthalates in house dust: A nested case-control study. Environmental Health Perspectives 112:1393-1397. 17 Hoppin JA, Ulmer R, London SJ. 2004. Phthalate exposure and pulmonary function. Environmental Health Perspectives 112(5):571-574. 18 Sutton R, Jackson J. Walker B, Tupper G, Horenstein B (eds.). 2007, July 12. Down the Drain: Sources of Hormone-Disrupting Chemicals in San Francisco Bay. Oakland, CA: Environmental Working Group. Available: http://www.ewg.org/reports/downthedrain. [Accessed 10 September 2007]. 19 EPA. 2006. Inventory Update Reporting. Environmental Protection Agency. Available: http://www.epa.gov/oppt/iur/ 20Environment California. 2007, September 4. Senate Passes Bill to Protect Kids From Toxic Toys: Bill Now Moves to the Governor’s Desk. Environmental Health News: Environment California. Available: http://www.environmentcalifornia.org/news-releases. [Accessed 13 September 2007]. 21Environment California. 2007. Phthalate Overview. Stop Toxic Toys. Environment California. Available: http://www.environmentcalifornia.org/environmental-health/stop-toxic-toys. [Accessed 13 September 2007].

505 W. Northern Lights, Suite 205 Anchorage, AK 99503 Phone: (907) 222-7714
Fax: (907) 222-7715 www.akaction.org
Polybrominated Diphenyl Ethers (PBDEs)
WHAT ARE PBDES? Polybrominated diphenyl ethers, or PBDEs, are a class of flame retardant chemicals added to many consumer products found in the home, office, automobiles, and airplanes.1 Three mixtures used widely—penta-BDE, octa-BDE, and deca-BDE—made up 14%, 6%, and 80% of the 1999 worldwide production, respectively.2 Usually found in electronics, such as TVs, and used in some furniture foams, fabrics, and kitchen appliances, the industry voluntarily ended production in the United States of the formulations of penta and octa in 2004 after high levels were found in breast milk. However, the deca formulation is still being produced and used mostly in plastic electronics such as televisions and computer casings. It is also used in the upholstery covers of items such as furniture, mattresses, and car seats.3,4 PBDEs are also part of a larger chemical class called polyhalogenated aromatic hydrocarbons (PHAHs) which include other highly toxic chemicals such as polychlorinated biphenyls (PCBs) and dioxins.2 PBDEs are intrinsically hazardous because of their chemical make-up: (1) they are stable, meaning they stay in the environment and do not break down easily; (2) they are lipophilic, meaning they build up in fatty tissues of living organisms; and (3) they have toxic properties, including the potential to act as endocrine disruptors.5 Their persistence and fat solubility allow them to both biomagnify and bioaccumulate, meaning they build up in
the bodies of animals and humans as they move through the food chain. Although the main component in deca-BDE, BDE-209, has a relatively short half-life in people,1 animal studies show that the liver breaks down BDE-209 into the more persistent and bioaccumulative formulations known as hepta-BDE, octa-BDE, and nona-BDE.6,7 HOW ARE WE EXPOSED? There are many ways that humans are exposed to PBDEs, including eating contaminated foods and incidental intake of PBDE-contaminated dust.7 Because of the chemical make-up of PBDEs, they do not fully attach to the products in which they are used. Deca, in particular, breaks down into more toxic products and volatizes when exposed to ultraviolet (UV) light.8 It is not entirely clear how deca is being released from products, though some think it might be released from physical abrasion or deterioration of the product. Penta does not need UV light exposure to volatize. PBDEs are released from furniture, electronics and other products when exposed to UV light, causing them to be present in the air we breathe and in dust. Although penta-BDE and octa-BDE are no longer produced in the United States, exposure continues from old computers, furniture, fabrics, and other consumer sources that were made before the discontinuation.9 Out of all possible exposure routes, the highest intake of deca-BDE results from household dust.10,11,12 Another major route

of exposure is eating fatty foods such as meat and dairy products,13 as PBDEs are fat-seeking and build up in the food chain. Eating fish and marine animals may be another route of exposure because they have been found to contain high levels of deca-BDE.14 The high levels in marine environments may be due to atmospheric deposition (when contaminants from the air come down to the earth’s surface by rain, snow, falling particles, and the absorption of gas) of deca-BDE as well as sewage discharge into the oceans.14 PBDES IN OUR BODIES Due to their widespread use, persistence and bioaccumulative properties, PBDEs have been found in humans at high levels. One study showed that 5 percent of American women have levels of PBDEs that are close to the levels linked to reproductive problems in animals,1 though we do not know if humans are more or less sensitive than animals. PBDEs have been found in mothers’ breast milk and in the blood of mothers and their babies.15,16 People of the Arctic may experience an even higher risk due to their traditional diet rich in fat from marine mammals.7 Concentrations of PBDEs have grown over the years in marine mammals due to atmospheric transport (transported long distances from areas of production and use via air and ocean currents into the north) and bioaccumulation.2
WHAT DOES EXPOSURE TO PBDES MEAN FOR OUR HEALTH? PBDEs have been linked to many adverse health effects, including: Developmental Effects: Studies in rodents suggest that neonatal exposure to PBDEs permanently affects learning and memory functions, impairs motor activity, and is linked to aberrations in spontaneous behavior and hyperactivity that seem to be permanent.17,18,19 However, it is not known what the
developmental effects are in people or at what doses they happen. Reproductive Effects: PBDEs are mildly estrogenic compounds20 which have been correlated to cryptorchidism, or undescended testes, in newborn boys,21 and shown to permanently impair sperm development in rodent studies.11 Exposure to PBDEs in household dust is linked with lower levels of androgens (male hormones) in adult men.22 PBDEs have also been associated with delay of puberty in both male and female rodents and changes in sexual development and gender-specific sexual behavior.23 Exposure to PBDEs has also been linked to low birth weight, birth defects, reduced weight gain during pregnancy, changes in ovary cells, and reduced sperm count.24,25 The breakdown products of PBDEs also may inhibit aromatase, an enzyme important in the formation of androgens and estrogens (male and female hormones),26 and in the skeletal development of both males and females. Cancer: One study suggests that in utero exposure to PBDE concentrations is associated with an increased risk of testicular cancer in men.27 The Agency for Toxic Substances and Disease Registry (ATSDR) lists deca-BDE as a possible human carcinogen based on the development of liver tumors in rats that were given the substance.7 Thyroid Problems: In a study of newborn babies, high PBDE levels in cord blood are associated with decreased levels of thyroid hormones.28 Corresponding animal studies have also shown that PBDE exposure is linked to decreased circulating concentrations of thyroid hormone11,29 and decreased thyroid weight in adult rodent offspring.13

REGULATIONS FOR PBDES There have been many steps forward in the regulation of PBDEs in recent years, but much more is needed to ensure the safety of public health. Internationally, Sweden was the first to initiate a phase-out of PBDEs in the late 1990s, followed by the European Union—first phasing out penta-BDE and octa-BDE and then deca-BDE in 2006.30 In 2008, Norway banned the use of deca-BDE in new consumer products,31
and Canada prohibited the manufacture of all PBDEs and put in place restrictions on the import of certain PBDEs.32 In the United States, industry voluntarily ended production of penta-BDE and octa-BDE in 2004, but deca-BDE is still allowed to be used in consumer products.16 Both Washington and Maine are currently discontinuing the use and manufacture of deca-BDE,33,34 with other states around the nation aiming for similar legislation.
REDUCING OUR EXPOSURE You can minimize your exposure to PBDEs by taking the following steps: PBDE-free Furniture:
Before purchasing furniture, find out which companies offer PBDE-free products. The following websites can help:
o Clean Production Action: www.cleanproduction.org/Flame.Alternatives.php o Pollution in People: www.pollutioninpeople.org/safer/products
Contact the company directly if you cannot figure out if the manufacturer uses PBDEs. Choose furniture made with less flammable fabrics like leather, wool and cotton.
PBDEs in Foam Padding: Foam items purchased before 2005 are likely to contain PBDEs. Make sure these items
are completely covered in fabric with no rips. Avoid reupholstering foam furniture. Be very careful when removing old carpet. Try to keep your work area separated from
the rest of the house and thoroughly clean up the area. Reduce Your Dust Exposure:
Wash your hands often to remove dust particles that your hands pick up throughout the day on everything you touch.
Use a wet rag or cloth while dusting to avoid kicking up the dust in the air. If possible, use a vacuum fitted with a HEPA filter. These vacuums can trap smaller
particles of dust and will be more likely to remove contaminants from your home. Vehicles have been exempt from recent PBDE laws and high levels have been found
inside cars.4 Removing dust with a wet cloth and keeping car seat cushions in good repair will help to reduce your exposure.
PBDE-free Electronics: Many companies are beginning to make electronics with alternatives to PBDEs. Certain
PBDE-free products are available from Canon, Dell, HP, Intel, Erickson, Apple, Acer, Nokia, Motorola, LG Electronics, and Sony.
Consider Eating Less Fat: Consider choosing leaner meat and poultry cuts. Consider removing fat that you see on meat and fish whenever possible. Choose cooking methods that remove excess fat such as broiling, grilling, and roasting.

1 McDonald TA. 2005. Polybrominated diphenylether levels among United States residents: Daily intake and risk of harm to the developing brain and reproductive organs.” Integrated Environmental Assessment and Management 1(4):343-354. 2 Ikonomou MG, Rayne S, Addision RF. 2002. Exponential increases of the brominated flame retardants, polybrominated diphenyl ethers, in the Canadian Arctic from 1981 to 2000. Environmental Science & Technology 36(6):1886-1892. 3 Toxic-Free Legacy Coalition Report. 2006. Pollution in People. Available: http://www.toxicfreelegacy.org. 4 Lagalante AF, Oswald TD, Calvosa FC. 2008. Polybrominated diphenyl ether (PBDE) levels in dust from previously owned automobiles at United States dealerships. Environment International. Available: http://www.sciencedirect.com/science/journal/01604120 [Accessed 3 March, 2009]. 5 Hooper K, McDonald TA. 2000. The PBDEs: An emerging environmental challenge and another reason for breast-milk monitoring programs. Environmental Health Perspectives 108(5):387-392. 6 Stapleton HM, Brazil B, Holbrook RD, Michelmore CL, Benedict R, Konstantinov A, et al. 2006. In vivo and invitro debromination of decabomodiphenyl ether (BDE 209) by juvenile rainbow trout and common carp. Environmental Science and Technology 40(16): 4653-4658. 7 Van der ven LT, van de Kuil T, Leonards PE, Slob W, Canton RF, Germer S, et al. 2008. A 28-day oral dose toxicity study in Wistar rats enhanced to detect endocrine effects of decabromodipenyl ether (decaBDE). Toxicology Letters 179(1): 6-14. 8 Washington State Department of Health and Washington State Department of Ecology. 2006. Washington State Polybrominated Diphenyl Ether (PBDE) Chemical Action Plan: Final Plan. Available: http://www.ecy.wa.gov/pubs/0507048.pdf. 9 Northwest Watch. 2004. Flame retardants in the bodies of pacific northwest residents: A study of toxic body burdens. Available: http://www.sightline.org/ 10 Frederiksen M, Vorkamp K, Thomsen M, Knudsen LE. 2009. Human internal and external exposure to PBDEs – a review of levels and sources. International Journal of Hygeine and Environmental Health 212(2): 109-134. 11 Wilford BH, Shoeib M, Harner T, Zhu J, Jones KC. 2005. Polybrominated diphenyl ethers in indoor dust in Ottawa, Canada: implications for sources and exposure. Environmental Science and Technology 39(18): 7027-7035. 12 Huwe JK, Hakk H, Smith DJ, Diliberto JJ, Richardson V, Stapleton HM, Birnbaum LS. 2008. Comparative absorption and bioaccumulation of polybrominated diphenyl ethers following ingestion via dust and oil in male rats. Environmental Science and Technology 42(7): 2694-2700. 13 Agency for Toxic Substances and Disease Registry (ATSDR). 2004. Toxicological Profile for Polybrominated Biphenyls and Polybrominated Diphenyl Ethers. Atlanta, GA: U.S. Department of Health and Human Services, Public Health Service, Agency for Toxic Substances and Disease Registry. Available: http://www.atsdr.cdc.gov/toxprofiles/tp68.html. 14 Ross PS, Couillard CM, Ikononmou MG, Johannessen SC, Lebeuf M, Macdonald RW, et al. 2009. Large and growing environmental reservoirs of Deca-BDE present an emerging health risk for fish and marine mammals. Marine Pollution Bulletin 58(1): 7-10. 15 Schecter A, Pavuk M, Papke O, Ryan JJ, Birnbaum L, Rosen R. 2003. Polybrominated diphenyl ether (PBDEs) in U.S. mother’s milk. Environmental Health Perspectives 111(14):1723-1729. 16 Mazadai A, et al. 2003. Polybrominated diphenyl ethers in maternal and fetal blood samples. Environmental Health Perspectives 111(9):1249-1252. 17 Eriksson P, Jakobsson E, Fredriksson A. 2001. Brominated flame retardants: A novel class of developmental neurotoxicants in our environment? Environmental Health Perspectives 109(9):903-908. 18 Kuriyama SN, Talsness CE, Grote K, Chahoud I. 2005. Developmental exposure to low-dose PBDE-99: Effects on male fertility and neurobehavior in rat offspring. Environmental Health Perspectives 13(2):149-154. 19 Johansson N, Viberg H, Fredricksson A, Eriksson P. 2008. Neonatal exposure to deca-brominated diphenyl ether (PBDE 209) causes dose-response changes in spontaneous behavior and cholinergic susceptibility in adult mice. Neurotoxicology 29(6): 911-919. 20 Mercado-Feliciano M, Bigsby RM. 2008. The polybrominated diphenyl ether mixture DE-71 is mildly estrogenic. Environmental Health Perspectives 116(5): 605-611. 21 Main KM, Kivirant H, et al. Accepted for print, May 2007, to be published. Flame retardants in placenta and breast milk and cryptorchidism in newborn boys. Environmental Health Perspectives doi:10.1289/ehp.9924 Available: http://dx.doi.org/ [Accessed 31 May 2007]. 22 Meeker JD, Johnson PI, Camann D, Hauser R. 2009. Polybrominated diphenyl ether (PBDE) concentration in household dust are related to hormone levels in men. Science of the Total Environment, doi:10.1016/j.scitotenv2009.01.030. 23 Lilienthal, Hellmuth, et al. 2006. Effects of developmental exposure to 2,2’,4,4’,5-pentabromodiphenyl ether (PBDE-99) on sex steroids, sexual development, and sexually dimorphic behavior in rats. Environmental Health Perspectives 114(2):194-201. 24 Schreder E. 2006. Pollution in People: A Study of Toxic Chemicals in Washingtonians. Available: www.pollutioninpeople.org.

25 Chao HR, Wang SL, Lee WJ, Wang YF, Papke O. 2007. Levels of polybrominated diphenyl ethers (PBDEs) in breast milk from central Taiwan and their relation to infant birth outcome and maternal menstruation effects. Environment International 33(2): 239-245. 26 Canton RF, Scholten DE, Marsh G, de Jong PC, van den Berg M. 2008. Inhibition of human placental aromatase activity by hydroxylated ploybrominated diphenyl ethers (OH-PDBEs). Toxicology and Applied Pharmacology 227(1): 68-75. 27 Hardell L, van Bavel B, Lindström G, Eriksson M, Carlberg M. 2006. In utero exposure to persistent organic pollutants in relation to testicular cancer risk. International Journal of Andrology 29:228-234. 28 Herbstman JB, Sjodin A, Apelberg BJ, Witter FR, Halden RU, Patterson DG, et al. 2008. Birth delivery mode modifies the associations between prenatal polychlorinated biphenyl (PCB) and polybrominated diphenyl ether (PBDE) and neonatal thyroid hormone levels. Environmental Health Perspectives 116(10): 1376-1382. 29 Tseng LH, Li MH, Tsai SS, Lee CW, Pan MH, Yao WJ, et al. 2008. Developmental exposure to decabromodiphenyl ether (PBDE 209): Effects on thyroid hormone and hepatic enzyme activity in male mouse offspring. Chemosphere 70(4): 640-647. 30 Northwest Watch. 2004. Flame retardants in the bodies of pacific northwest residents: A study of toxic body burdens. Available: http://www.sightline.org/ 31 Norwegian Pollution Control Authority. 2008. Ban on Deca-BDE. Available: http://www.sft.no/publikasjoner/ 2401/ta2401.pdf [Accessed 4 March, 2009]. 32 Government of Canada. 2008. Polybrominated diphenyl ether regulations. Canada Gazette Part II 142(14): 1663-1682. 33 State of Maine. 2007. Title 38, Chapter 16, Section 1609: Restrictions on sale and distribution of brominated flame retardants. Available: www.mainelegislature.org/legis/statutes/38/title38sec1609.html [Accessed 5 March 2009]. 34 State of Washington. 2008. Revised Code of Washington, chapter 70.76: Polybrominated diphenyl ethers –flame retardants. Available: http://apps.leg.wa.gov/RCW/default.aspx?cite=70.76 [Accessed 5 March 2009].

505 W. Northern Lights; Suite 205 Anchorage, AK 99503 Phone: (907) 222-7714
Fax: (907) 222-7715 www.akaction.org
Polychlorinated Biphenyls (PCBs) WHAT ARE POLYCHLORINATED BIPHENYLS (PCBS)? PCBs, compounds once used as insulators
in the electrical industry, are now banned in the United States, Northern Europe and other countries. These compounds are found throughout the environment and in human bodies worldwide.1,2 PCBs are considered persistent organic
pollutants (POPs) because they do not easily break down and they stay in the environment for many years. POPs are toxic at extremely low levels. PCBs were left behind as waste by the
military at formerly used defense sites (FUDS) throughout Alaska. PCBs produced throughout the world can travel on wind and ocean currents and build up in wildlife and people of the North/Arctic, a process called global transport.3
HOW ARE WE EXPOSED? PCBs build up in fatty tissue in the body. People are exposed to PCBs through foods such as fish, dairy products, marine mammals, and through breast milk.1,2,4 SYMPTOMS & HEALTH PROBLEMS Prenatal exposure to PCBs is linked to
lower developmental test scores, short-term memory defects, and lower IQ levels
in children.1,2,5 Health effects that may result from high
exposures to PCBs include: chloracne, keratoses and pigmentation of the skin; mixed peripheral neuropathy; and gastritis.1,6,7 Long-term and chronic PCBs exposures
are also associated with adverse health effects, including: cancer, immune suppression, neurobehavioral problems, endocrine disruption of sex steroid and thyroid function, cardiovascular disease, and diabetes.3,8,9
FOLLOW UP ACTION If you think your patient may have been
exposed to PCBs, refer patient to a physician and contact ACAT at (907) 222-7714 or [email protected]. Recommend breastfeeding to postpartum
patients.1 In communities at risk of chemical exposures, it is even more important that mothers breastfeed their babies because breast milk reduces the effects of the chemicals on infants and makes them healthier.10,11,12,13 Support patients’ continued consumption
of traditional subsistence foods, unless you have information that indicates PCBs or other contamination.

REDUCING YOUR EXPOSURE You can prevent or minimize exposure to PCBs in the following ways: Consider removing fat that you see on meat and fish whenever possible. Consider eating leaner meats whenever possible. Consider eating less dairy products; or, if available, choose low fat or nonfat dairy
products.2 Although it is uncertain how far contaminants may spread around formerly used
defense sites, it is advisable to have water and traditional food sources close to, downstream or downwind of these sites tested for the possibility of harmful exposures. If you have concerns about the safety of your water or traditional foods, contact ACAT or visit our website at www.akaction.org.
1 Etzel RA, ed. 2003. Pediatric Environmental Health. 2nd ed. Elk Grove Village, IL: American Academy of Pediatrics. 2 Greater Boston Physicians for Social Responsibility. Provider Reference Card. Available: http://psr.igc.org/toolkit/ref_guide.pdf [Accessed 22 June, 2007]. 3 Carpenter DO, DeCaprio AP, O’Hehir D, Akhtar F, Johnson G, Scrudato RJ, Apatiki L, Kava J, Gologergen J, Miller PK, Eckstein L. 2005. Polychlorinated biphenyls in serum of the Siberian Yupik People from St. Lawrence Island, Alaska. International Journal of Circumpolar Health 64(4): 322-335. 4 Dewailly E, Nantel A, Weber JP, Meyer F. 1989, Nov. High levels of PCBs in breast milk of Inuit women from arctic Quebec. Bulletin of Environmental Contamination and Toxicology 43(5): 641-646. 5 Jacobson JL. 1996, Sept. Intellectual impairment in children exposed to polychlorinated biphenyls in utero. New England Journal of Medicine 335(11): 783-783. 6 Rogan WJ, Gladen BC, Hung KL, Koong SL, Shih LY, Taylor JS, et al. 1988, July. Congenital poisoning by polychlorinated biphenyls and their contaminants in Taiwan. Science 241(4863): 334-336. 7 Caramaschi F, del Corno G, Favaretti C, Giambelluca SE, Montesarchio E, Fara GM. 1981, June. Chloracne following environmental contamination by TCDD in Seveso, Italy. International Journal of Epidemiology 10(2): 135-143. 8 Agency for Toxic Substances and Disease Registry (ATSDR). 2000. Toxicological profile for polychlorinated biphenyls. Atlanta, GA: U.S. Department of Health and Human Services, Public Health Service. 9 Carpenter DO. Polychlorinated biphenyls and human health. International Journal of Occupational Medicine & Environmental Health 1998; 11:291-303. 10 Lanting CI, Patandin S, Weisglas-Kuperus N, Touwen BC, Boersma ER. 1998. Breastfeeding and neurological outcome at 42 months. Acta Paediatrica 87(12):1224–1229. 11 Patandan, S, Lanting CI, Mulder PG, Boersma ER, Sauer PJ, Weisglas-Kuperus N. (1999). Effects of environmental exposure to polychlorinated biphenyls dioxins on cognitive abilities in Dutch children at 42 months of age. Journal of Pediatrics 134(1):33–41. 12 Hooper K, She J. 2003, January. Lessons from the polybrominated diphenyl ethers (PBDEs): Precautionary principle, primary prevention, and the value of community-based body burden monitoring using breast milk. Environmental Health Perspectives, 111(1):109-114, p. 112. 13 Greater Boston Physicians for Social Responsibility (GBPSR). 2002, Fall. Out of Harm’s Way: Preventing Toxic Threats to Child Development. Why Breast-Feeding is Still Best for Baby. Available: http://www.psr.org/site/DocServer/BFeasyeng2pg.10.18.pdf?docID=5205.

505 W. Northern Lights, Suite 205 Anchorage, AK 99503 Phone: (907) 222-7714
Fax: (907) 222-7715 www.akaction.org
Solvents WHAT ARE SOLVENTS? Solvents are any class of chemicals used to dissolve materials. Usually, solvents are extremely volatile and reactive, meaning they quickly evaporate into their gaseous form and interact with other molecules to form byproducts (or different chemical ombinations) quickly.1
ent or cleaning electronics before ale.1
posed to solvents in a
f exposure for solvents is
t such as
orkplace, while working
aint or gasoline—evaporate into
ed into the air from gasoline xhaust.3
of symptoms. he health effects of some common
included here. c Because of their ability to dissolve solids, solvents are often used to clean and sanitize. Solvents are also used industrially for many purposes such as degreasing equipms HOW ARE WE EXPOSED? People can be exnumber of ways: The main route o
breathing it in. Household exposures to solvents are fairly
common. Solvents are commonly added to many household produc scleaning supplies and paints.1 Individuals may also be exposed to
solvents in the wwith solvents.1 Indirect exposure can occur when
solvents added to consumer products—such as pthe air. Environmental exposures to solvents are
also possible, as some solvents persist in the environment due to improper disposal.2 Other solvents such as benzene are release
SYMPTOMS & HEALTH OUTCOMES There are different health effects of solvent exposure depending on the specific solvent and the length of exposure. Different solvents will result in a rangeTsolvents are Ammonia Ammonia is commonly occurring and naturally present in the environment. Exposure to these background levels is not harmful. However, important research shows that acute exposure to high concentratio
4
ns of ammonia and chronic xposure to moderate levels can be harmful
tion, short-term lindness or altered vision, watering eyes,
eal abrasions.4
eor deadly. At low levels, ammonia inflicts tissue damage to the exposed area, including the nose, throat, and lungs if it is inhaled.5,6 At higher levels, animal studies suggest it may interfere with neurological processes, especially when ingested.7,8 Airborne ammonia can cause irritation of the eyes resulting in inflammaband corn Bleach Sodium hypochlorite is the active ingredient in chlorine bleach and cleaning products containing bleach. Exposure to sodium hypochlorite irritates skin and mucus membranes, and high concentrations of odium hypochlorite can cause serious
tissue damage.9 s

In addition to being acutely toxic, sodium hypochlorite can react with other cleaners and organic matter to form dangerous chemicals. Chloroform can be created when bleach contacts organic matter during cleaning10 and can be created in chlorinated drinking water as well.11 Free chlorine gas can be created when bleach is mixed with cidic solutions.12
t, chest pain, vomiting, and even death.14
a Chloroform is a probable human carcinogen according to the US EPA.13 Chronic exposure is known to cause depression, lack of concentration, and irritability. Chlorine gas is acutely toxic and can cause irritation to the nose and throa
Benzene Benzene is a petrochemical, meaning it is a refined product of oil. It is present in the environment in water, soil and air. Some of the major sources of benzene are car exhaust, cigarette smoke, and paint or glues. Exposure to benzene through food, water, and soil is not common, unless there is a local source of contamination. Approximately 95% of exposure to benzene is through inhalation. Acute exposure can cause dizziness, rapid h
3
15
eart rate, tremors nd unconsciousness.3
el
m Benzene fact sheet for more
a Benzene is known to cause cancer. The most significant health risk to low lev exposure to benzene is leukemia.15 However, research suggests that benzene can induce other diseases of the blood, such as anemia, and uncontrolled bleeding.16 Benzene may also cause reproductive effects such as irregular
enstruation and birth defects.3 (Please see thedetails.) Simple Green Simple Green contains 2-butoxyethanol, a
ethers (EGEs), that are commonly used as solvents both in businesses and industries.
type of chemicals known as ethylene glycol
In humans, long term exposure to EGEs can result in dizziness, lethargy, headaches, and memory loss as well as hematopoietic effects such as decreases in some types of blood cells.17,18 Long-term exposure in animals has been linked to damage to DNA, sperm and blood cells.19,20,21 Exposure to 2-butoxyethanol is known to cause hemolysis, or destruction of blood cells, and reduce concentrations of hemoglobin in rats,22 and research has correlated 2-butoxyethanol exposure to an increase in tumors in rats and mice.23
Toluene Exposure to toluene can happen in many different ways, but the main route of exposure is inhalation from contaminated air. Gasoline, car exhaust, cigarette smoke, and paint or paint thinner are all common sources of toluene.24 Using nail polish significantly increases concentrations of toluene in the air.25 Acute exposure to toluene has been shown to result in dizziness, headaches,26 manual impairment, intoxication, and loss of color recognition.27 In humans, long-term exposure to toluene has been linked to mucus membrane irritation, altered temperature and sound perception, intoxication and an increase in spontaneous abortions.
24
28 It is also linked to dizziness, headaches,29 and hearing loss.30 In animals, toluene exposure has been linked to lower dopamine and noradrenaline levels, important neural hormones31 and an overall decrease in brain weight.32
FOLLOW UP ACTION If you think your patient may have been
exposed to solvents, refer patient to a physician.

REDUCING OUR EXPOSURE You can prevent or minimize exposure to solvents in the following ways: Whenever possible, buy products that do not contain harmful solvents. Water-based
paints and glues and citrus-based cleaners are safer to use. If you have solvents or products containing solvents in your home, carefully label
them and store them in a safe place, especially in homes with young children. When you use products with solvents, such as paints, cleaners, or nail polish, make
sure they are used in well ventilated areas and open windows or use fans to reduce the amount of solvents in the air.
Never mix cleaning solutions or solvents, as the resulting vapors can be harmful or deadly.
Gasoline and exhaust are major sources of solvents and other contaminants. Turn off the engines of cars, ATVs, and snow machines when not needed.
1 National Institute for Occupational Safety and Health (NIOSH). 2009. NIOSH Safety and Health Topic: Organic Solvents. Available: http://www.cdc.gov/niosh/topics/organsolv/. 2 Yeh HC, Kastenberg W. 1991. Health risk assessment of biodegradable volatile organic chemicals: A case study of PCE, TCE, DCE and VC, J. Hazard. Mater 27:111–126. 3 Agency for Toxic Substances and Disease Registry (ATSDR). 2007. Toxic substance profiles: Benzene. Available: http://www.atsdr.cdc.gov/toxprofiles/phs3.html. 4 Agency for Toxic Substances and Disease Registry (ATSDR). 2004. Toxic substance profiles: Ammonia. http://www.atsdr.cdc.gov/toxprofiles/tp126.html. 5 MacEwen JD, Theodore J, Vernot EH. 1970. Human exposure to EEL concentrations of monomethylhydrazine. In: Proceedings 1st Annual Conference on Environmental Toxicology, pp. 355-363. Wright-Patterson Air Force Base, OH: Aerospace Medical Research Laboratory. 6 Verberk MM. 1977. Effects of ammonia in volunteers. Int Arch Occup Environ Health 39:73-81. 7 Tepper JS, Weiss B, Wood RW. 1985. Alterations in behavior produced by inhaled ozone or ammonia. Fundam Appl Toxicol. 5:1110-1118. 8 Coon RA, Jones RA, Jenkins LJ Jr. 1970. Animal inhalation studies on ammonia, ethylene, glycol, formaldehyde, dimethylamine and ethanol. Toxicol Appl Pharmacol 16:646-655. 9 Agency for Toxic Substances and Disease Registry (ATSDR). 1997. Toxic substance profiles: Sodium hypochlorite. Available: http://www.atsdr.cdc.gov/tfacts184.html. 10 Odabasi M. 2008. Halogenated Volatile Organic Compounds from the Use of Chlorine-Bleach-Containing Household Products. Environ. Sci. Technol. 42(5):445–1451. 11 Kavcar P, Odabasi M, Kitis M, Inal F, Sofuoglu SC. 2006. Occurrence, oral exposure and risk assessment of volatile organic compounds in drinking water for Izmir. Water Res. 40:3219-3230 12 Nazaroff WW, Weschler CJ. 2004. Cleaning products and air fresheners: Exposure to primary and secondary air pollutants Atmos. Environ. 38:2841-2865. 13 United States Environmental Protection Agency (EPA). 2008. Integrated Risk Information System: Chloroform. Available: http://www.epa.gov/iris/subst/0025.htm. 14 Agency for Toxic Substances and Disease Registry (ATSDR). 2007. Toxic substance profiles: Chlorine. Available: http://www.atsdr.cdc.gov/toxprofiles/tp172.html. 15 Duarte-Davidson R, Courage C, Rushton L, Levy L. 2001. Benzene in the environment: An assessment of the potential risks to the health of the population. Occup Environ Med 58:2-13. 16 Smith MT. 1996. The mechanism of benzene-induced leukemia: A hypothesis and speculations on the causes of leukemia, Environ Health Perspect 104(6):1219–1225. 17 Browning RG, Curry SC. 1994. Clinical toxicology of ethylene glycol ethers. Hum. Exp. Toxicol. 13:325–335. 18 Kalf GF, Post GB, Snyder R. 1987. Solvent toxicology: Recent advances in the toxicology of benzene, the glycol ethers, and carbon tetrachloride. Annu. Rev. Pharmacol. Toxicol. 27:399–427. 19 Johanson G. 1988. Aspects of biological monitoring of exposure to glycol ethers. Toxicol. Lett. 43:5–21. 20 Johanson G. 2000. Toxicity review of ethylene glycol monomethyl ether and its acetate ester. Crit. Rev. Toxicol. 30:307–345.

21 Ghanayem BI, Burka LT, Matthews HB. 1987. Metabolic basis of ethylene glycol monobutyl ether (2-butoxyethanol) toxicity: Role of alcohol and aldehyde dehydrogenases. J. Pharmacol. Exp. Ther. 242:222–231. 22 Ghanayem BI, Ward SM, Chanas B, Nyska A. 2000. Comparison of the acute hematotoxicity of 2-butoxyethanol in male and female F344 rats. Human & Experimental Toxicology. 19:85-192. 23 National Toxicology Program. 2000, Mar. Toxicology and carcinogenesis studies of 2-Butoxyethanol (CAS No. 111-76-2) in F344/N rats and B6C3F1 mice (inhalation studies). National Toxicology Program Technical Report Series 484:1-290. Bethesda, MD: Department of Health and Human Services, Public Health Service. 24 Agency for Toxic Substances and Disease Registry (ATSDR). 2000. Toxicological profiles: Toluene. Available: http://www.atsdr.cdc.gov/toxprofiles/phs56.html. 25 Curry KK, Brookman DJ, Whitmyre GK. 1994. Personal exposures to toluene during use of nail lacquers in residences: Description of the results of a preliminary study. J Expos Anal Environ Epidemiol 4(4):443-456. 26 Anderson MA. 1992. Influence of surfactants on vapor-liquid partitioning. Environ Sci Technol 26:2186-2191. 27 Baelum J, Andersen I, Lundqvist GR. 1985. Response of solvent-exposed printers and unexposed controls to six-hour toluene exposure. Scand J Work Environ Health 11:271-280. 28 Ng TP, Foo SC, Yoong T. 1992. Menstrual function in workers exposed to toluene. Br J Ind Med 49:799-803. 29 Yin S, Li G, Hu Y, et al. 1987. Symptoms and signs of workers exposed to benzene, toluene or the combination. Ind Health 25:113-130. 30 Morata TC, Fiorini AC, Fischer FM. 1997. Toluene-induced hearing loss among rotogravure printing workers. Scand J Work Environ Health. 23(4):289-98. 31 Ikeda M, Koizumi A, Kasahara M. 1986. Combined effects of n-hexane and toluene on norepinephrine and dopamine levels in rat brain tissues after long-term exposure. Bull Environ Contam Toxicol. 36:510-517. 32 Kyrklund T, Kjellstrand P, Haglid K. 1987. Brain lipid changes in rats exposed to xylene and toluene. Toxicology 5:123-133.

505 W. Northern Lights, Suite 205 Anchorage, AK 99503 Phone: (907) 222-7714
Fax: (907) 222-7715 www.akaction.org
Triclosan
WHAT IS TRICLOSAN? Triclosan is an antibacterial chemical used to kill bacteria in a wide range of consumer products including soaps, deodorants, cosmetics, cleansing lotions, toothpaste, plastics, and fabrics.1,2 Antimicrobial pesticides, such as triclosan, are made to destroy or suppress the growth of microorganisms and are regulated by the Environmental Protection Agency. However, when triclosan is used in products intended for contact with the human body (i.e. personal care products such as soaps, antiseptics, and toothpaste) or in food or food wrappers, it is not considered a “pesticide” by U.S. law and is regulated by the Food and Drug Administration.3 Triclosan is mostly used in consumer products that are disposed of down drains. Wastewater treatment plants do not completely remove triclosan from the water before it is released. Thus, triclosan is thought to be found everywhere throughout the environment and the water cycle. Between 1999 and 2000 the U.S. Geological Survey tested water samples for 95 different chemicals including triclosan, which was among the most often found chemicals and had some of the highest levels.4 HOW ARE WE EXPOSED TO TRICLOSAN? Although triclosan was developed more than 30 years ago, over the last 10 years there has been a big increase in consumer products that contain triclosan.5,6 Daily exposure to consumer products that contain
triclosan (including at least one brand of toothpaste, skin-care products, and other household products) is most likely the main source of exposure for the U.S. population.7 A number of companies that make toothpaste and soap products with triclosan claim that the active ingredient continues to work for up to 12 hours following use. As a result, consumers are exposed to triclosan long after the few minutes it takes to wash their hands or brush their teeth.2 Triclosan can be absorbed through the skin, mouth, and nose.7,8 TRICLOSAN IN OUR BODIES In an on-going nationwide study of exposure of the U.S. population to environmental chemicals, scientists from the Centers for Disease Control and Prevention measured samples taken from 2003-2004 for triclosan in 2,517 people and found that 74.6% had detectable levels of triclosan in their urine.7 In a pilot study of 90 girls ages 6-9 years old, triclosan levels in their urine were detected in 67.8%.9 Triclosan has also been found in the breast milk and plasma of breast-feeding mothers. In one study that collected and tested the breast milk and plasma of 36 mothers for triclosan, those who used personal care products containing triclosan had higher levels suggesting that consumer products are a main source of exposure.10

SYMPTOMS & HEALTH OUTCOMES In acute toxicological studies, triclosan has been found to have low toxicity to humans and other mammals.11 However, many cases of skin irritation and eczematous rash resulting from skin contact with products containing triclosan have been reported.12 Long-term chronic exposures to triclosan may result in more serious health outcomes. Thyroid Disruption: The thyroid gland regulates development and metabolism. Because triclosan is structurally similar to thyroid hormone and has been shown to build up in the bodies of certain fish, it may disrupt normal growth and development in humans and wildlife. One study showed that triclosan interfered
with the thyroid hormone in frogs and affected the timing of metamorphosis in tadpoles with levels commonly found in the environment.13 Allergies: The overuse of triclosan (and other antibacterial chemicals) may be linked to increased allergies and asthma.2 Follow Up Action If you think your patient may have been
exposed to triclosan, refer patient to a physician. Long-term exposure can be addressed by
treating the symptoms and informing patients about ways to limit future exposure to triclosan (see “Reducing Your Exposure” section below).
Products Containing Triclosan
SOAP: Dial® Liquid Soap; Softsoap® Antibacterial Liquid Hand Soap; Tea Tree Therapy™ Liquid Soap; Provon® Soap; Clearasil® Daily Face Wash; Dermatologica ® Skin Purifying Wipes; Clean & Clear Oil Free Foaming Facial Cleanser; DermaKleen™ Antibacterial Lotion Soap; Naturade Aloe Vera 80® Antibacterial Soap; CVS Antibacterial Soap; pHisoderm Antibacterial Skin Cleanser;
Dawn® Complete Antibacterial Dish Liquid; Ajax® Antibacterial Dish Liquid. DENTAL CARE: Colgate Total®; Breeze™ Triclosan Mouthwash; Reach® Antibacterial Toothbrush; Janina Diamond Whitening Toothpaste. COSMETICS: Supre® Café Bronzer™; TotalSkinCare Makeup Kit; Garden Botanika® Powder Foundation; Mavala Lip Base; Jason Natural Cosmetics; Blemish Cover Stick; Movate® Skin Litening Cream HQ; Paul Mitchell Detangler Comb; Revlon ColorStay LipSHINE Lipcolor Plus Gloss, Dazzle. DEODORANT: Old Spice High Endurance Stick Deodorant; Right Guard Sport Deodorant; Queen Helene® Tea Trea Oil Deodorant and Aloe Deodorant; Nature De France Le Stick Natural Stick Deodorant; DeCleor Deodorant Stick; Epoch® Deodorant with Citrisomes; X Air Maximum Strength
Deodorant. OTHER PERSONAL CARE PRODUCTS: Gillette® Complete Skin Care MultiGel Aerosol Shave Gel; Murad Acne Complex® Kit; ®; Diabet-x™ Cream; T.Taio™ sponges and wipes, Aveeno Therapeutic Shave Gel. FIRST AID: SyDERMA® Skin Protectant plus First Aid Antiseptic; Solarcaine® First Aid Medicated Spray; Nexcare™ First Aid, Skin Crack Care; First Aid/Burn Cream; HealWell® Night Splint; 11-1X1: Universal Cervical Collar with Microban. KITCHENWARE: Farberware® Microban Steakknife Set and Cutting Boards; Franklin Machine Products FMP Ice Cream Scoop SZ 20 Microban; Hobart Semi-Automatic Slicer; Chix® Food Service Wipes with Microban; Compact Web Foot® Wet Mop Heads. COMPUTER EQUIPMENT: Fellowes Cordless Microban Keyboard and Microban Mouse Pad. CLOTHES: Teva® Sandals; Merrell Shoes; Sabatier Chef’s Apron; Dickies Socks; Biofresh® socks. CHILDRENS TOYS: Playskool®: Stack ‘n Scoop Whale, Rockin’ Radio, Hourglass, Sounds Around Driver, Roll ‘n Rattle Ball, Animal Sounds Phone, Busy Beads Pal, Pop ‘n Spin Top, Lights ‘n Surprise Laptop. OTHER: Bionare® Cool Mist Humidifier; Microban®All Weather Reinforced Hose; Thomasville® Furniture; Deciguard AB Ear Plugs; Bauer® 5000 Helmet; Aquatic Whirlpools; Miller

Paint Interior Paint; QVC® Collapsible 40-Can Cooler; Holmes Foot Buddy™ Foot Warmer; Blue Mountain Wall Coverings; California Paints®; EHC AMRail Escalator Handrails, Dupont™ Air Filters,
Durelle™ Carpet Cushions; Advanta One Laminate Floors; San Luis Blankets; J Cloth® towels, JERMEX mops.
REDUCING OUR EXPOSURE You can prevent or minimize your exposure to triclosan in the following ways: Keep clean without using antimicrobials: Wash hands often and thoroughly. Lather
hands for at least 10 to 15 seconds and rinse with warm water. Regular soap lowers the surface tension of water and washes away unwanted bacteria.
Wash hands often, especially when handling food, before you eat, after you go to the bathroom, or when you are around someone who is sick.
Dry hands with a clean towel to help remove any germs that did not get washed away. Wash children’s hands and toys often. Since triclosan is almost always found in personal care products, make sure to read all
the ingredients when buying these products. Triclosan is also called Microban, Irgasan, Lexol, Ster-Zac, Cloxifenolum, and Biofresh.
Australian tea tree oil and grapefruit seed extract have natural antimicrobial properties and are included in some soaps.
1 National Library of Medicine. 2007. Household Products Database. Bethesda, MD:National Library of Medicine, National Institutes of Health. Available: http://hpd.nlm.nih.gov/index.htm. Accessed June 4, 2008. 2 Glaser, Aviva. 2007. The ubiquitous triclosan: A common antibacterial agent exposed. Pesticides and You Vol. 24, No. 3: 12-17. 3 Environmental Protection Agency. April 17, 2008. Memorandum. Subject: 5-Chloro-2-(dichlorophenoxy)phenol (Triclosan): Risk Assessment for the Reregistration Eligibity Decision (RED) Document. Case No 2340. PC Code: 054901. DP Barcode: 373535. Available : http://www.regulations.gov/fdmspublic/component/main?main=DocumentDetail&d=EPA-HQ-OPP-2007-0513-0002. Accessed June 3, 2008. 4 Kolpin, DW, Furlong ET, Meyer MT, Thurman EM, et al. 2002. Pharmaceuticals, Hormones, and other organic wastewater contaminants in U. S. streams, 1999-2000: A national reconnaissance. Environmental Science Technology 36:1202-1211. 5 Ciba. Triclosan Information: History. June 2008. Available: http://www.ciba.com/index/ind-index/ind-per_car/ind-pc-ah/ind-pc-triclosan/ind-pc-triclosan-triclosan-101/ind-pc-triclosaninfo-101-history.htm. Accessed June 3, 2008. 6 American Medical Association. 2000. Use of Antimicrobials in Consumer Products (CSA Rep. 2, A-00). Summaries and Recommendations of Council on Scientific Affairs Report. 7 Calafat A, et al. 2008. Urinary Concentrations of Triclosan in the U.S. Population: 2003-2004. Environmental Health Perspectives 116(3):303-307. 8 Environmental Protection Agency. April 17, 2008. Memorandum. Subject: 5-Chloro-2-(dichlorophenoxy)phenol (Triclosan): Risk Assessment for the Reregistration Eligibity Decision (RED) Document. Case No 2340. PC Code: 054901. DP Barcode: 373535. Available: http://www.regulations.gov/fdmspublic/component/main?main=DocumentDetail&d=EPA-HQ-OPP-2007-0513-0002. Accessed June 3, 2008. 9 Wolff MS, Teitelbaum SL, Windham G, Pinney SM, Britton JA, Chelimo C, et al. 2007. Pilot study of urinary biomarkers of phytoestrogens, phthalates, and phenols in girls. Environ Health Perspect 115:116–121. 10 Allmyr M, et al. 2006. Triclosan in plasma and milk from nursing Swedish nursing mothers and their exposure via personal care products. Science of the Total Environment 372:87-93. 11 Environmental Protection Agency. April 17, 2008. Memorandum. Subject: 5-Chloro-2-(dichlorophenoxy)phenol (Triclosan): Risk Assessment for the Reregistration Eligibity Decision (RED) Document. Case No 2340. PC Code: 054901. DP Barcode: 373535. Available: http://www.regulations.gov/fdmspublic/component/main?main=DocumentDetail&d=EPA-HQ-OPP-2007-0513-0002. Accessed June 3, 2008. 12Wong, CSM and MH Beck. 2001. Allergic contact dermatitis from triclosan in antibacterial handwashes. Contact Dermatitis 45 (5) 307. 13 Veldoen N, et al. 2006. The bactericidal agent triclosan modulates thyroid hormone-associated gene expression and disrupts postembryonic anuran development. Aquatic Toxicology 80(2006) 217-227.

505 W. Northern Lights, Suite 205 Anchorage, AK 99503 Phone: (907) 222-7714
Fax: (907) 222-7715 www.akaction.org
Uranium WHAT IS URANIUM? Uranium is a radioactive element found in
mineral deposits in certain locations around the world.1 It is a hard metal that is mined for the production of energy in nuclear power plants and is also used in the production of nuclear weapons. Mineral deposits containing uranium usually range from .002 to .004 percent of the rock material.2 Uranium is used by the military when
making nuclear weapons, such as atomic bombs. Nuclear weapons are currently stored in many countries around the world, including the United States, Russia, the United Kingdom, France, and China. Uranium is also the fuel used in nuclear power plants. A form of uranium used by the U.S.
military in bullets and other weapons is called “depleted uranium,” which means the portion left after enriched uranium is removed from natural uranium. The term “depleted” is misleading because it hints that this form of uranium is safer, but depleted uranium acts the same way in the body as natural uranium. Depleted uranium is a toxic heavy metal and a radioactive hazard to human health and the environment.3,4 It is used to strengthen munitions and other weapons due to its high density. In the case of the planned uranium mine
near Elim, Alaska, the proposed method for extracting uranium ore is in-situ leach (ISL) mining. In ISL mining, a series of wells are drilled into the ore deposit. A leaching liquid (a strong acid solution
such as sulfuric acid or ammonium-carbonate) is then injected through these wells into the ore, separating the uranium from the ore body. The liquid with uranium is pumped to the surface and piped to a processing plant where the uranium is separated. Most of the leftover solution is recharged with more of the leaching agent and then injected back into the wells. However, a certain amount of this solution is not re-used and becomes waste, which is returned back into the ore body in disposal wells.
HOW ARE WE EXPOSED? People can be exposed to uranium
through breathing air or drinking water contaminated with uranium, eating food grown in areas contaminated with uranium, working in factories that process uranium, or living near a uranium mine.5 With ISL mining, there is a risk of
groundwater contamination. The leaching process not only moves uranium particles, but also releases other contaminants and toxic metals that can contaminate groundwater, including radioactive thorium, radium, radon, lead, cadmium, and arsenic. Soldiers currently deployed and other
military personnel returning to Alaska may be exposed to depleted uranium.
SYMPTOMS & HEALTH PROBLEMS
The harmful effects of uranium on human health have been linked to its radioactive and heavy metal properties.6

Inhaling or ingesting uranium can cause malignant and nonmalignant respiratory diseases, kidney failure, leukemia, and stomach, kidney and soft tissue cancer.2,5,7 Animal studies suggest that uranium may
adversely affect reproduction and harm the developing fetus.1
FOLLOW UP ACTION If you think your patient may have been
exposed to uranium, refer patient to a physician and contact ACAT at (907) 222-7714 or [email protected].
REDUCING YOUR EXPOSURE You can prevent or minimize exposure to uranium in the following ways: Keep children from putting hands in their mouths and have them wash their hands
often to lower the amount of contaminated soil that could be eaten or swallowed.3 Although it may be uncertain how far contaminants may spread around mine sites,
it is advisable to have water and traditional food sources close to, downstream or downwind of these sites tested for the possibility of harmful exposures. If you have concerns about the safety of your water or traditional foods, contact ACAT or visit our website at www.akaction.org.
1 Agency for Toxic Substances and Disease Registry (ATSDR). December 1990. Public Health Statement: Uranium. Atlanta: ATSDR. 2 Uranium Information Center. 2006, June. What is uranium. Australian Uranium Association. Available: http://www.uic.com.au/uran.htm [Accessed 12 September, 2007]. 3 World Health Organization (WHO). 2003, January. Fact sheet 257: Depleted uranium. Available: http://www.who.int/entity/mediacentre/factsheets/fs257/en/index.html [Accessed 19 March, 2008]. 4 Federation of American Scientists (FAS). 1999, April 29. Depleted uranium. Available: http://www.fas.org/man/dod-101 /sys/land/du.htm [Accessed 21 April, 2008]. 5 Filippova, LG, Nifatov AP, Lyubchanskii ER. 1978. Some of the long-term sequelae of giving rats enriched uranium (in Russian), Radiobiologiya 18(3): 400-405. Translated in NTIS UB/D/120-03 (DOE-TR-4/9), National Technical Information Service, Springfield, Virginia. 6 Brugge D, deLemos JL, Oldmixon B. 2005. Exposure pathways and health effects associated with chemical and radiological toxicity of natural uranium: a review. Rev Environ Health 20:177–193. 7 Roscoe RJ, Deddens JA, Salvan A, Schnorr TM. 1995. Mortality among Navajo uranium miners. Am J Public Health 85:535–540.

�� ��
��
��
��
���� ��
����
����
��
��
��
��
��
�� ��
��
�
��
�
�
�
�
�
��
�
�
�
�
�
�
��
��
��
����
��
��
��
����
��
��
��
��
��
��
��
��
��
��
����
��
����
������
����
�� ��
��
��
��
��
��
������
����
��
����
��
�
���������
�����
������ �������
�����
�����������
��������������
������ ������������
�������
��������
��� �������
�� �!��
���"���� �"���
�������#���
���
��� "���� ���"��
$���� ���"
�"����������"���!����
����������
�� ����� ������������ �������� ���
���������������
�� ���� � ����
���
���
���
� ��������!���������
"�� � �� ��#����
�� �����
$��%�&!���
$��%�&!���
�� ���� � '�����#�������
���������
��������
������
���������������������
�
�������������������
�����������
���������
�� �������������
���������
�����
�����������������
%$��&�'
������
�����"�
�����()
*+,
�����������������
����������������������
�������������
����������
�� ����� ������������ �������� ���
���������������
�� ���� � ����
���
���
���
� ��������!���������
"�� � �� ��#����
��
������������������������������
�������������
���������������
�
���������������
��������������
����������������
�������������
��������������������������������������������������������������������� �
����������� ���� ����������������������������
��������������������������
��� ������������� ����
�� �� ���!���"#$�%"$&"'(��%)�����)���**+
�� �� ���������"$&�%"$,�
�� �� ���������"$,�%"$-�������. �!��� /��)/� ���������01.��� ��������0�����2�� ��������/��� ��
��2�� ��������/����� �3���/������� /��"$,�4��!������ �����������������.��� �01.��� �������0��.��.���������� ����3������� �3��
��)/� ���������������� ����
������
� �� �� �� �� ������
����� ���������� �
-.��/0)�%'��1�2342(, 55
-�����
-���!�6��������"���"��4-�����������!"���%7��"8�9���"8�������,:������!�"��
�����������������#��$��������
� ����5�����'6��5+
� ���� �7����'6��7+
� 5��
� ���� ������6��5��� ���� ����
��%�����������%�����

EENNVVIIRROONNMMEENNTTAALL HHEEAALLTTHH CCAARREE TTOOOOLLKKIITT
Text for Poster: Protecting Our Health in Alaska
Pesticides Insecticides, herbicides, fungicides, and rodenticides (collectively known as “pesticides”) contain chemicals that are toxic to humans and can harm the health of children and adults. Safe alternatives can be used to solve nearly all pest problems without the need for toxic chemicals. We recommend that you try prevention and non‐toxic alternatives first. For example, citronella oil can be used instead of DEET to keep mosquitoes away. Burning of alder branches at fish camp helps to keep them out of the area. Peppering fish during processing and drying can discourage flies. You can prevent pests from entering your home by sealing cracks in windows, doors and baseboards. Storing food properly and cleaning food or beverage spills will help to keep out unwanted pests from your home. Lice combs and mayonnaise can be used instead of chemical shampoos to treat head lice. Keep It Outside Remove your shoes outside to prevent tracking of harmful chemicals into your home. If you work with chemicals in your job, be careful not to expose your family to your work clothes and wash them separately. Berries and Greens Rinse berries and greens with water before you eat them to reduce possible exposure to harmful contaminants that may be in the dust on the outside of the plants.

EENNVVIIRROONNMMEENNTTAALL HHEEAALLTTHH CCAARREE TTOOOOLLKKIITT
Manage Waste Burning Trash in Barrels and Burn Boxes Lower the amount of waste by reducing, recycling, and re‐using materials. Avoid the burning of plastics to prevent exposure to toxic chemicals. The smoke from burning plastics can harm people’s health and may be linked with illnesses such as asthma, increased risk of cancer and diabetes, and reproductive health problems. Some communities have banned plastic bags to reduce waste. For information on these projects, contact ACAT. Make sure that burn barrels and burn boxes are not used near places where people might be exposed to the smoke. Open Dumpsites Open dumps are a hazard to health and may have dangerous toxics. Keep children away from dumps and streams that flow from these waste sites. Dump sites should be fenced and properly maintained to prevent animals and people from toxic exposures. Personal Care Products Some personal care products may have chemicals that have been linked with harmful health effects. Phthalates are a group of chemicals found in everyday products such as lotions, soaps and cosmetics that have been shown to have reproductive health effects. You can find non‐toxic alternatives at www.safecosmetics.org. Some of the ingredients that might cause harm include phthalates, thimerosol, lead acetate, formaldehyde, sodium lauryl sulfate, parabens, and toluene. Furniture and Electronics PBDEs (polybrominated diphenyl ethers) are flame‐retardant chemicals added to many consumer products, including furniture and electronics such as TVs and computers. PBDEs don’t break down quickly and build up in living organisms including people and wildlife. PBDEs may affect learning, damage reproduction and the thyroid. You can reduce your exposure to PBDEs by choosing PBDE‐free products. To find out if a product contains PBDEs, go to www.thegreenguide.com or call the manufacturer. Dust your home often with a wet cloth, and sweep or vacuum to lower exposures to PBDEs in dust particles. Plastics Chemicals found in plastic products such as food containers, baby bottles and toys have been linked to health effects including fertility and other reproductive health problems. Using glass, ceramic or wooden products will reduce your exposure to these chemicals. If you must use plastic, avoid plastics marked #7 (these are polycarbonate plastics that contain the chemical bisphenol A). Avoid using plastic wrap and heating plastic containers in the microwave oven. Household Products Many cleaning products contain chemical solvents linked to infertility and other health problems. You can buy non‐toxic cleaners or make your own using vinegar, baking soda and borax soap. Water‐based paints, glues and citrus‐based cleaners are safer to use. For suggestions about other safe product recommendations, contact ACAT or visit our website at www.akaction.org. Clean Hands Wash hands often to prevent harmful exposures to chemicals and bacteria.

EENNVVIIRROONNMMEENNTTAALL HHEEAALLTTHH CCAARREE TTOOOOLLKKIITT
Mold Mold is a fungus that grows in moist areas and is linked to lung bleeding and other problems in babies, allergic reactions and some cancers in adults. Fix water leaks as soon as possible and make sure that you have good air flow to prevent mold growth. To remove mold, spray with a solution of 1 part vinegar and 1 part water, then wipe clean while wearing a dust mask. Tobacco Smoke Tobacco smoke contains thousands of chemicals, many of which are poisonous. If you quit smoking, it will improve your health and the health of those around you. Do not smoke indoors because it exposes others to secondhand smoke. Children are especially vulnerable to the harmful effects of secondhand smoke. Formerly Used Defense Sites (FUDS) Many dangerous chemicals have been used by the military and left behind when sites were abandoned. Although it may be uncertain about how far contaminants may spread around formerly used defense sites, it is advisable to have water and traditional food sources close to, downstream or downwind of these sites tested for the possibility of harmful exposures. For more information on possible chemical exposure in these areas, contact ACAT or visit our website at www.akaction.org. Persistent Organic Pollutants (POPs) Persistent organic pollutants, or POPs, are chemicals that take a long time to break down, they build up in animals and people, and are toxic. Ocean and wind currents transport POPs from thousands of miles away to the north/Arctic, where they enter the food chain—into the soil and plants, insects, fish, wildlife, and people. POPs include many dangerous chemicals such as PCBs, DDT and dioxin. For more information on ways to take action against these chemicals, contact ACAT or visit our website at www.akaction.org. Vehicles Exhaust from ATVs and other vehicles contains toxic chemicals that may lead to health effects such as respiratory ailments, cancer, heart disease, and damage to the nervous system. Avoid breathing exhaust from vehicles so that you can reduce your exposure to these chemicals. You can reduce exhaust from your vehicle by turning off the engine when the vehicle is stopped for more than a few minutes. Don’t let children handle gasoline, and store fuels safely in well‐marked containers out of the reach of children. Mining Chemicals that are harmful to human health, such as heavy metals, are released into the environment through mining. Although it may be uncertain about how far contaminants may spread around mine sites, it is advisable to have water and traditional food sources close to, downstream or downwind of these sites tested for the possibility of harmful exposures. If you have concerns about the safety of your water or traditional foods, contact ACAT or visit our website at www.akaction.org.