The 3D moore-rayleigh test for the quantitative groupwise comparison of MR brain images
12
The 3D Moore-Rayleigh Test for the Quantitative Groupwise Comparison of MR Brain Images. A.E.H. Scheenstra 1; 2 , M. Muskulus 5 , M. Staring 1; 2 , A.M.J.V. van den Maagdenberg 3; 4 , S. Verduyn Lunel 5 , J.H.C.Reiber 1; 2 , L. van der Weerd 1; 4 , and J. Dijkstra 1; 2 1 Department of Radiology, 2 Division of Image Processing, 3 Department of Neurology, 4 Department of Anatomy and Embryology, Leiden University Medical Center, Postbus 9600, 2300 RC , Leiden, the Netherlands 5 Leiden University, Mathematical Institute, Leiden, The Netherlands Abstract. Non-rigid registration of MR images to a common reference image results in deformation flelds, from which anatomical difierences can be statistically assessed, within and between populations. Without further assumptions, nonparametric tests are required and currently the analysis of deformation flelds is performed by permutation tests. For deformation flelds, often the vector magnitude is chosen as test statistic, resulting in a loss of information. In this paper, we consider the three dimensional Moore-Rayleigh test as an alternative for permutation tests. This nonparametric test ofiers two novel features: flrst, it incorporates both the directions and magnitude of the deformation vectors. Second, as its distribution function is available in closed form, this test statistic can be used in a clinical setting. Using synthetic data that represents variations as commonly encountered in clinical data, we show that the Moore-Rayleigh test outperforms the classical permutation test. 1 1 Introduction Mice have been used in genetic research as models for a variety of diseases occurring in the human population. They allow researchers to study the devel- opment of genetic diseases, to improve early diagnoses and subsequent treat- ment. Non-invasive imaging techniques, e.g. MRI, allow localized investigation of 3D anatomical structures of interest [1]. This provides a useful tool for in vivo structural and functional phenotyping, especially in the brain [2]. Since the introduction of non-rigid registration of brain images, a variety of new applica- tions for brain research have emerged. Non-rigid registration is used in clinical practice to register MR images taken from difierent biological populations to a common average. The resulting deformation flelds indicate and localize difier- ences between pairs of images. Their second order statistics are stored in atlases to characterize variability within a population (intra-group variability) [3,4]. 1 J.L. Prince, D.L. Pham and K.J. Meyers (Eds.): IPMI 2009, LNCS 5636, pp 564 { 575, 2009. c Springer-Verlag Berlin Heidelberg 2009
-
Upload
independent -
Category
Documents
-
view
1 -
download
0
Transcript of The 3D moore-rayleigh test for the quantitative groupwise comparison of MR brain images

The 3D Moore-Rayleigh Testfor the Quantitative Groupwise Comparison
of MR Brain Images.
A.E.H. Scheenstra1,2, M. Muskulus5, M. Staring1,2, A.M.J.V. van denMaagdenberg3,4, S. Verduyn Lunel5, J.H.C.Reiber1,2, L. van der Weerd1,4, and
J. Dijkstra1,2
1 Department of Radiology, 2 Division of Image Processing,3 Department of Neurology, 4 Department of Anatomy and Embryology,
Leiden University Medical Center, Postbus 9600, 2300 RC , Leiden, the Netherlands5 Leiden University, Mathematical Institute, Leiden, The Netherlands
Abstract. Non-rigid registration of MR images to a common referenceimage results in deformation fields, from which anatomical differencescan be statistically assessed, within and between populations. Withoutfurther assumptions, nonparametric tests are required and currently theanalysis of deformation fields is performed by permutation tests. Fordeformation fields, often the vector magnitude is chosen as test statistic,resulting in a loss of information. In this paper, we consider the threedimensional Moore-Rayleigh test as an alternative for permutation tests.This nonparametric test offers two novel features: first, it incorporatesboth the directions and magnitude of the deformation vectors. Second,as its distribution function is available in closed form, this test statisticcan be used in a clinical setting. Using synthetic data that representsvariations as commonly encountered in clinical data, we show that theMoore-Rayleigh test outperforms the classical permutation test.1
1 Introduction
Mice have been used in genetic research as models for a variety of diseasesoccurring in the human population. They allow researchers to study the devel-opment of genetic diseases, to improve early diagnoses and subsequent treat-ment. Non-invasive imaging techniques, e.g. MRI, allow localized investigationof 3D anatomical structures of interest [1]. This provides a useful tool for invivo structural and functional phenotyping, especially in the brain [2]. Since theintroduction of non-rigid registration of brain images, a variety of new applica-tions for brain research have emerged. Non-rigid registration is used in clinicalpractice to register MR images taken from different biological populations to acommon average. The resulting deformation fields indicate and localize differ-ences between pairs of images. Their second order statistics are stored in atlasesto characterize variability within a population (intra-group variability) [3, 4].
1 J.L. Prince, D.L. Pham and K.J. Meyers (Eds.): IPMI 2009, LNCS 5636, pp 564 –575, 2009. c⃝ Springer-Verlag Berlin Heidelberg 2009

Quantitative groupwise comparison of MR brain images 565
A major challenge in this area of research is not only to highlight the intra-group variability but to also assess inter-group variability, especially with regardto structural anatomical differences and their possible causes. For instance, ingenetic research with transgenic mice, mutants are compared with their wild-types, where the group difference is determined by only one gene. To test andlocalize possible anatomical differences, statistical testing is required. In humanbrain research, similar problems have been addressed in functional brain images.BOLD signals are compared between and within groups to characterize differ-ences in brain activation. A logical first choice for the statistical analysis of suchdata are permutation tests with their minimal assumptions [5, 6].
In contrast to the statistical analysis of fMRI signals, the statistical analysisof deformation fields requires handling vector data instead of scalars. Further-more, in genetic research, usually transgenic mouse with the same genetic back-ground (apart from the gene of interest) are compared, resulting in populationswith low intra-variability[3], but often also very subtle inter-group differences,thus requiring a highly sensitive test. Chen et al. presented a test statistic usingthe standard deviation of the lengths of deformation vectors, for which differentmouse strains (129S1, SvImJ, C57/B16 and CD1) were subjected to permuta-tion tests [7]. However, since they were analyzing the complete brain, they hadto limit their tests to 500 permutations because of time considerations. In mousestrains for which there result large inter-group differences, this might be suffi-cient. The minimal p-value that can be resolved with 500 permutations is 1
500+1 ,without correcting for multiple comparisons. Obviously, a larger number of per-mutations is required to resolve smaller significance probabilities. Furthermore,by using only the lengths of the deformation vectors, valuable information, inparticular that encoded in the directionality, is lost. A first step to improve onthis situation is the use of Hotelling’s t2-test with voxelwise estimated covari-ances of the vector field. This test statistic can also be used in the setting of apermutation test as in [6]. Unfortunately permutation tests are highly compu-tationally expensive, even taking into account algorithmic improvements [8], soalternatives for the permutation tests have been considered: among others, theBrunner - Munzel test[9].
The goal of this work is to show the applicability of the 3D Moore-Rayleightest for the quantitative groupwise comparison of images, and to propose theMoore-Rayleigh test as an alternative to permutation testing. The 2D case ofthis test was first introduced by Moore [11] who numerically obtained criticalvalues. We generalized his idea to k dimensions and determined the closed formof the densitity and the distribution function for three dimensional vector data.Because its test statistic is available in closed form, the test does not requiremuch computational effort. We evaluate it empirically with simulated clinicaldata of known ground-truth and compare it to the performance of a permutationtest and a variant of the Mann-Whitney test. Furthermore, we show that theMoore-Rayleigh test outperforms permutation testing on account of sensitivity.For the compactness of this paper, in Section 2 we introduce the Moore-Rayleightest only for the three-dimensional case and describe how this method is applied
566 Scheenstra et al.
in the two-sample problem. In Section 3 experimental results on simulated dataare given and the method is compared to currently popular methods. Finally,we conclude the paper with a summary and discussion in Section 4.
2 3D Moore-Rayleigh Test
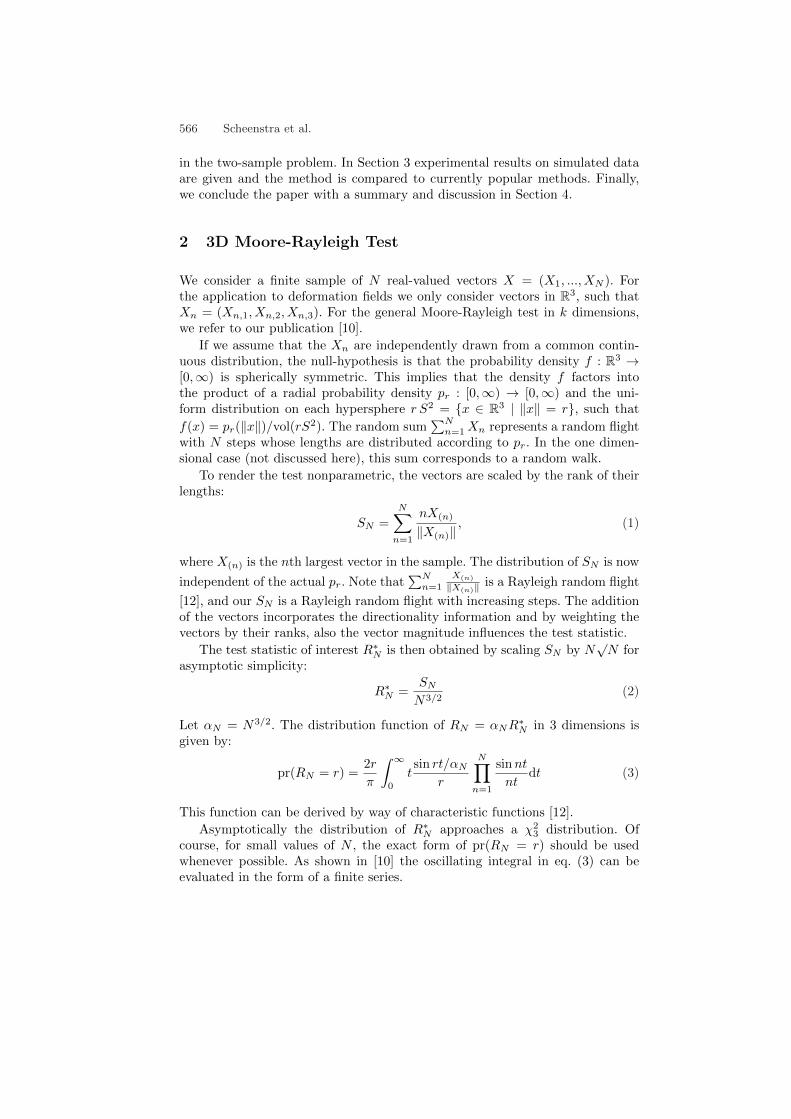
We consider a finite sample of N real-valued vectors X = (X1, ..., XN ). Forthe application to deformation fields we only consider vectors in ℝ3, such thatXn = (Xn,1, Xn,2, Xn,3). For the general Moore-Rayleigh test in k dimensions,we refer to our publication [10].
If we assume that the Xn are independently drawn from a common contin-uous distribution, the null-hypothesis is that the probability density f : ℝ3 →[0,∞) is spherically symmetric. This implies that the density f factors intothe product of a radial probability density pr : [0,∞) → [0,∞) and the uni-form distribution on each hypersphere r S2 = {x ∈ ℝ3 ∣ ∥x∥ = r}, such that
f(x) = pr(∥x∥)/vol(rS2). The random sum∑N
n=1 Xn represents a random flightwith N steps whose lengths are distributed according to pr. In the one dimen-sional case (not discussed here), this sum corresponds to a random walk.
To render the test nonparametric, the vectors are scaled by the rank of theirlengths:
SN =
N∑n=1
nX(n)
∥X(n)∥, (1)
where X(n) is the nth largest vector in the sample. The distribution of SN is now
independent of the actual pr. Note that∑N
n=1X(n)
∥X(n)∥ is a Rayleigh random flight
[12], and our SN is a Rayleigh random flight with increasing steps. The additionof the vectors incorporates the directionality information and by weighting thevectors by their ranks, also the vector magnitude influences the test statistic.
The test statistic of interest R∗N is then obtained by scaling SN by N
√N for
asymptotic simplicity:
R∗N =
SN
N3/2(2)
Let ®N = N3/2. The distribution function of RN = ®NR∗N in 3 dimensions is
given by:
pr(RN = r) =2r
¼
∫ ∞
0
tsin rt/®N
r
N∏n=1
sinnt
ntdt (3)
This function can be derived by way of characteristic functions [12].
Asymptotically the distribution of R∗N approaches a Â2
3 distribution. Ofcourse, for small values of N , the exact form of pr(RN = r) should be usedwhenever possible. As shown in [10] the oscillating integral in eq. (3) can beevaluated in the form of a finite series.

Quantitative groupwise comparison of MR brain images 567
2.1 The Two-Sample Problem
In the two sample problem, we are given two vector-valued random variablesX = (X1, ..., XN ) and Y = (Y1, ..., YN ). Under the null hypothesis that Xi
and Yj are identically and independently distributed according to a commonprobability density f : ℝ3 → [0,∞), the differences Xi − Yj are distributedaccording to the symmetrizing convolution f ∗ (−f), whose density is given by
pr(X − Y = x) =
∫pr(X = u)pr(Y = u+ x) du (4)
Under the null hypothesis that f is spherically symmetric around its mean,significance probabilities can be calculated from eq.(3). If it is assumed that Xis distributed according to a multivariate normal distribution, the use of theMoore-Rayleigh test is justified. However the distribution of g = f ∗ (−f) isin general only symmetric, i.e. g(x) = g(−x) for all x ∈ ℝ3 and therefore theMoore-Rayleigh test is only approximately valid.
Of course, one would prefer to test conservatively for mere symmetry, but theavailable tests are either only asymptotically nonparametric or require furtherrandomization of the underlying distribution [13–18].
Therefore, we suggest to use the Moore-Rayleigh test, but to bootstrap theempirical distributions of the two samples X and Y by random sampling withoutreplacement (to avoid degeneracy issues when two or more vector differencesare equal) and to compare the mean of R∗
N obtained under M such sampleswith eq. (3). In theory, the bootstrapping reduces the error made when theassumptions of the Moore-Rayleigh test are only approximately fulfilled by afactor of almost 1/
√M , although these considerations are beyond the scope of
this paper. Here, the properties of the test so obtained are evaluated by computerexperiments.
2.2 Clinical Interpretation
Consider two sets of 3D MR images taken from different populations of equalsize. The first step in the analysis is the affine registration to an atlas A. This nor-malization step brings all images to the same coordinate system and removes allnon-specific anatomical differences, like global orientation and the scale parame-ters. From now on, we consider only the normalized sets of images I = (I1, ..., IN )and J = (J1, ..., JN ).
A non-rigid registration defines the relation between the average and animage I, which is found by the minimum of a similarity measure ½:
TI = min ½(I,A) (5)
Assuming that the similarity measure returns the best approximation of theunknown relation between I and A, TI indicates the local anatomical differencesbetween I and A, which are coded by vectors in ℝ3.
Non-rigidly registering I and J to the atlas results in two sets of deformationfields TI = (TI1, ..., TIN ) and TJ = (TJ1, ..., TJN ). Each anatomically homologous
568 Scheenstra et al.
point ℎ in TI and TJ can then be subjected to the two sample Moore-Rayleightest, as described in Section 2.1.
The resulting p-value in a point ℎ indicates the probability that an observeddifference between groups I and J occurs by chance. A small p-value is an indi-cation that there is a difference between I and J . It can occur that both groups Iand J are significantly different from A, but as long as the difference of I with Ais similar to the difference of J with A, the Moore-Rayleigh test will not returna significant difference between I and J .
3 Validation
3.1 Image Formation
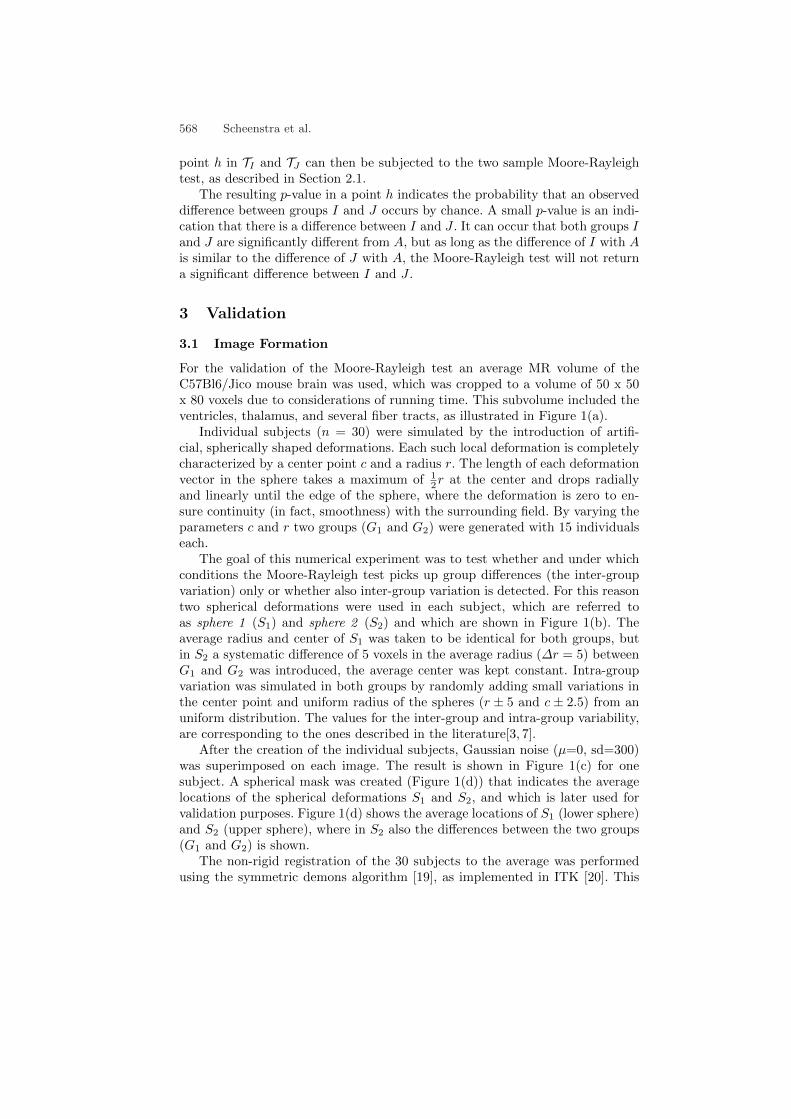
For the validation of the Moore-Rayleigh test an average MR volume of theC57Bl6/Jico mouse brain was used, which was cropped to a volume of 50 x 50x 80 voxels due to considerations of running time. This subvolume included theventricles, thalamus, and several fiber tracts, as illustrated in Figure 1(a).
Individual subjects (n = 30) were simulated by the introduction of artifi-cial, spherically shaped deformations. Each such local deformation is completelycharacterized by a center point c and a radius r. The length of each deformationvector in the sphere takes a maximum of 1
2r at the center and drops radiallyand linearly until the edge of the sphere, where the deformation is zero to en-sure continuity (in fact, smoothness) with the surrounding field. By varying theparameters c and r two groups (G1 and G2) were generated with 15 individualseach.
The goal of this numerical experiment was to test whether and under whichconditions the Moore-Rayleigh test picks up group differences (the inter-groupvariation) only or whether also inter-group variation is detected. For this reasontwo spherical deformations were used in each subject, which are referred toas sphere 1 (S1) and sphere 2 (S2) and which are shown in Figure 1(b). Theaverage radius and center of S1 was taken to be identical for both groups, butin S2 a systematic difference of 5 voxels in the average radius (¢r = 5) betweenG1 and G2 was introduced, the average center was kept constant. Intra-groupvariation was simulated in both groups by randomly adding small variations inthe center point and uniform radius of the spheres (r ± 5 and c ± 2.5) from anuniform distribution. The values for the inter-group and intra-group variability,are corresponding to the ones described in the literature[3, 7].
After the creation of the individual subjects, Gaussian noise (¹=0, sd=300)was superimposed on each image. The result is shown in Figure 1(c) for onesubject. A spherical mask was created (Figure 1(d)) that indicates the averagelocations of the spherical deformations S1 and S2, and which is later used forvalidation purposes. Figure 1(d) shows the average locations of S1 (lower sphere)and S2 (upper sphere), where in S2 also the differences between the two groups(G1 and G2) is shown.
The non-rigid registration of the 30 subjects to the average was performedusing the symmetric demons algorithm [19], as implemented in ITK [20]. This

Quantitative groupwise comparison of MR brain images 569
registration algorithm uses the mean squared difference with a smoothing factorof 1.0 and was performed with 60 iterations. The output of the non-rigid reg-istration is a deformation field, i.e. vectors in ℝ3 that represent the geometrictranslations of voxels to their corresponding points in the atlas image.
Fig. 1. The various stages during the creation of one of the synthetic images: Themidsection of the average image (a), which is deformed by two spheres (b), and thefinal image after adding gaussian noise (c). For each dataset a sphere mask is created(d) which indicates the average locations of the spherical deformations S1 and S2 forG1 (outer sphere) and G2 (inner sphere).
3.2 Validation Method
The output of the two-sample Moore-Rayleigh test is a probability image witha p-value per voxel that indicates how likely it is that the null hypothesis holdsat that particular point, thus indicating how likely it is that an observed differ-ence between groups I and J occurs by chance in that voxel. Thresholding theprobability image with a critical value ® results in a binary image that showsthe regions where a significant group difference has been detected. For the syn-thetically generated data the locations are known where there exists a simulatedstructural difference between the two groups; these are all the voxels lying in S2
(Figure 1(d)) and this knowledge is taken as ground-truth for the assessment ofthe statistical tests. We use this information to quantify the performance of theMoore-Rayleigh test by calculating the following:
True positives (TP) Amount of voxels found significant inside S2
False positives (FP) Amount of voxels found significant outside S2
false negatives (FN) Amount of voxels found not significant inside S2
true negatives (TN) Amount of voxels found not significant outside S2
For the various tests, we report the sensitivity and specificity for ®=0.05. Thesensitivity is the ratio of significant voxels which are detected correctly andspecificity is the ratio of not significant voxels which are detected correctly.
sensitivity =TP
TP + FN(6)

570 Scheenstra et al.
specificity =TN
TN+ FP(7)
From these two measures we also calculated Receiver Operator Curves (ROCs)that show the dependence of sensitivity and specificity on the critical values0.0 ≤ ® ≤ 1.0.
3.3 Comparison of Test Statistic
To compare the performance of the Moore-Rayleigh test to other nonparamet-ric methods, we implemented a permutation test (m=10.000 labellings) withHotelling’s t2 as test statistic as in [6]. Furthermore, we also implemented theMann–Whitney test [21], which is the nonparametric equivalent of the t-test, ona rank one approximation (see Appendix A for details).
A visualization of the significant voxels for the three test statistics are givenin Figure 2. By visual inspection, better classification results were obtained us-ing the Moore-Rayleigh test. The performance of the three test statistics aregiven in Figure 3. The sensitivity and the specificity of the cut-off value of® = 0.05 is given for the three test statistics in Table 1. The relatively lowsensitivity of the permutation tests, might be increased if more permutationswere used. Furthermore, the sensitivity of the Mann-Whitney test is comparablewith the Moore-Rayleigh test, where the Moore-Rayleigh test outperforms theMann-Whitney on specificity. Furthermore, the presented p-values are not cor-rected for multi testing[23]. If multitest correction would have been applied, theMann-Whitney test would have shown no significance, since the Mann-Whitneytest classified voxels significantly different with a probability between 0.01 and0.05, whereas the Moore-Rayleigh test indicates significance with a probabilityof between 10−2 and 10−10.
Fig. 2. The classification result with cut-off value ® = 0.05 for the Moore-Rayleightest (a), the permutation test (b), and the Mann-Whitney test (c) as compared tothe ground truth(d)

Quantitative groupwise comparison of MR brain images 571
Fig. 3. The ROC of the different non-parametric test statistics for the quanti-tative analysis of deformation fields.
Fig. 4. The ROC of the different param-eter settings for the robustness testing ofthe Moore-Rayleigh test
3.4 Robustness Testing
Several parameters have been varied to investigate the robustness of the Moore-Rayleigh test under various conditions. The dataset as described in 3.1 was usedas input and for each experiment only one parameter was changed to measureits effect. The several tests are described below:Registration Algorithm Instead of using the Demons non-rigid registration
method, a B-Spline transform[24] was applied, as implemented in elastix[25].Since the Moore-Rayleigh test is a voxel based test, the gridspacing was setat 2.5 voxels with a 3-level pyramid registration. Furthermore, the mutualinformation metric was used.
Noise Noise is known for having a major influence on the quality of the imagesand their postprocessing. The influence of noise on the hypothesis testing isquantified by increasing the standard deviation from 300 (used in Section 3.1)to a value of 700.
6 Neighbors With the hope of increasing the sensitivity of the test and de-creasing the influence of noise, the deformation vectors of the six closestneighbors (two in each coordinate dimension) for each voxel z are pooled.
¢r In this test, 15 subjects of one group are generated with a systematic differ-ence in radius of 3 voxels between G1 and G2 (for S2), instead of 5 voxelsas in Section 3.1. The intra-group variation is kept constant at ±5 voxels asbefore.
The ROCs of the Moore-Rayleigh test for these various settings are shownin Figure 4. The sensitivity and the specificity for the cut-off value ® = 0.05 areadditionally given in Table 2. The performance of the Moore-Rayleigh test isseen to be least influenced by the change in the nonlinear registration method.

572 Scheenstra et al.
Moore-Rayleigh test Permutation test Mann-Whitney test
sensitivity 0.91 0.73 0.41specificity 0.97 0.89 0.99
Table 1. Sensitivity and specificity for the Moore-Rayleigh test, the permutation testand the Mann-Whitney test (® = 0.05 each).
Moore-Rayleigh test Registration Algorithm Noise Pooling ¢r
sensitivity 0.91 0.88 0.77 0.99 0.70specificity 0.97 0.97 0.99 0.90 0.98
Table 2. The sensitivity and specificity (® = 0.05) for the different parameter settingsfor the robustness testing of the Moore-Rayleigh test.
However, the Moore-Rayleigh test is quite sensitive on the influence of noise,loosing sensitivity when the noise level is increased. Pooling neighboring voxels,however, increases the sensitivity, with an accompanying loss in specificity due tothe smoothing effect this introduces. As can also be seen in Figure 4, a decreasein inter-group variation (scenario ¢r) decreases the sensitivity. This is well ex-plained, as the intra-group variation was kept constant, while the inter-groupvariation was decreased to only 3 voxels.
4 Discussion
In this paper we presented a novel nonparametric statistical method to detectand quantify anatomical differences between groups of MR images. Our methodis based on (a generalization of)the nonparametrical Moore-Rayleigh test, whichtests for spherical symmetry in vector data. This method uses as input the defor-mation fields which are obtained by the non-rigid registration of all subjects to acommon reference image. Under the assumption that no registration errors weremade in the creation of the deformation fields, significant anatomical differencesbetween the two groups can be assessed.
Permutation tests are not routinely applicable in a clinical setting because ofthe large number of permutations required. In clinical practice the number of la-bellings is often reduced to speed up the analysis, which reduces the power of thepermutation test severely and makes it almost impossible to correct for multiplecomparisons. The method presented here, on the other hand, is computationallyfast and offers an interesting alternative to permutation tests. Although the nullhypothesis of mere symmetry is not tested, i.e. the Moore-Rayleigh test is onlyapproximately valid, the results are quite convincing, as shown in Section 3.3.
A further advantage of the Moore-Rayleigh test is that it is completely non-parametric and needs no assumptions on the underlying dataset. As the teststatistic is continuous, the significance probabilities can be very low (up to 10−18
or less is numerically possible), so the Moore-Rayleigh test also results in signif-icant voxels under correction for multiple comparisons (not shown). It was alsofound to be relatively unaffected by the (non-rigid) registration method used.

Quantitative groupwise comparison of MR brain images 573
The sensitivity was most influenced by the decrease of the inter-variation to 3voxels, but considering that the intra-variation was 5 voxels and that still morethan 70 percent of all voxels assessed as significant were true positives, it canbe concluded that the Moore-Rayleigh test is able to detect small differencesbetween groups. Furthermore, it was expected and indeed observed that noise,which affects the registration algorithm, results in an increase of false positives.As the results in Section 3.4 indicate, this problem could be addressed by poolingthe deformation vectors from neighboring voxels. Although this would result ina loss of specificity, it is plausible that the Moore-Rayleigh test would then bemore robust to the effect of noise.
One important topic of our future work concerns the evaluation of this algo-rithm on real clinical data. For now, we have only assessed the Moore-Rayleightest on simulated images, with spherically deformations. Although, it can be ar-gued that these deformations are representative for structural deformations, asbrain atrophy. Furthermore, the main goal of this paper is to show the perfor-mance of the Moore-Rayleigh test on the quantification of inter-group variability.This performance can only be validated on a dataset with known inter-group andintra-group variability. Therefore, to stay close to real data, the variabilities fromthe synthetic dataset are simulated according to the descriptions of variationsof real mouse brain MRI data[3, 7].
Finally, we would like to encourage the reader to apply this method on theirown data. Therefore, the code is made publicly available and can be obtainedby sending an e-mail to the corresponding author.
Acknowledgments. This work was supported in part by funds from CYTTRONwithin the BSIK program (Besluit subsidies investeringen kennisinfrastructuur)and has been performed within the Molecular Imaging Laboratories Leiden(MILL). Furthermore, the authors would like to thank Boudewijn Lelieveldtand Luca Ferrarini for their useful comments on the manuscript and methoddevelopment.
References
1. Driehuys. B., Nouls, J., Badea, A., Bucholz, E., Ghaghada, K., Petiet, A., Hedlund,L.W.: Small animal imaging with magnetic resonance microscopy. ILAR Journal 4935–53 (2008)
2. Benveniste, H., Blackband, S.: MR microscopy and high resolution small animalMRI: applications in neuroscience research. Progress in Neurobiology 67 393–420(2002)
3. Kovacevic, N., Henderson, J.T., Chan, E., Lifshitz, N., Bishop, J., Evans, A.C.,Henkelman, R.M., Chen, X.J.: A Three-dimensional MRI Atlas of the Mouse Brainwith Estimates of the Average and Variability. Cerebral Cortex 15 639–645 (2005)
4. Pohl, K.M., Fisher, J., Bouix, S., Shenton, M., McCarley, R.W., Grimson, W.E.L.,Ron Kikinis, R., Wells W.M.: Using the logarithm of odds to define a vector spaceon probabilistic atlases. Medical Image Analysis 11 465-477 (2007)

574 Scheenstra et al.
5. Nichols, T.E. and Holmes, A.P.: Nonparametric Permutation Tests For FunctionalNeuroimaging: A Primer with Examples. Human Brain Mapping 15 1-25(2001)
6. Ferrarini, L., Palm, W.M., Olofson, H., van Buchem, M.A., Reiber,J.H.C., Admiraal-Behloul, F.: Shape differences of the brain ventricles in Alzheimer’s disease. Neu-roImage 32 1060–1069 (2006)
7. Chen, X.J., Kovacevic, N., Lobaugh, N.J., Sled, J.G., Henkelman,R.M., HendersonJT.: Neuroanatomical differences between mouse strains as shown by high-resolution3D MRI. Neuroimage. 29 99–105 (2005)
8. Heckel, D., Arndt, S., Cizadlo, T., Andreasen, N.C.: An efficient procedure for per-mutation tests in imaging research. Computers and biomedical research 31 164–171(1998)
9. Rorden, C., Bonilha, L., Nichols, T.E.: Rank-Order versus mean based statistics forneuroimaging. NeuroImage 35 1531–1537 (2007)
10. Removed for anonymous reviewing.11. Moore, B.R.: A modification of the Rayleigh test for vector data. Biometrika 67
175–180 (1980)12. Dutka, J.: On the problem of random flights. Archive for History of Exact Sciences
32 351–375 (1985)13. Aki, S.: On nonparametric tests for symmetry in ℛm. Annals of the Institute of
Statistical Mathematics 45 787–800 (1993)14. Ngatchou-Wandji, J.: Testing for symmetry in multivariate distributions. Statisti-
cal Methodology in press15. Henze, N. Klar, B., Meintanis, S.G.: Invariant tests for symmetry about an unspec-
ified point based on the empirical characteristic function. Journal of MultivariateAnalysis 87 275–297 (2003)
16. Fernandez, V.A., Gamero, M.D.J., Garcia, J.M.: A test for the two-sample prob-lem based on empirical characteristic functions. Computational Statistics & DataAnalysis 52 3730–3748 (2008)
17. Diks, C., Tong, H.: A test for symmetries of multivariate probability distributions.Biometrika 86 605–614(1999)
18. Jupp, P.E.: A nonparametric correlation coefficient and a two-sample test for ran-dom vectors or directions. Biometrika 74 887–890 (1987).
19. Thirion, J.P.: Image matching as a diffusion process: an analogy with Maxwell’sdemons. Medical Image Analysis 2 243–260 (1998)
20. Yoo, T.S., Ackerman, M.J., Lorensen,W.E., Schroeder,W., Chalana, V., Aylward,S., Metaxes, D., Whitaker, R.: Engineering and Algorithm Design for an ImageProcessing API: A Technical Report on ITK - The Insight Toolkit. In: Proc. ofMedicine Meets Virtual Reality 586–592 (2002)
21. Mann, H.B. Whitney, D.R.: On a test of whether one of 2 random variables isstochastically larger than the other. The Annals of Mathematical Statistics. 1850-60 (1947)
22. Siegel, S., Castellan, N.J.: Nonparametric Statistics for the Behavioural Sciences(2nd edition). New York: McGraw-Hill ISBN: 978-00-7057-357-4 (1988)
23. Shaffer, J.P.: Multiple Hypothesis Testing. Annual Review of Psychology 46, 561–584 (1995)
24. Rueckert, D., Sonoda, L.I., Hayes, C., Hill, D.L.G., Leach, M.O., Hawkes, D.J.:Non-rigid registration using free-form deformations: Application to breast MR im-ages. IEEE Transactions on Medical Imaging 18 712-721 (1999)
25. Staring, M.: Intrasubject Registration for Change Analysis in Medical Imaging.PhD thesis, Utrecht University, The Netherlands ISBN 978-90-8891-063-0 (2008)http://elastix.isi.uu.nl

Quantitative groupwise comparison of MR brain images 575
A Mann-Whitney test
The Mann Whitney test is the nonparametric equivalent to the t–test. It makesthe following assumptions:
1. The two samples are randomly and independently drawn from the sameunderlying distribution.
2. The dependent variable is continuous.3. The values of the dependent variable are at least ordinal.
As item 3 is stating, the vectors for a point need to be ordered, based on ameasure of a continuous scale (item 2). To order vectors in R3, a rank–1 approx-imation has been performed: for each point of the average image, a covariancematrix § is calculated based on all subjects in the two groups under considera-tion. Using the singular value decomposition of this covariance matrix (principalcomponent analysis), the eigenvectors V and eigenvalues ¤ are obtained andrepresent the principal modes of variation. § = U¤V ,
The first mode of variation V1, corresponding to the largest eigenvalue ¤1,1,represents the direction of largest variance between the vectors considered forthat particular point in the average. Projecting the vectors on this directionresults in vectors all pointing in the same direction, and their lengths are thenused in the usual Mann-Whitney test. A disadvantage of this test is that only thefirst principal mode of the covariance matrix is used, and therefore only partialinformation on the orientation of the vectors is used, decreasing the power ofthe test.