The 2020 National Nursing Workforce Survey
96
www.journalofnursingregulation.com S1 Volume 12/Supplement April 2021 The 2020 National Nursing Workforce Survey Richard A. Smiley, MS, MA Senior Statistician, Research, National Council of State Boards of Nursing Clark Ruttinger, MPA, MBA President, The National Forum of State Nursing Workforce Centers Director, Utah Nursing Workforce Information Center Carrie M. Oliveira, PhD Associate Specialist for Workforce Research, Hawaii Center for Nursing Laura R. Hudson, MSN, RN Associate Director - CE/Workforce, Iowa Center for Nursing Workforce Richard Allgeyer, PhD Associate Director – Research Director, Oregon Center for Nursing Kyrani A. Reneau, MA Data Project Manager, ICPSR at University of Michigan Institute for Social Research Josephine H. Silvestre, MSN, RN Senior Associate, Regulatory Innovations, National Council of State Boards of Nursing Maryann Alexander, PhD, RN, FAAN Chief Officer, Nursing Regulation, National Council of State Boards of Nursing Supplement
-
Upload
khangminh22 -
Category
Documents
-
view
3 -
download
0
Transcript of The 2020 National Nursing Workforce Survey

www.journalofnursingregulation.com S1Volume 12/Supplement April 2021
The 2020 National Nursing Workforce Survey
Richard A. Smiley, MS, MASenior Statistician, Research, National Council of State Boards of Nursing
Clark Ruttinger, MPA, MBAPresident, The National Forum of State Nursing Workforce Centers
Director, Utah Nursing Workforce Information Center
Carrie M. Oliveira, PhD Associate Specialist for Workforce Research, Hawaii Center for Nursing
Laura R. Hudson, MSN, RNAssociate Director - CE/Workforce, Iowa Center for Nursing Workforce
Richard Allgeyer, PhD Associate Director – Research Director, Oregon Center for Nursing
Kyrani A. Reneau, MAData Project Manager, ICPSR at University of Michigan Institute for Social Research
Josephine H. Silvestre, MSN, RN Senior Associate, Regulatory Innovations, National Council of State Boards of Nursing
Maryann Alexander, PhD, RN, FAANChief Officer, Nursing Regulation, National Council of State Boards of Nursing
Supplement

S2 Journal of Nursing Regulation
CONTENTSApril 2021 • Volume 12 • Issue 1 Supplement
Advancing nursing excellence for public protection
Mission The Journal of Nursing Regulation provides a worldwide forum for sharing research, evidence-based practice, and innovative strategies and solutions related to nursing regulation, with the ultimate goal of safeguarding the public. The journal maintains and promotes National Council of State Boards of Nursing’s (NCSBN’s) values of integrity, accountability, quality, vision, and collaboration in meeting readers’ knowledge needs.
Manuscript Information The Journal of Nursing Regulation accepts timely articles that may advance the science of nursing regulation, promote the mission and vision of NCSBN, and enhance com-munication and collaboration among nurse regulators, educators, practitioners, and the scientific community. Manuscripts must be original and must not have been nor will be submitted elsewhere for publication. See www.journalofnursingregulaton.com for author guidelines and manuscript submis-sion information.Letters to the EditorSend to Maryann Alexander at [email protected].
Executive Summary . . . . . . . . . . . . . . . . . . . . . . . . . . . . . . . . . . . . . . . . . . . . . . . . . . . .S4
Selected Survey Results . . . . . . . . . . . . . . . . . . . . . . . . . . . . . . . . . . . . . . . . . . . . . . . . . . . S4Size of the Workforce . . . . . . . . . . . . . . . . . . . . . . . . . . . . . . . . . . . . . . . . . . . . . . . . . . . . S4Aging of the Workforce . . . . . . . . . . . . . . . . . . . . . . . . . . . . . . . . . . . . . . . . . . . . . . . . . . . S5Gender, Race, and Ethnicity . . . . . . . . . . . . . . . . . . . . . . . . . . . . . . . . . . . . . . . . . . . . . . . . S5Education . . . . . . . . . . . . . . . . . . . . . . . . . . . . . . . . . . . . . . . . . . . . . . . . . . . . . . . . . . . S5Licensure . . . . . . . . . . . . . . . . . . . . . . . . . . . . . . . . . . . . . . . . . . . . . . . . . . . . . . . . . . . . S5Employment and Salary . . . . . . . . . . . . . . . . . . . . . . . . . . . . . . . . . . . . . . . . . . . . . . . . . . . S5Telehealth Utilization . . . . . . . . . . . . . . . . . . . . . . . . . . . . . . . . . . . . . . . . . . . . . . . . . . . . S6Conclusion . . . . . . . . . . . . . . . . . . . . . . . . . . . . . . . . . . . . . . . . . . . . . . . . . . . . . . . . . . . S6
Introduction . . . . . . . . . . . . . . . . . . . . . . . . . . . . . . . . . . . . . . . . . . . . . . . . . . . . . . . . . . .S7
Methods . . . . . . . . . . . . . . . . . . . . . . . . . . . . . . . . . . . . . . . . . . . . . . . . . . . . . . . . . . . . . .S7
Sample . . . . . . . . . . . . . . . . . . . . . . . . . . . . . . . . . . . . . . . . . . . . . . . . . . . . . . . . . . . . . S7
Survey Instrument and Materials . . . . . . . . . . . . . . . . . . . . . . . . . . . . . . . . . . . . . . . . . . . . S10
Procedure. . . . . . . . . . . . . . . . . . . . . . . . . . . . . . . . . . . . . . . . . . . . . . . . . . . . . . . . . . . S10
Analysis. . . . . . . . . . . . . . . . . . . . . . . . . . . . . . . . . . . . . . . . . . . . . . . . . . . . . . . . . . . . S11
Population Estimate . . . . . . . . . . . . . . . . . . . . . . . . . . . . . . . . . . . . . . . . . . . . . . . . . . . . S11
Registered Nurse Results . . . . . . . . . . . . . . . . . . . . . . . . . . . . . . . . . . . . . . . . . . . . . . . S12
Gender . . . . . . . . . . . . . . . . . . . . . . . . . . . . . . . . . . . . . . . . . . . . . . . . . . . . . . . . . . . . S12
Age . . . . . . . . . . . . . . . . . . . . . . . . . . . . . . . . . . . . . . . . . . . . . . . . . . . . . . . . . . . . . . S12Age by Gender . . . . . . . . . . . . . . . . . . . . . . . . . . . . . . . . . . . . . . . . . . . . . . . . . . . . . . . .S13
Race/Ethnicity . . . . . . . . . . . . . . . . . . . . . . . . . . . . . . . . . . . . . . . . . . . . . . . . . . . . . . . S13Hispanic/Latinx Ethnicity . . . . . . . . . . . . . . . . . . . . . . . . . . . . . . . . . . . . . . . . . . . . . . . . .S14Race/Ethnicity by Gender . . . . . . . . . . . . . . . . . . . . . . . . . . . . . . . . . . . . . . . . . . . . . . . . .S15Race by Age . . . . . . . . . . . . . . . . . . . . . . . . . . . . . . . . . . . . . . . . . . . . . . . . . . . . . . . . . .S15
Education . . . . . . . . . . . . . . . . . . . . . . . . . . . . . . . . . . . . . . . . . . . . . . . . . . . . . . . . . . S16Type of Nursing Degree or Credential for First U.S. Nursing License . . . . . . . . . . . . . . . . . . . . . . . .S16Type of Nursing Degree or Credential for First U.S. Nursing License by Age . . . . . . . . . . . . . . . . . . .S17Highest Level of Nursing Education . . . . . . . . . . . . . . . . . . . . . . . . . . . . . . . . . . . . . . . . . . . .S17Highest Level of Nursing Education by Gender . . . . . . . . . . . . . . . . . . . . . . . . . . . . . . . . . . . . .S18Highest Level of Nursing Education by Race . . . . . . . . . . . . . . . . . . . . . . . . . . . . . . . . . . . . . .S18Highest Level of Nursing Education by Age . . . . . . . . . . . . . . . . . . . . . . . . . . . . . . . . . . . . . . .S19Highest Level of Non-nursing Education . . . . . . . . . . . . . . . . . . . . . . . . . . . . . . . . . . . . . . . . S20
Licensure . . . . . . . . . . . . . . . . . . . . . . . . . . . . . . . . . . . . . . . . . . . . . . . . . . . . . . . . . . . S21Type of License Currently Held . . . . . . . . . . . . . . . . . . . . . . . . . . . . . . . . . . . . . . . . . . . . . . .S21Number of Years Licensed . . . . . . . . . . . . . . . . . . . . . . . . . . . . . . . . . . . . . . . . . . . . . . . . . .S22Country Where Entry-Level Nursing Education Was Received . . . . . . . . . . . . . . . . . . . . . . . . . . . .S23Credentialed to Practice as an APRN . . . . . . . . . . . . . . . . . . . . . . . . . . . . . . . . . . . . . . . . . . .S23
Multistate License . . . . . . . . . . . . . . . . . . . . . . . . . . . . . . . . . . . . . . . . . . . . . . . . . . . . . S24
Employment . . . . . . . . . . . . . . . . . . . . . . . . . . . . . . . . . . . . . . . . . . . . . . . . . . . . . . . . . S25Employment Status . . . . . . . . . . . . . . . . . . . . . . . . . . . . . . . . . . . . . . . . . . . . . . . . . . . . . .S25Reasons for Being Unemployed . . . . . . . . . . . . . . . . . . . . . . . . . . . . . . . . . . . . . . . . . . . . . . .S26Retirement Plans . . . . . . . . . . . . . . . . . . . . . . . . . . . . . . . . . . . . . . . . . . . . . . . . . . . . . . .S27Number of Positions Currently Held . . . . . . . . . . . . . . . . . . . . . . . . . . . . . . . . . . . . . . . . . . .S27Number of Hours Worked During a Typical Week in All Nursing Positions . . . . . . . . . . . . . . . . . . .S28Primary Nursing Practice Position Setting . . . . . . . . . . . . . . . . . . . . . . . . . . . . . . . . . . . . . . . .S29Primary Nursing Position Title . . . . . . . . . . . . . . . . . . . . . . . . . . . . . . . . . . . . . . . . . . . . . . .S31Primary Nursing Position Specialty . . . . . . . . . . . . . . . . . . . . . . . . . . . . . . . . . . . . . . . . . . . .S33Providing Direct Patient Care—Primary Nursing Position . . . . . . . . . . . . . . . . . . . . . . . . . . . . . .S35Secondary Nursing Practice Position Setting of Registered Nurses . . . . . . . . . . . . . . . . . . . . . . . . .S35Secondary Nursing Position Title . . . . . . . . . . . . . . . . . . . . . . . . . . . . . . . . . . . . . . . . . . . . .S37Secondary Nursing Position Specialty . . . . . . . . . . . . . . . . . . . . . . . . . . . . . . . . . . . . . . . . . . .S38Providing Direct Patient Care—Secondary Nursing Practice Position . . . . . . . . . . . . . . . . . . . . . . . S40
Salary/Earnings . . . . . . . . . . . . . . . . . . . . . . . . . . . . . . . . . . . . . . . . . . . . . . . . . . . . . . . S402020 Pretax Annual Earnings From Primary Nursing Position . . . . . . . . . . . . . . . . . . . . . . . . . . S40Earnings by Gender and Specialty . . . . . . . . . . . . . . . . . . . . . . . . . . . . . . . . . . . . . . . . . . . . S41Earnings by Highest Education . . . . . . . . . . . . . . . . . . . . . . . . . . . . . . . . . . . . . . . . . . . . . S42Earnings by State . . . . . . . . . . . . . . . . . . . . . . . . . . . . . . . . . . . . . . . . . . . . . . . . . . . . . . S42Earnings by Years Licensed and Age . . . . . . . . . . . . . . . . . . . . . . . . . . . . . . . . . . . . . . . . . . S44Earnings by APRNs . . . . . . . . . . . . . . . . . . . . . . . . . . . . . . . . . . . . . . . . . . . . . . . . . . . . S44
Telehealth Utilization . . . . . . . . . . . . . . . . . . . . . . . . . . . . . . . . . . . . . . . . . . . . . . . . . . . S45Percentage of Time Providing Telehealth . . . . . . . . . . . . . . . . . . . . . . . . . . . . . . . . . . . . . . . . S45Telehealth Across State Borders . . . . . . . . . . . . . . . . . . . . . . . . . . . . . . . . . . . . . . . . . . . . . S46Telehealth Across National Borders . . . . . . . . . . . . . . . . . . . . . . . . . . . . . . . . . . . . . . . . . . . .S47Modes of Communication Used for Telehealth . . . . . . . . . . . . . . . . . . . . . . . . . . . . . . . . . . . . S48
Licensed Practical Nurse/Licensed Vocational Nurse Results . . . . . . . . . . . . . . . . . S49
Gender . . . . . . . . . . . . . . . . . . . . . . . . . . . . . . . . . . . . . . . . . . . . . . . . . . . . . . . . . . . . S49
Age . . . . . . . . . . . . . . . . . . . . . . . . . . . . . . . . . . . . . . . . . . . . . . . . . . . . . . . . . . . . . . S49Age by Gender . . . . . . . . . . . . . . . . . . . . . . . . . . . . . . . . . . . . . . . . . . . . . . . . . . . . . . . .S50
Race/Ethnicity . . . . . . . . . . . . . . . . . . . . . . . . . . . . . . . . . . . . . . . . . . . . . . . . . . . . . . . S51Hispanic/Latinx Ethnicity . . . . . . . . . . . . . . . . . . . . . . . . . . . . . . . . . . . . . . . . . . . . . . . . .S51
www.journalofnursingregulation.com S3Volume 12/Supplement April 2021
Race/Ethnicity by Gender . . . . . . . . . . . . . . . . . . . . . . . . . . . . . . . . . . . . . . . . . . . . . . . . .S52Race/Ethnicity by Age . . . . . . . . . . . . . . . . . . . . . . . . . . . . . . . . . . . . . . . . . . . . . . . . . . . .S53
Education . . . . . . . . . . . . . . . . . . . . . . . . . . . . . . . . . . . . . . . . . . . . . . . . . . . . . . . . . . S53Type of Nursing Degree or Credential for First U.S. Nursing License . . . . . . . . . . . . . . . . . . . . . . . .S53Type of Nursing Degree or Credential for First U.S. Nursing License by Age. . . . . . . . . . . . . . . . . . . .S54Highest Level of Nursing Education . . . . . . . . . . . . . . . . . . . . . . . . . . . . . . . . . . . . . . . . . . . .S54Highest Level of Nursing Education by Race . . . . . . . . . . . . . . . . . . . . . . . . . . . . . . . . . . . . . .S55Highest Level of Non-nursing Education . . . . . . . . . . . . . . . . . . . . . . . . . . . . . . . . . . . . . . . . .S56
Licensure . . . . . . . . . . . . . . . . . . . . . . . . . . . . . . . . . . . . . . . . . . . . . . . . . . . . . . . . . . . S56Number of Years Licensed . . . . . . . . . . . . . . . . . . . . . . . . . . . . . . . . . . . . . . . . . . . . . . . . . .S56Initially Licensed in the United States . . . . . . . . . . . . . . . . . . . . . . . . . . . . . . . . . . . . . . . . . . .S57
Multistate License . . . . . . . . . . . . . . . . . . . . . . . . . . . . . . . . . . . . . . . . . . . . . . . . . . . . . S58Use of Multistate License . . . . . . . . . . . . . . . . . . . . . . . . . . . . . . . . . . . . . . . . . . . . . . . . . .S58
Employment . . . . . . . . . . . . . . . . . . . . . . . . . . . . . . . . . . . . . . . . . . . . . . . . . . . . . . . . . S58Employment Status . . . . . . . . . . . . . . . . . . . . . . . . . . . . . . . . . . . . . . . . . . . . . . . . . . . . . .S58Reason for Being Unemployed . . . . . . . . . . . . . . . . . . . . . . . . . . . . . . . . . . . . . . . . . . . . . . S60Retirement Plans . . . . . . . . . . . . . . . . . . . . . . . . . . . . . . . . . . . . . . . . . . . . . . . . . . . . . . .S61Number of Positions Currently Held . . . . . . . . . . . . . . . . . . . . . . . . . . . . . . . . . . . . . . . . . . .S61Number of Hours Worked During a Typical Week in all Nursing Positions . . . . . . . . . . . . . . . . . . . S62Primary Nursing Practice Position Setting . . . . . . . . . . . . . . . . . . . . . . . . . . . . . . . . . . . . . . . S63Primary Nursing Position Title . . . . . . . . . . . . . . . . . . . . . . . . . . . . . . . . . . . . . . . . . . . . . . S64Primary Nursing Position Specialty . . . . . . . . . . . . . . . . . . . . . . . . . . . . . . . . . . . . . . . . . . . S66Providing Direct Patient Care—Primary Nursing Position . . . . . . . . . . . . . . . . . . . . . . . . . . . . . S69Secondary Nursing Position Setting . . . . . . . . . . . . . . . . . . . . . . . . . . . . . . . . . . . . . . . . . . . S69Secondary Nursing Position Title . . . . . . . . . . . . . . . . . . . . . . . . . . . . . . . . . . . . . . . . . . . . .S71Secondary Nursing Position Specialty . . . . . . . . . . . . . . . . . . . . . . . . . . . . . . . . . . . . . . . . . .S72Providing Direct Patient Care—Secondary Nursing Practice Position . . . . . . . . . . . . . . . . . . . . . . .S74
Salary/Earnings . . . . . . . . . . . . . . . . . . . . . . . . . . . . . . . . . . . . . . . . . . . . . . . . . . . . . . . S742020 Pretax Annual Earnings From Primary Nursing Position . . . . . . . . . . . . . . . . . . . . . . . . . . . .S74Earnings by Gender and Specialty . . . . . . . . . . . . . . . . . . . . . . . . . . . . . . . . . . . . . . . . . . . . .S75Earnings by Highest Education . . . . . . . . . . . . . . . . . . . . . . . . . . . . . . . . . . . . . . . . . . . . . . .S76Earnings by State . . . . . . . . . . . . . . . . . . . . . . . . . . . . . . . . . . . . . . . . . . . . . . . . . . . . . . .S77Earnings by Years Licensed and Age . . . . . . . . . . . . . . . . . . . . . . . . . . . . . . . . . . . . . . . . . . . .S78
Telehealth Utilization . . . . . . . . . . . . . . . . . . . . . . . . . . . . . . . . . . . . . . . . . . . . . . . . . . . S78Percentage of Time Providing Telehealth . . . . . . . . . . . . . . . . . . . . . . . . . . . . . . . . . . . . . . . . .S78Telehealth Across State Borders . . . . . . . . . . . . . . . . . . . . . . . . . . . . . . . . . . . . . . . . . . . . . . .S79Telehealth Across National Borders . . . . . . . . . . . . . . . . . . . . . . . . . . . . . . . . . . . . . . . . . . . S80Modes of Communication Used for Telehealth . . . . . . . . . . . . . . . . . . . . . . . . . . . . . . . . . . . . .S81
Discussion and Implications . . . . . . . . . . . . . . . . . . . . . . . . . . . . . . . . . . . . . . . . . . . . S83
Demographics . . . . . . . . . . . . . . . . . . . . . . . . . . . . . . . . . . . . . . . . . . . . . . . . . . . . . . . . S83
Employment . . . . . . . . . . . . . . . . . . . . . . . . . . . . . . . . . . . . . . . . . . . . . . . . . . . . . . . . . S83
Education . . . . . . . . . . . . . . . . . . . . . . . . . . . . . . . . . . . . . . . . . . . . . . . . . . . . . . . . . . S84
Licensure . . . . . . . . . . . . . . . . . . . . . . . . . . . . . . . . . . . . . . . . . . . . . . . . . . . . . . . . . . . S84
Salary . . . . . . . . . . . . . . . . . . . . . . . . . . . . . . . . . . . . . . . . . . . . . . . . . . . . . . . . . . . . . S84
Limitations . . . . . . . . . . . . . . . . . . . . . . . . . . . . . . . . . . . . . . . . . . . . . . . . . . . . . . . . . . S84
Conclusion . . . . . . . . . . . . . . . . . . . . . . . . . . . . . . . . . . . . . . . . . . . . . . . . . . . . . . . . . . . S85
References . . . . . . . . . . . . . . . . . . . . . . . . . . . . . . . . . . . . . . . . . . . . . . . . . . . . . . . . . . . S86
Appendices . . . . . . . . . . . . . . . . . . . . . . . . . . . . . . . . . . . . . . . . . . . . . . . . . . . . . . . . . . . S87
Appendix A: 2020 National Workforce Study Questionnaire . . . . . . . . . . . . . . . . . . . . . . . . . . . S87
Appendix B: Impact of COVID-19 on Survey Responses . . . . . . . . . . . . . . . . . . . . . . . . . . . . . S91
Appendix C: Registered Nurse Nonresponse Analyses and Sample Weighting . . . . . . . . . . . . . . . . S92Preliminary Analysis . . . . . . . . . . . . . . . . . . . . . . . . . . . . . . . . . . . . . . . . . . . . . . . . . . . . .S92Bivariate Analysis . . . . . . . . . . . . . . . . . . . . . . . . . . . . . . . . . . . . . . . . . . . . . . . . . . . . . . .S92Weights . . . . . . . . . . . . . . . . . . . . . . . . . . . . . . . . . . . . . . . . . . . . . . . . . . . . . . . . . . . .S93Licensed Practical Nurse/Licensed Vocational Nurse Nonresponse Analyses and Sample Weighting . . . . . S94Preliminary Analysis . . . . . . . . . . . . . . . . . . . . . . . . . . . . . . . . . . . . . . . . . . . . . . . . . . . . S94Bivariate analysis . . . . . . . . . . . . . . . . . . . . . . . . . . . . . . . . . . . . . . . . . . . . . . . . . . . . . . S95Weights . . . . . . . . . . . . . . . . . . . . . . . . . . . . . . . . . . . . . . . . . . . . . . . . . . . . . . . . . . . S95

S4 Journal of Nursing Regulation
The 2020 National Nursing Workforce Survey
Background: Every two years, the National Council of State Boards of Nursing (NCSBN) and the National Forum of State
Nursing Workforce Centers (Forum) conduct the only national-level survey focused on the entire U.S. nursing workforce.
The survey generates data on the supply of registered nurses (RNs) and licensed practical nurses/licensed vocational nurses
(LPNs/LVNs). These data are especially crucial in providing information on emerging nursing issues which in 2020 was the
significant burden placed on nurses and the healthcare system by the coronavirus (COVID-19) pandemic. Purpose: To provide
data critical to planning for enough adequately prepared nurses and ensuring a safe, diverse, and effective healthcare system.
Methods: This study used a national, randomized sample survey of 157,459 licensed RNs and 172,045 LPNs/LVNs. Data from
42,021 RN respondents and 39,765 LPN/LVN respondents were collected between February 19, 2020, and June 30, 2020. Data
included nurse demographics, educational attainment, employment, practice characteristics, and trends. Results: The total
number of active RN and LPN/LVN licenses in the United States were 4,198,031 and 944,813, respectively. The median age of
RNs was 52 years and 53 years for LPNs/LVNs. The nursing workforce has become more diverse than in any other study year
as nurses between 19 and 49 years of age have introduced greater racial diversity. Findings suggest the nursing workforce is
becoming increasingly more educated and experienced. An average of 83% of all nurses who maintain licensure are employed
in nursing with roughly two-thirds working full-time. Hospitals and nursing/extended care facilities continue to be the primary
practice setting for RNs and LPNs, respectively. More than one-fifth of all nurses reported they plan to retire from nursing over
the next 5 years. Nursing incomes have remained essentially flat over time. Conclusion: Employment setting, age, diversity,
and education have all changed over the last 2 years. Challenges will continue in the nursing workforce such as matching
workforce diversity to the population, compensation, and opportunities; preparing for the large numbers of nurses retiring;
exploring the role of nurses in new practice settings; and changes in healthcare delivery modalities such as telehealth.
Keywords: U.S. nursing workforce, nursing demographics, nursing education, nursing licensure, nursing employment, nursing diversity, telehealth.
Executive Summary
Worldwide, the coronavirus (COVID-19) pandemic has simultaneously strained healthcare infrastructures and demonstrated the agility and resilience of frontline healthcare professionals. In the United States, significant demand has been placed on the nursing workforce as cases continue to rise (National Council of State Boards of Nursing [NCSBN], 2020a). The col-
lection of nursing data is especially crucial during this time because of the burden on our healthcare delivery systems. Evidence on the supply of nurses can be used to help curb potential shortages, guide recruitment efforts, influence policy decisions, and plan for future healthcare challenges (Fraher et al., 2020).
Since 2013, the NCSBN and the National Forum of State Nursing Workforce Centers (Forum) have collaborated every 2 years to conduct a national sample survey of registered nurses (RNs) and licensed practical nurses/licensed vocational nurses (LPNs/LVNs) in the United States. A team of scientists from both organizations developed and analyzed the data. The purpose of this study is to provide the most accurate data available on the characteristics of the U.S. nursing workforce. This study presents a national, randomized sample survey of 157,459 licensed RNs and 172,045 LPNs/LVNs. Data were collected between February 19, 2020, and June 30, 2020, from 42,021 RN respondents and 39,765 LPN/LVN respondents. Data collected included nurse demographics, educational attainment, em-ployment, practice characteristics, and trends of the U.S. nursing workforce as of 2020. The data are also compared with data from previ-ous Workforce Surveys. The 2020 data provide a portrait of the current state of the nursing workforce in the United States. Healthcare policy makers and leaders in nursing education and practice can use this evidence-based research when making decisions that impact the future of nursing in America.
Selected Survey Results
Size of the Workforce
As of December 31, 2019, the total number of active RN licenses in the United States was 4,948,914, an increase of 309,366 (6.7%), and active LPN/LVN licenses was 996,154 (NCSBN, 2020b), an increase of 20,166 (2.1%), compared to 2017. After adjusting for nurses with multiple licenses, the total number of active RNs in the United States was 4,198,031, an increase of 246,970 (6.3%), and active LPN/LVNs was 944,813 (NCSBN, 2020b), an increase of 24,070 (2.6%), compared to 2017.

www.journalofnursingregulation.com S5Volume 12/Supplement April 2021
Aging of the Workforce
The median age of RNs was 52 years, up from 51 years in 2017. Nurses aged 65 years or older account for 19.0% of the RN workforce, up from 14.6% in 2017 and 4.4% in 2013. They also comprise the largest age category. The median age of LPNs/LVNs was 53 years, up from 52 years in 2017. LPNs/LVNs who are aged 65 years or older account for 18.2% of the workforce. This cohort has grown by 5.0 percentage points since 2017 and by 8.3 percentage points since 2015. The aging of the nurse workforce is expected to continue: In 2020, more than one-fifth of all nurse respondents replied positively when asked if they plan to retire in the next 5 years.
Gender, Race, and Ethnicity
Males accounted for 9.4% of the RN workforce, an increase of 0.3 percentage points since 2017. Additionally, males accounted for 8.1% of all LPNs/LVNs, an increase of 0.4 percentage points since 2017. In 2020, a third gender response option of “other” was added to the survey and was selected by 0.1% of nurses. Nearly 81% of RNs reported being White/Caucasian. RNs who reported being Asian ac-counted for 7.2% of the workforce, representing the largest non-Caucasian racial group in the RN workforce. Black/African American RNs increased from 6.0 % in 2013 to 6.7 % in 2020 and the proportion of RNs reporting being Hispanic/Latinx also increased from 2017. LPNs/LVNs who reported being Black/African American represent the second largest racial group in the workforce (17.2%) after White/Caucasian (69.5%). LPNs/LVNs who reported being Hispanic/Latinx account for 10.0% of the workforce, an increase of 2.6 percentage points since 2017.
Education
Approximately 42% of nurses in 2020 reported the baccalaureate nursing degree as their first U.S. nursing license, an increase of 5.8 percentage points from 2013. The percentage of respondents who initially earned a diploma or associate degree decreased by 7.5 points. Diploma (almost 50%) and associate degree (17.2%) were associated with RNs who were aged 65 years or older. Increasingly, a baccalau-reate degree is more common in younger age groups for initial licensure (13.5% for RNs younger than 30 years and aged 30–34 years), which suggests the RN workforce is becoming increasingly educated at initial licensure. The most common highest level of nursing education is a baccalaureate degree across all groups (65.2% of RNs), which increased by 7.8 percentage points between 2013 and 2020. RNs achieving a doctorate of nursing practice (DNP) as their highest level of nursing education increased by a full percentage point from 0.4% in 2013 to 1.4% in 2020.
In 2020, 81.5% of LPN/LVN respondents reported a vocational/practical certificate for their first nursing license. Interestingly, the proportion of LPNs/LVNs with an associate or baccalaureate degree increased over the years, while the number of those qualifying with a vocational/practical certificate and diploma has decreased. The highest level of nursing education reported by LPNs/LVNs were vocational/practical certificate (72%), diploma (12.2%), associate degree (12.7%), and baccalaureate degree (3.1%).
Licensure
Less than 1% of RNs also held an LPN/LVN license, while 6.6% held an advanced practice registered nurse (APRN) credential, which represents the highest proportion of RNs not credentialed as an APRN since 2013, dropping 3.4 percentage points since 2017. RNs responding to the survey were licensed for a median of 20 years. Most RNs (93.9%) reported receiving their entry-level nursing education in the United States and 24% reported holding a multistate license. Of those nurses reporting possession of a multistate license, 33% use that license for physical crossborder practice.
LPN/LVN respondents reported they were licensed for a median of 17 years. In 2020, 21.2% of LPNs/LVNs reported holding a multistate license. Of those LPNs/LVNs reporting possession of a multistate license, 21.9% use that license for physical crossborder practice.
Employment and Salary
The major portion of responding RNs (84.1%) were actively employed in nursing, with 64.9% employed in nursing full time. This represents a 0.5% decrease in the proportion of RNs working full time from 2017 (65.4%). Hospital was the primary nursing practice setting selected by RNs (54.8%), representing a decrease of 0.9 percentage points from 2017. Ambulatory care setting was the second most frequently selected setting by 9.7% of RNs, followed by home health at 4.5% and the nursing home/extended care setting at 4.4%.
Staff nurse was the title that most closely corresponded to the primary nursing position by 60.1% of respondents, up from 58.0% of 2017 respondents. The APRN title decreased from 10.1% in 2017 to 6.3% in 2020. In 2020, 13.4% of RNs reported their primary practice specialty was acute care/critical care, compared to 14.0% in 2017. The second most frequently selected specialty was medical-surgical at 8.5%, down from 8.6% of RN respondents in 2017. When Survey respondents were asked, “In your primary nursing practice position, do you spend the majority of your time providing direct patient care?” More than two-thirds, (68.6%) of RNs and 77.8% of LPNs/LVNs responded “yes”.

S6 Journal of Nursing Regulation
The median pretax annual earnings for responding RNs increased from $60,000 in 2015 to $70,000 in 2020, constituting 3.3% growth in earnings during the 5-year period. Categorically, the percentage of respondents earning less than $40,000 annually decreased by 0.4 percentage points, the percentage making between $40,000 and $60,000 decreased by 3.9 percentage points. Since 2015, median earnings have risen in all states.
Among responding LPNs/LVNs, 65.7% reported being actively employed in nursing full time, which is consistent with the 2017 survey (65.0%). The most notable increase was among those who selected retired, which increased from 8.7% in 2017 to 11.3% in 2020.
The median pretax annual earnings for responding LPNs/LVNs increased from $38,000 in 2015 to $40,000 in 2017 and $44,000 in 2020. This constitutes a 3.2% simple annual growth in earnings during the 5-year period (0.1% lower than the growth in reported RN incomes during the same period). The largest increase has been in the $60,000 to $80,000 category, which has increased by 8.4 percentage points since 2015.
Telehealth Utilization
Telehealth utilization by nurses has remained relatively unchanged since 2017, with approximately 50% of RNs and LPNs/LVNs respond-ing that they use telehealth technologies when providing nursing services. Considering that this survey was collected when healthcare delivery systems were transitioning to more telehealth due to the pandemic, it is expected that there will be a future trend toward an increase in time spent by nurses utilizing telehealth.
Conclusion
The nursing workforce in 2020 was more demographically diverse and representative of the country’s population than in any other year in which this study was conducted. Although these data indicate that persons of color are still not adequately represented in the RN workforce, as younger nurses have entered the workforce, they have introduced greater racial diversity.
The proportion of nurses reporting a plan to retire from nursing over the next 5 years is on the rise, so the U.S. healthcare system needs to be prepared for large numbers of nurses leaving the profession in the near future. This may be even more critical as we face the COVID-19 pandemic, which may accelerate the retirement rate given that persons older than 60 years are at increased risk for severe symptoms from COVID-19.
The proportion of RNs holding a baccalaureate degree increased for those reporting their highest level of nursing education but remained steady for those reporting the degree held when obtaining their first nursing license. The proportion of RNs holding an as-sociate degree when first licensed increased slightly in 2020. The proportion of LPNs/LVNs earning an associate or baccalaureate degree also increased, while those with a practical/vocational certificate or nursing diploma declined. The proportion of nurses with 10 or fewer years practicing declined according to survey respondents, while the proportion of those with between 11 and 30 years of experience grew in 2020. Evidence here suggests both RNs and LPNs/LVNs are more educated and more experienced now than in previous years.
Nursing incomes have remained essentially flat over time, with increases that just barely beat out inflation. Of concern are greater-than-average drops in reported median income in specialties related to women and maternal-child health.
While telehealth has become a major focus of healthcare delivery during the pandemic, it does not seem that there have been major changes to how nurses use telehealth, which may be due to the timing of this survey. It is anticipated that the use of telehealth will change a great deal in the future as our care delivery systems learn how best to utilize nursing services in this new normal.
Over the next few years, new challenges will continue as the nursing workforce undergoes significant changes and healthcare de-livery systems adjust to the pandemic. Ongoing monitoring of nursing data will be more important than ever. Ultimately, nursing will continue pursuing the goals of achieving higher levels of education, promoting diversity, and improving data collection regarding the national healthcare workforce.

www.journalofnursingregulation.com S7Volume 12/Supplement April 2021
IntroductionFor the fourth time, the National Council of State Boards of Nursing (NCSBN) and the National Forum of State Nursing Workforce Centers (Forum) have collaborated on the biennial national survey of registered nurses (RNs) and licensed practical nurses/licensed vo-cational nurses (LPNs/LVNs). The purpose of this study is to collect information on the supply of RNs and LPNs/LVNs in the United States. This study presents a national, randomized sample survey of 157,459 licensed RNs and 172,045 LPNs/LVNs. Data were collected between February 19, 2020, and June 30, 2020, from 42,021 RN respondents and 39,765 LPN/LVN respondents. Data collected in-cluded details about nurses’ demographics, educational attainment, employment, practice characteristics, and trends of the U.S. nursing workforce as of 2020. To illustrate supply trends, study results were compared to national nursing workforce studies from previous years as well as national studies from other entities that utilize different collection methods than the one described below. This consideration should be kept in mind when interpreting the comparison of statistics from various nursing workforce studies.
MethodsSample
All RNs and LPNs/LVNs with an active license in the United States and its territories were eligible to be survey participants. A portion of the sample was drawn from Nursys, NCSBN’s licensure database. This database contains basic demographic and licensure information for RN and LPN/LVN licensees. Licensee lists and addresses were also obtained directly from the following boards of nursing (BONs): California (LPN/LVN), Hawaii, Indiana, Louisiana (LPN), Nevada, New Hampshire, Utah, and Wisconsin. For New York and Michigan, licensee lists and addresses were purchased from Exact Data. American Samoa and Virgin Islands chose not to participate in this survey.
As of December 31, 2019, the total number of active RN licenses in the United States was 4,948,914 and the total number of active LPN/LVN licenses was 996,154 (NCSBN, 2020b). Note that the numbers for Michigan reflect data from July 2017. Separate RN and LPN/LVN samples stratified by state were randomly selected from the RN licensees and LPN/LVN licensees. Surveys were mailed to 157,459 RNs and 172,045 LPNs/LVNs. Table 1 and Table 2 present the sampling by jurisdiction/state. Each jurisdiction is listed with the actual number of active licenses at the time of sampling and the number of surveys that needed to be received from each jurisdiction in order to construct a 95% confidence of plus or minus 3% error. Regardless of jurisdiction size, this calculated to be approximately 1,000 nurses for most states and less for the jurisdictions of Guam and the Northern Mariana Islands, respectively. To calculate the number of surveys that needed to be mailed out to reach the targeted survey response, response rates for online and paper surveys from the previous 2017 survey administration were used as estimates. For example, for Alaska in 2017 there was a 36.7% response rate for the RN survey. Given this estimated response rate, 2,728 RNs in Alaska were selected to be survey recipients in order to receive the target of 1,000 sur-veys. Actual response from Alaska RNs to the current survey (i.e., the number of responses returned) was 773, a response rate of 29.1%.
TABLE 1
RN Sampling: Number of Active RN Licenses
Jurisdiction Number of Active RN Licenses
Target sample
Estimated total response rate
Number of surveys mailed
Undeliverable Number Delivered
Number of Responses
Total Response Rate
AK 15,487 1,000 36.7% 2,728 69 2,659 773 29.1%
AL 85,746 1,000 27.2% 3,673 30 3,643 952 26.1%
AR 42,487 1,000 28.5% 3,504 298 3,206 761 23.7%
AZ 93,928 1,000 32.4% 3,087 414 2,673 561 21.0%
CA 444,964 1,000 31.5% 3,177 48 3,129 811 25.9%
CO 77,705 1,000 36.6% 2,734 168 2,566 682 26.6%
CT 67,924 1,000 32.9% 3,041 27 3,014 820 27.2%
DC 27,575 1,000 28.3% 3,532 92 3,440 809 23.5%
DE 18,674 1,000 31.8% 3,145 12 3,133 947 30.2%
FL 316,557 1,000 26.1% 3,832 87 3,745 865 23.1%
GA 132,922 1,000 29.8% 3,356 71 3,285 800 24.4%
HI 24,652 1,000 32.8% 3,050 34 3,016 925 30.7%
IA 55,355 1,000 38.4% 2,606 30 2,576 809 31.4%
ID 22,912 1,000 39.6% 2,523 26 2,497 894 35.8%
IL 207,001 1,000 32.3% 3,099 68 3,031 790 26.1%
IN 116,264 1,000 33.5% 2,988 30 2,958 951 32.2%
(continued)

S8 Journal of Nursing Regulation
RN Sampling: Number of Active RN Licenses (continued)
Jurisdiction Number of Active RN Licenses
Target sample
Estimated total response rate
Number of surveys mailed
Undeliverable Number Delivered
Number of Responses
Total Response Rate
KS 58,781 1,000 34.1% 2,930 23 2,907 911 31.3%
KY 71,603 1,000 29.7% 3,371 13 3,358 873 26.0%
LA 69,699 1,000 30.1% 3,319 124 3,195 601 18.8%
MA 138,481 1,000 32.2% 3,107 41 3,066 817 26.6%
MD 82,686 1,000 33.3% 3,000 60 2,940 762 25.9%
ME 25,807 1,000 38.6% 2,592 29 2,563 838 32.7%
MI 149,864 1,000 39.1% 2,558 40 2,518 865 34.4%
MN 115,068 1,000 40.0% 2,500 25 2,475 806 32.6%
MO 113,032 1,000 30.0% 3,333 50 3,283 1,094 33.3%
MS 50,103 1,000 26.5% 3,773 61 3,712 801 21.6%
MT 18,391 1,000 46.3% 2,161 50 2,111 843 39.9%
NC 139,452 1,000 32.2% 3,109 46 3,063 789 25.8%
ND 16,046 1,000 43.7% 2,289 34 2,255 836 37.1%
NE 31,000 1,000 36.7% 2,725 31 2,694 905 33.6%
NH 24,217 1,000 35.4% 2,823 184 2,639 411 15.6%
NJ 133,029 1,000 31.9% 3,134 97 3,037 568 18.7%
NM 28,715 1,000 35.0% 2,861 89 2,772 825 29.8%
NV 45,254 1,000 31.9% 3,138 100 3,038 727 23.9%
NY 358,901 1,000 26.1% 3,832 94 3,738 737 19.7%
OH 211,769 1,000 32.4% 3,085 15 3,070 890 29.0%
OK 51,110 1,000 27.8% 3,595 57 3,538 978 27.6%
OR 65,333 1,000 39.8% 2,510 32 2,478 716 28.9%
PA 225,852 1,000 35.6% 2,807 36 2,771 836 30.2%
RI 25,014 1,000 33.7% 2,970 73 2,897 803 27.7%
SC 71,392 1,000 29.7% 3,368 84 3,284 817 24.9%
SD 18,473 1,000 40.5% 2,471 28 2,443 825 33.8%
TN 104,780 1,000 27.5% 3,633 52 3,581 881 24.6%
TX 336,520 1,000 24.4% 4,106 66 4,040 879 21.8%
UT 35,931 1,000 25.2% 3,976 91 3,885 1,126 29.0%
VA 107,495 1,000 31.4% 3,185 44 3,141 835 26.6%
VT 16,991 1,000 37.5% 2,668 29 2,639 781 29.6%
WA 105,526 1,000 39.3% 2,548 146 2,402 772 32.1%
WI 105,898 1,000 46.0% 2,174 117 2,057 721 35.1%
WV 31,473 1,000 26.7% 3,751 26 3,725 944 25.3%
WY 9,213 1,000 42.3% 2,365 53 2,312 795 34.4%
Guam 1,528 175 23.1% 758 50 708 158 22.3%
Northern Mariana Islands
4,334 164 19.0% 861 72 789 105 13.3%
TOTAL 4,948,914 51,339 32.6% 157,459 3,764 153,695 42,021 27.3%
Note. RN = registered nurse.

www.journalofnursingregulation.com S9Volume 12/Supplement April 2021
TABLE 2
LPN/LVN Sampling: Number of Active LPN/LVN Licenses
Jurisdiction Number of Active LPN/LVN Licenses
Estimated sample: 95% confidence,
3% error
Estimated total response rate
Number of surveys mailed
Undeliverable Number Delivered
Number of Responses
Total Response
Rate
AK 845 174 24.8% 701 50 651 143 22.0%
AL 18,627 1,000 27.3% 3,660 82 3,578 867 24.2%
AR 14,595 1,000 25.2% 3,961 370 3,591 807 22.5%
AZ 10,506 1,000 26.5% 3,770 651 3,119 527 16.9%
CA 102,851 1,000 23.5% 4,251 142 4,109 779 19.0%
CO 8,423 1,000 30.7% 3,252 276 2,976 628 21.1%
CT 12,757 1,000 21.6% 4,638 98 4,540 946 20.8%
DC 1,957 287 19.9% 1,442 71 1,371 209 15.2%
DE 3,040 703 23.3% 3,015 166 2,849 576 20.2%
FL 61,624 1,000 19.9% 5,023 146 4,877 1,039 21.3%
GA 29,861 1,000 22.6% 4,424 97 4,327 944 21.8%
HI 1,836 587 29.9% 1,961 39 1,922 629 32.7%
IA 9,832 1,000 31.7% 3,158 70 3,088 905 29.3%
ID 3,626 1,000 31.4% 3,183 83 3,100 969 31.3%
IL 26,204 1,000 27.2% 3,670 84 3,586 770 21.5%
IN 24,356 1,000 25.0% 3,996 103 3,893 1,047 26.9%
KS 10,403 1,000 28.6% 3,499 77 3,422 975 28.5%
KY 13,269 1,000 24.4% 4,104 40 4,064 924 22.7%
LA 22,711 1,000 19.4% 5,156 49 5,107 1,051 20.6%
MA 19,721 1,000 23.6% 4,237 52 4,185 912 21.8%
MD 11,699 1,000 23.6% 4,242 143 4,099 824 20.1%
ME 1,994 687 36.0% 1,908 59 1,849 541 29.3%
MI 24,237 1,000 30.8% 3,251 74 3,177 878 27.6%
MN 21,017 1,000 40.2% 2,489 33 2,456 732 29.8%
MO 24,737 1,000 23.3% 4,298 137 4,161 1,222 29.4%
MS 14,333 1,000 23.0% 4,348 114 4,234 1,071 25.3%
MT 2,636 709 43.5% 1,629 52 1,577 595 37.7%
NC 22,543 1,000 30.3% 3,301 76 3,225 808 25.1%
ND 3,584 938 41.2% 2,276 59 2,217 771 34.8%
NE 5,479 1,000 35.7% 2,800 15 2,785 900 32.3%
NH 3,157 277 26.6% 1,041 91 950 151 15.9%
NJ 23,886 1,000 23.3% 4,300 110 4,190 791 18.9%
NM 2,609 733 29.5% 2,487 150 2,337 520 22.3%
NV 4,256 1,000 26.7% 3,742 213 3,529 773 21.9%
NY 82,302 1,000 19.5% 5,121 93 5,028 1,190 23.7%
OH 54,194 1,000 29.3% 3,411 90 3,321 763 23.0%
OK 16,382 1,000 21.4% 4,663 96 4,567 1,030 22.6%
OR 5,801 1,000 29.7% 3,369 112 3,257 798 24.5%
PA 53,891 1,000 30.6% 3,273 55 3,218 879 27.3%
RI 2,286 608 27.0% 2,252 85 2,167 460 21.2%
SC 12,131 1,000 24.8% 4,028 111 3,917 942 24.0%
SD 2,634 896 35.9% 2,498 61 2,437 745 30.6%
TN 30,297 1,000 23.3% 4,293 72 4,221 936 22.2%
TX 107,368 1,000 21.2% 4,718 124 4,594 862 18.8%
(continued)

S10 Journal of Nursing Regulation
LPN/LVN Sampling: Number of Active LPN/LVN Licenses (continued)
Jurisdiction Number of Active LPN/LVN Licenses
Estimated sample: 95% confidence,
3% error
Estimated total response rate
Number of surveys mailed
Undeliverable Number Delivered
Number of Responses
Total Response
Rate
UT 2,806 581 21.1% 2,758 91 2,667 652 24.4%
VA 27,383 1,000 22.8% 4,379 110 4,269 848 19.9%
VT 2,533 625 26.0% 2,400 199 2,201 498 22.6%
WA 11,434 1,000 28.8% 3,476 271 3,205 864 27.0%
WI 12,435 1,000 39.7% 2,516 51 2,465 888 36.0%
WV 7,815 1,000 21.9% 4,575 77 4,498 899 20.0%
WY 964 316 33.8% 935 47 888 254 28.6%
Guam 235 23 18.1% 127 5 122 23 18.9%
Northern Mariana Islands
52 8 20.5% 39 5 34 10 29.4%
TOTAL 996,154 45,152 28.0% 172,045 5,828 166,217 39,765 23.9%
Note. LPN/LVN = licensed practical nurse/licensed vocational nurse.
Survey Instrument and Materials
The survey instrument is based on the Forum’s Nurse Supply Minimum Data Set (MDS), which was approved in 2009 after an intensive process of consensus-building and data compilation on the nursing workforce at the state level. The Nurse Supply MDS was last updated by the Forum in 2016 to account for the transformations that occurred in healthcare and nursing during the past decade (Forum, 2016). Additionally, the 2020 survey instrument includes three new questions regarding the Nurse Licensure Compact (NLC; Appendix A). The survey was a four-page Scantron document with 38 questions. Data elements from the latest revision of the Nurse Supply MDS were incorporated, resulting in the following changes to the survey between the 2017 and 2020 waves of data collection:⦁ A “Middle Eastern/North African” category was added as a race response option and “other” was added as a gender response option ⦁ Respondents were asked specifically about where they received their entry-level nursing education and where they received their
initial license⦁ A question about plans to leave nursing was added⦁ A question about whether the nurse provided direct patient care was added⦁ Questions about the NLC were added.
Procedure
The Western Institutional Review Board granted approval for the current study. A unique identification number was generated and assigned to each sampled participant. The identification number was only to be used to record that the survey had been returned. This helped prevent unnecessary and expensive duplicate mailings to those selected to participate in the study. The unique access code identifier was also used for the online survey option. Once materials were developed and the sampling file was complete, surveys were distributed over a 20-week period starting the week of February 17, 2020, that included the following steps:⦁ Weeks 1-2: A cover letter and paper survey were mailed via first-class U.S. mail to all nurses selected to participate. The letter included
a URL and access code to take the survey online.⦁ Week 6: For nurses who had not responded, a cover letter, paper survey, and pre-paid reply envelope were mailed via first class U.S. mail. ⦁ Week 10: For nurses who still had not responded, an additional cover letter, paper survey, and pre-paid reply envelope were mailed
via first-class U.S. mail. ⦁ Week 20: Deadline for receipt of all surveys. Once the survey was closed, the final data file was compiled separately for RNs and
LPNs/LVNs.Survey response data are kept on department-secured servers. NCSBN’s research staff, three key members of the Forum, and key
personnel at Scantron had initial access to the identifiable data. Scantron no longer has access to the identifiable data. The functioning of the survey was impacted by COVID-19. Details of the impact are presented in Appendix B.

www.journalofnursingregulation.com S11Volume 12/Supplement April 2021
Analysis
At the close of the survey, 42,021 of 153,695 successfully delivered RN surveys were returned, yielding a response rate of 27.3%. There were 39,765 of 166,217 successfully delivered LPN/LVN surveys returned, resulting in a 23.9% response rate. A formal nonresponse bias analysis was conducted immediately following the close of the survey. An analysis of basic demographic data (i.e., gender, age, and race/ethnicity) for all RN licensees sampled from the Nursys database was used to compare survey respondents to survey nonrespondents. Results revealed White/Caucasian nurses, female nurses, and nurses aged 50 years or older may have been slightly overrepresented in both the RN and LPN/LVN samples. Because of missing or incomplete data on race/ethnicity, only gender and age were used to make nonre-sponse weighting adjustments. Additionally, since sampling was stratified by state, to prevent smaller states from being overrepresented in the overall analysis, a weighting variable was constructed to adjust for differing nursing population sizes across states. A description of this process can be found in Appendix C.
For an accurate and comprehensive view of the statistics drawn from the sample, the number of actual valid answers to each question is reported for every table. Missing data were not imputed; hence, the presented statistics represent the actual responses from participants who responded to each respective survey item. If a participant did not respond to a certain item, they were not part of the analysis for that item. Additionally, some tables display data for all responding nurse licensees while other tables display data for employed nurses. If a table is specific to nurses employed in nursing, it is explicitly stated. Many tables include bar graphs to help you easily visualize and comprehend the data presented.
Population Estimate
For each question on the survey, frequencies are shown that reflect the nonresponse weighting adjustments. For some of the questions, an additional set of frequencies are shown that display the data scaled up to reflect estimates of the nursing population in the subgroup identified. For example, the 391,141 males reported in the 2020 column of Table 3 reflect the number of male respondents adjusted to the population level of the number of RNs after the nonresponse weighting adjustments were made to the survey results, and after adjusting the population number to account for nurses having licenses in multiple states.
The adjustments for multiple licenses were derived from data in the Nursys database in December 2019. At that time, the database contained 4,948,914 RN licenses, which corresponded to 4,198,031 unique RNs. The number of RN survey responses was 42,021. This produced an RN population adjustment factor of 4,198,031/42,021 = 99.90, which was multiplied by sample counts to produce population estimates.
For LPNs/LVNs, the December 2019 database contained 996,154 licenses, which corresponded to 944,813 unique LPNs/LVNs. The number of LPN/LVN survey responses was 39,765. This produced an LPN/LVN population adjustment factor of 944,813/39,765 = 23.76, which was multiplied by sample counts to produce population estimates.

S12 Journal of Nursing Regulation
Registered Nurse ResultsGender
Males accounted for 9.4% of the RN workforce, which is an increase of 0.3 percentage points from 2017 and 2.8 percentage points from 2013. In 2020, respondents were able to select “other” in response to the gender question on the survey, and it was selected by 0.1% of nurses (Table 3).
TABLE 3
Gender Distribution of Registered Nurses, 2013–2020
Weighted Sample ValuesGender 2013 (n = 40,364.5) 2015 (n = 43,330.9) 2017 (n = 48,084.9) 2020 (n = 41,698.8)
n % n % n % n %Male 2,678.9 6.6 3,459.6 8.0 4,369.3 9.1 3,915.2 9.4Female 37,685.6 93.4 39,871.4 92.0 43,715.5 90.9 37,739.9 90.5Other 43.6 0.1
Estimated Population ValuesGender 2013 2015 2017 2020
n % n % n % n %Male 221,416 6.6 277,542 8.0 354,453 9.1 391,141 9.4Female 3,114,767 93.4 3,198,650 92.0 3,546,321 90.9 3,770,336 90.5Other 4,356 0.1
Note. “Other” was added as a response option with the 2020 survey.
Age
The median age of RNs was 52 years. Although the median age of the workforce has remained approximately the same since 2013, the age distribution of the workforce has changed substantially. Nurses who are aged 65 years or older account for 19% of the RN workforce and comprise the largest age category. The proportion of nurses aged 65 years or older increased by 5.1 percentage points from 2013 and by 4.4 percentage points from 2017 (Table 4 and Figure 1).
TABLE 4
Age Distribution of Registered Nurses, 2013–2020
Weighted Sample ValuesAge in Years 2013 (n = 34,793.9) 2015 (n = 41,258.6) 2017 (n = 47,527.3) 2020 (n = 39.899.2)
n % n % n % n %18–29 2,997.9 8.6 3,905.2 9.5 4,594.5 9.7 3,349.5 8.430–34 2,615.4 7.5 4,098.0 9.9 4,762.8 10.0 3,792.0 9.535–39 2,784.0 8.0 3,928.1 9.5 4,390.6 9.2 4,006.2 10.040–44 3,088.6 8.9 4,200.7 10.2 4,356.7 9.2 3,645.9 9.145–49 3,379.3 9.7 4,398.2 10.7 5,250.7 11.1 3,956.5 9.950–54 4,652.6 13.4 4,724.8 11.5 4,914.9 10.3 4,191.6 10.555–59 5,887.7 16.9 5,622.4 13.6 5,834.4 12.3 4,502.0 11.360–64 4,570.1 13.1 5,254.9 12.7 6,489.8 13.7 4,884.2 12.2≥ 65 4,818.4 13.9 5,126.3 12.4 6,932.9 14.6 7,571.3 19.0
Estimated Population ValuesAge in Years 2013 2015 2017 2020
n % n % n % n %18–29 247,778 8.6 313,291 9.5 372,716 9.7 334,626 8.430–34 216,164 7.5 328,759 9.9 386,374 10.0 378,833 9.535–39 230,098 8.0 315,127 9.5 356,175 9.2 400,232 10.040–44 255,281 8.9 337,000 10.2 353,430 9.2 364,237 9.145–49 279,305 9.7 352,843 10.7 425,953 11.1 395,267 9.9
(continued)

www.journalofnursingregulation.com S13Volume 12/Supplement April 2021
Estimated Population ValuesAge in Years 2013 2015 2017 2020
n % n % n % n %50–54 384,543 13.4 379,041 11.5 398,712 10.3 418,754 10.555–59 486,625 16.9 451,051 13.6 473,303 12.3 449,764 11.360–64 377,724 13.1 421,574 12.7 526,468 13.7 487,947 12.2≥ 65 398,247 13.9 411,256 12.4 562,414 14.6 756,397 19.0
FIGURE 1
Age Distribution of Registered Nurses, 2013–2020
0
2
4
6
8
10
12
14
16
18
20
2020201720152013
≥ 6560-6455-5950-5445-4940-4435-3930-3418-29
Perc
enta
ge
of
RN
res
po
nd
ents
Age cohorts (years)
Age by Gender
The proportion of female RNs in the 65 years or older cohort is almost double of total male RNs, while almost half of male RNs are in 35 to 54 aged cohort (Table 5).
TABLE 5
Age Distribution of Registered Nurses by Gender, 2020
Weighted Sample ValuesAge in Years Male (n =3,690.6) Female (n = 36,004.7) Other (n = 36.4) Total (n = 39,731.7)
n % n % n % n %19–29 316.2 8.6 3,021.2 8.4 5.9 16.3 3,343.3 8.430–34 353.1 9.6 3,429.4 9.5 7.6 20.8 3,790.1 9.535–39 483.3 13.1 3,511.4 9.8 7.3 19.9 4,002.0 10.140–44 431.6 11.7 3,207.3 8.9 1.4 3.8 3,640.3 9.245–49 449.2 12.2 3,480.5 9.7 8.4 23.2 3,938.1 9.950–54 479.8 13.0 3,690.3 10.3 0.0 0.0 4,170.1 10.555–59 393.0 10.7 4,088.7 11.4 0.0 0.0 4,481.7 11.360–64 355.2 9.6 4,502.5 12.5 0.0 0.0 4,857.7 12.2≥ 65 429.1 11.6 7,073.4 19.7 5.8 18.9 7,508.4 18.9
Race/Ethnicity
The racial composition of the RN workforce in 2020 is nearly identical to that in 2017. Nearly 81% of nurses reported being White/Caucasian.

S14 Journal of Nursing Regulation
Nurses who reported being Asian accounted for 7.2% of the workforce. Although this is a slight decrease (0.3 percentage points) from 2017, nurses who reported being Asian represent the largest non-White/Caucasian racial group in the workforce. The proportion of RNs who reported being Black/African American accounted for 6.7% of the workforce, which is an increase of 0.5 percentage points from 2017 (Table 6).
TABLE 6
Race of Registered Nurses, 2017–2020
Weighted Sample ValuesRace 2017 (n = 47,966.3) 2020 (n = 41,702.0)
n % n %American Indian or Alaska Native 176.0 0.4 194.1 0.5Asian 3,605.6 7.5 2,996.3 7.2Black/African American 2,995.9 6.2 2,800.7 6.7Native Hawaiian or other Pacific Islander 226.3 0.5 175.9 0.4Middle Eastern/North African 89.4 0.2White/Caucasian 38,766.1 80.8 33,595.1 80.6Other 1,367.8 2.9 967.7 2.3More than one race category selected 828.5 1.7 882.8 2.1
Estimated Population ValuesRace 2017 2020
n % n %American Indian or Alaska Native 14,276 0.4 19,391 0.5Asian 292,497 7.5 299,340 7.2Black/African American 243,032 6.2 279,799 6.7Native Hawaiian or other Pacific Islander 18,362 0.5 17,573 0.4Middle Eastern/North African 8,931 0.2White/Caucasian 3,144,812 80.8 3,356,257 80.6Other 110,960 2.9 96,676 2.3More than one race category selected 67,214 1.7 88,195 2.1
Note. Respondents were asked to select all that apply. The responses were subsequently recoded to ensure that the race categories were mutually ex-clusive. Respondents selecting multiple race categories were reclassified into the “More than one race category selected” category. For the 2020 sur-vey, “Middle Eastern/North African” was added as a response category.
Hispanic/Latinx Ethnicity
The proportion of RNs reporting being Hispanic/Latinx was 5.6%, which is an increase of 0.3 percentage points compared to 2017 (Table 7).
TABLE 7
Hispanic or Latinx Ethnicity of Registered Nurses, 2013–2020
Weighted Sample ValuesHispanic or Latinx
2013 (n = 41,876.0) 2015 (n = 45,989.3) 2017 (n = 47,852.6) 2020 (n = 41,483.3)n % n % n % n %
Yes 1,406.6 3.4 1,654.0 3.6 2,528.1 5.3 2,335.9 5.6No 40,469.5 96.6 44,335.3 96.4 45,324.5 94.7 39,147.4 94.4
Estimated Population ValuesHispanic or Latinx
2013 2015 2017 2020n % n % n % n %
Yes 116,257 3.4 136,707 3.6 205,088 5.3 233,364 5.6No 3,344,857 96.6 3,556,764 96.4 3,676,844 94.7 3,910,949 94.4
Note. In the 2013 and 2015 surveys, the Hispanic/Latino origin and race categories were combined into one question. The categories were separated for the 2017 and 2020 surveys.

www.journalofnursingregulation.com S15Volume 12/Supplement April 2021
Race/Ethnicity by Gender
Although male nurses account for only 9.4% of the RN workforce, male nurses account for a disproportionately high proportion of all non-White/Caucasian racial groups: male nurses account for 13.6% of all multiracial nurses and 34.3% of nurses identifying as Native Hawaiian or other Pacific Islanders (Table 8).
TABLE 8
Race of Registered Nurses by Gender, 2020
Weighted Sample ValuesRace n Male Female Other
n % n % n %American Indian or Alaska Native 189.5 13.6 7.2 175.9 92.8 0.0 0.0Asian 2,985.5 470.0 15.7 2,514.3 84.2 1.2 0.0Black/African American 2,785.1 306.0 11.0 2,477.1 88.9 1.9 0.1Native Hawaiian or other Pacific Islander 175.9 60.4 34.3 115.5 65.7 0.0 0.0Middle Eastern/North African 88.3 16.9 19.1 71.4 80.9 0.0 0.0White/Caucasian 33,478.9 2,779.0 8.3 30,672.6 91.6 27.4 0.1Other 962.2 125.5 13.0 824.9 85.7 11.8 1.2More than one race category selected 872.5 118.8 13.6 752.5 86.2 1.3 0.2Total 41,538.0 3,890.2 9.4 37,604.1 90.5 43.6 0.1
Note. Respondents were asked to select all that apply. The responses were subsequently recoded to ensure that the race categories were mutually ex-clusive. Respondents selecting multiple race categories were reclassified into the “More than one race category selected” category. For the 2020 sur-vey, “Middle Eastern/North African” was added as a response category.
Race by Age
Although younger nurses are generally more racially diverse than older nurses, the youngest RNs (aged 19 to 29 years) are notably less diverse than RNs aged between 30 and 49 years. As compared to the next oldest cohort of nurses (aged 30 to 34 years), the youngest nurses are less likely to be Asian, Black/African American, Native Hawaiian or other Pacific Islander, or multiracial. The proportion of nurses ages 19-29 years who identify as White/Caucasian (84.1%) is higher than the proportion of White/Caucasian nurses in any other cohort younger than 60 years (mean = 75.1%, highest = 76.8%) and higher than the proportion of White/Caucasian nurses in the RN workforce as a whole (80.7%) (Table 9).
TABLE 9
Race Distribution of Registered Nurses by Age, 2020
Weighted Sample ValuesAge in Years
n n (%)American Indian or Alaska Native
Asian Black/African
American
Native Ha-waiian or
Other Pacif-ic Islander
Middle Eastern/
North African
White/Caucasian
Other More ThanOne Race
19–29 3,334.0 12.7 (0.4) 204.8 (6.1) 143.0 (4.3) 7.9 (0.2) 5.4 (0.2) 2,804.5 (84.1) 51.9 (1.6) 103.6 (3.1)30–34 3,787.0 12.4 (0.3) 397.6 (10.5) 205.2 (5.4) 21.6 (0.6) 9.8 (0.3) 2,908.6 (76.8) 103.4 (2.7) 128.4 (3.4)35–39 3,990.7 22.2 (0.6) 315.5 (7.9) 281.7 (7.1) 44.2 (1.1) 9.3 (0.2) 3,054.7 (76.6) 128.9 (3.2) 134.1 (3.4)40–44 3,641.3 21.0 (0.6) 328.5 (9.0) 317.8 (8.7) 10.4 (0.3) 14.4 (0.4) 2,781.3 (76.4) 75.7 (2.1) 92.2 (2.5)45–49 3,939.3 19.8 (0.5) 547.9 (13.9) 342.2 (8.7) 24.5 (0.6) 12.8 (0.3) 2,782.4 (70.6) 142.4 (3.6) 67.4 (1.7)50–54 4,171.1 26.6 (0.6) 347.7 (8.3) 323.9 (7.8) 23.2 (0.6) 6.4 (0.2) 3,245.2 (77.8) 96.4 (2.3) 101.6 (2.4)55–59 4,491.4 22.2 (0.5) 195.3 (4.4) 314.2 (7.0) 10.9 (0.2) 11.8 (0.3) 3,772.3 (84.0) 96.5 (2.2) 68.1 (1.5)60–64 4,849.0 20.0 (0.4) 255.6 (5.3) 283.1 (5.8) 24.5 (0.5) 7.7 (0.2) 4,113.4 (84.8) 76.3 (1.6) 68.4 (1.4)≥ 65 7,542.5 28.8 (0.4) 275.7 (3.7) 434.8 (5.8) 6.2 (0.1) 7.2 (0.1) 6,606.3 (87.6) 116.3 (1.5) 67.3 (0.9)Total 39,746.2 185.8 (0.5) 2,868.6 (7.2) 2,646.0 (6.7) 173.5 (0.4) 84.9 (0.2) 32,068.5 (80.7) 887.8 (2.2) 831.2 (2.1)
Note. Respondents were asked to select all that apply. The responses were subsequently recoded to ensure that the race categories were mutually ex-clusive. Respondents selecting multiple race categories were reclassified into the “More than one race category selected” category. For the 2020 sur-vey, “Middle Eastern/North African” was added as a response category.

S16 Journal of Nursing Regulation
Education
Type of Nursing Degree or Credential for First U.S. Nursing License
The percentage of nurses reporting the baccalaureate as the nursing degree that qualified them for their first U.S. nursing license increased by 5.8 percentage points between 2013 and 2020, although this rate remained unchanged from 2017. The percent of respondents who initially earned a diploma or associate degree decreased by 7.5 points during the same period (Table 10 and Figure 2).
TABLE 10
Type of Nursing Degree or Credential of Registered Nurses for First U.S. Nursing License, 2013–2020
Weighted Sample ValuesNursing Degree or Credential 2013 (n = 41,747.9) 2015 (n = 45,758.5) 2017 (n = 47,650.0) 2020 (n = 41,383.6)
n % n % n % n %Vocational/practical certificate 1,993.8 4.8 2,442.1 5.3 2,850.6 6.0 2,382.8 5.8Diploma 7,364.6 17.6 6,539.3 14.3 5,708.1 12.0 4,581.2 11.1Associate degree 16,152.0 38.7 17,625.9 38.5 17,332.5 36.4 15,611.5 37.7Baccalaureate degree 15,019.5 36.0 17,853.4 39.0 19,922.7 41.8 17,313.6 41.8Master’s degree 1,218.0 2.9 1,297.9 2.8 1,836.0 3.9 1,494.5 3.6
Estimated Population ValuesNursing Degree or Credential 2013 2015 2017 2020
n % n % n % n %Vocational/practical certificate 164,793 4.8 195,916 5.3 231,247 6.0 238,049 5.8Diploma 608,692 17.6 524,607 14.3 463,060 12.0 457,676 11.1Associate degree 1,334,987 38.7 1,414,020 38.5 1,406,062 36.4 1,559,638 37.7Baccalaureate degree 1,241,379 36.0 1,432,271 39.0 1,616,186 41.8 1,729,683 41.8Master’s degree 100,673 2.9 104,121 2.8 148,942 3.9 149,305 3.6
FIGURE 2
Type of Nursing Degree or Credential of Registered Nurses for First U.S. Nursing License
0 10 20 30 40 50
2020201720152013
Master’s degree
Baccalaureate degree
Associate degree
Diploma
Vocational/practical certi�cate
Percentage of RN respondents
Nu
rsin
g d
egre
e o
r cr
eden
tial

www.journalofnursingregulation.com S17Volume 12/Supplement April 2021
Type of Nursing Degree or Credential for First U.S. Nursing License by Age
Two degrees are associated with older RNs: diploma (almost 50% are aged 65 years or older) and associate degree (17.2% are aged 65 years or older). A baccalaureate degree is increasingly more common in younger age groups as the education qualifier for initial licensure (13.5% are younger than 30 years; and 13.5% are aged 30 to 34 years). This suggests the workforce is becoming increasingly educated at initial licensure (Table 11).
TABLE 11
Type of Nursing Degree or Credential of Registered Nurses for First U.S. Nursing License by Age, 2020
Weighted Sample ValuesNursing Degree or Credential n Age in Years, n (%)
19-29 30-34 35-39 40-44 45-49 50-54 55-59 60-64 ≥ 65Vocational/practical certificate 2,305.5 95.0
(4.1)140.7 (6.1)
212.6 (9.2)
239.0 (10.4)
254.6 (11.0)
227.4 (9.9)
280.0 (12.1)
328.5 (14.3)
527.8 (22.9)
Diploma 4,422.5 85.5 (1.9)
89.0 (2.0)
151.1 (3.4)
127.7 (2.9)
198.8 (4.5)
278.5 (6.3)
544.8 (12.3)
748.4 (16.9)
2,198.6 (49.7)
Associate degree 14,947.0 890.8 (6.0)
1,181.7 (7.9)
1,533.2 (10.3)
1,563.1 (10.5)
1,577.7 (10.6)
1,809.1 (12.1)
1,879.9 (12.6)
1,946.6 (13.0)
2,564.9 (17.2)
Baccalaureate degree 16,417.4 2,208.8 (13.5)
2,218.2 (13.5)
1,889.9 (11.5)
1,491.3 (9.1)
1,694.2 (10.3)
1,667.7 (10.2)
1,596.7 (9.7)
1,642.1 (10.0)
2,008.6 (12.2)
Master’s degree 1,367.9 50.4 (3.7)
143.9 (10.5)
193.8 (14.2)
180.2 (13.2)
185.2 (13.5)
162.7 (11.9)
141.8 (10.4)
156.4 (11.4)
153.6 (11.2)
Total 39,460.4 3,330.5 (8.4)
3,773.5 (9.6)
3,980.6 (10.1)
3,601.3 (9.1)
3,910.4 (9.9)
4,145.4 (10.5)
4,443.3 (11.3)
4,822.0 (12.2)
7,453.5 (18.9)
Highest Level of Nursing Education
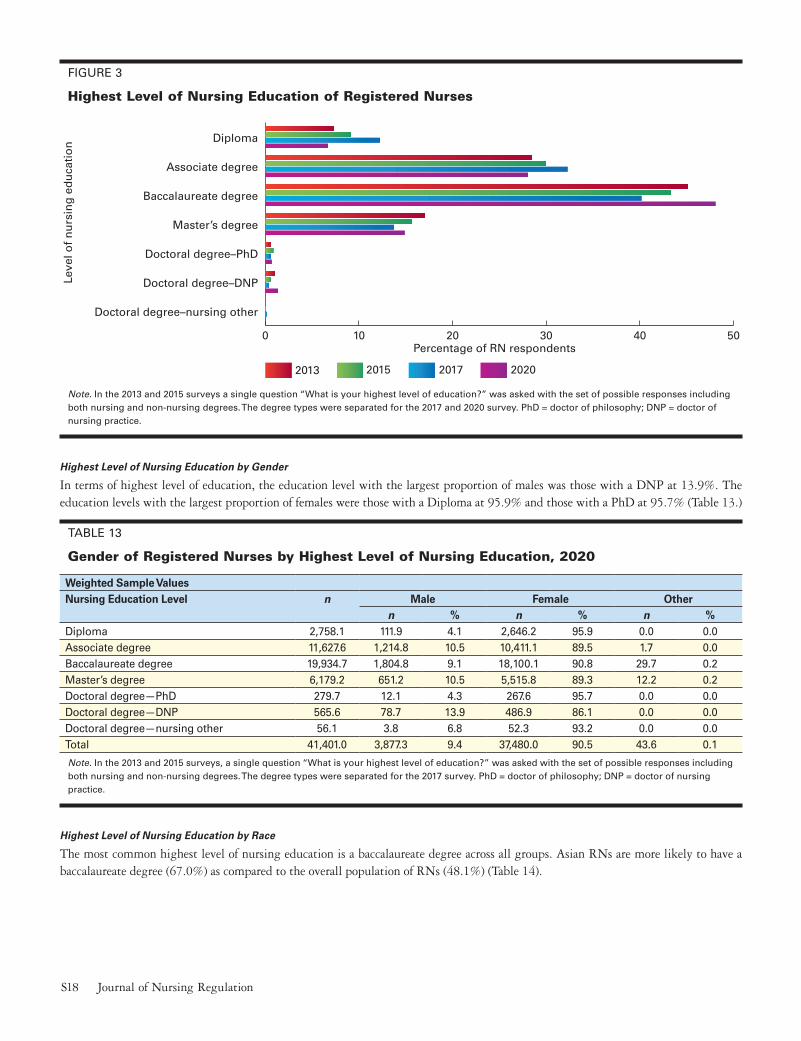
The percentage of RNs reporting a baccalaureate degree as their highest level of nursing education increased by 7.8 percentage points between 2013 and 2020. Additionally, the percentage of RNs reporting a graduate degree as their highest level of nursing education increased by 2.1 percentage points. The percentage of RNs reporting a diploma or associate degree declined by 9.9 percentage points. Overall, 65.2% of RNs report their highest level of nursing education as a baccalaureate degree or higher in 2020. RNs earning a doc-torate of nursing practice (DNP) as their highest level of nursing education increased by a full percentage point from 0.4% in 2013 to 1.4% in 2020 (Table 12 and Figure 3).
TABLE 12
Highest Level of Nursing Education of Registered Nurses, 2013–2020
Weighted Sample ValuesNursing Education Level 2013 (n = 35,016.5) 2015 (n = 38,625.9) 2017 (n = 48,140.7) 2020 (n = 41,571.5)
n % n % n % n %Diploma 4,319.4 12.3 3,551.3 9.2 3,547.7 7.4 2,782.8 6.7Associate degree 11,331.6 32.4 11,608.8 30.1 13,729.1 28.5 11,683.2 28.1Baccalaureate degree 14,097.0 40.3 16,762.5 43.4 21,744.1 45.2 19,998.5 48.1Master’s degree 4,846.0 13.8 6,085.1 15.8 8,238.3 17.1 6,200.5 14.9Doctoral degree: PhD 217.0 0.6 340.2 0.9 284.1 0.6 281.2 0.7Doctoral degree: DNP 142.5 0.4 239.1 0.6 551.2 1.1 569.1 1.4Doctoral degree: nursing other 62.9 0.2 39.0 0.1 46.1 0.1 56.1 0.1
Note. In the 2013 and 2015 surveys a single question “What is your highest level of education?” was asked with the set of possible responses including both nursing and non-nursing degrees. The degree types were separated for the 2017 and 2020 surveys. PhD = doctor of philosophy; DNP = doctor of nursing practice.
S18 Journal of Nursing Regulation
FIGURE 3
Highest Level of Nursing Education of Registered Nurses
0 10 20 30 40 50
2020201720152013
Doctoral degree–nursing other
Doctoral degree–DNP
Doctoral degree–PhD
Master’s degree
Baccalaureate degree
Associate degree
Diploma
Percentage of RN respondents
Leve
l of
nu
rsin
g e
du
cati
on
Note. In the 2013 and 2015 surveys a single question “What is your highest level of education?” was asked with the set of possible responses including both nursing and non-nursing degrees. The degree types were separated for the 2017 and 2020 survey. PhD = doctor of philosophy; DNP = doctor of nursing practice.
Highest Level of Nursing Education by Gender
In terms of highest level of education, the education level with the largest proportion of males was those with a DNP at 13.9%. The education levels with the largest proportion of females were those with a Diploma at 95.9% and those with a PhD at 95.7% (Table 13.)
TABLE 13
Gender of Registered Nurses by Highest Level of Nursing Education, 2020
Weighted Sample ValuesNursing Education Level n Male Female Other
n % n % n %Diploma 2,758.1 111.9 4.1 2,646.2 95.9 0.0 0.0Associate degree 11,627.6 1,214.8 10.5 10,411.1 89.5 1.7 0.0Baccalaureate degree 19,934.7 1,804.8 9.1 18,100.1 90.8 29.7 0.2Master’s degree 6,179.2 651.2 10.5 5,515.8 89.3 12.2 0.2Doctoral degree—PhD 279.7 12.1 4.3 267.6 95.7 0.0 0.0Doctoral degree—DNP 565.6 78.7 13.9 486.9 86.1 0.0 0.0Doctoral degree—nursing other 56.1 3.8 6.8 52.3 93.2 0.0 0.0Total 41,401.0 3,877.3 9.4 37,480.0 90.5 43.6 0.1
Note. In the 2013 and 2015 surveys, a single question “What is your highest level of education?” was asked with the set of possible responses including both nursing and non-nursing degrees. The degree types were separated for the 2017 survey. PhD = doctor of philosophy; DNP = doctor of nursing practice.
Highest Level of Nursing Education by Race
The most common highest level of nursing education is a baccalaureate degree across all groups. Asian RNs are more likely to have a baccalaureate degree (67.0%) as compared to the overall population of RNs (48.1%) (Table 14).

www.journalofnursingregulation.com S19Volume 12/Supplement April 2021
TABLE 14
Highest Level of Nursing Education of Registered Nurses by Race, 2020
Weighted Sample ValuesRace n Diploma Associate Baccalaureate Master’s Doctoral
(PhD)Doctoral
(DNP)Doctoral (Other)
American Indian or Alaska Native
191.9 15.3 (8.0) 67.4 (35.1) 79.9 (41.7) 24.1 (12.6) 0.0 (0.0) 5.2 (2.7) 0.0 (0.0)
Asian 2,974.7 91.5 (3.1) 420.3 (14.1) 1,991.9 (67.0) 433.8 (14.6) 12.4 (0.4) 17.8 (0.6) 6.9 (0.2)Black/African American 2,757.6 76.5 (2.8) 676.4 (24.5) 1,335.7 (48.4) 570.6 (20.7) 30.0 (1.1) 60.7 (2.2) 7.7 (0.3)Native Hawaiian or other Pacific Islander
175.9 4.9 (2.8) 30.9 (17.6) 103.5 (58.8) 25.2 (14.3) 0.0 (0.0) 11.4 (6.5) 0.0 (0.0)
Middle Eastern/North African
88.6 1.2 (1.4) 23.2 (26.2) 46.8 (52.8) 13.3 (15.0) 0.0 (0.0) 4.1 (4.6) 0.0 (0.0)
White/Caucasian 33,409.5 2,551.4 (7.6) 9,899.3 (29.6) 15,397.5 (46.1) 4,847.4 (14.5) 227.2 (0.7) 445.2 (1.3) 41.5 (0.1)Other 933.4 14.9 (1.6) 287.1 (30.8) 500.8 (53.7) 115.3 (12.4) 2.3 (0.2) 13.0 (1.4) 0.0 (0.0)More than one race cate-gory selected
869.5 15.8 (1.8) 224.7 (25.8) 460.5 (53.0) 150.9 (17.4) 8.5 (1.0) 9.0 (1.0) 0.0 (0.0)
Total 41,401.1 2,771.6 (6.7) 11,629.3 (28.1) 19,916.6 (48.1) 6,180.6 (14.9) 280.4 (0.7) 566.5 (1.4) 56.1 (0.1)
Note. In the 2013 and 2015 surveys, a single question “What is your highest level of education?” was asked with the set of possible responses including both nursing and non-nursing degrees. The degree types were separated for the 2017 and 2020 surveys. For the race question, respondents were asked to select all that apply. The responses were subsequently recoded to ensure that the race categories were mutually exclusive. Respondents selecting multiple race categories were reclassified into the “More than one race category selected” category. For the 2020 survey, “Middle Eastern/North Afri-can” was added as a response category. PhD = doctor of philosophy; DNP = doctor of nursing practice.
Highest Level of Nursing Education by Age
More than half of respondents whose highest level of nursing education is a diploma are aged 65 years or older. Conversely, those report-ing a baccalaureate degree as their highest level of education tend to be younger than 35 years (12.8% are younger than 30 years of age; 12.8% are between 30 and 34 years of age) (Table 15).
TABLE 15
Age of Registered Nurses by Highest Level of Nursing Education, 2020
Weighted Sample ValuesNursing Education Level n Age in Years, n (%)
19-29 30-34 35-39 40-44 45-49 50-54 55-59 60-64 ≥ 65Diploma 2,673.7 55.1
(2.1)30.7 (1.2)
41.3 (1.6)
53.2 (2.0)
107.7 (4.0)
143.9 (5.4)
318.0 (11.9)
469.8 (17.6)
1,453.8 (54.4)
Associate degree 11,154.3 606.2 (5.4)
711.2 (6.4)
1,041.4 (9.3)
1,017.1 (9.1)
1,076.4 (9.7)
1,352.0 (12.1)
1,478.1 (13.3)
1,618.0 (14.5)
2,254.0 (20.2)
Baccalaureate degree 19,006.0 2,434.3 (12.8)
2,436.1 (12.8)
2,125.1 (11.2)
1,816.8 (9.6)
1,995.9 (10.5)
1,933.3 (10.2)
1,885.9 (9.9)
1,921.6 (10.1)
2,456.9 (12.9)
Master’s degree 5,907.8 223.3 (3.8)
523.4 (8.9)
694.2 (11.8)
648.8 (11.0)
665.8 (11.3)
644.1 (10.9)
670.8 (11.4)
726.2 (12.3)
1,111.1 (18.8)
Doctoral degree - PhD 272.9 8.8 (3.2) 9.7 (3.5) 6.9 (2.5) 11.9 (4.4)
23.2 (8.5)
35.8 (13.1)
37.4 (13.7)
39.7 (14.6)
99.5 (36.5)
Doctoral degree - DNP 544.8 14.9 (2.7)
64.0 (11.7)
80.8 (14.8)
71.6 (13.2)
66.5 (12.2)
57.6 (10.6)
56.4 (10.4)
66.4 (12.2)
66.7 (12.3)
Doctoral degree - nursing other 51.9 0.0 (0.0) 0.8 (1.6) 1.7 (3.3) 1.6 (3.1) 3.6 (6.9) 6.9 (13.4)
5.6 (10.7)
9.1 (17.5)
22.6 (43.5)
Total 39,611.3 3,342.6 (8.4)
3,775.9 (9.5)
3,991.5 (10.1)
3,621.0 (9.1)
3,939.1 (9.9)
4,173.7 (10.5)
4,452.1 (11.2)
4,850.8 (12.2)
7,464.5 (18.8)
Note. In the 2013 and 2015 surveys, a single question “What is your highest level of education?” was asked with the set of possible responses including both nursing and non-nursing degrees. The degree types were separated for the 2017 and 2020 surveys.

S20 Journal of Nursing Regulation
Highest Level of Non-nursing Education
The 2017 survey asked about the highest level of non-nursing education. The percentage of RNs reporting an associate degree as their highest level of non-nursing education increased 1.9 percentage points between 2017 and 2020. Those reporting a baccalaureate degree remained about the same, increasing by 0.2 percentage points. RNs reporting a master’s or doctorate degree as their highest level of nursing education decreased slightly, 1.4 and 0.7 percentage points, respectively (Table 16 and Figure 4).
TABLE 16
Highest Level of Non-Nursing Education of Registered Nurses, 2020
Weighted Sample ValuesNon-nursing Education Level 2017 (n = 19,904.5) 2020 (n = 17,698.1)
n % n %Associate degree 7,025.9 35.3 6,578.1 37.2Baccalaureate degree 9,115.4 45.8 8,141.5 46.0Master’s degree 3,150.8 15.8 2,547.4 14.4Doctoral degree 612.4 3.1 431.1 2.4
Note. In the 2013 and 2015 surveys a single question “What is your highest level of education?” was asked with the set of possible responses including both nursing and non-nursing degrees. The degree types were separated for the 2017 and 2020 surveys.
FIGURE 4
Highest Level of Non-nursing Education of Registered Nurses
05
101520253035404550
20202017
Doctoral degree-non-nursing
Masters degree-non-nursing
Baccalaureate degree-non-nursing
Associate degree-non-nursing
Non-nursing education level
Perc
enta
ge
of
RN
res
po
nd
ents
Note. In the 2013 and 2015 surveys a single question “What is your highest level of education?” was asked with the set of possible responses including both nursing and non-nursing degrees. The degree types were separated for the 2017 AND 2020 surveys.

www.journalofnursingregulation.com S21Volume 12/Supplement April 2021
Licensure
Type of License Currently Held
Respondents were asked to report all the nursing licenses they currently hold. Less than 1% of responding RNs also held an LPN/LVN license, while 6.6% held an advanced practice registered nurse (APRN) credential. The percentage of RNs also holding an APRN cre-dential is the lowest reported since 2013, dropping 3.4 percentage points since 2017 (Table 17 and Figure 5).
TABLE 17
Type of License Currently Held by Registered Nurses, 2013–2020
Weighted Sample ValuesLicense 2013 (n = 41,658.3) 2015 (n = 46,047.8) 2017 (n = 48,128.0) 2020 (n = 41,601.8)
n % n % n % n %RN 39,521.6 94.9 43,730.2 95.0 45,971.3 95.5 40,378.3 97.1LPN 215.9 0.5 330.8 0.7 386.2 0.8 323.6 0.8APRN 3,046.4 7.3 3,974.7 8.6 4,788.6 10.0 2,763.2 6.6
Estimated Population ValuesLicense 2013 2015 2017 2020
n % n % n % n %RN 3,266,514 94.9 3,508,219 95.0 3,729,318 95.5 4,033,920 97.1LPN 17,845 0.5 26,534 0.7 31,328 0.8 32,329 0.8APRN 251,788 7.3 318,870 8.6 388,461 10.0 276,052 6.6
Note. Respondents were asked to select all that apply. RN = registered nurse; LPN = licensed practical nurse; APRN = advanced practice registered nurse.
FIGURE 5
Type of License Currently Held by Registered Nurses, 2013–2020
0
10
20
30
40
50
60
70
80
90
100
2020201720152013
APRNLPNRN
Perc
enta
ge
of
RN
res
po
nd
ents
License type held by RNs
Note. Respondents were asked to select all that apply. RN = registered nurse; LPN = licensed practical nurse; APRN = advanced practice registered nurse. Some states do not include APRNs in their RN population.

S22 Journal of Nursing Regulation
Number of Years Licensed
RNs responding to the survey were licensed for a median of 20 years. Nearly one third (30.5%) were licensed for 10 years or less. An additional 22.1% were licensed between 11 and 20 years. These figures are similar to those reported in 2017 (32.9% and 19.7%, respec-tively) (Table 18 and Figure 6).
TABLE 18
Number of Years the Registered Nurse Has Been Licensed, 2013–2020
Weighted Sample ValuesYears Licensed 2013 (n = 37,655.3) 2015 (n = 39,771.5) 2017 (n = 46,757.6) 2020 (n = 38,741.0)
n % n % n % n %0–10 9,845.5 26.2 13,307.3 33.5 15,397.6 32.9 11,802.6 30.511–20 7,156.2 19.0 7,753.4 19.5 9,217.7 19.7 8,577.4 22.121–30 7,340.5 19.5 6,855.8 17.2 8,121.6 17.4 6,934.1 17.931–40 8,213.0 21.8 7,311.4 18.4 8,226.1 17.6 5,951.6 15.4> 40 5,100.0 13.5 4,543.7 11.4 5,794.6 12.4 5,475.4 14.1
Estimated Population ValuesYears Licensed 2013 2015 2017 2020
n % n % n % n %0–10 813,747 26.2 1,067,569 33.5 1,249,096 32.9 1,179,117 30.511–20 591,472 19.0 622,009 19.5 747,767 19.7 856,909 22.121–30 606,701 19.5 549,997 17.2 658,844 17.4 692,739 17.931–40 678,818 21.8 586,547 18.4 667,326 17.6 594,584 15.4> 40 421,525 13.5 364,511 11.4 470,073 12.4 547,010 14.1
FIGURE 6
Number of Years the Registered Nurse Has Been Licensed, 2013–2020
0
5
10
15
20
25
30
35
40
2020201720152013
More than 41 years31 to 40 years21 to 30 years11 to 20 years0 to 10 years
Perc
enta
ge
of
RN
res
po
nd
ents
Number of years licensed

www.journalofnursingregulation.com S23Volume 12/Supplement April 2021
Country Where Entry-Level Nursing Education Was Received
The majority of RNs (93.9%) reported receiving their entry-level nursing education in the United States, while 3.3% reported obtaining their nursing education in the Philippines, 0.5% in Canada, and 0.5% in India (Table 19).
TABLE 19
Country of Entry-Level Nursing Education of Registered Nurses, 2020
Weighted Sample ValuesCountry 2020 (n = 41,745.5)
n %United States 31,192.5 93.9Canada 224.7 0.5Philippines 1,360.3 3.3India 212.8 0.5Other 755.2 1.8
Estimated Population ValuesCountry 2020
n %United States 3,116,230 93.9Canada 22,448 0.5Philippines 135,898 3.3India 21,259 0.5Other 75,447 1.8
Credentialed to Practice as an APRN
Respondents were asked whether they were credentialed in their state as an APRN enabling them to practice in any of the four APRN roles, including nurse practitioner (NP), clinical nurse specialist (CNS), certified registered nurse anesthetist (CRNA), or certified nurse midwife (CNM). Most respondents (91.6%) indicated they were not credentialed to practice as an APRN. This represents the highest proportion of RNs not credentialed as an APRN since 2013. In 2020, 5.5% of respondents reported being credentialed as an NP, com-pared with 8.5% in 2017 (Table 20 and Figure 7).
TABLE 20
Registered Nurse Credentials to Practice as an APRN, 2013–2020
Weighted Sample ValuesCredential 2013 (n = 40,053.2) 2015 (n = 43,045.0) 2017 (n = 47,713.6) 2020 (n = 41,129.2)
n % n % n % n %Nurse practitioner 2,266.4 5.7 3,129.4 7.2 4,067.1 8.5 2,257.1 5.5Clinical nurse specialist 1,243.1 3.1 576.8 1.3 983.5 2.1 769.2 1.9Certified registered nurse anesthetist 509.1 1.3 571.9 1.3 728.7 1.5 399.7 0.9Certified nurse midwife 159.3 0.4 167.7 0.4 242.0 0.5 192.0 0.5Not licensed/certified as any above 35,875.3 90.8 38,599.3 89.7 42,004.2 88.0 37,677.6 91.6
Estimated Population ValuesCredential 2013 2015 2017 2020
n % n % n % n %Nurse practitioner 187,325 5.7 251,053 7.2 329,933 8.5 225,491 5.5Clinical nurse specialist 102,741 3.1 46,275 1.3 79,787 2.1 76,846 1.9Certified registered nurse anesthetist 42,078 1.3 45,879 1.3 59,114 1.5 39,931 0.9Certified nurse midwife 13,165 0.4 13,452 0.4 19,636 0.5 19,181 0.5Not licensed/certified as any above 2,965,145 90.8 3,096,595 89.7 3,407,498 88.0 3,764,112 91.6
Note. Respondents were asked to select all that apply. APRN = advanced practice registered nurse.

S24 Journal of Nursing Regulation
FIGURE 7
Registered Nurses Credentialed as APRNs
0 20 40 60 80 100
2020201720152013
Not licensed/certi�ed as any above
Certi�ed nurse midwife
Certi�ed registered nurse anesthetist
Clinical nurse specialist
Nurse practitioner
Percentage of RN respondents
AP
RN
cre
den
tial
Note. Respondents were asked to select all that apply. APRN = advanced practice registered nurse.
Multistate License
New to the 2020 survey, 24% of nurses reported holding a multistate license (Table 21. The NLC has important implications for how nursing workforce statistics on surplus and shortage of workforce supply are calculated by state. States record the number of nurses’ licenses issued; however, care must be taken to account for those nurses licensed in each state who are delivering care elsewhere. The number of licensed nurses in a state does not equal the number of nurses providing services in the state. More work is needed to understand how the NLC contributes to meeting the workforce needs of each state in the nation.
TABLE 21
Registered Nurses Holding a Multistate License, 2020
Weighted Sample ValuesMultistate License 2020 (n = 34,825.9)
n %Yes 8,367.4 24.0No 26,458.5 76.0
Note. Respondents were asked to answer this question only if they were actively employed in nursing.
Use of Multistate License. Of nurses reporting possession of a multistate license, 33% use it for physical crossborder practice and 20% of respondents indicated using it for “other” uses (Table 22).
TABLE 22
How a Multistate License is Used by Registered Nurses, 2020
Weighted Sample ValuesUse of Multistate License 2020 (n = 5,481.8)
n %Physical crossborder practice 1,816.7 33.1Telehealth 868.0 15.8Distance education 446.8 8.2Disaster support 155.7 2.8Travel nursing 190.1 3.5Have not used 1,314.8 24.0Other 1,095.6 20.0
Note. Respondents were asked to answer this question only if they were actively employed in nursing. Respondents were asked to select all that apply.

www.journalofnursingregulation.com S25Volume 12/Supplement April 2021
Employment
Employment Status
The major portion of responding RNs (84.1%) were actively employed in nursing with 64.9% employed in nursing full time. This represents a slight decrease in the proportion of RNs working full time from 2017 (65.4%) but an increase from 2015 (62.9%) (Table 23 and Figure 8).
TABLE 23
Employment Status of Registered Nurses, 2013–2020
Weighted Sample ValuesEmployment Status 2013 (n = 42,145.6) 2015 (n = 46,210.2) 2017 (n = 48,146.9) 2020 (n = 41,783.4)
n % n % n % n %Actively employed in nursing full-time 25,447.3 60.4 29,088.5 62.9 31,476.6 65.4 27,101.0 64.9Actively employed in nursing part-time 6,276.1 14.9 6,088.0 13.2 5,820.9 12.1 4,901.7 11.7Actively employed in nursing per diem 3,069.5 7.3 3,675.2 8.0 3,424.9 7.1 3,133.6 7.5Actively employed in a field other than nursing full-time
1,713.0 4.1 1,576.1 3.4 1,108.9 2.3 882.4 2.1
Actively employed in a field other than nursing part-time
1,169.0 2.8 850.8 1.8 605.7 1.3 438.5 1.1
Actively employed in a field other than nursing per diem
512.7 1.2 377.7 0.8 267.5 0.6 188.5 0.5
Working in nursing only as a volunteer 810.6 1.9 564.5 1.2 645.6 1.3 517.1 1.2Unemployed, seeking work as a nurse 1,144.4 2.7 1,070.7 2.3 1,030.2 2.1 809.1 1.9Unemployed, not seeking work as a nurse 1,463.3 3.5 1,611.6 3.5 1,616.2 3.4 1,362.4 3.3Retired 4,755.1 11.3 4,993.7 10.8 4,916.9 10.2 4,824.7 11.6
Estimated Population ValuesEmployment Status 2013 2015 2017 2020
n % n % n % n %Actively employed in nursing full-time 2,103,254 60.4 2,333,606 62.9 2,553,467 65.4 2,707,476 64.9Actively employed in nursing part-time 518,727 14.9 488,405 13.2 472,204 12.1 489,695 11.7Actively employed in nursing per diem 253,696 7.3 294,837 8.0 277,834 7.1 313,057 7.5Actively employed in a field other than nursing full-time
141,583 4.1 126,445 3.4 89,956 2.3 88,155 2.1
Actively employed in a field other than nursing part-time
96,616 2.8 68,255 1.8 49,139 1.3 43,808 1.1
Actively employed in a field other than nursing per diem
42,379 1.2 30,298 0.8 21,702 0.6 18,832 0.5
Working in nursing only as a volunteer 66,996 1.9 45,288 1.2 52,374 1.3 51,660 1.2Unemployed, seeking work as a nurse 94,587 2.7 85,896 2.3 83,573 2.1 80,832 1.9Unemployed, not seeking work as a nurse 120,945 3.5 129,287 3.5 131,114 3.4 136,108 3.3Retired 393,014 11.3 400,613 10.8 398,871 10.2 482,003 11.6
Note. Respondents were asked to select all that apply.

S26 Journal of Nursing Regulation
FIGURE 8
Employment Status of Registered Nurses, 2013–2020
0 10 20 30 40 50 60 70 80
2020201720152013
Retired
Unemployed, not seeking work as a nurse
Unemployed, seeking work as a nurse
Working in nursing only as a volunteer
Actively employed, non-nursing per diem
Actively employed, non-nursing part time
Actively employed, non-nursing full time
Actively employed in nursing per diem
Actively employed in nursing part time
Actively employed in nursing full-time
Percentage of RN respondents
Em
plo
ymen
t st
atu
s
Note. Respondents were asked to select all that apply.
Reasons for Being Unemployed
Respondents were asked to select all the reasons for being unemployed. Taking care of home and family was the most frequently selected reason for being unemployed by 49.0% of respondents. The percentage of RNs who indicated they were unemployed because they expe-rienced difficulty in finding a nursing position was 14.6%, which is down from 15.4% in 2017. The percentage of RNs who indicated they were disabled was 10.7%, and 8.1% listed being in school as the reason for unemployment (Table 24 and Figure 9).
TABLE 24
Reasons for Unemployment of Registered Nurses, 2013–2020
Weighted Sample Values 2013 (n = 2,549.0) 2015 (n = 2,272.4) 2017 (n = 2,567.2) 2020 (n = 2,122.1)
n % n % n % n %Taking care of home and family 1258.7 49.4 1137.3 50.0 1226.8 47.8 1,039.5 49.0Disabled 486.2 19.1 298.5 13.1 347.6 13.5 226.4 10.7Inadequate salary 58.4 2.3 48.2 2.1 73.7 2.9 53.7 2.5School 195.4 7.7 143.1 6.3 186.0 7.2 172.2 8.1Difficulty in finding a nursing position 672.1 26.4 352.0 15.5 395.0 15.4 310.3 14.6Other 774.8 30.4 557.4 24.5 758.9 29.6 680.2 32.1
Note. Respondents were asked to answer this question only if they were unemployed. Respondents were asked to select all that apply.
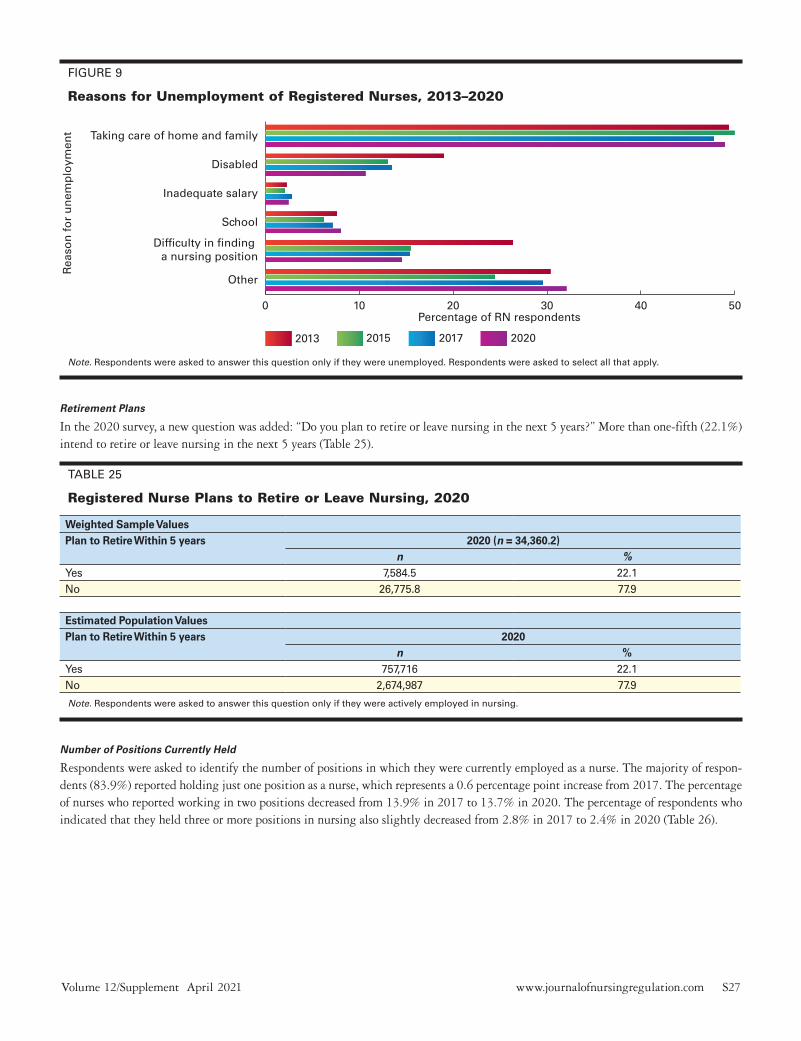
www.journalofnursingregulation.com S27Volume 12/Supplement April 2021
FIGURE 9
Reasons for Unemployment of Registered Nurses, 2013–2020
0 10 20 30 40 50
2020201720152013
Other
Dif�culty in �nding a nursing position
School
Inadequate salary
Disabled
Taking care of home and family
Percentage of RN respondents
Rea
son
fo
r u
nem
plo
ymen
t
Note. Respondents were asked to answer this question only if they were unemployed. Respondents were asked to select all that apply.
Retirement Plans
In the 2020 survey, a new question was added: “Do you plan to retire or leave nursing in the next 5 years?” More than one-fifth (22.1%) intend to retire or leave nursing in the next 5 years (Table 25).
TABLE 25
Registered Nurse Plans to Retire or Leave Nursing, 2020
Weighted Sample ValuesPlan to Retire Within 5 years 2020 (n = 34,360.2)
n %Yes 7,584.5 22.1No 26,775.8 77.9
Estimated Population ValuesPlan to Retire Within 5 years 2020
n %Yes 757,716 22.1No 2,674,987 77.9
Note. Respondents were asked to answer this question only if they were actively employed in nursing.
Number of Positions Currently Held
Respondents were asked to identify the number of positions in which they were currently employed as a nurse. The majority of respon-dents (83.9%) reported holding just one position as a nurse, which represents a 0.6 percentage point increase from 2017. The percentage of nurses who reported working in two positions decreased from 13.9% in 2017 to 13.7% in 2020. The percentage of respondents who indicated that they held three or more positions in nursing also slightly decreased from 2.8% in 2017 to 2.4% in 2020 (Table 26).
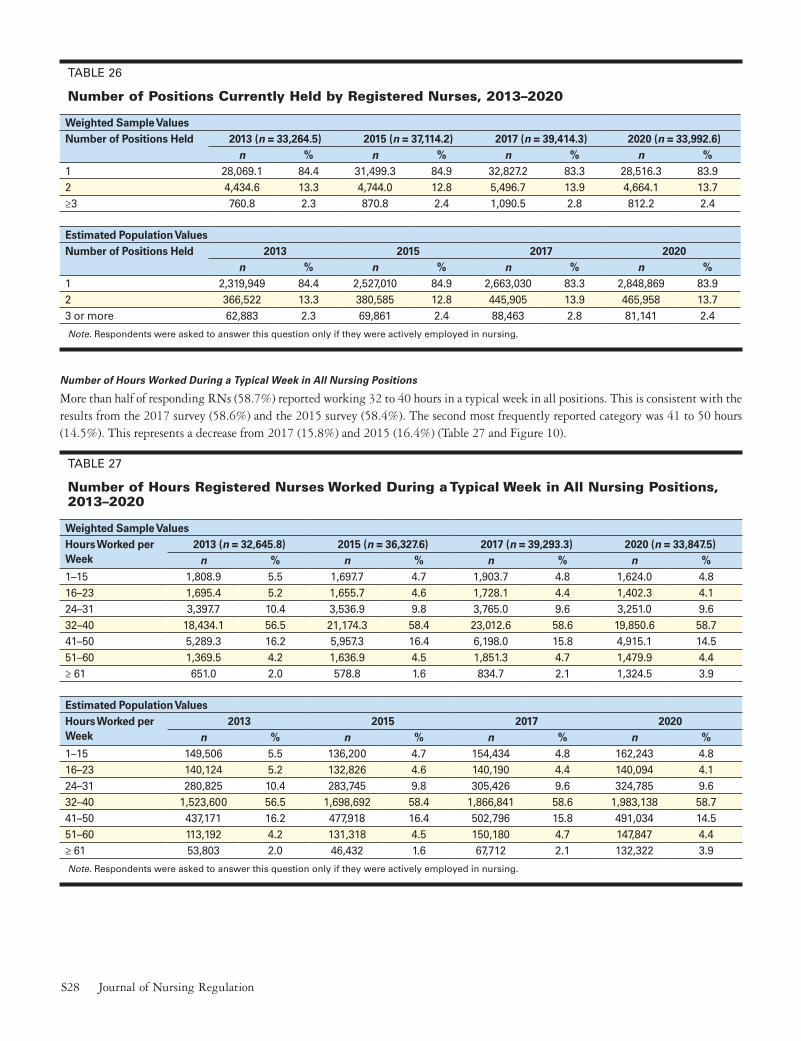
S28 Journal of Nursing Regulation
TABLE 26
Number of Positions Currently Held by Registered Nurses, 2013–2020
Weighted Sample ValuesNumber of Positions Held 2013 (n = 33,264.5) 2015 (n = 37,114.2) 2017 (n = 39,414.3) 2020 (n = 33,992.6)
n % n % n % n %1 28,069.1 84.4 31,499.3 84.9 32,827.2 83.3 28,516.3 83.92 4,434.6 13.3 4,744.0 12.8 5,496.7 13.9 4,664.1 13.7≥3 760.8 2.3 870.8 2.4 1,090.5 2.8 812.2 2.4
Estimated Population ValuesNumber of Positions Held 2013 2015 2017 2020
n % n % n % n %1 2,319,949 84.4 2,527,010 84.9 2,663,030 83.3 2,848,869 83.92 366,522 13.3 380,585 12.8 445,905 13.9 465,958 13.73 or more 62,883 2.3 69,861 2.4 88,463 2.8 81,141 2.4
Note. Respondents were asked to answer this question only if they were actively employed in nursing.
Number of Hours Worked During a Typical Week in All Nursing Positions
More than half of responding RNs (58.7%) reported working 32 to 40 hours in a typical week in all positions. This is consistent with the results from the 2017 survey (58.6%) and the 2015 survey (58.4%). The second most frequently reported category was 41 to 50 hours (14.5%). This represents a decrease from 2017 (15.8%) and 2015 (16.4%) (Table 27 and Figure 10).
TABLE 27
Number of Hours Registered Nurses Worked During a Typical Week in All Nursing Positions, 2013–2020
Weighted Sample ValuesHours Worked per Week
2013 (n = 32,645.8) 2015 (n = 36,327.6) 2017 (n = 39,293.3) 2020 (n = 33,847.5)n % n % n % n %
1–15 1,808.9 5.5 1,697.7 4.7 1,903.7 4.8 1,624.0 4.816–23 1,695.4 5.2 1,655.7 4.6 1,728.1 4.4 1,402.3 4.124–31 3,397.7 10.4 3,536.9 9.8 3,765.0 9.6 3,251.0 9.632–40 18,434.1 56.5 21,174.3 58.4 23,012.6 58.6 19,850.6 58.741–50 5,289.3 16.2 5,957.3 16.4 6,198.0 15.8 4,915.1 14.551–60 1,369.5 4.2 1,636.9 4.5 1,851.3 4.7 1,479.9 4.4≥ 61 651.0 2.0 578.8 1.6 834.7 2.1 1,324.5 3.9
Estimated Population ValuesHours Worked per Week
2013 2015 2017 2020n % n % n % n %
1–15 149,506 5.5 136,200 4.7 154,434 4.8 162,243 4.816–23 140,124 5.2 132,826 4.6 140,190 4.4 140,094 4.124–31 280,825 10.4 283,745 9.8 305,426 9.6 324,785 9.632–40 1,523,600 56.5 1,698,692 58.4 1,866,841 58.6 1,983,138 58.741–50 437,171 16.2 477,918 16.4 502,796 15.8 491,034 14.551–60 113,192 4.2 131,318 4.5 150,180 4.7 147,847 4.4≥ 61 53,803 2.0 46,432 1.6 67,712 2.1 132,322 3.9
Note. Respondents were asked to answer this question only if they were actively employed in nursing.
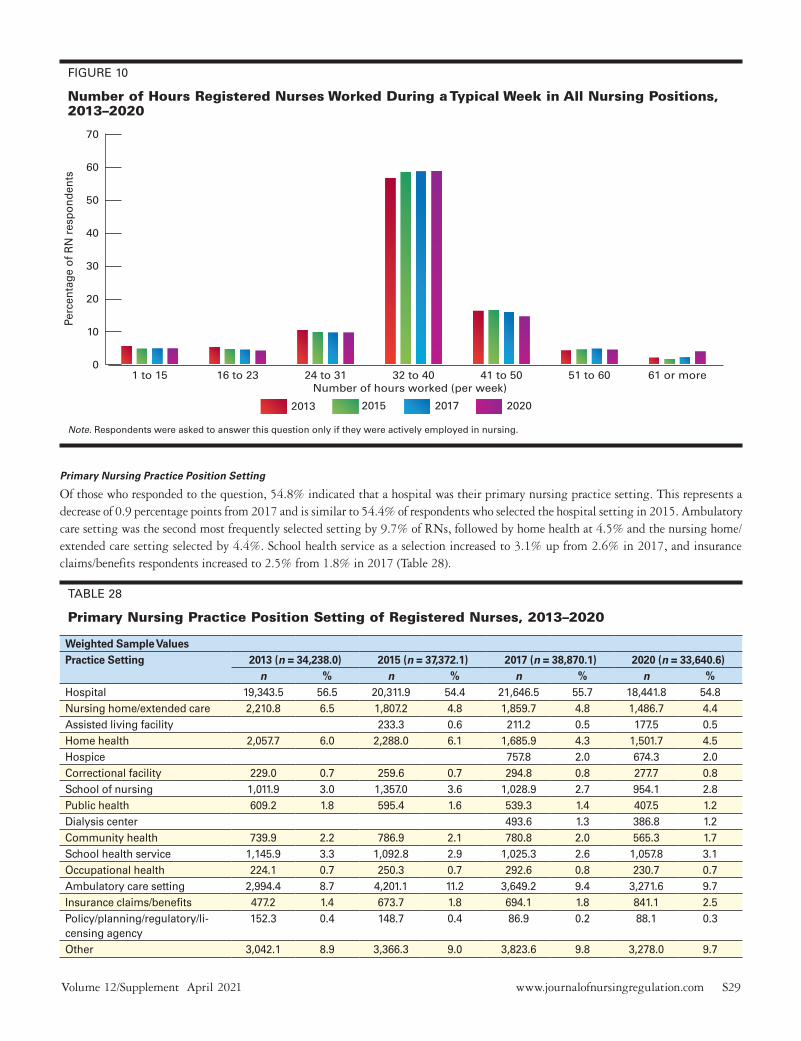
www.journalofnursingregulation.com S29Volume 12/Supplement April 2021
FIGURE 10
Number of Hours Registered Nurses Worked During a Typical Week in All Nursing Positions, 2013–2020
0
10
20
30
40
50
60
70
2020201720152013
61 or more51 to 6041 to 5032 to 4024 to 3116 to 231 to 15
Perc
enta
ge o
f RN
res
pond
ents
Number of hours worked (per week)
Note. Respondents were asked to answer this question only if they were actively employed in nursing.
Primary Nursing Practice Position Setting
Of those who responded to the question, 54.8% indicated that a hospital was their primary nursing practice setting. This represents a decrease of 0.9 percentage points from 2017 and is similar to 54.4% of respondents who selected the hospital setting in 2015. Ambulatory care setting was the second most frequently selected setting by 9.7% of RNs, followed by home health at 4.5% and the nursing home/extended care setting selected by 4.4%. School health service as a selection increased to 3.1% up from 2.6% in 2017, and insurance claims/benefits respondents increased to 2.5% from 1.8% in 2017 (Table 28).
TABLE 28
Primary Nursing Practice Position Setting of Registered Nurses, 2013–2020
Weighted Sample ValuesPractice Setting 2013 (n = 34,238.0) 2015 (n = 37,372.1) 2017 (n = 38,870.1) 2020 (n = 33,640.6)
n % n % n % n %Hospital 19,343.5 56.5 20,311.9 54.4 21,646.5 55.7 18,441.8 54.8Nursing home/extended care 2,210.8 6.5 1,807.2 4.8 1,859.7 4.8 1,486.7 4.4Assisted living facility 233.3 0.6 211.2 0.5 177.5 0.5Home health 2,057.7 6.0 2,288.0 6.1 1,685.9 4.3 1,501.7 4.5Hospice 757.8 2.0 674.3 2.0Correctional facility 229.0 0.7 259.6 0.7 294.8 0.8 277.7 0.8School of nursing 1,011.9 3.0 1,357.0 3.6 1,028.9 2.7 954.1 2.8Public health 609.2 1.8 595.4 1.6 539.3 1.4 407.5 1.2Dialysis center 493.6 1.3 386.8 1.2Community health 739.9 2.2 786.9 2.1 780.8 2.0 565.3 1.7School health service 1,145.9 3.3 1,092.8 2.9 1,025.3 2.6 1,057.8 3.1Occupational health 224.1 0.7 250.3 0.7 292.6 0.8 230.7 0.7Ambulatory care setting 2,994.4 8.7 4,201.1 11.2 3,649.2 9.4 3,271.6 9.7Insurance claims/benefits 477.2 1.4 673.7 1.8 694.1 1.8 841.1 2.5Policy/planning/regulatory/li-censing agency
152.3 0.4 148.7 0.4 86.9 0.2 88.1 0.3
Other 3,042.1 8.9 3,366.3 9.0 3,823.6 9.8 3,278.0 9.7

S30 Journal of Nursing Regulation
Estimated Population ValuesPrimary Practice Setting 2013 2015 2017 2020
n % n % n % n %Hospital 1,598,768 56.5 1,629,506 54.4 1,756,021 55.7 1,842,394 54.8Nursing home/extended care 182,724 6.5 144,982 4.8 150,865 4.8 148,526 4.4Assisted living facility 18,718 0.6 17,132 0.5 17,733 0.5Home health 170,069 6.0 183,553 6.1 136,765 4.3 150,025 4.5Hospice 61,471 2.0 67,365 2.0Correctional facility 18,930 0.7 20,828 0.7 23,918 0.8 27,743 0.8School of nursing 83,637 3.0 108,863 3.6 83,466 2.7 95,318 2.8Public health 50,354 1.8 47,763 1.6 43,748 1.4 40,711 1.2Dialysis center 40,040 1.3 38,643 1.2Community health 61,150 2.2 63,128 2.1 63,337 2.0 56,475 1.7School health service 94,708 3.3 87,666 2.9 83,178 2.6 105,678 3.1Occupational health 18,519 0.7 20,080 0.7 23,736 0.8 23,048 0.7Ambulatory care setting 247,495 8.7 337,028 11.2 296,030 9.4 326,843 9.7Insurance claims/benefits 39,445 1.4 54,046 1.8 56,306 1.8 84,029 2.5Policy/planning/regulatory/li-censing agency
12,586 0.4 11,930 0.4 7,050 0.2 8,801 0.3
Other 251,438 8.9 270,057 9.0 310,178 9.8 327,483 9.7
Note. Respondents were asked to answer this question only if they were actively employed in nursing.
FIGURE 11
Primary Nursing Practice Position Setting of Registered Nurses, 2013–2020
0 10 20 30 40 50 60
2020201720152013
Other
Policy/planning/regulatory/licensing agency
Insurance claims/bene�ts
Ambulatory care setting
Occupational health
School health service
Community health
Dialysis center
Public health
School of nursing
Correctional facility
Hospice
Home health
Assisted living facility
Nursing home/extended care
Hospital
Percentage of RN respondents
Prim
ary
prac
tice
setti
ng
Note. Respondents were asked to answer this question only if they were actively employed in nursing.

www.journalofnursingregulation.com S31Volume 12/Supplement April 2021
Primary Nursing Position Title
Staff nurse was indicated as the title that most closely corresponds to respondents’ primary nursing position and was selected by 60.1% of respondents, up from 58.0% in 2017. “Other—health related” was the next most frequently selected position by 9.7% of respondents. The APRN title decreased from 10.1% in 2017 to 6.3% in 2020. Between 2013 and 2020, there was a 3.1% decrease in respondents who indicated that their primary practice position was nurse manager. RNs selecting case manager as their primary position (7.4%) was an increase from what was reported in 2017 (6.4%). The percentage of respondents who selected nurse faculty/educator increased slightly from 4.0% in 2017 to 4.1% in 2020. Each of the remaining positions were selected by less than 2% of the responding nurses. Additionally, 0.5% selected “other—not health related” (Table 29 and Figure 12).
TABLE 29
Primary Nursing Position Title of Registered Nurses, 2013–2020
Weighted Sample ValuesPrimary Title 2013 (n = 34,356.6) 2015 (n = 37,711.1) 2017 (n = 39,063.1) 2020 (n = 33,713.7)
n % n % n % n %Consultant 772.5 2.2 672.4 1.8 577.4 1.5 531.7 1.6Nurse researcher 251.3 0.7 247.2 0.7 235.9 0.6 155.6 0.5Nurse executive 834.4 2.4 881.4 2.3 725.3 1.9 647.7 1.9Nurse manager 3,792.0 11.0 3,045.8 8.1 3,126.2 8.0 2,673.3 7.9Nurse faculty/educator 1,105.4 3.2 1,422.2 3.8 1,558.2 4.0 1,392.5 4.1Advanced practice registered nurse 2,531.4 7.4 3,069.1 8.1 3,946.1 10.1 2,130.2 6.3Staff nurse 21,902.1 63.7 21,920.7 58.1 22,673.0 58.0 20,265.9 60.1Case manager 2,524.8 6.7 2,519.2 6.4 2,485.3 7.4Other—health related 3,068.9 8.9 3,685.1 9.8 3,561.9 9.1 3,277.4 9.7Other—not health related 98.7 0.3 242.5 0.6 139.7 0.4 154.2 0.5
Estimated Population ValuesTitle 2013 2015 2017 2020
n % n % n % n %Consultant 63,846 2.2 53,944 1.8 46,844 1.5 53,119 1.6Nurse researcher 20,770 0.7 19,830 0.7 19,139 0.6 15,545 0.5Nurse executive 68,962 2.4 70,706 2.3 58,836 1.9 64,707 1.9Nurse manager 313,418 11.0 244,343 8.1 253,609 8.0 267,071 7.9Nurse faculty/educator 91,360 3.2 114,099 3.8 126,408 4.0 139,115 4.1Advanced practice registered nurse 209,222 7.4 246,214 8.1 320,121 10.1 212,814 6.3Staff nurse 1,810,238 63.7 1,758,573 58.1 1,839,294 58.0 2,024,628 60.1Case manager 202,546 6.7 204,368 6.4 248,289 7.4Other—health related 253,647 8.9 295,637 9.8 288,950 9.1 327,423 9.7Other—not health related 8,155 0.3 19,453 0.6 11,332 0.4 15,405 0.5
Note. Respondents were asked to answer this question only if they were actively employed in nursing.

S32 Journal of Nursing Regulation
FIGURE 12
Primary Nursing Position Title of Registered Nurses, 2013–2020
0 10 20 30 40 50 60 70 80
2020201720152013
Other–not-health related
Other–health related
Case manager
Staff nurse
Advanced practice registered nurse
Nurse faculty/educator
Nurse manager
Nurse executive
Nurse researcher
Consultant
Percentage of RN respondents
Prim
ary
nu
rsin
g t
itle
Note. Respondents were asked to answer this question only if they were actively employed in nursing.

www.journalofnursingregulation.com S33Volume 12/Supplement April 2021
Primary Nursing Position Specialty
In the 2017 survey, secondary practice specialties were modified. Categories now include adult and family health, cardiology, other—clini-cal, and other—nonclinical specialties.
In 2020, 13.4% of RNs reported their primary practice specialty was acute care/critical care compared to 14.0% in 2017. The second most frequently selected specialty was medical-surgical at 8.5%, down from 8.6% of RN respondents who selected this specialty in 2017. Perioperative was the third most frequently selected specialty by 6.7% of respondents, up from 5.8% in 2017. RNs selecting other specialties (13.1%) represented an increase from 12.0% in 2017 (Table 30 and Figure 13).
TABLE 30
Primary Nursing Position Specialty of Registered Nurses, 2013–2020
Weighted Sample ValuesPrimary Specialty 2013 (n = 33,516.5) 2015 (n = 36,424.1) 2017 (n = 37,484.3) 2020 (n = 32,364.8)
n % n % n % n %Acute care/critical care 5,789.0 17.3 4,159.1 11.4 5,239.2 14.0 4,338.5 13.4Adult health 871.9 2.6 756.1 2.1 1,447.1 3.9 1,172.9 3.6Family health 1,243.4 3.3 801.2 2.5Anesthesia 654.3 2.0 549.9 1.5 705.5 1.9 379.4 1.2Cardiology 1,291.0 3.4 1,086.0 3.4Community 335.0 1.0 356.7 1.0 386.6 1.0 300.9 0.9Geriatric/gerontology 1,988.8 5.9 1,754.7 4.8 1,918.5 5.1 1,614.2 5.0Home health 1,515.3 4.5 1,604.0 4.4 1,360.1 3.6 1,226.1 3.8Maternal-child health/obstetrics 1,662.2 5.0 1,633.9 4.5 1,778.1 4.7 1,422.3 4.4Medical surgical 4,248.6 12.7 3,695.7 10.1 3,203.1 8.6 2,757.8 8.5Nephrology 476.4 1.3 555.7 1.5 500.7 1.6Occupational health 333.4 1.0 280.7 0.8 339.8 0.9 314.4 1.0Oncology 952.7 2.8 1,044.0 2.9 1,046.9 2.8 955.9 3.0Palliative care/hospice 498.9 1.5 529.1 1.5 643.3 1.7 522.2 1.6Pediatrics 1,995.8 6.0 1,570.3 4.3 1,774.1 4.7 1,345.9 4.2Neonatal 808.4 2.2 809.5 2.2 725.4 2.2Perioperative 2,195.7 6.0 2,187.7 5.8 2,173.2 6.7Public health 510.6 1.5 466.0 1.3 472.3 1.3 428.9 1.3Psychiatric/mental health/substance abuse 1,340.5 4.0 1,418.4 3.9 1,534.1 4.1 1,206.8 3.7Rehabilitation 691.4 2.1 717.3 2.0 725.4 1.9 541.4 1.7School health 1,097.2 3.3 1,025.1 2.8 945.5 2.5 980.0 3.0Emergency/trauma 566.0 1.7 2,026.7 5.6 2,027.3 5.4 1,818.4 5.6Women’s health 651.3 1.9 651.7 1.8 567.1 1.5 490.5 1.5Other—clinical specialties 4,507.7 12.0 4,229.5 13.1Other—nonclinical specialties 775.1 2.1 1,032.1 3.2Other 6,568.4 19.6 6,200.8 17.0 Primary care 1,340.5 2.6 1,092.5 3.0 Genetics 40.6 0.1 Informatics 318.2 0.9 Neurology/neurosurgical 337.1 0.9 Orthopedic 436.1 1.2 Radiology 191.2 0.5 Urology 87.5 0.2 Telehealth 288.5 1.2
Note. Respondents were asked to answer this question only if they were actively employed in nursing.

S34 Journal of Nursing Regulation
FIGURE 13
Primary Nursing Position Specialty of Registered Nurses, 2013–2020
0 5 10 15 20 25
2020201720152013
Women’s health
Emergency/trauma
School health
Rehabilitation
Psychiatric/mental health/substance abuse
Public health
Perioperative
Neonatal
Pediatrics
Palliative care/hospice
Other
Oncology
Occupational health
Nephrology
Medical-surgical
Maternal-child health/obstetrics
Home health
Geriatric/gerontology
Community
Cardiology
Anesthesia
Family health
Adult health
Acute care/critical care
Percentage of RN respondents
Prim
ary
nu
rsin
g s
pec
ialt
y
Note. Respondents were asked to answer this question only if they were actively employed in nursing.
(continued)

www.journalofnursingregulation.com S35Volume 12/Supplement April 2021
Providing Direct Patient Care—Primary Nursing Position
A new question was added to the 2020 survey regarding direct patient care. Survey respondents were asked, “In your primary nursing practice position, do you spend the majority of your time providing direct patient care?” More than two-thirds (68.6%) responded “yes” (Table 31).
TABLE 31
Registered Nurses Providing Direct Patient Care—Primary Nursing Position, 2020
Weighted Sample ValuesDirect Patient Care 2020 (n = 34,080.7)
n %Yes 23,391.8 68.6No 10,688.9 31.4
Estimated Population Values
Direct Patient Care 2020
n %Yes 2,336,915 68.6No 1,067,855 31.4
Note. Respondents were asked to answer this question only if they were actively employed in nursing.
Secondary Nursing Practice Position Setting of Registered Nurses
More than one-third of RN respondents (36.7%) identified their secondary nursing practice position setting as being in a hospital, which has been consistent during the past three surveys. The second most frequently selected setting for secondary nursing positions was ambulatory care (9.6%) followed by school of nursing (8.7%), home health (8.4%), and nursing home/extended care (7.1%) (Table 32 and Figure 14).
TABLE 32
Secondary Nursing Practice Position Setting of Registered Nurses, 2013–2020
Weighted Sample ValuesSecondary Practice Setting 2013 (n = 4,415.5) 2015 (n = 4,877.3) 2017 (n = 6,153.3) 2020 (n = 5,121.6)
n % n % n % n %Hospital 1,061.5 24.0 1,632.6 33.5 2,213.4 36.0 1,879.1 36.7Nursing home/extended care 502.9 11.4 277.2 5.7 456.7 7.4 363.8 7.1Assisted living facility 58.9 1.2 58.4 1.0 58.3 1.1Home health 560.5 12.7 577.5 11.8 555.7 9.0 430.1 8.4Hospice 185.9 3.0 139.3 2.7Correctional facility 52.1 1.2 72.2 1.5 68.3 1.1 46.2 0.9School of nursing 439.7 10.0 519.7 10.7 493.6 8.0 446.2 8.7Public health 66.8 1.5 38.1 0.8 89.2 1.5 68.9 1.3Dialysis center 87.7 1.4 54.7 1.1Community health 188.0 4.3 191.1 3.9 209.6 3.4 121.6 2.4School health service 191.3 4.3 171.7 3.5 173.0 2.8 113.2 2.2Occupational health 90.2 2.0 39.0 0.8 57.1 0.9 36.3 0.7Ambulatory care setting 506.7 11.5 451.2 9.3 556.7 9.1 492.6 9.6Insurance claims/benefits 38.8 0.9 39.4 0.8 51.7 0.8 44.1 0.9Policy/planning/regulatory/licensing agency 19.0 0.4 6.1 0.1 7.1 0.1 22.5 0.4Other 698.0 15.8 802.5 16.5 889.3 14.5 806.9 15.8

S36 Journal of Nursing Regulation
FIGURE 14
Secondary Nursing Practice Position Setting of Registered Nurses, 2013–2020
0 5 10 15 20 25 30 35 40
2020201720152013
Other
Policy/planning/regulatory/licensing agency
Insurance claims/bene�ts
Ambulatory care setting
Occupational health
School health service
Community health
Dialysis center
Public health
School of nursing
Correctional facility
Hospice
Home health
Assisted living facility
Nursing home/extended care
Hospital
Percentage of RN respondents
Sec
on
dar
y p
ract
ice
sett
ing
Note. Respondents were asked to answer this question only if they were actively employed in nursing.

www.journalofnursingregulation.com S37Volume 12/Supplement April 2021
Secondary Nursing Position Title
The most frequently selected position title that corresponds to secondary nursing practice position was staff nurse at 57.6%, up from 55.8% in 2017, followed by nurse faculty/educator at 10.8%. APRN respondents were at 8.7%, down from 12.1% in the 2017 survey. Respondents who selected the “other—health related” category were at 9.7%, similar to the past two surveys (Table 33 and Figure 15).
TABLE 33
Secondary Nursing Practice Position Title of Registered Nurses, 2013–2020
Weighted Sample ValuesSecondary Title 2013 (n = 5,370.9) 2015 (n = 4,857.8) 2017 (n = 6,145.9) 2020 (n = 5,080.8)
n % n % n % n %Consultant 244.2 4.6 216.0 4.5 201.2 3.3 165.6 3.3Nurse researcher 41.6 0.8 28.9 0.6 36.2 0.6 21.9 0.4Nurse executive 77.0 1.4 46.6 1.0 34.6 0.6 40.3 0.8Nurse manager 301.1 5.6 143.2 3.0 235.4 3.8 196.2 3.9Nurse faculty/educator 469.4 8.7 482.0 9.9 601.5 9.8 547.0 10.8Advanced practice registered nurse 520.6 9.7 521.8 10.7 743.0 12.1 443.9 8.7Staff nurse 3,050.7 56.8 2,767.9 57.0 3,430.8 55.8 2,924.9 57.6Case manager 157.8 3.4 256.3 4.2 205.5 4.1Other—health related 628.1 11.7 475.0 9.8 573.7 9.3 490.2 9.7Other—not health related 38.1 0.7 18.6 0.4 33.3 0.5 45.3 0.9
Note. Respondents were asked to answer this question only if they were actively employed in nursing.
FIGURE 15
Secondary Nursing Practice Position Title of Registered Nurses, 2013–2020
0 10 20 30 40 50 60
2020201720152013
Other-non-health related
Other-health related
Case manager
Staff nurse
Advanced practice registered nurse
Nurse faculty/educator
Nurse manager
Nurse executive
Nurse researcher
Consultant
Percentage of RN respondents
Sec
on
dar
y n
urs
ing
tit
le
Note. Respondents were asked to answer this question only if they were actively employed in nursing.

S38 Journal of Nursing Regulation
Secondary Nursing Position Specialty
Acute care/critical care was the highest reported specialty for the secondary nursing position (10.7%), followed by the medical surgical specialty (7.7%) and the geriatric/gerontology specialty (7.3%) (Table 34 and Figure 16).
TABLE 34
Secondary Nursing Practice Position Specialty of Registered Nurses, 2013–2020
Weighted Sample ValuesSecondary Specialty 2013 (n = 5,285.6) 2015 (n = 4,791.1) 2017 (n = 5,895.2) 2020 (n = 4,887.2)
n % n % n % n %Acute care/critical care 673.1 12.7 386.2 8.1 602.6 10.2 523.2 10.7Adult health 187.5 3.6 124.7 2.6 309.0 5.2 229.6 4.7Family health 149.1 2.5 116.7 2.4Anesthesia 115.2 2.2 76.2 1.6 161.2 2.7 95.1 2.0Cardiology 119.8 2.0 97.0 2.0Community 120.5 2.3 72.1 1.5 116.2 2.0 69.4 1.4Geriatric/gerontology 421.1 8.0 295.7 6.2 433.2 7.4 355.0 7.3Home health 414.2 7.8 404.4 8.4 378.9 6.4 332.9 6.8Maternal-child health/obstetrics 234.4 4.4 182.8 3.8 168.7 2.9 133.4 2.7Medical surgical 485.9 9.2 324.5 6.8 451.5 7.7 360.6 7.4Nephrology 37.9 0.8 112.6 1.9 40.8 0.8Occupational health 86.4 1.6 44.2 0.9 59.0 1.0 36.2 0.7Oncology 83.4 1.6 37.5 0.8 66.6 1.1 55.1 1.1Palliative care/hospice 83.6 1.6 55.9 1.2 140.7 2.4 91.1 1.9Pediatrics 243.0 4.6 219.6 4.6 242.7 4.1 226.8 4.6Neonatal 87.5 1.8 86.3 1.5 58.9 1.2Perioperative 227.1 4.7 269.8 4.6 222.1 4.5Public health 81.0 1.5 46.2 1.0 87.4 1.5 69.5 1.4Psychiatric/mental health/sub-stance abuse
237.8 4.5 265.7 5.5 317.4 5.4 266.2 5.5
Rehabilitation 121.5 2.3 109.7 2.3 150.3 2.6 119.8 2.5School health 200.0 3.8 177.7 3.7 146.0 2.5 123.7 2.5Emergency/trauma 98.1 1.9 291.5 6.1 375.1 6.4 290.8 6.0Women’s health 68.0 1.3 53.1 1.1 79.8 1.4 60.3 1.2Other—clinical specialties 714.4 12.1 744.6 15.2Other—nonclinical specialties 156.9 2.7 168.4 3.5Other 1155.4 21.9 1,033.7 21.6 Primary care 134.7 2.6 144.7 3.0 Genetics 11.0 0.2 Informatics 20.0 0.4 Neurology/neurosurgical 21.0 0.4 Orthopedic 21.5 0.5 Radiology 13.9 0.3 Urology 5.2 0.1 Telehealth 40.9 0.8
Note. Respondents were asked to answer this question only if they were actively employed in nursing.

www.journalofnursingregulation.com S39Volume 12/Supplement April 2021
FIGURE 16
Secondary Nursing Practice Position Specialty of Registered Nurses, 2013–2020
0 5 10 15 20 25 30
2020201720152013
Other
Women’s Health
Emergency/trauma
School health
Rehabilitation
Psychiatric/mental health/substance abuse
Public health
Perioperative
Neonatal
Pediatrics
Palliative care/hospice
Oncology
Occupational health
Nephrology
Medical-surgical
Maternal-child health/obstetrics
Home health
Geriatric/gerontology
Community
Cardiology
Anesthesia
Family health
Adult health
Acute care/critical care
Sec
on
dar
y n
urs
ing
sp
ecia
lty
Percentage of RN respondents
Note. Respondents were asked to answer this question only if they were actively employed in nursing.

S40 Journal of Nursing Regulation
Providing Direct Patient Care—Secondary Nursing Practice Position
A new question was added to the 2020 survey regarding direct patient care. Survey respondents were asked, “In your secondary nursing practice position, do you spend the majority of your time providing direct patient care?” Nearly three-fourths (72.0%) responded “yes” (Table 35).
TABLE 35
Providing Direct Patient Care—Secondary Nursing Position of Registered Nurses, 2020
Weighted Sample Values2020 (n = 5,076.1)
n %Yes 3,653.3 72.0No 1,422.7 28.0
Note. Respondents were asked to answer this question only if they were actively employed in nursing.
Salary/Earnings
2020 Pretax Annual Earnings From Primary Nursing Position
The median pretax annual earnings for responding RNs have slowly increased from $60,000 in 2015 to $70,000 in 2020. This consti-tutes a 3.3% simple annual growth in earnings during the 5-year period. Categorically, the percentage of respondents earning less than $40,000 annually decreased by 0.4 percentage points, the percentage making between $40,000 and $60,000 decreased by 3.9 percentage points in 2020 from 2017. The percentage of respondents in categories earning more than $60,000 per year all saw small increases in 2020 from 2017 (1.3% for those between $60,000 to $80,000, 1.2% for those earning more than $80,000 but less than $100,000, and 1.8% in those earning more than $100,000) (Table 36 and Figure 17).
TABLE 36
Annual Earnings of Registered Nurses, 2015–2020
Weighted Sample ValuesAnnual Earnings 2015 (n = 32,455.7) 2017 (n = 35,745.6) 2020 (n = 29,453.8)
n % n % n %< $40,000 4,711.3 14.5 4,217.8 11.8 3,355.6 11.4$40,000 to < $60,000 8,436.8 26.0 8,243.4 23.1 5,639.5 19.2$60,000 to < $80,000 9,202.0 28.4 10,213.3 28.6 8,808.0 29.9$80,000 to < $100,000 5,279.8 16.3 6,386.3 17.9 5,617.0 19.1≥ $100,000 or more 4,825.7 14.9 6,684.8 18.7 6,033.8 20.5
Estimated Population ValuesAnnual Earnings 2015 2017 2020
n % n % n %< $40,000 377,964 14.5 342,160 11.8 335,235 11.4$40,000 to < $60,000 676,837 26.0 668,729 23.1 563,404 19.2$60,000 to < $80,000 738,224 28.4 828,530 28.6 879,947 29.9$80,000 to < $100,000 423,568 16.3 518,071 17.9 561,156 19.1≥ $100,000 387,136 14.9 542,292 18.7 602,796 20.5
Note. Respondents were asked to answer this question only if they were actively employed in nursing. Salary includes overtime and bonuses but does not include sign-on bonuses.

www.journalofnursingregulation.com S41Volume 12/Supplement April 2021
FIGURE 17
Annual Earnings of Registered Nurses, 2015–2020
0
5
10
15
20
25
30
202020172015
$100,000 or more$80,000 to less than $100,000
$60,000 to less than $80,000
$40,000 to less than $60,000
Less than $40,000
Perc
enta
ge
of
RN
res
po
nd
ents
Note. Respondents were asked to answer this question only if they were actively employed in nursing. Salary includes overtime and bonuses but does not include sign-on bonuses.
Earnings by Gender and Specialty
Looking across all the specialties, the specialty with the highest median salary remains anesthesia ($170,000 overall). Across nearly all specialties, men have a higher median salary than women. In 2017, the only specialty where women reported higher earnings was oncol-ogy. In 2020, women reported higher median earnings in the specialties of nephrology, palliative care/hospice, and rehabilitation. Of note, out of 23 specialties (not including the “other” categories), 16 reported a drop in median incomes at an average of –$3,200 since 2017. Greater-than-average drops in reported median income occurred in family health (–$9,250), maternal-child health/obstetrics (–$4,000), pediatrics (–$5,000), neonatal (–$5,250), and women’s health (–$7,425) (Table 37).
TABLE 37
Median Annual Earnings by Gender and Specialty of Registered Nurses, 2020
Specialty Male Female Other Totaln Earnings n Earnings n Earnings n Total
Acute care/critical care 523 $75,000 3,109 $70,000 1 $60,000 3,633 $71,000Adult health 74 $80,130 909 $74,000 983 $74,000Family health 53 $94,000 863 $75,000 916 $75,000Anesthesia 128 $184,500 237 $160,000 365 $170,000Cardiology 96 $83,836 815 $69,000 911 $70,000Community 22 $77,134 260 $67,040 282 $68,578Geriatric/gerontology 92 $70,850 1,455 $65,000 2 $68,240 1,549 $66,000Home health 75 $73,000 978 $65,000 2 $38,413 1,055 $65,000Maternal-child health/obstetrics 4 $64,500 1,251 $64,000 2 $74,000 1,257 $64,000Medical-surgical 206 $65,000 2,219 $62,000 1 $75,000 2,426 $62,000Nephrology 63 $70,000 379 $74,000 1 $71,721 443 $73,000Occupational health 21 $99,500 259 $76,000 1 $88,000 281 $78,000Oncology 36 $75,468 784 $70,000 820 $70,000Palliative care/hospice 29 $70,000 435 $70,000 1 $76,000 465 $70,000Pediatrics 50 $77,000 1,115 $62,000 1 $20,587 1,166 $62,000Neonatal 7 $80,000 586 $66,800 1 $690,000 594 $67,750
(continued)

S42 Journal of Nursing Regulation
Specialty Male Female Other Totaln Earnings n Earnings n Earnings n Total
Perioperative 142 $78,700 1,693 $68,640 1,835 $70,000Public health 27 $80,000 384 $60,951 411 $62,180Psychiatric/mental health/substance abuse 175 $75,000 926 $70,000 2 $109,000 1,103 $71,000Rehabilitation 33 $64,400 388 $65,000 421 $65,000School health 14 $67,000 789 $50,000 803 $50,000Emergency/trauma 256 $77,500 1,220 $69,000 3 $72,000 1,479 $70,000Women’s health 1 $120,000 441 $62,150 442 $62,575Other—clinical specialties 251 $81,000 3,605 $70,000 2 $45,500 3,858 $71,000Other—nonclinical specialties 63 $88,000 892 $77,000 955 $78,000Total 2,441 $78,000 25,992 $68,291 20 $71,861
Note. Respondents were asked to answer this question only if they were actively employed in nursing. Salary includes overtime and bonuses but does not include sign-on bonuses.
Earnings by Highest Education
As expected, higher-level degrees result in increases in median earnings, with those reporting DNP as their highest degree receiving the highest earnings. Overall, reported earnings by education category have dropped by an average of $3,700 since 2017. Respondents with a diploma report a decrease of $7,900 in median earnings since 2017. Other decreases include those with an associate degree ($2,000), bac-calaureate degree ($1,000), master’s degree ($5,000), doctoral degree - PhD ($6,400), and doctoral degree - DNP ($4,000). Respondents with a doctoral degree in other nursing reported no change in median earnings since 2017 (Table 38).
TABLE 38
Median Annual Earnings of Registered Nurses by Highest Education, 2017 and 2020
Highest Education 2017 2020n Earnings n Earnings
Diploma 1,358 $72,900 1,318 $65,000Associate degree 8,303 $65,000 8,308 $63,000Baccalaureate degree 12,714 $68,000 14,964 $67,000Master’s degree 4,999 $95,000 4,617 $90,000Doctoral degree—PhD 200 $100,000 209 $93,600Doctoral degree—DNP 413 $104,000 519 $100,000Doctoral degree—nursing other 37 $96,000 40 $96,000
Note. Respondents were asked to answer this question only if they were actively employed in nursing. Salary includes overtime and bonuses but does not include sign-on bonuses. In the 2013 and 2015 surveys, a single question, “What is your highest level of education?” was asked with the set of pos-sible responses including both nursing and non-nursing degrees. The degree types were separated for the 2017 and 2020 surveys. PhD = doctor of phi-losophy; DNP = doctor of nursing practice.
Earnings by State
Since 2015, median earnings have risen in all states. States with the highest median earnings for RNs continue to be California ($90,000), Hawaii ($90,000), New York ($80,000), Oregon ($80,000), and Washington ($80,000). The following states with the lowest median earnings have also remained unchanged over time: South Dakota ($62,000), Iowa ($63,000), Kansas, and North Dakota ($65,000). Despite no changes in the rankings by state, the states with the lowest reported median earnings reported much higher increases in earnings over time since 2015 than the states with the largest reported median earnings. The lowest ranked states reported an average increase in annual earnings of 4.2% since 2015. While the states with the highest reported annual earnings averaged an increase of just 1.4 percentage points in reported earnings during the same period. The states with the highest increase in median wages since 2015 are Indiana (6.0%), Utah (5.7%), Tennessee (5.5%), Nebraska (5.2%), and Virginia (5.0%). Also, of note, the Northern Mariana Islands saw the highest increase (14.3%) in reported median earnings since 2015 (Table 39).

www.journalofnursingregulation.com S43Volume 12/Supplement April 2021
TABLE 39
Median Annual Earnings in Primary Nursing Position by State(s) Where Registered Nurses Are Currently Practicing, 2015–2020
State/Jurisdiction 2015 2017 2020Alabama $55,000 $60,000 $68,000Alaska $70,000 $76,000 $79,000Arizona $69,000 $70,500 $75,000Arkansas $56,000 $61,605 $68,000California $90,000 $88,000 $90,000Colorado $63,000 $65,000 $74,030Connecticut $75,000 $75,000 $80,000Delaware $71,000 $71,900 $75,000District of Columbia $75,000 $79,000 $80,000Florida $60,000 $65,500 $72,000Georgia $64,000 $68,000 $75,000Hawaii $82,000 $85,000 $90,000Idaho $60,000 $62,000 $70,000Illinois $65,000 $67,000 $73,169Indiana $53,000 $64,000 $69,000Iowa $51,662 $58,000 $63,000Kansas $54,000 $64,000 $65,000Kentucky $60,000 $64,000 $68,000Louisiana $60,000 $65,000 $68,000Maine $60,000 $63,000 $68,800Maryland $70,000 $74,466 $78,000Massachusetts $75,633 $76,000 $79,655Michigan $60,000 $67,000 $73,000Minnesota $64,870 $66,000 $74,000Mississippi $58,000 $60,000 $68,000Missouri * * $68,640Montana $58,000 $60,000 $66,000
State/Jurisdiction 2015 2017 2020Nebraska $54,000 $60,000 $68,000Nevada $72,000 $77,000 $78,000New Hampshire $64,000 $66,500 $75,000New Jersey $76,000 $75,915 $80,000New Mexico $62,000 $69,500 $73,000New York $77,000 $80,000 $80,000North Carolina $58,890 $61,000 $69,000North Dakota $54,000 $60,000 $65,000Ohio $58,000 $65,000 $70,000Oklahoma $58,326 $64,000 $70,000Oregon $75,000 $80,000 $80,000Pennsylvania $62,000 $70,000 $75,000Rhode Island $70,000 $70,000 $77,400South Carolina $57,000 $64,000 $69,609South Dakota $51,000 $54,000 $62,000Tennessee $55,000 $62,000 $70,000Texas $68,700 $72,000 $75,000Utah $53,000 $65,000 $68,000Vermont $62,000 $61,000 $73,492Virginia $60,000 $69,000 $75,000Washington $70,000 $75,000 $80,000West Virginia $55,000 $62,000 $68,000Wisconsin $60,000 $63,000 $70,500Wyoming $64,000 $65,000 $70,000Guam $52,000 $60,000 $61,604Northern Mariana Islands
$35,000 $41,600 $60,000
Note. Respondents were asked to answer this question only if they were actively employed in nursing. Salary includes overtime and bonuses but does not include sign-on bonuses.
*Missouri did not participate in the 2015 and 2017 surveys.

S44 Journal of Nursing Regulation
Earnings by Years Licensed and Age
Median annual wages increase with both experience and age; however, wage increases are more dependent on experience than age (Table 40).
TABLE 40
Median Annual Earnings of Registered Nurses by Years Licensed and Age, 2020
Age in Years
Number of Years Licensed0–1 2–5 6–10 ≥ 11 Total
n Earnings n Earnings n Earnings n Earnings n Earnings19-29 555 $49,000 1,780 $58,573 455 $60,000 8 $55,000 2,798 $56,00030-34 166 $50,000 814 $60,000 1,754 $65,000 410 $65,000 3,144 $62,00035-39 102 $50,000 523 $60,000 913 $68,000 1,646 $70,000 3,184 $66,00040-44 74 $51,708 347 $60,000 576 $67,000 1,894 $74,767 2,891 $70,00045-49 47 $54,000 210 $62,200 402 $70,500 2,212 $76,000 2,871 $74,00050-54 21 $57,300 172 $64,329 363 $70,000 2,444 $78,000 3,000 $75,00055-59 11 $48,000 81 $62,400 208 $65,500 3,207 $79,000 3,507 $77,00060-64 2 $66,000 24 $62,500 118 $69,500 3,448 $76,000 3,592 $75,000≥ 65 9 $70,000 25 $65,000 66 $62,500 2,996 $65,000 3,096 $65,000Total 987 $50,000 3,976 $60,000 4,855 $65,000 18,265 $75,000 20,083
Note. Respondents were asked to answer this question only if they were actively employed in nursing. Salary includes overtime and bonuses but does not include sign-on bonuses.
Earnings by APRNs
CRNAs continue to report the highest salaries among ARPNs (median $180,000 in 2020). Reported salaries from APRN professions have remained relatively stable since 2017 (Table 41).
TABLE 41
Median Annual Earnings by APRN Role, 2017 and 2020
APRN Role 2017 2020n Earnings n Earnings
CNP 2,982 $100,000 1,958 $100,000CNS 644 $88,000 448 $80,000CRNA 557 $171,000 341 $180,000
CNM 186 $97,750 116 $86,000
Note. Respondents were asked to answer this question only if they were actively employed in nursing. Salary includes overtime and bonuses but does not include sign-on bonuses. APRN = advanced practice registered nurse; CNP = certified nurse practitioner; CRNA = certified registered nurse anesthe-tist; CNM = certified nurse midwife.

www.journalofnursingregulation.com S45Volume 12/Supplement April 2021
Telehealth Utilization
Percentage of Time Providing Telehealth
Telehealth utilization by nurses seems to have remained relatively unchanged since 2017, However, since 2015, there has been a 4.7 percentage point decrease in nurses providing telehealth services up to 25% of their time and a 4.2 percentage point increase in nurses providing telehealth more than 75% of their time. Considering that this survey was collected right at the time that healthcare delivery systems were been transitioning to more telehealth due to the pandemic, it is expected that there will be an increase in time spent by nurses utilizing telehealth. However, considering that most nurses work in inpatient hospital settings, the increase in telehealth may only be seen in nurses with advanced practice degrees working in ambulatory and primary care settings (Table 42 and Figure 18).
TABLE 42
Percentage of Time Registered Nurses Report Providing Telehealth, 2015–2020
Weighted Sample ValuesProvides Telehealth 2015 (n = 37,354.6) 2017 (n = 39,441.6) 2020 (n = 33,582.4)
n % n % n %Never 19,119.1 51.2 18,095.1 45.9 17,460.2 52.01%–25% 11,710.7 31.4 12,490.6 31.7 8,960.8 26.726%–50% 2,560.5 6.9 2,851.2 7.2 2,184.9 6.551%–75% 1,785.3 4.8 2,201.6 5.6 1,634.5 4.976%–100% 2,179.1 5.8 3,803.2 9.6 3,341.9 10.0
Estimated Population ValuesProvides Telehealth 2015 2017 2020
n % n % n %Never 1,533,811 51.2 1,467,920 45.9 1,744,329 52.01%–25% 803,549 31.4 1,013,268 31.7 895,212 26.726%–50% 175,691 6.9 231,294 7.2 218,278 6.551%–75% 122,502 4.8 178,602 5.6 163,292 4.976%–100% 149,519 5.8 308,529 9.6 333,866 10.0
FIGURE 18
Percentage of Time Registered Nurses Report Providing Telehealth, 2015–2020
0
10
20
30
40
50
60
202020172015
76-100%51-75%26-50%1-25%Never
Perc
enta
ge
of
RN
res
po
nd
ents
Percent of time spent providing telehealth
Note. Respondents were asked to answer this question only if they were actively employed in nursing.
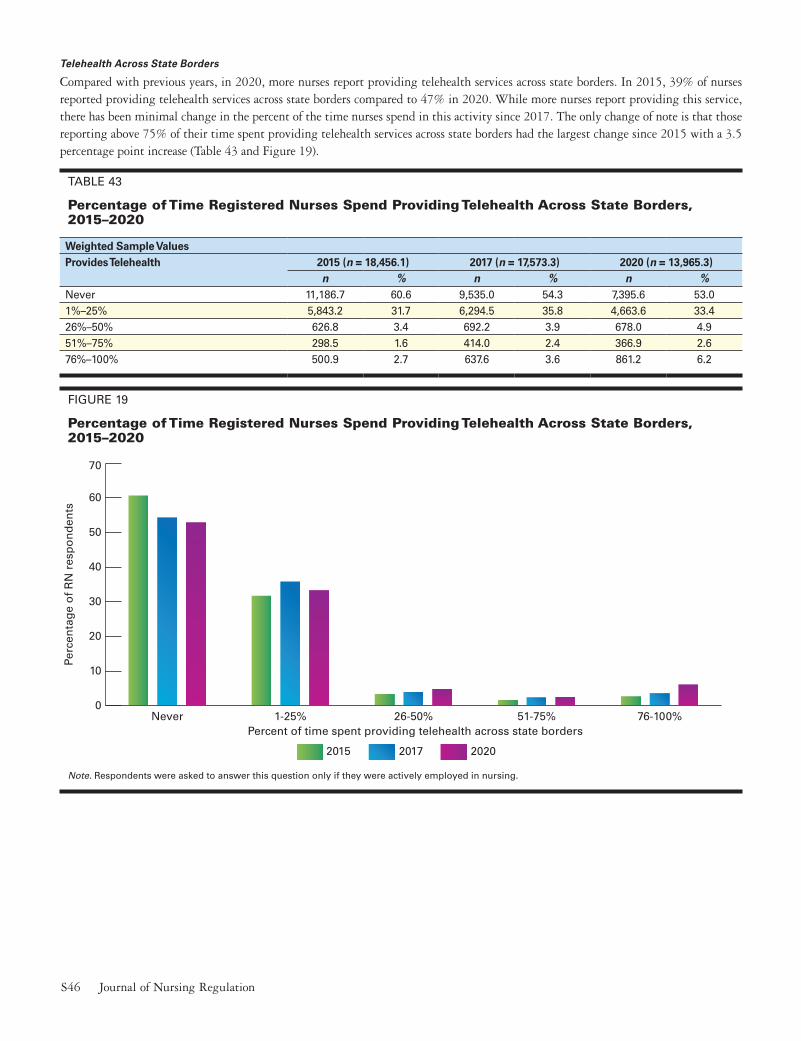
S46 Journal of Nursing Regulation
Telehealth Across State Borders
Compared with previous years, in 2020, more nurses report providing telehealth services across state borders. In 2015, 39% of nurses reported providing telehealth services across state borders compared to 47% in 2020. While more nurses report providing this service, there has been minimal change in the percent of the time nurses spend in this activity since 2017. The only change of note is that those reporting above 75% of their time spent providing telehealth services across state borders had the largest change since 2015 with a 3.5 percentage point increase (Table 43 and Figure 19).
TABLE 43
Percentage of Time Registered Nurses Spend Providing Telehealth Across State Borders, 2015–2020
Weighted Sample ValuesProvides Telehealth 2015 (n = 18,456.1) 2017 (n = 17,573.3) 2020 (n = 13,965.3)
n % n % n %Never 11,186.7 60.6 9,535.0 54.3 7,395.6 53.01%–25% 5,843.2 31.7 6,294.5 35.8 4,663.6 33.426%–50% 626.8 3.4 692.2 3.9 678.0 4.951%–75% 298.5 1.6 414.0 2.4 366.9 2.676%–100% 500.9 2.7 637.6 3.6 861.2 6.2
FIGURE 19
Percentage of Time Registered Nurses Spend Providing Telehealth Across State Borders, 2015–2020
0
10
20
30
40
50
60
70
202020172015
76-100%51-75%26-50%1-25%Never
Perc
enta
ge
of
RN
res
po
nd
ents
Percent of time spent providing telehealth across state borders
Note. Respondents were asked to answer this question only if they were actively employed in nursing.

www.journalofnursingregulation.com S47Volume 12/Supplement April 2021
Telehealth Across International Borders
A small percentage of nurses in the United States provide services across international borders. This percentage has changed little from 2015 to 2020 going from 7.7% in 2015 to 8.6% in 2020 (Table 44 and Figure 20).
TABLE 44
Percentage of Time Registered Nurses Spend Providing Telehealth Across International Borders, 2015–2020
Weighted Sample ValuesProvides Telehealth 2015 (n = 18,096.1) 2017 (n = 16,369.8) 2020 (n = 13,208.2)
n % n % n %Never 16,707.2 92.3 14,548.6 88.9 12,087.2 91.51%–25% 1,194.7 6.6 1,488.2 9.1 965.9 7.326%–50% 96.3 0.5 129.4 0.8 74.0 0.651%–75% 33.7 0.2 103.7 0.6 32.9 0.376%–100% 64.3 0.4 99.8 0.6 48.3 0.4
FIGURE 20
Percentage of Time Registered Nurses Spend Providing Telehealth Across National Borders, 2015–2020
0
10
20
30
40
50
60
70
80
90
100
202020172015
76-100%51-75%26-50%1-25%Never
Perc
enta
ge
of
RN
res
po
nd
ents
Percent of time spent providing telehealth internationally
Note. Respondents were asked to answer this question only if they were actively employed in nursing.

S48 Journal of Nursing Regulation
Modes of Communication Used for Telehealth
The use of telephones continues to be the most common method of communication for telehealth provision. However, telephone use has declined 3.5 percentage points since 2015 in favor of video calls, Voice over Internet Protocol (VoIP), and electronic messaging (increases of 8.1, 5.4, and 5.9 percentage points, respectively, since 2015) (Table 45 and Figure 21).
TABLE 45
Modes of Communication Used for Telehealth by Registered Nurses, 2015–2020
Weighted Sample ValuesMode of Telehealth 2015 (n = 15,864.1) 2017 (n = 17,066.0) 2020 (n = 13,775.4)
n % n % n %Electronic messaging 2,954.0 18.6 3,599.6 21.1 3,379.3 24.5VoIP 528.7 3.3 817.3 4.8 11,297.7 8.7Virtual ICU 167.7 1.1 276.9 1.6 316.3 2.3Telephone 15,406.7 97.1 16,143.9 94.6 12,893.3 93.6Email 5,128.2 32.3 5,574.4 32.7 4,497.9 32.7Video call 463.7 2.9 619.8 3.6 1,517.1 11.0Other 1,070.9 6.8 926.4 5.4 753.5 5.5
Note. VOIP = Voice over Internet Protocol; ICU = intensive care unit.
FIGURE 21
Modes of Communication Used for Telehealth by Registered Nurses, 2015–2020
0
10
20
30
40
50
60
70
80
90
100
202020172015
OtherVideo callEmailTelephoneVirtual ICUVoIPElectronic messaging
Perc
enta
ge
of
RN
res
po
nd
ents
Telehealth communication modes
Note. Respondents were asked to answer this question only if they were actively employed in nursing. Respondents were asked to select all that apply. VoIP = Voice over Internet Protocol; ICU= intensive care unit.

www.journalofnursingregulation.com S49Volume 12/Supplement April 2021
Licensed Practical Nurse/Licensed Vocational Nurse ResultsGender
Males accounted for 8.1% of all LPNs/LVNs, which is an increase of 0.4 percentage points since 2017. In 2020, a third category, “other” was added to the response options to the gender question on the survey and was selected by 0.1% of LPNs/LVNs (Table 46).
TABLE 46
Gender Distribution of Licensed Practical Nurses/Licensed Vocational Nurses, 2015–2020
Weighted Sample ValuesGender 2015 (n = 28,891.0) 2017 (n = 34,616.8) 2020 (n = 39,530.0)
n % n % n %Male 2,169.7 7.5 2,670.9 7.7 3,195.8 8.1Female 26,721.3 92.5 31,945.9 92.3 36,303.1 91.8Other 31.1 0.1
Estimated Population ValuesGender 2015 2017 2020
n % n % n %Male 65,246 7.5 61,064 7.7 75,932 8.1Female 803,559 92.5 730,383 92.3 862,559 91.8Other 739 0.1
Note. “Other” was added as an option with the 2020 survey.
Age
The median age of LPNs/LVNs was 53 years. LPNs/LVNs who are aged 65 years or older account for 18.2% of the workforce. This cohort has grown by 5.0 percentage points since 2017 and by 8.3 percentage points since 2015 (Table 47 and Figure 22).
TABLE 47
Age Distribution of Licensed Practical Nurses/Licensed Vocational Nurses, 2015–2020
Weighted Sample ValuesAge in Years 2015 (n = 27,172.4) 2017 (n = 34,454.1) 2020 (n = 37,868.7)
n % n % n %17–29 2,652.5 9.8 3,072.7 8.9 2,816.1 7.430–34 2,579.5 9.5 2,930.1 8.5 3,163.8 8.435–39 2,689.3 9.9 3,541.2 10.3 3,710.1 9.840–44 3,331.8 12.3 3,539.4 10.3 3,885.0 10.345–49 3,375.1 12.4 4,052.6 11.8 4,253.5 11.250–54 3,076.4 11.3 3,875.0 11.2 4,056.5 10.755–59 3,516.3 12.9 4,428.0 12.9 4,305.6 11.460–64 3,264.9 12.0 4,476.9 13.0 4,770.8 12.6≥ 65 2,686.6 9.9 4,538.3 13.2 6,907.3 18.2
Estimated Population ValuesAge in Years 2015 2017 2020
n % n % n %17–29 79,764 9.8 70,251 8.9 66,910 7.430–34 77,569 9.5 66,991 8.5 75,172 8.435–39 80,873 9.9 80,962 10.3 88,152 9.840–44 100,194 12.3 80,921 10.3 92,307 10.345–49 101,495 12.4 92,654 11.8 101,063 11.250–54 92,513 11.3 88,595 11.2 96,382 10.755–59 105,742 12.9 101,239 12.9 102,301 11.4
(continued)

S50 Journal of Nursing Regulation
Estimated Population ValuesAge in Years 2015 2017 2020
n % n % n %60–64 98,182 12.0 102,356 13.0 113,354 12.6≥ 65 80,791 9.9 103,759 13.2 164,117 18.2
FIGURE 22
Age Distribution of LPNs/LVNs, 2015–2020
0
2
4
6
8
10
12
14
16
18
20
202020172015
≥ 6560-6455-5950-5445-4940-4435-3930-3417-29
Perc
enta
ge
of
LPN
/LV
N r
esp
on
den
ts
Age cohorts (years)
Note. LPN/LVN = licensed practical nurse/licensed vocational nurse.
Age by Gender
The age distribution of male LPNs/LVNs differs from the age distribution of female LPNs/LVNs. The proportion of female LPNs/LVNs aged 65 years or older is almost double that of male LPNs/LVNs in that age cohort, while a larger proportion of male LPNs/LVNs are in the 40–59 age range (Table 48).
TABLE 48
Age Distribution of Licensed Practical Nurses/Licensed Vocational Nurses by Gender, 2020
Weighted Sample ValuesAge in Years Male (n =3,046.1) Female (n = 34,652.2) Other (n = 21.8) Total (n = 37,720.1)
n % n % n % n %17–29 256.0 8.4 2,556.3 7.4 1.6 7.5 2,813.9 7.530–34 251.4 8.3 2,905.1 8.4 0.5 2.4 3,157.0 8.435–39 263.8 8.7 3,438.3 9.9 0.4 1.7 3,702.4 9.840–44 395.6 13.0 3,454.9 10.0 15.8 72.5 3,866.3 10.345–49 413.4 13.6 3,831.6 11.1 1.0 4.5 4,246.0 11.350–54 408.3 13.4 3,633.9 10.5 0.8 3.9 4,043.0 10.755–59 412.6 13.5 3,876.8 11.2 0.4 1.6 4,289.7 11.460–64 287.1 9.4 4,439.1 12.8 0.6 2.9 4,726.8 12.5≥ 65 357.9 11.8 6,516.2 18.8 0.7 3.2 6,874.8 18.2
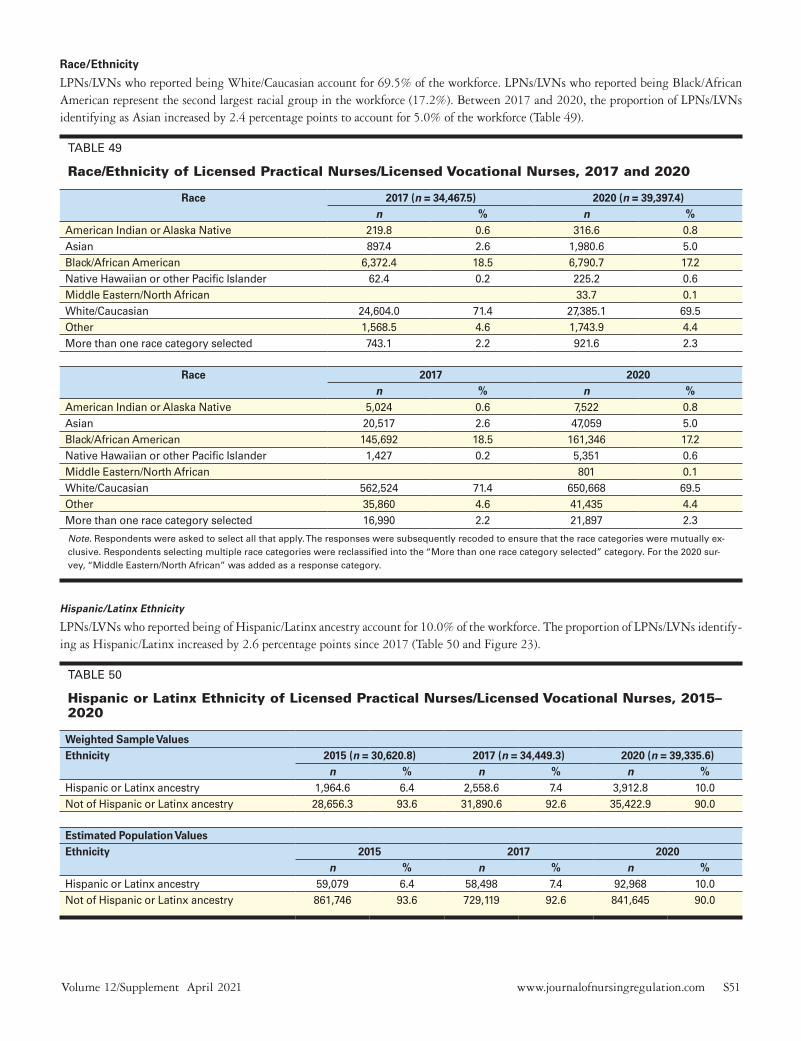
www.journalofnursingregulation.com S51Volume 12/Supplement April 2021
Race/Ethnicity
LPNs/LVNs who reported being White/Caucasian account for 69.5% of the workforce. LPNs/LVNs who reported being Black/African American represent the second largest racial group in the workforce (17.2%). Between 2017 and 2020, the proportion of LPNs/LVNs identifying as Asian increased by 2.4 percentage points to account for 5.0% of the workforce (Table 49).
TABLE 49
Race/Ethnicity of Licensed Practical Nurses/Licensed Vocational Nurses, 2017 and 2020
Race 2017 (n = 34,467.5) 2020 (n = 39,397.4)n % n %
American Indian or Alaska Native 219.8 0.6 316.6 0.8Asian 897.4 2.6 1,980.6 5.0Black/African American 6,372.4 18.5 6,790.7 17.2Native Hawaiian or other Pacific Islander 62.4 0.2 225.2 0.6Middle Eastern/North African 33.7 0.1White/Caucasian 24,604.0 71.4 27,385.1 69.5Other 1,568.5 4.6 1,743.9 4.4More than one race category selected 743.1 2.2 921.6 2.3
Race 2017 2020n % n %
American Indian or Alaska Native 5,024 0.6 7,522 0.8Asian 20,517 2.6 47,059 5.0Black/African American 145,692 18.5 161,346 17.2Native Hawaiian or other Pacific Islander 1,427 0.2 5,351 0.6Middle Eastern/North African 801 0.1White/Caucasian 562,524 71.4 650,668 69.5Other 35,860 4.6 41,435 4.4More than one race category selected 16,990 2.2 21,897 2.3
Note. Respondents were asked to select all that apply. The responses were subsequently recoded to ensure that the race categories were mutually ex-clusive. Respondents selecting multiple race categories were reclassified into the “More than one race category selected” category. For the 2020 sur-vey, “Middle Eastern/North African” was added as a response category.
Hispanic/Latinx Ethnicity
LPNs/LVNs who reported being of Hispanic/Latinx ancestry account for 10.0% of the workforce. The proportion of LPNs/LVNs identify-ing as Hispanic/Latinx increased by 2.6 percentage points since 2017 (Table 50 and Figure 23).
TABLE 50
Hispanic or Latinx Ethnicity of Licensed Practical Nurses/Licensed Vocational Nurses, 2015–2020
Weighted Sample ValuesEthnicity 2015 (n = 30,620.8) 2017 (n = 34,449.3) 2020 (n = 39,335.6)
n % n % n %Hispanic or Latinx ancestry 1,964.6 6.4 2,558.6 7.4 3,912.8 10.0Not of Hispanic or Latinx ancestry 28,656.3 93.6 31,890.6 92.6 35,422.9 90.0
Estimated Population ValuesEthnicity 2015 2017 2020
n % n % n %Hispanic or Latinx ancestry 59,079 6.4 58,498 7.4 92,968 10.0Not of Hispanic or Latinx ancestry 861,746 93.6 729,119 92.6 841,645 90.0

S52 Journal of Nursing Regulation
FIGURE 23
Hispanic or Latinx Ethnicity of Licensed Practical Nurses/Licensed Vocational Nurses, 2015–2020
0 10 20 30 40 50 60 70 80 90 100
202020172015
Not of Hispanic or Latinx ancestry
Hispanic or Latinx ancestry
More than one race category selected
Other
White/Caucasian
Middle Eastern/North African
Native Hawaiian or other Paci�c Islander
Black/African American
Asian
American Indian or Alaska Native
Percentage of LPN/LVN respondents
Eth
nic
ity
Note. In the 2013 and 2015 surveys, the Hispanic/Latino origin and race categories were combined into one question. The categories were separated for the 2017 survey. LPN/LVN = licensed practical nurse/licensed vocational nurse.
Race/Ethnicity by Gender
In comparison to their overall representation in the workforce, LPNs/LVNs who are male are disproportionately likely to identify as racial minorities. Males account for 8.1% of all LPNs/LVNs, but account for substantially larger proportions of LPNs/LVNS who identify as Native Hawaiian or other Pacific Islander (22.1%), Asian (17.2%), and Black/African American (11.0%) (Table 51).
TABLE 51
Race/Ethnicity of Licensed Practical Nurses/Licensed Vocational Nurses by Gender, 2020
Weighted Sample ValuesGender n Male Female Other
n % n % n %American Indian or Alaska Native 316.3 18.4 5.8% 296.3 93.7% 1.6 0.5%Asian 1,970.7 339.5 17.2% 1,624.6 82.4% 6.6 0.3%Black/African American 6,758.3 742.6 11.0% 6,015.7 89.0% 0.0 0.0%Native Hawaiian or other Pacific Islander 225.2 49.8 22.1% 175.3 77.9% 0.0 0.0%Middle Eastern/North African 33.3 3.5 10.5% 29.8 89.5% 0.0 0.0%White/Caucasian 27,284.7 1,674.1 6.1% 25,604.7 93.8% 6.0 0.0%Other 1,736.4 244.2 14.1% 1,475.9 85.0% 16.3 0.9%More than one race category selected 919.3 101.9 11.1% 817.3 88.9% 0.1 0.0%Total 39,244.2 3,174.0 8.1% 36,039.6 91.8% 30.6 0.1%
Note. Respondents were asked to select all that apply. Responses were subsequently recoded to ensure that the race categories were mutually exclu-sive. Respondents selecting multiple race categories were reclassified into the “More than one race category selected” category.

www.journalofnursingregulation.com S53Volume 12/Supplement April 2021
Race/Ethnicity by Age
Although LPNs/LVNs younger than 50 years account for a larger proportion of minority nurses, the youngest cohort of LPNs/LVNs (age 19 to 29 years) is more racially similar to nurses between the ages of 50 and 59 years. Compared to the next oldest cohort (age 30 to 34), the youngest LPNs/LVNs are more likely to be White/Caucasian (73.6% vs. 66.3%) and less likely to identify as Asian, Black/African American, Native Hawaiian or other Pacific Islander, or multiracial. As compared to the entire LPN/LVN workforce, a smaller proportion of LPNs/LVNs younger than 30 years identify as belonging to a racial minority group (26.6% vs. 30.3%) (Table 52).
TABLE 52
Race/Ethnicity of Licensed Practical Nurses and Licensed Vocational Nurses by Age, 2020
Weighted Sample ValuesAge in Years
n n (%)American Indian or Alaska Native
Asian Black/African
American
Native Hawaiian or Other Pacific
Islander
Middle Eastern/
North African
White/Caucasian
Other More Than One Race
17–29 2,789.0 34.0 (1.2) 174.9 (6.3) 286.0 (10.3) 5.5 (0.2) 4.7 (0.2) 2,051.2 (73.6) 144.2 (5.2) 88.4 (3.2)30–34 3,131.4 32.7 (1.1) 214.2 (6.8) 481.1 (15.4) 27.5 (0.9) 1.4 (0.1) 2,075.6 (66.3) 177.0 (5.7) 121.9 (3.9)35–39 3,680.0 21.1 (0.6) 239.1 (6.5) 725.5 (19.7) 56.7 (1.5) 10.9 (0.3) 2,335.8 (63.5) 173.7 (4.7) 117.2 (3.2)40–44 3,850.2 38.3 (1.0) 189.3 (4.9) 815.7 (21.2) 32.9 (0.9) 0.0 (0.0) 2,468.5 (64.1) 195.1 (5.1) 110.5 (2.9)45–49 4,233.6 35.5 (0.8) 247.3 (5.8) 993.4 (23.5) 29.7 (0.7) 2.0 (0.1) 2,625.3 (62.0) 204.0 (4.8) 96.5 (2.3)50–54 4,028.6 27.3 (0.7) 199.6 (5.0) 752.0 (18.7) 31.8 (0.8) 2.7 (0.1) 2,714.0 (67.4) 220.0 (5.5) 81.3 (2.0)55–59 4,274.1 28.9 (0.7) 190.4 (4.5) 708.2 (16.6) 23.7 (0.6) 4.3 (0.1) 3,076.0 (72.0) 178.8 (4.2) 63.9 (1.5)60–64 4,748.9 37.2 (0.8) 206.5 (4.4) 699.6 (14.7) 7.0 (0.2) 1.7 (0.0) 3,570.8 (75.2) 134.7 (2.8) 91.4 (1.9)≥ 65 6,855.9 44.7 (0.7) 234.9 (3.4) 950.2 (13.9) 7.9 (0.1) 1.9 (0.0) 5,293.4 (77.2) 201.1 (2.9) 121.6 (1.8)Total 37,591.7 299.7 (0.8) 1,896.1 (5.0) 6,411.7 (17.1) 222.9 (0.6) 29.7 (0.1) 26,210.6 (69.7) 1,628.5 (4.3) 892.6 (2.4)
Note. Respondents were asked to select all that apply. Responses were subsequently recoded to ensure that the race categories were mutually exclu-sive. Respondents selecting multiple race categories were reclassified into the “More than one race category selected” category.
Education
Type of Nursing Degree or Credential for First U.S. Nursing License
In 2020, 81.5% of respondents reported that a vocational/practical certificate in nursing qualified them for their first U.S. nursing li-cense. An additional 10.1% reported that a diploma was their qualifying degree, while 7.2% and 1.3% reported it was an associate or baccalaureate degree, respectively. Interestingly, the proportion of LPNs/LVNs with an associate or baccalaureate degree increased over the years, while those qualifying with a vocational/practical certificate and diploma has decreased (Table 53).
TABLE 53
Type of Nursing Degree or Credential of Licensed Practical Nurses/Licensed Vocational Nurses for First U.S. Nursing License, 2015–2020
Weighted Sample ValuesDegree or Credential 2015 (n = 30,223.3) 2017 (n = 34,108.8) 2020 (n = 38,868.2)
n % n % n %Vocational/practical certificate 25,257.4 83.6 28,395.0 83.2 31,665.6 81.5Diploma 3,661.3 12.1 4,098.6 12.0 3,914.4 10.1Associate degree 1,168.8 3.9 1,521.3 4.5 2,793.3 7.2Baccalaureate degree 135.8 0.4 93.9 0.3 495.0 1.3

S54 Journal of Nursing Regulation
Estimated Population ValuesDegree or Credential 2015 2017 2020
n % n % n %Vocational/practical certificate 759,537 83.6 649,197 83.2 752,371 81.5Diploma 110,101 12.1 93,707 12.0 93,006 10.1Associate degree 35,146 3.9 34,782 4.5 66,368 7.2Baccalaureate degree 4,085 0.4 2,146 0.3 11,760 1.3
Type of Nursing Degree or Credential for First U.S. Nursing License by Age.
LPNs/LVNs whose initial education to receive their license was an associate degree were more likely to be younger than those whose initial education was a vocational/practical certificate. Additionally, those whose initial education was a baccalaureate degree tended to be slightly older than those with an associate degree, but younger than those with a vocational/practical certificate (Table 54 and Figure 24).
TABLE 54
Type of Nursing Degree or Credential of Licensed Practical Nurses/Licensed Vocational Nurses for First U.S. Nursing License by Age, 2020
Weighted Sample ValuesDegree or Credential n Age in Years, n (%)
18–29 30–34 35–39 40–44 45–49 50–54 55–59 60–64 ≥ 65 Vocational/ practical certificate
30,275.1 2,280.9 (7.5)
2,489.1 (8.2)
2,844.3 (9.4)
3,002.7 (9.9)
3,251.0 (10.7)
3,190.2 (10.5)
3,494.9 (11.5)
3,956.4 (13.1)
5,765.4 (19.0)
Diploma 3,714.4 248.8 (6.7)
318.5 (8.6)
439.2 (11.8)
445.4 (12.0)
505.4 (13.6)
447.8 (12.1)
404.7 (10.9)
348.6 (9.4)
556.1 (15.0)
Associate degree 2,649.6 212.3 (8.0)
263.1 (9.9)
337.0 (12.7)
312.4 (11.8)
355.2 (13.4)
278.8 (10.5)
272.5 (10.3)
284.0 (10.7)
334.3 (12.6)
Baccalaureate degree 470.3 33.0 (7.0)
49.4 (10.5)
37.6 (8.0)
48.2 (10.2)
63.7 (13.6)
79.4 (16.9)
31.2 (6.6)
69.2 (14.7)
58.7 (12.5)
Total 37,109.4 2,774.9 (7.5)
3,120.1 (8.4)
3,658.1 (9.9)
3,808.8 (10.3)
4,175.4 (11.3)
3,996.2 (10.8)
4,203.3 (11.3)
4,658.2 (12.6)
6,714.5 (18.1)
FIGURE 24
Type of Nursing Degree or Credential of LPNs/LVNs for First U.S. Nursing License by Age, 2020
0 20 40 60 80 100
202020172015
Baccalaureate degree
Associate degree
Diploma
Vocational/practical certi�cate
Percentage of LPN/LVN respondents
Nu
rsin
g d
egre
e o
r cr
eden
tial
Note. LPN/LVN = licensed practical nurse/licensed vocational nurse.
Highest Level of Nursing Education
When asked about the highest level of nursing education earned, 72.0% reported a vocational/practical certificate, 12.2% reported a diploma, 12.7% reported an associate degree, and 3.1% indicated a baccalaureate degree. The percentage of LPNs/LVNs who reported an associate or baccalaureate degree increased markedly since 2015, while those earning a vocational/practical certificate or diploma declined (Table 55 and Figure 25).

www.journalofnursingregulation.com S55Volume 12/Supplement April 2021
TABLE 55
Highest Level of Nursing Education Among Licensed Practical Nurses/Licensed Vocational Nurses, 2015–2020
Weighted Sample ValuesEducation Level 2015 (n = 25,626.5) 2017 (n = 34,208.6) 2020 (n = 38,746.1)
n % n % n %Vocational/practical certificate 19,481.3 76.0 26,615.3 77.8 27,899.9 72.0Diploma 3,882.5 15.2 4,900.8 14.3 4,732.5 12.2Associate degree 1,888.6 7.4 2,509.6 7.3 4,910.1 12.7Baccalaureate degree 308.5 1.2 182.8 0.5 1,203.5 3.1
Note. In the 2013 and 2015 surveys a single question “What is your highest level of education?” was asked with the set of possible responses including both nursing and non-nursing degrees. The degree types were separated for the 2017 and 2020 surveys.
FIGURE 25
Highest Level of Nursing Education Among LPNs/LVNs, 2015–2020
0 10 20 30 40 50 60 70 80
202020172015
Baccalaureate degree
Associate degree
Diploma
Vocational/practical certi�cate
Percentage of LPN/LVN respondentsLeve
l of
nu
rsin
g e
du
cati
on
Note. In the 2013 and 2015 surveys a single question “What is your highest level of education?” was asked with the set of possible responses including both nursing and non-nursing degrees. The degree types were separated for the 2017 and 2020 surveys. LPN/LVN = licensed practical nurse/licensed vo-cational nurse.
Highest Level of Nursing Education by Race
Across all race/ethnicity groups, the highest level of nursing education was reported as the vocational/practical certificate. Asian LPNs/LVNs are more likely to hold a baccalaureate degree (23.6%) than all other groups (3.1% for all other groups combined) (Table 56).
TABLE 56
Highest Level of Nursing Education of Licensed Practical Nurses/Licensed Vocational Nurses by Race, 2020
Weighted Sample ValuesRace n Vocational/
Practical CertificateDiploma Associate Degree Baccalaureate
Degreen % n % n % n %
American Indian or Alaska Native 306.6 224.2 73.1 34.7 11.3% 47.1 15.4% 0.7 0.2%Asian 1,922.9 1,074.6 55.9 166.4 8.7% 228.7 11.9% 453.2 23.6%Black/African American 6,629.0 4,345.0 65.6 1,164.0 17.6 905.1 13.7 214.9 3.2Native Hawaiian or other Pacific Islander
222.2 173.4 78.0 3.2 1.4 12.0 5.4 33.6 15.1
Middle Eastern/North African 33.2 21.3 64.2 3.6 10.7 4.8 14.4 3.6 10.7White/Caucasian 26,768.0 20,026.0 74.8 3,027.5 11.3 3,320.3 12.4 394.2 1.5Other 1,695.7 1,177.8 69.5 210.3 12.4 231.6 13.7 76.1 4.5More than one race category selected 890.3 638.6 71.7 101.2 11.4 127.4 14.3 23.1 2.6
(continued)

S56 Journal of Nursing Regulation
Weighted Sample ValuesRace n Vocational/
Practical CertificateDiploma Associate Degree Baccalaureate
Degreen % n % n % n %
Total 38,467.9 27,680.9 72.0 4,710.8 12.2 4,877.0 12.7 1,199.3 3.1
Note. In the 2013 and 2015 surveys, a single question “What is your highest level of education?” was asked with the set of possible responses including both nursing and non-nursing degrees. The degree types were separated for the 2017 and 2020 surveys. For the race question, respondents were asked to select all that apply. The responses were subsequently recoded to ensure that the race categories were mutually exclusive. Respondents selecting multiple race categories were reclassified into the “More than one race category selected” category. For the 2020 survey, “Middle Eastern/North Afri-can” was added as a response category.
Highest Level of Non-nursing Education
About a third (32.3%) of LPNs/LVNs indicated they earned a non-nursing degree. Of those reporting a non-nursing degree, 69.8% reported an associate degree and 24.1% reported a baccalaureate degree. An additional 6.2% indicated they had earned a non-nursing graduate degree (Table 57).
TABLE 57
Highest Level of Non-Nursing Education of Licensed Practical Nurses/Licensed Vocational Nurses, 2017 and 2020
Weighted Sample ValuesNon-Nursing Education 2017 (n = 9,832.6) 2020 (n = 12,497.8)
n % n %Associate degree 6,762.0 68.8 8,719.7 69.8Baccalaureate degree 2,460.1 25.0 3,008.1 24.1Master’s degree 515.6 5.2 674.0 5.4Doctoral degree 95.0 1.0 95.9 0.8
Licensure
Number of Years Licensed
LPN/LVN respondents reported they were licensed for a median of 17 years. A little more than a third of respondents (36.9%) were licensed for 0-10 years, as compared to 43.7% in 2015 and 40.7% in 2017. An additional 23.4% were licensed between 11 and 20 years, which represents an increase from previous years (Table 58 and Figure 26).
TABLE 58
Number of Years Licensed Practical Nurses/Licensed Vocational Nurses Have Been Licensed, 2015–2020
Weighted Sample ValuesYears Licensed 2015 (n = 26,138.0) 2017 (n = 33,652.6) 2020 (n = 36,311.8)
n % n % n %0–10 11,417.8 43.7 13,694.1 40.7 13,401.4 36.911–20 5,258.9 20.1 6,674.0 19.8 8,502.2 23.421–30 4,018.0 15.4 5,483.9 16.3 6,028.3 16.631–40 3,552.0 13.6 4,531.9 13.5 4,213.2 11.6 ≥ 41 1,891.4 7.2 3,268.6 9.7 4,166.7 11.5
Estimated Population ValuesYears Licensed 2015 2017 2020
n % n % n %0–10 343,353 43.7 313,090 40.7 318,416 36.911–20 158,145 20.1 152,589 19.8 202,012 23.421–30 120,828 15.4 125,379 16.3 143,232 16.631–40 106,815 13.6 103,614 13.5 100,105 11.6
(continued)

www.journalofnursingregulation.com S57Volume 12/Supplement April 2021
Estimated Population ValuesYears Licensed 2015 2017 2020
n % n % n % ≥ 41 56,877 7.2 74,730 9.7 99,000 11.5
FIGURE 26
Number of Years LPNs/LVNs Have Been Licensed, 2015–2020
0
5
10
15
20
25
30
35
40
45
50
202020172015
More than 40 years30 to 40 years20 to 30 years10 to 20 years0 to 10 years
Perc
enta
ge
of
LPN
/LV
N r
esp
on
den
ts
Number of years licensed
Initially Licensed in the United States
Almost 99% of LPN/LVN respondents were initially licensed in the United States, while 0.6% were initially licensed in the Philippines, 0.1% in Canada, and 0.1% in India (Table 59).
TABLE 59
Country in Which Licensed Practical Nurses/Licensed Vocational Nurses Were Initially Licensed, 2020
Weighted Sample ValuesCountry 2020 (n = 39,472.5)
n %United States 38,959.1 98.7Canada 48.2 0.1Philippines 237.9 0.6India 28.9 0.1Other 198.4 0.5
Estimated Population ValuesCountry 2020
n %United States 925,665 98.7Canada 1,145 0.1Philippines 5,652 0.6India 687 0.1Other 4,714 0.5

S58 Journal of Nursing Regulation
Multistate License
In 2020, 21.2% of LPNs/LVNs reported holding a multistate license (Table 60).
TABLE 60
Licensed Practical Nurses/Licensed Vocational Nurses Holding a Multistate License, 2020
Weighted Sample ValuesMultistate License 2020 (n = 32,235.9)
n %Yes 6,847.5 21.2No 25,388.3 78.8
Note. Respondents were asked to answer this question only if they were actively employed in nursing.
Use of Multistate License
Of those LPNs/LVNs reporting possession of a multistate license, 21.9% use it for physical crossborder practice. The largest majority of respondents indicated using it for “other” purposes (Table 61).
TABLE 61
How Multistate License is Used by Licensed Practical Nurses/Licensed Vocational Nurses, 2020
Weighted Sample ValuesUse of Multistate License 2020 (n = 4,378.1)
n %Physical crossborder practice 959.1 21.9Telehealth 286.0 6.5Distance education 202.6 4.6Disaster support 147.2 3.4Travel nursing 52.7 1.2Have not used 1,573.5 35.9Other 1,309.1 29.9
Note. Respondents were asked to answer this question only if they were actively employed in nursing. Respondents were asked to select all that apply.
Employment
Employment Status
Among responding LPNs/LVNs, 65.7% reported being actively employed in nursing full time, which is consistent with the 2017 sur-vey (65.0%). The most notable increase was among those who selected retired, which increased from 8.7% in 2017 to 11.3% in 2020. Approximately 11% of LPNs/LVNs reported working in nursing part-time (Table 62 and Figure 27).
TABLE 62
Employment Status of Licensed Practical Nurses/Licensed Vocational Nurses, 2015–2020
Weighted Sample ValuesEmployment Status 2015 (n = 30,766.0) 2017 (n = 34,570.2) 2020 (n = 39,579.6)
n % n % n %Actively employed in nursing full-time 18,823.4 61.2 22,476.5 65.0 26,020.5 65.7Actively employed in nursing part-time 3,714.0 12.1 4,151.9 12.0 4,275.9 10.8Actively employed in nursing per diem 2,179.4 7.1 2,227.5 6.4 2,326.0 5.9Actively employed in a field other than nursing full-time 1,504.3 4.9 1,306.6 3.8 1,257.8 3.2Actively employed in a field other than nursing part-time 868.5 2.8 756.7 2.2 600.9 1.5Actively employed in a field other than nursing per diem 386.7 1.3 193.6 0.6 230.5 0.6Working in nursing only as a volunteer 366.1 1.2 408.9 1.2 383.6 1.0Unemployed, seeking work as a nurse 1,558.7 5.1 1,162.0 3.4 1,260.9 3.2
(continued)
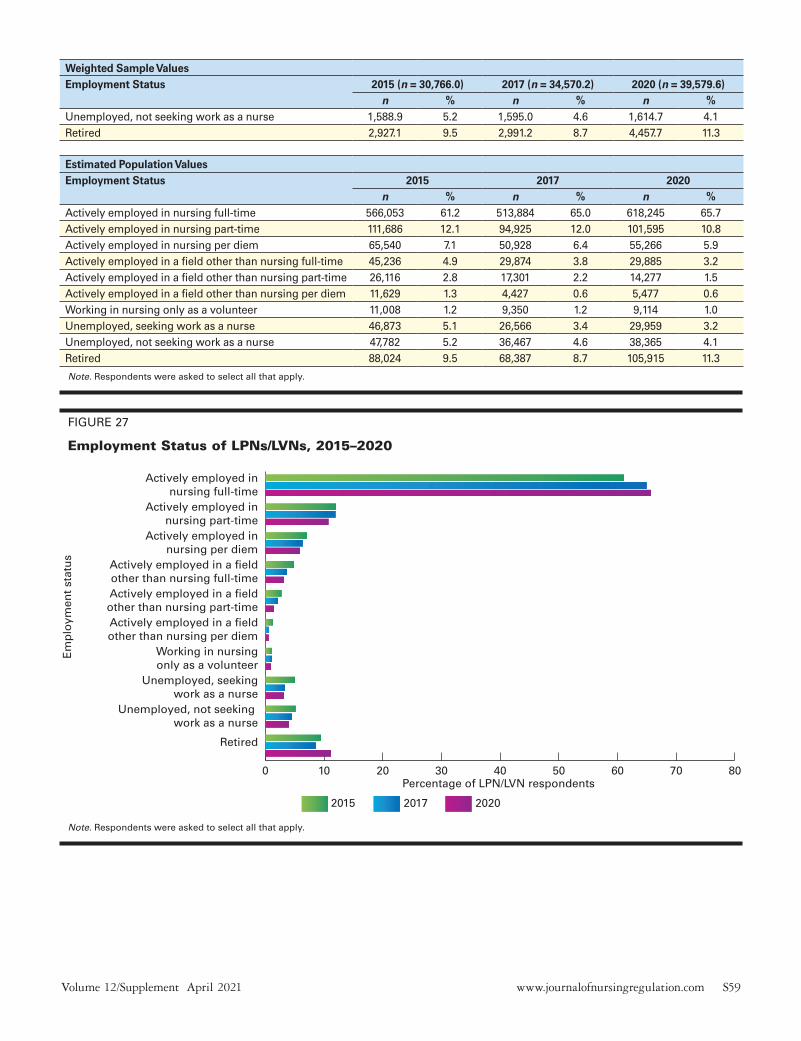
www.journalofnursingregulation.com S59Volume 12/Supplement April 2021
Weighted Sample ValuesEmployment Status 2015 (n = 30,766.0) 2017 (n = 34,570.2) 2020 (n = 39,579.6)
n % n % n %Unemployed, not seeking work as a nurse 1,588.9 5.2 1,595.0 4.6 1,614.7 4.1Retired 2,927.1 9.5 2,991.2 8.7 4,457.7 11.3
Estimated Population ValuesEmployment Status 2015 2017 2020
n % n % n %Actively employed in nursing full-time 566,053 61.2 513,884 65.0 618,245 65.7Actively employed in nursing part-time 111,686 12.1 94,925 12.0 101,595 10.8Actively employed in nursing per diem 65,540 7.1 50,928 6.4 55,266 5.9Actively employed in a field other than nursing full-time 45,236 4.9 29,874 3.8 29,885 3.2Actively employed in a field other than nursing part-time 26,116 2.8 17,301 2.2 14,277 1.5Actively employed in a field other than nursing per diem 11,629 1.3 4,427 0.6 5,477 0.6Working in nursing only as a volunteer 11,008 1.2 9,350 1.2 9,114 1.0Unemployed, seeking work as a nurse 46,873 5.1 26,566 3.4 29,959 3.2Unemployed, not seeking work as a nurse 47,782 5.2 36,467 4.6 38,365 4.1Retired 88,024 9.5 68,387 8.7 105,915 11.3
Note. Respondents were asked to select all that apply.
FIGURE 27
Employment Status of LPNs/LVNs, 2015–2020
0 10 20 30 40 50 60 70 80
202020172015
Retired
Unemployed, not seeking work as a nurse
Unemployed, seeking work as a nurse
Working in nursing only as a volunteer
Actively employed in a �eld other than nursing per diem
Actively employed in a �eld other than nursing part-time
Actively employed in a �eld other than nursing full-time
Actively employed in nursing per diem
Actively employed in nursing part-time
Actively employed in nursing full-time
Percentage of LPN/LVN respondents
Em
plo
ymen
t st
atu
s
Note. Respondents were asked to select all that apply.

S60 Journal of Nursing Regulation
Reason for Being Unemployed
Respondents were asked to select all the applicable reasons for being unemployed. Taking care of home and family was the most frequently selected reason for being unemployed (43.3%) in 2020, which is an increase from 2017 (41.4%) and from 2015 (39.1%). The second and third most frequently selected reasons were “other” by 29.2% of respondents and ‘disabled’ at 16.9%. By comparison, in 2017, 21.1% of respondents reported disability, 15.6% responded difficulty in finding a nursing position, and 26.4% reported the other category (Table 63 and Figure 28).
TABLE 63
Reasons for Unemployment Among Licensed Practical Nurses/Licensed Vocational Nurses, 2015–2020
Weighted Sample ValuesUnemployment Reaso 2015 (n = 2,644.5) 2017 (n = 2,696.8) 2020 (n = 2,781.4)
n % n % n %Taking care of home and family 1,033.0 39.1 1,117.4 41.4 1,203.2 43.3Disabled 463.3 17.5 570.0 21.1 470.5 16.9Inadequate salary 77.9 3.0 111.5 4.1 133.7 4.8School 393.9 14.9 288.4 10.7 336.5 12.1Difficulty in finding a nursing position 610.4 23.1 419.6 15.6 384.5 13.8Other 600.1 22.7 713.0 26.4 812.3 29.2
Note. Respondents were asked to answer this question only if they were unemployed. Respondents were asked to select all that apply.
FIGURE 28
Reasons for Unemployment Among LPNs/LVNs, 2015–2020
0 10 20 30 40 50
202020172015
Other
Dif�culty in �nding a nursing position
School
Inadequate salary
Disabled
Taking care of home and family
Percentage of LPN/LVN respondents
Rea
son
fo
r u
nem
plo
ymen
t
Note. Respondents were asked to answer this question only if they were unemployed. Respondents were asked to select all that apply.

www.journalofnursingregulation.com S61Volume 12/Supplement April 2021
Retirement Plans
In the 2020 LPN/LVN survey, a new question was added: “Do you plan to retire or leave nursing in the next five years?” Only one-fifth of respondents (20.2%) answered “yes.” (Table 64).
TABLE 64
Retirement Plans of Licensed Practical Nurses/Licensed Vocational Nurses, 2020
Weighted Sample ValuesPlan to Retire Within 5 Years 2020 (n = 31,693.0)
n %Yes 6,406.8 20.2No 25,286.2 79.8
Estimated Population ValuesPlan to Retire Within 5 Years 2020
n %Yes 152,225 20.2No 600,798 79.8
Note. Respondents were asked to answer this question only if they were actively employed in nursing.
Number of Positions Currently Held
Respondents were asked to identify the number of positions in which they were currently employed as a nurse. In 2020 and 2017, 82.4% of LPN/LVN respondents indicated holding just one position as a nurse. The percentage of LPNs/LVNs who reported working in two positions increased slightly from 14.9% in 2017 to 15.1% in 2020. The percentage of respondents who indicated that they held three or more positions in nursing slightly decreased from 2.7% in 2017 to 2.5% in 2020 (Table 65).
TABLE 65
Number of Positions Currently Held by Licensed Practical Nurses/Licensed Vocational Nurses, 2015–2020
Weighted Sample ValuesNumber of Positions 2015 (n = 23,317.3) 2017 (n = 27,576.8) 2020 (n = 31,231.7)
n % n % n %1 19,706.5 84.5 22,725.0 82.4 25,738.9 82.42 3,113.0 13.4 4,117.5 14.9 4,705.7 15.13 or more 497.8 2.1 734.3 2.7 787.1 2.5
Estimated Population ValuesNumber of Positions 2015 2017 2020
n % n % n %1 592,611 84.5 519,563 82.4 611,554 82.42 93,613 13.4 94,139 14.9 111,807 15.13 or more 14,970 2.1 16,788 2.7 18,701 2.5
Note. Respondents were asked to answer this question only if they were actively employed in nursing.

S62 Journal of Nursing Regulation
Number of Hours Worked During a Typical Week in all Nursing Positions
In the 2020 survey, 58.6% of responding LPNs/LVNs reported working 32 to 40 hours in a typical week in all positions, which decreased from 59.4% in 2017 and 60.4% in 2015. The second most frequently reported category was 41 to 50 hours (14.9%). This represents a slight decrease from 16% in 2017 (Table 66 and Figure 29).
TABLE 66
Number of Hours Worked by Licensed Practical Nurses/Licensed Vocational Nurses During a Typical Week in All Nursing Positions, 2015–2020
Weighted Sample ValuesHours Worked per Week 2015 (n = 22,450.6) 2017 (n = 27,505.7) 2020 (n = 30,985.7)
n % n % n %1–15 913.1 4.1 1,132.6 4.1 1,214.4 3.916–23 1,088.9 4.9 1,298.4 4.7 1,323.6 4.324–31 1,866.4 8.3 2,031.1 7.4 2,238.6 7.232–40 13,562.8 60.4 16,328.2 59.4 18,164.7 58.641–50 3,410.0 15.2 4,412.7 16.0 4,609.1 14.951–60 928.3 4.1 1,391.1 5.1 1,567.2 5.1≥ 61 681.1 3.0 911.5 3.3 1,868.1 6.0
Estimated Population ValuesHours Worked per Week 2015 2017 2020
n % n % n %1–15 27,459 4.1 25,896 4.1 28,854 3.916–23 32,744 4.9 29,686 4.7 31,449 4.324–31 56,126 8.3 46,437 7.4 53,189 7.232–40 407,859 60.4 373,314 59.4 431,592 58.641–50 102,546 15.2 100,888 16.0 109,512 14.951–60 27,916 4.1 31,805 5.1 37,237 5.1≥ 61 20,482 3.0 20,841 3.3 44,386 6.0
FIGURE 29
Number of Hours Worked by LPNs/LVNs During a Typical Week in All Nursing Positions, 2015–2020
0
10
20
30
40
50
60
70
202020172015
≥ 6051 to 6041 to 5032 to 4024 to 3116 to 231 to 15
Perc
enta
ge
of
LPN
/LV
N r
esp
on
den
ts
Number of hours worked (per week)
Note. Respondents were asked to answer this question only if they were actively employed in nursing.

www.journalofnursingregulation.com S63Volume 12/Supplement April 2021
Primary Nursing Practice Position Setting
Of the responding LPNs/LVNs, 27.5% indicated that their primary nursing practice position was in a nursing home/extended care set-ting, down from 31.7% in 2017. The hospital setting was the second most frequently selected setting by 12.8% of LPNs/LVNs, a 3.2 percentage point increase since 2017, followed by home health at 12.4% and 8.6% in the ambulatory care setting. Hospice (2.1%) and dialysis center (0.9%) were added as new categories in the 2017 survey (Table 67 and Figure 30).
TABLE 67
Primary Nursing Practice Position Setting of Licensed Practical Nurses/Licensed Vocational Nurses, 2015–2020
Weighted Sample ValuesPrimary Practice Setting 2015 (n = 22,989.1) 2017 (n = 26,459.8) 2020 (n = 30,055.4)
n % n % n %Hospital 2,478.9 10.8 2,540.3 9.6 3,831.4 12.8Nursing home/extended care 6,911.9 30.1 8,385.3 31.7 8,250.3 27.5Assisted living facility 1,369.5 6.0 1,484.2 5.6 1,679.5 5.6Home health 3,451.0 15.0 3,710.5 14.0 3,733.3 12.4Hospice 426.6 1.6 639.8 2.1Correctional facility 670.2 2.9 738.6 2.8 729.3 2.4School of nursing 142.0 0.6 78.4 0.3 173.7 0.6Public health 399.8 1.7 498.3 1.9 623.1 2.1Dialysis center 165.8 0.6 266.1 0.9Community health 922.6 4.0 888.1 3.4 1,073.8 3.6School health service 683.9 3.0 697.4 2.6 977.2 3.3Occupational health 174.9 0.8 166.6 0.6 187.3 0.6Ambulatory care setting 2,061.2 9.0 1,797.3 6.8 2,588.2 8.6Insurance claims/benefits 259.7 1.1 241.3 0.9 331.8 1.1Policy/planning/regulatory/licensing agency 32.3 0.1 24.4 0.1 36.7 0.1Other 3,431.2 14.9 4,616.7 17.4 4,933.9 16.4
Estimated Population ValuesPrimary Practice Setting 2015 2017 2020
n % n % n %Hospital 74,544 10.8 58,079 9.6 91,034 12.8Nursing home/extended care 207,854 30.1 191,715 31.7 196,026 27.5Assisted living facility 41,183 6.0 33,933 5.6 39,905 5.6Home health 103,779 15.0 84,834 14.0 88,703 12.4Hospice 9,753 1.6 15,202 2.1Correctional facility 20,154 2.9 16,887 2.8 17,328 2.4School of nursing 4,270 0.6 1,792 0.3 4,127 0.6Public health 12,022 1.7 11,394 1.9 14,805 2.1Dialysis center 3,790 0.6 6,323 0.9Community health 27,745 4.0 20,305 3.4 25,513 3.6School health service 20,565 3.0 15,945 2.6 23,218 3.3Occupational health 5,260 0.8 3,810 0.6 4,450 0.6Ambulatory care setting 61,984 9.0 41,091 6.8 61,495 8.6Insurance claims/benefits 7,810 1.1 5,517 0.9 7,884 1.1Policy/planning/regulatory/licensing agency 973 0.1 557 0.1 872 0.1Other 103,182 14.9 105,553 17.4 117,229 16.4

S64 Journal of Nursing Regulation
FIGURE 30
Primary Nursing Practice Position Setting of LPNs/LVNs, 2015–2020
0 5 10 15 20 25 30 35
202020172015
Other
Policy/planning/regulatory/licensing agency
Insurance claims/bene�ts
Ambulatory care setting
Occupational health
School health service
Community health
Dialysis center
Public health
School of nursing
Correctional facility
Hospice
Home health
Assisted living facility
Nursing home/extended care
Hospital
Percentage of LPN/LVN respondents
Prim
ary
pra
ctic
e se
ttin
g
Note. Respondents were asked to answer this question only if they were actively employed in nursing.
Primary Nursing Position Title
Staff nurse was the title reported as most closely corresponding to the LPN/LVN respondents’ primary nursing position by 72.8%. The second most frequently selected position title was “other—health related” at 15.6%, followed by 5.5% of respondents choosing nurse manager as their title, slightly lower than the 6.2% reported in 2017 (Table 68 and Figure 31).
TABLE 68
Primary Nursing Position Title of Licensed Practical Nurses/Licensed Vocational Nurses, 2015–2020
Weighted Sample ValuesTitle 2015 (n = 23,567.8) 2017 (n = 26,776.9) 2020 (n = 30,512.5)
n % n % n %Consultant 140.6 0.6 152.7 0.6 148.4 0.5Nurse researcher 65.0 0.3 51.2 0.2 66.3 0.2Nurse executive 137.6 0.6 70.9 0.3 120.6 0.4Nurse manager 1,365.4 5.8 1,661.5 6.2 1,680.2 5.5
(continued)

www.journalofnursingregulation.com S65Volume 12/Supplement April 2021
Weighted Sample ValuesTitle 2015 (n = 23,567.8) 2017 (n = 26,776.9) 2020 (n = 30,512.5)
n % n % n %Nurse faculty/educator 967.9 4.1 257.5 1.0 310.5 1.0Advanced practice registered nurse 401.7 1.7 9.0 0.0 149.4 0.5Staff nurse 16,214.1 68.8 19,564.6 73.1 22,209.9 72.8Case manager 595.3 2.5 561.4 2.1 842.8 2.8Other—health related 3,444.2 14.6 4,275.5 16.0 4,768.8 15.6Other—not health related 236.0 1.0 172.7 0.7 215.5 0.7
Estimated Population ValuesTitle 2015 2017 2020
n % n % n %Consultant 4,227 0.6 3,490 0.6 3,526 0.5Nurse researcher 1,955 0.3 1,170 0.2 1,575 0.2Nurse executive 4,138 0.6 1,621 0.3 2,865 0.4Nurse manager 41,060 5.8 37,986 6.2 39,921 5.5Nurse faculty/educator 29,107 4.1 5,887 1.0 7,377 1.0Advanced practice registered nurse 12,079 1.7 206 0.0 3,550 0.5Staff nurse 487,589 68.8 447,308 73.1 527,705 72.8Case manager 17,902 2.5 12,835 2.1 20,025 2.8Other—health related 103,572 14.6 97,751 16.0 113,306 15.6Other—not health related 7,097 1.0 3,949 0.7 5,120 0.7
Note. Respondents were asked to answer this question only if they were actively employed in nursing.
FIGURE 31
Primary Nursing Position Title of LPNs/LVNs, 2015–2020
0 10 20 30 40 50 60 70 80
202020172015
Other–non-health related
Other–health related
Case manager
Staff nurse
Advanced practice registered nurse
Nurse faculty/educator
Nurse manager
Nurse executive
Nurse researcher
Consultant
Percentage of LPN/LVN respondents
Prim
ary
nu
rsin
g t
itle
Note. Respondents were asked to answer this question only if they were actively employed in nursing. LPN/LVN = licensed practical nurse/licensed vo-cational nurse.

S66 Journal of Nursing Regulation
Primary Nursing Position Specialty
Among LPN/LVN respondents, 26.6% selected geriatric/gerontology as the employment specialty that most closely corresponded to their primary nursing practice position, down from 30.5% in 2017. Home health was the second most frequently selected employment specialty (8.4%) followed by adult health (8.3%). A slightly greater proportion of LPNs/LVNs selected “other—clinical specialties” in 2020 (11.5%) compared to 2017 (10.8%). The acute care/critical care employment specialty responses increased from 2.7% in 2017 to 4.1% in 2020 (Table 69 and Figure 32).
TABLE 69
Primary Nursing Position Specialty of Licensed Practical Nurses/Licensed Vocational Nurses, 2015–2020
Weighted Sample ValuesPrimary Position Specialty 2015 (n = 21,932.4) 2017 (n = 25,214.9) 2020 (n = 28,417.9)
n % n % n %Acute care/critical care 458.5 2.1 670.0 2.7 1,157.6 4.1Adult health 960.6 4.4 1,968.0 7.8 2,354.2 8.3Family health 1,712.4 6.8 1,840.3 6.5Anesthesia 18.0 0.1 17.6 0.1 22.5 0.1Cardiology 250.4 1.0 312.5 1.1Community 262.6 1.2 216.8 0.9 323.6 1.1Geriatric/gerontology 6,064.1 27.7 7,685.8 30.5 7,545.9 26.6Home health 2,109.3 9.6 2,228.2 8.8 2,372.5 8.4Maternal-child health/obstetrics 120.5 0.6 225.1 0.9 266.5 0.9Medical surgical 777.3 3.5 728.6 2.9 1,008.2 3.6Nephrology 133.7 0.6 201.0 0.8 258.2 0.9Occupational health 154.5 0.7 160.8 0.6 183.4 0.7Oncology 137.1 0.6 152.9 0.6 252.5 0.9Palliative care/hospice 348.2 1.6 354.7 1.4 490.7 1.7Pediatrics 1,326.0 6.1 1,880.2 7.5 1,819.5 6.4Neonatal 28.2 0.1 28.8 0.1 40.8 0.1Perioperative 93.1 0.4 76.4 0.3 135.3 0.5Public health 173.1 0.8 257.6 1.0 332.4 1.2Psychiatric/mental health/substance abuse 1,084.8 5.0 1,205.0 4.8 1,405.0 4.9Rehabilitation 847.7 3.9 1,081.5 4.3 990.8 3.5School health 612.9 2.8 646.2 2.6 870.1 3.1Emergency/trauma 157.2 0.7 127.5 0.5 261.6 0.9Women’s health 342.8 1.6 291.0 1.2 426.2 1.5Other—clinical specialties 2,724.1 10.8 3,264.9 11.5Other—nonclinical specialties 324.1 1.3 482.9 1.7Other 3,400.7 15.5Primary care 1,695.5 7.7Genetics 182.2 0.8Informatics 41.4 0.2Neurology/neurosurgical 90.6 0.4Orthopedic 185.5 0.9Radiology 24.2 0.1Urology 102.1 0.5

www.journalofnursingregulation.com S67Volume 12/Supplement April 2021
Estimated Population ValuesPrimary Position Specialty 2015 2017 2020
n % n % n %Acute care/critical care 13,787 2.1 15,319 2.7 27,504 4.1Adult health 28,888 4.4 44,995 7.8 55,936 8.3Family health 39,151 6.8 43,725 6.5Anesthesia 542 0.1 401 0.1 535 0.1Cardiology 5,725 1.0 7,425 1.1Community 7,896 1.2 4,956 0.9 7,689 1.1Geriatric/gerontology 182,359 27.7 175,722 30.5 179,290 26.6Home health 63,430 9.6 50,944 8.8 56,370 8.4Maternal-child health/obstetrics 3,623 0.6 5,148 0.9 6,332 0.9Medical surgical 23,375 3.5 16,659 2.9 23,955 3.6Nephrology 4,022 0.6 4,595 0.8 6,135 0.9Occupational health 4,647 0.7 3,677 0.6 4,358 0.7Oncology 4,124 0.6 3,497 0.6 5,999 0.9Palliative care/hospice 10,471 1.6 8,109 1.4 11,659 1.7Pediatrics 39,875 6.1 42,988 7.5 43,231 6.4Neonatal 848 0.1 659 0.1 969 0.1Perioperative 2,798 0.4 1,747 0.3 3,215 0.5Public health 5,207 0.8 5,889 1.0 7,898 1.2Psychiatric/mental health/substance abuse 32,622 5.0 27,550 4.8 33,383 4.9Rehabilitation 25,493 3.9 24,727 4.3 23,541 3.5School health 18,432 2.8 14,774 2.6 20,674 3.1Emergency/trauma 4,729 0.7 2,915 0.5 6,216 0.9Women’s health 10,308 1.6 6,653 1.2 10,126 1.5Other—clinical specialties 62,282 10.8 77,574 11.5Other—nonclinical specialties 7,411 1.3 11,474 1.7Other 102,266 15.5Primary care 50,986 7.7Genetics 5,480 0.8Informatics 1,244 0.2Neurology/neurosurgical 2,723 0.4Orthopedic 5,577 0.9Radiology 727 0.1Urology 3,071 0.5
Note. Respondents were asked to answer this question only if they were actively employed in nursing.
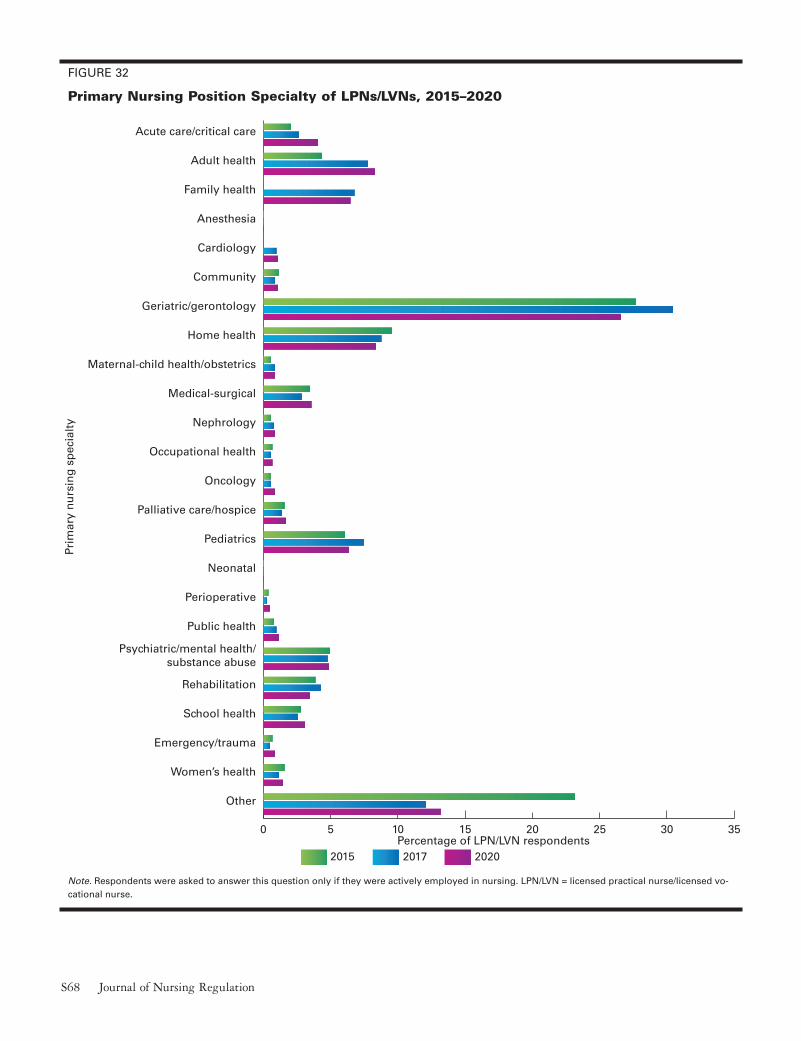
S68 Journal of Nursing Regulation
FIGURE 32
Primary Nursing Position Specialty of LPNs/LVNs, 2015–2020
0 5 10 15 20 25 30 35
202020172015
Other
Women’s health
Emergency/trauma
School health
Rehabilitation
Psychiatric/mental health/substance abuse
Public health
Perioperative
Neonatal
Pediatrics
Palliative care/hospice
Oncology
Occupational health
Nephrology
Medical-surgical
Maternal-child health/obstetrics
Home health
Geriatric/gerontology
Community
Cardiology
Anesthesia
Family health
Adult health
Acute care/critical care
Percentage of LPN/LVN respondents
Prim
ary
nu
rsin
g s
pec
ialt
y
Note. Respondents were asked to answer this question only if they were actively employed in nursing. LPN/LVN = licensed practical nurse/licensed vo-cational nurse.
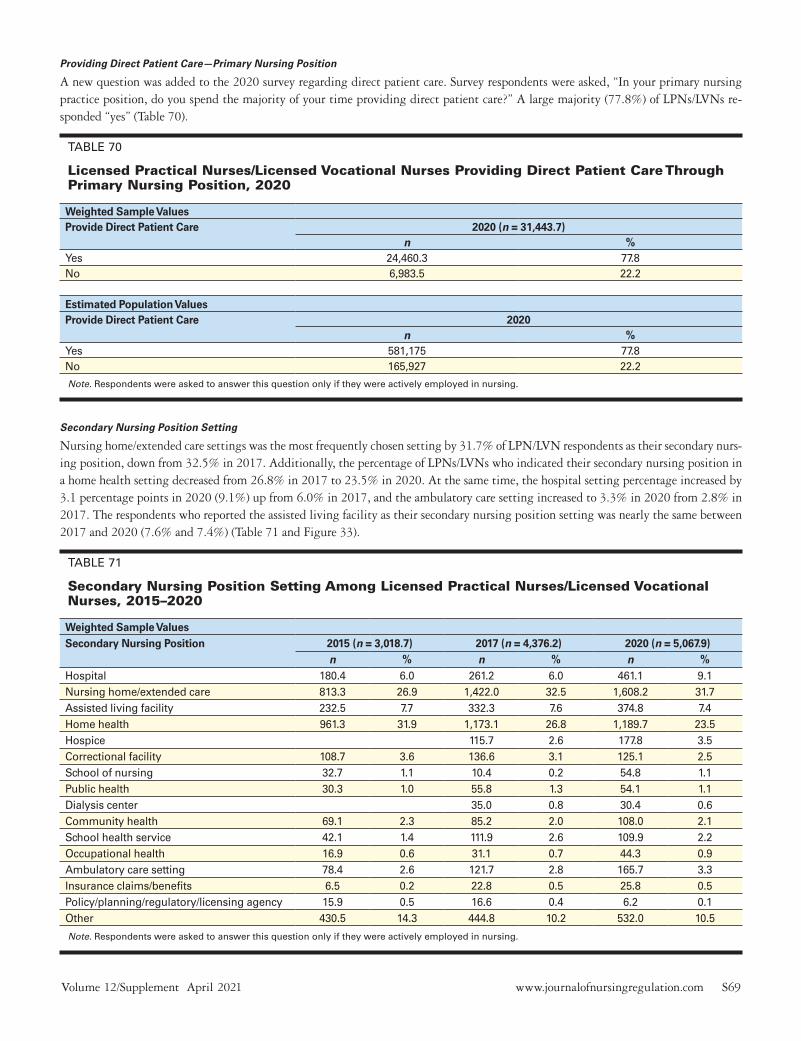
www.journalofnursingregulation.com S69Volume 12/Supplement April 2021
Providing Direct Patient Care—Primary Nursing Position
A new question was added to the 2020 survey regarding direct patient care. Survey respondents were asked, “In your primary nursing practice position, do you spend the majority of your time providing direct patient care?” A large majority (77.8%) of LPNs/LVNs re-sponded “yes” (Table 70).
TABLE 70
Licensed Practical Nurses/Licensed Vocational Nurses Providing Direct Patient Care Through Primary Nursing Position, 2020
Weighted Sample ValuesProvide Direct Patient Care 2020 (n = 31,443.7)
n %Yes 24,460.3 77.8No 6,983.5 22.2
Estimated Population ValuesProvide Direct Patient Care 2020
n %Yes 581,175 77.8No 165,927 22.2
Note. Respondents were asked to answer this question only if they were actively employed in nursing.
Secondary Nursing Position Setting
Nursing home/extended care settings was the most frequently chosen setting by 31.7% of LPN/LVN respondents as their secondary nurs-ing position, down from 32.5% in 2017. Additionally, the percentage of LPNs/LVNs who indicated their secondary nursing position in a home health setting decreased from 26.8% in 2017 to 23.5% in 2020. At the same time, the hospital setting percentage increased by 3.1 percentage points in 2020 (9.1%) up from 6.0% in 2017, and the ambulatory care setting increased to 3.3% in 2020 from 2.8% in 2017. The respondents who reported the assisted living facility as their secondary nursing position setting was nearly the same between 2017 and 2020 (7.6% and 7.4%) (Table 71 and Figure 33).
TABLE 71
Secondary Nursing Position Setting Among Licensed Practical Nurses/Licensed Vocational Nurses, 2015–2020
Weighted Sample ValuesSecondary Nursing Position 2015 (n = 3,018.7) 2017 (n = 4,376.2) 2020 (n = 5,067.9)
n % n % n %Hospital 180.4 6.0 261.2 6.0 461.1 9.1Nursing home/extended care 813.3 26.9 1,422.0 32.5 1,608.2 31.7Assisted living facility 232.5 7.7 332.3 7.6 374.8 7.4Home health 961.3 31.9 1,173.1 26.8 1,189.7 23.5Hospice 115.7 2.6 177.8 3.5Correctional facility 108.7 3.6 136.6 3.1 125.1 2.5School of nursing 32.7 1.1 10.4 0.2 54.8 1.1Public health 30.3 1.0 55.8 1.3 54.1 1.1Dialysis center 35.0 0.8 30.4 0.6Community health 69.1 2.3 85.2 2.0 108.0 2.1School health service 42.1 1.4 111.9 2.6 109.9 2.2Occupational health 16.9 0.6 31.1 0.7 44.3 0.9Ambulatory care setting 78.4 2.6 121.7 2.8 165.7 3.3Insurance claims/benefits 6.5 0.2 22.8 0.5 25.8 0.5Policy/planning/regulatory/licensing agency 15.9 0.5 16.6 0.4 6.2 0.1Other 430.5 14.3 444.8 10.2 532.0 10.5
Note. Respondents were asked to answer this question only if they were actively employed in nursing.

S70 Journal of Nursing Regulation
FIGURE 33
Secondary Nursing Position Setting Among LPNs/LVNs, 2015–2020
0 5 10 15 20 25 30 35
202020172015
Other
Policy/planning/regulatory/licensing agency
Insurance claims/bene�ts
Ambulatory care setting
Occupational health
School health service
Community health
Dialysis center
Public health
School of nursing
Correctional facility
Hospice
Home health
Assisted living facility
Nursing home/extended care
Hospital
Percentage of LPN/LVN respondents
Sec
on
dar
y p
ract
ice
sett
ing
Note. Respondents were asked to answer this question only if they were actively employed in nursing. LPN/LVN = licensed practical nurse/licensed vo-cational nurse.

www.journalofnursingregulation.com S71Volume 12/Supplement April 2021
Secondary Nursing Position Title
It remains that more than three-quarters (77.7%) of LPN/LVN respondents reported their secondary nursing position title as staff nurse, which is similar to 2017 (78.5%). The percentage of LPNs/LVNs who reported a secondary nursing position title of nurse manager was 3.1%, down from 3.4% in 2017. The next highest category reported was case manager at 2.3% of respondents, followed by nurse faculty/educators at 2.2%. Unspecified titles are in the category of “other—health related” positions at 11.9% (Table 72 and Figure 34).
TABLE 72
Secondary Nursing Position Title of Licensed Practical Nurses/Licensed Vocational Nurses, 2015–2020
Weighted Sample ValuesSecondary Title 2015 (n = 2,980.3) 2017 (n = 4,217.2) 2020 (n = 4,942.1)
n % n % n %Consultant 37.5 1.3 45.2 1.1 47.0 1.0Nurse researcher 7.0 0.2 1.3 0.0 7.3 0.2Nurse executive 10.4 0.4 10.0 0.2 8.6 0.2Nurse manager 59.9 2.0 141.4 3.4 153.2 3.1Nurse faculty/educator 132.0 4.4 58.4 1.4 107.9 2.2Advanced practice registered nurse 34.1 1.1 2.6 0.1 36.1 0.7Staff nurse 2,167.2 72.7 3,309.2 78.5 3,842.2 77.7Case manager 53.8 1.8 66.6 1.6 111.6 2.3Other—health related 440.3 14.8 528.9 12.5 586.2 11.9Other—not health related 38.3 1.3 53.5 1.3 42.1 0.9
FIGURE 34
Secondary Nursing Position Title of LPNs/LVNs, 2015–2020
0 10 20 30 40 50 60 70 80
202020172015
Other–non-health related
Other–health related
Case manager
Staff nurse
Advanced practice registered nurse
Nurse faculty/educator
Nurse manager
Nurse executive
Nurse researcher
Consultant
Percentage of LPN/LVN respondents
Sec
on
dar
y n
urs
ing
tit
le
Note. Respondents were asked to answer this question only if they were actively employed in nursing. LPN/LVN = licensed practical nurse/licensed vo-cational nurse.

S72 Journal of Nursing Regulation
Secondary Nursing Position Specialty
Nearly one-third of LPNs/LVNs (30.6%) reported their secondary nursing position specialty was geriatric/gerontology, a decrease of nearly 4 percentage points from 2017 (34.5%). Home health was the second most frequently selected specialty at 18.2%, followed by adult health at 8.0%, and “other—clinical specialties” at 7.9% of respondents (Table 73 and Figure 35).
TABLE 73
Secondary Nursing Position Specialty of Licensed Practical Nurses/Licensed Vocational Nurses, 2015–2020
Weighted Sample ValuesSecondary Position Specialty 2015 (n = 2,809.3) 2017 (n = 4,024.3) 2020 (n = 4,686.1)
n % n % n %Acute care/critical care 70.9 2.5 120.5 3.0 188.0 4.0Adult health 63.8 2.3 236.6 5.9 373.0 8.0Family health 88.6 2.2 101.9 2.2Anesthesia 0.0 0.0 1.9 0.1 0.0 0.0Cardiology 13.1 0.3 12.3 0.3Community 37.3 1.3 72.3 1.8 64.9 1.4Geriatric/gerontology 834.0 29.7 1,388.2 34.5 1,432.1 30.6Home health 568.1 20.2 679.5 16.9 853.6 18.2Maternal-child health/obstetrics 10.5 0.4 21.4 0.5 25.1 0.5Medical surgical 48.2 1.7 73.9 1.8 117.4 2.5Nephrology 9.3 0.3 27.8 0.7 19.3 0.4Occupational health 17.2 0.6 27.3 0.7 38.2 0.8Oncology 1.6 0.1 9.0 0.2 16.5 0.4Palliative care/hospice 77.8 2.8 58.0 1.4 105.8 2.3Pediatrics 181.7 6.5 378.6 9.4 271.7 5.8Neonatal 8.4 0.3 1.7 0.0 0.3 0.0Perioperative 0.5 0.0 2.9 0.1 17.5 0.4Public health 21.6 0.8 57.6 1.4 65.8 1.4Psychiatric/mental health/substance abuse 111.8 4.0 159.5 4.0 224.1 4.8Rehabilitation 108.3 3.9 184.2 4.6 174.1 3.7School health 39.8 1.4 82.8 2.1 72.9 1.6Emergency/trauma 43.6 1.6 48.4 1.2 45.2 1.0Women’s health 10.5 0.4 17.1 0.4 21.8 0.5Other—clinical specialties 227.0 5.6 368.0 7.9Other—nonclinical specialties 48.3 1.2 76.4 1.6Other 420.1 15.0Primary care 76.9 2.7Genetics 29.9 1.1Informatics 3.6 0.1Neurology/neurosurgical 3.4 0.1Orthopedic 6.7 0.2Radiology 1.8 0.1Urology 1.8 0.1
Note. Respondents were asked to answer this question only if they were actively employed in nursing.

www.journalofnursingregulation.com S73Volume 12/Supplement April 2021
FIGURE 35
Secondary Nursing Position Specialty of LPNs/LVNs, 2015–2020
0 5 10 15 20 25 30 35
202020172015
Other
Women’s health
Emergency/trauma
School health
Rehabilitation
Psychiatric/mental health/substance abuse
Public health
Perioperative
Neonatal
Pediatrics
Palliative care/hospice
Oncology
Occupational health
Nephrology
Medical-surgical
Maternal-child health/obstetrics
Home health
Geriatric/gerontology
Community
Cardiology
Anesthesia
Family health
Adult health
Acute care/critical care
Percentage of LPN/LVN respondents
Sec
on
dar
y n
urs
ing
sp
ecia
lty
Note. Respondents were asked to answer this question only if they were actively employed in nursing. LPN/LVN = licensed practical nurse/licensed vo-cational nurse.

S74 Journal of Nursing Regulation
Providing Direct Patient Care—Secondary Nursing Practice Position
A new question was added to the 2020 survey regarding direct patient care. Survey respondents were asked, “In your secondary nursing practice position, do you spend the majority of your time providing direct patient care?” The vast majority (85.5%) responded “yes” (Table 74).
TABLE 74
Providing Direct Patient Care—Secondary Nursing Practice Position of Licensed Practical Nurses/Licensed Vocational Nurses, 2020
Provide Direct Patient Care 2020 (n = 5,140.8)n %
Yes 4,393.8 85.5No 747.0 14.5
Note. Respondents were asked to answer this question only if they were actively employed in nursing.
Salary/Earnings
2020 Pretax Annual Earnings From Primary Nursing Position
The median pretax annual earnings for responding LPNs/LVNs increased from $38,000 in 2015 to $40,000 in 2017 and $44,000 in 2020. This constitutes a 3.2% simple annual growth in earnings during the 5-year period (0.1% lower than the growth in reported RN incomes during the same period). Categorically, there has been a trend since 2015 of the percentage of respondents earning less than $40,000 annually decreasing while percentages in all other wage categories have increased. The percent of LPNs reporting wages under $40,000 has decreased by 17.7 percentage points from 2015 to 2020 while all other earnings categories have increased. The largest in-crease has been in the $60,000 to $80,000 category, which has increased by 8.4 percentage points since 2015 (Table 75 and Figure 36).
TABLE 75
Annual Earnings of Licensed Practical Nurses/Licensed Vocational Nurses, 2015–2020
Weighted Sample ValuesEarnings 2015 (n = 19,436.4) 2017 (n = 24,473.1) 2020 (n = 26,035.6)
n % n % n %< $40,000 10,138.3 52.2 11,190.3 45.7 8,988.0 34.5$40,000 to < $60,000 7,088.3 36.5 9,819.4 40.1 10,653.6 40.9$60,000 to < $80,000 1,418.5 7.3 2,243.9 9.2 4,073.6 15.7$80,000 to < $100,000 174.6 0.9 361.1 1.5 1,118.1 4.3≥ $100,000 616.8 3.2 858.4 3.5 1,202.3 4.6
Estimated Population ValuesEarnings 2015 2017 2020
n % n % n %< $40,000 304,877 52.2 255,845 45.7 213,554 34.5$40,000 to < $60,000 213,157 36.5 224,501 40.1 253,129 40.9$60,000 to < $80,000 42,657 7.3 51,303 9.2 96,788 15.7$80,000 to < $100,000 5,250 0.9 8,256 1.5 26,566 4.3≥ $100,000 18,548 3.2 19,626 3.5 28,567 4.6
Note. Respondents were asked to answer this question only if they were actively employed in nursing. Salary includes overtime and bonuses but does not include sign-on bonuses.

www.journalofnursingregulation.com S75Volume 12/Supplement April 2021
FIGURE 36
Annual Earnings of LPNs/LVNs, 2015–2020
0
10
20
30
40
50
60
202020172015
$100,000 or more$80,000 to less than $100,000
$60,000 to less than $80,000
$40,000 to less than $60,000
Less than $40,000
Perc
enta
ge
of
LPN
/LV
N r
esp
on
den
ts
Annual earnings
Note. Respondents were asked to answer this question only if they were actively employed in nursing. Salary includes overtime and bonuses but does not include sign-on bonuses. LPN/LVN = licensed practical nurse/licensed vocational nurse.
Earnings by Gender and Specialty
For all specialties, the median salary for males is higher than the median salary for females. LPNs/LVNs working in occupational health and rehabilitation tied for the specialty with the highest median salary. LPNs/LVNs working in school health have the lowest median salary overall. These rankings remain unchanged from the previous survey (Table 76).
TABLE 76
Median Annual Earnings of Licensed Practical Nurses/Licensed Vocational Nurses by Gender and Specialty, 2020
Specialty Male Female Other Totaln Earnings n Earnings n Earnings n Earnings
Acute care/critical care 95 $54,000 776 $45,000 871 $45,000Adult health 176 $50,000 1,607 $45,000 2 $40,500 1,785 $45,000Family health 41 $45,760 1,933 $38,000 1974 $38,000
Anesthesia 2 $59,500 12 $37,500 14 $42,500Cardiology 17 $45,000 252 $40,000 269 $40,000Community 22 $53,000 281 $41,000 303 $42,000Geriatric/gerontology 430 $53,000 6,278 $46,000 3 $65,000 6,711 $47,000Home Health 135 $50,000 1,605 $42,000 1,740 $42,000Maternal-child health/obstetrics
187 $42,000 187 $42,000
Medical-surgical 66 $47,000 756 $41,000 1 $45,000 823 $41,041Nephrology 16 $57,500 144 $45,000 1 $50,000 161 $46,600Occupational health 13 $49,000 148 $50,000 1 $74,000 162 $50,000Oncology 9 $38,000 173 43296 1 $19,000 183 $43,000Palliative care/hospice 16 $54,000 333 $47,000 349 $47,500Pediatrics 56 $42,075 1,321 $40,000 1 $50,000 1,378 $40,000Neonatal 23 $45,000 23 $45,000
(continued)

S76 Journal of Nursing Regulation
Specialty Male Female Other Totaln Earnings n Earnings n Earnings n Earnings
Perioperative 11 $52,000 98 $45,000 109 $45,760Public health 18 $43,000 249 $40,000 267 $40,000Psychiatric/mental health/substance abuse
142 $51,400 1,009 $45,000 1 $64,000 1,152 $45,000
Rehabilitation 90 $55,000 756 $50,000 2 $44,640 848 $50,000School health 16 $39,000 631 $29,000 647 $29,000Emergency/trauma 26 $47,584 173 $40,000 199 $41,674Women’s health 316 $40,780 316 $40,780Other—clinical special-ties
170 $52,000 2,624 $44,000 1 $46,784 2,795 $44,800
Other—nonclinical spe-cialties
25 $59,599 314 $50,000 339 $50,000
Total 1,593 $50,000 21,999 $43,000 14 $48,392
Note. Respondents were asked to answer this question only if they were actively employed in nursing. Salary includes overtime and bonuses but does not include sign-on bonuses.
Earnings by Highest Education
Holding true from previous years, LPNs/LVNs with baccalaureate degrees have the highest median salaries (Table 77).
TABLE 77
Median Annual Earnings of Licensed Practical Nurses/Licensed Vocational Nurses by Highest Education, 2017 and 2020
Highest Education Level 2017 2020n Earnings n Earnings
Vocational/practical certificate-nursing 16,750 $42,000 17,947 $43,000Diploma 3,709 $41,600 3,589 $43,000Associate degree 2,199 $40,000 3,565 $45,000Baccalaureate degree 227 $51,619 566 $60,000

www.journalofnursingregulation.com S77Volume 12/Supplement April 2021
Earnings by State
Reported median earnings rose in most states. The highest median earnings were for LPNs/LVNs practicing in New York ($60,000) and Alaska ($56,559). California, Nevada, and Washington, D.C., tied at around $55,000. The lowest median earnings were for LPNs/LVNs practicing in Alabama ($39,000), South Dakota ($38,000), Mississippi ($37,000), and West Virginia ($36,000). Unlike with RNs where the highest gains in earnings were also the states with the lowest earnings, the states with the highest gains in earnings since 2015 for LPNs/LVNs are New York (10%), Idaho (5.8%), Michigan (5.7%), South Dakota (5.3%), and Oregon (5.0%). Notably, LPNs/LVNs working in the Northern Mariana Islands had both lower reported median earnings than LPNs/LVNs in all U.S. states and also saw an 8% decline in those earnings since 2015 (Table 78).
TABLE 78
Median Annual Earnings of Licensed Practical Nurses/Licensed Vocational Nurses in Primary Nursing Position by State(s) Where Currently Practicing
State 2015 2017 2020Alabama $33,000 $35,000 $39,000Alaska $50,000 $52,000 $56,559Arizona $48,000 $48,000 $52,000Arkansas $33,500 $37,000 $40,000California $45,000 $48,000 $55,836Colorado $42,000 $45,000 $50,000Connecticut $49,000 $50,000 $52,360Delaware $45,000 $47,000 $50,000District of Columbia $53,000 $50,000 $55,000Florida $37,000 $40,000 $43,210Georgia $36,000 $39,800 $42,000Hawaii $45,000 $46,000 $50,000Idaho $32,560 $38,000 $42,000Illinois $40,000 $40,000 $45,000Indiana $36,000 $40,000 $45,000Iowa $34,640 $36,000 $41,000Kansas $35,000 $39,000 $41,500Kentucky $35,000 $40,000 $42,000Louisiana $35,000 $38,000 $40,000Maine $36,000 $40,000 $43,500Maryland $45,000 $50,000 $53,012Massachusetts $48,000 $50,000 $54,000Michigan $35,000 $40,000 $45,000Minnesota $33,000 $36,750 $40,000Mississippi $35,000 $35,000 $37,000Missouri * * $40,000
State 2015 2017 2020Montana $36,260 $37,440 $43,000Nebraska $33,000 $38,000 $40,000Nevada $48,000 $49,000 $55,000New Hampshire $42,000 $45,500 $50,000New Jersey $45,000 $48,000 $54,000New Mexico $45,000 $45,000 $50,000New York $40,000 $45,000 $60,000North Carolina $38,000 $41,000 $44,000North Dakota $35,000 $37,000 $40,000Ohio $34,000 $36,000 $40,000Oklahoma $35,000 $37,000 $40,000Oregon $42,240 $47,000 $53,000Pennsylvania $39,000 $40,320 $44,000Rhode Island $45,000 $50,000 $50,000South Carolina $37,124 $40,000 $42,000South Dakota $30,000 $34,865 $38,000Tennessee $34,000 $36,000 $40,000Texas $40,082 $43,000 $49,383Utah $36,000 $41,000 $41,000Vermont $37,128 $42,000 $45,000Virginia $36,000 $40,000 $44,000Washington $44,000 $48,000 $54,000West Virginia $32,000 $35,000 $36,000Wisconsin $35,000 $38,000 $40,000Wyoming $40,000 $40,500 $44,000Guam $34,000 $32,000 $40,000Northern Mariana Islands $55,000 $28,500 $32,959
Note. Respondents were asked to answer this question only if they were actively employed in nursing. Salary includes overtime and bonuses but does not include sign-on bonuses.
*Missouri did not participate in the 2015 and 2017 surveys.

S78 Journal of Nursing Regulation
Earnings by Years Licensed and Age
Similar to RNs, there are steady increases in reported median salary as the number of years licensed increases, and less increase when looking at increase in age within the same number of years of experience (Table 79).
TABLE 79
Median Annual Earnings of Licensed Practical Nurses/Licensed Vocational Nurses by Years Licensed and Age, 2020
Number of Years LicensedAge in Years 0–1 2–5 6–10 ≥ 11 Total
n Earnings n Earnings n Earnings n Earnings n Earnings18–29 655 $29,983 1,159 $38,000 286 $40,000 9 $60,000 2,109 $35,30030–34 318 $33,519 804 $40,000 847 $42,000 256 $42,000 2,225 $40,00035–39 234 $35,000 583 $42,000 789 $44,422 859 $45,000 2,465 $42,80640–44 176 $37,872 413 $42,000 651 $45,000 1,330 $43,000 2,570 $43,00045–49 119 $35,675 339 $45,000 511 $47,000 1,772 $48,000 2,741 $46,36050–54 88 $37,720 268 $45,000 415 $47,121 2,107 $48,000 2,878 $47,00055–59 45 $40,000 123 $44,000 329 $45,017 2,671 $48,000 3,168 $47,08460–64 17 $49,920 58 $42,075 200 $45,000 2,909 $46,600 3,184 $46,000≥ 65 16 $11,820 51 $45,000 103 $43,000 2,645 $42,000 2,815 $42,000Total 1,668 $32,316 3,798 $40,000 4,131 $45,000 14,558 $45,167
Note. Respondents were asked to answer this question only if they were actively employed in nursing. Salary includes overtime and bonuses but does not include sign-on bonuses.
Telehealth Utilization
Percentage of Time Providing Telehealth
There has been little change over time in the percentage of LPNs/LVNs who report providing telehealth services (Table 80 and Figure 37).
TABLE 80
Percentage of Time Licensed Practical Nurses/Licensed Vocational Nurses Spend Providing Telehealth, 2015–2020
Weighted Sample ValuesProvides Telehealth 2015 (n = 23,619.9) 2017 (n = 27,760.6) 2020 (n = 31,095.7)
n % n % n %Never 12,723.1 53.9 12,715.8 45.8 15,504.3 49.91%–25% 5,496.6 23.3 6,436.4 23.2 6,799.8 21.926%–50% 2,207.1 9.3 2,821.3 10.2 2,993.3 9.651%–75% 1,490.6 6.3 2,253.8 8.1 2,240.4 7.276%–100% 1,702.4 7.2 3,533.3 12.7 3,557.9 11.4
Estimated Population ValuesProvides Telehealth 2015 2017 2020
n % n % n %Never 382,606 53.9 290,722 45.8 368,381 49.91%–25% 165,294 23.3 147,157 23.2 161,563 21.926%–50% 66,373 9.3 64,503 10.2 71,121 9.651%–75% 44,826 6.3 51,529 8.1 53,232 7.276%–100% 51,195 7.2 80,781 12.7 84,535 11.4
Note. Respondents were asked to answer this question only if they were actively employed in nursing.

www.journalofnursingregulation.com S79Volume 12/Supplement April 2021
FIGURE 37
Percentage of Time LPNs/LVNs Spend Providing Telehealth, 2015–2020
0
10
20
30
40
50
60
202020172015
76 to 100%51 to 75%26 to 50%1 to 25%Never
Perc
enta
ge
of
LPN
/LV
N r
esp
on
den
ts
Percent of time spent providing telehealth
Note. Respondents were asked to answer this question only if they were actively employed in nursing. LPN/LVN = licensed practical nurse/licensed vo-cational nurse.
Telehealth Across State Borders
Of those providing nursing services remotely, there has been a 9.2 percentage point increase in those who reported providing telehealth across state borders compared to 2015 (Table 81 and Figure 38).
TABLE 81
Percentage of Time Licensed Practical Nurses/Licensed Vocational Nurses Spend Providing Telehealth Across State Borders, 2015–2020
Weighted Sample ValuesProvide Telehealth 2015 (n = 11,421.5) 2017 (n = 12,214.3) 2020 (n = 12,981.4)
n % n % n %Never 7,566.5 66.2 6,849.9 56.1 7,413.4 57.11%–25% 3,140.4 27.5 4,040.1 33.1 4,062.8 31.326%–50% 371.1 3.2 622.9 5.1 692.7 5.351%–75% 180.4 1.6 372.2 3.1 390.8 3.076%–100% 163.1 1.4 329.3 2.7 421.7 3.3
Note. Respondents were asked to answer this question only if they were actively employed in nursing.

S80 Journal of Nursing Regulation
FIGURE 38
Percentage of Time LPNs/LVNs Spend Providing Telehealth Across State Borders, 2015–2020
0
10
20
30
40
50
60
70
202020172015
76 to 100%51 to 75%26 to 50%1 to 25%Never
Perc
enta
ge
of
LPN
/LV
N r
esp
on
den
ts
Percent of time spent providing telehealth across state borders
Note. Respondents were asked to answer this question only if they were actively employed in nursing. LPN/LVN = licensed practical nurse/licensed vo-cational nurse.
Telehealth Across International Borders
LPNs/LVNs providing remote services across international borders has remained relatively flat, with 10% of LPNs/LVNs reporting they provide telehealth (Table 82).
TABLE 82
Percentage of Time Licensed Practical Nurses/Licensed Vocational Nurses Spend Providing Telehealth Across National Borders, 2015–2020
Weighted Sample ValuesProvide Telehealth 2015 (n = 11,089.2) 2017 (n = 11,117.1) 2020 (n = 12,295.4)
n % n % n %Never 10,201.8 92.0 9,800.3 88.2 11,068.0 90.01%–25% 633.3 5.7 807.0 7.3 814.2 6.626%–50% 129.0 1.2 208.1 1.9 193.3 1.651%–75% 82.0 0.7 189.0 1.7 115.8 0.976%–100% 43.1 0.4 112.7 1.0 104.2 0.9
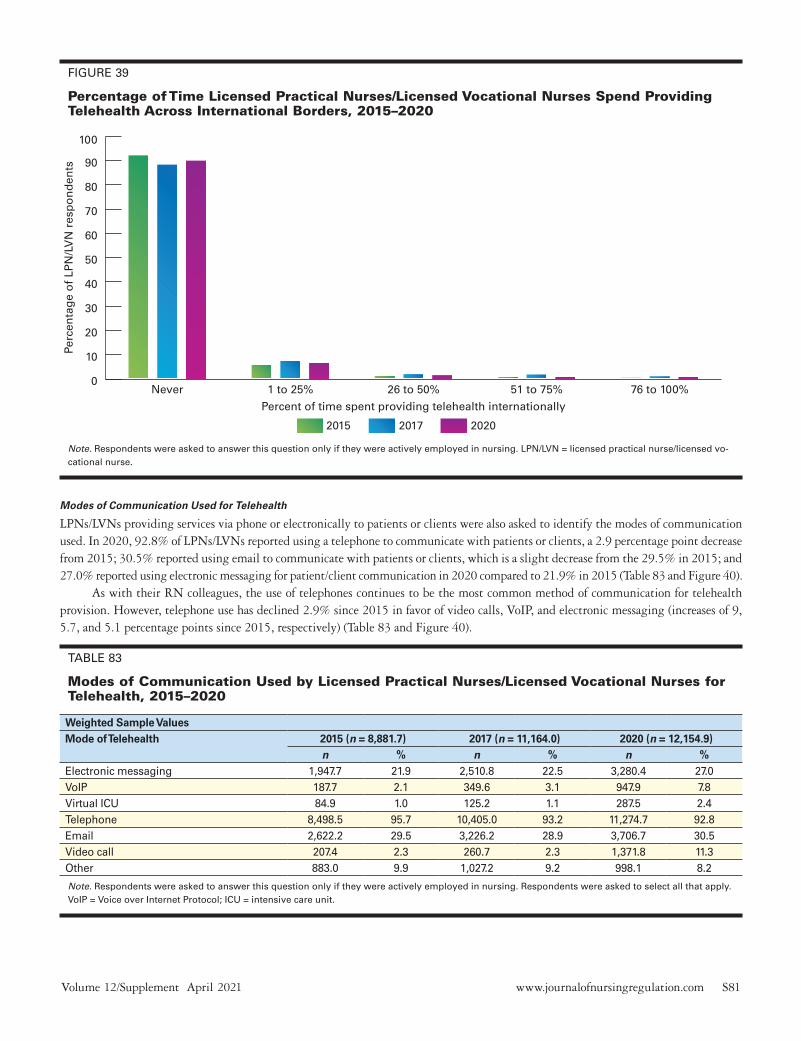
www.journalofnursingregulation.com S81Volume 12/Supplement April 2021
FIGURE 39
Percentage of Time Licensed Practical Nurses/Licensed Vocational Nurses Spend Providing Telehealth Across International Borders, 2015–2020
0
10
20
30
40
50
60
70
80
90
100
202020172015
76 to 100%51 to 75%26 to 50%1 to 25%Never
Perc
enta
ge
of
LPN
/LV
N r
esp
on
den
ts
Percent of time spent providing telehealth internationally
Note. Respondents were asked to answer this question only if they were actively employed in nursing. LPN/LVN = licensed practical nurse/licensed vo-cational nurse.
Modes of Communication Used for Telehealth
LPNs/LVNs providing services via phone or electronically to patients or clients were also asked to identify the modes of communication used. In 2020, 92.8% of LPNs/LVNs reported using a telephone to communicate with patients or clients, a 2.9 percentage point decrease from 2015; 30.5% reported using email to communicate with patients or clients, which is a slight decrease from the 29.5% in 2015; and 27.0% reported using electronic messaging for patient/client communication in 2020 compared to 21.9% in 2015 (Table 83 and Figure 40).
As with their RN colleagues, the use of telephones continues to be the most common method of communication for telehealth provision. However, telephone use has declined 2.9% since 2015 in favor of video calls, VoIP, and electronic messaging (increases of 9, 5.7, and 5.1 percentage points since 2015, respectively) (Table 83 and Figure 40).
TABLE 83
Modes of Communication Used by Licensed Practical Nurses/Licensed Vocational Nurses for Telehealth, 2015–2020
Weighted Sample ValuesMode of Telehealth 2015 (n = 8,881.7) 2017 (n = 11,164.0) 2020 (n = 12,154.9)
n % n % n %Electronic messaging 1,947.7 21.9 2,510.8 22.5 3,280.4 27.0VoIP 187.7 2.1 349.6 3.1 947.9 7.8Virtual ICU 84.9 1.0 125.2 1.1 287.5 2.4Telephone 8,498.5 95.7 10,405.0 93.2 11,274.7 92.8Email 2,622.2 29.5 3,226.2 28.9 3,706.7 30.5Video call 207.4 2.3 260.7 2.3 1,371.8 11.3Other 883.0 9.9 1,027.2 9.2 998.1 8.2
Note. Respondents were asked to answer this question only if they were actively employed in nursing. Respondents were asked to select all that apply. VoIP = Voice over Internet Protocol; ICU = intensive care unit.

S82 Journal of Nursing Regulation
FIGURE 40
Modes of Communication Used by Licensed Practical Nurses/Licensed Vocational Nurses for Telehealth, 2015–2020
0
10
20
30
40
50
60
70
80
90
100
202020172015
OtherVideo callEmailTelephoneVirtual ICUVoIPElectronic messaging
Perc
enta
ge
of
LPN
/LV
N r
esp
on
den
ts
Telehealth communication modes
Note. Respondents were asked to answer this question only if they were actively employed in nursing. Respondents were asked to select all that apply. LPN/LVN = licensed practical nurse/licensed vocational nurse; VoIP = Voice over Internet Protocol; ICU = intensive care unit.

www.journalofnursingregulation.com S83Volume 12/Supplement April 2021
Discussion and ImplicationsDemographics
The workforce in 2020 is more demographically diverse and representative of the country’s population than in any other year in which this study was previously conducted. Overall, the RN workforce is 81% White/Caucasian. In contrast, 72% of the U.S. population identifies as Caucasian (U.S. Census Bureau, 2020). Although these data indicate that persons of color are not adequately represented in the RN workforce, as younger nurses have entered the workforce, they have introduced greater racial diversity by identifying as an underrepresented minority. Nurses between the ages of 19 and 49 comprise 47% of all RNs but account for 49% of RNs who are Black/African American and more than 60% of RNs who are multiracial, Asian, or Native Hawaiian or other Pacific Islander.
In a pattern similar to that of RNs, younger LPNs/LVNs have introduced more racial diversity to the workforce. It is notable, however, that the racial distribution of the LPN/LVN workforce much more closely matches the racial distribution of the U.S. population than does the RN workforce. As the workforce ages and the less racially diverse generation of nurses begins to retire out of practice, it will be important to monitor whether persons of color become overrepresented among LPNs/LVNs. LPN/LVN licensure requires the lowest level of nursing education and yields a median annual salary that is more than 35% lower than the median income of RNs.
An additional area that warrants monitoring is the proportion of nurses in the workforce who are working past typical retirement age. Nurses aged 65 years or older account for nearly 20% of each of the RN and LPN/LVN workforces. In 2017, this same age cohort accounted for 15% of RNs and 13% of LPNs/LVNs. During the COVID-19 pandemic, which has resulted in a high rate of complications and mortality for patients older than 65 years, many nurses may reconsider how long they plan to remain in the workforce. Employers should develop and implement succession plans to ensure that the rapid loss of the workforce’s oldest nurses does not result in an unre-coverable loss of expertise.
Although women continue to account for the largest majority of nurses, the proportion of men licensed as RNs or LPNs/LVNs in the country is increasing. Currently, men account for just under 10% of the RN workforce, which is up from 7% in 2013. The same pattern, though less pronounced, holds true for the proportion of men in the LPN/LVN workforce. The increase in the number of men in the overall nursing workforce reflects the improved representation of men among nurses younger than 50 years. Men account for a higher proportion of nurses within every age cohort between 19 and 49 years of age than they account for in the workforce as a whole.
Employment
Data suggest an average of 83% of all nurses who maintain licensure are employed in nursing; of those, roughly two-thirds work full-time, 10% work part-time, and about 7% work per diem shifts. During the past four reporting periods, there has been a consistent number of RNs and LPNs/LVNs who maintain a nursing license and report working in fields other than nursing. Using weighted sample values, this translates to approximately 200,000 licensees. Additionally, there are approximately 175,000 projected licensees who report being unemployed but are not seeking work as nurses. Still another nearly 15% of unemployed nurses who are seeking nursing employment reported difficulty in finding a nursing position.
For nurses who report being unemployed, about half of RNs and roughly 43.3% of LPNs/LVNs cite taking care of home and family as their reason for not working. Being disabled is another significant reason reported for unemployment among RNs (10.7%) and LPNs/LVNs (16.9%). This is consistent with the research, which suggests that nurses suffer workplace injuries at a higher incidence than other professionals (Dressner & Kissinger, 2018).
The proportion of nurses reporting a retired nursing employment status is on the rise. In a new survey question for 2020, respondents were asked if they plan to retire in the next 5 years. More than one-fifth of all nurses replied positively to the question. This response correlates to the longstanding belief that we will see a tsunami of nurses retire and leave the profession in the near future (McMenamin, 2014). The authors note this may be more critical as we face COVID-19 pandemic responses, which may more quickly accelerate the retirement rate due to the increased health risks that COVID-19 places on persons older than 60 years.
Nearly 84% of RNs work only one position in nursing; however, 13.7% reported that they work two positions and 2.4% reported working three positions or more. Nearly 60% of nurses work 32 to 40 hours a week and more than one-fifth of nurses work more than 40 hours per week. Similar to RNs, 82.4% of LPNs/LVNs reported being currently employed in only one position, and those who reported working two positions increased from 2017 to 2020. One-fifth of LPNs/LVNs report working 41 to 50 hours in their typical week and roughly 60% report working 32 to 40 hours.
Hospitals continue to be the primary practice setting for RNs, followed by the ambulatory care setting, home health, and nursing homes. The number of LPNs/LVNs who are working in hospitals have increased since 2017, which corresponds with the decrease of those who reported working in nursing homes or extended care settings.
Of those nurses who provide direct patient care, more than 90% of the respondents hold the title of staff nurse. Not surprisingly, the title with the least amount of direct patient care is a nurse executive. In the specialty area of anesthesia, 94.7% of respondents provide direct patient care; for nurses who report neonatal as their specialty, 91.2% provide direct patient care. Of those nurses reporting geriatric/
S84 Journal of Nursing Regulation
gerontology as their specialty area, less than half (45.1%) provide direct patient care. Those nurses who report public health (31.0%) and community (26.7%) as specialty areas are providing direct patient care at a proportion lower than all other specialties.
Education
In the 2020 survey, the proportion of RNs holding a baccalaureate degree increased for those reporting their highest level of nursing edu-cation but remained steady for those reporting the degree held when obtaining their first nursing license. The proportion of RNs holding an associate degree when first licensed increased slightly in 2020. This trend had been declining in recent years. When only considering the highest nursing degree earned, the proportion of RNs earning a baccalaureate degree or higher continues to increase, although the proportion will fall short of the National Academy of Medicine’s goal of 80% of RNs hold a baccalaureate degree or higher (National Academy of Medicine, 2011). The proportion of LPNs/LVNs earning an associate or baccalaureate degree also increased slightly this year, while the proportion of those with a practical/vocational certificate or nursing diploma declined.
There is also evidence RNs and LPNs/LVNs are continuing their nursing education after obtaining their initial nursing license. Comparing the highest level of nursing education to the educational attainment when first licensed show that proportionally more RNs hold a baccalaureate or graduate degree than did at initial licensure. Additionally, proportionally more LPNs/LVNs hold an associate or baccalaureate degree as their highest level of nursing education than at initial licensure.
Licensure
Evidence suggests both RNs and LPNs/LVNs are more experienced now than in previous years. The proportion of nurses with 10 or fewer years practicing declined according to survey respondents, while the proportion of those with between 11 and 30 years of experience grew in 2020. As in previous years, most RNs (95%) and LPNs/LVNs (99%) obtained their initial nursing license in the United States.
Salary
Nursing incomes overall have at best remained essentially flat over time, with increases that just barely beat out inflation. Regional income increases in specific states as described in the report may be a good indicator for where employment demand for nurses is high in the country. Of concern are greater-than-average drops in reported median income in specialties related to women and maternal-child health. However, this finding may simply be an indicator that there is less demand in these areas as our population ages.
While telehealth has become a major focus of pandemic healthcare delivery, at the time of this survey, it does not seem that there have been major changes to how nurses use telehealth. It is anticipated that this will change a great deal in the future as our care delivery systems learn how best to utilize nursing services in this new normal.
Limitations One of the difficulties of a national survey is making a single national observation when nursing, as a profession, is highly dependent on regional and local factors. This must be kept in mind when interpreting the results of the survey.
The survey was conducted during the COVID-19 pandemic. The responses received pre-pandemic did not differ from the responses received after the initial months of the pandemic for most of the survey questions; however, there were some exceptions. Respondents in the Pre-COVID groups were more likely to be younger, fully employed, and working in hospitals. Respondents in the Post- COVID groups were more likely to be older, retired, and working in home health.
Response rates in social science and public surveys have been declining for quite some time. The Nursing Workforce Survey has reflected this decline. The RN response rates were 38.5% in 2013, 34.3% in 2015, 32.8% in 2017, and 27.3% in 2020. The LPN/LVN rates were 28.0% in 2015, 26.5% in 2017, and 23.9% in 2020. A response rate decline of RNs dropping to 30% and the LPN/LVNs dropping to 25% may have been expected from 2017 to 2020 even without the pandemic. But the decline in response rates was larger for RNs and LPN/LVNs and may also have been a result of the COVID pandemic.
The following groups of nurses may have been slightly overrepresented in both the RN and LPN/LVN samples: White/Caucasian, female, and age of 50 years or older. Because of missing or incomplete data on race/ethnicity, only gender and age could be used to make nonresponse weighting adjustments (Appendix C).
While the response trends of APRNs remained consistent with prior surveys, the overall proportion of APRN responses in the 2020 cycle declined after years of incremental growth. Future survey administrations are necessary to determine whether this reflects a permanent shift in respondent profile or is an outlier due to the pandemic.

www.journalofnursingregulation.com S85Volume 12/Supplement April 2021
ConclusionThe nursing workforce has slowly changed during the past 2 years as evidenced by the information described in this report in terms of employment setting, age, diversity, and education. Efforts to increase baccalaureate-prepared nurses in the workforce according to the goal outlined in the Future of Nursing report (National Academy of Medicine, 2011) have resulted in an increase in the number of baccalaureate-prepared nurses. However, the goal of 80% baccalaureate-prepared nurses by 2020 has not been met. The workforce is also shifting as older nurses retire and Generation Z enters the workforce. Challenges will continue in the nursing workforce, such as matching workforce diversity to population, compensation, and opportunity; exploring the role of nurses in new practice settings; and adjusting to changes in healthcare delivery modalities such as telehealth. Ultimately, nursing will continue pursuing the goals of achieving higher levels of education, promoting diversity, and improving data collection regarding the national healthcare workforce.

S86 Journal of Nursing Regulation
ReferencesDressner, M. A., & Kissinger, S.P. (2018, November). Occupational inju-
ries and illnesses among registered nurses. Monthly Labor Review. https://doi.org/10.21916/mlr.2018.27
Fraher, E. P., Pittman, P., Frogner, B. K., Spetz, J., Moore, J., Beck, A. J., Armstrong, D., & Buerhaus, P. I. (2020). Ensuring and sustaining a pandemic workforce. The New England Journal of Medicine, 382(23), 2181–2183. https://doi.org/10.1056/NEJMp2006376
McMenamin, P. (2014, April 9). Tsunami warning: Massive RN retire-ments coming. Medscape Nurses. https://www.medscape.com/viewarticle/823183
National Academy of Medicine (2011). Future of nursing: Leading change, advancing health. https://www.nap.edu/catalog/12956/the-future-of-nursing-leading-change-advancing-health
National Council of State Boards of Nursing. (2020a). Policy brief: U.S. nursing leadership supports practice/academic partnerships to assist the nursing workforce during the COVID-19 crisis. https://www.ncsbn.org/Policy_Brief_US_Nursing_Leadership_COVID19.pdf
National Council of State Boards of Nursing. (2020b). Number of nurses in U.S. and by jurisdiction. https://www.ncsbn.org/14283.htm
The National Forum of State Nursing Workforce Centers. (2016). Mini-mum nurse supply dataset. https://www.nursingworkforcecenters.org/wp-content/uploads/2020/10/National-Forum-Supply-Minimum-Dataset_September-2016.pdf
U.S. Census Bureau. (2020). ACS demographic and housing 1-year esti-mates: 2019. https://www.census.gov/newsroom/press-kits/2020/acs-1year.html
Conflicts of Interest: None

www.journalofnursingregulation.com S87Volume 12/Supplement April 2021
Appendices
APPENDIX A
2020 National Workforce Study Questionnaire
T
T
\\\\\\\\\\\\\\\\\\\\\\\\ SERIAL #DO NOT WRITE IN THIS AREA
PageONE
Marking InstructionsUse a No. 2 pencil or blue or black ink pen only.Do not use pens with ink that soaks through the paper.Make solid marks that fill the oval completely.
Incorrect MarksCorrect Mark
»»»»\\\\»»»»\\\\\
Demographics 1. What is your gender?
2. Are you of Hispanic or Latino origin?
3. What is your race? (Select all that apply)
4. In what year were you born?
9. Year of Initial U.S. Licensure:
5. What type of nursing degree/credential qualified you for your first U.S. nursing license?
6. What is your highest level of nursing education?
7. What is your highest level of non-nursing education?
8. What type of license do you currently hold? (Select all that apply)
Male Female Other
NoYes
American Indian or Alaska NativeAsianBlack/African AmericanNative Hawaiian or Other Pacific IslanderMiddle Eastern/North AfricanWhite/CaucasianOther
Vocational/Practical certificate–nursingDiploma–nursingAssociate degree–nursingBaccalaureate degree–nursingMaster’s degree–nursingDoctoral degree–nursing (PhD)Doctoral degree–nursing (DNP)
Vocational/Practical certificate–nursingDiploma–nursingAssociate degree–nursingBaccalaureate degree–nursingMaster’s degree–nursingDoctoral degree–nursing (PhD)Doctoral degree–nursing practice (DNP)Doctoral degree–nursing other
Associate degree–non-nursingBaccalaureate degree–non-nursingMaster’s degree–non-nursingDoctoral degree–non-nursingNot applicable
RN LPN APRN
\
\ \
\ \ \
\
\ \
\
\\\\\\\
\\\\\\\
\\\\\\\\
\\\\\
YEAR
YEAR
License/Certification Information
Active Inactive 12. What is the status of the license currently held?
10. In what country did you receive your entry-level nursing education?
11. In what country were you initially licensed as an RN, LPN or APRN?
United StatesCanada Philippines
United StatesCanada Philippines
IndiaOther, please specify
IndiaOther, please specify
\\\
\\\
\\
\\
||
|
|
|
Unless indicated, select one answer per question.
Certified Nurse PractitionerClinical Nurse SpecialistCertified Registered Nurse Anesthetist Certified Nurse Midwife Not credentialed as any of the above
\\\\\
13. Indicate whether you are credentialed in your state to practice as any of the following: (Select all that apply)
14. Please indicate the states in which you hold an active license to practice as an RN, LPN or APRN: (Select all that apply)
AKALARAZCACOCTDCDEFLGA
HIIAIDILINKSKYLAMAMDME
MIMNMOMSMTNCNDNENHNJNM
NVNYOHOKORPARISCSDTNTX
UTVAVTWAWIWVWYASGUMPVI
\\\\\\\\\\\
\\\\\\\\\\\
\\\\\\\\\\\
\\\\\\\\\\\
\\\\\\\\\\\

S88 Journal of Nursing Regulation
t
tPageTWO
| |
|
|
|
*If you are actively employed in nursing, please answer the remaining questions. If you are not actively employed in nursing, you have completed the survey.
Employment Information
19. In how many positions are you currently employed as a nurse?
18. Do you plan to retire or leave nursing in the next five years?
20. How many hours do you work during a typical week in all your nursing positions?
16. What is your employment status? (Select all that apply)
17. If unemployed, please indicate the reasons. (Select all that apply)
Actively employed in nursing or in a position that requires a nurse license full-timeActively employed in nursing or in a position that requires a nurse license part-timeActively employed in nursing or in a position that requires a nurse license on a per-diem basisActively employed in a field other than nursing full-timeActively employed in a field other than nursing part-timeActively employed in a field other than nursing on aper-diem basisWorking in nursing only as a volunteerUnemployed, seeking work as a nurseUnemployed, not seeking work as a nurseRetired
Taking care of home and familyDisabledInadequate salarySchool Difficulty in finding a nursing positionOther
\
\
\
\\\
\\\\
\\\\\\
HOURS
15. Please indicate the states in which you are currently practicing as an RN, LPN or APRN:
(Select all that apply)
AKALARAZCACOCTDCDEFLGA
HIIAIDILINKSKYLAMAMDME
MIMNMOMSMTNCNDNENHNJNM
NVNYOHOKORPARISCSDTNTX
UTVAVTWAWIWVWYASGUMPVI
\\\\\\\\\\\
\\\\\\\\\\\
\\\\\\\\\\\
\\\\\\\\\\\
\\\\\\\\\\\
NoYes\ \
2 3 or more1\ \ \
22. Please estimate your 2019 pre-tax annual earnings from your primary nursing position. Include overtime and bonuses, but exclude sign-on bonuses.
23. Please identify the type of setting that most closely corresponds to your primary nursing practice position.
HospitalNursing Home/Extended CareAssisted Living FacilityHome HealthHospiceCorrectional FacilitySchool of NursingPublic HealthDialysis Center Community HealthSchool Health ServiceOccupational HealthAmbulatory Care SettingInsurance Claims/BenefitsPolicy/Planning/Regulatory/Licensing AgencyOther (Please specify)
\\\\\\\\\\\\\\\\
\\\\\\\\\\
0
1
2
3
4
5
6
7
8
9
\\\\\\\\\\
0
1
2
3
4
5
6
7
8
9
\\\\\\\\\\
0
1
2
3
4
5
6
7
8
9
\\\\\\\\\\
0
1
2
3
4
5
6
7
8
9
\\\\\\\\\\
0
1
2
3
4
5
6
7
8
9
\\\\\\\\\\
0
1
2
3
4
5
6
7
8
9
\\\\\\\\\\
0
1
2
3
4
5
6
7
8
9
EARNINGS
.00 per year$ , ,
21. Please indicate the zip code of your primary employer.
\\\\\\\\\\
0
1
2
3
4
5
6
7
8
9
\\\\\\\\\\
0
1
2
3
4
5
6
7
8
9
\\\\\\\\\\
0
1
2
3
4
5
6
7
8
9
\\\\\\\\\\
0
1
2
3
4
5
6
7
8
9
\\\\\\\\\\
0
1
2
3
4
5
6
7
8
9
ZIP CODE

www.journalofnursingregulation.com S89Volume 12/Supplement April 2021
T
TPageTHREE
||
|
|
|
26. Please identify the employment specialty that most closely corresponds to your primary nursing practice position.
Acute Care/Critical CareAdult HealthFamily HealthAnesthesiaCardiologyCommunityGeriatric/GerontologyHome HealthMaternal-Child Health/ObstetricsMedical SurgicalNephrologyOccupational HealthOncologyPalliative Care/HospicePediatricsNeonatalPerioperativePublic HealthPsychiatric/Mental Health/Substance AbuseRehabilitationSchool HealthEmergency/TraumaWomen’s HealthOther–Clinical specialties (Please specify)
Other–Non-clinical specialties (Please specify)
\\\\\\\\\\\\\\\\\\\\\\\\
\
24. Please identify the position title that most closely corresponds to your primary nursing practice position.
ConsultantNurse ResearcherNurse ExecutiveNurse ManagerNurse Faculty/EducatorAdvanced Practice Registered NurseStaff NurseCase ManagerOther–Health Related (Please specify)
Other–Not Health Related (Please specify)
\\\\\\\\\
\
27. Please identify the type of setting that most closely corresponds to your secondary nursing practice position.
No Secondary Practice PositionHospitalNursing Home/Extended CareAssisted Living FacilityHome HealthHospiceCorrectional FacilitySchool of NursingPublic HealthDialysis Center Community HealthSchool Health ServiceOccupational HealthAmbulatory Care SettingInsurance Claims/BenefitsPolicy/Planning/Regulatory/Licensing AgencyOther (Please specify)
\\\\\\\\\\\\\\\\\
28. Please identify the position title that most closely corresponds to your secondary nursing practice position.
No Secondary Practice PositionConsultantNurse ResearcherNurse ExecutiveNurse ManagerNurse Faculty/EducatorAdvanced Practice Registered NurseStaff NurseCase ManagerOther–Health Related (Please specify)
Other–Not Health Related (Please specify)
\\\\\\\\\\
\
29. In your secondary nursing practice position, do you spend the majority of your time providing direct patient care?
No Secondary Practice PositionYesNo
\\\
25. In your primary nursing practice position, do you spend the majority of your time providing direct patient care?
NoYes\ \

S90 Journal of Nursing Regulation
t
t
\\\\\\\\\\\\\\\\\\\\\\\\ SERIAL #DO NOT WRITE IN THIS AREA
PageFOUR
| | |
| |
Telehealth
Nurse Licensure Compact
31. What percentage of your work time do you estimate you provide nursing services or communicate with a patient or client located somewhere different from where you are located, via phone or electronically?
32. When providing nursing services or communicating with a remote patient or client via phone or electronically, what percentage of the time is it across a state border?
33. When providing nursing services or communicating with a remote patient or client via phone or electronically, what percentage of the time is it across an international border?
34. Please select the mode(s) of communication you use to provide nursing services, or communicate with, a remote patient or client. (Select all that apply)
Never1 – 25% 26 – 50%
Never1 – 25% 26 – 50%
51 – 75%76 – 100%
51 – 75%76 – 100%
Physical cross-border practiceTelehealthDistance educationDisaster supportOther:
Not applicable; I do not provide nursing services or communicate with remote patients or clients
Not applicable; I do not provide nursing services or communicate with remote patients or clientsNever1 – 25% 26 – 50%51 – 75%76 – 100%
Not applicable; I do not provide nursing services or communicate with remote patients or clientsElectronic messaging (ex: text message, instant message)Voice over internet protocol (VoIP) (Skype, FaceTime)Virtual ICU (also known as: tele-ICU, remote ICU, eICU)TelephoneEmailVideo callOther
\\\
\\\
\\
\\
\\\\\
\
\
\\\\\
\ \\\\\\\
Scantron EliteView™ M-291676-4:654321
30. Please identify the employment specialty that most closely corresponds to your secondary nursing practice position.
No Secondary Practice PositionAcute Care/Critical Care Adult HealthFamily HealthAnesthesiaCardiologyCommunityGeriatric/GerontologyHome HealthMaternal-Child Health/ObstetricsMedical SurgicalNephrologyOccupational HealthOncologyPalliative Care/HospicePediatricsNeonatalPerioperativePublic HealthPsychiatric/Mental Health/Substance AbuseRehabilitationSchool HealthEmergency/TraumaWomen’s HealthOther–Clinical specialties (Please specify)
Other–Non-clinical specialties (Please specify)
\\\\\\\\\\\\\\\\\\\\\\\\\
\ 35. Do you hold a multi-state license?
36. How have you used your multi-state license?
37. Please share any examples of how the multi-state license has enhanced or hindered your practice.
NoYes\ \
*If you hold a multi-state license, please answer the remaining questions. If you do not hold a multi-state license, you have completed the survey.

www.journalofnursingregulation.com S91Volume 12/Supplement April 2021
APPENDIX B
Impact of COVID-19 on Survey Responses
During data collection for the survey, the United States became engulfed in the COVID-19 pandemic. The response to the pandemic caused major shifts in the country’s workforce activities, which in-cluded a rapidly increasing workload for nurses on the “frontlines,” shifts in priorities for nurses not on the frontlines, and a tempo-rary closure of the physical sites for many businesses. Among those temporary business closures was the data processing center of the Workforce Survey’s vendor, Scantron. During the closure, a large volume of workforce survey responses was not processed. Scantron re-opened their offices in mid-April and spent the rest of the month catching up on the processing of the backlog of responses.
In an attempt to determine whether the COVID-19 pan-demic impacted the responses to the survey, a study was conducted that compared the answers to questions from surveys collected be-fore the pandemic to those received after the state of the workforce had changed. A “Pre-COVID” group of RNs and LPNs/LVNs was collected, whose data process date was identified as being March 11, 2020, or earlier (March 11 was the date a global pandemic was declared by the World Health Organization). A “Post-COVID” group of RNs and LPNs/LVNs was also collected, whose data pro-cess date was identified as being May 1, 2020, or later. May 1 was chosen because Scantron had caught up with the processing backlog by that date. Records from the interim period, when it could not be determined whether the response was sent to Scantron® before or after the pandemic took effect, were excluded from the analysis.
The Pre-COVID group of RNs consisted of 3,293 respon-dents whereas the Post-COVID group of RNs consisted of 9,871 respondents. For the LPNs/LVNs, the Pre-COVID group consisted of 1,622 respondents while the Post-COVID group consisted of 11,246 respondents. The distributions of the responses to all the sur-vey questions were calculated for the Pre-COVID and Post-COVID groups. For most of the survey questions, the differences between the response distributions for the Pre-COVID and Post-COVID groups were negligible for both the RN and LPN/LVN surveys. The exceptions for both license types were found in the responses to the gender, age, years licensed, employment status, and employ-ment setting questions:⦁ In the Pre-COVID RN group, 15.1% of the respondents were
male, whereas 8.5% of the respondents in the Post-COVID RN group were male. For LPNs/LVNs, 12.9% of the respondents in the Pre-COVID group were male, whereas 7.3% of the respon-dents in the Post-COVID group were male.
⦁ In the Pre-COVID RN group, the median age of the respondents was 42 years, whereas in the Post-COVID RN group the median age of the respondents was 52 years. For LPNs/LVNs, the median age of the respondents in the Pre-COVID group was 42 years, wheras the median age of the respondents in the Post-COVID group was 54 years.
⦁ In the Pre-COVID RN group, the median number of years that respondents were licensed was 12, whereas in the Post-COVID RN group, the median number of years the repondents were licensed was 20. For LPNs/LVNs, the median number of years licensed in the Pre-COVID group was 9, whereas the median number of years licensed in the Post-COVID group was 18.
⦁ In the Pre-COVID RN group, 75.3% of the respondents worked full-time, whereas 65.3% of the respondents in the Post-COVID RN group worked full-time. For LPNs/LVNs, 74.4% of the re-spondents in the Pre-COVID group worked full-time, whereas 66.2% of the respondents in the Post-COVID group worked full-time.
⦁ In the Pre-COVID RN group, 4.6% of the respondents were retired, whereas 12.1% of the respondents in the Post-COVID RN group were retired. For LPNs/LVNs, 2.4% of the respon-dents in the Pre-COVID group were retired, whereas 12.5% of the respondents in the Post-COVID group were retired.
⦁ In the Pre-COVID RN group, 62.2% of the respondents worked in hospitals, whereas 54.9% of the respondents in the Post-COVID RN group worked in hospitals. For LPNs/LVNs, 16.6% of the respondents in the Pre-COVID group worked in hospitals, whereas 12.9% of the respondents in the Post-COVID group worked in hospitals.
⦁ In the Pre-COVID RN group, 2.9% of the respondents worked in home health, wheras 5.1% of the respondents in the Post-COVID RN group worked in home health. For LPNs/LVNs, 8.9% of the respondents in the Pre-COVID group worked in home health, whereas 13.0% of the respondents in the Post-COVID group worked in home health.
In general, respondents prior to the pandemic were more likely to be younger, fully employed, and working in hospitals. Respondents after the pandemic were more likely to be older, re-tired, and working in home health (Appendix B).
A caveat: Without data from comparable comparisons in previous surveys, it cannot be determined whether the differences in responses are strictly due to the pandemic. It is quite possible that the different response patterns for the demographic variables (gender, age, years licensed) would also be found in earlier surveys. However, working full-time, retirement status, and working in hospitals could quite reasonably be a result of the pandemic.

S92 Journal of Nursing Regulation
APPENDIX C
Registered Nurse Nonresponse Analyses and Sample Weighting
A formal nonresponse bias analysis was conducted following the close of the survey. Although response rates are a valuable indicator of survey quality, they are not a good measure of response bias. An analysis of basic demographic data (i.e., gender, age, race/ethnic-ity, number of years since graduation, number of years since first licensed) for all registered nurse (RN) licensees sampled from the Nursys database was used to compare the survey respondents and nonrespondents to determine the representativeness of the survey participants.
Variables in the data file came from both the Nursys data-base (i.e., the frame data) and responses to the survey (i.e., survey data). The variables used in the nonresponse analysis were from the frame and include state, date of birth, gender, and ethnicity. The dependent variable in the analysis was whether or not the sampled RN population completed the questionnaire.
Preliminary Analysis
Of the 153,695 RNs in the sample frame, 42,021 responded for a response rate of 27.3%* (Table C1). Tables C2 and C3 show the frequencies for the categorical variables. Table 4 shows the descrip-tive statistics for age. The only demographic information used for the following analyses comes from Nursys, not the survey.
TABLE C1
Response Bias of Registered Nurses: Response Rate (N = 153,695)
Response Status n %
Nonresponse 111,674 72.7
Response 42,021 27.3
TABLE C2
Response Bias of Registered Nurses: Gender (N = 153,695)
Gender Response Variables n % Valid %
Valid Female 86,025 56.0 89.5
Male 10,065 6.5 10.5
Total 96,090 62.5 100.0
Missing Restricted/unknown 3,382 2.2
Missing 54,223 35.3
Total 57,605 37.5
* This response rate corresponds to the American Association of Public Opinion’s Response Rate 1 (the minimum response rate), in which the numerator is the number of completed questionnaires and the denominator is the total sample size. Retrieved from https://www.aapor.org/AAPOR_Main/media/publications/Standard-Definitions20169theditionfinal.pdf
TABLE C3
Response Bias of Registered Nurses: Race/Ethnicity (N = 153,695)
Race/Ethnicity Response Variables n % Valid %
Valid White 43,322 28.2 77.5
Black/African American
3,922 2.6 7.0
Asian 2,075 1.4 3.7
Hispanic 2,290 1.5 4.1
Native American 772 0.5 1.4
Pacific Islander 71 0.0 0.1
Other 3,418 2.2 6.1
Total 55,870 36.4 100.0
Missing Restricted/unknown 41,092 26.7
Missing 56,733 36.9
Total 97,825 63.6
TABLE C4
Response Bias of Registered Nurses: Descriptive Statistics for Age (N = 91,540)
M SD Min Max
Age in Years 46.8 13.7 20 92
Bivariate Analysis
Tables 5 and 6 show the bivariate relationships between the demo-graphic variables from the sample frame and whether or not the respondent completed the survey. There were far fewer men in the database (10,065 compared to 86,025 women) and they were less likely to complete the survey (20.3% compared to 28.5% among women).
TABLE C5
Response Bias of Registered Nurses: Survey Completion Rate by Gender
Gender n Complete Survey?
No Yes
Female 86,025 71.5% 28.5%
Male 10,065 79.7% 20.3%
Total 96,090 72.3% 27.7%
Note. χ2 (1, N = 96,090) = 309.6, p < .001.
As presented in Table 6, nurses who identified as Pacific Islander were most likely to respond, with a response rate of 29.6%. African

www.journalofnursingregulation.com S93Volume 12/Supplement April 2021
American nurses were least likely to respond, with a response rate of 19.0%.
TABLE C6
Response Bias of Registered Nurses: Survey Completion Rate by Race/Ethnicity
Race/Ethnicity n Complete Survey?
No Yes
White 43,322 72.0% 28.0%
African American 3,922 81.0% 19.0%
Hispanic 2,290 77.7% 22.3%
Asian 2,075 74.4% 25.6%
Native American 772 78.9% 21.1%
Pacific Islander 71 70.4% 29.6%
Other 3,418 71.4% 28.6%
Total 55,870 73.0% 27.0%
Note. χ2 (6, N = 55,870) = 198.0; p < .001.
Table C7 displays the mean age of RNs. On average, those who completed the survey were 4.9 years older than the nonrespondents. This relationship is statistically significant (p < .001).
TABLE C7
Response Bias of Registered Nurses: Differences in Mean Age by Survey Completion
Complete Survey? n Age in Years
M SD
No 65,632 45.4 13.2
Yes 25,908 50.3 14.3
Total 91,540 46.8 13.7
Note. A t test shows that the relationship is significant at the <.001 level.
Weights
In the 2015 and 2017 National Nursing Workforce Survey reports, nonresponse adjustments were made for gender and age. In 2020, nonresponse adjustments were again made for gender and age. There was a high degree of missing race/ethnicity data in the sample frame (63.6% missing/unknown). It was deemed impractical to use race/ethnicity for nonresponse adjustment even though there were dif-ferences in response rates by the category.
For the 2020 Survey, nonresponse adjustments were applied for gender and age in the jurisdictions for which data were obtained through the Nursys database. To create the combined age and gen-der (AgeGender) nonresponse weights (i.e., AgeGenderWgtC), the survey response rates for the age variable were compared at the
5-year age group level and neighboring cells with similar response rates were collapsed. Upon completion of this process, six age groups were created (16 (AuthorWas this the youngest age? Elsewher in the article, 17, 18, and 19 are used.) to 49, 50 to 54, 55 to 59, 60 to 64, 65 or older, missing). These six age groups were combined with the gender variable response categories (male, female, missing (AU: What about the “other” response option? (This question also per-tains to the relevant LPN/LVN section)) to produce 18 AgeGender categories. The survey response rate for each AgeGender category (# responding/# in sample frame) was calculated and used to create each category’s weight as follows:
AgeGender Category Weight = Overall Survey Response RateAgeGender Category Survey
Response Rate
As an example of how this was calculated, there were 1,479 RNs in the sample frame whose gender was identified as male and whose age was missing. Out of these 1,479 RNs, 251 responded. The AgeGender response rate for this category was determined to be 251/1479 = .1697. The overall survey response rate was 42021/153695 = .2734. Hence, the AgeGender weight for the age missing-gender male category was .2734/.1697 = 1.611.
When the AgeGender weights for each respondent are totaled up, the sum comes to 42,021—the same as the total number of respondents. Table C8 displays the weights for the 18 AgeGender categories in jurisdictions for which data were obtained through the Nursys database.
TABLE C8
Response Rate Bias of Registered Nurses: AgeGender Weights
Age in Years Missing Gender
Female Male
16–49 1.310 1.152 1.602
50–54 1.076 1.008 1.308
55–59 0.840 0.811 1.199
60–64 0.749 0.710 0.907
≥ 65 0.623 0.607 0.698
Age missing 1.030 1.118 1.611
In a similar manner, poststratification weights (i.e., JurisdictionWgtC) were constructed at the state level to adjust for differing sampling rates across states. These adjustments were made by comparing the number of responses to the number of licensees in that state. Analysis of the raw data, without accounting for the sample design, would lead to the overall results being too heavily influenced by states with fewer licensees.
For example, there were 444,964 licensed RNs in California, out of which 811 responded. The California response per license rate was 811/444964 = .0018. The overall response per license rate

S94 Journal of Nursing Regulation
was 42021/4948914 = .0085. Hence, the poststratification weight for California was .0085/.0018 = 4.659.
Overall weights (pct_wgtC), which combined the AgeGender and poststratification weights were created by multiplying the AgeGender and poststratification weights for each individual to create an initial set of weights, adding the initial weights together, and slightly adjusting the weights so that they summed 42,021.
The overall weights adjust the distribution across states, age, and gender but the sum is the actual number of RNs in the subset of completed responses. They can be applied when analyzing rela-tionships between variables without the effect of artificially altering the degrees of freedom and thereby affecting significance tests. The AgeGender weights, poststratification weights, and overall weights are summarized in Table C9.
TABLE C9
Response Bias of Registered Nurses: Descriptive Statistics of Weights, Complete Responses Only
n Min Max Sum Mean
AgeGender (AgeGenderWgtC)
42,021 0.607 1.611 42,021 1.000
Poststratification (JurisdictionWgtC)
42,021 0.082 4.659 42,021 1.000
Combined (pct_wgtC) 42,021 0.049 7.415 42,021 1.000
Note. Combined (pct_wgtC) was used in reporting results.
Licensed Practical Nurse/Licensed Vocational Nurse Nonresponse Analyses and Sample Weighting
As with the RNs, a formal nonresponse bias analysis was conducted on the licensed practical nurse/licensed vocational nurse (LPN/LVN) data following the close of the survey. Variables in the data file came from both the Nursys database (i.e., the frame data) and responses to the survey (i.e., survey data). The variables used in the nonre-sponse analysis were from the frame and include state, date of birth, gender, and race/ethnicity. The dependent variable in the analysis was whether or not the sampled LPN/LVN population completed the questionnaire.
Preliminary Analysis
Of the 166,217 LPNs/LVNs in the sample frame, 39,765 responded for a response rate of 23.9% (Table C10). Tables C11 and C12 show the frequencies for the categorical variables. Table C13 shows the descriptive statistics for age.
TABLE C10
Response Bias of Licensed Practical Nurses/Licensed Vocational Nurses: Response Rate
Response Status (n = 166,217) %
No 126,452 76.1
Yes 39,765 23.9
TABLE C11
Response Bias of Licensed Practical Nurses/Licensed Vocational Nurses: Gender
Gender Response Variables (n = 166,217) % Valid %
Valid Female 93,317 56.1 91.8%
Male 8,344 5.0 8.2%
Total 101,661 61.2 100.0%
Missing Restricted/unknown 1,033 0.6
Missing 63,523 38.2
Total 64,556 38.8
TABLE C12
Response Bias of Licensed Practical Nurses/Licensed Vocational Nurses: Race/Ethnicity
Race/Ethnicity Response Variables
(n = 166,217) % Valid %
Valid White 39,165 23.6% 73.4%
Black/African American
6,975 4.2% 13.1%
Asian 709 0.4% 1.3%
Hispanic 3,373 2.0% 6.3%
Native American 811 0.5% 1.5%
Pacific Islander 63 0.0% 0.1%
Other 2,233 1.3% 4.2%
Total 53,329 32.1% 100.0%
Missing Restricted/unknown 48,740 29.3%
Missing 64,148 38.6%
Total 112,888 67.9%

www.journalofnursingregulation.com S95Volume 12/Supplement April 2021
TABLE C13
Response Bias of Licensed Practical Nurses/Licensed Vocational Nurses: Descriptive Statistics for Age (n = 97,238)
M SD Min Max
Age in Years 47.0 13.6 19 93
Bivariate analysis
Tables 14 and 15 show the bivariate relationships between the de-mographic variables from the sample frame and whether or not the respondent completed the survey. There were far fewer men in the database (8,344 compared to 93,317 women), and they were less likely to complete the survey (17.2% compared to 24.6% among women).
TABLE C14
Response Bias of Licensed Practical Nurses/Licensed Vocational Nurses: Survey Completion Rate by Gender
Gender n Complete Survey?
No Yes
Female 93,317 75.4% 24.6%
Male 8,344 82.8% 17.2%
Total 101,661 76.0% 24.0%
Note. χ2 (1, N = 101,661) = 229.8, p < .001.
From Table C15, LPNs/LVNs who identified as White were most likely to respond, with a response rate of 25.7%. African American nurses were least likely to respond, with a response rate of 17.8%.
TABLE C15
Response Bias of Licensed Practical Nurses/Licensed Vocational Nurses: Survey Completion Rate by Race/Ethnicity
Race/Ethnicity n Complete Survey?
No Yes
White 39,165 74.3% 25.7%
African American 6,975 82.2% 17.8%
Asian 709 76.2% 23.8%
Hispanic 3,373 80.3% 19.7%
Native American 811 79.8% 20.2%
Pacific Islander 63 81.0% 19.0%
Race/Ethnicity n Complete Survey?
No Yes
Other 2,233 78.9% 21.1%
Total 53,329 76.0% 24.0%
Note. χ2 (6, N = 53,329) = 258.5, p < .001.
Table C16 displays the mean age of LPNs/LVNs. On aver-age, those who completed the survey were 5.3 years older than the nonrespondents. This relationship is statistically significant.
TABLE C16
Response Bias of Licensed Practical Nurses/Licensed Vocational Nurses: Differences in Mean Age by Survey
Complete Survey? n Age in Years
M SD
No 73,806 45.7 13.2
Yes 23,432 51.0 14.0
Total 97,238 47.0 13.6
Note. A t test shows that this relationship is significant at the <.001 level.
Weights
In the 2015 and 2017 National Nursing Workforce Survey reports, nonresponse adjustments were made for gender and age. Due to the high degree of missing race/ethnicity data in the sample frame (67.9% missing/unknown), it was still deemed impractical to use that category for nonresponse adjustment.
To create the combined age and gender (AgeGender) nonre-sponse weights (i.e., AgeGenderWgtC), the survey response rates for the age variable were compared at the 5-year age group level, and neighboring cells with similar response rates were collapsed. Upon completion of this process, six age groups were created (16 to 49, 50 to 54, 55 to 59, 60 to 64, 65 or older, missing). These six age groups were combined with the gender variable response categories (male, female, missing) to produce 18 AgeGender categories. The survey response rate for each age-gender category (# responding/# in sample frame) was calculated and used to create each category’s weight, as follows:
AgeGender Category Weight = Overall Survey Response RateAgeGender Category Survey
Response Rate
An example of how this was calculated can be found in the RN nonresponse sample weighting section.
When the AgeGender weights for each respondent are to-taled, the sum comes to 39,765—the same as the total number of respondents. Table C17 displays the weights for the 18 AgeGender

S96 Journal of Nursing Regulation
categories in jurisdictions for which data were obtained through the Nursys database.
TABLE C17
Response Bias of Licensed Practical Nurses/Licensed Vocational Nurses: AgeGender Weights
Age in Years Gender
Missing Female Male
18 to 49 1.496 1.253 1.715
50 to 54 1.177 0.977 1.355
55 to 59 0.944 0.799 1.187
60 to 64 0.765 0.697 1.049
65 or older 0.665 0.592 0.745
Age missing 0.993 1.078 1.435
In a similar manner poststratification weights (i.e., JurisdictionWgtC) were constructed at the state level to adjust for differing sampling rates across states. However, these adjustments were made not by comparing the number of responses in a state to its sample frame count, but rather by comparing the number of responses to the number of licensees in that state. An example of how these weights were calculated can be found in the RN nonre-sponse sample weighting section.
Overall weights (pct_wgtC), which combined the AgeGender and poststratification weights, were created by multiplying the AgeGender and poststratification weights for each individual to create an initial set of weights, adding the initial weights together, and slightly adjusting the weights so that they sum up to 39,765.
The overall weights simply adjust the distribution across states, age, and gender but sum to the actual number of LPNs/LVNs in the subset of completed responses. They can be applied when analyzing relationships between variables without the effect of artificially altering the degrees of freedom and thereby affecting sig-nificance tests. The AgeGender weights, poststratification weights, and overall weights for LPNs/LVNs are summarized in Table C18.
TABLE C18
Response Bias of Licensed Practical Nurses/Licensed Vocational Nurses: Descriptive Statistics of Weights, Complete Responses Only
n Min Max Sum Mean
AgeGender (AgeGenderWgtC)
39,765 0.592 1.715 39,765 1.000
Poststratification (JurisdictionWgtC)
39,765 0.117 5.270 39,765 1.000
n Min Max Sum Mean
Combined (pct_wgtC)
39,765 0.083 7.059 39,765 1.000
Note. pct_wgtC was used in reporting results.