The 2010 Very High Energy γ-Ray Flare and 10 Years of Multi-wavelength Observations of M 87
19
Draft version November 24, 2011 Preprint typeset using L A T E X style emulateapj v. 11/10/09 THE 2010 VERY HIGH ENERGY γ-RAY FLARE & 10 YEARS OF MULTI-WAVELENGTH OBSERVATIONS OF M87 The H.E.S.S. Collaboration: A. Abramowski 1 , F. Acero 2 , F. Aharonian 3,4,5 , A.G. Akhperjanian 6,5 , G. Anton 7 , A. Balzer 7 , A. Barnacka 8,9 , U. Barres de Almeida 10 ,Y.Becherini 11,12 , J. Becker 13 , B. Behera 14 , K. Bernl ¨ ohr 3,15 , E. Birsin 15 , J. Biteau 12 , A. Bochow 3 , C. Boisson 16 , J. Bolmont 17 , P. Bordas 18 , J. Brucker 7 , F. Brun 12 , P. Brun 9 , T. Bulik 19 , I. B ¨ usching 20,13 , S. Carrigan 3 , S. Casanova 13 , M. Cerruti 16 , P.M. Chadwick 10 , A. Charbonnier 17 , R.C.G. Chaves 3 , A. Cheesebrough 10 , A.C. Clapson 3 , G. Coignet 21 , G. Cologna 14 , J. Conrad 22 , M. Dalton 15 , M.K. Daniel 10 , I.D. Davids 23 , B. Degrange 12 , C. Deil 3 , H.J. Dickinson 22 , A. Djannati-A ta¨ ı 11 , W. Domainko 3 , L.O’C. Drury 4 , G. Dubus 24 , K. Dutson 25 , J. Dyks 8 , M. Dyrda 26 , K. Egberts 27 , P. Eger 7 , P. Espigat 11 , L. F allon 4 , C. F arnier 2 , S. Fegan 12 , F. Feinstein 2 , M.V. Fernandes 1 , A. Fiasson 21 , G. Fontaine 12 , A. F ¨ orster 3 , M. F ¨ ußling 15 , Y.A. Gallant 2 , H. Gast 3 , L. G´ erard 11 , D. Gerbig 13 , B. Giebels 12 , J.F. Glicenstein 9 , B. Gl ¨ uck 7 , P. Goret 9 , D. G ¨ oring 7 , S. H ¨ affner 7 , J.D. Hague 3 , D. Hampf 1 , M. Hauser 14 , S. Heinz 7 , G. Heinzelmann 1 , G. Henri 24 , G. Hermann 3 , J.A. Hinton 25 , A. Hoffmann 18 , W. Hofmann 3 , P. Hofverberg 3 , M. Holler 7 , D. Horns 1 , A. J acholkowska 17 , O.C. de J ager 20 , C. J ahn 7 , M. J amrozy 28 , I. Jung 7 , M.A. Kastendieck 1 , K. Katarzy ´ nski 29 , U. Katz 7 , S. Kaufmann 14 , D. Keogh 10 , D. Khangulyan 3 , B. Kh´ elifi 12 , D. Klochkov 18 , W. Klu´ zniak 8 , T. Kneiske 1 ,Nu.Komin 21 , K. Kosack 9 , R. Kossakowski 21 , H. Laffon 12 , G. Lamanna 21 , D. Lennarz 3 , T. Lohse 15 , A. Lopatin 7 , C.-C. Lu 3 ,V.Marandon 11 , A. Marcowith 2 , J. Masbou 21 , D. Maurin 17 , N. Maxted 30 , M. Mayer 7 , T.J.L. McComb 10 , M.C. Medina 9 , J. M´ ehault 2 , R. Moderski 8 , E. Moulin 9 , C.L. Naumann 17 , M. Naumann-Godo 9 , M. de Naurois 12 , D. Nedbal 31 , D. Nekrassov 3 , N. Nguyen 1 , B. Nicholas 30 , J. Niemiec 26 , S.J. Nolan 10 , S. Ohm 32,25,3 , E. de O˜ na Wilhelmi 3 , B. Opitz 1 , M. Ostrowski 28 , I. Oya 15 , M. P anter 3 , M. P az Arribas 15 , G. Pedaletti 14 , G. Pelletier 24 , P.-O. Petrucci 24 , S. Pita 11 , G. P ¨ uhlhofer 18 , M. Punch 11 , A. Quirrenbach 14 , M. Raue 1,* , S.M. Rayner 10 , A. Reimer 27 , O. Reimer 27 , M. Renaud 2 , R. de los Reyes 3 , F. Rieger 3,33 , J. Ripken 22 , L. Rob 31 , S. Rosier-Lees 21 , G. Rowell 30 , B. Rudak 8 , C.B. Rulten 10 , J. Ruppel 13 ,V.Sahakian 6,5 , D.A. Sanchez 3 , A. Santangelo 18 , R. Schlickeiser 13 , F.M. Sch ¨ ock 7 , A. Schulz 7 , U. Schwanke 15 , S. Schwarzburg 18 , S. Schwemmer 14 , F. Sheidaei 11,20 , J.L. Skilton 3 , H. Sol 16 , G. Spengler 15 , L. Stawarz 28,* , R. Steenkamp 23 , C. Stegmann 7 , F. Stinzing 7 , K. Stycz 7 , I. Sushch 15 , A. Szostek 28 , J.-P. T avernet 17 , R. Terrier 11 , M. Tluczykont 1 , K. V alerius 7 , C. van Eldik 3 , G. V asileiadis 2 , C. Venter 20 , J.P. Vialle 21 , A. Viana 9 , P. Vincent 17 , H.J. V ¨ olk 3 , F. Volpe 3 , S. Vorobiov 2 , M. Vorster 20 , S.J. W agner 14 , M. W ard 10 , R. White 25 , A. Wierzcholska 28 , M. Zacharias 13 , A. Zajczyk 8,2 , A.A. Zdziarski 8 , A. Zech 16 , H.-S. Zechlin 1 , and The MAGIC Collaboration: J. Aleksi ´ c 34 , L. A. Antonelli 35 , P. Antoranz 36 , M. Backes 37 , J. A. Barrio 38 , D. Bastieri 39 , J. Becerra Gonz ´ alez 40 , W. Bednarek 41 , A. Berdyugin 42 , K. Berger 40 , E. Bernardini 43 , A. Biland 44 , O. Blanch 34 , R. K. Bock 45 , A. Boller 44 , G. Bonnoli 35 , D. Borla Tridon 45 , I. Braun 44 , T. Bretz 46 , A. Ca ˜ nellas 47 , E. Carmona 45 , A. Carosi 35 , P. Colin 45,* , E. Colombo 40 , J. L. Contreras 38 , J. Cortina 34 , L. Cossio 48 , S. Covino 35 , F. Dazzi 48 , A. De Angelis 48 , E. De Cea del Pozo 49 , B. De Lotto 48 , C. Delgado Mendez 40 , A. Diago Ortega 40 , M. Doert 37 , A. Dom´ ınguez 50 , D. Dominis Prester 51 , D. Dorner 44 , M. Doro 52 , D. Elsaesser 46 , D. Ferenc 51 , M. V. Fonseca 38 , L. Font 52 , C. Fruck 45 , R. J. Garc´ ıa L´ opez 40 , M. Garczarczyk 40 , D. Garrido 52 , G. Giavitto 34 , N. Godinovi ´ c 51 , D. Hadasch 49 , D. H¨ afner 45 , A. Herrero 40 , D. Hildebrand 44 , D. H ¨ ohne-M¨ onch 46 , J. Hose 45 , D. Hrupec 51 , B. Huber 44 , T. Jogler 45 , S. Klepser 34 , T. Kr ¨ ahenb ¨ uhl 44 , J. Krause 45 , A. La Barbera 35 , D. Lelas 51 , E. Leonardo 36 , E. Lindfors 42 , S. Lombardi 39 , M. L ´ opez 38 , E. Lorenz 44 , M. Makariev 53 , G. Maneva 53 , N. Mankuzhiyil 48 , K. Mannheim 46 , L. Maraschi 35 , M. Mariotti 39 , M. Mart´ ınez 34 , D. Mazin 34,* , M. Meucci 36 , J. M. Miranda 36 , R. Mirzoyan 45 , H. Miyamoto 45 , J. Mold ´ on 47 , A. Moralejo 34 , P. Munar 47 , D. Nieto 38 , K. Nilsson 42 , R. Orito 45 , I. Oya 38 , D. P aneque 45 , R. P aoletti 36 , S. P ardo 38 , J. M. P aredes 47 , S. P artini 36 , M. P asanen 42 , F. P auss 44 , M. A. Perez-Torres 34 , M. Persic 48 , L. Peruzzo 39 , M. Pilia 54 , J. Pochon 40 , F. Prada 50 , P. G. Prada Moroni 55 , E. Prandini 39 , I. Puljak 51 , I. Reichardt 34 , R. Reinthal 42 , W. Rhode 37 , M. Rib ´ o 47 , J. Rico 56 , S. R ¨ ugamer 46 , A. Saggion 39 , K. Saito 45 ,T. Y. Saito 45 , M. Salvati 35 , K. Satalecka 43 ,V.Scalzotto 39 ,V.Scapin 38 , C. Schultz 39 , T. Schweizer 45 , M. Shayduk 45 , S. N. Shore 55 , A. Sillanp ¨ a ¨ a 42 , J. Sitarek 41 , D. Sobczynska 41 , F. Spanier 46 , S. Spiro 35 , A. Stamerra 36 , B. Steinke 45 , J. Storz 46 , N. Strah 37 , T. Suri ´ c 51 , L. T akalo 42 , H. T akami 45 , F. T avecchio 35 , P. Temnikov 53 , T. Terzi ´ c 51 , D. Tescaro 55 , M. Teshima 45 , M. Thom 37 , O. Tibolla 46 , D. F. Torres 56 , A. Treves 54 , H. V ankov 53 , P. Vogler 44 , R. M. W agner 45 , Q. Weitzel 44 , V. Zabalza 47 , F. Zandanel 50 , R. Zanin 34 , and The VERITAS Collaboration: T. Arlen 57 , T. Aune 58 , M. Beilicke 59,* , W. Benbow 60 , A. Bouvier 58 , S. M. Bradbury 61 , J. H. Buckley 59 , V. Bugaev 59 , K. Byrum 62 , A. Cannon 63 , A. Cesarini 64 , L. Ciupik 65 , M. P. Connolly 64 , W. Cui 66 , R. Dickherber 59 , C. Duke 67 , M. Errando 68 , A. F alcone 69 , J. P. Finley 66 , G. Finnegan 70 , L. Fortson 71 , A. Furniss 58 , N. Galante 60 , D. Gall 72 , S. Godambe 70 , S. Griffin 73 , J. Grube 65 , G. Gyuk 65 , D. Hanna 73 , J. Holder 74 , H. Huan 75 , C. M. Hui 70,* , P. Kaaret 72 , N. Karlsson 71 , M. Kertzman 76 ,Y.Khassen 63 , D. Kieda 70 , H. Krawczynski 59 , F. Krennrich 77 , M. J. Lang 64 , S. LeBohec 70 , G. Maier 78 , S. McArthur 59 , A. McCann 73 , P. Moriarty 79 , R. Mukherjee 68 , P. D Nu ˜ nez 70 , R. A. Ong 57 , M. Orr 77 , A. N. Otte 58 , N. P ark 75 , J. S. Perkins 80,81 , A. Pichel 82 , M. Pohl 83,78 , H. Prokoph 78 , K. Ragan 73 , L. C. Reyes 75 , P. T. Reynolds 84 , E. Roache 60 , H. J. Rose 61 , J. Ruppel 83,78 , M. Schroedter 60 , G. H. Sembroski 66 , G. D. S ¸ ent ¨ urk 68 , I. Telezhinsky 83,78 , G. Teˇ si ´ c 73 , M. Theiling 60 , S. Thibadeau 59 , A. V arlotta 66 ,V. V. V assiliev 57 , M. Vivier 74 , S. P. W akely 75 , T. C. Weekes 60 , D. A. Williams 58 , B. Zitzer 66 , and U. Barres de Almeida 45 , M. Cara 85 , C. Casadio 86,50 , C.C. Cheung 87 , W. McConville 88,89 , F. Davies 90 , A. Doi 91 , G. Giovannini 86,92 , M. Giroletti 86 , K. Hada 93,94 , P. Hardee 95 , D. E. Harris 96 , W. Junor 97 , M. Kino 94 , N.P. Lee 96 , C. L y 98 , J. Madrid 99 , F. Massaro 96 , C. G. Mundell 100 , H. Nagai 94 , E. S. Perlman 85 , I. A. Steele 100 , R.C. W alker 101 , D.L. Wood 102 Draft version November 24, 2011 ABSTRACT The giant radio galaxy M 87 with its proximity (16 Mpc), famous jet, and very massive black hole ((3 - 6) × 10 9 M ) provides a unique opportunity to investigate the origin of very high energy (VHE; E>100 GeV) γ-ray emission generated in relativistic outflows and the surroundings of super-massive black holes. M87 has been established as a VHE γ-ray emitter since 2006. The VHE γ-ray emission displays strong variability on timescales as short as a day. In this paper, results from a joint VHE monitoring campaign on M87 by the MAGIC and VERITAS instruments in 2010 are reported. During the campaign, a flare at VHE was detected arXiv:1111.5341v1 [astro-ph.CO] 22 Nov 2011
-
Upload
independent -
Category
Documents
-
view
2 -
download
0
Transcript of The 2010 Very High Energy γ-Ray Flare and 10 Years of Multi-wavelength Observations of M 87
Draft version November 24, 2011Preprint typeset using LATEX style emulateapj v. 11/10/09
THE 2010 VERY HIGH ENERGY γ-RAY FLARE & 10 YEARS OF MULTI-WAVELENGTH OBSERVATIONS OF M 87
The H.E.S.S. Collaboration: A. Abramowski1, F. Acero2, F. Aharonian3,4,5, A.G. Akhperjanian6,5, G. Anton7, A. Balzer7, A. Barnacka8,9,U. Barres de Almeida10, Y. Becherini11,12, J. Becker13, B. Behera14, K. Bernlohr3,15, E. Birsin15, J. Biteau12, A. Bochow3, C. Boisson16,
J. Bolmont17, P. Bordas18, J. Brucker7, F. Brun12, P. Brun9, T. Bulik19, I. Busching20,13, S. Carrigan3, S. Casanova13, M. Cerruti16,P.M. Chadwick10, A. Charbonnier17, R.C.G. Chaves3, A. Cheesebrough10, A.C. Clapson3, G. Coignet21, G. Cologna14, J. Conrad22,
M. Dalton15, M.K. Daniel10, I.D. Davids23, B. Degrange12, C. Deil3, H.J. Dickinson22, A. Djannati-Ataı11, W. Domainko3, L.O’C. Drury4,G. Dubus24, K. Dutson25, J. Dyks8, M. Dyrda26, K. Egberts27, P. Eger7, P. Espigat11, L. Fallon4, C. Farnier2, S. Fegan12, F. Feinstein2,
M.V. Fernandes1, A. Fiasson21, G. Fontaine12, A. Forster3, M. Fußling15, Y.A. Gallant2, H. Gast3, L. Gerard11, D. Gerbig13, B. Giebels12,J.F. Glicenstein9, B. Gluck7, P. Goret9, D. Goring7, S. Haffner7, J.D. Hague3, D. Hampf1, M. Hauser14, S. Heinz7, G. Heinzelmann1,G. Henri24, G. Hermann3, J.A. Hinton25, A. Hoffmann18, W. Hofmann3, P. Hofverberg3, M. Holler7, D. Horns1, A. Jacholkowska17,
O.C. de Jager20, C. Jahn7, M. Jamrozy28, I. Jung7, M.A. Kastendieck1, K. Katarzynski29, U. Katz7, S. Kaufmann14, D. Keogh10,D. Khangulyan3, B. Khelifi12, D. Klochkov18, W. Kluzniak8, T. Kneiske1, Nu. Komin21, K. Kosack9, R. Kossakowski21, H. Laffon12,
G. Lamanna21, D. Lennarz3, T. Lohse15, A. Lopatin7, C.-C. Lu3, V. Marandon11, A. Marcowith2, J. Masbou21, D. Maurin17, N. Maxted30,M. Mayer7, T.J.L. McComb10, M.C. Medina9, J. Mehault2, R. Moderski8, E. Moulin9, C.L. Naumann17, M. Naumann-Godo9, M. de Naurois12,
D. Nedbal31, D. Nekrassov3, N. Nguyen1, B. Nicholas30, J. Niemiec26, S.J. Nolan10, S. Ohm32,25,3, E. de Ona Wilhelmi3, B. Opitz1,M. Ostrowski28, I. Oya15, M. Panter3, M. Paz Arribas15, G. Pedaletti14, G. Pelletier24, P.-O. Petrucci24, S. Pita11, G. Puhlhofer18,
M. Punch11, A. Quirrenbach14, M. Raue1,*, S.M. Rayner10, A. Reimer27, O. Reimer27, M. Renaud2, R. de los Reyes3, F. Rieger3,33, J. Ripken22,L. Rob31, S. Rosier-Lees21, G. Rowell30, B. Rudak8, C.B. Rulten10, J. Ruppel13, V. Sahakian6,5, D.A. Sanchez3, A. Santangelo18,
R. Schlickeiser13, F.M. Schock7, A. Schulz7, U. Schwanke15, S. Schwarzburg18, S. Schwemmer14, F. Sheidaei11,20, J.L. Skilton3, H. Sol16,G. Spengler15, Ł. Stawarz28,*, R. Steenkamp23, C. Stegmann7, F. Stinzing7, K. Stycz7, I. Sushch15, A. Szostek28, J.-P. Tavernet17,
R. Terrier11, M. Tluczykont1, K. Valerius7, C. van Eldik3, G. Vasileiadis2, C. Venter20, J.P. Vialle21, A. Viana9, P. Vincent17, H.J. Volk3,F. Volpe3, S. Vorobiov2, M. Vorster20, S.J. Wagner14, M. Ward10, R. White25, A. Wierzcholska28, M. Zacharias13, A. Zajczyk8,2,
A.A. Zdziarski8, A. Zech16, H.-S. Zechlin1,and
The MAGIC Collaboration: J. Aleksic34, L. A. Antonelli35, P. Antoranz36, M. Backes37, J. A. Barrio38, D. Bastieri39, J. Becerra
Gonzalez40, W. Bednarek41, A. Berdyugin42, K. Berger40, E. Bernardini43, A. Biland44, O. Blanch34, R. K. Bock45, A. Boller44,G. Bonnoli35, D. Borla Tridon45, I. Braun44, T. Bretz46, A. Canellas47, E. Carmona45, A. Carosi35, P. Colin45,*, E. Colombo40,
J. L. Contreras38, J. Cortina34, L. Cossio48, S. Covino35, F. Dazzi48, A. De Angelis48, E. De Cea del Pozo49, B. De Lotto48, C. Delgado
Mendez40, A. Diago Ortega40, M. Doert37, A. Domınguez50, D. Dominis Prester51, D. Dorner44, M. Doro52, D. Elsaesser46, D. Ferenc51,M. V. Fonseca38, L. Font52, C. Fruck45, R. J. Garcıa Lopez40, M. Garczarczyk40, D. Garrido52, G. Giavitto34, N. Godinovic51, D. Hadasch49,
D. Hafner45, A. Herrero40, D. Hildebrand44, D. Hohne-Monch46, J. Hose45, D. Hrupec51, B. Huber44, T. Jogler45, S. Klepser34,T. Krahenbuhl44, J. Krause45, A. La Barbera35, D. Lelas51, E. Leonardo36, E. Lindfors42, S. Lombardi39, M. Lopez38, E. Lorenz44,
M. Makariev53, G. Maneva53, N. Mankuzhiyil48, K. Mannheim46, L. Maraschi35, M. Mariotti39, M. Martınez34, D. Mazin34,*, M. Meucci36,J. M. Miranda36, R. Mirzoyan45, H. Miyamoto45, J. Moldon47, A. Moralejo34, P. Munar47, D. Nieto38, K. Nilsson42, R. Orito45, I. Oya38,
D. Paneque45, R. Paoletti36, S. Pardo38, J. M. Paredes47, S. Partini36, M. Pasanen42, F. Pauss44, M. A. Perez-Torres34, M. Persic48,L. Peruzzo39, M. Pilia54, J. Pochon40, F. Prada50, P. G. Prada Moroni55, E. Prandini39, I. Puljak51, I. Reichardt34, R. Reinthal42, W. Rhode37,
M. Ribo47, J. Rico56, S. Rugamer46, A. Saggion39, K. Saito45, T. Y. Saito45, M. Salvati35, K. Satalecka43, V. Scalzotto39, V. Scapin38,C. Schultz39, T. Schweizer45, M. Shayduk45, S. N. Shore55, A. Sillanpaa42, J. Sitarek41, D. Sobczynska41, F. Spanier46, S. Spiro35,
A. Stamerra36, B. Steinke45, J. Storz46, N. Strah37, T. Suric51, L. Takalo42, H. Takami45, F. Tavecchio35, P. Temnikov53, T. Terzic51,D. Tescaro55, M. Teshima45, M. Thom37, O. Tibolla46, D. F. Torres56, A. Treves54, H. Vankov53, P. Vogler44, R. M. Wagner45, Q. Weitzel44,
V. Zabalza47, F. Zandanel50, R. Zanin34,and
The VERITAS Collaboration: T. Arlen57, T. Aune58, M. Beilicke59,*, W. Benbow60, A. Bouvier58, S. M. Bradbury61, J. H. Buckley59,V. Bugaev59, K. Byrum62, A. Cannon63, A. Cesarini64, L. Ciupik65, M. P. Connolly64, W. Cui66, R. Dickherber59, C. Duke67, M. Errando68,
A. Falcone69, J. P. Finley66, G. Finnegan70, L. Fortson71, A. Furniss58, N. Galante60, D. Gall72, S. Godambe70, S. Griffin73, J. Grube65,G. Gyuk65, D. Hanna73, J. Holder74, H. Huan75, C. M. Hui70,*, P. Kaaret72, N. Karlsson71, M. Kertzman76, Y. Khassen63, D. Kieda70,
H. Krawczynski59, F. Krennrich77, M. J. Lang64, S. LeBohec70, G. Maier78, S. McArthur59, A. McCann73, P. Moriarty79, R. Mukherjee68,P. D Nunez70, R. A. Ong57, M. Orr77, A. N. Otte58, N. Park75, J. S. Perkins80,81, A. Pichel82, M. Pohl83,78, H. Prokoph78, K. Ragan73,
L. C. Reyes75, P. T. Reynolds84, E. Roache60, H. J. Rose61, J. Ruppel83,78, M. Schroedter60, G. H. Sembroski66, G. D. Senturk68,I. Telezhinsky83,78, G. Tesic73, M. Theiling60, S. Thibadeau59, A. Varlotta66, V. V. Vassiliev57, M. Vivier74, S. P. Wakely75, T. C. Weekes60,
D. A. Williams58, B. Zitzer66,and
U. Barres de Almeida45, M. Cara85, C. Casadio86,50, C.C. Cheung87, W. McConville88,89, F. Davies90, A. Doi91, G. Giovannini86,92,M. Giroletti86, K. Hada93,94, P. Hardee95, D. E. Harris96, W. Junor97, M. Kino94, N.P. Lee96, C. Ly98, J. Madrid99, F. Massaro96,
C. G. Mundell100, H. Nagai94, E. S. Perlman85, I. A. Steele100, R.C. Walker101, D.L. Wood102
Draft version November 24, 2011
ABSTRACTThe giant radio galaxy M 87 with its proximity (16 Mpc), famous jet, and very massive black hole ((3 −
6) × 109M�) provides a unique opportunity to investigate the origin of very high energy (VHE; E>100 GeV)γ-ray emission generated in relativistic outflows and the surroundings of super-massive black holes. M 87 hasbeen established as a VHE γ-ray emitter since 2006. The VHE γ-ray emission displays strong variability ontimescales as short as a day. In this paper, results from a joint VHE monitoring campaign on M 87 by theMAGIC and VERITAS instruments in 2010 are reported. During the campaign, a flare at VHE was detected
arX
iv:1
111.
5341
v1 [
astr
o-ph
.CO
] 2
2 N
ov 2
011
2 The H.E.S.S., MAGIC, & VERITAS Collaborations and the M 87 MWL Monitoring Team
triggering further observations at VHE (H.E.S.S.), X-rays (Chandra), and radio (43 GHz VLBA). The excellentsampling of the VHE γ-ray light curve enables one to derive a precise temporal characterization of the flare: thesingle, isolated flare is well described by a two-sided exponential function with significantly different flux riseand decay times of τrise
d = (1.69 ± 0.30) days and τdecayd = (0.611 ± 0.080) days, respectively. While the overall
variability pattern of the 2010 flare appears somewhat different from that of previous VHE flares in 2005 and2008, they share very similar timescales (∼day), peak fluxes (Φ>0.35 TeV ' (1 − 3) × 10−11 ph cm−2 s−1), andVHE spectra. 43 GHz VLBA radio observations of the inner jet regions indicate no enhanced flux in 2010 incontrast to observations in 2008, where an increase of the radio flux of the innermost core regions coincidedwith a VHE flare. On the other hand, Chandra X-ray observations taken ∼ 3 days after the peak of the VHEγ-ray emission reveal an enhanced flux from the core (flux increased by factor ∼ 2; variability timescale < 2days). The long-term (2001-2010) multi-wavelength (MWL) light curve of M 87, spanning from radio to VHEand including data from HST , LT, VLA and EVN, is used to further investigate the origin of the VHE γ-rayemission. No unique, common MWL signature of the three VHE flares has been identified. In the outer kpcjet region, in particular in HST-1, no enhanced MWL activity was detected in 2008 and 2010, disfavoring itas the origin of the VHE flares during these years. Shortly after two of the three flares (2008 and 2010), theX-ray core was observed to be at a higher flux level than its characteristic range (determined from more than60 monitoring observations: 2002-2009). In 2005, the strong flux dominance of HST-1 could have suppressedthe detection of such a feature. Published models for VHE γ-ray emission from M 87 are reviewed in the lightof the new data.Subject headings: galaxies: active – galaxies: individual (M 87) – gamma rays: galaxies – galaxies:jets; nuclei
– radiation mechanisms: non-thermal
* Correspondence and requests for material should be sent to M. Raue([email protected]), L. Stawarz ([email protected]),D. Mazin ([email protected]), P. Colin ([email protected]),C. M. Hui ([email protected]), and M. Beilicke ([email protected]).
1 Universitat Hamburg, Institut fur Experimentalphysik, LuruperChaussee 149, D 22761 Hamburg, Germany
2 Laboratoire Univers et Particules de Montpellier, Universite Montpel-lier 2, CNRS/IN2P3, CC 72, Place Eugene Bataillon, F-34095 MontpellierCedex 5, France
3 Max-Planck-Institut fur Kernphysik, P.O. Box 103980, D 69029Heidelberg, Germany
4 Dublin Institute for Advanced Studies, 31 Fitzwilliam Place, Dublin2, Ireland
5 National Academy of Sciences of the Republic of Armenia, Yerevan6 Yerevan Physics Institute, 2 Alikhanian Brothers St., 375036 Yerevan,
Armenia7 Universitat Erlangen-Nurnberg, Physikalisches Institut, Erwin-
Rommel-Str. 1, D 91058 Erlangen, Germany8 Nicolaus Copernicus Astronomical Center, ul. Bartycka 18, 00-716
Warsaw, Poland9 CEA Saclay, DSM/IRFU, F-91191 Gif-Sur-Yvette Cedex, France10 University of Durham, Department of Physics, South Road, Durham
DH1 3LE, U.K.11 Astroparticule et Cosmologie (APC), CNRS, Universite Paris 7
Denis Diderot, 10, rue Alice Domon et Leonie Duquet, F-75205 ParisCedex 13, France (UMR 7164: CNRS, Universite Paris VII, CEA,Observatoire de Paris)
12 Laboratoire Leprince-Ringuet, Ecole Polytechnique, CNRS/IN2P3,F-91128 Palaiseau, France
13 Institut fur Theoretische Physik, Lehrstuhl IV: Weltraum und Astro-physik, Ruhr-Universitat Bochum, D 44780 Bochum, Germany
14 Landessternwarte, Universitat Heidelberg, Konigstuhl, D 69117Heidelberg, Germany
15 Institut fur Physik, Humboldt-Universitat zu Berlin, Newtonstr. 15,D 12489 Berlin, Germany
16 LUTH, Observatoire de Paris, CNRS, Universite Paris Diderot, 5Place Jules Janssen, 92190 Meudon, France
17 LPNHE, Universite Pierre et Marie Curie Paris 6, Universite DenisDiderot Paris 7, CNRS/IN2P3, 4 Place Jussieu, F-75252, Paris Cedex 5,France
18 Institut fur Astronomie und Astrophysik, Universitat Tubingen, Sand1, D 72076 Tubingen, Germany
19 Astronomical Observatory, The University of Warsaw, Al. Ujaz-dowskie 4, 00-478 Warsaw, Poland
20 Unit for Space Physics, North-West University, Potchefstroom 2520,South Africa
21 Laboratoire d’Annecy-le-Vieux de Physique des Particules, Univer-site de Savoie, CNRS/IN2P3, F-74941 Annecy-le-Vieux, France
22 Oskar Klein Centre, Department of Physics, Stockholm University,Albanova University Center, SE-10691 Stockholm, Sweden
23 University of Namibia, Department of Physics, Private Bag 13301,Windhoek, Namibia
24 Laboratoire d’Astrophysique de Grenoble, INSU/CNRS, UniversiteJoseph Fourier, BP 53, F-38041 Grenoble Cedex 9, France
25 Department of Physics and Astronomy, The University of Leicester,University Road, Leicester, LE1 7RH, United Kingdom
26 Instytut Fizyki Jadrowej PAN, ul. Radzikowskiego 152, 31-342Krakow, Poland
27 Institut fur Astro- und Teilchenphysik, Leopold-Franzens-UniversitatInnsbruck, A-6020 Innsbruck, Austria
28 Obserwatorium Astronomiczne, Uniwersytet Jagiellonski, ul. Orla171, 30-244 Krakow, Poland
29 Torun Centre for Astronomy, Nicolaus Copernicus University, ul.Gagarina 11, 87-100 Torun, Poland
30 School of Chemistry & Physics, University of Adelaide, Adelaide5005, Australia
31 Charles University, Faculty of Mathematics and Physics, Institute ofParticle and Nuclear Physics, V Holesovickach 2, 180 00 Prague 8, CzechRepublic
32 School of Physics & Astronomy, University of Leeds, Leeds LS29JT, UK
33 European Associated Laboratory for Gamma-Ray Astronomy, jointlysupported by CNRS and MPG
34 IFAE, Edifici Cn., Campus UAB, E-08193 Bellaterra, Spain35 INAF National Institute for Astrophysics, I-00136 Rome, Italy36 Universita di Siena, and INFN Pisa, I-53100 Siena, Italy37 Technische Universitat Dortmund, D-44221 Dortmund, Germany38 Universidad Complutense, E-28040 Madrid, Spain39 Universita di Padova and INFN, I-35131 Padova, Italy40 Inst. de Astrofısica de Canarias, E-38200 La Laguna, Tenerife, Spain41 University of Łodz, PL-90236 Lodz, Poland42 Tuorla Observatory, University of Turku, FI-21500 Piikkio, Finland43 Deutsches Elektronen-Synchrotron (DESY), D-15738 Zeuthen,
Germany44 ETH Zurich, CH-8093 Switzerland45 Max-Planck-Institut fur Physik, D-80805 Munchen, Germany46 Universitat Wurzburg, D-97074 Wurzburg, Germany47 Universitat de Barcelona (ICC/IEEC), E-08028 Barcelona, Spain48 Universita di Udine, and INFN Trieste, I-33100 Udine, Italy49 Institut de Ciencies de l’Espai (IEEC-CSIC), E-08193 Bellaterra,
Spain50 Inst. de Astrofısica de Andalucıa (CSIC), E-18080 Granada, Spain51 Croatian MAGIC Consortium, Institute R. Boskovic, University of
Rijeka and University of Split, HR-10000 Zagreb, Croatia
2010 VHE flare & 10 years of MWL observations of M 87 3
52 Universitat Autonoma de Barcelona, E-08193 Bellaterra, Spain53 Inst. for Nucl. Research and Nucl. Energy, BG-1784 Sofia, Bulgaria54 Universita dell’Insubria, Como, I-22100 Como, Italy55 Universita di Pisa, and INFN Pisa, I-56126 Pisa, Italy56 ICREA, E-08010 Barcelona, Spain57 Department of Physics and Astronomy, University of California, Los
Angeles, CA 90095, USA58 Santa Cruz Institute for Particle Physics and Department of Physics,
University of California, Santa Cruz, CA 95064, USA59 Department of Physics, Washington University, St. Louis, MO
63130, USA60 Fred Lawrence Whipple Observatory, Harvard-Smithsonian Center
for Astrophysics, Amado, AZ 85645, USA61 School of Physics and Astronomy, University of Leeds, Leeds, LS2
9JT, UK62 Argonne National Laboratory, 9700 S. Cass Avenue, Argonne, IL
60439, USA63 School of Physics, University College Dublin, Belfield, Dublin 4,
Ireland64 School of Physics, National University of Ireland Galway, University
Road, Galway, Ireland65 Astronomy Department, Adler Planetarium and Astronomy Museum,
Chicago, IL 60605, USA66 Department of Physics, Purdue University, West Lafayette, IN 47907,
USA67 Department of Physics, Grinnell College, Grinnell, IA 50112-1690,
USA68 Department of Physics and Astronomy, Barnard College, Columbia
University, NY 10027, USA69 Department of Astronomy and Astrophysics, 525 Davey Lab,
Pennsylvania State University, University Park, PA 16802, USA70 Department of Physics and Astronomy, University of Utah, Salt Lake
City, UT 84112, USA71 School of Physics and Astronomy, University of Minnesota, Min-
neapolis, MN 55455, USA72 Department of Physics and Astronomy, University of Iowa, Van
Allen Hall, Iowa City, IA 52242, USA73 Physics Department, McGill University, Montreal, QC H3A 2T8,
Canada74 Department of Physics and Astronomy and the Bartol Research
Institute, University of Delaware, Newark, DE 19716, USA75 Enrico Fermi Institute, University of Chicago, Chicago, IL 60637,
USA76 Department of Physics and Astronomy, DePauw University, Green-
castle, IN 46135-0037, USA77 Department of Physics and Astronomy, Iowa State University, Ames,
IA 50011, USA78 DESY, Platanenallee 6, 15738 Zeuthen, Germany79 Department of Life and Physical Sciences, Galway-Mayo Institute of
Technology, Dublin Road, Galway, Ireland80 CRESST and Astroparticle Physics Laboratory NASA/GSFC,
Greenbelt, MD 20771, USA.81 University of Maryland, Baltimore County, 1000 Hilltop Circle,
Baltimore, MD 21250, USA.82 Instituto de Astronomia y Fisica del Espacio, Casilla de Correo 67 -
Sucursal 28, (C1428ZAA) Ciudad Aut?noma de Buenos Aires, Argentina83 Institut fur Physik und Astronomie, Universitat Potsdam, 14476
Potsdam-Golm,Germany84 Department of Applied Physics and Instrumentation, Cork Institute
of Technology, Bishopstown, Cork, Ireland85 Department of Physics and Space Sciences, 150 W. University Blvd.,
Florida Institute of Technology, Melbourne, FL 32901, USA86 INAF Istituto di Radioastronomia, 40129 Bologna, Italy87 National Research Council Research Associate, National Academy
of Sciences, Washington, DC 20001, resident at Naval Research Labora-
tory, Washington, DC 20375, USA88 NASA Goddard Space Flight Center, Greenbelt, MD 20771, USA89 Department of Physics and Department of Astronomy, University of
Maryland, College Park, MD 20742, USA90 Department of Physics and Astronomy, University of California, Los
Angeles, CA 90095, USA91 Institute of Space and Astronautical Science, Japan Aerospace
Exploration Agency, Sagamihara 252-5210, Japan92 Dipartimento di Astronomia, Universita di Bologna, 40127 Bologna,
Italy93 The Graduate University for Advanced Studies (SOKENDAI),
Mitaka 181-8588, Japan94 National Astronomical Observatory of Japan, Mitaka 181-8588,
Japan95 Department of Physics & Astronomy, The University of Alabama,
Tuscaloosa, AL 35487, USA.96 Smithsonian Astrophysical Observatory, 60 Garden St., Cambridge,
MA 02138, USA97 ISR-2, MS 436, Los Alamos National Laboratory, P.O. Box 1663,
Los Alamos, NM 87545, USA98 Space Telescope Science Institute, 3700 San Martin Drive, Balti-
more, MD 21218, USA (Giacconi fellow)99 Centre for Astrophysics and Supercomputing, Swinburne University
of Technology, Hawthorn, VIC 3122, Australia100 Astrophysics Research Institute, Liverpool John Moores University,
UK101 National Radio Astronomy Observatory (NRAO), Socorro, NM
87801, USA102 Space Science Division, Naval Research Laboratory, Washington,
DC 20375, USA

4 The H.E.S.S., MAGIC, & VERITAS Collaborations and the M 87 MWL Monitoring Team
1. INTRODUCTIONThe giant radio galaxy M 87 provides a unique environment
to study relativistic plasma outflows and the surroundings ofsuper-massive black holes (SMBH). Its prominent jet (Cur-tis 1918) is resolved from radio to X-rays displaying com-plex structures (knots, diffuse emission; Perlman et al. 1999,2001a), strong variability (Harris et al. 2003, 2006), and ap-parent super-luminal motion (Biretta et al. 1999; Cheung et al.2007). With its proximity (16.7 ± 0.2 Mpc; Mei et al. 2007)and its very massive black hole of MBH ' (3− 6)× 109 M�104
(Macchetto et al. 1997; Gebhardt & Thomas 2009) high res-olution very long baseline interferometry (VLBI) at radiowavelengths enables one to directly probe structures withsizes down to < 200 Schwarzschild radii. From the detectionof super-luminal features in the jet in the optical and radio thejet orientation angle towards the line of sight at the sub-kpcscale is limited to θ . 20◦ (Biretta et al. 1999; Cheung et al.2007).
Evidence for very high energy (VHE; E > 100 GeV) γ-rayemission from M 87 was reported by the HEGRA collabo-ration in 2003 (Aharonian et al. 2003)105 and was later con-firmed by H.E.S.S., VERITAS, and MAGIC (Aharonian et al.2006a; Acciari et al. 2008; Albert et al. 2008a). While thelarge majority of active galactic nuclei (AGN) with detectedVHE γ-ray emission are strongly beamed sources, M 87 is oneof only four known VHE AGN with weak or, at most, mod-erate beaming; the other three being the radio galaxies Cen-taurus A (Aharonian et al. 2009), IC 310 (Aleksic et al. 2010),and NGC 1275 (Mariotti & MAGIC Collaboration 2010a). In-terestingly, for such a weakly beamed source, M 87 showsstrong variability at VHE with timescales of the order of days(Aharonian et al. 2006a; Albert et al. 2008a; Acciari et al.2009). This points, through the causality argument, towards acompact emission region < 5×10¹⁵δ cm (δ being the Dopplerfactor of the emitting plasma) corresponding to only a fewSchwarzschild radii RS = 2GMBH/c2 ' 1015 cm. At GeV en-ergies M 87 has recently been detected as a weak source byFermi-LAT (Abdo et al. 2009).
The exact location of the VHE γ-ray emitting region inM 87 remains elusive. The angular resolution of ground-basedVHE instruments is of the order of 0.1◦ (corresponding to∼ 30 kpc projected size) and, therefore, does not allow for adirect precise determination of the VHE γ-ray emission site inthe inner kpc-scale structures, although the outer radio lobescan be excluded as the origin (Aharonian et al. 2006a). Tofurther investigate the location of the VHE γ-ray emission siteand the associated production mechanisms, variability studiesand the search for correlations with other wavelengths havesuccessfully been utilized (e.g. Acciari et al. 2009). Of par-ticular interest are radio observations, since they allow forthe highest angular resolution, and X-ray observations, dueto their potential connection with the VHE γ-ray emission ine.g. synchrotron self-Compton (SSC) models.
Up to now, three episodes of enhanced VHE γ-ray emis-sion have been detected from M 87, with details on the lat-est one, observed in 2010, being reported in this paper. Thefirst one, detected in 2005 (Aharonian et al. 2006a), coincidedwith an extreme multi-frequency outburst of the jet featureHST-1 (Harris et al. 2003, 2006).106, which has also been dis-
104 In the following MBH ' 3 × 10⁹ M� is adopted.105 See also Le Bohec et al. (2004).106 The outburst was also followed by the ejection of apparent superlumi-
cussed as a possible VHE γ-ray emission site (e.g. Stawarzet al. 2006; Cheung et al. 2007; Harris et al. 2009). Duringthe second flaring episode, detected in 2008, HST-1 was ina low flux state, but radio measurements at 43 GHz with theVery Long Baseline Array (VLBA) showed a flux increase inthe core region within a few hundred Schwarzschild radii ofthe SMBH, suggesting the direct vicinity of the SMBH as theorigin of the VHE γ-ray emission (Acciari et al. 2009). Thisconclusion was further supported by the detection of an en-hanced X-ray flux from the core region by Chandra.
In this paper results from a joint observation campaign ofM 87 in 2010 are presented and discussed in the broader con-text of the multi-wavelength (MWL) behavior of M 87 overthe past ten years. During the campaign, a high flux state atVHE was detected (Mariotti & MAGIC Collaboration 2010b;Ong & Mariotti 2010). Characteristics of the VHE flare areinvestigated and possible correlations with other wavelengthsare discussed. New observational results from H.E.S.S.,MAGIC, VERITAS, Fermi-LAT, Chandra, HST , LT, VLBA,MOJAVE, VLA, and the EVN are presented.107
In Sec. 2 the instruments and the data are introduced. InSec. 3 the characteristics of the VHE high state are investi-gated and compared to previous flares. New results from opti-cal polarimetry observations with the Hubble Space Telescopeand the Liverpool Telescope are presented and discussed inSec. 4. In Sec. 5 the VHE results are confronted with thebroader MWL picture and the theoretical implications con-cerning the VHE γ-ray emission site are presented in Sec. 6.The paper concludes with Sec. 7.
2. DATA2.1. Very high energy (VHE)
M 87 has been the target of several coordinated VHE mon-itoring campaigns since 2008. In 2010 the source was jointlymonitored by MAGIC and VERITAS. During the campaignMariotti & MAGIC Collaboration (2010b) reported an in-creased flux from the source in February 2010, but follow-upobservations did not reveal further activity at VHE. A sec-ond increase in flux, marking the onset of a strong VHE flare,was detected in April 2010 by MAGIC and VERITAS (Ong &Mariotti 2010) triggering further ToO (Target of Opportunity)observations by H.E.S.S., Chandra, the VLBA, and the EVN.
For the 2010 campaign, M 87 has been observed for a totalof ∼80 h from December 2009 to June 2010. The data fromdifferent VHE instruments have been combined after separateanalysis within the individual collaborations. Integral fluxesfor the VHE band ΦVHE are calculated above an energy of350 GeV. Observations taken or published with a different en-ergy threshold are extrapolated using the average measuredVHE spectrum, which is well described by a power law spec-trum dN/dE ∝ E−Γ with photon index Γ = 2.3 ± 0.11 (Albertet al. 2008a).
Given the indications for spectral variability of M 87 atVHE (Aharonian et al. 2006a; Albert et al. 2008a; Aliu et al.2011) using a single photon index for the flux extrapolationcould introduce a bias in the light curves. For the flaringstates the hardest spectral index reported is Γ = 2.21 ± 0.18(Albert et al. 2008a) and, therefore, the systematic error in-troduced when using Γ = 2.3 is completely negligible com-pared to the typical statistical error of 10-20% of the flux dur-ing such states. For the quiescent state spectral indices up
nal radio components from HST-1 (Cheung et al. 2007).107 Full names of the instruments can be found in Sec. 2.

2010 VHE flare & 10 years of MWL observations of M 87 5
Time (MJD)
-0.50
0.51
1.52
2.53
3.5
ΦVHE (
10−
11 c
m−
2 s−
1)
H.E.S.S.MAGICVERITAS
20012002
20032004
20052006
20072008
20092010
2011Year
012345
ΦHE (
10−
9 c
m−
2 s−
1)
Fermi-LAT
0.00.20.40.60.81.01.21.4
ΦX−ray
(keV
/s) Chandra - core
02468
1012
ΦX−ray
(keV
/s) Chandra - HST-1
0.0
0.2
0.4
0.6
0.8
ΦUV/O
(m
Jy)
HST STIS/F25QTZ - coreHST ACS/F220W - coreHST ACS/F250W - coreHST STIS/F25QTZ - HST-1HST ACS/F220W - HST-1HST ACS/F250W - HST-1
LT - (core + HST-1) / 10
0.0
0.5
1.0
1.5
2.0
ΦRadio (
Jy)
VLBA 43 GHz - 1.2masVLBA 43 GHz - peakVLBA 43 GHz - jet
1.01.52.02.53.03.5
ΦRadio (
Jy)
VLA 22GHz - coreVLA 15GHz - coreMOJAVE 15GHz - peakEVN 5GHz - coreVLBA 2.3GHz - coreVLBA 1.7GHz - core
52000 52500 53000 53500 54000 54500 55000 55500MJD
0.000.050.100.150.200.250.300.350.40
ΦRadio (
Jy)
VLA 22GHz - HST-1 x 4.6VLA 15GHz - HST-1 x 3.7EVN 5GHz - HST-1 x 1.9VLBA 2.3GHz - HST-1 x 1.2VLBA 1.7GHz - HST-1 x 1.0
Fig. 1.— Multi-wavelength light curve of M 87 from 2001 to 2011. The VHE γ-ray flux (top panel) is calculated above an energy threshold of 350 GeV (seetext). Separate fluxes for the core and HST-1 are shown in cases where the instrument resolution is sufficient to separate the two components. Gray vertical bandsmark the times of increased VHE activity in 2005, 2008, and 2010 (see Fig. 2). The dashed line and the gray horizontal band in the 2nd panel marks the averageflux with 1 s.d. error measured by Fermi-LAT. The radio flux of HST-1 at different frequencies has been normalized to the 5 GHz flux assuming a spectrumS ν ∼ ν
−α with α = 0.6. All flux errors shown are the 1 s.d. statistical errors except for the LT data where the uncertainty on the contribution from the galaxy isincluded in the error bars. For details on the data, the data analysis, and references see text.
to Γ = 2.60 ± 0.30 have been reported (Albert et al. 2008a).This could, in principle, create a bias for the H.E.S.S. data set,where the flux is extrapolated down to 350 GeV from energiesabove 500 GeV. For example, for spectral indices of Γ1 = 2.3and Γ2 = 2.6 the flux extrapolated down to 350 GeV from700 GeV would differ by a factor (350 GeV/700 GeV)Γ2−Γ1 ∼
0.8, which would imply errors of order ∼20 %. Given thatthe typical flux error for the nightly averaged flux bins in thequiescent state is of order ∼100 % (i.e. the individual nightlyflux points are not significant detections) the systematic un-certainty introduced by using a single photon index for ex-trapolation can also safely be neglected.
Given recent results on the Crab Nebula (the referencesource for ground-based VHE instruments) indicating onlysmall systematic offset between the energy scale of differ-ent instruments (Meyer et al. 2010)108 and the general goodagreement of the flux measurements during quasi simultane-ous observations, the systematic error between the differentinstruments is estimated to be small compared to the statisti-cal error of individual measurements of the 2010 campaign.
Additional archival data from Aharonian et al. (2006a), Ac-ciari et al. (2008), Albert et al. (2008a), Acciari et al. (2010),
108 Energy scale scaling factors relative to the Fermi-LAT energy scale of0.961 ± 0.004 for H.E.S.S. and 1.03 ± 0.01 for MAGIC are derived.

6 The H.E.S.S., MAGIC, & VERITAS Collaborations and the M 87 MWL Monitoring Team
and Aleksic et al. (2011a) are also shown in the light curves(Fig. 1 and Fig. 2).
In the following, the main characteristics of the VHE ob-servatories involved in the M 87 campaign are reviewed, anddetails on the corresponding data-sets are presented.
H.E.S.S. — The High Energy Stereoscopic System(H.E.S.S.)109 is a system of four large (13 m mirror di-ameter) imaging atmospheric Cherenkov telescopes (IACTs)for the detection of VHE γ-rays, located in the southernhemisphere in Namibia (23◦16′ S, 16◦30′W; 1800 m abovesea level). It has been in operation since 2002, with the fullarray completed in 2004 (Hinton 2004). H.E.S.S. observedM 87 for 10.7 h in 2010 (dead-time corrected) yielding atotal detection significance of 9.7 standard deviations (s.d.;following Li & Ma 1983) using a standard Hillas-typeanalysis and cuts from Aharonian et al. 2006b (softwareversion hap-10-06). M 87 culminates at ∼35◦ zenith angleat the H.E.S.S. site resulting in an energy threshold ofEthr > 500 GeV for the analysis and data-set. The integralflux is extrapolated down to 350 GeV using the averageenergy spectrum (see above). In addition, results from are-analysis of the 2004 and 2006 H.E.S.S. data in nightlyflux bins, utilizing the same analysis as discussed above,are presented in the light curves. Cross check on the resultswith data from an independent calibration chain and utilizingdifferent analysis have been performed and good agreementis found.
MAGIC — The Major Atmospheric Gamma-ray ImagingCherenkov (MAGIC)110 telescope system consists of two17 m diameter IACTs located at the Roque de los MuchachosObservatory, on the Canary Island of La Palma (28◦46′ N,17◦53′W; 2200 m above sea level). Since 2005 M 87 has beenregularly observed by MAGIC with a single telescope (Albertet al. 2008b; Aleksic et al. 2011a). In the Autumn of 2009the system became stereoscopic, with the commissioning ofa second telescope and the stereo trigger, resulting in an al-most doubling of its sensitivity (Colin et al. 2009; Aleksicet al. 2011b). In 2010, M 87 observations were conducted,for the first time, in stereoscopic mode. 20 h of good qualitydata were taken between January and June with zenith anglesranging from 16 to 35 degrees. Analysis of these data withthe standard MAGIC software (Moralejo et al. 2009) resultedin a 10 s.d. detection above 200 GeV.
VERITAS — The Very Energetic Radiation Imaging Tele-scope Array System (VERITAS)111 consists of four 12 mdiameter IACTs and is located at the base camp of theFred Lawrence Whipple Observatory in southern Arizona(31◦40′ N, 110◦57′W; 1280 m above sea level). More detailsabout VERITAS, the data calibration, and the analysis tech-niques can be found in Acciari et al. (2008). VERITAS ob-served M 87 in 2010 for 48.2 h (after quality cuts) resultingin a detection of 26 s.d. The zenith angles of the observationsranged from 19 to 40◦, with a few nights with zenith angles upto 60◦ during the flares (April 9-11th). The energy thresholdof the analysis for the mean zenith angle of the observations of25◦ is 250 GeV. The VERITAS data covered the whole 2010flare period; a detailed study of the VHE spectral evolution
109 http://www.mpi-hd.mpg.de/hfm/HESS/110 http://wwwmagic.mppmu.mpg.de/111 http://veritas.sao.arizona.edu/
indicating a spectral change with flux will be published in aparallel paper (Aliu et al. 2011).
2.2. High energy (HE)Fermi-LAT — The Large Area Telescope (LAT) onboard
the Fermi satellite is a pair-conversion telescope that coversthe energy range from 20 MeV to more than 300 GeV(HE) (Atwood et al. 2009). The LAT instrument features aper-photon angular resolution of θ68% = 0.8◦ at 1 GeV and alarge field-of-view of 2.4 sr. The primary mode of operationis an all-sky survey mode, where the full sky is covered ap-proximately every three hours. The LAT data for this analysisconsists of two years of nominal all-sky survey data betweenthe energy range 100 MeV and 300 GeV, and spanning themission elapsed time (MET) 239557417 to 302630530(August 4, 2008 through August 4, 2010). Event selectionsinclude “diffuse” class events recommended for point sourceanalysis, a rocking angle cut of < 52◦, and a zenith angle cutof < 100◦ in order to avoid contamination from the Earth’slimb. A 2 ks window beginning at MET 259459364 was alsoremoved in order to avoid contamination from GRB 090323,which occurred nearby. All LAT analysis was performedusing instrument response functions (IRFs) P6 V11 DIFFUSEand science tools v9r20p0, along with the recommended112
Galactic diffuse gll iem v02 P6 V11 DIFFUSE.fitand corresponding isotropic spectral templateisotropic iem v02 P6 V11 DIFFUSE.txt.
An analysis of the LAT spectrum over the two-year periodwas performed using a binned likelihood analysis (Mattoxet al. 1996) selecting all events that fell within a 20◦ × 20◦square region of interest (ROI) centered at the M 87 radio po-sition of the core. All point sources from an internal two-yearpreliminary catalog that fell within 15◦ of the source wereincluded in the fit. All sources within the square ROI weremodeled with a power law spectrum with their normalizationand index as free parameters, while those that fell outside ofthe ROI were fixed to their catalog values. The M 87 spectrumwas modeled as a power law with photon index and normal-ization parameters left free and using the radio position (Feyet al. 2004) as the source location. A point source was de-tected with a test statistic (TS; Mattox et al. 1996) of 301,representing a detection of
√301 ' 17 s.d. From the result-
ing fit, the photon index and flux (> 100 MeV) were foundto be 2.16 ± 0.07 and (2.66 ± 0.36) × 10−8 ph cm−2 s−1, re-spectively. In order to test for curvature, the spectrum wasalso fit to a log parabola, where the TS of the overall fit wasfound to improve by only 0.89, which does not represent astatistically significant improvement over the single powerlaw. The largest systematic errors can be attributed to un-certainties in the modeling of the diffuse background emis-sion. These were estimated by repeating the analysis withboth binned and unbinned gtlike using a refined versionof the current diffuse background model that is under devel-opment by the LAT collaboration. Systematic errors on theindex and flux were thus found to be (+0.05/ − 0.01) and(+0.40/ − 0.13) × 10−8 ph cm−2 s−1, respectively. Compar-ing results from this analysis for the last 14 month with theinitial 10-month spectrum reported in Abdo et al. (2009), noevidence of variability in the flux above 100 MeV was found.Comparing the flux above 1 GeV between these two epochs,however, a marginal indication of a rise in the flux of the latter
112 http://fermi.gsfc.nasa.gov/ssc/data/access/lat/BackgroundModels.html
2010 VHE flare & 10 years of MWL observations of M 87 7
epoch at a significance of 2 s.d. is found. Systematic uncer-tainties on the LAT flux due to the instrument response areestimated at values of 10 %, 5 %, and 20 % above and belowtheir nominal values at log(E/MeV) = 2, 2.75, and 4, respec-tively (Atwood et al. 2009).
The LAT light curve (> 1 GeV) was constructed using theevents that fell within a 10◦ circular ROI centered at the M 87radio position. Fluxes were derived for bins with a detec-tion significance exceeding 3 s.d., otherwise upper limits werecalculated. To generate the light curve, events were groupedinto 56-day time bins, and a separate likelihood analysis us-ing gtlike was performed over each of the bins. All pointsources from the two-year fit were included in the model overeach interval. Sources that fell within the 10◦ ROI were fitwith their normalization parameters free, while the photon in-dex of each source was fixed to the best-fit value obtainedfrom the full two-year analysis. Both the index and normal-ization parameters of M 87 were left free, except in the caseof upper limit calculations, in which case the photon indexwas fixed to the nominal two-year average of 2.16. In orderto avoid modeling sources with a negative TS value, an initialfit over each interval was performed, and all sources found tohave a TS< 1 were subsequently removed from the fit. Fol-lowing the method for variability detection outlined in Abdoet al. (2010a), the weighted average flux was first calculatedwith a resulting value of (1.62±0.18)×10−9 ph cm−2 s−1. A χ2
analysis was then performed by comparing the best-fit valuesof all points to the weighted average, and the resulting prob-ability P(χ2 ≥ χ2
obs) was found to be 0.027, which representsa significance of 2.2 s.d. for the source to be variable and fallsslightly below the threshold for variability defined in Abdoet al. (2010a).
2.3. X-rayChandra — X-ray data have been taken with the Advanced
CCD Imaging Spectrometer (ACIS) on board the Chandrasatellite. For details of the Chandra data reduction proce-dures, see Harris et al. (2003), Perlman et al. (2003), andHarris et al. (2009). In brief, a 1/8th segment of the backilluminated S3 chip of the ACIS detector aboard Chandra isused. This results in a frame time of 0.4s with 90 % efficiency.Although this setup was essentially free of pileup when Wil-son & Yang (2002) tested various options during 2000 July,with the advent of the ever increasing brightness of HST-1,pileup (Davis 2001) became a major problem so the measureof intensity was switched to a detector based unit: keV/s. Thisapproach uses the event 1 file with no grade filtering (so as torecover all events affected by ’grade migration’) and energiesfrom 0.2 to 17 keV are integrated so as to recover all the en-ergy of the piled events. Other uncertainties for piled eventscome from the on-board filtering, the ’eat-thy-neighbor’ ef-fect, and second order effects such as release of trapped charge(see Appendix A of Harris et al. 2009). Although a smallcircular aperture was used for flux-map photometry in Har-ris et al. (2003), the basic analysis for this paper adopts therectangular regions used in Harris et al. (2006) so as to en-compass more of the point spread function (PSF). All eventswithin each rectangle are weighted by their energy and thesum of these energies, when divided by the exposure times,gives the final keV/s value used in the light curve. Uncer-tainties are strictly statistical, based on the number of countsmeasured (
√N/N) and typically range from 1% to 5%.
2.4. OpticalHubble Space Telescope (HST) — Near Ultraviolet HST ob-
servations were obtained with the Space Telescope ImagingSpectrograph (STIS) and the Advanced Camera for SurveysHigh Resolution Camera (ACS/HRC). STIS imaging wastaken with the F25QTZ filter that has its maximum through-put wavelength at 2364.8 Å (Kim Quijano et al. 2003). All ob-servations after August 2004 were taken with the ACS/HRCusing two filters: F220W and F250W which have their max-imum throughput wavelength at 2255.5 Å and 2715.9 Å, re-spectively (Mack & Gilliland 2003). All science ready fileswere retrieved from the STScI public archive and processedthrough the PYRAF task MULTIDRIZZEL (Fruchter et al.2009). Both HST detectors have a pixel scale of ∼ 0.024′′ perpixel and a resolution that enables one to clearly separate thenucleus and the innermost components of the jet, i.e. HST-1.The details of these observations have been presented in Perl-man et al. (2003), Madrid (2009), and Perlman et al. (2011).
Optical HST polarimetry observations were obtained withthe ACS/HRC and the Wide-field Planetary Camera 2(WFPC2), using the F606W filter that has its maximumthroughput at roughly ∼6000 Å and a nearly flat throughputcurve from 4800 to 7000 Å. The single WFPC2 observation(pixel scale ∼ 0.1 arcsec/pixel) was obtained when the ACSwas not operational, and used the POLQ polarizing filter,while the ACS/HRC observations used the POLVIS polariz-ing filter. For both of these polarizers, the F606W filter givesnearly optimal transmission of parallel polarized light as wellas rejection of perpendicularly polarized light. Polarimetryobservations were obtained at 18 epochs between December2002 and November 2007, with 14 of the 18 observations con-centrated between November 2004 and December 2006 onthe same schedule as the ultraviolet photometry. As with theUV observations, all polarimetry was obtained from the HSTarchive and re-calibrated using updated flat field files and im-age distortion correction (IDC) tables (Mobasher et al. 2002;Pavlovsky et al. 2002). multidrizzle was used to combineand cosmic-ray reject the images, which were aligned usingTweakshifts (Fruchter et al. 2009), and CTE (Charge TransferEfficiency) corrections were computed using data found in theACS instrument handbook (Boffi et al. 2007). Once this wasdone, the images in each polarizer were combined accordingto recipes in the ACS and WFPC2 instrument handbooks, re-spectively (Boffi et al. 2007; Biretta & McMaster 1997). Be-fore performing photometry and polarimetry, galaxy emissionwas subtracted from the images. This was done using a modelcomputed in the Stokes I image using the IRAF tasks EL-LIPSE and BMODEL. Error bars for the polarimetry are typ-ically 2-3% for high signal-to-noise data (further details canbe found in Perlman et al. 2011).
Liverpool Telescope (LT) — Hybrid R+V-band optical po-larimetry data (460-720 nm at FWHM) were taken with the2-meter Liverpool Telescope (LT)113, located on La Palma,using the newly commissioned RINGO2 fast-readout imagingpolarimeter (Steele et al. 2010). The polarimeter uses a rotat-ing polaroid with frequency of approximately 1 Hz, during thecycle of which 8 exposures of the source are obtained. Theseexposures are synchronized with the phase of the polaroid andfollowing the analysis method of Clarke & Neumayer (2002)allows determination of the degree and angle of polarization.
113 http://telescope.livjm.ac.uk/

8 The H.E.S.S., MAGIC, & VERITAS Collaborations and the M 87 MWL Monitoring Team
The LT observations were taken during and shortly afterthe observed VHE high-state, MJD 55295-402, with threemeasurements taken contemporaneously to the time of theVHE flare, MJD 55295-97. Further data on M 87 have beentaken since then and will be presented elsewhere. Total in-tegration times of typically 100 s were used in the observa-tions, corresponding to an achieved polarimetric accuracy ofabout 1 % for the brightness of the source. The field of viewof the instrument is of 4 × 4 arcmin with a pixel scale of0.45 arcsec/pixel, which at the distance of M 87 correspondsto a linear scale of ∼40 pc/pixel, equivalent to approximatelyhalf the distance between the core and the innermost jet com-ponent, the knot HST-1. Given the typical seeing during theobservations of 1.0 ′′ to 1.7 ′′ (FWHM) the two components,core and HST-1, cannot be resolved individually. There-fore, an aperture radius for the integration of the signal of2.7 arcsec was used, so that both the nucleus and HST-1 wereincluded. The outer jet is nevertheless well resolved and in-dependent light-curves were produced with the same apertureradius used for the core but now centered at knot-A, located12.3 arcsec downstream from the nucleus, revealing a steadypolarization aligned with the jet direction.
The greatest source of error in the determination of the po-larization levels is a systematic effect caused by contamina-tion by the bright host galaxy, which extends out to severalkpc and dilutes the polarization signal from the nucleus. Thestrength of the contamination is estimated by adding a Sersicprofile with n = 4 to a frame built by summing data from allpolaroid angles. This shows the well known flattening in thecentral ∼ 10 arcsec (e.g. Kormendy et al. 2009). Fitting thedata from 9 to 2.7 arcsec reveals an excess within the central2.7 arcsec due to the core plus HST-1 of ∼ 10 ± 5 %. Thephotometric flux of the background galaxy is of order 90 % ofthe total flux within the aperture used for extracting the polar-ization measurements. The measured fractional polarizationwas therefore multiplied by a factor of 10 and the flux mea-surement divided by a factor 10 in order to correct for thisbackground light, and allow comparison with the high resolu-tion HST measurements of the core + HST-1.
Light-curves for the polarization position angle (or electricvector position angle, EVPA, defined as 0.5 × arctan(u/q),where u and q are the linear Stokes parameters) were ob-tained for all the epochs of observation, and are presented inFig. 4, along with the other polarization quantities. Due tohost-galaxy contamination,the polarization position angle forthe nucleus and HST-1 combined are measured to an accu-racy of 25◦, considerably degraded in comparison to the 10◦resolution achieved for the outer jet where the host galaxy isfainter.
2.5. RadioRadio interferometers enable one to observe the jet of M 87
with a large variety of angular resolutions and sensitivities,depending on the array size and observing frequency. InTab. 1 the highest angular resolution achieved for each instru-ment contributing data to this paper is shown. Overall, theyspan an angular scale range from as large as ∼ 0.1′′ (fromthe VLA at 22 GHz) down to a fraction of a milli-arcsecond(e.g. ∼ 0.2 mas with the VLBA at 43 GHz, see Table 1).The longest baseline and highest frequency observations pro-vide the most valuable information about the compact, flatspectrum core; conversely, instruments with shorter baselines(such as the VLA) or lower observing frequency (like theEVN) are most valuable for the fainter and more extended
TABLE 1Angular resolution for different radio observations.
Instrument Wavelength Resolution
VLBA 43 GHz (0.21 × 0.43) masVLBA (MOJAVE) 15 GHz (0.6 × 1.3) masVLBA 2.3 GHz (7.5 × 3.9) masVLBA 1.7 GHz (8.0 ×3.4) masEVN 5 GHz (1.0 × 2.0) masVLA 15 GHz ∼ 0.13′′ × 0.12′′VLA 22 GHz ∼ 0.10′′ × 0.09′′
Note. — The beam sizes are given as full width athalf maximum (FWHM). In case different resolutionshave been used in the analysis the highest one is givenin the table.
HST-1 feature.
VLBA 43 GHz — The 43 GHz VLBA (Napier et al. 1994) datafrom 2006 through 2008 were collected as part of an effortto study the dynamics of the inner jet near the launch region(Walker et al. 2008). The 2009 and 2010 observations werepart of a project to find and study another VHE/radio flarelike that seen in 2008 (Acciari et al. 2009). The observationswere made on the 10-antenna VLBA using a total bandwidthof 64 MHz. The data were reduced in AIPS following theusual procedures for VLBI data reduction including correc-tion for instrumental offsets using the autocorrelations, band-pass calibration based on strong calibrator observations, andcorrection for atmospheric opacity based on the system tem-perature data. The a priori amplitude calibration dependedon the gains provided by VLBA operations, which are basedon results from regular single-dish pointing observations ofJupiter, Saturn, and Venus averaged over many months. Theimages are based on data that are both amplitude and phaseself-calibrated. The flux scale for each epoch was set by nor-malizing the self-calibration gain adjustments to the a priorigains for observations above 30◦ elevation on those antennaswith good weather and instrumental conditions for that epoch.The flux densities typically accurate to within about 5%.
Three VLBA flux densities are provided. The first isthe peak brightness on the core in an image made with a0.21 × 0.43 mas beam. The second is the integrated flux den-sity within 1.2 mas of the core and represents the total emis-sion from a region within a projected distance of 0.1 pc fromthe presumed position of the black hole at the radio core(0.1 pc = 340 RS for a 3.0 × 10⁹ M� black hole). The thirdis the integrated flux density from the jet over the region 1.2to 5.3 mas from the core.
VLBA 15 GHz (MOJAVE) — VLBA 15 GHz observations fromthe MOJAVE program (Lister et al. 2009) have been analyzedto obtain core fluxes over 16 epochs from 2001.0 - 2011.0.The calibrated (u, v) data were retrieved114 and re-imaged uni-formly with the final maps restored using a 0.6 mas × 1.3 masbeam (position angle = −11◦) following Abdo et al. (2009).The peak core fluxes measured from the resultant maps spantypical values of ∼1.0–1.2 Jy/beam (Fig. 1) with two notablepeaks of ∼1.5 Jy/beam recorded in early-2008 and mid-2009.
VLBA 2.3 GHz — Observations at 2.3 GHz were made on 8and 18 April 2010 using 10 VLBA stations as a part of ex-periments BH163. Each session has a total on-source time of∼15 minutes with the total bandwidth being 64 MHz. In order
114 http://www.physics.purdue.edu/MOJAVE/
2010 VHE flare & 10 years of MWL observations of M 87 9
to obtain better u, v coverage, the short scan blocks (∼ 2 min-utes per block) were distributed uniformly at several hour an-gles. The initial data calibration was performed in AIPS basedon the standard VLBI data reduction procedures (the AIPScookbook115). The amplitude calibration with the opacity cor-rections was applied using the measured system noise tem-peratures and the elevation-gain curves of each antenna.Thedata were fringe-fitted and then averaged at short intervals(every 5 seconds and 1 MHz in time and frequency domains)before the imaging process in order to avoid the smearing ef-fects due to the time and bandwidth averaging at the HST-1region. The images were made in DIFMAP software (Shep-herd 1997) with the iterative phase/amplitude self-calibrationprocesses. The off-source rms noises in the resultant imagesare 0.4-0.5 mJy/beam. The peak flux densities are providedfor the core region with the synthesized beam of 7.5 × 3.9 masat −5◦, and the integrated flux densities are provided for theHST-1 region. The errors in flux densities are assumed to be5% based on the typical VLBA calibration accuracy at thisfrequency.
VLBA 1.7 GHz — 19 epochs of VLBA 1.7 GHz observa-tions from ∼2005.0 - 2008.0 have been obtained in an ef-fort to monitor the evolution of the HST-1 knot followingits brightening at X-ray, optical, and radio frequencies (Har-ris et al. 2009). The results of the first 9 of these observa-tions (programs BH126, BH135) were presented in Cheunget al. (2007), where apparent superluminal radio features inthe HST-1 complex were discovered. For the additional 10observations (programs BC167, BH151), the identical cali-bration and imaging procedure was followed for this analysis.From maps restored with the same uniformly weighted beam(8.0 mas × 3.4 mas elongated north-south), we measured thepeak core brightness (5% errors are assumed). Integrated fluxdensities (10% errors are assumed) for the HST-1 were mea-sured from naturally weighted images (11.5 mas × 5.5 mas)using a 80 mas × 50 mas box that covers the entire radio com-plex resolved in the VLBA images (cf., Cheung et al. 2007).
EVN — M 87 was observed with the European VLBI Net-work (EVN) at 5 GHz seven times between November 2009and June 2010 as part of a project aimed at correlating theradio and high energy behavior of the source. Given the inter-esting episodes of activity of the source during the campaign,a few observations were scheduled as ToO and do not havethe same array configuration as the other ones. In general,6 to 11 telescopes participated in the observations, with base-lines ranging between less than 100 km (as provided by MER-LIN stations) and 7 000-9 000 km (as provided by the Areciboand Shanghai stations, respectively). The observations werecarried out at 5.013 GHz, divided in 8 sub-bands separatedby 16 MHz each, for an aggregate bit rate of 1 Gbps. Thedata were correlated in real time at JIVE using the so-callede-VLBI technique, which provides a fast turn-around of theresults (as was the case near the Feb. 2010 event; see Giro-letti et al. 2010). Automated data flagging and initial ampli-tude and phase calibration were also carried out at JIVE us-ing dedicated pipeline scripts. Data were finally averaged infrequency within each IF, but individual IFs were kept sep-arate to avoid bandwidth smearing. Similarly, the data weretime-averaged only to 8 s, in order to avoid time smearing.Final images were produced in DIFMAP after several cycles
115 http://www.aips.nrao.edu/cook.html
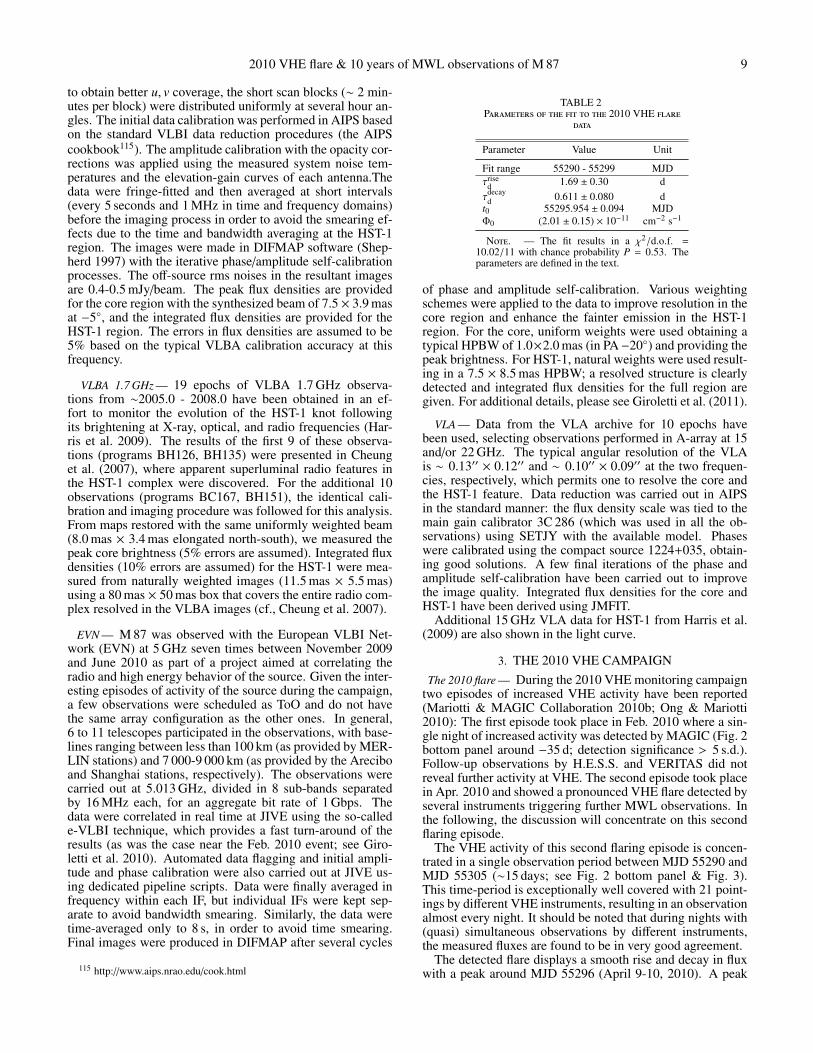
TABLE 2Parameters of the fit to the 2010 VHE flare
data
Parameter Value Unit
Fit range 55290 - 55299 MJDτrise
d 1.69 ± 0.30 dτ
decayd 0.611 ± 0.080 d
t0 55295.954 ± 0.094 MJDΦ0 (2.01 ± 0.15) × 10−11 cm−2 s−1
Note. — The fit results in a χ2/d.o.f. =10.02/11 with chance probability P = 0.53. Theparameters are defined in the text.
of phase and amplitude self-calibration. Various weightingschemes were applied to the data to improve resolution in thecore region and enhance the fainter emission in the HST-1region. For the core, uniform weights were used obtaining atypical HPBW of 1.0×2.0 mas (in PA−20◦) and providing thepeak brightness. For HST-1, natural weights were used result-ing in a 7.5 × 8.5 mas HPBW; a resolved structure is clearlydetected and integrated flux densities for the full region aregiven. For additional details, please see Giroletti et al. (2011).
VLA — Data from the VLA archive for 10 epochs havebeen used, selecting observations performed in A-array at 15and/or 22 GHz. The typical angular resolution of the VLAis ∼ 0.13′′ × 0.12′′ and ∼ 0.10′′ × 0.09′′ at the two frequen-cies, respectively, which permits one to resolve the core andthe HST-1 feature. Data reduction was carried out in AIPSin the standard manner: the flux density scale was tied to themain gain calibrator 3C 286 (which was used in all the ob-servations) using SETJY with the available model. Phaseswere calibrated using the compact source 1224+035, obtain-ing good solutions. A few final iterations of the phase andamplitude self-calibration have been carried out to improvethe image quality. Integrated flux densities for the core andHST-1 have been derived using JMFIT.
Additional 15 GHz VLA data for HST-1 from Harris et al.(2009) are also shown in the light curve.
3. THE 2010 VHE CAMPAIGNThe 2010 flare — During the 2010 VHE monitoring campaign
two episodes of increased VHE activity have been reported(Mariotti & MAGIC Collaboration 2010b; Ong & Mariotti2010): The first episode took place in Feb. 2010 where a sin-gle night of increased activity was detected by MAGIC (Fig. 2bottom panel around −35 d; detection significance > 5 s.d.).Follow-up observations by H.E.S.S. and VERITAS did notreveal further activity at VHE. The second episode took placein Apr. 2010 and showed a pronounced VHE flare detected byseveral instruments triggering further MWL observations. Inthe following, the discussion will concentrate on this secondflaring episode.
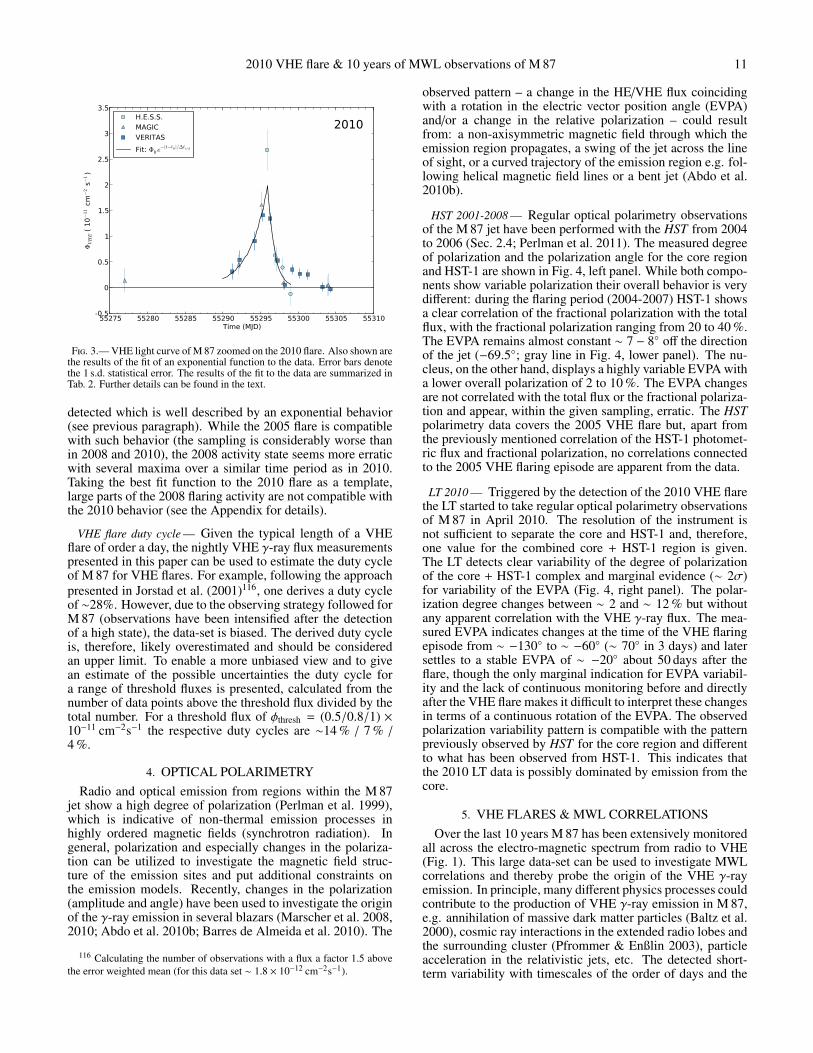
The VHE activity of this second flaring episode is concen-trated in a single observation period between MJD 55290 andMJD 55305 (∼15 days; see Fig. 2 bottom panel & Fig. 3).This time-period is exceptionally well covered with 21 point-ings by different VHE instruments, resulting in an observationalmost every night. It should be noted that during nights with(quasi) simultaneous observations by different instruments,the measured fluxes are found to be in very good agreement.
The detected flare displays a smooth rise and decay in fluxwith a peak around MJD 55296 (April 9-10, 2010). A peak
10 The H.E.S.S., MAGIC, & VERITAS Collaborations and the M 87 MWL Monitoring Team
+5.342e4-0.5
0
0.5
1
1.5
2
2.5
3
3.5
ΦVHE (
10−
11 c
m−
2 s−
1) 2005
H.E.S.S.
MAGIC
VERITAS
-0.5
0
0.5
1
1.5
2
2.5
3
ΦVHE (
10−
11 c
m−
2 s−
1) 2008
-40 -30 -20 -10 0 10 20 30 40Time (days)
-0.5
0
0.5
1
1.5
2
2.5
3
ΦVHE (
10−
11 c
m−
2 s−
1) 2010
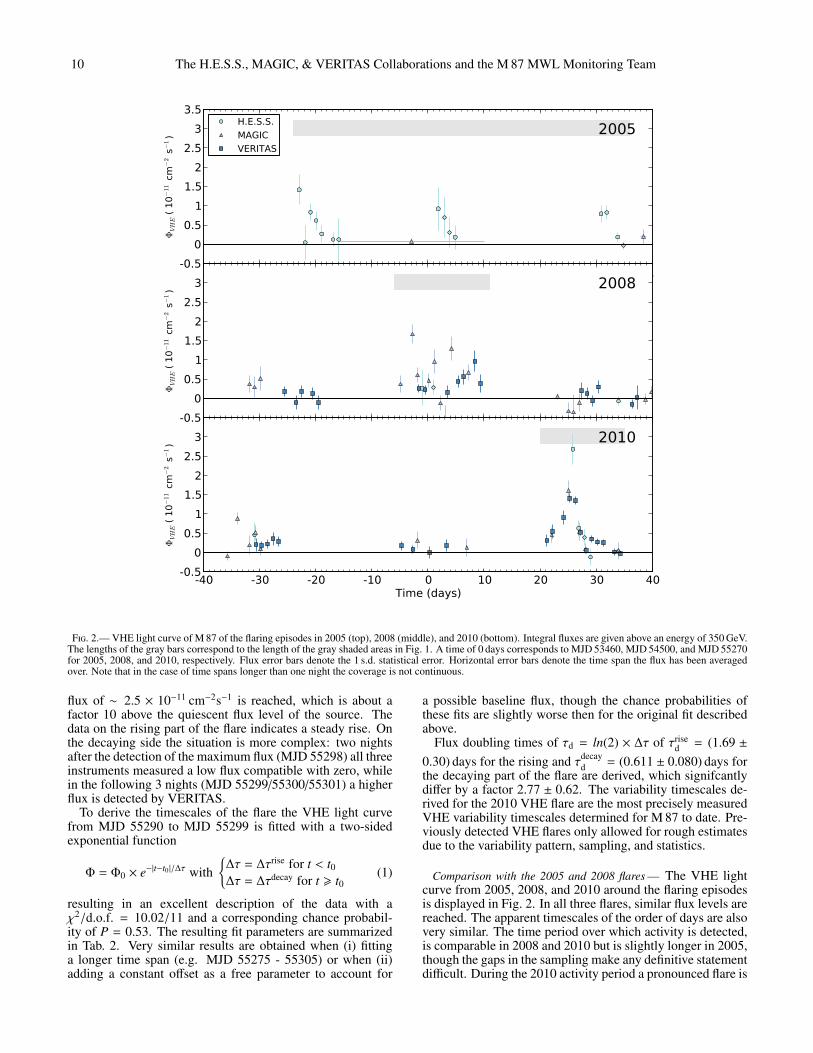
Fig. 2.— VHE light curve of M 87 of the flaring episodes in 2005 (top), 2008 (middle), and 2010 (bottom). Integral fluxes are given above an energy of 350 GeV.The lengths of the gray bars correspond to the length of the gray shaded areas in Fig. 1. A time of 0 days corresponds to MJD 53460, MJD 54500, and MJD 55270for 2005, 2008, and 2010, respectively. Flux error bars denote the 1 s.d. statistical error. Horizontal error bars denote the time span the flux has been averagedover. Note that in the case of time spans longer than one night the coverage is not continuous.
flux of ∼ 2.5 × 10⁻¹¹ cm−2s−1 is reached, which is about afactor 10 above the quiescent flux level of the source. Thedata on the rising part of the flare indicates a steady rise. Onthe decaying side the situation is more complex: two nightsafter the detection of the maximum flux (MJD 55298) all threeinstruments measured a low flux compatible with zero, whilein the following 3 nights (MJD 55299/55300/55301) a higherflux is detected by VERITAS.
To derive the timescales of the flare the VHE light curvefrom MJD 55290 to MJD 55299 is fitted with a two-sidedexponential function
Φ = Φ0 × e−|t−t0 |/∆τ with{
∆τ = ∆τrise for t < t0∆τ = ∆τdecay for t > t0
(1)
resulting in an excellent description of the data with aχ2/d.o.f. = 10.02/11 and a corresponding chance probabil-ity of P = 0.53. The resulting fit parameters are summarizedin Tab. 2. Very similar results are obtained when (i) fittinga longer time span (e.g. MJD 55275 - 55305) or when (ii)adding a constant offset as a free parameter to account for
a possible baseline flux, though the chance probabilities ofthese fits are slightly worse then for the original fit describedabove.
Flux doubling times of τd = ln(2) × ∆τ of τrised = (1.69 ±
0.30) days for the rising and τdecayd = (0.611 ± 0.080) days for
the decaying part of the flare are derived, which signifcantlydiffer by a factor 2.77 ± 0.62. The variability timescales de-rived for the 2010 VHE flare are the most precisely measuredVHE variability timescales determined for M 87 to date. Pre-viously detected VHE flares only allowed for rough estimatesdue to the variability pattern, sampling, and statistics.
Comparison with the 2005 and 2008 flares — The VHE lightcurve from 2005, 2008, and 2010 around the flaring episodesis displayed in Fig. 2. In all three flares, similar flux levels arereached. The apparent timescales of the order of days are alsovery similar. The time period over which activity is detected,is comparable in 2008 and 2010 but is slightly longer in 2005,though the gaps in the sampling make any definitive statementdifficult. During the 2010 activity period a pronounced flare is
2010 VHE flare & 10 years of MWL observations of M 87 11
55275 55280 55285 55290 55295 55300 55305 55310Time (MJD)
-0.5
0
0.5
1
1.5
2
2.5
3
3.5
ΦVHE (
10−
11 c
m−
2 s−
1)
2010H.E.S.S.
MAGIC
VERITAS
Fit: Φ0 e−|t−t0 |/∆tr/d
Fig. 3.— VHE light curve of M 87 zoomed on the 2010 flare. Also shown arethe results of the fit of an exponential function to the data. Error bars denotethe 1 s.d. statistical error. The results of the fit to the data are summarized inTab. 2. Further details can be found in the text.
detected which is well described by an exponential behavior(see previous paragraph). While the 2005 flare is compatiblewith such behavior (the sampling is considerably worse thanin 2008 and 2010), the 2008 activity state seems more erraticwith several maxima over a similar time period as in 2010.Taking the best fit function to the 2010 flare as a template,large parts of the 2008 flaring activity are not compatible withthe 2010 behavior (see the Appendix for details).
VHE flare duty cycle — Given the typical length of a VHEflare of order a day, the nightly VHE γ-ray flux measurementspresented in this paper can be used to estimate the duty cycleof M 87 for VHE flares. For example, following the approachpresented in Jorstad et al. (2001)116, one derives a duty cycleof ∼28%. However, due to the observing strategy followed forM 87 (observations have been intensified after the detectionof a high state), the data-set is biased. The derived duty cycleis, therefore, likely overestimated and should be consideredan upper limit. To enable a more unbiased view and to givean estimate of the possible uncertainties the duty cycle fora range of threshold fluxes is presented, calculated from thenumber of data points above the threshold flux divided by thetotal number. For a threshold flux of φthresh = (0.5/0.8/1) ×10−11 cm−2s−1 the respective duty cycles are ∼14 % / 7 % /4 %.
4. OPTICAL POLARIMETRYRadio and optical emission from regions within the M 87
jet show a high degree of polarization (Perlman et al. 1999),which is indicative of non-thermal emission processes inhighly ordered magnetic fields (synchrotron radiation). Ingeneral, polarization and especially changes in the polariza-tion can be utilized to investigate the magnetic field struc-ture of the emission sites and put additional constraints onthe emission models. Recently, changes in the polarization(amplitude and angle) have been used to investigate the originof the γ-ray emission in several blazars (Marscher et al. 2008,2010; Abdo et al. 2010b; Barres de Almeida et al. 2010). The
116 Calculating the number of observations with a flux a factor 1.5 abovethe error weighted mean (for this data set ∼ 1.8 × 10⁻¹² cm−2s−1).
observed pattern – a change in the HE/VHE flux coincidingwith a rotation in the electric vector position angle (EVPA)and/or a change in the relative polarization – could resultfrom: a non-axisymmetric magnetic field through which theemission region propagates, a swing of the jet across the lineof sight, or a curved trajectory of the emission region e.g. fol-lowing helical magnetic field lines or a bent jet (Abdo et al.2010b).
HST 2001-2008 — Regular optical polarimetry observationsof the M 87 jet have been performed with the HST from 2004to 2006 (Sec. 2.4; Perlman et al. 2011). The measured degreeof polarization and the polarization angle for the core regionand HST-1 are shown in Fig. 4, left panel. While both compo-nents show variable polarization their overall behavior is verydifferent: during the flaring period (2004-2007) HST-1 showsa clear correlation of the fractional polarization with the totalflux, with the fractional polarization ranging from 20 to 40 %.The EVPA remains almost constant ∼ 7 − 8◦ off the directionof the jet (−69.5◦; gray line in Fig. 4, lower panel). The nu-cleus, on the other hand, displays a highly variable EVPA witha lower overall polarization of 2 to 10 %. The EVPA changesare not correlated with the total flux or the fractional polariza-tion and appear, within the given sampling, erratic. The HSTpolarimetry data covers the 2005 VHE flare but, apart fromthe previously mentioned correlation of the HST-1 photomet-ric flux and fractional polarization, no correlations connectedto the 2005 VHE flaring episode are apparent from the data.
LT 2010 — Triggered by the detection of the 2010 VHE flarethe LT started to take regular optical polarimetry observationsof M 87 in April 2010. The resolution of the instrument isnot sufficient to separate the core and HST-1 and, therefore,one value for the combined core + HST-1 region is given.The LT detects clear variability of the degree of polarizationof the core + HST-1 complex and marginal evidence (∼ 2σ)for variability of the EVPA (Fig. 4, right panel). The polar-ization degree changes between ∼ 2 and ∼ 12 % but withoutany apparent correlation with the VHE γ-ray flux. The mea-sured EVPA indicates changes at the time of the VHE flaringepisode from ∼ −130◦ to ∼ −60◦ (∼ 70◦ in 3 days) and latersettles to a stable EVPA of ∼ −20◦ about 50 days after theflare, though the only marginal indication for EVPA variabil-ity and the lack of continuous monitoring before and directlyafter the VHE flare makes it difficult to interpret these changesin terms of a continuous rotation of the EVPA. The observedpolarization variability pattern is compatible with the patternpreviously observed by HST for the core region and differentto what has been observed from HST-1. This indicates thatthe 2010 LT data is possibly dominated by emission from thecore.
5. VHE FLARES & MWL CORRELATIONSOver the last 10 years M 87 has been extensively monitored
all across the electro-magnetic spectrum from radio to VHE(Fig. 1). This large data-set can be used to investigate MWLcorrelations and thereby probe the origin of the VHE γ-rayemission. In principle, many different physics processes couldcontribute to the production of VHE γ-ray emission in M 87,e.g. annihilation of massive dark matter particles (Baltz et al.2000), cosmic ray interactions in the extended radio lobes andthe surrounding cluster (Pfrommer & Enßlin 2003), particleacceleration in the relativistic jets, etc. The detected short-term variability with timescales of the order of days and the

12 The H.E.S.S., MAGIC, & VERITAS Collaborations and the M 87 MWL Monitoring Team
0.0
0.2
0.4
0.6
0.8
1.0
ΦUV/O
(m
Jy)
HST STIS/F25QTZ - coreHST ACS/F220W - coreHST ACS/F250W - coreHST STIS/F25QTZ - HST-1HST ACS/F220W - HST-1HST ACS/F250W - HST-1
20012002
20032004
20052006
20072008
Year
Time (MJD)
0
10
20
30
40
P (
%)
HST F606W - coreHST F606W - HST-1
52000 52500 53000 53500 54000MJD
150
100
50
0
EV
PA
(deg)
HST F606W - coreHST F606W - HST-1
LT - (core + HST-1) / 10
20102011
Year
LT - (core + HST-1) x 10
55200 55300 55400 55500MJD
LT - core + HST-1
Fig. 4.— Optical polarization for different components of the M 87 jet as measured by HST and LT. The LT polarization measurement of the core + HST-1complex is scaled up by a factor of 10 to compensate for the host galaxy emission in the measurements (see Sect. 2.4 for details). The horizontal gray solid linein the lower panel marks the jet direction (−69.5◦) while the horizontal gray dashed lines are located at −69.5◦ ± 90◦ (180◦ distance).
limits on the location place strong constraints on possible sce-narios (Aharonian et al. 2006a), leaving the inner jet and theclose vicinity of the SMBH as the most probable emissionsites. In the following, the MWL behavior of the two mostprominent features in the innermost structure of M 87, namelythe HST-1 knot and the core, are discussed in the light of theVHE flaring activity.
HST-1 — Between 2001 and 2008 the first bright feature inthe jet resolved by the HST in the optical, HST-1, underwenta spectacular flare detected in radio, optical, and X-rays (Perl-man et al. 2003; Harris et al. 2003). The flare displayed a rel-atively smooth rise over several years with a flux increase bymore than a factor 50 in X-rays and optical. The flux peakedin the beginning of 2005 (Harris et al. 2006, 2009) aroundthe same time when the enhanced activity level and the firstshort term variability had been detected at VHE (Aharonianet al. 2006a). HST-1 has been discussed as a possible sitefor the VHE γ-ray emission (e.g. Stawarz et al. 2006; Che-ung et al. 2007; Harris et al. 2009). While the size of HST-1 as a whole is too large to account for the short-term vari-ability detected at VHE (following causality arguments), highresolution VLBA radio observations resolve HST-1 into sev-eral, partially unresolved sub-structures (Cheung et al. 2007).These sub-structures also display apparent superluminal mo-tion up to 4.3 c ± 0.7 c (see also Giovannini et al. 2011). Incombination with the detected synchrotron X-ray emissionand strong polarization of the radio-to-optical continuum, thisindicates that efficient in-situ acceleration of the radiating par-ticles is taking place in compact sub-volumes of the HST-1 re-gion, characterized by well-organized magnetic field and rel-ativistic bulk velocities. On the other hand, during the 2008and 2010 VHE flares HST-1 was in a low flux state withoutpronounced activity at radio or X-ray wavelengths, thus disfa-
voring it as the origin of the VHE γ-ray emission during theseepisodes.
Core — The direct vicinity of the SMBH and the jet basehave been proposed as possible production sites of the VHEγ-ray emission (e.g. Reimer et al. 2004; Ghisellini et al. 2005;Tavecchio & Ghisellini 2008; Neronov & Aharonian 2007;Rieger & Aharonian 2008; Lenain et al. 2008; Barkov et al.2010; Giannios et al. 2010; Levinson & Rieger 2011). M 87is only a weak IR source (νLν ∼ 1041 erg/s; Perlman et al.2001b) and, therefore, VHE γ-rays are most likely able to es-cape even from the close vicinity of the SMBH without suf-fering strong absorption due to γγ-interactions (Neronov &Aharonian 2007; Brodatzki et al. 2011), although the debatedorigin of the observed IR photons and the poorly known struc-ture of the accretion disk in the M 87 core, which both play acrucial role in this context, should be kept in mind (see the dis-cussion in Cheung et al. 2007 and Li et al. 2009). The M 87jet base has been imaged with VLBI with sub-mas resolution(see e.g. Ly et al. 2007, and references therein). It shows aresolved, edge brightened structure to within 0.5 mas of thecore (0.04 pc) and indications for a weak counter-jet feature,suggesting that the SMBH lies within the central beam of theVLBI observations. At even shorter distances to the core thejet has a wider opening angle, which is interpreted as the jetcollimation zone (Junor et al. 1999).
In 2008, densely sampled 43 GHz radio observation of theinnermost jet regions revealed a flare of the radio core (fluxincrease of ∼ 30 %; Acciari et al. 2009). At the same time, aflare at VHE and a subsequent enhanced X-ray flux from thecore region followed by a sharp decrease were detected. Theobserved MWL variability pattern supported the interpreta-tion that the VHE γ-ray emission likely originates from theclose vicinity of the SMBH near the jet base (Acciari et al.
2010 VHE flare & 10 years of MWL observations of M 87 13
2009). The observed MWL behavior (VHE and radio flux,radio map) is well described by a simple, phenomenologicalmodel where the VHE flares are associated with the injectionof plasma at the jet base (Acciari et al. 2009 supporting on-line material). As the injected plasma blobs travel down thejet, they expand and become transparent for radio emissionleading to the observed radio feature.
In contrast, radio observations taken in 2010 contempora-neous with the VHE flare show no enhanced radio flux fromthe core region (Fig. 1): VLBA 43 GHz ToO observationstriggered by the detection of the VHE flare indicate a sta-ble flux state of the core (1.2 mas) and the inner jet (1.2 to5.3 mas) at the previously detected flux levels. In addition,EVN 5 GHz, VLBA 2.3 GHz, and MOJAVE 15 GHz measure-ments also show no indication of an enhanced radio flux statefrom the core in 2010. A direct comparison of these data withthe 43 GHz data is difficult given the difference in resolutionand the missing overlap during the 2008 flare.117 In the op-tical, only a combined measurement for the core and HST-1with limited sensitivity by the LT is available, which does notindicate any strong activity in the two components in 2010.
On the other hand, Chandra X-ray observations of the coreshow an enhanced flux ∼ 3 days after the peak of the VHEγ-ray emission in 2010 (see Fig. 1). The flux is enhanced by afactor ∼ 2 for a single measurement and than drops back to alower state less than two days later. The observed variabilitytimescale is significantly shorter (by a factor ∼ 10) then theshortest X-ray variability measured previously from the M 87core (. 20 days; Harris et al. 2009). Further details on theChandra X-ray data from 2010 will be reported in a compan-ion paper (Harris et al. 2011).
It should be noted that the X-ray fluxes measured from thecore during the time of the VHE flares in 2008 and 2010 arethe two highest measurements since the start of the Chandraobservations in 2002. This coincidence can be interpretedas indication that the VHE γ-ray emission in 2008 and 2010originates from the X-ray core region. During the 2005 VHEflaring episode no enhanced X-ray emission from the corewas detected. At that time, HST-1 was more than a factor 30brighter than the core region in X-rays leading to uncertain-ties in the flux estimation of the core (e.g. ’eat-thy-neighbor’effect; see Appendix A of Harris et al. 2009) which could sup-press the detection of a core flare.
6. DISCUSSIONGeneral considerations — The VHE and MWL data in this
paper can be interpreted in two fundamentally different ways:(1) each of the VHE flares detected originates from a differentemission region and/or process, or (2) they have a commonorigin. Support for the former interpretation comes from thedifference in the VHE light curves (variability pattern and theoverall duration of each episode), as well as from the differ-ence in the apparent MWL correlations in the different years.In this interpretation, all previously derived models remainpossible and an additional explanation for the 2010 flare hasto be found. Observational support for the latter interpreta-tion, involving a common origin of the VHE flares, followsfrom the similarities in the detected peak fluxes, flux doublingtimescales, and also in the spectral shapes of the differentVHE flares (for details on the VHE spectrum see Aharonianet al. 2006a; Albert et al. 2008a; Aliu et al. 2011). In this in-
117 Noteworthy, one of the highest flux states in the MOJAVE 15 GHz datais measured in 2008 shortly after the VLBA 43 GHz observations ended.
terpretation the only remaining MWL signature for the VHEflares is an X-ray flare of the core region (see previous section)locating the VHE γ-ray emission site in the central resolutionelement of the Chandra observations (0.6 ′′ ∼ 50 pc).118
In addition, it is not known whether the quiescent and flar-ing VHE γ-ray emission are produced in the same region andby the same process. While, in principle, they can be pro-duced in two distinct locations by two different processes, thesimilarities of the VHE γ-ray spectrum between the two statesmight suggest a common origin, or at least a very similarphysical process involved. A common origin of the quiescentand flaring VHE fluxes is therefore anticipated below, eventhough different emission regions dominating the two statescannot be excluded. Interestingly, the HE spectrum measuredby Fermi-LAT joins smoothly with the VHE spectra derivedfor the quiescence state (Abdo et al. 2009) possibly indicatinga common origin and, therefore, HE-VHE flux correlationscould be expected. Unfortunately, due to the low flux of M 87in the HE band and the limited sensitivity of Fermi-LAT, noconclusive statement on such correlation can be derived fromthe data presented in this paper.
In the following, the discussion will mainly focus on thecase where a common origin of all VHE flares in the X-raycore (0.6 ′′ ∼ 50 pc) associated with an X-ray flare is assumed.
Characteristics of the VHE flares — The VHE flares are char-acterized by a variability timescale tvar ' 1 day, and a broadband power law spectrum extending from ∼0.1 TeV up toat least 10 TeV with photon index Γ ' 2.3, weakly vari-able during flares (Aharonian et al. 2006a; Albert et al.2008a; Aliu et al. 2011). The observed VHE flux duringthe flaring episodes reached similar maximum flux levels ofΦ>0.35 TeV ' (1 − 3) × 10−11 ph cm−2 s−1. With the adopteddistance of d = 16.7 Mpc and using the average photon in-dex Γ = 2.3, the corresponding isotropic VHE luminosity isLVHE = 4πd2 Φ>E0 E0 (Γ−1)/(Γ−2) ' (0.8−2.4)×1042 erg s−1.If extrapolated down to the HE range (0.1 GeV) with thesame photon index, the total γ-ray luminosity of the flaringevents would be even higher, namely LHE−VHE ∼ 1043 erg s−1.This is a non-negligible amount given that the bolometricaccretion luminosity of the M 87 nucleus is relatively low,Lacc ∼ 1042 erg s−1 (Reynolds et al. 1996; Di Matteo et al.2003; Kharb & Shastri 2004), and the total kinetic luminos-ity of the jet is also quite modest, Lj ∼ 1044 erg s−1 (Bick-nell & Begelmann 1996; Owen et al. 2000). The efficiencyof the VHE γ-ray production in M 87 is therefore an issue,even taking into account order-of-magnitude dimmer quies-cence fluxes. More specifically, the observed VHE luminos-ity during the flaring events (which is approximately equal tothe average/quiescence bolometric γ-ray luminosity in bothHE and VHE bands; see Abdo et al. 2009) is of the orderof the accretion luminosity in the M 87 system, constitutingat the same time about 1% of the jet total kinetic luminosity,LVHE ∼ Lacc ∼ 0.01 × Lj.
Interestingly, assuming the observed emission is moder-ately beamed with a Doppler factor δ of the order of a fewand that, when viewed at smaller inclinations, the beaming ofthe nuclear jet in the M 87 system would be the same as theone deduced for blazar sources, namely δ? ' 10 − 30, theisotropic VHE flaring luminosity of M 87 observed at smallerviewing angles would read L?VHE ' (δ?/δ)4 LVHE ' (1044 −
118 It should also be noted that direct observational limits on the extent ofthe VHE emitting region constrain its projected size to be . 14 kpc centeredon the radio core (Aharonian et al. 2006a).

14 The H.E.S.S., MAGIC, & VERITAS Collaborations and the M 87 MWL Monitoring Team
1046) erg s−1. This is in the range of VHE flaring luminosi-ties of blazars of the BL Lac type, for which low-power radiogalaxies like M 87 are believed to constitute a parent popula-tion (Urry & Padovani 1995). Moreover, in such a scenariothe observed variability timescales are scaled down by the ra-tio of the Doppler factors ∆t? = (δ/δ?) ∆t ∼ (0.5 − 0.2) ∆tbecoming of the order of a few hours, which is less than thetimescale derived from the size of the Schwarzschild radiivia causality arguments (∼day). Variability timescales shorterthen the causality timescales are also observed in flaring VHEblazars, where, in some cases, variability timescales down toa few minutes imply even higher Doppler factors of O(100)(e.g. Albert et al. 2007; Wagner 2008; H.E.S.S. Collaborationet al. 2010). This agreement can be considered as support fora blazar-like origin of the γ-ray emission in M 87. The VHEflux changes by a factor of 10 and a VHE flare duty cycleof O(10%), as estimated in this paper, would also be consis-tent with such a hypothesis (Wagner 2008). Note in this con-text that with relativistic beaming involved the power emittedduring the VHE flares would be reduced with respect to theisotropic luminosity estimated above as Lem,VHE ' Γ−2
j LVHE,where Γ j is the bulk Lorentz factor of the emitting region.
Particularly interesting and constraining are the distincttiming properties of the one-day-long VHE flares of M 87,recognized clearly and quantified for the first time in this pa-per. These include repetitive outbursts (2005), erratic fluxchanges (2008), exponential flux increases/decays for well-defined isolated events, and significantly different rise and de-cay times (2010). If indeed the three flares share a commonorigin, every model dealing with the VHE γ-ray emission ofM87 has to be able to accommodate such a diversity in theobserved variability patterns.
Lastly, MWL correlations (or the apparent lack of such)have to be addressed as well, meaning in particular the emerg-ing connection between the VHE and X-ray bands with no ac-companying flux variations at radio or optical frequencies. Itshould be noted, however, that unlike the order-of-magnitudeflux increases observed in the VHE regime, the observed vari-ability in the X-ray regime is of a much lower amplitude(flux changes by a factor of ∼ 2 only), corresponding to arather moderate X-ray core peak luminosity of the order of∼ 1041 erg s−1. This value has to be taken with some cautionthough since, up to now, there are no truly simultaneous X-raycore observations during a VHE flare (i.e. during the night ofthe peak of the VHE γ-ray emission).
In the following paragraphs, existing models for VHE γ-ray emission from the M 87 core are briefly reviewed anddiscussed in the light of the new observational result pre-sented in this paper. The majority of models discussed havebeen published before the detection of M 87 by Fermi-LAT(Abdo et al. 2009). Models published before 2006 are alsonot constrained by the VHE short-term variability discoveredby H.E.S.S. (Aharonian et al. 2006a).
Observations versus modeling — Let us start with the ’mis-aligned blazar’-type, or rather ’misaligned BL Lac’-type sce-narios (noting at the same time that the standard leptonic ’ho-mogeneous one-zone SSC’ approach has been often consid-ered to fail in explaining the observed VHE properties of theM 87 nucleus; but see also the discussion in Abdo et al. 2009).One of the first models of this kind was discussed by Reimeret al. (2004), and involved a mixture of hadronic and leptonicemission processes operating within its relativistic outflow atdistances from the jet base small enough to assure R < c tvarδ
for the emission region size R ∼ 1016 cm, variability timescaletvar ∼ 1 day, and the expected moderate beaming, δ ∼a few.Designed to account for the non-simultaneous data known atthat time, the HE/VHE continuum was dominated by the syn-chrotron radiation of protons and muons in strong magneticfields. While proton synchrotron radiation, with a maximumintrinsic cut-off at ∼ 0.3 TeV, appears unable to account forthe measured VHE spectra detected up to ∼ 10 TeV, syn-chrotron radiation from muons (produced in charged pion de-cays) and the pion cascade components could potentially ex-tend the VHE spectrum to higher energies. This would thenimply pion-production losses to be at least of the same orderof magnitude as proton synchrotron losses. The low energy,millimeter–to–UV part of the spectrum is ascribed to the syn-chrotron emission of primary electrons with the same injec-tion spectral index as the primary protons, and the high, non-simultaneously measured X-ray flux considered to be domi-nated by an additional component. A direct VHE/X-ray cor-relation with a high X-ray flux level is thus not expected insuch a scenario.
Georganopoulos et al. (2005) discussed a leptonic versionof the blazar-type modeling of the M 87 nucleus, relaxing theassumption regarding the homogeneity of the emission re-gion. More precisely, Georganopoulos et al. considered thecase of a relativistic jet decelerating substantially on sub-pcdistances from the core, and showed that the velocity dif-ference between a faster and a slower portion of the outflowcould lead to the enhanced inverse-Compton emission of theformer one in the TeV range (due to a relativistic boost of theenergy density of soft photons produced in one portion of theflow in the rest frame of the other), at a level allowing a fitto the VHE data. In the model, the core emission observed atlonger wavelengths (including the GeV range) was predomi-nantly due to the slower and outer parts of the decelerating jet.A related scenario was analyzed by Tavecchio & Ghisellini(2008), who assumed instead radial velocity stratification, in-volving a relativistic jet spine surrounded by a slower sheath.In the particular model fits presented by Tavecchio & Ghis-ellini, the observed radio–to–HE emission of the unresolvedM 87 core was dominated by the radiative output of the jetspine, while the observed VHE γ-ray emission was producedmainly in the jet boundary layer. Both models are charac-terized by compact sizes of the VHE γ-ray emission region(R < 1017 cm), moderate beaming, and no obvious — if any— correlation between the VHE and lower-frequency bands.Importantly, the VHE spectra calculated in the framework ofboth models were rather soft, due to the Klein-Nishina and γ-ray opacity effects involved (see the discussion in Tavecchio& Ghisellini 2008). Multi-zone approaches, meaning a dou-bled number of the model free parameters, could possibly al-low for some modifications to the presented fits enabling oneto accommodate some additional MWL constraints (for ex-ample the VHE/X-ray correlation), but the observed flat flar-ing spectra of M 87 in the VHE range will remain problematicin both cases.
Blazar type models assuming a different structure of theemission region are discussed in Lenain et al. (2008) and Gi-annios et al. (2010). In those, the bulk of the observed emis-sion of the unresolved M 87 jet was proposed to be producedin extremely compact sub-volumes of the main outflow. In thescenario analyzed by Lenain et al., such compact sub-volumeswere assumed to be multiple blobs ejected from the core withmodest or highly relativistic bulk velocities into a cone witha large opening angle. In the framework of the model con-

2010 VHE flare & 10 years of MWL observations of M 87 15
sidered by Giannios et al., on the other hand, one is dealingwith fast mini-jets moving in random directions within a rel-ativistic ‘large-scale’ outflow. Complex setups of the modelsresulted in the fact that different variability patterns and vari-ous variability timescales could, in principle, be expected, de-pending on a particular choice of the model free parameters(for which broad ranges of values could be considered). In theparticular fits presented by Lenain et al. (2008), the authorsconsidered for example the radio–to–UV continuum of theM 87 core to be produced by the extended though still unre-solved portion of the jet, and argued that the synchrotron andinverse-Compton emission of tiny blobs moving within sucha jet may account for the observed nuclear X-ray and γ-rayfluxes, respectively, including not only the quiescent but alsoflaring states. The anticipated VHE/X-ray correlation with noaccompanying flux variations at longer wavelengths is thus aninteresting feature of the model.
Yet the crucial assumption regarding linear sizes of theemitting blobs significantly smaller than the Schwarzschildradius of the M 87 black hole, R � RS, might be regardedas questionable (see the discussion in Begelman et al. 2008).A possible physical justification for the formation of suchultra-compact sites of the enhanced energy dissipation closeto SMBHs in AGN jets, and M 87 in particular, was given byGiannios et al. (2010), who speculated that this is the mag-netic reconnection process which may trigger compact beamsof plasma (‘mini-jets’), which then propagate with relativis-tic bulk velocities within a strongly magnetized, extendedand similarly relativistic outflow. In their application to thespecific case of M 87, Giannios et al. (2010) demonstratedthat the synchrotron and inverse-Compton emission of thereconnection-driven mini-jets could account for the observedX-ray and VHE nuclear fluxes, somewhat in analogy to theresults obtained by Lenain et al. (2008), again under particu-lar model assumptions regarding the model free parameters.In the end, not only the fast VHE variability and the flat VHEspectra, but also the VHE/X-ray correlation could be success-fully accommodated in the model.
Possibly challenging for scenarios involving ultra-compactemission regions is also the required efficiency of the VHE γ-ray production. As discussed above, the VHE flares observedin the M 87 system are characterized by an isotropic luminos-ity constituting at least 1% of the total kinetic power of theM 87 jet. Whether such a power can indeed be efficiently dis-sipated within tiny sub-volumes of the jet remains an openquestion, even taking into account the expected beaming cor-rections.
Magnetospheric particle acceleration and emission modelshave also been invoked to explain the observed VHE emis-sion in M 87 (see e.g. Rieger 2011, for a review). Assumedto be operating close to the event horizon of the central su-permassive black hole, the anticipated variability timescale(light-crossing argument) could be as small t ' 2GMBH/c3 '
0.35 day, and thereby satisfy the observed variability con-straints. The observed radio-VHE correlation during the 2008VHE flare has been interpreted to provide additional supportfor such an approach (Acciari et al. 2009). Usually, efficientparticle acceleration in these scenarios is related either to gap-type (Neronov & Aharonian 2007; Levinson & Rieger 2011)or centrifugal-type processes (Rieger & Aharonian 2008) oc-curring in the magnetosphere around a rotating black hole.While the former can be very efficient and lead to the onset ofan electromagnetic pair cascade (triggered by the absorptionof ambient photons up-scattered to high energies by electrons
accelerating in the gap), the latter is less efficient such that theVHE spectrum is expected to be shaped by the ambient softphoton spectrum (see also Vincent & LeBohec 2010). Bothapproaches appear to be able to reproduce the observed hardVHE flaring characteristics, but may need an additional con-tribution to account for the HE continuum.
Recently, a different type of modeling has been broughtforward to explain the observed VHE γ-ray emission fromM 87: Barkov et al. (2010) argued that interactions of a rel-ativistic and strongly magnetized outflow around the jet for-mation zone with a star partially tidally disrupted by the in-teraction with the SMBH can lead to a very efficient produc-tion of hadronic-originating VHE photons (see also Bednarek& Protheroe 1997, for a different version of the jet-star in-teraction model for blazar-type sources). The predicted ex-ponential character of the flux increase and decay during theresulting VHE event, a flat GeV to TeV γ-ray spectrum fromproton-proton interactions, as well as the accompanying X-ray flux enhancement due to the free-free emission of theshocked cloud of the stellar matter, are particularly interest-ing features of the model which should be kept in mind.Other scenarios could yet be considered in the same con-text as well, involving stochastic acceleration of high en-ergy particles within a turbulent accretion flow close to theevent horizon of a SMBH (in analogy to the model proposedby Liu et al. 2006, in the context of VHE γ-ray emissionof Sgr A*), or reconnection-driven impulsive acceleration ofelectron-positron pairs in a magnetized corona of the accre-tion disk, e.g., in analogy to the model proposed by Zdziarskiet al. (2009) in the context of VHE observations of the Galac-tic X-ray binary system Cygnus X-1 (see also de Gouveia DalPino et al. 2010).
HST-1 — The arguments against association of the detectedVHE γ-ray emission with the non-thermal activity of the HST-1 knot are twofold: First, rapid variability of the VHE con-tinuum involving day-long flares implies that the emissionregion size is significantly smaller than the inferred size ofthe knot. Second, apart from the 2005 event, no correla-tion between the VHE activity and the radio–to–X-ray syn-chrotron radiation of the HST-1 flaring region, variable on thetimescales of weeks and months, has been established. Thefirst argument has to be taken with caution, though. That isbecause the HST-1 flaring region is basically unresolved evenfor radio interferometers, as already noted before. More im-portantly, very recently it has been found that rapidly variablehigh-energy radiation can be generated far away from the cen-tral jet engine, within the outer parts of relativistic outflows.In particular, the analysis of the γ-ray emission of a brightquasar PKS 1222+216 indicates that the day-long VHE flaresin this object originate most likely in compact sub-volumesof a relativistic jet at parsec distances from the active cen-ter (Aleksic et al. 2011; Tanaka et al. 2011; Tavecchio et al.2011). Interestingly, analogous phenomena seem to occur oneven larger scales as well. For example, Chandra monitoringof the Pictor A radio galaxy reveals that the synchrotron X-rayemission of the knots located at tens of kpc from the jet baseis variable on the timescales of years. This is much shorterthan the variability timescale expected following the causalityarguments for a given jet radius at the position of the knot,which is of the order of thousands of years (Marshall et al.2010). Hence, it remains formally possible that also in thecase of the HST-1 knot, located about 100 pc from the M 87nucleus, rapid VHE flares are being generated on timescales

16 The H.E.S.S., MAGIC, & VERITAS Collaborations and the M 87 MWL Monitoring Team
shorter than the ones expected for a homogeneous outflow.Yet, the indications found in this paper for correlation be-
tween the VHE flares and an X-ray flux increases of the nu-cleus of M 87 provide observational support for the idea thatthe observed VHE γ-ray emission, at least during the flaringepisodes, is associated with the innermost parts of the jet orwith the closest vicinities of the SMBH in the center of thisradio galaxy. Again, in principal, it remains plausible that,while the unresolved core dominates the flaring states, the qui-escent VHE γ-ray emission of M 87 is instead related to theHST-1 knot. However, above we have advocated for a com-mon origin of the quiescence and flaring VHE fluxes basedon the spectral similarity of the two states. If the favored hy-pothesis is correct indeed, then interesting constraints on thephysical parameters of HST-1 can be derived. That is becausethe inverse-Compton up-scattering of ambient photon fieldsto the VHE range by the high-energy electrons producing theobserved radio–to–X-ray synchrotron radiation of the knot isat some level inevitable, with the efficiency depending mostcrucially on the unknown magnetic field intensity within theconsidered jet region. Since for the equipartition value of thejet magnetic field a relatively intense VHE γ-ray emission ofHST-1 should be expected (Stawarz et al. 2006; Cheung et al.2007), the upper limits for the radiative output of the knot inγ-rays (following from the fact that the observed VHE flux isassociated with the nucleus) implies a strong, possibly evendynamically relevant jet magnetic field at hundreds-of-pc dis-tances from the jet base. This should be then considered as animportant support for the MHD models of AGN jets, like theone presented in the particular context of the M 87 core andHST-1 knot by (Nakamura et al. 2010), and discussed furtherfrom the observational perspective by Perlman et al. (2011)and Chen et al. (2011). Analogous constraints emerging fromthe VHE data can be investigated for the outer parts of theM 87 jet as well (Stawarz et al. 2005; Hardcastle & Croston2011).
7. SUMMARY & CONCLUSIONSDuring a joint VHE monitoring campaign on the nearby
radio galaxy M 87 in 2010, a major flux outburst was de-tected, triggering further VHE and MWL observations. Thecoordinated observations led to the best-sampled VHE lightcurve during a flaring state from this source (21 observa-tions in 15 days), revealing a single, isolated outburst. Themeasured VHE light curve of the flare is well described bya two-sided exponential function with significantly differentflux doubling times of τrise
d = (1.69 ± 0.30) days for the ris-ing and τdecay
d = (0.611 ± 0.080) days for the decaying part,i.e. a difference of a factor 2.77 ± 0.62. This measurementprovides the shortest and the most precisely determined VHEvariability timescale of M 87 today, and the first detection ofa significantly asymmetric VHE flare profile in the source.
In comparison to previous VHE flares detected in 2005 and2008, the 2010 flare shows similar timescales and peak fluxlevels, but the overall variability pattern is somewhat differentfrom the more extended periods of flaring activity with sev-eral flux maxima observed before, though the statistics andthe sampling of the previous VHE flares limit a definitive con-clusion on that matter. From the VHE long-term light curvethe duty cycle for VHE flares is estimated to be < 4 − 28%,depending on the assumed threshold flux defining a VHE highstate.
VLBA 43 GHz observations, triggered by the detection of
the VHE flare, show no indications for an enhanced radioemission from the jet base in 2010. This is in contrast to ob-servations in 2008, where the detection of a radio outburst ofthe core contemporaneous with the VHE flare lead to the con-clusion that the VHE γ-ray emission is likely produced in thedirect vicinity of the SMBH (Acciari et al. 2009). ChandraX-ray observations, taken ∼ 3 days after the peak of the VHEγ-ray emission, show a high flux state of the core region in2010, supporting the interpretation that the VHE flare origi-nates from the innermost jet regions.
The long term (2001-2010) light curve of M 87, spanningfrom radio to VHE, is investigated for a common MWL signa-ture accompanying the three VHE flares. No unique signatureis found. Observations of the jet component HST-1, whichhas also been proposed as a possible emission site of the VHEγ-ray emission, show no enhanced activity in 2008 and 2010,disfavoring HST-1 as the origin of the VHE flares during thoseyears. In 2008 and 2010 the VHE flares are accompanied bya high state of the X-ray core with a flux increase by a fac-tor ∼ 2, while in 2005 the strong flux dominance (more thana factor 30) of the nearby X-ray feature HST-1 could havesuppressed the detection of such an increase of the core emis-sion. Associating the VHE flares with the X-ray flares fromthe core places the emission site in the central resolution ele-ment of Chandra (0.6 ′′ ∼ 50 pc).
Several models have been proposed to explain the observedVHE γ-ray emission from M 87, most of which were basedon the ‘misaligned BL Lac’ hypothesis. And, in fact, sev-eral observed properties of the source, including the broad-band γ-ray spectrum, the multi-wavelength character of theVHE flares, and their overall energetics, could be consid-ered as support for the blazar-like models for the VHE γ-ray emission. Yet, the particular one-zone or two-zone emis-sion models proposed involving only moderate beaming, bothhadronic and leptonic, have difficulties in explaining VHE/X-ray correlated variability, for which indications are found inthis paper, as well as the relatively flat VHE spectrum ofM 87 (photon index Γ ∼ 2.3) extending up to ∼ 10 TeV.More complex blazar-type scenarios, involving ultra-compactemission regions and more substantial beaming, may, in-stead, face difficulties in accounting for the flares’ energet-ics with the isotropic peak luminosity during the flares reach-ing LVHE ' (0.8 − 2.4) × 1042 erg s−1, which is of order ofthe accretion luminosity and about 1% of the total jet power.Other non-blazar emission models discussed in the contextof the VHE observations of M 87, which are quite success-ful in reproducing some of the established properties of thesource, seem, on the other hand, challenged by the broad-bandcharacter of the γ-ray continuum, as long as the GeV photonenergy range constrained by the Fermi-LAT observations isincluded. All in all, even though no emission model couldbe identified as the most plausible one, important limitationsfor most of them have been identified and novel observationalconstraints have been presented in this paper. Thus, the caseof M 87 demonstrates the relevance of systematic, long-termand multi-wavelength monitoring of nearby radio galaxies inunderstanding the origin of the high-energy emission of radio-loud AGN.
The authors thank the anonymous referee for helpful suggestionswhich improved the manuscript.The H.E.S.S. Collaboration acknowledges support of the Namibianauthorities and of the University of Namibia in facilitating the con-

2010 VHE flare & 10 years of MWL observations of M 87 17
struction and operation of H.E.S.S., as is the support by the GermanMinistry for Education and Research (BMBF), the Max Planck So-ciety, the French Ministry for Research, the CNRS-IN2P3 and theAstroparticle Interdisciplinary Programme of the CNRS, the U.K.Science and Technology Facilities Council (STFC), the IPNP ofthe Charles University, the Polish Ministry of Science and HigherEducation, the South African Department of Science and Technol-ogy and National Research Foundation, and by the University ofNamibia. We appreciate the excellent work of the technical sup-port staff in Berlin, Durham, Hamburg, Heidelberg, Palaiseau, Paris,Saclay, and in Namibia in the construction and operation of theequipment.The MAGIC Collaboration would like to thank the Instituto de As-trofısica de Canarias for the excellent working conditions at the Ob-servatorio del Roque de los Muchachos in La Palma. The support ofthe German BMBF and MPG, the Italian INFN, the Swiss NationalFund SNF, and the Spanish MICINN is gratefully acknowledged.This work was also supported by the Marie Curie program, by theCPAN CSD2007-00042 and MultiDark CSD2009-00064 projects ofthe Spanish Consolider-Ingenio 2010 programme, by grant DO02-353 of the Bulgarian NSF, by grant 127740 of the Academy of Fin-land, by the YIP of the Helmholtz Gemeinschaft, by the DFG Clusterof Excellence “Origin and Structure of the Universe”, by the DFGCollaborative Research Centers SFB823/C4 and SFB876/C3, and bythe Polish MNiSzW grant 745/N-HESS-MAGIC/2010/0.The VERITAS Collaboration acknowledges support from the USDepartment of Energy Office of Science, the US National Sci-ence Foundation, and the Smithsonian Institution, from NSERC inCanada, from Science Foundation Ireland (SFI 10/RFP/AST2748),and from STFC in the UK. We acknowledge the excellent work ofthe technical support staff at the FLWO and at the collaborating in-stitutions in the construction and operation of the instrument.
The Fermi LAT Collaboration acknowledges generous ongoing sup-port from a number of agencies and institutes that have supportedboth the development and the operation of the LAT as well as sci-entific data analysis. These include the National Aeronautics andSpace Administration and the Department of Energy in the UnitedStates, the Commissariat a l’Energie Atomique and the Centre Na-tional de la Recherche Scientifique / Institut National de PhysiqueNucleaire et de Physique des Particules in France, the AgenziaSpaziale Italiana and the Istituto Nazionale di Fisica Nucleare inItaly, the Ministry of Education, Culture, Sports, Science and Tech-nology (MEXT), High Energy Accelerator Research Organization(KEK) and Japan Aerospace Exploration Agency (JAXA) in Japan,and the K. A. Wallenberg Foundation, the Swedish Research Coun-cil and the Swedish National Space Board in Sweden. Additionalsupport for science analysis during the operations phase is gratefullyacknowledged from the Istituto Nazionale di Astrofisica in Italy andthe Centre National d’Etudes Spatiales in France.Analysis of the Chandra data was supported by NASA grant GO0-11120X.The Very Long Baseline Array is operated by the National RadioAstronomy Observatory, a facility of the NSF, operated under coop-erative agreement by Associated Universities, Inc.The European VLBI Network is a joint facility of European, Chi-nese, South African and other radio astronomy institutes funded bytheir national research councils. This effort is supported by the Eu-ropean Community Framework Programme 7, Advanced Radio As-tronomy in Europe, grant agreement No. 227290.This research has made use of data from the MOJAVE database thatis maintained by the MOJAVE team (Lister et al. 2009).This research has made use of NASA’s Astrophysics Data Systemand of the python modules numpy, scipy, & matplotlib (Hunter2007).
APPENDIX
QUANTIFYING THE DIFFERENCE BETWEEN THE 2008 AND THE 2010 VHE FLARES
To investigate the compatibility of the 2008 and 2005 VHE data with the flare detected in 2010, the best fit exponential functionto the 2010 data (Fig. 3; Tab. 2) is taken as a template and compared with the 2008 and 2005 light curves. The position of the peakt0 is varied (all other parameters fixed) and the resulting χ2/d.o.f. and probabilities are calculated for the data within a time spanof length of the original fit length: t0−7 < tdata < t0 + 2. The results for the 2010, 2008, and 2005 data around the flaring episodesare shown in Fig. 5, with the gray band again denoting the observation period with the flaring episode in each year. The statisticsin 2005 are low resulting in several good probabilities (high probabilities > 0.1) over the flaring episode. For most parts of the2008 flare, the probability for the 2010 fit describing the data is well below 1%. The only notable exception is the beginningof the episode around MJD 54496 where the first two data points are reasonably well described by the function resulting in aprobability of O(5%). Note that the peak flux from the fit (∼ 2 × 10⁻¹¹ cm−2s−1) is similar to the peak fluxes measured in 2008.Varying the fit parameters in their errors does not significantly change the results. For comparison, the same study is shown forthe 2010 data where, at the best fit position from the fit, the probability is ∼70%.
REFERENCES
Abdo, A. A., Ackermann, M., Ajello, M., Allafort, A., Antolini, E., Atwood,W. B., Axelsson, M., Baldini, L., Ballet, J., Barbiellini, G., et al. 2010a,ApJS, 188, 405
Abdo, A. A., Ackermann, M., Ajello, M., Atwood, W. B., Axelsson, M.,et al. 2009, ApJ, 707, 55
Abdo, A. A., Ackermann, M., Ajello, M., Axelsson, M., Baldini, L., Ballet,J., Barbiellini, G., Bastieri, D., Baughman, B. M., Bechtol, K., & et al.2010b, Nature, 463, 919
Acciari, V. A., Aliu, E., Arlen, T., Aune, T., Beilicke, M., et al. 2010, ApJ,716, 819
Acciari, V. A., Aliu, E., Arlen, T., Bautista, M., Beilicke, M., et al. 2009,Science, 325, 444
Acciari, V. A., Beilicke, M., Blaylock, G., Bradbury, S. M., Buckley, J. H.,et al. 2008, ApJ, 679, 397
Aharonian, F., Akhperjanian, A., Beilicke, M., et al. 2003, A&A, 403, L1Aharonian, F., Akhperjanian, A. G., Anton, G., et al. 2009, ApJ, 695, L40Aharonian, F., Akhperjanian, A. G., Bazer-Bachi, A. R., et al. 2006a,
Science, 314, 1424—. 2006b, A&A, 457, 899
Albert, J., Aliu, E., Anderhub, H., Antonelli, L. A., Antoranz, P., et al.2008a, ApJ, 685, L23
Albert, J., Aliu, E., Anderhub, H., Antoranz, P., Armada, A., et al. 2008b,ApJ, 674, 1037
Albert, J., Aliu, E., Anderhub, H., et al. 2007, ApJ, 669, 862Aleksic, J., Antonelli, L. A., Antoranz, P., Backes, M., Barrio, J. A., et al.
2010, ApJ, 723, L207—. 2011, ApJ, 730, L8+Aleksic, J., et al. 2011a, in preparation—. 2011b, in preparationAliu, V. A., et al. 2011, in preparationAtwood, W. B., Abdo, A. A., Ackermann, M., Althouse, W., Anderson, B.,
et al. 2009, ApJ, 697, 1071Baltz, E. A., Briot, C., Salati, P., et al. 2000, Physical Review D, 61, 023514Barkov, M. V., Aharonian, F. A., & Bosch-Ramon, V. 2010, ApJ, 724, 1517Barres de Almeida, U., Ward, M. J., Dominici, T. P., Abraham, Z., Franco,
G. A. P., Daniel, M. K., Chadwick, P. M., & Boisson, C. 2010, MNRAS,408, 1778
Bednarek, W., & Protheroe, R. J. 1997, MNRAS, 287, L9Begelman, M. C., Fabian, A. C., & Rees, M. J. 2008, MNRAS, 384, L19

18 The H.E.S.S., MAGIC, & VERITAS Collaborations and the M 87 MWL Monitoring Team
0+5.345e4
100
101
102
103
χ2
/ d
.o.f
.
54490 54500 54510 54520 54530t0 (MJD)
55280 55290 55300 55310 55320 55330t0 (MJD)
53450 53500t0 (MJD)
10-5
10-4
10-3
10-2
10-1
100
Pro
babili
ty
0
1
2
3
ΦVHE (
10−
11 c
m−
2 s−
1)
2005 2008 2010
Fig. 5.— VHE light curve (top), reduced chi-square χ2/d.o.f. (degree of freedom) (middle), and probability (bottom) vs the position of the peak t0 of the bestfit function to the 2010 VHE data for the 2005 (left), 2008 (middle), and 2010 VHE data (right). Values are calculated for data points inside a time-span oft0 − 7 < tdata < t0 + 2. The gray bands mark the same time period as in Fig. 1 and 2, denoting periods of increased VHE activity. Dashed vertical lines mark thepositions of VHE flares. The horizontal line in the bottom panels marks a probability of 5%.
Bicknell, G. V., & Begelmann, M. C. 1996, The Astrophysical Journal, 467,597
Biretta, J., & McMaster, M. 1997, WFPC2 Polarization Calibration, Tech.rep.
Biretta, J. A., Sparks, W. B., & Macchetto, F. 1999, ApJ, 520, 621Boffi, F. R., et al. 2007, ACS Instrument Handbook for Cycle 17, Version 8.0
(Baltimore, MD: STScI)Brodatzki, K. A., Pardy, D. J. S., Becker, J. K., & Schlickeiser, R. 2011,
ApJ, 736, 98Chen, Y. J., Zhao, G. ., & Shen, Z. . 2011, MNRAS Letters, accepted for
publicationCheung, C. C., Harris, D. E., & Stawarz, L. 2007, ApJ, 663, L65Clarke, D., & Neumayer, D. 2002, A&A, 383, 360Colin, P., Borla Tridon, D., Carmona, E., De Sabata, F., Gaug, M.,
Lombardi, S., Majumdar, P., Moralejo, A., Scalzotto, V., Sitarek, J., &Collaboration), M. 2009, in 31st International Cosmic Ray Conference,Lodz
Curtis, H. D. 1918, Publications of Lick Observatory, 13, 31Davis, J. E. 2001, ApJ, 562, 575de Gouveia Dal Pino, E. M., Piovezan, P. P., & Kadowaki, L. H. S. 2010,
A&A, 518, A5+Di Matteo, T., Allen, S. W., Fabian, A. C., Wilson, A. S., & Young, A. J.
2003, ApJ, 582, 133Fey, A. L., Ma, C., Arias, E. F., Charlot, P., Feissel-Vernier, M., Gontier,
A.-M., Jacobs, C. S., Li, J., & MacMillan, D. S. 2004, AJ, 127, 3587Fruchter, A., et al. 2009, The MultiDrizzle Handbook, Version 3.0
(Baltimore, MD: STScI)Gebhardt, K., & Thomas, J. 2009, ApJ, 700, 1690Georganopoulos, M., Perlman, E. S., & Kazanas, D. 2005, ApJ, 634, L33Ghisellini, G., Tavecchio, F., & Chiaberge, M. 2005, A&A, 432, 401
Giannios, D., Uzdensky, D. A., & Begelman, M. C. 2010, MNRAS, 402,1649
Giovannini, G., Casadio, C., Giroletti, M., Beilicke, M., Cesarini, A., &Krawczynski, H. 2011, in IAU Symposium, Vol. 275, IAU Symposium,ed. G. E. Romero, R. A. Sunyaev, & T. Belloni, 150–154
Giroletti, M., Giovannini, G., Beilicke, M., Cesarini, A., & Krawczynski, H.2010, The Astronomer’s Telegram, 2437, 1
Giroletti, M., et al. 2011, in prep.Hardcastle, M. J., & Croston, J. H. 2011, MNRAS, 415, 133Harris, D. E., Biretta, J. A., Junor, W., Perlman, E. S., Sparks, W. B., &
Wilson, A. S. 2003, ApJ, 586, L41Harris, D. E., Cheung, C. C., Biretta, J. A., Sparks, W. B., Junor, W.,
Perlman, E. S., & Wilson, A. S. 2006, ApJ, 640, 211Harris, D. E., Cheung, C. C., Stawarz, Ł., Biretta, J. A., & Perlman, E. S.
2009, ApJ, 699, 305Harris, D. E., et al. 2011, ApJ, 743H.E.S.S. Collaboration, Abramowski, A., Acero, F., Aharonian, F.,
Akhperjanian, A. G., Anton, G., et al. 2010, ArXiv e-prints, accepted forpublication in A&A
Hinton, J. A. 2004, New Astronomy Review, 48, 331Hunter, J. D. 2007, Computing In Science & Engineering, 9, 90Jorstad, S. G., Marscher, A. P., Mattox, J. R., Aller, M. F., Aller, H. D.,
Wehrle, A. E., & Bloom, S. D. 2001, ApJ, 556, 738Junor, W., Biretta, J. A., & Livio, M. 1999, Nature, 401, 891Kharb, P., & Shastri, P. 2004, A&A, 425, 825Kim Quijano, J., et al. 2003, STIS Instrument Handbook - Version 7.0
(Baltimore: STScI)Kormendy, J., Fisher, D. B., Cornell, M. E., & Bender, R. 2009, ApJS, 182,
216

2010 VHE flare & 10 years of MWL observations of M 87 19
Le Bohec, S., Badran, H. M., Bond, I. H., Boyle, P. J., Bradbury, S. M., et al.2004, ApJ, 610, 156
Lenain, J.-P., Boisson, C., Sol, H., & Katarzynski, K. 2008, A&A, 478, 111Levinson, A., & Rieger, F. 2011, ApJ, 730, 123Li, T. P., & Ma, Y. Q. 1983, The Astrophysical Journal, 272, 317Li, Y.-R., Yuan, Y.-F., Wang, J.-M., Wang, J.-C., & Zhang, S. 2009, ApJ,
699, 513Lister, M. L., Aller, H. D., Aller, M. F., Cohen, M. H., Homan, D. C.,
Kadler, M., Kellermann, K. I., Kovalev, Y. Y., Ros, E., Savolainen, T.,Zensus, J. A., & Vermeulen, R. C. 2009, AJ, 137, 3718
Liu, S., Melia, F., Petrosian, V., & Fatuzzo, M. 2006, ApJ, 647, 1099Ly, C., Walker, R. C., & Junor, W. 2007, ApJ, 660, 200Macchetto, F., Marconi, A., Axon, D. J., Capetti, A., Sparks, W., & Crane, P.
1997, ApJ, 489, 579Mack, J., & Gilliland, R. 2003, ACS Data Handbook - Version 2.0
(Baltimore: STScI)Madrid, J. P. 2009, AJ, 137, 3864Mariotti, M., & MAGIC Collaboration. 2010a, The Astronomer’s Telegram,
2916—. 2010b, The Astronomer’s Telegram, 2431Marscher, A. P., Jorstad, S. G., D’Arcangelo, F. D., Smith, P. S., Williams,
G. G., et al. 2008, Nature, 452, 966Marscher, A. P., Jorstad, S. G., Larionov, V. M., Aller, M. F., Aller, H. D.,
et al. 2010, ApJ, 710, L126Marshall, H. L., Hardcastle, M. J., Birkinshaw, M., Croston, J., Evans, D.,
et al. 2010, ApJ, 714, L213Mattox, J. R., Bertsch, D. L., Chiang, J., Dingus, B. L., Digel, S. W., et al.
1996, ApJ, 461, 396Mei, S., Blakeslee, J. P., Cote, P., Tonry, J. L., West, M. J., Ferrarese, L.,
Jordan, A., Peng, E. W., Anthony, A., & Merritt, D. 2007, ApJ, 655, 144Meyer, M., Horns, D., & Zechlin, H. 2010, A&A, 523, A2+Mobasher, B., et al. 2002, HST Wide Field and Planetary Camera 2 Data
Handbook (Baltimore, MD: STScI)Moralejo, A., Gaug, M., Carmona, E., Colin, P., Delgado, C., Lombardi, S.,
Mazin, D., Scalzotto, V., Sitarek, J., Tescaro, D., & for the MAGICcollaboration. 2009, ArXiv e-prints
Nakamura, M., Garofalo, D., & Meier, D. L. 2010, ApJ, 721, 1783Napier, P. J., Bagri, D. S., Clark, B. G., Rogers, A. E. E., Romney, J. D.,
Thompson, A. R., & Walker, R. C. 1994, IEEE Proceedings, 82, 658Neronov, A., & Aharonian, F. A. 2007, ApJ, 671, 85Ong, R. A., & Mariotti, M. 2010, The Astronomer’s Telegram, 2542
Owen, F. N., Eilek, J. A., & Kassim, N. E. 2000, ApJ, 543, 611Pavlovsky, C., et al. 2002, Advanced Camera for Surveys Data Handbook
(Baltimore, MD: STScI)Perlman, E. S., Biretta, J. A., Sparks, W. B., Macchetto, F. D., & Leahy, J. P.
2001a, ApJ, 551, 206Perlman, E. S., Biretta, J. A., Zhou, F., Sparks, W. B., & Macchetto, F. D.
1999, AJ, 117, 2185Perlman, E. S., Harris, D. E., Biretta, J. A., Sparks, W. B., & Macchetto,
F. D. 2003, ApJ, 599, L65Perlman, E. S., Sparks, W. B., Radomski, J., Packham, C., Fisher, R. S.,
Pina, R., & Biretta, J. A. 2001b, ApJ, 561, L51Perlman, E. S., et al. 2011, to be submittedPfrommer, C., & Enßlin, T. A. 2003, A&A, 407, L73Reimer, A., Protheroe, R. J., & Donea, A.-C. 2004, A&A, 419, 89Reynolds, C. S., Di Matteo, T., Fabian, A. C., Hwang, U., & Canizares,
C. R. 1996, MNRAS, 283, L111Rieger, F. M. 2011, International Journal of Modern Physics D, in pressRieger, F. M., & Aharonian, F. A. 2008, A&A, 479, L5Shepherd, M. C. 1997, in Astronomical Society of the Pacific Conference
Series, Vol. 125, Astronomical Data Analysis Software and Systems VI,ed. G. Hunt & H. Payne, 77
Stawarz, Ł., Aharonian, F., Kataoka, J., Ostrowski, M., Siemiginowska, A.,& Sikora, M. 2006, MNRAS, 370, 981
Stawarz, Ł., Siemiginowska, A., Ostrowski, M., & Sikora, M. 2005, ApJ,626, 120
Steele, I. A., Bates, S. D., Guidorzi, C., Mottram, C. J., Mundell, C. G., &Smith, R. J. 2010, in Presented at the Society of Photo-OpticalInstrumentation Engineers (SPIE) Conference, Vol. 7735, Society ofPhoto-Optical Instrumentation Engineers (SPIE) Conference Series
Tanaka, Y. T., Stawarz, Ł., Thompson, D. J., D’Ammando, F., Fegan, S. J.,et al. 2011, ApJ, 733, 19
Tavecchio, F., Becerra-Gonzales, J., Ghisellini, G., Stamerra, A., Bonnoli,G., Foschini, L., & Maraschi, L. 2011, A&A, accepted for publication
Tavecchio, F., & Ghisellini, G. 2008, MNRAS, 385, L98Urry, C. M., & Padovani, P. 1995, PASP, 107, 803Vincent, S., & LeBohec, S. 2010, MNRAS, 409, 1183Wagner, R. M. 2008, MNRAS, 385, 119Walker, R. C., Ly, C., Junor, W., & Hardee, P. J. 2008, Journal of Physics
Conference Series, 131, 012053Wilson, A. S., & Yang, Y. 2002, ApJ, 568, 133Zdziarski, A. A., Malzac, J., & Bednarek, W. 2009, MNRAS, 394, L41