The 2000 update of the stock assessment for spiny lobster ...
37
The 2000 update of the stock assessmentfor spiny lobster, Panulirus argus, in the Florida Keys by Robert G. Mullerl, William C. Sharp2, Thomas R. Matthews2, Rod Bertelsen2, and John H. Hunt2 Fish and Wildlife Conservation Commission Florida Marine Research lnstitute 1 t00 fighth Avenue, Southeast St. Petersburg, FL 33701-5095 2 2796 Overseas Highway, Suite119 Marathon, FL 33050 September 12,2000
-
Upload
khangminh22 -
Category
Documents
-
view
5 -
download
0
Transcript of The 2000 update of the stock assessment for spiny lobster ...
The 2000 update of the stock assessment for spiny lobster, Panulirus argus, inthe Florida Keys
by
Robert G. Mullerl, William C. Sharp2, Thomas R. Matthews2, Rod Bertelsen2, and JohnH. Hunt2
Fish and Wildlife Conservation CommissionFlorida Marine Research lnstitute1 t00 fighth Avenue, SoutheastSt. Petersburg, FL 33701-5095
2 2796 Overseas Highway, Suite 119Marathon, FL 33050
September 12,2000
The 2000 update of the stock assessment for spiny lobster, Panulirus argus, inthe Florida Keys
EXECUTIVE SUMMARY
Commercial and recreational landings were updated through the '1999-2000
fishing season. Landings were combined with lengths and sexes to estimate the numberof lobsters landed by ages and season. In turn, catch-at-age data were analyzedtogether with indices of abundance using the same age-structured, separable virtualpopulation method that was used in previous assessments to estimate population sizes,fishing mortality rates, and recruitment trends. In addition, we applied Prager's non-equil ibrium, surplus-production model (ASPIC) to total landings and trips to estimate thehistorical biomass trajectory, ratio of current biomass to the biomass that producesmaximum sustainable yield (MSY), and the ratio of current fishing mortality to that atMSY.
Commercial landings from this past season were 6.3 mill ion pounds, up from lastseason's 4.9 mill ion pounds. Historical landings by calendar year from 1950 through1999 show that landings after the Trap Reduction program began have been high exceptfor the 1998-99 season.
The estimated recreational harvest in July and August 1999 in the Florida Keyswas 1,190,000 lobsters which was higher than last season's harvest of 837,000 lobsterswhich was the lowest harvest since August 1992 when Hurricane Andrew passed throughsouthern Florida.
Three indices of abundance indices were to tune the age-structured analyses: 1)the seasonal average pounds per commercial trip adjusted for month, number of traps,soak time and trip duration; 2)the seasonal average pounds per trap from the observerprogram adjusted for soak time, month, and zone; and 3) an age specific index of thenumber of lobsters (68-75 mm carapace length) per trap that are expected to enter thefishery during a particular season. For males, these pre-recruitment lobsters wereconsidered as being age-one, i.e. between their first and second year and for femalesthese lobsters were considered as age-two.
Using the same natural mortality rate of 0.34 per year that was used in previousassessments, the population of lobsters that comprise most of the fishery (ages twothrough seven) has been stable for both sexes since the 1994-95 season. Age-twocontinues to be the modal age in the landings. The fishing mortality rates in 1999-00 forfully recruited ages (F = 0.37 per year for females and 0.49 per year for males) werehigher than last season and back to more typical levels.
2000 Spiny lobster stock assessrnenú Florida Fish and Wildlife Conservation Commission 1

The surplus-production model, ASPIC, supported the findings from the age-structured model that fishing mortality in 1998-99 was down and that biomass hadfluctuated in a manner similar to that estimated with the age-structured model(correlation coefficient = 0.80, d.f. = 11, P < 0.05) with higher values in recent years.Based upon 1,000 simulation iterations, the median ratio of current biomass to thebiomass at MSY was 0.81 (121 outcomes were 1.00 or greater) and the median ratio ofcurrent fishing mortality to fishing mortality at MSY was 1 .02 (422 outcomes were lessthan 1.00).
The transitional spawning potential ratios based upon biomass have varied from23% to 29% with the value at the end of the 1999-00 season being 28%. Whentransitional spawning potential ratios were calculated using the number of eggs instead ofbiomass, the values were higher 4% higher, i.e. ranging from 27oA to 33% with the valueat the end of the 1999-00 season being 32%.
In summary, the lobster fishery continues fluctuate without trend as it has done for30 years. Landings from both sectors were up this season after being down in the 1998-99 season. The evidence indicates that lobster biomass in the Florida Keys is increasingalthough the overall average fishing mortality rates after the Trap Reduction Programhave been similar to those from before the program. A possible explanation for theincrease in the fishable population stems from the fishery using fewer sub-legal lobstersto bait the remaining traps.
2000 Spiny lobster stock assessrnenf Florida Fish and Wildlife Conservation Commission 2

INTRODUCTION
Spiny lobsters, Panulirus argus, have been commercially fished in the FloridaKeys for over 100 years (Labisky et al. 1980). ln 1999, the fishery for spiny lobsterstatewide was Florida's most valuable fishery with an ex-vessel value of $31.9 mill ionwhich exceeding pink shrimp's ex-vessel value of $25.9 mill ion (Fish and WildlifeConservation Commission (FWC), Marine Fisheries Information System, unpublisheddata). Recreational divers also target spiny lobsters during the regular season whichbegins on August 6 each year as well as during the two-day Special Sport Season in lateJuly. When the State of Florida Legislature reduced the minimum size to 3 inches (76.2mm) in 1965, f ishers were able to expand their f ishing area for spiny lobster into FloridaBay and, after an brief adjustment period, lobster landings from the Florida Keys havevaried without trend since 1970. Recent landings, except for 1998-99, were among thehighest on record.
Prior to the age-structured assessment by Muller et al. (1997), the condition ofFlorida's spiny lobster fishery and the ramifications of alternative management measureswere assessed with Ricker yield-per-recruit models (Ricker 1975, Powers andThompson 1986, Powers and Sutherland 1989). This assessment follows the moredata-intensive methods in Muller et al. (1997) with the addition of a non-equil ibrium,surplus-production model (Prager 1994).
METHODS
We extracted all commercial spiny lobster records that were received by theFWC's Fishery Dependent Monitoring Group through 24 July 2000 from Florida'sMarine Fisheries lnformation System, commonly known as the Trip Ticket System.Records through Batch 601 had completed the editing process while records fromBatch 602 through Batch 621 were only partially edited. This assessment focuses onthe spiny lobster fishery in the Florida Keys and we analyzed only those records fromthe period July 1987 through March 2000 that specified Monroe county as the countyof landing. Commercial landings for the 1999-00 fishing season were considered aspreliminary and the landings for 1998-99 season were updated in this assessmentbecause additional trip tickets were received after last year's update.
Recreational landings have been estimated for the two-day sport season inlate July and for the period between August 6 and Labor Day (the first Monday ofSeptember)with mail surveys of recreational lobster l icense holders since 1991(Sharp et al. In press). A survey of the 1994-95 fishing season after Labor Dayconducted by FMRI showed that the recreational landings made after Labor Daywere quite low compared to the amount landed earlier in the season. We are
2000 Spiny lobster stock assessrnenf Florida Fish and Wildlife Conservation Commission

assuming that this seasonal pattern has not changed significantly for other fishingseasons covered in this analysis. Recreational landings prior to 1991 wereextrapolated using a regression of the 1991 through 1999 recreational landings oncommercial landings.
Two types of programs measure the sizes of lobsters captured in the Keys'commercialf ishery: f ish house sampling and on-board observers. The NationalMarine Fisheries Service's sampler in Key West has measured and recorded the sexof lobsters at fish houses in the lower Keys since August 1986 and FWC samplershave measured and recorded the sex of spiny lobsters throughout the Keys sinceAugust 1987. Carapace lengths (CL) are recorded to the nearest 1 mm. Since1993, observers onboard commercial lobster vessels have identified and measuredthe total catch brought up in traps. This additional information is crucial becausetraps capture lobsters smaller than legal size and lobsters down to about 50 mmcarapace length (CL) are subjected to additional mortality when placed in traps aslive attractants (see Heatwole et al. 1988).
To avoid masking underlying patterns, we partitioned landings and lengths intogeographic zone, time period within a fishing season, and sex. For commerciallandings, we divided the Florida Keys into two zones based upon differences in thefishery. The Upper Keys zone extended from Key Largo to West Summerland Keyand the Lower Keys zone extended from Big Pine Key to Key West. This yearinstead of using the location of the fish house to assign landings to either the Upper orLower Keys, we used the area-fished field on each trip ticket and the fish houselocation if the area information was missing. Originally, the area fished field wasvoluntary but has been required since 1994 so now there are several years with area-fished information. The location of observer size information was used directly. Theperiods within a fishing season were Summer (July to October), Winter (November toJanuary), and Spring (February and March) .
Commercial landings are reported in pounds (lobsters landed as tails wereconverted to body weight with a factor of 3.0 times tail weight) and pounds must beconverted into numbers of lobsters per stratum before the commercial landings canbe combined with the recreational landings for subsequent analysis. Sample weightswere calculated from carapace length frequencies using the sex specific equations inLyons et al. (1981 ) to determine the average weights by fishing season, zone, period,and sex. The numbers of lobster landed commercially per zone, t ime period, and sexwere estimated by dividing the pounds landed by stratum by the correspondingaverage weight from the samples. The recreational landings are reported as numberharvested and were only from the summer period. We assumed that sizes oflobsters caught recreationall followed the commercial summer size distribution of theKeys irrespective of zone.
2000 Spiny lobsfer sfock assessrnenf Florida Fish and Wildlife Conservation Commission 4
Numbers of lobsters from the commercial and recreational sectors wereadded together by fishing season, zone, and sex for total landings by length. Ageswere assigned to lobster lengths based on sex-specific age-length keys derived fromthe model in Muller et al. (1997) based on tagging and recapture information thatincludes terms for sex, carapace length, and time period within a fishing season.
We used Integrated Catch at Age, Version 1.4 (Patterson 1998) to estimatethe population size in numbers of lobsters and fishing mortality rates by fishing seasonand age from the catch-at-age data. In our landings data, some older ages occurredsporadically, so all lobsters age-1 2 and older were combined into the age-12+ group.As with previous lobster assessments, we used a natural mortality rate of 0.34 peryear. Integrated Catch at Age (lCA) fits a separable virtual population analysis to aspecified portion of the data, in this case the catch-at-age data since August 1993and performs sequential population analyses on data from earlier fishing seasons.The model used three indices of abundance to identify the solution with the lowestresiduals: 1) standardized commercial pounds per trip adjusted for zone, month, soaktime, number of traps and trip duration expressed as days away from the dock; 2)the weight of lobsters per trap from the observer program adjusted for zone, soaktime and month; and 3) the number of lobsters with carapace lengths of 68 mm to 75mm per trap as a pre-recruit index of age-2 for females and age-1 for males. Sincethe standardization uses logarithms of the catch rates, the indices were normalized tothe mean to focus on relative changes instead of the magnitude of the rates.
Transitional spawning potential ratios (tSPR) were calculated from age-specific total mortality rates by summing the female spawning biomass per recruitfrom ages 1 to 15 and comparing that biomass to the female spawning biomass withfishing mortality set to zero (spawning potential). Mature females as small as 67 mmCL have been observed but full maturity is not attained until 85 mm CL (Lyons et al.1981). We selected a maturity schedule where 50% are mature during their first year(CL < 78 mm CL),77% are mature in their second year (CL 78-87 mm) and 100%are mature for all older ages. Multiple spawning (Lipcius 1985) was incorporated intothe SPR calculations by assuming that females less than 80 mm CL had a singlebrood (ages two and three and part of age-4) and larger lobsters had two broods(part of age-4 and older).
As an alternative analysis, we used a non-equil ibrium, surplus-productionmodel, ASPIC, developed by Prager (1994) to estimate the population biomasstrajectory over time, landings, necessary trips, the maximum sustainable yield(MSY), the ratio of the current biomass to that at MSY, and the ratio of currentfishing mortality to the fishing mortality at MSY. Because this model allows formissing data and because the NMFS's General Canvass has landings available bymonth and county since January 1978, we were able to extend the landings for
2000 Spiny lobsfer sfock assessrnenf Florida Fish and Wildlife Conservation Commission

Monroe county data back to the 1978-79 fishing season. The number of trips for theperiod of 1978-79 through 1984-85 were set to missing and we approximated thenumber of trips in 1985-86 by applying the pounds per trip from the trips reported ontrip tickets to the entire season's landings. Last year, the model only includedcommercial landings but because the intention of using ASPIC is to recreate thehistorical biomass trajectory we thought it necessary to run the model using totallandings. The recreational landings were extrapolated back to the 1978-79 usingcommercial landings and the average weight of a spiny lobster.
RESULTS
The early commercial fishery for spiny lobsters operated primarily on theocean side of the Florida Keys and produced landings of between 2 and 3 millionpounds unti l 1965 (Figure 1). In 1965, the Florida Legislature changed the minimumsize from one pound (approximately 80 mm CL) to76.2 mm CL (3 inches) whichallowed the fishery to expand into Florida Bay. Landings in the Keys stabilized by1970 (test for slope equal to zero, t = 1.42, d. f. = 28, P = 0.17) at an average of 5.6mill ion pounds although landings in 1989-90 exceeded 7 mill ion pounds. Commercialfishers during the most recent fishing season (1999-00) reported landings in the Keysof 6.3 mill ion pounds from 22,600 trips (Table 1). With the 76-mm minimum carapacelength, the average spiny lobster landed by the commercial fishery weighs slightlymore than a pound such that the landings of 6.3 mill ion pounds represent anestimated 5.2 mill ion lobsters in the 1999-00 season.
Commercial harvesting patterns differ between the upper and lower Keys.Since the 1993-94 season, fishers from the lower Keys typically have landed about24o/o more pounds of lobsters from about 30% fewer trips than do the fishers in theupper Keys. For example, in this past season fishers from the lower Keys reportedhigher landings (3.7 mill ion pounds) from fewer trips (8,986 trips) than did those fromthe upper Keys (2.5 mill ion pounds and 13,606 trips) (Table 1 , Figure 2). In anattempt to explain the difference between zones, we looked at whether fishers in thelower Keys made longer trips, fished more traps, or soaked their traps longer. Tripduration between the two zones was tested with a general linear model that adjustedthe means for fishing season, month within a season, as well as zone. On theaverage, fishers in the lower Keys made longer trips (adjusted mean trip duration =1 .27 days, standard error = 0.00150, ¡ = 133,543 ) than did fishers in the upper Keys(adjusted mean trip duration = 1.03 days, standard error = 0.00189, n = 222,370).However, fishers in both zones fished similar numbers of traps (adjusted meannumber of traps in upper Keys = 217 , standard error = 0.574, n = 134,355 andadjusted mean number of traps in lower Keys = 214, standard error = 1.048, n =25,727). The length of time that fishers soaked their traps differed in that long soaktimes in the upper Keys reduced the harvest of lobsters (coefficient for soak time =
2000 Spiny lobster stock assessmenf Florida Fish and Wildlife Conservation Commission

-3.05 with a standard error of 0.83, d. f. = 125147, P < 0.05) while the length of timethe traps soaked was not significant in determining the lobster harvest in the lowerKeys (coefficient for soak time = 0.37 with a standard error of 0.49, d. f . = 18343, P= 0.45). Thus, the differences in catch rates between the two zones in the Keys isprobably due to higher concentrations of spiny lobsters in the lower Keys and not justdifferences in fishing practices.
Estimated recreational landings from FWC surveys for the Special SportSeason in July and the first month of the regular season were about 24o/o of eachseason's commercial landings (Table 1). The recreational landings estimate duringthe most recent season (1.19 mill ion lobsters) was slightly higher than the averageestimated landings (1 .13 mill ion lobsters). A 1994-95 study by showed that less thanlQo/o of the recreational landings in that season were taken after Labor day (FWCunpublished manuscript). Thus, during the 1999-00 season, a minimum of 6.4 mill ionlobsters (5.2 mill ion commercial and 1.2 mill ion recreational) were landed in theFlorida Keys.
The trend in overall commercial catch rates expressed in pounds per trip andadjusted with a general linear model for zone, month, soak time, number of traps, andtrip duration generally has been increasing since 1990-91 to a peak in 1997-98 and adrop afterwards (Figure 3). Fewer tickets reported all of the effort data in the earlyyears because soak time and number of traps was voluntary until 1994. The paucityof early trap data does not influence the model results because catch rates prior to1993-94 were not used in tuning the age-structured model.
Catch rates decrease as the fishing season progresses (Figure 4 a) and differamong fishing seasons (Figure 4 b). For example, catch rates in the first two monthsof the 1999-00 season were the highest of the 13-year time series. As has beenpointed out before, commercial landings in August are good predictors of the seasonlandings (correlation coefficient, r= 0.89, d. f. = 11, P < 0.05) (Figure 5).
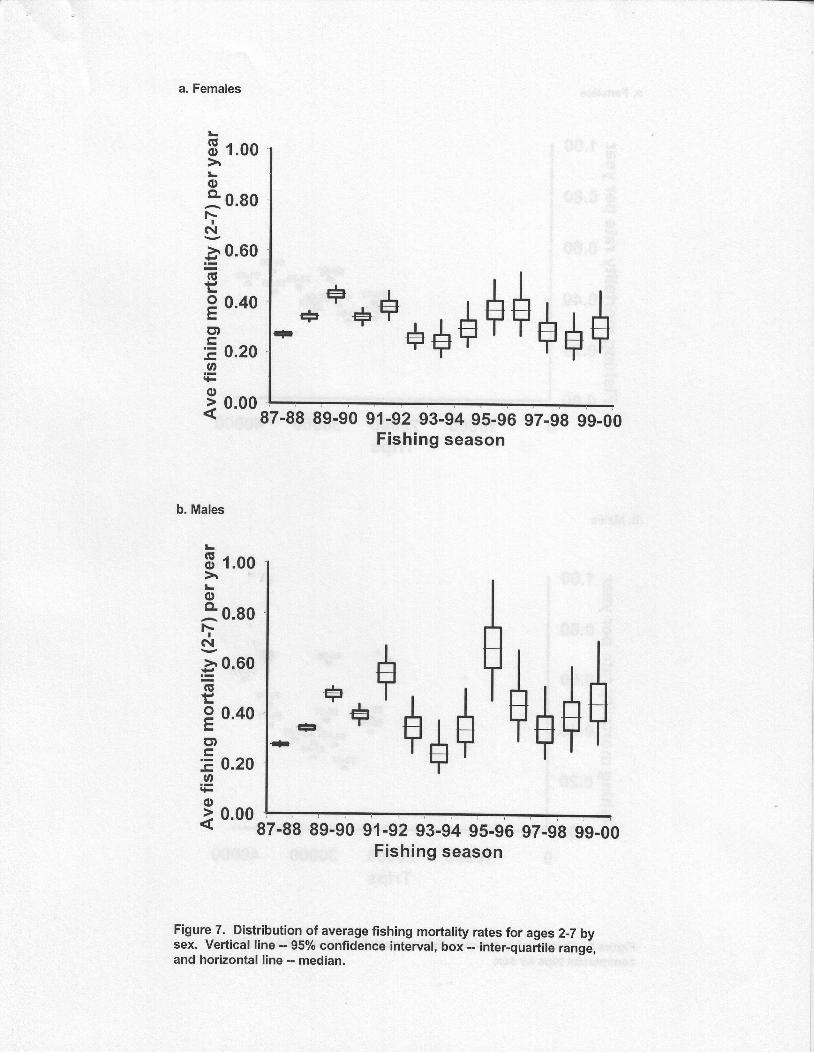
The ICA model fit the indices reasonably well (Figure 6 a-c) with the pre-recruit index having the greatest influence (weight = 10.00 for both sexes), followedby the observer indices (weight = 3.93 for females and weight = 10.00 for males) andfinally the commercial catch rates (weight = 3.28 for females and weight = 9.79 formales). An index's weight was the inverse of the index's variance up to the program'smaximum weight of 10.00. The numbers of lobsters at the beginning of the seasonand the instantaneous fishing mortality rates by sex, age, and fishing season are inTable 2. Although some age-1 lobsters are captured, most of the harvest is onanimals age-2 through age-7. The modal age in the landings for male lobsterscontinues to be age-two and agethree for females. Fishing mortality ratesestimated by ICA increased in 1995-96 for both sexes (Figure 7). The fishing
2000 Spiny lobster stock assessrnenf Florida Fish and Wildlife Conservation Commission

mortality rate for females stayed high in 1996-97 and then declined even though totallandings in 1997-98 were the highest on record. The 1999-00 median fishingmortality rate for females ages 2-7 was 0.30 per year (95% confidence interval 0.21- 0.45 per year). Beginning with the 1993-94 season, the average fishing mortalityrate on fully recruited ages was 0.38 per year which is less than the common fisherybenchmark Fo 1 (0.44 per year). The fishing mortality rate for males peaked with the1995-96 season and then has remained lower. The 1999-00 average fishing mortalityrate for males ages 2-7 was 0.44 per year (95% confidence interval 0.29 - 0.70 peryear) and the average fishing mortality rate on fully recruited ages since 1993-94 wassimilar at 0.45 per year. The relationship between fishing mortality rate and thecorresponding number of commercial trips shows only a general increase with moretrips especially in males (Figure 8).
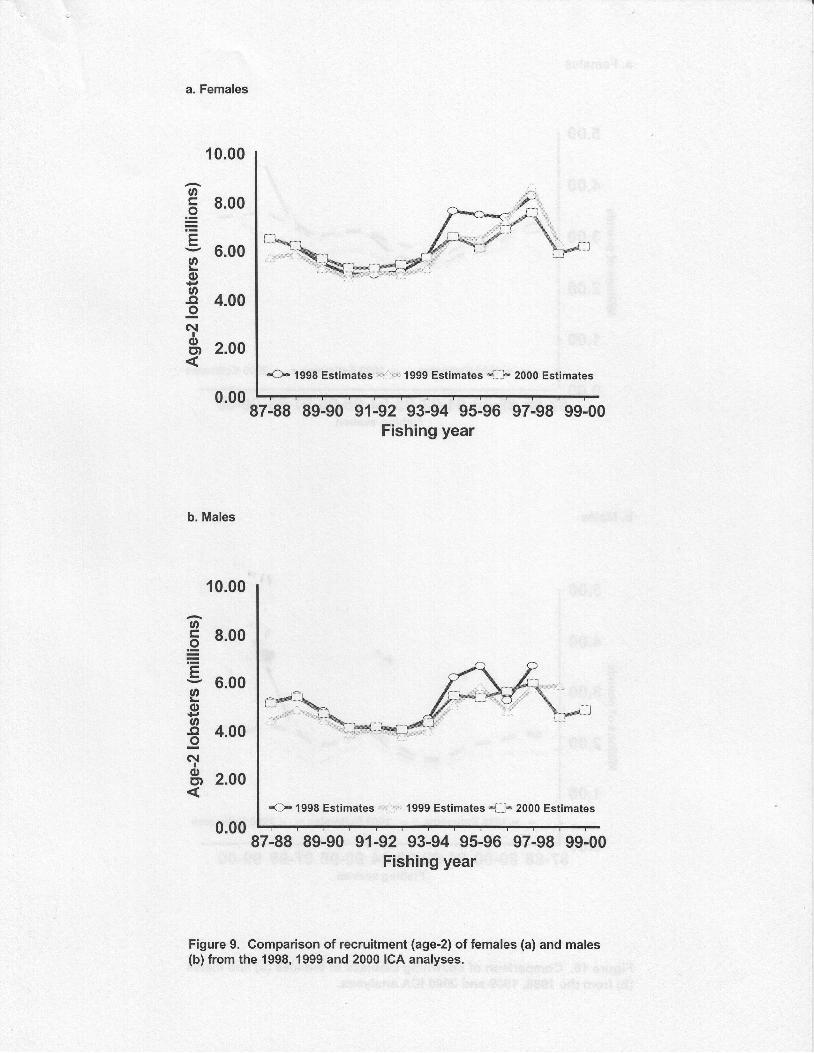
Output from the ICA model includes recruitment and spawning biomass trends.Recruitment, when measured by age-2lobsters, was declining and reached a low inthe 1992-93 season and then increased (Figure 9). This figure includes estimates ofnumber of age-2lobsters from the two previous stock assessments showing thatalthough there have been improvements in analytical methods, the overall recruitmentpatterns remain consistent. The number of age-2 female lobsters reached a peak in1997-98 and then has been lower but at higher levels than the early 1990s. Thenumber of age-2 males generally has been higher after 1993-94 but this year'sanalysis indicates a leveling off at around 5.1 mill ion lobsters. Spawning biomass offemales also has tended to increase (test for slope equal zero, t = 2.47, d.f. = 11, P< 0.05) especially after 1993-94 whereas the males have been more variable withouta significant increase (test for slope equal zero, t = 1.15, d.f. = 11, P = 0.28) (Figure10). lf recruitment of both males and females is compared to female spawningbiomass, one clearly sees that recruitment has been higher after 1993-94 (Figure11).
In contrast to the age-structured model, a surplus-production model requiresminimal input -- landings and trips. The model estimated the biomass over the periodfrom 1 978-79 through 1999-00 and the corresponding catchability coefficient todetermine the number of trips that would be necessary to produce the observedlandings. The fit between the estimated number of trips and the observed wasreasonable (correlation coefficient, r = 0.87, d.f. = 13, P < 0.05) (Figure 12). Thetrajectory of biomass at the beginning of the seasons estimated by this model issimilar to that produced by the age-structured model (correlation coefficient, r = 0.80,d.f. = 11, P < 0.05) (Figure 13). The 1999-00 fishing mortality rate was similar tothat producing MSY (median F/F,,y = 1.02 and 422 outcomes out of 1,000 simulationruns were less than 1.00 ) and the 1999-00 biomass was below the biomass at MSY(median B/B.ry = 0.81 and only 121 outcomes out of 1,000 simulation runs weregreater than 1.00) (Figure 14).
2000 Spiny lobster stock assessmenf Florida Fish and Wildlite Conservation Commission

Transitional spawning potential ratios (tSPR) based upon biomass calculatedwith the total mortality rates (natural mortality plus fishing mortality)from the ICAmodef varied between 23o/o and 29% without trend during this 13 year period (test forslope equal zero, t= 1.76, d.f. = 11, P = 0.11)with a value of 28% forthe end of the1999-00 fishing season (Table 2, Figure 15). When ISPR is calculated usingfecundity, then the values were higher ranging between 27oA and 33% with a value of32o/o at the end of the 1999-00 season. The ISPR values in this assessment arehigher than the ISPR values in last year's assessment because the estimated fishingmortality rates were lower in this analysis as compared to last year's. We are unableto state whether the spiny lobster stock is meeting the management objectivebecause, there is not a quantitative management objective for spiny lobster at thistime.
DISCUSSION
Overall, the commercial spiny lobster fishery in the Florida Keys has beenstable since 1970. However, the landings have not been constant. Prior to theimplementation of the Trap Reduction Program, seasons with landings above sixmillion pounds occurred about every five years and then usually they were followed byseasons with low landings but that pattern changed recently and four out of the pastsix seasons landed more than six mill ion pounds per year such that the 1998-99landings were considered very low. When the fishery is looked at by zones, one seesthat the most of the fluctuation in landings occurs in the upper Keys (Table 1, Figure2). There appears to be a base level in either zone of approximately 2.2 millionpounds and then depending upon the season landings in a zone be higher but a goodyear in the upper Keys may not correspond to a good year In the lower Keys. Forexample, in the 1988-89 season, the commercial landings were 3.8 mill ion pounds butonly 2.2 million pounds in the following season in the upper Keys while in the LowerKeys the landings were 3.4 mill ion pounds in the 1988-89 season and 3.2 mill ion inthe following season. This year there were 2.5 million pounds reported from theupper Keys and 3.7 million from the lower Keys.
Last year, we speculated that perhaps high water temperatures in June-August 1998 in the Marathon area could explain the low catch rates in August 1998.Again we extracted the hourly water temperatures from Sombrero Key, Sand Key,Long Key, and Molasses and found that the temperatures in June-August 1999 wereback down the monthly averages (Figure 16). In the next assessment, the catchrates in August 2000 need to be looked at closely because the average watertemperature in July 2000 was even higher (87 .4"F) than the July 1998 temperature.
One of the questions that frequently arises is how consistent is themanagement advice from assessment to assessment? To address that, we plotted
2000 Spiny lobsfer sfock assessrnent Florida Fish and Wildlite Conservation Commission

recruitment and spawning biomass estimates from last year's ICA analyses togetherwith those from this year (Figures 9 and 10). Recruitment and biomass estimatesfrom the three analyses generally track each other. As was noted in last year's stockassessment, the inclusion of the pre-recruit index removed the spike in biomass in the1997-98 season estimated in the 1998 assessment.
Recruitment appears to be higher after the Trap Reduction Program wasimplemented. Prior to reducing the number of traps, recruitment of age-2 lobstersaveraged 9.1 million lobsters; however, afterwards the number of age-2 lobsters hasaveraged 12.6 mill ion lobsters (Figure 11). The spawning biomass associated withthe highest recruitment is not any higher than what was commonly seen before.Therefore, another explanation is that by removing traps from the fishery, fewer sub-legal lobsters are needed to bait the traps thereby increasing the young number oflobsters in the population.
The 1996 stock assessment on data through the 1995-96 fishing seasonconcluded that the higher landings after the Trap Reduction Program waslmplemented was due to higher population sizes (Muller et al. 1997). Thisassessment still supports that conclusion but now we believe that the population hasleveled off. In other words, the spiny lobster fishery in the Florida Keys appears todeveloped in a stepwise fashion with a stable level of landings in the 1960s thatincreased to a new level after the Florida Bay region was opened up to fishing, andnow the fishery appears to have reached a new plateau.
LITERATURE C¡TED
Heatwole, D.W., J.H. Hunt, and F.S. Kennedy, Jr. 1988. Catch efficiencies of l ivelobster decoys and other attractants in the Florida spiny lobster fishery. FloridaDepartment of Natural Resources. Florida Marine Research Publications. No. 44. 15p.
Labisky, R.F., D.R. Gregory, Jr., and J.A. Conti. 1980. Florida's spiny lobsterfishery: an historical perspective. Fisheries 5:28-37.
Lipcius, R.N. 1985. Size-dependent reproduction and molting in spiny lobsters andother long-lived decapods. p.129-148. ln Wenner, A. [ed.]. Crustacean lssues,Volume 3. Factors in adult growth. Balkema Press. Rotterdam.
Lyons, W.G., D.G. Barber, S.M. Foster, F.S. Kennedy, Jr . , and G.R. Mi lano. 1981.The spiny lobster, Panulirus argus, in the Middle and Upper Florida Keys: populationstructure, seasonal dynamics, and reproduction. Florida Department of NaturalResources. Florida Marine Research Publications. No. 38. 38 p.
2000 Spiny lobster stock assessment Florida Fish and Wildlife Conservation Commission l 0

Muller, R. G. , J. H. Hunt, T. R. Matthews, and W. C. Sharp. 1997. Evaluation ofeffort reduction in the Florida Keys spiny lobster, Panulirus argus, fishery using anage-structured population analysis. Marine and Freshwater Research 48: 1045-1058.
Patterson, K. R. 1998. Integrated catch at age analysis, version 1.4. FRS MarineLaboratory, Aberdeen Scotland.
Powers, J.E. and N.B. Thompson. 1986. Spiny lobster assessment update andpreliminary examination of management options. National Oceanic and AtmosphericAdministration. National Marine Fisheries Service. Southeast Fisheries Center.Coastal Resources Division. CRD-86/87-1 .
Powers, J. E. and D. L. Sutherland. 1989. Spiny lobster assessment, cpue, sizefrequency, yield per recruit and escape gap analyses. National Oceanic andAtmospheric Administration. National Marine Fisheries Service. Southeast FisheriesCenter. Coastal Resources Division. CRD-88/89-24.
Prager, M. H. 1994. A suite of extensions to a nonequil ibrium surplus-productionmodel. Fishery Bulletin 92:37 4-389.
Ricker, W. E. 1975. Computation and interpretation of biological statistics of fishpopulations. Fisheries Research Board of Canada, Bulletin No. 191.382 p.
Sharp, W. C., R. D. Bertelsen, and J. H. Hunt. In Press. The 1994 Floridarecreational spiny lobster fishing season: results of a mail survey. Proceedings of theGulf and Caribbean Fisheries Institute No. 48.
2000 Spiny lobsfer sfock assessrnenf Florida Fish and Wildlife Conservation Commission 11

LIST OF TABLES
1. Landings summary of the Florida Keys fishery for spiny lobster by seasonincluding commercial effort (traps and trips), landings by zone, landings in number byrecreational and commercial sectors.
2. Number of spiny lobster harvested, estimated population size, fishing mortalityrates, average fishing mortality rates for ages 2-7 by fishing season, and transitionalspawning potential ratios. Natural mortality rate: 0.34 per year. Separable fit usingdata from 1993-94 through 1998-99 only.
2000 Spiny lobster stock assessmenf Florida Fish and Wildlife Conseruation Commission 12

oq)(0
Eo)oño).=(o
L
o
c)
o)L(úoo
oc)É.óoo
o
Eoo
a n
o.9q)
aaq)L
o.9,tL
9 o: ( )+ññ \c $O += ozü ,
bE6 ¡ :
8 '=+ O9 ' - =
ó . :O ) r \O)
o t L: F -
95O- O,( / , No-
o E9 0( ¡ ) ( 6
= oz t u* N
@ N ( 9 O O r r N N o ) O r F . - O ) O )r C ) l t * O N c O O O N @ r O ( ' ) $@^ lr)- o- F_ F_ro_.ü- o- @- \ \ s- qO) (O F- @ rO O r tl) r (O f'- CO \tc 9 - - - O ) ( O @ F - ( O r c r ) ( Y ) -O- @- -- .1 cO- tf)_ o.)- \t_ F- O- ñl (o_ atf) (O ¡'- () rO $ S (o tf) F- F- \t (o
c . ) ( o O O ) O C 9 ( o @ ( o r N c O t OO) tf) @ V f'- (o l'- O cO O, cD rf O)@_ -_ S- <O- - ¡l o{ cO^ -- \ 0o- V_ er l f ) - ( o : t t O r S F - ( o c Y ) ¡ . - o )O r O r lt* l.- O ¡.- O l-. C{ cr) cOo) ñ{ (9^ O- cO- f'- - O- -- -rc)- oO :
r r r r r - r F F
tf) (O C9 r O) @ @ V (Y) @ tf) (O iüC\¡ S O) tO tr) (O N O, O, O) N tr) $o- ca- V- ¡-- ol-o{ - @- S_ Or- O)_ O_ o)I t - r ( O e O T O O O $ ( o C O ( o t( f ) O r O N @ @ O t O ( f ) r O ) Nr- (O_ @_ I lO- N- cO- tt_ O- @_ \ F-_ Nv t o t l ) s s c f ) c o l r ) $ t o t o ( r ) t f )
O $ O) O F- O) F- O (f) (O N t- sf O) e O) f.- f.- CO C{ oO (f)tf CO $ CO N cO N O (o 6 (O @ F O O Cf) O O r lt- l.- 6S- lr)- F-- r_ d)_ rO_ (9_ (')- (O_
\ .t Or- O)- rf)- ll)- O- ó- t-- tr)_ \ .a q
@ o) @ cD Í) o) N .t ¡-. @ o lo o) @ o) - o rf) o) o) N c)rf) tü @ F.- (o N O) (O ó tf) F- - O O $ O tO (O ¡.- ó tr) (oo_ o)_.a @_ a F-- O_ lo- @- @^ 'o- o{ \f- co_@_ rlf- co- \ co- S- @- qto @ 1() rt ro (.) @ ro $ s (c) f.- lr) l¡) \t rü @ ro @ (o $ (o
i o o ¡ N N $ \ t c g ( o r o r o r r ( q!: F F- ¡.- cf) lO lr) N O (o o) N cg O) O)gi @- \ @^ r^ o- cD- V- o- o)- O- or- - @- I:-@ o, r () tf) @ O 1l) @ @ N @ r C\Jq.¿ N C{ (o C9 (f) CO Cq N N N C{ N N N
r @ l O ( g C D ! O t O ¡ \ N O O ) @ r@ l O í ) O ) N O ) ( o c O c A l \ @ r @(Y)- r- r_ S- ctr_crl- a @- ry <O- -- - ñl( o O N @ @ ( O d ) - @ r O ) ( O O )l O ( o l O O @ N ( v ) $ r N @ l O C \ lr O ( o í ) c ! O ) N O N S ( o ( O @ f rñ ñ c " ) ( " ) ñ ñ ñ ( o ( o o o ñ o
r¡) o (o c{ rf (f) - (o lo c9 co @ (oO) cO $ ll, (o N F $ ¡-. (Y) cO tO 6o{ at .t- s- o- ca_ -- ll)- (o_ o)_ o)_ o_ o)C . . l r ( O N N O O ¡ O - - r O ) €- - r r r r e F F F
N ¡ - N d ) r N F - r F - l . c ) : t O r- o - - x i : t $ s $ N ( o ( ( ) o )c\t- @_ o{ o_ o- o_ co- (f)- cq- N- \t- o- c\lO lO F (O l'- - $ lt'- N lt- O (O s( O $ @ F - l O N ( O O O t f ) O O T d )N_ (O_ F-_ -_ \ \t- (O_ r- (r)- N- @- F-_ U?N C D ( e N c { N N í ) N d ) N - c r l
N C f ) @ O - O € l O $ O N I O ( o|¡) (O lr) - C') O) f.- O O) O, \f (O OO- O- O_ ír- O)_O- lt-_ .<l_ O{ O)_ r- @_ (qI r O ) r N S O ( o ( o $ r f ) ( o N C 4r F N C { N N r r r r r F r
$
d) N O lO tO S ¡..- or, cO oO o.)O ) O $ O $ ( O C r l t - N - -- - \ @ _ a r ¡ - - - O - r O - - - r -l . - * N l O N r ( O r l Oc f r @ @ ñ t ( o
N
N O ) í ) N O ) O $ ( f ) r N e( f ) N ( f ) O ) N r$ ro_(o c{ tü r
o o o o o o o o o o o o o o o r o s l r ) \ t ( o N oO O O O O O O O O O O O O O O r ( O @ @ l l ) O , Oo- o-O- O_ O- O- C)- O- O- O- O_ O_ O- O-O_ (O_ F_ O)- ct- (o- $_ OGl (Y) to N N lf) lf) $ (O ¡'- F- (O (O O)- $ O) N $ F- l.l) Ot- o)o N $ () F- (o F- t- co F F- co cD o cD @ oi) or) Í) f|f) lO (O (o ll) ll) (O tf) ll) F- l'.- O) @ O) @ ¡.- (O lr) tO tl) ll) tO
O) Os N (f) $ rO (O F- @ ci) O r N (f) {- () (o ¡.- @ o.) OF- co @ co co @ @ @ @ 6 co o) o) o) o) o) o) o) o) o) o, o
r t t l t t t t t lcO O)O r N (O $ l.r) (O F- @ O) O r N Cr) $ |tr) (O F- (D O)F- F- @ oO ó cO @ @ cO @ @ @ O) O) O) O) O) O, o) O) O) O)
ñF-
E-.F(!
EooÉ.
(!
F
c)Y
oc)Y
6 hp:o qE -Eo
.J'
oY
L
c)
=
oG')<
Y
F
üp= ( )0 ) t ra ! t rñ3
ocoN
-oal,q,
.cc(0
i.v,o-. E
oc(úU'o-(5L
tsooEoLoEEo()o)€=(). ccoañoU'
-oo
Po-oo
c'a2e€9- ( )l'' c)o ( / ,6¡5 C ). ^ L
< oO EY Ef i t o
E ( J
E:l ! ( 5o 6
; . 9o ñ> oo ot r oE > ,f _ oO sa Q )oD -o. c EE f
ñ -a
- O ¡, c
( ¡ l ¡ -
= 'iog -
, ( o 6F _

e3
N S t s @ F O O O O Ne O O O O N - F e N
o o o o o o o o o o
O @ - O @ F @ o O O
: . ! r ? a ? n n . : . : ' : ' :
$ o o N N o F ó - o@ O O O N @ O F @ O9 0 0 0 ó @ o { f @O O F O O O O O O O
N N @ f O $ @ O t s F- : q G ? a ? n n ' : ' : ' : . !o o o o o o o o o o
F - @ t @ o ó o N NN { ! f O O N F N No o c o o o o o o o
ó t s 6 Q f ó O @ NO O O O N - F r No é o o o o o o o
s t s c o o o o N 6 @' : . ! c ? n c l c ! ' : . : ' : ' :o o o o o o o o o o
e t F @ O F ó @ óO O Ó N N N N N N
o é o o o o o o o
O N t ó F O ó ñ - O- ó s $ f { < o N o
@ O F @ O N A O F O- o ! o o $ o o o {O O O O O O O O F O
N 9 O O F f O F O ON 9 f O O f N N O O
o o o o o o o o o o
O N Ó f O b Ó @ N NN O i l ó N - O - N
c i o o o o c i c i c i o o
O O O O @ F ó ó - O
" : q f ? r ? . ! c ! q . : l . lo o o o o o o o o o
F N @ S ó F O O N @N V { Í ó O N - N N
o o o o o o o o o o
oq
L
ooGú=oÉo=C''
p,lt
- t o o o o N ó @ @N @ @ o - @ t s N O @O @ O F O $ N N @ Not rtot oo- o d @ ñ - sO O N O N N N @ * N@ - @ _ @ - r i o N F
O @ O O O N O O O Ff @ o o f i O F F óo- 4- É- o_ N- o- o- N- ó_ o-- O t s O O - O @ O {F O T O O O - @ f NF - @ - < - O _ f N -
f F f o N O N O F No o o @ @ b N @ N ot s @ N N F - - d @ o
d ñ o t ñ d ñ ñ d d ro @ N F N O F @ { N@ _ o - o _ 6 9 - F
ó O F S O S e O e Oo O F ó O 6 ó @ O @o- t" @, F_ f. N. @- t_ N- N,
F ó O O F O O @ O FF O f O N O O @ f NO - O - @ - @ O e F
O @ O t s o @ - o @ Oo o o f t S S N F ño, 9- o, o- o- o- ts- N, o- o.@ N O N O O N O N Oo O o - F O F O ó N@ - o - @ - @ f N r
O @ N O O - O g N @@ É o o S l f S @ Ft s F N O O N O O O Nrt o.t 's d{ ñct - oi@ O O O N N N @ S FO " O - ó - @ t d F
F o O ó N ó O N ñ @6 O o o N F N O F ON _ @ - o - o _ S . t i ó . @ . o . 4@ ñ O { 6 O @ @ O FO N O o N F O @ O -6 - O - ó - @ { N -
O O O O N F O O S4 N @ ó @ F @ O Oo-o- ñ, i_s_ F,o- @- nO O t s 9 O N @ ó F{ N O O @ F S - ÉO " @ " F O F F
N O N S @ O ód O F O O N I- O O t s F O Oo - rt rtat o a;o t O O o N -
o
.9.I
N
otoo
d
.{\
c.] o-
@ @ t s oo @ @ oa ac! o-
o, ol *_ r-F
6
N('
N$_
Nts
- 6 $ N 6 O t s O O ó{ O F @ O S O O I @ó _ - , @ , o - @ - o _ s - ! 1 ó - ñ l
ó o t s o o o o o o @@ O 9 ó N @ N N O -@ . @ , O - ó O F F
@ F @ { t O d F O No @ @ o o o o s o @O- N- O- O- r_ r_ O_ {- N_ S-
o @ o o s N N o @ @O O - F t s N F O Nt - - o - o - ó O d É -
O O O O N o @ F @ Nf N 6 @ O @ N N F O$ o F O - f F o @ i
ñ ñ d o { r o @ o o@ o O S O O F S F Ft - @ _ @ _ N f N N
ó-o-
o ñti o-
f- o,
N, @,
ri ts-
N @ri-
N
o o < o o s o o $ ;o o s o o s o o ! ;- N o $ o o s o o p 5
o
o
o6
oo.ED
tttoo
r t i\ o ^N N
N- N.
O Nñ ñ
N Oó_ o-
t s o
ri rt
o t óN_ S-
o- N.
@ o!: Ó.
N N
o t ó
ñ o
f - \
N " fN N
F N
@ _ q
O N
ñ ñ i
o, ñlN 6
ñ ñ
t s " I
o _ 9N N
r d o
c i o
@ - @
ñ o
@ o
ñ cN 6
O O O { { - O O N O O @ lo o F o d @ t @ - f O O 1O_ {_ ts- 11 o- @- F- @- O- ó_ O_ O-
O @ O O - t s F N o b S N l9 @ o N O o 9 -F @ O S N
o N N @ N N N - O O O No o o o N @ o o t s t s N oF o @ @ N o N $ N O F O
ñ o i { - { . j o t ñ d ú t { oO @ O O t s N N -- @ F S -
t s i O r O O @ N F O N t sO O O N @ É S F r É O @S_ @- F- É_ o_ @_ :: o. .i !1 O- ó-O N O t s O F @ $ @ O F -O @ O N O O O F
o 6 0 0 0 0 { N $ @ @ @@ @ o N O O ó - O { O Oó @ N @ @ N O N O F o Fñ ñ ñ ñ ñ ó o o t d @ ú t ñt s @ o F @ O f F FÉ o - F @ N F
a o @ O - ó o S o @ 9 Sr l O @ S t @ @ - @ N ot s ó ó F ó O O d $ N O @ó { r t d d ñ ñ ñ É d ú t dO F ó O N F @ O F F
@ @ $ N F
- N O @ O $ f É f N € O$ N O O @ @ O O O N @ O$ @ { O f N F N o N @ o
d . j c i o r t o t d d d o - ñ@ 6 F O t O S FF O O _ b N
ñ O 9 t s ? O N @ N O O oO n S É t t s o o @ @ @ Fo" o" r: o" {_ o_ N_ @. N. rl o- @"@ ó S @ i O f O { N F No O F o @ @ N
o F o @ { @ F o @ f 9 0O O O N O T N F O F V oO O O O N @ O N o o o Fd o d , j , j , j d a i o ú t o óO F O O N t s O ?
o F o r O @ O $ O N @ No o o t s o @ @ o o o @ ao_ @- o" o- o- @- o- @- ts- @- o- {o F @ o @ @ o $ @ O N tO t s O O @ t s O -
t É O F S F F O N @ O OO O O N F O S O O O O NO ó N O N É - N O N @ -
r t d d o t ñ o t ñ d d d ñ ñO t s 6 O b F O d F- F ó O N -
F O O O O N @ 6 O f - @N N N O @ @ O N N O I t so_ o- \ S, O. ó- o_ o- o_ o- a IN o { F F 9 @ F O N ó Fo t t s F o o q N r N F sF @ t s É N F
O F O e @ N t s O N O { f{ O N { N @ O @ N O N No- @_ o- t: @_ n S_ t_ cl ó- o- I* O F F O o O o F @ { OO @ F O O N O N F- o - @ o -
@ o @ N @ @ É o o o o NO i - N { t s @ N o @ o N11 @- ts- @_ o- o9 o- ó! {_ @- o, N@ - @ * O o r @ @ N F@ @ S t s 6 o S FF O O - O N F
+
c
oa
E
iI
o
=o
o
o
oooooft
=o
trN6oEúooo6
Eo
Er ¡! E= o- oF Qú óq ó
9 s! ) t ' '¿ =o o
o zo 9: ; ! tÉ o
F3EE.g I gT3 E .E
E ¡O I E Ó L. E o l l E- E ñ T. g o =
o t g . z
ü áoE ¡.:G 6
= o= >= L
á 3l l *g . ?9 o6 go ñO L
r i bó =o :> z
:Eo :o É9 Z
> oe o
o i :o 6o c
z o
N ' =
. E ;3 66 0l - o

ct
c;
o
o
o
F
o
a \o "
9 Í< ¿
o o @ o o o + @ F o o@ O @ ó @ - @ @ N O O\ I o? o? oqq \ oq o? q qa É O O O O O o o - F
F O @ A O O @ O O O Oa ? a . q a . q c ? c ? a a a a
o o N o @ 6 * @ o o oo ! * * o o o ó $ t {
O O t s O O F O * O @ @N ó O O O O O ó O ó ó
@ € t s a N o @ N É @ @c ? f f 9 a c ? e ? a f a f
O A N @ É O N O N Ó Óo t s N @ @ 6 0 @ @ N ñÁ : A A A A A A A A
@ t s t s o o o o o t N FN O O O O O N O O O O^ : ¡ : ¡ : ^ : : : :
O t s @ b { N F f O N NN N N N N N N N N N N
t t S F ! @ r O @ F Fo ! É ó o N ó N 6 6 6c i d d c t o o o d o c i d
o t s o o s ! t o * @ @9 9 q q q q q q q a q @
o O O O F O @ F @ F Fo ! s o $ $ 6 ñ o @ @O O A O O O O O F O o
S F O O @ N F O O O ov o a $ $ É o É ó É 3o o o c i c i c i d d d c i d
N t s F t t s @ @ @ A O CS { 9 O N F F r N o c
o a o o N o s @ a @ qN ó O N N N F - N N d
+
oo
oooÉ.(úEo
o)
=.9,lr
@
ño
o
F
\tsNq
oq
F
q
N
4F
F
N @o o0 - co qN C
d ¡
@ 6
6 ño i e
o oo t sN " O
o . co o
$ ch @ó @' j oN t s
o i ¡
o no t s$ sc i ¡
ñ c
N C
N - A
N Fe _ FF I
n f io ^Í i F
o eo d {
$ 4
O FF CF _ 4€ {
@ !6 @6 { AO F
ó oo 4
@ c9 0o _ ct s oo @F _ SA F
o €s _ !
o f- - cO F
ts
N S
O F
N o { o o r o o p 5N o r b o r o o p 5
@ $ o o s t s o o @ s @ ao @ o o o o * É o o t s @F O N O O V @ O O @ A O@ O O F O É N o F O { Ft n F @ t O O f N F€ O N O { F
d r t ñ
@ f N N S N N @ F N O Oo F o o r 6 0 0 0 N o 6O O t s @ 9 O N - N $ N @ñ o d a t ñ @ + + ñ { - d o iO O @ N S @ O O N F@ + O O @ N F
ñ r t ñ . j
r o V o A o @ @ N @ r Ao F b $ o o o o * t s o eo t s o o o @ t s @ r @ N €+ o t o { o + @ o t + - - r i dO S O t s O N O É N FO @ O É @ N F@ $ ñ - j
N @ O F O O O t s o t t s N@ O F T F O O * O V F OF @ O O O @ F @ O O O O@ o o t e t . j ñ o t o d r t d o +@ O F O f N O V N F SO b F O É Nñ + a t . j
F N N O @ A O @ F O F oN O N F @ N Q @ @ N O to v t N o @ o o t s o o {o - o t - + d o d o r t ñ d d o iN O ó O N O O + N Fr l @ - - - O - t -O O N É
@ t s @ N @ O O O O t @ OO O O N N f F S $ r V @N @ A t t s N t @ @ @ O 6d r t d d d o - a t @ + @ - c iO N N O O A F O N F No - o , O - ñ { o N F6 O N F
O O T N O O O O O O e Só o @ o @ 6 @ o o o o o$ t N @ e F o * 9 9 @ Fo o ñ ! ¡ d d ñ d o d ñ d a iA O g T O F O O N TO t O F f N Fd d ñ J
! 9 @ t ¡ C { 9 E ( o @ b @ @ {O É O t s N O @ O @ N N F@ o o @ o o o f o o o €$ o o o o o ñ o t ñ < d ñ oF Q S O O O @ 1 N FO ó O O ó Fd { ñ
N * O O D S b O F O @ O@ o S F N F O N O t s O OF O O O N F b O N 9 @ $
d ñ út ot od ri .j ñ oi oo- ri uO o O f @ r O É Fb O O @ O Fd { ' j
o 6 t s o @ o @ o o @ o oO @ O e @ O @ O t N O *O t N N @ N O F @ O @ eñ ot rt rt od at at.j ñ ñ .ri ot s $ O O @ $ F O N FT F F O V N F
d d ñ
o @ * @ @ N @ o F o o {t s @ O F O N @ @ @ N O t sO O O @ N F 6 O O O N Fñ f r t ñ ñ . j ñ d ñ r i d oF A $ F O S F A O T F ñN F F O O N Fd + ñ . j
r @ O @ @ @ O @ O S @ OO 9 @ $ $ O F F * O b tN N F O A O F O F @ o Na t d d ' j a i . j o t ' j ñ o i r i oO O F F A A F t s O F mS - @ - g - N _ o N F
o @ o @ @ @ @ o @ o o oO O f @ t s V F O r N S NN @ O F F F F O O T N Fo d { d ñ r t d d ñ ñ d d o$ @ O F O N N O O Fg . A - F - I S N F
r O N e
O ó N N O F O O * F O -O O F N @ F O O F N N Os t s @ o o r o N o @ N oñ o r t . j + o d r t o d d ñ do N O r F - O A FO - F - O - O $ N@ o N
F N o * o o F @ . e E &
U)
L
ñ
No
(tr=ñ
c
ofn
F
NN
F
a
N
6
N
N
¡IN
F
sN
N
od
a
o
o@
@N
o
oo@
noN
@
NN
bb
N
O F o + o + O O F t sN O @ O @ $ O S F No " F " @ - r i o " F - o { t o _ lN @ - O N + O * N @@ O * o N @ O N F@ N Ú N F
t s O O F O + N F F OO @ O t s @ O 6 O F @o o o o { + o o t oñ d { d o d + d d ñ JO O t t O N F
;
o o N o N N s @ o oo { o o * * @ N F oe ? O O O @ F N O Éd o t d ú t ñ ñ d ñ d . jt N 4 $ @ N -S - @ O -
o o N o o o s o o o@ * @ @ o @ o o @ @\ \9 - N-@-o- @-- o - @-F d F @ O O O t s O -@ O O O $ N FO O N F
O F S N @ @ @ O O NF N @ O F O O O @ @o { l o - o - * _ F - O _ o - O - O
@ @ O F @ O @ O F$ f F N É F@ 6 O F
-j
@ F O @ @ F O N F OO O F O f O O V O O@ N ó O @ ó @ ó O N
+ ñ d d d { ' j o d d . jt s O * O b N F
@ F N e @ N O @ f @o o É o o o o b N o$ . o _ a - l @ _ * - O - * " F : nO * F O @ F Q N ÉN N r ñ N rl o N
F b O N @ O É t F F@ F F F @ g F N @ t@ o @ N o o 6 @ o or t ñ É ñ ñ . d o t o d d ' jO O O O f FO @ N F
a { { o @ É o N o oF t s @ o Í O O O @ Ot s @ F @ @ O 6 F N Oñ r t ñ + o d d d o t d t i@ o @ o o { N
O N N N @ O N N O Fs o s F @ Q o @ @ at _ { @ - @ _ 9 - o _ @ - o _ @ - o -e O O F O É O F @ {@ O O t @ O N FO @ ó F
F O N $ O @ b O O @N O N @ F @ @ t s O @6 l o _ @ _ o - o _ r - o - o _ o - FN N N e S @ @ t NF @ 9 N t F
.j
N - t O A N $ N O {O b O O @ 6 N F ó 6O- r-: O^ @- O- F_ O_ 9- A- $@ O o o A S g N rO O ó @ ó Fo - @ N
O O f @ @ F O @ F É+ F N O T O ó O O O6- @. @- @^ F- ñl O_ O- O_ O-Q o o S O A @ O S FS ó N @ F O F! q o f -
ooo
z.9
l"-
N
ooG
og >r ú =
- o. E OE 9ll o¡6 0 ¡- c tt t fÉ o
. : L
ü 5F a 'o q )Y ' O¡: ot
9e6 . =- o
o =d r g( E bL o
> EÉ gG r úE C Lo oe O
E = X, e ü üí)- i L
. ñ g 6o = r
EE -ü #:* E 2; L
á ¡5EEb
á i E
T E, zo¿ u t6 0
L ! Eo -ü "¡ 5
> :
É L -o = '
e . =
o cL '@ 6
lt o.
E oz ¿
. o= EEE- G
g añ r io 3
¡ 6o ol o

oN
sN
s
s
s
s
sFN
sNN
sN
I
i 3
S O O N N O - ó F O O@ O O O N @ O F ó O Os o o o @ @ o t t @ @
O O F O O O O O O O O
N i F @ F o O O @ N N- O O Ó O N F F - N N
o o o o o ó o o o o o
N N O { O { @ O t s F F. : a l c ? q q q ' : ' : ' : n . !o o é o o o o o o o o
F N O T O É O O N @ 6
n f . q a a , l c ? n . : n o t qo o o o o o o o o o o
É - @ t @ o o o N F FN t t t O O N T N N N
N O t s O O S @ O € N N. : q r ? q c ? n ' : . : ' : o t no o o ó e o o o o o o
s t s o o o o o N o 6 @F N O N N N
o o c o o o o o o o o
O t s { ó - O ó N - q AF o ! É É É $ o d o oc t o d c i o < i o o o o o
N $ o o - t o F O O ON t f o o { N N o o úo o 9 0 0 0 0 0 0 0 0
O N Ó Í O O @ @ N N AN O l t ó N e o - N d
c i o o o o c i c i c i c i d c
O O @ O @ - ó ó - o e
" : q r? r? . . . | .1 q . : a . !so o o o o o o o o o c
O @ e O @ F @ O O O OF N o o N N
o o o o o o o o o o o
f - ! F @ O - O @ O O- ó o o N N N N N N N
o o o o o o o o o o o
@ O F @ O N O O F O O- ó I O O S O O O { io o o O O O O O - O O
oo6É,ñ
=
olt
- S O O ó 6 N O @ @N @ @ O - @ N N O @o" @_ o" N_ o- s- N- N- @- N-o o o @ o o @ N e {O O N O N N N @ V N@ @ @ - O N F@ o . j -
O @ O o O N ó O o -{ @ O O t n O - - óo- o- {- o_ N" o_ o- N- o" o-- O t s o ó - o @ O vN O f o ó O F @ $ N- _ @ - { - O _ $ N -
t - { O N O N O F No o o @ @ o t s @ N oN " @ - N " N - ! : F _ ! : r y @ - o ,
@ t s o t s o N N o o ÉO @ N - N o - @ f N@ - O - O - @ V F e
o o t s f o V F o F oO O F O O @ @ @ O @o - { . @ - F - f - N - @ - t t s _ N -F @ O O - O O @ O FF O S O t s O O @ t No - O - @ - @ o F -
O @ O F O @ F O @ Oo o o $ t f f N F No- {- o, o_ o- o- F- N- o- o.
@ N O N O O N O N OO O O - F O - @ O NO " O " ó , 6 4 N -
O N 6 ó e O S ñ @F o O V W f S @ Fts- N- O- O- ^l O- O- O- .go $ É @ t N o F óO O O N N N @ 9 FO . @ _ ó t d F
- O @ ó F @ O N ñ @O O O O N F N O F ON @ O O t F O O O td ñ o d ú t o d d < t ' jO N O O N F O @ O FO _ O , O - ó S N r
O O O O O N F O O SN g N @ ó ó É @ O OO_ O- O- F_ {_ f. t: O_ @, alO O O t s t O N @ 6 Fo t N @ O @ F f F -@ _ O " @ _ F O F F
@ t N o d t o o oO O N O - O O d ÉO O F O O t s F O Od ó d , j r t ó c t d dO F 6 { O O O N F
N ó O @ @ F O F 6 OO O F O @ @ O O N t s@- $-o- s. t_N_ o-N" N_ 9-@ O O S O S O F N O@ F O F F @ t s $ O -N _ N . @ _ N $ -
N S O S f t @ F NF @ i o @ € o o N--ts- o_ N_f_ aol o_ o,O * t s - O N @ O FN { { @ @ ó @ f @N - @ " O O F
F O V d O O t s O O ó$ Q F @ O $ O O S @o- F- @. o- @, o- f_ !: @_ c.!
o o F o o o o o o @@ O $ @ N @ N N O -@ - @ - o - @ O e F
@ É ó { * O N F O No @ @ o h o o s o @O N O O F F 6 { t s 1
at odct ot +ñ ño d @o 6 - - t s d e O dr O O @ ó N F -
@ r ; . j
O O ó N O @ F O NN O @ O @ N N F Oo- !: ó- r: t- !: o_ @_ s.
N @ 6 S { O @ O Oo o { o o e * F r@ _ @ - t s s N N
@
@
oj
*_
r
o
rf,
r@t-
N ó + o @ t s . - 9 : 5É N ó r o o s o o ! ; ñF N o $ o @ N @ - 3 : $
oN0
oÉoo-
EDoo
{ ó l
N o lN N
@ o
N N{ ñO Nñ ñ
N O
ci ol
F- @-
.! s-
o_ N"
@ ori o,N N
N N
@- @-
ñ o -
s. ts,
ñ ñ
Ñ N
@- o-
O No - -
N N
N Óo- N-
N 6
4- ts-N N
\ f "
. i ñ
N, O.
N _ a
@- (q
ñ c t
@ o
ñ o
ó - aN N
ts
N g
O O O { t T O O N O O @O O F O N @ f @ - S O OO $ t s e O @ t s @ O O O O
o d o o . j ñ - ñ @ o + ñS @ o N o o S F
@ N N 6 N N N - O O O No o o o N @ o o N F N oF ó @ @ N o F $ N o N o
t s o i + - { - d o , i d ú t s oO @ O O F t s N F
t s S O F O O @ q F O N t so o o N o F f t s - F ó @$- ó- \ N- o - @- ! : o - ' i . l @. o ,O t s @ N O F @ f @ ó e *O @ O N O O O -
o @ o o o o É N { @ @ @@ ó O N O O 6 - O f O O@_ @- c! @" @. N_ b" N- o,.: O,:t s N N N N O O O O @ O NF @ o F @ O S F -F o - - @ N F
{ o O O - O @ 9 O @ $ tF 9 O @ O S @ @ F @ N @F o o F ó O O N 9 d o o@ { ú t d d ñ ñ ñ ñ d o dO F 6 O N F @ O - F
@ @ * N -
F N o ó O V { t t ñ @ Ot t s o o @ o o o o N @ o{_ @- {- ó- t- \ .1 N- o- N- @- c?O - O 6 O O O 6 @ O F N@ 6 F O V O V FF O O _ b N
N O S t s F O N ó N O O OO S t F $ F O O @ ó ó t so- o- ri o_ i_ o- N- @_ cl {_ o" q@ O { @ f o S o $ d F NO O F O @ @ N
@ o @ N @ @ f o o o o ño t - N { F @ N o @ o NF O N @ O N b N { @ O Fd . j d + o d . j d o ñ -@ @ S t s O O { -F O O - O N F
O F o F ó @ @ t O N @ ño o o t s @ @ @ o o o @ co_ @- o" o- o- @- o- @- ts- @- o- !O F O O O @ O t @ O N lO F O O @ N O É
b ñ o @ s @ ñ o ó n n óO O ó N O ñ N N O e { Oo o o o N @ O N O O O Fd o t ú i . j . j - o r i ú t . . t r t @O F O O N t s o F
t É ó F S e F O t s @ O OO O O N F O 9 O O Q O No_ 6_ \ o_ N,,: - N- @_ N. @- !:o o @ o N o N 9 0 b N Nó ñ O O O - 6 N -- N @ b N F
F O O O O N @ O O I F @N N t s O @ @ O N t s O { Fo- o- N- 9- @_ @- o- o_ o_ o_': oN o $ N F { @ - o N @ FO $ F t s o O € N - N F {r @ t s { d F
ó N O F @ N F O d O f {9 O N { N @ O @ N Ó N NO @ O F @ N { $ N @ o e
{ r i . j . j d o t d r t - j d : ¡ i aO @ F O O N O N É- O r - - @ O -
o
tso
F
@
o
6
o'6
ñ
6
oooooE
Eo
rrNoo|!
oooE=Eo
q r ¡! E= oA ét oo áq 6
P s! 0 t Dz :E Oo =! t e: í rE O
F 3 $E P o 6E . = O >9 . 2 E h- 9 E ¡D l t O L
, E o l r EE = 4. g ! ! =
q t 8 z' t3o. E É6 G
ó ¡9 6E qt t +g . ?! o. = oo 6O L
d bo =o l< oL E
o :o €9 Zo> r O.E .9o-' go 6
o c
z oN ' Fg ;o d- 6 qt s o
3sEiI
N
o
@
ts
c
LIST OF FIGURES
1. Historical spiny lobster landings from the west coast of Florida by calendaryear and the 1970-92 average (pre Trap Reduction Program).
2. Landings and effort by fishing season and zone.
3. Distribution of standardized commercial catch rates in relative pounds per tripby fishing season from 1 000 simulation runs.
4. Standardized catch per trip adjusted for soak time, number of traps, and tripduration. a) Monthly pounds per trip and b) seasonally adjusted pounds pertrap by subtracting the monthly average.
5. The relationship between season landings and August landings (R-squared =0.80, d.f. = 11).
6. Observed and predicted values of the indices by sex used to tune theseparable virtual population analysis. a) Pounds per commercial trip, b)observed pounds per trap, and c) number of pre-recruits (females age-2 andmales age-1) per trap.
7. Distribution of average fishing mortality rates for ages 2-7 by sex. Vertical line-- 95o/o confidence interval, the box - interquartile range, and horizontal line -median.
8. Relationship between fishing mortality rate and the number of commercial tripsby sex. a) Females and b) males.
9. Comparison of recruitment (age-2) of females (a) and males (b) from the1998, 1999 and 2000 ICA analysis.
10. Comparison of spawning biomass of females (a) and males (b) from the 1998,1999 and 2000 ICA analysis.
11. Recruitment of age-2 lobsters, sexes combined, and the corresponding femalespawning biomass two years earlier.
12. Predicted number of trips from ASPIC based on reported landings and theobserved number of lobster trips in the Florida Keys.
2000 Spiny lobster stock assessmenf Florida Fish and Wildlife Conservation Commission l3

13.
14 .
15 .
16 .
Comparison of the relative lobster biomass at the beginning of the season.estimated by ASPIC and that estimated from the ICA model for both sexes.
Distributions of the ratios of 1998-99 biomass (a) and 1998-99 fishing mortalityrates (b) to those at MSY from 1 000 simulation runs.
Transitional spawning potential ratios by fishing season calculated usingbiomasses (ellipses) and fecundity (triangles).
Monthly average water temperatures in the Upper Keys (Molasses, Sombrero,Long Key stations) for 1988-99 average temperatures and for 1999 monthlyaverages.
2000 Spiny lobsfer sfock assessmenú Florida Fish and Wildlife Conservation Commission 14

a-rag
E¡ I
trY
oct)
.=!tqG'J
8.00
7.00
6.00
5.00
4.00
3.00
2.00
1.00
0.0050 55 60 65 70 75 80 85 90
Galendar year95
Figure 1. Historical spiny lobster landings from the west coast ofof Ff orida by calendar year and the 1970-92 average (pre TrapReduction Program).

Aotr.9-I'Ev
oEtr=oG
5.00
4.00
3.00
2.00
1.00
0.0005
t Upper ii' Lower
89-90r5' r
92-93,} 9o-9r
I
10 15 20 25Trips (thousands)
'?;lo e6.*{t,ortTf-r?"0
s\-szeqee /,k,# **&"orro
,,f3 * E'93-94itrf
,it¡ 9a.99a
30
Figure 2. Landings and effort by zone and fishing season.

1.50
1.25
1.00
0.75
0.50
0.25
0.0087-88 90-91 93-94 96-97
Fishing season
Figure 3. Distribution of standardized commercial catch rates in relativepounds per trip by fishing season from 1 000 simulation runs.Vertical line - 95% confidence interval, the box - interquartile range,and horizontal l ine - median.
CL¡ -t-+,LoCLo!tcI
¿oCLo
I -
rF,
G'I
oÉ,

a.
400
350
Month
-1008708 8908 9108 9308 9508
Month
Figure 4. Seasonal availabil i ty. Standardized pounds per tr ipadjusted for soak time, number of traps, and trip duration. a) Monthlypounds per tr ip and b) seasonally adjusted monthly pounds per tr ipcalculated by subtracting the monthly averages.
@ s,{ $o*i^ pA j^ iA %¡ *^
*"i'" qA TX +"x"-ffiNo i t -T^ ?A i^ T ' 4n 1- i Eo ii I i I s - f h¿ i i i i qNt i: ;" T: 3X i"" 1: :" tr T" i, i"l" i i +" {" T" +, } i l" T., ir i 'il+ Y" %1 V. :l ti **" i', gt i.,,
*u 4s'u¡ M Wi,r %Fr'¡
300CL
:250oCLo 200t,tr3 150o.
100
50
b.
150o(EoE 100.>
o50
tro. ts0ooo
E -50o
i5

1.50
1.25
1.00
0.75
0.50
0.25
0.0087-88 90-91 93-94 96-97
Fishing season99-00
Figure 3, Distribution of standardized commercial catch rates in relativepounds per trip by fishing season from 1 000 simulation runs.Vertical line - 95% confidence interval, the box - interquartile range,and horizontal l ine - median.
CL¡ -l-
*,t-oCLo!tc-¿oCLo
t -
*,(E
-o
É,

g'9.0; T.oo= 6.0=sr 5,0o
.g 4.0E 3.0(ú-=2-0
A r.oG
E o.o0,0 2.50.5 1.0 1.5 2,0
August landings (million lbs)
Figure 5. The relationship between season landings and Augustlandings (R-squared = 0.80, d.f. = 11).
96-97-sz.dF5t-espril.oo

60
a 5 0o.NE 4 0oEg
.E 30I
Eoro
J , l 0
0
Fema lesa, Commercia l indices
. lndox Prodictsd
87-88 89-90 91.92 93-94 95-96 97-98 99-00
b. Observer catch rate indices
- lnd.x , Prsdlctod . Indox r Prodlcted Welcht= 10,00
87-88 89-90 91-92 93.94 95-96 97-98 99-00 87-88 89.90 91-92 93-94 95-96 97-98 99-00
c. Pre-recruit indices
. l n d e x . r r P r e d ¡ c t o d - I n d o x , i , . . : , i : P f s d ¡ c t o d
87-88 89-90 91-92 93-94 95-96 97-98 99-00 87-88 89-90 9l-92 93-94 95-96 97-98 99-00
Figure 6. Observed and predicted values of the indices used to tune the separable virtualpopulation analysis. a) Pounds per commercial trip, b) Observed pounds per trap, and c)number of pre-recruits (females age-2 and males age-1) per trap"
60
a50o.!8 4 0o
Esog
Eozo
J l o
0
2.00
^1 .75
,$ r.so'! L25
# r.00
3' 0.75
; 0'50t
o,2s
0.00
2.00
^ 1 . 7 5
.8 r.soE€ 1.25
# r.00
t 0.75
i o.so' 0 . 2 5
0.00
2.00
A1.75o
fi r.so
! '.ru8r.oogo 0.75
i o.soz o.2s
0.00
2.00
a 1 .75o
$ r.so
f r.zsI r.ooS o.zsi o.soaz o.2s
0.00
Fishing season
Fishing season Fishing season
Fishing season Fishing season
L.
E t.ooLoI o.eoN
I
ñl
¡ 0.60(E
{r,
9 0.40F
qf
= 0.20o
rh
> 0.00q
L.
E t.ooLo:0.80N¡(\
¡ 0.60(E*,¡-I 0.40trCDc= 0.20o
o> 0.00
<(
a. Females
b. Males
Figure 7. Distribution_of average fishing mortality rates for ages 2-7 bysex. Vertical line - 95% confidence interval, box -- inter-quañile range,and horizontal line * median.
++++++++*a++87-88 89-90 91-92 93-94 95-96 97-98 99-00
Fishing season
o+*a+T{+++87-88 89-90 91-92 93-94 95-96 97-98 99-00
Fishing season

a. Females
k r.00o
I o.ao.EI o.oogtr 0.40oE
,P o.zo.9,lL 0.00
*f ,r'rrifii'g';H3*Hq$ '
20000 30000 40000Trips
b. Males
95-96t
91-92a
89-90tD
e6j7 so-stslselt8lr+s '
- 8r-8893-94 .
O
20000 30000 40000Trips
Figure 8. Relationship between fishing mortality rate and the number ofcommercial trips by sex.
; 1 .00o
I o.aogE o.oo
t|J
=
r 0.40oE
.p o.zo
.9rr 0.00
oc
Étrotoo-ao(\¡oct)
a. Females
10.00
8.00
6.00
4.00
2.00
0.00
.(). 1998 Estimates,/,r r 1999 Estimates .{} 2000 Estimates
87-88 89-90 91-92 93-94 95-96 97-98 99-00
b. Males
10.00
8.00
6.00
4.00
2.00
0.00¡Ci- 1998 Estimates '.'::: : 1999 Estimates {_}, 2000 Estimates
87-88 89-90 91-92 93-94 95-96 97-98 99-00
Figure 9. Gomparison of recruitment (age-2) of females (a) and males(b) from the 1998, 1999 and 2000 ICA analyses.
oc
ÉEooo.Cl-9N
Toct)
Fishing year
Fishing year

a. Females
5.00
4.00o!t
3 3.00eoo
! z.oo=
1.00
0.00
h*.h*
i_)
{ * , * ,
*.f *^'-Jé'-.'
-. .r- 1998 Estimates 'r rr, l$$B Est¡mates *, * 2000 Estimates
87-88 89-90 91-92 93-94 95-96 97-98 99-00
b. Males
5.00
4.00oEg
B 3.00CL
oo
! z.ooE
1.00
0.00
*.-i 1998 Estimates ':::: ,'1999 Estimates.r * 2000 Estimates
87-88 89-90 91-92 93-94 95-96 97-98 99-00
Figure 10. Comparison of spawning biomass of females (a) and males(b) from the 1998, 1999 and 2000 ICA analyses.
Fishing season
Fishing season

Erco=14E6, 12t 10ctogñl
I
t'6G
b4LO^t r¿E2o
97-98f,
96-9794.95 üq¡;tu
es-ooe3-e4 sSsogsü
0 eflDrg$-ei{ t i l
0.0 0.5 1.0 1.5 2.0 2.5 3.0 3.5 4.0Spawning biomass (mill ion pounds)
Figure 11. Recruitment of age-2 lobsters both sexes combined andthe corresponding female spawning biomass two years earlier.

60000
50000oo.t!-
E 40000icto
E 30000L(E
E zoooo(E
*,oI 0000
rp i , .,, .,. 4lwsse :1,,b
W
# Observed ,-*-- Predicted
78-79 g1-82 g4-95 g7-gg 90-91 93-94 96-97 gg-00
Figure 12. Predicted number of trips from ASPIC based on reportedlandings and observed number of lobster trips in the Florida Keys
Fishing season

?16o_= 14Eó12fi 10-cto8(\
I
t'6G
b4l-
O/r-cr ¿E2o
97-98s
96-97&94-95
q5-96* 99-00
e3-s4 sg¡togsü& ea0t$o-e1
{tl g¡
0.0 0.5 1.0 1.5 2.0 2.5 3.0 3.5 4.0Spawning biomass (mill ion pounds)
Figure 11. Recruitment of age-2 lobsters both sexes combined andthe corresponding female spawn¡ng biomass two years earlier.

1.50
1.25oo
I r.oo.9f o.zs¡ I
.h,
s 0.50o
É,
0.25
/ *\ * Á ,
' ' r,.ry _{,ru
0.00r-78-79 81-8284-85 87-88 90-91 93-94 96-97 99-00
Fishing season
Figure 13. Gomparison of the relative lobster biomass at the beginningof the season estimated by ASPIC to that estimated from the ICA modelfor both sexes.

a. Ratio of estimated biomass in 2000 to biomass at MSY.
200
150 -
00.00 0.75
Ratio
b. Ratio of fishing mortality in 2000 to fishing mortality at MSY.
0.50 0.75 1.00 1.25 1.50Ratio
Figure 14. Distributions of the ratios of biomass and fishing mortality to those at MSYfrom I 000 simulation runs.
otrI rooEo
]L
50
200
150
()tr9 rooEo ,
l!
50

20%
o+,(E¡-
I
(E'j=Co
rl¡,
octct)e-¡ -e
=(ECLo
-(ttF
o*,l -
oFL
(EL
F
35%
30%
25%
15%
10%
5o/o
0o/o87-88 89-90 91-92 93-94 95-96 97-98 99-00
Fishing season
Figure 15. Transitional spawn¡ng potential ratios by fishingseason calculated using biomass (ellipses) and fecundity(triangles).

ce0ct)o985o¡E
5880¡¡oCLE75o
*,
oP70Lo Average Temp rÑ 1999
NovJan Mar May JulMonth
sep
Figure 16. Monthly average water temperatures in the Upper Keys(Molasses, Sombrero, and Long Key stations) for 1988-99 averagetemperatures and for 1999 monthly averages.