Thanks for downloading a sample plan from Bplans.com
31
Thanks for downloading a sample plan from Bplans.com A sample plan is a great way to get started, but you can’t just print this plan out and turn it into the bank. You’re still going to have to put in all your own information and do all of your own financial forecasts. With LivePlan, you can easily use this sample as inspiration and create your own plan, complete with financial tables and graphs. You’ll also be able to: • Save time with linked financial tables (the formulas are built in, so you don’t have to do the calculations!) • Benefit from tons of help, advice, and resources. • Present your plan with confidence, with automatic charts and graphs corresponding to your financial data. • Work on your plan anywhere, on any computer. “For 20 dollars I ended up getting a quarter of a million dollars of funding. That’s worth it!” – Todd C. Tablegate Click here to save 50% off the first month of LivePlan!
Transcript of Thanks for downloading a sample plan from Bplans.com

Thanks for downloading a sample plan from Bplans.com
A sample plan is a great way to get started, but you can’t just print this plan out and turn it into the bank. You’re still going to have to put in all your own information and do all of your own financial forecasts.
With LivePlan, you can easily use this sample as inspirationand create your own plan, complete with financial tables andgraphs. You’ll also be able to:
• Save time with linked financial tables (the formulas are built in, so you don’t have to do the calculations!)• Benefit from tons of help, advice, and resources.• Present your plan with confidence, with automatic charts and graphs corresponding to your financial data.• Work on your plan anywhere, on any computer.
“For 20 dollars I ended up getting a quarter of a million dollars of funding. That’s worth it!” – Todd C. Tablegate
Click here to save 50% off the first month of LivePlan!

Cover Page
This sample business plan has been made available to users of Business Plan Pro®, business planning software published by Palo Alto Software, Inc. Names, locations and numbers may have been changed, and substantial portions of the original plan text may have been omitted to preserve confidentiality and proprietary information.
You are welcome to use this plan as a starting point to create your own, but you do not have permission to resell, reproduce, publish, distribute or even copy this planas it exists here.
Requests for reprints, academic use, and other dissemination of this sample plan should be emailed to the marketing department of Palo Alto Software at [email protected]. For product information visit our Website: www.paloalto.com or call: 1-800-229-7526.
Copyright © Palo Alto Software, Inc., 1995-2009 All rights reserved.

Legal Page
Confidentiality Agreement
The undersigned reader acknowledges that the information provided by _________________________ in this business plan is confidential; therefore, reader agrees not to disclose it without the express written permission of _________________________.
It is acknowledged by reader that information to be furnished in this business plan is in all respects confidential in nature, other than information which is in the public domain through other means and that any disclosure or use of same by reader, may cause serious harm or damage to _________________________.
Upon request, this document is to be immediately returned to _________________________.
___________________ Signature
___________________Name (typed or printed)
___________________Date
This is a business plan. It does not imply an offering of securities.

Table of Contents
1.0 Executive Summary...............................................11.1 Objectives.....................................................1Chart: Highlights................................................1
1.2 Mission........................................................21.3 Keys to Success................................................2
2.0 Company Summary.................................................22.1 Company Ownership..............................................22.2 Start-up Summary...............................................2Chart: Start-up..................................................3Table: Start-up..................................................3Table: Start-up Funding..........................................4
3.0 Products........................................................44.0 Market Analysis Summary.........................................54.1 Market Segmentation............................................5Table: Market Analysis...........................................5
5.0 Strategy and Implementation Summary.............................55.1 Competitive Edge...............................................55.2 Sales Strategy.................................................65.2.1 Sales Forecast.............................................6Table: Sales Forecast..........................................6Chart: Sales Monthly...........................................7Chart: Sales by Year...........................................7
6.0 Management Summary..............................................86.1 Personnel Plan.................................................8Table: Personnel.................................................8
7.0 Financial Plan..................................................97.1 Break-even Analysis............................................9Table: Break-even Analysis.......................................9Chart: Break-even Analysis.......................................9
7.2 Projected Profit and Loss.....................................10Chart: Profit Monthly...........................................10Chart: Profit Yearly............................................10Table: Profit and Loss..........................................11
7.3 Projected Cash Flow...........................................12Table: Cash Flow................................................12Chart: Cash.....................................................13
7.4 Projected Balance Sheet.......................................14Table: Balance Sheet............................................14
7.5 Business Ratios...............................................15
Page 1
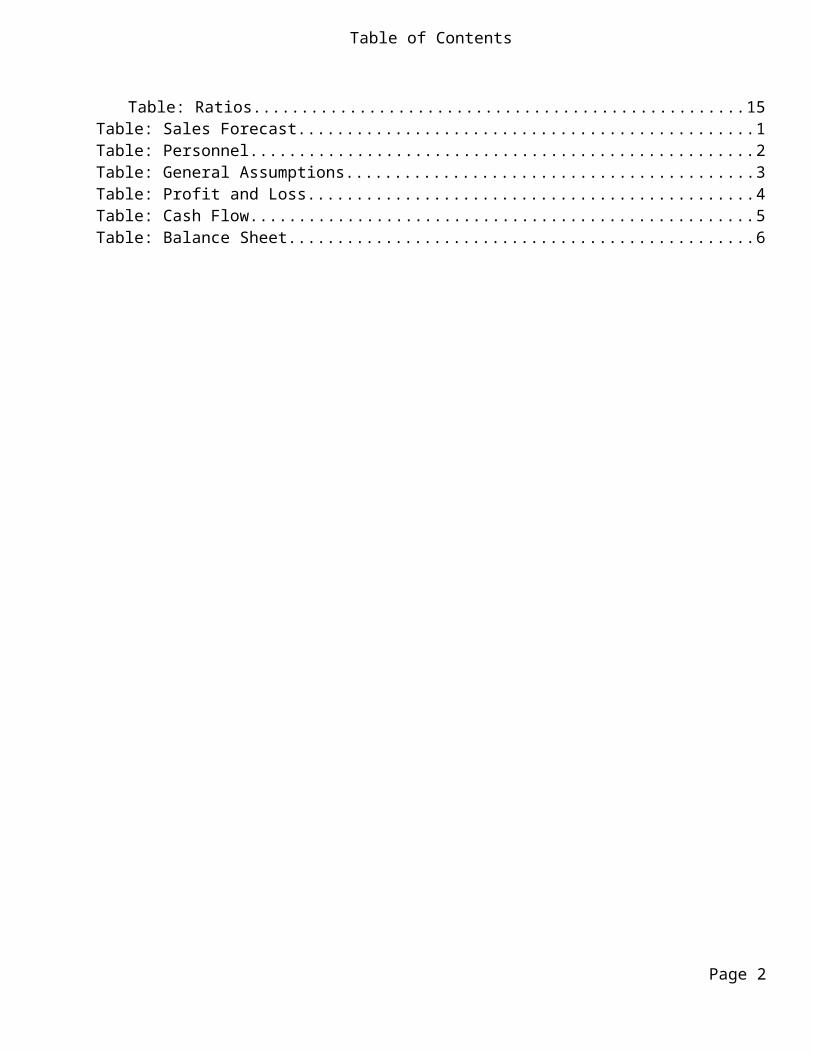
Table of Contents
Table: Ratios...................................................15Table: Sales Forecast...............................................1Table: Personnel....................................................2Table: General Assumptions..........................................3Table: Profit and Loss..............................................4Table: Cash Flow....................................................5Table: Balance Sheet................................................6
Page 2

Allensburg's Food and Gas
1.0 Executive Summary
Allensburg is a small town with a population 3,400. Located on rural Highway 310,the town is 30 miles south of the city of Kent and 34 miles north of the city of Willard. Highway 310 connects Kent and Willard that both have universities and a cumulative population of 200,000 residents. The highway is the main road through town and is used daily by thousands of commuters between the two cities. These commuters sustain a number of road side businesses on Highway 310 that sell flowers, produce and bakery products.
In order to get gas in the Allensburg area, commuters currently have to leave thehighway and drive three miles into the edge of town. Robert Cole, the owner of Allensburg's Food and Gas has the opportunity to rent a plot of land just off theAllensburg exit of Highway 310.
Allensburg's Food and Gas will offer these commuters gas, organic produce, and a deli. On the way to work, a commuter could stop for gas and pick up a sandwich. On the way home, the same commuter could stop again to pick up something for dinner.
The aim of this plan is to be a guide for this start-up business. Researching anddefining our markets, strategies, mission and financials will provide insight andprepare the owner to successfully run Allensburg's Food and Gas.
1.1 Objectives
To capture an increasing share of the commuter traffic passing through Allensburg.
To offer our customers superior products, at an affordable price. To provide customer service that is second to none.
Page 1

Allensburg's Food and Gas
Chart: Highlights
Sales
Gross Margin
Net Profit
$0
$100,000
$200,000
$300,000
$400,000
$500,000
$600,000
$700,000
$800,000
$900,000
$1,000,000
Year 1 Year 2 Year 3
Highlights
1.2 Mission
The mission of Allensburg's Food and Gas is to offer commuters on Highway 310 competitive gas prices and great food. The company will make a healthy profit forits owners and provide a rewarding work environment for its employees.
1.3 Keys to Success
Good quality products at competitive prices. Excellent customer service that will promote customer loyalty. A location that will assure that commuters will stop.
2.0 Company Summary
Allensburg's Food and Gas is a new convenience store and gas station in Allensburg. Robert Cole, owner of Allensburg's Food and Gas, has seven years of experience in managing gas stations. Robert will focus on the commuters that passthrough the town daily. Allensburg's Food and Gas will offer its customers the best gas prices and quality food products.
2.1 Company Ownership
Allensburg's Food and Gas is wholly owned by Robert Cole.
Page 2

Allensburg's Food and Gas
2.2 Start-up Summary
Robert Cole will invest $60,000 in Allensburg's Food and Gas. Robert aims to secure an SBA of $150,000 to finance the remainder of the start up costs.
The following chart and table show projected initial start-up costs for Allensburg's Food and Gas.
Chart: Start-up
$0
$20,000
$40,000
$60,000
$80,000
$100,000
$120,000
$140,000
Expenses Assets Investment Loans
Start-up
Table: Start-up
Start-up
Requirements
Start-up ExpensesLegal $1,000 Insurance $1,000 Rent $1,500 State Permits $3,000 Gas Station Setup $70,000 Store Setup $20,000 Promotional Sign $5,000 Total Start-up Expenses $101,500
Start-up AssetsCash Required $18,500
Page 3
Allensburg's Food and Gas
Start-up Inventory $10,000 Other Current Assets $0 Long-term Assets $80,000 Total Assets $108,500
Total Requirements $210,000
Page 4
Allensburg's Food and Gas
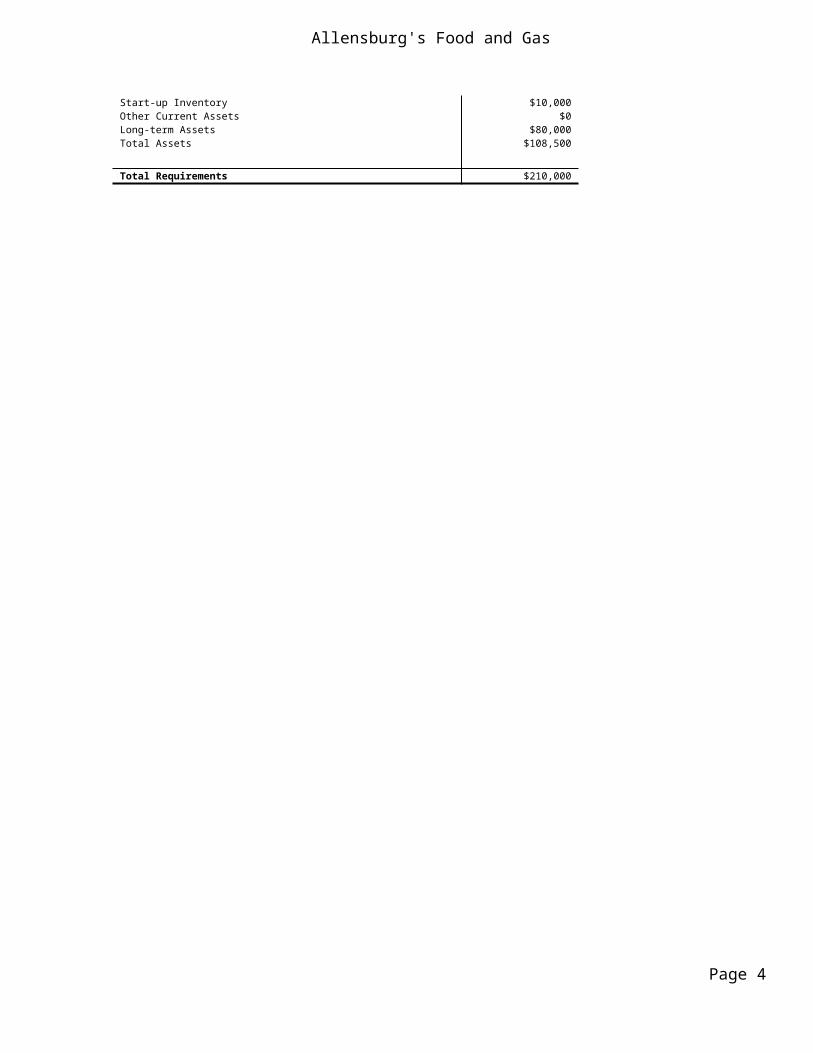
Table: Start-up Funding
Start-up Funding
Start-up Expenses to Fund $101,500 Start-up Assets to Fund $108,500 Total Funding Required $210,000
Assets Non-cash Assets from Start-up $90,000 Cash Requirements from Start-up $18,500 Additional Cash Raised $0 Cash Balance on Starting Date $18,500 Total Assets $108,500
Liabilities and Capital
LiabilitiesCurrent Borrowing $0 Long-term Liabilities $150,000 Accounts Payable (Outstanding Bills) $0 Other Current Liabilities (interest-free) $0 Total Liabilities $150,000
Capital
Planned InvestmentRobert Cole $60,000 Other $0 Additional Investment Requirement $0 Total Planned Investment $60,000
Loss at Start-up (Start-up Expenses) ($101,500)Total Capital ($41,500)
Total Capital and Liabilities $108,500
Total Funding $210,000
3.0 Products
Allensburg's Food and Gas sells the following products:
Gasoline and diesel fuel; Oil, de-icer, car accessories, etc.; Deli items; Drinks; Bakery goods; Organic produce.
Page 5

Allensburg's Food and Gas
4.0 Market Analysis Summary
Located on rural Highway 310, Allensburg is 30 miles south of the city of Kent and 34 miles north of the city of Willard. Highway 310 connects Kent and Willard that both have universities and a cumulative population of 200,000 residents. Thehighway is the main road through town and is used daily by thousands of commutersbetween the two cities. The closest gas station in either direction is over 20 miles away.
These commuters currently have no convenient shop in which to buy food to or fromwork once they are on Highway 310; more importantly, eighty percent of Highway 310 commuters fits the demographic profile of customers of upscale organic/natural food stores:
Age: 25 - 45 years of age; Gender: 60% women; Average income: $40,000+; Education: college graduate; Employment: professionals in business and education.
4.1 Market Segmentation
The target customers of Allensburg's Food and Gas are the commuters that use Highway 310.
Table: Market Analysis
Market Analysis
Year 1 Year 2 Year 3 Year 4 Year 5Potential Customers Growth CAGRCommuters 10% 5,500 6,050 6,655 7,321 8,053 10.00% Other 0% 0 0 0 0 0 0.00% Total 10.00% 5,500 6,050 6,655 7,321 8,053 10.00%
5.0 Strategy and Implementation Summary
Allensburg's Food and Gas will focus on becoming a routine stop for the commuter traffic on Highway 310, not just for those people who need gas, but for those whoare looking for a healthy, tasty snack on their drive, or need to pick up some small grocery item on their way home. Allensburg's Food and Gas will aim to be more than a gas station to its customers, it will be a friendly place to stop fortired commuters.
Page 6
Allensburg's Food and Gas
5.1 Competitive Edge
The competitive edge for Allensburg's Food and Gas is the following:
Location: Allensburg's Food and Gas is located on Highway 310. The closest competitor is three miles into the town of Allensburg.
Quality Deli and Organic Produce: While buying gas, commuters will now be ableto pick up lunch, or buy something to take home. The commuter will soon regardAllensburg's Food and Gas as an invaluable time saver in their day.
5.2 Sales Strategy
Allensburg's Food and Gas will keep its gas prices competitive with other stations in a fifty mile radius of the station in order to attract commuters. Customers that purchase more than $10 worth of gas will be given 15% coupon on purchases in the store during the first month of operation, to encourage purchases and to introduce them to the concept of buying quality organic foods atthe gas station.
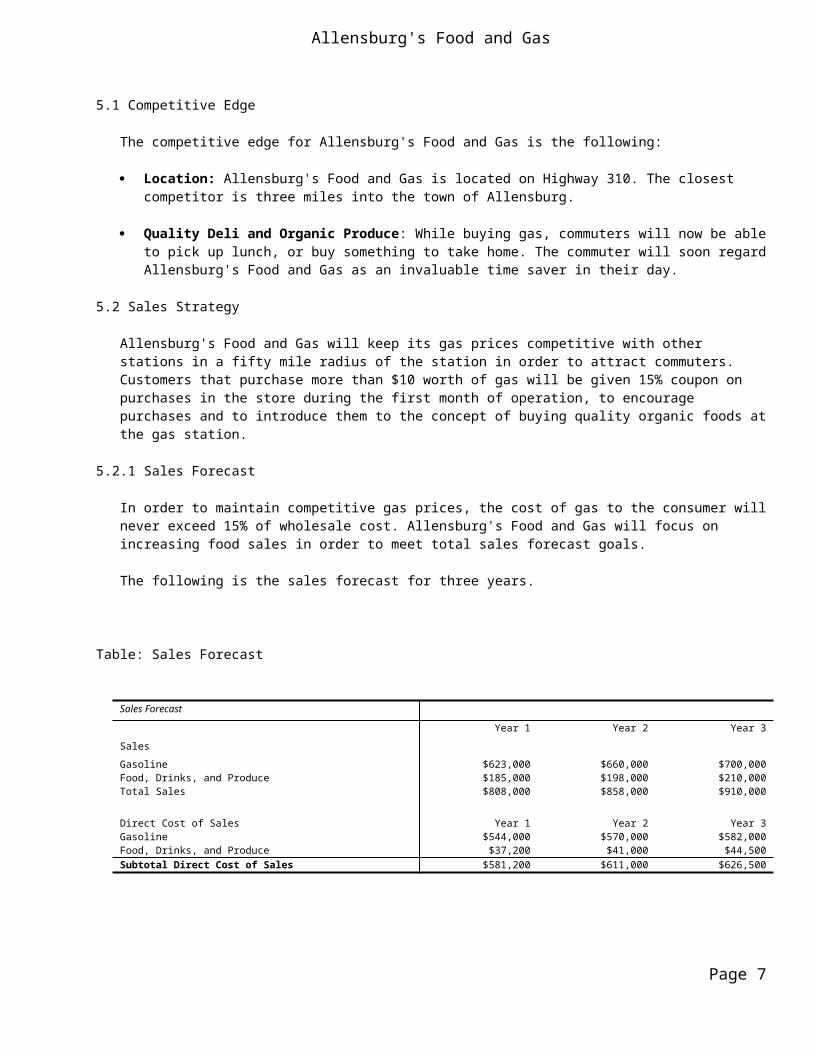
5.2.1 Sales Forecast
In order to maintain competitive gas prices, the cost of gas to the consumer willnever exceed 15% of wholesale cost. Allensburg's Food and Gas will focus on increasing food sales in order to meet total sales forecast goals.
The following is the sales forecast for three years.
Table: Sales Forecast
Sales Forecast
Year 1 Year 2 Year 3SalesGasoline $623,000 $660,000 $700,000 Food, Drinks, and Produce $185,000 $198,000 $210,000 Total Sales $808,000 $858,000 $910,000
Direct Cost of Sales Year 1 Year 2 Year 3Gasoline $544,000 $570,000 $582,000 Food, Drinks, and Produce $37,200 $41,000 $44,500 Subtotal Direct Cost of Sales $581,200 $611,000 $626,500
Page 7
Allensburg's Food and Gas
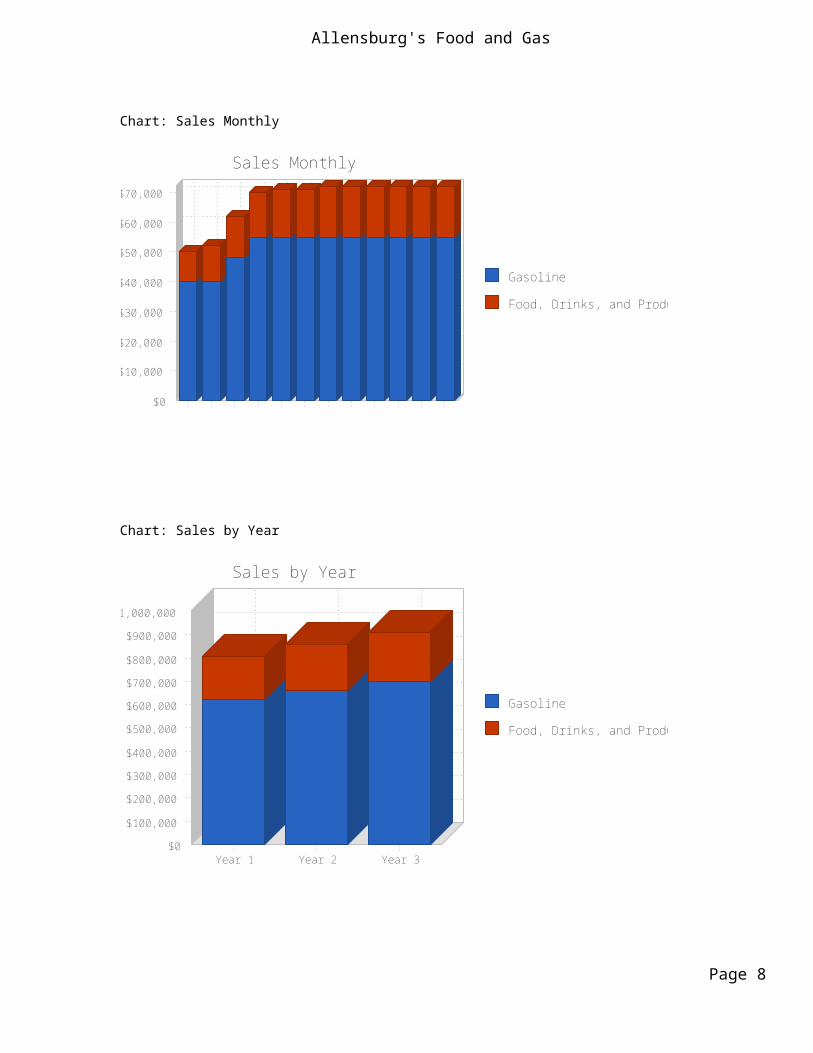
Chart: Sales Monthly
Gasoline
Food, Drinks, and Produce
$0
$10,000
$20,000
$30,000
$40,000
$50,000
$60,000
$70,000
Mon
th 1
Mon
th 2
Month 3
Month
4 Mon
th 5
Mon
th 6
Month
7 Month
8 M
onth
9 Month
10
Mon
th 11
Mon
th 1
2
Sales Monthly
Chart: Sales by Year
Gasoline
Food, Drinks, and Produce
$0
$100,000
$200,000
$300,000
$400,000
$500,000
$600,000
$700,000
$800,000
$900,000
$1,000,000
Year 1 Year 2 Year 3
Sales by Year
Page 8
Allensburg's Food and Gas
6.0 Management Summary
Robert Cole, owner of Allensburg's Food and Gas, has seven years of experience inmanaging gas stations/convenience stores. Robert has a reputation as an excellentstaff supervisor. From 1993 to 1996, Robert was the manager of Higgins Texaco, one of the largest gas station/convenience stores in Willard. At Higgins, Robert supervised a staff of seven. In 1997, Robert became manager of the Barger Chevron, located at the southern tip of Kent, near Highway 310.
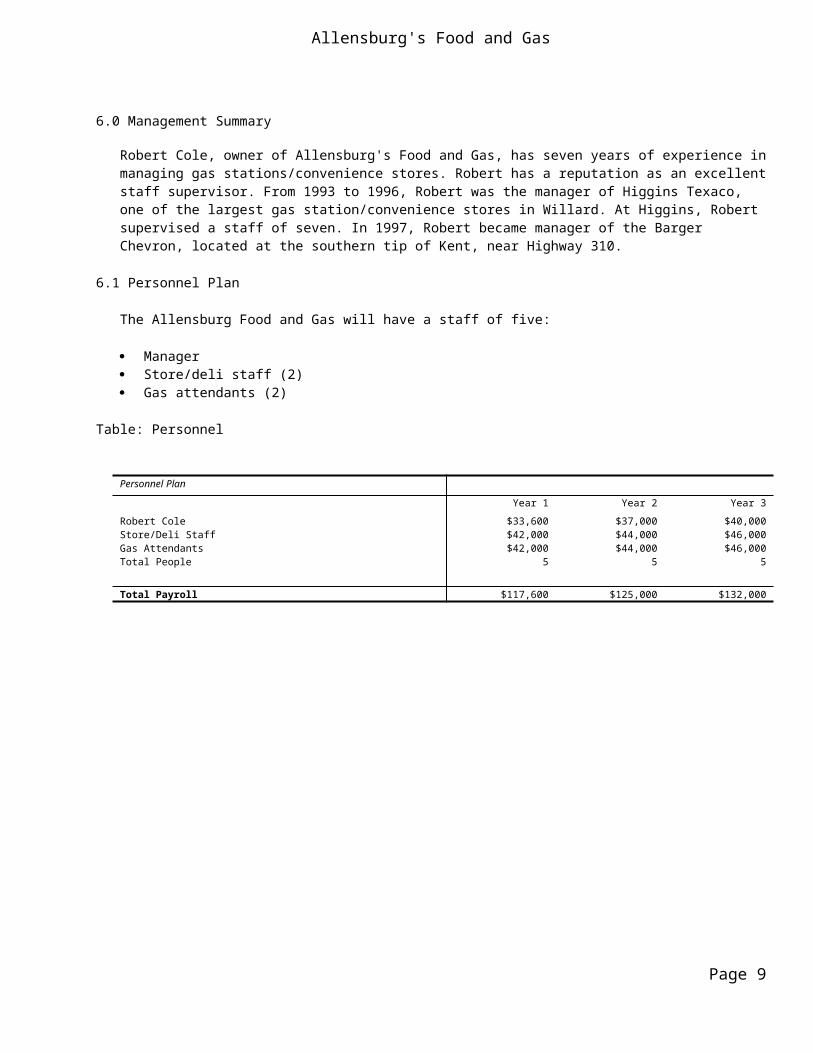
6.1 Personnel Plan
The Allensburg Food and Gas will have a staff of five:
Manager Store/deli staff (2) Gas attendants (2)
Table: Personnel
Personnel Plan
Year 1 Year 2 Year 3Robert Cole $33,600 $37,000 $40,000 Store/Deli Staff $42,000 $44,000 $46,000 Gas Attendants $42,000 $44,000 $46,000 Total People 5 5 5
Total Payroll $117,600 $125,000 $132,000
Page 9

Allensburg's Food and Gas
7.0 Financial Plan
The following is the financial plan for Allensburg's Food and Gas.
7.1 Break-even Analysis
The monthly break-even point is approximately $49,500.
Table: Break-even Analysis
Break-even Analysis
Monthly Revenue Break-even $49,539
Assumptions:Average Percent Variable Cost 72% Estimated Monthly Fixed Cost $13,905
Chart: Break-even Analysis
$0
$3,000
$6,000
$9,000
($3,000)
($6,000)
($9,000)
($12,000)
$0$8,000
$16,000$24,000
$32,000$40,000
$48,000$56,000
$64,000$72,000
$80,000$88,000
Break-even Analysis
Page 10

Allensburg's Food and Gas
7.2 Projected Profit and Loss
The following table and charts highlight the projected profit and loss for three years.
Chart: Profit Monthly
$0
$500
$1,000
$1,500
$2,000
$2,500
$3,000
$3,500
$4,000
($500)
Month 1 Month 2
Month 3 Month 4
Month 5 Month 6
Month 7 Month 8
Month 9 Month 10
Month 11 Month 12
Profit Monthly
Page 11
Allensburg's Food and Gas
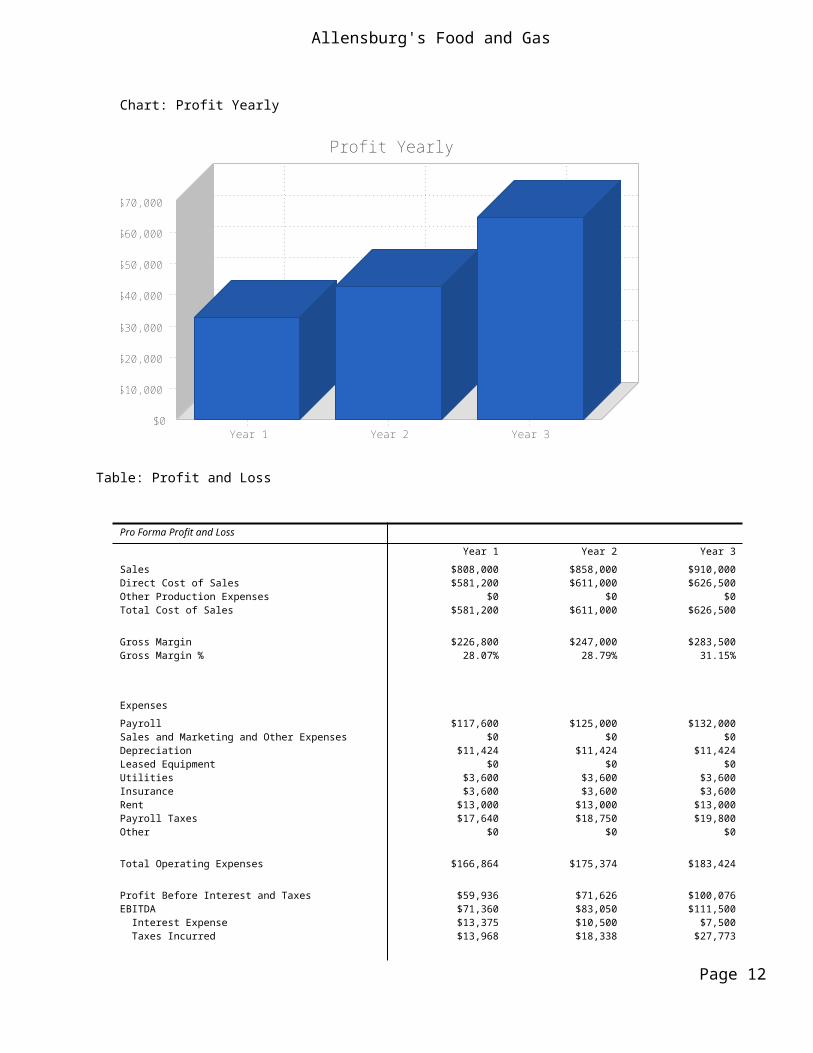
Chart: Profit Yearly
$0
$10,000
$20,000
$30,000
$40,000
$50,000
$60,000
$70,000
Year 1 Year 2 Year 3
Profit Yearly
Table: Profit and Loss
Pro Forma Profit and Loss
Year 1 Year 2 Year 3Sales $808,000 $858,000 $910,000 Direct Cost of Sales $581,200 $611,000 $626,500 Other Production Expenses $0 $0 $0 Total Cost of Sales $581,200 $611,000 $626,500
Gross Margin $226,800 $247,000 $283,500 Gross Margin % 28.07% 28.79% 31.15%
ExpensesPayroll $117,600 $125,000 $132,000 Sales and Marketing and Other Expenses $0 $0 $0 Depreciation $11,424 $11,424 $11,424 Leased Equipment $0 $0 $0 Utilities $3,600 $3,600 $3,600 Insurance $3,600 $3,600 $3,600 Rent $13,000 $13,000 $13,000 Payroll Taxes $17,640 $18,750 $19,800 Other $0 $0 $0
Total Operating Expenses $166,864 $175,374 $183,424
Profit Before Interest and Taxes $59,936 $71,626 $100,076 EBITDA $71,360 $83,050 $111,500 Interest Expense $13,375 $10,500 $7,500 Taxes Incurred $13,968 $18,338 $27,773
Page 12

Allensburg's Food and Gas
Net Profit $32,593 $42,788 $64,803 Net Profit/Sales 4.03% 4.99% 7.12%
Page 13

Allensburg's Food and Gas
7.3 Projected Cash Flow
The following table and chart highlight the projected cash flow for three years.
Table: Cash Flow
Pro Forma Cash Flow
Year 1 Year 2 Year 3Cash Received
Cash from OperationsCash Sales $808,000 $858,000 $910,000 Subtotal Cash from Operations $808,000 $858,000 $910,000
Additional Cash ReceivedSales Tax, VAT, HST/GST Received $0 $0 $0 New Current Borrowing $0 $0 $0 New Other Liabilities (interest-free) $0 $0 $0 New Long-term Liabilities $0 $0 $0 Sales of Other Current Assets $0 $0 $0 Sales of Long-term Assets $0 $0 $0 New Investment Received $0 $0 $0 Subtotal Cash Received $808,000 $858,000 $910,000
Expenditures Year 1 Year 2 Year 3
Expenditures from OperationsCash Spending $117,600 $125,000 $132,000 Bill Payments $637,424 $680,644 $700,081 Subtotal Spent on Operations $755,024 $805,644 $832,081
Additional Cash SpentSales Tax, VAT, HST/GST Paid Out $0 $0 $0 Principal Repayment of Current Borrowing $0 $0 $0 Other Liabilities Principal Repayment $0 $0 $0 Long-term Liabilities Principal Repayment $30,000 $30,000 $30,000 Purchase Other Current Assets $0 $0 $0 Purchase Long-term Assets $0 $0 $0 Dividends $0 $0 $0 Subtotal Cash Spent $785,024 $835,644 $862,081
Net Cash Flow $22,976 $22,356 $47,919 Cash Balance $41,476 $63,832 $111,751
Page 14

Allensburg's Food and Gas
Chart: Cash
Net Cash Flow
Cash Balance
$0
$10,000
$20,000
$30,000
$40,000
$50,000
$60,000
($10,000)
($20,000)
($30,000) Mon
th 1
Month 2
Month
3 Mon
th 4
Month 5
Month
6 M
onth
7 Month
8 Mon
th 9
Mon
th 1
0 M
onth
11
Month
12
Cash
Page 15
Allensburg's Food and Gas
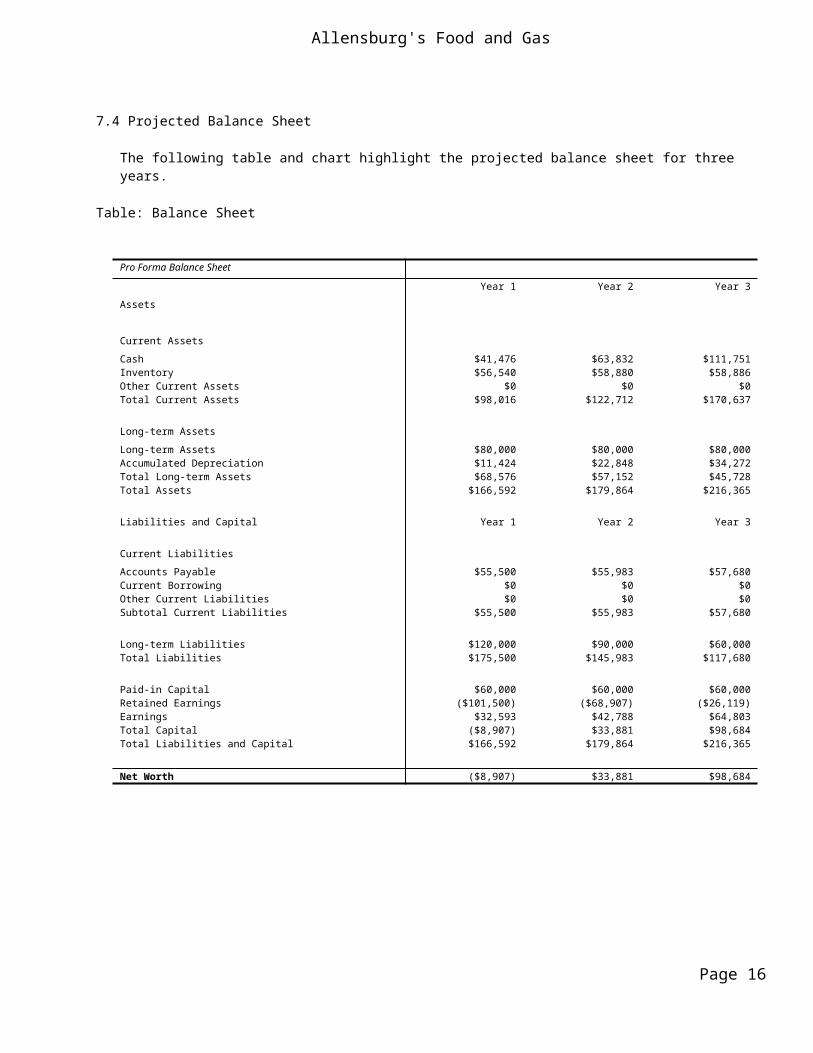
7.4 Projected Balance Sheet
The following table and chart highlight the projected balance sheet for three years.
Table: Balance Sheet
Pro Forma Balance Sheet
Year 1 Year 2 Year 3Assets
Current AssetsCash $41,476 $63,832 $111,751 Inventory $56,540 $58,880 $58,886 Other Current Assets $0 $0 $0 Total Current Assets $98,016 $122,712 $170,637
Long-term AssetsLong-term Assets $80,000 $80,000 $80,000 Accumulated Depreciation $11,424 $22,848 $34,272 Total Long-term Assets $68,576 $57,152 $45,728 Total Assets $166,592 $179,864 $216,365
Liabilities and Capital Year 1 Year 2 Year 3
Current LiabilitiesAccounts Payable $55,500 $55,983 $57,680 Current Borrowing $0 $0 $0 Other Current Liabilities $0 $0 $0 Subtotal Current Liabilities $55,500 $55,983 $57,680
Long-term Liabilities $120,000 $90,000 $60,000 Total Liabilities $175,500 $145,983 $117,680
Paid-in Capital $60,000 $60,000 $60,000 Retained Earnings ($101,500) ($68,907) ($26,119)Earnings $32,593 $42,788 $64,803 Total Capital ($8,907) $33,881 $98,684 Total Liabilities and Capital $166,592 $179,864 $216,365
Net Worth ($8,907) $33,881 $98,684
Page 16
Allensburg's Food and Gas
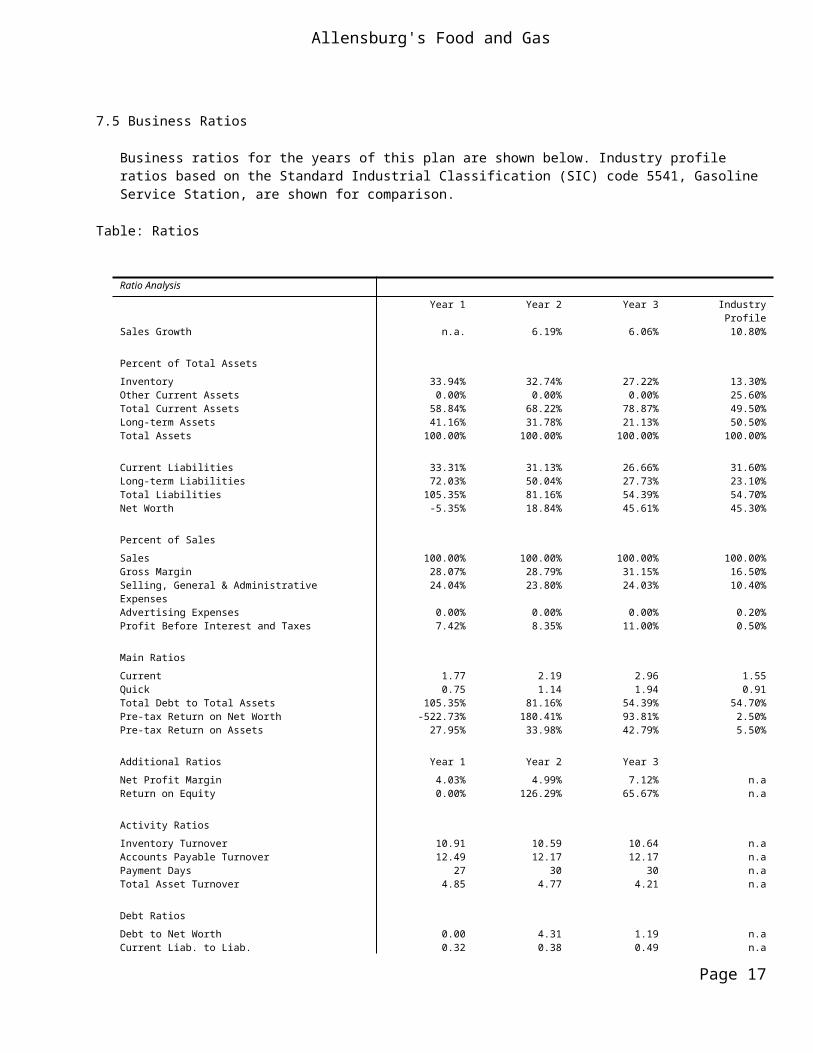
7.5 Business Ratios
Business ratios for the years of this plan are shown below. Industry profile ratios based on the Standard Industrial Classification (SIC) code 5541, Gasoline Service Station, are shown for comparison.
Table: Ratios
Ratio Analysis
Year 1 Year 2 Year 3 IndustryProfile
Sales Growth n.a. 6.19% 6.06% 10.80%
Percent of Total AssetsInventory 33.94% 32.74% 27.22% 13.30% Other Current Assets 0.00% 0.00% 0.00% 25.60% Total Current Assets 58.84% 68.22% 78.87% 49.50% Long-term Assets 41.16% 31.78% 21.13% 50.50% Total Assets 100.00% 100.00% 100.00% 100.00%
Current Liabilities 33.31% 31.13% 26.66% 31.60% Long-term Liabilities 72.03% 50.04% 27.73% 23.10% Total Liabilities 105.35% 81.16% 54.39% 54.70% Net Worth -5.35% 18.84% 45.61% 45.30%
Percent of SalesSales 100.00% 100.00% 100.00% 100.00% Gross Margin 28.07% 28.79% 31.15% 16.50% Selling, General & Administrative Expenses
24.04% 23.80% 24.03% 10.40%
Advertising Expenses 0.00% 0.00% 0.00% 0.20% Profit Before Interest and Taxes 7.42% 8.35% 11.00% 0.50%
Main RatiosCurrent 1.77 2.19 2.96 1.55 Quick 0.75 1.14 1.94 0.91 Total Debt to Total Assets 105.35% 81.16% 54.39% 54.70% Pre-tax Return on Net Worth -522.73% 180.41% 93.81% 2.50% Pre-tax Return on Assets 27.95% 33.98% 42.79% 5.50%
Additional Ratios Year 1 Year 2 Year 3Net Profit Margin 4.03% 4.99% 7.12% n.aReturn on Equity 0.00% 126.29% 65.67% n.a
Activity RatiosInventory Turnover 10.91 10.59 10.64 n.aAccounts Payable Turnover 12.49 12.17 12.17 n.aPayment Days 27 30 30 n.aTotal Asset Turnover 4.85 4.77 4.21 n.a
Debt RatiosDebt to Net Worth 0.00 4.31 1.19 n.aCurrent Liab. to Liab. 0.32 0.38 0.49 n.a
Page 17

Allensburg's Food and Gas
Liquidity RatiosNet Working Capital $42,517 $66,729 $112,956 n.aInterest Coverage 4.48 6.82 13.34 n.a
Additional RatiosAssets to Sales 0.21 0.21 0.24 n.aCurrent Debt/Total Assets 33% 31% 27% n.aAcid Test 0.75 1.14 1.94 n.aSales/Net Worth 0.00 25.32 9.22 n.aDividend Payout 0.00 0.00 0.00 n.a
Page 18

Appendix
Table: Sales Forecast
Sales Forecast
Month 1 Month 2 Month 3 Month 4 Month 5 Month 6 Month 7 Month 8 Month 9 Month10
Month11
Month12
SalesGasoline 0% $40,000 $40,000 $48,000 $55,000 $55,000 $55,000 $55,000 $55,000 $55,000 $55,000 $55,000 $55,000 Food, Drinks, and Produce 0% $10,000 $12,000 $14,000 $15,000 $16,000 $16,000 $17,000 $17,000 $17,000 $17,000 $17,000 $17,000 Total Sales $50,000 $52,000 $62,000 $70,000 $71,000 $71,000 $72,000 $72,000 $72,000 $72,000 $72,000 $72,000
Direct Cost of Sales Month 1 Month 2 Month 3 Month 4 Month 5 Month 6 Month 7 Month 8 Month 9 Month10
Month11
Month12
Gasoline $35,000 $35,000 $42,000 $48,000 $48,000 $48,000 $48,000 $48,000 $48,000 $48,000 $48,000 $48,000 Food, Drinks, and Produce $2,000 $2,500 $2,900 $3,000 $3,200 $3,200 $3,400 $3,400 $3,400 $3,400 $3,400 $3,400
Subtotal Direct Cost of Sales
$37,000 $37,500 $44,900 $51,000 $51,200 $51,200 $51,400 $51,400 $51,400 $51,400 $51,400 $51,400
Page 1
Appendix
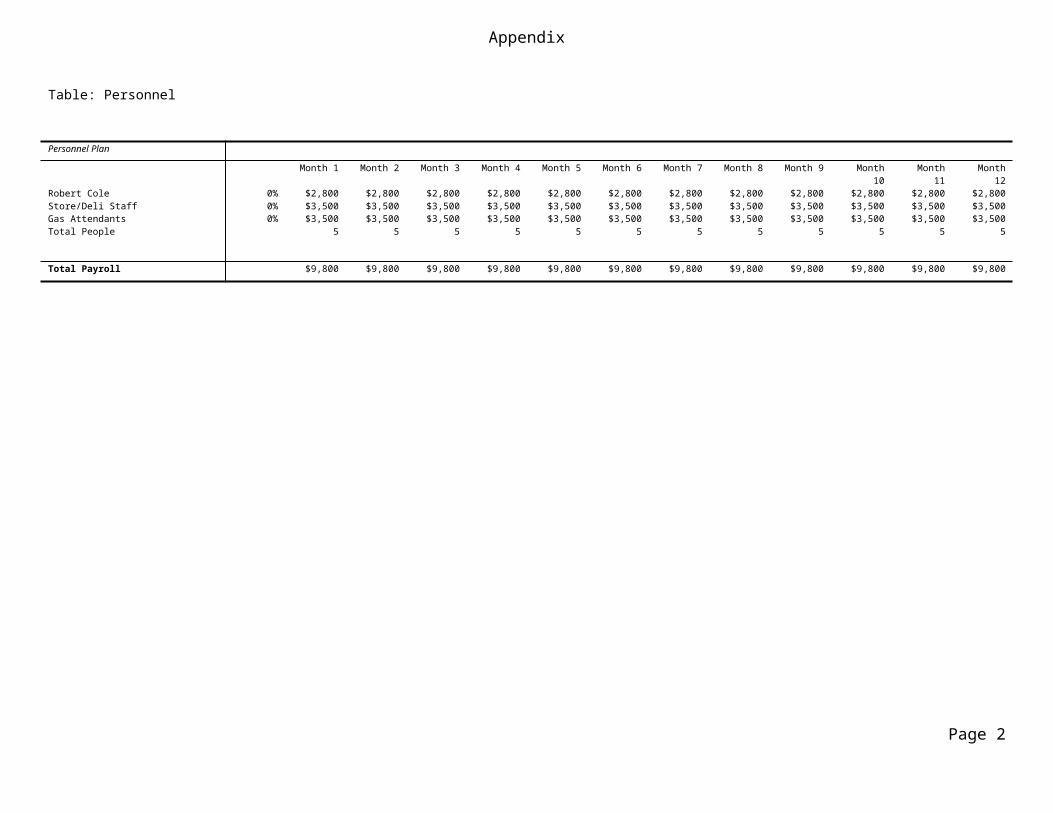
Table: Personnel
Personnel Plan
Month 1 Month 2 Month 3 Month 4 Month 5 Month 6 Month 7 Month 8 Month 9 Month10
Month11
Month12
Robert Cole 0% $2,800 $2,800 $2,800 $2,800 $2,800 $2,800 $2,800 $2,800 $2,800 $2,800 $2,800 $2,800 Store/Deli Staff 0% $3,500 $3,500 $3,500 $3,500 $3,500 $3,500 $3,500 $3,500 $3,500 $3,500 $3,500 $3,500 Gas Attendants 0% $3,500 $3,500 $3,500 $3,500 $3,500 $3,500 $3,500 $3,500 $3,500 $3,500 $3,500 $3,500 Total People 5 5 5 5 5 5 5 5 5 5 5 5
Total Payroll $9,800 $9,800 $9,800 $9,800 $9,800 $9,800 $9,800 $9,800 $9,800 $9,800 $9,800 $9,800
Page 2

Appendix
Table: General Assumptions
General Assumptions
Month 1 Month 2 Month 3 Month 4 Month 5 Month 6 Month 7 Month 8 Month 9 Month 10 Month 11 Month 12Plan Month 1 2 3 4 5 6 7 8 9 10 11 12Current Interest Rate
10.00% 10.00% 10.00% 10.00% 10.00% 10.00% 10.00% 10.00% 10.00% 10.00% 10.00% 10.00%
Long-term InterestRate
10.00% 10.00% 10.00% 10.00% 10.00% 10.00% 10.00% 10.00% 10.00% 10.00% 10.00% 10.00%
Tax Rate 30.00% 30.00% 30.00% 30.00% 30.00% 30.00% 30.00% 30.00% 30.00% 30.00% 30.00% 30.00%
Other 0 0 0 0 0 0 0 0 0 0 0 0
Page 3

Appendix
Table: Profit and Loss
Pro Forma Profit and Loss
Month 1 Month 2 Month 3 Month 4 Month 5 Month 6 Month 7 Month 8 Month 9 Month 10 Month 11 Month 12Sales $50,000 $52,000 $62,000 $70,000 $71,000 $71,000 $72,000 $72,000 $72,000 $72,000 $72,000 $72,000 Direct Cost of Sales $37,000 $37,500 $44,900 $51,000 $51,200 $51,200 $51,400 $51,400 $51,400 $51,400 $51,400 $51,400 Other Production Expenses
$0 $0 $0 $0 $0 $0 $0 $0 $0 $0 $0 $0
Total Cost of Sales $37,000 $37,500 $44,900 $51,000 $51,200 $51,200 $51,400 $51,400 $51,400 $51,400 $51,400 $51,400
Gross Margin $13,000 $14,500 $17,100 $19,000 $19,800 $19,800 $20,600 $20,600 $20,600 $20,600 $20,600 $20,600 Gross Margin % 26.00% 27.88% 27.58% 27.14% 27.89% 27.89% 28.61% 28.61% 28.61% 28.61% 28.61% 28.61%
ExpensesPayroll $9,800 $9,800 $9,800 $9,800 $9,800 $9,800 $9,800 $9,800 $9,800 $9,800 $9,800 $9,800 Sales and Marketing and Other Expenses
$0 $0 $0 $0 $0 $0 $0 $0 $0 $0 $0 $0
Depreciation $952 $952 $952 $952 $952 $952 $952 $952 $952 $952 $952 $952 Leased Equipment $0 $0 $0 $0 $0 $0 $0 $0 $0 $0 $0 $0 Utilities $300 $300 $300 $300 $300 $300 $300 $300 $300 $300 $300 $300 Insurance $300 $300 $300 $300 $300 $300 $300 $300 $300 $300 $300 $300 Rent $0 $0 $1,300 $1,300 $1,300 $1,300 $1,300 $1,300 $1,300 $1,300 $1,300 $1,300 Payroll Taxes 15% $1,470 $1,470 $1,470 $1,470 $1,470 $1,470 $1,470 $1,470 $1,470 $1,470 $1,470 $1,470 Other $0 $0 $0 $0 $0 $0 $0 $0 $0 $0 $0 $0
Total Operating Expenses
$12,822 $12,822 $14,122 $14,122 $14,122 $14,122 $14,122 $14,122 $14,122 $14,122 $14,122 $14,122
Profit Before Interest and Taxes
$178 $1,678 $2,978 $4,878 $5,678 $5,678 $6,478 $6,478 $6,478 $6,478 $6,478 $6,478
EBITDA $1,130 $2,630 $3,930 $5,830 $6,630 $6,630 $7,430 $7,430 $7,430 $7,430 $7,430 $7,430 Interest Expense $1,229 $1,208 $1,188 $1,167 $1,146 $1,125 $1,104 $1,083 $1,063 $1,042 $1,021 $1,000 Taxes Incurred ($315) $141 $537 $1,113 $1,360 $1,366 $1,612 $1,618 $1,625 $1,631 $1,637 $1,643
Net Profit ($736) $329 $1,253 $2,598 $3,173 $3,187 $3,762 $3,776 $3,791 $3,805 $3,820 $3,835
Page 4
Appendix
Net Profit/Sales -1.47% 0.63% 2.02% 3.71% 4.47% 4.49% 5.22% 5.24% 5.27% 5.29% 5.31% 5.33%
Page 5

Appendix
Table: Cash Flow
Pro Forma Cash Flow
Month 1 Month 2 Month 3 Month 4 Month 5 Month 6 Month 7 Month 8 Month 9 Month10
Month11
Month12
Cash Received
Cash from OperationsCash Sales $50,000 $52,000 $62,000 $70,000 $71,000 $71,000 $72,000 $72,000 $72,000 $72,000 $72,000 $72,000 Subtotal Cash from Operations $50,000 $52,000 $62,000 $70,000 $71,000 $71,000 $72,000 $72,000 $72,000 $72,000 $72,000 $72,000
Additional Cash ReceivedSales Tax, VAT, HST/GST Received
0.00% $0 $0 $0 $0 $0 $0 $0 $0 $0 $0 $0 $0
New Current Borrowing $0 $0 $0 $0 $0 $0 $0 $0 $0 $0 $0 $0 New Other Liabilities (interest-free)
$0 $0 $0 $0 $0 $0 $0 $0 $0 $0 $0 $0
New Long-term Liabilities $0 $0 $0 $0 $0 $0 $0 $0 $0 $0 $0 $0 Sales of Other Current Assets $0 $0 $0 $0 $0 $0 $0 $0 $0 $0 $0 $0 Sales of Long-term Assets $0 $0 $0 $0 $0 $0 $0 $0 $0 $0 $0 $0 New Investment Received $0 $0 $0 $0 $0 $0 $0 $0 $0 $0 $0 $0 Subtotal Cash Received $50,000 $52,000 $62,000 $70,000 $71,000 $71,000 $72,000 $72,000 $72,000 $72,000 $72,000 $72,000
Expenditures Month 1 Month 2 Month 3 Month 4 Month 5 Month 6 Month 7 Month 8 Month 9 Month10
Month11
Month12
Expenditures from OperationsCash Spending $9,800 $9,800 $9,800 $9,800 $9,800 $9,800 $9,800 $9,800 $9,800 $9,800 $9,800 $9,800 Bill Payments $2,356 $69,710 $42,025 $58,309 $63,158 $57,288 $57,082 $57,698 $57,471 $57,457 $57,442 $57,427 Subtotal Spent on Operations $12,156 $79,510 $51,825 $68,109 $72,958 $67,088 $66,882 $67,498 $67,271 $67,257 $67,242 $67,227
Additional Cash SpentSales Tax, VAT, HST/GST Paid Out
$0 $0 $0 $0 $0 $0 $0 $0 $0 $0 $0 $0
Principal Repayment of Current Borrowing
$0 $0 $0 $0 $0 $0 $0 $0 $0 $0 $0 $0
Other Liabilities Principal Repayment
$0 $0 $0 $0 $0 $0 $0 $0 $0 $0 $0 $0
Page 6

Appendix
Long-term Liabilities Principal Repayment
$2,500 $2,500 $2,500 $2,500 $2,500 $2,500 $2,500 $2,500 $2,500 $2,500 $2,500 $2,500
Purchase Other Current Assets $0 $0 $0 $0 $0 $0 $0 $0 $0 $0 $0 $0 Purchase Long-term Assets $0 $0 $0 $0 $0 $0 $0 $0 $0 $0 $0 $0 Dividends $0 $0 $0 $0 $0 $0 $0 $0 $0 $0 $0 $0 Subtotal Cash Spent $14,656 $82,010 $54,325 $70,609 $75,458 $69,588 $69,382 $69,998 $69,771 $69,757 $69,742 $69,727
Net Cash Flow $35,344 ($30,010)
$7,675 ($609) ($4,458) $1,412 $2,618 $2,002 $2,229 $2,243 $2,258 $2,273
Cash Balance $53,844 $23,834 $31,509 $30,900 $26,442 $27,855 $30,472 $32,474 $34,703 $36,946 $39,204 $41,476
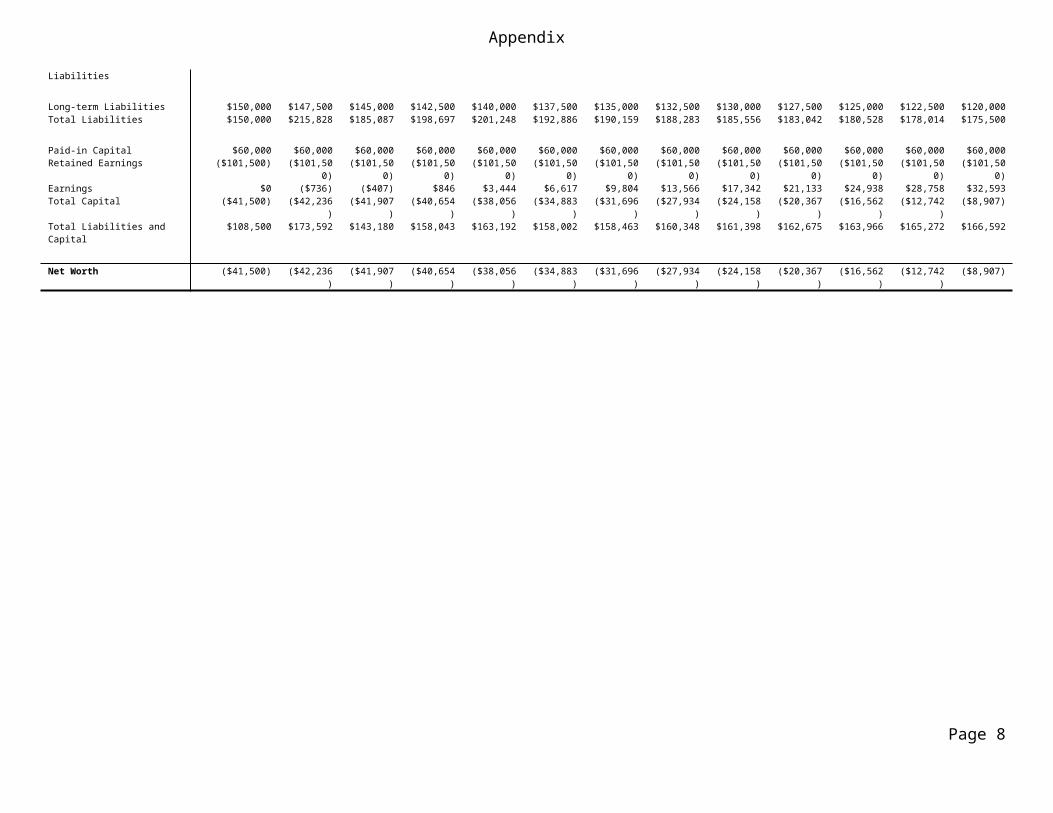
Table: Balance Sheet
Pro Forma Balance Sheet
Month 1 Month 2 Month 3 Month 4 Month 5 Month 6 Month 7 Month 8 Month 9 Month10
Month11
Month12
Assets Starting Balances
Current AssetsCash $18,500 $53,844 $23,834 $31,509 $30,900 $26,442 $27,855 $30,472 $32,474 $34,703 $36,946 $39,204 $41,476 Inventory $10,000 $40,700 $41,250 $49,390 $56,100 $56,320 $56,320 $56,540 $56,540 $56,540 $56,540 $56,540 $56,540 Other Current Assets $0 $0 $0 $0 $0 $0 $0 $0 $0 $0 $0 $0 $0 Total Current Assets $28,500 $94,544 $65,084 $80,899 $87,000 $82,762 $84,175 $87,012 $89,014 $91,243 $93,486 $95,744 $98,016
Long-term AssetsLong-term Assets $80,000 $80,000 $80,000 $80,000 $80,000 $80,000 $80,000 $80,000 $80,000 $80,000 $80,000 $80,000 $80,000 Accumulated Depreciation $0 $952 $1,904 $2,856 $3,808 $4,760 $5,712 $6,664 $7,616 $8,568 $9,520 $10,472 $11,424 Total Long-term Assets $80,000 $79,048 $78,096 $77,144 $76,192 $75,240 $74,288 $73,336 $72,384 $71,432 $70,480 $69,528 $68,576 Total Assets $108,500 $173,592 $143,180 $158,043 $163,192 $158,002 $158,463 $160,348 $161,398 $162,675 $163,966 $165,272 $166,592
Liabilities and Capital Month 1 Month 2 Month 3 Month 4 Month 5 Month 6 Month 7 Month 8 Month 9 Month10
Month11
Month12
Current LiabilitiesAccounts Payable $0 $68,328 $40,087 $56,197 $61,248 $55,386 $55,159 $55,783 $55,556 $55,542 $55,528 $55,514 $55,500 Current Borrowing $0 $0 $0 $0 $0 $0 $0 $0 $0 $0 $0 $0 $0 Other Current Liabilities
$0 $0 $0 $0 $0 $0 $0 $0 $0 $0 $0 $0 $0
Subtotal Current $0 $68,328 $40,087 $56,197 $61,248 $55,386 $55,159 $55,783 $55,556 $55,542 $55,528 $55,514 $55,500
Page 7
Appendix
Liabilities
Long-term Liabilities $150,000 $147,500 $145,000 $142,500 $140,000 $137,500 $135,000 $132,500 $130,000 $127,500 $125,000 $122,500 $120,000 Total Liabilities $150,000 $215,828 $185,087 $198,697 $201,248 $192,886 $190,159 $188,283 $185,556 $183,042 $180,528 $178,014 $175,500
Paid-in Capital $60,000 $60,000 $60,000 $60,000 $60,000 $60,000 $60,000 $60,000 $60,000 $60,000 $60,000 $60,000 $60,000 Retained Earnings ($101,500) ($101,50
0)($101,50
0)($101,50
0)($101,50
0)($101,50
0)($101,50
0)($101,50
0)($101,50
0)($101,50
0)($101,50
0)($101,50
0)($101,50
0)Earnings $0 ($736) ($407) $846 $3,444 $6,617 $9,804 $13,566 $17,342 $21,133 $24,938 $28,758 $32,593 Total Capital ($41,500) ($42,236
)($41,907
)($40,654
)($38,056
)($34,883
)($31,696
)($27,934
)($24,158
)($20,367
)($16,562
)($12,742
)($8,907)
Total Liabilities and Capital
$108,500 $173,592 $143,180 $158,043 $163,192 $158,002 $158,463 $160,348 $161,398 $162,675 $163,966 $165,272 $166,592
Net Worth ($41,500) ($42,236)
($41,907)
($40,654)
($38,056)
($34,883)
($31,696)
($27,934)
($24,158)
($20,367)
($16,562)
($12,742)
($8,907)
Page 8


![355 Motion ol Thanks on [ RAJYA SABHA ] President's Address 356 ...](https://static.fdokumen.com/doc/165x107/633d6a0483491b55fb06ff79/355-motion-ol-thanks-on-rajya-sabha-presidents-address-356-.jpg)