
Testing the voltage and the power as a function of the current ...
38
EUR xxxxx EN 2010 Testing the voltage and the power as a function of the current density following a dynamic profile versus time Dynamic load cycling ageing test for a PEFC single cell Test Module PEFC SC 5-7 30 April, 2010 T Malkow, G De Marco, A Pilenga, M. Honselaar, G Tsotridis European Commission, Joint Research Centre, Institute for Energy, Petten S Escribano, L Antoni Commissariat à l'énergie atomique et aux énergies alternatives, Grenoble R Reißner, O Thalau Deutsches Zentrum für Luft- und Raumfahrt e.V., Stuttgart E Sitters ECN-Fuel Cell Technology G Heinz SolviCore GmbH & Co. KG
-
Upload
khangminh22 -
Category
Documents
-
view
1 -
download
0
Transcript of Testing the voltage and the power as a function of the current ...
EUR xxxxx EN 2010
Testing the voltage and the power as a function of the current density
following a dynamic profile versus time
Dynamic load cycling ageing test for a PEFC single cell
Test Module PEFC SC 5-7
30 April, 2010
T Malkow, G De Marco, A Pilenga, M. Honselaar, G TsotridisEuropean Commission, Joint Research Centre, Institute for Energy, Petten
S Escribano, L AntoniCommissariat à l'énergie atomique et aux énergies alternatives, Grenoble
R Reißner, O ThalauDeutsches Zentrum für Luft- und Raumfahrt e.V., Stuttgart
E SittersECN-Fuel Cell Technology
G HeinzSolviCore GmbH & Co. KG
The mission of the JRC-IE is to provide support to Community policies
related to both nuclear and non-nuclear energy in order to ensure
sustainable, secure and efficient energy production, distribution and use.
European Commission
Joint Research Centre
Institute for Energy
Contact information
Address: Postbus 2, NL-1755 ZG Petten
E-mail: [email protected]
Tel.: +31 224 56 5656
Fax: +31 224 56 5600
http://ie.jrc.ec.europa.eu/
http://www.jrc.ec.europa.eu/
Legal Notice
Neither the European Commission nor any person acting on behalf of the
Commission is responsible for the use which might be made of this
publication.
Europe Direct is a service to help you find answers
to your questions about the European Union
Freephone number (*):
00 800 6 7 8 9 10 11
(*) Certain mobile telephone operators do not allow access to 00 800 numbers or
these calls may be billed.
A great deal of additional information on the European Union is available
on the Internet.
It can be accessed through the Europa server http://europa.eu/
JRC 56063
EUR XXXXX EN
ISBN XXX-XX-XX-XXXXX-X
ISSN XXXX-XXXX
DOI XX.XXXX/XXXXX
Luxembourg: Publications Office of the European Union
© European Union, 2010
Reproduction is authorised provided the source is acknowledged
Printed in the Netherlands

Contributors
A Ravachol (Commissariat à l'Energie Atomique et aux Energies Alternatives,
Grenoble)

Test Module TM PEFC SC 5-7
Version 30 04 2010
iii
Preface
This report is part of a series of reports on harmonised testing procedures for PEFC polymer electrolyte or proton exchange membrane fuel cell. The testing procedures called Test Modules are originally developed under the Research & Training Network (RTN) FCTESTNET (Fuel Cells Testing & Standardisation NETwork). This project was partly funded by the 5th European Community Framework Programme on Research, Technological Development and Demonstration (FP5). The present report contains the Test Module TM PEFC SC 5-7 entitled “Testing the voltage and the power as a function of the current density following a dynamic profile versus time (Dynamic load cycling ageing test for a PEFC single cell)” The scope of the module is to determine the evolution of the voltage of a PEFC single cell operating in specified conditions during a durability test performed in cycling conditions with the current density following a dynamic profile versus time. The module has no target application. It is a general characterization method used in research & development (R&D) of PEFC; for example, to perform baseline measurements for qualification of PEFC materials, components and designs in a given application. The module character of this testing procedure makes it suitable to apply it as a part of an entire test programme. The present version of the module is the result of an extensive review process carried out by the participating members to work package PEFC of the FCTESQA (Fuel Cell Systems Testing, Safety & Quality Assurance) Specific Targeted REsearch Project (STREP). FCTESQA is the successor project to FCTESTNET. It is in part funded by the Sixth Framework Programme of the European Community on Research, Technological development and Demonstration activities (FP6).

Test Module TM PEFC SC 5-7
Version 30 04 2010
iv
Test Module TM PEFC SC 5-7
Version 30 04 2010
v
Table of Contents
Preface iii
FCTESTNET vii
FCTESQA viii
Test Module PEFC SC 5-7 1
1 Objective and scope 3
2 Terminology, definitions, and symbols 4 2.1 TERMINOLOGY AND DEFINITIONS ........................................................4 2.2 SYMBOLS ........................................................................................4
3 Test Inputs 4 3.1 VARIABLE TEST INPUTS .....................................................................7 3.2 STATIC TEST INPUTS .........................................................................8
4 Test Outputs 9
5 References, required Documentation and Provisions 10 5.1 REFERENCES.................................................................................10 5.2 REQUIRED DOCUMENTATION ............................................................10 5.3 PROVISIONS ..................................................................................10
6 Test Equipment and Setup 11 6.1 TEST SET-UP..................................................................................11 6.2 SENSORS OR CONTROL/ACQUISITION EQUIPMENT NEEDED ...................12
7 Test Procedure 13 7.1 STEP 1: PRE-CONDITIONING OF TEST OBJECT......................................13 7.2 STEP 2: SETTING THE TEST CONDITIONS (TEST INPUTS) ........................14 7.3 STEP 3: MEASURING THE TEST OUTPUTS ............................................14 7.3.1 LOAD CYCLING MEASUREMENT STEP...........................................14 7.3.2 ILLUSTRATION OF THE LOAD CYCLING MEASUREMENT STEP ..........16
7.4 STEP 4: DATA POST PROCESSING......................................................17 7.5 ACCEPTANCE CRITERION.................................................................17
Appendix A. Test information for test report 18
Appendix B. Methods to apply the load cycles 19

Test Module TM PEFC SC 5-7
Version 30 04 2010
vi
Test Module TM PEFC SC 5-7
Version 30 04 2010
vii
FCTESTNET
The 55 partner strong FCTESTNET thematic network was established to define harmonised test procedures applicable to the component level (single cells, fuel cell stacks, Balance-of-Plant or BoP), sub-systems, and entire fuel cell systems. The project started in January 2003 and presented its final results in December 2005. It targeted apart from PEFC two other major types of fuel cells namely solid oxide fuel cells (SOFC) and molten carbonate fuel cells (MCFC) in stationary, transport, and portable applications.
The main objectives of FCTESTNET were to compile already existing testing procedures and methodologies and to further develop harmonised testing procedures and methodologies applicable to transport applications, stationary power sources, and portable fuel cells, focusing on:
• fuel cells,
• fuel cell stacks and
• fuel cell systems. The main deliverables of the network were:
• Contribution to the FC glossary EUR 2295 EN
• Mapping of testing competencies and inventory of equipment around Europe;
• Compilation and further development of methodologies for testing procedures;
• Common measuring criteria;
• Agreement on and harmonisation of approaches;
• Release of testing procedures
• Establishing links between European, US and Japanese standardisation bodies in the frame of harmonising test procedures.
FCTESTNET had not a mandate to establish formal standards for fuel cell test procedures. Instead FCTESTNET strived to provide harmonisation of application and technology oriented to ensure the support and integration of European industrial interests. The idea was to start from an analysis of fuel cell applications to define test parameters, test methods and conditions that are relevant for testing of single cells, stacks, sub-systems, and systems. The project output is considered useful input for standard setting bodies, but also for definition of ad-hoc test procedures applied by R&D organisations and industry.
In fact various fuel cell test procedures were developed and compiled individually as Test Modules. These modules are accessible at the FCTESQA website.

Test Module TM PEFC SC 5-7
Version 30 04 2010
viii
FCTESQA
Started in May 2006, the FCTESQA project addresses pre-normative research, benchmarking, and experimental validation through Round Robin Testing of harmonised, industry wide test protocols and testing methodologies for three types of fuel cells: PEFC, SOFC, and MCFC in stationary applications. The main objective of the project is the validation and benchmarking - by means of experimental campaigns – of the results of FCTESTNET testing procedures for three different levels (single cells, fuel cell stacks, and entire systems). The Round Robin Testing campaigns of FCTESQA are carried out by world class laboratories from among the 27 European project participants and participants from China, Japan, Korea, and US.
The results of this four years project are discussed debated and agreed in cooperative progress meetings and dedicated international workshops under the auspices of the International Partnership for the Hydrogen Economy (IPHE) and the International Energy Agency (IEA). The outcome of FCTESQA will support to lessen the gap between individual and independent management decision making within companies and research groups as far as fuel cells are concerned following accepted international quality practices.
The flow chart below describes the methodology used to improve/validate the original FCTESTNET procedures up to the final release of the procedures. The same validation methodology has been considered for all the 3 technologies and for testing of fuel cells, fuel cell stacks and fuel cell systems.
Selection / Revision of Test Proceduresfrom FCTESTNET with FCTESQA partners
Validation of the selected ProceduresUsing single cells, stacks, systems
Review of Test Procedures
Validation of Reviewed Procedures
Final Release of Test Procedures
Definition of the validation process
The test procedures can be downloaded form the website and will feed into the appropriate standardization platforms for further consensus building and international approval (like IEC TC 105).

Test Module TM PEFC SC 5-7
Version 30 04 2010
1
FCTESQA
Fuel Cell Testing, Safety and Quality
Assurance
Programme: ENERGY 3 -Sustainable Energy Systems
Test Module PEFC SC 5-7
Testing the voltage and the power as a function of the current density
following a dynamic profile versus time
Dynamic load cycling ageing test for a PEFC single cell
Version 30-04-2010

Test Module TM PEFC SC 5-7
Version 30 04 2010
2
Test Module TM PEFC SC 5-7
Version 30 04 2010
3
1 Objective and scope
The objective is to determine the evolution of the voltage of a PEFC single cell operating in specified conditions during a durability test performed in cycling conditions with the current density following a dynamic profile versus time. This test module is specifically adapted for transportation application since the load profile defined is an adaptation of the type of power profiles defined for different vehicles, including different levels of power with dynamic variations. However, since several applications are interested in the ageing behaviour of PEFC components, the test module can also be used to qualify the generic performance of a polymer electrolyte fuel cell single cell submitted to this cycling ageing test. It can either be used as a general method to characterize PEFC components such as MEAs or sub-components of MEAs for research and development objectives or as a specific test to qualify the life time of PEFC components for a specific transportation system with adapted operating conditions. So the test module is defined with ranges of operating conditions not necessarily specific of a particular transportation application. Note: the ranges of the operating conditions considered for this test module correspond to
the current conditions generally used in the field of PEFC testing.
Most important, the parameters, values and range of values
including uncertainties and control accuracies used throughout this document are recommended only.
Test Module TM PEFC SC 5-7
Version 30 04 2010
4
2 Terminology, definitions, and symbols
2.1 Terminology and definitions
Terminology and definitions used in this document correspond to the European 5th FCTESTNET terminology document EUR 22295 EN (see Section 5.1).
2.2 Symbols
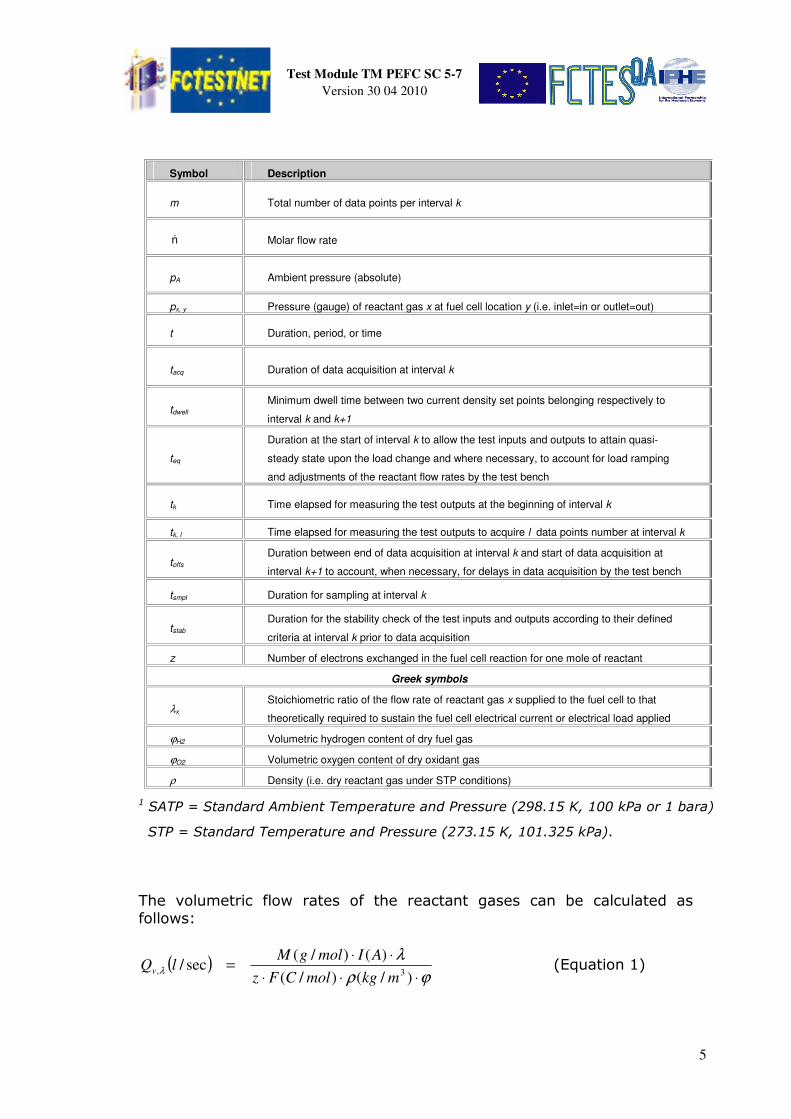
Symbols used in this document are defined as follows: Table 1: Definition of symbols used.
Symbol Description
A Common active geometric area of the fuel cell
F Faraday’s constant (F = 96485.3 C/mol)
I Electrical fuel cell current
Imax Maximum electrical fuel cell current
M Molar mass
P Electrical fuel cell power
Pk Electrical fuel cell power related to interval k
Qcool Flow rate of the fuel cell coolant
Qv Volumetric flow rate
Qv, λ Volumetric flow rate (dry basis) of a reactant gas at stoichiometry λ under STP
1
conditions
Qv, x Volumetric flow rate of fuel cell fluid x (i.e. dry reactant gas, fuel gas=fuel or oxidant
gas=ox) under STP conditions
Qv, x, λ Volumetric flow rate (dry basis) of reactant gas x at stoichiometry λ under STP conditions
Qv, x, min Minimum volumetric flow rate of fuel cell fluid x
RHx, y Relative humidity of reactant gas x at fuel cell location y (i.e. inlet=in or outlet=out)
T Temperature
Tx, y Temperature of fuel cell fluid x at fuel cell location y (i.e. inlet=in or outlet=out)
TA Ambient temperature
Tdew x, y Dew point temperature of reactant gas x at fuel cell location y (i.e. inlet=in or outlet=out)
Tc Fuel cell temperature
V Fuel cell voltage
XO2 Oxygen content in oxidant gas (molar fraction)
X H2 Hydrogen content in fuel gas (molar fraction)
i Fuel cell current density ( i = I / A)
k Interval k belonging to current density set point k during the measurement of the test
outputs
l Data acquisition index or number of data points recorded during tacq
Test Module TM PEFC SC 5-7
Version 30 04 2010
5
Symbol Description
m Total number of data points per interval k
n& Molar flow rate
pA Ambient pressure (absolute)
px, y Pressure (gauge) of reactant gas x at fuel cell location y (i.e. inlet=in or outlet=out)
t Duration, period, or time
tacq Duration of data acquisition at interval k
tdwell Minimum dwell time between two current density set points belonging respectively to
interval k and k+1
teq
Duration at the start of interval k to allow the test inputs and outputs to attain quasi-
steady state upon the load change and where necessary, to account for load ramping
and adjustments of the reactant flow rates by the test bench
tk Time elapsed for measuring the test outputs at the beginning of interval k
tk, l Time elapsed for measuring the test outputs to acquire l data points number at interval k
toffs Duration between end of data acquisition at interval k and start of data acquisition at
interval k+1 to account, when necessary, for delays in data acquisition by the test bench
tsmpl Duration for sampling at interval k
tstab Duration for the stability check of the test inputs and outputs according to their defined
criteria at interval k prior to data acquisition
z Number of electrons exchanged in the fuel cell reaction for one mole of reactant
Greek symbols
λx Stoichiometric ratio of the flow rate of reactant gas x supplied to the fuel cell to that
theoretically required to sustain the fuel cell electrical current or electrical load applied
ϕH2 Volumetric hydrogen content of dry fuel gas
ϕO2 Volumetric oxygen content of dry oxidant gas
ρ Density (i.e. dry reactant gas under STP conditions)
1 SATP = Standard Ambient Temperature and Pressure (298.15 K, 100 kPa or 1 bara)
STP = Standard Temperature and Pressure (273.15 K, 101.325 kPa).
The volumetric flow rates of the reactant gases can be calculated as follows:
( )ϕρ
λλ
⋅⋅⋅
⋅⋅=
)/()/(
)()/(sec/
3,mkgmolCFz
AImolgMlQv (Equation 1)
Test Module TM PEFC SC 5-7
Version 30 04 2010
6
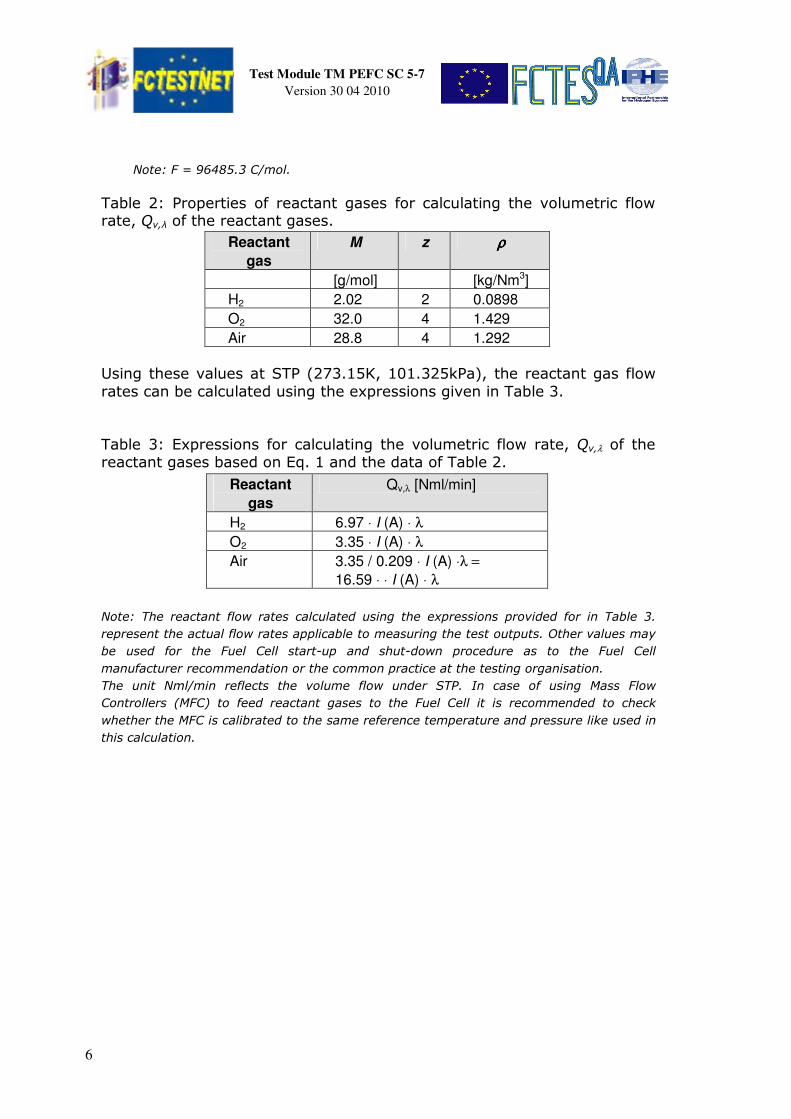
Note: F = 96485.3 C/mol.
Table 2: Properties of reactant gases for calculating the volumetric flow rate, Qv,λ of the reactant gases.
Reactant
gas
M z ρρρρ
[g/mol] [kg/Nm3]
H2 2.02 2 0.0898
O2 32.0 4 1.429
Air 28.8 4 1.292
Using these values at STP (273.15K, 101.325kPa), the reactant gas flow rates can be calculated using the expressions given in Table 3.
Table 3: Expressions for calculating the volumetric flow rate, Qv,λ of the reactant gases based on Eq. 1 and the data of Table 2.
Reactant
gas
Qv,λ [Nml/min]
H2 6.97 ⋅ I (A) ⋅ λ
O2 3.35 ⋅ I (A) ⋅ λ
Air 3.35 / 0.209 ⋅ I (A) ⋅λ =
16.59 ⋅ ⋅ I (A) ⋅ λ
Note: The reactant flow rates calculated using the expressions provided for in Table 3.
represent the actual flow rates applicable to measuring the test outputs. Other values may
be used for the Fuel Cell start-up and shut-down procedure as to the Fuel Cell
manufacturer recommendation or the common practice at the testing organisation.
The unit Nml/min reflects the volume flow under STP. In case of using Mass Flow
Controllers (MFC) to feed reactant gases to the Fuel Cell it is recommended to check
whether the MFC is calibrated to the same reference temperature and pressure like used in
this calculation.

Test Module TM PEFC SC 5-7
Version 30 04 2010
7
3 Test Inputs
In tables below are listed all the test inputs (operating conditions) that must be controlled in this testing procedure. Concerning the control accuracy, the measurement uncertainties and the sample rates, the values given in the following tables are the values commonly available with most of the equipments in the middle of the ranges but they can be too difficult to get in the extremities of the ranges or with particular operating conditions. The most important is to clearly give the actual values in the test report when these values differ from what is required by the test module.
3.1 Variable Test Inputs
Among the following inputs, Tcell should be variable only during the start-up and the conditioning steps. The other inputs are variable during the dynamic load cycling step. Table 4: Variable test inputs during test step 3.
Input Value / Range Control
accuracy
Sample
rate
t 0 – 5,000 h NA -
i 0 – 2 A/cm2
± 2% FS for i < 0.1A/cm²
± 1% FS for i ≥ 0.1A/cm² ≥ 1 Hz
i 0 (during “off” phase)
0,8 > i load > 0,5 A/cm2 (during
“on” phase)
± 2% FS for i < 0.1A/cm²
± 1% FS for i ≥ 0.1A/cm² ≥ 1 Hz
Tc TA ÷ 80 ºC ± 2 ºC ≥ 1 Hz
Qv, fuel** Corresponding to the fuel
stoichiometry, see Eq. 1 ± 1% FS* ≥ 1 Hz
Qv, ox** Corresponding to the oxidant
stoichiometry, see Eq. 1 ± 1% FS* ≥ 1 Hz
* Note 1: usually the digital mass flow meters used on the test benches are provided with
an accuracy level of 1% of the Full Scale (maximum flow) and with a minimum measurable
flow (generally 10% of the maximum flow).That means that the measurement uncertainty
decreases with the flow rate and so decreases while increasing the current density when
operating at fixed stoichiometry. In order to guarantee sufficient precision the digital mass
flow meter should be selected in such a way that its maximum flow does not exceed by
more than 100% QV, λ at the maximum desirable current density.
** Note 2: QV, λfuel and QV, λox are respectively the stoichiometry controlled volumetric flow
rates of fuel and oxidant unless these values are smaller than the minimum flow rates: QV,
fuel,min and QV, ox,min, These minimum values may correspond to the stoichiometric flow rates
for a low current density comprised between 0.05 and 0.2 A/cm². The actual minimal
current density will have to be clearly given in the test report with the related fuel and
oxidant flow rates and stoichiometries.
Test Module TM PEFC SC 5-7
Version 30 04 2010
8
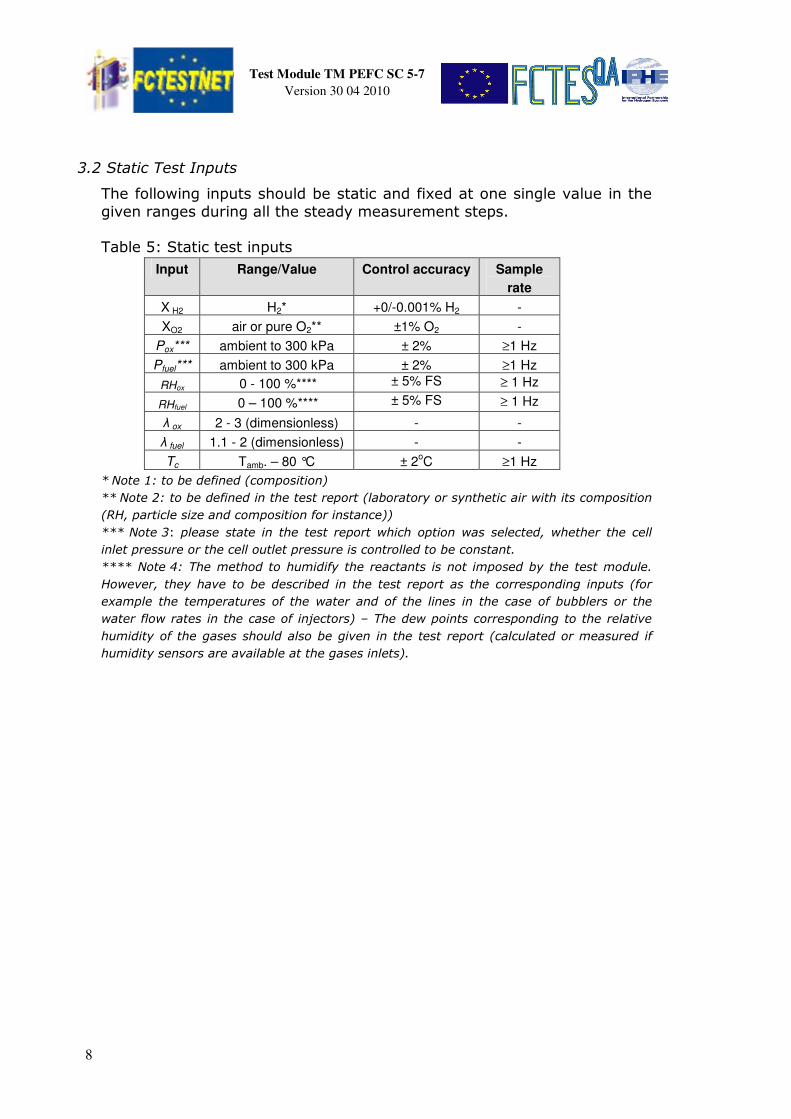
3.2 Static Test Inputs
The following inputs should be static and fixed at one single value in the given ranges during all the steady measurement steps. Table 5: Static test inputs
Input Range/Value Control accuracy Sample
rate
X H2 H2* +0/-0.001% H2 -
XO2 air or pure O2**
±1% O2 -
Pox*** ambient to 300 kPa ± 2% ≥1 Hz
Pfuel*** ambient to 300 kPa ± 2% ≥1 Hz
RHox 0 - 100 %**** ± 5% FS ≥ 1 Hz
RHfuel 0 – 100 %**** ± 5% FS ≥ 1 Hz
λ ox 2 - 3 (dimensionless) - -
λ fuel 1.1 - 2 (dimensionless) - -
Tc Tamb. – 80 °C ± 2oC ≥1 Hz
* Note 1: to be defined (composition)
** Note 2: to be defined in the test report (laboratory or synthetic air with its composition
(RH, particle size and composition for instance))
*** Note 3: please state in the test report which option was selected, whether the cell
inlet pressure or the cell outlet pressure is controlled to be constant.
**** Note 4: The method to humidify the reactants is not imposed by the test module.
However, they have to be described in the test report as the corresponding inputs (for
example the temperatures of the water and of the lines in the case of bubblers or the
water flow rates in the case of injectors) – The dew points corresponding to the relative
humidity of the gases should also be given in the test report (calculated or measured if
humidity sensors are available at the gases inlets).
Test Module TM PEFC SC 5-7
Version 30 04 2010
9
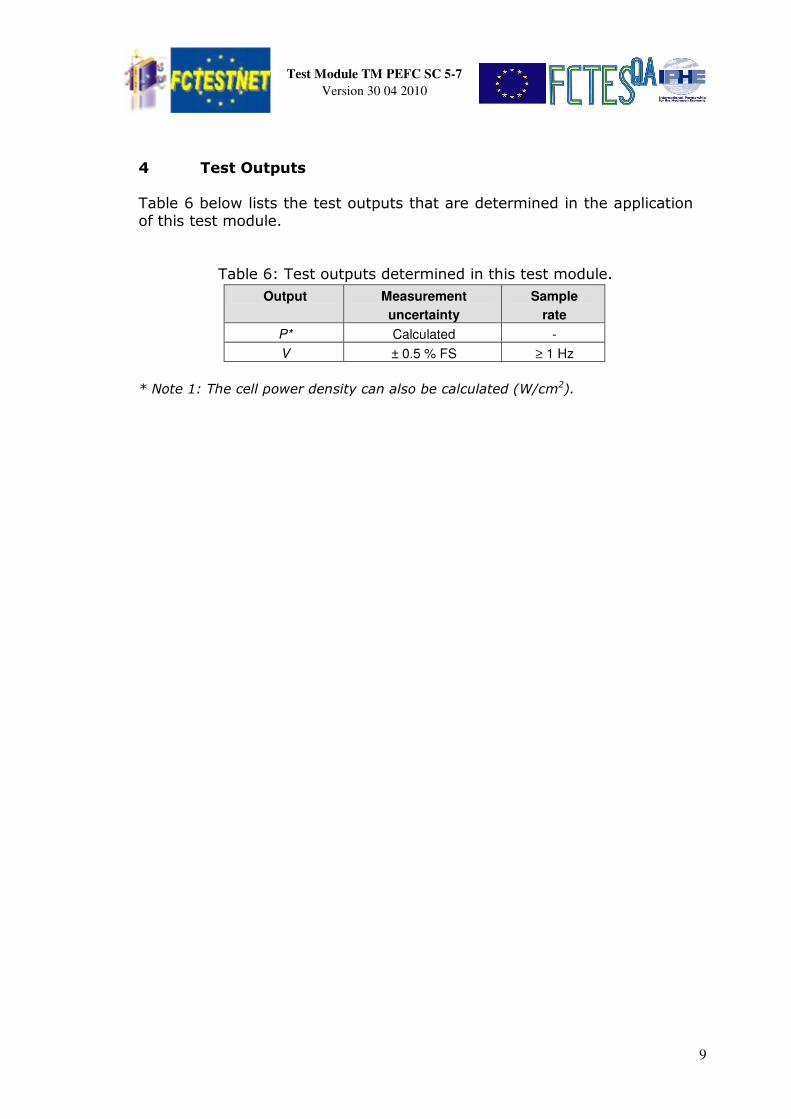
4 Test Outputs
Table 6 below lists the test outputs that are determined in the application of this test module.
Table 6: Test outputs determined in this test module.
Output Measurement
uncertainty
Sample
rate
P* Calculated -
V ± 0.5 % FS ≥ 1 Hz
* Note 1: The cell power density can also be calculated (W/cm2).
Test Module TM PEFC SC 5-7
Version 30 04 2010
10
5 References, required Documentation and Provisions
5.1 References
1. FCTESTNET Fuel Cells Glossary, EUR Report 22295 EN, Scientific and Technical Research Series, Office for Official Publications of the European Communities, Luxembourg, ISBN 92-79-02747-6, 2006.
2. Polarisation curve method (Test Module TM PEFC SC 5-2) and related specific test report template: FCTESQA_TR_TM_PEFC_SC_5--2_2010-05.doc - This test module describes the testing procedure to study the voltage of a single cell as a function of the current density and the test report template describes how to report all the needed information when this procedure has been applied.
3. IEC 62282-2 Ed.1: Fuel cell technologies – Part 2: Fuel cell modules. 4. The specific test report template: FCTESQA_TR_TM_PEFC_SC_5-
7_2010-05.doc - This test report template describes how to report all the needed information when this procedure has been applied.
5.2 Required documentation
The following are required: 1. Documentation (including installation and safety instructions) provided by the fuel cell test bench manufacturer or component manufacturers for a self-assembled test bench. 2. Calibration certificates of the fuel cell test bench instrumentation. These documents will be necessary to determine the actual uncertainty of the measurements of the test inputs and outputs and to check whether the requirements of this test module are met. 3. Test object or components documentation provided by the manufacturers including start-up, conditioning and shut-down procedures. 4. Safety instructions for the fuel cell.
5.3 Provisions
Standard local safety precautions for working with the fuels and oxidants used shall be followed.
Test Module TM PEFC SC 5-7
Version 30 04 2010
11
6 Test Equipment and Setup
This test procedure does not prescribe the type, geometry and size of the single cell. Materials, design, geometry and sizes of the MEA, monopolar plates and cell will have to be described in the test report (Cf. Appendix A). The performance measurement will need at least the test set-up and the sensors described or listed below in order to apply and measure the test inputs and outputs listed in sections 3 and 4.
6.1 Test set-up
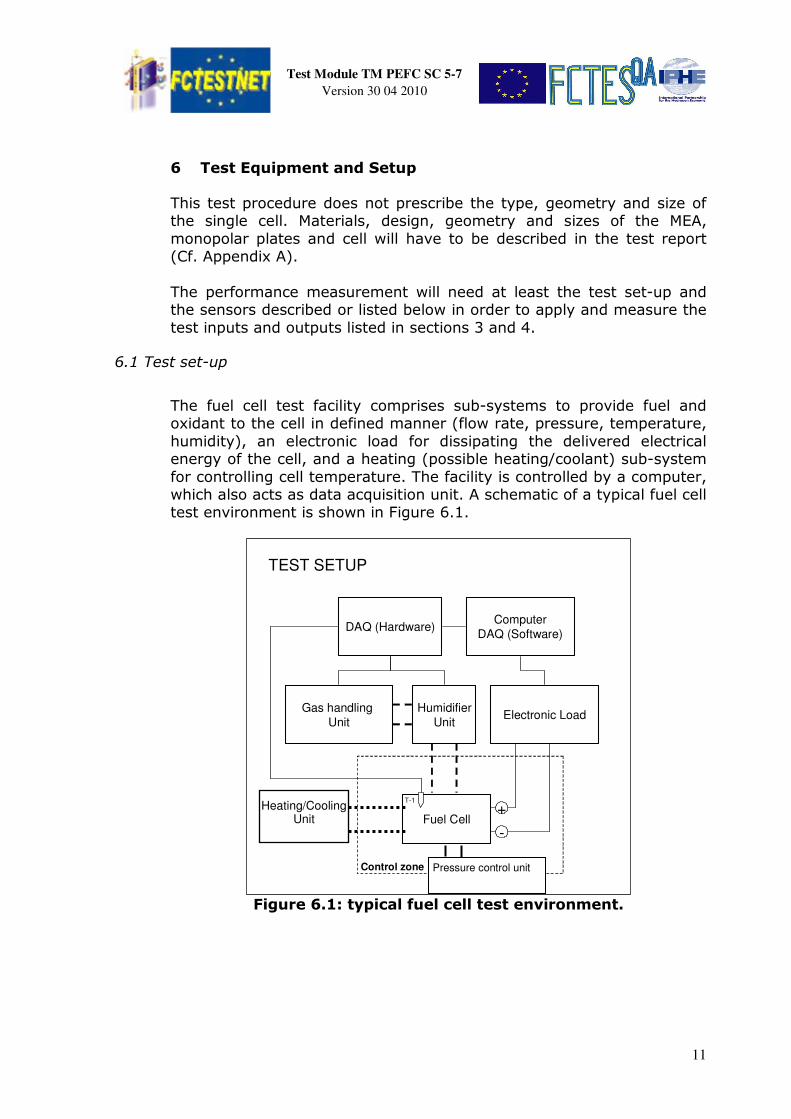
The fuel cell test facility comprises sub-systems to provide fuel and oxidant to the cell in defined manner (flow rate, pressure, temperature, humidity), an electronic load for dissipating the delivered electrical energy of the cell, and a heating (possible heating/coolant) sub-system for controlling cell temperature. The facility is controlled by a computer, which also acts as data acquisition unit. A schematic of a typical fuel cell test environment is shown in Figure 6.1.
Figure 6.1: typical fuel cell test environment.
Electronic Load
DAQ (Hardware)Computer
DAQ (Software)
Gas handling
Unit
Humidifier
Unit
Fuel Cell+
-
T-1
Control zone
Heating/Cooling Unit
TEST SETUP
Pressure control unit
Test Module TM PEFC SC 5-7
Version 30 04 2010
12
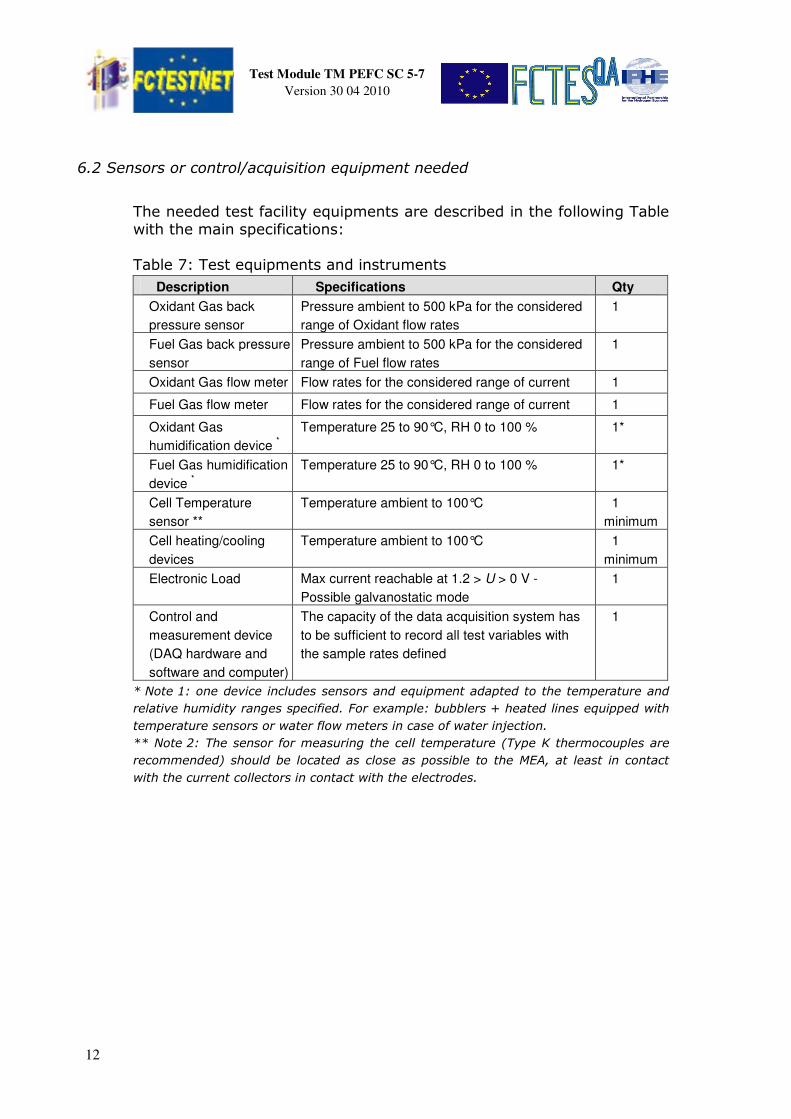
6.2 Sensors or control/acquisition equipment needed
The needed test facility equipments are described in the following Table with the main specifications: Table 7: Test equipments and instruments
Description Specifications Qty
Oxidant Gas back
pressure sensor
Pressure ambient to 500 kPa for the considered
range of Oxidant flow rates
1
Fuel Gas back pressure
sensor
Pressure ambient to 500 kPa for the considered
range of Fuel flow rates
1
Oxidant Gas flow meter Flow rates for the considered range of current 1
Fuel Gas flow meter Flow rates for the considered range of current 1
Oxidant Gas
humidification device *
Temperature 25 to 90°C, RH 0 to 100 % 1*
Fuel Gas humidification
device *
Temperature 25 to 90°C, RH 0 to 100 % 1*
Cell Temperature
sensor **
Temperature ambient to 100°C 1
minimum
Cell heating/cooling
devices
Temperature ambient to 100°C 1
minimum
Electronic Load Max current reachable at 1.2 > U > 0 V -
Possible galvanostatic mode
1
Control and
measurement device
(DAQ hardware and
software and computer)
The capacity of the data acquisition system has
to be sufficient to record all test variables with
the sample rates defined
1
* Note 1: one device includes sensors and equipment adapted to the temperature and
relative humidity ranges specified. For example: bubblers + heated lines equipped with
temperature sensors or water flow meters in case of water injection.
** Note 2: The sensor for measuring the cell temperature (Type K thermocouples are
recommended) should be located as close as possible to the MEA, at least in contact
with the current collectors in contact with the electrodes.
Test Module TM PEFC SC 5-7
Version 30 04 2010
13
7 Test Procedure
Note: Deviations from the following recommended procedure shall be described in the test
report.
The most important factor, regardless of conditioning procedure, is that the cell voltage be stable before the actual measurement step starts. A stability criterion can be defined based on the deviation of the fuel cell voltage measured over a fixed period of time. It is recommended that the variations in the cell voltage be lower than +/- 5 mV during the last hour before ending the conditioning step.
7.1 Step 1: Pre-conditioning of test object
The start-up of the fuel cell and conditioning step can be performed following one of these procedures: • proposed by the manufacturer of the test object, • proposed by the manufacturer of a fuel cell component, • the one that is common practice at the testing organisation, or • as recommended below (based on galvanostatic mode).
The test starts by bringing the operating conditions (inputs) to the values specified for the conditioning of the cell. The conditioning consists in keeping the previous conditions stable until the cell voltage reaches a stable value (normally corresponding to an optimized humidified state of the MEA electrolyte). The stabilisation of the conditions for the conditioning of the cell can be part of the start-up procedure. If this is not the case it is recommended to operate the cell in galvanostatic mode at the selected operating temperature and at the gas conditions of the paragraph 7.2, by increasing the current density by steps of 0.1 A/cm² while keeping the cell voltage higher than 0.5 V until reaching the current density identified for the conditioning. The current density for the conditioning of the cell will correspond either to the maximum current reachable at 0.5 V in the selected conditions or to a current density specified by the specific objective of the test. The conditioning step has to last at least 24h with a cell voltage variation of less than +/-5 mV in the last hour before starting the test. Note: this stability criterion can be reduced for specific conditions, depending on the test
objective, especially at high current densities where fluctuations of the cell voltage might
be observed. However it should be verified that the average cell voltage (averaged over 5
min) varies less than +/-5 mV in the last hour before starting the test.
Applied conditions and procedure for start-up, stabilisation and conditioning should be described in the test report (Cf. Appendix A).
Test Module TM PEFC SC 5-7
Version 30 04 2010
14
7.2 Step 2: Setting the test conditions (test inputs)
The test is under galvanostatic control with a load profile at fixed operating temperature and gas conditions. This step starts by setting the current density to i load max = i @ 100% Pmax
(Pmax is defined here as the maximum power to be used during normal operation and does not correspond necessarily to the real maximum being reachable by the fuel cell) and then the operating conditions to the values specified for the voltage measurement versus time (selected within the ranges specified). I load max = i @ 100% Pmax is the maximum current of the load during the cycling test and is defined as the current density corresponding to 100% of the maximum power to be delivered during normal operation by the fuel cell. This current density will be fixed at the initial value corresponding to the initial value of the Pmax. The Pmax has to be determined by a previous experiment according to specifications defined for the fuel cell or for the system by the end-users or the manufacturers. A first value of the cell voltage at i load max is measured when the operating conditions have all reached a stable value. The conclusion of the test referring to the qualification of the single cell tested will partially be based on this initial value.
7.3 Step 3: Measuring the test outputs
During the test the static test inputs (temperatures, relative humidity and pressures) are to be kept at the values selected within the ranges and with the accuracy specified. All the functional inputs and outputs are measured versus time.
7.3.1 Load cycling measurement step
The main objective is to determine the evolution of voltage on load in terms of V/hours when submitting the single cell to a specific load profile including low power and high power phases, respectively corresponding to two values of current densities identified as i load min and i load max. Since polarization curves will be performed at fixed intervals, it is possible to determine also the evolution of Open Circuit Voltage and of voltage at other power levels than the ones included in the cycle. An initial polarization curve has to be performed as described in the test module TM PEFC SC 5-2 after stabilization at i load max . After the initial polarization curve, the current density is fixed at iload max for a first high power phase of 10 minutes to stabilize the operating conditions before starting the dynamic cycling phase.
Test Module TM PEFC SC 5-7
Version 30 04 2010
15
Then the dynamic cycling phase has to be performed with the following current profile: • low power stationary phase = 40 seconds at i @ 20% Pmax A/cm² • high power dynamic phase = 20 seconds with an increase of i from i @ 20% Pmax to i @ 100% Pmax A/cm². Methods to apply technically these cycles, including particularly the way to increase the current density from i load min to i load max are recommended in Appendix B. The ageing test will include these dynamic cycling phases and polarization curves (as described in the test module TM PEFC SC 5-2). The polarization curves will be performed at fixed intervals corresponding to t max/10 where t max is the maximum duration of the test as defined by the specific objective of the test module: t max can be fixed between 500 and 10000 hours depending on the operating conditions and on the specific application considered. So the measurement step of the test will follow the sequence: • Initial polarization curve starting at t = 0 • Dynamic cycling phase n°1 • Polarization curve n°2 at t = t max/10 • Dynamic cycling phase n°2 • Polarization curve n°3 at t = 2 x t max/10 … • Dynamic cycling phase n°(n) • Polarization curve n°(n+1) at t = n x t max/10 with 1 ≤ n ≤ 10 The comparison of the final polarization curve with the initial one will be used to qualify the performance loss of the cell on the entire range of current density in order to analyse the causes of performance degradation if any.
Note: other characterizations using electrochemical methods like voltammetry and
electrochemical impedance spectroscopy can be applied during or before starting and after
the end of the cycling step in order to help understanding the performance evolution.
The duration of this step will be t max unless another ending criterion, defined according to either technical or security matter, is reached before. Apart from the fixed duration t max, other specific ending criteria can be specified by the test depending on the objective of the test like acceptable fixed performance losses (considering the power or the voltage at low or high power or the Open Circuit Voltage). Note: if the test module is used to characterize components life time, it is recommended
to apply the test module on several identical cells for different fixed durations in order to
analyse the components at different stages of ageing.
Test Module TM PEFC SC 5-7
Version 30 04 2010
16
End of test criterion: apart from ending criteria specifically defined, the test has to be stopped (gases, temperatures and load off) if the cell voltage goes below a pre-defined minimum voltage. It is recommended to use a minimum voltage of 0.5 V if the components under investigation should be used for further testing; for research purposes e.g. qualifying the life time and investigating the degradation processes a minimum voltage of 0.3 V is recommended to avoid irreversible damage of the cell components. As described in the test module PEFC SC 5-2, it is recommended to use a minimum voltage of 0.5 V for the polarization curves.
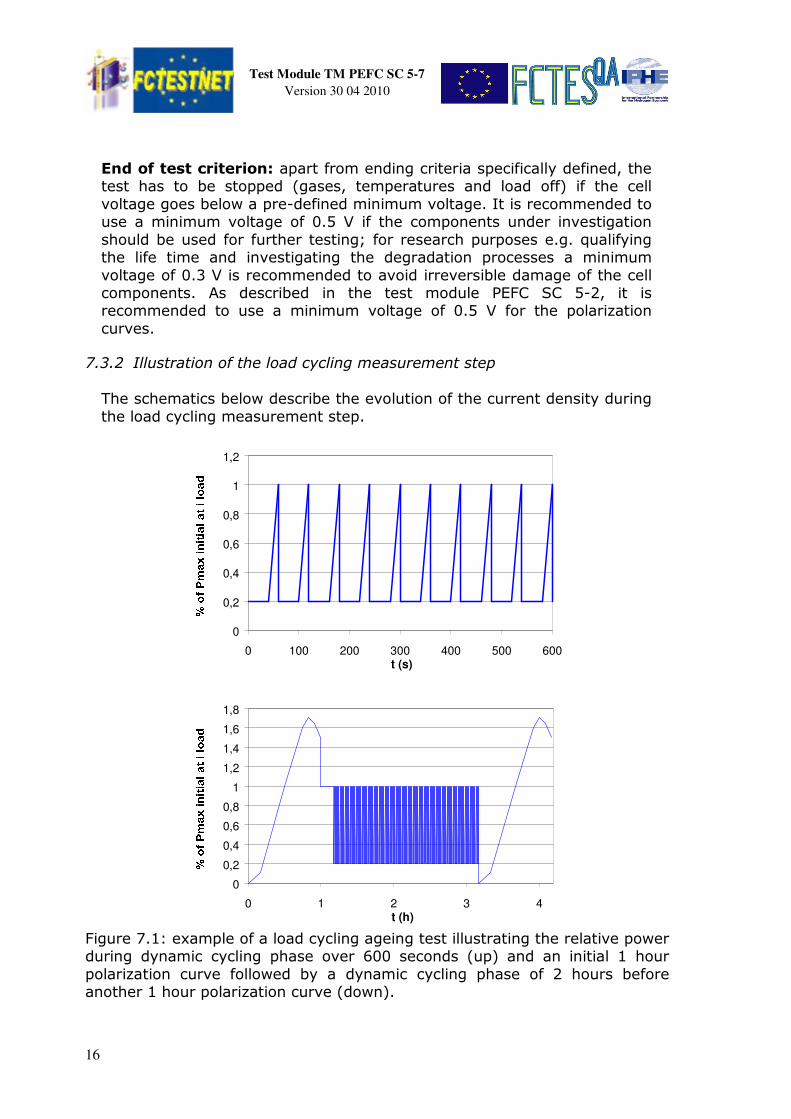
7.3.2 Illustration of the load cycling measurement step
The schematics below describe the evolution of the current density during the load cycling measurement step.
0
0,2
0,4
0,6
0,8
1
1,2
0 100 200 300 400 500 600t (s)
0
0,2
0,4
0,6
0,8
1
1,2
1,4
1,6
1,8
0 1 2 3 4t (h)
Figure 7.1: example of a load cycling ageing test illustrating the relative power during dynamic cycling phase over 600 seconds (up) and an initial 1 hour polarization curve followed by a dynamic cycling phase of 2 hours before another 1 hour polarization curve (down).
Test Module TM PEFC SC 5-7
Version 30 04 2010
17
7.4 Step 4: Data Post Processing
The evolution of the voltage over time is the main output of this test.
Note: If the test station does not allow for on-line data processing the amount of data
registered at a sampling rate of 1Hz might be too much for post-processing. If a sampling rate
lower than 1Hz during the long term measurements should be necessary make sure that at
least during the polarization curve the sampling rate of 1 Hz should be respected. It is also
recommended to use a higher sampling rate just before and after the polarization curves in
order to clearly identify their effect on performance. Actual data sampling rates should be given
in the test report.
The power density [P (W/cm²) = V (V) · i (A/cm²)] should be calculated as a further output for this test and will be calculated for all the measurement steps (polarization curves and cycling step).
The voltage deviations, ∆V, can be calculated at OCV (measured at the beginning of the polarization curves), and on load, over the complete duration of the cycling measurement step. These deviations can be used to evaluate a “performance progression rate” (normally a performance “degradation rate”) ∆VOCV/dt and ∆Viload/dt. These values will correspond to the slopes of the plots giving the voltages versus time.
The performance loss will be calculated in % at iload as follow:
• [Vinitial at i @ 20% Pmax – Vfinal at i @ 20% Pmax] / Vinitial at i @ 20% Pmax
• [Vinitial at i @ 100% Pmax – Vfinal at i @ 100% Pmax] / Vinitial at i @ 100% Pmax
• [Pinitial at i @ 20% Pmax – Pfinal at i @ 20% Pmax] / Pinitial at i @ 20% Pmax
• [Pinitial at i @ 100% Pmax – Pfinal at i @ 100% Pmax] / Pinitial at i @ 100% Pmax
7.5 Acceptance Criterion
To be specified by the user of this test module. Since the test module is to be used as a durability test, the acceptance criteria could be defined either as a maximum acceptable power loss over a fixed period or as a maximum acceptable voltage loss rate.

Test Module TM PEFC SC 5-7
Version 30 04 2010
18
Appendix A. Test information for test report
It is strongly recommended to use for test reporting, the specific test report template related to this procedure: PEFC Single Cell Test Report. Dynamic load cycling test report. File: FCTESQA_TR_TM_PEFC_SC5-7_2010-05.doc
Test Module TM PEFC SC 5-7
Version 30 04 2010
19
Appendix B. Methods to apply the load cycles
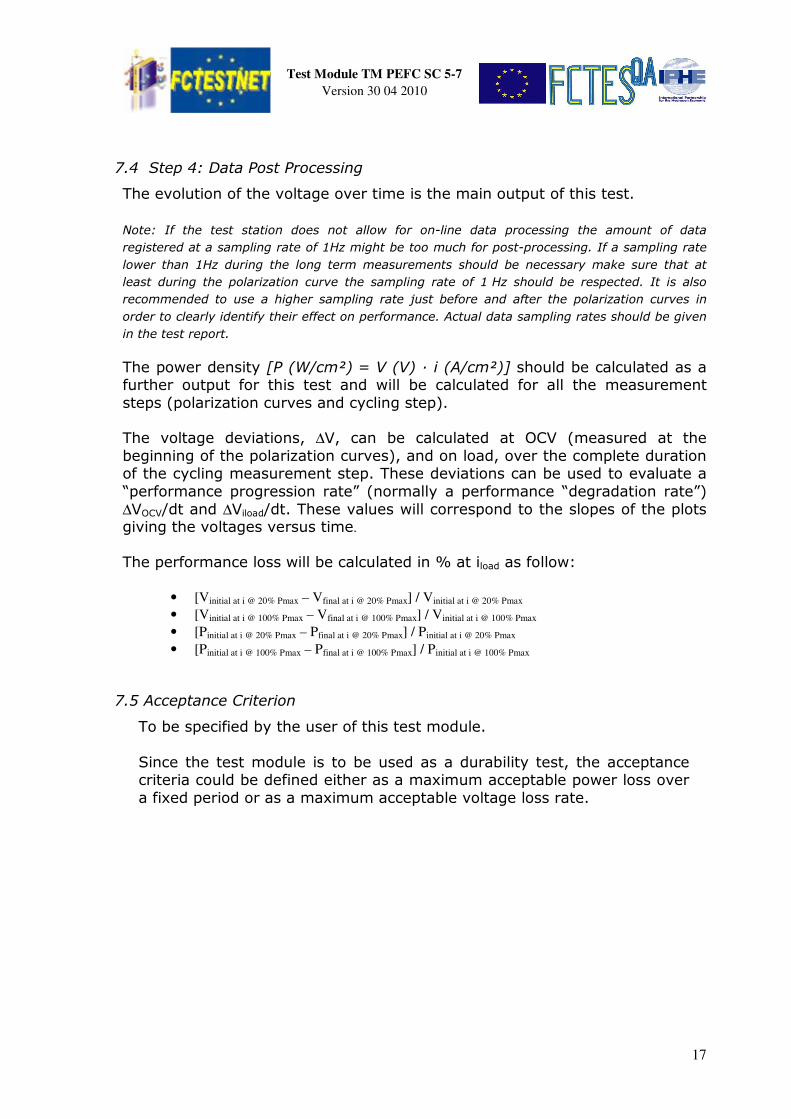
The load cycles are applied using galvanostatic control between two current densities corresponding to two levels of power density of the initial performance of the single cell. The aim of this appendix is to propose with more details the way to control the current density during the dynamic cycles. Two types of methods can be applied to control the current density between i load min and i load max: with fixed current densities steps or with a current density sweep at a fixed rate from i load min to i load max. Fixed current densities steps method
In this case, the current density is increased step by step. It is recommended to use regular steps with a dwell time fixed at 2 seconds for all steps, as illustrated in the figure below:
0%
20%
40%
60%
80%
100%
120%
0 20 40 60
Time (s)
% o
f i
loa
d m
ax
Test Module TM PEFC SC 5-7
Version 30 04 2010
20
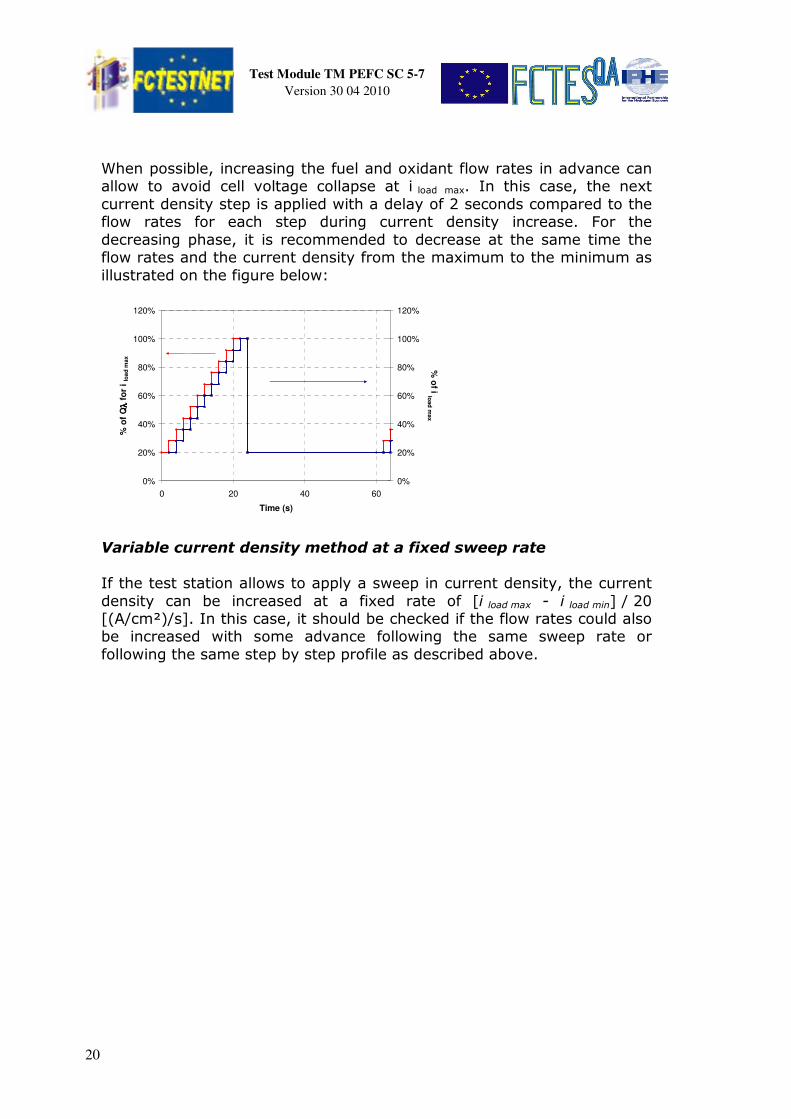
When possible, increasing the fuel and oxidant flow rates in advance can allow to avoid cell voltage collapse at i load max. In this case, the next current density step is applied with a delay of 2 seconds compared to the flow rates for each step during current density increase. For the decreasing phase, it is recommended to decrease at the same time the flow rates and the current density from the maximum to the minimum as illustrated on the figure below:
0%
20%
40%
60%
80%
100%
120%
0 20 40 60
Time (s)
% o
f Q
λλ λλ f
or
i lo
ad
max
0%
20%
40%
60%
80%
100%
120%
% o
f i load
max
Variable current density method at a fixed sweep rate
If the test station allows to apply a sweep in current density, the current density can be increased at a fixed rate of [i load max - i load min] / 20 [(A/cm²)/s]. In this case, it should be checked if the flow rates could also be increased with some advance following the same sweep rate or following the same step by step profile as described above.

Test Module TM PEFC SC 5-7
Version 30 04 2010
21

Test Module TM PEFC SC 5-7
Version 30 04 2010
22
Document Information
Version Change Date Status Text / revision by
30 04 2010 Initial release 30-04-2010 original FCTesQA PEFC team
Acknowledgements
This report is part of the efforts made by and the result of the support of many individuals
and organisations from the participating members of FCTESTNET and FCTESQA
.
The editors of this report together with the Ente per le Nuove tecnologie, l’Energia e
l’Ambiente (ENEA) acting as the administrative and financial coordinator of the FCTESQA
project, and the Joint Research Centre (JRC) of the European Commission acting as the
scientific coordinator of both projects would like to express their gratitude to the partners
of both projects that have greatly contributed to the development of the testing procedure
under the FCTESTNET thematic network and to the review of the procedure.
The funding by FP5 under contract # ENK5-CT-2002-20657 for FCTESTNET and by FP6
under contract # 020161 for FCTESQA
is appreciated by the project partners.


European Commission
EUR xxxxx EN – Joint Research Centre – Institute for Energy
Title: Testing the voltage and the power as a function of the current density following a
dynamic profile versus time (Dynamic load cycling ageing test for a PEFC single cell).
Test Module PEFC SC 5-7. Version 30 04 2010.
Author(s): T Malkow, G De Marco, A Pilenga, M Honselaar, G Tsotridis, S Escribano,
L Antoni, R Reissner, O Thalau, E Sitters, G Heinz
Luxembourg: Office for Official Publications of the European Union
2010 – 34 pp. – 21 x 29.7 cm
EUR – Scientific and Technical Research series – ISSN xxxx-xxxx
ISBN xxx-xx-xx-xxxxx-x
DOI xx.xxxx/xxxxx
Abstract
This report contains the Test Module TM PEFC SC 5-7 entitled “Testing the voltage
and the power as a function of the current density following a dynamic profile versus
time (Dynamic load cycling ageing test for a PEFC single cell)”. The module is a
general characterization method used in research and development of PEFC with no
target application. It may be used as a baseline measure to qualify fuel cells and its
components in any given application.
The Test Module was originally developed and compiled under the Research & Training
Network (RTN) FCTESTNET (Fuel Cell Testing and Standardisation). This project was
partly funded during 2003-2005 under contract # ENK5-CT-2002-20657 by the 5th
European Community Framework Programme on Research, Technological
Development and Demonstration (FP5).
However, the present version of the Test Module is the result of a review undertaken in
the frame of the FCTESQA
(Fuel Cell Systems Testing, Safety & Quality Assurance)
Specific Targeted Research Project (STREP). This project started in April 2006 with
funding provide in part under contract # 020161 by FP6. The Test Module is subject to
an experimental validation by means of a Round Robin Testing campaign conducted on
PEFC by the partners participating in Work Package 2 of FCTESQA
.


How to obtain EU publications
Our priced publications are available from EU Bookshop (http://bookshop.europa.eu),
where you can place an order with the sales agent of your choice.
The Publications Office has a worldwide network of sales agents. You can obtain their
contact details by sending a fax to (352) 29 29-42758.

The mission of the JRC is to provide customer-driven scientific and technical support for the
conception, development, implementation and monitoring of EU policies. As a service of the
European Commission, the JRC functions as a reference centre of science and technology for
the Union. Close to the policy-making process, it serves the common interest of the Member
States, while being independent of special interests, whether private or national.
LD
- NA
- 24
12
6- E
N- C


![Testing Testing [Read-Only] - Czone - East Sussex](https://static.fdokumen.com/doc/165x107/6327b2a26d480576770d6757/testing-testing-read-only-czone-east-sussex.jpg)