Experimental investigation and constitutive model for lime ...

ORIGINAL PAPER
Testing and Modeling the Short-Term Behavior of Limeand Fly Ash Treated Sulfate Contaminated CL Soil
Ahmed Mohammed . Cumaraswamy Vipulanandan
Received: 15 December 2013 / Accepted: 22 April 2015
� Springer International Publishing Switzerland 2015
Abstract In this study, the effects of calcium sulfate
contaminated soil treatment methods on the index
properties, compacted soil properties, free swelling and
compressive stress strain relationship of a CL soil
obtained from the field was investigated. Calcium
sulfate concentration in the soil was varied up to 4 %
(40,000 ppm) and the soil samples were cured for seven
days at 25 �C and 100 % humidity before testing. With
4 % sulfate contamination the liquid limit and plasticity
index of the soil increased by 44 and 81 % respectively.
The free swelling increased from 7 to 18 % and the
compressive strength decreased by 65 % with 4 % of
calcium sulfate, Also the study investigated the effects
of fly ash (class C) and hydrated lime treatment on the
behavior of treated sulfate soils. X-ray diffraction
(XRD)was used to characterize the soil and the reaction
products of lime and fly ash treated soils. Based onXRD
analyses,major constituents of theCL soilwere calcium
silicate (CaSiO3), aluminum silicate (Al2SiO5), magne-
sium silicate (MgSiO3) and quartz (SiO2). Addition of
calcium sulfate resulted in the formation of calcium
silicate sulfate [Ternesite Ca5(SiO4)2SO4] and alu-
minum silicate sulfate [Al5(SiO4)2SO4]. Treatment
with lime resulted in the formation of ettringite
[Ca6Al2(SO4)3(OH)12�26H2O]. Treating with fly
ash resulted in the formation of calcium silicate
hydrate (CaSiO3H2O) and magnesium silicate hydrate
(Mg3SiO3H2O), cementing by products. Contaminated
soil treatment with lime and fly ash reduced the index
properties and free swelling and increased the short-
term compressive strength of the soil. Behavior of the
compacted sulfate soils, with and without treatment,
has been quantified using a unique model that was used
to represent both linear and nonlinear responses. Also
the model predications were compared with other
published data in the literature. Compressive stress–
strain relationships of the sulfate soil, with and without
lime and fly ash, have been quantified using a nonlinear
constitutive model. The constitutive model parameters
were sensitive to the calcium sulfate content and the
type of treatment. Compared to the fly ash treatment,
the lime treatment reduced the strain at peak stress
making the lime treated soil more brittle.
Keywords Calcium sulfate � Free swelling �Compaction � Compressive strength � Lime � Fly ash
1 Introduction
In the past few decades, it has been reported that
sulfate rich soils have become a challenge in
A. Mohammed � C. Vipulanandan (&)
Center for Innovative Grouting Material and Technology
(CIGMAT), Texas Hurricane Center for Innovative
Technology (THC-IT), Department of Civil and
Environmental Engineering, University of Houston,
Houston, TX 77204-4003, USA
e-mail: [email protected]
A. Mohammed
e-mail: [email protected]
123
Geotech Geol Eng
DOI 10.1007/s10706-015-9890-8

engineering projects because of swelling and also
chemically attacking the construction materials such
as steel and concrete (Mitchell and Dermatas 1992;
Petry and Little 1992; Kota et al. 1996; Rollings et al.
1999; Puppala et al. 2002). Sulfate heave distress
problems have been reported in Texas, Nevada,
Louisiana, Kansas, Oklahoma, and Colorado where
lime, fly ash and cement have been traditionally used
to treat the natural soils rich in sulfates (Kota et al.
1996; Rollings et al. 1999).
Hunter (1988) indicated that lime treated sulphate
bearing clay is risky even at relatively low sulphate
concentrations. Based on short-term (1–30 days)
studies it has been observed that treating the sulfate
soils with calcium-based chemicals such as lime and
ordinary Portland cement has resulted in increased
heave (Mitchell and Dermatas 1992; Petry and Little
1992).
Bell (1996) studied the linear shrinkage of mont-
morillonite clay with different percentages of lime
additive and showed that the shrinkage decreased with
the addition of lime, but the decrease was not a linear.
The study also showed that the unconfined compres-
sion strength did not increase linearly with the addition
of lime and excessive addition of lime actually
reduced the strength. During this treatment, miner-
alogical and microstructural changes occurred, which
lowered the plasticity and also enhanced the load-
bearing capacity and enable soil compaction to higher
density. Arabani and Veis (2007) observed that any
increase in lime content beyond 6 % had a negligible
effect on the compressive strength of a treated CL soil.
However, an increase in lime content up to 6 percent
resulted in a noticeable increase in compressive
strength and the results reported are for 1 day of
curing. Reaction of lime with alumino-silicate in
clays, produced hydrated cementitious products that
bonded to the soil particles and the results reported are
for 7 and 28 days of curing (McCarthy et al. 2009).
During this treatment, mineralogical and microstruc-
tural changes occurred, which lowered the plasticity
and also enhanced the load-bearing capacity and
enable soil compaction to higher density. Ramesh
(2009) concluded that adding barium chloride to lime
treated soil prevented the formation of ettringite and
thaumasite in lime treated soils containing sulphate.
Cokca (2001) used low calcium and high calcium
fly ash to stabilize expansive CH soils. The study also
included comparison with lime and cement treated
soils. The results showed that a the soil treated with
20 % fly ash had nearly the same stabilizing effect on
the swelling potential as a soil treated with 8 % lime.
Nalbantoglu (2004) investigated the effectiveness of
class C fly ash as a stabilizer to expansive CH soils and
the results reported are for 28 days. This study showed
that the plasticity index of high plasticity soils was
reduced but the effect was minimal with low plastic
soils. The study also found that fly ash was an effective
method to reduce the swelling potential for one of the
tested soil but had adverse effects with other soils.
Little et al. (2010) stated that civil engineers are at
times required to stabilize sulfate-bearing clay soils
with calcium-based stabilizers. Deleterious heaving in
these stabilized soils may result over time. Recently,
the potential of polymer treatment on a sulfate CL soil
was investigated and the polymer was effective in
modifying the soil properties in less than a day
(Mohammed and Vipulanandan 2014).
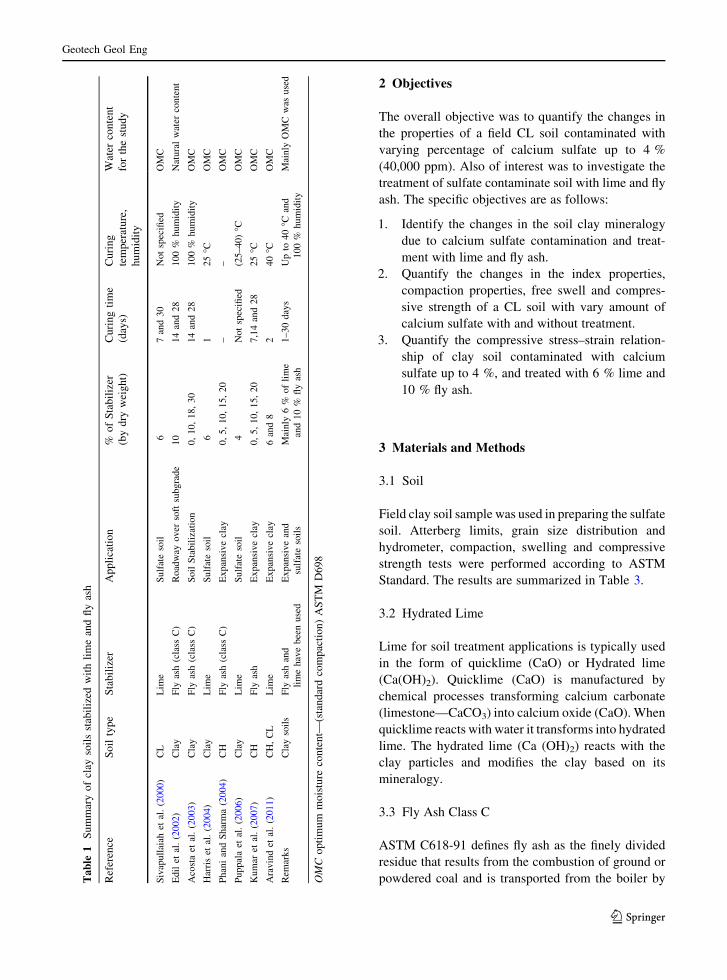
According to the studies summarized in Table 1
on clay soils stabilized with lime and fly ash, most of
the specimens were prepared and tested near opti-
mum moisture content (OMC %) from 1 to 30 days
of curing. Both 6 % lime and 10 % fly ash have been
used to treat the soil (Tables 1, 2). Calcium compo-
nents in the stabilizers such as lime, cement and fly
ash are known to react with free alumina and soluble
sulfates in the soils to form ettringite mineral a weak
sulfate mineral that will undergo significant heaving
when subjected to hydration. This heave, termed as
sulfate-induced heave in the literature, is known to
severely affect the performance of highways, run-
ways, parking lots, residential and industrial build-
ings, and other earth structures built on fly ash and
lime treated sulfate rich soils (Hunter 1988; Mitchell
and Dermatas 1992; Petry and Little 1992; Rajendran
and Lytton 1997; Rollings et al. 1999). The formation
of ettringite mineral (Ca6(Al(OH)6)2(SO4)326H2O) in
treated soils and its exposure to moisture variations
from seasonal changes result in differential heaving,
which in turn causes cracking of pavement struc-
tures built on the treated soils. If not addressed
immediately, this heave will further deteriorate the
structures to a condition where they need immediate
and extensive rehabilitation (Mitchell and Dermatas
1992; Petry and Little 1992). Hence there is a need
to develop relationships to quantify the effect of
calcium sulfate on the behavior of treated and
untreated soils.
Geotech Geol Eng
123
2 Objectives
The overall objective was to quantify the changes in
the properties of a field CL soil contaminated with
varying percentage of calcium sulfate up to 4 %
(40,000 ppm). Also of interest was to investigate the
treatment of sulfate contaminate soil with lime and fly
ash. The specific objectives are as follows:
1. Identify the changes in the soil clay mineralogy
due to calcium sulfate contamination and treat-
ment with lime and fly ash.
2. Quantify the changes in the index properties,
compaction properties, free swell and compres-
sive strength of a CL soil with vary amount of
calcium sulfate with and without treatment.
3. Quantify the compressive stress–strain relation-
ship of clay soil contaminated with calcium
sulfate up to 4 %, and treated with 6 % lime and
10 % fly ash.
3 Materials and Methods
3.1 Soil
Field clay soil sample was used in preparing the sulfate
soil. Atterberg limits, grain size distribution and
hydrometer, compaction, swelling and compressive
strength tests were performed according to ASTM
Standard. The results are summarized in Table 3.
3.2 Hydrated Lime
Lime for soil treatment applications is typically used
in the form of quicklime (CaO) or Hydrated lime
(Ca(OH)2). Quicklime (CaO) is manufactured by
chemical processes transforming calcium carbonate
(limestone—CaCO3) into calcium oxide (CaO). When
quicklime reacts with water it transforms into hydrated
lime. The hydrated lime (Ca (OH)2) reacts with the
clay particles and modifies the clay based on its
mineralogy.
3.3 Fly Ash Class C
ASTM C618-91 defines fly ash as the finely divided
residue that results from the combustion of ground or
powdered coal and is transported from the boiler byTable
1Summaryofclay
soilsstabilized
withlimeandflyash
Reference
Soiltype
Stabilizer
Application
%ofStabilizer
(bydry
weight)
Curingtime
(days)
Curing
temperature,
humidity
Water
content
forthestudy
Sivapullaiah
etal.(2000)
CL
Lim
eSulfatesoil
67and30
Notspecified
OMC
Edilet
al.(2002)
Clay
Fly
ash(class
C)
Roadway
over
softsubgrade
10
14and28
100%
humidity
Naturalwater
content
Acostaet
al.(2003)
Clay
Fly
ash(class
C)
SoilStabilization
0,10,18,30
14and28
100%
humidity
OMC
Harriset
al.(2004)
Clay
Lim
eSulfatesoil
61
25�C
OMC
PhaniandSharma(2004)
CH
Fly
ash(class
C)
Expansiveclay
0,5,10,15,20
––
OMC
Puppalaet
al.(2006)
Clay
Lim
eSulfatesoil
4Notspecified
(25–40)�C
OMC
Kumar
etal.(2007)
CH
Fly
ash
Expansiveclay
0,5,10,15,20
7,14and28
25�C
OMC
Aravindet
al.(2011)
CH,CL
Lim
eExpansiveclay
6and8
240�C
OMC
Rem
arks
Claysoils
Fly
ashand
limehavebeenused
Expansiveand
sulfatesoils
Mainly
6%
oflime
and10%
flyash
1–30days
Upto
40�C
and
100%
humidity
Mainly
OMC
was
used
OMCoptimum
moisture
content—
(standardcompaction)ASTM
D698
Geotech Geol Eng
123

flue gases. The physical and chemical characteristics
of fly ash vary greatly and mainly depend on the
combustion method, coal properties, and particle
shape of the fly ash. According to the literature, coal
from different sources will produce different combus-
tion products and these differences will influence the
effectiveness of fly ash as a soil stabilizer (Karim et al.
2011).
3.4 Test Methods
Soil was first dried in the oven at a temperature of
60 �C, crushed, pulverized and sieved to get sizes finerthan # 4 (0.075 mm) sieve. The pulverized soil was
then mixed with different percentage of calcium
sulfate and water. Soil samples were placed in
moisture tight bags and cured for 7 days at room
temperature before testing.
Four tests, Atterberg limits, compressive strength,
standard compaction and swell tests were conducted
on contaminated soil with different percentages (by
weight) of calcium sulfate up to 4 %. Sulfate soils
were treated separately with 6 % of lime and 10 % of
fly ash. Based on the compaction results, optimum
moisture content was used to prepare soil specimen for
the strength, swell and shrinkage tests. Cylindrical
specimens (1.400 dia. 9 2.800 length) were used for
UCS tests. After 7 days of curing, treated soil
specimens were subjected to unconfined compression
strength (UCS) and free swell tests.
3.4.1 XRD Analysis
AnX-ray diffraction (XRD) analyses was performed in
order to determine the effect of calcium sulfate
contaminated and treatment with lime and fly ash.
X-ray diffraction (XRD) was used to characterize the
field soil and reaction products of soilwith 4 %calcium
sulfate and treated contaminated soils with 6 % of lime
and 10 % of fly ash at 25 �C. The XRD pattern of the
particleswasobtainedbyusingSiemensD5000powder
X-ray diffraction (Jenkins and Snyder 1996) (Fig. 1).
Specimens for XRDwere prepared from air-dried soils
and ground with a mortar and pestle until the material
passed through sieve No. 200 (75 lm). The powder
(&2 g) was placed in an acrylic sample holder (3 mm)
Table 2 Literature review on sulfate soil stabilization using lime
Reference Soil type Lime (%) Sulfate content (ppm)
Mitchell (1986) Silty clay 4 Up to 15,000
Hunter (1988) Silty clay 4.5 43,500
Perrin (1992) Clays 5 2000–9000
Perrin (1992) Clays 6–9 % 14,000–25,000
Mitchell and Dermatas (1992) Sand mixed with 30 % clay content 3 3000–62,000
Rajasekaran et al. (1994) Marine clay with 52 % clay fraction 3 30,000
McCallister and Tidwell (1997) Expansive clays NA 2775
Sridhran et al. (1995) Black cotton soil 6 5000–30,000
Kota et al. (1996) Clayey subgrades 6–7 % [12,000
Burkart et al. (1999) Clays 6–9 % 233–18,000
Remarks Mainly clay soils Lime content varied
between 3 and 9 %
Sulfate content varied between
223 and 30,000 ppm (0.023–3 %)
Table 3 Test methods and physical properties of the CL soil
Property Test method Value
Passing sieve #200 (%) ASTM D 6913 64
Specific gravity ASTM D 854 2.66
LL (%) ASTM D 4318 40
PI (%) ASTM D 4318 19
OMC (%) (standard compaction) ASTM D 698 16.5
Max. dry density (g/cm3) ASTM D 698 1.52
Sand (%) ASTM D 6913 36
Silt (%) ASTM D 6913 45
Clay (%) ASTM D 6913 19
Free swelling (%) ASTM D 4546 7.0
Compressive strength (kPa) ASTM D 5102 573
Soil type ASTM D 2487 CL
Geotech Geol Eng
123
depth. All samples were analyzed by using parallel
beam optics with CuKa radiation at 40 kV and 30 mA.
Sampleswereground toafine textureusingamortarand
pestle andweremountedonplastic sample holders. The
average grain size of the soil crushed with an agate
mortar and pestle is expected to be in the 10–15 lmrange. All samples were scanned for reflections (2h)from 0� to 80� in steps of 0.02� and a 2 s count time per
step.
3.4.2 Free Swelling Test (FS)
The optimum water contents of clay soil con-
taminated with different percent of calcium sulfate
with and without 6 % lime and 10 % fly ash
treatment were determined by standard proctor tests
in accordance with ASTM D 698. For cyclic free
swelling tests, cylindrical samples were prepared at
optimum water content for the natural clay soil and
clay soil treated using 6 % lime and 10 % fly ash.
The swelling tests were carried out in the conven-
tional oedometer apparatus for natural soils and
treated soils using lime and fly ash. The consolida-
tion ring was pushed through the compacted soil
samples at optimum moisture content, using stan-
dard proctor and the extra material was carefully
trimmed in accordance with the ASTM Test
Method D 2435-96 to match the height of the
consolidation ring. The inside of the ring was
lubricated with silicone grease to minimize side
friction between the ring and the soil specimen.
After 7 days curing period at 100 % humidity and
25 �C temperature, the swelling tests were per-
formed based on ASTM D 4546. Filter papers were
placed on top and bottom of the soil specimen to
prevent finer particles from being forced into the
pores of the porous stones placed on both sides of
the specimen. Soils trimming were used to obtain
the moisture content data of the specimens before
start of the test. Each ring was weighed to cross
check the maximum dry unit weight. The specimens
were inundated with water and were allowed to
swell freely under 7 kPa (1psi) pressure. Free swell
measurements for first day were made at various
time intervals similar to that used for consolidation
test (ASTM D 4546-08). Each test was performed
for at least 7 days. Times versus swelling measure-
ments were then recorded. The percent free swell
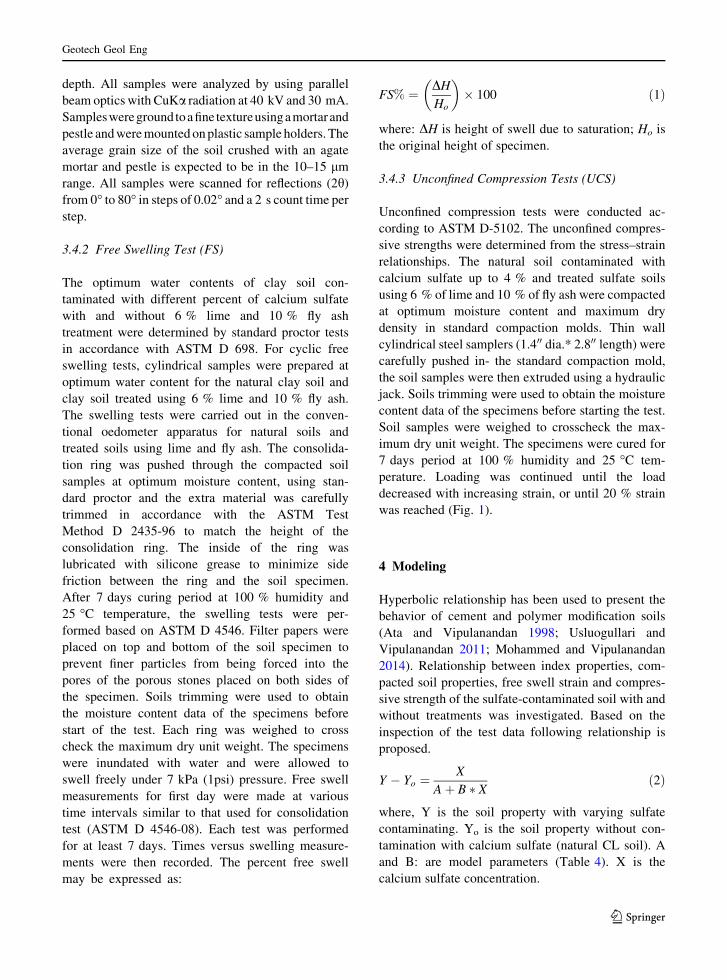
may be expressed as:
FS% ¼ DHHo
� �� 100 ð1Þ
where: DH is height of swell due to saturation; Ho is
the original height of specimen.
3.4.3 Unconfined Compression Tests (UCS)
Unconfined compression tests were conducted ac-
cording to ASTM D-5102. The unconfined compres-
sive strengths were determined from the stress–strain
relationships. The natural soil contaminated with
calcium sulfate up to 4 % and treated sulfate soils
using 6 % of lime and 10 % of fly ash were compacted
at optimum moisture content and maximum dry
density in standard compaction molds. Thin wall
cylindrical steel samplers (1.400 dia.* 2.800 length) werecarefully pushed in- the standard compaction mold,
the soil samples were then extruded using a hydraulic
jack. Soils trimming were used to obtain the moisture
content data of the specimens before starting the test.
Soil samples were weighed to crosscheck the max-
imum dry unit weight. The specimens were cured for
7 days period at 100 % humidity and 25 �C tem-
perature. Loading was continued until the load
decreased with increasing strain, or until 20 % strain
was reached (Fig. 1).
4 Modeling
Hyperbolic relationship has been used to present the
behavior of cement and polymer modification soils
(Ata and Vipulanandan 1998; Usluogullari and
Vipulanandan 2011; Mohammed and Vipulanandan
2014). Relationship between index properties, com-
pacted soil properties, free swell strain and compres-
sive strength of the sulfate-contaminated soil with and
without treatments was investigated. Based on the
inspection of the test data following relationship is
proposed.
Y � Yo ¼X
Aþ B � X ð2Þ
where, Y is the soil property with varying sulfate
contaminating. Yo is the soil property without con-
tamination with calcium sulfate (natural CL soil). A
and B: are model parameters (Table 4). X is the
calcium sulfate concentration.
Geotech Geol Eng
123

Fig. 1 XRD Pattern of: a natural CL soil. b Soil contaminated with 4 % calcium sulfate. c Soil contaminated with 4 % calcium sulfate
treated with 6 % of lime. d Soil contaminated with 4 % calcium sulfate treated with 10 % of fly ash
Geotech Geol Eng
123

Fig. 1 continued
Geotech Geol Eng
123

Based on the experimental results the trends were
either linear or nonlinear with the calcium sulfate
content. As shown in Fig. 2 relationship proposed in
Eq. 2 can be used to represent various linear and
nonlinear trends based on the values of the parameters
A and B. When parameters A and B are positive the
relationship was hyperbolic. Linear relationship is
represented by Eq. 2 when B = 0 and A will take any
value. When parameters A and B are negative the
inverse hyperbolic relationship is obtained.
5 Results and Analyses
5.1 XRD
The soil had calcium silicate (CaSiO3) (2h peaks at
26.33�, 35.12�, 36.20� and 73.53�), aluminum silicate
(Al2SiO5) (2h peaks at 39.55�, 57.19� and 60.09�),magnesium silicate (MgSiO3) (2h peak at 43.17�) andquartz (SiO2) (2h peaks at 14.02�, 20.92�, 27.98�,45.87�, 64.21�, 68.36� and 75.68�). Addition of 4 %
calcium sulfate modified the clay composition with the
formation of ternesite (Ca5(SiO4)2SO4) (2h peaks at
20.85�, 28.43� and 29.88�) and aluminum silicate
sulfate (Al5(SiO4)2SO4) (2h peaks at 40.03� and
60.09�) and merwinite (Ca3Mg(SiO4)2) (2h peak at
46.0�). XRD analyses also showed that the fly ash
class C composition was quartz (SiO2), mullite
(Al2O3SiO2), aluminum oxide (Al2O3), iron oxide
(Fe2O3), calcium silicate (Ca2SiO4) and magnesium
silicate (Mg2SiO4). The major quartz peaks were
found at 2h of 19.75�, 20.92�, 23.23�, 27.59� and
50.21�. The main mullite peaks were at 2h of 12.77�,31.21�, 35.16�, 55.12�, 60.09� and 63.83�. Duchesneand Reardon (1999) also reported mullite (Al2O3SiO2)
peak for fly ash in their study. Addition of lime to
Table 4 Model parameters
for treated and untreated
soils contaminated with
calcium sulfate
Treatment Soil property (Y) Figure Model parameters
Yo A B R2
Untreated LL 3a 40 0.04 0.05 0.94
PI 3b 19 0.04 0.06 0.92
OMC (%) 5a 17 0.21 0.20 0.95
cdmax. (g/cm3) 5b 1.52 -6.45 -9.18 0.92
Free swell (%) 9 7.0 0.094 0.065 0.95
Compressive strength (kPa) 11 553.6 -0.0019 -0.002 0.88
6 % Lime LL 3a 37 0.285 0.0 0.97
PI 3b 15.7 0.085 0.069 0.95
OMC (%) 5a 18.4 0.84 0.0 0.98
cdmax. (g/cm3) 5b 1.64 -14.48 -7.26 0.82
Free swell (%) 9 5.54 0.223 0.240 0.89
Compressive strength (kPa) 11 716 -0.003 -0.002 0.91
10 % Fly ash (C) LL 3a 31.5 0.282 0.0 0.92
PI 3b 12 0.079 0.044 0.94
OMC (%) 5a 20 0.802 0.0 0.95
cdmax. (g/cm3) 5b 1.59 -10.64 -9.278 0.94
Free swell (%) 9 5.85 0.181 0.172 0.91
Compressive strength (kPa) 11 807.4 -0.002 -0.002 0.96
Fig. 2 Modeling the linear and non linear responses of treated
sulfate soils
Geotech Geol Eng
123

sulfate contaminated soil resulted in the formation of
ettringite which is hydrous calcium aluminum sulfate
mineral [Ca6Al2(SO4)3(OH)12�26H2O)] (2h peaks at
9.01�, 22.06�, 27.62�, 35.04�, 37.45� and 75.48�),calcium silicate hydrate (CaH2O4Si) (2h peaks at
39.7�, 42.7� and 46.0�) and aluminum silicate hydrate
(AlSiO3H2O) (2h peak at 60.0�).
5.1.1 Liquid Limit (LL)
Additional of calcium sulfate to the natural CL soil
increased the liquid limit and the change was nonlinear
as shown in Fig. 3a. When the calcium sulfate content
in the soil was 4 %, the liquid limit increased from 40
to 57 % and can be attributed to the changes in the clay
mineralogy. The change in the LLwith calcium sulfate
concentration was represented using hyperbolic rela-
tionship Eq. (2) and the parameters A, B and Yo are
summarized in Table 4, and the coefficient of deter-
mination (R2) for the relationship was 0.94. Total of 19
data were collected from the literature and the liquid
limit varied from 31 to 73 % with a mean and standard
deviation of 52.3 % and 13.2 respectively. The
collected data from the literature are compared to the
model prediction and 47 % of these data located above
the model prediction as shown in Fig. 3. Addition of
6 % of lime and 10 % of fly ash to the sulfate soil with
4 % of calcium sulfate decreased the liquid limit by 12
and 22 % respectively. Linear trends were observed
between the LL and calcium sulfate concentration of
sulfate soils modified using 6 % of lime and 10 % of
fly ash (by dry weight) as shown in Fig. 4 (a). Fly ash
treatment showed greater reduction in LL than lime
treatment. The model parameters for lime and fly ash
treatment are summarized in Table 4 with parameter B
being zero and the coefficient of determination (R2)
were 0.97and 0.92 respectively.
5.1.2 Plasticity Index (PI)
Plasticity index of natural CL soil increased from 19 to
34 % by increasing calcium sulfate content to 4 %
because of the formation of calcium silicate sulfate
and aluminum silicate sulfate in the soil. Total of 17
data were collected from various research studies in
the literature and the plasticity index varied from 14 to
48 % with a mean and standard deviation of 22.2 and
11.3 respectively. About 65 % of the research data
located below the model prediction as shown in
Fig. 3b. Plasticity index of the natural soil contaminat-
ed with 4 % of calcium sulfate decreased by 25 and
16 % when the sulfate soil modified using 6 % of lime
and 10 % of fly ash (by dry weight) respectively as
shown in Fig. 4b. In this study, total of 21 soil samples
were tested. Hyperbolic relationship was used to relate
plasticity index to calcium sulfate concentration for
treated and untreated sulfate soil as shown in Fig. 4b.
The parameters A, B and Yo for untreated sulfate soil
and treated using 6 % of lime and 10 % of fly ash are
summarized in Table 4. The coefficients of determi-
nation (R2) for the hyperbolic relationships for
untreated and lime and fly ash treated sulfate soils
were 0.92, 0.95 and 0.94 respectively.
5.1.3 Compacted Soil
Optimum moisture content for the field CL soil
increased from 17 to 21.8 % when the calcium sulfate
concentration increased from 0 to 4 % as shown in
Fig. 5a. Total of 17 data on optimum moisture content
25
35
45
55
65
75
0 1 2 3 4 5
LL (%
)
Calcium Sulfate Concentra�on (%)
No. of Data=19
Sivapullaiah (2002) Puppala (2004)Harris (2004) Chakkrit (2008)Cerato (2011) Current StudyModel
10
15
20
25
30
35
40
45
50
0 1 2 3 4 5
PI (%
)
Calcium Sulfate Concentra�on (%)
No.of Data=17
Puppala (2004) Arvind (2007)Harris (2008) Chakkrit (2008)Cerato (2011) Current Study
(a) (b)
Fig. 3 Variations of index properties with calcium sulfate content. a Liquid limit (LL). b Plasticity Index (PI)
Geotech Geol Eng
123

(OMC) for sulfate contaminated soils from various
research studies were obtained and the mean and
standard deviation were 20 and 4.5 %respectively.
About 33 % of the literature data were located below
the model predication as shown in Fig. 5a. Additional
of 6 % lime and 10 % of fly ash (by dry weight) to the
sulfate soil with 4 % of calcium sulfate in the current
study increased the (OMC) by 6 and 12 % respectively
as shown in Fig. 6a. Linear trends were observed
between the (OMC %) versus calcium sulfate con-
centration for soils treated with 6 % of lime and 10 %
of fly ash (by dry weight) as shown in Fig. 5a and the
parameter B was zero. The model parameters A, B, Yo
and coefficient of determination (R2[ 0.9) for un-
treated sulfate soil and treated with 6 % of lime and
10 % of fly ash are summarized in Table 4.
As shown in Fig. 5b, when the calcium sulfate
concentration increased from 0 to 4 % the dry density of
the CL soil decreased by 7 %. Total of 16 data on
maximum dry density of calcium sulfate contaminated
soils were collected from the literature and themean and
standard deviation were 1.66 g/cm3 and 0.11 respec-
tively.All the data from the literaturewere located above
the results from the current study as shown in Fig. 5b. In
the current study, the maximum dry density of sulfate
soil with 4 % calcium sulfate concentration increased 7
and 6 % by using 6 % lime and 10 % of fly ash
respectively as shown in Fig. 6b. The model parameters
A, B, Yo and coefficient of determination for untreated
sulfate soil and treated with 6 % of lime and 10 % of fly
ash are summarized in Table 4.
5.1.4 Free Swelling (FS)
Total of 15 soil samples were tested in this study.
Percent of free swelling with time for the CL soil with
10
15
20
25
30
35
40
0 1 2 3 4 5
PI (%
)
Calcium Sulfate Concentra�on (%)
Field Soil 6% lime 10% Fly ash Model
20
25
30
35
40
45
50
55
60
65
0 1 2 3 4 5
LL (%
)
Calcium Sulfate Concentra�on (%)
Field Soil6% lime 10% Fly ash Model
(a) (b)
Fig. 4 Variations of Index properties of untreated and treated calcium sulfate soil with 6 % of lime and 10 % of fly ash. a Liquid limit
(LL). b Plasticity Index (PI)
1.2
1.3
1.4
1.5
1.6
1.7
1.8
1.9
2
Max
imum
Dry
Dens
ity(g
m/c
m3 )
No.of Data=16
Gerald (2000) Harris (2008)Michael (2011) Cerato (2011)McCarthy (2012) Current Study
12
14
16
18
20
22
24
26
28
0 1 2 3 4 50 1 2 3 4 5
Op�
mum
Moi
stur
eCo
nten
t(%
)
Calcium Sulfate Concentra�on (%) Calcium Sulfate Concentra�on (%)
No.of Data=17
Harris (2008) Michael (2011)Cerato (2011) McCarthy (2012)McCarthy (2012) Current StudyModel
(a) (b)
Fig. 5 Variations of compacted soil properties with calcium sulfate content. a Optimum moisture content (OMC). b Maximum dry
density
Geotech Geol Eng
123

different percentage of calcium sulfate are shown in
Fig. 7. Free swelling percent of natural CL soil
increased by 160 % when the calcium sulfate changed
from 0 to 4 % as shown in Fig. 7 because of changes in
the clay mineralogy. Free swelling versus calcium
sulfate concentrations were compared with the several
data from literature as shown in Fig. 8. About 50 % of
the literature data were located above the model
predication as shown in Fig. 8. Additional of 6 % of
lime and 10 % of fly ash decreased the free swelling at
4 % of calcium sulfate concentration by 53 and 46 %
respectively as shown in Fig. 9. Hyperbolic relation-
ship between the percentage of free swelling and
calcium sulfate concentration for untreated and treated
sulfate soils were observed as shown in Fig. 9. The
model parameters A, B and Yo are summarized in
Table 4 and the coefficient of determination (R2)
varied from 0.89 to 0.95.
5.1.5 Stress–Strain Relationship
Stress–strain relationships for untreated and treated
sulfate soils are shown in Fig. 10. With the increase in
sulfate content the unconfined compressive strength
and the initial modules of the treated and untreated
compacted soils decreased as shown in Fig. 10.
Total of 15 unconfined compression tests were
performed in this study. Compressive strength of the
CL soil used in the current study decreased by 65 %
when the calcium sulfate content was increased from 0
to 4 % as shown in Fig. 11. The variation of strength
with calcium sulfate content was represented using the
proposed model and the parameters are summarized in
Table 4. Additional of 6 % of lime and 10 % of fly ash
(by dry weight) to the sulfate soil with 4 % calcium
sulfate increased the 7 days cured unconfined com-
pressive strength by 130 and 120 % respectively as
shown in Fig. 11.
5.1.6 Stress–Strain Behavior Modeling
Soils are generally modeled as linear elastic, linear
elastic—perfectly plastic or as strain hardening mate-
rials. In this study the soil, with and without treatment,
exhibitored strain softening behavior as shown in
Fig. 10.
5.2 p–q Model
Based on experimental results, model proposed by
Mebarkia and Vipulanandan (1992), was used to
predict the stress–strain behavior of treated sulfate
contaminated CL soil with different percentage of
polymer solution (Eq. 3). The model is defined as
follows:
r ¼eec
qþ ð1� p� qÞ eec
� �þ p � e
ec
� �pþqp
0BB@
1CCA� rc ð3Þ
where, r = compressive strength, rc; ec = compres-
sive strength and corresponding strain, p,q = material
parameters.
16
18
20
22
24
26
0 1 2 3 4 5
Op�
mum
Moi
stur
e Co
nten
t (%
)
Calcium Sulfate Concentra�on (%)
Field Soil6% Lime10% fly ash Model
1.35
1.4
1.45
1.5
1.55
1.6
1.65
0 1 2 3 4 5
Max
imum
Dry
Den
sity
(gm
/cm
3 )
Calcium Sulfate Concentra�on (%)
Untreated Soil6% Lime10% Fly ash Model
(a) (b)
Fig. 6 Variations of compaction characteristics of treated soils with different calcium sulfate content. a Optimum moisture content
(OMC). b Maximum dry density
Geotech Geol Eng
123

Parameter q was defined as the ratio of secant
modulus at peak stress to initial tangent modulus.
Parameter p was obtained by minimizing the error in
the predicated stress–strain relationship. Hence, pa-
rameters p and q in (Eq. 3) were determined based on
the stress–strain behavior of sulfate soil treated with
6 % of lime and 10 % of fly ash and the values and
coefficient of determination (R2) are summarized in
Table 5. In the Fig. 10, the predicted values of
compressive strength for sulfate contaminated CL soil
0
2
4
6
8
10
12
14
16
18
20
0 2 4 6 8 10 12
Free
Sw
ellin
g (%
)
Time (Days)
Untreated Soil
0% 1% 2% 4%Calcium Sulfate Concentra�on
0
1
2
3
4
5
6
7
8
9
10
0 2 4 6 8
Free
Sw
ellin
g ( %
)
Time (Days)
6% Lime
Calcium Sulfate Concentra�on
(a) (b)
(c)
0
2
4
6
8
10
12
42 30 1 5 6 7 8
Free
Sw
ellin
g (%
)
Time(Days)
10% Fly Ash
Calcium Sulfate Concentra�on
0% 1% 2% 4%
0% 1% 2% 4%
Fig. 7 Free swell–time relationships. aUntreated calcium sulfate soil. bModified soil using 6 % of lime. cModified soil using 10 % of
fly ash
0
5
10
15
20
25
30
35
40
45
0 1 2 3 4 5 6
Free
Sw
ellin
g (%
)
Calcium Sulfate Concentra�on (%)
Li�le (2010)Cerato et al. (2011)McCarthy (2012)Current StudyModel
Fig. 8 Variation of free swell with calcium sulfate content
4
6
8
10
12
14
16
18
20
0 1 2 3 4 5
Free
Sw
ellin
g ( %
)
Calcium Sulfate concentration (%)
Free Swelling % at 7days
Untreated Soil6% Lime10% fly ashModel
Fig. 9 Variation of free swell of sulfate soil after 7 days of
curing with lime and fly ash stabilizer
Geotech Geol Eng
123

treated with 6 % lime are compared to the 10 % fly ash
treated soil. The lime treated soils were stronger than
fly ash treated soils. As summarized in Table 5 the
parameters p and q influence by sulfate content and the
method of treatment.
5.2.1 Parameter q
Parameter q represents the nonlinear behavior of the
material up to peak stress. For calcium sulfate
contaminated CL soil the parameter q was in the
range of 0.56–1.0 (Table 5). Treating the CL soil with
6 % lime and 10 % fly ash decreased the q parameter
to be in the range of 0.53–0.6 and 0.53–0.71 respec-
tively (Table 5).
5.2.2 Parameter p
For untreated soils the parameter p varied from 0.02 to
0.51. Soil treated with 6 % lime and 10 % fly ash the
parameter p varied from 0.2 to 0.65 and 0.07 to 0.22
respectively.
5.3 Failure Strain
The compressive strain at peak stress was affected by
the level of sulfate contamination and also the type of
0
100
200
300
400
500
600
700
0 0.5 1 1.5 2 2.5 3 3.5 4
Stre
ss (k
Pa)
Axial Strain (%)
Calcium Sulfate=0%
Calcium Sulfate=1%
Calcium Sulfate=4%
Model
0
100
200
300
400
500
600
700
800
900
0 0.5 1 1.5 2 2.5 3
Stre
ss (k
Pa)
Axial Strain (%)
Calcium Sulfate=0%
Calcium Sulfate=1%
Calcium Sulfate=4%
Model
(a)
(b)
0
100
200
300
400
500
600
700
800
0 0.5 1 1.5 2 2.5 3 3.5 4 4.5 5
Stre
ss (k
Pa)
Axial Strain (%)
Calcium Sulfate=0%
Calcium Sulfate=1%
Calcium Sulfate=4%
Model(c) 10% Fly Ash Treatment
Untreated Soil
6% Lime Treatment
Fig. 10 Compressive stress–strain relationship for a untreated sulfate soil, b treated sulfate soil with 6 % lime, c treated sulfate soil
with 10 % fly ash
0
100
200
300
400
500
600
700
800
900
0 1 2 3 4 5
Unc
onfin
ed C
ompr
essi
ve S
tren
gth
(kPa
)
Calcium Sulfate Concentra�on %
Untreated Soil6% Lime10% fly ash Model
Fig. 11 Variation of compressive strength with sulfate content
for untreated and treated sulfate contaminated CL soil
Geotech Geol Eng
123

treatment. Compared to the 10 % fly ash treatment
where failure strain was over 2.5 %, 6 % lime
treatment reduced the strain at failure stress to about
1.5 %.
5.4 Nonlinear Model (NLM) Parameters
The model parameters rc, ec, p and q were influenced
by the composition of the soil. It is being proposed to
relate the model parameters to the independent
variables [sulfate concentration (S%), lime (L%) and
fly ash (FA%)] using a nonlinear power relationship as
proposed by Demircan et al. (2011).
The effect of sulfate content, lime and fly ash were
separated as follows:
Model parameters ðrc; ec; p; qÞ¼ A0 þ a � ðSÞb þ c � ðLÞd þ e � ðFAÞf ð4Þ
where: Ao Initial model parameter for uncontaminated
and untreated soil (field soil). a, b, c, d, e, f, g and h are
the nonlinear model parameters.
The NLM parameters were obtained from multiple
regression analyses using the least square method. The
NLM model parameters are summarized in Table 6.
6 Conclusions
In this study the effect of sulfate content on a CL soil
was investigated. XRD analyses showed that the
composition of clay was calcium silicate (CaSiO3),
aluminum silicate (Al2SiO5), magnesium silicate
(MgSiO3) and quartz (SiO2). Addition of calcium
sulfate to the soil resulted in the formation of calcium
silicate sulfate (Ternesite) and aluminum silicate
sulfate. Over 140 tests were performed during this
study. Also data from the literature was compared to
the data from the current study. Based on the
experimental and analytical study on a sulfate con-
taminated CL soil with and without treatment follow-
ing conclusions are advanced.
1. Liquid limit of natural CL soil increased from 40
to 57 % with the addition of 4 % calcium sulfate
because of the modification of clay mineralogy.
Adding 6 % lime and 10 % fly ash to the 4 %
sulfate soil decreased the LL by 12 and 22 %
respectively.
2. Plasticity index of the CL soil increased by 79
with 4 % calcium sulfate content. The plasticity
index for 4 % sulfate contaminated soil was
Table 5 Stress–strain model parameters for sulfate soil treated using lime and fly ash
Calcium sulfate, S (%) Lime, L (%) Fly ash, FA (%) p–q Model parameter
rc (kPa) ec (%) p q R2
0 – – 573 2.77 0.22 0.69 0.99
1 – – 285 1.88 0.51 0.56 0.99
4 – – 196 3.72 0.02 1.0 0.99
0 6 – 810 1.33 0.22 0.53 0.97
1 6 – 533 1.49 0.47 0.60 0.98
4 6 – 450 1.94 0.65 0.58 0.98
0 – 10 715 2.69 0.22 0.53 0.99
1 – 10 494 3.10 0.41 0.64 0.99
4 – 10 433 3.81 0.07 0.71 0.97
Table 6 Nonlinear model parameters for sulfate contaminated CL soil treated with 6 % lime and 10 % fly ash
Model parameters Ao a b c d e f R2
rc (kPa) 573 -2.81 0.26 240 0.16 8.9 1.2 0.96
ec (%) 2.77 0.65 0.21 -0.37 0.01 7E-5 4.2 0.94
p 0.22 0.08 0.22 0.02 1.13 0.5 2.3 0.85
q 0.69 0.10 0.62 2E-4 1.13 3E-4 1.0 0.83
Geotech Geol Eng
123

reduced by 25 and 16 % when treated with 6 %
lime and 10 % fly ash respectively.
3. Addition of lime and fly ash increased the
maximum dry density and optimum moisture
content of the compacted sulfate soils.
4. Free swelling increased from 7 to 19 % with the
increase of calcium sulfate content from 0 to 4 %
because of the modification of the clay mineralogy.
Additional of 6 % lime and 10 % fly ash decreased
the free swelling percent to 9 and 10 % respectively
after 7 days of swelling measurement.
5. Compressive stress–strain relationship was af-
fected by sulfate content in the soil. Unconfined
compressive strength of the CL decreased with
increased sulfate content. Addition of 4 % calci-
um sulfate to the soil decreased the strength by
65 %. The unconfined compressive strength of
sulfate soils increased with 6 % lime and 10 % fly
ash.
6. The improvement in the soil strength due to lime
and fly ash treatments can be attributed to the
formation of calcium silicate hydrate as cement-
ing compound.
7. The hyperbolic model was effective in predicting
the changes in the sulfate contaminated CL soil
with and without treatment.
8. Lime treatment (6 %) showed much higher
enhancement in short-term strengths of sulfate
contaminated soils compared to 10 % fly ash
treatment. Also lime treatment reduced the com-
pressive strain at failure stress to 1.5 % compared
to fly ash treated soil of 2.5 %.
9. Nonlinear compressive stress–strain model was
used to predict the behavior of lime and fly ash
treated sulfate contaminated soils. The model
parameters were sensitive to the type of
treatment.
Acknowledgments This study was supported by the Center
for Innovative Grouting Materials and Technology (CIGMAT)
with funding from various industries and Underground
Construction Technology Association (UCTA). Sponsors are
not responsible for any of the findings.
References
Arabani M, Veis M (2007) Geomechanical properties of lime
stabilized clayey sands. Arab J Sci Eng 32(1B):11–25
Aravind P, Chittoori S, Puppala AJ (2011) Influence of miner-
alogy and plasticity index on the stabilization effectiveness
of expansive clays. Transp Res Rec 91–99
Ata A, Vipulanandan C (1998) Cohesive and adhesive proper-
ties of silicate grout on grouted—sand behavior. J Geotech
Geoenviron Eng 124(1):38–44
Acosta HA, Edil TB, Benson, CH (2003) Soil stabilization and
drying using fly ash. Geo Engineering Report No. 03-03,
Department of Civil and Environmental Engineering,
University of Wisconsin-Madison
Bell G (1996) Lime stabilization of clay minerals and soils. Eng
Geol 42:223–237
Burkart B, Goss CG, Kern PJ (1999) The role of gypsum in
production of sulfate-induced deformation of lime-stabi-
lized soils. Environ Eng Geosci 5(2):173–187
Cokca E (2001) Use of class C fly ashes for the stabilization of
an expansive soil. J Geotech Geoenviron Eng 127(7):568–
573
Demircan E, Harendra S, Vipulanandan C (2011) Artificial
neural network and nonlinear models for gelling time and
maximum curing temperature rise in polymer grouts.
J Mater Civil Eng 23(4):372–377
Duchesne J, Reardon EJ (1999) Lime treatment of fly ash:
characterization of leachate composition and solid/water
reactions. Waste Manag 19(3):221–231
Edil T, Bin-Shafique M, Tanyu B, Kim W-H, Senol A (2002)
Field evaluation of construction alternatives for roadway
over soft subgrade. Transportation Research Board,
Washington, DC, pp 36–48
Harris P, Tom S, Stephen S (2004) Hydrated lime stabilization
of sulfate-bearing soils in Texas. Texas Department of
Transportation, FHWA/TX-04/0-4240-2, pp 1–36
Hunter D (1988) Lime-induced heave in sulfate-bearing clay
soils. J Geotech Eng 114(2):150–167
Jenkins R, Snyder RL (1996) Introduction to X-ray powder
diffractometry. Wiley, New York
Karim R, Zain M, Jamil M, Lai C, Islam N (2011) Strength
development of mortar and concrete containing fly ash: a
review. Int J Phys Sci 6(17):4137–4153
Kota P, Hazlett D, Perri L (1996) Sulfate-bearing soils: prob-
lems with calcium based stabilizers. Transportation Re-
search Record 1546, Transportation Research Board,
Washington, DC, pp 62–69
Kumar A,Walia B, Bajaj A (2007) Influence of fly ash, lime, and
polyester fibers on compaction and strength properties of
expansive soil. J Mater Civil Eng ASCE 19(3):242–248
Little D, Syam N, Herbert B (2010) Addressing sulfate-induced
heave in lime treated soils. J Geotech Geoenviron Eng
ASCE 110–118
McCallister LD, Tidwell L (1997) Double lime treatment to
minimize sulfate-lime induced heave in expansive clays.
US Army Engineers, Waterways Experiment Station,
Vicksburg
McCarthy M, Csetenyi L, Sachdev A, Jones M (2009) Role of
fly ash in the mitigation of swelling in lime stabilized
sulfate—bearing soils. World of coal ash (WOCA) con-
ference, pp 1–18
Mebarkia S, Vipulanandan C (1992) Compressive behavior of
glass-fiber-reinforced polymer concrete. J Mater Civil Eng
4(1):91–105
Geotech Geol Eng
123
Mitchell JK (1986) Practical problems from surprising soil be-
havior. J Geotech Eng ASCE 112:259–289
Mitchell K, Dermatas D (1992) Clay soil heave caused by lime-
sulfate reactions. Innovations in uses for lime. ASTM STP
1135, American Society for Testing and Materials
(ASTM), Philadelphia, PA, pp 41–64
Mohammed A, Vipulanandan C (2014) Compressive and tensile
behavior of polymer treated sulfate contaminated CL soil.
J Geotech Geol Eng 32(1):71–83
Nalbantoglu Z (2004) Effectiveness of class C fly ash as an ex-
pansive soil stabilizer. Construct Build Mater 18:377–381
Perrin L (1992) Expansion of lime-treated clays containing
sulphates. In: Proceedings of the seventh international
conference on expansive soils, ASCE Expansive Soils
Research Council, New York, 1, pp 409–414
Petry M, Little D (1992) Update on sulfate-induced heaven
treated clays; problematic sulfate levels. Transportation
Research Record 1362, National Research Council,
Washington, DC, pp 51–55
Phani BR, Sharma RS (2004) Effect of fly ash on engineering
properties of expansive soils. J Geotech Geoenviron Eng
130(7):764–767
Puppala AJ, Kadam R, Madhyannapu R, Hoyos LR (2006)
Small-strain shear moduli of chemically stabilized sulfate-
bearing cohesive soils. J Geotech Geoenviron Eng 132(3):
322–336
Puppala AJ, Viyanant C, Kruzic. AP, Perrin L (2002) Evaluation
of a modified sulfate determination method for cohesive
soils. Geotech Test J 25(1):85–94
Rajasekaran G, Essaku S, Mathews PK (1994) Physico-chemi-
cal and mineralogical studies on Cochin marine clays.
Ocean Eng 21(8):771–780
Rajendran D, Lytton R (1997) Reduction of sulfate swell in
expansive clay subgrades in the Dallas district. Texas
Transportation Institute, Rep. No. TX-98/3929-1, Bryan,
TX, pp 1–159
Ramesh HN (2009) Effect of sulphate content in soils as a po-
tential geohazard. IGC 2009, Guntur, pp 976–979
Rollings R, Burkes J, Rollings M (1999) Sulfate attack on ce-
ment-stabilized sand. Geotech Geoenviron Eng 125(5):364–
372
Sivapullaiah P, Sridharan A, Ramesh HN (2000) Strength be-
havior of lime treated soils in the presence of sulphate. Can
Geotech J 37:1–10
Sridhran A, Sivapullaiah PV, Ramesh HN (1995) Consolidation
behavior of lime treated sulphatic soils. In: Proceedings
international symposium compression consolidation
clayey soils, Hiroshima, Japan, I, pp 183–188
Usluogullari O, Vipulanandan C (2011) Stress–strain behavior
and California bearing ratio of artificially cemented sand.
Test Eval ASTM 39(4):637–645
Geotech Geol Eng
123
Copyright © 2022 FDOKUMEN