Testbed architecture for generic, energy-aware evaluations and optimisations
6
Testbed architecture for generic, energy-aware evaluations and optimisations Alexander Kipp, Jia Liu, Tao Jiang, Jochen Buchholz, Lutz Schubert High Performance Computing Centre Stuttgart (HLRS) Stuttgart, Germany {kipp | liu | jiang | buchholz | schubert}@hlrs.de Micha vor dem Berge, Wolfgang Christmann Christmann Informationstechnik + Medien GmbH Ilsede, Germany {micha.vordemberge | wolfgang.christmann} @christmann.info Abstract - Worldwide data centers CO2 emissions are equivalent already to about the total airlines’ CO2 emissions and are expected to overcome the 40% of Total Cost of Ownership of worldwide IT by 2012. Data centre electricity consumption accounts for almost 2% of the world production and their overall carbon emissions are greater than both Argentina and the Netherlands. Since computing demand and electricity prices rise, posing new environmental concerns, and due to limited resources, energy consumption of IT systems and data centre energy efficiency are expected to become a priority for the industry. In particular within the HPC domain the continuously raising energy consumption is seen as a major issue to be addressed. Therefore, new approaches are required facing this challenging issue. In this paper, we are going to present the setup of a testbed architecture and realisation in order to enable the evaluation of a broad range of differing (infrastructure) environments whilst keeping the maintenance efforts as little as possible. Therefore, the presented testbed architecture allows for the best possible inspection of the entire testbed environment for evaluation issues, in particular with respect to the evaluation and comparison of the energy efficiency of different approaches and environmental settings. Keywords - Testbed architecture; Evaluation; Energy-Efficiency; High Performance Computing; Monitoring; Management. I. INTRODUCTION This paper is framed within the GAMES (Green Active Management of Energy in IT Service centers) project [4], which is targeting to develop methodologies, models, and tools to reduce the environmental impact of such systems. The focus of this paper is on a new approach taking into consideration the classification of the energy efficiency of HPC applications, by allowing for an effective monitoring solution of complex IT infrastructures enabling to analyse the according energy consumption in a fine-granular way, whilst keeping the affect of this monitoring processing as little as possible for the entire infrastructure. In particular within complex infrastructures with a large amount of compute nodes to be monitored these systems often are supervised just in a sporadic way in order to provide as much of the available compute power to the running applications and services. For this reason, common systems do typically not allow determining potential energy wasting since the according overview about the energy consumption of specific compute nodes, in particular in combination with the according executed applications, is missing. Within GAMES we already defined a set of so called "Layered Green Performance Indicators" [9] [6] to analyse the energy efficiency of applications and on actions that can be undertaken to save energy such as redundancy elimination from applications or better exploitation of middleware and processing infrastructures. Our set of Green Performance Indicators regards various system components (CPU, memory, I/O channels, and so on); once an energy leakage has been discovered through monitoring in one or more components, green actions allow one to (at least partially) remove or reduce this energy loss by reducing redundancies of data and processes, by adjusting the storage subsystem e.g., by running disks in slower mode, or by improving the rate of CPU usage, just to mention a few of several possibilities. The GAMES approach framing this paper proposes guidelines for designing and managing applications along the perspectives of energy awareness. The approach focuses on the following two aspects, with the ultimate goal of developing a new systematic scientific discipline in the area of Green Computing: a) the co-design of energy-aware information systems and their underlying services and IT service centre architectures in order to satisfy users requirements, performance, QoS, and context whilst addressing energy efficiency and controlling emissions. This is carried out through the definition of Green Metrics, enabling us to evaluate if and to what extent a given service and workload configuration will affect the IT resources footprint; b) the run-time management of IT Centre energy efficiency, which will exploit the adaptive behaviour of the system at run time, both at the application and IT architecture levels, considering the interactions of these two aspects in an overall unifying vision. In this paper, we are going to provide an overview of the GAMES testbed infrastructure allowing for the evaluation of complex IT infrastructures, in particular with respect to the according energy-efficiency of the hardware environment as well as the corresponding applications. We are furthermore introducing a fine-granular monitoring architecture of the according infrastructure whilst keeping the payload on the corresponding systems as little as possible, as well as allowing for the easy adaptation of the entire testbed with differing images and configurations. In particular the latter aspect allows the easy comparison of differing testbed setups. 103 INFOCOMP 2011 : The First International Conference on Advanced Communications and Computation Copyright (c) IARIA, 2011. ISBN: 978-1-61208-161-8
Transcript of Testbed architecture for generic, energy-aware evaluations and optimisations
Testbed architecture for generic, energy-aware evaluations and optimisations
Alexander Kipp, Jia Liu, Tao Jiang, Jochen
Buchholz, Lutz Schubert
High Performance Computing Centre Stuttgart (HLRS)
Stuttgart, Germany
{kipp | liu | jiang | buchholz | schubert}@hlrs.de
Micha vor dem Berge, Wolfgang Christmann
Christmann Informationstechnik + Medien GmbH
Ilsede, Germany
{micha.vordemberge | wolfgang.christmann}
@christmann.info
Abstract - Worldwide data centers CO2 emissions are
equivalent already to about the total airlines’ CO2 emissions
and are expected to overcome the 40% of Total Cost of
Ownership of worldwide IT by 2012. Data centre electricity
consumption accounts for almost 2% of the world production
and their overall carbon emissions are greater than both
Argentina and the Netherlands. Since computing demand and
electricity prices rise, posing new environmental concerns, and
due to limited resources, energy consumption of IT systems
and data centre energy efficiency are expected to become a
priority for the industry. In particular within the HPC domain
the continuously raising energy consumption is seen as a major
issue to be addressed. Therefore, new approaches are required
facing this challenging issue. In this paper, we are going to
present the setup of a testbed architecture and realisation in
order to enable the evaluation of a broad range of differing
(infrastructure) environments whilst keeping the maintenance
efforts as little as possible. Therefore, the presented testbed
architecture allows for the best possible inspection of the entire
testbed environment for evaluation issues, in particular with
respect to the evaluation and comparison of the energy
efficiency of different approaches and environmental settings.
Keywords - Testbed architecture; Evaluation; Energy-Efficiency;
High Performance Computing; Monitoring; Management.
I. INTRODUCTION
This paper is framed within the GAMES (Green Active Management of Energy in IT Service centers) project [4], which is targeting to develop methodologies, models, and tools to reduce the environmental impact of such systems. The focus of this paper is on a new approach taking into consideration the classification of the energy efficiency of HPC applications, by allowing for an effective monitoring solution of complex IT infrastructures enabling to analyse the according energy consumption in a fine-granular way, whilst keeping the affect of this monitoring processing as little as possible for the entire infrastructure. In particular within complex infrastructures with a large amount of compute nodes to be monitored these systems often are supervised just in a sporadic way in order to provide as much of the available compute power to the running applications and services. For this reason, common systems do typically not allow determining potential energy wasting since the according overview about the energy consumption of specific compute nodes, in particular in combination with the according executed applications, is missing.
Within GAMES we already defined a set of so called "Layered Green Performance Indicators" [9] [6] to analyse the energy efficiency of applications and on actions that can be undertaken to save energy such as redundancy elimination from applications or better exploitation of middleware and processing infrastructures. Our set of Green Performance Indicators regards various system components (CPU, memory, I/O channels, and so on); once an energy leakage has been discovered through monitoring in one or more components, green actions allow one to (at least partially) remove or reduce this energy loss by reducing redundancies of data and processes, by adjusting the storage subsystem e.g., by running disks in slower mode, or by improving the rate of CPU usage, just to mention a few of several possibilities.
The GAMES approach framing this paper proposes guidelines for designing and managing applications along the perspectives of energy awareness. The approach focuses on the following two aspects, with the ultimate goal of developing a new systematic scientific discipline in the area of Green Computing:
a) the co-design of energy-aware information systems and their underlying services and IT service centre architectures in order to satisfy users requirements, performance, QoS, and context whilst addressing energy efficiency and controlling emissions. This is carried out through the definition of Green Metrics, enabling us to evaluate if and to what extent a given service and workload configuration will affect the IT resources footprint;
b) the run-time management of IT Centre energy efficiency, which will exploit the adaptive behaviour of the system at run time, both at the application and IT architecture levels, considering the interactions of these two aspects in an overall unifying vision.
In this paper, we are going to provide an overview of the GAMES testbed infrastructure allowing for the evaluation of complex IT infrastructures, in particular with respect to the according energy-efficiency of the hardware environment as well as the corresponding applications.
We are furthermore introducing a fine-granular monitoring architecture of the according infrastructure whilst keeping the payload on the corresponding systems as little as possible, as well as allowing for the easy adaptation of the entire testbed with differing images and configurations. In particular the latter aspect allows the easy comparison of differing testbed setups.
103
INFOCOMP 2011 : The First International Conference on Advanced Communications and Computation
Copyright (c) IARIA, 2011. ISBN: 978-1-61208-161-8
Therefore, we are going to provide an overview of the architecture of our flexible testbed environment in Section II. In Section III we are giving an overview about the technical details of our testbed environment, and, in particular, of our monitoring approach. Details about the extractable monitoring information are given in Section IV. Finally, conclusions are given in Section V.
II. TESTBED ARCHITECTURE
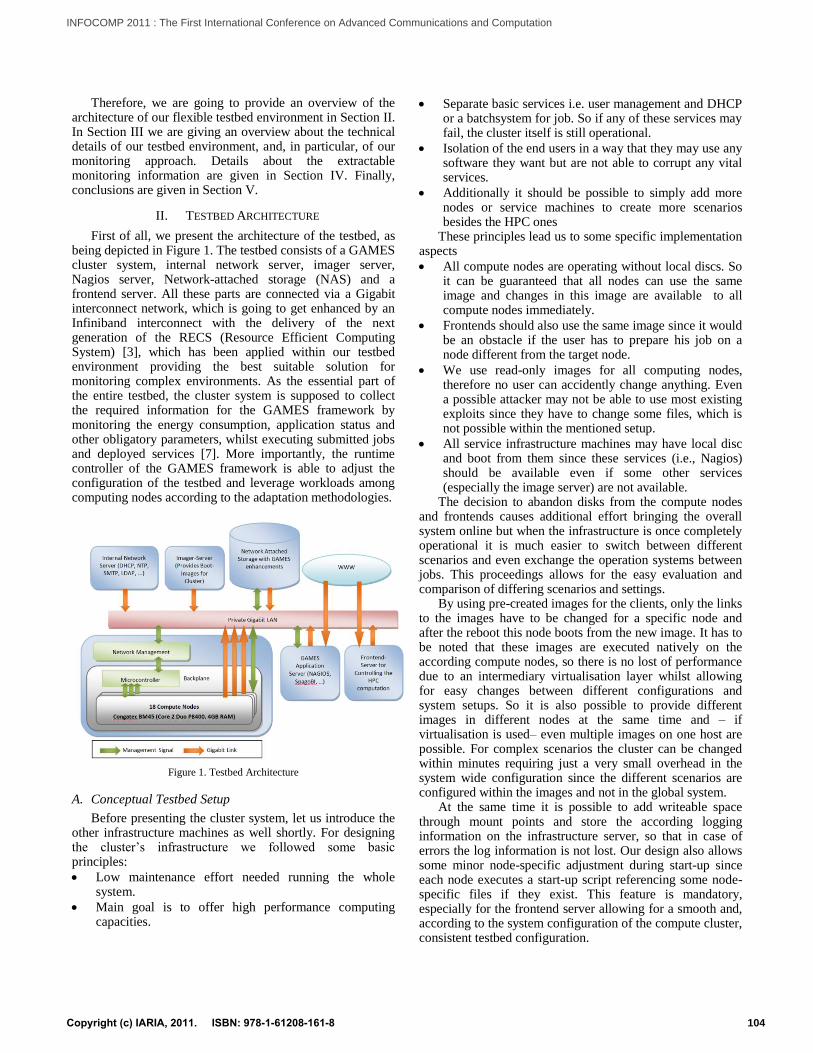
First of all, we present the architecture of the testbed, as being depicted in Figure 1. The testbed consists of a GAMES cluster system, internal network server, imager server, Nagios server, Network-attached storage (NAS) and a frontend server. All these parts are connected via a Gigabit interconnect network, which is going to get enhanced by an Infiniband interconnect with the delivery of the next generation of the RECS (Resource Efficient Computing System) [3], which has been applied within our testbed environment providing the best suitable solution for monitoring complex environments. As the essential part of the entire testbed, the cluster system is supposed to collect the required information for the GAMES framework by monitoring the energy consumption, application status and other obligatory parameters, whilst executing submitted jobs and deployed services [7]. More importantly, the runtime controller of the GAMES framework is able to adjust the configuration of the testbed and leverage workloads among computing nodes according to the adaptation methodologies.
Figure 1. Testbed Architecture
A. Conceptual Testbed Setup
Before presenting the cluster system, let us introduce the other infrastructure machines as well shortly. For designing the cluster’s infrastructure we followed some basic principles:
Low maintenance effort needed running the whole system.
Main goal is to offer high performance computing capacities.
Separate basic services i.e. user management and DHCP or a batchsystem for job. So if any of these services may fail, the cluster itself is still operational.
Isolation of the end users in a way that they may use any software they want but are not able to corrupt any vital services.
Additionally it should be possible to simply add more nodes or service machines to create more scenarios besides the HPC ones
These principles lead us to some specific implementation aspects
All compute nodes are operating without local discs. So it can be guaranteed that all nodes can use the same image and changes in this image are available to all compute nodes immediately.
Frontends should also use the same image since it would be an obstacle if the user has to prepare his job on a node different from the target node.
We use read-only images for all computing nodes, therefore no user can accidently change anything. Even a possible attacker may not be able to use most existing exploits since they have to change some files, which is not possible within the mentioned setup.
All service infrastructure machines may have local disc and boot from them since these services (i.e., Nagios) should be available even if some other services (especially the image server) are not available.
The decision to abandon disks from the compute nodes and frontends causes additional effort bringing the overall system online but when the infrastructure is once completely operational it is much easier to switch between different scenarios and even exchange the operation systems between jobs. This proceedings allows for the easy evaluation and comparison of differing scenarios and settings.
By using pre-created images for the clients, only the links to the images have to be changed for a specific node and after the reboot this node boots from the new image. It has to be noted that these images are executed natively on the according compute nodes, so there is no lost of performance due to an intermediary virtualisation layer whilst allowing for easy changes between different configurations and system setups. So it is also possible to provide different images in different nodes at the same time and – if virtualisation is used– even multiple images on one host are possible. For complex scenarios the cluster can be changed within minutes requiring just a very small overhead in the system wide configuration since the different scenarios are configured within the images and not in the global system.
At the same time it is possible to add writeable space through mount points and store the according logging information on the infrastructure server, so that in case of errors the log information is not lost. Our design also allows some minor node-specific adjustment during start-up since each node executes a start-up script referencing some node-specific files if they exist. This feature is mandatory, especially for the frontend server allowing for a smooth and, according to the system configuration of the compute cluster, consistent testbed configuration.
104
INFOCOMP 2011 : The First International Conference on Advanced Communications and Computation
Copyright (c) IARIA, 2011. ISBN: 978-1-61208-161-8
Taking all this into account we have designed a testbed architecture allowing for the required flexibility whilst considering the monitoring of the entire testbed environment in a fine-granular way. In particular the latter aspect is quite important for evaluation testbeds in order to afford for detailed evaluations of the according executed tests. Within this architecture, the Frontend Server offering worldwide access for end users. On these hosts the users are enabled to prepare their jobs, compile their sources, upload data and submit their jobs in the first place. Later on there might be a cloud frontend where they can deploy their services or compute jobs. The frontend server is used by all logged in users to work in shared mode so that the processing speed depends on the activity of other users at the same time. This implies that the frontend server is not designed to be used for intense computing, but only for preparing and testing.
The computation jobs are executed on the Compute Nodes where the user’s jobs are scheduled by a batch systems so that only one user uses a node at a time – at least for the HPC scenario. In a cloud scenario this might be different. Details about the compute nodes and especially the monitoring are described in the following.
Since the frontend and compute nodes are diskless we use a Network attached Storage (NAS) to provide storage capabilities in several ways. Therefore, all diskless nodes mount their root directory from the NAS server. Additionally the home directory of all users is provided to all nodes by the NAS server via the NFS protocol. In practise it might happen that many users do not care about their data after they finished their jobs and so the storage capacity will soon be reached. In order to avoid this, we restrict the space in the home directories and introduce workspaces which have a limited lifetime. This allows us to ensure that the users have enough storage for their jobs and the space will be freed again after they finished saving their data, so the users are taken into responsibility to decide which data is sensible to be stored for later usage, and which data is just of temporary nature (e.g., intermediary results of a simulation process), which can be erased after a specific period of time.
The above mentioned systems are the main parts of the system visible to the user. However, in order to handle and manage the entire testbed environment, a dedicated Infrastructure Server has been set up controlling the entire cluster. This server provides DHCP and acts as a log host for the diskless clients, account management, a batchsystem and scheduler for the HPC scenario, a SMTP Gateway so that any node – especially GAMES services and monitoring, can send eMail-notifications. So this server is the critical part in running the cluster and therefore no other services should be deployed on it to ensure a smooth operation of the infrastructure.
For additional services, test environments, etc. we installed an additional server – the GAMES Server - where currently Nagios as well as the according GAMES infrastructure components are installed in order to collect the desired monitoring information, compute the according metrics including power consumption and temperature to built the database on which decisions can be made on how the nodes should be used to reduce the energy footprint, as
well as the GAMES runtime environment allowing for adaptive actions in order to optimise the entire energy consumption of the testbed cluster [8].
Finally, within our testbed architecture we considered an Imager server which is used to update / create images without interference to the other systems. Therefore this imager server mounts a copy of the old image in read-write mode and after the new image is ready all nodes can mount the new image in read-only mode. This imager can be also one of the compute nodes but to provide a constant number of compute nodes we do this on a dedicated machine.
This concept allows us to create images in parallel to the working environment, distribute these images to the compute nodes – not necessarily the same for all nodes – and control these nodes from a central point, namely the infrastructure server. In the same way we can add additional frontends of services on the same host to be accessed from the outside.
B. Enhanced Monitoring Infrastructure
In order to evaluate the described testbed in operation, a fine-grained monitoring solution has been developed allowing a detailed inspection of the entire testbed. In order not to influence the evaluation results by bothering the testbed environment with the according monitoring actions, a new monitoring infrastructure was evaluated within a research project funded by the German federal ministry for economy and technology [11], in which the University of Paderborn and Christmann designed the RECS [3]. The concept of this monitoring approach is to reduce network load, avoid the dependency of polling every single compute node at operation system layer and build up a basis on which new monitoring- and controlling-concepts can be developed. For these needs there is an especially designed central backplane for the RECS with an integrated master-slave system of microcontrollers.
The status of each compute node within the GAMES test cluster is connected to an additional independent microcontroller in order to manage the measured data. The main advantage of the RECS system is to avoid the potential overheads caused by measuring and transferring data, which would consume lots of computing capabilities, in particular in a large-scale environment this approach can play a significant role. On the other hand, the microcontrollers also consume additional energy. Comparing with the potential saved energy, it is expected that the additional energy consumption could be neglected. This microcontroller-based monitoring architecture is accessible to the user by a dedicated network port and has to be read out only once to get all information about the installed computing nodes. If a user monitors e.g., 10 metrics on all 18 nodes, he would have to perform 180 pulls which can now be reduced to only one, because the master does a pre-aggregation and processing of the monitoring data. This example shows the immense capabilities of a dedicated monitoring architecture. Further technical details are provided within the following section.
In order to allow for the monitoring of the energy consumption of the infrastructure servers, an external power meter has been installed in the environment as well, following a similar type of microcontroller based
105
INFOCOMP 2011 : The First International Conference on Advanced Communications and Computation
Copyright (c) IARIA, 2011. ISBN: 978-1-61208-161-8
architecture is used for the power meter. The power meter is a CLM5-IP-P from Christ Elektronik and can monitor five single power lines, two thermal sensors, as well as some additional digital signals. All these information can be read out with the help of a self developed Nagios plugin with only one pull. Further technical details are described in the GAMES Deliverable D5.4 in section 2 [5].
III. TECHNICAL TESTBED REALISATION
The cluster server consists of 18 single PCs. The mainboards of the current RECS are COM Express based Congatec BM45 modules with an Intel P8400 CPU (2x 2.26 GHz, 1066 MHz FSB) and 4GB DDR3 Dual Channel RAM, each mounted on a baseboard which makes it possible to use almost every available COM Express mainboard. With the availability of the new Sandy Bridge architecture from Intel for COM Express the computing nodes could be scaled up to Quadcore i7 with max. 16 GB RAM. Each baseboard is connected to a central backplane which connects the Gigabit Network Interfaces to the front panel of the server. The mainboards have a loose interconnection regarding the central monitoring infrastructure but the main connection is the Gigabit Network Interface with a 24 Port Gigabit Switch.
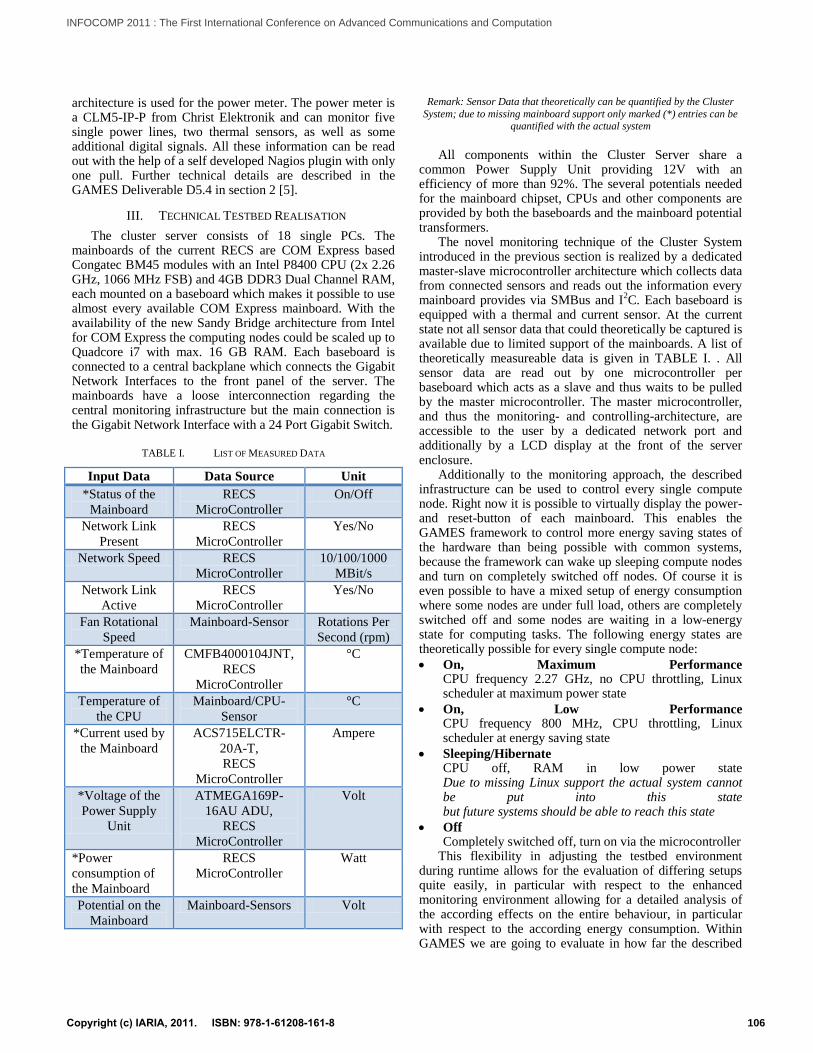
TABLE I. LIST OF MEASURED DATA
Input Data Data Source Unit
*Status of the
Mainboard
RECS
MicroController
On/Off
Network Link
Present
RECS
MicroController
Yes/No
Network Speed RECS
MicroController
10/100/1000
MBit/s
Network Link
Active
RECS
MicroController
Yes/No
Fan Rotational
Speed
Mainboard-Sensor Rotations Per
Second (rpm)
*Temperature of
the Mainboard
CMFB4000104JNT,
RECS
MicroController
°C
Temperature of
the CPU
Mainboard/CPU-
Sensor
°C
*Current used by
the Mainboard
ACS715ELCTR-
20A-T,
RECS
MicroController
Ampere
*Voltage of the
Power Supply
Unit
ATMEGA169P-
16AU ADU,
RECS
MicroController
Volt
*Power
consumption of
the Mainboard
RECS
MicroController
Watt
Potential on the
Mainboard
Mainboard-Sensors Volt
Remark: Sensor Data that theoretically can be quantified by the Cluster
System; due to missing mainboard support only marked (*) entries can be quantified with the actual system
All components within the Cluster Server share a
common Power Supply Unit providing 12V with an efficiency of more than 92%. The several potentials needed for the mainboard chipset, CPUs and other components are provided by both the baseboards and the mainboard potential transformers.
The novel monitoring technique of the Cluster System introduced in the previous section is realized by a dedicated master-slave microcontroller architecture which collects data from connected sensors and reads out the information every mainboard provides via SMBus and I
2C. Each baseboard is
equipped with a thermal and current sensor. At the current state not all sensor data that could theoretically be captured is available due to limited support of the mainboards. A list of theoretically measureable data is given in TABLE I. . All sensor data are read out by one microcontroller per baseboard which acts as a slave and thus waits to be pulled by the master microcontroller. The master microcontroller, and thus the monitoring- and controlling-architecture, are accessible to the user by a dedicated network port and additionally by a LCD display at the front of the server enclosure.
Additionally to the monitoring approach, the described infrastructure can be used to control every single compute node. Right now it is possible to virtually display the power- and reset-button of each mainboard. This enables the GAMES framework to control more energy saving states of the hardware than being possible with common systems, because the framework can wake up sleeping compute nodes and turn on completely switched off nodes. Of course it is even possible to have a mixed setup of energy consumption where some nodes are under full load, others are completely switched off and some nodes are waiting in a low-energy state for computing tasks. The following energy states are theoretically possible for every single compute node:
On, Maximum Performance CPU frequency 2.27 GHz, no CPU throttling, Linux scheduler at maximum power state
On, Low Performance CPU frequency 800 MHz, CPU throttling, Linux scheduler at energy saving state
Sleeping/Hibernate CPU off, RAM in low power state Due to missing Linux support the actual system cannot be put into this state but future systems should be able to reach this state
Off Completely switched off, turn on via the microcontroller
This flexibility in adjusting the testbed environment during runtime allows for the evaluation of differing setups quite easily, in particular with respect to the enhanced monitoring environment allowing for a detailed analysis of the according effects on the entire behaviour, in particular with respect to the according energy consumption. Within GAMES we are going to evaluate in how far the described
106
INFOCOMP 2011 : The First International Conference on Advanced Communications and Computation
Copyright (c) IARIA, 2011. ISBN: 978-1-61208-161-8
new monitoring- and controlling approach can be seen as an enabler to monitor and control IT systems at a very fine granularity whilst keeping the payload for the computing environment as little as possible. Furthermore it has to be evaluated what mixture of energy states provides the best balance between maximum performance and energy efficiency. Refer to D5.4 [5] for further information and the corresponding metrics.
IV. MONITORING OF THE TESTBED INFRASTRUCTURE
At the time of writing this paper, the Nagios-based GAMES Monitoring infrastructure is configured to provide an initial information base for the GAMES framework prototype, in particular for the data mining and knowledge management activities. In particular, this monitoring information is the backbone for any kind of analysis and optimisation of the environment in order to achieve specific goals. As shown in [1] and [2] this monitored information, used to compute the according Green Performance Indicators [6], allow for an extensive analysis and optimisation of the according hardware and software settings. The testbed is monitored by a central Nagios instance and the monitor data are stored in a data base. The initial monitoring data set on energy consumption is composed of following metrics:
Mainboard Temperature: Temperature of each single board (sensor is placed below the mainboard).
Central Voltage: input voltage which is the same for all compute nodes installed on the base board.
Power: power consumption in Watt of each compute node.
Status of the Mainboard: on or off
CPU Usage: the CPU occupation of a compute node including %user, %nice, %system, %iowait %idle values.
Memory Usage: Memory occupation of a compute node.
Process info: resource usage of the simulation process including its CPU Usage, Memory Usage and CPU time.
In particular, the first four values are measured directly from the master microcontroller through one single pull by using one single NAGIOS plugin. The output of the collected information of the according plugin is structured as follows:
{OK, all 18 boards available|nr_boards=18 |boards_status=1;1;1;1;1;1;1;1;1;1;1;1;1;1;1;1;1;1 boards_temp=31;27;28;28;26;27;27;26;28;33;32;33;31;3
1;30;30;30;30 central_voltage=11.78 boards_power=23;24;24;21;21;19;21;19;18;11;20;14;16;
13;16;17;16;26} The last three values are measured in a traditional way by
using three different plugins. These metrics are collected from the RECS nodes and stored into a historical data base during the execution of certain simulation jobs. It has to be noted that the data being monitored is a first draft for the GAMES prototype, other metrics like Storage Usage, I/O per second/Watt, Application Performance (FLOPs/KWh) which are relevant for the evaluation, in particular for HPC
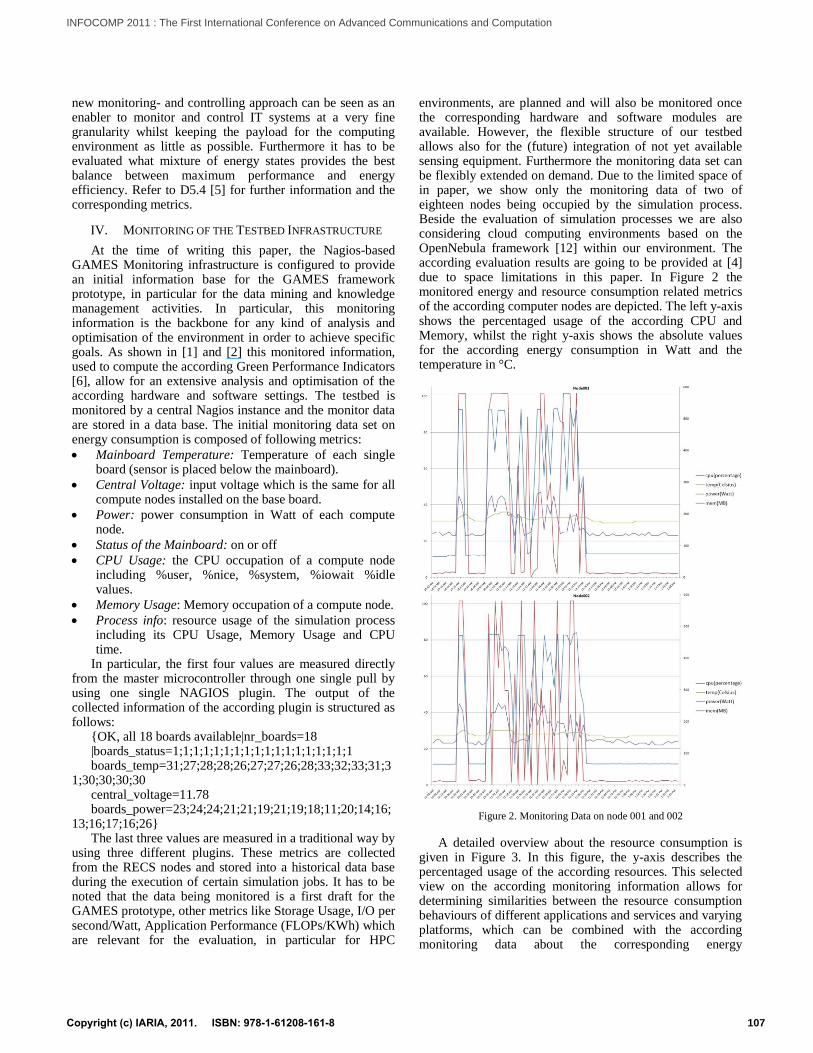
environments, are planned and will also be monitored once the corresponding hardware and software modules are available. However, the flexible structure of our testbed allows also for the (future) integration of not yet available sensing equipment. Furthermore the monitoring data set can be flexibly extended on demand. Due to the limited space of in paper, we show only the monitoring data of two of eighteen nodes being occupied by the simulation process. Beside the evaluation of simulation processes we are also considering cloud computing environments based on the OpenNebula framework [12] within our environment. The according evaluation results are going to be provided at [4] due to space limitations in this paper. In Figure 2 the monitored energy and resource consumption related metrics of the according computer nodes are depicted. The left y-axis shows the percentaged usage of the according CPU and Memory, whilst the right y-axis shows the absolute values for the according energy consumption in Watt and the temperature in °C.
Figure 2. Monitoring Data on node 001 and 002
A detailed overview about the resource consumption is given in Figure 3. In this figure, the y-axis describes the percentaged usage of the according resources. This selected view on the according monitoring information allows for determining similarities between the resource consumption behaviours of different applications and services and varying platforms, which can be combined with the according monitoring data about the corresponding energy
107
INFOCOMP 2011 : The First International Conference on Advanced Communications and Computation
Copyright (c) IARIA, 2011. ISBN: 978-1-61208-161-8
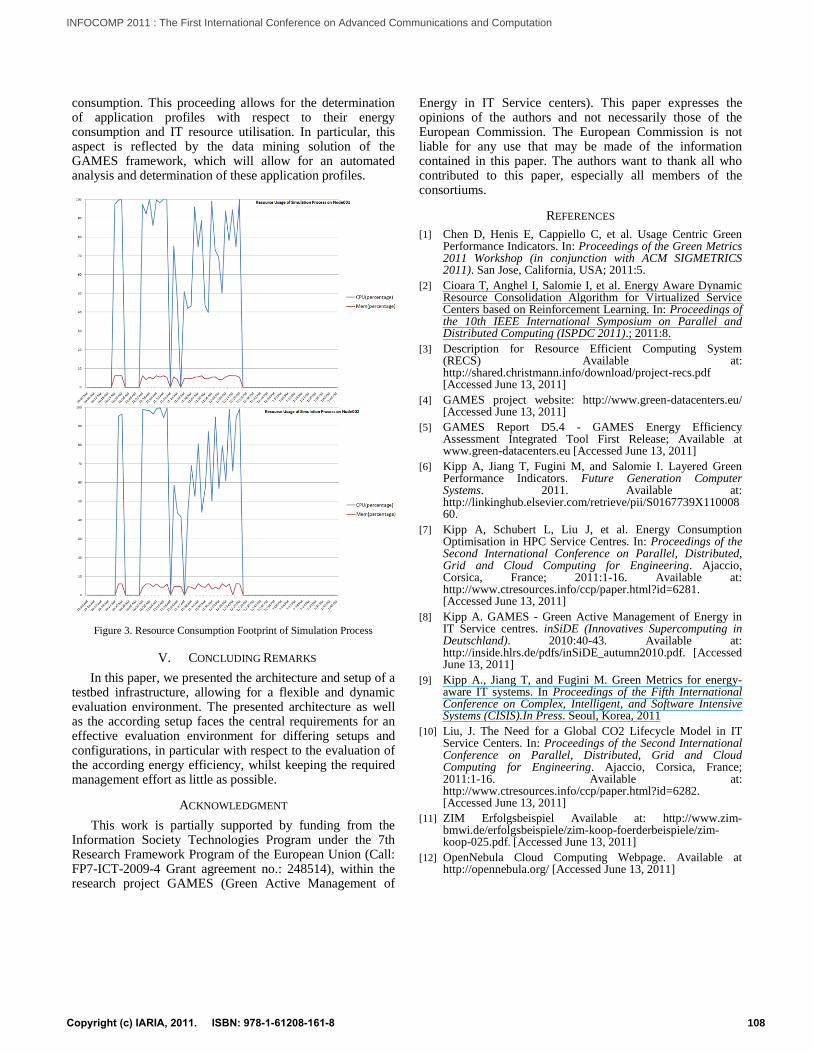
consumption. This proceeding allows for the determination of application profiles with respect to their energy consumption and IT resource utilisation. In particular, this aspect is reflected by the data mining solution of the GAMES framework, which will allow for an automated analysis and determination of these application profiles.
Figure 3. Resource Consumption Footprint of Simulation Process
V. CONCLUDING REMARKS
In this paper, we presented the architecture and setup of a testbed infrastructure, allowing for a flexible and dynamic evaluation environment. The presented architecture as well as the according setup faces the central requirements for an effective evaluation environment for differing setups and configurations, in particular with respect to the evaluation of the according energy efficiency, whilst keeping the required management effort as little as possible.
ACKNOWLEDGMENT
This work is partially supported by funding from the Information Society Technologies Program under the 7th Research Framework Program of the European Union (Call: FP7-ICT-2009-4 Grant agreement no.: 248514), within the research project GAMES (Green Active Management of
Energy in IT Service centers). This paper expresses the opinions of the authors and not necessarily those of the European Commission. The European Commission is not liable for any use that may be made of the information contained in this paper. The authors want to thank all who contributed to this paper, especially all members of the consortiums.
REFERENCES
[1] Chen D, Henis E, Cappiello C, et al. Usage Centric Green Performance Indicators. In: Proceedings of the Green Metrics 2011 Workshop (in conjunction with ACM SIGMETRICS 2011). San Jose, California, USA; 2011:5.
[2] Cioara T, Anghel I, Salomie I, et al. Energy Aware Dynamic Resource Consolidation Algorithm for Virtualized Service Centers based on Reinforcement Learning. In: Proceedings of the 10th IEEE International Symposium on Parallel and Distributed Computing (ISPDC 2011).; 2011:8.
[3] Description for Resource Efficient Computing System (RECS) Available at: http://shared.christmann.info/download/project-recs.pdf [Accessed June 13, 2011]
[4] GAMES project website: http://www.green-datacenters.eu/ [Accessed June 13, 2011]
[5] GAMES Report D5.4 - GAMES Energy Efficiency Assessment Integrated Tool First Release; Available at www.green-datacenters.eu [Accessed June 13, 2011]
[6] Kipp A, Jiang T, Fugini M, and Salomie I. Layered Green Performance Indicators. Future Generation Computer Systems. 2011. Available at: http://linkinghub.elsevier.com/retrieve/pii/S0167739X11000860.
[7] Kipp A, Schubert L, Liu J, et al. Energy Consumption Optimisation in HPC Service Centres. In: Proceedings of the Second International Conference on Parallel, Distributed, Grid and Cloud Computing for Engineering. Ajaccio, Corsica, France; 2011:1-16. Available at: http://www.ctresources.info/ccp/paper.html?id=6281. [Accessed June 13, 2011]
[8] Kipp A. GAMES - Green Active Management of Energy in IT Service centres. inSiDE (Innovatives Supercomputing in Deutschland). 2010:40-43. Available at: http://inside.hlrs.de/pdfs/inSiDE_autumn2010.pdf. [Accessed June 13, 2011]
[9] Kipp A., Jiang T, and Fugini M. Green Metrics for energy-aware IT systems. In Proceedings of the Fifth International Conference on Complex, Intelligent, and Software Intensive Systems (CISIS).In Press. Seoul, Korea, 2011
[10] Liu, J. The Need for a Global CO2 Lifecycle Model in IT Service Centers. In: Proceedings of the Second International Conference on Parallel, Distributed, Grid and Cloud Computing for Engineering. Ajaccio, Corsica, France; 2011:1-16. Available at: http://www.ctresources.info/ccp/paper.html?id=6282. [Accessed June 13, 2011]
[11] ZIM Erfolgsbeispiel Available at: http://www.zim-bmwi.de/erfolgsbeispiele/zim-koop-foerderbeispiele/zim-koop-025.pdf. [Accessed June 13, 2011]
[12] OpenNebula Cloud Computing Webpage. Available at http://opennebula.org/ [Accessed June 13, 2011]
108
INFOCOMP 2011 : The First International Conference on Advanced Communications and Computation
Copyright (c) IARIA, 2011. ISBN: 978-1-61208-161-8