Generic Name Letterhead Branded
78
4/20/2016 Community Assessment 2016 Data Analysis Final Report Table of Contents Executive Summary 2 Map of Region Divisions 5 Kitsap County Overview 6 Bainbridge Island 17 Bremerton 25 Kingston 33 Little Boston and Northward 36 Poulsbo / North Kitsap 54 Port Orchard / South Kitsap 65 Silverdale / Central Kitsap 74 Acknowledgements 78
-
Upload
khangminh22 -
Category
Documents
-
view
1 -
download
0
Transcript of Generic Name Letterhead Branded

4/20/2016
Community Assessment 2016
Data Analysis Final Report
Table of Contents
Executive Summary 2
Map of Region Divisions 5
Kitsap County Overview 6
Bainbridge Island 17
Bremerton 25
Kingston 33
Little Boston and Northward 36
Poulsbo / North Kitsap 54
Port Orchard / South Kitsap 65
Silverdale / Central Kitsap 74
Acknowledgements 78

2
Executive Summary
In Feb-March 2016, the Adult Services librarians created 8 data analysis reports. Seven of these
reports cover a specific region of Kitsap County, and one looks at the county as a whole. The
purpose of these reports is to create a foundation for our community assessment process by
understanding what information has already been produced about our county. The analysis
delved into a wide variety of sources, including census data, school district data, city and
county comprehensive plans, state and local government documents, business and nonprofit
sources, and interviews with local residents.
This summary will lay out the questions each report answers, and identify overarching themes.
1. What is the demographic makeup of your service area? Provide an overview of data on
age, race and ethnicity, income, and occupation. Also describe any other demographic points
that are unique or salient in your community.
Kitsap County is racially homogenous, with nearly all areas at least 75% white. The Hispanic
population is smaller than anticipated (usually around 6-8%), but some signs point to a growth
trend in this group.
The average age varies significantly throughout the county, and age distribution did not always
match our expectations. Bremerton is particularly young, while Kingston, Poulsbo, and Silverdale
had a higher than expected average age or number of seniors.
Average and per capita incomes appear largely middle and upper-middle class across the
county, but wide disparities lie beneath. South Kitsap especially contains significant income
diversity, with extreme poverty and wealth in the same zip codes. There are also pockets of
wealth and pockets of poverty.
In terms of employment, a few industries dominate most communities: military and its
contractors, healthcare, education, and in some locations service/retail. Kitsap overall has a
surprising gender imbalance in employment; much more of the workforce is female than male.
2. Using the Mosaic Population Comparison report in DemographicsNow, describe the
largest Mosaic clusters in your community.
Mosaic clusters can be a rich source of insight, as they offer a data-based view of people’s
behaviors as well as their characteristics. At the same time, we have unanswered questions
about the results we uncovered.
The clusters do not always reflect the demographic data we collected. We often found mostly
Baby Boomer clusters in areas we know to have a significant number of residents in other age
groups. We are investigating the possible causes and implications of this discrepancy. For now,
we are considering Mosaic as just one data point that reflects a portion of our population,
needing to be taken in the context of the rest of the report.
Overall, all the most common clusters address Kitsap’s Baby Boomer generation. In general, they
are described as middle to upper-middle class, with conservative financial habits and an interest
in the environment and community involvement.
This analysis, which describes our middle aged and older populations as largely well -off, raises a
question of whether income disparities are drawn along age lines as much as geographical ones.

3
3. What is the geography of your area? Where do various communities live? Where do
people work? How are voting districts divided? Are there areas that stand out in some way?
Kitsap has densely, moderately, and sparely populated regions. South Kitsap has the largest
regional population overall, followed by Central Kitsap, and then the City of Bremerton. Central
Kitsap near the base is densely populated.
Each region has its own unique geography, influenced by both natural and human factors. A
few common themes do affect many of the communities:
Strong local, neighborhood identities
Tension between development and preservation
Traffic and transportation as a significant issue
4. What government comprehensive plan covers your area? What are the major goals it
sets for your community? What are the biggest problems it identifies?
Unincorporated areas are governed by the Kitsap County Comprehensive Plan, though the way
it impacts each area may differ. Incorporated areas generally have their own city plans. This is a
particularly informative section, as it reveals the long-term goals and challenges for each
community. A few frequent themes were:
Preserving local character while encouraging smart development
Protecting the natural environment
Providing more housing options for low and middle income residents
Improving transportation options, including for pedestrians
5. Where do people gather in your community? These can be physical places, like bars or
churches, or social ones, like Rotary meetings or music events.
This varies from community to community, and can provide valuable insight into the character
of each region. Churches, service clubs, farmers’ markets, and restaurants are among the most
common local meeting places. The mall, fairgrounds, and Central Market draw people from
around the county.
6. What organizations provide social services, recreation services, or educational services
in your community? What community needs have they identified?
• Social Services:
Overall, the county provides many social services, but these can be difficult to access for
those in outlying communities. Even supplemented by local and nonprofit efforts, in some
places more services are needed to meet the need.
• Recreation Services:
Recreation is provided mostly at the local level, by Parks and Rec departments and
private organizations.
• Educational Services:
Kitsap has 5 public school districts for k-12, in addition to multiple private schools. College
and vocational level programs are offered around the county, primarily in Bremerton and
Poulsbo.

4
7. What groups did you not know were in your community? Were some larger than you
realized, or have unique needs you weren’t aware of?
A recurring theme was the surprisingly high level of poverty and homelessness, even in seemingly
affluent areas of the county. Another was the distinct nature and importance of the tribal
communities, which have unique needs.
8. What overall conclusions do you draw about the makeup of your community?
This varies with each report. Themes reflect the answers to the previous questions, but the focus
varies based on the community.
9. The next step in this process will be identifying groups for community discussions. We
want to hear about the needs of a wide and representative cross-section of those we serve.
Based on what you’ve learned from the data, who do you think we should talk with? Why?
This list will be utilized to help identify the community partners for our discussions. It is a starting
point; we may not have conversations with every organization listed here, and we may have
conversations with some that are not.

5
Map of Approximate Report Region Divisions These divisions are intended to be an approximation only, to provide general context and a
starting point for research. They are shared here to provide a broad overview of the regions
addressed by each section of this report.
The goal of each section was to include the residents that perceive themselves as belonging to
that community. As a result, there may be some overlap. Furthermore, most available data do
not line up neatly with any single set of boundaries; every source may capture a slightly different
area. Each section will clarify more specifically to what areas any given statistic applies.

6
Kitsap County Overview Prepared by Sarah Jaffa
1. What is the demographic makeup of your service area? Provide an overview of data on
age, race and ethnicity, income, and occupation. Also describe any other demographic
points that are unique or salient in your community.
Population: 254,183 (2014 est); 251,113 (2010 census)
Age breakdown by percentage
Under 5: 5.7% (2014 est); 5.9% (2010 census)
Under 18: 20.9% (2014 est); 22.5% (2010 census)
65 & over: 16.1% (2014 est); 13.3% (2010 census)
Sex breakdown by percentage
Female: 49.1% (2014 est); 49.4 (2010 census)
Male: 50.9% (2014 est); 50.6% (2010 census)
Racial breakdown by percentage
White alone: 83.3% (2014 est); 82.6% (2010 census)
Black/African American alone: 2.9% (2014 est); 2.6% (2010 census)
American Indian/Alaska Native alone: 1.8% (2014 est); 1.6% (2010 census)
Asian alone: 5.4; 4.9
Native Hawaiian/Pacific Islander alone: 1%(2014 est); .9% (2010 census)
Two or more races: 5.6% (2014 est); 5.8% (2010 census)
Hispanic/Latino: 7.2% (2014 est); 6.2% (2010 census)
Veteran presence: 35,134 (2010-2014)
Foreign born percentage: 6.5%
Percentage of Language other than English spoken at home for those over 5: 8.5%
Income
Median household income in 2014 dollars: 62,473 (2010-2014)
Per capita income in past 12 months in 2014 dollars: 31,901 (2010-2014)
Percentage of person in poverty: 11.2%
Unemployment Rate: 6.3% 2014; 5.0% 2015 (WA State employment Security Dept,
Labor market performance analysis)
Business/Occupations (US Census QuickFacts)
All firms, 2007: 20,393
Men owned: 7,909
Women owned: 6,176
Minority owned: 1,907
Veteran owned: 2,009
Employment by industry (nonfarm) Revised Nov. 15 (Washington State Employment
Security Department, Labor Market and Performance Analysis Branch)
Total private: 57,100
Goods producing: 6,600

7
Mining, Logging, Constuction: 4,300
Manufacturing: 2,300
Service Providing: 81,600
Private service providing: 50,500
Trade/transporation/utilities: 13,800
Retail trade: 11,200
Professional/business services: 6,900
Leisure/Hospitality: 8,800
Government: 31,100
Federal: 18,600
State: 2,000
Local: 10,500
Kitsap features an “economy based on public sector Department of Defense jobs, as well as
over 10,000 uniform service personnel based there. The balance of economic activity in the
county includes a thriving gaming industry with large casinos located on tribal properties, a
major medical center and a regional retail hub attracting shoppers from Kitsap County as well
as the surrounding rural counties: Clallam, Jefferson and Mason.” (Kitsap County Profile, ESD)
The civilian employed population is 59% white collar and 40.9% blue collar. (DemographicsNow
Population Comparison report)
Industries and Gender (Kitsap County Profile, ESD)
(Source: The Local Employment Dynamics) The Local Employment Dynamics (LED) database, a joint
project of state employment departments and the U.S. Census Bureau, matches state employment
data with federal administrative data. Among the products is industry employment by age and gender.
All workers covered by state unemployment insurance data are included; federal workers and non-
covered workers, such as the self-employed, are not. Data are presented by place of work, not place
of residence. Some highlights:
Industry employment by age in 2014 shows younger workers ages 14 to 24 dominating employment in
the accommodation and food services industry (35.7 percent) and also having strong participation in
retail trade (20.3 percent). They are minimally represented in public sector jobs, mining , utilities or private
sector educational services jobs. Workers age 55 and over are fairly evenly represented in all sectors
with the exception of accommodation and food services and construction. Their numbers are most
concentrated in educational services, healthcare and social assistance and management.
Gender divisions in the labor force also follow typical patterns with males dominating construction,
transportation and warehousing and manufacturing while females make up the majority of the labor
force in health care and social assistance, finance and insurance and educational services.
In 2014, females held 62.2 percent and men held 37.8 percent of the jobs in Kitsap County. There were
substantial differences in gender dominance by industry.
Male-dominated industries included construction (84.2 percent), mining (75.9 percent), manufacturing (73.6
percent) and transportation and warehousing (73.7 percent).
Female-dominated industries included healthcare and social assistance (78.4 percent), finance and
insurance (73.3 percent) and educational services (72.8 percent).
Educational Attainment (Kitsap County Profile, ESD)

8
Most Kitsap County residents age 25 and older (94.1 percent) were high school graduates, which
compares favorably with 90.2 percent of Washington state’s residents and 86.3 percent of U.S. residents
during the period 2010-2014.
Those with a bachelor’s degree or higher made up 30.0 percent of Kitsap County residents age 25 and
older compared to 32.3 percent of state residents and 29.3 percent o f U.S. residents during the same
period.
2. Using the Mosaic Population Comparison report in DemographicsNow, describe the
largest Mosaic clusters in your community.
The largest Mosaic clusters in Kitsap were
E21 Unspoiled Splendor 52,618 20.5%
Comfortably established baby boomer couples in town or country communities. They’re
conservative financially, price conscious and love a coupon. They’re upper middle class empty
nesters. They’re traditional and are community minded. They consider themselves “American
made” and enjoy outdoor pursuits. They are not avid users of the internet, but are able to use it
for their needs.
C11 Aging of Aquarius 30,829 12.0%
Upscale boomer-aged couples living in city or close-in suburbs. They’re white collar,
health conscious, with empty nests. They’re ethically and environmentally responsible. They’re
eclectic shoppers but loyal to brands and stores. They are well educated.
L42 Rooted Flower Power 32,953 12.8%
Mid-scale baby boomer singles and couples rooted in established suburban communities
and approaching retirement. They’re politically active, involved in clubs and volunteering and
are interested in all forms of philanthropy. They’re conservative investors and bargain hunters
approaching retirement while living in older suburban homes. They are informed consumers who
like to home-based activities and shopping.
K40 Bohemian Groove 21,698 8.4%
Older divorced and widowed individuals enjoying settled urban lives. They are proud
individualists with eclectic interests. They’re concerned about nutrition and good music and live
on modest finances in apartments. They are value conscious shoppers and are influential in their
community.
C13 Silver Sophisticates 17,819 6.9%
Mature, upscale couples and singles in suburban homes. They are retired, liberal and
philanthropic, enjoying empty nests in established neighborhoods. They’re experienced
travelers who are globally conscious and live an ecological lifestyle.
E20 No Place Like Home 15,965 6.2%
Upper middle-class multi-generational households in exurban areas. They’re active
young adults and their laid back boomer parents. They value stability and have strong family
values. They give to charity, shop smart, and dislike advertising. They use the internet but not all
media is adopted with open arms.

9
3. What is the geography of your area? Where do various communities live? Where do
people work? How are voting districts divided? Are there areas that stand out in some way?
Geography:
Land area in square miles: 394.94 (US Census QuickFacts)
Persons per square mile 2010: 635.9
Kitsap is largely surrounded by water although much of the shoreline is private. Due to its
close proximity to Seattle and Tacoma, it is a county that blends rural, suburban and
urban elements. It has the 3rd most population density in the state, behind, King and
Clark counties, largely due to its relatively small geographical area. (Office of Financial
management, Population density)
Where do communities live:
Cities include: Bainbridge Island, Bremerton, Port Orchard, and Poulsbo.
Other communities that fall outside of the cities include: Bangor, Bethel, Burley, Chico,
East Port Orchard, Enetai, Erlands Point Kitsap Lake, Gorst, Hansville, Indianola, Keyport,
Kingston, Lofall, Manchester, Navy Yard City, Ollala, Parkwood, Port Gamble Tribal
Community, Rocky Piont, Seabeck, Silverdale, Suquamish and Tracyton
Where people work:
The largest component of Kitsap County nonfarm employment is government. This sector
typically accounts for a third of the nonfarm total with a November 2015 total of 31,200 jobs
(35.3 percent). Of that total, 18,600 was federal government employment. The second largest
group was local government, with 10,600 jobs. (ESD)
Major Employers in Kitsap County (KEDA 2013)
Data gathered by KEDA in Q2 2013 – July 2013. Published August 2013.
Department of Defense Civilian Military
16,392 14,953
Naval Base Kitsap 4,800 13,500
Naval Hospital Bremerton 600 800
PSNS* and Intermediate 1,952 653
Maintenance Facility
*Puget Sound Naval Shipyard (PSNS) is a tenant activity located
within Naval Base Kitsap, Washington states’ 5th largest employer.
Defense Contractors Total Employees
Skookum 396
Lockheed Martin Space Systems 375
EJB 361
Raytheon 167
Maufacturing Firms Total Employees
SAFE Boats International 300
Sage / Redington Inc / Far Bank 170
Watson Furniture Company 120

10
Trulife 110
Other Private Sector Employers Total Employees
Harrison Medical Center 2442
Port Madison Enterprises 752
Martha & Mary Health Services 599
Safeway 549
Fred Meyer 500
The Doctors Clinic 476
IBM (Manpower) 473
YMCA 466
McDonalds 430
Kitsap Mental Health Services 401
State & Other Public Sector Employers Total Employees
WA State Government 1746
Central Kitsap School District 1469
Olympic College 1206
South Kitsap School District 1176
Kitsap County 1124
North Kitsap School District 844
Bremerton School District 663
According to Census American FactFinder in 2014 the mean commute t ime for residents of
Kitsap County was 29.9 minutes, suggesting that most of those employed have jobs in Kitsap
itself.
Voting Districts:
Kitsap County falls under the 6th congressional district which includes the Olympic Peninsula and
the City of Tacoma.
There are 3 legislative districts 23 (Represents part of Kitsap County, including Bainbridge Island,
Poulsbo, Kingston, Silverdale, Winslow and East Bremerton,) 26 (Represents part of Pierce and
Kitsap Counties including part of Bremerton, Port Orchard, and Gig Harbor,) and 35 (Represents
Mason County and part of Kitsap and Thurston Counties including Shelton, Grapeview and
Belfair.) (Washington State Legislature)
The 3 county commissioner districts are divided geographically, north, central, and south.
Generally speaking other voting districts such as the school and fire districts are organized
geographically, north, central, and south, with Bainbridge Island often having its own district.
Of note:
The largest concentration of population is on the Bangor base north of Silverdale and the Navy
Yard in Bremerton. However, the percentage of the county population that lives in military
quarters is 2.8%. For context, the percentage of people in nursing homes is 2.4%. The population
tends to be larger along the Hwy 3 corridor with pockets of community around the
unincorporated towns north and south.
4. What government comprehensive plan covers your area? What are the major goals it
sets for your community? What are the biggest problems it identifies?

11
The county operates under the Kitsap County Comprehensive Plan, the current plan created in
2006 but a drawn out legal battle led to a revised plan adopted in August 2012. 2016 sees the
beginning stages of a new comprehensive plan.
Vision: (Kitsap County Comprehensive Plan 2012)
Kitsap County faces several critical issues, including the loss of rural character, increasing growth
pressures from forces both within Kitsap County and from without, and increasing traffic on area
roadways and how to appropriately provide wastewater sewer service in urban areas. In the face
of continued growth, Kitsap County seeks to shape its future in ways that will maintain the quality
of life that makes Kitsap County a special place to live and work. They envision a future in which
natural systems are protected; the water quality in our lakes, streams and Puget Sound is
enhanced; the village character of some of the smaller towns is preserved; the historical nature
of communities is respected in order to preserve our heritage for future generations; a diversified
economic base supports good jobs, contributes to healthy downtowns in cities, and offers
affordable housing choices; and the rural appearance of the county is perpetuated.
County Government: County government that is accountable and accessible;
encourages citizen participation; seeks to operate as efficiently as possible; and works
with citizens, governmental entities and tribal governments to meet collective needs
fairly while respecting individual and property rights.
Natural Environment: Natural ecosystems—including interconnected wetlands, streams,
wildlife habitat, and water quality—that are rehabilitated, protected and enhanced and
that allow for flexible and innovative development to meet environmental and growth
goals. In developed areas, the growth pattern supports conservation of non-renewable
energy and minimizes impacts on air quality and climate.
Housing: Residential communities that are attractive, affordable, diverse, and livable
supported by appropriate urban or rural services. A variety of housing choices are
available, meeting a full range of resident income levels and preferences. Residents are
able to walk between neighborhoods and to community destinations.
Open Space: An open space network—including greenbelts, wildlife habitat, forested
areas, and active and passive parks—that is accessible, inter-connected, provides
opportunities for recreation and defines and distinguishes urban and rural areas.
Urban Areas: Healthy urban areas that are the region's centers for diverse employment
and housing opportunities, all levels of education, and civic and cultural activities.
Rural Areas: Rural areas and communities where unique historical characters,
appearances, functions, and pioneering spirits are retained and enhanced. Natural
resource activities, such as forestry, agriculture, and mining continue to contribute to the
rural character and economy. Rural recreation opportunities are enhanced, including
equestrian facilities, trails, and others.
Cultural Resources: Historical and archaeological resources that are recognized and
preserved for future generations.
Economic Development: A stable, prosperous and diversified economy that provides
living wage jobs for residents, supported by adequate land for a range of employment
uses and that encourages accomplishment of local economic development goals.

12
Public Services and Facilities: Public services and facilities—including, but not limited to,
parks and recreation, law enforcement, fire protection, emergency preparedness,
water/sewer, roads, transit, non-motorized facilities, ferries, storm water management,
education, library services, health and human services, energy, telecommunications,
etc.—are provided in an efficient, high-quality and timely manner by the County and its
partner agencies. Public services and facilities are monitored, maintained and
enhanced to meet quality service standards.
Transportation: An efficient, flexible, and coordinated multi-modal transportation
system—including roads, bridges and highways, ferries, transit, and non-motorized
travel—that provides interconnectivity and mobility for county residents and supports our
urban and rural land use pattern.
5. Where do people gather in your community? These can be physical places, like ba rs or
churches, or social ones, like Rotary meetings or music events .
Each community has their own gathering places, and many draw people from across the
county. The Kitsap Mall and the shopping centers of Silverdale are a draw as well as fairs and
festivals that occur throughout the year. The Kitsap County Fairgrounds draws people to various
events throughout the year. People gather at schools and churches, sports games, open mic
nights and club meetings, movie theaters and restaurants/bars.
6. What organizations provide social services, recreation services, or educational services
in your community? What community needs have they identified?
• Social Services:
The County government Human Services includes (Kitsap County Department of Human Services):
Aging and Long Term Care:
o Community needs: The government resources for social and health programs serving older
persons, which had been relatively stagnant leading up to the economic downturn, have
since experienced significant reductions while simultaneously being stretched across a
rapidly expanding older population. In the department’s Area Plan the needs of the
community are highlighted through the goals for developing age-friendly communities. The
major goals are to:
Address basic needs of older adults and individuals with disabilities
Improve health and well-being
Improve health care quality for older adults and adults with disabilities
Promote civic and social engagement of all residents of Kitsap County
Increase the independence for older adults and people with disabilities
Promote aging readiness and healthy aging
Commission on Children and Youth:
o Community needs: Although the commission does not provide any social services, they
advise the County Commissioners on the needs of youth, they facilitate coordination of
information among agencies and they advocate for a healthy environment . They support
activities that increase the capacity for the community to build developmental assets
(developed by Search Institute as building blocks of healthy development that help you

13
people grow up healthy, caring, and responsible) The areas identified by the Commission as
needing the most focus are:
Dropping out of school
Youth Substance Abuse
Youth Violence
Child Abuse and Neglect
Developmental Disabilities:
o Community needs: The Developmental Disabilities program provides services and supports
that enhance the lives of youth and adults with developmental disabilities. They assist
individuals and families who experience developmental disability to lead full, integrated,
active, and productive lives in Kitsap County. They identify the needs of the community
(both for those who have developmental disabilities and those who don’t) in their values:
Power and choice: making our own choices and directing our own lives
Relationships: having people in our lives whom we love and care about and who
love and care about us
Status/contribution: feeling good about ourselves and having others recognize us for
what we contribute to others and our community
Integration: being part of our community, through active involvement. This means
doing things we enjoy as well as new and interesting things
Competence: learning to do things on our own or be supported to do things
ourselves
Health and safety: feeling safe and secure, and being healthy.
Housing and Homelessness Program:
o Community needs: This program works to reduce homelessness and support and increase
affordable housing. They partner with many social services providers and housing
developers on systemic planning, facilitating strategic allocation of public funds,
measuring/reporting on progress and keeping the community informed on these issues. Their
goal in Kitsap is to make homelessness rare, brief, and a one-time event. In their Homeless
Housing Plan data sources indicate more than 2,500 households require homeless housing
and services on an annual basis. The plan also identified needs of those living homeless that
are not being filled at the current time as:
Emergency shelter for single men, men with children, couples, households with pets,
and large families
Housing and services for homeless individuals entering the community from jails,
correctional facilities, foster care, hospitals, and mental institutions, and who are
chronically unsheltered.
Housing First/harm Reduction housing (for chronically unsheltered and high needs
populations)
Additional units of Permanent Supportive Housing
Job Training/Worksource:
o Community needs: Kitsap is part of a consortium with Clallam and Jefferson to plan,
establish, and operate a comprehensive employment and training system for unemployed
and economically disadvantaged individuals. Kitsap has locations in Port Orchard and
Bremerton. Program services include job search help, career skills assessment, reading and

14
math skills updating, and job placement assistance. They identify in the Olympic Integrated
Workforce Plan the following changes to community needs:
Aging of the working population: a need to emphasize services to help mature
workers obtain and remain in v iable jobs.
Increase in the nonwhite population: they plan on ensuring availability of bilingual
materials and translation services for program applicants.
Kitsap Mental Health Services/PRSN:
o Community needs: Peninsula Regional Support network is a consortium of Clallam, Jefferson
and Kitsap counties. Kitsap Mental Health Services administers mental health services for
Kitsap County. They provides planning, contracting and admin for mental health services in
the area. Programs include: inpatient services for adults and youth, gatekeeping for
Medicaid-eligible voluntary psychiatric hospitalizations, and on-call services. Services are
designed to help community embers function as independently as possible by linking them
to natural supports in the community. The Crisis Clinic phone line is also a part of the PRSN.
Beginning in 2016 PRSN will become the Salish Behavioral Health Organization.
In addition there are a large number of nonprofit organizations that provide social services to
the county, geographic regions, and cities.
As an example, Kitsap Community Resources, a county-wide nonprofit, provides services to low-
income individuals. They have identified community needs as poverty with 11.3% living at or
below federal poverty thresholds. Employment and training is also a need, although the
unemployment rate for adults and youth was below the rates for WA State. Housing cost
increases are an issue in Kitsap County. Access to affordable food is also a need with 48% of all
infants born in Kitsap County being served by WIC. 45% of all students in local school districts are
covered by the Free and Reduced Lunch program. Food banks have experience a decline in
donations while food costs have risen. Access to health care is an issue as of 2011 14% lacked
any health care insurance. (Kitsap Community Resources Kitsap County Needs Assessment)
There are a wide array of social services within Kitsap County that do not fall under the County
government umbrella, both state government, nonprofits, and religious charities. Many of these
organizations coordinate and partner with each other. A sampling of the organizations who provide
social services include:
Kitsap County Food Bank Coalition
Catholic Community Services
Kitsap County Consolidated Housing Authority
Peninsula Community Health Services
Kitsap Public Health District
DSHS (located in Bremerton and in Kingston for the Port Gamble S'Klallam Tribe)
Crisis Clinic of the Peninsulas
Kitsap Mental Health Services
NAMI Kitsap County
United Way of Kitsap County
Goodwill
Coffee Oasis
Kitsap Continuum of Care Coalition
15
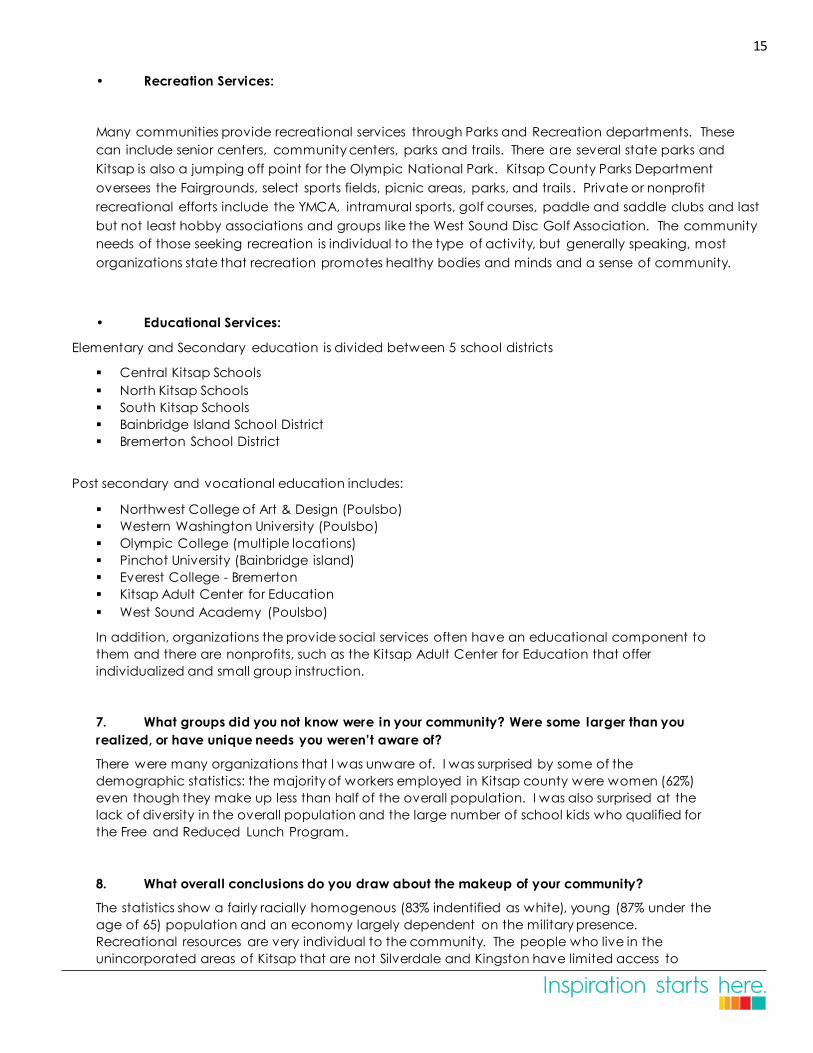
• Recreation Services:
Many communities provide recreational services through Parks and Recreation departments. These
can include senior centers, community centers, parks and trails. There are several state parks and
Kitsap is also a jumping off point for the Olympic National Park. Kitsap County Parks Department
oversees the Fairgrounds, select sports fields, picnic areas, parks, and trails . Private or nonprofit
recreational efforts include the YMCA, intramural sports, golf courses, paddle and saddle clubs and last
but not least hobby associations and groups like the West Sound Disc Golf Association. The community
needs of those seeking recreation is individual to the type of activity, but generally speaking, most
organizations state that recreation promotes healthy bodies and minds and a sense of community.
• Educational Services:
Elementary and Secondary education is divided between 5 school districts
Central Kitsap Schools
North Kitsap Schools
South Kitsap Schools
Bainbridge Island School District
Bremerton School District
Post secondary and vocational education includes:
Northwest College of Art & Design (Poulsbo)
Western Washington University (Poulsbo)
Olympic College (multiple locations)
Pinchot University (Bainbridge island)
Everest College - Bremerton
Kitsap Adult Center for Education
West Sound Academy (Poulsbo)
In addition, organizations the provide social services often have an educational component to
them and there are nonprofits, such as the Kitsap Adult Center for Education that offer
individualized and small group instruction.
7. What groups did you not know were in your community? Were some larger than you
realized, or have unique needs you weren’t aware of?
There were many organizations that I was unware of. I was surprised by some of the
demographic statistics: the majority of workers employed in Kitsap county were women (62%)
even though they make up less than half of the overall population. I was also surprised at the
lack of diversity in the overall population and the large number of school kids who qualified for
the Free and Reduced Lunch Program.
8. What overall conclusions do you draw about the makeup of your community?
The statistics show a fairly racially homogenous (83% indentified as white), young (87% under the
age of 65) population and an economy largely dependent on the military presence.
Recreational resources are very individual to the community. The people who live in the
unincorporated areas of Kitsap that are not Silverdale and Kingston have limited access to

16
services all around and must drive to most basic necessities. Kitsap is made up of people who
love the semi-rural nature of the county and want to preserve that while also wanting better
infrastructure, transportation, and services.
9. The next step in this process will be identifying groups for community discussions. We
want to hear about the needs of a wide and representative cross-section of those we serve.
Based on what you’ve learned from the data, who do you think we should talk with? Why?
School districts and post-secondary educational organizations; Kitsap Continuum of Care
Coalition and Kitsap Community Resources; the Port Gamble S’Klallam and Suquamish tribal
communities; strategic Naval and Department of Defense groups; Kitsap Mental Health; local
business associations; and the Kitsap Coordinating Council.
Sources Cited:
WA State Employment Security Department (ESD), Labor market performance analysis
DemographicsNow
United States Census QuickFacts and American FactFinder
Kitsap County Profile, Employment Security Department, Washington State
Kitsap County Department of Human Services
Kitsap Comprehensive Plan 2012
Kitsap Economic Development Alliance

17
Bainbridge Island Prepared by John Fossett
1. What is the demographic makeup of your service area?
The total population of Bainbridge Island is 23,254 people.
The density per square mile is 815 people.
11,973 females (51.4%)
11,281 males (48.5%)
The median age is 49.5 years.
19.8% of the population is between 55-64
17.4% of the population is between 45-54
12.8% of the population is between 5-14
12.7% of the population is between 65-74
90.5 % of the islands inhabitants are white.
4.4% identify as Hispanic
4.0% identify as Multi-Race
3.3% identify as Asian
There are 19,451 people on the island who are at least 15 years old.
63.3% are married
21.4% have never married
11% are divorced
Bainbridge has 10,670 housing units with an 89.4% occupancy rate.
9,548 units are owner occupied.
54.3% own their unit with a mortgage/loan
24.9% rent
20.7% own their units free and clear
There are 18,640 vehicles registered on Bainbridge Island with a 1.95 vehicles per household average.
61.6% have 2 + vehicles
31.9% have 1 vehicle
6.3% have no vehicles
The 2015 estimates for average household income on the island is $131,060, with per capita income at
$53,971
24.7% make $150,000+
14.2% make $50,000-$74,999
11.6% make $75,000-$99,999
11.4% make $100,000-$124,999
10.3% make $125,000-$149,999
Education
35.2% have a bachelor’s degree
29.8% have a graduate degree
18.1% have some college, no degree
5.5% have an associate degree
2. Using Mosaic Population Comparison report in Demographics Now, describe the largest Mosaic Clusters in
community.
76.7 % Booming with Confidence: Silver Sophisticates
Prosperous, established couples in their peak earning years living in suburban homes. Mature, upscale
couples and singles in suburban homes.
Booming with Confidence contain married couples in their peak earning years and approaching
retirement. Many of the households have dual incomes and few children, allowing them to afford

18
fashionable homes on small, manicured yards in city and suburban neighborhoods. Having made a
conscious effort to distance themselves from the noise and chaos of the urban core, they’ve retreated to
the quiet and predominantly white homogeneity of desirable neighborhoods only a short commute from
their jobs.
Most households in Booming with Confidence are found in relatively new subdivisions in the West and
Northeast on tree-lined streets worth more than $330,000. With a majority having lived at the same address
for more than 15 years, many have built up equity in their homes that supports their comfortable lifestyles
and leisure activities. Their houses are also large enough to accommodate the quarter of households that
have a young adult still living at home.
With six-figure incomes, Booming with Confidence are at the peak of their careers in white-collar profession
in business, law, public administration, education and science. Given their college degrees and foreign
travel, there’s a cultured air to these segments. If they fly a flag above their front door, it’s rarely an
American flag; one depicting flowers, pets, or their college alma mater is much more common.
Booming with Confidence tend to have sophisticated tastes. With their well -appointed homes, solid
incomes and diversified portfolios, they can afford to live the good life. They like to spend on nightlife, going
to plays, concerts, movies and restaurants. On weekends, they can be seen touring museums and antique
shops, always on the lookout for objects to add to their collections. They travel widely, taking getaways to
Caribbean beaches and visiting nearly every country in Europe at more than twice the national average.
At home, they like to relax by reading, gardening and entertaining friends and family. Their end tables are
stacked with old copies of Smithsonian, The New Yorker, Gourmet and Metropolitan Home.
As consumers, Booming with Confidence have conservative tastes; they’re attracted to classic fashions that
have stood the test of time and mid-range sedans from both domestic and foreign automakers. With many
still in the workforce or volunteering for charitable causes, they wear smart styles and designer labels they
find at favorite mall retailers like Nordstrom, Talbots, Anne Taylor and Chico’s. Many patronize local shops
they’ve frequented for years when stocking up on wine, gourmet food and books. They’d never qualify as
early adopters, but they like to equip their homes with the latest flat -screen TVs and carry new smartphones.
These folks pride themselves on quiet good taste rather than ostentatious display.
Despite their busy lifestyles, Booming with Confidence make time for traditional media. They watch an
average amount of TV, enjoying the programming on cable networks like A&E, CNN, ESPN, History, National
Geographic, TCM and the Travel Channel. Radio is popular among these daily commuters, especially the
stations that offer news, sports, classic hits, golden oldies and classical music.
Among Booming with Confidence segments, though, nothing compares to their obsession with traditional
print media. They read daily newspapers from cover to cover and subscr ibe to science, travel and news
magazines. No fans of advertising, they will, nevertheless, read ads in print media and are receptive to the
messages that appear in movie theaters.
Booming with Confidence are active in their communities, and they frequently belong to arts groups,
veterans’ clubs and churches and synagogues. Politically, they tend to be moderates with a
disproportionate number affiliated with the Republican Party. However, these centrists rarely take strong
stands on many social issues and only a small percentage will ever be seen marching in a protest. That
doesn’t mean they’re unwilling to donate money to causes that take tough stands on contentious issues,
though. Indeed, many members of this group say they support a variety of charitabl e organizations
because, intellectually and morally, it’s the right thing to do.
The older couples in this group make a solid audience for digital media. They use the Internet for utilitarian
purposes: to trade stocks, get news, book airline tickets and follow the leaders on the PGA tour.
Increasingly, these silver surfers are going online to shop, both gathering information about products and

19
making purchases. Although they’re still not comfortable using social networks, they do go online to stay in
touch with family and friends by sending emails and photographs to loved ones.
14.3% Thriving Boomers: Full Pockets and Empty Nest
Upper-middle-class baby boomer-age couples living comfortable lifestyles settled in town and exurban
homes. Empty-nesting, upper middle-class households with discretionary income living sophisticated
lifestyles.
Thriving Boomers feature empty-nesting couples in their 50s and 60s who long ago fled the cities for quiet
towns and upper middle-class resort communities. Most of the households contain childless couples who’ve
lived at the same address for over a decade and are now beginning to contemplate their retirement.
Others are more recent arrivals who’ve left large homes in bedroom suburbs to downsize to more
manageable houses and condos. While some of their peers have migrated to active retirement
communities, these folks are content to live in their mixed-age neighborhoods, not to mention their mixed-
aged households: one-quarter has an aged parent or young adult living at home.
Thriving Boomers are concentrated in small cities and towns, including popular vacation destinations like
Santa Fe, N.M., Berkeley, Calif., Vail, Colo., and Nantucket, Mass. Their housing stock varies from older
ranches to mountainside bungalows and beachfront condos. Although they’re nearly twice as likely as
average Americans to live on large properties of up to four acres, they also enjoy a change in scenery from
time to time, as seen in the many who own vacation homes.
An educated group, a majority of households has at least one member with a college degree; these
couples typically have white-collar jobs in public administration, law, education and sales. Their mid-level
positions provide above-average incomes, though nearly a quarter of adults are retired. With their strong
earnings over the course of many years, they’ve managed to build diversified 401(k)s and IRAs to ensure a
comfortable retirement. These fiscal conservatives also like to buy long-terms CDs and invest in money
markets to protect their portfolios from the vagaries of the stock market.
Half of Thriving Boomers may be grandparents, but they’ve hardly retired to a rocking chair. Many are
much different than preceding generations at the same point in life. They exercise regularly, en joying
biking, hiking, hunting, snorkeling and golf. These educated Americans frequent the theater, museums and
classical music concerts, and many like nightlife activities like going to bars, nightclubs and comedy clubs.
They dine out often at steakhouses and chains and have a soft spot for restaurants like Bob Evans and
Cracker Barrel that offer home-style fare. They travel often, visiting Caribbean beaches, taking
Mediterranean cruises and driving RVs to parks and tourist sites across America. To relax at home, they like
to garden, read books, cook and do woodworking.
As consumers, Thriving Boomers tend to be practical shoppers who like functional clothes at good prices.
They rarely buy products to make a statement, and they patronize a wide variety of retailers - from
discounters like Dress Barn and Sam’s Club to retail chains such as Chico’s and Coldwater Creek. They’re
late adopters when it comes to technology, with below -average rates for owning smartphones and MP3
players, but they’re willing to splurge on a flat-screen TV. Though few have flashy cars, many own late-
model trucks made in Detroit. American-made products, they declare, set the standard.
Thriving Boomers are selective media consumers, though they embrace both traditional and new media.
They’re among the top readers of newspapers, especially the travel, science, movie and editorial sections.
These outdoorsy folks like to read fishing and hunting magazines along with newsweeklies and automotive
publications. They listen to the radio fairly often, tuning in to golden oldies, classic rock, adult contemporary
and news talk stations. They’re especially fond of TV news, documentaries, history programs, dramas and
how-to programs aired on cable channels like History, HGTV, TCM, the Travel Channel and Fox News.
They’re no fans of TV commercials - or most advertising for that matter - but they respond to billboards and
links on the Internet.

20
The Americans who launched the counterculture revolution continue to be activists. Many are rooted in
their communities and they often belong to veterans’ clubs, arts groups and unions. Politically, they’re
ideologically split, with about equal numbers belonging to the Democratic and Republican parties.
However, they tend to be more liberal on social issues and advocate corporate ethics. On issues they feel
strongly about, they’re willing to join a protest march.
Thriving Boomers are active users of the Internet, comfortable going online to shop, telecommute and bid
on auctions. They access the Internet for a variety of activities: booking flights, trading stocks, following
political events and looking up health and medical information. They frequently surf to Websites like
huffingtonpost.com, fidelity.com, craigslist.org and tripadvisor.com. They mostly go online from the comfort
of their desktop or laptop computers; they’re only half as likely as the general population to access the
Internet using their cell phones.
9% Booming with Confidence: Aging of Aquarius
Prosperous, established couples in their peak earning years living in suburban homes. Upscale boomer-
aged couples living in city and close-in suburbs. Please see above Booming with Confidence: Silver
Sophisticates for a more complete description.
3. What is the Geography of the area?
Bainbridge Island is a community west of Seattle. It is approximately 12 miles long and 4 miles wide (27.7 square
miles or 17,777 acres). There are 5 small harbors; Blakely Harbor, Eagle Harbor, Murden Cove, Port Madison,
Manzanita Bay and Fletcher Bay. The island topography is gently, rolling hills with generous tree canopy.
Regular ferry service to downtown Seattle is provided by the Washington State Ferries. A bridge on the north
end connects the island to the Kitsap Peninsula.
Where do the various communities live (population concentrations?)
Bainbridge has several neighborhoods with concentrated populations and retail cores; Winslow, Rolling Bay,
Island Center and Lynwood Center and the island is speckled with small housing developments and
individual homes outside of these areas.
Where do people work?
The largest employers on Bainbridge Island:
Bainbridge Island School District – 358 employees
City of Bainbridge Island – 290 employees
Far Bank Enterprises (Sage & Redington) 261 employees
Avalara Inc. – 180 employees (in the process of relocating to Seattle)
Town & Country Market – 140 employees
WSF Machine Shop – 124 employees
Messenger House Care Ctr. – 120 Employees
Safeway – 115 employees
Columbia Bank – 74 employees
Island Fitness – 69 employees
Islandwood – 60 employees
NETS (NorEastern Trawl Systems) Inc -56 Employees
Mean Travel time to work for workers age 16+ from 2010-2014 is 45.6 minutes.
WSF indicates that roughly 5500 people commute to work via ferry to the Seattle area every day.

21
From Demographics Now, 2015 estimates on labor force
19,107 people are 16 years and older
11,381 people are in the labor force
8,503 people identify as “white collar”
2,360 people identify as “blue collar”
7,726 people identify as “not in labor force”
57.3% indicate employment in the Service sector
o 21% of Service is Educational Services
o 17.9% of Service is Engineering, Accounting, Research, Management
o 17.7% of Service is Health Services
o 15.5% of Service is Business Services
13.1% indicate employment in the Retail sector
o 30.6% of Retail is Food Stores
o 25.6% of Retail is Eating & Drinking Places
o 21.9% of Retail is Miscellaneous Retail
7.4% indicate employment in the Finance, Insurance, Real Estate sector
o 53.5% of Finance, Insurance, Real Estate is Real Estate
o 16% of Finance, Insurance, Real Estate is Depository Institutions
o 8.5% of Finance, Insurance, Real Estate is Insurance Agents, Brokers and Services
5.5% indicate employment in the Construction sector
o 67.6% of Construction is Building Construction: General Contractors & Operative Builders
o 29.8% of Construction is Special Trade Contractors
How are voting districts divided?
For the state and federal voting districts, i.e., 6th Congressional District, 23rd Legislative District, a five person
commission reviews the latest Census data and submits a recommendation to the state legislature.
Districts are drawn to create nearly equal populations within the boundaries. There is an opportunity for
public comment. The legislature can amend up to 2%, but needs a 2/3 majority to do so. Governor
cannot veto.
For the city, the Bainbridge City Council is divided into three wards, north, central & south, as well as an at
large position. The districts are divided evenly by population along voting precincts by the city council.
Public comment is encouraged.
4. What government comprehensive plan covers area?
Bainbridge Island Comprehensive Plan (which is in revision at this time) including the Winslow Master Plan and
the Shoreline Master Management Program.
What are the major goals it sets for the community?
Preserve open space and the character of the natural landscape.
Preserve environmentally sensitive areas.
Protect the water resources of the Island, which are of primary importance to its residents.
Preserve and encourage agricultural activities as a means of providing locally grown food, enhancing the
cultural and economic diversity of the community and preserving open space and view corridors.
Foster the diversity of the residents of the Island, its most precious resource.
Encourage the retention of small-scale service centers outside Winslow.
Provide a variety of housing choices for residents.
Foster a financially sound development pattern.
Preserve a reasonable use of the land for all landowners.
Reduce reliance on the auto and encourage establishment of pedestrian and bicycle-oriented
communities.
Provide affordable housing.

22
Establish Winslow’s urban core as a mixed-use, pedestrian-oriented village.
Foster the energy, drive, initiative and artistic talent of Island residents by encouraging home occupations
and environmentally-sound businesses, with minimal impact on groundwater resources.
Provide adequate public facilities and utilities within the citizens’ ability to pay which maximize public
safety and minimize adverse environmental impacts.
Support, protect and enhance the value of the arts and humanities as essential to education, quality of
life, economic vitality, broadening of mind and spirit, and as treasure in trust for our descendants.
What are the biggest problems it identifies?
Beyond the previously mentioned items, none are specifically mentioned in the plan. However, five “overriding
principles” were added to guide the plan.
Preserve the special character of the Island
Protect fragile water resources
Foster diversity
Consider the cost and benefits to property owners when making land use decisions
Promote sustainable development
5. Where do people gather in your community?
These can be physical places like bars or churches, social li ke Rotary or performance venues.
Parks & trails, senior center, classes thru Parks & Rec and other institutions, library events, meetings and events
organized by the many non-profits on the island, churches, school bus stops (waiting with other parents to
pick up/drop off kids), school events, coffee shops, restaurants & pubs, plays and performances at various
venues, Bainbridge Farmers Market, Rotary, Kiwanis, Bainbridge Island Land Trust, The Grange, Seabold Hall,
Island Center Hall, VFW, Bainbridge Island Museum of Art, BI Historical Museum, Bloedel Reserve,
Islandwood, Spacecraft (music venue)
6. What orgs provide social services?
Arms Around Bainbridge – Support for people with long term illness
Bainbridge Island Child Care Centers – day care and after school programs
Boys & Girls Club of Bainbridge Island – after school programs
Bainbridge Youth Services – support services for the island’s youth
Helpline House – support services for people with financial challenges
Housing Resources Bainbridge – housing and support services for people with financial challenges
Peacock Family Center – day care and after school programs
Bainbridge Island churches
What orgs provide recreational services?
This is not a comprehensive list. There are too many recreational organizations on the island to list in this report
so I’ve shared a snapshot.
Bainbridge Parks & Recreation Department – various classes, events, leagues and venues for physical
activities for all ages
Bainbridge Athletic Club – private gym and tennis club
Island Fitness – private gym
Bainbridge Island Rowing Club – rowing for all ages
Rock Climbing Gym – private gym
Squeaky Wheels – cycling advocacy group, organizes bike rides
Various Yoga Centers – Yoga, Qi Gong, Tai Chi, meditation
Wing Point and Meadowmeer Country Clubs – golf
Port Madison, Eagle Harbor & Queen City Yacht Clubs - Boating

23
What orgs provide educational services?
Bainbridge Island School District
Seattle Central Community College
Olympic College
Kitsap Regional Library
Various Pre K-12 private schools
7. What groups did you not know were in your community?
None. I’ve lived on Bainbridge for 20 years and try to stay connected with the happenings on the island.
8. What conclusions do you draw about the makeup of your community?
Bainbridge is a fairly homogenized community. It is predominantly comprised of white, middle-aged, married,
homeowners with college degrees, a couple of cars, working white collar, civilian jobs making over $100K
per household annually.
Next Step: ID’ing groups for community discussions. From your research, who should we talk with?
Bainbridge Downtown Association
Bainbridge Island City Council
Bainbridge Island School Board
Bainbridge Island Senior Center
Bainbridge Island Land Trust
Filipino American Community of BI and Vicinity
SWERV: Savvy Women Exploring Relative Viewpoints – A monthly gathering of women interested in
community and life-long learning. I have contact information.
Oatmeal - A weekly gathering of men interested in community and life-long learning. I have contact
information.
Sources
1. Demographics Now. "Demographic Detail Summary." Demographics Now. Gale Cenage Learning, 1
Mar. 2016. Web. 1 Mar. 2016.
Demographics Now. " Business Major Industries Summary.” Demographics Now. Gale Cenage Learning, 1
Mar. 2016. Web. 1 Mar. 2016.
2. Experian Information Solutions. "Audience Guide." Audience Guide. Experian Information Solutions, Feb.
2015. Web. 1 Mar. 2016. <https://www.experian.com/assets/marketing-services/product-sheets/mosaic-
usa.pdf>.
MissionInsite. "Mosaic Guide." Mosaic Guide. MissionInsite, 2008. Web. 1 Mar. 2016.
<http://missioninsite.com/PDF_Files/MOSAIC Descriptions.pdf>.
3. Bainbridge Island Chamber of Commerce. "Welcome to Picturesque Bainbridge Island..." Welcome to
Picturesque Bainbridge Island... Bainbridge Island Chamber of Commerce, 1 Mar. 2016. Web. 1 Mar.
2016. <http://www.bainbridgechamber.com/default.aspx?SS=1>.
InfoGroup. "Business by Number of Employees." Reference USA. InfoGroup, 1 Mar. 2016. Web. 1 Mar. 2016.
Census Bureau. "QuickFacts." QuickFacts Bainbridge Island. Census Bureau, 1 Mar. 2016. Web. 1 Mar. 2016.
<http://www.census.gov/quickfacts/table/PST045215/5303736,53>.

24
Washington Department of Transportation. “Traffic Statistics Rider Segment Report” WSF Traffic Statistics
Washington State Ferries, 1 Mar. 2016. Web. 1 Mar. 2016.
<http://www.wsdot.wa.gov/ferries/traffic_stats/annualpdf/2015.pdf>.
Washington Secretary of State. "Redistricting - How the Commission Works." Washington Secretary of State.
Washington Secretary of State, 1 Mar. 2016. Web. 1 Mar. 2016.
<http://www.sos.wa.gov/elections/redistricting/commission.aspx#top>.
City of Bainbridge Island. "Council Representation." City of Bainbridge Island. City of Bainbridge Island, 1
Mar. 2016. Web. 1 Mar. 2016. <http://www.ci.bainbridge-isl.wa.us/219/Council-Representation>.
4. City of Bainbridge Island. "Comprehensive Plan.” City of Bainbridge Island. City of Bainbridge Island, 1
Mar. 2016. Web. 1 Mar. 2016. < http://www.bainbridgewa.gov/432/Plan-Elements>.
City of Bainbridge Island. "Document Center: Comprehensive Plan.” City of Bainbridge Island. City of
Bainbridge Island, 1 Mar. 2016. Web. 1 Mar. 2016. <
http://www.bainbridgewa.gov/DocumentCenter/View/6078 >.
5. Informal interviews with friends and work colleagues
6. City of Bainbridge Island. "City Funded Community Services.” City of Bainbridge Island. City of
Bainbridge Island, 1 Mar. 2016. Web. 1 Mar. 2016. < http://www.ci.bainbridge-isl.wa.us/600/City-Funded-
Community-Services>.
Bainbridge Island Chamber of Commerce. "Social Services.” Social Services. Bainbridge Island Chamber of
Commerce, 1 Mar. 2016. Web. 1 Mar. 2016. <http://web.bainbridgechamber.com/Social-Services>.
Bainbridge Community Foundation. "Bainbridge Community Foundation." Health & Human Services.
Bainbridge Community Foundation, 1 Mar. 2016. Web. 1 Mar. 2016.
<http://bainbridgecf.org/causes/health-human-services/>.

25
Bremerton Prepared by Michelle Will
Preview
The map below defines the boarders used in this community analysis of Bremerton. Using the zip
codes created an area that was too large, expanding into Seabeck, Wildcat Lake, and Camp
Union. The map defines Bremerton to include the communities of Manette, Illahee, Brownsville,
Tracyton, Chico, Kitsap Lake, Navy Yard City, Charleston, Downtown Bremerton, Westpark, Gorst,
and Bremerton Junction. Other areas outside of this map will be included in other community
analyses, and will most likely overlap with the Silverdale analysis.
The Kitsap Economic Development Alliance (KEDA - http://kitsapeda.org/life-work/cities-and-
communities/) describes the City of Bremerton as follows:
Bremerton
The county’s largest city (38,790), Bremerton is home of the Puget Sound Naval Shipyard (PSNS)
and has a strong Navy history. The city is undergoing a renaissance with new publicly and privately
funded buildings emerging along the waterfront. Waterfront condos provide residents easy
access to new parks and a newly expanded marina, planned boardwalk, and more downtown
development. A new, multi-modal transportation center has been built for Washington State
Ferries, which has been connecting the peninsula to Seattle for more than a century.
Amenities include the Bremerton Naval Museum, downtown waterfront promenade and the
Navy destroyer, USS Turner Joy, Harborside Fountain Park and PSNS Memorial Plaza, the historic
Arts District, unique shops and Gold Mountain Golf Complex, rated one of the best public golf
courses in the country.
1. What is the demographic makeup of your service area? Provide an overview of data on
age, race and ethnicity, income, and occupation. Also describe any other demographic points
that are unique or salient in your community.
Using the 2015 estimate from the Demographics Now snapshot comparison for the mapped area:
The population is 79,191 with 30,944 total households. The population is 73.3% white, 7.7%

26
Multirace, 7.5% Asian, 5.6% Black, 1.6% American Indian or Alaska Native, 1.4% Hawaiian or Pacific
Islander, 2.6% other. 9.2% of the population consider themselves Hispanic and 90.7% Non Hispanic.
The employed civilian population over age 16 is 34,651, of which 54.5% is white collar and 45.4% is
blue collar. The Average Household Income is $64,682 with a Median Household Income of
$50,027. The median age is 34.5, with a majority of the population aged 15 – 34, representing
32.9%. People aged 25-44 represent 23.8%, while everyone aged 45 and over fits into 25.4% of the
population. This median age is considerably younger than that of WA state, which is 37.5. I believe
this is due to the large number of single adults in the military.
According to data gathered by KEDA in 2013, PSNS & IMF, located in Bremerton, employed 653
military and 10,952 civilian employees, and Naval Hospital Bremerton employed 800 military and
640 civilian employees, ranking the Department of Defense the largest employer in the area.
Private employers in the defense industry also rank high in Bremerton.
With the reduction in services, and possible closing, of Harrison Hospital, jobs in the healthcare
industry are moving out of Bremerton. What once was the second largest employer in town is now
overcome by public employers like Olympic College (with 1,206 employees), the Bremerton
School Disctrict (663 employees), the City of Bremerton (351 employees), and Kitsap Transit (348
employees).
2. Using the Mosaic Population Comparison report in DemographicsNow, describe the
largest Mosaic clusters in your community.
The largest Mosaic cluster in this community is Rooted Flower Power (in Group L: Blue Sky Bloomers)
which is defined as “mid-scale baby boomer singles and couples rooted in established suburban
communities and approaching retirement.” Their key traits include home-based activities, political
activism, informed consumerism, and conservative investors, who are bargain hunters and mail-
order buyers, and enjoy clubs and volunteering, as well as philanthropy. This cluster accounts for
16,818 people, 21.2% of the population.
The second largest cluster is No Place Like Home (in Group E: Thriving Boomers) defined as “upper
middle-class multi-generational households in exurban areas.” This cluster includes active young
adults and laid-back boomers who are described as stable, matter-of-fact, charitable folks with
strong family values, who are smart shoppers, adverse to ads, and avid Internet users. (*It is of
some note that when I looked at just the mosaic for the city of Bremerton, this group hardly existed
– 18 people, less than 1% -- indicating that this cluster is obviously living on the outskirts of
Bremerton, outside of the city’s limit). This cluster accounts for 15,728, 19.8% of the population.
The third largest group is Bohemian Groove (in Group K: Significant Singles) defined as “older
divorced and widowed individuals enjoying settled urban lives.” Their key trai ts include eclectic
interests, modest finances, and value-conscious shopping. This population is made up of proud
individualists, unconventional thinkers, and influencers who love music and care about their health
and nutrition. This cluster accounts for 11,380 people, 14.3% of the population.
The fourth and fifth largest groups are of note, as together they make up almost 20% of the
population, and would come in third if only looking at the city of Bremerton. These groups are the
Digital Dependents (in Group O: Singles and Starters) and Dare to Dream (in Group R: Aspirational
Fusion). Digital Dependents are defined as “a mix of Generation Y and X singles who live digital -
driven, urban lifestyles.” The Dare to Dream population are “young singles, couples and single
parents with lower incomes starting out in city apartments.” Both groups live active lifestyles; they
are digital trendsetters, risk-takers, gamers, bloggers, and Internet-savvy. They are optimistic and
artistic. The Digital Dependents account for 7,415 people, 9.3% of the population. Dare to Dream
accounts for 7,247 people, 9.1% of the population. Together, they round-out an important part of
the Bremerton community.

27
Summing up, Bremerton is a multi-generational community with diverse backgrounds, showcasing
a solid base of older singles, baby boomers, and active young adults. This seems like a community
that would benefit from cross-cultural and cross-generational interaction and development.
3. What is the geography of your area? Where do various communities live? Where do
people work? How are voting districts divided? Are there areas that stand out in some way?
From the “City Profile” in the City of Bremerton Comprehensive Plan, EP Appendix, pp. 1-2.
(http://www.ci.bremerton.wa.us/DocumentCenter/View/167):
The City of Bremerton is at the geographic center of the Puget Sound Region, located on the
Kitsap Peninsula, only 11 miles across the water from Seattle and just 33 miles no rthwest of Tacoma
off State Highway 16. The Washington State Ferry system conveniently links downtown Bremerton
to downtown Seattle, providing unobstructed automobile access, a unique feature, in
comparison to other satellite cities around Seattle.
Residents, visitors, and Bremerton-based businesses benefit from this unparalleled regional access
as well as the City’s favorable size for City operations and management. In fact, Bremerton is the
largest incorporated City in the West Sound, with a population o f approximately 37,000 - more
than the combined markets of Gig Harbor and Silverdale, and more than the combined
population of the other incorporated cities in Kitsap County.
The City has grown in geography over the years, but annexation has become a more
complicated process and has generally not kept pace with urban development pressures. Thus,
the development and population growth in the unincorporated areas around Bremerton has far
exceeded the growth of Bremerton and other cities in Kitsap County. There are many
opportunities in Bremerton for “infill” development on small vacant or underdeveloped lots, but
most new growth has been occurring in subdivisions and on larger tracts of land available at the
urban fringes of the County’s Urban Growth Areas.
A number of unincorporated communities remain just outside the City limits today. Enetai,
Tracyton, Rocky Point, Erlands Point, Navy Yard City, and Gorst, for example, are considered part
of the Greater Bremerton area and will likely grow in their urban qual ities and reliance on the City
of Bremerton for various types of urban services.
The City of Bremerton is 14,800 acres, or approximately 23 square miles. The Puget Sound Naval
Shipyard has long been the City’s principal economic base despite its federal exemption from
paying local taxes and property assessments. Shipyard activities strongly affect the City’s
population demographics and land use development. Commercial activities are often
strategically located near PSNS access points, including automobile orientated business on the
edges of Charleston, near the shipyard’s main gate on Naval Avenue.
Downtown Bremerton is currently the scene of the most development activity, including public
investments into a modern Government Center, and along its waterfront, a new hotel/conference
center and market-rate condominiums. Since its inception, the City of Bremerton has functioned
as the principal City of the West Sound, a legacy continuing today as the only recognized “Urban
Center” in Kitsap County by the Puget Sound Regional Council.
The densities of people per acre, the highly developed infrastructure, the employee base of PSNS,
and significant public investments, including the recently renovated state ferry terminal, have
proven to outlast the area’s cycles of growth and development shifts.
Downtown Bremerton, with its central location, sophisticated infrastructure, ferry access to
downtown Seattle and Port Orchard, and proximity to PSNS, is well poised for this kind of
development. The City of Bremerton is reemerging as a commercial, residential, and cultural
center in the region. Downtown is the first of the City’s newly designated centers, with its own

28
adopted sub-area plan to assure a quality setting for new investments. This focused economic
activity, with the subsequent protection of quality residential neighborhoods, will lead to new
vibrancy and economic well-being City-wide.
Bremerton is divided among three state legislative districts in Kitsap County. The 23rd legislative district to
the north, 35th legislative district in the center and 26th legislative district to the south. Also, the line
separating the first and sixth Congressional districts runs through East Bremerton.
4. What government comprehensive plan covers your area? What are the major goals it
sets for your community? What are the biggest problems it identifies?
The City of Bremerton is updating the Comprehensive Plan to be consistent with state, regional
and countywide laws and policies. This periodic update is required by Washington State's Growth
Management Act (GMA) and as it is planning for the 20 year horizon, it has been called
Bremerton2035. To see more information on this update, please visit: www.Bremerton2035.com.
The plan is based on nine themes.
1. Distinctive growth, with viable neighborhoods and activity centers that provide greater
convenience and choice.
2. Enticing new development, focusing on Downtown Bremerton.
3. Supportive transportation, with seamless, efficient and varied options.
4. Improved access, especially for pedestrians.
5. Quality housing, providing broader choices.
6. Business support, for increased opportunity.
7. Environmental management, integrating natural systems.
8. Community service, focusing on assets.
9. Design review, advancing quality urban development.
This long-range plan focuses on creating newly designated “Centers,” which are strategic
locations integrated throughout the city to offer and promote higher density lifestyles.
The comprehensive plan also seeks to rebuke the feeling that Bremerton’s neighborhoods and
commercial areas as places “where things just happen”.
The relationships between places and people, too often minimized, will instead be highlighted,
acknowledging their association, purpose, or inherent organization. Neighborhood and
District Centers will best demonstrate this concept, designed through a planning process to
provide convenient services in a unique, identifiable setting that compliments the character
of surrounding communities. (City of Bremerton Comprehensive Plan, p.38)
The plan points out several issues facing Bremerton including the lack of adequately-sized sites
for redevelopment, inflexibility in codes for creative development practices, and a persistent,
negative perspective of Bremerton as an obsolete commercial hub.
For many years, Bremerton will be affected more by urban growth levels outside its City limits than
within them. With the continuing urbanization outside the City, there is increased demand for
urban services. This demand will be met somewhere, sometime, by someone. If not met
locally, the demand for services such as neighborhood parks, schools and libraries will be
satisfied by driving (or busing) to other communities. Bremerton can influence whether growth
has positive or negative effects. The degree of influence that can be exercised is largely
linked to who ultimately assumes responsibility to plan for and provide the urban services.
(City of Bremerton Comprehensive Plan, p. Intro-11)

29
5. Where do people gather in your community? These can be physical places, like bars or
churches, or social ones, like Rotary meetings or music events .
With 15,000 square feet of meeting space, the Kitsap Conference Center on the Bremerton
waterfront is one of the main spaces for formal events, including workshops, meetings,
conferences, and personal events, like weddings. Many government and public meetings are
held at the Norm Dick Government Center. The downtown Bremerton area also has several places
that serve as gathering spaces, including the Admiral Theater, the Rice-Fergus-Miller building, the
Downtown Bremerton Library, as well as many restaurants in the area. The new Salvation Army, as
well as the Coffee Oasis, also have meeting areas. Many community groups meet at the Family
Pancake House, both east and west locations, which both have areas that can be closed off.
Other venues and meeting spaces in the Downtown area include a variety of churches, the Sons
of Norway building, the Masonic Lodge, and other places I am sure to have missed. Olympic
College is a gathering place on its own, as is Bremerton High School. Two large outdoor spaces
dominate the area – Evergreen Park, which hosts the city’s farmer’s market, and the Bremerton
Boardwalk and Harborside Fountains, host to several annual festivals.
Located in East Bremerton is the Kitsap County Fairgrounds and Eagle’s Nest, which serve as one
of the main locations for formal events, shows, concerts, and fairs. The Kitsap County Fair probably
draws the most people into Bremerton, with people coming from all over the county, as well as
from neighboring counties. East Bremerton is home to the Elks Lodge, which hosts many events,
including the local Lions Club, and well as the new Filipino Community Center on Sheridan.
McCloud’s Restaurant hosts many groups also, including the East Bremerton Rotary group. East
Bremerton is also home to two community centers run by the Park and Rec Department – Sheridan
Park and the Senior Center – as well as two of the largest parks in the city – Lion’s Park and
Blueberry Park. The Sylvan Way Library serves as a popular and high-traffic public space, and the
Boys and Girls Club is a gathering space for teens.
The sports community can gather at the three golf courses in the area – Kitsap Country Club, Gold
Mountain and Rolling Hills – as well as the Olympic Sports Center at Pendergast Park, the Bremerton
YMCA, the Jarstad Aquatic Center, the Bremerton Ice Center, Fitness Evolution, and at the
Bremerton and Olympic high schools. The fairgrounds also houses fields for Bremert on’s two minor
league sports teams, the Bluejackets baseball team and the Kitsap Pumas. Even Bremerton
Skateland serves as gathering place for families, and as a roller derby venue.
Other gathering places include the restaurants in satellite neighborhoods, like Manette, which has
an established business core that includes the Manette Saloon and the Boat Shed; Tracyton’s
Publich House; and HiLo’s 15th Street Café. Many other places around the city serve as meeting
places for individuals to gather, including the Bremerton Airport Diner, Jimmy J’s in Gorst, the
Oyster Bay Inn and Brother Don’s on Kitsap Way, Noah’s Ark, and a variety of eateries, tattoo
parlors, and shops on Callow Avenue in Charleston. Charleston is also home to the Alcoholic
Anonymous/Narcotics Anonymous meeting space.
The area surrounding the Kitsap Way corridor is home to West Sound Tech, the Westside
Imporovement Club, and the Jackson Park Community, which includes a community center, a
new school, and the Naval Hospital.
Major churches that impact the Bremerton community and may serve as meeting spaces include
GracePoint Church, newlife Bremerton, Calvary Baptist Church, Christ the King Luthern Church,
Peace Lutheran Church, Our Lady Star of the Sea Catholic Church, Holy Trinity Church, Hi llcrest
Assembly, Our Savior’s Lutheran Church, St. Paul’s Episcopal Church, Sylvan Way Baptist Church,
Peninsula Bible Fellowship, Mount Zion Baptist Church, Emmanuel Apostolic Church, and Ebenezer
African Methodist Church. Community churches include Brow nsville United Methodist Church,
Chico Alliance Church, Crossroads Neighborhood Church, Kitsap Lake Baptist Church, Lincoln
Avenue Bible Church, Manette Community Church, Discovery Fellowship of Manette, Navy Yard

30
City Bible Church, Tracyton United Methodist Church, and Sinclair Community Baptist.
International congregations include Bremerton Korean Presbetyrian, Bremerton Korean Baptist,
and Iglesia Ni Cristo on Sheridan.
6. What organizations provide social services, recreation services, or educational services
in your community? What community needs have they identified?
• Social Services:
Bremerton serves as a hub for county, state, and national community services. These include the
Bremerton Housing Authority, Department of Social & Health Services, the Department of Children
& Family Services, Department of Development Disabilities, Housing Kitsap, Kitsap Community
Resources, Kitsap Mental Health, and Peninsula Community Health Services. Other services
include Bremerton Foodline, Coffee Oasis, Habitat for Humanity, Kitsap Rescue Mission, New Day
Ministries, the Salvation Army, the United Way, YWCA Alive.
• Recreation Services:
Sports and recreation programs in Bremerton are guided by the Park and Recreation Department,
as well as several independent leagues for soccer, baseball, softball, pee wee football, and
basketball. The sports community offers three golf courses in the area – Kitsap Country Club, Gold
Mountain and Rolling Hills – as well as sports programs at the Olympic Sports Center at Pendergast
Park, the Bremerton YMCA, the Jarstad Aquatic Center, the Bremerton Ice Center, the Kitsap
Tennis & Athletic Club, Fitness Evolution, and at Bremerton and Olympic high schools. The
fairgrounds also houses fields for Bremerton’s two minor league sports teams, the Bluejackets
baseball team and the Kitsap Pumas. Even Bremerton Skateland serves as gathering place for
families, and as a roller derby venue.
There are many activities for children in Bremerton including a variety of dance schools and clubs,
the Bug Museum, Kitsap Play, Quarters Arcade, the Game Wizard, as well as a variety of great
parks and playgrounds in the area.
Bremerton offers a host of arts programs to the community. Bremerton is home to several theaters
and production companies including the Admiral Theater, Bremerton Community Theater, the
Evergreen Children’s Theater, and the Forest Theater. Museums and memorials include the Aurora
Valentinetti Puppet Museum, the Kitsap 9-11 memorial, the Kitsap Historical Society Museum, the
Puget Sound Naval Museum, and the USS Turner Joy. Art galleries dot the downtown hub, as well
as the Manette and Charleston communities. Elandan Gardens also provides a wonderful spot for
reflection.
Bremerton boasts over 25 parks in the city limits, including Bremerton’s Bark Park for dogs.
• Educational Services:
According to the Bremerton Chamber of Commerce website, “No community in the West Sound
offers more education option than Bremerton.”
Olympic College is a public two-year community college that educates more than 13,000
students a year. Founded in 1946, the college has three campuses in Bremerton, Poulsbo, and
Shelton - it serves a population of 280,000 residents living in Kitsap and Mason Counties.
Bremerton School District is home to over 5,000 students. The District consists of:
- Four elementary schools (grades K-5)
- One Early Learning Center (grades PS-3)
- One elementary STEM academy (grades PS-7)

31
- One middle school (grades 6-8)
- One high school (grades 9-12)
- Two alternative high schools (grades 9-10 & 11-12)
- Alliance Academy (a K-8 homeschool partnership program)
Bremerton is also home to the largest number of Independent and Religious private schools in
Kitsap County, including the Alta Vista School, two Montessori schools, one Catholic school , and
5 other Christian-based schools.
7. What groups did you not know were in your community? Were some larger than you
realized, or have unique needs you weren’t aware of?
I was aware that homelessness in the county was on the rise, but the number of families with small
children is staggering. In 2012 there were 272 homeless children in the Bremerton School District, a
jump of 600% since 2008. I could not find more current numbers for Bremerton, but in an article in
The Bremerton Patriot in February 2016, numbers were disclosed from the annual Kitsap County
Point in Time Count, a survey that took place over a 24-hour period in January to identify those
living homeless – “644 individuals were counted (in Kitsap County) — a 30-percent increase since
last year. Preliminary results for Kitsap identified 217 individuals living unsheltered in cars,
abandoned buildings, the streets, tents or other places — a figure more than double last year’s
count.”
“The Point in Time Count is considered to be an undercount o f the real number of people
experiencing unsheltered homelessness because the count is dependent on how many people
can be found during the survey period and the fact that not everyone is willing to take the survey.
Many communities multiply their Point in Time Count by 2.2 as an estimate of the actual number
of unsheltered individuals.”
There are also a large number of churches, many more than I realized. The faith community
cannot be ignored.
8. What overall conclusions do you draw about the makeup of your community?
There is a looming reputation in Bremerton that calls the community out as underdeveloped,
failing, and abandoned. Yet, its community has great pride in their city, its assets and
accomplishments, viewing Bremerton as a progressive, active community that is diverse in its
people, economy, neighborhoods, and businesses. It is the metropolitan center of the county and
deserves an upgraded infrastructure that the comprehensive plan promises. The multi -
generational makeup of Bremerton, from retirees to young adults, could serve as a learning
platform in which everyone brings something of worth to the table.
9. The next step in this process will be identifying groups for community discussions. We
want to hear about the needs of a wide and representative cross-section of those we serve.
Based on what you’ve learned from the data, who do you think we should talk with? Why?
There are so many opportunities for discussion between populations in Bremerton that I would
recommend people from all aspects of the community. I recently took part in a community
discussion with the leadership of newlife church in which they identified people within the church
who represented all area of the community. They chose people who represented the areas of
business, education, military, faith, family, government/leadership, healthcare, media, and
sports/recreation. In Bremerton, I would add the category of underserved, to include

32
homelessness, addiction, hunger, and other social services. I would also add a category of the
arts, seeing how much culture is already in Bremerton. Here are some recommendations for these
area of our community:
Business: business leaders, Bremerton Chamber of Commerce, Excell Puget Sound, Kitsap
SCORE
Education: teachers, librarians, Olympic College, PTA members, homeschoolers
Military: PSNS enlistees, retirees, military families, veterans, government/military workers
Faith: religious leaders, NewDay ministries, Christian schools
Family: neighborhood families, foster families, homeschoolers, elder care, day cares
Government/Leadership: Bremerton officials, civil workers
Healthcare: medical employees, nursing students, caregivers
Media: newspapers, facebook users, public relations people, BKAT
Sports/Recreation: coaches, afterschool programs, parks & rec employees
Underserved: Salvation Army, United Way, shelters, Foodline, Goodwill, Kitsap Mental
Health, immigrants
Arts/Entertainment: local artists, patrons of the arts, Olympic College, local theaters
Sources Cited:
City of Bremerton Comprehensive Plan (http://www.ci.bremerton.wa.us/185/Comprehensive-
Plan)
City of Bremerton Parks and Recreation website (http://www.ci.bremerton.wa.us/210/Parks-
Recreation)
Bremerton Chamber of Commerce website (http://www.bremertonchamber.org/)
Kitsap Economic Development Alliance website (http://kitsapeda.org/)
Holt, Martha. Underserved Homeless Populations Report: High Barrier Populations of Individuals Re-
entering from Institutions, Chronically Homeless, and Elderly Homeless: A Current Assessment of
Population Demographics, Housing Facilities and Services, and Best Practices. Prepared for the Kitsap
Regional Coordinating Council. October 2013. (http://www.kitsapgov.com/hs/housing/Documents/Housing%20&%20Homelessness%20Overview/Und
erserved%20Homeless%20Populations%20Report.pdf)
Morrow, Wes. “Student homelessness rapidly increasing,” The Bremerton Patriot, February 7, 2013.
(http://www.bremertonpatriot.com/news/190230501.html)
“The number of unsheltered homeless in Kitsap County increased,” The Bremerton Patriot, February 12, 2016. (http://www.bremertonpatriot.com/news/368496081.html)
Other resources included: DemographicsNow and AmericanFactFinder (http://factfinder.census.gov/).

33
Kingston Prepared by Gail Goodrick
1. What is the demographic makeup of your service area? Provide an overview of data on
age, race and ethnicity, income, and occupation. Also describe any other demographic points
that are unique or salient in your community.
Using the 2015 estimate for the 98346 zip code area: The population is 10,049 with 3,934 total
households. The population is 84.5% white, .4% black, 7.3% American Indian or Alaska native,
1.8% Asian or Pacific Islander, 6.1% Hispanic or Latino, 4% Mixed Race. Employment is 59.3%
white collar and 40.6% blue collar. The Average Household Income is $85,636 with a Median
Household Income of $65,273. The median age is 44.3. I suspect that this age may be older
than other service areas of the county.
2. Using the Mosaic Population Comparison report in DemographicsNow, describe the
largest Mosaic clusters in your community.
The largest Mosaic cluster in this community is Thriving Boomers: Unspoiled Splendor which is
defined as comfortably established baby boomer couples living either in a city or close-in
suburbs. The second largest cluster is Middle-class Melting Pot: Birkenstocks and Beemers
defined as upper middle class established couples living leisure lifestyles in small towns. The next
largest is Booming with Confidence: Aging of Aquarius defined as upscale boomer-aged
couples living in a city or close-in suburbs. The fourth largest cluster is Families in Motion: Red,
White and Bluegrass which are younger, working class families earning moderate incomes in
small communities. The last group is Blue Sky Boomers: Booming and Consuming which are
financially fit baby boomer couples and singles in the 50-60 year old range with moderate
incomes but possessing nest eggs. They are philanthropic and interested in the arts.
Summing up, the vast majority of the people located in this zip code fall into the baby boomer
age range with established lifestyles and comfortable financially.
3. What is the geography of your area? Where do various communities live? Where do
people work? How are voting districts divided? Are there areas that stand out in some way?
Beyond the small downtown area, the geography of the area consists either of shoreline or
forested land. There is a condominium in downtown Kingston. There are virtually no rental
properties in this area. Most people live in small developments near Kingston or on acreage.
Many people work for the naval bases in Kitsap County. Some people work for Boeing in
Everett. There are many who commute out of the county for work. The Edmonds-Kingston ferry
comprises over 17% of the total Washington State Ferry business.
The main Kingston area surrounding the town itself is in Precinct 430. Precinct 423 is Highland
which stretches from an area south of the highway down towards an area west of Indianola.
Precinct 422 is Apple Tree and it extends north of Kingston towards Hansville. Precinct 419 is Point
Jefferson which extends south towards Indianola. Precinct 450 is Port Gamble. All of these
precincts are in Congressional District 6 and Legislative District 23. They are in Commissioner
District 1.
The most unique area is Port Gamble because it is an historical district with limited housing in the
core area which will be preserved from regular development. There is a specific code definit ion
in the Kitsap County Code which applies to Port Gamble (17.321B) and its surrounding area.

34
Since the mill closed, Pope & Talbot is committed to cleaning the bay. Work is due to be
completed in 2017. Here’s the link to the project:
http://www.portgamblebaycleanup.com/#!project-information/cnkf
Another fact that makes Port Gamble unique is its reliance on tourism.
4. What government comprehensive plan covers your area? What are the major goals it
sets for your community? What are the biggest problems it identifies?
Kitsap County Comprehensive Plan is being reviewed and revised with a deadline of June 2016.
The Kingston “downtown” area is defined as “Urban High” density with the adjacent areas
defined as either “Urban Low” or “Rural Residential”.
Urban High definition: This zone is intended to provide for multiple-family residential and
professional office development based upon compatibility with surrounding land uses. The
primary use of this zone is intended to be high density residential. Professional office use is
intended to compliment and support the residential use within the zone and be consistent with,
and in conjunction with, residential development.
Urban Low definition: The intent of this zone is to recognize, maintain, and encourage urban low
density residential areas by including a full range of urban services and facilities that are
adequate at the time of development. This zone is also intended to create cost-efficient
residential areas which are capable of allowing the provision of community services in a more
economical manner.
Rural Residential definition: This zone promotes low-density residential development consistent
with rural character. It is applied to areas that are relatively unconstrained by environmentally
sensitive areas or other significant landscape features. These areas are provided with limited
public services.
In my view,the biggest problem facing the development of downtown Kingston i s the traffic and
parking woes caused by the ferry’s location in the downtown core area. This problem is the
greatest during the summer vacation season but causes problems year round. If more housing
could be developed in this downtown core area, residents could walk to restaurants, shops and
the ferry.
5. Where do people gather in your community? These can be physical places, like bars or
churches, or social ones, like Rotary meetings or music events .
Churches are an important gathering place. Bayside Church has rooms available for the
community and the Garden Club meets there. The Senior Center is a gathering place. The
Kiwanis Club is dwindling while the Rotary Club is growing. The Rotary meets at the Yacht Club.
Membership is required at the Yacht Club unless attending a club meeting there. In the summer
there are concerts at Waterfront Park in the evening and the Farmer’s Market in the daytime.
There is a new brew pub in town—Downpour—which has become very popular. Several
restaurants have closed or moved away from town. White Horse Golf Club also hosts events.
6. What organizations provide social services, recreation services, or educational services
in your community? What community needs have they identified?

35
• Social Services:
Kingston Food Bank, North Kitsap Boys and Girls Club, Sharenet, Chuckwagon, Senior Foot Care
once a month, Bridge every Monday in the Senior Center
• Recreation Services:
Mike Wallace Waterfront Park, North Kitsap Heritage Park, North Kitsap Trails Association,
Kingston Cove Yacht Club, White Horse Golf Club, Olympic Outdoor Center in Port Gamble rents
bicycles and kayaks
• Educational Services:
There is nothing in Kingston itself. People who are looking for educational opportunities
commute to Olympic College (Poulsbo and Bremerton) or to Edmonds Community College.
7. What groups did you not know were in your community? Were some larger than you
realized, or have unique needs you weren’t aware of?
I didn’t realize that there would be a problem of homelessness here and that there is no real
provision for the homeless. More social services are needed in the community. Sharenet is
located 2 miles out of town. The only food bank in town is an unofficial one operated by
volunteers out of a RV.
8. What overall conclusions do you draw about the makeup of your community?
There is a sense that the county often ignores the needs of this community though the current
commissioner (Gelder) has an appointed advisory board and makes a walk through town every
Saturday. Sometimes people from the Village Green or the Metropolitan Park District join him.
He seems to be trying to make himself available to people who might have questions or
complaints. According to my information, local residents often ignore the county and act on
their own when they see a problem such as upkeep needed on the parks or Community Center.
9. The next step in this process will be identifying groups for community discussions. We
want to hear about the needs of a wide and representative cross-section of those we serve.
Based on what you’ve learned from the data, who do you think we should talk with? Why?
Kingston Chamber of Commerce
Greater Kingston Kiwanis
Kingston-North Kitsap Rotary
North Kitsap Boys and Girls Club
Village Green Foundation
Sources Cited:
Demographics Now
Interview with Tomi Whalen
Websites for Port Gamble and Kingston

36
Little Boston and North Prepared by Tressa Johnson
Please note: this report was written without the input or review of an official representative of the
Port Gamble S’Klallam Tribe.
1. What is the demographic makeup of your service area? Provide an overview of data on
age, race and ethnicity, income, and occupation. Also describe any other demographic points
that are unique or salient in your community.
Total Population1: Percent Change:
2010
Census 2015A
Estimates 2020
Projections 2000 to
2010 2015 to
2020
4,496 4,561 5,076 23.5% 11.3%
Total Households2: Percent Change:
1 Alteryx Inc. (2016). Demographic Detail Summary, Geography: Little Boston Library service area. Retrieved
February 11, 2016, from DemographicsNow Library Edition database.
2 Alteryx Inc. (2016). Demographic Detail Summary, Geography: Little Boston Library service area. Retrieved
February 11, 2016, from DemographicsNow Library Edition database.
2010
Census
2015A
Estimates
2020
Projections
2000 to
2010
2015 to
2020
1,851 1,878 2,104 26.5% 12.0%

37
Population by Age3: _______________________________________ Percent Change:
2010 2015A 2020
Census % Estimates % Projections % 2000 to
2010 2015 to
2020
0 to 4 216 4.7% 205 4.5% 201 3.9% -8.7% -2.0%
5 to 14 522 11.6% 488 10.7% 500 9.8% -8.3% 2.5%
15 to 19 296 6.5% 274 6.0% 280 5.5% 47.0% 2.1%
20 to 24 195 4.3% 250 5.4% 272 5.3% 39.6% 8.6%
25 to 34 308 6.8% 355 7.7% 444 8.7% -15.1% 25.0%
35 to 44 479 10.6% 431 9.4% 431 8.4% -13.7% 0.0%
45 to 54 762 16.9% 679 14.8% 617 12.1% 31.8% -9.0%
55 to 64 806 17.9% 778 17.0% 868 17.1% 91.4% 11.5%
65 to 74 579 12.8% 700 15.3% 921 18.1% 78.9% 31.6%
75 to 84 253 5.6% 307 6.7% 425 8.3% 18.6% 38.6%
85+ 76 1.6% 89 1.9% 111 2.2% 120.8% 25.2%
Population by Race/Ethnicity4: ___________________________________________ Percent
Change
2010 2015A 2020
Census % Estimates % Projection
s %
2000 to
2010
2015 to
202
0
White 3,611 80.3% 3,632 79.6% 4,043 79.6% 24.5% 11.3%
Black 18 0.4% 17 0.3% 19 0.3% 1,686.2% 14.2%
American Indian or
Alaska
Native
627 13.9% 653 14.3% 678 13.3% 30.7% 3.9%
3 Alteryx Inc. (2016). Demographic Detail Summary, Geography: Little Boston Library service area. Retrieved
February 11, 2016, from DemographicsNow Library Edition database.
4 Alteryx Inc. (2016). US ACS Race Ethnicity Ancestry Summary, Geography: Little Boston Library service area.
Retrieved from DemographicsNow Library Edition database.

38
Asian/Native Hawaiian/Other Pacific Islander
64 1.4% 67 1.4% 84 1.6% -6.0% 23.9%
Some Other
Race
17 0.3% 20 0.4% 27 0.5% -66.3% 34.0%
Two or More
Races
159 3.5% 171 3.7% 225 4.4% 12.8% 31.1%
Hispanic Ethnicity
128 2.8% 142 3.1% 176 3.4% 55.4% 24.1%
Not Hispanic
or Latino
4,368 97.1% 4,419 96.8% 4,900 96.5% 22.8% 10.8%
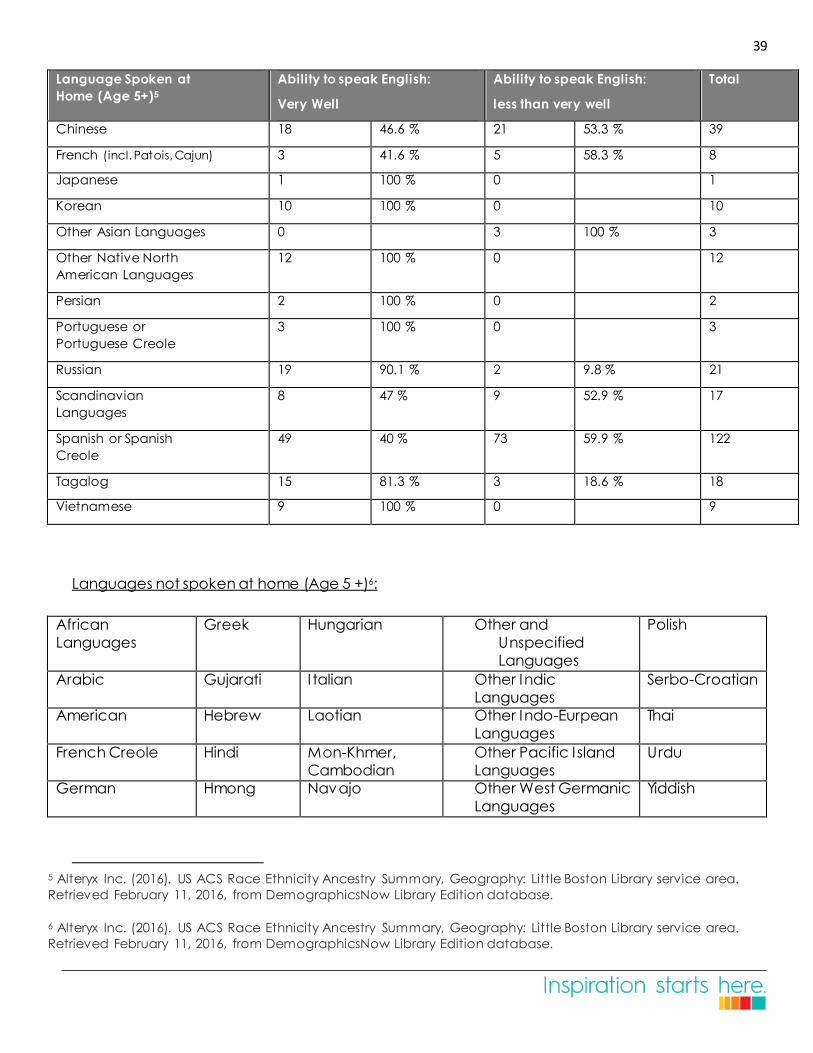
39
Languages not spoken at home (Age 5 +)6:
5 Alteryx Inc. (2016). US ACS Race Ethnicity Ancestry Summary, Geography: Little Boston Library service area.
Retrieved February 11, 2016, from DemographicsNow Library Edition database.
6 Alteryx Inc. (2016). US ACS Race Ethnicity Ancestry Summary, Geography: Little Boston Library service area.
Retrieved February 11, 2016, from DemographicsNow Library Edition database.
Language Spoken at
Home (Age 5+)5
Ability to speak English:
Very Well
Ability to speak English:
less than very well
Total
Chinese 18 46.6 % 21 53.3 % 39
French (incl. Patois, Cajun) 3 41.6 % 5 58.3 % 8
Japanese 1 100 % 0 1
Korean 10 100 % 0 10
Other Asian Languages 0 3 100 % 3
Other Native North
American Languages
12 100 % 0 12
Persian 2 100 % 0 2
Portuguese or
Portuguese Creole
3 100 % 0 3
Russian 19 90.1 % 2 9.8 % 21
Scandinavian
Languages
8 47 % 9 52.9 % 17
Spanish or Spanish
Creole
49 40 % 73 59.9 % 122
Tagalog 15 81.3 % 3 18.6 % 18
Vietnamese 9 100 % 0 9
African
Languages
Greek Hungarian Other and
Unspecified
Languages
Polish
Arabic Gujarati I talian Other Indic
Languages
Serbo-Croatian
American Hebrew Laotian Other Indo-Eurpean
Languages
Thai
French Creole Hindi Mon-Khmer,
Cambodian
Other Pacific I sland
Languages
Urdu
German Hmong Navajo Other West Germanic
Languages
Yiddish

40
Households by Income7: ____ __ ___ Percent
Change:
2010 2015A 2020
Census % Estimates % Projection
s % 2000 to
2010
2015 to
202
0
$0 - $15,000 121 6.5% 147 7.8% 140 6.6% -18.3% -4.9%
$15,000 -
$24,999 163 8.8% 187 9.9% 185 8.7% 3.7% -1.0%
$25,000 -
$34,999 139 7.5% 140 7.4% 143 6.8% -16.0% 1.7%
$35,000 - $49,999
285 15.4% 291 15.5% 286 13.6% 22.3% -1.6%
$50,000 -
$74,999 344 18.6% 354 18.8% 355 16.8% 9.1% 0.1%
$75,000 -
$99,999 353 19.0% 315 16.7% 371 17.6% 66.2% 17.8%
$100,000 - $149,999
288 15.6% 280 14.9% 398 18.9% 150.6% 42.0%
$150,000 + 154 8.3% 160 8.5% 223 10.6% 122.7% 39.2%
Average/Median/Per Capita Income8: ___________________________________ Percent
Change:
2010
Census
2015A
Estimates 2020
Projections
2000 to
2010
2015 to
2020
Average Hhld
Income $81,493 $78,068 $87,483 34.3% 12.0%
Median Hhld
Income $62,919 $59,072 $70,050 25.2% 18.5%
Per Capita Income
$33,552 $32,147 $36,261 37.6% 12.7%
7 Alteryx Inc. (2016). Demographic Detail Summary, Geography: Little Boston Library service area. Retrieved
February 11, 2016, from DemographicsNow Library Edition database.
8 Alteryx Inc. (2016). Demographic Detail Summary, Geography: Little Boston Library service area. Retrieved
February 11, 2016, from DemographicsNow Library Edition database.

41
“The Port Gamble S’Klallam reservation contains the highest percentage of families living in
poverty of any community in Kitsap County. According to the Kitsap Interagency Coordinating
Council 2011 Comprehensive Community Assessment, the on-reservation population living
below the poverty line is 21%. Compare this to the state’s 12.1% and Kitsap County’s relatively
low 9.4%.” (CEDS, 2014, p. 24)9
Employment10: ___ Percent
Change:
2010 2015A 2020
Census % Estimates % Projection
s % 2000 to
2010
2015 to
202
0
Total Population
16+ 3,689 3,811 4,314 31.9% 16.9%
Total Labor
Force 2,061 55.8% 2,088 54.7% 2,332 54.0
% 28.3% 11.6%
Civilian,
Employed 1,874 90.8% 1,931 92.4% 2,165 92.8
% 24.9% 12.1%
Civilian,
Unemploye
d 145 7.0% 114 5.4% 121 5.1% 116.6% 5.9%
In Armed Forces 43 2.1% 43 2.0% 46 1.9% 10.2% 5.4%
Not In Labor
Force 1,627 44.1% 1,723 45.2% 1,982 45.9
% 36.8% 14.9%
% Blue Collar 691 36.8% 720 37.3% 812 42.0
% 18.2% 12.6%
% White Collar 1,182 63.1% 1,209 62.6% 1,353 70.0% 29.4% 11.8%
9 Port Gamble S’Klallam Tribe, the Noo-Kayet Development Corporation. (2014). Port Gamble S’Klallam Tribe
Comprehensive Economic Development Strategies [PDF file]. Retrieved February 22, 2016 from
https://www.pgst.nsn.us/tribal-enterprises/noo-kayet-development
10 Alteryx Inc. (2016). Demographic Detail Summary, Geography: Little Boston Library service area. Retrieved
February 11, 2016, from DemographicsNow Library Edition database.

42
U.S. Census 2000 Employment Summary11:
2000 Means of Transportation to Work
2000 Travel Time to Work
Workers Age 16+ 1,461 Median Travel Time To Work in Minutes
31
Bicycle 0.2% 0 to 5 4.1%
Bus or trolley bus 2.3% 5 to 9 9.3%
Carpooled 16.3% 10 to 14 4.6%
Drove alone 66.6% 15 to 19 10.0%
Ferryboat 3.8% 15 to 24 8.0%
Motorcycle 0.7% 25 to 29 5.7%
Other means 1.3% 30 to 34 13.9%
Railroad 0.0% 35 to 39 2.4%
Streetcar or trolley car
0.0% 40 to 44 4.9%
Subway or elevated 0.0% 45 to 59 4.6%
Taxicab 0.0% 60 to 89 7.5%
Walked 1.7% 90 or more 17.8%
Worked at home 9.3% Worked at home 9.3%
2000 Employment by Industry: Sorted Descending By Percent12
Retail trade 12.6%
Public administration 12.4%
Manufacturing 10.0%
Professional scientific and technical services
9.7%
Construction 9.0%
Educational services 7.4%
Health care and social assistance 6.6%
Other services (except public admin) 5.1%
Transportation and warehousing 4.2%
Accommodation and food services 3.7%
Finance and insurance 3.4%
Administrative and support and waste management services
3.3%
Information 3.3%
Arts entertainment and recreation 2.6%
Wholesale trade 2.4%
Real estate and rental and leasing 1.9%
11 Alteryx Inc. (2016). US Census 2000 Employment Summary, Geography: Little Boston Library service area.
Retrieved February 16, 2016 from DemographicsNow Library Edition database.
12 Alteryx Inc. (2016). US Census 2000 Employment Summary, Geography: Little Boston Library service area.
Retrieved February 16, 2016 from DemographicsNow Library Edition database.

43
2000 Employment by Industry: Sorted Descending By Percent12
Agriculture forestry fishing and hunting
1.5%
Utilities 0.0%
Mining 0.0%
2000 Employment by Occupation: Sorted Descending By Percent13
Office and administrative support occupations
11.6%
Management occupations except farmers and farm managers
11.4%
Sales and related occupations 9.9%
Construction trades workers 7.7%
Education training and library occupations
5.6%
Production occupations 5.3%
Food preparation and serving related occupations
4.5%
Installation maintenance and repair occupations
4.2%
Building and grounds cleaning and maintenance occs
4.0%
Personal care and service occupations
3.7%
Arts design entertainment sports and media occupations
3.0%
Legal occupations 2.5%
Community and social services occupations
2.3%
Motor vehicle operators 2.2%
Computer and mathematical occupations
2.1%
Business operations specialists 2.1%
Architects surveyors cartographers and engineers
2.0%
Health diag and treating practitioners and technical occs
1.6%
Health technologists and technicians 1.6%
Healthcare support occupations 1.6%
Financial specialists 1.5%
Material moving workers 1.4%
Supervisors construction and extraction workers
1.3%
13 Alteryx Inc. (2016). US Census 2000 Employment Summary, Geography: Little Boston Library service area.
Retrieved February 16, 2016 from DemographicsNow Library Edition database.

44
2000 Employment by Occupation: Sorted Descending By Percent13
Fire fighting and law enforcement incl supervisors
1.3%
Drafters engineering and mapping technicians
1.1%
Farmers and farm managers 1.0%
Farming fishing and forestry occupations
0.9%
Rail water and other transportation occupations
0.5%
Life physical and social science occupations
0.4%
Other protective service workers including supervisors
0.2%
Supervisors transportation and material moving workers
0.1%
Aircraft and traffic control occupations
0.0%
Extraction workers 0.0%
U.S. Census Bureau, Employment Data for Hansville, WA14
14 United States Census Bureau/ American FactFinder. (2014). “DP03: Selected Economic Characteristics.” 2010-
2014 American Community Survey. U.S. Census Bureau’s American Community Survey Office. Retrieved
February 22, 2016 from http://factfinder2.census.gov
Hansville CDP [Census Designated Place], Washington Estimate
EMPLOYMENT STATUS
Population 16 years and over 2,930
In labor force 1,651
Civilian labor force 1,651
Employed 1,520
Unemployed 131
Armed Forces 0
Not in labor force 1,279
Civilian labor force 1,651
Percent Unemployed (X)
Females 16 years and over 1,534
In labor force 824
Civilian labor force 824
Employed 740
Own children under 6 years 240
All parents in family in labor force 72
Own children 6 to 17 years 347
All parents in family in labor force 217
COMMUTING TO WORK
Workers 16 years and over 1,520

45
Car, truck, or van -- drove alone 1,010
Car, truck, or van -- carpooled 76
Public transportation (excluding taxicab) 315
Walked 0
Other means 16
Worked at home 103
Mean travel time to work (minutes) 50.2
OCCUPATION
Civilian employed population 16 years and over 1,520
Management, business, science, and arts occupations 537
Service occupations 381
Sales and office occupations 228
Natural resources, construction, and maintenance occupations 96
Production, transportation, and material moving occupations 278
INDUSTRY
Civilian employed population 16 years and over 1,520
Agriculture, forestry, fishing and hunting, and mining 0
Construction 124
Manufacturing 151
Wholesale trade 0
Retail trade 82
Transportation and warehousing, and utilities 151
Information 83
Finance and insurance, and real estate and rental and leasing 0
Professional, scientific, and management, and administrative and waste
management services 206
Educational services, and health care and social assistance 359
Arts, entertainment, and recreation, and accommodation and food services 149
Other services, except public administration 76
Public administration 139
CLASS OF WORKER
Civilian employed population 16 years and over 1,520
Private wage and salary workers 891
Government workers 453
Self-employed in own not incorporated business workers 176
Unpaid family workers 0
INCOME AND BENEFITS (IN 2014 INFLATION-ADJUSTED DOLLARS)
Total households 1,564
Less than $10,000 65
$10,000 to $14,999 31
$15,000 to $24,999 111
$25,000 to $34,999 169
$35,000 to $49,999 167
$50,000 to $74,999 417
$75,000 to $99,999 114
$100,000 to $149,999 327
$150,000 to $199,999 134
$200,000 or more 29
Median household income (dollars) 65,859
Mean household income (dollars) 77,237
With earnings 1,075
Mean earnings (dollars) 70,992
With Social Security 572

46
U.S. Census Bureau, Health Insurance Data for Hansville, WA15
HEALTH INSURANCE COVERAGE
Civilian noninstitutionalized population 3,573
With health insurance coverage 3,312
With private health insurance 2,802
With public coverage 1,372
No health insurance coverage 261
Civilian noninstitutionalized population under
18 years 679
No health insurance coverage 0
Civilian noninstitutionalized population 18 to 64
years 2,080
In labor force: 1,520
Employed: 1,389
With health insurance coverage 1,251
With private health insurance 1,215
With public coverage 101
15 United States Census Bureau/ American FactFinder. (2014).“DP03: Selected Economic Characteristics.” 2010-
2014 American Community Survey. U.S. Census Bureau’s American Community Survey Office. Retrieved
February 22, 2016 from http://factfinder2.census.gov
Mean Social Security income (dollars) 18,004
With retirement income 508
Mean retirement income (dollars) 36,160
With Supplemental Security Income 65
Mean Supplemental Security Income (dollars) 14,366
With cash public assistance income 13
Mean cash public assistance income (dollars) 2,462
With Food Stamp/SNAP benefits in the past 12 months 0
Families 1,094
Less than $10,000 34
$10,000 to $14,999 0
$15,000 to $24,999 70
$25,000 to $34,999 90
$35,000 to $49,999 121
$50,000 to $74,999 324
$75,000 to $99,999 95
$100,000 to $149,999 224
$150,000 to $199,999 107
$200,000 or more 29
Median family income (dollars) 73,189
Mean family income (dollars) 83,089
Per capita income (dollars) 34,218
Nonfamily households 470
Median nonfamily income (dollars) 41,786
Mean nonfamily income (dollars) 62,536
Median earnings for workers (dollars) 38,397
Median earnings for male full-time, year-round workers (dollars) 69,089
Median earnings for female full-time, year-round workers (dollars) 44,602
Alteryx Inc. (2016). US Census 2000
Employment Summary,
Geography: Little Boston Library
serv ice area. Retrieved February
16, 2016 from DemographicsNow
Library Edition database.

47
No health insurance coverage 138
Unemployed: 131
With health insurance coverage 57
With private health insurance 57
With public coverage 0
No health insurance coverage 74
Not in labor force: 560
With health insurance coverage 511
With private health insurance 313
With public coverage 242
No health insurance coverage 49
2. Using the Mosaic Population Comparison report in DemographicsNow, describe the
largest Mosaic clusters in your community.
Booming and Consuming16 – 2,555 – 56%
“Older empty-nesting couples and singles enjoying relaxed lives in small towns”
“Older couples and singles who are beginning to enjoy the first years of retirement.”
Key Traits:
Middle-class
Zealous Internet Users
Disposable Income
Open-minded
Pristine small-town communities
Busy Social Lives
Risk-adverse investors
Cultured sensibilities
Pragmatic Shoppers
Involved citizens
Unspoiled Splendor17 – 1,061 – 23.2%
“Comfortably established baby boomer couples in town and country communities”
“Predominantly white, older married couples with grown children.”
Key Traits:
Upper middle-class
Empty-nesters
16 Experian Marketing Services. (n.d.). Type L41: Booming and Consuming. Mosaic USA. Retrieved February 12,
2016, from DemographicsNow Library Edition database.
17 Experian Marketing Services. (n.d.). Type E21: Unspoiled Splendor. Mosaic USA. Retrieved February 12, 2016,
from DemographicsNow Library Edition database.

48
Traditional
Rustic outdoor sports
Conservative finances
Coupon favorable
American-made
Community-minded
Price-conscious
Internet pragmatics
Red, White and Bluegrass18 – 935 – 20.5%
“Lower middle-income rural families with diverse adult and children household dynamics”
“Young white families in rural and small-town settings. Nine out of ten households contain
married couples with kids. Many of the families are large and multi -generational: about half
contain five or more people, and nearly a quarter contain an aged parent or a young adult.”
Key Traits:
Working-class lifestyles
Young children
Convenience foods
Utilitarian shoppers
Buy American
Workboots and jeans
Religious conservatives
Avid radio listeners
Family-centered activities
Rural Communities
3. What is the geography of your area? Where do various communities live? Where do
people work? How are voting districts divided? Are there areas that stand out in some way?
The Greater Hansville Area (GHA) consists of 3 distinct communities: Hansville, Eglon, and the
Port Gamble S’Klallam Tribe.
18 Experian Marketing Services. (n.d.). Type M44: Red, White and Bluegrass. Mosaic USA. Retrieved February 12,
2016, from DemographicsNow Library Edition database.

49
Voting Districts for the Greater Hansville Area are as follows:
Federal Congressional District19: 6
State Legislative District20: 23
County Commissioner District21: 1
Public Utility District22: No. 1
North Kitsap School District (includes the Reservation)23
North Kitsap Fire & Rescue District24 (includes the Reservation)25
Port of Eglon District26: 4
The Port Gamble S’Klallam Tribe is a sovereign nation, which exercises full governmental control
over its land and resources. As a sovereign nation it is free from external government control or
political authority.
The Tribe’s General Council is composed of all eligible voters of the Port Gamble S’Klallam Tribe.
All Tribal members who are 18 years or older are eligible to vote in tribal elections and
participate in open tribal meetings27.
Tribal Council holds legislative authority within reservation boundaries, and consists of six elected
positions. Each position has a term of 2 years; 3 positions stand for election in any given year 28.
19 Kitsap County Office of the Auditor. (2015). Contressional District 6, Kitsap County Washington [PDF file].
Retrieved February 22, 2016 from http://www.kitsapgov.com/aud/elections/maps.htm
20 Kitsap County Office of the Auditor. (2015). Kitsap County Legislative District 23 [PDF file]. Retrieved February
22, 2016 from http://www.kitsapgov.com/aud/elections/maps.htm
21 Kitsap County Office of the Auditor. (2015). Kitsap County Commissioner District 1 [PDF file]. Retrieved
February 22, 2016 from http://www.kitsapgov.com/aud/elections/maps.htm
22 Kitsap County Office of the Auditor. (2015). Public Utility District No. 1, Kitsap County, Washington [PDF file].
Retrieved February 22, 2016 from http://www.kitsapgov.com/aud/elections/maps.htm
23 Kitsap County Elections. (2012). North Kitsap School District [PDF file]. Retrieved February 22, 2016 from
http://www.kitsapgov.com/aud/elections/maps.htm
24 Kitsap County Office of the Auditor. (2013). North Kitsap Fire & Rescue [PDF file]. Retrieved February 22, 2016
from http://www.kitsapgov.com/aud/elections/maps.htm
25 North Kitsap Fire & Rescue, Port Gamble S’Klallam Tribe. (2013). Fire Protection and Emergency Medical
Services Agreement [PDF file]. Retrieved February 17, 2016 from
http://nkfr.org/information/interlocal-agreements/
26 Kitsap County Office of the Auditor. (2013). Port of Eglon District No. 4 [PDF file]. Retrieved February 22, 2016
from http://www.kitsapgov.com/aud/elections/maps.htm
27 Constitution of the Port Gamble S'Klallam Tribe. (2013) [PDF file]. Port Gamble S'Klallam Election Committee.
Retrieved February 11, 2016, from https://www.pgst.nsn.us/government/law-and-order-code
28 Constitution of the Port Gamble S'Klallam Tribe. (2013) [PDF file]. Port Gamble S'Klallam Election Committee.
Retrieved February 11, 2016, from https://www.pgst.nsn.us/government/law-and-order-code

50
The Judicial power of the Tribe lies with the Tribal Court and the Tribal Court of Appeals29.
The Port Gamble S’Klallam Tribe operates, maintains and manages their water and sewer
utilities30.
“Commercial fishing is the number one economic resource for Port Gamble S’Klallam
community members… the number of registered Port Gamble S’Klallam commercial fishermen
has increased almost 57% from 2005-2012. In 2012, there were 228 Tribal members who were
registered to fish and shellfish harvest for purposes of selling to a third party. With a total
population (living on and off the reservation) of approximately 1200, this means almost 20% of
Tribal members engage in commercial fishing at some level whether as a primary or secondary
income source.” (CEDS, 2014, p. 24)31
4. What government comprehensive plan covers your area? What are the major goals it
sets for your community? What are the biggest problems it identifies?
Hansville and Eglon are unincorporated, rural areas; Kitsap County governs and regulates all
unincorporated areas in the County, including Hansville and Eglon. Major County services that
affect the GHA include Community Development, Sheriff’s Patrol and Transportation.
The Parks and Recreation Department is also important to GHA since Buck Lake Park, the
Greenway, Point No Point Lighthouse Park, Norwegian Pont Park and Lower Parks Pond are
either owned or operated by the County.
The County established the Greater Hansville Area Advisory Council (GHAAC) in 2007, which
created the 2009 Greater Hansville Community Plan32.
The GHAAC authored work plans in 2010, 2011 and 201333.
Major Goals of the 2013 Greater Hansville Area Work Plan34:
1. Coordinate information sharing among GHA neighborhoods to improve community
livability and economy.
29 Constitution of the Port Gamble S'Klallam Tribe. (2013) [PDF file]. Port Gamble S'Klallam Election Committee.
Retrieved February 11, 2016, from https://www.pgst.nsn.us/government/law-and-order-code
30 Port Gamble S’Klallam Tribe Law and Order Code, Title 19 – Utility Code [PDF file]. (2014). Retrieved February
17, 2016, from https://www.pgst.nsn.us/government/law-and-order-code
31 Port Gamble S’Klallam Tribe, the Noo-Kayet Development Corporation. (2014). Port Gamble S’Klallam Tribe
Comprehensive Economic Development Strategies [PDF file]. Retrieved February 22, 2016 from
https://www.pgst.nsn.us/tribal-enterprises/noo-kayet-development
32 Kitsap County, Department of Community Development (2009). Executive Summary, Greater Hansville
Community Plan [PDF file]. Retrieved February 16, 2016 from
http://www.kitsapgov.com/boards/CAC/ghaac/ghaac%20com munity%20plan/ghaac_comm_plan.htm
33Greater Hansville Area Advisory Council. (April 21, 2014). Retrieved February 12, 2016, from
http://www.kitsapgov.com/boards/CAC/ghaac/ghaac_main.htm
34 Greater Hansville Area Advisory Council. (2013). Greater Hansville Area Advisory Council 2013 Work Plan [PDF
file]. Retrieved February 12, 2016, from http://www.kitsapgov.com/boards/CAC/ghaac/ghaac_main.htm

51
2. Develop an emergency management program for the community
3. Continue to track development issues
4. Increase regional networking with other planning efforts
5. Enhance community infrastructure
6. Support saltwater parks development and improvement
7. Support Kitsap Forest Bay Project
8. Maintain a medical equipment exchange list
9. Encourage information sharing between area neighborhoods.
10. Encourage information sharing between area community groups
In 2013 the GHAAC disbanded. The County website directs people to http://www.hansville.org/,
a website for the Greater Hansville Community Center35. The Greater Hansville Community
Center Board meets monthly and posts their minutes; while there are only 35 individual members
of the Center (and a number of businesses), the Board is active in maintaining the Center as a
community center. They publish a monthly newsletter, The Hansville Log, available in both digital
and paper formats.
In 2002 the Port Gamble S’Klallam Tribe created a Long Range Plan, Years: 2002-2006. While a
more recent Community Plan, per se, was not found, the Tribe worked with the Noo-Kayet
Development Corporation (NKDC) to develop Comprehensive Economic Development
Strategies (CEDS), published in 201436.
This document provides a broad overview of the community and its fundamental philosophy
and values. In my opinion this document provides an excellent place to start when learning
about the tribe; its history, geography, community, government, its culture.
Partial list of goals identified by the CEDS:
“Another key to economic success in the future will be the inclusion of tribal values and
culture… Even in today’s modern world traditional ways are important and should be
cornerstone to the development and operations of all Port Gamble S’Klallam ventures.”
(CEDS, 2014, p.8)
“Implement the approved sewer plan to increase system capacity for new
development.” (CEDS, 2014, p. 16)
“Continue to develop and implement plans for roads and trails, with assistance of the
BIA.” (CEDS, 2014, p. 16).
“Develop and expand economic opportunities in connection with natural resources.”
(CEDS, 2014, p. 20)
Partial list of challenges identified by the CEDS:
“Most recently, the Tribe was recognized for being the first in the Nation to develop a
contract with the United States for caring for our foster children. The Tribe is regularly
sharing their work and assisting other tribes to develop their systems, which exemplify the
Tribal value of contributing to the World Community. Lately, the requests have
35 Greater Hansville Area Advisory Council. (April 21, 2014). Retrieved February 12, 2016, from
http://www.kitsapgov.com/boards/CAC/ghaac/ghaac_main.htm
36 Port Gamble S’Klallam Tribe, the Noo-Kayet Development Corporation. (2014). Port Gamble S’Klallam Tribe
Comprehensive Economic Development Strategies [PDF file]. Retrieved February 22, 2016 from
https://www.pgst.nsn.us/tribal-enterprises/noo-kayet-development

52
outweighed the resources and staff is being taken away from the clients to share our
innovative ways of providing services to other tribes and communities.” (CEDS, 2014, p.7)
“… we have an increasing number of homeless people on the reservation, which is not
strictly due to a lack of housing and are driven by socio- economic problems that affect
an individual’s ability to obtain suitable housing.” (CEDS, 2014, p. 16)
“Unlike fishing rights, hunting rights have not yet been defined through litigation in the
federal courts.” (CEDS, 2014, p. 22)
“The Port Gamble S’Klallam reservation contains the highest percentage of families living
in poverty of any community in Kitsap County. According to the Kitsap Interagency
Coordinating Council 2011 Comprehensive Community Assessment, the on-reservation
population living below the poverty line is 21%. Compare this to the state’s 12.1% and
Kitsap County’s relatively low 9.4%.” (CEDS, 2014, p. 24)
“Because the reservation does not offer much in the way of retail diversity, the money
earned by Port Gamble S’Klallam’s fishers is mostly spent off reservation with nonTribal
businesses.” (CEDS, 2014, p. 25)
“According to 2011 American Community Survey 5-year estimates the unemployment
rate for Kitsap County is 8.9%. For the PGST community, that percentage is dramatically
higher at 16.0%.” (CEDS, 2014, p. 28)
5. Where do people gather in your community? These can be physical places, like bars or
churches, or social ones, like Rotary meetings or music events .
Hansville: Greater Hansville Community Center, Driftwood Key Clubhouse, Hansville Community
Church, Hansville Grocery. Flotsam and Jetsam Garden Club, Men’s Koffee Klatch. Please see
the events calendar, maintained by the Greater Hansville Community Center,
http://www.hansville.org/index.php/events
Eglon: Eglon Schoolhouse, Eglon Community Church, a boat launch, a beach, and a picnic
area. Local events include: Candle Light Thanksgiving Potluck, twice-yearly Craft and Bake
Sales, and weekly Summer Beach Nights.
Port Gamble S’Klallam:
Please note: this list was drafted without the input or review of an official representative of the
Port Gamble S’Klallam Tribe.
Church, Tribal Center, Heronswood, Long House, Elder Center
6. What organizations provide social services, recreation services, or educational services
in your community? What community needs have they identified?
Please note: with regard to the Reservation, the following was drafted without the input or
review of an official representative of the Port Gamble S’Klallam Tribe.
• Social Services:
Greater Hansville Area: Kingston Food Bank, Sharenet Food Bank, Hansville
Port Gamble S’Klallam: Wellness Center
• Recreation Services:
Greater Hansville Area: Hansville Art Guild, Hansville Greenway Association,
Port Gamble S’Klallam: Skateboard Park, Youth Center

53
• Educational Services:
Greater Hansville Area: Greater Hansville Community Center,
Port Gamble S’Klallam: Education Center
7. What groups did you not know were in your community? Were some larger than you
realized, or have unique needs you weren’t aware of?
This entire region of the County was essentially unknown to me prior to undertaking this research.
8. What overall conclusions do you draw about the makeup of your community?
The Port S'Klallam Tribe is distinct from the surrounding communities.
9. The next step in this process will be identifying groups for community discussions. We
want to hear about the needs of a wide and representative cross-section of those we serve.
Based on what you’ve learned from the data, who do you think we should talk with? Why?
Any project or action which may involve or impact the Port Gamble S’Klallam Tribe should be
approached with the care and respect due any sovereign nation.
I suggest that Tomi Whalen act as the primary Library liaison with the Tribe. She not only serves
the Tribe as Branch Manager, she has long and ongoing personal ties to the community.
Perhaps most important, she has an awareness of the ways in which County and Tribal cultures
both complement and reflect each other.
In the Greater Hansville Area, a few groups that may merit visiting include:
The Men’s Koffee Klatch (as per GHCC website, contact Tom at 638-0142. http://www.hansv ille.org/index.php/community-links/clubs-and-organizations/44-mens-koffee-
klatch)
Greater Hansville Community Center Board (President, Connie Gordon. 360-271-6166)
Neighbors’ Lunch (3rd Wed, includes a presentation of interest to the community.
Contact: Judy Hutchinson, 360-638-2871)
Sources Cited:
See footnotes.

54
Poulsbo / North Kitsap
1. What is the demographic makeup of your service area? Provide an overview of data on
age, race and ethnicity, income, and occupation. Also describe any other demographic points
that are unique or salient in your community.
Demographic Makeup of the Area:
This report covers the communities of Poulsbo, Suquamish and Indianola (Zip Codes 98370, 98392
and 98342).
Before viewing the demographic reports for these three zip codes, it is important to note some
very significant and unique neighbors:
Suquamish Tribe/Port Madison Reservation
The ancestral Suquamish have lived in this area for approximately 10,000 years. Of the 950
enrolled members of the Suquamish Tribe, half live on the Port Madison Indian Reservation.
The Suquamish are currently experiencing a cultural resurgence and financial benefits from the
many successful business ventures of Port Madison Enterprises such as the Suquamish Clearwater
Casino Resort, White Horse Golf Club, Kiana lodge, PME Retail, Property Management and
subsidiaries in construction. The tribe has been able to reacquire land lost during the historic
allotment era, and now owns more than half of the land of the reservation for the first time in
recent history. Port Madison Enterprises, governed by a seven-member board of directors
including a Tribal Council liaison, is the second-largest private-sector employer in Kitsap County
with 752 employees.
As of 2014, the reservation area consists of 7,657 acres, of which 1,475 acres are owned by the
Suquamish Tribe, 2,601 acres are owned by individual citizens of the Suquamish Tribe, and 3,581
acres are owned by non-Indians.
The Suquamish Tribe itself is governed by a seven-member council, elected by citizens of the
Suquamish Tribe. Government departments include administration, child support enforcement,
community development, court, early learning center, education, fisheries, human services,
legal, natural resources and police (The Tribe contracts with local fire districts for fire protection).
The Tribe continues to exercise treaty rights to fish and gather shellfish and the ancient right to
self-governance, with 240 employees in a variety of government program roles.
Indianola/Port Madison Reservation
The Port Madison reservation is divided by Miller Bay into two separate parcels, with the towns of
Suquamish and Indianola both lying within the bounds of the reservation. The towns of Indianola
and Suquamish are both covered in this data report.
Impact of nearby Keyport/Naval Base Kitsap
Although the Naval Base Kitsap communities are not covered in this report, their impact on
Poulsbo is significant, with Keyport impacting local use of land and w ater and using Poulsbo
goods and services. Until World War II, many Poulsbo residents retained Norwegian as a primary
language and it was the dominant language in the retail markets, until the Navy’s nearby
presence had an enormous impact on the local community, which almost tripled in population
over three years and led to the dominance of English as the primary language for the first time.
Little Norway – not just for tourists
It is vital to capture the strong influence of the historical origins of Poulsbo and its Scandinavian
Heritage – the history and traditions that form a central cultural “personality” and point of pride

55
for Poulsbo residents, reflected in their annual festivals, Historic Downtown, and a significant living
history for local families who still frequently use the Scandinavian specialty foods at Marina
Market. Ballard is no longer able to sustain a Scandinavian specialty market. Poulsbo, however,
can and does support their local Norwegian foods, and people from as far as Ellensburg make
regular trips here to Poulsbo’s Marina Market to find their essential Scandinavian imports. One of
the first reference questions I got after transferring to Poulsbo in 2014 was a Norwegian recipe
question, answered by the library’s special Scandinavian collection. The Scandinavian
immigrants who arrived in the 1880s have a lasting impact on the community today.
98370 Demographic Snapshot (2015): Poulsbo
For the Greater Poulsbo area included in the Zip Code 98370:
The total population is 29,661, 51.6% Female and 48.4% Male, with a median age of 43.9.
The 13,730 employed civilian population age 16+ is 63.9% White Collar and 36.1% Blue Collar.
Population Growth 2000-2010 was 18.7% and is projected to slow down to 6.2% for 2015-2020.
Average Household Income is $86,563, Median is $69,670 and Per Capita Income is $34,482.
Average Income Growth 2000-2010 was 43.9%, and is projected to slow to 10.6% for 2015-2020.
The total number of Households is 11,756, with an Average Household Size of 2.48 people.
Household Growth 2000-2010 was 23.1%, and is projected to slow down to 7.1% for 2015-2020.
The population is 7% Hispanic and 93% Non-Hispanic, 86.4% White, 4.9% Multi-Race, 3.7% Asian,
1.9% Other Race, 1.7% American Indian or Alaska Native, .8% Black and .2% Hawaiian or Pacific
Islander.
98392 Demographic Snapshot (2015): Suquamish
For the Suquamish area included in the Zip Code 98392:
The total population is 3,124, 51.1% Female and 48.9% Male, with a median age of 40.6.
The 1,565 employed civilian population age 16+ is 53.8% White Collar and 46.2% Blue Collar.
Population Growth 2000-2010 was 18.4% and is projected to slow down to 4.4% for 2015-2020.
Average Household Income is $73,889, Median is $59,103 and Per Capita Income is $30,347.
Average Income Growth 2000-2010 was 40.4%, and is projected to slow to 11.7% for 2015-2020.
The total number of Households is 1,269, with an Average Household Size of 2.35 people.
Household Growth 2000-2010 was 19.9%, and is projected to slow to 5.7% for 2015-2020.
The population is 6.5% Hispanic and 93.4% Non-Hispanic, 78% White, 9.5% American Indian or
Alaska Native, 7.6% Multi-Race, 2.5% Asian, 1.4% Other Race, .7% Black and .1% Hawaiian or
Pacific Islander.
98342 Demographic Snapshot (2015): Indianola
For the Indianola area included in the Zip Code 98342:
The total population is 1,603, 50.6% Female and 49.3% Male, with a median age of 41.3.
The 815 employed civilian population age 16+ is 56.7% White Collar and 43.2% Blue Collar.
Population Growth 2000-2010 was 17% and is projected to slow down to 6.3% for 2015-2020.

56
Average Household Income is $87,660, Median is $68,564 and Per Capita Income is $39,744.
Average Income Growth 2000-2010 was 43.6%, and is projected to slow to 11% for 2015-2020.
The total number of Households is 727, with an Average Household Size of 2.53 people.
Household Growth 2000-2010 was 22.9%, and is projected to slow to 7.3% for 2015-2020.
The population is 4.7% Hispanic and 95.3% Non-Hispanic, 86.2% White, 6.5% Multi-Race, 4.0%
American Indian or Alaska Native,1.3% Asian, .6% Other Race, .8% Black and .2% Hawaiian or
Pacific Islander.
See “PL Demographic Detail Summary” and “PL Demographic Trend Comparison” for
projections and trends using combined data on the three zip code areas.
See “PL Household Comparison” for 2015 Household detail for each of the three zip code areas.
See “PL Rank by Race” report for details as of 2015.
See “PL US Census 2010 Ancestry Comparison” for detail for each of the three zip code areas.
Employment & Business Community in the Greater Poulsbo Area
The average commute time is 27.4 minutes, as cited by the City of Poulsbo, for local residents.
See also PL Business Comparison, PL Employment Comparison and #7 (“Surprise – it’s Bigger!”).
2. Using the Mosaic Population Comparison report in DemographicsNow, describe the
largest Mosaic clusters in your community.
Suquamish
Keep in mind we are describing the large, non-Tribal population of Suquamish with many
desirable waterfront properties as well as older modest homes on Tribal land. Many of these
properties are under 100 year leases, some of these are being non-renewed as they come up
and being reacquired by the Suquamish tribe as they become available.
The dominant Mosaic type in Suquamish for these residents is Type L42: Rooted Flower Power
(76.8% of the population). Key traits include home-based activities, political activism, informed
consumers, older suburban homes, approaching retirement, bargain hunters, mail -order buyers,
clubs and volunteering, conservative investors and an interest in philanthropy. These are mid-
scale baby boomer singles and couples rooted in established communities and approaching
retirement.
How we live: They enjoy plenty of home-based leisure activities, spending their free time reading
books and magazines and pursuing traditional hobbies like woodworking and needlepoint. They
spend time in their gardens and may join the Garden Club, but skip the health club. Politically
they tend to be left-of-center Democrats who worry about the ethical lapses of Big Business, but
they’re also sensitive to family values. Firm in their faith and civic activism, they belong to a
variety of local groups and volunteer for community causes.
Digital Behavior : The older Rooted Flower Power nearly missed the digital revolution and many
still don’t get the fascination with social media. They go online for utilitarian purposes like
banking, sending email, reading news and finding medical information. For them, the Internet is
more like a home library and communication tool. With many missing grown children, they have
one of the highest rates in the nation for sending electronic greeting cards.

57
Indianola
As a very small and tight-knit community with a strong identity, it will come as no surprise that
fully 100% of Indianola people are in the same group, Type E21: Unspoiled Splendor . Key traits
include Upper middle-class, empty-nesters, traditional, rustic outdoor sports, conservative
finances, coupon favorable, American-made, community-minded, price-conscious and they
are Internet pragmatics. These are comfortably established baby boomer couples.
How we live: They spend a lot of free time at their homes gardening, reading books,
woodworking and taking photographs. They prefer to cook at home and love outdoor activities.
They are more conservative than the general population with a higher-than-average
concentration of religious people. They are right-of-center with the highest percentage being
Republican.
Digital Behavior: They look to the Internet as a key source for both information and com merce,
using the Web to research projects, and ignoring online advertising.
Poulsbo
The largest group in Poulsbo is Type C11: Aging of Aquarius (35.1%). Key traits include White
collar baby boomers, health conscious, empty nests, cruises, well -educated, eclectic shoppers,
ethically-responsible, enthusiastic investors, brand and store loyal, environmentally-responsible.
These are upscale baby-boomer aged couples.
How we live: Empty-nesting couples between 50 and 65, they enjoy active leisure lives, fitness
clubs, golf, yoga and sailing. They have a cultural streak and enjoy plays, museums and antique
shows. They’re print fans who read daily newspapers and subscribe to magazines that specialize
in business, news and travel. They describe their politics as conservative and most are
Republicans. They are more liberal on environmental issues.
Digital Behavior: They tend to be moderate adopters of technology who regard the Internet as
a source of news and information. They have an above-average tendency to go online at
home, work and hotels. Their idea of online entertainment is sending an e-birthday card. Their
favorite websites include CNN, Expedia and Accuweather.
The second largest group in Poulsbo is Type E21: Unspoiled Splendor (26.1%), described above
under Indianola.
Other sizeable population groups include: H27: Birkenstocks and Beemers (12.4% upper-middle
class established couples), K40: Bohemian Groove (9.9% older divorced and widowed
individuals), C14: Boomers and Boomerangs (8.3% baby boomer adults and their
teenage/young adult children sharing a home) and L41: Booming and Consuming (6.6% older
empty-nesting couples and singles enjoying relaxed small town living). More information about
any of these groups cheerfully available upon request!
3. What is the geography of your area? Where do various communities live? Where do
people work? How are voting districts divided? Are there areas that stand out in some way?
Voting Districts – will we see the players change in 2016?
All of Kitsap County is in Congressional District 6, with Representative Kilmer and Senator Murray
(both Democrats) up for election in 2016.

58
At the state level, these areas are in the 23rd District with State Senator Rolfes, Representative
Hansen and Representative Appleton (all three Democrats) also up for election in 2016.
These three communities are in County District 1, represented by County Commissioner Gelder
(a Democrat), also up for election in 2016.
City of Poulsbo Mayor Erickson and 3 of the 7 City Council positions will be up fo r election in 2017.
North Kitsap School District will have 2 of 5 School Board seats up for election in 2017.
Note this important local dynamic due to voting district lines: City of Poulsbo decisions affect the
greater Poulsbo area, but only those living inside city limits may vote.
Geography
Poulsbo as Crossroads
Poulsbo is the crossroads for many out of area residents from neighboring counties of Jefferson
and Clallam to the north, and commuters and travelers on Highway 3 from the south, who visit
Central Market, commute to Seattle via the Bainbridge or Kingston ferry crossings or head to and
from the woods, waterways and mountains as Poulsbo is the “Gateway to the Olympics” and all
the recreational opportunities of the natural environment. Poulsbo is, in short, “on the way” to a
lot of places, and as a result becomes a drop off place for library books, a meeting place for
friends, a destination for Walmart shopping or a MAP appointment with Peggy for people from
Sequim or Port Townsend. People embrace the option of living in the countryside of Kitsap and
rural atmosphere outside of city limits, yet being near goods and services in Poulsbo city limits, or
the reverse – living in a town with amenities, while being close to wilderness and water. Poulsbo’s
location on Liberty Bay (“the fjord” that drew those Norwegians here, because it reminded them
of home) adds boating, fishing, kayaking and water views.
(This impression of Poulsbo’s role as a genuine “crossroads/destination” was confirmed by the
Traffic Count report in DemographicsNow).
See “PL Traffic Counts List Report” for details.
Geographic impact of an island between you and your ride
Poulsbo area commuters, as well as those passing through Poulsbo from outside the area,
whether working in Kitsap or Edmonds, Everett, Seattle or Tacoma, create commute patterns to
Kingston and Bainbridge Ferries. Working in Bremerton/other Kitsap locations creates car/bus
commute patterns. The unique geographic feature of having an island that is opposed to
expanding its highway capacity between you and your transportation to work (ferry) has
negatively impacted commute times to and from Bainbridge Island and the Seattle ferry, with
Poulsbo residents reluctant to travel to Bainbridge for programs, goods or services as a result of
heavy, unpredictable traffic and travel times.
Importance of Neighborhoods
Poulsbo has variety of areas where people choose to live, from newer subdivisions, to rural
homes with acreage to Little Norway/on the Fjord and its older and historical areas, as well as
waterfront properties on all sides of Liberty Bay with waterfront joys and properties on hillsides
with glorious mountain and water views. As identified in the Mosaic profiles, Poulsbo residents in
the city limits have a very notable attachment to their neighborhoods and want to know their
neighbors, walk and interact, cultivating the small town lifestyle actively, whether in the newest
subdivisions or the oldest areas. These neighborhoods are like towns within the city, on a very
small scale, contributing to the quality of life.
Indianola has the strongest identity as a very small but close-knit community, with only a few
thousand residents centered around a small handful of services (a dock and store) that have

59
focused the community since its earliest development in 1916 with the formation of the Indianola
Beach Land Company and promotion of its real estate as a vacation community.
4. What government comprehensive plan covers your area? What are the major goals it
sets for your community? What are the biggest problems it identifies?
Local and County Comprehensive Plans covering this area include:
1. City of Poulsbo Comprehensive plan 2016 update (including a 2015 Community Survey) for
the incorporated Poulsbo area, preceded by the 2009 Comprehensive Plan and 2007
Community survey.
2. 2009 Kitsap County Comprehensive Plan covering unincorporated areas as well as the city of
Poulsbo and Poulsbo UGA.
Note: The 2009 Poulsbo Comprehensive plan is beginning the updating process for 2016, and
conducted relatively recent community surveys, available online (Project Poulsbo 2036).
Major City of Poulsbo goals include these notable ones that represent both a goal and a
challenge or problem:
1. Respecting Poulsbo’s identity, including the historic downtown and existing neighborhoods
and districts, while allowing new areas to develop. (Balancing these two is one of the
challenges).
2. Improving and sustaining the natural environment. (2015 Community Survey input ranked this
concern as the #1 value/priority voiced by community members).
3. Connect the City, neighborhoods and neighbors through mobility options. (2015 Community
Survey input ranked transportation and traffic concerns as second only to concerns about
preserving and protecting the natural environment.)
4. Overall, the City aims to plan for growth, while preserving community character and quality
of life. Business surveys from the Greater Poulsbo Chamber of Commerce rank “quality of life”
as the #1 reason to locate business here. City of Poulsbo 2015 Communit y Survey ranked
small town scale and atmosphere as the #1 quality that attracted them here by 82.69% of
respondents.
Poulsbo’s Scandinavian heritage is a quality of life that is unique and highly valued by its people.
Poulsbo’s unique location on Liberty Bay, proximity to the Olympic Peninsula and natural
features are very highly valued.
Balancing local residents’ needs with tourist culture is a challenge.
Balancing residential and commercial growth with the diverse needs of all ages is a challenge.
Encouraging community cohesion in close-knit neighborhoods and gathering places is a priority.
Reducing sprawl while preserving structures of historical significance is a challenge.
Growth in technology, manufacturing, education and support for telecommuting infrastructure
are City and Chamber of Commerce priorities.
Open space and outdoor recreation are highly valued by a broad cross-section of the
community.
Poulsbo is a community that values moderation and balance between tradition & the new.

60
Notable features of the 2015 Community Survey (2016 update of the 2009 City’s Comp Plan):
Between 2009 and 2015 there was a notable shift to the top concerns becoming protecting the
natural environment and promoting community interaction by supporting gathering places,
open spaces, and parks and recreation. The most important challenges included protection
of Liberty Bay and Traffic Congestion. This shift followed a period of population growth and
rising housing prices, generating concerns about the impacts of growth and po pularity.
As reflected also in the census and Mosaic data, between 2009 and 2015 there is a notable shift
to a majority of respondents having higher household income levels ($100,000 and above
31.95% and $45,000-99,999 29.88%).
Survey respondents and where people live: 27.9% live within the Poulsbo UGA but outside the
city limits, 23.5% live in the Old Town area, 20.6% live on the East Side, 12.5% live in North
Poulsbo and 2.9% live on the West Side.
A whopping 74.2% of respondents receive government information about the city by reading
the newspaper (not surprising given the traditional media consumption habits profiled in the
Mosaic reports, or how full our newspaper reading section is on a daily basis in the library).
The #1 business challenge faced today was listed as Permitting and Regulations, with Land
Values and Rising Rents #2.
68.8% of responding Business owners considers Poulsbo’s #1 market strength to be Quality of Life,
with affordable Rents/Property #2 (37.5%). There is anecdotal evidence of local families
seeing their young adult children leave Seattle area to return to Poulsbo to raise their families
for its affordability.
5. Where do people gather in your community? These can be physical places, like bars or
churches, or social ones, like Rotary meetings or music events.
People gather at a number of venues including:
Central Market (to shop but also as a crossroads location to meet for everything from Bible Study
groups to business meetings),
Poulsbohemian Coffeehouse (monthly poetry readings, alternative spiritual communities, arts
groups, a gathering place for the “hidden” community of “bohemian/vintage loving subculture”
and the hidden community of “spiritual alternative/nature loving subculture” ,
Faith Communities and Churches are significant gathering places, such as Gateway Fellowship,
St. Cecilia’s Catholic Church and Poulsbo First Lutheran Church. As reported in the Mosaic
market segmentation data, 38-39% of the people belong to a church, temple or synagogue,
much higher than the national or state averages.
Deep roots in the community for many people means they care about their neighbors and form
tight bonds with their immediate neighborhoods, making the many well -defined and distinctive
neighborhood areas and Homeowner’s Associations important gathering places.
6. What organizations provide social services, recreation services, or educational services
in your community? What community needs have they identified?
• Social Services:
American Legion provides Veteran assistance services.

61
Churches play a vital role in providing social services. For example, Gateway Fellowship offers
services in Spanish as well as English, serves free community meals, provides job help, brings
countywide services together once a year to its extensive campus in Poulsbo for a “Day of
Hope” event, a “social services fair” for the public, and hosts other social services like KCR’s WIC
program and a Free Medical Clinic. Other churches and faith communities also play significant
community support roles, with meals being served by Coffee Oasis for youth and at First
Lutheran, St. Olaf’s Catholic Church, Gateway and the Suquamish Community Kitchen.
North Kitsap Fishline provides food bank services, employment, computer assistance, shower &
haircut vouchers, rent, utilities and prescription help and many other supports for the community.
Service Clubs like Lions, Rotary and Soroptimists enrich the community through service, with
Rotary generally keeping the higher community profile.
Sons of Norway has an active chapter here, but keeps a relatively quiet profile beyond
traditional annual events.
St. Vincent de Paul provides help with utilities, rent, transportation, emergencies & other services.
The Suquamish Tribe has its own social and educational services as part of the Tribal
organization.
Youth Services include West Sound Youth for Christ and Coffee Oasis (serving ‘at risk’ youth).
• Recreation Services:
Poulsbo Parks & Recreation Department, though not a formal official park district, handles a wide
range of recreational venues and opportunities for all ages.
Poulsbo has 3 marinas, many tour, boating, fishing and tourist opportunities, as well as retail and
social organizations supporting residents’ interest in mountain and water sports of all kinds.
Note: School parents deeply involved in Athletics with their children are among the most active,
vocal and influential parents on many issues. After we lost our last levy lid lift request, a local
building and business owner told me he made his mind up to vote “no” after listening to the
parents at the soccer games saying they should vote “no”. We should not overlook this group of
influencers.
• Educational Services:
Poulsbo is a destination for students of all ages locally and regionally from neighboring counties.
Olympic College – Poulsbo: a thriving and growing community college campus of Olympic
college in Bremerton.
Northwest College of Art & Design: a career-oriented college offering a BFA in Visual Communication, with Double Majors in Entertainment Art, Graphic Design, Illustration, Interactive Design, and Motion
Design, attracting students from all over the country.
WWU Center at OC: Western Washington University is rumored to be planning on expanding
services here, based on their own community and county analysis. It would be interesting to
interview them on this point.
West Sound Academy – IB world school: an independent college preparatory school serving students in grades six through twelve, offering the International Baccalaureate (IB) Diploma Programme i n the
junior and senior years.

62
7. What groups did you not know were in your community? Were some larger than you
realized, or have unique needs you weren’t aware of?
Surprise! It’s smaller!
Hispanic, Asian and non-English speakers were smaller than I expected, since I see Spanish
language church services and we had seen Mexican groceries and restaurants nearby. The
North Kitsap High School data on Student Ethnicity lists the top three minorities as #1 Hispanic
(10.9%), #2 Asian/Pacific Islander (4.2%) and #3 Asian (4.0%). Census figures are lower with
Hispanics around 7%, however if you study the growth of these groups (especially Hispanic) over
recent years and review the projected increases in these groups over the next 5 and 10 years,
you will see a significant growth trend in what is essentially still a relatively small group.
See “PL Demographic Detail Summary” report, which includes projections.
Surprise! It’s bigger!
Business infrastructure and variety were bigger than I expected. I was aware of the high profile
businesses like Headquarters locations for Pope Resources (John Lamb) and for Town & Country
Market Inc. (Larry Nakata), and aware of the 14 banks and credit unions, 51 restaurants, 3
breweries, 12 art galleries, retail and shopping centers. I was aware of “big box” stores in the
Olhava area and some of the larger companies and manufacturers like Watson Furniture,
Gravitec, Trulife, Marine View Beverage and Twiss Labs, and some of the unique
entrepreneurships like Blue Frog Solar, Well Being Health Center, Valley Nursery, Orbea Signs and
Marina Market, but not as aware of the size of what the Chamber of Commerce calls Greater
Poulsbo’s “deceptively productive economy”: the Twelve Trees business complex, hidden
manufacturers, technology and science companies, labs, and entrepreneurs. The Chamber has
425 members and says business is booming in North Kitsap.
I might think that statement by the Chamber is salesmanship/hyperbole, but I AM noticing how
many types of nonprofits as well as business and education organizations have recently put a
second location or class or program in Poulsbo to create a presence for themselves in the north
part of the county, or have plans to do so in the near future. Poulsbo is not going unnoticed.
Where have all the children gone?
I was surprised that families with young children were not a more dominant statistic in the reports,
seeing on a daily basis how extremely busy serving young families we are at the library. With the
trend in our area toward an older and wealthier population, the library is certainly filling a vital
need for activities and community building for these young families.
8. What overall conclusions do you draw about the makeup of your community?
People in the greater Poulsbo area are largely contented but concerned about traffic and
growth’s impact on quality of life. The city of Poulsbo may be the center of this area but it is far
from the whole story. Poulsbo is a city undergoing transformation while tenaciously holding onto
its small town identity. Many live and work here for the kinder and gentler way of life it offers, a
delight in this day and age. Like the Suquamish ancestors before us, change and newcomers
are inevitable. The community strives to cherish the old while embracing the new.

63
9. The next step in this process will be identifying groups for community discussions. We
want to hear about the needs of a wide and representative cross-section of those we serve.
Based on what you’ve learned from the data, who do you think we should talk with? Why?
GATEWAY FELLOWSHIP: Tom Duchemin (Lead Pastor) and Dave Fischer (Global & Local
Outreach): They provide meals, job training, multi-lingual services, an annual Day of Hope for all
social services, partner with Transit for park and rides, and serve throughout the Christian
communities here. We should tap them to find our underserved, our hidden communities,
understand the needs of our Hispanic and minority communities, to ask them to share their
community analysis and their experiences partnering, as well as their vision for our future.
GREATER POULSBO CHAMBER of COMMERCE: Sharon is embedded, they are movers & shakers.
They have a good grasp of the local community position within the greater area, growth and
sustainability issues supporting quality of life, and government.
CENTRAL MARKET owner Larry Nakata & Manager Tom Hall (Town & Country Markets): Their local
knowledge and understanding of the surrounding market as well as their community
contributions and partnerships make them a great resource – I would love to hear what their
community studies have unearthed.
OLYMPIC COLLEGE/POULSBO AND WWU AT OC: The leadership of both institutions should be
consulted, and close partnerships fostered with KRL, as Poulsbo increasingly becomes an
educational center for the region.
PORT MADISON ENTERPRISES & SUQUAMISH TRIBE: Their leadership are key partners in the
community, impacting its neighbors and sharing its resources and enriching we relative
newcomers to the area’s lives through cultural heritage and exchange.
Other suggestions from staff include:
Boaters and live-aboard communities, Yacht Club.
Homeowners associations and neighborhood groups. Some use our Community Room for
meetings, and reviewing meeting room users is another way to spot these and other influencers.
Kitsap Quilters is a very active group in the community, blending tradition and love of crafts/art.
League of Women Voters.
Marina Market (Audrey) (Scandinavian specialty grocer).
Moms, playgroups and child/parent oriented local websites and Facebook groups like Macaroni
Kid Kitsap and the North Kitsap Moms group (Heather Blue).
PTA organizations, Teacher groups, and Homeschoolers.
Poulsbo Farmers Market and Kitsap Fresh CSA community “farm to table” advocates.
Poulsbohemian Coffeehouse manager would be a good resource for hidden community
representation and the arts and poetry fans.
Shawna at Slipper Pig (pub and eatery partnering with KRL for our new nonfiction book group).
Tammy at Tizley’s EuroPub (very active in the Historic Downtown Poulsbo Association, also
connected to the three local breweries and the brew -pub “scene”).
Sources Cited: (more details available upon request)
64
DemographicsNow (Mosaic Market Segmentation reports and Census data): Mosaic Population
Comparison, Demographic Detail Summary, Demographic Trend Comparison, 2000 Census
Employment Comparison, Census 2010 Ancestry Comparison, Business Comparison, Household
Comparison, Mature Market Comparison, Rank by Income, Rank by Race, Rank by Population,
Traffic Counts List Report. Accessed March 4, 2016.
ReferenceUSA (Government Offices, Social Services, Recreation, Education, US Businesses,
Headquarters, Home Based Businesses). Accessed March 4, 2016.
They Represent You (League of Women Voters pamphlet, 2016).
Web Accessible Public Resources:
City of Poulsbo 2009 Comprehensive Plan and 2016 updates. Accessed March 4, 2016.
City of Poulsbo Planning & Economic Development website. Accessed March 4, 2016.
The Greater Poulsbo Chamber of Commerce website. Accessed March 4, 2016.
KEDA (Kitsap Economic Development Alliance) website. Accessed March 4, 2016.
Kitsap County Comprehensive Plan 2012 and 2036 Vision. Accessed March 8, 2016.
North Kitsap School District website (2014-2020 Strategic Plan, NK High School Profile). Accessed
March 4, 2016.
Northwest College of Art & Design website. Accessed March 8, 2016.
Olympic College Poulsbo website. Accessed March 8, 2016.
Sally’s Resource Guide, WINTER 2016. Accessed March 8, 2016.
Suquamish Tribe website. Accessed March 5, 2016.
Western on the Peninsulas (WWU at OC Poulsbo) website. Accessed March 8, 2016.
West Sound Academy/IB /World School website. Accessed March 11, 2016.
Wikipedia articles (sources verified) for: Poulsbo, WA, Indianola, WA, Suquamish, and Port
Madison Indian Reservation. Accessed March 4, 2016.
Interview Sources:
Kim Anderson (Gateway Church and School resource)
Kitty Buel (Arts, Crafts, Quilting)
Suzanne Christman (Public schools, Athletic and Parent/Teacher Organizations, Garden Club,
League of Women Voters)
Sharon Lee, Poulsbo Branch manager (community leaders/influencers, Chamber of Commerce
Secretary, Poulsbo values, neighborhoods and Homeowners Associations)
Jay Logan (Poulsbohemian Cafe resource, alternative spiritual ity communities)
Lynn Stone (Homeschooling, Teens & Technology)
Charlie Wise (Downtown Historic District small business owner)

65
South Kitsap / Port Orchard Prepared by Kristine Berg
1. What is the demographic makeup of your service area? Provide an overvi ew of data on
age, race and ethnicity, income, and occupation. Also describe any other demographic points
that are unique or salient in your community.
South Kitsap has the largest population out of any segment evaluated in Kitsap County. Only
when “Greater Central Kitsap” (Silverdale, Seabeck, Keyport, and Bremerton) is rolled up does a
segment of Kitsap County have a larger population than South Kitsap. Other than its population
size (an estimated 68,241), South Kitsap does not stand out particularly from the rest of the
county in terms of its demographic statistics. The age of residents is spread evenly. The vast
majority of South Kitsap is white (85.3%) and that is representative of the rest of the county.
The average household income for South Kitsap is $73,971. This is about the same as the average
for the county, but considerably lower than the average income for Bainbridge Island and
higher than the average income for Bremerton. Though South Kitsap’s average is comparable to
the rest of the county, the most populous portion of South Kitsap, zip code 98366 is notable for its
wide distribution of income. The average income is slightly lower at $68,052 and 10% of the
community likely live in poverty and make $15,000 or less per household (the average household
size for this zip code is 2.6 people). The wealthiest households in 98366 make more than $150,000
annually and every income level between is represented fairly evenly with the majority of
households making between $50,000 and $74,999 annually. This wide distribution is reflected in all
of South Kitsap as well.
CommunityPopulation
(2015A)
Population
Density
(Sq Mi)
White % Black %Am.
Indian%
Asian/
PI%
Multi
race%
Other
Race%
SOUTH KITSAP 68,241 571 58,193 85.3% 1,297 1.9% 751 1.1% 2,809 4.1% 3,788 5.6% 776 1.1%
98359 Olalla 4,844 349 4,349 89.8% 50 1.0% 54 1.1% 107 2.5% 182 3.8% 81 1.9%
98366 Port Orchard 34,627 1,422 28,924 83.5% 855 2.5% 395 1.1% 1,596 5.5% 2,116 6.1% 359 1.2%
98367 Port Orchard 28,770 354 24,921 86.6% 391 1.4% 302 1.1% 1,107 4.4% 1,490 5.2% 336 1.4%
CommunityHispanic
Origin%
Non-
Hispanic
Origin
%
SOUTH KITSAP 3,661 5.4% 63,938 93.7%
98359 Olalla 203 4.7% 4,618 95.3%
98366 Port Orchard 1,990 6.9% 32,245 93.1%
98367 Port Orchard 1,468 5.9% 27,075 94.1%
CommunityTotal
Households
Average
Household
Income
$0 -
$15,000
$15,000 -
$24,999
$25,000 -
$34,999
$35,000 -
$49,999
$50,000 -
$74,999
$75,000 -
$99,999
$100,000 -
$149,999
$150,000
+
SOUTH KITSAP 25,798 $73,971 8.7% 7.6% 9.6% 13.9% 21.9% 15.9% 15.6% 6.7%
98359 Olalla 1,811 $80,134 7.4% 5.8% 8.5% 14.3% 21.4% 17.6% 17.4% 7.8%
98366 Port Orchard 13,412 $68,052 10.0% 9.5% 10.9% 14.3% 21.8% 14.3% 13.7% 5.5%
98367 Port Orchard 10,575 $80,422 7.3% 5.6% 8.1% 13.3% 22.3% 17.7% 17.7% 8.0%

66
11,452 people are employed in South Kitsap, the majority of which are employed in either the service or
retail industries. The largest single employer in South Kitsap is South Kitsap School District, which
according to their 2015 Annual Report employs more than 1,200 individuals, only 496 of whom are
teachers. The next largest type of employer within the services industry in South Kitsap is the health
services industry; there are several large medical complexes in South Kitsap: Harrison Medical Center,
Group Health Port Orchard Medical Center, and Franciscan Medical Clinic. Those are all located near
Highway 16. Residents in the southern part of South Kitsap may be closer to St. Anthony’s Hospital in Gig
Harbor (both in terms of employment opportunities and emergencies).
Retail is the second largest employment sector in South Kitsap. Most shopping areas are made up of
chain stores, though there are small and local businesses as well as self-employed residents operating
out-of-home-businesses as well. The key commercial areas as identified by the Economic Development
Plan by the City of Port Orchard are the Bethel Corridor, Mile Hill, and the Sedgwick/SR-16 Corridor.
Nearly all of the businesses along the historic downtown stretch of Bay Street in Port Orchard (98366) are
small and owned locally and residents take pride in that, though there are fewer employment
opportunities here compared to opportunities at SKSD, the health care industry, or outside South Kitsap.
Port Orchard is the county seat and houses the county courthouse and jail. This accounts for
government and public administrative jobs making up the next largest employment sector of South
Kitsap.
2. Using the Mosaic Population Comparison report in DemographicsNow, describe the
largest Mosaic clusters in your community.
South Kitsap is predominantly (41.21%) “Unspoiled Splendor.” Due to the size of South Kitsap, the
rest of the county is skewed towards that MOSAIC category, though much of the county was
already leaning that way. South Kitsap is also represented by “Rooted Flower Power” (20.12%)
and though “Aging of Aquarius” is only 7.64% of the South Kitsap population, it is still worth calling
out this MOSAIC tile in South Kitsap as it also represents 12.11% of Kitsap County overall.
“Unspoiled Splendor” and “Rooted Flower Power” overlap in their key traits with their relative
conservative finances in terms of banking, politics, and spending.
CommunityAlcoholic
Beverages
Food At
Home
Food Away
from HomeCoffee
Personal Care
(Including
Services)
Reading Tobacco
Products
SOUTH KITSAP $593.45 $4,898.47 $3,391.15 $53.40 $755.47 $105.95 $423.51
98359 Olalla $619.45 $5,152.80 $3,641.61 $55.15 $1,044.87 $115.79 $468.96
98366 Port Orchard $559.27 $4,657.01 $3,162.42 $50.88 $989.06 $96.72 $392.17
98367 Port Orchard $632.35 $5,161.15 $3,638.35 $56.31 $1,066.35 $116.03 $455.49
CommunityTotal
Employees
Agriculture,
Forestry, &
Fishing
Construction
Finance,
Insurance,
Real Estate
MfG MiningPublic
AdminRetail Services
Transport,
Comm,
Utilities
Wholesale
Trade
Total
Establishments
SOUTH KITSAP 11,452 258 681 715 559 1 1,103 2,499 5,021 402 216 1,702
98359 Olalla 463 19 58 15 28 0 4 27 264 15 34 117
98366 Port Orchard 7,242 163 213 557 155 0 950 1,687 3,266 178 74 1,025
98367 Port Orchard 3,747 76 410 143 376 1 149 785 1,491 209 108 560

Unspoiled Splendor
Key Traits:
Upper middle-class
Empty-nesters
Traditional
Rustic outdoor sports
Conservative finances
Coupon favorable
American-made
Community-minded
Price-conscious
Internet pragmatics
Rooted Flower
Power Key Traits:
Home-based activities
Political activism
Informed consumers
Older suburban homes
Approaching
retirement
Bargain hunters
Mail-order buyers
Clubs and volunteering
Conservative investors
Philanthropy
Aging of Aquarius
Key Traits:
White collar baby
boomers
Health-conscious
Empty nests
Cruises
Well-educated
Eclectic shoppers
Ethically-responsible
Enthusiastic investors
Brand- and store-loyal
Environmentally-
responsible
3. What is the geography of your area? Where do various communities live? Where do
people work? How are voting districts divided? Are there areas that stand out in some way?
South Kitsap is defined by three zip codes: 98359 (Olalla), 98366 (Port Orchard), and 98367 (Port
Orchard).These zip codes are next to each other and are bordered by the Sinclair Inlet to the
North and Colvos Passage to the East, extend to Highway 3 to the West nearly to Belfair, and
South to the Kitsap-Pierce County line just past Burley.
About half of South Kitsap residents live in zip code 98366, the Northern most part of South Kitsap.
The population density in this area (1,422 people per square mile) is about half of what it is in the
least dense areas of the City of Bremerton (2,903 people per square mile), but is considerably
more dense the majority of Kitsap County, where the population density for the entire county is
624 people per square mile. The remaining half of South Kitsap residents are spread out with
much more space between neighbors.
Depending on a resident’s specific location within South Kitsap, they are either in Legislative
District 26 or 35.
In addition to where residents currently live, a large residential development is planned for the
1,100 acres immediately to the west of the McCormick Woods neighborhood (98367). There are
more than 2,000 platted lots in that development and building is anticipated to begin in as early
as late 2016. These homes would be within the South Kitsap School District.
Community
C11
Aging of
Aquarius
C14
Boomers
and
Boomerangs
E21
Unspoiled
Splendor
H27
Birkenstocks
and
Beemers
H28
Everyday
Moderates
K40
Bohemian
Groove
L41
Booming
and
Consuming
L42
Rooted
Flower
Power
N47
Countrified
Pragmatics
O51 Digital
Dependents
O54
Striving
Single
Scene
SOUTH KITSAP 5214 1411 28122 3970 3952 4073 1690 13728 2088 2431 1562
98359 Olalla 18 0 4826 0 0 0 0 0 0 0 0
98366 Port Orchard 1632 0 4868 1936 2707 4073 1690 13728 0 2431 1562
98367 Port Orchard 3564 1411 18428 2034 1245 0 0 0 2088 0 0
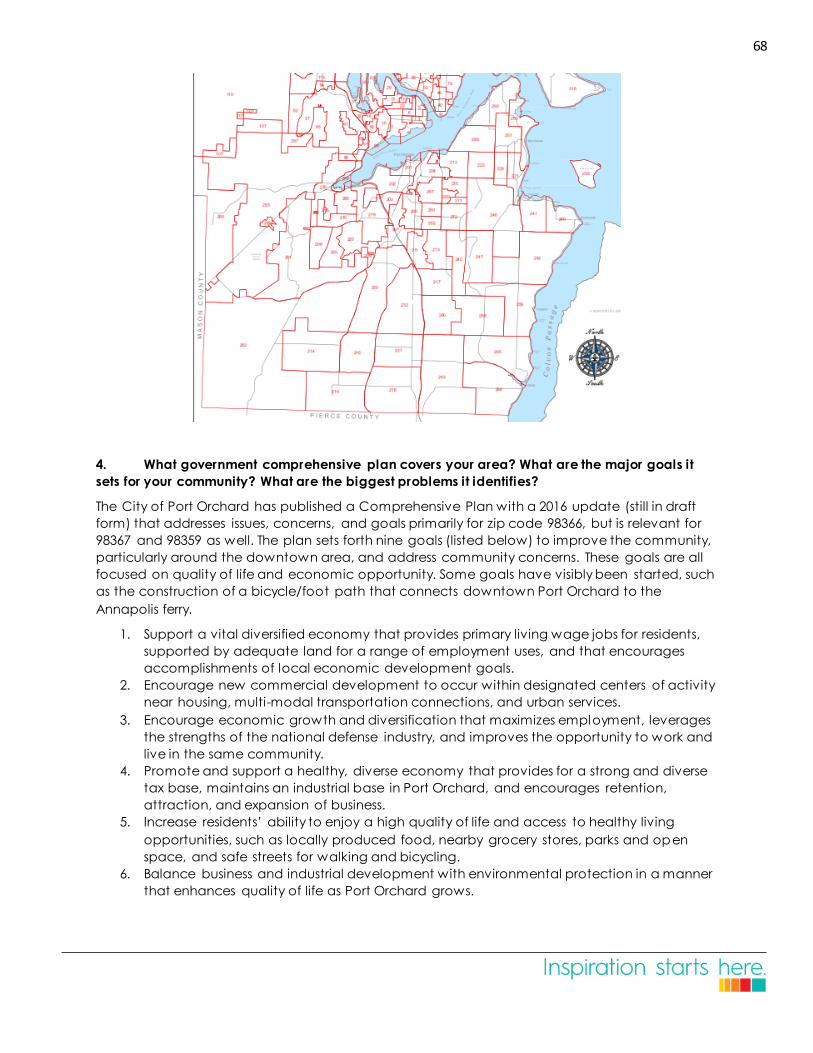
68
4. What government comprehensive plan covers your area? What are the major goals it
sets for your community? What are the biggest problems it identifies?
The City of Port Orchard has published a Comprehensive Plan with a 2016 update (still in draft
form) that addresses issues, concerns, and goals primarily for zip code 98366, but is relevant for
98367 and 98359 as well. The plan sets forth nine goals (listed below) to improve the community,
particularly around the downtown area, and address community concerns. These goals are all
focused on quality of life and economic opportunity. Some goals have visibly been started, such
as the construction of a bicycle/foot path that connects downtown Port Orchard to the
Annapolis ferry.
1. Support a vital diversified economy that provides primary living wage jobs for residents,
supported by adequate land for a range of employment uses, and that encourages
accomplishments of local economic development goals.
2. Encourage new commercial development to occur within designated centers of activity
near housing, multi-modal transportation connections, and urban services.
3. Encourage economic growth and diversification that maximizes employment, leverages
the strengths of the national defense industry, and improves the opportunity to work and
live in the same community.
4. Promote and support a healthy, diverse economy that provides for a strong and diverse
tax base, maintains an industrial base in Port Orchard, and encourages retention,
attraction, and expansion of business.
5. Increase residents’ ability to enjoy a high quality of life and access to healthy living
opportunities, such as locally produced food, nearby grocery stores, parks and open
space, and safe streets for walking and bicycling.
6. Balance business and industrial development with environmental protection in a manner
that enhances quality of life as Port Orchard grows.

69
7. Coordinate economic expansion that is concurrent with capital facilities, multi-modal
transportation networks, and urban services, especially within designated centers of local
importance.
8. Foster and facilitate partnerships and cooperation among government, private
corporations, and nonprofit entities to promote economic development goals.
9. Attract and encourage expansion of educational and medical institutions to assure a
highly skilled work force.
The City of Port Orchard intends to achieve these goals by adhering to the following
principles:
Provide committed leadership
Provide public investment to stimulate private reinvestment
Develop downtown management
Provide effect events and promotions
Make continuous small changes
Think quality/enhance identity
Foster new development and remove obstacles
Enhance downtown as the center of activity
Attract interest with education and interpretation
Enhance greenspace and walkability
These goals and principles speak to community concern regarding the downtown Port Orchard
area’s walkability and accessibility, aesthetic appearance, economic sustainability, and the
general quality of life throughout South Kitsap which is supported by the City of Port Orchard’s
findings in the 2014 Economic Development Survey. People are extremely concerned with
parking availability, acquisition of funds for improvements (as well as the perceived
mismanagement of any funds acquired), and there are mixed opinions among survey
responders as to what specifically should be done to improve the downtown area, though all
responders suggested that improvements were necessary.
5. Where do people gather in your community? These can be physical places, like bars or
churches, or social ones, like Rotary meetings or music events .
As indicated by the MOSAIC tiles, residents of South Kitsap are active in clubs and organizations.
In terms of national organizations, there are two Rotary Clubs in Port Orchard, two Kiwanis Clubs
in Port Orchard, two National Granges, and one Fraternal Order of Eagles. There are many
churches that provide volunteer opportunities (see below). There are also other, smaller
community-based interest organizations, such as the Saints Car Club and the McCormick
Garden Club.
The Givens Community Center, Olalla Community Club, and the Kitsap Regional Library provide
social events and community spaces available to rent or reserve. During the spring, summer,
and early fall, there is a Famers Market in downtown Port Orchard where local farmers and artists
sell and community members socialize.
6. What organizations provide social services, recreation services, or educational services
in your community? What community needs have they identified?
• Social Services:
1. Free meals are available in South Kitsap
a. Food Banks
i. Helpline House: 1012 Mitchell Avenue, Monday-Friday

70
ii. Life Care Community Food Bank: 8640 Journey Lane SE, Saturdays
b. Hot meals are provided by various Christian organizations throughout the
week
i. Church of Christ: 2588 Carr Lane, 2nd Mondays
ii. Family Kitchen First Lutheran: 2483 Mitchell Road, Last two
Mondays, Tuesdays, Thursdays, Fridays
iii. Christian Life Center Care Kitchen: 1780 SE Lincoln Avenue,
Wednesdays, Saturdays
iv. The Shepherd’s Kitchen Faith Life Church: 1213 Bay Street,
Thursdays
v. Coffee OASIS Center: 807A Bay Street, Fridays (Youth Only)
2. Clothing and other items for low prices
a. St. Vincent de Paul
i. This valuable community resource is moving to a new location. The
building it currently occupies was purchased by a Ford dealership
and the South Kitsap community recently rallied to raise at least
$100,000 so St. Vincent de Paul could afford to relocate.
3. General assistance
a. Helpline: 1012 Mitchell Avenue, Monday-Friday
4. Veteran’s assistance
a. Retsil Veteran’s Home is a service center and provides transitional housing
for homeless veterans: 1141 Beach Drive
b. VFW: 736 Bay Street, Tuesdays
5. The Crisis Clinic is available throughout Kitsap County and can be reached by
calling 2-1-1.
6. Vocational Services with Compass
• Recreation Services:
1. Kitsap Regional Library
a. Two Library locations serve South Kitsap (both are in 98366)
i. Port Orchard: 87 Sidney Avenue
ii. Manchester: 8067 E. Main St.
b. The Bookmobile makes regular stops in multiple locations in South Kitsap
i. Olalla: Olalla Boat Landing (13965 Crescent Valley Road), Pine
Lake Estate (SE Pine Lake Road and Barbara Lane SE), and Ebbert
Drive SE and North Street SE
ii. Port Orchard: Orchard Bluff (1345 Carl Pickel Drive), Conifer Ridge
(1721 Fircrest Drive), and Madrona Manor (3900 Madrona Drive
SE)
iii. South Kitsap: Albertson’s Plaza (370 SW Sedgwick Road), The
Ridge 2 (Old Clifton Road and Chanting Circle), Burley Store
(14972 Bethel Burley Road), Horizon Lane and Brookside Court,
and The Ridge at McCormick (SW Lazuli Street)
2. Fathoms of Fun
a. Community service organization that provides scholarships for youth and
recreational activities for families.
3. Recreational Sports Leagues
a. There are many recreational sports leagues for both children and adults
in South Kitsap. As suggested by the MOSAIC (above), South Kitsap
residents tend to be involved with clubs and organizations and

71
recreational sports leagues are no exception. Below are several of the
organizations in South Kitsap.
i. Kitsap Peninsula Adult Pee Wee Association
ii. South Kitsap Eastern Little League
iii. South Kitsap Homeschool Sports Club
iv. South Kitsap Pee Wees
v. South Kitsap Soccer Club
vi. South Kitsap Western Little League
vii. Washington Youth Soccer
• Educational Services:
1. South Kitsap School District
a. South Kitsap is in the South Kitsap School District, which is made up of 17
schools (11 elementary schools, 3 junior highs, 1 high school, 1 alternative
high school, and 1 online alternative school for all grades). South Kitsap
High School is the largest 3-year high school in Washington State in terms
of number of students and has more students than many 4-year high
schools in the state. The South Kitsap School District is also the second
largest school district in the state.
i. Burley Glenwood Elementary
ii. East Port Orchard Elementary
iii. Hidden Creek Elementary
iv. Madrona Heights Developmental Preschool Program
v. Manchester Elementary
vi. Mullenix Ridge Elementary
vii. Olalla Elementary
viii. Orchard Heights Elementary
ix. Sidney Glen Elementary
x. South Colby Elementary
xi. Sunnyslope Elementary
xii. Cedar Heights Junior High
xiii. John Sedgwick Junior High
xiv. Marcus Whitman Junior High
xv. South Kitsap High School
xvi. Discovery Alternative High School
xvii. Explorer Academy
b. 2016 Bond for a Second High School
i. In early 2016, the South Kitsap School District attempted to pass a
bond to finance the construction of a second high school which
required a super majority approval of 60% to pass. It was narrowly
defeated with only 59.92% approval and the school district plans
to have the community vote again. The bond will cost tax payers
an estimated $0.99 per $1,000 of assessed property value and for
the bond valued at $126,992,867.
ii. The second high school will be a 4-year high school and serve
approximately 1,500 students
7. What groups did you not know were in your community? Were some larger than you
realized, or have unique needs you weren’t aware of?

72
The percentage of households living near or below the poverty level was greater than I realized.
Based on Sally’s Resource Guide, it appears that the majority of low -income resources are
located in Bremerton, though they may be available to South Kitsap residents. Even those
resources that are in South Kitsap are located primarily in 98366 around the downtown area and
may be difficult for those with limited transportation to access.
8. What overall conclusions do you draw about the makeup of your community?
South Kitsap is an economically diverse region with opportunities for growth. The community
generally desires civic improvement, but opinions vary on how that should be accomplished.
9. The next step in this process will be identifying groups for community discussions. We
want to hear about the needs of a wide and representative cross-section of those we serve.
Based on what you’ve learned from the data, who do you think we should talk with? Why?
South Kitsap School District representatives
Largest employer in South Kitsap
Interacts with the majority of the South Kitsap population
Currently highly motivated by 2016 Bond to understand, connect with, and motivate
community
St. Vincent de Paul shoppers and employees
Community valued resource enough to raise money to save it
Interacts with the community both as a retailer and as a community service
Open 2-3 Minute Conversations in Public Places (Passers-By)
Grocery Stores
Parking Lots
Ferry Terminals
Churches
Virtually all of the social services that are not publicly funded are run by Christian
organizations. They are supporting the low -income community.
National Organizations Local Chapters
Community is pro-organization
Chapters throughout South Kitsap, not just 98366
Sources Cited:
ASPE. "2015 Poverty Guidelines." https://aspe.hhs.gov/2015-poverty-guidelines.
City of Port Orchard. "Draft Port Orchard Comp Plan: Economic Development Element."
http://www.cityofportorchard.us/docs/planning/2016CompPlan/draft_ed_element_4-15-
15_meeting.pdf.
City of Port Orchard. “Report on the Economic Development Survey Results – October 10, 2014.”
http://www.cityofportorchard.us/docs/planning/2016CompPlan/econ_dev_survey_rpt.pdf
DemographicsNow (Multiple Reports)
Kelly, Tim. "Home construction surges in South Kitsap." Kitsap Sun.
http://www.kpbj.com/topstories/home-construction-surges-in-south-kitsap-2ed17263-eda6-4796-
e053-0100007fc686-374612541.html.
Kitsap County Auditor. http://www.kitsapgov.com/aud/elections/maps.htm.
Kitsap County Auditor. "Voting Precincts Kitsap County Washington."
http://www.kitsapgov.com/aud/elections/maps.htm.

73
Niche. "2016 Largest Public High Schools in Washington." https://k12.niche.com/rankings/public-high-
schools/largest-enrollment/s/washington/.
Piercy, Sheryl. "Sally's Kitsap Community Homeless & Low-Income Resource Guide." Winter 2016.
ReferenceUSA
South Kitsap School District. "2015 Annual Report."
http://www.skitsap.wednet.edu/cms/lib/WA01000495/Centricity/Domain/11/Annual%20Report%
20District%206pg%202015.pdf.
South Kitsap School District. "Bond 2016." http://www.skitsap.wednet.edu/Page/16322.
South Kitsap School District. “Schools Directory.”
U.S. Bureau of Labor and Statistics. "Consumer Expenditures in 2012."
http://www.bls.gov/cex/csxann12.pdf.

74
Silverdale/Central Kitsap Prepared by Megan Doreen May
1. What is the demographic makeup of your service area? Provide an overview of data on
age, race and ethnicity, income, and occupation. Also describe any other demographic points
that are unique or salient in your community.
There are 43,002 people living in the Silverdale/Central Kitsap area. The genders are split with 48.3%
female and 51.6% male. The median age is 35.7. 24.6% of the population is aged 0-19. The largest
ethnic groups are White, Hispanic, Asian, and Black. The exact breakdowns of the population are 80%
white, 7.3% Hispanic, 7.2% Asian, and 3.2 % Black, with 6.1 % identifying as multiracial. The average
annual household income is $83, 276, with 61.6% of the workforce employed in white collar jobs. 12%
of the population is in the armed forces. 71.6% have completed at least some college, with over 40%
having earned a college degree. 63.9% of the households live in owner occupied homes, and 68% of
households have at least 2 cars available to them.
2. Using the Mosaic Population Comparison report in DemographicsNow, describe the
largest Mosaic clusters in your community.
Half of the population is either Aging of Aquarius (21.3%) or Unspoiled Splendor (29.5%). This lines
up with the age statistics which show 50.5% are over 35 years old. Both of these groups are
defined as being comprised of financially comfortable to upper middle class baby boomers,
generally white, and married with older children or children who have already left home. They
generally have male heads of household. Both groups display community activism and loyalty,
as well as a strong sense of ethics and traditional values. The main difference between the two
clusters appears to be education level and occupation, with Aging of Aquarius tending more
toward graduate degrees and professional careers, while Unspoiled Splendor tends more
toward high school degrees and agricultural or technical careers. The third largest mosaic
cluster is Family Troopers at 12%. This lines up exactly with the 12% of households in Central Kitsap
that have one or more members in the armed forces. While the total percentage of military
families in this area remains fairly constant over the years, the actual individuals making up that
12% change as they are transferred in and out of our area. In fact, the Family Troopers cluster is
notable for the fact that 72.9% remain in any given location for 3 years or less. Because of the
transient nature of a military career, 93% tend to be renters rather than home owners.
3. What is the geography of your area? Where do various communities live? Where do
people work? How are voting districts divided? Are there areas that stand out in some way?
Silverdale/Central Kitsap geography is characterized by its hills, woodland, lakes, and streams.
There are several nature reserves, state parks, and municipal parks in the area. Silverdale, in
particular, is known for its Clear Creek walking trails and efforts to maintain the salmon streams.
The majority of the Silverdale/Central Kitsap population lives in the areas directly surrounding the
Silverdale shopping districts and Bangor Base. The outlying areas, such as Seabeck and Holly
have a significantly lower population, since they are mostly rural woodland or agricultural.
The top three employers in Silverdale/Central Kitsap are the naval bases at Keyport and Bangor,
Harrison Hospital Silverdale, and the Central Kitsap School District.
The voting districts appear to be based primarily on geography and population, with the districts
being larger in the more rural parts of the region.

75
Seabeck stands out as a notable part of Central Kitsap. It is a small unincorportated town on the
Hood Canal that was founded as a mill town in the 1850’s. It has a relatively small developed
town, consisting mostly of a general store, a pizzeria, and a thriving conference center.
However, Seabeck residents have a clear identity and love for their community.
4. What government comprehensive plan covers your area? What are the major goals it
sets for your community? What are the biggest problems it identifies?
Kitsap County Comprehensive Plan is being reviewed and revised with a deadline of June 2016.
According to the proposed plan, the county hopes that Silverdale itself will become
incorportated within the next 20 years, and therefore self-governing. The county would like to
increase the number of businesses in Silverdale, while cutting down on the amount of parking.
Suggestions include a shift toward underground parking or parking structures, and in increase in
public transit usage/carpooling. Although the plan calls for an increase in affordable multifamily
housing to increase the walkable lifestyle, there is not currently a proposed zoning change from
the current commercial or residential to urban. This is a twenty year long term plan, so it is safe to
assume that those sorts of zoning changes are on the horizon.
5. Where do people gather in your community? These can be physical places, like bars or
churches, or social ones, like Rotary meetings or music events .
Silverdale itself has a host of restaurants, eateries, and bars that cater to all segments of the
population. A major gathering place is the Kitsap Mall, which serves residents from every part of
Kitsap County, not just Silverdale and CK. In fact, 34% of jobs in Silverdale/Central Kitsap are in
retail or food service.
There are a number of large and active Christian churches in the area. However, it is important
to note that 73% of residents do not affiliate themselves with a religion. There are other active
community groups: Silverdale Chamber of Commerce, Rotary, Kiwanis, Scouting (Boy and Girl),
CStock (theater group). There is also a particularly active AA group that meets in its own building
in Silverdale.
There are a lot of locations for people with active lifestyles to gather. There is the Clear Creek
Trail system, a variety of lakes and public parks, a skate park, and several dog parks. The YMCA
also has a Silverdale location and high membership rate.
The Kitsap County Fairgrounds is also located in unincorportated Central Kitsap. In addition to
the annual county fair, it hosts a variety of other events year round including: Bluejackets
baseball games, Christmas village, dog/cat/rabbit/horse shows, quilt shows, conventions,
bazaars, trade shows.
The naval base also provides lots of opportunities and locations for people to gather, and has a
very active social calendar for military members and their families.
Other than the Kitsap County Fair, the largest annual event in Silverdale/Central Kitsap is Whaling
Days. Whaling Days occurs at the end of July every year in the Old Town Silverdale area.
6. What organizations provide social services, recreation services, or educational services
in your community? What community needs have they identified?
• Social Services:
Central Kitsap Food Bank

76
Social Security Administration Office
Caregiver Support Network
Harrison Hospital, Silverdale
Alcoholics Anonymous
Goodwill Industries
DePaul industries
• Recreation Services:
CStock
YMCA
Kitsap County Parks Department
• Educational Services:
Central Kitsap School District
4-H
Kitsap County Extension Office
Boy Scouts of America
Girl Scouts of America
7. What groups did you not know were in your community? Were some larger than you
realized, or have unique needs you weren’t aware of?
While I had been aware of the large number of retirement/senior housing communities in
Silverdale and Central Kitsap, I had not been aware of the variety of care and levels of service
they offered. Each community, such as the Vintage, Crista Shores, or Silverdale Estates, offers a
full calendar of social activities for their residents. They can also have sliding scales of care from
fully independent to secure memory care facilities.
Also, while I was aware of the military presence in the community, I had underestimated what
percentage of the population it comprised. I had also been unaware of how much the
members of this population are called on to relocate, and had not realized the full range of
activities and services offered to them already on base.
A group that was significantly smaller than I had expected is the young professionals/singles.
Adult Services has been doing a push toward programming for this demographic, but in
Silverdale and Central Kitsap it is only 7.6 of the population according to Mosaic cluster s. This
surprised me, and is causing me to rethink the audiences that I should be programming for.
8. What overall conclusions do you draw about the makeup of your community?
Silverdale and Central Kitsap is a large and geographically diverse area. The largest age group
in the population is the boomer/seniors, although the median age is lower than the overall
county median. There is a significant number of households associated with the military, which at
12% is higher than the overall county population percentage. Silverdale/Central Kitsap is home
to the major retail establishments in the county, such as big box stores and the mall. While the
43,002 residents of Silverdale/Central Kitsap only account for 16% of the overall Kitsap County
population, the geographic region accounts for over 25% of the county.

77
9. The next step in this process will be identifying groups for community discussions. We
want to hear about the needs of a wide and representative cross-section of those we serve.
Based on what you’ve learned from the data, who do you think we should talk with? Why?
Military Families on Base: how can they be made to feel like they are a part of our
community, how can the library better serve their unique needs, how can library service
be expanded on base?
Seabeck residents: although the bookmobile has stops in Seabeck, less than 50% of
residents are library card holders. This is lower than the overall county percentage. How
can we better serve their community?
Silverdale Seniors: what services are they already receiving from the Outreach
department, how can we expand services to them, are their needs they have that the
library is not currently meeting, what would they like to see offered at their local library or
in their communities?
Teachers: Central Kitsap School District is not only one of the largest employers in Kitsap
County, it also serves the highest number of students.
Sources Cited:
Demographics Now
US Department of Labor
Kitsap County Comprehensive Plan 2016-2036 (draft)
Central Kitsap School District Website
Kitsap County Visitor’s Bureau
Kitsap County Fairgrounds Website
Orangeboy

78
Thank you! Thank you to everyone who participated in the research, interviews, editing, or writing for this report. The
Adult Services Team at Kitsap Regional Library prepared this document, informed by a variety of
published sources (many created locally) and the valuable input of staff, community members, and
community leaders. They are credited in each section, and we would like to thank them all again here.
Please feel free to share this report and/or any information it contains both within and outside of our
organization. Just as the Library plans to use this knowledge as a first step in a process to make decisions
that are rooted in community needs and aspirations, we hope others may use it to make informed
decisions that improve life in Kitsap County.