Consumers’ quality perception of national branded, national store branded, and imported store...
13
This article appeared in a journal published by Elsevier. The attached copy is furnished to the author for internal non-commercial research and education use, including for instruction at the authors institution and sharing with colleagues. Other uses, including reproduction and distribution, or selling or licensing copies, or posting to personal, institutional or third party websites are prohibited. In most cases authors are permitted to post their version of the article (e.g. in Word or Tex form) to their personal website or institutional repository. Authors requiring further information regarding Elsevier’s archiving and manuscript policies are encouraged to visit: http://www.elsevier.com/copyright
Transcript of Consumers’ quality perception of national branded, national store branded, and imported store...

This article appeared in a journal published by Elsevier. The attachedcopy is furnished to the author for internal non-commercial researchand education use, including for instruction at the authors institution
and sharing with colleagues.
Other uses, including reproduction and distribution, or selling orlicensing copies, or posting to personal, institutional or third party
websites are prohibited.
In most cases authors are permitted to post their version of thearticle (e.g. in Word or Tex form) to their personal website orinstitutional repository. Authors requiring further information
regarding Elsevier’s archiving and manuscript policies areencouraged to visit:
http://www.elsevier.com/copyright

Author's personal copy
Consumers’ quality perception of national branded, national store branded,and imported store branded beef
Marija Banovic a,b,*, Klaus G. Grunert c, Maria Madalena Barreira b, Magda Aguiar Fontes a
a CIISA – Faculdade de Medicina Veterinária, Universidade Técnica de Lisboa, Pólo Universitário do Alto da Ajuda, Avenida da Universidade Técnica, 1300-477 Lisboa, Portugalb Instituto Superior de Agronomia, Universidade Técnica de Lisboa, Tapada da Ajuda, 1349-017 Lisboa, Portugalc MAPP Centre for Research on Customer Relations in the Food Sector, Aarhus School of Business, Aarhus University, Haslegaardsvej 10, DK-8210 Aarhus V, Denmark
a r t i c l e i n f o
Article history:Received 16 March 2009Received in revised form 24 May 2009Accepted 9 August 2009
Keywords:Branded beefIntrinsic cuesExtrinsic cuesQuality perception
a b s t r a c t
This study investigated the differences in the consumers’ quality perception of national branded, nationalstore branded, and imported store branded beef. Partial Least Squares analysis is used for modelling thequality perception process. Results show that consumers perceived national branded Carnalentejana beef,as better on all quality cues and quality aspects than the other two store branded beefs. Preference forCarnalentejana beef stayed highly consistent even after the blind test, where consumers differentiatedthis beef from the other two beef brands on all sensory dimensions: taste, tenderness, and juiciness,and chose it as the preferred one. Consumers utilized more perceived intrinsic cues to infer expectedeating quality of store branded beefs.
� 2009 Elsevier Ltd. All rights reserved.
1. Introduction
Consumers’ perceptions about product quality may be based onorigin, physical characteristics of the product, communicationaround the product, or combination of these (Steenkamp, 1990).In the shop, consumers assess quality of a product by making prod-uct evaluations based on the available intrinsic and extrinsic cuesthey believe reflect product quality. Of all the cues consumersare exposed to, only those which are perceived and used will influ-ence the expected quality and thus product evaluation (Grunert,1997). After product purchasing and following its preparation,product quality is experienced during its consumption, henceconfirming or disconfirming quality expectations, and determiningfinal satisfaction with the product and intention of repeat purchase(Grunert, Hartvig Larsen, Madsen, & Baadsgaard, 1996).
Among quality cues, brand has been found to be one of the mostimportant indicators of product quality, where consumers selectbrand names more often than other cues to infer product quality(Bredahl, 2003; Dodds, Monroe, & Grewal, 1991). However, it hasbeen found that national brands (i.e. manufacturer brands nation-ally known and identified as being the product of a single firm ormanufacturer) have much more positive impact on the product
quality perception than store brands (i.e. brands related to specificstore and not to the manufacturer). Richardson, Dick, and Jain(1994) found that consumers’ quality perceptions of store brandgrocery products were much higher when the store brand productswere repacked and presented as national brands. Additionally, con-sumer quality perceptions were considerably lower when the na-tional brand products were presented as store brands. Bellizzi,Kruckeberg, Hamilton, and Martin (1981) and Cunningham, Hardy,and Imperia (1982) found that national brands are considered asmore superior than private label store brands on attributes mostlyrelated to product quality, attractiveness, taste, and labelling. Like-wise, Juhl, Esbjerg, Grunert, Bech-Larsen, and Brunsø (2006) foundthat store brands are in an unfavourable position compared tonational brands independent of category and retail chain brandassortment strategy. Brand assortment strategy here refers to aretail chain’s plan dealing with store and national brands.1 Thus,store brands appear to be affected by unfavourable consumers’perceptions (Cardello, 1997); these of course may differ betweencountries and stores (Guerrero, Colomer, Guàrdia, Xicola, & Clotet,2000). Reasons for these unfavourable perceptions of store brandsin comparison to national brands may be due to the inexpensivepackage, absence of an attractive brand image, but also due to thepoor communications leading to weak/unknown brand image
0309-1740/$ - see front matter � 2009 Elsevier Ltd. All rights reserved.doi:10.1016/j.meatsci.2009.08.037
* Corresponding author. Address: Faculdade de Medicina Veterinária, Departa-mento de Produção Animal e Segurança Alimentar, Avenida da UniversidadeTécnica, Polo Universitário Alto da Ajuda, 1300-477 Lisboa, Portugal. Tel.: +351 21365 28 84; fax: +351 21 365 28 89.
E-mail address: [email protected] (M. Banovic).
1 That is, a retail chain can use many different names for their store brands withoutany link to the name of the retail chain, or they may choose very few names andmaybe only one name for the store brands, making it easier for the consumer todistinguish between store and national brands.
Meat Science 84 (2010) 54–65
Contents lists available at ScienceDirect
Meat Science
journal homepage: www.elsevier .com/ locate/meatsc i

Author's personal copy
(Richardson et al., 1994). Hence, consumers’ quality perceptions mayalso be influenced by prior experience or knowledge of a particularbrand, rather than specific information contained on the label.Bredahl (2003) found that brand-related experience (i.e. past pur-chases of a particular brand) may influence perceived product qualityand future product purchases, where brand overrides the influence ofother product information. Likewise, Juhl et al. (2006) showed thatthere exists quite a big difference in the consumers’ ability to retrievefrom the memory store brands compared to the most well-knownnational brands. Consequently, they pointed out that one of the indi-cators of success and competitive position of a national brand lays inthe consumers’ knowledge and ability to recall of this brand.
Recently, national and store branding of fresh beef has emergedas a key weapon in the battle waged between manufacturers andretailers for consumer loyalty, and branding has been found to pos-itively influence consumers’ expectations of beef quality (Bredahl,2003). More and more, retailers of fresh beef are promoting theirown brands aiming to differentiate a chain from other retailersand improve the quality image of their label. However, having inmind consumers’ unfavourable perceptions of store brands thisseems a difficult job.
Despite this fact and the considerable research in the consumerarea on the different influence of national and store brands onproduct quality, this kind of research has not been undertaken inthe case of fresh beef. Furthermore, even though consumers facemore than one possibility when purchasing beef, most of the beefstudies consider quality perceptions of one product only and not incomparison to other available products and brands (Bredahl,2003). Also, studies are usually conducted in controlled settings(Brunsø, Bredahl, Grunert, & Scholderer, 2005) and not with re-spect to real purchase environment (Acebrón & Dopico, 2000).
Studying consumer behaviour at the point of purchase has theadvantage of shedding more light on how consumers utilize andevaluate available cues across products and brands, and enhancesthe external validity of the results. On the other hand, capturingreal consumer behaviour at the consumption situation using inhome tests, even though it increases the external validity of the re-sults, carries also some shortcomings. For example, beef is con-sumed with other products, only one product can be tasted atthe time, other family members might influence tasting of theproduct – the family halo effect, and there is a lack of control overthe cooking procedures (Dransfield et al., 2000; Wood, Nute, Fur-sey, & Cuthbertson, 1995). Thus, capturing consumer behaviourat the consumption situation using blind test overcomes thesehandicaps. With regard to beef and blind-tasting test, the cattlebreed type and production system should be considered, as theywere found to influence beef quality attributes like taste, juiciness,and tenderness (Oliver et al., 2006).
The aim of this study was to provide more information aboutconsumers’ quality perception of national branded, national storebranded, and imported store branded beef both before and after beefconsumption at the purchase point, using a simplified framework ofthe Total Food Quality Model (TFQM) of Grunert et al. (1996) and re-ported in Fig. 1. The main objectives were: (i) to evaluate differencesin the consumers’ perceptions of quality cues and perceived beefquality between three differently branded beefs; (ii) to analyse, for
each beef, relationships between perceived quality cues, expectedquality, experienced quality, and future purchase intention, and(iii) to measure whether these relationships differ between threedifferently branded beefs. The study also explored the breed typeand production method of each of the programs evaluated.
2. Methodology
2.1. Beef selection
Beef steaks from three different production systems andbranded differently were selected. Beef steaks from strip loin musclewere harvested from carcasses of steers of two cattle breed-typesfrom Portugal, and one imported from Brazil. The selection of thecommercial carcasses for this trial was conducted by the supermar-ket butcher’s division, and over six days of the trial two carcassesper each breed type (36 carcasses in total) have been used.
One of the Portuguese breeds was produced in the region ofAlentejo (south of Portugal): the Alentejana breed. Alentejana breedis an indigenous purebred raised in a traditional production system(i.e. includes inherent natural and human factors, such as climate,soil quality, and local expertise). Steers of Alentejana breed arereared in extensive grazing systems based on natural pastures, witha finishing period on concentrate feeds during 30 days. Steers areslaughtered at 13–30 months (carcass weight ± 180 kg).
The other Portuguese breed was a cross-breed from the exoticcattle breed Charolais and local cattle breed Mertolenga, com-monly used for production of meat in Portugal, here referred toas National beef. Steers from this cross-breed are reared intensivelyand fattened on concentrate and cereal straw ad libitum. Steers areslaughtered at 12–16 months (carcass weight ± 300 kg).
Finally, the other beef available was an imported one, from Bra-zil, a cross-breed between Nelore and Angus cattle breed, com-monly used for production of meat in Brazil, here referred to asBrazilian beef. Steers from this cross-breed are extensively rearedwith diet based on pasture, silage (corn, sorgus), sugar cane, andsoybean bran. Steers are slaughtered at 17–24 months (carcassweight ± 400 kg).
These beefs are marketed differently. Due to its typical produc-tion, products of breed-Alentejana are registered by the nationalbrand name Carnalentejana, and the other two types, Nationaland Brazilian beef, are marketed under the store brand name ofthe supermarket chain.
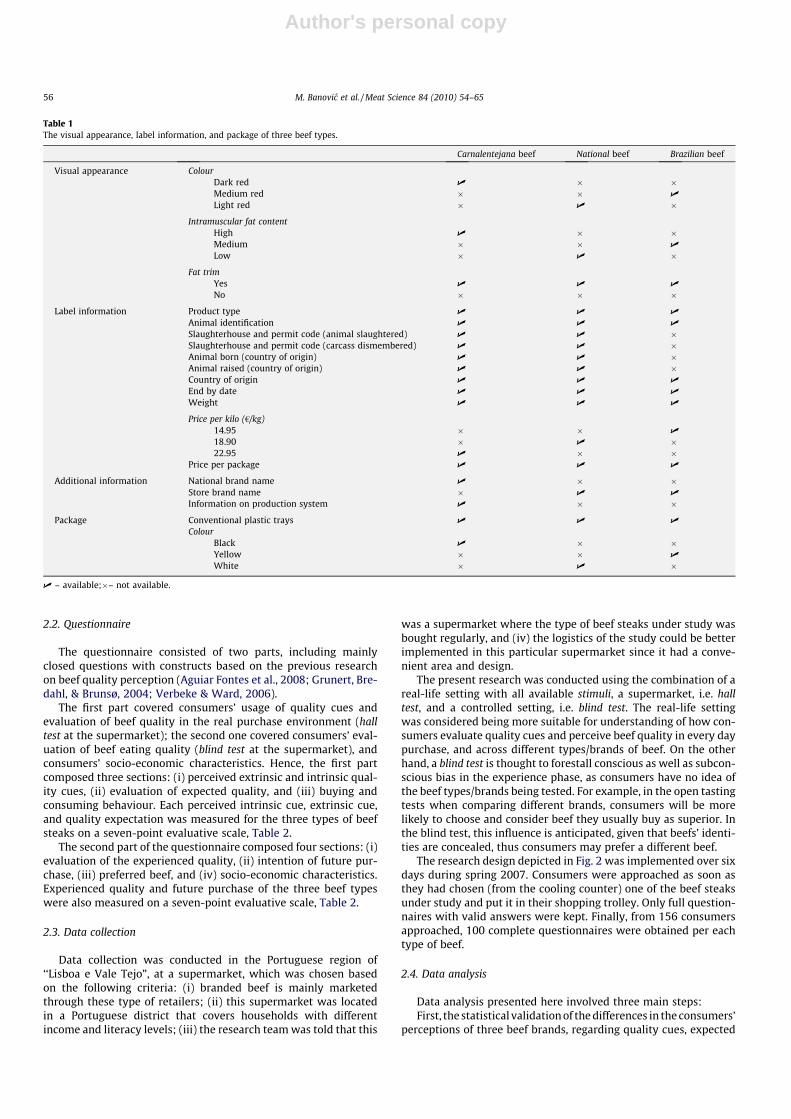
The supermarkets’ butcher department was in charge of collect-ing, cutting and packaging of the beef steaks. For each day of thetrail, over six days, beef steaks were all freshly cut in the sameway and from the same part of selected carcasses, i.e. strip loinmuscle. The strip loin muscle was cut into chops 1.5 cm-thick. Fromthe prepared chops, three beef steaks were randomly selected forlater blind test, while other beef steaks were packed for sale. Beefsteaks for sale were displayed in the usual locations in the retailcounter, where the consumers are expecting to find them. All threebeef types were different in terms of appearance, label information,package and price, Table 1.
Selected beef steaks for blind tasting were cut in 5–6 portions.The supermarket’s butcher department was likewise in charge ofpreparing and cutting the beef steaks for the blind test to ensurethat these were all cut in the same way. The portion of beef steakfor tasting, for all three samples, was from the same place in allslices of the beef steaks. Beef steaks for tasting were stored in cool-ing conditions until grilling (4 �C). The preparation of beef steaksfor tasting took place at the supermarket with an electric contactgrill by a professional cook. Beef steaks were grilled at the pre-heated grill at 200 �C until medium degree of doneness, withoutany salt or spices, and in front of the respondent.
Adapted from Grunert et al. (1996).
Perceived intrinsic and extrinsic cues
Quality expectations
tsetdnilBtsetllaH
Quality experience
Future purchase
Fig. 1. Framework for the analysis.
M. Banovic et al. / Meat Science 84 (2010) 54–65 55
Author's personal copy
2.2. Questionnaire
The questionnaire consisted of two parts, including mainlyclosed questions with constructs based on the previous researchon beef quality perception (Aguiar Fontes et al., 2008; Grunert, Bre-dahl, & Brunsø, 2004; Verbeke & Ward, 2006).
The first part covered consumers’ usage of quality cues andevaluation of beef quality in the real purchase environment (halltest at the supermarket); the second one covered consumers’ eval-uation of beef eating quality (blind test at the supermarket), andconsumers’ socio-economic characteristics. Hence, the first partcomposed three sections: (i) perceived extrinsic and intrinsic qual-ity cues, (ii) evaluation of expected quality, and (iii) buying andconsuming behaviour. Each perceived intrinsic cue, extrinsic cue,and quality expectation was measured for the three types of beefsteaks on a seven-point evaluative scale, Table 2.
The second part of the questionnaire composed four sections: (i)evaluation of the experienced quality, (ii) intention of future pur-chase, (iii) preferred beef, and (iv) socio-economic characteristics.Experienced quality and future purchase of the three beef typeswere also measured on a seven-point evaluative scale, Table 2.
2.3. Data collection
Data collection was conducted in the Portuguese region of‘‘Lisboa e Vale Tejo”, at a supermarket, which was chosen basedon the following criteria: (i) branded beef is mainly marketedthrough these type of retailers; (ii) this supermarket was locatedin a Portuguese district that covers households with differentincome and literacy levels; (iii) the research team was told that this
was a supermarket where the type of beef steaks under study wasbought regularly, and (iv) the logistics of the study could be betterimplemented in this particular supermarket since it had a conve-nient area and design.
The present research was conducted using the combination of areal-life setting with all available stimuli, a supermarket, i.e. halltest, and a controlled setting, i.e. blind test. The real-life settingwas considered being more suitable for understanding of how con-sumers evaluate quality cues and perceive beef quality in every daypurchase, and across different types/brands of beef. On the otherhand, a blind test is thought to forestall conscious as well as subcon-scious bias in the experience phase, as consumers have no idea ofthe beef types/brands being tested. For example, in the open tastingtests when comparing different brands, consumers will be morelikely to choose and consider beef they usually buy as superior. Inthe blind test, this influence is anticipated, given that beefs’ identi-ties are concealed, thus consumers may prefer a different beef.
The research design depicted in Fig. 2 was implemented over sixdays during spring 2007. Consumers were approached as soon asthey had chosen (from the cooling counter) one of the beef steaksunder study and put it in their shopping trolley. Only full question-naires with valid answers were kept. Finally, from 156 consumersapproached, 100 complete questionnaires were obtained per eachtype of beef.
2.4. Data analysis
Data analysis presented here involved three main steps:First, the statistical validation of the differences in the consumers’
perceptions of three beef brands, regarding quality cues, expected
Table 1The visual appearance, label information, and package of three beef types.
Carnalentejana beef National beef Brazilian beef
Visual appearance ColourDark red U � �Medium red � � U
Light red � U �
Intramuscular fat contentHigh U � �Medium � � U
Low � U �
Fat trimYes U U U
No � � �
Label information Product type U U U
Animal identification U U U
Slaughterhouse and permit code (animal slaughtered) U U �Slaughterhouse and permit code (carcass dismembered) U U �Animal born (country of origin) U U �Animal raised (country of origin) U U �Country of origin U U U
End by date U U U
Weight U U U
Price per kilo (€/kg)14.95 � � U
18.90 � U �22.95 U � �
Price per package U U U
Additional information National brand name U � �Store brand name � U U
Information on production system U � �
Package Conventional plastic trays U U U
ColourBlack U � �Yellow � � U
White � U �
U – available;�– not available.
56 M. Banovic et al. / Meat Science 84 (2010) 54–65

Author's personal copy
and experienced quality, and intention for future purchase was as-sessed through F-test, and post hoc tests (Tukey and Dunnett’s test).
Second, in order to examine hypothesized relationships be-tween perceived quality cues, expected quality, experienced qual-
ity, and future purchase intention, Fig. 1, Principal ComponentAnalysis (PCA) (using SPSS 15.0, Varimax rotation with Kaisernormalization) and Reliability Analysis (Cronbach’s a) followedby Partial Least Squares (PLS) were conducted for each beef
Table 2Selected variables and scales.
Variable Scale endpoints
Perceived quality cuesa
Colour 1 – Absolutely dislike 7 – Absolutely likeFat 1 – Absolutely dislike 7 – Absolutely likeCut 1 – Absolutely dislike 7 – Absolutely likeBrand 1 – Absolutely dislike 7 – Absolutely likeCountry of origin 1 – Absolutely dislike 7 – Absolutely likeLabel information 1 – Absolutely dislike 7 – Absolutely likePackage 1 – Absolutely dislike 7 – Absolutely likePrice 1 – Not at all expensive 7 – Extremely expensive
Expected qualityb
Taste 1 – Not at all tasty 7 – Extremely tastyTenderness 1 – Not at all tender 7 – Extremely tenderJuiciness 1 – Not at all juicy 7 – Extremely juicyHealthiness 1 – Not at all healthy 7 – Extremely healthyNutrition 1 – Not at all nutritious 7 – Extremely nutritiousSafety 1 – Not at all safe 7 – Extremely safe
Experienced qualityc
Taste 1 – Not at all tasty 7 – Extremely tastyTenderness 1 – Not at all tender 7 – Extremely tenderJuiciness 1 – Not at all juicy 7 – Extremely juicyHealthiness 1 – Not at all healthy 7 – Extremely healthyNutrition 1 – Not at all nutritious 7 – Extremely nutritiousSafety 1 – Not at all safe 7 – Extremely safeFuture purchase intentiond 1 – Definitely will not buy 7 – Definitely will buy
a Perceived quality cues – hall test.b Expected quality – hall test.c Experienced quality – blind test.d Future purchase intention – blind test.
Fig. 2. Research design.
M. Banovic et al. / Meat Science 84 (2010) 54–65 57

Author's personal copy
separately. The PCA and Reliability analysis were undertaken in or-der to identify underlying factors that explain the patterns within aset of observed variables, i.e. quality cues, expected and experi-enced quality, as well as to obtain constructs that are unidimen-sional (Tenenhaus, Vinzi, Chatelin, & Lauro, 2005). Based on theresults from the PCA and Reliability analysis and using the hypoth-esized relationships in Fig. 1, quality perception models for eachtype of beef were estimated by PLS using SmartPLS 2.0 (Ringle,Wende, & Will, 2005).
The evaluation of model’s goodness-of-fit estimated using PLS isbased on different authors’ recommendations (Chin, 1998; Fornell& Cha, 1994; Hair, Black, Babin, Anderson, & Tatham, 2006; Tenen-haus et al., 2005), Table 3, and assessed in two steps: (i) evaluationof the measurement model quality, and (ii) evaluation of structuralmodel quality.
Finally, in order to compute significant differences between thestandardized path coefficient estimates obtained from three beefmodels, t-test was used (Chin, 2000), where estimated path coeffi-cients were compared two by two. It is assumed that the estimatedpath coefficients are independently distributed and that error var-iance is unknown but equal.
3. Results
Main sample characteristics of the respondents are presentedin Table 4. The majority of respondents were women. Respon-dents’ age ranged from 22 to 82 years, though 40% fell in theage class 31–40. Majority of respondents were highly educatedwith medium to high income. This was expected since beefsteaks from strip loin muscle are the second most expensive beefsteaks in Portugal. With respect to beef purchases, the majorityof respondents bought beef steaks either once a week or 2–3times a month. Respondents claimed to consume beef steaksseveral times a week. In addition, this selection of consumerswas in accordance with previous research undertaken on Portu-guese household food expenditure (Banovic, Barreira, & AguiarFontes, 2006). According to this research women are still the pri-mary food shopper; and households that spend higher share oftotal meat expenditure on beef consumption are mostly house-
holds in region of ‘‘Lisboa e Vale Tejo”, with medium to higherincome, higher literacy levels, and average age between 30 and64 years.
3.1. Differences in consumers’ perceptions of three beef brands
Table 5 shows the mean scores of consumers’ perceptions ofquality cues. As seen from Table 5, consumers perceived Carnal-entejana beef as better than National and Brazilian beef on almostall intrinsic quality cues, except for cut. The fact that cut was notperceived to be different between beef brands was expected, sinceall the beef steaks were cut in the same way. Further, Carnalentej-ana beef was also preferred over other two beef brands in terms ofall extrinsic cues, and regarded as more expensive beef. The brandname Carnalentejana was preferred by consumers over the storebrand names in National and Brazilian beef. Consumers perceivedNational beef, when compared to Brazilian beef, as more expensive,and preferred it in terms of origin and label information. There wasno major distinction between these two beef brands consideringintrinsic quality cues.
Table 6 shows mean evaluations of expected quality aspects forthree types of beef. Consumers perceived Carnalentejana beef ashaving higher expected quality than National and Brazilian beefon all quality aspects considered. Further, it seems that consumersfeel safer with National beef than with Brazilian beef.
Moreover, and as can be seen from Table 7, consumers consid-ered Carnalentejana beef, after the blind-tasting test, as better thanNational and Brazilian beef based on the sensory dimensions taste,tenderness, and juiciness. On the other hand, consumers regardedNational and Brazilian beef to be similar across these sensorydimensions. Other quality aspects, i.e. nutrition, healthiness, andsafety were perceived to be similar between the three beef brands.This was expected, since these dimensions represent credencequality aspects that consumers cannot readily evaluate in the blindtest. Furthermore, consumers’ added that for future beef purchase,Carnalentejana beef would be their choice. Finally, in terms of anoverall appreciation, consumers preferred Carnalentejana beef,over National and Brazilian beef, where 53% of respondents choseCarnalentejana beef.
Table 3Measures for the evaluation of PLS model.
Criterion Rule of thumb Description
Evaluation of measurement model qualityFactor loadings P0.7 Convergent validityAverage variance
extracted (AVE)P0.5 Convergent and Discriminant validity
Square root AVE Less than correlations amonglatent constructs
Discriminant validity
Composite reliability (CR) P0.7 Convergent validityCross-validated
communality (CVC)index
>0 Observed values well reconstructed and model has a predictive relevance;index assessed by blindfolding method (Wold, 1985)
Evaluation of structural model qualityR2 0.67 – substantial Power of the relations among different latent constructs (Chin, 1998)
0.33 – moderate0.19 – weak
Standardized pathestimates
Should be significant at 0.1,0.05 or 0.001
t-Values computed using a bootstrapping method (Hesterberg, Monaghan, Moore, Clipson, & Epstein,2003)
Cross-validatedredundancy (CVR)index
>0 Model has a predictive relevance; index assessed by blindfolding method (Wold, 1985)
Global criterion ofgoodness-of-fit (GOF)
Closer to 1 better the fit Absolute GOF is computed as the geometric mean of the average communality and the average R2, whilethe relative GOF is computed by dividing the absolute GOF value by its maximum value achievable for theanalysed set. (Tenenhaus, Vinzi, Chatelin, & Lauro, 2005)– Absolute GOF
– Relative GOF
58 M. Banovic et al. / Meat Science 84 (2010) 54–65

Author's personal copy
3.2. Relationships between perceived quality cues, expected quality,experienced quality, and future purchase intention for three beefbrands
In order to investigate the underlying factor structure of per-ceived quality cues, expected and experienced quality, three PCA
analyses were performed for each of the three beef types. Theresults are presented in Table 8.
The results from the PCA analysis for perceived quality cues andfor each beef, Table 8, revealed three distinct factors. These factorscan be dubbed as intrinsic, extrinsic, and price factors. The extractedfactors explained a high proportion of the original variance, had
Table 4Sample characteristics (n = 100).
Variable Categories Frequency (%)/mean (St. deviation)
District Lisboa 62.0Setúbal 38.0
Gender Female 66.0Male 34.0
Household size 3.0 (1.3)Number of children (<12 years) 0.5 (0.9)Civil state Single 19.0
Married 64.0Widow/er 3.0Divorced 4.0Other cases 10.0
Age 630 15.031–40 41.041–50 20.0P51 24.0
Education Primary school 15.0Secondary school 16.0Bachelor 5.0University or higher 64.0
Household net income per month (€) <1100 14.01110–1850 21.01850–3700 37.0>3700 28.0
Beef buying frequency Once a week 41.02–3 times a month 41.0Less than once a month 18.0
Beef consumption frequency Daily 6.02–3 times a week 47.0Once a week 26.0Less than once a week 21.0
Table 5Quality cues – mean scores for three beef brands on a seven-point scale.A
Carnalentejana beef National beef Brazilian beef F-test (ANOVA) p-Value
Colour 5.81a 5.28b 5.07b 8.306 .000Fat 5.03a 4.45b 4.18b 7.864 .000Cut 5.14a 5.08a 4.76a 2.013 .135Brand 5.90a 4.32b 4.09b 56.881 .000Country of origin 6.13a 5.13b 4.56c 34.788 .000Price 5.94a 5.14b 4.04c 53.253 .000Label information 5.48a 4.99b 4.53c 12.440 .000Package 5.22a 4.57b 4.32b 10.249 .000
AA higher mean score indicates better appreciation of quality cues and more expensively perceived meat by the consumers (see Table 2).a,b,cScores in the same row with a different superscript are significantly different at p < 0.05 (post hoc Tukey and Dunnett’s multiple comparison tests).
Table 6Expected quality – mean scores for three beef brands on a seven-point scale.A
Carnalentejana beef National beef Brazilian beef F-test (ANOVA) p-Value
Taste 5.97a 5.02b 5.10b 18.831 .000Tenderness 5.88a 5.15b 5.27b 10.273 .000Juiciness 5.92a 5.18b 5.23b 12.964 .000Nutrition 5.48a 5.07b 4.91b 6.059 .003Healthiness 5.14a 4.63b 4.43b 7.010 .001Safety 5.86a 5.10b 4.81c 15.582 .000
AA higher mean score indicates better meat quality expectations by the consumers (see Table 2).a,b,cScores in the same row with a different superscript are significantly different at p < 0.05 (post hoc Tukey and Dunnett’s multiple comparison tests).
M. Banovic et al. / Meat Science 84 (2010) 54–65 59

Author's personal copy
Eigenvalues over one, and yielded satisfactory Cronbach’s a. A sim-ilar structure of intrinsic and extrinsic factors was obtained forboth Carnalentejana and National beef. The extrinsic factor coveredbrand, origin, label information, and package, while the intrinsic
factor included colour, fat, and cut. Similar factors’ constructs werefound for Brazilian beef. Notice that in the case of Brazilian beef thefirst factor identified was intrinsic, and not extrinsic like in the caseof Carnalentejana and National beef. Another interesting element is
Table 8Results of PCA analysis on perceived quality cues, expected and experienced quality.A
Carnalentejana beef National beef Brazilian beef
Factor 1 Factor 2 Factor 3 Factor 1 Factor 2 Factor 3 Factor 1 Factor 2 Factor 3
Perceived quality cues Extrinsic Intrinsic Price Extrinsic Intrinsic Price Intrinsic Extrinsic PriceBrand .79 .72 .64Origin .79 .82 .77Label information .71 .73 .69Package .63 .58 .78Colour .85 .77 .64Fat .65 .83 .80Cut .67 .74 .58Price .74 .94 .96Eigenvalues 2.35 1.67 1.18 2.27 2.09 1.08 2.23 1.98 1.09% Variance explained 29.33 20.90 14.71 28.43 26.11 13.46 27.90 24.75 13.58Cronbach’s a .73 .61 .74 .74 .73 .64BTB 164.39 205.37 171.92KMOC .64 .77 .71
% Total variance 64.95 68.00 66.23
Expected quality Eating quality Health quality Eating quality Health quality Eating quality Health quality
Taste .85 .89 .87Tenderness .82 .83 .90Juiciness .84 .89 .90Healthiness .89 .87 .89Nutrition .82 .84 .88Safety .67 .62 .70Eigenvalues 2.29 2.03 2.65 2.13 2.59 2.15% Variance explained 38.14 33.76 44.26 35.50 43.14 35.83Cronbach’s a .82 .77 .90 .83 .90 .81BTB 220.22 354.61 312.22KMOC .74 .87 .78
% Total variance 71.91 79.76 78.97
Experienced quality Eating quality Health quality Eating quality Health quality Eating quality Health quality
Taste .76 .82 .88Tenderness .88 .90 .84Juiciness .84 .87 .84Healthiness .86 .90 .87Nutrition .85 .80 .89Safety .77 .74 .75Eigenvalues 2.12 2.12 2.35 2.09 2.35 2.21% Variance explained 35.35 35.35 39.08 34.86 39.18 36.77Cronbach’s a .79 .79 .85 .78 .85 .82BTB 202.45 246.95 267.33KMOC .72 .73 .74
% Total variance 70.69 73.94 75.95
AVarimax rotated solution. Factor loadings < 0.50 excluded.BBartlett’s test of sphericity (all significant at p < 0.001).CKaiser–Meyer–Olkin measure of sampling adequacy.
Table 7Experienced quality and future purchase – mean scores for three beef brands on a seven-point scale.A
Carnalentejana beef National beef Brazilian beef F-test (ANOVA) p-Value
Experienced qualityTaste 5.43a 4.96b 4.91b 6.227 .000Tenderness 5.66a 4.90b 5.19b 8.793 .002Juiciness 5.51a 5.12b 4.91b 5.318 .005Nutrition 5.12a 4.97a 5.01a .523 .593Healthiness 4.83a 4.78a 4.73a .175 .840Safety 5.29a 5.26a 5.20a .194 .824Future purchase intention 5.73a 4.69b 4.69b 12.273 .000
AA higher mean score indicates better appreciation of meat and higher intention for future purchase by the consumers (see Table 2).a,b,cScores in the same row with a different superscript are significantly different at p < 0.05 (post hoc Tukey and Dunnett’s multiple comparison tests).
60 M. Banovic et al. / Meat Science 84 (2010) 54–65

Author's personal copy
that origin was loading on intrinsic factor in the case of Brazilianbeef. Price was perceived as a separate factor for all three typesof beef.
The second PCA analysis was undertaken to investigate dimen-sionality of the expected quality for three beef brands. Regardingexpected quality and three beef types, two factors emerged, Table8, an eating dimension and a health dimension. The first factor, forthree beef brands, eating dimension included taste, tenderness,and juiciness. The second factor, for three beef brands, health
dimension covered nutrition, healthiness, and safety. Both factorsyielded high proportion of variance, Eigenvalues values over one,and satisfactory Cronbach’s a.
The results of the third PCA analysis on experienced quality,after the blind-taste, brought to light the same two-factor structurefor the three types of beef. Again, experienced eating quality coveredtaste, tenderness, and juiciness, while experienced health qualitycovered healthiness, nutrition, and safety, for all three types ofbeef. Factors obtained from the third PCA analysis resulted in high
Table 9Measurement models.
Relationships Carnalentejana beef National beef Brazilian beef
Standardizedfactor loadings
Itemreliabilities
Standardizedfactor loadings
Itemreliabilities
Standardizedfactor loadings
Itemreliabilities
Perceived extrinsic cuesBrand .83 .70 .83 .69 .90 .81Origin .77 .60 .79 .63 – –Label information .79 .62 .67 .45 .71 .50Package .58 .33 .69 .48 .64 .41CR .83 .84 .80AVE .56 .56 .57CVC .26 .27 .20
Perceived intrinsic cuesColour .85 .72 .88 .77 .81 .65Fat .76 .58 .72 .52 .68 .46Cut .62 .38 .82 .68 .74 .55OriginA .74 .55CR .79 .85 .83AVE .56 .65 .55CVC .16 .31 .26
Perceived pricePrice 1.0 1.0 1.0 1.0 1.0 1.0CR 1.0 1.0 1.0AVE 1.0 1.0 1.0CVC – – –
Expected eating qualityTaste .88 .77 .92 .85 .91 .83Tenderness .87 .75 .91 .83 .92 .84Juiciness .83 .69 .90 .81 .90 .82CR .89 .94 .94AVE .74 .83 .83CVC .46 .62 .62
Expected health qualityHealth .85 .72 .87 .75 .87 .75Nutrition .82 .68 .84 .71 .83 .69Safety .80 .64 .87 .76 .85 .73CR .86 .90 .89AVE .68 .74 .73CVC .35 .46 .43
Experienced eating qualityTaste .82 .68 .85 .72 .87 .76Tenderness .86 .74 .89 .80 .86 .74Juiciness .83 .69 .90 .81 .89 .80CR .88 .91 .91AVE .70 .87 .77CVC .39 .52 .51
Experienced health qualityHealth .89 .80 .87 .76 .91 .83Nutrition .83 .69 .80 .65 .82 .67Safety .79 .72 .82 .67 .84 .71CR .88 .87 .89AVE .70 .69 .73CVC .40 .37 .45
Future purchaseIntention to buy 1.0 1.0 1.0 1.0 1.0 1.0CR 1.0 1.0 1.0AVE 1.0 1.0 1.0CVC – – –
All significant at p < 0.01.AVE – average variance extracted; CR – composite reliability; CVC – cross-validated communality – blindfolding results.AOrigin was considered as intrinsic cue only for Brazilian beef.
M. Banovic et al. / Meat Science 84 (2010) 54–65 61

Author's personal copy
proportion of variance explained, Eigenvalues over one, and whenseparate items combined into scales revealed satisfactory Cron-bach’s a.
Based on the findings from PCA analyses on perceived qualitycues, expected and experienced quality (for each beef), Table 8,and hypothesized relationships in Fig. 1, the relationships betweenperceived quality cues, expected quality, experienced quality, andfuture purchase intention for each beef investigated, i.e. Carnal-entejana, National, and Brazilian, was estimated using PLS pathmodelling.
Table 9 provides standardized factor loadings for each item andtheir corresponding reliabilities, as well as the goodness of fit mea-sures for the measurement model for each beef type. Overall, whenobserving the quality of the measurement model for each beef,they support the validity of the latent constructs included in thequality perception model for each beef. That is, factor loadingsare above 0.7 and corresponding reliabilities above 0.5. All AVE val-ues are higher than the suggested cut off level of 0.5, and each con-struct square root AVE is larger than its correlations with the otherconstructs. Composite reliability (CR) is greater than the recom-mended level of 0.7 for all constructs. Finally, all three models ex-hibit positive CV-communality (CVC) showing that the observedvariables are well reconstructed and that measurement modelhas a good predictive relevance.
Table 10 shows standardized path estimates of the structuralmodel for each beef, as well as the corresponding goodness of fitmeasures. The quality of the structural model is initially observedby the R2, measuring the explanatory power of the relations be-tween the different constructs. Results show that in all three mod-els, the best explained endogenous construct is future purchase,followed by expected eating quality, while the other constructs are
explained moderately to weak. The less explained of all constructsand for all beef is experienced eating quality, as expected. This find-ing is in line with previous research on the matter (Brunsø et al.,2005). Moreover, all three models exhibit positive CV-redundancy(CVR) and confirm good fit of the models. Finally, absolute and rel-ative criterions of goodness-of-fit (GOF) are also computed for thestructural models showing the satisfactory fit of the three models.
When observing the structural model, and estimated path coef-ficients, Table 10, some interesting matters emerge. Consumersseem to utilize perceived intrinsic cues more in order to infer ex-pected eating quality of Brazilian and National beef. On the otherhand, for Carnalentejana beef, consumers use perceived extrinsiccues with quite similar weight, as perceived intrinsic cues. Whenforming eating quality expectations of Brazilian beef, consumersutilize perceived extrinsic cues with much lower weight than per-ceived intrinsic cues. Further, consumers form health qualityexpectations using more perceived extrinsic cues than perceivedintrinsic cues. Consumers perceived price as unimportant factorfor quality evaluation of both Carnalentejana and Brazilian beef.However, in the case of National beef, consumers regarded priceas predictive of expected eating quality. Moreover, in this case,the relationship between perceived price and expected eatingquality is positive (i.e. higher price linked to a higher eating qualityexpectation), what implies that consumers use price as a qualitycue.
Generally, Table 10, the relationship between expected andexperienced beef quality is stronger between expected and experi-enced health quality, than between expected and experienced eat-ing quality. Additionally, explained variance of experienced eatingquality is very weak in all structural models. Furthermore, and forthree beef brands, experienced health quality is reasonably well
Table 10Structural models. Standardized path estimates, multiple-group comparison of the standardized path estimates, and goodness-of-fit measures.
Relationship Standardized path estimates t-Test (t-Value)
Carnalentejana beef National beef Brazilian beef C–N C–B N–B
Expected eating qualityPerceived extrinsic cues .37���� .31���� .19�� .53 2.02�� 1.07Perceived intrinsic cues .38���� .48���� .59���� �1.09 �2.11�� �1.04Perceived price .13 .14� �.02 .08 1.35 1.87�
R2 .33 .51 .50CVR .17 .38 .39
Expected health qualityPerceived extrinsic cues .33���� .31��� .32��� .09 .06 �.63Perceived intrinsic cues .20��� .25�� .25�� �.39 �.37 .00Perceived price .09 .12 .01 �.21 .60 1.11R2 .20 .27 .25CVR .09 .14 .12
Experienced eating qualityExpected eating quality .17�� .25�� .35��� �.51 �1.27 �.59R2 .03 .06 .12CVR .01 .04 .09Experienced health qualityExpected health quality .22�� .33���� .47���� �.74 �1.84� �1.10Experienced eating quality .33���� .36���� .28��� �.24 .42 .59R2 .17 .25 .37CVR .11 .17 .26Future purchase intentionExperienced eating quality .65���� .62���� .79���� .30 �1.95� �1.91�
Experienced health quality �.02 �.11 �.12 �1.05 �1.16 �.10R2 .42 .39 .56CVR .40 .37 .55GOF – absolute .40 .47 .51GOF – relative .74 .85 .88
C – Carnalentejana beef; N – National beef; B – Brazilian beef.CVR – cross validated redundancy – blindfolding results.�p < 0.1.��p < 0.05.���p < 0.01.����p < 0.001.
62 M. Banovic et al. / Meat Science 84 (2010) 54–65

Author's personal copy
explained by expected health quality and experienced eating qual-ity. Finally, future purchase, for three beef brands, is highly influ-enced by experienced eating quality. These findings are verymuch in accordance with other studies in this field (Bredahl,2003; Brunsø et al., 2005).
3.3. Comparison of structural relationships
In order to observe differences in the structural relationships,standardized path coefficients were compared two by two be-tween the three beef models using the t-test, Table 10. As seenfrom Table 10 results show differences between six path estimates.
The influence of perceived intrinsic cues on expected eatingquality is significantly different between Carnalentejana and Brazil-ian beef. Perceived attractiveness of intrinsic cues has much higherinfluence on expected eating quality of Brazilian beef than of Car-nalentejana beef. Another significant difference was also observedbetween Carnalentejana and Brazilian beef, but now in the relationbetween perceived extrinsic cues and expected eating quality. Inthis case, the influence of perceived extrinsic cues on expected eat-ing quality was higher for Carnalentejana beef than it was for Bra-zilian beef. Further, results show that the influence of perceivedprice on expected eating quality significantly differs between Na-tional and Brazilian beef. However, consumers considered price asan important factor for forming eating quality expectations onlyin the case of National beef. A further significant difference was ob-served between Carnalentejana and Brazilian beef for the relation-ship expected health quality–experienced health quality. Thisrelationship is stronger for Brazilian beef.
Finally, results show that Brazilian beef differs from both Carnal-entejana and National beef in the relationship between experiencedeating quality and future purchase. This is in such a way that theinfluence of experienced eating quality on future purchase is muchmore distinct in the case of Brazilian beef.
4. Conclusions and discussion
This study analysed quality perception of a particular beef prod-uct, i.e. beef steaks from strip loin muscle and from the three differ-ently branded beefs and provides a comprehensive insight of theconsumers’ beef quality perception process, both at the purchasepoint, and after beef consumption, regarding Portuguese consum-ers. The results from this study are very much in accordance withfindings from similar studies (Acebrón & Dopico, 2000; Bredahl,2003; Brunsø et al., 2005; Grunert, 1997).
At the point of purchase, consumers preferred beef steaks fromnational branded Carnalentejana beef on all quality cues and qual-ity aspects, over the other two store branded beefs. The fact thatCarnalentejana beef was perceived as better than National and Bra-zilian beef on all quality cues and quality aspects might suggestthat consumers actually find information about the way this beefis produced (e.g. autochthonous breed; traditional methods; spe-cific product characteristics) provided by the national brand nameand label information as relevant and predictive of a higher beefquality. This finding is in line with the suggestion by Brunsøet al. (2005) that only when a brand translates intrinsic productcharacteristics, usually difficult to evaluate, to extrinsic ones, andthus makes them visible, will the brand actually signal the qualityof the product.
On the other hand, the fact that both National and Brazilianbeef were unknown store brands, might have led consumers toprefer national branded Carnalentejana beef. This is supportedby the studies of Richardson et al. (1994), Bellizzi et al. (1981),and Cunningham et al. (1982). Moreover, Carnalentejana is awell-known national brand name among Portuguese consumers
(Banovic et al., 2008), might have override much of the labelinformation. In other words, once the consumer recognizes thewell-know national brand name, the details on its label becomeof minor importance. That is, consumers’ prior experience andconfidence in credibility of Carnalentejana brand might have influ-enced evaluations of both quality cues and quality aspects leadingto increased expected quality of this beef. This is in accordancewith previous research, on branded beef by Bredahl (2003), whichhas shown that prior experience with the particular brand mightinfluence not only expected quality, but also future purchases.Moreover, it has also revealed that familiar brand might overrulethe influence of other product information, such as intrinsic cues,promotional material, package and price, on expected beefquality.
Second, preference for Carnalentejana beef stays highly consis-tent even after blind tasting, where consumers differentiate thisbeef from the other two beef brands on all sensory dimensions:taste, tenderness, and juiciness, and choose it as the preferredone. Finding that Carnalentejana beef was perceived as better onall sensory aspects might suggest that Carnalentejana, being anautochthonous Portuguese breed, raised in a traditional way,where steers are kept on natural and/or improved pastures andsupplemented with forages and/or concentrates during the periodsof low availability of grass (Barreira, Brandão, Lemos, & Aguiar Fon-tes, 2009) can have distinctive features that lead consumers, in ablind taste, to evaluate this beef as better when comparing it toothers. This finding is in agreement with other studies, which haveshown that the production system that includes breed, slaughterweight, and fattening of the animals affect their meat characteris-tics (Oliver et al., 2006; Realini, Duckett, Brito, Dalla Rizza, & DeMattos, 2004).
Third, in the case of Brazilian beef, consumers use more intrinsicquality cues to form expectations about beef eating quality, whileextrinsic cues are important in the case of Carnalentejana beef. Thisfinding confirms conclusions mentioned above, that consumers’acquaintance with the national brand name Carnalentejana mighthave overruled other product information. Moreover, consumersregarded this well-known brand as much more relevant and trust-worthy to make judgements of beef quality, than the unknownstore brand associated with Brazilian beef. Furthermore, as major-ity of consumers were highly educated, it might be that they aremore aware of the certain intrinsic qualities national beef Carnal-entejana might possess when compared to Brazilian beef. Hence,as the store brand of Brazilian beef does not have an effective com-munication strategy, it cannot enjoy the same advantages relevantto familiar national brand. Hence, this again confirms that brandfunctions better if it has a strong consumers’ recognition (Richard-son et al., 1994), that is, if consumers have knowledge and abilityto recall of this brand (Juhl et al., 2006). Furthermore, Brazilian beefis a lower priced, poorly packed beef, with no label information onproduction method or objective product characteristics, whichapparently leaves additional vague impression on the consumers.Consequently, this might led consumers not only to discount qual-ity of Brazilian beef, but also to increase reliance on perceivedintrinsic quality cues.
Fourth, consumers perceived price to be a quality indicator forNational beef, where higher price was linked to higher beef qual-ity, while for Brazilian beef consumers regarded price as an unim-portant factor. The case of National beef may be explained by thefact that when the product does not carry a strong brand, pricemay be used to reduce the purchase risk and to re-identify theproduct (Monroe & Krishnan, 1985; Stokes, 1985). On the otherhand, as Brazilian beef is lower priced beef than other two beefbrands, consumers use more intrinsic quality cues and countryof origin to summarize the available information (Johansson,1989). For Carnalentejana beef, price was perceived as unimpor-
M. Banovic et al. / Meat Science 84 (2010) 54–65 63

Author's personal copy
tant due to the presence of a strong brand name which set asidethe effect of price. This is in accordance with Olson’s research(1977), which showed that price becomes less important as aquality cue when other quality cues, such as brand are present.However, unimportance of price in the quality evaluation of Car-nalentejana beef might also be owed to the fact that this group ofconsumers were highly educated individuals, with medium tohigh income, who probably care less about the price, than theydo about quality.
Finally, results show that that the relationship between experi-enced eating quality and further purchase is very strong for allthree types of beef, but is significantly different between Brazilianand Carnalentejana beef and likewise between Brazilian and Na-tional beef. This relationship was much stronger for Brazilian beef.These findings can be explained by the fact that in the blind-tastingphase, consumers did not have the information (e.g. brand, price)and the knowledge which beef they are experiencing, thus the lar-ger variation in sensory quality with regard to Carnalentejana andNational beef, and more constant quality of Brazilian beef, led con-sumers to be more sure of their future purchase in the case of Bra-zilian beef. Notice that Brazilian beef was less appreciated thanCarnalentejana beef.
The aforementioned results have implications for the beef sec-tor. Regarding in particular Carnalentejana beef, the results havedemonstrated the impact this kind of national brand name canhave on the perceived beef quality. That is, a brand backed byan effective communication strategy, related to specific productcharacteristics and production methods (relevant for the consum-ers), and considered as predictive of higher beef quality, can bevery valuable in the marketplace. On the other hand, store brandsnot consistently positioned and lacking of relevant product-re-lated information, might lead consumers to perceive them asambiguous and of lower value, when compared to those productswith a well-known national brand name. Here, making invest-ments in strong brand image, besides improvements in theextrinsic cues associated with store brands, as package designand labelling may increase consumers’ quality expectations ofproducts carrying those brands. Alternately, the provision ofproducts with more consistent quality may increase the perceivedquality and influence future purchases of store brands. On theother hand, failing to provide consistent quality may result in dis-confirmation and decrease of the perceived quality of nationalbrands.
Another relevant implication for Carnalentejana beef and itsproducers is that consumers indeed differentiate this beef fromothers, not only at the purchase point, but also in the consumptionphase and on all sensory dimensions. A traditional production sys-tem like in the case of Alentejana breed does add value to the prod-uct. Nevertheless, producers and marketers of Carnalentejana beefshould be aware of their vulnerability to quality variation, as hav-ing a strong brand image without delivering a corresponding levelof product quality may result in lower consumers’ willingness topay the premium for national brands.
Acknowledgements
The authors would like to thank Professor Raul Fernandes Jorgefrom Instituto Superior de Agronomia and Professor Luís ManuelMorgado Tavares from Faculdade de Medicina Veterinária, Univer-sidade Técnica de Lisboa for their help in the implementation ofthis research project. The present research was supported by Pro-ject AGRO 422: A quality policy for the beef sector in Portugal: pro-duction systems, consumers’ tastes and preferences. M. Banovicwas supported by Fundação para a Ciência e a Tecnologia throughgrant SFRH/BD/21784/2005.
References
Acebrón, L. B., & Dopico, D. C. (2000). The importance of intrinsic and extrinsic cuesto expected and experienced quality: An empirical application for beef. FoodQuality and Preference, 11, 229–238.
Aguiar Fontes, M., Lemos, J. P. C., Banovic, M., Monteiro, A. C. G., Lúcio, C., Duarte, M.F., et al. (2008). Is beef differentiation a real source of competitiveness? Acombination of procedures to achieve an answer. In R. Fanfani, E. Ball, L.Gutierrez, & E. Ricci Maccarini (Eds.), Competitiveness in agriculture and foodindustry: US and EU perspectives. Bologna: BUP.
Banovic, M., Barreira, M. M., & Aguiar Fontes, M. (2006). Portuguese household foodexpenditure: 1990, 1995 and 2000. New Medit, 2, 25–31.
Banovic, M., Barreira, M. M., Fraústo da Silva, M., Lemos, J. P. C., Aguiar Fontes, M., &Jorge, R. (2008). The role of specific quality labels in rural development: Lessonsfrom the Portuguese experience. In D. Tomic & M. M. Ševarlic (Eds.),Development of agriculture and rural areas in central and eastern Europe:Thematic proceedings of the 100th seminar of EAAE (pp. 439–448). Beograd:Mladost-biro, Serbia.
Barreira, M. M., Brandão, A.R.W., Lemos, J. P. C., & Aguiar Fontes, M. (2009). Qualityperceptions of PDO beef producers. Agricultural Economics Review, in press.
Bellizzi, J. A., Kruckeberg, H. F., Hamilton, J. R., & Martin, W. S. (1981). Consumerperceptions of national, private, and generic brands. Journal of Retailing, 57, 56–70.
Bredahl, L. (2003). Cue utilisation and quality perception with regard to brandedbeef. Food Quality and Preference, 15, 65–75.
Brunsø, K., Bredahl, L., Grunert, K. G., & Scholderer, J. (2005). Consumer perceptionof the quality of beef resulting from various fattening regimes. LivestockProduction Science, 94, 83–93.
Cardello, A. V. (1997). Food stereotypes: Prejudice in the pantry. Cereal Foods World,42(4), 231–233.
Chin, W. W. (1998). The partial least squares approach to structural equationmodelling. In G. A. Marcoulides (Ed.), Modern methods for business research(pp. 295–358). Mahwah: Lawrence Erlbaum Associates.
Chin, W. W. (2000). Multiple-group analysis with PLS: Frequently asked questions –Partial Least Squares and PLS-graph. <http://discnt.cba.uh.edu/chin/plsfaq/plsfaq.htm>.
Cunningham, I. C. M., Hardy, A. P., & Imperia, G. (1982). Generic brands versusnational brands and store brands. Journal of Advertising Research, 22, 25–32.
Dodds, W. B., Monroe, K. B., & Grewal, D. (1991). Effects of price, brand and storeinformation on buyers’ product evaluations. Journal of Marketing Research, 28,307–319.
Dransfield, E., Martin, J. F., Fisher, A., Nute, G. R., Zygyiannis, D., Stamataris, C., et al.(2000). Home placement testing of lamb conducted in six countries. Journal ofSensory Studies, 15(4), 421–436.
Fornell, C., & Cha, J. (1994). Partial least squares. In R. P. Bagozzi (Ed.), Advancedmethods of marketing research (pp. 52–78). Cambridge: Blackwell.
Grunert, K. G. (1997). What’s in a steak? A cross-cultural study of the qualityperception of beef. Food Quality and Preference, 8(3), 157–174.
Grunert, K. G., Bredahl, L., & Brunsø, K. (2004). Consumer perception of meat qualityand implications for product development in the meat sector – A review. MeatScience, 66, 259–272.
Grunert, K. G., Hartvig Larsen, H., Madsen, T. K., & Baadsgaard, A. (1996). Marketorientation in food and agriculture. Norwell, MA: Kluwer.
Guerrero, L., Colomer, Y., Guàrdia, M. D., Xicola, J., & Clotet, R. (2000). Consumerattitude towards store brands. Food Quality and Preference, 11(5), 387–395.
Hair, J. F., Jr., Black, W. C., Babin, B. J., Anderson, R. E., & Tatham, R. L. (2006).Multivariate data analysis. New Jersey: Pearson, Prentice Hall.
Hesterberg, T., Monaghan, S., Moore, D. S., Clipson, A., & Epstein, R. (2003). Bootstrapmethods and permutation tests. New York: W.H. Freeman and Company.
Johansson, J. K. (1989). Determinants and effects of the use of ‘made in’ labels.International Marketing Review, 6, 47–58.
Juhl, H. J., Esbjerg, L., Grunert, K. G., Bech-Larsen, T., & Brunsø, K. (2006). The fightbetween store brands and national brands – What’s the score? Journal ofRetailing and Consumer Services, 13(5), 331–338.
Monroe, K. B., & Krishnan, R. (1985). The effect of price on subjective productevaluations. In J. Jacoby & J. C. Olson (Eds.), Perceived quality: How consumersview stores and merchandise (pp. 209–232). Toronto: Lexington.
Oliver, M. A., Nute, G. R., Font i Furnols, M., San Julián, R., Campo, M. M., Sañudo, C.,et al. (2006). Eating quality of beef, from different production systems, assessedby German, Spanish and British consumers. Meat Science, 74, 435–442.
Olson, J. C. (1977). Price as an informational cue: Effects on product evaluations. InA. G. Woodside, J. N. Sheth, & P. D. Bennett (Eds.), Consumer and industrial buyingbehavior (pp. 267–286). New York: Elsevier.
Realini, C. E., Duckett, S. K., Brito, G. W., Dalla Rizza, M., & De Mattos, D. (2004).Effect of pasture vs concentrate feeding with or without antioxidants on carcasscharacteristics, fatty acid composition, and quality of Uruguayan beef. MeatScience, 66, 567–577.
Richardson, P. S., Dick, A. S., & Jain, A. K. (1994). Extrinsic and intrinsic cue effect onperceptions of store brand quality. Journal of Marketing, 58(4), 28–36.
Ringle, C., Wende S., & Will, A. (2005). Smart-PLS version 2.0. <http://www.smartpls.de>.
Steenkamp, J.-B. E. M. (1990). Conceptual model of the quality perception process.Journal of Business Research, 21, 309–333.
Stokes, R. C. (1985). The effect of price, package, design and brand familiarity onperceived quality. In J. Jacoby & J. Olson (Eds.), Perceived quality (pp. 233–246).Lexington, MA: Lexington Books.
64 M. Banovic et al. / Meat Science 84 (2010) 54–65

Author's personal copy
Tenenhaus, M., Vinzi, E., Chatelin, Y.-M., & Lauro, C. (2005). PLS path modelling.Computational Statistics and Data Analysis, 48(1), 159–205.
Verbeke, W., & Ward, R. W. (2006). Consumer interest in information cues denotingquality, traceability and origin: An application of ordered probit models to beeflabels. Food Quality and Preference, 17(6), 453–467.
Wold, H. (1985). Partial least squares. In S. Kotz & N. L. Johnson (Eds.). Encyclopaediaof statistical sciences (Vol. 6, pp. 581–591). New York: Wiley-Interscience.
Wood, J. D., Nute, G. R., Fursey, G. A., & Cuthbertson, A. (1995). The effect of cookingconditions on the eating quality of pork. Meat Science, 40, 127–135.
M. Banovic et al. / Meat Science 84 (2010) 54–65 65