Test-Treat-Retain” cascade for men who have sex with ... - CES
99
Clare Barrington, Renato Santa Luce, Karla Guzmán, Yolanda Pajarito, Juan Pablo Alvis, Christian Murray, Dirk A. Davis, Alexandra Munson, Katie Flowers, M. Ricardo Calderón UNIVERSIDAD DEL VALLE DE GUATEMALA Programa Regional Centroamericano de VIH Guatemala March 2020July 2019 Strengthening the “Reach- Test-Treat-Retain” cascade for men who have sex with men in Guatemala: A pilot intervention. EIR- HIV KPIS
-
Upload
khangminh22 -
Category
Documents
-
view
0 -
download
0
Transcript of Test-Treat-Retain” cascade for men who have sex with ... - CES

Clare Barrington, Renato Santa Luce, Karla Guzmán, Yolanda Pajarito, Juan Pablo Alvis, Christian Murray, Dirk A. Davis, Alexandra Munson, Katie Flowers, M. Ricardo Calderón
UNIVERSIDAD DEL VALLE DE GUATEMALA Programa Regional Centroamericano de VIH Guatemala March 2020July 2019
Strengthening the “Reach-Test-Treat-Retain” cascade for men who have sex with men in Guatemala: A
pilot intervention. EIR-HIV KPIS

Strengthening the “Reach-Test-Treat-Retain” cascade for men who have sex with men in Guatemala: A pilot intervention” (EIR-HIV KPIS) 1
The presentation of this material was supported by the Presidential Emergency Plan for AIDS Relief
(PEPFAR) through the United States Centers for Disease Control and Prevention (CDC), under the terms
and conditions of the Cooperative Agreement with the Universidad del Valle de Guatemala No.
5U2GGH001285-02. The content of this material is the responsibility of the authors and does not
necessarily represent the official position of the funding agencies.

Strengthening the “Reach-Test-Treat-Retain” cascade for men who have sex with men in Guatemala: A pilot intervention” (EIR-HIV KPIS) 2
TABLE OF CONTENTS
1. INTRODUCTION ................................................................................................................................................. 4
1.1 STUDY PURPOSE ....................................................................................................................................................... 5
2. STUDY DESIGN AND METHODS ……………………………………………………………………………………………………………6
2.1 STUDY POPULATION .................................................................................................................................................. 6 2.2 AIM 1 METHODS ...................................................................................................................................................... 7 2.3 AIM 2 METHODS ...................................................................................................................................................... 8 2.4 AIM 2 INTERVENTION COMPONENTS ............................................................................................................................ 9 2.5 AIM 2 EVALUATION ................................................................................................................................................ 11
2.6 ETHICAL APPROVALS ............................................................................................................................................... 16 2.7 REFERENCES .......................................................................................................................................................... 16
3. AIM 1 FORMATIVE RESEARCH .......................................................................................................................... 18
3.1 DESCRIPTION ......................................................................................................................................................... 18 3.2 RESULTS ............................................................................................................................................................... 18 3.3 IMPLICATIONS FOR INTERVENTION .............................................................................................................................. 22
4. DECENTRALIZATION ......................................................................................................................................... 23
4.1 DESCRIPTION ......................................................................................................................................................... 23 4.2 RESULTS ............................................................................................................................................................... 24 4.3 CONCLUSIONS ........................................................................................................................................................ 29 4.4 KEY FINDINGS .................................................................................................................................................... 29 4.5 REFERENCES .......................................................................................................................................................... 30
5. ECONOMIC EVALUATION ................................................................................................................................. 31
5.1 DESCRIPTION ......................................................................................................................................................... 31 5.2 METHODS ............................................................................................................................................................. 31 5.3 RESULTS ............................................................................................................................................................... 34 5.4 CONCLUSIONS ........................................................................................................................................................ 56 5.5 REFERENCES .......................................................................................................................................................... 58
6. HEALTH NAVIGATION ...................................................................................................................................... 59
6.1 NAVIGATION DESCRIPTION ....................................................................................................................................... 59 6.2 NAVIGATION MONITORING SYSTEM ........................................................................................................................... 59 6.3 NAVIGATION RESULTS .............................................................................................................................................. 60 6.4 VOLUNTARY PARTNER REFERRAL DESCRIPTION ............................................................................................................ 72 6.5 VOLUNTARY PARTNER REFERRAL RESULTS .................................................................................................................... 72 6.6 CONCLUSIONS ........................................................................................................................................................ 76 6.7 KEY FINDINGS .................................................................................................................................................... 76 6.8 REFERENCES .......................................................................................................................................................... 77
7. EMOTIONAL WELLBEING .................................................................................................................................. 78
7.1 DESCRIPTION ........................................................................................................................................................ 78 7.2 RESULTS ............................................................................................................................................................... 78 7.3 CONCLUSIONS ........................................................................................................................................................ 87 7.4 KEY FINDINGS .................................................................................................................................................... 87 7.5 REFERENCES .......................................................................................................................................................... 88

Strengthening the “Reach-Test-Treat-Retain” cascade for men who have sex with men in Guatemala: A pilot intervention” (EIR-HIV KPIS) 3
8. MHEALTH ......................................................................................................................................................... 89
8.1 DESCRIPTION ......................................................................................................................................................... 89 8.2 RESULTS ............................................................................................................................................................... 90 8.3 CONCLUSIONS ........................................................................................................................................................ 94 8.4 KEY FINDINGS .................................................................................................................................................... 94 8.5 REFERENCES .......................................................................................................................................................... 95
9. CAPACITY BUILDING ......................................................................................................................................... 96
9.1 COMPREHENSIVE HIV CARE ..................................................................................................................................... 96 9.2 PHARMACY ........................................................................................................................................................... 97 9.3 EMOTIONAL WELLBEING .......................................................................................................................................... 97 9.4 LABORATORY ......................................................................................................................................................... 97
10. CONCLUSIONS ................................................................................................................................................ 98
Strengthening the “Reach-Test-Treat-Retain” cascade for men who have sex with men in Guatemala: A pilot intervention” (EIR-HIV KPIS) 4
1. INTRODUCTION Significant advances have been achieved in HIV prevention and care in recent years with expanded access
to anti-retroviral therapy (ART) and the demonstrated effect of viral suppression on HIV transmission, or
what is referred to treatment as prevention (TasP) (Cohen et al. 2016; Cohen et al. 2011; Yombi and
Mertes 2018). Gaps exist in understanding how to optimize the potential of TasP among individuals from
key populations living with HIV, including men who have sex with men (MSM) and transgender women
(TW), especially in resource-constrained settings. There is also a need for greater understanding of how
individuals from key populations navigate care and treatment systems to inform interventions that
translate the biomedical advances of TasP to the reality of HIV clinics in low-and-middle-income countries
in a sustainable manner.
The HIV epidemic in Guatemala is characterized as concentrated, with adult HIV prevalence at the national
level estimated to be less than 1% (Miller et al. 2010), compared to 10.5% among MSM (Guardado Escobar
et al. 2017). Late presentation due to missed opportunities for diagnosis has historically been a challenge
to optimizing TasP (Meléndez et al. 2018), though improvements in early diagnosis have been made in
recent years, including using innovative strategies such as navigation for linkage to care (Loya-Montiel et
al. 2018; Barrington et al. 2016). While access to ART has improved dramatically during the last decade,
in 2015 it was estimated that only 35% (18,325) of the 52,784 people living with HIV in Guatemala were
engaged in HIV care and 31% (16,386) received anti-retroviral therapy (ART), which is provided to all
people living with HIV free of charge by the government (Mejia 2015). These HIV continuum data are not
available for specific key populations in Guatemala. The overall trend of high drop-off from diagnosis to
engagement in care, however, highlights the need for interventions to strengthen the continuum of care
to translate the biomedical advances in HIV treatment and prevention to the reality of HIV clinics in low-
income and middle-income countries.
While MSM experience a disproportionate burden of HIV in Guatemala, prior to this study, very little was
known about their experiences navigating the HIV care and treatment system and how these experiences
affect their HIV outcomes, in particular sustained viral suppression. In research exploring the social
context of sexual health in general among MSM and TW in Guatemala City, barriers to accessing sexual
health care in general included fear, cost, lack of social support, and the multiple, intersecting forms of
stigma related to sexual and gender identity, socio-economic position, and involvement in sex work
(Tucker et al. 2014; Boyce et al. 2012). In a qualitative study with both MSM and TW living with HIV in
Guatemala City, Barrington et al (2016) again found that intersecting stigma and discrimination created
fear of HIV testing and linkage to HIV care and barriers to knowledge about HIV. Retention-specific
determinants included HIV clinic dynamics and limited employment opportunities, which affected
economic stability. These multiple levels of factors driving linkage and retention in care and treatment
require multi-level, integrated responses.

Strengthening the “Reach-Test-Treat-Retain” cascade for men who have sex with men in Guatemala: A pilot intervention” (EIR-HIV KPIS) 5
1.1 Study Purpose The purpose of the Key Populations Implementation Science (KPIS) study “Strengthening the ‘Reach-Test-
Treat-Retain’ cascade for men who have sex with men and transgender women in Guatemala: A pilot
intervention” was to:
Implement and evaluate a pilot intervention to sustain and improve viral suppression, adherence to ART,
and retention in care among MSM and TW living with HIV in Guatemala City in a cost-effective manner.
Specific aims included:
Aim 1: Adapt and refine a multi-level intervention model through qualitative, formative
assessment conducted in Guatemala City, Quetzaltenango, Escuintla, and Coatepeque.
Aim 2: Assess the feasibility, initial effects, and cost of a multi-level intervention to sustain viral
suppression, adherence to ART, and retention in HIV care among MSM living with HIV in
Guatemala City.
Aim 3: Disseminate findings from the pilot to develop adaptation and sustainability plans in the
17 HIV Comprehensive Care Units (CCU) in Guatemala.
It is important to note that following data collection for Aim 1, two key changes were made to the KPIS
study. First, decentralization as a strategy to improve sustainable, high-quality HIV care was identified as
a priority in Guatemala and was integrated as a key strategy in the multi-level intervention package. This
shift resulted in focusing implementation on the highly centralized HIV clinic at the Roosevelt Hospital and
working to create capacity for HIV care and treatment at three specialized key population friendly HIV/STI
prevention and treatment clinics, known locally as VICITS clinic. The research team also decided to focus
on MSM as the target population given the importance of generating population-specific findings that
reflect the unique reality of different groups.
Strengthening the “Reach-Test-Treat-Retain” cascade for men who have sex with men in Guatemala: A pilot intervention” (EIR-HIV KPIS) 6
2. STUDY DESIGN AND METHODS We conducted a prospective, mixed-methods study implemented in three phases, each guided by a study
aim. For Aim 1, we conducted formative, qualitative interviews with MSM and TW living with HIV and key
informants (n=38). For Aim 2, we recruited 374 MSM living with HIV to receive a combination of the
following intervention strategies: 1) emotional wellbeing; 2) navigation; 3) voluntary partner referral for
HIV prevention, care and treatment; 4) mHealth messages and 5) decentralization of HIV care and
treatment. Capacity building was integrated throughout the intervention strategies. Following the
intervention implementation period, Aim 3 entailed facilitating a dissemination process to promote
adaptation and sustainability of the intervention components found to be effective to the other HIV clinics
in the country .
Evaluation of the intervention included longitudinal qualitative interviews and focus groups, quantitative
surveys, and clinical measures in order to obtain a systematic, contextualized, and holistic understanding
of the intervention experience and outcomes. We first conducted a formative qualitative assessment to
confirm acceptability of the proposed intervention strategies and to identify any specific implementation
considerations (Aim 1). Informed by the findings of this formative work, we designed and implemented a
multi-level intervention to achieve sustained viral suppression, adherence to ART, and retention in HIV
care among MSM at the Roosevelt Hospital and 3 VICITS clinics in Guatemala City (Aim 2). We evaluated
the intervention using socio-behavioral surveys and viral load testing at baseline and 12 months follow-
up, clinical chart review, and longitudinal qualitative interviews with an embedded cohort of intervention
participants. We also assessed cost at the patient and provider (facility) levels.
2.1 Study Population The target populations for Aim 1 was MSM and TW living with HIV and HIV care providers. We broadly
defined these populations in the following manner:
MSM living with HIV: Male, 18 years old or older, who has been diagnosed as being HIV positive,
living/working/receiving HIV care in Guatemala City, Quetzaltenango, Escuintla, or Coatepeque
(Aim 1) or in Guatemala City only (Aim 2), and reports having sex with a man (oral or anal sex) at
least once in lifetime.
TW living with HIV: Born as a biological male but self-defines as transgender, 18 years old or older,
who has been diagnosed as being HIV positive, living/working/receiving HIV care in Guatemala
City, Quetzaltenango, Escuintla, or Coatepeque (Aim 1); and reports having had sex with a man
(oral or anal sex) at least once in lifetime.
HIV Care provider: 18 years old or older, provider of HIV-related care and/or treatment services
at one of the participating clinics including physicians, nurses, psychologists, social workers, etc.
For Aim 1, we only recruited MSM and TW who were currently receiving HIV care as we were interested
in assessing how our proposed strategies to strengthen the cascade resonated with their experiences. We
defined “currently retained in care” as having attended at least 75% of appointments in the last twelve
months. For most individuals, this would mean having attended at least 3 out of 4 appointments in the
last year based on the standard protocol of appointments every 3 months. We also recruited HIV care
providers at each facility for key informant interviews.

Strengthening the “Reach-Test-Treat-Retain” cascade for men who have sex with men in Guatemala: A pilot intervention” (EIR-HIV KPIS) 7
For Aim 2, we recruited 374 MSM living with HIV who met the following eligibility criteria:
1. At least 18 years of age 2. Male 1. Self-report ever having sex with men 2. Diagnosed with HIV and enrolled in care at the Roosevelt Hospital in Guatemala City 3. Enrolled in HIV care and treatment services at Roosevelt HIV clinic at the time of recruitment 4. Speak and understand Spanish
Potential participants who met these general criteria were then recruited into three study groups for Aim
2 based on specific eligibility criteria described below:
Group 1 (Decentralized): consistently in care at Roosevelt for at least a year AND have a viral load
<1000 copies/mL, AND taking a first line ART regimen and voluntarily chose to decentralize to one
of three clinics.
Group 2 (Decentralization eligible, stayed centralized): consistently in care at Roosevelt for at
least a year AND have a viral load <1000 copies/mL, AND taking a first line ART regimen and
voluntarily chose to stay receiving care at Roosevelt.
Group 3: including both newly diagnosed individuals and those who were re-engaged in care at
Roosevelt within the last year.
Aim 3 focused on dissemination and scale-up and therefore did not include a specific study population.
2.2 Aim 1 Methods Aim 1 sample and recruitment
For Aim 1, MSM and TW who had been diagnosed with HIV for at least 6 months and were currently
receiving care in Guatemala City, Quetzaltenango, Escuintla, and Coatepeque were recruited through
referrals from HIV care providers, representatives from NGO’s, or other participants in the study. HIV care
providers introduced the study to potential participants when they attended an HIV care appointment at
one of the participating clinics. At each clinic we identified a pool of providers (e.g., physician, nurse, social
workers, and psychologist) who had contact with MSM and TW populations. We first introduced the study
to the Comprehensive Care Units (CCU) leadership and obtained recommendations for potential
participants, who we then approached about the study.
Aim 1 Data collection and Analysis
We developed 2 semi-structured guides: one for MSM and TW living with HIV and another for key
informants. The interview guide followed an illness narrative structure, starting with diagnosis and
progressing through linkage to care and experiences living with HIV over time. In the key informant guides
with HIV providers, we elicited critical perspectives and opinions about the state of HIV care for MSM and
TW, again grounded in the experiences of HIV care providers. Interviews were conducted in a private
location, usually within the HIV clinic. Interviewers took detailed field notes in a structured template
covering the key themes of Aim 1 immediately following the interview in order to facilitate timely analysis
and application of data. All interviews were audio-recorded, with the permission of participants, and
Strengthening the “Reach-Test-Treat-Retain” cascade for men who have sex with men in Guatemala: A pilot intervention” (EIR-HIV KPIS) 8
transcribed verbatim. We used rapid analysis techniques to identify salient themes and experiences to
inform and modify the intervention strategies proposed for Aim 2.
2.3 Aim 2 Methods Aim 2 sample and recruitment
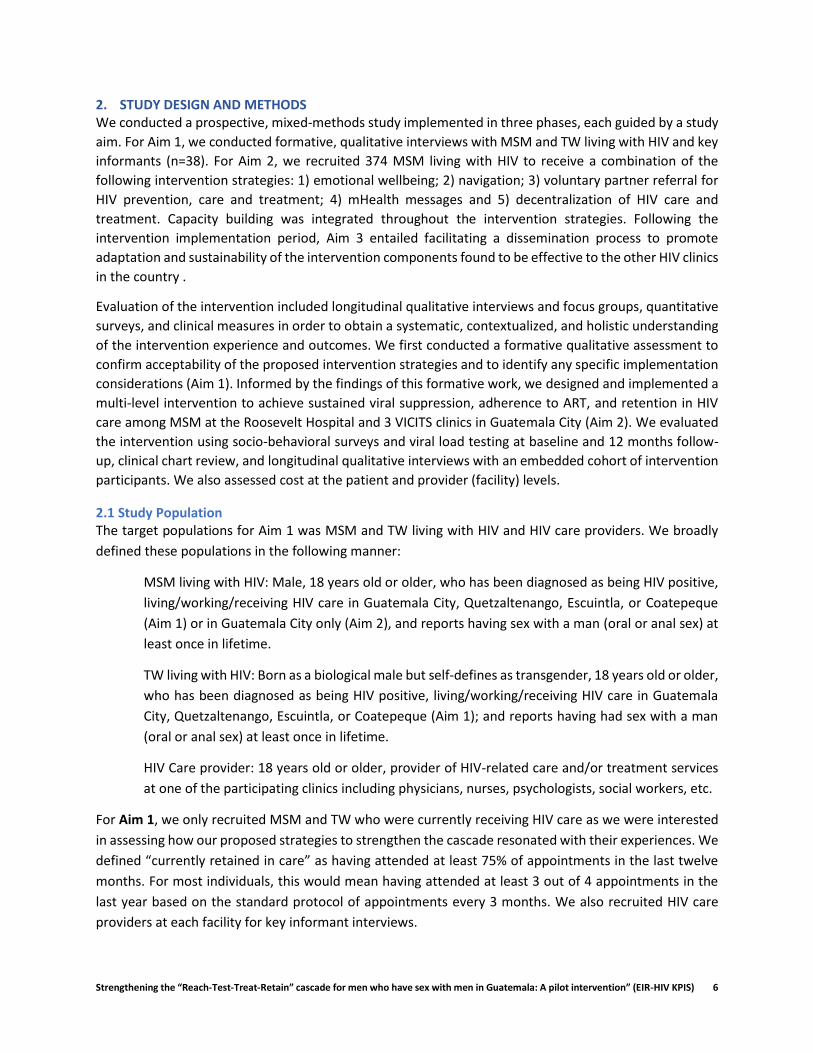
For Aim 2, MSM were recruited at the Roosevelt Hospital HIV clinic in Guatemala City through a staged
process. Figure 1 provides an overview of the recruitment process for Aim 2. The Roosevelt clinic team
screened medical charts of 2333 men living with HIV for general study criteria and identified a pool of 445
potential participants. Potential participants were then screened for decentralization criteria. Guided by
the results of the screening process, the study team approached potential participants for recruitment
from January to May 2017 when they came in for regular HIV care appointments. Individuals who were
eligible for decentralization were given the option to enroll in the study and decentralize to one of the 3
VICITS clinics (Group 1) or continue to receive care at Roosevelt. Individuals who were not
decentralization-eligible (Group 3) were given the option to enroll in the study and continue receiving care
at Roosevelt. All participants were offered the support of a navigator and mHealth appointment
reminders and Group 3 participants were also offered emotional wellbeing. Out of 445 MSM who were
identified as potential eligible participants, 400 were initially enrolled in the study. Of these, 374
completed all consent procedures and participated in all study-related assessments. Sample size by group
was 124 in Group 1, 137 in Group 2 and 113 in Group 3.
Figure 1. Aim 2 Screening and recruitment into study groups
For the qualitative evaluation of Aim 2, we recruited an embedded sample of 30 MSM to participate in
qualitative interviews at baseline, 6 months, and 12 months. This longitudinal data collection allowed us
to follow the evolution of change over time through participant’s narratives of their experiences,
elucidating processes and mechanisms of change related to study outcomes. We recruited 20 participants
Strengthening the “Reach-Test-Treat-Retain” cascade for men who have sex with men in Guatemala: A pilot intervention” (EIR-HIV KPIS) 9
who were decentralization eligible (5 who stayed at Roosevelt and 5 from each of the 3 VICITS clinics) and
10 participants from Group 3.
2.4 Aim 2 Intervention Components Our differentiated care intervention included five different strategies including: 1) Emotional Wellbeing;
2) Navigation; 3) Voluntary partner referral; 3) mHealth messages; and 5) Decentralization. As mentioned
above, capacity building was integrated throughout intervention strategies. As reflected in Figure 1,
participants who were decentralized were offered navigation (including voluntary partner referral),
mHealth, in addition to decentralization. Participants who were decentralization eligible but opted to
continue receiving HIV care and treatment at Roosevelt were offered navigation (including voluntary
partner referral), and mHealth all at Roosevelt. Participants who were not decentralization eligible were
offered emotional wellbeing in addition to navigation (including voluntary partner referral), and mHealth
at Roosevelt. The reason for the additional component of emotional wellbeing for those who were not
decentralization eligible was that given their new diagnosis or experience abandoning care, we believed
these patients would benefit from our patient-centered counseling and education program in order to
accelerate their progression towards acceptance of their diagnosis and retention in care, adherence to
treatment and viral suppression. We describe each intervention component in detail below.
Emotional Wellbeing We developed a 4-session emotional wellbeing intervention integrating health education and counseling.
The sessions were facilitated by a trained psychologist in a private location at the Roosevelt Hospital. We
adapted two curricula developed by members of our team in other studies, one with female sex workers
in the Dominican Republic, called Abriendo Puertas (Opening Doors) and one with Latino MSM and TW in
North Carolina called Enlaces por la Salud (Health Linkages), to the local context of MSM in Guatemala
(“Enlaces Por La Salud Intervention Guide” 2014; “Modelo de Intervención Terapéutico ‘Abriendo
Puertas’: Manual de Consejería” 2019). The adaptation process was informed by findings from Aim 1 and
resulted in a manual to guide the implementation process. Each session was flexible and responded to
the emotional wellbeing, priorities, and interests of the participant while still being systematic with clear
goals and plans for each session. Topics covered in these sessions included: disclosure and communication
about HIV; self-acceptance and self-esteem; knowledge of HIV care and ART; substance use; and managing
stigma related to HIV and sexual/gender identity, among others. ART adherence was a cross-cutting
theme and topic reinforced in all sessions.
Navigation Health navigation is a “strengths-based” model originally developed in the context of cancer care and
adapted as a way to support people living with HIV to negotiate social and structural barriers to care
(Bradford, Coleman, and Cunningham 2007; Mizuno et al. 2018; Higa et al. 2012; Govindasamy et al.
2014). We built upon a health navigation model developed by members of our study team through a Key
Population Challenge Fund study to support early testing and linkages to care among MSM and TW in
Guatemala City (Loya-Montiel et al. 2018; Davis et al. 2017). We extended that model to provide ongoing
social support for sustained retention in care and adherence. Navigation was offered to all participants.
Navigators aided in disclosing to family, friends and partners, and providing social support as needed by
the patient for the duration of the study. Navigators also worked with participants to address barriers to
Strengthening the “Reach-Test-Treat-Retain” cascade for men who have sex with men in Guatemala: A pilot intervention” (EIR-HIV KPIS) 10
accessing care, develop strategies to use their existing resources, cultivate additional resources to
maintain health and well-being, and, when needed, advocate for their rights. Navigators facilitated the
voluntary partner referral process (described below) for those participants who requested such support.
Voluntary Partner Referral This component reflects the growing interest in reaching partners of individuals who are known to be
living with HIV as a target population for testing, linkage to care and care and treatment services (WHO
2016). As part of navigation, intervention participants were offered support with disclosure and referrals
to testing for their partners if they were interested. Partners were offered services based on their
individual situation including HIV/STI testing, linkage to care at Roosevelt or another clinic for those who
test positive, re-engagement to care for those who had been in care, and referral to preventive services.
We did not engage in any data collection with partners, but we tracked referrals through study surveys
and navigator monitoring.
mHealth Messages Mobile technology is increasingly used to extend the reach of health care in low-income countries.
mHealth (mobile-health) strategies have been reported to effectively promote specific HIV-related
health behaviors, such as adherence to HIV treatment, at low cost (Pop-Eleches et al. 2011; Horvath et al.
2012). In a recent systematic review of mHealth for the treatment and prevention of HIV, Catalani and
colleagues emphasized the need to integrate mHealth tools to HIV programs to key populations, including
MSM (Catalani et al. 2013).
The mHealth component in KPIS included developing and using a bidirectional text-message system (a system that sends and receives text-messages) in order to meet two goals: 1) to promote retention in care and 2) to measure exposure and acceptability of text-messages. Messages were sent 1 month, 2 weeks and 1 week (or less) before each clinic appointment. Participants who accepted participation in this component were asked to provide their telephone number to receive messages during enrollment. The mHealth platform that we developed for this study (“2-way SMS4research”) was capable of sending reminder and informational text-messages, and of receiving and categorizing incoming answers.
Decentralization Finally, we implemented a partial decentralization from the Roosevelt HIV clinic to one of the 3 VICITS
clinics, two Non-Governmental Organization (NGO) clinics (Colectivo Amigos Contra el SIDA and
Fundacion Marco Antonio), and one governmental clinic (Zone 3 STI clinic). In addition to decentralization,
each clinic offered distinct days and hours of services, including evenings and weekends, with scheduled
appointment times, reflecting additional strategies of differentiated care.
Participants who opted to be decentralized receive their routine care and treatment and the intervention
strategies at a VICITS clinic for their 3, 6, and 9-month appointments during the 12-month intervention
period. Routine care at the VICITS clinics followed the same model of care provided at Roosevelt; a care
team from Roosevelt was assigned to each of the 3 VICITS clinics to provide clinical care and training to
VICITS staff, including a pharmacist who supervised drug supply, management, and distribution at the 3
VICITS clinics. All laboratory tests including blood chemistries, hematology, viral load, and CD4 were
performed at the Roosevelt laboratory (blood samples of decentralized participants were collected at the

Strengthening the “Reach-Test-Treat-Retain” cascade for men who have sex with men in Guatemala: A pilot intervention” (EIR-HIV KPIS) 11
VICITS clinic and sent to Roosevelt). Baseline and endline (12-month) appointments occurred at Roosevelt
or other study sites to facilitate evaluation activities.
In order to refine our approach to decentralization, a PEPFAR and MOH supported strategy in Central
America, we conducted a rapid assessment of priorities and preferences for HIV care and treatment with
MSM. We used the results to refine our decentralization model to the needs of our patient population. A
member of the study team administered the instrument, which included both closed and open-ended
questions to assess preferences and priorities with regard to HIV care and treatment.
Health Provider Capacity Building Capacity building was integrated throughout the KPIS study. We facilitated bi-directional exchange
between providers at Roosevelt and the VICITS clinics to strengthen capacities for HIV and STI clinical care.
We also facilitated capacity building in Emotional Wellbeing, training providers at all facilities in our
manual. Finally, representatives from the UVG study team, Roosevelt and VICITS clinics participated in
courses on comprehensive HIV care and exchange visits with a clinic in Mexico.
2.5 Aim 2 Evaluation
2.5.1 Aim 2 Design We used a prospective, comparative, mixed-methods approach to assess biological and behavioral
outcomes among the three intervention groups. As reflected In Figure 2, we integrated qualitative,
quantitative, and clinical data due to the multi-faceted and complex nature of the HIV care and treatment
experience, a phenomenon that cannot be fully understood through only one source of data (Irwin 2008).
Our primary biological outcome for the intervention was a sustained viral load of <1000 copies/mL from
baseline to endline. The primary behavioral outcomes were retention in care and adherence. We also
conducted a longitudinal qualitative evaluation of the intervention experience and a quantitative
assessment of cost.

Strengthening the “Reach-Test-Treat-Retain” cascade for men who have sex with men in Guatemala: A pilot intervention” (EIR-HIV KPIS) 12
Figure 2. Aim 2 Evaluation Components
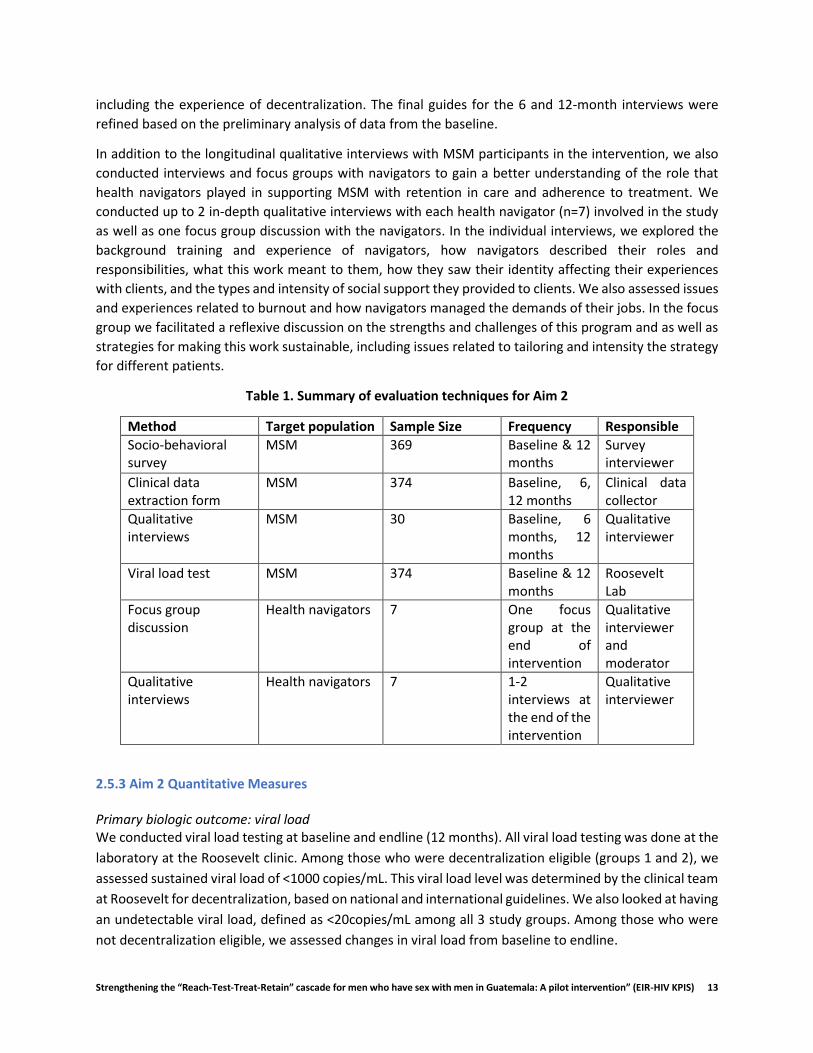
3.5.2 Aim 2 Data Collection We developed a set of evaluation tools to elicit key information related to study aims. Table 1 provides a
summary of the methods and samples for each evaluation component of Aim 2.
Socio-behavioral surveys
Interviewer-administered socio-behavioral surveys were conducted at baseline and 12-months follow-up
(endline) in private locations at the Roosevelt and VICITS clinics. The socio-behavioral survey was
developed based on international surveys and our team’s previous work in Guatemala. The instruments
were also developed with input from key stakeholders and were piloted to confirm they were
understandable to the participants. Key measures are described below.
Clinical data
We extracted data for every clinical visit during the study period and the year prior to the visit. Data was
extracted by Roosevelt staff. The clinical data form followed the structure of the MANGUA system, a
national system used to track HIV clinical data in Guatemala.
Qualitative data collection
We conducted qualitative interviews at baseline, 6 months, and 12 months; interviews at baseline and 12
months were conducted at Roosevelt while the 6 months interview were conducted at Roosevelt for those
who receive their care there and at the VICITS clinics for those who have been decentralized. For each
interview we used a semi-structured guide to elicit narratives of participant’s life experiences with HIV
prior to and during the intervention. We probed on topics related to the individual, relational and
contextual factors that affect retention and adherence as well as the specific intervention components,
Quantitative
Evaluation
Qualitative
Evaluation
Socio-behavioral survey(0 and 12 months)
n = 368 MSM
Cost Evaluation
Clinical Survey(0, 6 and 12 months)
n = 374 MSM
Viral Load(0 and 12 months)
n = 374 HSH
Qualitative Interviews(0, 6 and 12 months)
n = 30 MSM
Socio-behavioral survey
(0 and 12 months)
n = 368 MSM
Provider cost tool(12 months)
n = 4 clinics
Qualitative Interviews(12 months)
n = 7 navigators
Focus Group(12 months)
n = 7 navigators
Qualitative Interviews
(0, 6 and 12 months)n = 30 MSM
Evaluation Components (Aim 2)
Strengthening the “Reach-Test-Treat-Retain” cascade for men who have sex with men in Guatemala: A pilot intervention” (EIR-HIV KPIS) 13
including the experience of decentralization. The final guides for the 6 and 12-month interviews were
refined based on the preliminary analysis of data from the baseline.
In addition to the longitudinal qualitative interviews with MSM participants in the intervention, we also
conducted interviews and focus groups with navigators to gain a better understanding of the role that
health navigators played in supporting MSM with retention in care and adherence to treatment. We
conducted up to 2 in-depth qualitative interviews with each health navigator (n=7) involved in the study
as well as one focus group discussion with the navigators. In the individual interviews, we explored the
background training and experience of navigators, how navigators described their roles and
responsibilities, what this work meant to them, how they saw their identity affecting their experiences
with clients, and the types and intensity of social support they provided to clients. We also assessed issues
and experiences related to burnout and how navigators managed the demands of their jobs. In the focus
group we facilitated a reflexive discussion on the strengths and challenges of this program and as well as
strategies for making this work sustainable, including issues related to tailoring and intensity the strategy
for different patients.
Table 1. Summary of evaluation techniques for Aim 2
Method Target population Sample Size Frequency Responsible
Socio-behavioral survey
MSM 369 Baseline & 12 months
Survey interviewer
Clinical data extraction form
MSM 374 Baseline, 6, 12 months
Clinical data collector
Qualitative interviews
MSM 30 Baseline, 6 months, 12 months
Qualitative interviewer
Viral load test MSM 374 Baseline & 12 months
Roosevelt Lab
Focus group discussion
Health navigators 7 One focus group at the end of intervention
Qualitative interviewer and moderator
Qualitative interviews
Health navigators 7 1-2 interviews at the end of the intervention
Qualitative interviewer
2.5.3 Aim 2 Quantitative Measures Primary biologic outcome: viral load We conducted viral load testing at baseline and endline (12 months). All viral load testing was done at the
laboratory at the Roosevelt clinic. Among those who were decentralization eligible (groups 1 and 2), we
assessed sustained viral load of <1000 copies/mL. This viral load level was determined by the clinical team
at Roosevelt for decentralization, based on national and international guidelines. We also looked at having
an undetectable viral load, defined as <20copies/mL among all 3 study groups. Among those who were
not decentralization eligible, we assessed changes in viral load from baseline to endline.

Strengthening the “Reach-Test-Treat-Retain” cascade for men who have sex with men in Guatemala: A pilot intervention” (EIR-HIV KPIS) 14
Primary behavioral outcomes:
ART Adherence was defined as no missed doses in the last 4 days based on self-report in baseline and 12-
month socio-behavioral surveys using the AIDS Clinical Trials Group (ACTG) adherence measures.
Retention in care was defined as attending at least 3 of the 4 quarterly appointments in the last 12
months. We also looked at full retention (4 out of 4 quarterly appointments). We also assessed retention
in care through clinic logs each quarter.
Cost analysis measures
Cost measures will include direct and indirect costing from the patient and the service provider in order
to capture the aggregate cost per patient.
Additional clinic data
CD4, past viral load, opportunistic infections, body mass index, treatment regimens.
Independent and control variables
Socio-demographic factors included age, gender, education, nationality, dependents, main source of
income; mental health; substance use; alcohol use; involvement in sex work; employment; stigma and
discrimination related to HIV, and sexual/gender identity; intimate partner violence; social support; sexual
behavior including number of partners and condom use.
Exposure to the intervention
We assessed exposure to the intervention in several ways. We developed a monitoring system for the
navigation component which tracked the number of interactions with each participant during the study.
For the emotional wellbeing component, the provider tracked the number of sessions attended by
participants.
2.5.4 Aim 2 Quantitative Analysis We computed descriptive statistics for the three groups and tested for differences in demographic and
clinical variables across groups. For Groups 1 and 2 (decentralized and decentralization-eligible), we
assessed sustained viral load from baseline to endline. For Group 3, we tested for differences from
baseline to endline in viral load, retention and adherence. For all groups, we also assessed and compared
outcomes by intervention intensity (i.e. number of EW sessions attended, number of interactions with
navigator). Analyses were conducted using the R software.
2.5.5 Aim 2 Qualitative Analysis All of the qualitative interviews were audio-recorded and transcribed verbatim. We integrated narrative
and thematic analysis for this evaluation (Maxwell and Miller 2008). Since we had longitudinal data, we
developed an overall narrative summary for each participant to follow key themes and narratives across
interviews. We iteratively updated these summaries during the data collection process as interviews were
conducted at 6 and 12 months. We also conducted rapid thematic analysis for each component to
contextualize the quantitative findings using the qualitative software Atlas.ti. Future qualitative analysis
used systematic coding and additional narrative analysis to assess “narratives of change” within and
across participants.

Strengthening the “Reach-Test-Treat-Retain” cascade for men who have sex with men in Guatemala: A pilot intervention” (EIR-HIV KPIS) 15
For the interviews and focus group with navigators, we followed similar analytic procedures. All of the
individual interviews and the focus group discussion were audio-recorded and transcribed verbatim. We
listened to audio and read the transcripts multiple times and wrote analytic memos. We again conducted
rapid thematic analysis.
2.6 Ethical Approvals
All participants provided consent and all participation was voluntary, both in the research and
intervention activities. The study was reviewed and approved by Ethics Committee for the Protection of
Human Subjects of the Guatemalan Ministry of Health and the Universidad del Valle de Guatemala and
the Institutional Review Board of the University of North Carolina at Chapel Hill. The protocol was
reviewed in accordance with CDC human research protection procedures and was determined to be
research, but CDC investigators did not interact with human subjects or have access to identifiable data
or specimens for research purposes.
Strengthening the “Reach-Test-Treat-Retain” cascade for men who have sex with men in Guatemala: A pilot intervention” (EIR-HIV KPIS) 16
2.7 References Barrington, Clare, Kelly Knudston, Olga Alicia Paz Bailey, Jose Manuel Aguilar, Marilu Itzel Loya-Montiel,
Sonia Morales-Miranda, Olga Alicia Paz Bailey, et al. 2016. “HIV Diagnosis, Linkage to Care, and Retention among Men Who Have Sex with Men and Transgender Women in Guatemala City.” Journal of Health Care for the Poor and Underserved 27 (4): 1745–60. doi:10.1353/hpu.2016.0160.
Boyce, Sabrina, Clare Barrington, Herbert Bolaños, Cesar Galindo Arandi, and Gabriela Paz-Bailey. 2012. “Facilitating Access to Sexual Health Services for Men Who Have Sex with Men and Male-to-Female Transgender Persons in Guatemala City.” Culture, Health and Sexuality 14 (3): 313–27. doi:10.1080/13691058.2011.639393.
Bradford, Judith B, Sharon Coleman, and William Cunningham. 2007. “HIV System Navigation: An Emerging Model to Improve HIV Care Access.” AIDS Patient Care STDS 21 Suppl 1 (s1): S49-58. doi:10.1089/apc.2007.9987.
Catalani, C, W Philbrick, H Fraser, P Mechael, and DM Israelski. 2013. “MHealth for HIV Treatment & Prevention: A Systematic Review of the Literature.” Open AIDS Journal 7: 17–41. https://www.dvb.org/resources/public/factsheets/dvb-t2_factsheet.pdf.
Cohen, Myron S., Ying Q. Chen, Marybeth McCauley, Theresa Gamble, Mina C. Hosseinipour, Nagalingeswaran Kumarasamy, James G. Hakim, et al. 2011. “Prevention of HIV-1 Infection with Early Antiretroviral Therapy.” The New England Journal of Medicine 365 (19): 1763–70.
Cohen, Myron S., Ying Q. Chen, Marybeth McCauley, Theresa Gamble, Mina C. Hosseinipour, Nagalingeswaran Kumarasamy, James G. Hakim, et al. 2016. “Antiretroviral Therapy for the Prevention of HIV-1 Transmission.” New England Journal of Medicine 375 (9): 830–39. doi:10.1056/NEJMoa1600693.
Davis, Dirk A, Jose Manuel Aguilar, Cesar Galindo Arandi, Sanny Northbrook, M Itzel Loya-Montiel, Sonia Morales-Miranda, and Clare Barrington. 2017. “‘Oh, I’m Not Alone’: Experiences of HIV-Positive Men Who Have Sex With Men in a Health Navigation Program to Promote Timely Linkage to Care in Guatemala City.” AIDS Education and Prevention 29 (6): 554–66. doi:10.1521/aeap.2017.29.6.554.
“Enlaces Por La Salud Intervention Guide.” 2014. Chapel Hill.
Govindasamy, Darshini, Jamilah Meghij, Eyerusalem Kebede Negussi, Rachel Clare Baggaley, Nathan Ford, and Katharina Kranzer. 2014. “Interventions to Improve or Facilitate Linkage to or Retention in Pre-ART (HIV) Care and Initiation of ART in Low- and Middle- Income Settings - A Systematic Review.” Journal of the International AIDS Society 17. doi:10.7448/IAS.17.1.19032.
Guardado Escobar, Maria Elena, Silvia Oliva, Mario Hernandez, and Jilmer Peren. 2017. “Medición de Prevalencia, Comportamiento, Actitudes y Prácticas En Poblaciones de Mayor Riesgo Al VIH-Sida En Guatemala, 2017.”
Higa, Darrel H., Gary Marks, Nicole Crepaz, Adrian Liau, and Cynthia M. Lyles. 2012. “Interventions to Improve Retention in Hiv Primary Care: A Systematic Review of U.S. Studies.” Current HIV/AIDS Reports 9 (4): 313–25. doi:10.1007/s11904-012-0136-6.
Horvath, T, H Azman, GE Kennedy, and GW Rutherford. 2012. “Mobile Phone Text Messaging for Promoting Adherence to Antiretroviral Therapy in Patients with HIV Infection (Review).” Cochrane Database of Systematic Reviews, no. 3. doi:10.1002/14651858.CD009756.www.cochranelibrary.com.

Strengthening the “Reach-Test-Treat-Retain” cascade for men who have sex with men in Guatemala: A pilot intervention” (EIR-HIV KPIS) 17
Irwin, S. 2008. “Data Analysis and Interpretation: Emergent Issues in Linking Qualitative and Quantitative Evidence.” In Handbook of Emergent Methods2, 427–47. New York: The Guilford Press.
Loya-Montiel, M Itzel, Dirk A. Davis, Jose Manuel Aguilar-Martínez, Olga Alicia Paz Bailey, Sonia Morales-Miranda, Juan Pablo Alvis-Estrada, Sanny Northbrook, and Clare Barrington. 2018. “Making the Link: A Pilot Health Navigation Intervention to Improve Timely Linkage to Care for Men Who Have Sex with Men and Transgender Women Recently Diagnosed with HIV in Guatemala City.” AIDS and Behavior. Springer US. doi:10.1007/s10461-018-2328-6.
Maxwell, Joseph A., and Barbara A. Miller. 2008. “Categorizing and Connecting Strategies in Qualitative Data Analysis.” In Handbook of Emergent Methods, 461–77. New York: Guilford.
Mejia, Carlos. 2015. “Informe Final De La Evaluación De La Adherencia Al Tratamiento Antirretroviral Y Condiciones Institucionales Que Puedan Influir En El Proceso.”
Meléndez, Johanna, Samuel Reinhardt, Jane O’Halloran, Andrej Spec, Andrea Alonzo Cordon, William G Powderly, and Carlos Mejia Villatoro. 2018. “Late Presentation and Missed Opportunities for HIV Diagnosis in Guatemala.” AIDS and Behavior. Springer US. doi:10.1007/s10461-018-2331-y.
Miller, C, J Garcia, B Alvarez, R Flores, S Morales-Miranda, M Aragon Lopez, and C Samayoa. 2010. “Perfil Epidemiológico Del VIH En Guatemala, 2009.” Guatemala City.
Mizuno, Yuko, Darrel H. Higa, Carolyn A. Leighton, Katherine B. Roland, Julia B. Deluca, and Linda J. Koenig. 2018. “Is HIV Patient Navigation Associated with HIV Care Continuum Outcomes? A Systematic Review.” AIDS. doi:10.1097/QAD.0000000000001987.
“Modelo de Intervención Terapéutico ‘Abriendo Puertas’: Manual de Consejería.” 2014. Santo Domingo.
Pop-Eleches, Cristian, Harsha Thirumurthy, James P. Habyarimana, Joshua G. Zivin, Markus P. Goldstein, Damien De Walque, Leslie MacKeen, et al. 2011. “Mobile Phone Technologies Improve Adherence to Antiretroviral Treatment in a Resource-Limited Setting: A Randomized Controlled Trial of Text Message Reminders.” AIDS 25 (6): 825–34. doi:10.1097/QAD.0b013e32834380c1.
Tucker, C, CG Galindo Arandi, JH Bolanos, G Paz-Bailey, C. Barrington, J Herbert Bolaños, and G Paz-Bailey. 2014. “Understanding Social and Sexual Networks of Sexual Minority Men and Transgender Women in Guatemala City to Improve HIV Prevention Efforts.” Journal of Health Care for the Poor and Underserved 25 (4): 1698–1717.
WHO. 2016. “Guidelines on HIV Self-Testing and Partner Notification,” no. December: 104. http://www.who.int/hiv/pub/vct/hiv-self-testing-guidelines/en/.
Yombi, Jean Cyr, and Helena Mertes. 2018. “Treatment as Prevention for HIV Infection: Current Data, Challenges, and Global Perspectives.” AIDS Reviews 20 (3): 131–40. doi:10.24875/AIDSRev.M18000024.
Strengthening the “Reach-Test-Treat-Retain” cascade for men who have sex with men in Guatemala: A pilot intervention” (EIR-HIV KPIS) 18
3. AIM 1 FORMATIVE RESEARCH
3.1 Description The purpose of formative research conducted for Aim 1 was to explore the experiences of men who have
sex with men (MSM) and transgender women (TW) with the HIV care cascade including: diagnosis, linkage
to care, retention in services, and adherence to anti-retroviral therapy (ART). We sought to identify the
primary barriers and facilitators at the different stages of the cascade, while also learning about the social
environments in which participants lived to develop a better understanding of the context.
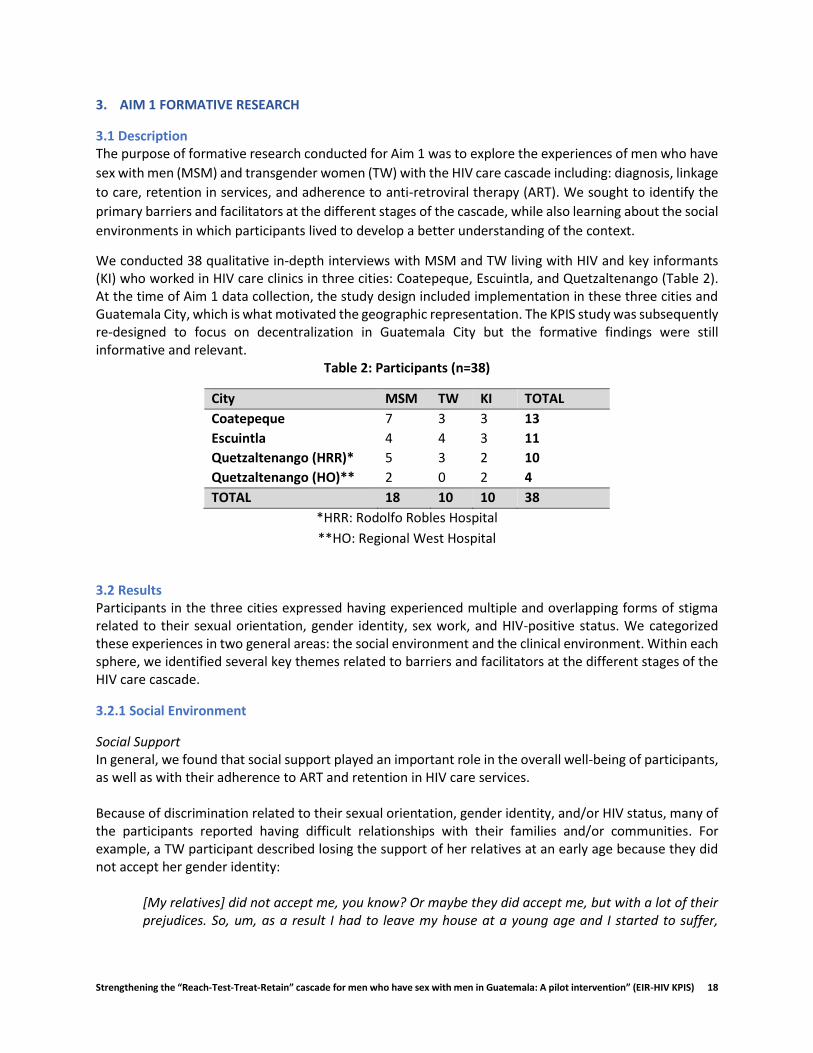
We conducted 38 qualitative in-depth interviews with MSM and TW living with HIV and key informants (KI) who worked in HIV care clinics in three cities: Coatepeque, Escuintla, and Quetzaltenango (Table 2). At the time of Aim 1 data collection, the study design included implementation in these three cities and Guatemala City, which is what motivated the geographic representation. The KPIS study was subsequently re-designed to focus on decentralization in Guatemala City but the formative findings were still informative and relevant.
Table 2: Participants (n=38)
City MSM TW KI TOTAL
Coatepeque 7 3 3 13
Escuintla 4 4 3 11
Quetzaltenango (HRR)* 5 3 2 10
Quetzaltenango (HO)** 2 0 2 4
TOTAL 18 10 10 38
*HRR: Rodolfo Robles Hospital
**HO: Regional West Hospital
3.2 Results Participants in the three cities expressed having experienced multiple and overlapping forms of stigma related to their sexual orientation, gender identity, sex work, and HIV-positive status. We categorized these experiences in two general areas: the social environment and the clinical environment. Within each sphere, we identified several key themes related to barriers and facilitators at the different stages of the HIV care cascade.
3.2.1 Social Environment
Social Support In general, we found that social support played an important role in the overall well-being of participants, as well as with their adherence to ART and retention in HIV care services. Because of discrimination related to their sexual orientation, gender identity, and/or HIV status, many of the participants reported having difficult relationships with their families and/or communities. For example, a TW participant described losing the support of her relatives at an early age because they did not accept her gender identity:
[My relatives] did not accept me, you know? Or maybe they did accept me, but with a lot of their prejudices. So, um, as a result I had to leave my house at a young age and I started to suffer,
Strengthening the “Reach-Test-Treat-Retain” cascade for men who have sex with men in Guatemala: A pilot intervention” (EIR-HIV KPIS) 19
because when you are thirteen years old and you leave your home, things are not the same. (TW, 42 years old)
Not all participants completely lost the support of their family like this participant, but in many cases, participants reported not feeling able to be themselves with some family members. In addition to being excluded by family, some participants expressed having lost the support of their communities, such as churches, as this gay participant described:
I suffered a lot of discrimination because they even excluded me from various groups, including the church ... apart from being a person with HIV, because I am gay. (MSM, 21 years old)
In these environments of discrimination and exclusion, it was common for participants to express feeling down or isolated. Notably, acceptance and support from families was identified as being critical for wellbeing, including retention in HIV care and adherence to ART,
In that sense, I never lacked their [my parents] support, they always accompanied me, since I started with the treatment, my mother was the one who accompanied me...they have supported me, they call me to make sure I’m taking the treatment, not to stop it. They encourage me to not quit the medication. (MSM, 22 years old)
Some families supported participants by motivating them to take medications and reminding the participants of their appointments. Some family members gave participants a ride to the clinics or paid for their transportation, again supporting good retention and adherence.
Employment Retention in HIV care services and adherence to ART were also affected by lack of employment as well as the time limitations and limited flexibility to attend medical appointments. Many participants reported difficulties getting or maintaining a stable job, which affected their ability to pay for transportation to the clinic to receive care, as well as other HIV-related expenses. For example, a TW participant, who lived far from the HIV clinic, recalled missing an appointment because she could not afford the bus fare:
I always travel by bus...once I did not come to the clinic because I did not have...I remembered the appointment, but I did not have any money. (TW, 42 years old)
This participant described losing her job in a store when her employer found out about her diagnosis. Without income from work or any other source of support, she did not have the means to get to the HIV clinic. In this way, discrimination because of her HIV status not only cost her the job, but it also prevented her ability to consistently attend her HIV care appointments. For participants who had a full-time job, the long waiting times for appointments could cause them to lose a whole day of work, as explained by a gay participant who worked in a bakery:
Something difficult for me, is when I'm going to get the CD4and viral load test because I have to come fasting, I have to leave from my house at three in the morning, to be there at seven o'clock ... and I come without coffee, without breakfast, without anything and they don’t see me until noon. (MSM, 23)
Strengthening the “Reach-Test-Treat-Retain” cascade for men who have sex with men in Guatemala: A pilot intervention” (EIR-HIV KPIS) 20
After waiting three hours at the clinic, the participant had to travel four hours on the bus to return home. Although not all participants missed a full day of work, most described spending many hours between travel and waiting time. Most participants reported not disclosing that they were living with HIV to their employers. Many times, participants had to lie to their employers to request permission and be able to get to the appointment. The same participant who worked at the bakery said it was difficult to obtain permission:
It was very difficult for me ... because I had to lie about everything ... that I had to go to a meeting ... or that I had to accompany my sister or my brother who was going to buy merchandise and everything. And that was how I got permission. (MSM, 23)
This participant was able to obtain permission to miss work, but in other cases employers did not allow participants to miss work, as described by another participant:
Then I was there, as a cashier, in a business [environment], but then they did not give me permission and he also did not know about my diagnosis, because I never told him, he told me that cannot give me permission to go to my house, because he did not trust anyone else. (TW, 40 years)
Without permission, participants were often faced with the difficult decision of missing their HIV appointment or risk losing their job to make it. Employment was especially complicated for TW. For many of them, sex work was the only way they could earn a living, as the following participant commented:
Well, [I do sex work] for lack of opportunities in formal work. We always have to go to a bar, the only places that accept us as TW. Then we have to deal with sex work. (TW, 38 years old)
Many participants who did sex work described low-wage work environments, mistreatment by employers, long hours and an inability to get permission to attend their appointments, which affected their ability to consistently attend HIV care appointments.
Drugs Several participants reported using alcohol and/or drugs to manage the stress produced by living with HIV and their daily experiences of stigma. There was a lot of misinformation about the use of alcohol and taking ART. Many participants reported that when they drank an alcoholic beverage, they stopped taking their ART to avoid an interaction, as this TW expressed:
The one that has been failing lately, it's been me. Because, sometimes I do not take the medication ... because of having been drinking. (TW, age unknown)
In these situations, the consumption of alcohol decreased ART adherence. Others expressed their need for help to stop or decrease their consumption of alcohol or drugs. For participants involved in sex work, the use of substances was very common and sometimes it was even demanded by their clients, which made it more difficult for them to remain adherent to ART.

Strengthening the “Reach-Test-Treat-Retain” cascade for men who have sex with men in Guatemala: A pilot intervention” (EIR-HIV KPIS) 21
Violence Participants described experiences of violence, especially from family and intimate partners. In some cases, stable partners manipulated participants to not attending their medical appointments because they were ashamed of their HIV status. In other cases, the emotional violence affected the mental health and adherence of the participants:
When I lived with my partner, he was jealous, I could not go out with my friends. Then it got to the point of the punches and well, because of fear, I couldn’t defend myself... that kind of psychological damage made me leave my treatment for exactly one month, but I realized that in that month I got a lot worse and I said, no, it's not fair for me. (MSM, 21 years old)
Although this participant managed to reengage with his treatment after abandoning it for a month, his experience reflects how violence could influence the participants' mental health, as well as their retention in HIV care services and adherence to ART.
3.2.2 Clinical Environment
Communication with providers Many participants felt that they received good care in the HIV clinics, as expressed by an MSM participant:
The nurses are kind, and all that ... they support us, they give us counseling as well, they give us a condom, too. (MSM, 49 years old)
Many mentioned that psychologists provided support for adherence and to overcome their experiences of mental health, stigma, and violence. One participant who had experienced depression explained,
... the psychologist helped me a lot, I even broke down several times with her when I felt that I couldn’t go on anymore and because of a depression that I fell into... I was at the point of abandoning my treatment, but I said no, it's not worth it, if the treatment is helping me to be well. (MSM, 21 years old)
This example reflects the central role of emotional and psychological support as an integral part of holistic care for HIV. Although most participants described positive interactions with clinic staff, including nurses, physicians and psychologists, some reported a lack of empathy in communication with clinic staff. There were examples where medical staff shamed patients in front of others for problems with their adherence, as explained by an MSM:
The doctors always scolds me because they tell me to take the medication as it was prescribed and they ask me if I value my life, and this and that … (MSM, 36 years old)
In other cases, TW participants reported receiving negative reactions from staff at the clinics due to their way of dressing or for their makeup, as well as a lack of understanding about appropriate language, as expressed by the following participant:
Well… I felt a little bit bad when they talked to me about ... my biological name ... because sometimes we feel bad when we show up with makeup, well dressed as a woman and they call us

Strengthening the “Reach-Test-Treat-Retain” cascade for men who have sex with men in Guatemala: A pilot intervention” (EIR-HIV KPIS) 22
[Registered name of the participant], and all the people turn to see… then that makes me feel bad ... (TW, 38 years)
This participant described how the clinic staff treated TW with inappropriate language, making them feel unwelcomed inside the clinic.
Confidentiality and Pressure to Disclose HIV Diagnosis Motivated by fear, many participants made the decision not to disclose their HIV status to their families, friends, or employers. However, several participants perceived a lack of confidentiality in the clinics and in some extreme cases, the disclosure of their diagnosis without their permission. As one TW participant reported:
I told my sister to come and she came and that was where she realized that I had HIV because she did not know, she did not know anything, but they told her something there in the clinic that I had it, and that was confidential ... it was my diagnosis to tell, not for nurses to tell her. (TW, 29 years old)
In other cases, clinic staff pressured the participants to disclose their diagnosis to their relatives, although they didn´t want to. The lack of confidentiality on the part of the staff, as well as the pressure to disclose their diagnosis, were examples of situations that participants had to manage while receiving HIV care and could negatively impact their retention and adherence.
3.3 Implications for intervention By having a better understanding of social and clinical influences on the HIV care cascade, we used the lessons learned to strengthen all components of the intervention, especially in the components of emotional well-being and health navigation. For example, we included the topics of substance use and adherence in Session 2 of the Emotional Wellbeing manual (Adherence, addictions and HIV rights education). We also integrated strategies in navigation to support participants who wanted to disclose their HIV diagnosis with family members. In addition, the results reflected the importance of decentralizing HIV care services to reduce barriers, including expenses, loss of wages, and the time participants waited to attend their appointments.

Strengthening the “Reach-Test-Treat-Retain” cascade for men who have sex with men in Guatemala: A pilot intervention” (EIR-HIV KPIS) 23
4. DECENTRALIZATION
4.1 Description The Differentiated Care Model is increasingly being used to improve access to and retention in HIV care
and treatment (“Differentiated Service Delivery” 2018). Differentiated Care refers to adapting and
tailoring services to the specific needs of populations. Decentralization and community-based treatment
delivery systems are key strategies within differentiated care. Other strategies include offering
alternatives days and hours of care and providing services in locations that are safe and friendly to the
populations most affected by HIV (“Differentiated Service Delivery” 2018; “Differentiated Care for HIV: A
Decision Framework for Antiretroviral Therapy Delivery” 2018; Roy et al. 2017; Ssonko et al. 2017).
HIV care and treatment in Guatemala is highly centralized. Across Guatemala, there are only 18 official
HIV care and treatment units, referred to as Unidades de Atencion Integral (Integrated Care Units referred
to as UAIs for their name in Spanish) providing care to over 17,000 people living with HIV (Farach 2018).
HIV care and treatment are offered in tertiary-level facilities and stable patients are required to have
appointments and refill their ART prescription every three months (more frequently for unstable or newer
to care patients); given the large number of patients at each UAI, receiving HIV care frequently requires
dedicating a full day, which can create social, economic and professional challenges for people living with
HIV. In comparison, Nicaragua has 55 clinics providing ART to a total of 4320 people living with HIV and
Honduras has 54 clinics for 10,848 patients (Farach 2018).
Such centralization can create congestion and time limitations in clinics as well as time and cost burdens
for patients (Kredo et al. 2013). For key populations, such as MSM and TW, the conditions of centralized
services can exacerbate the aforementioned layered stigma and discrimination. There is growing evidence
that decentralizing HIV care and treatment services can improve retention and adherence (“Differentiated
Service Delivery” 2018; Kredo et al. 2013), though limited studies have focused on the effects of
decentralizing services for key populations, including MSM (“Differentiated Care for HIV: A Decision
Framework for Antiretroviral Therapy Delivery” 2018; Oucul 2018). Partial decentralization entails starting
care and treatment at a hospital and continuing at a lower level health center while full decentralization
is the initiation and continuation of care in lower level health centers. The main concern with both models
of decentralization is the potential for outcomes to become worse; however, systematic reviews find no
evidence of this and find better retention with both decentralization models (Kredo et al. 2013). Recently
in Brazil, however, concern has been raised regarding the potential for decentralization to result in lower
prioritizing of HIV care and treatment (Frasca, Fauré, and Atlani-Duault 2018). In high-prevalence
countries, in particular in Sub-Saharan Africa, delivery of HIV care and treatment has been decentralized
down to the community level with encouraging results in terms of patient outcomes and cost as well as
health systems costs though questions about sustainability remain (“Differentiated Service Delivery”
2018).
Drawing upon the Differentiate Care Model, the purpose of the decentralization component of KPIS was
to offer voluntary, partial decentralization of stable patients from the Roosevelt Hospital to one of three
VICITS clinics in Guatemala City: 1) Colectivo Amigos Contra el SIDA (CAS), 2) Fundacion Marco Antonio
(FMA) and 3) the STI clinic at the Zone 3 health center (Zone 3). Individuals were eligible if they met the
general study inclusion criteria of being > 18 years old, male, self-reported ever having sex with men and

Strengthening the “Reach-Test-Treat-Retain” cascade for men who have sex with men in Guatemala: A pilot intervention” (EIR-HIV KPIS) 24
diagnosed with HIV as well as the definition of bring a “stable” patient, which included having been
enrolled in care for > one year without interruption, viral load < 1,000 copies/mL, on first-line ART. Viral
load was based on the most recent result in the medical chart. Each clinic offered a distinct schedule, with
the two NGO clinics offering weekend and evening hours. Decentralized clinics also offered scheduled
appointments, another strategy of differentiated care, in contrast to the rolling appointments at
Roosevelt.
In the evaluation of the decentralization component, we assessed acceptability, satisfaction, and HIV
outcomes with decentralized and differentiated HIV care and treatment for MSM enrolled in KPIS who
were eligible for decentralization.
4.2 Results
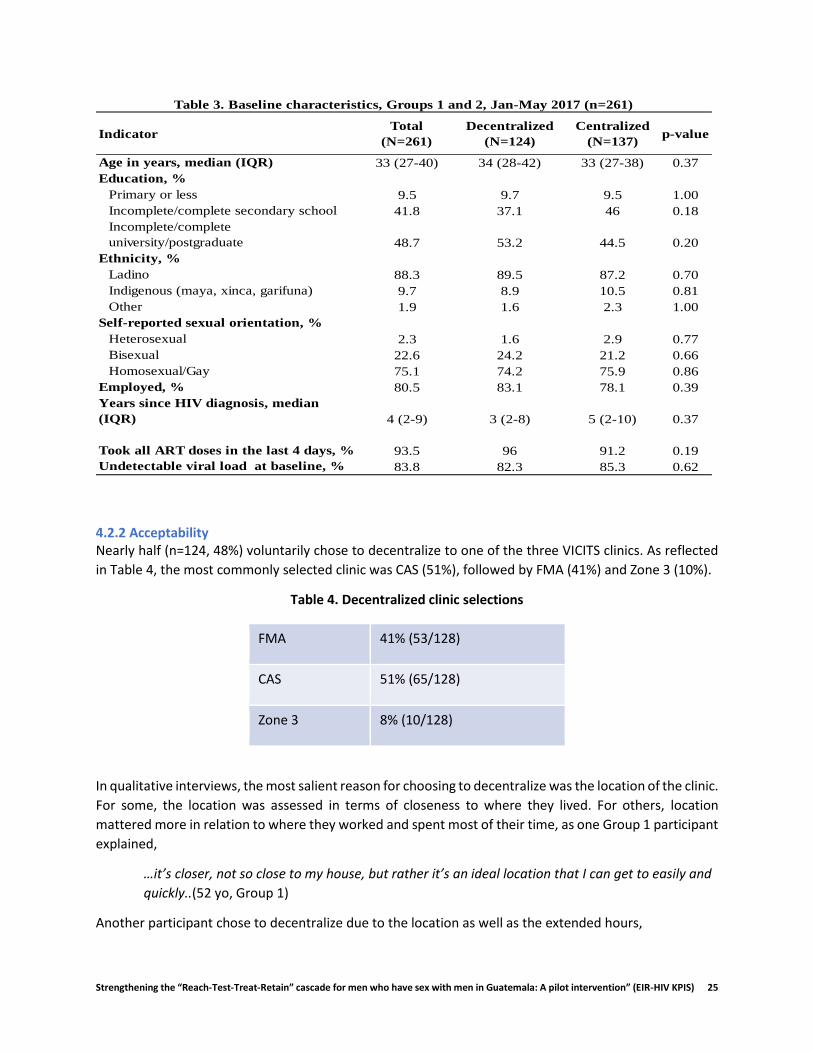
4.2 1 Description of the sample A total of 261 decentralization-eligible participants enrolled in the KPIS study. Baseline characteristics are
presented in Table 3. Importantly, there were no significant differences in baseline characteristics
between Groups 1 (Decentralized) and 2 (Centralized), which lends strength to our comparisons. Median
age of the sample was 33 years (range 27-40). Nearly half (48.7%) of participants had some university-
level education. This was higher among Decentralized participants (53.2%) compared to Centralized
(44.5%). The majority of participants were Ladino in both groups (88.3%) with approximately 10%
indigenous. Three-quarters of the participants identified as gay (75.1%), 22.6% bisexual and 2.3%
heterosexual. The majority (80.5%) were employed (see cost chapter for more detailed discussion of types
of employment).
With regard to HIV-related indicators, the median number of years since diagnosis was 4 (range 2-9). The
vast majority of participants reported being adherent to ART (93.5%) and had an undetectable viral load
(>50 copies/mL) (83.8%), consistent with their classifications as “stable” patients. Retention in care during
the last year was an eligibility criterion for Groups 1 and 2, therefore all participants had attended all of
their quarterly appointments in the last year (data not shown).
Strengthening the “Reach-Test-Treat-Retain” cascade for men who have sex with men in Guatemala: A pilot intervention” (EIR-HIV KPIS) 25
4.2.2 Acceptability Nearly half (n=124, 48%) voluntarily chose to decentralize to one of the three VICITS clinics. As reflected
in Table 4, the most commonly selected clinic was CAS (51%), followed by FMA (41%) and Zone 3 (10%).
Table 4. Decentralized clinic selections
FMA 41% (53/128)
CAS 51% (65/128)
Zone 3 8% (10/128)
In qualitative interviews, the most salient reason for choosing to decentralize was the location of the clinic.
For some, the location was assessed in terms of closeness to where they lived. For others, location
mattered more in relation to where they worked and spent most of their time, as one Group 1 participant
explained,
…it’s closer, not so close to my house, but rather it’s an ideal location that I can get to easily and
quickly..(52 yo, Group 1)
Another participant chose to decentralize due to the location as well as the extended hours,
IndicatorTotal
(N=261)
Decentralized
(N=124)
Centralized
(N=137)p-value
Age in years, median (IQR) 33 (27-40) 34 (28-42) 33 (27-38) 0.37
Education, %
Primary or less 9.5 9.7 9.5 1.00
Incomplete/complete secondary school 41.8 37.1 46 0.18
Incomplete/complete
university/postgraduate 48.7 53.2 44.5 0.20
Ethnicity, %
Ladino 88.3 89.5 87.2 0.70
Indigenous (maya, xinca, garifuna) 9.7 8.9 10.5 0.81
Other 1.9 1.6 2.3 1.00
Self-reported sexual orientation, %
Heterosexual 2.3 1.6 2.9 0.77
Bisexual 22.6 24.2 21.2 0.66
Homosexual/Gay 75.1 74.2 75.9 0.86
Employed, % 80.5 83.1 78.1 0.39
Years since HIV diagnosis, median
(IQR) 4 (2-9) 3 (2-8) 5 (2-10) 0.37
Took all ART doses in the last 4 days, % 93.5 96 91.2 0.19
Undetectable viral load at baseline, % 83.8 82.3 85.3 0.62
Table 3. Baseline characteristics, Groups 1 and 2, Jan-May 2017 (n=261)

Strengthening the “Reach-Test-Treat-Retain” cascade for men who have sex with men in Guatemala: A pilot intervention” (EIR-HIV KPIS) 26
…more than anything, for the location. Oh! The hours. I can’t remember the hours at the other
clinics, but this one had services until 7 something, 7:30 if I remember well… (27 yo, Group 1)
The preferences for location and schedule reflect the salience of time in the lives of participants as they
manage their life and work responsibilities along with their HIV care.
Personal experience with the clinic was also an influential factor. Several participants mentioned that they
chose the decentralization because they had been diagnosed there. One participant emphasized that this
created a sense of loyalty, which influenced his selection.
…I picked it (the clinic) because this is where I did my first tests, my analyses…ELISA and all that,
right? Where they gave me my diagnosis, positive diagnosis. So, out of loyalty, for that reason I
decided to come to this (clinic), right? (32 yo, Group 1)
Past experience with the clinic also generated trust, another influential factor in the decision to
decentralize,
…this is the place I know. Even though it brings back some memories, I know people there and that
makes me feel comfortable there. (33 yo, Group 1)
Finally, some Group 1 participants mentioned altruism and wanting to support the study as a motivation
to receive care in a decentralized clinic.
Among Group 2 participants, location and positive experiences as Roosevelt also influenced their decision
to stay. Additionally, concern about change was a deterrent to decentralizing, as reflected here,
Well, I can tell you that transferring to another clinic, I feel that would be really different, a big
change in my life and it will take me a while to join in. (41 yo, Group 2)
In summary, participants generally opted to decentralize or stay at Roosevelt for similar reasons, focused
on location and experience with the clinic.
4.2.3 HIV Outcomes The goal of this study was to assess if key biological and behavioral outcomes related to HIV could be
sustained among participants who decentralized. Therefore, we were interested in whether outcomes
were sustained, rather than changed, during the study period. Overall, there were no significant changes
in viral load, retention in care or adherence among participants in Group 1 or Group 2, suggesting that
decentralization could be a feasible and effective way to offer more sustainable care to MSM living with
HIV in Guatemala.
Retention in care One of main concerns with our partial decentralization was that participants would drop out of
care during the process. This is one of the reasons why decentralization was voluntary and why
we offered navigation support to all participants in the study to provide support findings and
getting acclimated to the new clinic. Among participants in Group 1, 98% attended all 3
appointments at the decentralized clinic indicating that participants did not drop out. This also
reflects the voluntary nature of the decentralization process.

Strengthening the “Reach-Test-Treat-Retain” cascade for men who have sex with men in Guatemala: A pilot intervention” (EIR-HIV KPIS) 27
Adherence With regard to adherence, as reflected in Table 3, adherence was high at baseline, as we would
have expected given that all decentralization-eligible participants were stable patients. Among
participants in Group 1 (decentralized) adherence was sustained from 96.0% at baseline to 97.0%
at endline. Among participants in Group 2, baseline adherence was slightly lower, 91.2% and
increased to 96.0%.
Viral load Finally, we assessed whether viral load was sustained. At baseline, 82.3% of participants in Group
1 and 85.3% of participants in Group 2 had an undetectable viral load (Table 3). These levels were
sustained at 81.0% among Group 1 participants and 83.0% among Group 2.
4.2.4 Care Experiences We also assessed participants’ satisfaction with care and their assessment of their experience with
decentralized care. In brief satisfaction surveys conducted with participants in Group 1, 94% considered
the quality of care at their decentralized clinic to be excellent. In midline and endline qualitative
interviews, participants used words including “excellent”, “fascinating”, “perfect”.
Given the salience of time as a challenge to receiving HIV care, we assessed the time it took participants
to complete their appointments at the decentralized clinics. Compared to the 4-5 hours it took to receive
care for a quarterly HIV care appointment at Roosevelt, the median time for appointments at
decentralized clinics was 40 minutes. Notably, no participants indicated feeling that anything was missing
nor that they had less time with providers. Rather they emphasized that the process was more efficient
and that their time was spent getting care rather than waiting and had integrated appreciation for the
time and quality of care, as reflected here,
The attention was better. It is close to my job and home and the key is that you don’t waste a lot
of time. I would like to continue getting my care here. (36 yo, Group 1)
Another participant echoed this integrated appreciation for time and quality,
We hope this project continues since, due to my work, I can only come on the weekends. Also, we
get good, personalized care without having to wait so long. (28 yo, Group 1)
Participants also explicitly mentioned their appreciation of having scheduled appointments as another
way to save time,
So, here, they gave me an appointment a 1:45 and at that time there were already attending to
me, right? Compared to (Roosevelt) where I sometimes have to wait one, two, three hours… (52
yo, Group 1)
These quotes reflect that the three VICITS clinics effectively integrated HIV care into their clinics and
provided high quality and efficient care. It is important to note that participants continued to be seen by
providers from Roosevelt, based on our bi-directional capacity building model. Therefore, these
assessments of quality and satisfaction also reflect the continuity of care from Roosevelt physicians in the
context of the VICITS clinics.

Strengthening the “Reach-Test-Treat-Retain” cascade for men who have sex with men in Guatemala: A pilot intervention” (EIR-HIV KPIS) 28
Finally, it is important to note the importance of the navigators in the decentralization process.
Participants appreciated having someone guide them through the transition to the new clinic, as explained
here,
He’s [navigator] always ready to help...always asking me how I’m doing, sending me
messages...and he’s always here with me at the clinic, making sure they’re treating me well, and
that I know what’s going on. (26 yo, Group 1)
As reflected in this quote, navigators were able to support the transition to the new clinic and keep
participants from feeling alone in that process.
Strengthening the “Reach-Test-Treat-Retain” cascade for men who have sex with men in Guatemala: A pilot intervention” (EIR-HIV KPIS) 29
4.3 Conclusions Decentralized, differentiated services were acceptable to almost half of the decentralization-eligible
participants with high levels of satisfaction at the end of the study. These approaches could enhance the
sustainability of HIV care for both patients and clinics, in particular by saving time.
Biological and behavioral HIV outcomes including viral load, retention and adherence were all sustained
during the decentralization process. Time was a very salient theme, both as a motivator to decentralize
as well as in the assessment of the experience. Participants were motivated to decentralize because they
perceived it would save them time due to the varied locations and schedules. On average, participants
saved hours of time with each appointment at the decentralized clinic without compromising quality of
care. Again, it is important to note that care continued to be provided by the Roosevelt physicians in
tandem with VICITS physicians, which may have enhanced the trust in the care received. Nevertheless,
beyond the physicians, participants were appreciative of how they were treated at the decentralized
clinics. Navigators played a key role in supporting decentralization.
4.4 Key findings
To increase acceptability of decentralization, consider offering counseling free of coercion to all potential decentralization candidates to address fears and concerns. Several participants who did not decentralize commented that they would be interested in doing so after hearing about the positive experiences of others.
Consider including navigators as part of the decentralization team as they can play a key role in guaranteeing that patients feel supported and have all of their questions and concerns addressed.
There is a need for further research on the ideal profile of the decentralization clinic. Our participants were mostly motivated by time and their previous experience with the clinic. It would be helpful to identify what types of clinics are best suited for decentralization to inform future efforts.
Beyond decentralization, our findings suggest that having scheduled appointments, even in a centralized facility, could reduce time and enhance satisfaction among patients.
By reducing the saturation of centralized services, there could be more opportunity for holistic services, including emotional wellbeing, which may not only be needed by newly diagnosed patients.
Consider assessing the feasibility and implications of complete decentralization in future implementation science studies given that the majority of new diagnoses among MSM occur at the same clinics where decentralization was assessed.

Strengthening the “Reach-Test-Treat-Retain” cascade for men who have sex with men in Guatemala: A pilot intervention” (EIR-HIV KPIS) 30
4.5 References “Differentiated Care for HIV: A Decision Framework for Antiretroviral Therapy Delivery.” 2018.
http://www.differentiatedcare.org/Portals/0/adam/Content/2a0WxWUHfUKtul1mKWdmGQ/File/Decision Framework Key Population Web.pdf.
“Differentiated Service Delivery.” 2018. Accessed December 2. http://www.differentiatedcare.org/about.
Farach, Nasim. 2018. “Descentralización de La Terapia Antiretroviral Como Una Opción de Servicio Diferenciado Para Mejorar El Acceso y La Retención: Consideraciones Técnicas.” In Tercer Taller Regional de Actualización En VIH, 27 August 2018. Guatemala City.
Frasca, Timothy, Yves A. Fauré, and Laetitia Atlani-Duault. 2018. “Decentralisation of Brazil’s HIV/AIDS Programme: Intended and Unintended Consequences.” Global Public Health 1692. Taylor & Francis: 1–12. doi:10.1080/17441692.2018.1455888.
Kredo, T, N Ford, FB Adeniyi, and P Garner. 2013. “Decentralising HIV Treatment in Lower-and Middle-Income Countries (Review).” Cochrane Database of Systematic Reviews, no. 6. doi:10.1002/14651858.CD009987.pub2.
Oucul, Lazarus. 2018. “RETAIN: Retaining Female Sex Works (FSW) in ART Programmes through Community-Client Led ART Delivery in Uganda.” In 22nd International AIDS Conference. Amsterdam.
Roy, M., M Mukumbwa-Mwenechanya, E Efronson, M Lumpa, A Sharma, I Sikazwe, N Padian, CB Moore, E Geng, and C Holmes. 2017. “Uptake and Adaptation of Community Adherence Groups in Zambia.” Topics in Antiviral Medicine 25 (1): 424s. http://www.embase.com/search/results?subaction=viewrecord&from=export&id=L616686297.
Ssonko, Charles, Lucia Gonzalez, Anita Mesic, Marcio Silveira Da Fonseca, Jay Achar, Nadia Safar, Beatriz Martin, Sidney Wong, and Esther C. Casas. 2017. “Delivering HIV Care in Challenging Operating Environments: The MSF Experience towards Differentiated Models of Care for Settings with Multiple Basic Health Care Needs.” Journal of the International AIDS Society 20 (5). Taylor & Francis: 14–20. doi:10.7448/IAS.20.5.21654.

Strengthening the “Reach-Test-Treat-Retain” cascade for men who have sex with men in Guatemala: A pilot intervention” (EIR-HIV KPIS) 31
5. ECONOMIC EVALUATION
5.1 Description Economic evaluations in healthcare seek to address and assess the efficient and effective use of resources (Walker, Sculpher, & Drummond, 2012). As healthcare budgets continue to tighten, assessments of healthcare costs are increasingly being used for high-level decision-making regarding which technologies and interventions to finance. These assessments provide important metrics in determining return on investments and justification for further financing.
The economic evaluation within the KPIS study sought to measure economic costs from both the patient and healthcare provider perspectives to inform Ministry of Health (MoH) decision-makers of the potential economic implications and cost-effectiveness of partial decentralization. In this section, we describe the design and methods of the economic evaluation, results of the quantitative and qualitative assessment of patient-incurred costs, and finally the results of the cost-effectiveness evaluation from the healthcare provider perspective.
5.2 Methods The cost analysis adopted two analytical perspectives: a patient perspective and healthcare provider perspective. The patient cost analysis focused on direct and indirect costs. Direct costs, colloquially known as out-of-pocket expenses, refer to the actual expenditures made in order to receive HIV care. Indirect costs refer to lost productivity incurred by in attending their routine clinical appointment before and during the study, measured as time. The provider cost analysis assessed site-level costs and cost drivers of improving the reach-test-treat-retain cascade for MSM at three VICITS clinics providing partial-decentralized care, and the centralized Roosevelt Hospital in Guatemala City. The following sections discuss the methodological approach to cost estimation under each perspective taken.
5.2.1 Patient Cost Measures The patient cost assessment measured direct costs incurred for medical treatment, such as transportation to the clinic, lodging for an overnight stay, food, as well as indirect costs, such as travel time to and from the clinic and the time spent in the clinic.
In the baseline survey, participants were asked about: method and payment of transportation to the clinic (public or private); lodging expenses; food and sanitary services expenses; and caregiver expenses (for children, parents or home); and time missed from work or school. These data enabled us to establish a baseline of cost data for all participants prior to the intervention.
At endline, patients were asked about the following in reference to the third (9-month) study-related appointment (which, for decentralized participants, was their final appointment at the VICITS clinic) and their final study appointment at 12-months when all participants had returned to Roosevelt: time missed from work or school; method and payment of transportation to the clinic (public or private); lodging expenses; food and sanitary services expenses; medical service expenses; medication and medical item expenses; appointment duration and time investment; and accompaniment of patient by others.
Furthermore, participants in the qualitative interviews were asked about their general impressions and preferences regarding decentralized care, time-savings, quality of care, and barriers.
5.2.2 Provider cost tools and measures The focus of the cost evaluation from the provider perspective was the total economic costs incurred to improve HIV care and treatment outcomes for MSM at the facility level and considered all sources of financial or in-kind support (Tables 5-8). The inclusion of all funding sources in the evaluation provided
Strengthening the “Reach-Test-Treat-Retain” cascade for men who have sex with men in Guatemala: A pilot intervention” (EIR-HIV KPIS) 32
complete information on the clinic’s financial support. These categories are designed to reveal the portion of total costs devoted to different interventions components (Table 5) and programmatic activities (Table 6), the share of total costs devoted to different types of inputs (Table 7) and the share of total costs borne by each provider involved in the process (Table 8). By doing so, the analysis provided a detailed description of the flow of resources used for the implementation of reach-test-treat-retain cascade intervention.
Table 5: Intervention Components
CCU intervention (patient care and treatment)
Provision of direct enhanced HIV services along the reach-test-treat-retain cascade for MSM.
Peer navigation services
Accompaniment to clinic appointments, support provided in-person or via phone/virtual platform.
Enhanced individual counseling and health education
Emotional well-being counseling provided by a psychologist at Roosevelt guided by a 4-session
curriculum. Sessions also cover health education and information about HIV, treatment, symptoms or
other aspects that the user has questions or concerns about relating to HIV- and STI- care. At VICITS
clinics, physicians or counselors also provided personalized sessions when deemed necessary.
HIV/STI care provider training
HIV-specific training, mentoring and consultancies, continuing education of health care workers
personnel to support HIV treatment services.
mHealth
Appointment reminders to KPIS participants via mobile phone text messages. This was done through a
digital platform that generated automated programmed messages.
Table 6: Programmatic Activity Categories
Clinical Care
Provision of direct enhanced HIV services along the reach-test-treat-retain cascade for MSM.
Laboratory services
Activities related to laboratory testing required to provide HIV care and treatment services for MSM
Monitoring through the information and reporting system
Insertion of results in the standard system of information and reporting of the Ministry of Health,
records and monitoring of patients.
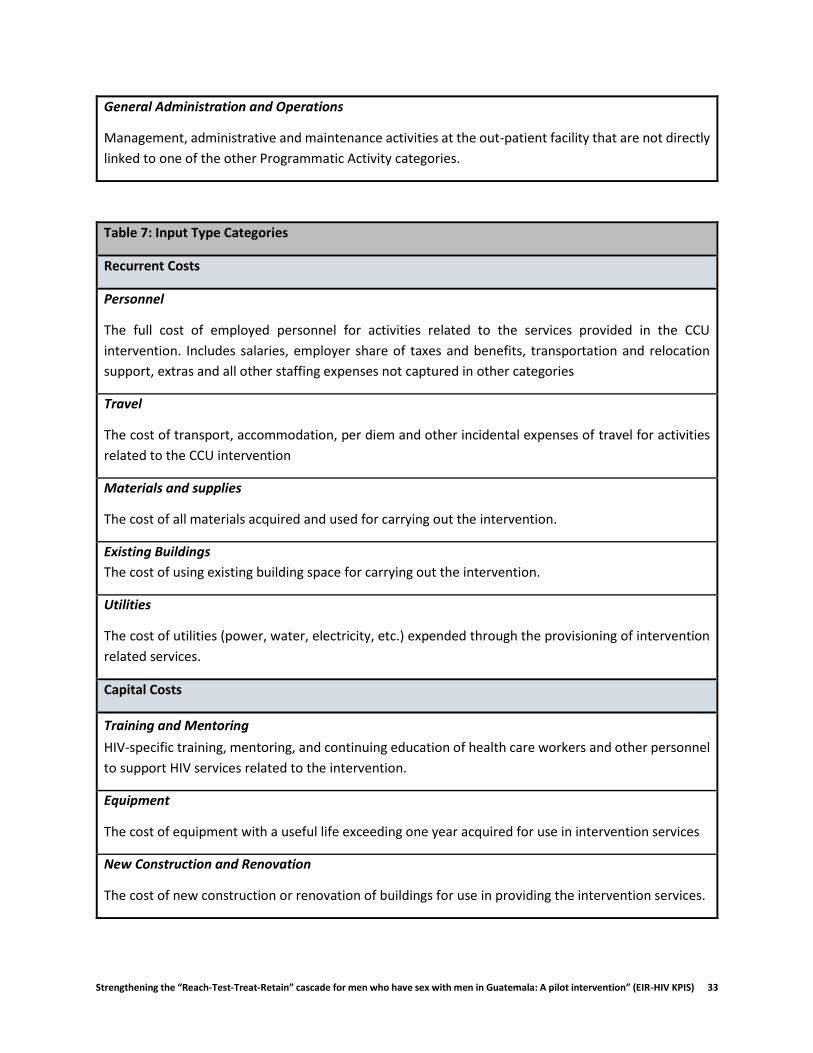
Strengthening the “Reach-Test-Treat-Retain” cascade for men who have sex with men in Guatemala: A pilot intervention” (EIR-HIV KPIS) 33
General Administration and Operations
Management, administrative and maintenance activities at the out-patient facility that are not directly
linked to one of the other Programmatic Activity categories.
Table 7: Input Type Categories
Recurrent Costs
Personnel
The full cost of employed personnel for activities related to the services provided in the CCU
intervention. Includes salaries, employer share of taxes and benefits, transportation and relocation
support, extras and all other staffing expenses not captured in other categories
Travel
The cost of transport, accommodation, per diem and other incidental expenses of travel for activities
related to the CCU intervention
Materials and supplies
The cost of all materials acquired and used for carrying out the intervention.
Existing Buildings
The cost of using existing building space for carrying out the intervention.
Utilities
The cost of utilities (power, water, electricity, etc.) expended through the provisioning of intervention
related services.
Capital Costs
Training and Mentoring
HIV-specific training, mentoring, and continuing education of health care workers and other personnel
to support HIV services related to the intervention.
Equipment
The cost of equipment with a useful life exceeding one year acquired for use in intervention services
New Construction and Renovation
The cost of new construction or renovation of buildings for use in providing the intervention services.

Strengthening the “Reach-Test-Treat-Retain” cascade for men who have sex with men in Guatemala: A pilot intervention” (EIR-HIV KPIS) 34
It is important to note that the perspective adopted by this study, while useful for projecting future funding requirements, did not capture all resource implications of a comprehensive HIV care and treatment program. The following cost components were not considered in this study:
Indirect costs associated with HIV-related morbidity and mortality, as well as those stemming from adverse events associated with care and treatment.
Costs borne by the health system for increased numbers on treatment.
Higher-level overheads outside the site-level borne by USG agencies, Ministries of Health and partner organizations to support the intervention.
Averted costs (cost savings) arising from the effect of HIV treatment in reducing needs for out-patient and in-patient treatment of opportunistic infections and in reducing HIV-attributable productivity losses.
5.3 Results
5.3.1 Socio- demographic and economic characteristics of the sample Table 9 presents the socio-demographic and economic characteristics of the sample that completed the end-line survey (n=369). The average participant age was 34 years (SD: 9.6). Most were from Guatemala (98%), lived within the capital (76%), and were single (83%). Most (92%) reported having some secondary education or above. Most participants were actively employed (82%), the majority of which engaged in formal employment (69%). The sample had an average reported monthly income of GTQ 3,790 (SD: GTQ 3,715) or USD 527 (SD: 505)1 and average reported monthly spending of GTQ 3,134 (SD: GTQ 3,014) or USD 426 (SD: 410). The sample did not vary much across study groups in terms of these socio- demographic and economic indicators. We did observe that, on average, the monthly reported income of those in Group 1 (Decentralized) was higher that than of both Group 2 and Group 3—GTQ 4,160 (USD 566) versus GTQ 3,526 (USD 499) versus GTQ 3,687 (USD 502), respectively.
1 1 USD: 7.35 GTQ (2017) taken as average of 2017 exchange rates, from the Guatemalan Central Bank database
Table 8: Source of Support Categories
Central Government/ MOH
Expenditures made by Central Government related to the expanded CCU intervention services.
Departmental Government
Expenditures made by the Departmental Government related to the expanded CCU intervention
services.
U.S. Government (CDC)
Funding provided by CDC for project implementation.

Strengthening the “Reach-Test-Treat-Retain” cascade for men who have sex with men in Guatemala: A pilot intervention” (EIR-HIV KPIS) 35
Table 9. Socio-demographic and economic characteristics of baseline KPIS sample (n=369)
All Group 1 Group 2 Group 3
n=369 n=124 n=133 n=112
Age, in years, mean (SD) 34 (9.6) 36 (10) 35 (10) 29 (8) Sexual Orientation, n (%)
Heterosexual 11 (3) 2 (2) 6 (5) 3 (3) Bisexual 72 (20) 26 (21) 21 (16) 25 (23) Homosexual/gay 282 (77) 95 (77) 104 (79) 83 (75)
Civil status, n (%) Single/separated/divorced/widower 308 (83) 98 (79) 111 (83) 99 (88) In a committed relationship 9 (2) 7 (6) 0 (0) 2 (2) Married or living with a woman 5 (1) 2 (2) 3 (2) 0 (0) Married or living with a man 47 (13) 17 (14) 19 (14) 11 (10)
Nationality, n (%) Guatemala 361 (98) 120 (97) 131 (98) 110 (98) Other 8 (2) 4 (3) 2 (2) 2 (2)
Residence, n (%) Guatemala 279 (76) 98 (79) 96 (72) 85 (76) Sacatepéquez 14 (4) 5 (4) 4 (3) 5 (4) Chimaltenango 12 (3) 4 (3) 6 (5) 5 (4) Escuintla 17 (5) 5 (4) 7 (5) 2 (2) Other 47 (13) 12 (10) 20 (15) 15 (13)
Education, n (%) No schooling 5 (1) 2 (2) 2 (2) 1 (1) Some/completed primary 24 (7) 8 (6) 9 (7) 7 (6) Some/completed secondary 169 (46) 48 (39) 66 (50) 55 (49) Some/completed college or higher 171 (46) 66 (53) 56 (42) 49 (44)
Currently employed, n (%) Yes 304 (82) 102 (82) 109 (82) 93 (83) No 65 (18) 22 (18) 24 (18) 19 (17)
Primary source of income, n (%) Formal employment/business owner 255 (69) 85 (69) 89 (67) 81 (72) Informal employment 45 (12) 16 (13) 18 (14) 11 (10) Support from partner, family, friends, etc. 33 (9) 10 (8) 10 (8) 13 (12) Savings or loan 16 (4) 4 (3) 9 (7) 3 (3) Illicit activities1 2 (1) 2 (2) 0 (0) 0 (0) Other 11 (3) 4 (3) 5 (4) 2 (2) No source of income 3 (1) 1 (1) 1 (1) 1 (1)
Monthly income, 2017 GTQ2 mean (SD) 3,790 (3,715) 4,160 (4,695) 3,526 (2,513) 3,687 (3,654) median (IQR) 3,000 (3,300) 3,000 (3,300) 3,000 (3,200) 3,000 (2,400)
Monthly spending, 2017 GTQ mean (SD) 3,134 (3,014) 3,499 (4,147) 3,024 (2,124) 2,857 (2,319) median (IQR) 2,500 (2,500) 2,500 (2,500) 2,700 (2,500) 2,500 (2,000)
1. Illicit activities refer to: selling drugs, fraud or prostitution. Prostitution is technically legal for sex workers under Guatemalan Penal code article 193, however it is illegal for persons to remunerate for sex or sexual favors. 2. When calculated for those who reported an income source, whether from employment or another source, the mean and median across the sample was: GTQ 3,876 (SD: 3,712) and GTQ 3,000 (3,200).

Strengthening the “Reach-Test-Treat-Retain” cascade for men who have sex with men in Guatemala: A pilot intervention” (EIR-HIV KPIS) 36
Figure 3. Mean income and spending by income quintile, by study group, end-line survey
However, all who reported income were not actively employed; for instance, those who were dependent
on family or friends, or savings. Therefore, conditioning on employment (Figure 4), the average income of
those actively employed in Groups 1, 2 and 3 was GTQ 4,813 (SD: 4,887) or USD 655 (USD 665), GTQ 4,027
(SD: 2,405) or USD 548 (USD 327), and GTQ 4,148 (SD: 3,745) or USD 564 (SD: 510), respectively. We did
not observe a significant difference across study groups2 (see Figure 3 for a detailed assessment of mean
income and spending across income quintiles for each group).
Participants in the sample, when compared with national data, on average had higher incomes and were
proportionately more economically active in the formal sector. According to most recently published,
nationally representative household income survey, by the National Center for Statistics (INE in Spanish
abbreviations) in 2017 (Encuesta Nacional de Empleo e Ingresos (ENEI 1-2017), 2017), the national
average monthly income was GTQ 2,052.77 or USD 279.29. Further, it was reported that of those
economically active, 70.2% were engaged in the informal economy. The difference between the national
average monthly income and average monthly income of our study sample was found to be significant at
the 99% confidence level (p<0.0).
2 For study group 1 with a mean monthly income of GTQ 4,160 [95%CI: 3,322-4,998], study group 2 with a mean of GTQ 3,526 [95%CI: 3,088-3,964], and Group 3 with a mean of GTQ3,687 [95%CI: 2,993-4,380]; the difference between Group 1 and 2 was not significant at (p-value=0.19), nor was it significant between Group 1 and Group 3 (p-value=0.40).

Strengthening the “Reach-Test-Treat-Retain” cascade for men who have sex with men in Guatemala: A pilot intervention” (EIR-HIV KPIS) 37
Figure 4. Mean monthly income and spending, conditioned on employment, by study group, endline
Regarding insurance coverage, we observed that 38% of the sample was covered by either private or
public insurance (Figure 5). Over half (61%) of participants were covered solely by the national
Guatemalan public insurance system (IGSS), reserved mainly for those who are employed or their
beneficiaries. Twelve percent of participants were covered solely by private insurance, and 27% were
doubly insured (private and public).
Figure 5. Health insurance coverage, end-line survey
5.3.2 Cost analysis from patient perspective In this section, we present results of the cost analysis conducted from the patient perspective. The cost analysis considers direct and indirect costs before and during the study. Furthermore, this section contains insights gained from the qualitative analysis. It concludes with a scenario and sensitivity analysis that tests certain assumptions used concerning indirect cost estimations and their effect on total economic cost estimations. Tables present estimations for values that were voluntarily reported; if no value was reported, it was considered missing and not included in the analysis. Tables present estimations for values
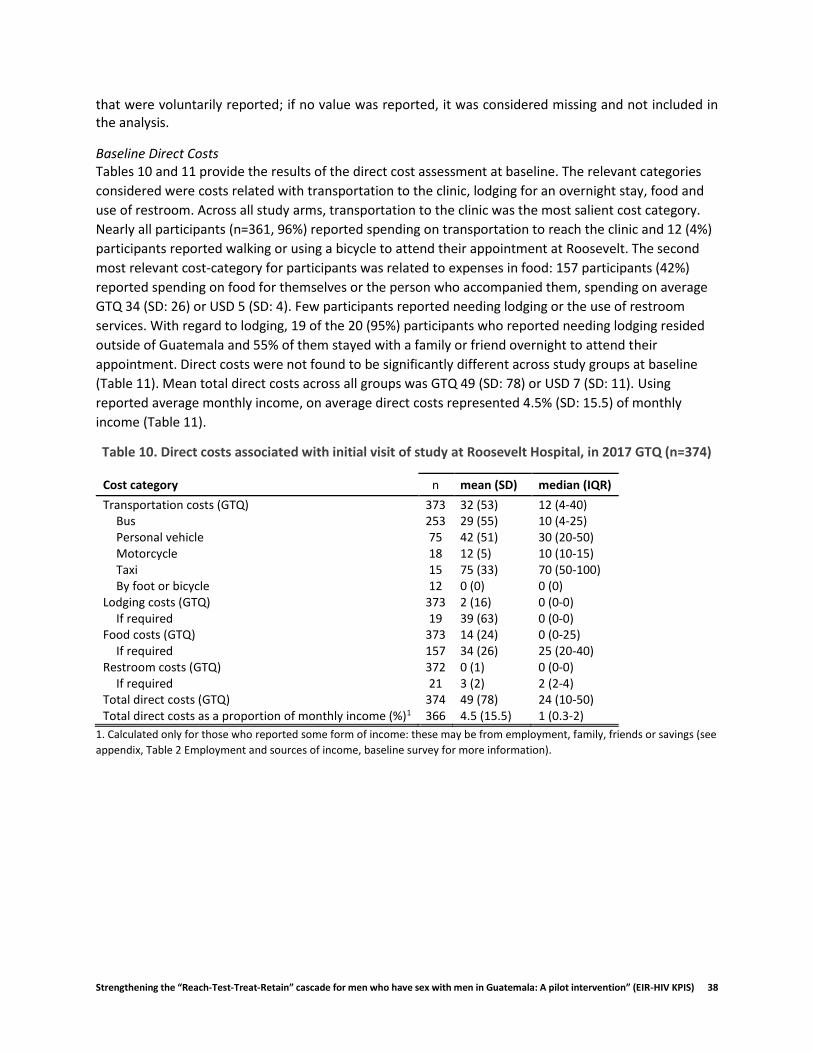
Strengthening the “Reach-Test-Treat-Retain” cascade for men who have sex with men in Guatemala: A pilot intervention” (EIR-HIV KPIS) 38
that were voluntarily reported; if no value was reported, it was considered missing and not included in the analysis.
Baseline Direct Costs Tables 10 and 11 provide the results of the direct cost assessment at baseline. The relevant categories
considered were costs related with transportation to the clinic, lodging for an overnight stay, food and
use of restroom. Across all study arms, transportation to the clinic was the most salient cost category.
Nearly all participants (n=361, 96%) reported spending on transportation to reach the clinic and 12 (4%)
participants reported walking or using a bicycle to attend their appointment at Roosevelt. The second
most relevant cost-category for participants was related to expenses in food: 157 participants (42%)
reported spending on food for themselves or the person who accompanied them, spending on average
GTQ 34 (SD: 26) or USD 5 (SD: 4). Few participants reported needing lodging or the use of restroom
services. With regard to lodging, 19 of the 20 (95%) participants who reported needing lodging resided
outside of Guatemala and 55% of them stayed with a family or friend overnight to attend their
appointment. Direct costs were not found to be significantly different across study groups at baseline
(Table 11). Mean total direct costs across all groups was GTQ 49 (SD: 78) or USD 7 (SD: 11). Using
reported average monthly income, on average direct costs represented 4.5% (SD: 15.5) of monthly
income (Table 11).
Table 10. Direct costs associated with initial visit of study at Roosevelt Hospital, in 2017 GTQ (n=374)
Cost category n mean (SD) median (IQR)
Transportation costs (GTQ) 373 32 (53) 12 (4-40) Bus 253 29 (55) 10 (4-25) Personal vehicle 75 42 (51) 30 (20-50) Motorcycle 18 12 (5) 10 (10-15) Taxi 15 75 (33) 70 (50-100) By foot or bicycle 12 0 (0) 0 (0)
Lodging costs (GTQ) 373 2 (16) 0 (0-0) If required 19 39 (63) 0 (0-0)
Food costs (GTQ) 373 14 (24) 0 (0-25) If required 157 34 (26) 25 (20-40)
Restroom costs (GTQ) 372 0 (1) 0 (0-0) If required 21 3 (2) 2 (2-4)
Total direct costs (GTQ) 374 49 (78) 24 (10-50) Total direct costs as a proportion of monthly income (%)1 366 4.5 (15.5) 1 (0.3-2)
1. Calculated only for those who reported some form of income: these may be from employment, family, friends or savings (see
appendix, Table 2 Employment and sources of income, baseline survey for more information).
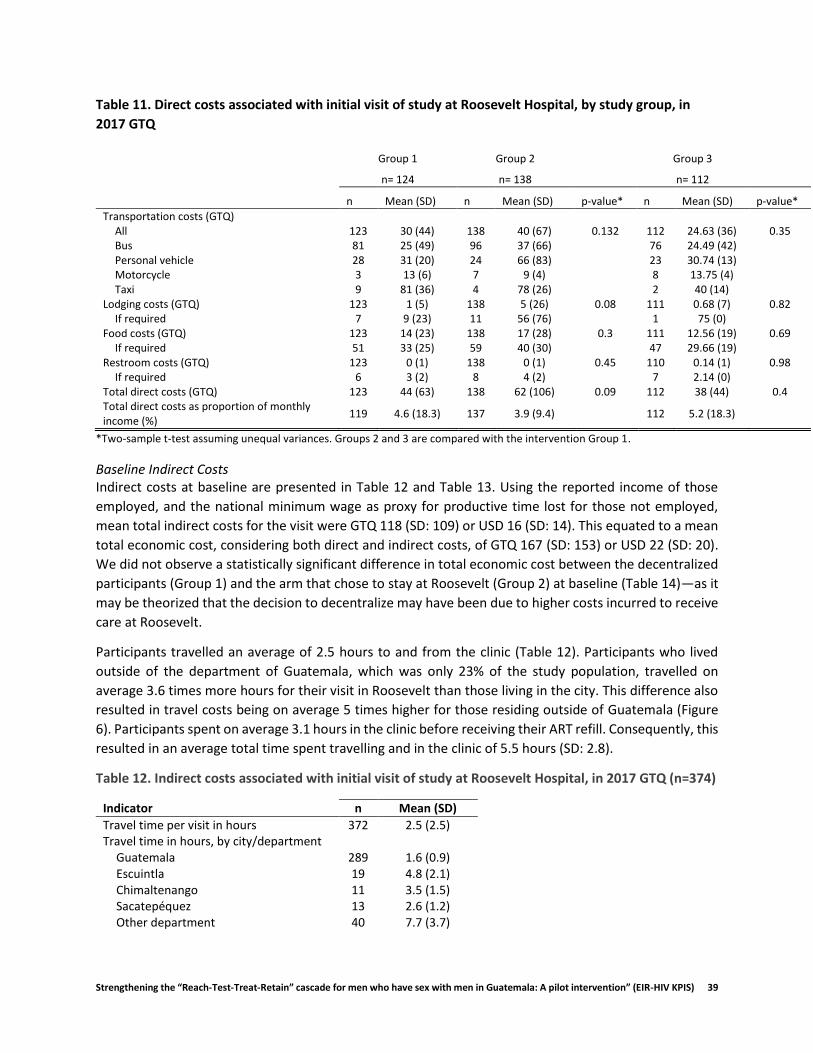
Strengthening the “Reach-Test-Treat-Retain” cascade for men who have sex with men in Guatemala: A pilot intervention” (EIR-HIV KPIS) 39
Table 11. Direct costs associated with initial visit of study at Roosevelt Hospital, by study group, in
2017 GTQ
Group 1 Group 2 Group 3
n= 124 n= 138 n= 112
n Mean (SD) n Mean (SD) p-value* n Mean (SD) p-value*
Transportation costs (GTQ) All 123 30 (44) 138 40 (67) 0.132 112 24.63 (36) 0.35 Bus 81 25 (49) 96 37 (66) 76 24.49 (42) Personal vehicle 28 31 (20) 24 66 (83) 23 30.74 (13) Motorcycle 3 13 (6) 7 9 (4) 8 13.75 (4) Taxi 9 81 (36) 4 78 (26) 2 40 (14)
Lodging costs (GTQ) 123 1 (5) 138 5 (26) 0.08 111 0.68 (7) 0.82 If required 7 9 (23) 11 56 (76) 1 75 (0)
Food costs (GTQ) 123 14 (23) 138 17 (28) 0.3 111 12.56 (19) 0.69 If required 51 33 (25) 59 40 (30) 47 29.66 (19)
Restroom costs (GTQ) 123 0 (1) 138 0 (1) 0.45 110 0.14 (1) 0.98 If required 6 3 (2) 8 4 (2) 7 2.14 (0)
Total direct costs (GTQ) 123 44 (63) 138 62 (106) 0.09 112 38 (44) 0.4 Total direct costs as proportion of monthly income (%)
119 4.6 (18.3) 137 3.9 (9.4) 112 5.2 (18.3)
*Two-sample t-test assuming unequal variances. Groups 2 and 3 are compared with the intervention Group 1.
Baseline Indirect Costs Indirect costs at baseline are presented in Table 12 and Table 13. Using the reported income of those
employed, and the national minimum wage as proxy for productive time lost for those not employed,
mean total indirect costs for the visit were GTQ 118 (SD: 109) or USD 16 (SD: 14). This equated to a mean
total economic cost, considering both direct and indirect costs, of GTQ 167 (SD: 153) or USD 22 (SD: 20).
We did not observe a statistically significant difference in total economic cost between the decentralized
participants (Group 1) and the arm that chose to stay at Roosevelt (Group 2) at baseline (Table 14)—as it
may be theorized that the decision to decentralize may have been due to higher costs incurred to receive
care at Roosevelt.
Participants travelled an average of 2.5 hours to and from the clinic (Table 12). Participants who lived
outside of the department of Guatemala, which was only 23% of the study population, travelled on
average 3.6 times more hours for their visit in Roosevelt than those living in the city. This difference also
resulted in travel costs being on average 5 times higher for those residing outside of Guatemala (Figure
6). Participants spent on average 3.1 hours in the clinic before receiving their ART refill. Consequently, this
resulted in an average total time spent travelling and in the clinic of 5.5 hours (SD: 2.8).
Table 12. Indirect costs associated with initial visit of study at Roosevelt Hospital, in 2017 GTQ (n=374)
Indicator n Mean (SD)
Travel time per visit in hours 372 2.5 (2.5) Travel time in hours, by city/department
Guatemala 289 1.6 (0.9) Escuintla 19 4.8 (2.1) Chimaltenango 11 3.5 (1.5) Sacatepéquez 13 2.6 (1.2) Other department 40 7.7 (3.7)
Strengthening the “Reach-Test-Treat-Retain” cascade for men who have sex with men in Guatemala: A pilot intervention” (EIR-HIV KPIS) 40
Time in clinic spent waiting for ART in hours
364 3.1 (1.3)
Total time in hours (travel + time in clinic) 363 5.6 (2.8) Total indirect costs (GTQ) 361 118 (109) Total economic costs (GTQ) 361 167 (153)
Table 13. Indirect costs associated with initial visit of study at Roosevelt Hospital, by study group, in
2017 GTQ
Group 1 Group 2 Group 3 n=124 n=138 n=112
Indicator n Mean (SD) n Mean (SD) n Mean (SD)
Travel time per visit in hours 123 2.4 (2.4) 137 2.9 (3) 112 2.0 (1.8) Travel time in hours, by city/department
Guatemala 100 1.7 (0.9) 99 1.52 (0.9) 90 1.48 (0.9) Escuintla 4 4.4 (2.5) 9 5.4 (2.1) 6 4.2 (1.8) Chimaltenango 3 4 (2.0) 6 3.5 (1.52) 2 2.5 (0.71) Sacatepéquez 6 2.9 (1.1) 3 1.2 (1.0) 4 3.1 (0.6) Other department 10 7.9 (4.8) 20 8.4 (3.6) 10 6.2 (2.2)
Time in clinic spent waiting for ART in hours 123 2.9 (1.1) 138 2.9 (1.2) 103 3.6 (1.5) Total time in hours (travel + time in clinic) 123 5.2 (2.8) 137 5.7 (3.2) 103 5.7 (2.2) Total indirect costs (GTQ) 122 122 (119) 137 116 (102) 102 115 (106) Total economic costs (GTQ) 122 167 (144) 137 178 (179) 102 152 (124)
Figure 6. Mean transportation cost (GTQ), by department of residence, baseline survey
Table 14. Direct, indirect and total economic costs, Group 1 and 2, baseline survey
Group 1 Group 2
n=124 n=138

Strengthening the “Reach-Test-Treat-Retain” cascade for men who have sex with men in Guatemala: A pilot intervention” (EIR-HIV KPIS) 41
Indicator Mean
(95% CI) Median (IQR) Mean
(95% CI) Median (IQR) p-value
Direct costs 44 (33-55) 25 (10-50) 62 (44-79) 22 (5-65) 0.09
Indirect costs 123 (101-144) 92 (56-150) 116 (99-133) 94 (53-131) 0.65
Total economic costs 167 (141-193) 127 (77-189) 178 (148-208) 125 (71-215) 0.56
To gain further insight into the potential economic impact of seeking HIV care, participants were asked if and how much time they had to miss work or school to get HIV care and treatment over the past three months (Figure 7 and 8). Over half of participants reported missing work or school over the past three months (Figure 7). Of those that reported missing work or school (n=192), on average they had missed 8 hours (SD: 7.8) or 1 day, across all three study arms (Figure 8).
Figure 7. Percent of participants reporting having missed work or school to receive ART in past three
months, by study arm
Figure 8. Mean number of hours reporting having missed from school or work, by study arm
Endline direct costs The following cost analysis focuses on the third appointment within the intervention. Out-of-pocket costs differed slightly across groups. On average, most participants across all study groups spent on

Strengthening the “Reach-Test-Treat-Retain” cascade for men who have sex with men in Guatemala: A pilot intervention” (EIR-HIV KPIS) 42
transportation and food (Table 15). Table 15 presents both unconditional and conditional means for each cost-category, to gain further insight into direct cost patterns observed.
The mode of transportation most frequently used across the study sample was bus (65%), with an average cost of GTQ 31 (SD: 56), or USD 4 (SD: 8). The second most used mode of transportation was a personal vehicle, with an average estimated expense of GTQ 44 (SD: 50), or USD 6 (SD: 7). While not used as frequently as other modes of transportation, the mean cost to participants for the use of taxi was on average 2.3 times higher than the mean cost of using a bus, and 1.6 times higher than the mean cost of using a personal vehicle. It should be further noted that those residing outside of Guatemala were more likely use bus as their mode of transportation (91%) (Figure 9), with an average cost of GTQ 72 (SD: 79) or USD 10 (SD: 11).
Table 15. Direct costs associated with visit in VICITS clinic or Roosevelt Hospital, full sample, in 2017
GTQ (n=369)
Indicator n mean (SD) median (IQR)
Transportation costs 363 33 (53) 15 (5-38) Bus 234 31 (56) 10 (4-30) Personal vehicle/motorcycle 76 44 (50) 30 (25-50) Motorcycle 18 15 (11) 10 (10-20) Taxi 15 70 (34) 70 (40-80) Other 5 8 (13) 0 (0-10)
Lodging costs 364 2 (14) 0 (0-0) If required 22 30 (50) 0 (0-50)
Food costs 364 14 (33) 0 (0-15.5) If required 114 43 (48) 30 (20-50)
Restroom costs 364 0 (1) 0 (0-0) If required 23 3 (1) 3 (2-4)
Additional Medical costs (medications + additional services) 364 1 (7) 0 (0-0) If required 3 68 (55) 100 (5-100)
Total out-of-pocket costs 365 49 (78) 25 (5-55) Routine visit 305 49 (80) 25 (6-55) Routine visit plus additional services 37 44 (64) 20 (4-50) Non-routine 23 51 (75) 30 (10-70)
Total direct costs as proportion of monthly income (%)1 349 3.8 (11.4) .80 (0.2-2.5) Annual out-of-pocket costs 365 145 (229) 75 (15-156)
1. Calculated only for those who reported some form of income: these may be from employment, family, friends or savings (see appendix, Table
2 Employment and sources of income, baseline survey for more information).

Strengthening the “Reach-Test-Treat-Retain” cascade for men who have sex with men in Guatemala: A pilot intervention” (EIR-HIV KPIS) 43
Figure 9. Mode of transportation, by department, end-line survey
Approximately 31% of participants across all three groups reported needing to purchase food when
attending their appointment, spending on average GTQ 43 (SD: 48) or USD 6 (SD: 7). This was slightly more
pronounced for those who received attention at Roosevelt, with 37% in Group 2 and 29% in Group 3,
versus 27% in Group 1, reporting purchasing food for themselves and/or a companion.
Few participants reported spending on lodging (6%) or restroom services (6%). Only one participant
residing in Guatemala reported needing lodging or to sleep outside of their home to attend their
appointment, whereas 24% of participants residing outside of Guatemala reported needing lodging or to
sleep outside of their home to attend their appointment. Similarly, 19% of those residing outside of
Guatemala reported requiring restroom services. It should be noted that not all participants who slept
outside of their home to attend their scheduled appointment incurred an expense, as they slept on the
bus travelling to Guatemala City (41% of cases) or in a relative’s or friend’s home (23% of cases).
Mean total direct cost for participants’ clinic appointment was GTQ 49 (SD: 78) or USD 7 (SD: 11). This
represented, on average, 3.8% of reported monthly average income. Assuming reported costs for this final
appointment were representative of all visits made during the intervention, multiplying by the number of
visits attended by each participant, we estimated a mean total annual direct cost of GTQ 145 (SD: 229) or
USD 20 (SD: 31).
When comparing direct costs between Group 1 and Group 2, using a t-test, we did not observe significant
differences across all cost categories considered (Table 16). However, given the non-normality of cost
data, assessed using the skewness and kurtosis test for normality, we explored and tested the significance
of direct cost estimation results using the non-parametric, Mann-Whitney U test (Table 17). This approach
showed a significant difference (p<0.04) in total direct costs between Group 1 and Group 2 at a 95%
confidence level, however failed to show any significant cost differences across the specific cost
categories. These results suggest that overall direct costs were lower on average for Group 1 during the
intervention.

Strengthening the “Reach-Test-Treat-Retain” cascade for men who have sex with men in Guatemala: A pilot intervention” (EIR-HIV KPIS) 44
Table 16. Direct costs, Group 1 and 2, end-line survey
Group 1 Group 2 n=124 n=133 Indicator n Mean (SD) Median (IQR) n Mean (SD) Median (IQR) p-value
Transportation costs 124 28 (48) 12 (4-30) 130 41 (68) 15 (4-50) 0.08 Lodging costs 124 0 (4) 0 (0-0) 129 3 (17) 0 (0-0) 0.17 Food costs 123 11 (24) 0 (0-10) 130 16 (35) 0 (0-20) 0.23 Restroom costs 123 0 (1) 0 (0-0) 130 0 (1) 0 (0-0) 0.91 Other medical costs 124 1 (9) 0 (0-0) 129 0 (0) 0 (0-0) 0.32 Total out-of-pocket costs 124 41 (65) 20 (4-53) 130 60 (95) 26 (8-65) 0.06
Table 17. Mann-Whitney U test results, by cost category
Indicator Transportation Lodging Food Restroom Additional Medical costs Total direct costs
Mann-Whitney U 7168 7875 7249.5 7970.5 7933.5 6884 Z-Score -1.528 -0.978 -1.55 -0.092 1.02 -2.012 Significance P-value 0.13 0.33 0.12 0.93 0.31 0.04*
Further, given participants in Group 1 were asked to report out-of-pocket expenses for both their
decentralized and non-decentralized appointment (closing appointment at Roosevelt), this allowed for a
comparison of direct costs in two periods for the same group. Table 18 and 19 presents the results of this
estimation and comparison.
Using classic, simple paired t-tests, a significant difference was observed for transportation costs (p<.04)
at the 95% confidence level. However, there were no significant differences found in other cost categories
or total direct costs between the decentralized and non-decentralized appointment for Group 1, at neither
the 95% nor the 90% confidence level. However, to further explore potential differences without assuming
normality, using non-parametric methods of estimation we found that direct costs were significantly
different between the two appointments for participants in Group 1, specifically for transportation and
total direct costs (Table 18 and Table 19). Evidence suggests that participants in Group 1 spent less on
average to attend their decentralized appointments during the intervention than to attend their
appointment at Roosevelt.
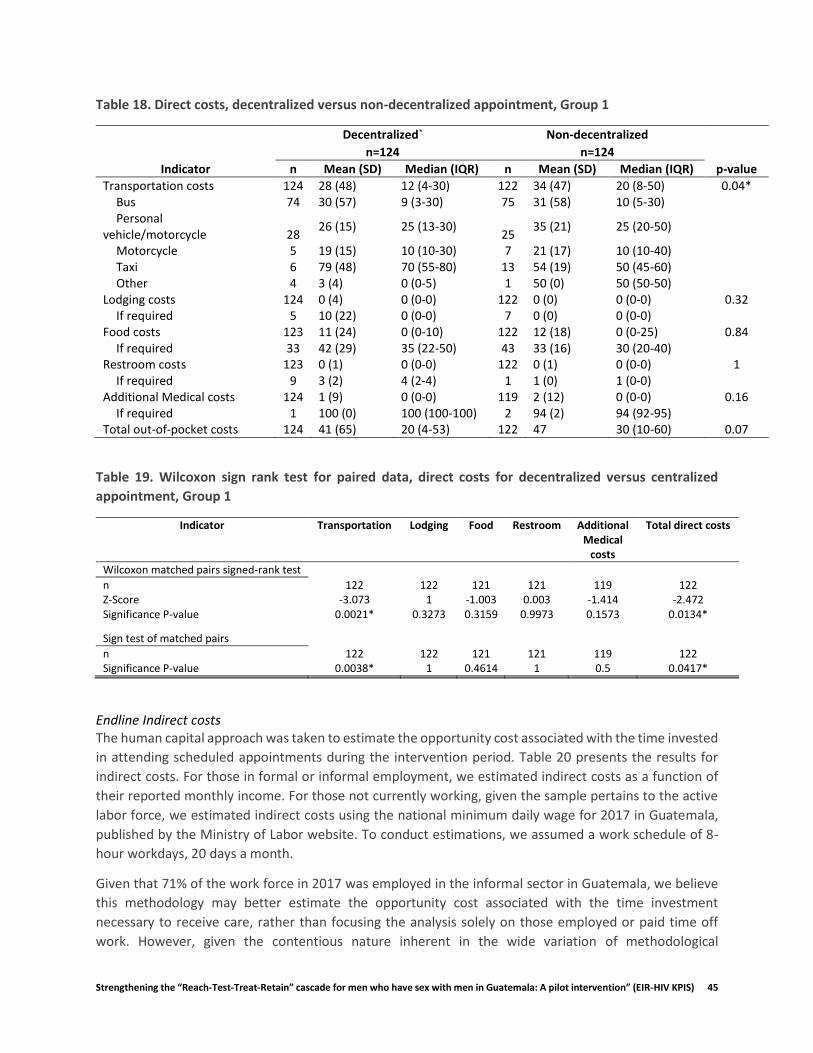
Strengthening the “Reach-Test-Treat-Retain” cascade for men who have sex with men in Guatemala: A pilot intervention” (EIR-HIV KPIS) 45
Table 18. Direct costs, decentralized versus non-decentralized appointment, Group 1
Decentralized` Non-decentralized n=124 n=124
Indicator n Mean (SD) Median (IQR) n Mean (SD) Median (IQR) p-value
Transportation costs 124 28 (48) 12 (4-30) 122 34 (47) 20 (8-50) 0.04* Bus 74 30 (57) 9 (3-30) 75 31 (58) 10 (5-30) Personal
vehicle/motorcycle 28 26 (15) 25 (13-30)
25 35 (21) 25 (20-50)
Motorcycle 5 19 (15) 10 (10-30) 7 21 (17) 10 (10-40) Taxi 6 79 (48) 70 (55-80) 13 54 (19) 50 (45-60) Other 4 3 (4) 0 (0-5) 1 50 (0) 50 (50-50)
Lodging costs 124 0 (4) 0 (0-0) 122 0 (0) 0 (0-0) 0.32 If required 5 10 (22) 0 (0-0) 7 0 (0) 0 (0-0)
Food costs 123 11 (24) 0 (0-10) 122 12 (18) 0 (0-25) 0.84 If required 33 42 (29) 35 (22-50) 43 33 (16) 30 (20-40)
Restroom costs 123 0 (1) 0 (0-0) 122 0 (1) 0 (0-0) 1 If required 9 3 (2) 4 (2-4) 1 1 (0) 1 (0-0)
Additional Medical costs 124 1 (9) 0 (0-0) 119 2 (12) 0 (0-0) 0.16 If required 1 100 (0) 100 (100-100) 2 94 (2) 94 (92-95)
Total out-of-pocket costs 124 41 (65) 20 (4-53) 122 47 30 (10-60) 0.07
Table 19. Wilcoxon sign rank test for paired data, direct costs for decentralized versus centralized
appointment, Group 1
Indicator Transportation Lodging Food Restroom Additional Medical
costs
Total direct costs
Wilcoxon matched pairs signed-rank test n 122 122 121 121 119 122 Z-Score -3.073 1 -1.003 0.003 -1.414 -2.472 Significance P-value 0.0021* 0.3273 0.3159 0.9973 0.1573 0.0134*
Sign test of matched pairs
n 122 122 121 121 119 122 Significance P-value 0.0038* 1 0.4614 1 0.5 0.0417*
Endline Indirect costs The human capital approach was taken to estimate the opportunity cost associated with the time invested
in attending scheduled appointments during the intervention period. Table 20 presents the results for
indirect costs. For those in formal or informal employment, we estimated indirect costs as a function of
their reported monthly income. For those not currently working, given the sample pertains to the active
labor force, we estimated indirect costs using the national minimum daily wage for 2017 in Guatemala,
published by the Ministry of Labor website. To conduct estimations, we assumed a work schedule of 8-
hour workdays, 20 days a month.
Given that 71% of the work force in 2017 was employed in the informal sector in Guatemala, we believe
this methodology may better estimate the opportunity cost associated with the time investment
necessary to receive care, rather than focusing the analysis solely on those employed or paid time off
work. However, given the contentious nature inherent in the wide variation of methodological

Strengthening the “Reach-Test-Treat-Retain” cascade for men who have sex with men in Guatemala: A pilot intervention” (EIR-HIV KPIS) 46
approaches to estimating indirect costs as well as their inclusion in economic evaluations (Krol & Brouwer,
2014; Tang, 2014; Zhang, Bansback, & Anis, 2011), we tested these assumptions, and provide results to
different estimation scenarios in Table 22.
Time spent in the clinic was found to be significantly different between Group 1 and 2 (Table 20). On
average, those receiving centralized care (Group 2) spent 3.6 times more time in the clinic than those in
decentralized care (Group 1), despite receiving a standard package of services in both settings. Further, it
was observed that travel time was lower on average for Group 1 relative to Group 2, with a mean travel
time of 139 minutes (2.3 hours) versus 185 minutes (3.1 hours), respectively. Differences in travel time
between group 1 and 3 were not found statistically significant (P>0.04), however, were found to be
statistically different at the 95% confidence level (P=0.044)3.
Mean indirect costs for Group 1 and Group 2 were GTQ 70 (SD: 71) or USD 9.50 (SD: 9.70) and GTQ 136
(SD: 124) or USD 19 (SD: 17), respectively (Table 20 and 21). When summing direct and indirect costs, the
estimated total economic cost per visit for Group 1 was GTQ 111 (SD: 112) or USD 15.10 (SD: 15.20) and
for Group 2 was GTQ 199 (SD:190) or USD 27 (SD: 26). Annual total economic costs for Group 1 during the
intervention period were estimated at GTQ 331 (SD: 336) or USD 45 (SD: 46), and GTQ 597 (SD: 571) or
USD 81 (SD: 78) for Group 2. The differences in indirect and total economic costs between Group 1 and
Group 2 were significant, and robust to different scenarios evaluated (Table 22).
Table 20. Indirect costs for Group 1, 2 and 3, End-line survey
Group 1 Group 2 Group 3
Indicator n=124 n=133 n=112
Had to miss work or school to attend either this visit or last, n/N(%) No 105/124 (85) 61/131 (47) 52/111 (47) Work 17/124 (14) 67/131 (51) 58/111 (52) School 2/124 (2) 3/131 (2) 1/111 (1) If employed and had to miss pay to make their appointment, n/N(%) Yes 11/102 (11) 23/105 (22) 17/91 (19) No 91/102 (89) 82/105 (78) 74/91 (81) Travel time in minutes, mean (SD) 139 (203) 185 (203) 140 (124) Time spent in clinic in minutes, mean (SD) 56 (52) 199 (74) 246 (86) Total time in hours (travel + time in clinic), mean (SD) 3.2 (2.8) 6.3 (3.8) 6.4 (2.5) Total indirect economic costs, 2017 GTQ, mean (SD) 70 (71) 136 (124) 140 (120) Total economic costs per visit, 2017 GTQ, mean (SD) 111 (112) 199 (190) 186 (154) Annual total economic cost, 2017 GTQ, mean (SD) 331 (336) 597 (571) 547 (425)
3 When relaxing the assumption of normality, the Mann-Whitney test found the difference significant (P =0.047).
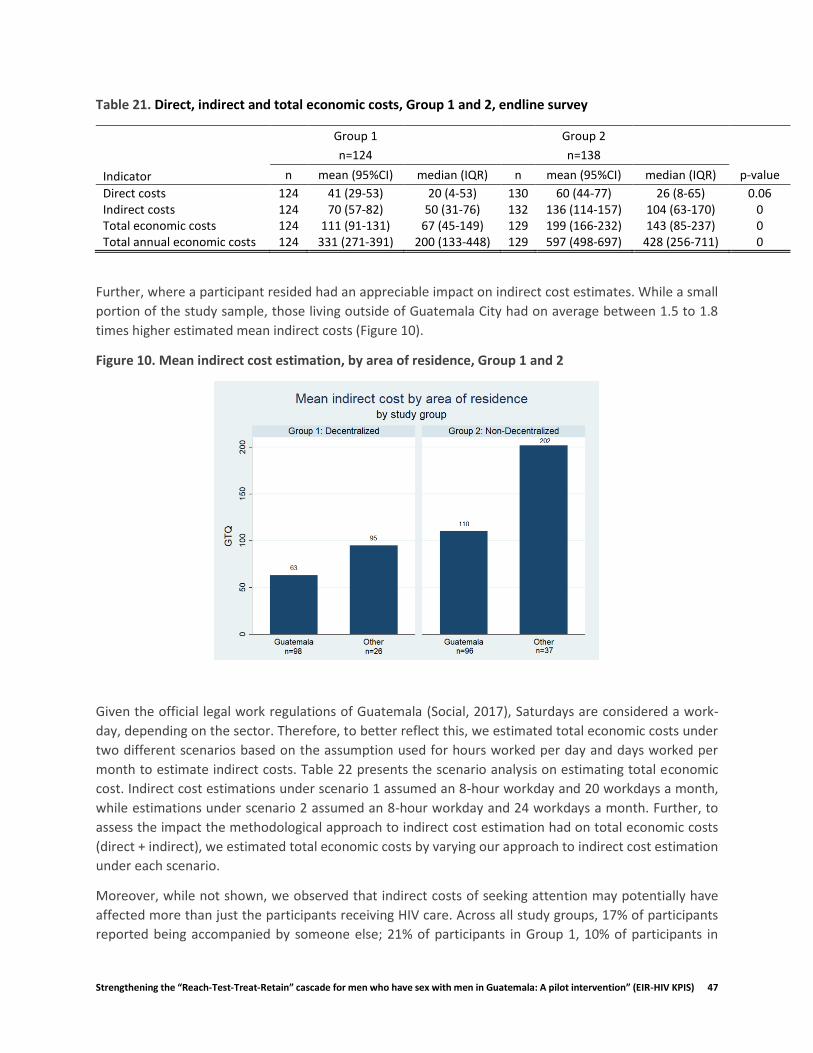
Strengthening the “Reach-Test-Treat-Retain” cascade for men who have sex with men in Guatemala: A pilot intervention” (EIR-HIV KPIS) 47
Table 21. Direct, indirect and total economic costs, Group 1 and 2, endline survey
Group 1 Group 2
n=124 n=138
Indicator n mean (95%CI) median (IQR) n mean (95%CI) median (IQR) p-value
Direct costs 124 41 (29-53) 20 (4-53) 130 60 (44-77) 26 (8-65) 0.06 Indirect costs 124 70 (57-82) 50 (31-76) 132 136 (114-157) 104 (63-170) 0 Total economic costs 124 111 (91-131) 67 (45-149) 129 199 (166-232) 143 (85-237) 0 Total annual economic costs 124 331 (271-391) 200 (133-448) 129 597 (498-697) 428 (256-711) 0
Further, where a participant resided had an appreciable impact on indirect cost estimates. While a small
portion of the study sample, those living outside of Guatemala City had on average between 1.5 to 1.8
times higher estimated mean indirect costs (Figure 10).
Figure 10. Mean indirect cost estimation, by area of residence, Group 1 and 2
Given the official legal work regulations of Guatemala (Social, 2017), Saturdays are considered a work-
day, depending on the sector. Therefore, to better reflect this, we estimated total economic costs under
two different scenarios based on the assumption used for hours worked per day and days worked per
month to estimate indirect costs. Table 22 presents the scenario analysis on estimating total economic
cost. Indirect cost estimations under scenario 1 assumed an 8-hour workday and 20 workdays a month,
while estimations under scenario 2 assumed an 8-hour workday and 24 workdays a month. Further, to
assess the impact the methodological approach to indirect cost estimation had on total economic costs
(direct + indirect), we estimated total economic costs by varying our approach to indirect cost estimation
under each scenario.
Moreover, while not shown, we observed that indirect costs of seeking attention may potentially have
affected more than just the participants receiving HIV care. Across all study groups, 17% of participants
reported being accompanied by someone else; 21% of participants in Group 1, 10% of participants in

Strengthening the “Reach-Test-Treat-Retain” cascade for men who have sex with men in Guatemala: A pilot intervention” (EIR-HIV KPIS) 48
Group 2, and 20% of participants in Group 3. Consequently, 25% of those who accompanied the study
participant were reported to have missed work to do so. Participants may have required accompaniment
due to their health state at the moment of the appointment, requiring additional support or assistance by
a friend or family member, and/or needed social support (Catz, 2000; Wohl, 2011). It may be theorized
that the higher percentage of accompaniment in Group 1 may have been due to the fact the participant
was attending a clinic they have less experience with, in a different setting, and being accompanied by a
friend or family member may help ease feelings of anxiety. This may also explain the similar percentage
of accompaniment for those in Group 3, who are naïve to care and may need similar social support. For
those in Group 2, given there was no change in the clinic they attended during the intervention, and they
had been in care for at least a year without interruption, they may no longer have required social support
to the same extent as someone in Group 3.
Table 22. Scenario analysis of total economic cost estimations
Scenario 1
Group 1 Group 2
Indirect cost estimation approach n Mean (95%CI) Mean (95%CI) p-value p-value (MWU)
Reported income for those employed only (paid/unpaid time lost)
124 104 (84-124) 187 (152-221) 0 0
Reported income for those employed & daily minimum wage for non-employed (paid/unpaid time lost)*
124 111 (91-131) 199 (166-232) 0 0
Reported income for those employed (paid time lost only)**
100 55 (37-74) 91 (64-119) 0.03 0.01
Average monthly national income used for those employed (paid time lost only)**
100 51 (34-67) 84 (59-108) 0.03 0
Scenario 2
Group 1 Group 2
n Mean (95%CI) Mean (95%CI) p-value p-value (MWU)
Reported income for those employed only (paid/unpaid time lost)
124 94 (75-112) 166 (135-196) 0 0
Reported income for those employed & daily minimum wage for non-employed (paid/unpaid time lost)*
124 100 (82-118) 178 (148-208) 0 0
Reported income for those employed (paid time lost only)**
100 53 (36-70) 87 (61-114) 0.03 0.01
Average monthly national income used for those employed (paid time lost only)**
100 49 (34-65) 81 (57-105) 0.03 0.01
*These estimates are used in main body of report.
**Conditioned on the participant being employed and reporting that they had lost income given absence.

Strengthening the “Reach-Test-Treat-Retain” cascade for men who have sex with men in Guatemala: A pilot intervention” (EIR-HIV KPIS) 49
5.3.3 Qualitative Patient Cost Findings In the qualitative interviews we found that many participants reported time to be a determining factor in
choosing to decentralize and for satisfaction with decentralization. Decentralized patients
overwhelmingly reported that the wait time and total time spent at the clinic was much shorter at the
decentralized VICITS clinics than at Roosevelt. The two most common reasons cited for this difference
were the number of people at Roosevelt and the ability to schedule an appointment. Participants reported
waking up early to get to Roosevelt to be seen earlier and leave sooner; however, it would still take several
hours for them to be seen. Not only would they have to wait to be seen by a doctor, they would often
have to wait a substantial amount of time between services. This could turn half an hour’s worth of
services into 4 or more hours at the hospital, according to one participant. In contrast, at the VICITS clinics,
having a set appointment time allowed patients to arrive at a more convenient time and been seen more
quickly. Both the waiting time and the time in between services was reported to be less at the VICITS
clinics. For many participants, the amount of time at the clinic was the main difference between their
experience at Roosevelt and their experience at the VICITS clinics, and the aspect that they liked the most
about decentralization. Below are three examples of how participants described the time burden of care,
In nursing it’s five minutes maybe, at most that you’re there, and with the doctor, another five
minutes…In theory you could say that, if they attended to you or, if they passed you to what you
would have to do as soon as you came, at most it would take maybe half an hour…but this becomes
three, four hours, because you have to wait for everyone to pass…(31 yo, Group 2)
The main difference is the time, the time…sometimes you have to get up very early, so that you
don’t have to leave so late, and other times we’re there almost half the day or something …But
that was the big difference of zone 3, right? That it was…at most half an hour… (49 yo, Group 1)
Honestly, [HR] is closer to me…but honestly, I would prefer a thousand times…to go to the
Foundation [Marco Antonio], because I knew that it would take me 15, 20 minutes more to get
there, but it would save me four or five hours...of sitting and waiting…in the end, it was less time.
(37 yo, Group 1)
One participant mentioned that the faster appointment time was good because it could be hard for him
to get permission to leave work, echoing our formative findings. Another participant talked about how
the long wait time at HR sometimes caused him to miss his classes at the university. We noticed that fewer
patients in Group 1 had to ask for permission to miss work for their appointment, when compared with
Group 2—10% versus 40% (Table 23). This provides further evidence toward the considerable opportunity
costs associated with lost productivity time, due mainly to longer times spent in the clinic for those who
received care in Roosevelt.
Table 23. Asking for permission from work to attend appointment by study arm, endline survey
Asked for permission
Group 1 %
Group 2 %
Yes 13 10 52 40
No
111 90 79 60
Total 124 100 131 100
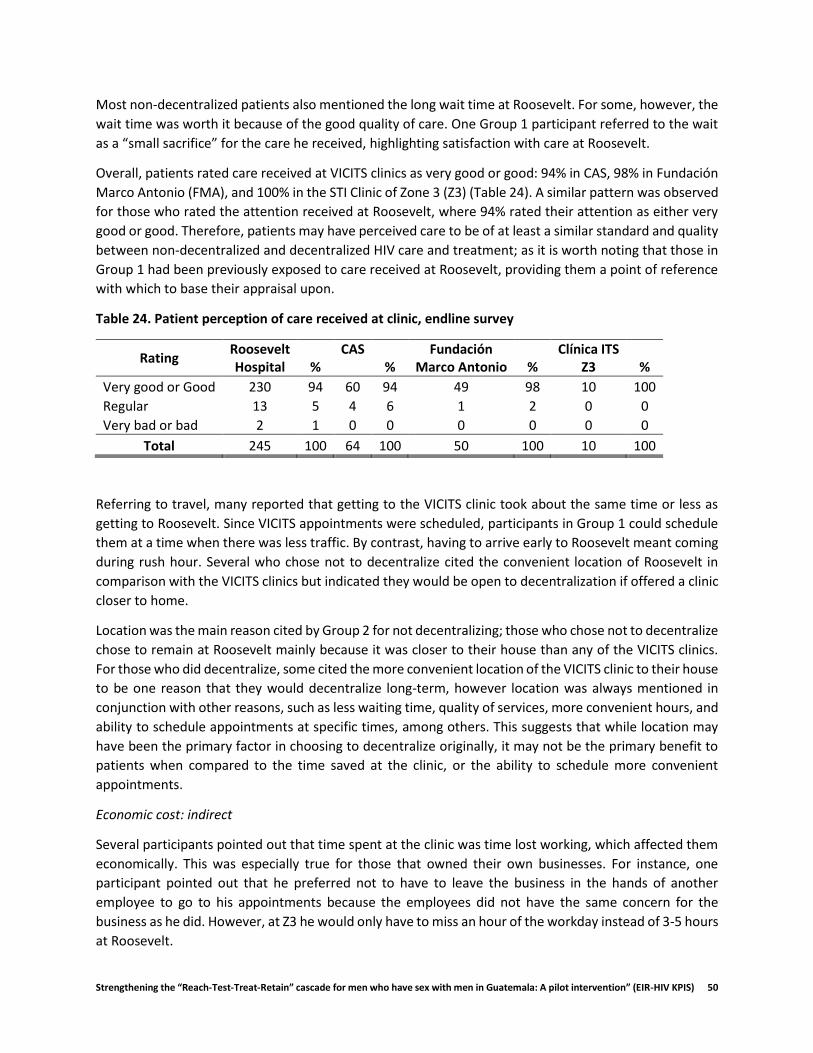
Strengthening the “Reach-Test-Treat-Retain” cascade for men who have sex with men in Guatemala: A pilot intervention” (EIR-HIV KPIS) 50
Most non-decentralized patients also mentioned the long wait time at Roosevelt. For some, however, the
wait time was worth it because of the good quality of care. One Group 1 participant referred to the wait
as a “small sacrifice” for the care he received, highlighting satisfaction with care at Roosevelt.
Overall, patients rated care received at VICITS clinics as very good or good: 94% in CAS, 98% in Fundación
Marco Antonio (FMA), and 100% in the STI Clinic of Zone 3 (Z3) (Table 24). A similar pattern was observed
for those who rated the attention received at Roosevelt, where 94% rated their attention as either very
good or good. Therefore, patients may have perceived care to be of at least a similar standard and quality
between non-decentralized and decentralized HIV care and treatment; as it is worth noting that those in
Group 1 had been previously exposed to care received at Roosevelt, providing them a point of reference
with which to base their appraisal upon.
Table 24. Patient perception of care received at clinic, endline survey
Rating Roosevelt Hospital %
CAS %
Fundación Marco Antonio %
Clínica ITS Z3 %
Very good or Good 230 94 60 94 49 98 10 100
Regular 13 5 4 6 1 2 0 0
Very bad or bad 2 1 0 0 0 0 0 0
Total 245 100 64 100 50 100 10 100
Referring to travel, many reported that getting to the VICITS clinic took about the same time or less as
getting to Roosevelt. Since VICITS appointments were scheduled, participants in Group 1 could schedule
them at a time when there was less traffic. By contrast, having to arrive early to Roosevelt meant coming
during rush hour. Several who chose not to decentralize cited the convenient location of Roosevelt in
comparison with the VICITS clinics but indicated they would be open to decentralization if offered a clinic
closer to home.
Location was the main reason cited by Group 2 for not decentralizing; those who chose not to decentralize
chose to remain at Roosevelt mainly because it was closer to their house than any of the VICITS clinics.
For those who did decentralize, some cited the more convenient location of the VICITS clinic to their house
to be one reason that they would decentralize long-term, however location was always mentioned in
conjunction with other reasons, such as less waiting time, quality of services, more convenient hours, and
ability to schedule appointments at specific times, among others. This suggests that while location may
have been the primary factor in choosing to decentralize originally, it may not be the primary benefit to
patients when compared to the time saved at the clinic, or the ability to schedule more convenient
appointments.
Economic cost: indirect
Several participants pointed out that time spent at the clinic was time lost working, which affected them
economically. This was especially true for those that owned their own businesses. For instance, one
participant pointed out that he preferred not to have to leave the business in the hands of another
employee to go to his appointments because the employees did not have the same concern for the
business as he did. However, at Z3 he would only have to miss an hour of the workday instead of 3-5 hours
at Roosevelt.

Strengthening the “Reach-Test-Treat-Retain” cascade for men who have sex with men in Guatemala: A pilot intervention” (EIR-HIV KPIS) 51
And time, time also implies economy, right? The fact that we aren’t doing things for work, also
implies economy, the fact of asking for permission, the fact of not…contributing economically,
those times, sometimes, are regrettable…so, for me, the experience of arriving, being attended
to immediately, like a normal appointment, was great. (41 yo, Group 1)
Another participant, who was a sex worker, liked the faster appointments at CAS because he could have
time to go to his appointment, see his clients, and have his social life, whereas at Roosevelt he would lose
an entire day just to get his medication. He appreciated the evening appointment slots offered by CAS as
they worked better with his schedule.
Current and potential barriers to retention
Most participants reported having no issues getting to appointments: either they scheduled them for days
that they did not have to work, or they were able to get permission to miss work to go to their
appointment. One participant mentioned that sometimes he was late due to traffic, though he had never
missed an appointment.
For some, work had represented a barrier to getting to appointments, but they had usually been able to
work it out. One participant, unemployed at the time of the interview, said that his work had given him
trouble before, when his employers resisted giving him permission to go to appointments, and even
inquired as to why he had to go to the hospital so often, again reflecting themes from our formative
findings. Though none reported missing appointments because of work, some had to change their
appointments or come in on different days due to a conflicting work schedule. One patient took advantage
of having a day off work to come a day earlier to his appointment; however, due to the number of patients
attending the Roosevelt clinic each day, they were not able to give him the full package of services, and
only gave him his medication. Another had to change an appointment at FMA because he was too far
away, traveling for work, and had to come a week later and risked running out of pills:
Because I was so far away, and when you work for yourself…you have to look for the money…only
that time I changed it, and I think it was three days, a week, but I had pills for three more days.
(37 yo, Group 1)
Several participants cited work as a potential barrier to making appointments in the future, especially if
they were to switch to a job with different hours or where it was harder to get permission to miss work.
One participant mentioned classes as a potential future barrier to making appointments. In this case, this
participant had to come in every month instead of once every three months, and due to the long
appointment times, often missed class.
Other actual and potential barriers mentioned included: demonstrations that block the streets, poor
health that keeps one from being able to arrive at the clinic, and potentially leaving Guatemala. Also, a
few participants mentioned violence as a potential barrier, saying that if there was more violence in the
streets, or more shootings at the hospital, it might make them too scared to come. However, most felt
that even with these barriers, they would still find a way to come to their appointments.
5.3.4 Provider Costs Costs to providers were retrospectively measured considering all resources used during the 12-month
intervention period. Table 25 provides an assessment of all direct costs attributed to each clinic. Figure 11
provides a percentage distribution of costs by each activity, and Figure 12 provides a percentage

Strengthening the “Reach-Test-Treat-Retain” cascade for men who have sex with men in Guatemala: A pilot intervention” (EIR-HIV KPIS) 52
distribution of costs by intervention activity. Personnel and material transportation costs were allocated
directly to the decentralized clinics. The rationale being that care at the decentralized clinic would not
have been attenable without medical doctors and pharmacists moving to and from clinics, and laboratory
samples being transported to the Roosevelt laboratory for processing. Therefore, decentralized clinics
would have to absorb these costs. This was thought to better reflect the reality of partial decentralization,
as envisioned in this intervention.
It was observed that personnel and material costs were the highest cost categories, followed by
equipment and transportation costs. For decentralization, across all clinics, costs attributed to personnel
represented 66% of total costs, and costs attributed to materials represented 17% of total costs (Table
25). For non-decentralized care at Roosevelt, personnel costs represented 46% of total costs and material
costs represented 47% of total costs. With regard to materials, antiretroviral medication costs were the
highest cost category, with an estimated total cost of GTQ 59, 347 or USD 8,074 for decentralized
attention, and GTQ 160, 194 or USD 21,825 for non-decentralized attention (Groups 2 and 3). For
Roosevelt, kits to conduct viral load testing was another important cost incurred, where each kit cost GTQ
12,850 or USD 1,748, equivalent to GTQ 267 or USD 37 per test in material costs.
Table 25. Total economic costs of providers, by clinic providing treatment, 12-month intervention
period 2017-2018, in 2017 USD
Clinic Personnel Equipment Materials Building & Utilities
Training* Transport-ation
Total
CAS 7,808 1,204 6,659 734 - 733 17,138
STI Clinic of Zone 3 14,303 132 458 1,009 - 310 16,212
FMA 22,267 3,647 4,450 2,758 - 669 33,791
Roosevelt Hospital 65,915 2,500 66,741 8,207 - - 143,362
Total 110,294 7,483 78,307 12,708 - 1,711 210,503
*Training was provided to clinical and technical staff by KPIS, however was an investment made prior to
the intervention period.
Costs of resources devoted to HIV care and treatment and laboratory services accounted for 62% and 15%
of total costs for decentralized care, and 36% and 24% of non-decentralized care, respectively. Relatively
lower personnel and equipment costs for Roosevelt may be explained by the lower overall percentage of
time devoted to participants in the intervention relative to the total patient load attended by the Hospital
(>100 patients daily).
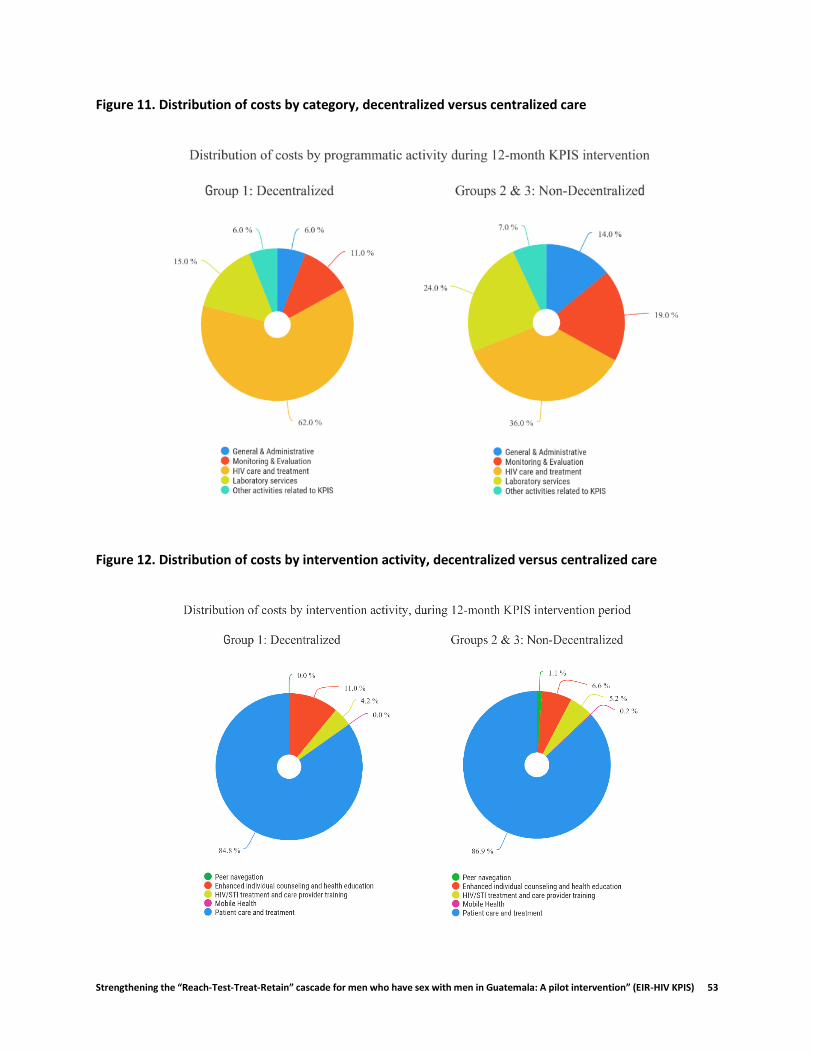
Strengthening the “Reach-Test-Treat-Retain” cascade for men who have sex with men in Guatemala: A pilot intervention” (EIR-HIV KPIS) 53
Figure 11. Distribution of costs by category, decentralized versus centralized care
Figure 12. Distribution of costs by intervention activity, decentralized versus centralized care
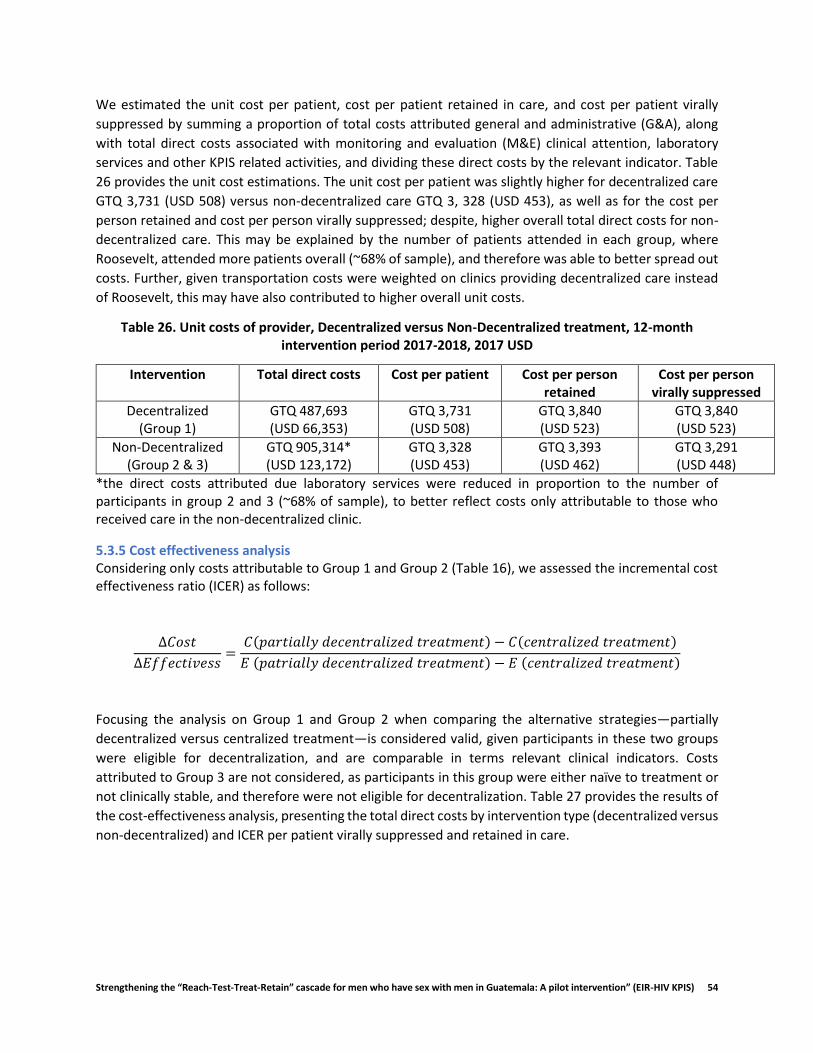
Strengthening the “Reach-Test-Treat-Retain” cascade for men who have sex with men in Guatemala: A pilot intervention” (EIR-HIV KPIS) 54
We estimated the unit cost per patient, cost per patient retained in care, and cost per patient virally
suppressed by summing a proportion of total costs attributed general and administrative (G&A), along
with total direct costs associated with monitoring and evaluation (M&E) clinical attention, laboratory
services and other KPIS related activities, and dividing these direct costs by the relevant indicator. Table
26 provides the unit cost estimations. The unit cost per patient was slightly higher for decentralized care
GTQ 3,731 (USD 508) versus non-decentralized care GTQ 3, 328 (USD 453), as well as for the cost per
person retained and cost per person virally suppressed; despite, higher overall total direct costs for non-
decentralized care. This may be explained by the number of patients attended in each group, where
Roosevelt, attended more patients overall (~68% of sample), and therefore was able to better spread out
costs. Further, given transportation costs were weighted on clinics providing decentralized care instead
of Roosevelt, this may have also contributed to higher overall unit costs.
Table 26. Unit costs of provider, Decentralized versus Non-Decentralized treatment, 12-month intervention period 2017-2018, 2017 USD
Intervention Total direct costs Cost per patient Cost per person retained
Cost per person virally suppressed
Decentralized (Group 1)
GTQ 487,693 (USD 66,353)
GTQ 3,731 (USD 508)
GTQ 3,840 (USD 523)
GTQ 3,840 (USD 523)
Non-Decentralized (Group 2 & 3)
GTQ 905,314* (USD 123,172)
GTQ 3,328 (USD 453)
GTQ 3,393 (USD 462)
GTQ 3,291 (USD 448)
*the direct costs attributed due laboratory services were reduced in proportion to the number of participants in group 2 and 3 (~68% of sample), to better reflect costs only attributable to those who received care in the non-decentralized clinic.
5.3.5 Cost effectiveness analysis Considering only costs attributable to Group 1 and Group 2 (Table 16), we assessed the incremental cost effectiveness ratio (ICER) as follows:
∆𝐶𝑜𝑠𝑡
∆𝐸𝑓𝑓𝑒𝑐𝑡𝑖𝑣𝑒𝑠𝑠=
𝐶(𝑝𝑎𝑟𝑡𝑖𝑎𝑙𝑙𝑦 𝑑𝑒𝑐𝑒𝑛𝑡𝑟𝑎𝑙𝑖𝑧𝑒𝑑 𝑡𝑟𝑒𝑎𝑡𝑚𝑒𝑛𝑡) − 𝐶(𝑐𝑒𝑛𝑡𝑟𝑎𝑙𝑖𝑧𝑒𝑑 𝑡𝑟𝑒𝑎𝑡𝑚𝑒𝑛𝑡)
𝐸 (𝑝𝑎𝑡𝑟𝑖𝑎𝑙𝑙𝑦 𝑑𝑒𝑐𝑒𝑛𝑡𝑟𝑎𝑙𝑖𝑧𝑒𝑑 𝑡𝑟𝑒𝑎𝑡𝑚𝑒𝑛𝑡) − 𝐸 (𝑐𝑒𝑛𝑡𝑟𝑎𝑙𝑖𝑧𝑒𝑑 𝑡𝑟𝑒𝑎𝑡𝑚𝑒𝑛𝑡)
Focusing the analysis on Group 1 and Group 2 when comparing the alternative strategies—partially
decentralized versus centralized treatment—is considered valid, given participants in these two groups
were eligible for decentralization, and are comparable in terms relevant clinical indicators. Costs
attributed to Group 3 are not considered, as participants in this group were either naïve to treatment or
not clinically stable, and therefore were not eligible for decentralization. Table 27 provides the results of
the cost-effectiveness analysis, presenting the total direct costs by intervention type (decentralized versus
non-decentralized) and ICER per patient virally suppressed and retained in care.
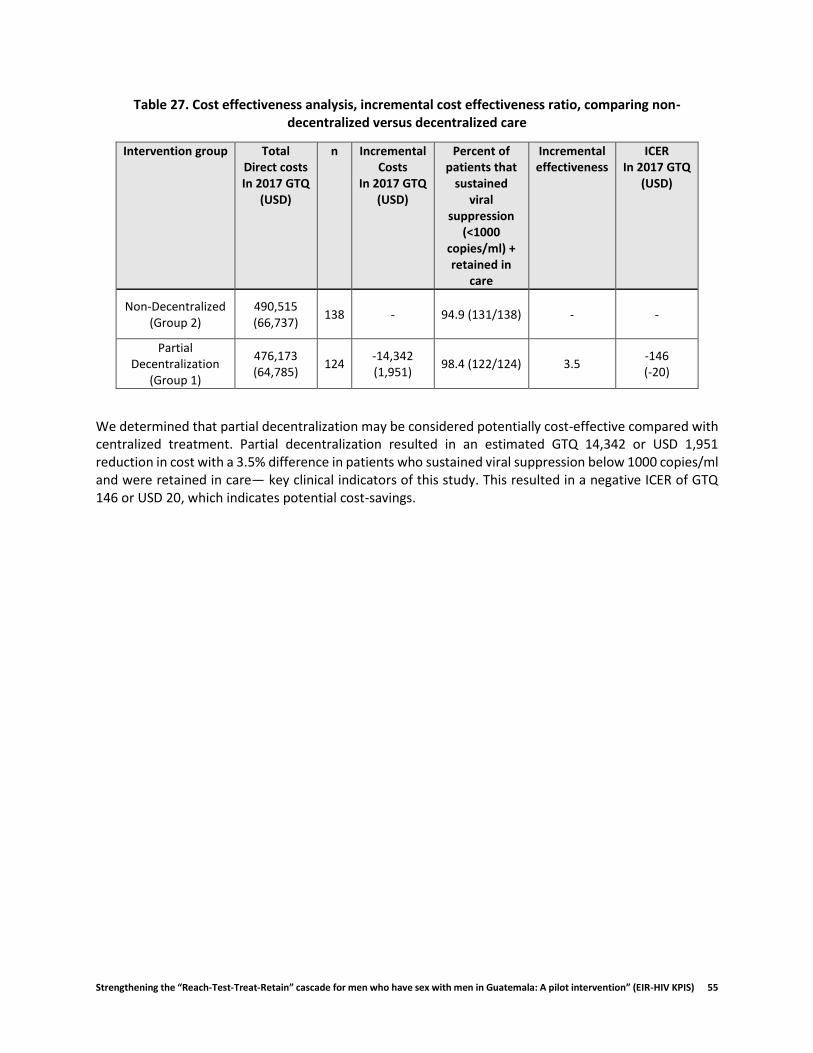
Strengthening the “Reach-Test-Treat-Retain” cascade for men who have sex with men in Guatemala: A pilot intervention” (EIR-HIV KPIS) 55
Table 27. Cost effectiveness analysis, incremental cost effectiveness ratio, comparing non-decentralized versus decentralized care
Intervention group Total Direct costs In 2017 GTQ
(USD)
n Incremental Costs
In 2017 GTQ (USD)
Percent of patients that
sustained viral
suppression (<1000
copies/ml) + retained in
care
Incremental effectiveness
ICER In 2017 GTQ
(USD)
Non-Decentralized (Group 2)
490,515 (66,737)
138 - 94.9 (131/138) - -
Partial Decentralization
(Group 1)
476,173 (64,785)
124 -14,342 (1,951)
98.4 (122/124) 3.5 -146 (-20)
We determined that partial decentralization may be considered potentially cost-effective compared with centralized treatment. Partial decentralization resulted in an estimated GTQ 14,342 or USD 1,951 reduction in cost with a 3.5% difference in patients who sustained viral suppression below 1000 copies/ml and were retained in care— key clinical indicators of this study. This resulted in a negative ICER of GTQ 146 or USD 20, which indicates potential cost-savings.

Strengthening the “Reach-Test-Treat-Retain” cascade for men who have sex with men in Guatemala: A pilot intervention” (EIR-HIV KPIS) 56
5.4 Conclusions The economic evaluation of KPIS sought to elucidate the economic costs to healthcare providers of the
intervention and to participants, in order to provide decision makers critical information that may help
inform their decision to potentially decentralize the provision of HIV treatment and care services. We used
a mixed methods approach, integrating quantitative and qualitative data, to provide a more
comprehensive understanding of the cost implications of partially decentralized HIV care and treatment.
We determined that the highest direct costs to participants were in transportation to and from the clinic,
where clear differences were observed between those living in Guatemala City and those living outside
the capital. Those who lived outside the capital were more likely to use public transportation and sleep
outside their home to attend their appointment. Quantitative and qualitative data suggest that those who
opted for decentralized care benefited from closer proximity to their home, as well as more flexible
appointments, which allowed them to potentially avoid greater travel times, as well as avoid missing work
or other economically productive activity. In general, the study population was economically active, and
this contributed to statistically significant indirect cost differences observed between those receiving
decentralized and non-decentralized care. Those in decentralized care benefited from less waiting times,
likely due to structured appointments and less patient congestion. This afforded significant time-savings,
enabling participants to lose less potentially productive time. These observations in the data were
corroborated with interviews with participants in both study arms, where many stated clear differences
in wait times between attention received at Hospital Roosevelt and VICITS clinics; this despite no observed
difference in the quality of care.
Direct cost to providers were similar, with decentralized care being slightly more expensive on a per
patient basis, which may be due to a slightly lower number of participants, and differences in payment
mechanisms, use of equipment for KPIS participants, and differences in the cost of infrastructure between
the NGO-run clinics (excluding STI Clinic of Zone 3) and the MoH-run hospital, Roosevelt. Using three-
times the GDP per capita, as well as three-times the amount spent on healthcare reported by the MoH,
the intervention was found to be potentially cost-effective.
The analysis is not without its limitations. In cases where item-specific costs of material or equipment
were not readily available, a close market equivalent cost was used, provided either by records maintained
by the Universidad Del Valle de Guatemala or the clinic. In the case of equipment without readily available
cost data, the assumed useful life years was 5 and future discount rate of 3%. Infrastructure and utility
costs of spaces used were allocated based on meters squared, which may not have reflected the true
usage in each specific area, as this was not recorded by any clinic in the sample; however, payment records
kept by the clinic’s administrative staff were used to estimate these costs at a site-level. Further, allocation
of costs across activities and interventions were done on a percentage basis, which was informed by
interviews with clinic staff personnel, retrospectively, which may be affected by recall-bias. Additionally,
allocation of laboratory costs was done based on the number of patients enrolled in each group, not
necessarily based on specific lab testing data per patient, as all routine lab testing for both Group 1 and
Group 2 patients was conducted at Roosevelt Hospital. This may over- or under- estimate laboratory costs
at a per patient level, given potential between-patient differences in testing. However, we expect the
impact to be minimal as clinical characteristics of patients were similar between Group 1 and Group 2. For
the cost-effectiveness analysis, given that resource use specific to each participant in each group in
Roosevelt was not collected, the allocation of resource costs relied on taking an estimated percentage
proportion of resources used by Group 2 only, based solely on the number of participants in each group,
Strengthening the “Reach-Test-Treat-Retain” cascade for men who have sex with men in Guatemala: A pilot intervention” (EIR-HIV KPIS) 57
which may over- or under- estimate actual costs based on resource use. Despite these limitations, the
micro-costing approach taken is expected to be the best approximation of real economic costs of the
intervention given its specificity. Future studies may want to consider a time-motion or prospective
approach to cost-estimation.
This is the first cost-effectiveness analysis of partial decentralized treatment in the Central American
region and has found partial decentralization to be a cost-effective solution to providing care to patients.
Given the patient-centric approach to care, partial decentralization may provide a favorable solution to
people living with HIV to receive care, providing them greater flexibility, as well as to providers, by
reducing congestion in healthcare facilities. This may serve to have long-term benefits in clinical
outcomes, reduction in provider burnout, among others (Boyer et al., 2012; Falagas, Zarkadoulia, Pliatsika,
& Panos, 2008; Mutevedzi et al., 2010).
Strengthening the “Reach-Test-Treat-Retain” cascade for men who have sex with men in Guatemala: A pilot intervention” (EIR-HIV KPIS) 58
5.5 References Análisis técnico 2016-2017 sobre el financiamiento y gasto en salud en Guatemala. (2017). MSPAS.
Retrieved from http://www.mspas.gob.gt/images/files/cuentasnacionales/publicaciones/CNyES(2017)Analisistecnicogastoensalud.pdf
Boyer, S., Protopopescu, C., Marcellin, F., Carrieri, M. P., Koulla-Shiro, S., Moatti, J. P., & Spire, B. (2012). Performance of HIV care decentralization from the patient’s perspective: Health-related quality of life and perceived quality of services in Cameroon. Health Policy and Planning, 27(4), 301–315. http://doi.org/10.1093/heapol/czr039
Encuesta Nacional de Empleo e Ingresos (ENEI 1-2017). (2017). ENEI.
Falagas, M. E., Zarkadoulia, E. A., Pliatsika, P. A., & Panos, G. (2008). Socioeconomic status (SES) as a determinant of adherence to treatment in HIV infected patients: A systematic review of the literature. Retrovirology, 5. http://doi.org/10.1186/1742-4690-5-13
Krol, M., & Brouwer, W. (2014). How to estimate productivity costs in economic evaluations. PharmacoEconomics, 32, 335–344. http://doi.org/10.1007/s40273-014-0132-3
Marseille, E., Larson, B., Kazi, D. S., Kahn, J. G., & Rosen, S. (2015). Thresholds for the cost – effectiveness of interventions: alternative approaches. Bulletin of the World Health Organization, 93(October 2014), 118–124. http://doi.org/2471/BLT.14.138206
Mutevedzi, P. C., Lessells, R. J., Heller, T., Bärnighausen, T., Cooke, G. S., & Newell, M.-L. (2010). Scale-up of a decentralized HIV treatment programme in rural KwaZulu-Natal, South Africa: does rapid expansion affect patient outcomes? Bulletin of the World Health Organization, 88(8), 593–600. http://doi.org/10.2471/BLT.09.069419
Robinson, L. A., Hammitt, J. K., Chang, A. Y., & Resch, S. (2017). Understanding and improving the one and three times GDP per capita cost-effectiveness thresholds. Health Policy and Planning, 32(1), 141–145. http://doi.org/10.1093/heapol/czw096
Social, M. de T. y P. (2017). Código de Trabajo de Guatemala. Retrieved from http://biblioteca.oj.gob.gt/digitales/36036.pdf
Tang, K. (2014). Estimating Productivity Costs in Health Economic Evaluations: A Review of Instruments and Psychometric Evidence. PharmacoEconomics, 33, 31–48. http://doi.org/10.1007/s40273-014-0209-z
Walker, S., Sculpher, M., & Drummond, M. (2012). The Methods of Cost-Effectiveness Analysis to Inform Decisions about the Use of Health Care Interventions and Programs. The Oxford Handbook of Health Economics. http://doi.org/10.1093/oxfordhb/9780199238828.013.0031
Woods, B., Revill, P., Sculpher, M., & Claxton, K. (2016). Country-Level Cost-Effectiveness Thresholds: Initial Estimates and the Need for Further Research. Value in Health, 19(8), 929–935. https://doi.org/10.1016/j.jval.2016.02.017
Zhang, W., Bansback, N., & Anis, A. H. (2011). Measuring and valuing productivity loss due to poor health: A critical review. Social Science & Medicine, 72, 185–192. http://doi.org/10.1016/j.socscimed.2010.10.026

Strengthening the “Reach-Test-Treat-Retain” cascade for men who have sex with men in Guatemala: A pilot intervention” (EIR-HIV KPIS) 59
6. HEALTH NAVIGATION
6.1 Navigation Description Health navigation is a strengths-based model originally developed in the context of cancer care and
adapted as a way to support people living with HIV to negotiate social and structural barriers to care
(Bradford, Coleman, & Cunningham, 2007). It is a recommended strategy towards achieving the 90-90-90
goals set by UNAIDS for 2020, as a way to mitigate the burden of HIV among key populations, including
men who have sex with men (MSM) (Thompson, Mugavero, Amico, & Cargill, 2012). Navigators, who may
or may not be peers, work with individuals living with HIV to address barriers to care, identify strategies
for using existing resources, and seek out additional resources to maintain health and well-being (Akolo
et al., 2017).
For this study, we extended a health navigation model originally developed in Guatemala City for early
testing and linkage to care (Davis et al., 2017; Loya-Montiel et al., 2018), to support retention in care and
adherence to treatment, along with other aspects of managing HIV as a chronic condition. Navigation was
offered to all participants. With decentralized participants (Group 1), navigators provided accompaniment
to the new clinics, and provided reminders for their appointments, which were scheduled at specific times
(compared to Hospital Roosevelt that did not schedule times). For participants that were eligible for
decentralization but chose to continue receiving care at Hospital Roosevelt (Group 2), navigators primarily
provided appointment reminders and offered accompaniment. For participants in Group 3 who were
more recently diagnosed, navigators provided accompaniment. Across all three groups, Navigators also
offered referrals to HIV testing for the partners of study participants (described below). In some cases,
navigators also aided in disclosing to family, friends, and partners, and provided emotional and
instrumental support by sending regular motivational messages during the week and talking through
personal, professional, and HIV-related issues with participants.
Nine health navigators were originally assigned to each of the participants who accepted this component.
The average age of the navigators was 28 years and the majority had completed at least some university
education; several had studied or were studying psychology. Over half had at least some previous
experience working with HIV prevention and treatment programs, and two were part of the original
navigation project. All navigators were trained by the study team in the study objectives and protocol and
in basic HIV knowledge. After two weeks of didactic training, new navigators shadowed experienced
navigators before being assigned their own patients. They were instructed to maintain at least monthly
communication with all participants, and to provide appointment reminders. Throughout the study
period, navigators were assigned between 30 and 60 participants.
6.2 Navigation Monitoring System In the initial months of the study (January 2017 to July 2017), navigators were instructed to report their
interactions with participants using an excel spreadsheet. However, due to challenges with timely and
consistent reporting, such as lack of access to computers during work hours and tedious and time-
consuming reporting in spreadsheets, we designed and implemented the mobile application (app), which
was put into place in July 2017 and used through the end of the study in June 2018. Data captured in
spreadsheets prior to July 2017 was back-entered into the mobile app by each navigator. The mobile app
was developed using Open Data Kit (ODK) (Hartung et al., 2010), a free, open-source tool. The app was
designed for navigators to report details of their interactions with participants in three focus areas: 1)
mode of navigator-patient interaction: in person (accompaniment to appointments, meetings with

Strengthening the “Reach-Test-Treat-Retain” cascade for men who have sex with men in Guatemala: A pilot intervention” (EIR-HIV KPIS) 60
relatives and partners, support visit) or remote (phone call, text messages, social networks); 2) duration
of the interaction; and 3) content of the interaction (appointment reminder, HIV education, emotional
support, clinic procedures, employment topics, etc.). Figure 13 displays a screenshot of the mobile app.
All data collected were securely stored on servers at the sponsoring institution.
Health navigators documented the interactions they had with participants using a mobile monitoring
system designed by our team for this study. In general, the navigators took between 1 and 5 minutes to
log each interaction in the monitoring app. Through qualitative interviews with navigators at the end of
the study, health navigators generally found the monitoring system easy to use and beneficial to them
and to the project. As one navigator said, “It’s super easy to use, like, even a kid could use it…it just takes
a little bit of time to learn how to use it and it’s not complicated at all.” However, navigators reflected
variation in terms of how and when they entered data into the monitoring system. Roughly half reported
entering data on a daily basis, which was the intention of the system when designed. Others, however,
reported entering data on a weekly basis by reviewing call and message logs on their phones as well as
their written notes. Another important finding was that navigators indicated they did not document all of
their interactions in the app. For example, general greetings and check-ins were sometimes not
documented as an attempted or successful interaction, despite taking time on the part of the navigator
to implement.
Figure 13. Screenshot of the mobile app data entry form.
6.3 Navigation Results In this section, we describe acceptability and satisfaction with the health navigation component using data
from both the surveys and qualitative interviews with participants, as well as the frequency, mode, and
content of navigator-participant interactions from the navigator monitoring system. We also discuss the
effect of navigation on adherence, retention, and HIV viral load using survey, clinical, and monitoring data
with participants, while contextualizing these findings with qualitative data from participants.

Strengthening the “Reach-Test-Treat-Retain” cascade for men who have sex with men in Guatemala: A pilot intervention” (EIR-HIV KPIS) 61
6.3.1 Acceptability and Satisfaction with Health Navigation Health navigation was highly acceptable across all intervention groups. Of the 374 participants enrolled
in the study, 97.3% (364/374) agreed to be contacted by a health navigator. Furthermore, during the 12-
month study period, 95.3% (347/364) had at least one interaction with their navigator, while the median
number of interactions per participant was 10 (range: 1-46).
In general, participants in all intervention groups were very satisfied with their health navigators, with
98.3% of the 354 participants that accepted navigation and completed the endline survey evaluating the
services provided by their navigator as either excellent or good. The vast majority of participants (98.6%)
reported being satisfied with their navigator, trusting them (94.6%), and believing that their navigator was
genuinely concerned with their wellbeing (96.9%) (Table 28). Participants often summed up their
experience with navigation similarly to the participant below,
They are [navigator] always ready to help…always asking me how I’m doing, sending me
messages...and they are always here with me at the clinic, making sure they are treating me well,
and that I know what’s going on. (26 yo, Group 3)
Furthermore, 98.0% of all participants reported that they would recommend navigators to others living
with HIV and 95.5% would have liked to continue receiving the support of a navigator. Although still very
high, satisfaction for participants from Group 2 who had been living with HIV for more than one year and
did not decentralize was marginally lower than other groups (Table 28). However, 92.7% from this group
still reported wanting to continue receiving the support of their navigator. Many participants from this
group valued the support and accompaniment provided by their navigator, as described below:
Yes, I received a lot of support and a lot of affection from them, which I liked a lot…I even asked
them if they could continue [being a navigator] with us…because yeah, they help, they help a lot,
every time I came to my appointments, they always reminded me one or two days before, not to
mention all the messages they send us… (31 yo, Group 2)
As this quote suggests, even stable patients who did not change clinic sites appreciated the appointment
reminders and seeing a friendly face at the clinic during visits.
Table 28. Participant Satisfaction with Navigators; Socio-behavioral Survey; n=354
Indicator Total % (N=354)
Group 1 % (N=122)
Group 2 % (N=124)
Group 3 % (N=108)
In general, how do you evaluate the attention provided by your navigator?
Excellent 85.3 85.2 82.9 88.0
Good 13.3 13.9 14.7 11.1
Normal 1.4 0.9 2.4 0.9
Bad 0.0 0.0 0.0 0.0
Satisfied with navigator 98.6 100.0 96.8 99.1
Trust navigator 94.6 98.4 89.5 96.3
Navigator provided good orientation to health services 96.9 98.4 92.7 100
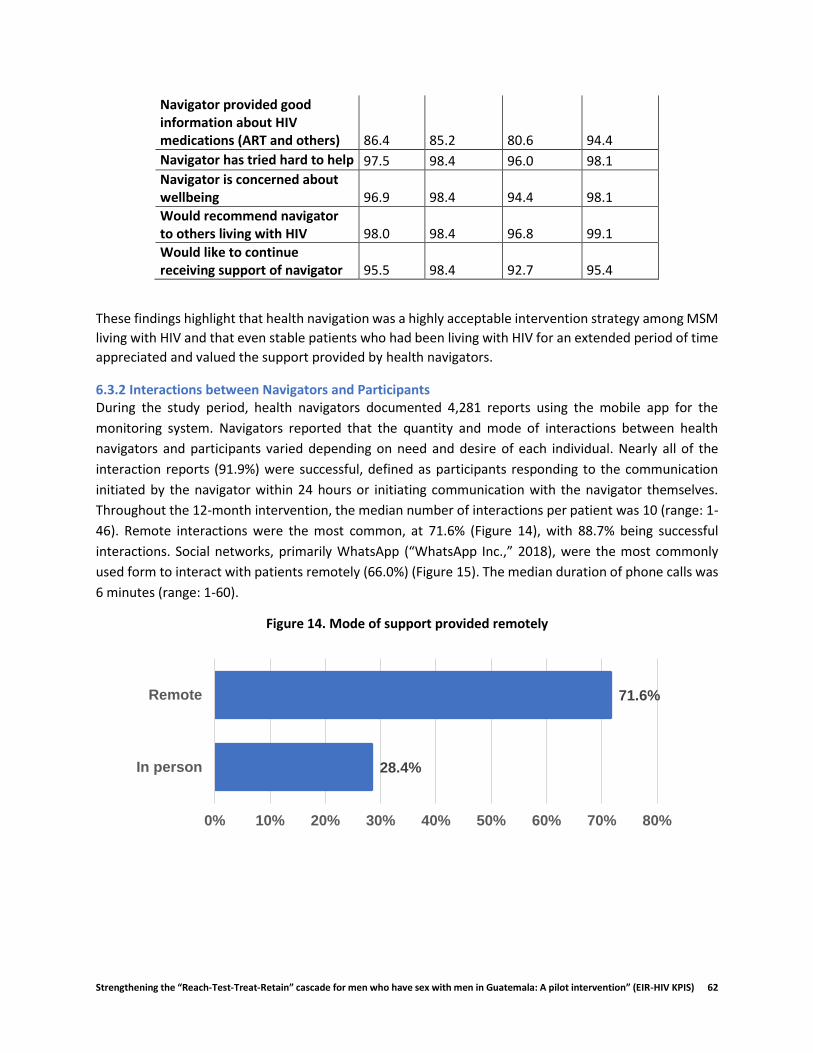
Strengthening the “Reach-Test-Treat-Retain” cascade for men who have sex with men in Guatemala: A pilot intervention” (EIR-HIV KPIS) 62
Navigator provided good information about HIV medications (ART and others) 86.4 85.2 80.6 94.4
Navigator has tried hard to help 97.5 98.4 96.0 98.1
Navigator is concerned about wellbeing 96.9 98.4 94.4 98.1
Would recommend navigator to others living with HIV 98.0 98.4 96.8 99.1
Would like to continue receiving support of navigator 95.5 98.4 92.7 95.4
These findings highlight that health navigation was a highly acceptable intervention strategy among MSM
living with HIV and that even stable patients who had been living with HIV for an extended period of time
appreciated and valued the support provided by health navigators.
6.3.2 Interactions between Navigators and Participants During the study period, health navigators documented 4,281 reports using the mobile app for the
monitoring system. Navigators reported that the quantity and mode of interactions between health
navigators and participants varied depending on need and desire of each individual. Nearly all of the
interaction reports (91.9%) were successful, defined as participants responding to the communication
initiated by the navigator within 24 hours or initiating communication with the navigator themselves.
Throughout the 12-month intervention, the median number of interactions per patient was 10 (range: 1-
46). Remote interactions were the most common, at 71.6% (Figure 14), with 88.7% being successful
interactions. Social networks, primarily WhatsApp (“WhatsApp Inc.,” 2018), were the most commonly
used form to interact with patients remotely (66.0%) (Figure 15). The median duration of phone calls was
6 minutes (range: 1-60).
Figure 14. Mode of support provided remotely
28.4%
71.6%
0% 10% 20% 30% 40% 50% 60% 70% 80%
In person
Remote
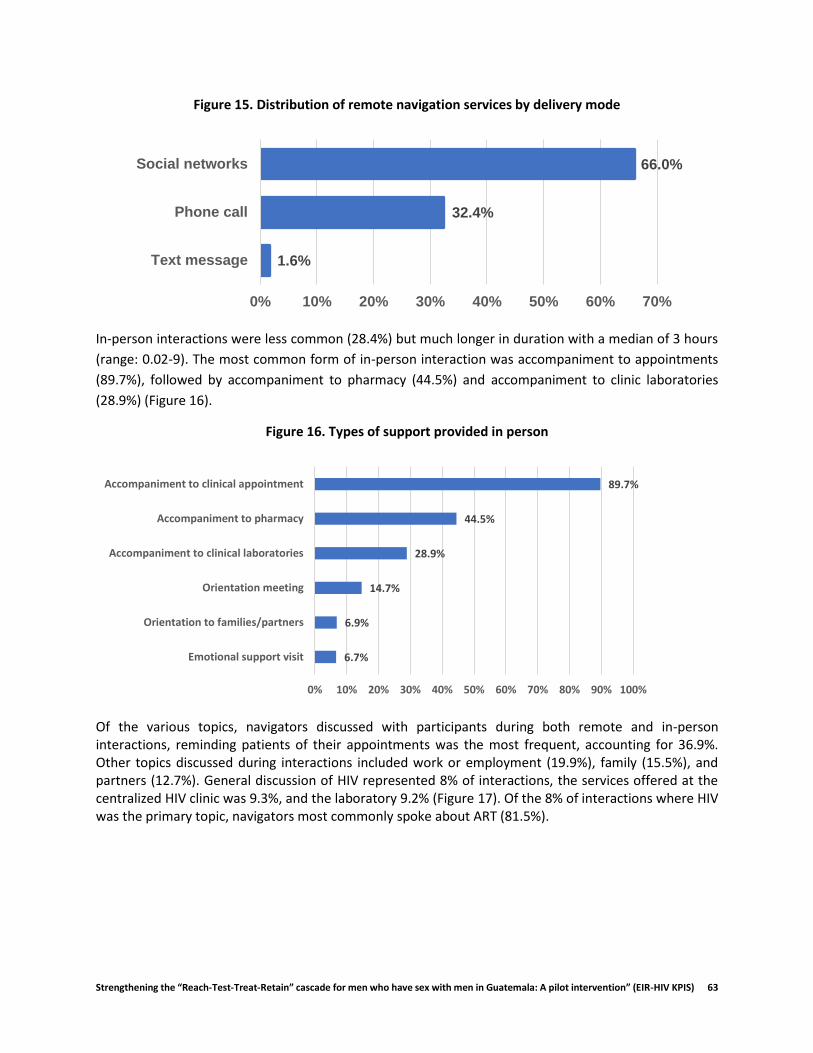
Strengthening the “Reach-Test-Treat-Retain” cascade for men who have sex with men in Guatemala: A pilot intervention” (EIR-HIV KPIS) 63
Figure 15. Distribution of remote navigation services by delivery mode
In-person interactions were less common (28.4%) but much longer in duration with a median of 3 hours
(range: 0.02-9). The most common form of in-person interaction was accompaniment to appointments
(89.7%), followed by accompaniment to pharmacy (44.5%) and accompaniment to clinic laboratories
(28.9%) (Figure 16).
Figure 16. Types of support provided in person
Of the various topics, navigators discussed with participants during both remote and in-person interactions, reminding patients of their appointments was the most frequent, accounting for 36.9%. Other topics discussed during interactions included work or employment (19.9%), family (15.5%), and partners (12.7%). General discussion of HIV represented 8% of interactions, the services offered at the centralized HIV clinic was 9.3%, and the laboratory 9.2% (Figure 17). Of the 8% of interactions where HIV was the primary topic, navigators most commonly spoke about ART (81.5%).
1.6%
32.4%
66.0%
0% 10% 20% 30% 40% 50% 60% 70%
Text message
Phone call
Social networks
6.7%
6.9%
14.7%
28.9%
44.5%
89.7%
0% 10% 20% 30% 40% 50% 60% 70% 80% 90% 100%
Emotional support visit
Orientation to families/partners
Orientation meeting
Accompaniment to clinical laboratories
Accompaniment to pharmacy
Accompaniment to clinical appointment
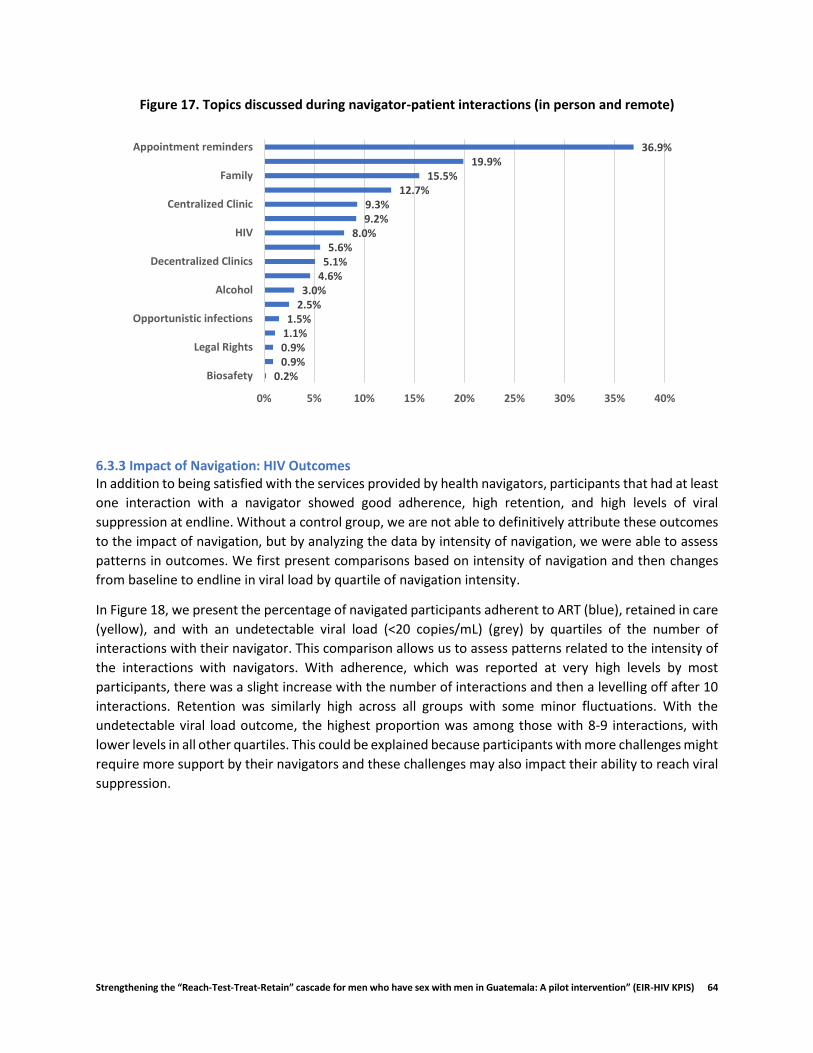
Strengthening the “Reach-Test-Treat-Retain” cascade for men who have sex with men in Guatemala: A pilot intervention” (EIR-HIV KPIS) 64
Figure 17. Topics discussed during navigator-patient interactions (in person and remote)
6.3.3 Impact of Navigation: HIV Outcomes In addition to being satisfied with the services provided by health navigators, participants that had at least
one interaction with a navigator showed good adherence, high retention, and high levels of viral
suppression at endline. Without a control group, we are not able to definitively attribute these outcomes
to the impact of navigation, but by analyzing the data by intensity of navigation, we were able to assess
patterns in outcomes. We first present comparisons based on intensity of navigation and then changes
from baseline to endline in viral load by quartile of navigation intensity.
In Figure 18, we present the percentage of navigated participants adherent to ART (blue), retained in care
(yellow), and with an undetectable viral load (<20 copies/mL) (grey) by quartiles of the number of
interactions with their navigator. This comparison allows us to assess patterns related to the intensity of
the interactions with navigators. With adherence, which was reported at very high levels by most
participants, there was a slight increase with the number of interactions and then a levelling off after 10
interactions. Retention was similarly high across all groups with some minor fluctuations. With the
undetectable viral load outcome, the highest proportion was among those with 8-9 interactions, with
lower levels in all other quartiles. This could be explained because participants with more challenges might
require more support by their navigators and these challenges may also impact their ability to reach viral
suppression.
0.2%0.9%0.9%1.1%1.5%
2.5%3.0%
4.6%5.1%5.6%
8.0%9.2%9.3%
12.7%15.5%
19.9%36.9%
0% 5% 10% 15% 20% 25% 30% 35% 40%
Biosafety
Legal Rights
Opportunistic infections
Alcohol
Decentralized Clinics
HIV
Centralized Clinic
Family
Appointment reminders
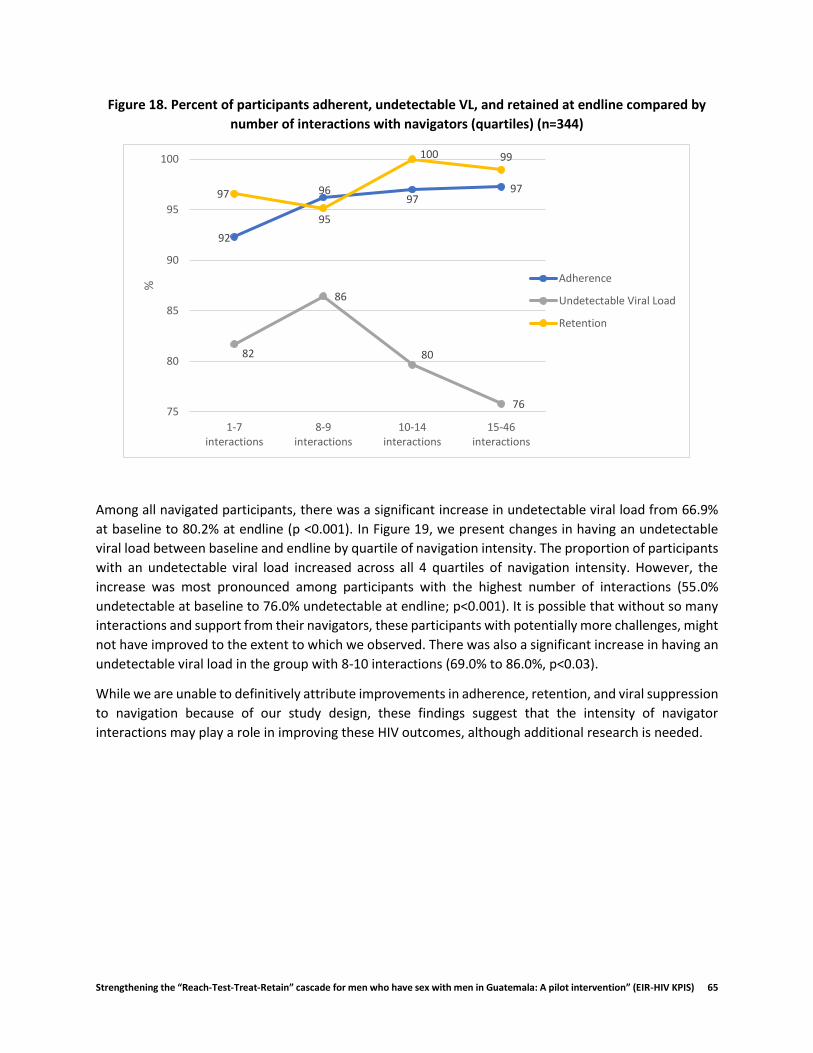
Strengthening the “Reach-Test-Treat-Retain” cascade for men who have sex with men in Guatemala: A pilot intervention” (EIR-HIV KPIS) 65
Figure 18. Percent of participants adherent, undetectable VL, and retained at endline compared by
number of interactions with navigators (quartiles) (n=344)
Among all navigated participants, there was a significant increase in undetectable viral load from 66.9%
at baseline to 80.2% at endline (p <0.001). In Figure 19, we present changes in having an undetectable
viral load between baseline and endline by quartile of navigation intensity. The proportion of participants
with an undetectable viral load increased across all 4 quartiles of navigation intensity. However, the
increase was most pronounced among participants with the highest number of interactions (55.0%
undetectable at baseline to 76.0% undetectable at endline; p<0.001). It is possible that without so many
interactions and support from their navigators, these participants with potentially more challenges, might
not have improved to the extent to which we observed. There was also a significant increase in having an
undetectable viral load in the group with 8-10 interactions (69.0% to 86.0%, p<0.03).
While we are unable to definitively attribute improvements in adherence, retention, and viral suppression
to navigation because of our study design, these findings suggest that the intensity of navigator
interactions may play a role in improving these HIV outcomes, although additional research is needed.
92
9697
97
82
86
80
76
97
95
100 99
75
80
85
90
95
100
1-7interactions
8-9interactions
10-14interactions
15-46interactions
%
Adherence
Undetectable Viral Load
Retention
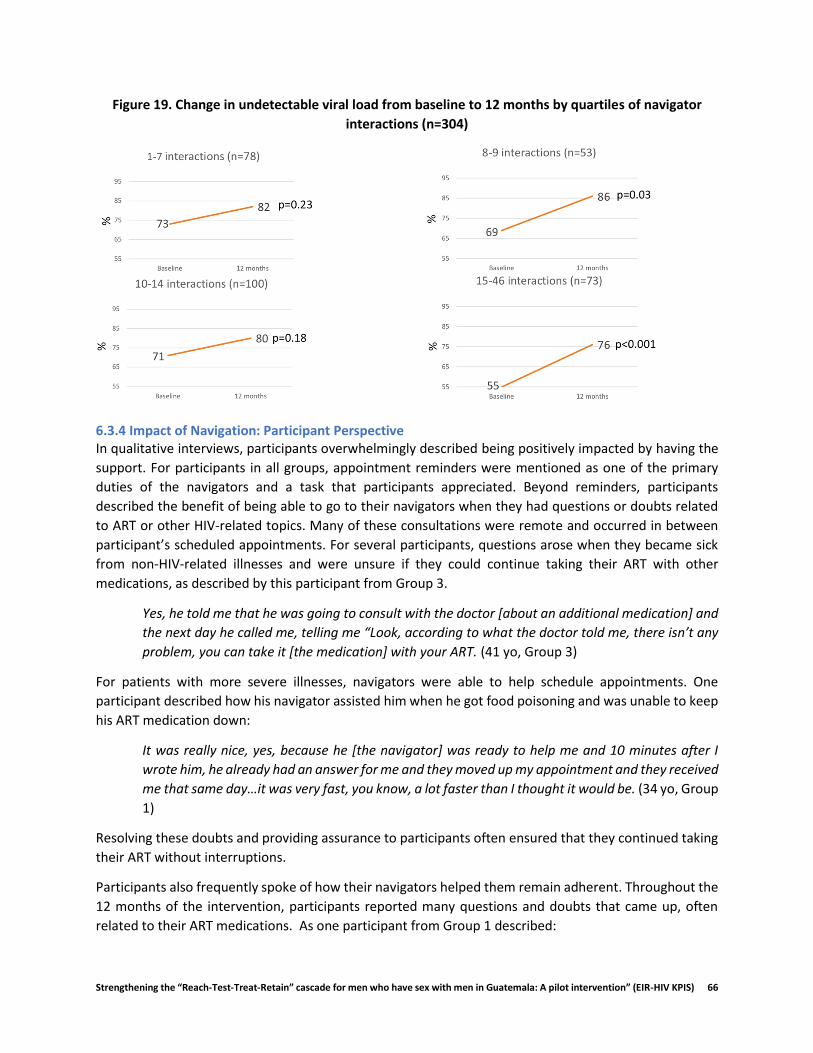
Strengthening the “Reach-Test-Treat-Retain” cascade for men who have sex with men in Guatemala: A pilot intervention” (EIR-HIV KPIS) 66
Figure 19. Change in undetectable viral load from baseline to 12 months by quartiles of navigator
interactions (n=304)
6.3.4 Impact of Navigation: Participant Perspective In qualitative interviews, participants overwhelmingly described being positively impacted by having the
support. For participants in all groups, appointment reminders were mentioned as one of the primary
duties of the navigators and a task that participants appreciated. Beyond reminders, participants
described the benefit of being able to go to their navigators when they had questions or doubts related
to ART or other HIV-related topics. Many of these consultations were remote and occurred in between
participant’s scheduled appointments. For several participants, questions arose when they became sick
from non-HIV-related illnesses and were unsure if they could continue taking their ART with other
medications, as described by this participant from Group 3.
Yes, he told me that he was going to consult with the doctor [about an additional medication] and
the next day he called me, telling me “Look, according to what the doctor told me, there isn’t any
problem, you can take it [the medication] with your ART. (41 yo, Group 3)
For patients with more severe illnesses, navigators were able to help schedule appointments. One
participant described how his navigator assisted him when he got food poisoning and was unable to keep
his ART medication down:
It was really nice, yes, because he [the navigator] was ready to help me and 10 minutes after I
wrote him, he already had an answer for me and they moved up my appointment and they received
me that same day…it was very fast, you know, a lot faster than I thought it would be. (34 yo, Group
1)
Resolving these doubts and providing assurance to participants often ensured that they continued taking
their ART without interruptions.
Participants also frequently spoke of how their navigators helped them remain adherent. Throughout the
12 months of the intervention, participants reported many questions and doubts that came up, often
related to their ART medications. As one participant from Group 1 described:
Strengthening the “Reach-Test-Treat-Retain” cascade for men who have sex with men in Guatemala: A pilot intervention” (EIR-HIV KPIS) 67
I got a really bad case of flu and I didn’t know what to do…so I wrote [the navigator] and he said
“yes, you can keep taking your medications [ART]”…because sometimes, especially in the
beginning, but even now, sometimes there are times when you’re not sure what to do. (41 yo,
Group 1)
This quote reflects the importance of having someone to contact when you are “not sure what to do”,
which can have a critical impact on adherence.
Participants from all groups also identified emotional support as a major contribution of navigation.
Participants appreciated receiving the motivational messages and greetings that many navigators sent
weekly. Many participants described how the emotional support they received from navigators when they
were feeling depressed or most vulnerable, even if provided remotely, had a positive impact on their
emotional wellbeing:
During the time that I was feeling really down, they [navigator] wrote me and asked me how I was
doing, if I felt better, and so they assumed the role of a friend in the moment that I most needed
it. (31 yo, Group 2)
Like I mentioned before, I was at the point of killing myself…I got really depressed because of the
situation I was in, when they [navigator], they helped me so much and I thank them, I thank them
and God for putting me back on the right path. (44 yo, Group 1)
While participants with weaker support networks often required more attention from navigators, patients
with partners or other forms of social support still described the benefits their navigators had on their
emotional wellbeing. One reason for this was that many felt more comfortable discussing the general
challenges of living with HIV and their diagnosis with their navigators than with their partners, family
members, or friends.
Even though I trust my partner 100%, there are times when you need someone else… because
sometimes you just feel bad and need someone to listen to you and understand what you’re going
through… (41 yo, Group 1)
In addition to providing support to participants, navigators were also often asked by participants to
provide support or a referral for a friend or partner. In one incident, a participant referred another friend
to his navigator because the friend said he was going to stop taking his ART:
I became friends with someone here in the waiting room and we would chat every once in a while
over social media and he was not doing well, I think he was depressed…and he didn’t want to
continue taking his treatment, not live or anything. So, I contacted my navigator to see what she
could do, to see if she could refer him to some place, and she did. She got him the help he needed
even though he wasn’t part of the project. (34 yo, Group 1)
The positive reputation of the navigators was also evident as several individuals at Hospital Roosevelt
(both part of the study and not) approached study team members requesting the services of a navigator
after hearing from friends and other patients of the benefits.
For participants who were decentralized, navigators provided much needed orientation to these new
clinics, as many participants were unfamiliar with them. This frequently included support in locating the
new clinics, providing a tour, and introducing participants to the clinic staff.
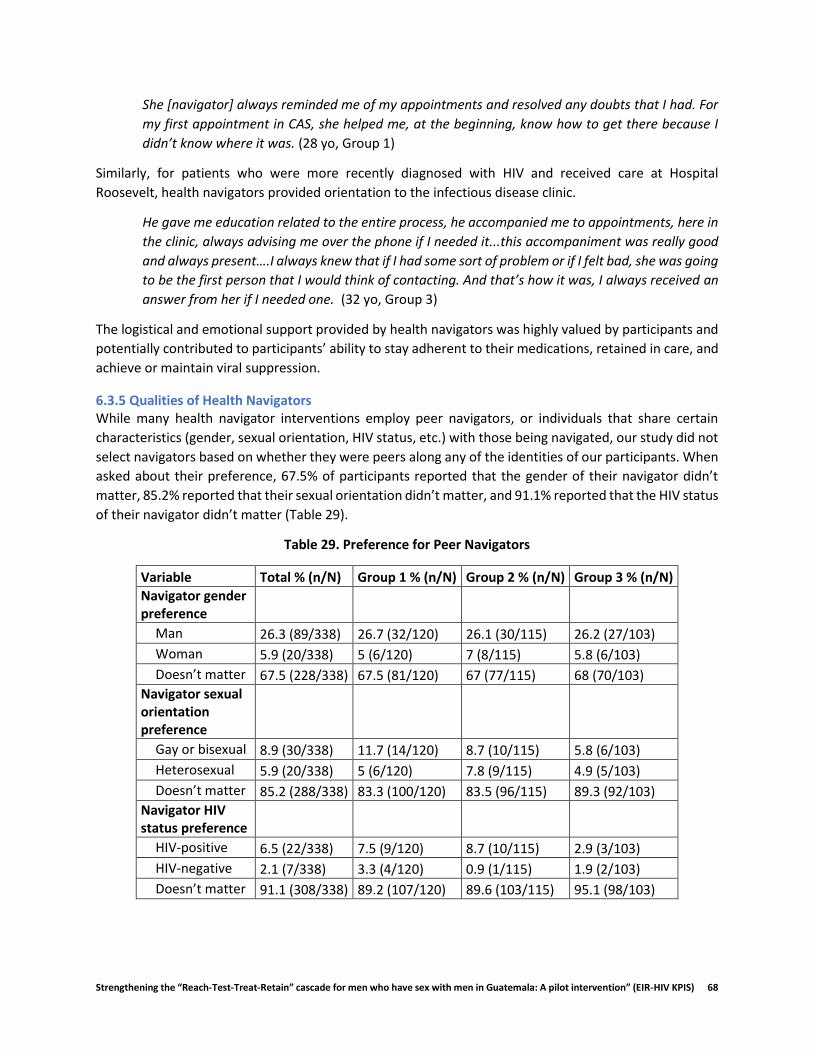
Strengthening the “Reach-Test-Treat-Retain” cascade for men who have sex with men in Guatemala: A pilot intervention” (EIR-HIV KPIS) 68
She [navigator] always reminded me of my appointments and resolved any doubts that I had. For
my first appointment in CAS, she helped me, at the beginning, know how to get there because I
didn’t know where it was. (28 yo, Group 1)
Similarly, for patients who were more recently diagnosed with HIV and received care at Hospital
Roosevelt, health navigators provided orientation to the infectious disease clinic.
He gave me education related to the entire process, he accompanied me to appointments, here in
the clinic, always advising me over the phone if I needed it...this accompaniment was really good
and always present….I always knew that if I had some sort of problem or if I felt bad, she was going
to be the first person that I would think of contacting. And that’s how it was, I always received an
answer from her if I needed one. (32 yo, Group 3)
The logistical and emotional support provided by health navigators was highly valued by participants and
potentially contributed to participants’ ability to stay adherent to their medications, retained in care, and
achieve or maintain viral suppression.
6.3.5 Qualities of Health Navigators While many health navigator interventions employ peer navigators, or individuals that share certain
characteristics (gender, sexual orientation, HIV status, etc.) with those being navigated, our study did not
select navigators based on whether they were peers along any of the identities of our participants. When
asked about their preference, 67.5% of participants reported that the gender of their navigator didn’t
matter, 85.2% reported that their sexual orientation didn’t matter, and 91.1% reported that the HIV status
of their navigator didn’t matter (Table 29).
Table 29. Preference for Peer Navigators
Variable Total % (n/N) Group 1 % (n/N) Group 2 % (n/N) Group 3 % (n/N)
Navigator gender preference
Man 26.3 (89/338) 26.7 (32/120) 26.1 (30/115) 26.2 (27/103)
Woman 5.9 (20/338) 5 (6/120) 7 (8/115) 5.8 (6/103)
Doesn’t matter 67.5 (228/338) 67.5 (81/120) 67 (77/115) 68 (70/103)
Navigator sexual orientation preference
Gay or bisexual 8.9 (30/338) 11.7 (14/120) 8.7 (10/115) 5.8 (6/103)
Heterosexual 5.9 (20/338) 5 (6/120) 7.8 (9/115) 4.9 (5/103)
Doesn’t matter 85.2 (288/338) 83.3 (100/120) 83.5 (96/115) 89.3 (92/103)
Navigator HIV status preference
HIV-positive 6.5 (22/338) 7.5 (9/120) 8.7 (10/115) 2.9 (3/103)
HIV-negative 2.1 (7/338) 3.3 (4/120) 0.9 (1/115) 1.9 (2/103)
Doesn’t matter 91.1 (308/338) 89.2 (107/120) 89.6 (103/115) 95.1 (98/103)

Strengthening the “Reach-Test-Treat-Retain” cascade for men who have sex with men in Guatemala: A pilot intervention” (EIR-HIV KPIS) 69
During qualitative interviews, many participants described the manner in which navigators treated
patients as being more important than any particular demographic characteristic they might have:
I don’t think any of that matters, what’s important is that they treat you well, you know? That you
get along well with them and they don’t discriminate against you. That’s what’s most important.
(34 yo, Group 1)
Nevertheless, some participants expressed opinions about the importance of certain characteristics.
Some believed that a female navigator would be easier to connect with and talk to about personal issues,
while others reported that gay or bisexual men would have similar experiences with stigma and isolation
from family and friends based on their sexual orientation, and would therefore be more equipped to
empathize with other gay and bisexual men. However, several also mentioned that they would prefer that
their navigator be heterosexual because of the perception that there would be a lack of confidentiality
among gay or bisexual navigators connected to the LGBTQ community.
I prefer a heterosexual, because you can trust them more, compared to someone from the same
[LGBTQ community]…so I prefer a heterosexual person…they’re more reserved and more
confidential. I just wouldn’t trust someone from the same [LGBTQ community]. (44 yo, Group 1)
Participants indicated that navigators should, however, possess certain qualities that they believed made
their navigators successful. These were often categorized into personal qualities, such as empathy,
patience, being non-judgmental, and friendly:
I think they should have four main qualities…love for what they do, respect for other people, well-
established values, both professional and social, and never involve personal feelings in the work
(37 yo, Group 1)
Participants also described professional qualities that navigators should have, including being
knowledgeable about HIV and the health system, confidential, well-organized, punctual, and a good
communicator.
More than anything knowledge [about HIV], and then organization, so that they are capable of
doing the tasks assigned to them. (43 yo, Group 3)
Our findings suggest that there is not one specific profile that makes a health navigator successful. Most
importantly, it seems, is that the navigator is able to make a personal connection with the participant and
gain their trust. As is discussed in the section below, navigators had a variety of strategies for ensuring
that participants felt comfortable confiding in them and going to them with questions or doubts.
6.3.6 Experiences of Health Navigators In qualitative interviews, health navigators described their motivations for becoming a navigator and the
benefits they received from the work. Many reported enjoying the opportunity to provide tangible
support to MSM living with HIV. They received personal and professional satisfaction when they were able
to assist participants to overcome obstacles.
[It feels] excellent, excellent, yes, very satisfying to be a navigator. With motivation to keep
working, because there’s so much work to do. [My favorite part] is helping other people.
Strengthening the “Reach-Test-Treat-Retain” cascade for men who have sex with men in Guatemala: A pilot intervention” (EIR-HIV KPIS) 70
Additionally, many felt that the hands-on experience they gained as a navigator would benefit them
professionally in the future.
However, navigators also reported many challenges to their work. The workdays were often long,
especially when they were linking a new patient to care at Hospital Roosevelt (which often started at
6:00am). In addition to accompaniment to clinic appointments, which occurred during the day, navigators
would often respond to calls or messages from participants late into the evening.
There came a time when I felt very overwhelmed…and I started to be in a bad mood at home, and
I never had time for my wife and my kids…I would just get home and want to go to sleep…and so
that went to a certain point, the first few months [of the project].
Navigators often had to take time to get accustomed to this demanding work schedule and balance the
various needs of their many patients.
Based on their experience working with participants, health navigators identified a variety of factors that
they believed influenced the level and type of support that participants required. One key factor identified
by navigators was participants’ general level of social support, including whether or not they had disclosed
their sexual orientation to family and friends and whether or not they had a partner. Other factors were
related to individual behaviors and sociodemographic context, such as the use of substances,
socioeconomic level, involvement in sex work, low self-esteem, and other conditions related to mental
health.
In part, when patients require more support, it’s because their diagnosis impacts them emotionally
much more, and the impact is related to the social context of each patient. For example, if he’s a
closeted MSM, where no one from his family or his circle knows, it’s much more difficult compared
to a guy that has gay friends that share the same environment, environments with other gay men
or MSM.
These same characteristics were relevant for participants from all groups – those recently diagnosed and
those living with HIV for years. In fact, several navigators discussed participants who were diagnosed with
HIV years ago but had never truly accepted their diagnosis – many of these participants did not have basic
knowledge of HIV (viral load, CD4, ARV, etc.). Several participants did not feel empowered to look for
assistance at the HIV clinic before their navigators provided orientation and support. These findings
support the benefits health navigators may provide even for MSM who are stable in HIV care.
In our team’s previous work with health navigation, we identified codependence as a potential challenge
to this model, whereby the participant could become too dependent on the support of the navigator
beyond the parameters of the intended relationship (Davis et al., 2017). Navigators were therefore
encouraged to implement tactics to avoid codependence with participants. One of their
recommendations included defining a schedule of availability (when navigators were willing to respond
to calls/texts). For our study, this was generally from 6:00am to 10:00pm. They also suggested defining
the relationship between navigator and participant from the beginning. Navigators often did this during
their first encounter with participants when explaining their roles and responsibilities to participants.
Navigators were also sure to emphasize how navigator support would only be available for a limited time.
I think that one of the main things is making it clear what type of relationship you’re going to have
with the patient. It’s a relationship of support, it’s professional, I’m your guide, I’ll be able to orient
Strengthening the “Reach-Test-Treat-Retain” cascade for men who have sex with men in Guatemala: A pilot intervention” (EIR-HIV KPIS) 71
you to the process. If you need to talk about something that’s bothering you or making you feel
bad, you can…so it [the relationship] can almost seem like a friendship, but I’m not your friend,
because then they can misinterpret the relationship…so defining really well the relationship at the
beginning and telling them that this will end after a certain amount of time.
Another important strategy that navigators implemented throughout the study was working with
participants to generate a sense of responsibility for their HIV treatment. This included simple tasks like
asking them to meet at the clinic (instead of always offering to accompany them from the bus terminal);
ensuring that the participants were the ones talking with and interacting with the medical providers about
their questions or worries; and holding participants responsible for completing relevant clinic paperwork
and turning in their medical records to the appropriate clinic station. According to the navigators, the
most important strategy was ensuring that participants were a part of the process and that navigators did
not do everything for them.
Yes, generating a sense of responsibility in them is important, no? Make them part of the process,
because if not, they’re not going to understand it. So especially for the first two, three
appointments, try to arrive before them, but then after, make sure they’re getting there first,
signing in, and incorporating into the clinic process so that they know their responsible for these
tasks.
Even with strategies in place, the emotional burden experienced by navigators was heavy. Many
navigators described how, while they attempted to maintain a professional relationship with all their
participants, certain difficult situations would affect them personally, causing them to be in a bad mood
at home, or to isolate themselves from family and friends. On the topic of avoiding burnout, navigators
spoke of the importance of realizing that as an individual navigator, they are not responsible for saving
the life of the participant or resolving every issue they might have.
Yes, I think it’s really important that they take this weight off of navigators…it’s not the
responsibility of the navigator to solve every problem the patient has. It’s not my job to help him
get a job, or whatever other problem they might have.
Navigators also mentioned the importance of setting aside time for family, partners, friends, and
themselves. For some, this included time to exercise, walk, go to the movies, volunteer, and travel.
For future navigation projects, navigators recommended additional trainings related to ART, including
how to respond to common questions about medication interactions or missed doses. They also
suggested better defining expectations of their roles and responsibilities as navigators. For example, when
the project first started, they knew they needed to communicate regularly with their assigned participants
but were unsure exactly how often. This is also evident in the varied frequency of communication reported
by each navigator – some communicated with participants multiple times per week, while others only
communicated with participants on a monthly basis or around the time of their clinic appointments.
In order to manage the emotional burden described above, navigators also requested more psychological
support for themselves in the form of support groups or individual counseling. Although navigators
reported that they supported one another when one had a question or problem, they also suggested
additional team-building opportunities, such as recreational activities with just navigators and
supervisors, in order to improve trust and team dynamics.
Strengthening the “Reach-Test-Treat-Retain” cascade for men who have sex with men in Guatemala: A pilot intervention” (EIR-HIV KPIS) 72
6.4 Voluntary Partner Referral Description As part of the navigation component, navigators offered voluntary partner referral (VPR) services for the
sexual partners of participants. This component reflects the growing interest in the partners of individuals
who are known to be living with HIV as a target population for testing, linkage to care and care and
treatment services (WHO, 2016). Intervention participants were offered both passive and active referral
services. In a passive referral, the health navigator provides the participant with information about the
importance of HIV testing and how their partner can access testing, treatment, and prevention services.
In an active or accompanied referral, the navigator accompanies the participant or the partner to
Roosevelt, one of the VICITS clinics, or another site to complete HIV testing. Navigators were instructed
to offer VPR to all participants with stable partners with an unknown or negative HIV status; participants
could choose whether or not to participate and whether they preferred active or passive referral. For
participants who had not yet disclosed their HIV diagnosis to their partners, navigators also offered
support with disclosure.
Navigators recorded information relevant to VPR, including whether or not participants had a formal or
casual partner, the partner’s HIV status, if known, and whether or not partners knew of the participant’s
positive HIV diagnosis. Navigators also recorded whether or not they offered partner referral to
participants, whether or not partners were tested for HIV, and the results of HIV testing. In most cases,
navigators documented the VPR process for just 1 partner per participant. These data were recorded and
updated throughout the twelve-month navigation period in the navigation monitoring system. We
analyzed the navigator database, results from the sociodemographic surveys at baseline and endline, as
well as midline and endline qualitative interviews to assess the effectiveness of the VPR process, and to
identify challenges navigators faced in partner referral, strategies that navigators used to overcome these
challenges and other factors that may facilitate or act a barrier to partner referral by participants.
6.5 Voluntary Partner Referral Results We first present findings from the baseline and endline socio-behavioral surveys, which included
questions on whether or not participants had referred a partner for HIV testing, care, or other services in
the previous year. We then present findings from the VPR database that tracked navigator reports of
referrals.
6.5.1 Participant-reported VPR Table 30 shows the number and percentages of participants with stable partners, stable partners who
knew about the respective participant’s HIV status, and participants who referred a partner to HIV testing,
care, and services at endline and at baseline. Overall, a higher percentage of participants referred their
partners in the previous year to testing, care, and to other HIV-related services, care, and to other HIV-
related services at endline than at baseline. Over one-third (38.0%, n=122) of participants had referred
their partners to HIV testing in the previous year at endline, compared to 33.8% (n=119) of participants at
baseline; 8.7% (n=28) of participants had referred their partners to HIV care in the previous year at
endline, compared to 5.1% (n=19) of participants at baseline, and 22.4% (n=72) of participants had
referred their partners to other HIV related services in the previous year at endline, compared to 9.6%
(n=36) of participants at baseline. A higher percentage of participants reported that their stable partners
knew about their HIV status at endline (73.2%, n=139) than at baseline (59.2%, n=161). As noted above,
these partner referrals by participants were not necessarily initiated by navigators, and so are not
necessarily a reflection of the effectiveness of the VPR component of our intervention.

Strengthening the “Reach-Test-Treat-Retain” cascade for men who have sex with men in Guatemala: A pilot intervention” (EIR-HIV KPIS) 73
Table 30. Voluntary Partner Referral (Baseline and 12 months)
Variable Baseline % (n/N) 12 months % (n/N)
Ever had stable partner or had stable partner in last year 72.7 (272/374) 51.8 (191/369)
Stable partner knows participant’s HIV status 59.2 (161/272) 73.2 (139/190)
Participant referred partner to HIV testing within last year 33.8 (119/374) 38.0 (122/321)
Participant referred partner to HIV care within last year 5.1 (19/374) 8.7 (28/321)
Participant referred partner for other HIV related services within last year 9.6 (36/374) 22.4 (72/322)
At endline, a higher percentage of participants in Group 1 (decentralized patients) referred their partners
to HIV testing services and to other HIV-related services (not HIV testing or care) than in groups 2 or 3.
Nearly forty percent (38.7%,n=48) of participants in Group 1 had referred their partners to HIV testing
services compared to 24.8% (n=41) of participants in group 2, and 36.6% (n=41) of participants in group
3. One quarter (24.2%, n=30) in Group 1 had referred their partners to other HIV-related services
compared to 16.5% (n=22) of participants in Group 2, and 17.9% (n=20) of participants in Group 3. Those
who talked to their navigators every day reported more partner referral for testing, treatment, and other
services than those who spoke to their navigators less frequently, suggesting that navigation could have
contributed to the reported increases in these indicators. Table 31 shows the relationships between
certain intervention components and partner referral by participant.
Table 31. Differences in VPR by Study Group and Frequency of Navigator Communication
Variable
Referred a partner to HIV testing services % (n/N)
Referred partner to HIV care % (n/N)
Referred partner to other HIV services % (n/N)
Study Group
Group 1 38.7 (48/124) 7.3 (9/124) 24.2 (30/124)
Group 2 24.8 (33/133) 6.8 (9/133) 16.5 (22/133)
Group 3 36.6 (41/112) 8.9 (10/112) 17.9 (20/112)
Frequency of navigator communication
Everyday 57.1 (8/14) 14.3 (2/14) 28.6 (4/14)
2-6 times per week 32.2 (19/59) 6.8 (4/59) 15.3 (9/59)
Once a week 37.1 (26/70) 8.6 (6/70) 24.3 (17/70)
Once every 2 weeks 28.2 (22/78) 2.6 (2/78) 16.7 (12/78)
Once a month 33.6 (43/128) 10.2 (13/128) 21.9 (28/128)
6.5.2 Navigator-reported VPR Of the 367 participants whose data were recorded in the navigator database, 136 (37.1%) reported having
had a stable partner at some point during the 12-month navigation period. Of those with stable partners,
the majority (77.2%, n=105) reported that all stable partners knew of the participant’s HIV status. With
regard to the HIV status of stable partners, 29.4% (n=40) of participants reported that all stable partners
were HIV positive, and 70.6% (n=95) had at least one partner with either unknown or negative HIV status.

Strengthening the “Reach-Test-Treat-Retain” cascade for men who have sex with men in Guatemala: A pilot intervention” (EIR-HIV KPIS) 74
Of the 95 participants with stable partners who had negative or unknown HIV status, 91 (95.8%) were
offered VPR, reflecting high coverage for the target population of this strategy. The majority of these
participants (65.9%, n=60) had partners who received an HIV test after offering VPR to the participant,
11.0% (n=10) only had partners who did not get tested, and for 23.1% (n=21) it was not known whether
any partner of the participant was tested. Of the 60 partners who received an HIV test, 59 tested negative
for HIV, and one partner’s result was not disclosed to the navigator.
Navigators also recorded whether or not participants reported having casual partners during the last year
of navigation. Of the 212 participants with information about casual partners, 29 (13.7%) reported having
a casual partner in the last year and 8 (3.8%) reported having only a casual partner or partners and no
stable partner during that time. Because VPR data were only collected for one partner at a time, only
those with only casual partners, and no stable partners had further data recorded about VPR. Of the 8
participants with only a casual partner, only one (12.5%) had a casual partner who knew about the
participant’s diagnosis. Three (37.5%) were offered passive referral for their casual partners, and, of these
referrals, one partner (33.3%) was tested for HIV, with a negative result.
In summary, 103 participants reported having stable or casual partners with a negative or unknown HIV
status to their navigators. Navigators offered VPR to 91.3% of these participants. Of the referred partners,
64.9% completed an HIV test, however all results were negative.
6.5.3 Challenges to Voluntary Partner Referral
Casual Partners One challenge that our team faced in carrying out VPR was the casual nature of many participants’
relationships. While only 30 participants reported having casual partners to their navigators, over half of
the participants in qualitative interviews (17/29) reported having casual sexual partners, either instead of
or in addition to a stable partner. Casual partners were often anonymous partners and lasted only one
night, with participants choosing not to keep in contact after being with them. One participant described
the fleeting nature of his sexual encounters:
Without involving…emotions, or exchanging telephone numbers, or continuing with
communication afterwards, nothing…only a sexual encounter…sporadic, yes, casual.” (Group 1,
Age 47).
Given that VPR requires both contacting and communicating with the partner, casual partners are a more challenging population to reach with this approach. In qualitative interviews, most participants with casual partners reported that they did not speak to their
partners about HIV or reveal their status but did take measures (such as using condoms) to protect
themselves and their partners. One participant described his reasoning for not telling his casual partner
about his status:
I feel like it’s not, it’s not necessary to tell them about my diagnosis… I would have to have a lot of
trust in a person and spend a lot of time with them to tell that that, I think that you can’t tell just
anyone about it (Group 2, Age 38).
This participant told the interviewer that for a stable partner, however, he would consider disclosing his
diagnosis.
Strengthening the “Reach-Test-Treat-Retain” cascade for men who have sex with men in Guatemala: A pilot intervention” (EIR-HIV KPIS) 75
Disclosure of partners to navigators In qualitative interviews, participants also described that they did not always reveal to their navigators
that they had a partner or partners, especially in the case of casual partners. Some participants explicitly
said in their interviews that their navigator did not know about their partners. For example, one
participant talking about his casual partners told the interviewer,
No, I didn’t mention to [my navigator] that I had a partner, I told her that I didn’t have a partner,
and that I will always continue without a partner,” (Group 3, Age 46).
Other participants mentioned relationships in interviews despite the fact that no stable or casual partner
was recorded in the navigator database. This was more common for casual partners than for stable
partners. Some participants who did not initially reveal their relationships to their navigators did
eventually tell their navigators about their partners, reflecting that VPR is a process that can take time,
especially as the patient develops trust with the navigator.
Resistance to VPR According to comments in the navigator database, some participants avoided the topic of partner referral
or stopped responding to navigators when the navigators brought it up. Others who were offered VPR
from navigators chose not to pass the information along to their partners because they did not want to
disclose or risk disclosing their HIV status. One participant went into greater depth as to why he did not
want to refer either of his stable partners to HIV testing during a qualitative interview:
I don’t want to take responsibility, for something that they tell me, look you gave me this, it’s your
fault I have this…because maybe I didn’t even get them sick…but they assume because I
recommended, that now they have an illness… when you tell them, go get a test done, and in the
worst cases, it comes out positive, they’re going to believe that maybe I infected them, or it was
my fault… (Group 2, Age 52).
The participant also felt that he “can’t pressure someone to go” to get tested, and that he had to respect
his partners’ privacy. Triangulating this finding, the participant’s navigator also noted that although he did
offer partner referral, the participant was very closed off to talking about the topic.
Strengthening the “Reach-Test-Treat-Retain” cascade for men who have sex with men in Guatemala: A pilot intervention” (EIR-HIV KPIS) 76
6.6 Conclusions Health navigation is a highly acceptable intervention strategy among MSM living with HIV, including
among stable patients who have been living with HIV for an extended period of time. Health navigation
may facilitate achieving and maintaining viral suppression. Those that receive more interactions with their
navigators may experience greater improvements in viral suppression. Trust is essential to effective
navigation, especially in the case of voluntary partner referral, which requires trust between the navigator
and participant.
The majority of navigator-participant interactions occurred remotely through instant messaging
application WhastApp, lasted 6 minutes, were most commonly related to appointment reminders, and
covered both HIV and non-HIV related topics. Navigators provided real-time remote support in a broad
range of topics, well beyond HIV. Appointment reminders, employment, and interpersonal relationships
were the three main topics discussed during navigator-participant interactions. How navigators treat
participants is more important than the characteristics of the navigator, such as gender, sexual
orientation, and HIV status. The level and type of support that participants require from navigators
depends on a variety of factors, including having disclosed sexual orientation to family and friends, general
level of social support, if they had a partner, the use of substances, socioeconomic level, involvement in
sex work, religion, low self-esteem and other conditions related to mental health. Navigators were
successful in connecting at least some participants to HIV testing, which is the first step in the VPR cascade.
6.7Key Findings
HIV is one of many topics on the minds of MSM living with HIV. Training navigators to not only have a solid command of HIV-related information, but also be prepared to provide support in other topics, in particular those related to family, partners, and work could help ensure they are better prepared to address participant concerns.
Screening the needs of patients to determine the intensity of navigation support could ensure navigators’ efforts are channeled where they are needed most and resources are used most efficiently.
Real time monitoring systems allows for timely identification of implementation achievements and challenges as well as monitoring key results and outcomes. Integrating more extensive monitoring of VPR into the monitoring system would enhance the documentation of that process.
Many participants mentioned during qualitative interviews that they would have preferred to have had more contact with their navigators. Increasing the frequency of contact with navigators may allow for a closer, more trusting relationship, which may more easily facilitate disclosure of partners/relationship status and partner referral.
On the other hand, it is important for program managers to establish boundaries and parameters for the navigator role and monitor how well navigators and participants adhere to them.
Developing more tailored and intense training for navigators in VPR implementation and documentation may help increase and improve VPR.
Strengthening the “Reach-Test-Treat-Retain” cascade for men who have sex with men in Guatemala: A pilot intervention” (EIR-HIV KPIS) 77
6.8 References Akolo, C., Baer, J., Bahattacharjee, P., Barton, K., DiCarlo, M., Kersten, S., … White, B. (2017).
Implementation guide: Peer Navigation for Key Populations. Washington, DC:
Bradford, J. B., Coleman, S., & Cunningham, W. (2007). HIV System Navigation: An emerging model to improve HIV care access. AIDS Patient Care STDS, 21 Suppl 1(s1), S49-58. http://doi.org/10.1089/apc.2007.9987
Davis, D. A., Aguilar, J. M., Arandi, C. G., Northbrook, S., Loya-Montiel, M. I., Morales-Miranda, S., & Barrington, C. (2017). “Oh, I’m Not Alone”: Experiences of HIV-Positive Men Who Have Sex With Men in a Health Navigation Program to Promote Timely Linkage to Care in Guatemala City. AIDS Education and Prevention, 29(6), 554–566. http://doi.org/10.1521/aeap.2017.29.6.554
Hartung, C., Lerer, A., Anokwa, Y., Tseng, C., Brunette, W., & Borriello, G. (2010). Open Data Kit: Tools to Build Information Services for Developing Regions. In Proceedings of the 4th ACM/IEEE International Conference on Information and Communication Technologies and Development - ICTD ’10 (pp. 1–12). http://doi.org/10.1145/2369220.2369236
Loya-Montiel, M. I., Davis, D. A., Aguilar-Martínez, J. M., Paz Bailey, O. A., Morales-Miranda, S., Alvis-Estrada, J. P., … Barrington, C. (2018). Making the Link: A Pilot Health Navigation Intervention to Improve Timely Linkage to Care for Men Who have Sex with Men and Transgender Women Recently Diagnosed with HIV in Guatemala City. AIDS and Behavior. http://doi.org/10.1007/s10461-018-2328-6
Thompson, M. A., Mugavero, M. J., Amico, K. R., & Cargill, V. A. (2012). Annals of Internal Medicine Clinical Guideline Guidelines for Improving Entry Into and Retention in Care and Antiretroviral Adherence for Persons With HIV : Evidence-Based Recommendations From an International Association of Physicians in AIDS Care Panel. Anales de Medicina Interna, 156(11), 817–833. http://doi.org/10.7326/0003-4819-156-11-201206050-00419
WhatsApp Inc. (2018). Menlo Park.
WHO. (2016). Guidelines on HIV Self-Testing and Partner Notification, (December), 104. Retrieved from http://www.who.int/hiv/pub/vct/hiv-self-testing-guidelines/en/

Strengthening the “Reach-Test-Treat-Retain” cascade for men who have sex with men in Guatemala: A pilot intervention” (EIR-HIV KPIS) 78
7. EMOTIONAL WELLBEING
7.1 Description The emotional burden of HIV diagnosis and the implications of managing life with HIV over time can affect
retention in care and adherence to ART. The time period when a person is diagnosed or re-engaged with
care (among those who have abandoned) is a key opportunity to offer emotional support and address
fears, doubts, feelings and blame. In response to this need, we developed and implemented a strategy
called “Emotional Wellbeing” (EW) to promote the process of acceptance, mental health, retention in HIV
care, adherence to ART, and viral suppression among participants in Group 3 who were recently diagnosed
or re-engaged with care within the last year at the Roosevelt Hospital.
The EW component was an individual-level strategy facilitated by a trained psychologist. We adapted the
EW implementation manual based on two intervention models used in past research studies, one with
female sex workers living with HIV in the Dominican Republic (called Abriendo Puertas) (Donastorg et al.
2014; “Enlaces Por La Salud Intervention Guide” 2014; “Modelo de Intervención Terapéutico ‘Abriendo
Puertas’: Manual de Consejería” 2014) and the other with Latino MSM and transgender women in North
Carolina (called “Enlaces por la Salud). Based on findings from the qualitative interviews conducted for
Aim 1, we designed an implementation manual with 4 counseling sessions including:
- Session 1: Social support and stigma and discrimination
- Session 2: Adherence, substance use, HIV information
- Session 3: Sexual health, disclosure, sexual partnerships
- Session 4: Life plan
For each session, the manual included a methodological guide along with suggested exercises that allow
for flexible implementation and adjustments based on the participants needs. We also included a self-
esteem scale (Rosenberg 1965), which is a cross-cutting theme in the EW strategy, and other tools to
improve self-esteem.
Each EW session lasted approximately one hour. The sessions were usually conducted on the same day as
the participants’ medical appointments, though some came between appointments based on their
availability or emotional needs. During each session, the psychologist and the participant identified
situations that may be causing worry or concern and identified appropriate strategies to address these
situations. The EW sessions were designed to be flexible and the session content and order could be
changed in response to participant needs.
7.2 Results
7.2.1 Acceptance and participation
All recently diagnosed and re-engaged participants (Group 3) were offered the EW component during
recruitment. Out of 112 eligible participants who enrolled in the study, the majority (n=96, 85.7%)
accepted participation in the EW component while the rest declined (n=16, 14.3%) (Table 32, Figure 20).
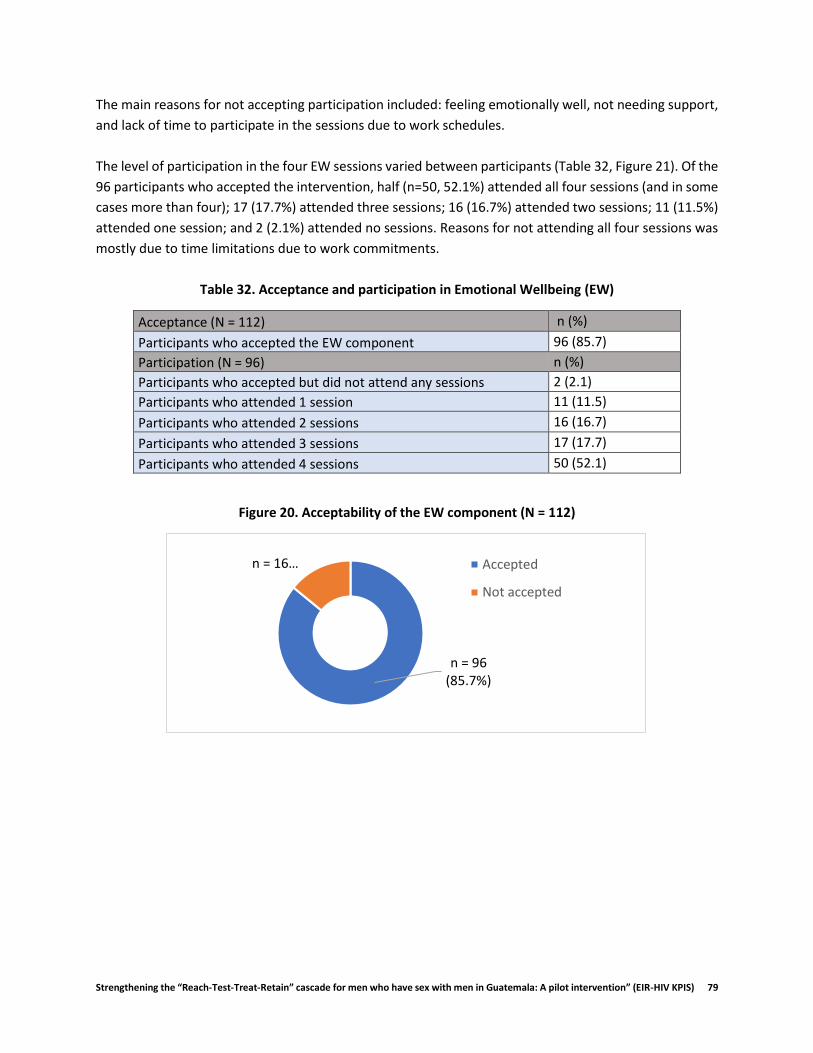
Strengthening the “Reach-Test-Treat-Retain” cascade for men who have sex with men in Guatemala: A pilot intervention” (EIR-HIV KPIS) 79
The main reasons for not accepting participation included: feeling emotionally well, not needing support,
and lack of time to participate in the sessions due to work schedules.
The level of participation in the four EW sessions varied between participants (Table 32, Figure 21). Of the
96 participants who accepted the intervention, half (n=50, 52.1%) attended all four sessions (and in some
cases more than four); 17 (17.7%) attended three sessions; 16 (16.7%) attended two sessions; 11 (11.5%)
attended one session; and 2 (2.1%) attended no sessions. Reasons for not attending all four sessions was
mostly due to time limitations due to work commitments.
Table 32. Acceptance and participation in Emotional Wellbeing (EW)
Acceptance (N = 112) n (%)
Participants who accepted the EW component 96 (85.7)
Participation (N = 96) n (%)
Participants who accepted but did not attend any sessions 2 (2.1)
Participants who attended 1 session 11 (11.5)
Participants who attended 2 sessions 16 (16.7)
Participants who attended 3 sessions 17 (17.7)
Participants who attended 4 sessions 50 (52.1)
Figure 20. Acceptability of the EW component (N = 112)
n = 96(85.7%)
n = 16… Accepted
Not accepted

Strengthening the “Reach-Test-Treat-Retain” cascade for men who have sex with men in Guatemala: A pilot intervention” (EIR-HIV KPIS) 80
Figure 21. Level of participation in the EW component (N = 96)
7.2.2 Satisfaction At endline, we assessed participants’ experiences in the EW strategy . All participants (n=9) expressed
satisfaction with the overall experience. A 23-year-old participant expressed the following,
Well, [the experience was] highly satisfactory, well, because [the psychologist] always advised
you…more than anything and she, she talks to you about topics that you, may not have ever looked
into. (23 yo, Group 3)
Participants indicated that they were able to learn and clear up doubts about topics including adherence,
how ART functions, and disclosure of HIV.
Other participants were satisfied because they appreciated having a space where they could freely express
their emotions and learn about strategies to help find solutions to their problems and challenges and learn
how to feel better emotionally managing their life with HIV. For example, a 40-year-old participant
explained how learning about the Guatemalan HIV law in the context of the EW intervention helped him
emotionally,
I learned to look at things more positively, in terms of the details of life, right? And evaluate…who
should know, who should not. We have a law that supports us, and we have the right to
confidentiality and well, this helped me a lot, learning about this. I felt more comfortable and
relaxed. (40 yo, Group 3)
Participants who lacked people they could trust and speak openly with talked about how in the EW
sessions they could express themselves emotionally without fear of being judged, critiqued or rejected,
It helps you, well, express myself as I, I never had expressed myself and to feel free of fear and
shame… (20 yo, Group 3).
n = 11 (11.5%)
n = 16(17.6%)
n = 17(16.7%)
n = 50(52.1%)
n = 2 (2.1%)
1 Session 2 Sessions 3 Sessions 4 Sessions 0 Sessions

Strengthening the “Reach-Test-Treat-Retain” cascade for men who have sex with men in Guatemala: A pilot intervention” (EIR-HIV KPIS) 81
The empathy that was exchanged in the sessions facilitated participants’ active engagement in the
sessions .
The participants also appreciated that the sessions provided an opportunity to reflect on their lives and
develop or revisit their life plans. For example, with the support of the psychologist, a 25-year-old
participant took on a very positive outlook towards his life plan,
What I don’t want is to die. I have many goals, I have many objectives and…I try to see myself in
the future…and remember that here (at Roosevelt) they always tell me I am a normal person, that
I am, that I am a successful person and I am going to achieve my dreams and my goals and that
my life has not stopped (25 yo, Group 3).
Other participants mentioned that they made positive changes in their lives, like a 40-year-old who
explained that the sessions had helped him, “feel secure about myself, acceptance [of his diagnosis],
improve management of the condition, improve dynamics with a partner and sexual activity.” Other
participants adopted healthy behaviors like reducing their smoking and safe sex behaviors as a result of
their participation in the EW sessions.
7.2.3 Key themes from EW Regarding the context of the EW sessions, several participants commented that all the themes were
important. Several themes were mentioned as being especially relevant or helpful. The theme of self-
esteem was one of the most important topics covered in the EW sessions. A 46-year-old expressed that
the psychologist,
Helped me to, in a way, raise my self-esteem because she told me, you are worthy, you are very
valuable person (46 yo, Group 3)
The activities carried out during the sessions strengthened self-esteem, such that some participants were
able to recuperate their trust in themselves to start a new relationship, look for a job or make timely
decisions about their lives. Other themes appreciated by participants were adherence and disclosure.
Participants talked about how learning about the importance of these topics helped them to manage them
and, in some cases, decide to disclose to people about their HIV status.
While it was not a formal theme included in the sessions, participants also mentioned the importance of
blame. The feeling of blame is a phase in the emotional response to the diagnosis, which can lead to
acceptance. This process was covered in the first EW session. A twenty-eight-year-old participant
described that by participating in the EW sessions, he started to accept that “it was not my fault that I got
infected…that I can’t be blaming myself for that”. Participants learned strategies to channel and resolve
these feelings as described by a 25-year-old who said he learned “what to do, when, when I blame myself,
for my diagnosis”. Participants learned to identify their feelings of blame and restructure their
interpretation using strategies inspired by Socratic questioning and Gestalt therapy (a humanist
therapeutic approach that encourages the participant to be conscious of his feelings towards himself and
his environment, focused on the here and now, experiencing the potential for acceptance).
While the themes of discrimination and partner dynamics were covered in the EW sessions, participants
indicated wanting more content in these areas. A 28-year-old participant said he would have liked more
about,
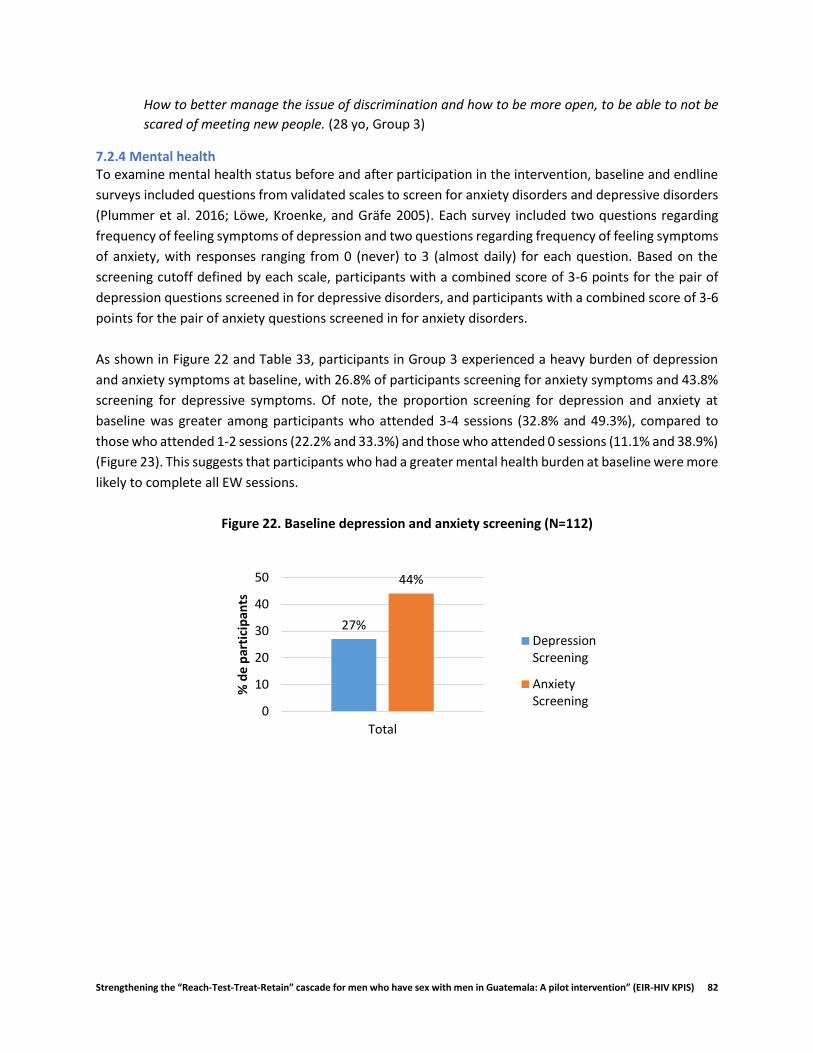
Strengthening the “Reach-Test-Treat-Retain” cascade for men who have sex with men in Guatemala: A pilot intervention” (EIR-HIV KPIS) 82
How to better manage the issue of discrimination and how to be more open, to be able to not be
scared of meeting new people. (28 yo, Group 3)
7.2.4 Mental health To examine mental health status before and after participation in the intervention, baseline and endline
surveys included questions from validated scales to screen for anxiety disorders and depressive disorders
(Plummer et al. 2016; Löwe, Kroenke, and Gräfe 2005). Each survey included two questions regarding
frequency of feeling symptoms of depression and two questions regarding frequency of feeling symptoms
of anxiety, with responses ranging from 0 (never) to 3 (almost daily) for each question. Based on the
screening cutoff defined by each scale, participants with a combined score of 3-6 points for the pair of
depression questions screened in for depressive disorders, and participants with a combined score of 3-6
points for the pair of anxiety questions screened in for anxiety disorders.
As shown in Figure 22 and Table 33, participants in Group 3 experienced a heavy burden of depression
and anxiety symptoms at baseline, with 26.8% of participants screening for anxiety symptoms and 43.8%
screening for depressive symptoms. Of note, the proportion screening for depression and anxiety at
baseline was greater among participants who attended 3-4 sessions (32.8% and 49.3%), compared to
those who attended 1-2 sessions (22.2% and 33.3%) and those who attended 0 sessions (11.1% and 38.9%)
(Figure 23). This suggests that participants who had a greater mental health burden at baseline were more
likely to complete all EW sessions.
Figure 22. Baseline depression and anxiety screening (N=112)
27%
44%
0
10
20
30
40
50
Total
% d
e p
arti
cip
ants
DepressionScreening
AnxietyScreening
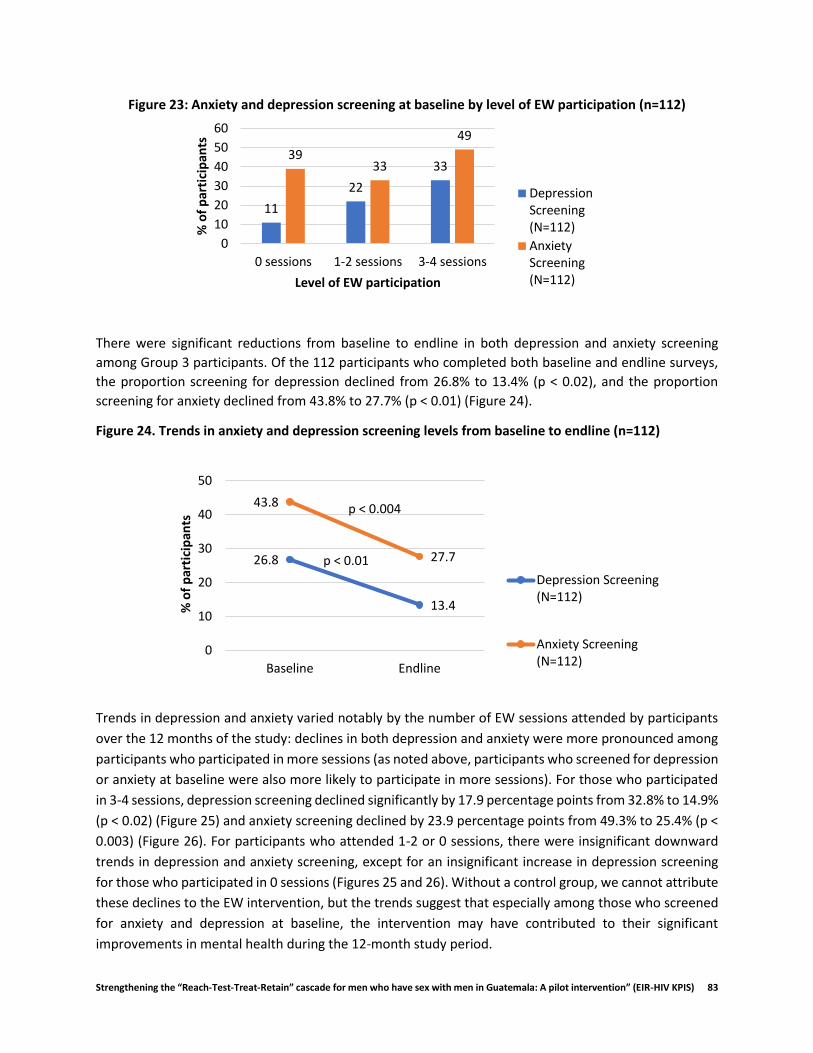
Strengthening the “Reach-Test-Treat-Retain” cascade for men who have sex with men in Guatemala: A pilot intervention” (EIR-HIV KPIS) 83
Figure 23: Anxiety and depression screening at baseline by level of EW participation (n=112)
There were significant reductions from baseline to endline in both depression and anxiety screening
among Group 3 participants. Of the 112 participants who completed both baseline and endline surveys,
the proportion screening for depression declined from 26.8% to 13.4% (p < 0.02), and the proportion
screening for anxiety declined from 43.8% to 27.7% (p < 0.01) (Figure 24).
Figure 24. Trends in anxiety and depression screening levels from baseline to endline (n=112)
Trends in depression and anxiety varied notably by the number of EW sessions attended by participants
over the 12 months of the study: declines in both depression and anxiety were more pronounced among
participants who participated in more sessions (as noted above, participants who screened for depression
or anxiety at baseline were also more likely to participate in more sessions). For those who participated
in 3-4 sessions, depression screening declined significantly by 17.9 percentage points from 32.8% to 14.9%
(p < 0.02) (Figure 25) and anxiety screening declined by 23.9 percentage points from 49.3% to 25.4% (p <
0.003) (Figure 26). For participants who attended 1-2 or 0 sessions, there were insignificant downward
trends in depression and anxiety screening, except for an insignificant increase in depression screening
for those who participated in 0 sessions (Figures 25 and 26). Without a control group, we cannot attribute
these declines to the EW intervention, but the trends suggest that especially among those who screened
for anxiety and depression at baseline, the intervention may have contributed to their significant
improvements in mental health during the 12-month study period.
11
22
3339
33
49
0
10
20
30
40
50
60
0 sessions 1-2 sessions 3-4 sessions
% o
f p
arti
cip
ants
Level of EW participation
DepressionScreening(N=112)
AnxietyScreening(N=112)
26.8
13.4
43.8
27.7
0
10
20
30
40
50
Baseline Endline
% o
f p
arti
cip
ants
Depression Screening(N=112)
Anxiety Screening(N=112)
p < 0.004
p < 0.01

Strengthening the “Reach-Test-Treat-Retain” cascade for men who have sex with men in Guatemala: A pilot intervention” (EIR-HIV KPIS) 84
Figure 25: Trends in depression by level of participation in EW sessions (N = 112)
Figure 26: Trends in anxiety by level of participation in EW sessions (N = 112)
11.1
16.722.2
7.4
32.8
14.9
0
10
20
30
40
50
60
Baseline Endline
% o
f p
arti
cip
ants
0 sessions 1-2 sessions 3-4 sessions
p < 1.00
p < 0.29
p < 0.02
38.9 33.333.3
29.6
49.3
25.4
0
10
20
30
40
50
60
Baseline Endline
% o
f p
arti
cip
ants
0 sessions 1-2 sessions 3-4 sessions
p < 1.00
p < 1.00
p < 0.003

Strengthening the “Reach-Test-Treat-Retain” cascade for men who have sex with men in Guatemala: A pilot intervention” (EIR-HIV KPIS) 85
Table 33: Mental Health, Viral Load, Adherence and Retention by level of EW participation (n=112)
Level of EW participation (Number to EW sessions)
0 sessions 1-2 sessions 3-4 sessions Total
n (%) n (%) n (%) n (%)
Depression Screening (N=18) (N=27) (N=67) (N=112)
Baseline 2 (11.1) 6 (22.2) 22 (32.8) 30 (26.8)
Endline 3 (16.7) 2 (7.4) 10 (14.9) 15 (13.4)
Difference % (p-value) 5.6 (p < 1.00) -14.8 (p< 0.29) -17.9 (p < 0.02) -13.4 (p < 0.02)
Anxiety Screening (N=18) (N=27) (N=67) (N=112)
Baseline 7 (38.9) 9 (33.3) 33 (49.3) 49 (43.8)
Endline 6 (33.3) 8 (29.6) 17 (25.4) 31 (27.7)
Difference % (p-value) -5.6 (p< 1.00) -3.7 (p <1.00) -23.9 (p < 0.003) -16.1 (p < 0.01)
Viral Load (undetectable) (N=18) (N=27) (N=67) (N=112)
Baseline 7 (38.9) 10 (37.0) 15 (22.4) 32 (28.6)
Endline 17 (94.4) 20 (74.1) 50 (74.6) 87 (77.7)
Difference % (p-value) 55.6 (p < 0.004) 37.0 (p < 0.02) 52.2 (p < 0.001) 49.1 (p < 0.001)
Adherence* (N=18) (N=27) (N=67) (N=112)
Endline 18 (100.0) 25 (92.6) 63 (94.0) 106 (94.6)
Retention** (N=18) (N=27) (N=67) (N=112)
Endline 15 (83.3) 21 (77.8) 53 (83.6) 92 (82.1)
* Adherence: no missed ART doses in the last 4 days ** Retention: attended at least 3 of 4 quarterly HIV care appointments in the last 12 months.
7.2.5 HIV Outcomes
Viral Load Viral load was measured at baseline and endline. Among Group 3 participants, the proportion of participants with an undetectable viral load increased significantly from 28.6% at baseline to 77.7% (p < 0.001) at endline (Figure 27).
Figure 27: Trends in viral suppression (N=112)
29
78
0
10
20
30
40
50
60
70
80
90
100
Baseline Endline
% o
f p
arti
cip
ants
Undetectableviral load
p < 0.001
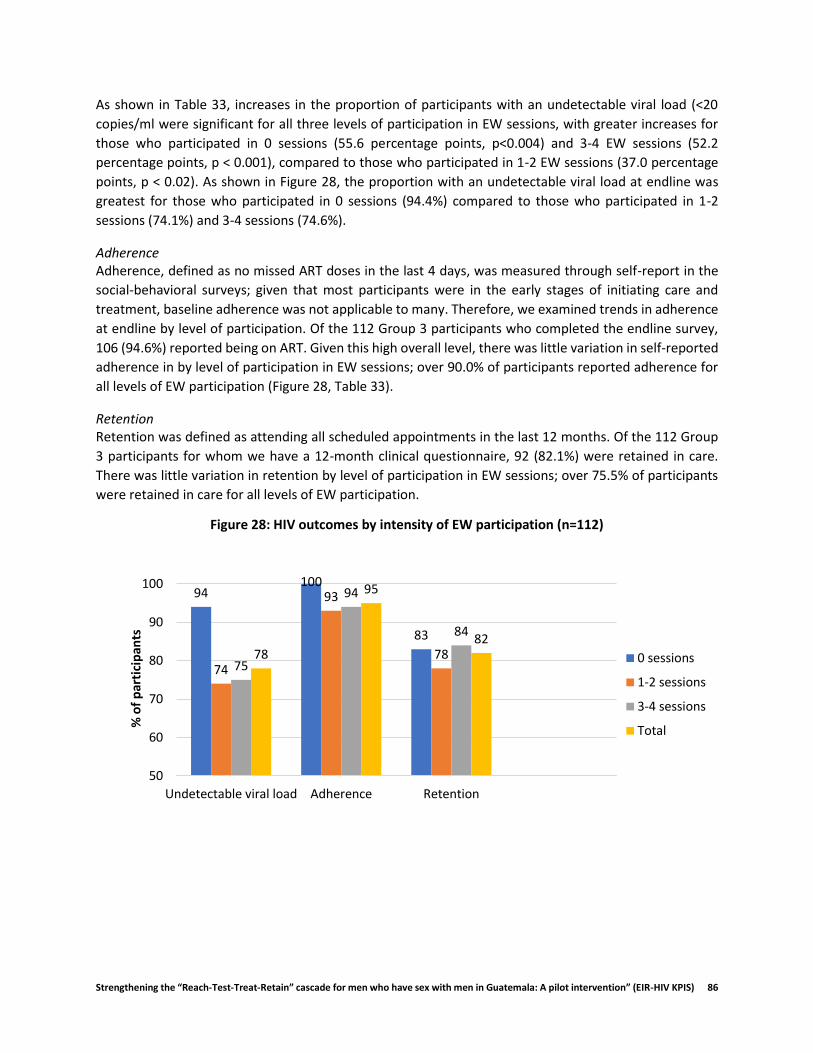
Strengthening the “Reach-Test-Treat-Retain” cascade for men who have sex with men in Guatemala: A pilot intervention” (EIR-HIV KPIS) 86
As shown in Table 33, increases in the proportion of participants with an undetectable viral load (<20
copies/ml were significant for all three levels of participation in EW sessions, with greater increases for
those who participated in 0 sessions (55.6 percentage points, p<0.004) and 3-4 EW sessions (52.2
percentage points, p < 0.001), compared to those who participated in 1-2 EW sessions (37.0 percentage
points, p < 0.02). As shown in Figure 28, the proportion with an undetectable viral load at endline was
greatest for those who participated in 0 sessions (94.4%) compared to those who participated in 1-2
sessions (74.1%) and 3-4 sessions (74.6%).
Adherence Adherence, defined as no missed ART doses in the last 4 days, was measured through self-report in the
social-behavioral surveys; given that most participants were in the early stages of initiating care and
treatment, baseline adherence was not applicable to many. Therefore, we examined trends in adherence
at endline by level of participation. Of the 112 Group 3 participants who completed the endline survey,
106 (94.6%) reported being on ART. Given this high overall level, there was little variation in self-reported
adherence in by level of participation in EW sessions; over 90.0% of participants reported adherence for
all levels of EW participation (Figure 28, Table 33).
Retention Retention was defined as attending all scheduled appointments in the last 12 months. Of the 112 Group
3 participants for whom we have a 12-month clinical questionnaire, 92 (82.1%) were retained in care.
There was little variation in retention by level of participation in EW sessions; over 75.5% of participants
were retained in care for all levels of EW participation.
Figure 28: HIV outcomes by intensity of EW participation (n=112)
94100
83
74
93
7875
94
84
78
95
82
50
60
70
80
90
100
Undetectable viral load Adherence Retention
% o
f p
arti
cip
ants
0 sessions
1-2 sessions
3-4 sessions
Total
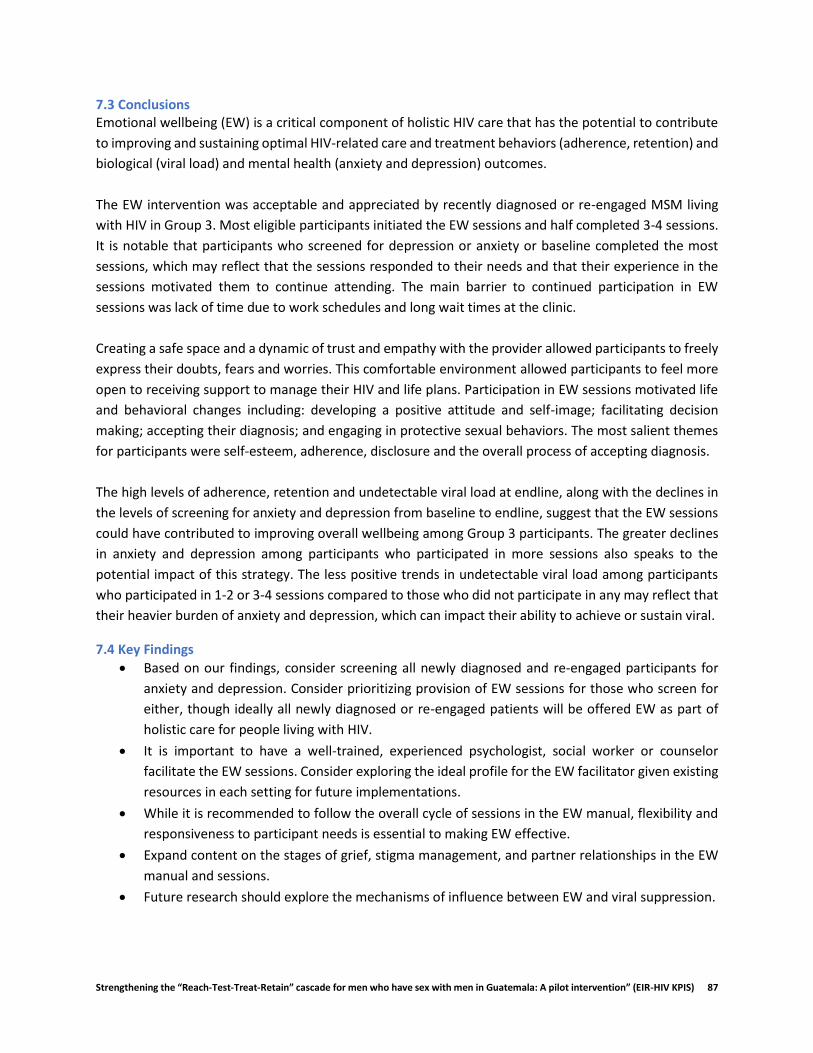
Strengthening the “Reach-Test-Treat-Retain” cascade for men who have sex with men in Guatemala: A pilot intervention” (EIR-HIV KPIS) 87
7.3 Conclusions Emotional wellbeing (EW) is a critical component of holistic HIV care that has the potential to contribute
to improving and sustaining optimal HIV-related care and treatment behaviors (adherence, retention) and
biological (viral load) and mental health (anxiety and depression) outcomes.
The EW intervention was acceptable and appreciated by recently diagnosed or re-engaged MSM living
with HIV in Group 3. Most eligible participants initiated the EW sessions and half completed 3-4 sessions.
It is notable that participants who screened for depression or anxiety or baseline completed the most
sessions, which may reflect that the sessions responded to their needs and that their experience in the
sessions motivated them to continue attending. The main barrier to continued participation in EW
sessions was lack of time due to work schedules and long wait times at the clinic.
Creating a safe space and a dynamic of trust and empathy with the provider allowed participants to freely
express their doubts, fears and worries. This comfortable environment allowed participants to feel more
open to receiving support to manage their HIV and life plans. Participation in EW sessions motivated life
and behavioral changes including: developing a positive attitude and self-image; facilitating decision
making; accepting their diagnosis; and engaging in protective sexual behaviors. The most salient themes
for participants were self-esteem, adherence, disclosure and the overall process of accepting diagnosis.
The high levels of adherence, retention and undetectable viral load at endline, along with the declines in
the levels of screening for anxiety and depression from baseline to endline, suggest that the EW sessions
could have contributed to improving overall wellbeing among Group 3 participants. The greater declines
in anxiety and depression among participants who participated in more sessions also speaks to the
potential impact of this strategy. The less positive trends in undetectable viral load among participants
who participated in 1-2 or 3-4 sessions compared to those who did not participate in any may reflect that
their heavier burden of anxiety and depression, which can impact their ability to achieve or sustain viral.
7.4 Key Findings
Based on our findings, consider screening all newly diagnosed and re-engaged participants for
anxiety and depression. Consider prioritizing provision of EW sessions for those who screen for
either, though ideally all newly diagnosed or re-engaged patients will be offered EW as part of
holistic care for people living with HIV.
It is important to have a well-trained, experienced psychologist, social worker or counselor
facilitate the EW sessions. Consider exploring the ideal profile for the EW facilitator given existing
resources in each setting for future implementations.
While it is recommended to follow the overall cycle of sessions in the EW manual, flexibility and
responsiveness to participant needs is essential to making EW effective.
Expand content on the stages of grief, stigma management, and partner relationships in the EW
manual and sessions.
Future research should explore the mechanisms of influence between EW and viral suppression.
Strengthening the “Reach-Test-Treat-Retain” cascade for men who have sex with men in Guatemala: A pilot intervention” (EIR-HIV KPIS) 88
7.5 References Donastorg, Yeycy, Clare Barrington, Martha Perez, and Deanna Kerrigan. 2014. “Abriendo Puertas:
Baseline Findings from an Integrated Intervention to Promote Prevention, Treatment and Care
among FSW Living with HIV in the Dominican Republic.” PLoS ONE 9 (2).
doi:10.1371/journal.pone.0088157.
“Enlaces Por La Salud Intervention Guide.” 2014. Chapel Hill.
Löwe, Bernd, Kurt Kroenke, and Kerstin Gräfe. 2005. “Detecting and Monitoring Depression with a Two-
Item Questionnaire (PHQ-2).” Journal of Psychosomatic Research 58 (2): 163–71.
doi:10.1016/j.jpsychores.2004.09.006.
“Modelo de Intervención Terapéutico ‘Abriendo Puertas’: Manual de Consejería.” 2014. Santo Domingo.
Plummer, Faye, Laura Manea, Dominic Trepel, and Dean McMillan. 2016. “Screening for Anxiety Disorders
with the GAD-7 and GAD-2: A Systematic Review and Diagnostic Metaanalysis.” General Hospital
Psychiatry 39. Elsevier Inc.: 24–31. doi:10.1016/j.genhosppsych.2015.11.005.
Rosenberg, M. 1965. Society and the Adolescent Self-Image. Princeton, NJ: Princeton University Press.
Strengthening the “Reach-Test-Treat-Retain” cascade for men who have sex with men in Guatemala: A pilot intervention” (EIR-HIV KPIS) 89
8. mHealth
8.1 Description mHealth is the use of wireless technology for health promotion and health care, including: mobile phones,
PDAs (personal digital assistants), smartphones, monitoring systems, e-book readers or mp3 electronic
devices (Hall, 2012). The main objectives of the KPIS mHealth strategy were to 1) develop a low-cost,
bidirectional text message system (a system that sends and receives text messages) to send appointment
reminders, and 2) measure real time exposure and acceptability of text messages. The mHealth
component was offered to all enrolled KPIS participants across all three study groups.
The mHealth platform, based on the open-source software FrontlineSMS, sends reminders and
informational text messages and receives and categorizes incoming responses. We developed a web
application to classify and categorize messages based on their content, track responses with real-time
graphs, and link responses to the messages that were sent by the platform. The mHealth component of
KPIS focused on appointment reminders.
We applied a SCRUM methodology to develop the mHealth platform. The approach is known to increase
flexibility and produce systems that are responsive to both initial and additional requirements discovered
during the ongoing development of software implementations (Schwaber 2002). In the pre-game phase,
the planning and system architecture were defined. The closure phase comprised the creation of the
Standard Operating Procedure for the execution of the mHealth component.
The KPIS mHealth component represents an integration of systems technologies and communication. It is
characterized by the use of the text messaging service for the dual purpose of reminding participants
about their appointments and collecting information. The system included a predetermined schedule of
the messages, the collection of received classified messages, and visual presentation of results by graphs.
Based on these requirements, the mHealth component was divided in two parts: the messaging
component and data analysis and visualization component.
Messaging component (Inputs):
Plugin of reminders: This functionality configured the number of messages to be sent per week
and the date and time to send the messages so that the messages were automatically scheduled.
Component of Data analysis and visualization (Outputs):
This component is divided into two functionalities to speed up the analysis and visualization of
data.
1. Viewing and classifying messages: This functionality allows the general display of sent and
received messages. Each message is classified according to the context of the message
(Table 34).
2. Graphics visualization: This functionality is characterized by the three types of graphs that
represent an easy visualization of the results of the messages received. The first is a graph
that summarizes the total number of messages sent, received or pending in real time. The
second is a graphic based on the total of messages according to its classification. And the
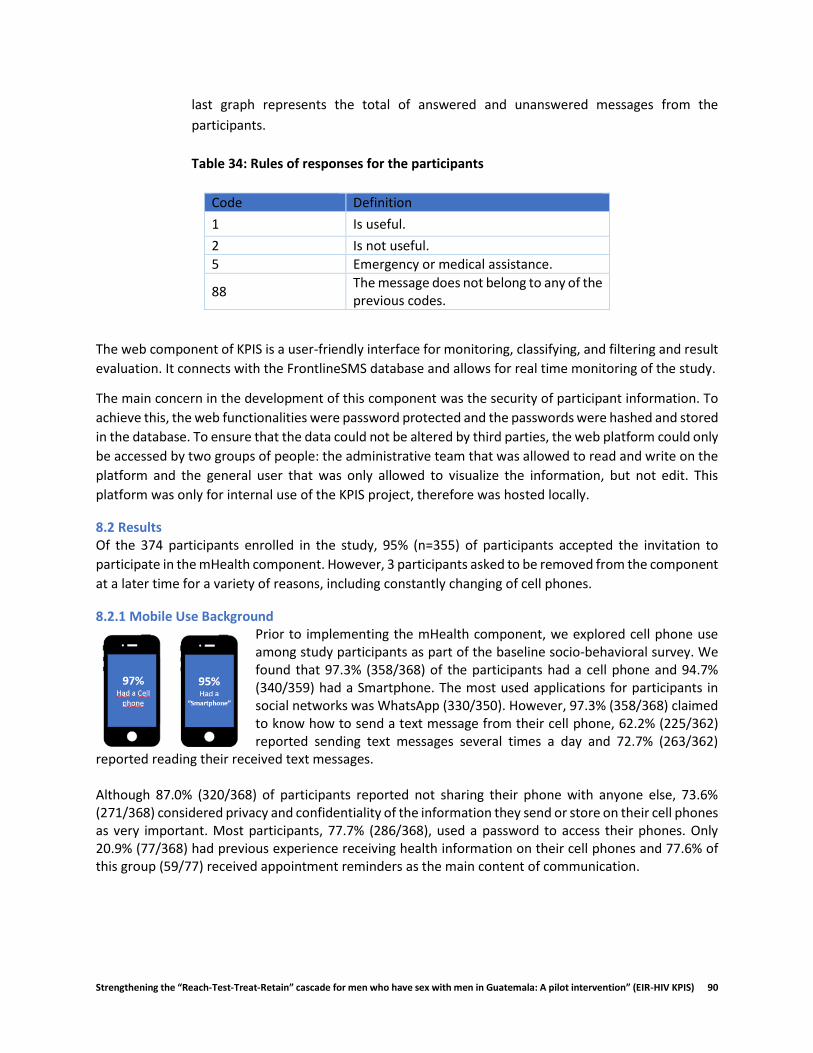
Strengthening the “Reach-Test-Treat-Retain” cascade for men who have sex with men in Guatemala: A pilot intervention” (EIR-HIV KPIS) 90
last graph represents the total of answered and unanswered messages from the
participants.
Table 34: Rules of responses for the participants
Code Definition
1 Is useful.
2 Is not useful.
5 Emergency or medical assistance.
88 The message does not belong to any of the previous codes.
The web component of KPIS is a user-friendly interface for monitoring, classifying, and filtering and result
evaluation. It connects with the FrontlineSMS database and allows for real time monitoring of the study.
The main concern in the development of this component was the security of participant information. To
achieve this, the web functionalities were password protected and the passwords were hashed and stored
in the database. To ensure that the data could not be altered by third parties, the web platform could only
be accessed by two groups of people: the administrative team that was allowed to read and write on the
platform and the general user that was only allowed to visualize the information, but not edit. This
platform was only for internal use of the KPIS project, therefore was hosted locally.
8.2 Results Of the 374 participants enrolled in the study, 95% (n=355) of participants accepted the invitation to
participate in the mHealth component. However, 3 participants asked to be removed from the component
at a later time for a variety of reasons, including constantly changing of cell phones.
8.2.1 Mobile Use Background Prior to implementing the mHealth component, we explored cell phone use among study participants as part of the baseline socio-behavioral survey. We found that 97.3% (358/368) of the participants had a cell phone and 94.7% (340/359) had a Smartphone. The most used applications for participants in social networks was WhatsApp (330/350). However, 97.3% (358/368) claimed to know how to send a text message from their cell phone, 62.2% (225/362) reported sending text messages several times a day and 72.7% (263/362)
reported reading their received text messages. Although 87.0% (320/368) of participants reported not sharing their phone with anyone else, 73.6% (271/368) considered privacy and confidentiality of the information they send or store on their cell phones as very important. Most participants, 77.7% (286/368), used a password to access their phones. Only 20.9% (77/368) had previous experience receiving health information on their cell phones and 77.6% of this group (59/77) received appointment reminders as the main content of communication.

Strengthening the “Reach-Test-Treat-Retain” cascade for men who have sex with men in Guatemala: A pilot intervention” (EIR-HIV KPIS) 91
8.2.2 mHealth Appointment Reminders Table 35 describes the number of appointment reminders that were sent 30 days, 15 days, and 7 days
prior to scheduled medical consults in both the centralized and decentralized clinics. Some participants
did not receive the reminders due to the different changes of appointments they made or changes in the
cell phone number, however, according to the platform's records, the following reminders were sent:
Table 35: Number of text messages reminders sent prior to appointments
Appointment 1 Appointment 2 Appointment 3 Appointment 4
30 days before 176 189 159 110
15 days before 187 201 188 135
7 days before 192 245 189 154
Total 555 635 536 399
Here is an example of the text message participants received:
Upon receiving reminders, participants were asked to respond to the text
message to rate its usefulness. The response rate for first appointment
reminders was 19.8%; second appointment reminders was 16.4%; third
appointment reminders was 15.5% and fourth appointment reminders was
14%. Table 36 indicates that 86.9% of the messages were perceived as useful,
1.6% were perceived as not useful, and 11.5% of the responses were
unclassifiable. Out of the 2125 messages sent by mHealth platform, we
received 549 replies (25.8%) from the participants. Figure 3 describes the text
messages reception.
Table 36: Text Messages Reception
Indicators Num Den %
Useful Message 477 549 86.9
Non Useful Messages 9 549 1.6
Non-Classifiable 63 549 11.5
Rate of message reception 549 2125 25.8
During the mHealth intervention we received three different types of messages from the participants. The
first group were messages that contained different kinds of signs or characters; the second group included
sentences, numbers or words that are not part of the classification table. These responses included
sentences, telephone numbers, and direct questions, which suggest that participants may have expected
direct and instantaneous communication. Finally, the third group included sentences with phrases or
words with accents that the FrontlineSMS software could not correctly compile.
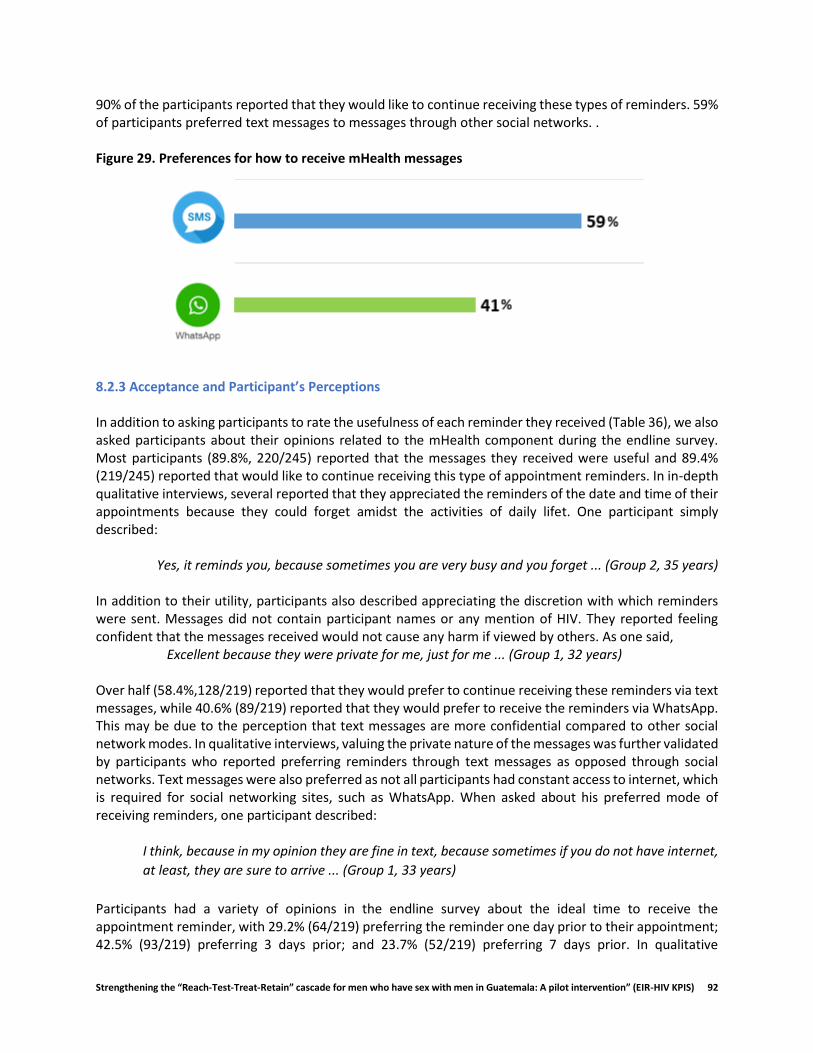
Strengthening the “Reach-Test-Treat-Retain” cascade for men who have sex with men in Guatemala: A pilot intervention” (EIR-HIV KPIS) 92
90% of the participants reported that they would like to continue receiving these types of reminders. 59% of participants preferred text messages to messages through other social networks. . Figure 29. Preferences for how to receive mHealth messages
8.2.3 Acceptance and Participant’s Perceptions In addition to asking participants to rate the usefulness of each reminder they received (Table 36), we also asked participants about their opinions related to the mHealth component during the endline survey. Most participants (89.8%, 220/245) reported that the messages they received were useful and 89.4% (219/245) reported that would like to continue receiving this type of appointment reminders. In in-depth qualitative interviews, several reported that they appreciated the reminders of the date and time of their appointments because they could forget amidst the activities of daily lifet. One participant simply described:
Yes, it reminds you, because sometimes you are very busy and you forget ... (Group 2, 35 years) In addition to their utility, participants also described appreciating the discretion with which reminders were sent. Messages did not contain participant names or any mention of HIV. They reported feeling confident that the messages received would not cause any harm if viewed by others. As one said,
Excellent because they were private for me, just for me ... (Group 1, 32 years) Over half (58.4%,128/219) reported that they would prefer to continue receiving these reminders via text messages, while 40.6% (89/219) reported that they would prefer to receive the reminders via WhatsApp. This may be due to the perception that text messages are more confidential compared to other social network modes. In qualitative interviews, valuing the private nature of the messages was further validated by participants who reported preferring reminders through text messages as opposed through social networks. Text messages were also preferred as not all participants had constant access to internet, which is required for social networking sites, such as WhatsApp. When asked about his preferred mode of receiving reminders, one participant described:
I think, because in my opinion they are fine in text, because sometimes if you do not have internet,
at least, they are sure to arrive ... (Group 1, 33 years)
Participants had a variety of opinions in the endline survey about the ideal time to receive the appointment reminder, with 29.2% (64/219) preferring the reminder one day prior to their appointment; 42.5% (93/219) preferring 3 days prior; and 23.7% (52/219) preferring 7 days prior. In qualitative

Strengthening the “Reach-Test-Treat-Retain” cascade for men who have sex with men in Guatemala: A pilot intervention” (EIR-HIV KPIS) 93
interviews, however, participants reported being satisfied with the frequency of the 3 reminders that were sent as part of the KPIS project.
... I think they are wise too, no, no, no, it's not annoying or anything, not at all. (Group 3, 26 years)

Strengthening the “Reach-Test-Treat-Retain” cascade for men who have sex with men in Guatemala: A pilot intervention” (EIR-HIV KPIS) 94
8.3 Conclusions The mHealth platform provided appointment reminders to MSM living with HIV 1 month, 15 days, and 7
days prior to their HIV clinic appointments. It was highly acceptable to study participants who were
satisfied with the discreet reminders they received via text messages.
The mHealth platform is a useful tool in a context of high cell phone useAlthough the text message has ceased to be a popular means of communication in Guatemala, it is still considered one of the safest, most confidential, low-cost and private media for participants. During the study, no violations of privacy were reported nor was the confidentiality of the diagnosis of participants compromised. The coding and standardization of text messages helped maintain a professional and discreet environment. The frequency of sending messages showed that it is more convenient for participants to receive the reminder at least 3 days before the medical appointment, this is because it allows them to better organize their time and not forget the attendance at the clinic. A limitation of the mHealth platform is that the results of acceptability by responding to the text message of the reminder was generally associated with the disposition of balance in their cell phones. Since sending the response generated a charge, some participants avoided responding. In addition to receiving appointment reminders, participants showed interest in receiving other types of educational information about the latest HIV updates, nutrition information, and motivational messages. Participants recommend this service and would like to continue receiving these types of reminders to improve their retention of health services. This platform can be adapted for medication reminders.
8.4 Key Findings
HIV and ART care clinics can adopt text messaging strategies for reminding appointments, taking
medications and other health information about HIV through low cost electronic platforms. Such
efforts could be scaled-up and integrated into local and national HIV prevention and treatment
programs as a sustainable way to support patients to stay in care and adherent to medication.
There is a need for additional evaluation to assess the attributable impact and mechanisms
through which mHealth supports and influences behavior and outcomes to provide actionable
evidence for program leaders, policymakers, and funders.
Beyond text message based mHealth systems, there is a need for additional research into the
acceptability and utility of mobile apps and other mHealth tools to provide more comprehensive
support for people living with HIV. Such tools could provide additional forms of social support
required for long-term retention and adherence among people living with HIV.
Strengthening the “Reach-Test-Treat-Retain” cascade for men who have sex with men in Guatemala: A pilot intervention” (EIR-HIV KPIS) 95
8.5 References 1. Schwaber, K., & Beedle, M. (2002). Agilè Software Development with Scrum.
2. Hall, A. K. (2012). Healthy Aging 2.0: the potential of new media and technology. Preventing
chronic disease, 9.
Strengthening the “Reach-Test-Treat-Retain” cascade for men who have sex with men in Guatemala: A pilot intervention” (EIR-HIV KPIS) 96
9. Capacity Building As part of the implementation of the decentralization of HIV care services and ART, we identified and implemented several capacity building activities. We used a horizontal, bi-directional approach to capacity building between the teams at UVG, Roosevelt and the 3 VICITS clinics. This approach allowed us to maximize the strengths of each team and share key skills across all sites. As a result of the capacity building component, more than 70 professionals and health workers from four distinct clinics benefited from theoretical and practical training in different topics related to comprehensive HIV care. During the implementation of this study, knowledge was shared, and teamwork and horizontal inter-institutional collaboration were fostered to promote sustainable change. We focused on strengthening capacity in four main areas: comprehensive medical care; pharmacy; emotional wellbeing; and laboratory, described below.
9.1 Comprehensive HIV Care
Horizontal capacity building for HIV care In order to provide comprehensive medical care during clinic visits, we had teams of two doctors, one from Roosevelt and one from the VICITS clinics, work together at the decentralization clinics. The Roosevelt physicians provided HIV-related care and mentorship to the VICITS physicians while the VICITS physicians focused on STI and other sexual health issues, again modeling best practices to Roosevelt physicians. By having appointments assigned on specific days and times, doctors had sufficient time to carry out their HIV-related care and assess STIs and other health concerns, as needed. The exchange of experiences and information within the teams allowed for strengthening capacity and acquiring new knowledge. In total, 8 VICITS physicians and 3 Roosevelt physicians participated in this horizontal exchange.
Integral Health and HIV Workshop Another capacity building exercise related to comprehensive HIV care was supporting eight health professionals from the three VICITS clinics to participate in an interdisciplinary course on integral health and HIV offered at the Dr. Carlos Mejia Villatoro Comprehensive Care Unit at Roosevelt Hospital. The objective of the 6-month course is to expand knowledge and capacity for providing comprehensive care for people living with HIV among a diverse pool of providers. The course provides information on comprehensive medical care, including diagnosis, opportunistic and concomitant infections, and antiretroviral therapy as well as psychological support and wellbeing. Participants are also trained in how to disseminate this information within the interdisciplinary teams at their clinics to improve quality of life and survival.
Condesa Clinic Visit In addition to the comprehensive course, a final capacity building activity focused on providing exposure to cutting edge, state-of-the-art HIV and STI care and treatment, with emphasis on quality of care and decentralization. Providers and managers from Roosevelt and the three VICITS clinics made a training exchange visit to the Condesa Clinic in Mexico City to enhance knowledge and skills. The Condesa Clinic in Mexico City is the largest comprehensive HIV prevention and treatment clinic in Latin America and has developed expertise in effective diagnosis, care and treatment, especially among key populations. The main objective of this visit was to learn about the comprehensive health care services provided at this specialized HIV clinic and gain an understanding of support services and programs offered

Strengthening the “Reach-Test-Treat-Retain” cascade for men who have sex with men in Guatemala: A pilot intervention” (EIR-HIV KPIS) 97
to key populations. As a center of excellence in ART decentralization, Condesa Clinic provided a model to guide the decentralization process in Guatemala.
9.2 Pharmacy Since VICITS clinics did not provide ART prior to decentralization, we had to provide information about medications, adverse effects, and interactions and create systems for logistics and evaluation of adherence. Both the medical staff and other key staff at the VICITS clinics were trained by the Roosevelt Hospital in the management of ART and the importance of adherence. Roosevelt staff provided hands on mentorship to the VICITS clinics to guarantee smooth distribution and management of ART. Over the study, 3 VICITS pharmacy staff were trained.
9.3 Emotional Wellbeing As described in the Emotional Wellbeing chapter, we developed a 4-session individual counseling and health education intervention for participants in Group 3 who were newly diagnosed or re-engaged in care. We developed a manual to guide the implementation of the sessions and used lessons learned during the study to revise and strengthen the manual. Additionally, the psychologist who implemented the sessions trained psychological staff at each of the participating clinics to promote the integration of emotional wellbeing into their care models and provide skills and experience in the KPIS EW intervention. The KPIS psychologist facilitated 6 trainings with a total of 35 participants.
9.4 Laboratory A training plan was developed for all laboratory personnel for the taking, preparation and sending of biological samples, strengthening bio-safety procedures in all facilities. In addition, equipment and supplies were also provided to process the samples, such as: 3 centrifugal machine, laboratory tubes for blood test and viral load and 3 coolers for samples transportation Manuals and SOP’s were created to control the sample quality procedures. Over the study, 3 VICITS laboratory staff were trained with a total of 5 laboratory technicians.

Strengthening the “Reach-Test-Treat-Retain” cascade for men who have sex with men in Guatemala: A pilot intervention” (EIR-HIV KPIS) 98
10. CONCLUSIONS Overall, we found that decentralized, differentiated services were acceptable to almost half of the
decentralization-eligible participants with high levels of satisfaction at the end of the study. Biological and
behavioral HIV outcomes including viral load, retention and adherence were all sustained during the
decentralization process. Time was a very salient theme, both as a motivator to decentralize as well as in
the assessment of the experience. Participants were motivated to decentralize because they perceived it
would save them time due to the varied locations and schedules. On average, participants saved hours of
time with each appointment at the decentralized clinic without compromising quality of care. This also
contributed to statistically significant indirect cost differences observed between those receiving
decentralized and non-decentralized care. Direct cost to providers were similar between groups. Using
three-times the GDP per capita, as well as three-times the amount spent on healthcare reported by the
MoH, the intervention was found to be potentially cost-effective.
Navigators also played a key role in supporting decentralization. We found that health navigation is a
highly acceptable intervention strategy among MSM living with HIV, including among stable patients who
have been living with HIV for an extended period of time. Health navigation may facilitate achieving and
maintaining viral suppression, as those that received more interactions with their navigators experienced
greater improvements in viral suppression. Navigators provided real-time remote support in a broad
range of topics, well beyond HIV. We found that how navigators treat participants is more important than
the characteristics of the navigator, such as gender, sexual orientation, and HIV status. Additionally, the
Emotional wellbeing (EW) was acceptable and appreciated by recently diagnosed or re-engaged MSM
living with HIV. Most eligible participants initiated the EW sessions and half completed 3-4 sessions. It is
notable that participants who screened for depression or anxiety at baseline completed the most sessions,
which may reflect that the sessions responded to their needs and that their experience in the sessions
motivated them to continue attending. The high levels of adherence, retention and undetectable viral
load at endline, along with the declines in the levels of screening for anxiety and depression from baseline
to endline, suggest that the EW sessions could have contributed to improving overall wellbeing among
participants.
Our mHealth platform that provided appointment reminders to participants 1 month, 15 days, and 7 days
prior to their HIV clinic appointments was highly acceptable. The frequency of sending messages showed
that it is more convenient for participants to receive the reminder at least 3 days before the medical
appointment to allow for better time management.