Tesis Doctoral H.D. Ponce-Rodríguez (1).pdf
202
MINIATURIZED LIQUID CHROMATOGRAPHY: ON-LINE COUPLING TO IN-TUBE SOLID-PHASE MICROEXTRACTION AND PORTABILITY FOR DIFFERENT MATRICES Tesis presentada para alcanzar el grado de Doctor en Química dentro del Programa de Doctorado en Química con Mención de Excelencia (R.D. 99/2011) Henry Daniel Ponce Rodríguez Directores Prof a . Dra. Pilar Campíns Falcó Prof. Dr. Jorge Verdú Andrés Valencia, junio 2020
-
Upload
khangminh22 -
Category
Documents
-
view
0 -
download
0
Transcript of Tesis Doctoral H.D. Ponce-Rodríguez (1).pdf

MINIATURIZED LIQUID CHROMATOGRAPHY: ON-LINE COUPLING TO IN-TUBE
SOLID-PHASE MICROEXTRACTION AND PORTABILITY FOR DIFFERENT
MATRICES
Tesis presentada para alcanzar el grado de Doctor en Química dentro del Programa de Doctorado en
Química con Mención de Excelencia (R.D. 99/2011)
Henry Daniel Ponce Rodríguez
Directores
Profa. Dra. Pilar Campíns Falcó
Prof. Dr. Jorge Verdú Andrés
Valencia, junio 2020
Certificado veracidad tesis
Dña. Pilar Campíns Falcó, Catedrática de Universidad, y D. Jorge Verdú Andrés, Profesor Titular de
Universidad, ambos del Departamento de Química Analítica de la Universitat de València,
CERTIFICAN
Que la presente memoria, titulada “Miniaturized liquid chromatography: on‐line coupling to in‐tube
solid phase microextraction and portability for different matrices”, constituye la Tesis Doctoral de
Henry Daniel Ponce Rodríguez para optar al grado de Doctor en Química, y que ha sido realizada en
los laboratorios del Departamento de Química Analítica de la Universitat de València, bajo su dirección
y supervisión.
Y para que así conste a los efectos oportunos, firman el presente certificado en
València, a 24 de junio de 2020.
Fdo. Dra. Pilar Campíns Falcó Fdo. Dr. Jorge Verdú Andrés
Directora de Tesis Director de Tesis

Esta tesis predoctoral ha sido realizada gracias a la beca predoctoral (CU‐O‐119‐09‐2015) concedida
por el Programa de Financiamiento de Movilidades y Becas Internacionales para el Relevo Docente y
Administrativo de la Universidad Nacional Autónoma de Honduras.

A Bessy,
cuyo inmenso amor y apoyo me
han seguido, incluso al otro lado
del mundo, recordándome que su
alma fue tatuada en mi piel.

“Por los sueños, se suspira.
Por las metas, se trabaja.”
(Humberto Ramos)

Agradecimientos
Agradezco a mis directores de Tesis, Pilar y Jorge. A Pilar gracias por todo el apoyo y
colaboración, y sobre todo por la dedicación a compartir tus inmensos conocimientos. Gracias Jorge
por toda la ayuda, paciencia y calidez, que hicieron todo más fácil. A las profesoras del grupo de
investigación. Gracias Rosa por tus enseñanzas, no solo de cromatografía sino de dedicación y
esfuerzo. A Carmen, Yolanda y Mari Carmen, gracias por vuestra empatía y sugerencias. A todos ellos
mi agradecimiento y admiración, son un ejemplo de Profesor investigador universitario.
Doy las gracias al resto de integrantes del grupo MINTOTA: María, Anabel, Rodrigo, Neus, Pascu,
Lusine, Sara, Lorenzo, Ana, Adrià, Héctor y Sergio, por todo el apoyo entregado, por hacerme sentir
como en casa. Fueron de mucha ayuda.
Fuera de la Universidad, agradezco a Bessy, Celeste, Ana Lucía, Lirio, Gloria, Noemí, Sofía y Esther, por
estar siempre conmigo, sin importar la ausencia física, por su apoyo incondicional y por su gran amor.
A mis hermanos en Tennessee, Jimmy, Eduardo, Fernando y Dulce, su apoyo ha sido muy importante
durante todo este tiempo. A mi familia en Tegucigalpa, Miguel, Mónica, Miguel Ángel y Ramón, gracias
por adoptarme entre ustedes. A mi familia en Goslar, Daniel, Sofía, Adrián y Arianna, por estar
pendientes siempre de mí (y el mejor pan que he probado en mi vida). A Beto, el único dedo que
queda en mi mano, por su amistad fiel.
Finalmente, doy las gracias a la Universidad Nacional Autónoma de Honduras, por invertir en mi
formación. Al Programa de Relevo Docente y en particular a Edna por todo su trabajo. Agradezco el
apoyo de mis compañeros, Nahun, Alba, Gina, Viena, Renata, Jacki, Jessica y Julio. Mi agradecimiento
a Iris Corrales y Doris Chinchilla por su apoyo institucional y creer en mí.

Abstract
Recent innovations and trends in analytical chemistry lead to the development and
application of new instrumental systems, innovative sample treatment techniques, and application to
problem solving in various fields of analysis. Likewise, the growing concern about the reduction of the
environmental impact during the analytical process, without impairing benefits in terms of sensitivity
and sensitivity, have modulated the main topics in this field of research.
In this context, the continuous application of miniaturized liquid chromatography (LC)
systems, including capillary liquid chromatography (CapLC) and nano liquid chromatography (NanoLC),
has represented important advances, due to their tangible advantages, related not only to their
performance, such as high sensitivity, but also from an environmental point of view, reducing the use
of solvents, electricity, involved material, and generated waste. Along these same lines, recent
applications of portable liquid chromatography systems have a significant potential for solving
analytical challenges in various applications in situ or at‐situ monitoring, due to their ability to perform
measurements at the point of sampling. These potential applications are focused on the need to
obtain results quickly, overcome problems in the preservation of the sample or the remote location
of the monitoring site.
Despite the great advances made at the instrumental level, sample treatment continues to be
the stage of the analytical process with the greatest investment of time, sources of error and possible
losses of the analytes of interest, therefore the replacing of conventional offline techniques by novel
techniques, developed under the green chemistry approach, has become one of the main topics on
which researchers have put much effort. An important group of these novel techniques is those based
on the absorption of the analytes of interest in a solid, known as solid‐phase microextraction (SPME),
which reduce the consumption of solvents and therefore minimize the generation of waste, as well as
achieve higher productivity due to its automation capacity. In‐tube solid‐phase microextraction (IT‐
SPME) corresponds to a type of dynamic SPME, with figures of merit related to the reduction of solvent
consumption, easy automation, and miniaturization, allowing it to be easily coupled to miniaturized
chromatographic systems. Currently, the development and application of new sorbent phases that
allow increasing the selectivity and sensitivity of IT‐SPME is one of the main lines of investigation of
this technique.
In the framework of the development of this thesis, the research has been focused on the
application of miniaturized LC systems for the analysis of highly polar and non‐polar compounds in
various matrices such as biological samples, environmental waters, dietary supplements, and natural
resins. Likewise, aspects such as the development of new sorbent phases and the use of new
commercial phases for IT‐SPME have been evaluated. Furthermore, the evaluation of the portable
NanoLC system for the analysis of emergent compounds in environmental waters has been
successfully studied.

Index
CHAPTER 1. INTRODUCTION ........................................................................................................... 1
1. INTRODUCTION ............................................................................................................................. 3
1.1. IN-TUBE SOLID-PHASE MICROEXTRACTION (IT-SPME) ..................................................... 4
1.1.1. Theoretical considerations ............................................................................................ 6
1.1.2. Settings for IT-SPME ...................................................................................................... 7
1.1.3. Coupling with liquid chromatography ............................................................................... 9
1.1.4. Extraction phases for IT-SPME .................................................................................... 10
1.1.4.1. Conventional capillary columns ................................................................................. 10
1.1.4.2. Development of new sorbent phases for IT-SPME .................................................... 12
1.1.5. Off-line development ....................................................................................................... 16
1.2. MINIATURIZED LIQUID-CHROMATOGRAPHY .................................................................. 16
1.3. PORTABLE LIQUID-CHROMATOGRAPHY ......................................................................... 19
1.4. MATRIX AND ANALYZED COMPOUNDS .......................................................................... 23
1.4.1. Biological samples: trimethylxanthines ...................................................................... 23
1.4.1.1. Blood, plasma and serum .......................................................................................... 24
1.4.1.2. Urine ........................................................................................................................... 25
1.4.1.3. Saliva (oral fluid) ........................................................................................................ 26
1.4.1.4. Determination of trimethylxanthines ....................................................................... 28
1.4.2. Environmental samples: trimethylxanthines in waters ............................................. 30
1.4.3. Dietary supplements: Multiclass analysis ................................................................... 33
1.4.3.1. Major compounds ...................................................................................................... 35
1.4.3.2. Minor compounds ...................................................................................................... 37
1.4.3.3. Analysis of dietary supplements ................................................................................ 39
1.4.4. Natural resins: terpenic compounds ........................................................................... 40
CHAPTER 2. OBJECTIVES ................................................................................................................ 46
CHAPTER 3. EXPERIMENTAL METHODOLOGY ........................................................................... 51
3.1 CHEMICALS .......................................................................................................................... 52
3.2 INSTRUMENTATION ............................................................................................................ 54
3.2.1 Spectroscopic techniques .................................................................................................. 54
3.2.1.1 UV-vis spectrophotometry .......................................................................................... 54
3.2.2 Microscopic techniques ..................................................................................................... 54
3.2.2.1 Optical microscope ..................................................................................................... 54
3.2.3 Chromatographic techniques ............................................................................................. 55
3.2.3.1 Capillary liquid chromatography ................................................................................ 55
3.2.3.2 Portable Nano liquid chromatography ....................................................................... 56
3.3 SAMPLE TREATMENT ........................................................................................................... 56
3.3.1 IT-SPME online ................................................................................................................... 57
3.3.2 IT-SPME offline ................................................................................................................... 58
3.3.3 SPE ...................................................................................................................................... 59
3.4 SYNTHESIS OF NEW PHASES FOR EXTRACTION .................................................................... 59
3.4.1 Capillary columns coated with a silicon polymer .............................................................. 59
3.5 PROCEDURES AND EXPERIMENTAL CONDITIONS ................................................................. 60
3.5.1 Chromatographic conditions ............................................................................................. 60
3.6 ANALYZED SAMPLES ............................................................................................................ 63
3.6.1 Biological samples .............................................................................................................. 63
3.6.1.1 Serum .......................................................................................................................... 64
3.6.1.2 Urine ............................................................................................................................ 64
3.6.1.3 Oral fluid ...................................................................................................................... 64
3.6.2 Waters ................................................................................................................................ 64
3.6.2.1 Superficial waters (river and sea water) ..................................................................... 65
3.6.2.2 Tap water .................................................................................................................... 65
3.6.3 Dietary supplements .......................................................................................................... 65
3.6.3.1 Green coffee extracts .................................................................................................. 65
3.6.3.2 Fat burning capsules ................................................................................................... 65
3.6.3.3 Herbal preparation ...................................................................................................... 66
3.6.4 Natural resins ..................................................................................................................... 66
CHAPTER 4. RESULTS AND DISCUSSION ...................................................................................... 67
4.1 Caffeine and its metabolites in biological samples ............................................................... 68
4.1.1. Optimization of the chromatographic conditions ............................................................ 68
4.1.2. Optimization of IT-SPME ................................................................................................... 70
4.1.2.1. Capillary sorbent selection ........................................................................................ 70
4.1.2.2. Sample preparation, pH and ionic strength .............................................................. 71
4.1.2.3. Sample volume ........................................................................................................... 72
4.1.2.4. Diluted sample volume processed ............................................................................. 72
4.1.2.5. Flushing of capillary ................................................................................................... 73
4.1.2.6 Effect of proteins of oral fluid on the system pressure .............................................. 73
4.1.3. Analytical performance ..................................................................................................... 74
4.1.3.1. Calibration curve and matrix effect ........................................................................... 74
4.1.3.2. Limit of detection and quantification ........................................................................ 77
4.1.3.3. Precision ..................................................................................................................... 77
4.1.3.4. Recovery ..................................................................................................................... 78
4.1.3.5. Specificity and selectivity ........................................................................................... 79
4.1.3.6. Stability ...................................................................................................................... 80
4.1.3.7. Robustness ................................................................................................................. 81
4.1.4. Analysis of real samples .................................................................................................... 83
4.1.4.1. Concentration of caffeine in serum and saliva samples ........................................... 83
4.1.4.2. Correlation between serum and saliva concentrations ............................................ 85
4.1.4.3. Evaluation of precision from duplicate results .......................................................... 86
4.1.5. Conclusions ....................................................................................................................... 87
4.2 Trimethylxanthines in waters .............................................................................................. 88
4.2.1. Optimization of the chromatographic separation ........................................................... 88
4.2.1.1. Portable NanoLC ........................................................................................................ 88
4.2.1.2. Capillary LC ................................................................................................................. 89
4.2.1.3. Comparison of analytical parameters achieved by Capillary LC and portable NanoLC
................................................................................................................................................. 90
4.2.2. Sample treatment techniques .......................................................................................... 93
4.2.2.1. On-line IT-SPME ......................................................................................................... 93
4.2.2.2. Off-line IT-SPME ......................................................................................................... 96
4.2.2.3. SPE .............................................................................................................................. 98
4.2.3. Analytical performance IT-SPME-CapLC and SPE/portable NanoLC .............................. 102
4.2.4. Analysis of real samples .................................................................................................. 105
4.2.5. Conclusions ..................................................................................................................... 106
4.3 Analysis of dietary supplements ........................................................................................ 107
4.3.1. Optimization of the chromatographic separation ......................................................... 107
4.3.1.1. Multi-class method .................................................................................................. 109
4.3.1.2. Chlorogenic acids method ....................................................................................... 111
4.3.2. Extraction optimization .................................................................................................. 112
4.3.3. Analytical performance ................................................................................................... 114
4.3.3.1. Multi-class method .................................................................................................. 114
4.3.3.2. Chlorogenic acids method ....................................................................................... 118
4.3.4. Analysis of real samples .................................................................................................. 120
4.3.4.1. Multi-class method .................................................................................................. 120
4.3.4.2. Chlorogenic acids method ....................................................................................... 126
4.3.5. Conclusions ..................................................................................................................... 130
4.4 Terpenic compounds in microsamples of natural resins ..................................................... 131
4.4.1. Optimization of the chromatographic separation ......................................................... 131

4.4.2. Extraction optimization .................................................................................................. 136
4.4.3. Analytical performance ................................................................................................... 138
4.4.4. Analysis of real samples .................................................................................................. 140
4.4.5. Conclusions ..................................................................................................................... 143
CHAPTER 5. GENERAL CONCLUSIONS ......................................................................................... 145
BIBLIOGRAPHY ............................................................................................................................... 148
APPENDIX ........................................................................................................................................ 179
A.1 ABBREVIATIONS ................................................................................................................ 180
A.2 LIST OF FIGURES ................................................................................................................ 184
A.3 LIST OF TABLES .................................................................................................................. 190
A.4 CONTRIBUTION IN PUBLICATIONS ..................................................................................... 192

CHAPTER 1. INTRODUCTION

Chapter 1. Introduction
3
1. INTRODUCTION In the last 30 years, sample treatment techniques have shown an advance in the green
chemistry point of view, searching for new methodologies friendly with the environment, with less
waste, toxic solvent volumes, energy consumption and timeless development. In this sense, the work
of Gałuszka et al. [1] establishes through the mnemonic code SIGNIFICANCE, the 12 principles of
green analytical chemistry, as Figure 1 shows.
Figure 1. Mnemonic SIGNIFICANCE of the twelve principles of green analytical chemistry by Gałuszka
et al. [1]
Most of these principles have a great impact on the stage of sample preparation of the
analytical process, so the application of microextraction techniques, preferably online, as well as
coupled with miniaturized instrumental techniques is of great interest to the green analytical
chemistry. The current approach for sample treatment techniques aims to increase the selectivity
and sensitivity of the analysis [2], to extract, purify, concentrate and/or derivatize the analytes,
without using laborious and tedious procedures, with a high economic and time cost such a case of
conventional extraction techniques.
In this context, the greening of the sample treatment process is a current demand of
contemporary researchers, so that, classical sample preparation techniques such as solid‐phase
extraction (SPE) and liquid‐liquid extraction (LLE) are being rapidly replaced by microextraction
techniques, generally divided into two groups: Liquid‐Phase and Solid‐Phase extractions [3]. In the
S Select direct analytical technique
I Integrate analytical processes and operation
G Generate as little waste as possible and treat it properly
N Never waste energy
I Implementautomation and miniaturization of methods
F
Avoid derivatizationA
I
C
Increase safety or operator
Note that the same sample number and size shouldbe minimal
Favor reagents obtainedfrom renewable source
Carry out in-situmeasurements
N
C Choose multi-analyte or multi-parameter method
E Eliminate or replace toxic reagents

Chapter 1. Introduction
4
first one group, single‐drop microextraction (SDME), dispersive liquid‐liquid microextraction (DLLME)
or hollow‐fiber liquid‐phase microextraction (HF‐LPME) are some examples included.
Solid‐phase microextractions techniques (SPME) are based on sorption processes of the
analytes in a solid, where SPME is the most widely used for several different matrices and using
alternative sorbent materials [4]. Configurations of SPME can be classified into dynamic and static
techniques. In the last one, the extraction is carried out in a stirred sample mode. Examples of these
are thin‐film, fiber microextraction, and rotating‐disk sorptive extraction. On the other hand,
methods such as in‐tube SPME, in‐tip and in‐needle microextraction, and capillary microextraction
are classified as dynamic techniques [5]. Other denomination employed are microextraction in
packed syringes (MEPS), disposable pipette tip extraction (DPX) and stir bar sorption extraction
(SBSE). Figure 2 shows a schematic summary of microextraction techniques.
1.1. IN-TUBE SOLID-PHASE MICROEXTRACTION (IT-SPME)
As mentioned above, an important group of microextraction techniques includes those that
use the mechanism of sorption of the analytes in a solid, within which is the solid‐phase
microextraction (SPME), introduced in 1990 by Pawliszyn et al [6], which manages to miniaturize the
sample preparation stage, as well as sampling, extraction, and preconcentration in a single stage.
Later, in order to avoid the disadvantages of SPME, associated with fiber fragility and long desorption
times, Eisert y Pawliszyn introduced the In‐tube Solid‐phase microextraction (IT‐SPME) [7].
IT‐SPME has been widely used because of its advantages such as the elimination of solvent
extraction, as well as combining the extraction, clean‐up and preconcentration in a single step, so
that it significantly reduces the analysis time. Likewise, IT‐SPME shows special attention for the on‐
line coupling to liquid chromatography (LC), which facilitates the separation and detection of target
analytes.
Also, it is possible to affirm that IT‐SPME is an environmentally friendly technique, achieving
the minimization of toxic solvents, waste reduction and being energy‐efficient and cost‐effective,
capable of maintaining the reliability of performance parameters, such as sensitivity, precision, and
accuracy [8].
The principal topics of this technique are aimed at developing the coupling with new
chromatographic modes, such as ultra‐high performance liquid chromatography (UHPLC), capillary
liquid chromatography (cap‐LC) and Nano liquid chromatography (Nano‐LC) [9], as well as the
synthesis of new extraction phases, off‐line development, and applications.

Chapter 1. Introduction
5
Figure 2. Schematic summary of microextraction techniques.

Chapter 1. Introduction
6
The application of IT‐SPME has increased since its appearance, which is supported by the
linear increase in papers and citations. The database ISI Web of Science shows more than 430 entries
at the end of 2019, with an H index of 69 and more than 15,000 citations (Figure 3) for the research
topic “in‐tube solid phase microextraction”.
Figure 3. Evolution in the number of works of the topic "in-tube solid-phase microextraction" since
1997. Source Web of Science (May 2020).
1.1.1. Theoretical considerations In IT‐SPME the sample is passed throughout a capillary, generally a fused‐silica tube coated or
packed on its inner surface with a sorbent phase, where analytes are retained and concentrated by a
process of sorption. Once the analytes are retained, they are desorbed by filling the capillary with a
proper solvent, to be collected for further processing or transferred to the analytical instrument
(static desorption), or if the mobile phase was used, dynamic desorption was carried out [17]. Due to
the amount of sample processed is generally higher than extracting sorbent, IT‐SPME is considered a
not exhaustive technique [18].
For those analytes with strong interactions with the extractive phase, the static mode is
preferred, as well as in the case of an off‐line technique application. In other case, analytes are
desorbed and transferred simultaneously to the analytical instrument by the mobile phase (dynamic
desorption).
0
10
20
30
40
50
60
Entr
ies in t
he s
cie
ntific li
tera
ture
Year

Chapter 1. Introduction
7
As well as in other sorptive techniques, some experimental parameters, such as phase
thickness, capillary length and diameter, processed sample volume, pH, ionic strength and washing
solvent, must be optimized in order to achieve the greatest benefits of this technique. The coupling
with a suitable chromatographic system is important for decreasing the LODs. Although IT‐SPME has
been used in combination with gas chromatography (GC), liquid chromatography (LC) is by far the
most used system in assays.
Commercial GC columns have been used to perform IT‐SPME, typically with two class of
sorbents: Si‐based (polysiloxane coating) and C‐based (divinylbenzene, polyethylene glycol, and
carbon molecular sieves). More than 70% of the studies use Si‐based sorbents [19]. Although the use
of conventional capillary coatings has allowed the popularity of this technique, it represents its main
limitation, the low extraction efficiency that can be achieved, attributed to the low sorbent loading
capacity, stability, and in some cases, the long extraction times involved in the extraction due to the
slow diffusion of the analytes from the sample to the capillary coating.
Due to this, in recent years the research works have been focused on finding more efficient
capillary coatings, as well as exploring new extraction phases of IT‐SPME. These capillary coatings can
tune the interaction, obtaining substantial improvements and counteracting the aforementioned
limitations.
1.1.2. Settings for IT-SPME The coupling of IT‐SPME with LC has been established through two types of configurations,
which require specific configurations as well as different levels of instrumentation. These are referred
to as draw/eject IT‐SPME and flow‐through IT‐SPME, each one with its advantages and limitations.
In draw/eject mode, the sample is repeatedly passed through the extractive capillary, that is
placed between the needle and the injection loop (or the metering pump) of the autosampler, by
cyclic reversing of the flow direction of the sample (draw/eject) by means of a programmable
autosampler. When the sample is aspirated from the sample vial, it becomes into contact with the
extractive capillary. As a result, a fraction of the analyte molecules migrates from the sample to the
extractive phase. After a number of cycles, the analytes are desorbed and injected (Figure 4.A).
Draw/eject IT‐SPME additional solvents (water or buffers) can be placed in different vials and
flushed though the capillary in order to eliminate selectively matrix components before the
desorption stage, or to clean and condition the capillary before loading the next sample [20]. This
mode of IT‐SPME has been especially used in the analysis of biological samples, where the sample
volume is limited, typically a few millilitres are used [21].

Chapter 1. Introduction
8
The distribution equilibrium of the extraction is achieved with a number of cycles, generally
greater than 20: however, it is not always possible to achieve it, since the analytes are partially
desorbed with each loading cycle. Likewise, the times involved in the extraction stage can be much
longer than those required for the chromatographic separation.
In the flow‐through IT‐SPME setting the sample is passed through the extractive capillary once
without reversing the flow direction. The extractive capillary is directly or indirectly connected to the
chromatographic column so that the compounds are desorbed by filling the capillary with a
desorption solvent (off‐line) before transferring them to the chromatographic column, or by flushing
through the capillary the mobile phase (on‐line). This configuration has versatility because it is
possible to use a variable combination of pumps, switching valves or external accessories (such as
those intended to create magnetic or electric fields or control the temperature) to implement the
flow of IT‐SPME, making it more useful.
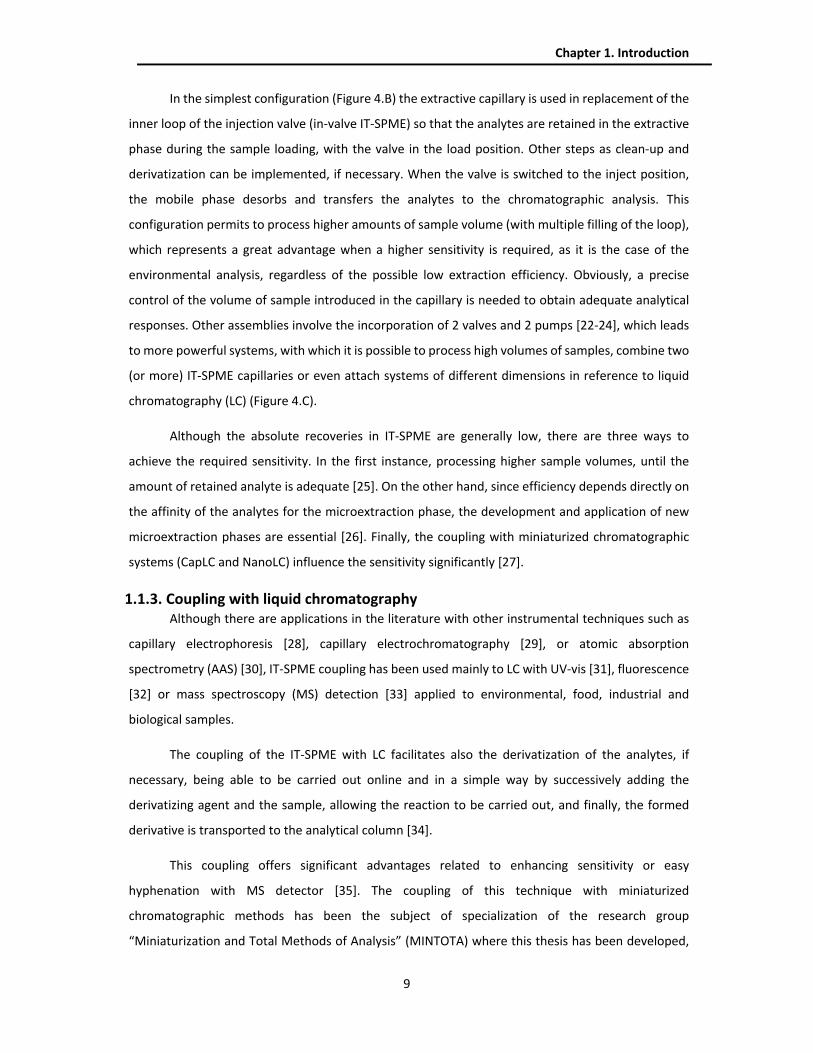
Figure 4. Schematic representation of configurations in IT-SPME-LC: A) draw/eject mode; B) in valve
with one pump and C) in valve with two pumps.
C
B
A
Analytical Column
Detector
Extractive Capillary
Pump
Extractive capillary
6 5
32
Waste
1 4
Analytical Column
DetectorPump
Waste
Pump
Detector
Extractive capillary
5
32
Waste
6
1 4
PumpAnalytical Column
Chapter 1. Introduction
9
In the simplest configuration (Figure 4.B) the extractive capillary is used in replacement of the
inner loop of the injection valve (in‐valve IT‐SPME) so that the analytes are retained in the extractive
phase during the sample loading, with the valve in the load position. Other steps as clean‐up and
derivatization can be implemented, if necessary. When the valve is switched to the inject position,
the mobile phase desorbs and transfers the analytes to the chromatographic analysis. This
configuration permits to process higher amounts of sample volume (with multiple filling of the loop),
which represents a great advantage when a higher sensitivity is required, as it is the case of the
environmental analysis, regardless of the possible low extraction efficiency. Obviously, a precise
control of the volume of sample introduced in the capillary is needed to obtain adequate analytical
responses. Other assemblies involve the incorporation of 2 valves and 2 pumps [22‐24], which leads
to more powerful systems, with which it is possible to process high volumes of samples, combine two
(or more) IT‐SPME capillaries or even attach systems of different dimensions in reference to liquid
chromatography (LC) (Figure 4.C).
Although the absolute recoveries in IT‐SPME are generally low, there are three ways to
achieve the required sensitivity. In the first instance, processing higher sample volumes, until the
amount of retained analyte is adequate [25]. On the other hand, since efficiency depends directly on
the affinity of the analytes for the microextraction phase, the development and application of new
microextraction phases are essential [26]. Finally, the coupling with miniaturized chromatographic
systems (CapLC and NanoLC) influence the sensitivity significantly [27].
1.1.3. Coupling with liquid chromatography Although there are applications in the literature with other instrumental techniques such as
capillary electrophoresis [28], capillary electrochromatography [29], or atomic absorption
spectrometry (AAS) [30], IT‐SPME coupling has been used mainly to LC with UV‐vis [31], fluorescence
[32] or mass spectroscopy (MS) detection [33] applied to environmental, food, industrial and
biological samples.
The coupling of the IT‐SPME with LC facilitates also the derivatization of the analytes, if
necessary, being able to be carried out online and in a simple way by successively adding the
derivatizing agent and the sample, allowing the reaction to be carried out, and finally, the formed
derivative is transported to the analytical column [34].
This coupling offers significant advantages related to enhancing sensitivity or easy
hyphenation with MS detector [35]. The coupling of this technique with miniaturized
chromatographic methods has been the subject of specialization of the research group
“Miniaturization and Total Methods of Analysis” (MINTOTA) where this thesis has been developed,

Chapter 1. Introduction
10
contributing since 2006, in particular with miniaturized LC techniques such as CapLC and NanoLC.
Unlike NanoLC, the coupling to CapLC can be carried out with minor modifications concerning the
conventional LC, therefore the IT‐SPME‐CapLC coupling is sufficiently resolved, achieving its
application in several fields of analysis such are the environmental, food, biological , industrial and
forensic [36‐40], being mainly the one employed in this work.
The coupling IT‐SPME to NanoLC has recently been introduced [41], so studies are needed to
elucidate and demonstrate the benefits and possibilities of this configuration. There are two practical
aspects to overcome in this coupling. On the one hand, the low mobile‐phase flow rates used in
NanoLC makes it essential to use capillaries with low inner diameters (≤ 100 µm). On the other, as
the number of coatings of commercially capillaries compatible with these systems is still rather
limited, new sorbents with improved extraction capabilities are needed to be developed [23].
1.1.4. Extraction phases for IT-SPME Initially in IT‐SPME, sorbent phase available in the capillary columns of gas chromatography,
called conventional phases, were used. However, as mentioned above, the development of new
sorbent phases is one of the main topics in which researchers and users of the technique have made
continuous efforts. It is known that the nature of the extraction phase will directly affect the
sensitivity of the technique since the ability of the analytes to interact with it, plays an important role
in retention and preconcentration in the sorption stage. Therefore, in the following lines, the main
extraction phases used in IT‐SPME are discussed, with special attention to those used in the
development of this work.
1.1.4.1. Conventional capillary columns The use of this type of capillaries makes it possible to have a variety of sorbent phases with
different polarity and thickness or sorbent layer. As mentioned before, the sorbents can be made of
polymeric material of carbon or silicon, which can be modified with other molecules, which allows
increasing the selectivity for the analytes of interest.
To date, columns based on polydimethylsiloxane (PDMS) are the most used for this technique.
PDMS is a polymer of the silicon family consisting of flexible chains of Si‐O(CH3)2 units, which has a
transparent appearance that due to its marked hydrophobic character does not react with most
chemical products, including hydrophilic solvents, and with the advantages of not being toxic or
bioaccumulative [42]. When IT‐SPME is coupled to LC, the use of PDMS based sorbents is extremely
convenient, since its hydrophobic character will favor the adsorption of the hydrophobic compounds
present in the sample, being an ideal phase for chromatographic separations in reverse phase.

Chapter 1. Introduction
11
The use of conventional columns of modified PDMS, through the incorporation of functional
groups, mainly variable percentages of polydiphenylsiloxane and others, has been very useful in the
application of IT‐SPME. With these modifications, it is possible to reduce the hydrophobicity of the
extractant phase, as well as to establish new interactions of π‐π type of the analytes with the aromatic
groups, which will lead to greater retention [43]. To date, the results achieved with PDMS capillaries
modified with diphenyl groups have been reflected in works in the literature that report the use of
these, in various fields of analysis, such as environmental pollutants [44], pharmaceuticals [39],
industrial products [45], biologicals [46] and study of nanoparticles [23].
A few applications with commercial GC columns based on other silicon derivatives, such as
cyanopropylmethylsilicone or dimethylsiloxane, have also been reported for the study of biological
matrices [47]. In relation to conventional columns with C‐based sorbents, mainly those that use
polymeric sorbents of divinylbenzene type (Supel‐Q PLOT and/or Valco PLOT) or molecular carbon
(Carboxen 1006) have shown excellent results. The sorbent in these columns, PLOT type (open porous
layer tubular columns), has a larger surface area which leads to an increase in the retention of the
extracted target compounds. Some papers of the literature have demonstrated the applicability of
these sorbents for the determination of compounds of relative polarity [48]; and mainly for the
determination of non‐polar compounds in environmental [49], food [50] or bioanalysis [51].
It is important to point out the performance of the CP‐Pora PLOT amines column, which due
to dipole‐dipole interactions, hydrogen bonds or ion exchange, has a higher extraction efficiency for
relatively polar compounds, such as medicines for influenza treatment [52]. Table 1 shows selected
examples of different methods of IT‐SPME coupled to LC in which commercial capillary columns of
gas chromatography are used. In the present thesis, commercial columns have been used for the
determination of trimethylxanthines and triazine pesticides in biological and environmental samples,
including those of fused‐silica coated with PDMS, with different percentages of diphenyl groups (5,
20, 35 and 50%), as well as commercial Carbowax columns coated with polyethylene glycol (PEG),
FFAP columns coated with PEG modified with nitroterephthalic groups, and two polystyrene‐
divinylbenzene (PS‐DVB) columns with different coating thickness.

Chapter 1. Introduction
12
Table 1. Examples of different procedures specified in LC systems with capillary columns methods used
in IT-SPME.
Extraction Phase
Application field Analytes System Reference
TRB‐5 Environmental DEHP CapLC‐DAD [53]
TRB‐5 Food DEHP CapLC‐DAD [54]
TRB‐5 Environmental Ethylenediamine HPLC‐FLD [55]
TRB‐35 Biological Meropenem CapLC‐DAD [39]
Supel‐Q PLOT Biological Anabolic steroids LC‐MS [56]
Supel‐Q PLOT Biological Heterocyclic
amines LC‐MS/MS [57]
Carboxen 1006 PLOT
Food Patulin LC‐MS [58]
CP‐Pora PLOT amine
Environmental
Perfluorooctanoic acid,
Perfluorooctane, sulfonate
LC‐MS [59]
1.1.4.2. Development of new sorbent phases for IT-SPME Despite the good results achieved with commercial capillary columns, treated in the previous
section, the variety of sorbents available is still limited, especially for smaller diameter columns
typically used in miniaturized LC systems. In addition, the phase thickness of these columns becomes
insufficient in those determinations where it is essential to reach lower detection limits. In this way,
the functionalization of the capillary columns, as well as the synthesis of new sorbent materials,
capable of tune the interaction, thereby, improving the sensitivity, selectivity, stability and extraction
time are an important subject matter in IT‐SPME. The sorbent extraction phases recently developed
for use in IT‐SPME are discussed below.
Metal nanoparticles and metal oxides. In recent years the use of nanomaterials has extended to
numerous fields of knowledge, such as medicine, electronics, agriculture, food industry or
biotechnology. In the specific case of Analytical Chemistry, its application as sorbents in different
extraction techniques has been proposed [60, 61]. In that sense, the increase in nanomaterial
extraction capacity is due to two different and complementary effects. In the first place, its presence
in the extraction phase modifies the morphology of the sorbent, thereby increasing its porosity [62].
On the other hand, new interactions, as well as an increase in the number and intensity of existing
ones, are obtained by immobilizing the materials in the extraction phase, which will also favor the
useful life of the capillary, reducing its fragility. Castillo‐García et al., point out that the main

Chapter 1. Introduction
13
advantages of the use of nanomaterials as extraction sorbents include increased adsorption and
preconcentration capacity, easy functionalization and possibility of reuse [63].
Metal nanoparticles and metal oxides are nanomaterials formed by one, two or three metals
and/or metal oxides. These materials have a large surface area and high absorption efficiency, hence
the special interest in their application as a sorbent phase [64]. In the case of metal oxides, the active
sites contain hydroxyl groups. These nanoparticles have the characteristic of establishing ion
exchange interactions, depending on the pH they can act as cation or anion. Likewise, both the metal
oxide NPs and the metal NPs can act as Lewis acids, presenting a strong interaction with species that
can act as Lewis bases [65]. To date, the most used nanomaterials of this type are those of Au, Ag,
Al2O3, Fe3O4, CeO2, SiO2, TiO2, ZnO and ZrO2. However, despite its wide use in fiber microextraction
techniques and other extraction formats, its use in IT‐SPME is still reduced [66, 67].
Interesting applications have been carried out with NP's of TiO2 and SiO2, the first ones for the
extraction of phosphopeptides [68], and the latter's, due to their high hydrophobic grade, for the
extraction of PAHs and endocrine disruptors by IT‐SPME‐UV [26]. The NPs of Fe3O4 are a
superparamagnetic material that can be used in magnetic IT‐SPME. By applying a magnetic field to
the extraction phase, it creates a magnetic order with regions of a different magnetic gradient. Upon
entering the sample through the extraction capillary, subjected to the magnetic field, a retention
effect is achieved for diamagnetic analytes in regions where the magnetic field is minimal, which leads
to an improvement in the extraction capacity. In the elution part, the external magnetic field is
eliminated, making the analytes easily eluted with the appropriate solvent or the mobile phase [69,
70].
The influence on the extraction capacity of a polymeric material of tetraethylorthosilicate
(TEOS) and trimethoxyethylsilane (MTEOS) fortified with NPs of SiO2, TiO2, ZrO2, CuO and ZnO has
been an object of study in this work, for the determination of trimethylxanthines in biological and
environmental samples.
Ionic liquids (IL). Ionic liquids are defined as ionic salts that are in a liquid state at room temperature,
formed by an organic cation (for example, imidazolium, pyridinium or quaternary ammonium) and an
inorganic or organic anion (Cl‐, Br‐, PF6‐, trifluoromethylsulfonate ) [71]. The application of ionic
liquids to increase the extraction capacity in SPME techniques, including IT‐SPME, has been gaining
popularity in the last years. This is due to its retention capacity of analytes through different
interaction mechanisms, such as hydrophobic and hydrophilic interactions, ion exchange, π‐π type or
hydrogen bonds [72].

Chapter 1. Introduction
14
Initially, ionic liquids were linked to the extraction phase by covalent bonds. However, at
present, they are being part of the polymer network that forms the extraction phase, as one monomer.
Some works of literature apply ionic liquids for determination of PAHs in water, based on the
monolithic polymer 1‐dodecyl‐3‐vinylimidazolium, which was used to coat steel fibers that were
subsequently packaged in a PEEK capillary for this purpose [73]. The sensitivity achieved by this
sorbent phase improved 200 times the extraction capacity than other SPME techniques, and the
detection limits were lower than those obtained when conventional phases were used.
Monoliths. One of the most active areas of research efforts for IT‐SPME is the development of
monolithic capillary columns. Monolithic materials have special structural characteristics since they
have macropores and mesopores. The first ones facilitate rapid dynamic transport, which allows
increasing the flow of the mobile phase, this reduces the analysis time without a significant increase
in pressure compared to the use of particulate capillary columns. Other advantages include a rapid
mass transfer, high stability, and loading capacity, as well as a wide variety of surface chemistry[74].
According to the nature of the monomers that form the monolith sorbent, this can be
classified into organic, silicon‐based, and hybrid monoliths. The two most common procedures for
the synthesis of monolith capillary columns are the thermal and UV‐polymerization, typically using as
support capillaries fused silica, PEEK and PTFE. The modification of the capillary surface can be done
in‐situ if the molecule, material or nanomaterial to be immobilized is added to the monomer mixture
or carried out in another stage different from the synthesis.
For fabrication of these monoliths, generally, five steps are required, include activation,
modification of the capillary surface, deposition of the polymeric mixture, polymerization, and
washing and drying. Activation of capillary columns is necessary to activate silanol groups and
normally is carried out by a rinse with methanol, then the modification of the surface is needed to
achieve the covalent binding of the capillary inner wall and polymeric material [75].
A mixture composed of monomers, such as choline‐chloride, acrylamide, divinylbenzene or
methacrylic acid, a crosslinking agent, commonly azobisisobutyronitrile (AIBN), and a solvent mixture
such as isopropanol, toluene, methanol, and isooctane, called porogen, whose function is to form the
pores, are needed to obtain the monolith, which is passed through the capillary column. Finally, if a
thermal treatment is applied, typically temperatures up to 80°C with times between 3 and 24 hours
are required. In UV‐treatment, UV radiation for less than 30 minutes is necessary.
The application of organic monoliths as sorbent phases for IT‐SPME to resolve different
analytical problems has been reported in the literature. In food analysis, Wu et al. [76] reported the
use of poly (octadecyl methacrylate‐co‐ethylene dimethacrylate) monolith for the analysis of trans

Chapter 1. Introduction
15
fatty acids in samples of instant coffee. In environmental analysis, the determination of thiazoles in
water samples by the application of a poly (4‐vinylpyridine‐co‐ethylenedimethacrylate) monolith has
been described by Pang et al., [77]. Likewise, the analysis of alkaloids derived from tobacco in urine
samples has been carried using IT‐SPME coupled to LC‐MS with a poly (N‐isopropylacylamide‐co‐
divinylbenzene‐co‐N, N`‐methylenediacrylamide) monolith [78].
Molecularly Imprinted Polymers (MIPs). In MIPs the specific gaps of these three‐dimensional
polymers allow a selective interaction with those compounds whose structure is similar to that
molecule. These specific gaps are induced by a template molecule. The application of these sorbent
phases has been studied extensively for SPE applications, as a mechanism to improve the selectivity
for target analytes, which can be used too for capillary columns. The application of these sorbents
represents advantages such as high thermal, mechanical and chemical resistance, easy synthesis and
low cost, and mainly, their selectivity can result in an improvement in the extraction efficiency [79].
The preparation of this type of polymers is quite similar to that described in monoliths
synthesis, with the difference that the template molecule, with a similar structure to analytes, must
be added to the monomer mixture and not polymerize with them. After the polymerization process
is done, the polymer chains grow around the template molecule in all three dimensions, and finally,
the template molecule is removed, and the sorbent phase obtained has a size, shape, and chemical
interactions specifics for the analytes of interest [80].
Recently, the preparation of a MIPS as an extraction phase in IT‐SPME‐LC for the
determination of citrin in food matrices such as cereals and food supplements has been reported by
Lhotská et al. They used 1‐hydroxy‐2‐naphthalic acid as the template molecule, acrylamide as the
functional monomer, ethylene glycol dimethacrylate as the crosslinker, and acetonitrile as the pore
generator, improving the sensitivity and selectivity compared with traditional sorbents as a C18 phase
[81].
Restricted Access Materials (RAMs). Restricted access materials are sorbent materials with a capacity
for the retention of different types of analytes regardless of the presence of proteins in the analyzed
sample, based on a process of molecular exclusion, which increases the selectivity. The use of these
materials has an important application for analysis of biological samples, where the presence of
macromolecules as proteins affects the sensitivity and selectivity of the extraction, as well as, they
can obstruct tubing and columns of the chromatographic system.
In RAMs preparation, the sorbent's surface is modified by the addition of hydrophilic
compounds that prevent the interaction of proteins with the sorbent, that means a protective layer
is created on the sorbent that acts as a filter, and only the smallest molecules can be retained in the

Chapter 1. Introduction
16
sorbent [82]. The resulted material can be easily combined with other materials to produce improved
sorbents. Souza et al. [83] reported the determination of parabens in breast milk samples using IT‐
SPME‐UHPLC‐MS/MS without the need for any prior treatment of the sample. Likewise, Huang et al.
synthesized a RAM based on an inorganic monolith of methyltrimethoxysilane and APTES for the
determination of antibiotic residues in the same matrix [82].
1.1.5. Off-line development It is possible to hold out the IT‐SPME procedure offline, although only 20% of the literature
reports its use [84], due to the loss of some advantages of the technique, as not all the extracted
analytes are introduced within the determination system, whereby a brand new step is introduced,
and automation is not achieved. Nevertheless, the best advantage of the operation is that, once the
target analytes are extracted, cleaning operation are often administrated that facilitate the
compatibility with chromatographic or detection systems, as an example, to derivatize the extracted
compounds [85].
Normally IT‐SPME offline has been used with electrophoretic techniques, HPLC, UHPLC and
mass spectrometry detectors [86, 87]. This work is pioneering to develop a method based on IT‐SPME
offline combined with a hand‐portable LC for the determination of trimethylxanthines in
environmental samples.
1.2. MINIATURIZED LIQUID-CHROMATOGRAPHY
The first work of the literature using a column with an internal diameter (i.d.) of 1 mm to
obtain the separation of ribonucleotides was developed by Horváth et al. at the end of the ´60s [88].
Ten years later, Tsuda and Novotny established the required equipment for working with capillary LC,
implementing modifications on conventional injection and detector systems aiming to reduce the
band‐broadening effects [89]. In the following decades, some publications continued to use columns
below that internal diameter. Nowadays, it is possible to find columns with an internal diameter
below 0.1 mm, as it is the case with columns for NanoLC [90].
Among the main advantages of miniaturized systems, we can point out the decrease in the
consumption of the mobile phases that promotes a reduction in both solvent consumption and
analysis waste. It is also possible to achieve a reduction in sample consumption, which may be
important in some fields of analysis. On the other hand, the use of analytical columns with low
internal diameter allows reducing the dispersion of the analytes by decreasing the chromatographic
dilution, which translates into an improvement in the signal‐to‐noise ratio, resulting in a significant
increase in sensitivity with respect to conventional LC systems. Additionally, the low flow rate allows

Chapter 1. Introduction
17
direct hyphenation with mass spectrometry (MS) and flame ionization detector (FID) [91, 92]. It is
known that the use of capillary columns with small i.d. values improve chromatographic efficiency,
as well as minimizes band broadening [93].
Despite the advantages obtained with the decrease of the i.d. in miniaturization of the LC
systems, another parameter of interest is the particle size of the stationary phase. In that sense, these
particles have undergone modifications, such as the decrease of the diameters, superficially porous
particles and a more diverse range that has contributed to a better separation performance [94].
Other instrumental components of miniaturized systems must be modified, so, in the following lines,
the main components of miniaturized LC instrumentation are briefly discussed.
The solvent delivery for miniaturized LC systems involves important challenges to ensure the
generation of precise, accurate and pulseless pumping at low flow rates, achieving µL or nL per min.
The first commercial devices developed included a mobile phase split valve coupled in the pump
outlet, to achieve a nano and capillary flow rate. However, this system has some drawbacks, such as
not achieve a significant decrease in waste generation, irreproducible results due to variable split
ratios, and flow fluctuations due to the varying viscosity of the gradient solvent mixtures [95].
Nowadays, piston and syringe pumps continue being the pump of choice in new miniaturized
HPLC systems. The miniaturized dual‐piston reciprocating pump with an electronic controller is
capable of assuring reproducible flow rate under isocratic and gradient elution without splitters.
However, most commercial systems still use a splitter after the mixer chamber, so a high amount of
the mobile phase goes to waste. On the other hand, a syringe pump may be thought of as a type of
piston pump without pulsation. Nevertheless, they find limited to a finite volume of solvent in the
inner reservoir for the separation. A way to overcome this limitation is the configuration of LC
miniaturized with two or more syringe pumps, it allows a continuous mobile phase flow in isocratic
mode or performing gradient mode with a finite volume of solvent [96].
In the last years, the application of electroosmotic pumps (EOPs) has been popularized, due
to the growing trend in microanalytical systems. These pumping systems use electroosmosis through
charged porous media (pumping elements) to generate pressure and flow pulse‐free, offering a cost‐
effective and simplistic method, readily miniaturized and integrated [97]. Despite their advantages,
the EOPs show some limitations, as pump‐solution incompatibility with high organic contents, flow
rate fluctuations, unstable voltage sources, and/or chemical breakdown within the pumping element
itself [98]. However, more efforts in research are needed to overcome its limitations before they will
ever reach the market.

Chapter 1. Introduction
18
Injector choice influences at void volume, flow disturbance, and precision to reduce band
broadening and increase resolution. However, due to their inherent small size, injectors not
undergone big transformations over the years. Until now, two categories are available: (1) stop‐flow
and (2) continuous‐flow injectors. The last one has been widely used in prototypes and commercial
systems; nevertheless, they typically cause an increased dead‐volume. On the other hand, Stop‐flow
injectors allow for much lower dead‐volume, so in the last few years they have been used with either
manual control or an actuated switch [99]. The extra‐column dispersion in miniaturized LC must be
avoided by the use of connections tubing and fittings of reduced inner diameter (25‐75 µm).
The miniaturization of the rest of the components of the chromatographic system involves
the resizes the detectors, in order to maximize the detectability, resolution, and efficiency. The
simplest class of detectors is absorbance detectors, such as UV‐Vis absorption detector, which cell
volume in miniaturized LC is reduced in comparison with conventional instruments [100]. Recently,
the development and application of the small size LED‐UV absorption detector has shown good
results in portable miniaturized LC [101]. Likewise, miniaturized mass spectrometry development and
commercialization are progressing rapidly [102], and many applications are anticipated since MS
presents good selectivity, detectability, and can generate additional chemical structural information.
In general, liquid chromatography systems can be classified according to the size of the
internal diameter of the analytical column or the flow used in the mobile phase, both criteria being
dependent on each other, as well as critical when defining their performance, coupling and
applications. Figure 5 shows the currently accepted classification for liquid chromatography systems
and their typical values.

Chapter 1. Introduction
19
Figure 5. Classification of liquid chromatography systems and operational parameters.
The application of LC miniaturized systems has been important for the resolution of analytical
problems, becoming effective and versatile tools for the study of various matrices and analytes. Table
2 presents some selected examples of the application of miniaturized liquid chromatography found
in the literature.
1.3. PORTABLE LIQUID-CHROMATOGRAPHY
The development of miniaturized systems has opened the possibility of the introduction of
hand‐portable LC instruments, which have significant potential for solving analytical challenges in
various applications in situ or at‐situ monitoring, due to their ability to perform measurements at the
point of sampling. The potential applications of portable LC systems focus on the need to obtain
results quickly, overcome problems in the preservation of the sample or remote location of the
monitoring site.

Chapter 1. Introduction
20
Table 2. Examples of application of different procedures based on miniaturized LC.
LC system-Detector
Application Column specification
Stationary phase or coated material
Reference i.d. (µm)
Length (cm)
Flow rate (µL/min)
CapLC‐UV Pharmaceuticals in biological sample
300 15 4 C18, 2 µm [103]
CapLC‐DAD
Sulfonylurea herbicides in
environmental water 300 15 10 C18, 5 µm [104]
CapLC‐MS Antidepressants in human blood drop
500 25 20 C12, 4 µm [105]
NanoLC‐UV
Pharmaceutical drugs in commercial preparations
75 20 0.23
Poly (glycidyl methacrylate‐
coethylene dimethacrylate)
monolith
[106]
NanoLC‐DAD
∆9‐tetrahydrocannabinol,
cannabidiol and cannabinol residues on different surfaces
75 5 0.80 C18, 3.5 [107]
NanoLC‐MS
Pesticides in food 75 15 0.30 C18, 3 [108]
DAD: diode array detection, MS: mass spectrometry, UV: ultraviolet absorption.
Like any other LC instrument, the main components that a portable LC system must include
are (a) an eluent pump; (b) an injector assembly to introduce the sample; (c) a column that separates
the analytes, and (d) a detector to record and, ideally, quantify the individual components that leave
the column [109]. At this point, it is important to establish that there can be three types of portable
instruments, based on their size: handheld, person‐portable, and transportable [110]. In that sense,
until a few years ago the use of these systems has involved an important challenge, mainly due to the
inconveniences associated with the reduction of solvent consumption and requirements for size,
weight and system power [111].
According to Sharma et al [112], there are at least ten essential requirements to consider an
LC system as portable, related to aspects of size, performance, operation and functionality:

Chapter 1. Introduction
21
(1) weighs <7 kg and measures < 16,387 cm3;
(2) contains all necessary electronics, digital interface and software integrated;
(3) allow at least 8 hours of operation;
(4) is easily operable with minimal supervision;
(5) is rugged enough to withstand changes in temperature and humidity;
(6) needs short instrument warm‐up time;
(7) uses low amounts of toxic organics;
(8) is customized for capillary column use with a non‐splitting flow arrangement, non‐splitting
injector, and low extra column volume to minimize dispersion;
(9) is integrated with a small detector that has excellent sensitivity; and
(10) is capable of binary gradient generation, competitive in performance to benchtop
instruments.
To date, some works have reported on the development of hand‐portable LC systems, the first
of which was developed by Baram et al. [113] in 1996, with a power requirement similar to
conventional LC systems and was used for the analysis of various compounds of environmental
interest. In the following years other systems appeared, however some presented operational
problems or limited applications [111]. Some other commercial systems were deprecated, while
certain works that attribute the term of portability do not complete the requirements to be
considered as a portable.
Recently, Lam et al. published the results of the development and application of a homemade
miniature capillary LC system for the determination of small pharmaceutical molecules by UV
detection and capable of coupling to a mass detector, with excellent performance [114]. Axcend®
company has introduced in 2019, a new portable nano liquid chromatograph with an on‐column UV‐
absorption detector [115]. Flow rate of the mobile phase in the order of 2 µL in gradient elution is
achieved. Here, the performance of this instrument was checked and evaluate what variables are
needed to optimize for obtaining suitable results. Table 3 includes a comparison of current and
historical portable LC systems reported in the literature, with special attention to their applications
and compliance with the portability criteria established by Sharma.

Chapter 1. Introduction
22
Table 3. Summary of modern and historical portable LC systems reported in the literature.
Portable LC systems
Application field / analytes
Size and weight specifications
Essential requirements a
Total weight
(kg)
Total dimension
(cm3)
Physical characteristics
Performance Operation Functionality
Baram (1996) [113]
Environmental / Pesticides,
phenols and phthalates
14 31800 0 + ++ +
Tulchinsky (1998) [116]
Environmental / Organic and
inorganic compounds
9.5 23575 0 + ++ ++
Ishida (2012) [117]
Environmental / Alquilphenols
2.0 9828 +++ + +++ ++
Sharma (2014) [111]
Standards / Uracil and alkyl‐
substituted benzenes
4.4 7812 +++ ++ +++ +++
Lam (2019) [115]
Environmental / Pesticides,
phenols and phthalates
2.7 7252 +++ +++ ++ ++
Chatzimichail (2019) [118]
Environmental / Pesticides,
phenols and phthalates
6.7 13398 ++ ++ ++ +++
Abonamah (2019) [110]
Forensic / Fentanyl and its
derivatives 37 61560 0 +++ + +
Current work (2020)
Environmental / Trimethylxanthines
7.8 14720 ++ +++ +++ +++
a The essential requirements are evaluated on a scale of 0 for noncompliance and +++ as a higher grade of
compliance.

Chapter 1. Introduction
23
1.4. MATRIX AND ANALYZED COMPOUNDS
The study of this thesis has focused on the applications of the analytical methodologies
described above, in biological, environmental, food and natural product matrices, to study a series of
compounds belonging to several families and with different polarities. Therefore, the approach of
this chapter will be based on the matrices analyzed.
1.4.1. Biological samples: trimethylxanthines Analysis of biological samples represents an important challenge to overcome in the
development of analytical methods due to very demanding requirements in terms of method
reliability, sensitivity, speed of analysis and sample throughput. The terms “specimen” and “sample”
are accustomed denote a portion of a body fluid, tissue, incubation medium, etc., collected under
defined conditions [119]. Biological samples usually encompass fluids like whole blood, serum,
plasma, urine, saliva, breast milk, sweat, cerebrospinal fluid, gastric fluid; exhaled breath (gas
sample); and solid samples include a different kind of tissue (i.e., hair, nail, skin, bone, muscle).
Despite this large number of specimens, it is possible to indicate as those of greatest analytical
interest the blood, including serum and plasma, urine and, recently, saliva, for the analysis of drugs,
metabolites, xenobiotics or biomarkers. Plasma, serum and blood are normally used if quantitative
measurements are needed. In urine the concentrations of target compounds, and their metabolites,
tend to be higher than the ones found in blood, thereby facilitating detection [120]. In recent years,
saliva has attracted attention due to advantages for its collection as it is a non‐invasive procedure.
Serious complications for analysis of biological samples include the presence of endogenous
or exogenous macromolecules, small molecules, and salts that interfere with analysis; the low analyte
concentration and, generally, the incompatibility of these kind of samples with analytical instruments
[121]. In that sense, sample preparation is of paramount importance to obtain the target analytes,
meeting at least four requirements: (a) reduce or eliminate matrix or unwanted interference
endogenous compounds; (b) increase selectivity for interest analytes; (c) pre‐concentration effect to
improve sensitivity; and, (d) stabilize the sample by reconstituting it in an inert solvent [122].
In general, analysis of biological samples involves the application of some pretreatment
procedures, which can facilitate instrumental analysis (dilution), minimize the presence of
endogenous substances (centrifugation, filtration and saponification), reduce quantitative errors due
to the extraction procedure (internal standards) and/or release metabolized analytes as conjugated
substances (enzymatic hydrolysis) [123].
Chapter 1. Introduction
24
Other aspects no less important, related to the analysis of biological samples, are several
ethical, legal and social issues co‐exist. The confidentiality, ownership, export, storage and secondary
use of samples (individual good) with specific consent, regulations and policies must be established
in accordance with the guidelines of the Research Policy Ethics Committees (REC). [124].
In the following lines of this section, aspects related to the collection, storage, preservation
and important issues of the biological samples studied during the development of this thesis will be
discussed. In the final part, a description of the analyzed compounds is presented.
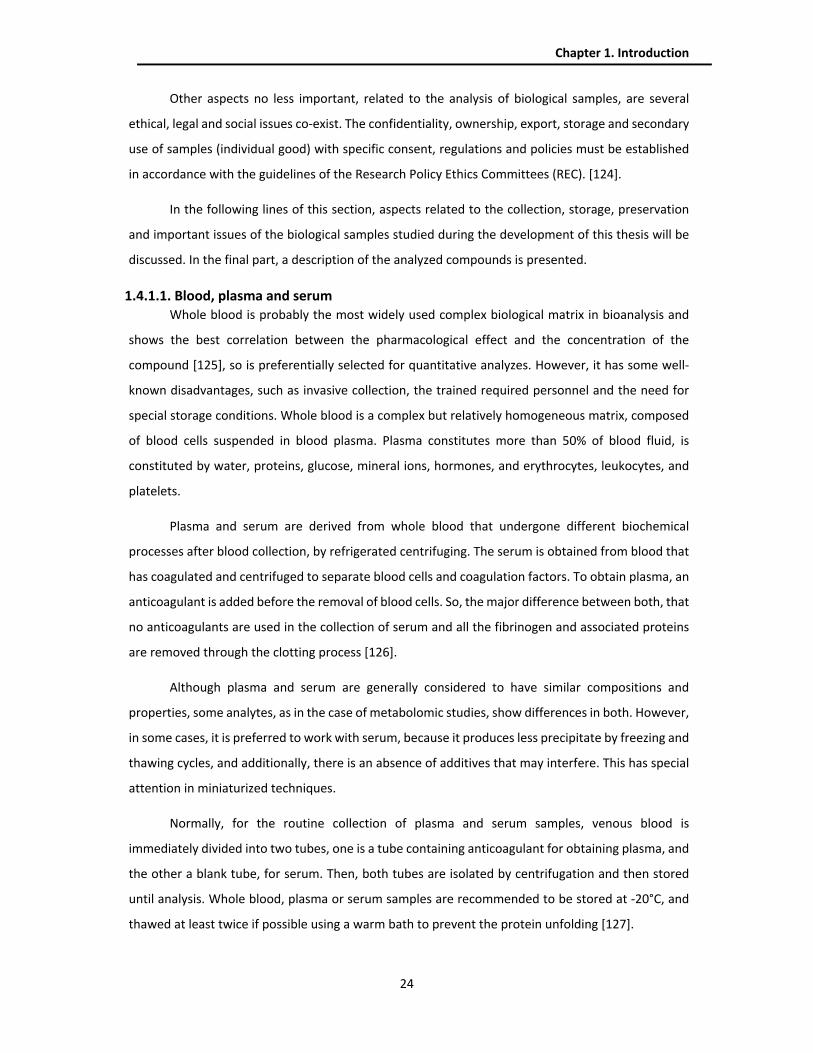
1.4.1.1. Blood, plasma and serum Whole blood is probably the most widely used complex biological matrix in bioanalysis and
shows the best correlation between the pharmacological effect and the concentration of the
compound [125], so is preferentially selected for quantitative analyzes. However, it has some well‐
known disadvantages, such as invasive collection, the trained required personnel and the need for
special storage conditions. Whole blood is a complex but relatively homogeneous matrix, composed
of blood cells suspended in blood plasma. Plasma constitutes more than 50% of blood fluid, is
constituted by water, proteins, glucose, mineral ions, hormones, and erythrocytes, leukocytes, and
platelets.
Plasma and serum are derived from whole blood that undergone different biochemical
processes after blood collection, by refrigerated centrifuging. The serum is obtained from blood that
has coagulated and centrifuged to separate blood cells and coagulation factors. To obtain plasma, an
anticoagulant is added before the removal of blood cells. So, the major difference between both, that
no anticoagulants are used in the collection of serum and all the fibrinogen and associated proteins
are removed through the clotting process [126].
Although plasma and serum are generally considered to have similar compositions and
properties, some analytes, as in the case of metabolomic studies, show differences in both. However,
in some cases, it is preferred to work with serum, because it produces less precipitate by freezing and
thawing cycles, and additionally, there is an absence of additives that may interfere. This has special
attention in miniaturized techniques.
Normally, for the routine collection of plasma and serum samples, venous blood is
immediately divided into two tubes, one is a tube containing anticoagulant for obtaining plasma, and
the other a blank tube, for serum. Then, both tubes are isolated by centrifugation and then stored
until analysis. Whole blood, plasma or serum samples are recommended to be stored at ‐20°C, and
thawed at least twice if possible using a warm bath to prevent the protein unfolding [127].

Chapter 1. Introduction
25
Recently, dried blood spot (DBS) has gained a great interest in the bioanalysis field. Here, a
blood sample is deposited onto a filter paper, followed by drying in the air for several hours.
Subsequently, a disk is punched out from the blood spot and this disk is extracted for the target
analytes. Some advantages of this technique include the ease of sampling (less invasive), small
sampling volume, long‐term analyte stability, and low solvent volumes needed in the extraction [128].
1.4.1.2. Urine Normal and healthy urine is mainly composed of water, plus ions such as Na+, K+, Mg2+, Ca2+,
Cl− and NH4+, urea, creatinine, proteins, and products processed by the kidney and liver, including
drugs and metabolites [129]. Urine sample has its own advantages, compared with serum and
plasma: a large volume of non‐invasive sampling can be obtained, sampling repetition is not a
problem, requires less complex sample preparation due to the lower amounts of protein, lipids, and
other substances of high molecular‐weight that it contains. However, the lack of proteins and lipids
can cause issues in bioanalysis, as these compounds perform a number of useful functions, prevents
adsorption to containers, binds analytes and helps to solubilize them [130].
From the bioanalytical point of view, urine analysis has the advantage of the high
concentrations of analytes and their metabolites, as it represents one of the main routes of
elimination of the body, which facilitates the detection of the compounds of interest. Urine analysis
is mainly used as a screening test for the determination of drugs of abuse and prescription drugs. The
absence of circulating serum proteins, lipids and other related large‐molecular‐weight compounds
greatly simplify the preparation of the specimen for bioanalysis, enabling the application of
immunoassays or non‐instrumental spot tests.
According to Fernandez‐Peralbo et al. [129], urine samples are collected as random samples,
timed samples or 24‐h samples. The first is done at any time of the day, instead, while timed samples
are necessary to study time‐related trends to catalog metabolites with high diurnal variation in
different species. However, a 24 h sample collection is preferred to eliminate the great variability in
metabolite profiles. Midstream portions or clean‐catch urine of first‐morning samples are the most
common and appropriate obtained specimens because the presence of contaminating elements is
minimized.
Urine samples for clinical practice are usually collected in a sterile container, which is not
endowed with special characteristics or reagents. The storage of urine samples is critical for the
reliability of analysis results, due to changes in the concentration of analytes or the formation of some
endogenous urine reactants that can appear [127]. Freeze‐thaw cycles are related to sample handling
and are another pivotal aspect, as it determines the exposition to degrading environmental
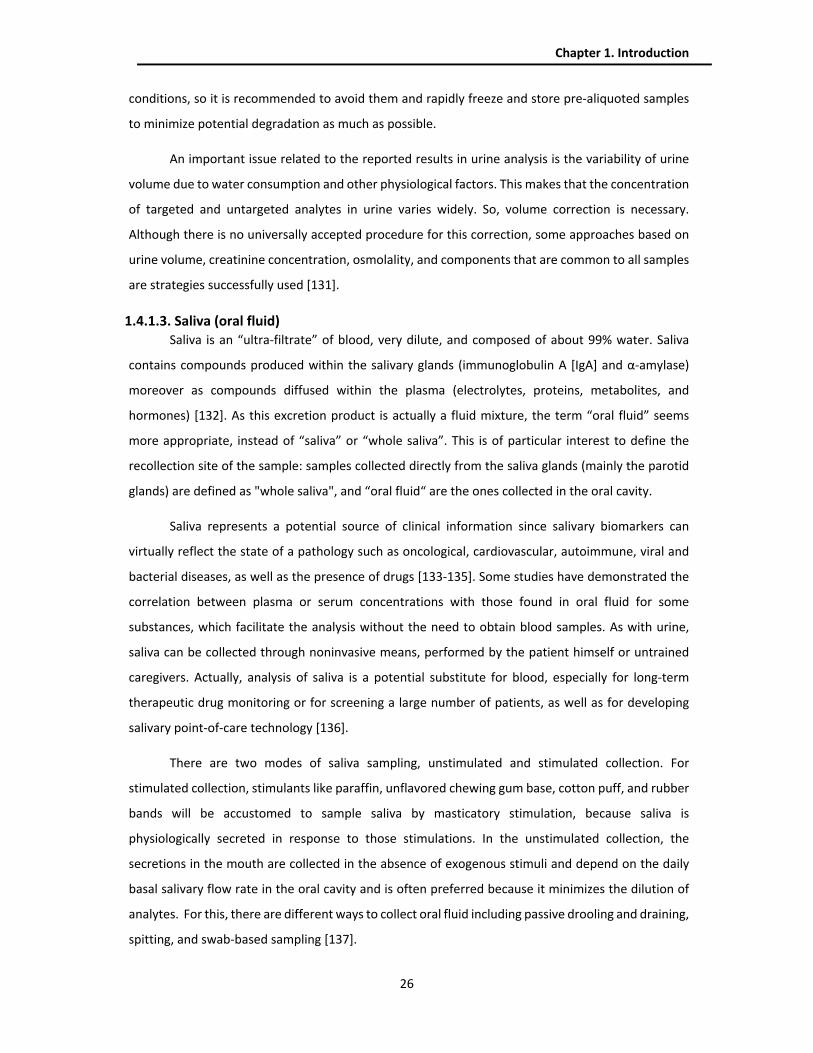
Chapter 1. Introduction
26
conditions, so it is recommended to avoid them and rapidly freeze and store pre‐aliquoted samples
to minimize potential degradation as much as possible.
An important issue related to the reported results in urine analysis is the variability of urine
volume due to water consumption and other physiological factors. This makes that the concentration
of targeted and untargeted analytes in urine varies widely. So, volume correction is necessary.
Although there is no universally accepted procedure for this correction, some approaches based on
urine volume, creatinine concentration, osmolality, and components that are common to all samples
are strategies successfully used [131].
1.4.1.3. Saliva (oral fluid) Saliva is an “ultra‐filtrate” of blood, very dilute, and composed of about 99% water. Saliva
contains compounds produced within the salivary glands (immunoglobulin A [IgA] and α‐amylase)
moreover as compounds diffused within the plasma (electrolytes, proteins, metabolites, and
hormones) [132]. As this excretion product is actually a fluid mixture, the term “oral fluid” seems
more appropriate, instead of “saliva” or “whole saliva”. This is of particular interest to define the
recollection site of the sample: samples collected directly from the saliva glands (mainly the parotid
glands) are defined as "whole saliva", and “oral fluid“ are the ones collected in the oral cavity.
Saliva represents a potential source of clinical information since salivary biomarkers can
virtually reflect the state of a pathology such as oncological, cardiovascular, autoimmune, viral and
bacterial diseases, as well as the presence of drugs [133‐135]. Some studies have demonstrated the
correlation between plasma or serum concentrations with those found in oral fluid for some
substances, which facilitate the analysis without the need to obtain blood samples. As with urine,
saliva can be collected through noninvasive means, performed by the patient himself or untrained
caregivers. Actually, analysis of saliva is a potential substitute for blood, especially for long‐term
therapeutic drug monitoring or for screening a large number of patients, as well as for developing
salivary point‐of‐care technology [136].
There are two modes of saliva sampling, unstimulated and stimulated collection. For
stimulated collection, stimulants like paraffin, unflavored chewing gum base, cotton puff, and rubber
bands will be accustomed to sample saliva by masticatory stimulation, because saliva is
physiologically secreted in response to those stimulations. In the unstimulated collection, the
secretions in the mouth are collected in the absence of exogenous stimuli and depend on the daily
basal salivary flow rate in the oral cavity and is often preferred because it minimizes the dilution of
analytes. For this, there are different ways to collect oral fluid including passive drooling and draining,
spitting, and swab‐based sampling [137].

Chapter 1. Introduction
27
The latter is particularly suitable for patients with less or no collaboration, such as disabled
people, children, the elderly and newborns, which is why it was used in this work. These devices have
a disposable non‐cellulosic absorbent pad, which is placed under the tongue or near the cheeks and
can take samples up to about 1.2 mL in a few minutes. Finally, the oral fluid sample is recovered by
squeezing the pad or centrifuging into a container like an Eppendorf tube. Until now, there is no
agreement on the storage temperature of oral fluid samples. A normal recommendation is that
samples should be refrigerated (4°C) if they are processed within 3‐6 h after collection. For long
periods of storage, they should be kept at ‐20°C to prevent bacterial growth.
Recently Abdel‐Rehim et al. have proposed a method called dried saliva spot (DSS), to see the
quantity of lidocaine in saliva [138]. Some drops of saliva are spotted onto a group card and dry at
room conditions, using 50 µL of the sample, and allowing easier transportation, storage, and pre‐
treatment of samples. Another application of DSS was reported for analysis of D‐ and L‐lactic acid in
diabetic patients, pre‐diabetic and nominally healthy persons [139].
Table 4 shows a comparison of characteristics, advantages, and disadvantages of the biological
samples addressed in the previous sections.
Table 4. Comparison of the characteristics, advantages, and disadvantages of biological
samples discussed. Adapted from [140]
Characteristics Blood (Plasma and
serum) Urine Saliva (Oral fluid)
Sample collection Requires medically trained
personal
Privacy concerns; not easily field
collected Noninvasive
Amount of sample typically available
1–5 mL >50 mL 1–5 mL
Speed of collection
Minutes Minutes Minutes
Drug concentration
High Moderate‐to high Low
Window of detection average
Narrow
Moderate, usually wider
than for blood
Narrow, similar to blood
Risk of infection Higher than others Low Low

Chapter 1. Introduction
28
1.4.1.4. Determination of trimethylxanthines Trimethylxanthines are a group of substances naturally present in beans, leaves, seeds, and
fruits of more than 60 plants. The most common sources are coffee and cocoa beans, as well as tea
leaves and guarana berries [141]. These compounds are alkaloids produced in plants as secondary
metabolites, with high polar characteristics and low log Kow values (Table 5).
Table 5. Chemical structure and log Kow of trimethylxanthines studied.
Compounds Structure log Kow
Caffeine
CH3
N
N
O
N
O N
CH3
CH3
‐0.10
Theobromine
CH3
N
N
O
NH
O N
CH3
‐0.80
Theophylline
CH3
N
O
N
O
CH3 NH
N
‐0.02
Paraxanthine
O NH
N
N
O
NCH3
CH3
‐0.22
Caffeine is the most consumed stimulant of the central nervous system, due to its presence in
beverages such as coffee, tea, energy drinks, and cola drinks. The metabolic pathway of caffeine
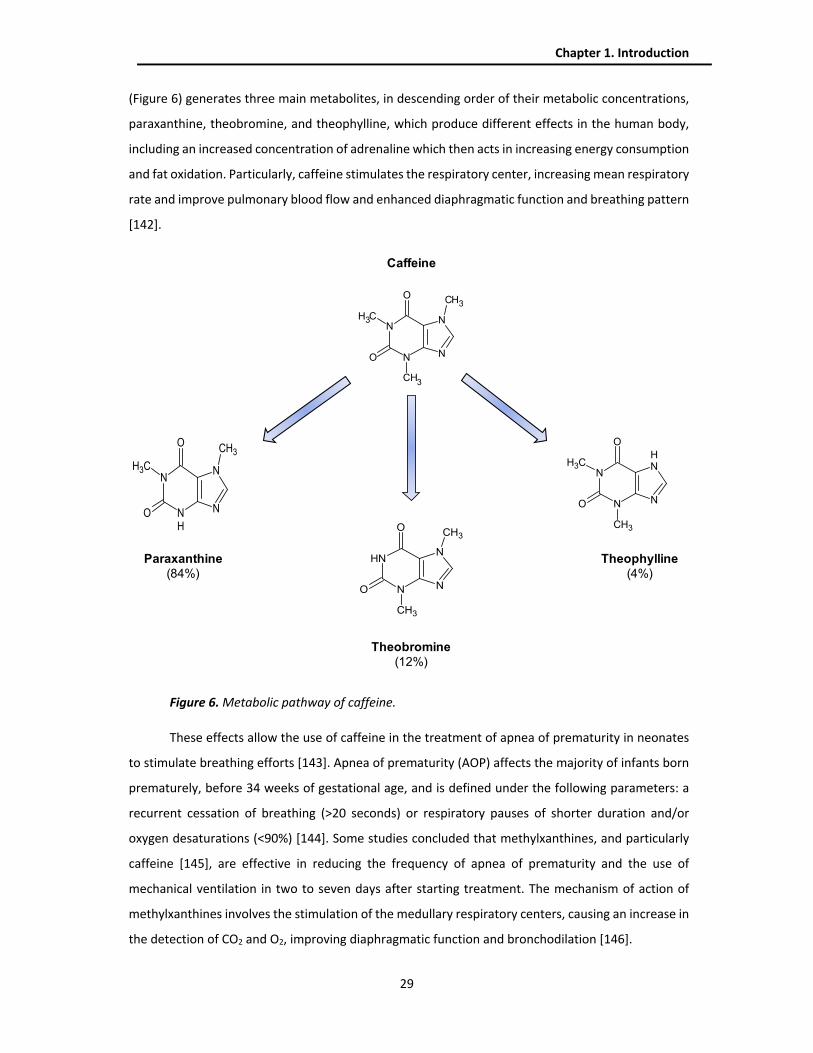
Chapter 1. Introduction
29
(Figure 6) generates three main metabolites, in descending order of their metabolic concentrations,
paraxanthine, theobromine, and theophylline, which produce different effects in the human body,
including an increased concentration of adrenaline which then acts in increasing energy consumption
and fat oxidation. Particularly, caffeine stimulates the respiratory center, increasing mean respiratory
rate and improve pulmonary blood flow and enhanced diaphragmatic function and breathing pattern
[142].
Figure 6. Metabolic pathway of caffeine.
These effects allow the use of caffeine in the treatment of apnea of prematurity in neonates
to stimulate breathing efforts [143]. Apnea of prematurity (AOP) affects the majority of infants born
prematurely, before 34 weeks of gestational age, and is defined under the following parameters: a
recurrent cessation of breathing (>20 seconds) or respiratory pauses of shorter duration and/or
oxygen desaturations (<90%) [144]. Some studies concluded that methylxanthines, and particularly
caffeine [145], are effective in reducing the frequency of apnea of prematurity and the use of
mechanical ventilation in two to seven days after starting treatment. The mechanism of action of
methylxanthines involves the stimulation of the medullary respiratory centers, causing an increase in
the detection of CO2 and O2, improving diaphragmatic function and bronchodilation [146].
CH3
N
N
O
N
O N
CH3
CH3
O NH
N
N
O
NCH3
CH3
CH3
N
N
O
NH
O N
CH3
CH3
N
O
N
O
CH3 NH
N
Caffeine
Paraxanthine(84%)
Theobromine(12%)
Theophylline(4%)

Chapter 1. Introduction
30
Over other therapeutic guides for AOP, caffeine has important advantages related to its long
half‐life and wide therapeutic range [147]. The loading and maintenance dosage of caffeine in the
treatment of AOP is 10 mg kg−1 of caffeine (intravenously) and 5–10 mg kg−1 every 24 hours (orally or
intravenously) [148]. Dose between 5 and 30 mg L−1 is commonly used and under this therapeutic
scheme, serum levels below 50 mg L−1 are considered safe. In clinical practice, caffeine citrate instead
of caffeine is administrated, so the doses prepared from this compound are doubled to the aforesaid
values.
In all therapeutic schemes, it is necessary to control the concentrations of the drugs
administered by determining the blood levels of caffeine throughout the treatment, to ensure the
expected clinical response, as well as possible signs of toxicity. For this, when therapeutic failure is
suspected, blood samples should be obtained just before the administration of the next dose, and
between 2 and 4 h after the previous dose, when toxicity is suspected. Perera et al., found an
adequate correlation between plasma and salivary concentrations of caffeine when 100 mg of
caffeine was administered to healthy male non‐smoking volunteers, which may serve as a measure
in future pharmacokinetic trials [149].
In the literature, many methods have been used for the determination of caffeine and its
metabolites in biological samples, using traditional sample treatment techniques like liquid‐liquid
extraction and solid‐phase extraction (SPE) [150‐152]. These procedures involve many stages, high
consumption of organic solvents and a high quantity of sample volume. This thesis proposes the
determination of trimethylxanthines in serum, urine and oral fluid using IT‐SPME‐CapLC, which
provides a simple and fast analytical methodology using micro volumes of samples.
1.4.2. Environmental samples: trimethylxanthines in waters Pollution represents a significant public health issue in the world, which according to
Landrigan et al, is responsible for approximately 25% of deaths in the most polluted countries and
16% of deaths worldwide [153]. The control and monitor of pollutants that can be found in water, air,
soils, sediments, and biota require the study of environmental matrices. The different environmental
pollutants can be found in their source of emission (places, objects, activities, or entities) and can be
transported in the environment through their receiving environmental compartment, which in turn
can act in some cases as a source of emission and reach human beings, through many processes. In
this cycle, human beings are at risk of exposure to these contaminants in their daily activities.
From all these matrices, water has a particular interest as an environmental compartment, for
its role in life and constant mobility on the planet by, so pollutants that reach the water cycle could
eventually travel to other compartments. Factors like population growth and development can alter
Chapter 1. Introduction
31
certain stages of the water cycle, causing increasing contamination in soils, groundwater, air, and,
other environmental compartments [154].
The Directive 2013/39/EU of the European Parliament and of the Council [155] classify the
waters as continental and coastal waters. Inland waters are understood as all surface or underground
waters, located towards the ground from the line that serves as the basis for measuring the width of
territorial waters. They can be classified in groundwater or surface water (rivers, lakes, transition,
etc.). Waters that extend between this line and a nautical mile inland are the so‐called coastal waters.
Another important type of water is wastewater, defined as any type of water whose quality has been
damaged by anthropogenic activities.
In the last ten years, the presence of so‐called "emerging" or "new" contaminants such as
pharmaceutical compounds and their metabolites in the aquatic environment, both water and
wastewater, has emerged as a major concern for the international scientific community on the need
to establish controls for their regulation [156]. According to Mackulak et al. [157], more than 200
active pharmaceutical substances have been identified in the environment, which enters in it
according to its pattern of usage, as well as the mode of application, and for those coming from
human use and/or excretion, sewage discharge is a very important source for the aquatic
environment.
Until today, the number and variety of these compounds are constantly increasing, as well as
their metabolites, which are detected even in natural compartments, which makes its control and
elimination difficult. Likewise, some of these compounds are considered as indicators of
anthropogenic activity, since their presence in environmental matrices come mainly for human use
and elimination [158, 159]. In that sense, wastewater has a wide range of chemical and biological
markers of human activity, whose study has been used for decades to monitor removal efficiencies
of wastewater treatment processes and to evaluate wastewater effluent as a point source for
environmental contamination [160].
Trimethylxanthines are an important group of compounds used as biomarkers of human
activity on wastewater under an epidemiological approach [161], and also as an indicator of lifestyle
[162] and for the evaluation of their intake [163]. The total daily intakes of these compounds varies
throughout the world, although coffee usually contributes more significantly more than other drinks
to overall caffeine consumption (coffee 71%, soft drinks 16% and tea 12%), particularly among adults
[164].
High stability and high consumption of these products have made it common to detect them
in considerable concentrations in surface water [165], seawater [166], stormwater [167], drinking

Chapter 1. Introduction
32
water [168] and groundwater [169]. Recently, some studies have reported high concentrations of
caffeine and paraxanthine in wastewater treatment plants (WWTP) [170]. Likewise, low
concentrations downstream of WWTPs demonstrate the efficiency in the degradation and
elimination of these molecules [171]. Figure 7 shows the growing interest related to the study of
trimethylxanthines in environmental issues, provided by the increase in the evolution of the number
of citations in the last thirty years.
Figure 7. Evolution in the number of citations on caffeine and trimethylxanthines in the topic
environment in the last 30 years. Source Web of Science (May 2020).
In general, for environmental analysis, pollutant concentrations may be below instrumental
sensitivity, so nowadays the need for reliable and sensitive analytical methods is highly desirable.
Likewise, sample treatment techniques with high preconcentration capacity and selectivity are
necessary [172]. Along these lines, SPE has been widely used with adequate results [173], applying
new polymeric sorbents, which improve retention by hydrophilic‐hydrophobic mechanism, especially
for molecules with high polarity characteristics such as trimethylxanthines [174]. Despite the
advantages of SPE, some drawbacks have been indicated including a large sample volume, the use of
organic solvents, and time required [175].
Table 6 shows some of the analytical methods developed in the last five years for the
determination of trimethylxanthines in environmental water samples by liquid chromatography with
mass spectrometry detection. In terms of extraction techniques, predominate the application of SPE.
0
200
400
600
800
1000
1200
1400
Num
ber
of
cita
tions
Year

Chapter 1. Introduction
33
In those studies, concentrations for caffeine were reported, mainly in upstream of WWTP´s. In this
thesis, a method with portable NanoLC‐UV has been developed, which has been compared with IT‐
SPME CapLC method, for the analysis of caffeine, theobromine, and theophylline in seawater and
river samples.
1.4.3. Dietary supplements: Multiclass analysis Dietary supplements, also called food or health supplements, are defined as products that are
intended to supplement the diet, which may include, some substances as vitamins, minerals,
botanicals (herbs), amino acids, or concentrates, and extracts of these [181]. According to the
European Directive 2002/46/EC, are ‘foodstuffs to supplement the normal diet, with a nutritional or
physiological effect, alone or in combination, marketed in various dosage forms, such as liquids and
powders, designed to be taken in measured small unit quantities’ [182].
The rising popularity of these products, especially those offered as natural food supplements
and alternative herbal medicines, is due in part to be conceived as free of adverse effects. A wide
variety of these products, administered as tablets, capsules, concentrated extracts, and infusion bags,
are extensively promoted in marketing campaigns to influence the idea to have "magical results" for
weight loss, to be anti‐carcinogenic, to improved sports performance, and to be stimulant, revitalizing
and “healthier” than conventional pharmaceutical drugs [183].
Some researchers have estimated that dietary supplements represent an industry with sales
gains of more than $ 37 billion annually, only in the USA [184]. Particularly, weight loss products
constitute a fast‐growing segment of this field which increases annually by 10‐20% [185]. This can be
explained due to the high availability of these products in grocery stores, supermarkets, and e‐
commerce platforms. Dietary supplements are products registered as food, which in terms of
requirements for production, quality control and commerce are much more lenient than guidelines
for pharmaceutical products [186, 187].
Although the main components of dietary supplements have a natural origin, a trending topic
in recent years is the adulteration with pharmaceutical active ingredients as some works have shown
[188]. These adulterants are added and not reported on the composition of the package label, even
in almost all cases they are present at potentially dangerous doses. This fact means that consumers
are not aware that they are taking other compounds, which at high doses can have toxic effects
and/or drug interactions with other medical treatments [189]. Adulteration of dietary supplements
with anabolic steroids [190], erectile dysfunction drugs [191], pharmaceuticals and plant toxins [192],
synthetic drugs [193], antidiabetic [194] and abuse drugs [195] has been reported in the literature.
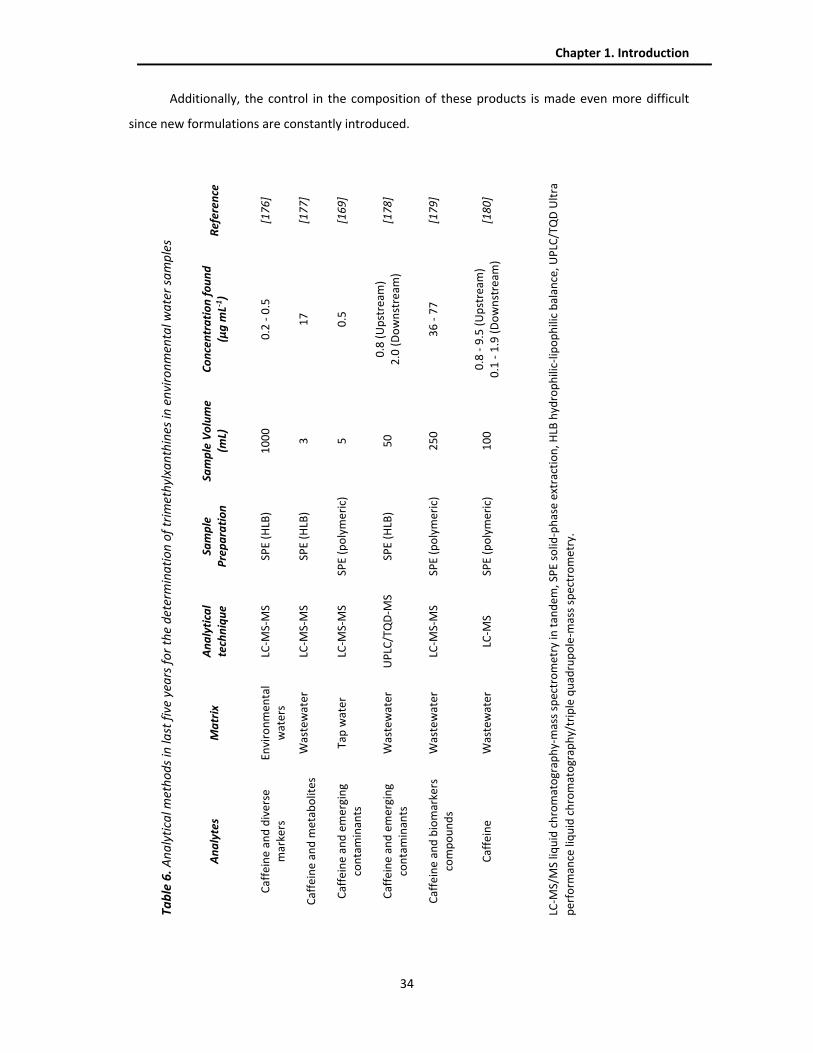
Chapter 1. Introduction
34
Additionally, the control in the composition of these products is made even more difficult
since new formulations are constantly introduced.
Tab
le 6
. An
aly
tica
l met
ho
ds
in la
st f
ive
yea
rs f
or
the
det
erm
ina
tio
n o
f tr
imet
hyl
xan
thin
es in
en
viro
nm
enta
l wa
ter
sam
ple
s
An
aly
tes
Ma
trix
A
na
lyti
cal
tech
niq
ue
Sam
ple
P
rep
ara
tio
n
Sam
ple
Vo
lum
e (m
L)
Co
nce
ntr
ati
on
fo
un
d
(µg
mL-1
) R
efer
ence
C
affe
ine
and
div
erse
m
arke
rs
En
viro
nm
en
tal
wat
ers
LC‐M
S‐M
S SP
E (H
LB)
10
00
0
.2 ‐
0.5
[1
76
]
C
affe
ine
and
met
abo
lites
W
aste
wat
er
LC‐M
S‐M
S SP
E (H
LB)
3
17
[1
77
]
C
affe
ine
and
em
ergi
ng
con
tam
inan
ts
Tap
wat
er
LC‐M
S‐M
S SP
E (p
oly
me
ric)
5
0
.5
[16
9]
C
affe
ine
and
em
ergi
ng
con
tam
inan
ts
Was
tew
ater
U
PLC
/TQ
D‐M
S SP
E (H
LB)
50
0
.8 (
Up
stre
am)
2.0
(D
ow
nst
ream
) [1
78
]
C
affe
ine
and
bio
mar
kers
co
mp
ou
nd
s W
aste
wat
er
LC‐M
S‐M
S SP
E (p
oly
me
ric)
2
50
3
6 ‐
77
[1
79
]
C
affe
ine
W
aste
wat
er
LC‐M
S SP
E (p
oly
me
ric)
1
00
0
.8 ‐
9.5
(U
pst
ream
) 0
.1 ‐
1.9
(D
ow
nst
ream
)
[18
0]
LC‐M
S/M
S liq
uid
ch
rom
ato
grap
hy‐
mas
s sp
ectr
om
etr
y in
tan
dem
, SP
E so
lid‐p
has
e ex
trac
tio
n, H
LB h
ydro
ph
ilic‐
lipo
ph
ilic
bal
ance
, UP
LC/T
QD
Ult
ra
per
form
ance
liq
uid
ch
rom
ato
grap
hy/
trip
le q
uad
rup
ole
‐mas
s sp
ectr
om
etry
.
Chapter 1. Introduction
35
In recent years, there is a growing concern about the composition, quality, labeling, and safety
of dietary supplements, which has resulted in the establishment of new regulations [196, 197]. The
presence of botanical extracts makes that dietary supplements have a diverse and complex chemical
composition, and many compounds that may be present, some of them considered as major
compounds, as well as trace compounds. The following lines present a description of major and trace
compounds commonly found in dietary products.
1.4.3.1. Major compounds Nowadays, dietary supplements with different functions and compositions are widely
available, such as slimming dietary supplements, also called fat burning for weight loss, multivitamin
formulations, natural extracts, and sexual enhancement. The main compounds responsible for these
desirable effects are the following.
Chlorogenic acids
Phenolic compounds are widely found in nature, among which chlorogenic acids (CGA) are a
family of esters formed between certain phenolic acids (trans‐cinnamic acids) and quinic acid.
Chemically, chlorogenic acids can be classified according to the type, number, and position of acyl
residues, where the most common isomer is 5‐caffeoquinine acid [198]. Another related compound
to chlorogenic acids in caffeic acid, which has structure and properties quite similar to these. The
main subgroups of CGA are caffeoylquinic acids (CQA), dicaffeoylquinic acids (diCQA) and
feruloyilquinic acids (FQA), each one of these groups have, at least, three isomers.
Although these compounds can be found in a variety of plants, mainly green (or raw) coffee
is a major source of CGA in nature, with an estimated percentage between 5 and 12% [199]. Green
coffee has a mild aroma similar to the characteristic aroma of coffee during the roasting process.
According to the literature, the scientific evidence is abundant to support the great health benefits
of CGA to humans. Recent studies demonstrated that they exhibit antimutagenic, anticarcinogenic
and antioxidant activities. Additionally, these compounds act as protective agents, reducing the
oxidative stress of cells, and they are also being investigated for their positive effect on blood pressure
and glucose regulation [200].
Roshan et al. [201], reported that the ingestion of the green coffee extract could feasibly be
an effective approach for the management of some of the metabolic syndrome features, as well as
insulin resistance, and abdominal obesity. Likewise, the ingestion of green coffee seems to facilitate
weight loss and show a tendency to reduce visceral fat and body weight, that is why green coffee
extracts are common components of dietary supplements.

Chapter 1. Introduction
36
Caffeine
Caffeine, as well as theobromine, has a potential thermogenic effect and reduces energy
intake. Although these compounds are naturally present in coffee, green coffee or tea extracts,
powdered pure caffeine is added intentionally as an adulterant in dietary supplements for physical
fitness and weight loss. This is of special attention for those fortified products with high quantities
marketed in bulk containers since they can present a significant or unreasonable risk of disease, injury
or even toxic doses [202]. Furthermore, the combination of trimethylxanthines with other
thermogenic ingredients, such as adrenergic amines, in these products can represent a major
problem due to the adverse drug interactions that may occur.
Synephrine
Synephrine is a biogenic protoalkaloid, chemically similar to ephedrine and catecholamines,
commonly present in various citrus species (C. sinensis, C. limon, C. limoni, etc.), especially in bitter
oranges (Citrus Aurantium). It has been used in Asian traditional medicine and in the Mediterranean
region as a cardiac and vascular stimulant, and in the treatment of digestive and gastric problems
[203]. Normally this molecule can be found in the human body at very low plasma concentrations,
which is why it is considered as a trace amine. Citrus aurantium extract contains para‐synephrine at
a 4‐6% level [204].
Both synephrine species have an affinity for adrenergic receptors present in adipose tissue,
therefore they stimulate lipolysis. Zheng et al. recently reported that this molecule modulates
NMUR2 receptors in the hypothalamus, achieving appetite suppression in humans [205]. Due to these
effects, Citrus aurantium extract has been extensively used in dietary supplements as a principal
constituent in fat‐burning weight‐loss products. The FDA's ban on the use of ephedra alkaloids in
dietary supplements in 2004, meant that synephrine quickly replaced them, making their use popular.
The effectiveness, as well as the safety of the intake of products containing synephrine, is
frequently questioned. For some authors, there is no solid evidence to support the beneficial effects
of synephrine as a lipolytic agent [206]; on the other hand, Stohs et al. concluded that modest
increases in weight loss were observed with bitter orange extract in a study of three months [207].
According to Jordan et al. [208], severe cardiovascular symptoms associated with the intake of dietary
supplements containing synephrine were reported between 1998 and 2004. In 2010 a new guide to
restrict the daily limit of 30 mg of synephrine as a value for maximum intake was published [209].
This makes it necessary to quantify synephrine concentrations in dietary supplements. Recently,
some studies have denied the risk of the cardiovascular effects of p‐synephrine [210, 211].

Chapter 1. Introduction
37
Figure 8 shows the chemical structure and log Kow for major compounds found in dietary
supplements.
Figure 8. Chemical structure and log Kow for major compounds found in dietary supplements.
1.4.3.2. Minor compounds Due to the natural origin of dietary supplements, numerous compounds in low
concentrations, considered as minor compounds, are present. Although they are not normally
reported, they can have physiological effects that can cause synergistic or antagonistic effects.
Riboflavin
Riboflavin, also called vitamin B2, is a water‐soluble vitamin, normally found in a wide variety
of foods, including milk, cereals, fatty fish, meats and certain fruits and vegetables. Chemically it is a
nucleoside with the presence of flavin and ribitol. The deficiency of this vitamin has been linked to
5-caffeoylquinic acid
(5-CQA)
log Kow = -0.36
Neochlorogenic acid
(3-CQA)log Kow = -0.4
Cryptochlorogenic acid
(4-CQA)log Kow = -0.4
O
OHOH
O
O
OH
OH
OH
OH
O
OHOH
O
O
OH
OH
OH
OH
O
OHOH
OH O
O
OH
OH
OH
Isochlorogenic acid A (3,5-diCQA)
log Kow = 1.5
O
O HO H
O
O
OH
OH
O H
O
O
OH O H
Isochlorogenic acid B (3,4-diCQA)
log Kow = 1.5
Isochlorogenic acid C (4,5-diCQA)
log Kow = 1.5
O
OHOH
O
O
OH
OH
O
O
OH
OH
OH
O
OHOH
O
O
OH
OH
O
O
OH
OH
OH
Caffeic acidlog Kow = 1.15
O
OH
OH OHCH3
N
N
O
N
O N
CH3
CH3
Caffeinelog Kow = -0.1
Theobrominelog Kow = -0.8
CH 3
N
N
O
NH
O N
C H3 CH3
NH
OH
OH
Synephrinelog Kow = -0.45
Chapter 1. Introduction
38
some diseases like anemia, cancer, and cardiovascular disease. Likewise, riboflavin is also thought to
protect tissues from ischemia [212]. Some sanitary guidelines establish the estimated average
requirements for riboflavin in 0.4 mg per day [213], so the consumption of dietary supplements
containing this compound may be beneficial.
Kaempferol
Flavonoids are polyphenolic compounds, which have commonly been incorporated into the
human diet through vegetal foods. Kaempferol is a flavonoid abundantly found in tea, broccoli,
apples, strawberries, and beans. The presence of these aliments in all food guide models around the
world [214] ensures a high consumption in all populations. This molecule shows antioxidant and anti‐
inflammatory properties and activates thermogenic processes, which is why it is found in several
dietary products. Additionally, it has been shown to invoke several different mechanisms in the
regulation of cancer cells [215].
Terpenic compounds
Terpenes are organic compounds derivatives of isoprene. They are produced in a high variety
of plants and are the most representative molecules in essential oils (> 90%). Terpenes have a great
variety and diversity of structures, the most common in nature being monoterpenes and
sesquiterpenes. The basic structure of monoterpenes consists of two linked isoprene units, which are
formed by a 5‐carbon‐base (C5) each [216]. There are different types of monoterpenes in nature,
including acyclic ones (such as linalool and myrcene), monocyclic monoterpenes (for example,
limonene among others), and bicyclic monoterpenes (as alpha and beta‐pinene). Sesquiterpenes
present three isoprene units in its structure, and such as monoterpenes they may be acyclic or contain
rings. Farnesene is an acyclic sesquiterpene.
Numerous studies have attributed the biological activity to terpenic compounds, which is why
they are used as antioxidants, antifungals, and antibacterial [217]. Likewise, all of these compounds
present important anesthetic and sedative effects [218‐220]. Historically terpenic compounds have
been applied in flavorings and fragrance industry, but recently, there is an increasing interest in its
application in the pharmaceutical and nutraceutical industry. Due to the plant nature of some dietary
supplements, terpenic substances are expected to be present as minor components. Chemical
structure and log Kow for trace compounds found in dietary supplements are given in Figure 9.

Chapter 1. Introduction
39
Figure 9. Chemical structure and log Kow for trace compounds found in dietary supplements.
1.4.3.3. Analysis of dietary supplements The analysis of dietary products can be carried out by two approaches, by the determination
of specific components or by multi‐class analysis methods, the latter being preferred according to the
principles of green analytical chemistry. However, multiclass methods involved sophisticated and
expensive instrumentation such as UHPLC and high resolution mass detectors. Thus, simple and rapid
methods for the qualitative and quantitative determination of major and trace compounds in dietary
supplements are highly desirable for improved sample characterization with a minimum of
experimental effort
Kaempferol
log Kow = 2.0
Riboflavinelog Kow = -1.5
α-Pinenelog Kow = 4.8
Linaloollog Kow = 3.0
Myrcenelog Kow = 4.3
Limonenelog Kow = 5.4
Farnesenelog Kow = 6.1
O
O OH
OH
OH
OH
C H 3
C H 3NNO
NH
O
N
O H
O H
OH
OH
C H 3
C H 3
C H 3
CH3
CH2
CH3CH3
CH2
CH2
CH3
CH3
CH3
CH2OH
CH3
CH3
CH3
CH2
CH3
CH3

Chapter 1. Introduction
40
Table 7 shows summarized the different methods found in the literature for the analysis of
dietary supplements by LC, some for individual determination of chlorogenic acids, synephrine,
caffeine, minerals or vitamins, and others for multi‐class analysis. Due to the increasing concern about
the composition of dietary supplements, in this thesis, a multi‐class method was developed, based
on capillary liquid chromatography for the simultaneous analysis of seventeen compounds that can
be found in those supplements at different concentration levels.
1.4.4. Natural resins: terpenic compounds According to Langenheim [226] in general terms, resins are a sap or exudate, different from
other vegetable exudates such as gums, mucilage, oils, waxes, and latex. Natural resins are defined
as plant secretions formed by a lipid‐soluble mixture of organic compounds, including a volatile and
non‐volatile terpenoid fraction, and/or secondary phenolic compounds, secreted in specialized
structures, that can be located internally or on the surface of the same, and that show potential
importance in ecological interactions.
The composition of resins consists primarily of secondary metabolites, which apparently play
no role in the fundamental physiology of the plant, with two fundamental fractions. In the first place,
a volatile fragrant fraction called essential oil, and on the other hand, a non‐volatile fraction, usually
consisting of long‐chain terpenoids [227]. The percentages and quantity of these fractions highly
depend on two aspects, the botanical origin and the age of the resins. In fresh resins, the presence of
the essential oil fraction makes the physical aspect of the material to be as translucent liquids, but by
lossing of this fraction, the material change into brown, yellow, or white solids that, by polymerization
and oxidation reactions, looks like an amber material.
Regarding botanical origin, the family of the Burseraceae, which includes over 20 genera and
more than 600 species of trees and shrubs from tropical and subtropical regions, three important
genera have been studied widely, Boswellia, Commiphora, and Bursera. The first one is commonly
called frankincense, myrrh is the resin of Commiphora, and Bursera resin is often called copal, all of
them with important use in perfumery and particularly as an incense [228]. The Bursera genus grows
widely in the Mesoamerica region, from the southwestern United States to the northern part of Brazil
and includes between 90 and 100 species of trees and shrubs [229], historically has been the source
of resin for the Aztec and Mayan civilizations.

Chapter 1. Introduction
41
Tab
le 7
. An
aly
tica
l met
ho
ds
fou
nd
in t
he
liter
atu
re f
or
the
an
aly
sis
of
die
tary
su
pp
lem
ents
by
LC
Ap
pro
ach
A
na
lyte
s M
atr
ix
An
aly
tica
l te
chn
iqu
e A
na
lyti
cal
colu
mn
C
hro
ma
tog
rap
hic
co
nd
itio
ns
Det
ecto
r R
efer
ence
Spec
ific
co
mp
on
ents
5
‐CQ
A, 4
‐CQ
A, 3
‐C
QA
, 3,4
‐diC
QA
, 3
,5‐d
iCQ
A, 4
,5‐
diC
QA
Gre
en c
off
ee
be
ans
extr
acts
LC
‐UV
C
18
(1
00
x
4.8
mm
; 5
µm
)
Mo
bile
ph
ase:
0.1
% T
FA in
wat
er (
A)
and
ac
eto
nit
rile
(B
).
Gra
die
nt
elu
tio
n
Flo
w r
ate:
1.5
mL/
min
33
0 n
m
[19
8]
A
nti
oxi
dan
t m
arke
rs
and
caf
fein
e
Co
mm
erci
al
teas
an
d
die
tary
su
pp
lem
ents
LC‐D
AD
Iner
tsil
OD
S‐3
v (2
50
x 4
.6
mm
; 5 µ
m)
Mo
bile
ph
ase:
wat
er
con
tain
ing
0.0
5%
ort
ho
ph
osp
ho
ric
acid
: ac
eto
nit
rile
(8
5:1
5 v
/v).
Is
ocr
atic
elu
tio
n.
Flo
w r
ate:
1.5
mL/
min
20
0 ‐
40
0 n
m
[19
9]
Sy
nep
hri
ne
and
am
ine
s
Foo
d
sup
ple
men
ts
LC‐F
LD‐U
V
C‐1
8 (
25
0 x
4
mm
, 5 μ
m)
2
.9 g
/L S
DS
in w
ater
(p
H =
4.2
, ort
ho
‐p
ho
sph
ori
c ac
id)
(A):
2.9
g/L
SD
S in
ac
eto
nit
rile
(6
2:3
8, v
/v)
(pH
= 4
.2,
ort
ho
‐ph
osp
ho
ric
acid
) (B
).
Gra
die
nt
elu
tio
n.
Flo
w r
ate:
1.0
mL/
min
FLD
: 2
70
/30
5n
m
(Ex/
Em).
U
V:
22
4 n
m
[20
0]

Chapter 1. Introduction
42
Tab
le 7
. Co
nti
nu
ati
on
.
Ap
pro
ach
A
na
lyte
s M
atr
ix
An
aly
tica
l te
chn
iqu
e A
na
lyti
cal
colu
mn
C
hro
ma
tog
rap
hic
co
nd
itio
ns
Det
ecto
r R
efer
ence
Mu
lti‐
clas
s
1
3 S
limm
ing
dru
gs
(caf
fein
e,
syn
eph
rin
e, e
ph
edri
ne
, si
bu
tram
ine
)
D
ieta
ry
sup
ple
men
ts
LC
/TO
F‐M
S
O
DP
2‐H
P 2
D
colu
mn
(1
50
×
2.0
mm
, 5
µm
)
Mo
bile
ph
ase:
10
mm
ol/
L am
mo
niu
m f
orm
ate
bu
ffer
(p
H
5.0
) (A
): m
eth
ano
l (B
): 1
0 m
mo
l/L
form
ic a
cid
(C
).
Gra
die
nt
elu
tio
n.
Flo
w r
ate
: 0.2
mL/
min
ESI +
, ca
pill
ary
25
00
V
[20
1]
1
11
am
ine‐
bas
ed (
p‐
syn
eph
rin
e,
trim
eth
ylxa
nth
ines
, ep
hed
rin
e,
Wei
ght
loss
an
d
ergo
gen
ic
sup
ple
men
ts
LC‐Q
ToF‐
MS
YMC
Tri
art
(10
0 ×
2.0
m
m, 3
µm
)
Mo
bile
ph
ase:
wat
er (
0.1
%
form
ic a
cid
) (A
): a
ceto
nit
rile
(0
.1%
fo
rmic
aci
d)
(B).
G
rad
ien
t el
uti
on
F
low
rat
e: 0
.21
mL/
min
ES
I +,
cap
illar
y 3
00
0 V
[20
2]
LC‐U
V li
qu
id c
hro
mat
ogr
aph
y‐u
ltra
vio
let
det
ecto
r; L
C‐D
AD
liq
uid
ch
rom
ato
grap
hy‐
dio
de
arra
y d
etec
tor;
LC
‐FLD
liq
uid
ch
rom
ato
grap
hy‐
flu
ore
scen
ce d
etec
tor;
LC/T
oF‐
MS
liqu
id c
hro
mat
ogr
aph
y/Ti
me‐
of‐
Flig
ht
Mas
s Sp
ectr
om
etry
; LC
‐QTo
F‐M
S liq
uid
ch
rom
ato
grap
hy‐
qu
adru
po
le t
ime
of
flig
ht
mas
s sp
ectr
om
etry
; ESI
+
elec
tro
spra
y io
niz
atio
n p
osi
tive
mo
de
Chapter 1. Introduction
43
In Maya languages, the term "pom" was assigned to the resin obtained of diverse trees. Copal
word derives from "copalli", the term used by Aztecs in Náhuatl language, which means resin or
incense. This term was export to the rest of the world when the Spanish arrived in America [230].
Nowadays, a variety of copal types can be found in marketplaces, mainly in Mexico and Guatemala,
includes copal blanco, copal oro, copal negro, copal lágrima, copal incienso and copal de piedra.
According to Stacey et al [231], “Copal blanco”, most commonly found, is exuded directly from
incisions made in the tree bark, and “Copal lágrima” (copal in tears) is the product remaining in the
recipient of collection and the incision in the bark.
Natural resins have important industrial applications, which involves the synthesis of flavors
and fragrances, as painting varnishes, and also in pharmaceutical and cosmetic preparations [232].
Specifically, copal has been appreciated and used from ancient times because of their variety of
purposes including religious ceremonies [233], beauty [234], dental care [235], as well as the
decoration of artworks [236]. In the last years, some constituents of copal have been an object of
study for researchers, due to their pharmacological effects as an anti‐inflammatory, antipruritic, anti‐
fungal and others [237–240].
In the study of copal composition, some works have reported the presence of monoterpene
compounds such as pinene and limonene as the most abundant in volatile fraction, whereas
triterpenoids such as ursane and oleanane are predominant in the non‐volatile fraction of copal
[238,241]. As mentioned in the previous section, terpenic compounds are organic derivatives of
isoprene with general formula (C5H8)n, which are the most numerous and structurally diverse
secondary metabolites among various natural products (˃50%) [242]. According to the number of
carbons atoms in their structure can be classified in monoterpenes (C = 10), Sesquiterpenes (C= 15),
Diterpenes (C =20), Sesterpenes (C =25),Triterpenes (C=30) and Carotenoids (C=40).
Triterpenes are widely found in the plant kingdom and have aroused interest from both an
evolutionary and a functional perspective [243]. Some of them, like the ursane (α‐amyrin) and
oleanane (β‐amyrin) skeletons, present properties of significant pharmacological importance. Table
8 shows the chemical structure and log Kow values of terpenic compounds commonly found in copal
resins, in which low polarity is observed especially for triterpenes compounds.
Quantitative analysis of copal resins could be of interest to discriminate resins by their
botanical origin as well as to explore the age and storage conditions of the samples [244]. In that
sense, methods capable to provide a better knowledge of the amounts of the major components of
these natural resins are a point of interest for researchers of natural products. A method for the
determination of triterpenes as lupeol, α and β‐amyrin, in copal resins used in folk ceremonies was
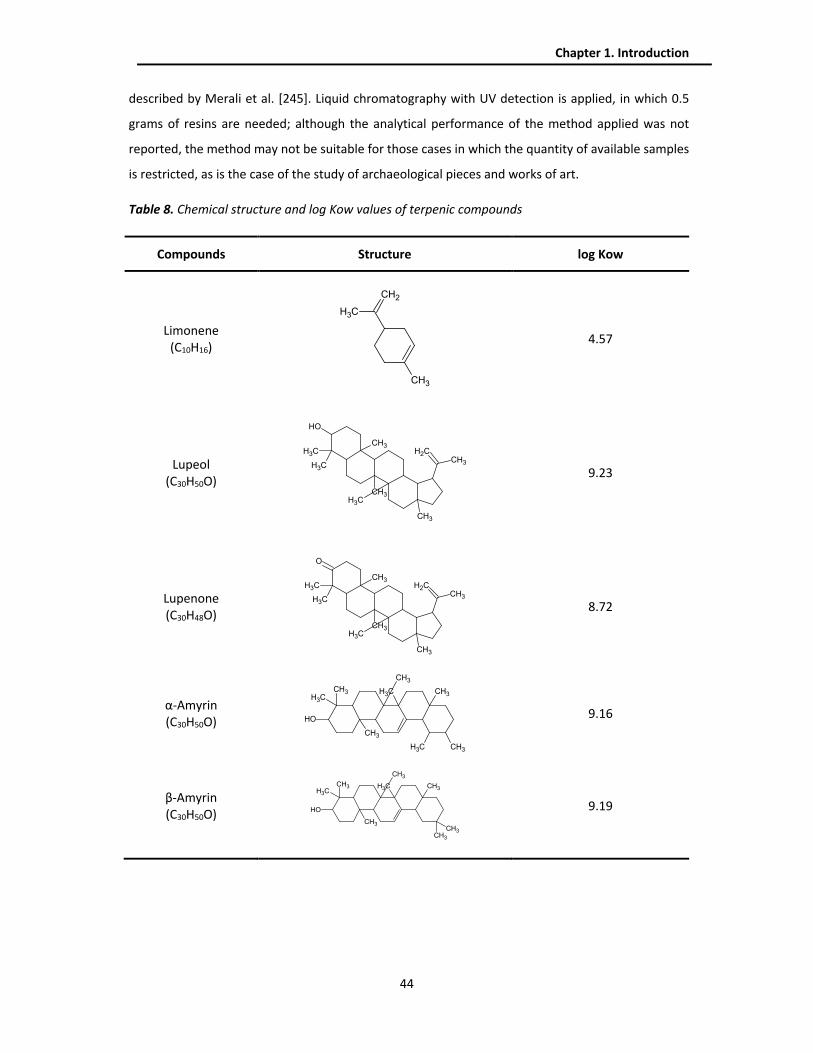
Chapter 1. Introduction
44
described by Merali et al. [245]. Liquid chromatography with UV detection is applied, in which 0.5
grams of resins are needed; although the analytical performance of the method applied was not
reported, the method may not be suitable for those cases in which the quantity of available samples
is restricted, as is the case of the study of archaeological pieces and works of art.
Table 8. Chemical structure and log Kow values of terpenic compounds
Compounds Structure log Kow
Limonene (C10H16)
CH3
CH2
CH3
4.57
Lupeol (C30H50O)
CH3
CH2
CH3
CH3
CH3
CH3
OH
CH3
CH3
9.23
Lupenone (C30H48O)
CH3
CH2
O
CH3
CH3
CH3
CH3
CH3
CH3
8.72
α‐Amyrin (C30H50O)
CH3
CH3CH3
OH
CH3
CH3
CH3
CH3 CH3
9.16
β‐Amyrin (C30H50O)
CH3
CH3CH3
OH
CH3
CH3
CH3 CH3
CH3
9.19

Chapter 1. Introduction
45
In this line, some works have been described in the literature for the chemical analysis of
resins in archeological pieces, by the application of gas chromatography (GC) with mass spectrometry
(MS) detection [230, 246]. However, those studies were aimed to define the chemical fingerprinting
in combination with chemometric tools, and none reported the quantitative composition of the
target compounds, which may be probably explained by the lack of reliable quantitative methods that
can be applied to micro samples, as the low amount of sample available is a major limitation in such
studies.
The determination of triterpenic compounds in different vegetal materials has been reported,
applying traditional and exhaustive sample treatments for large amounts of the samples, and multiple
steps of extractions, purification, solvent evaporation, and redissolution since the amount of sample
is not limited [247‐249]. Chromatographic analysis of terpenic compounds in natural resins arises
several difficulties, such as these samples contain numerous compounds with very wide chemical
properties. For example, the most abundant high molecular triterpenes are highly nonpolar with high
octanol‐water partition coefficients (Kow > 109.0), so, application of reverse‐phase mechanism
represents a challenge because the choice of the mobile phase is rather limited [243]. Additionally,
the lack of chromophores in those molecules maybe also a limitation when a UV detection is applied,
especially in the analysis of micro samples.
On the other hand, for GC‐based methods, the application of previous derivatization step is
required, especially for the determination of low‐volatile high‐molecular triterpenes. The complexity
of resin samples makes that reported assays have been focused only on one family of compounds,
typically the triterpene fraction. Alternatively, portions of the sample extract can be analyzed under
two or more different chromatographic conditions to obtain more exhaustive sample
characterization, which moves away from the principles of the green analytical chemistry.
In this thesis, a method was developed for the quantification of representative components
of copal resins, both volatile (limonene) and non‐volatile (lupeol, lupenone, and amyrins) fractions,
using capillary chromatography with UV detection, taking the advantages of high sensitivity
attainable with this miniaturized LC systems, which make them better suited for the analysis of micro
samples.

CHAPTER 2. OBJECTIVES

Chapter 2. Objectives
47
As has been discussed in the introductory part of this thesis, the development and applicability
of miniaturized liquid chromatography systems in recent years have facilitated the resolution of
analytical problems in fields such as clinical, foodstuff, forensic, omics, and pharmaceutical. The
emergence and commercialization of these new instruments capable of meeting the needs of these
fields, and others on the rise, have offered significant advantages like the possibility to work with a
small sample volume, reduce solvent consumption, thus maintain lower analysis costs, as well as an
improve the detection as a result of the lower chromatographic dilution. Besides, the development of
these systems has opened the introduction of hand‐portable LC instruments, which special ability to
offer results quickly, overcome obstacles related to the preservation of the sample, and allow
applications in situ or at‐situ monitoring.
The main characteristics of miniaturized and portable systems are tuned with the
environmental approach, in the recent context of green analytical chemistry, which demands the need
to develop new and sustainable analytical techniques from an ecological point of view, to expand the
applicability of liquid chromatography. In this sense, the development of new sample treatment
techniques, alternatives to liquid‐liquid extraction and solid‐phase extraction, traditionally used,
represents one of the most important topics that researchers address. As noted above, a
preponderant group of these alternative techniques are the SPME techniques, within which IT‐SPME
stands out for its characteristics in reducing analysis time and solvent consumption, decrease in waste
generation, as well as the easy implementation in line with the chromatographic system, making the
coupling of IT‐SPME with miniaturized and portable systems an ideal option for the development of
methodologies with high analytical performance and low environmental impact.
In this scenario, the use of commercially available extractive phases, as well as the
development of new sorbent phases for IT‐SPME, and the application of analytical procedures using
miniaturized and portable LC systems for the study of substances of interest in biological,
environmental matrices, food and natural products is eminently required. Therefore, the main
objective of this doctoral thesis is the study of miniaturized and portable liquid chromatography, and
its on‐line coupling to in‐tube solid‐phase microextraction for the analysis of different matrices. To
fulfill it, the following specific objectives are set:
Develop a methodology based on IT‐SPME coupled with Cap LC for the determination of
caffeine and its main metabolites in serum, urine, and oral fluid, with characteristics of simple
and green chemistry sample treatment technique, simple analytical procedure, and use of a
minimum amount of sample.
Chapter 2. Objectives
48
Explore the basic characteristics of the merit and operability of a portable NanoLC for the
determination of trimethylxanthines in environmental waters.
Evaluate possible strategies for water sample treatment for on‐site analysis, including the off‐
line IT‐SPME and solid‐phase extraction (SPE) with cartridges.
Developed chromatographic strategies for the simultaneous determination of major and trace
compounds commonly found in dietary supplements based on capillary liquid
chromatography.
Developed a method for the quantification of volatile and non‐volatile representative terpenic
compounds in micro samples for the characterization of natural resins.
The development of this thesis has been possible thanks to doctoral grant “Programa de
Relevo Docente” from the Universidad Nacional Autónoma de Honduras (Honduras) and the research
projects awarded to the MINTOTA group, which are detailed below:
P. Campíns (PI), R. Herráez, C. Molins, J. Verdú, Y. Moliner. Ref .: CTQ2017‐90082‐P TITLE:
MICROEXTRATION IN SOLID PHASE IN TUBE COUPLED IN LINE TO LIQUID
NANOCROMATOGRAPHY: NEW OPPORTUNITIES FOR / FROM NANOESCALA AND LIQUID
CHROMATOGRAPHY ”. Financing: MCIU / FEDER, 01/01/2018 to 12/31/2021, € 134,310.00
and FPI contract.
Development of new strategies for the design of an in situ analysis device: nano and
biomaterials. Prometheus Program for research groups of Excellence PROMETEO / 2016/109
2016‐€ 54,298; 2017‐ € 63,000; 2018‐ € 63,000; 2019‐ € 63,000. Responsible researcher: Pilar
Campíns Falcó.
VLC‐BIOMED PROGRAM: 2016 grants to carry out joint projects between researchers from the
University of Valencia and researchers / professionals from the Hospital Universitario y
Politécnico / Instituto de Investigación Sanitària La Fe. Non‐invasive pharmacokinetic study of
caffeine administered in newborn infants with a diagnosis apnea in prematurity. Financing: €
4,000. IP: Jorge Verdú Andrés.
The knowledge acquired during the development of this doctoral thesis has allowed us to
obtain as a result publication of 4 scientific articles published or send to high‐impact journals, and one
pending submissions for publication.
Ponce-Rodríguez, H.D., García‐Robles, A.A., Sáenz‐González, P., Verdú‐Andrés, J. and
Campíns‐Falcó, P. (2020). On‐line in‐tube solid phase microextraction coupled to capillary
liquid chromatography‐diode array detection for the analysis of caffeine and its metabolites

Chapter 2. Objectives
49
in small amounts of biological samples. Journal of Pharmaceutical and Biomedical Analysis,
178, 112914. Impact Factor (JCR 2018): 2.983. Contribution 100%.
Ponce-Rodríguez, H.D., Herráez‐Hernández, R., Verdú‐Andrés, J. and Campíns‐Falcó, P.
(2019). Quantitative Analysis of Terpenic Compounds in Microsamples of Resins by Capillary
Liquid Chromatography. Molecules, 24, 4068. Impact Factor (JCR 2018): 3.060. Contribution
100%.
Ponce-Rodríguez, H.D., Verdú‐Andrés, J., Herráez‐Hernández, R. and Campíns‐Falcó, P.
(2020). Innovations in extractive phases for in‐tube solid‐phase microextraction coupled to
miniaturized liquid chromatography: A critical review. Molecules, 25, 2460. Impact Factor (JCR
2018): 3.060. Contribution 100%.
Ponce-Rodríguez, H.D., Verdú‐Andrés, J., Herráez‐Hernández, R. and Campíns‐Falcó, P.
(2020). Exploring hand‐portable nano‐liquid chromatography for in place water analysis:
determination of trimethylxanthines as a use case. Science of the Total Environment (In
revision). Contribution 100 %.
Ponce-Rodríguez, H.D., Verdú‐Andrés, J., Herráez‐Hernández, R. and Campíns‐Falcó, P.
(2020). Multi‐class analysis of botanical dietary supplements by capillary liquid
chromatography. Pending submit. Contribution 100 %.
Likewise, the results obtained in the development of this thesis have been disseminated
through its presentation as a poster or oral presentation in different national and international
conferences. The works presented include:
Ponce-Rodríguez, H.D., Verdú‐Andrés, J., Herráez‐Hernández, R. and Campíns‐Falcó, P.
(2019). Analysis of terpenic compounds in microsamples of natural resins by capillary liquid
chromatography. XXII Reunión de la Sociedad Española de Química Analítica. Valladolid,
España, National congress. Póster.
Verdú‐Andrés, J., Ponce-Rodríguez, H.D. and Campíns‐Falcó, P. (2019). Determination of
trimethylxanthines as anthropogenic contaminants in drinking and wastewater by In‐tube
Solid‐phase microextraction ‐ CapLC. XXII Reunión de la Sociedad Española de Química
Analítica. Valladolid, España, National congress. Oral presentation.

Chapter 2. Objectives
50
Ponce-Rodríguez, H.D., Verdú‐Andrés, J., Herráez‐Hernández, R. and Campíns‐Falcó, P.
(2019). Chemical Composition of Dietary Supplements by Capillary Liquid Chromatography‐
Diode Array Detection. 25th International Symposium on Separation Sciences. Lodz, Polonia,
International congress. Oral presentation.
Verdú‐Andrés, J., Ponce-Rodríguez, H.D., García‐Robles, A.A., Sáenz‐González, P. and
Campíns‐Falcó, P. (2019). On‐line IT‐SPME coupled to CapLC‐DAD for the Analysis of Small
Amounts of whole Biological samples. 25th International Symposium on Separation Sciences.
Lodz, Polonia, International congress. Oral presentation.
CHAPTER 3. EXPERIMENTAL METHODOLOGY

Chapter 3. Experimental methodology
52
3.1 CHEMICALS
For the development of this thesis, analytical grade reagents were used, which are
presented in the Table 9. Likewise, the chemical supply company and the safety pictograms are
shown, according to the guidelines R (CE) n ° 1272/2008 of the Parliament and of the Council,
regarding the classification, labeling, and packaging of substances and mixtures.
Table 9. List of reagents, chemical supply company and safety pictograms Flammable, corrosive,
toxic, high-dose side effects, dangerous for health, Dangerous for the environment. 1) Sigma: Sigma-Aldrich; Dr. Ehrenst: Dr Ehrenstorfer; Cayman: Cayman Chemical; Fisher: Fisher Scientific.
Reagent Chemical
supply company1
3‐CQA (Neochlorogenic acid)
Phytopurify
3,4‐diCQA (Isochlorogenic acid B)
Phytopurify
3,5‐diCQA (Isochlorogenic acid A)
Phytopurify
4‐CQA (Cryptochlorogenic acid)
Phytopurify
4,5‐diCQA (Isochlorogenic acid C)
Phytopurify
5‐CQA (5‐caffeoylquinic acid)
Sigma
α‐amyrin Sigma α‐pinene Sigma x x x x β‐amyrin Sigma Acetic acid VWR x x Acetone Panreac x x Acetonitrilo VWR x x Ammonia Scharlab x x x APTS Sigma x x Bovine serum albumin Sigma Brij 35 P Merck x Caffeic acid Sigma Caffeine Sigma Cetyltrimethylammonium chloride solution (CTAC)
Sigma x x
Chloroform Romil x Copper(II) sulfate pentahydrate
Merck x
Ethanol VWR x x Ethyl acetate Romil x Farnesene Sigma x Formic acid 85% VWR x x x Hydrochloric acid Scharlab x x Isopropanol Scharlab x

Chapter 3. Experimental methodology
53
Reagent Chemical
supply company1
Kaempferol Fisher Limonene Sigma x x x x Linalool Sigma x Lupenone Sigma Lupeol Cayman Methanol VWR x x x MTEOS Sigma x Myrcene Sigma x x x Paraxanthine Sigma Phosphoric acid (85%) Scharlab x Poly(vinyl alcohol) Sigma Polyethylene glycol (PEG) Sigma Riboflavin Guinama SiO2 NPs (20 nm) Sigma x Sodium carbonate Prolabo x Sodium chloride Scharlab Sodium citrate tribasic dihydrate
Sigma
Sodium dodecyl sulfate Panreac x x x Sodium dodecylbenzenesulfonate
Sigma x x
Sodium hydroxide Sigma x Sodium phosphate dibasic Sigma Synephrine Sigma x TEOS Sigma x x Tetrahydrofuran Scharlab x Theobromine Sigma Theophylline Sigma TiO2 NPs (21 nm) Sigma x ZnO NPs (44 nm) Sigma x ZrO2 NPs (20 nm) Sigma

Chapter 3. Experimental methodology
54
3.2 INSTRUMENTATION
In the framework of this thesis, different analytical instruments were used, the specifications
of them are detailed below, including spectroscopy, microscopic and chromatographic techniques.
3.2.1 Spectroscopic techniques
3.2.1.1 UV-vis spectrophotometry
For the acquisition of UV‐vis molecular absorption spectra, a Carry‐60 spectrophotometer
(Agilent Technologies, Santa Clara, CA, USA) (Figure 10. A) was used. A quartz or plastic cuvette with
an optical path of 1 cm and a range of measures between 190 and 1000 nm was used in all
experiments. Acquisition of signals, as well as data processing, was performed with Carry WinUV
software (Agilent Technologies). Other spectrophotometric measurements were also made with an
optical fiber device (3.5 mm diameter and 10 mm optical path) coupled to the same instrument (Figure
10. B).
Figure 10. A) Cary-60 UV-vis spectrophotometer; B) Optical fiber.
3.2.2 Microscopic techniques
3.2.2.1 Optical microscope
A microscope ECLIPSE E200LED MV Series (Nikon, Tokyo, Japan) under bright and darkfield
illumination was used. For images acquisition and processing a Nis‐Elements 4.20.02 software (Nikon)
was required. Figure 11 shows the microscope, equipped with 3 objective lenses of different
magnifications (10x, 50x, and 100x).

Chapter 3. Experimental methodology
55
Figure 11. Microscopic optical ECLIPSE E200LED MV.
3.2.3 Chromatographic techniques
Two chromatographic systems were applied to carry out the studies of this work. A CapLC
miniaturized liquid chromatography system with a DAD detector and coupled to IT‐SPME with in‐valve
configuration and, a hand‐portable NanoLC with a UV detector. Data acquisition and subsequent
processing have been done with HP ChemStation software (Agilent Technologies) and Axcend focus
LC software (Provo, UT. USA).
3.2.3.1 Capillary liquid chromatography
Agilent 1200 Series (Agilent Technologies), with a conventional binary pump with a flow split
that allows working with flows no higher than 20 µL min‐1. For sample introduction, a 6‐port manual
valve Rheodyne 7721‐i (IDEX Health and Science, Rohnert Park, CA. USA) was used, in which the
injection loop contained the extraction phase (details in section 3.3). Signals were recorded in a
wavelength range of 180 and 400 nm with a diode array detector (DAD) equipped with an 80 nL cell
(Agilent Technologies). Figure 12 shows the system with the configuration described above.
Chromatographic separations were carried‐out with C18 particulate columns (Section 3.5.1) from
Agilent and Phenomenex (Torrance, CA, USA).
Figure 12. Cap LC-DAD system, Agilent 1200 Series with binary pump.
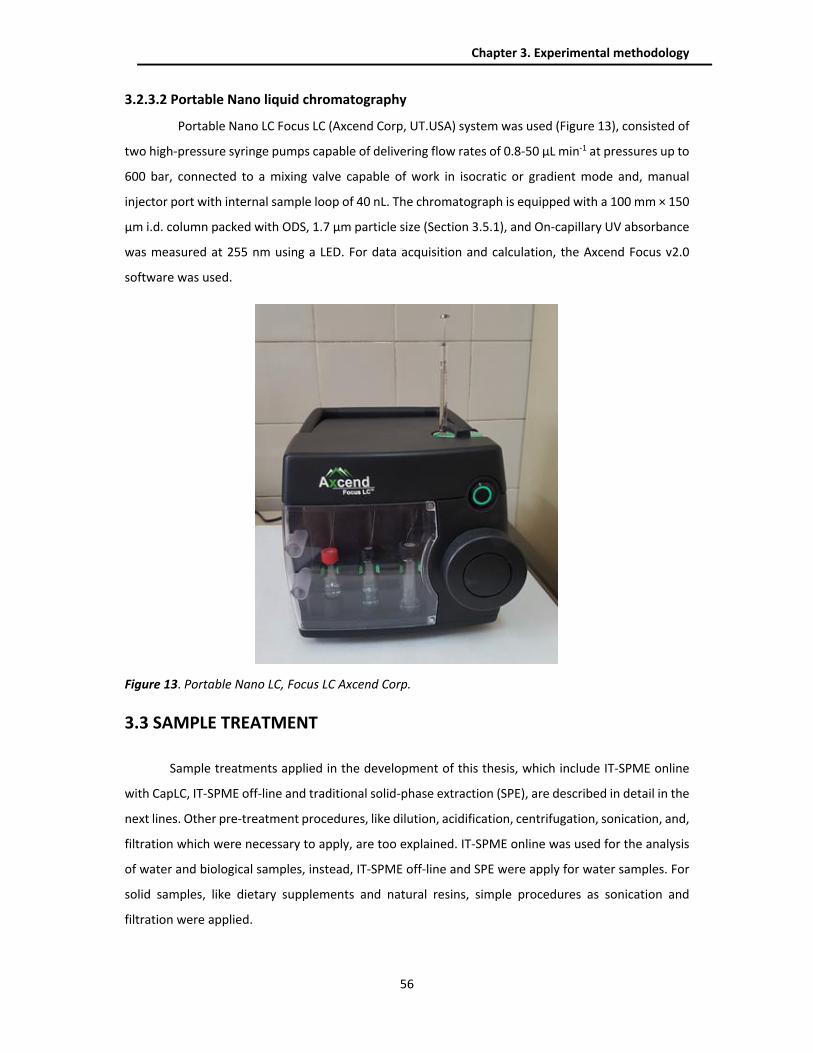
Chapter 3. Experimental methodology
56
3.2.3.2 Portable Nano liquid chromatography
Portable Nano LC Focus LC (Axcend Corp, UT.USA) system was used (Figure 13), consisted of
two high‐pressure syringe pumps capable of delivering flow rates of 0.8‐50 μL min‐1 at pressures up to
600 bar, connected to a mixing valve capable of work in isocratic or gradient mode and, manual
injector port with internal sample loop of 40 nL. The chromatograph is equipped with a 100 mm × 150
µm i.d. column packed with ODS, 1.7 µm particle size (Section 3.5.1), and On‐capillary UV absorbance
was measured at 255 nm using a LED. For data acquisition and calculation, the Axcend Focus v2.0
software was used.
Figure 13. Portable Nano LC, Focus LC Axcend Corp.
3.3 SAMPLE TREATMENT
Sample treatments applied in the development of this thesis, which include IT‐SPME online
with CapLC, IT‐SPME off‐line and traditional solid‐phase extraction (SPE), are described in detail in the
next lines. Other pre‐treatment procedures, like dilution, acidification, centrifugation, sonication, and,
filtration which were necessary to apply, are too explained. IT‐SPME online was used for the analysis
of water and biological samples, instead, IT‐SPME off‐line and SPE were apply for water samples. For
solid samples, like dietary supplements and natural resins, simple procedures as sonication and
filtration were applied.

Chapter 3. Experimental methodology
57
3.3.1 IT-SPME online
IT‐SPME online coupled to CapLC was used under in valve setting. Here, the conventional steel
injection loop of the 6‐port manual injection valve (Rheodyne) is replaced by a capillary, which
contains the sorbent phase, as Figure 14 shows. Conventional GC capillary columns with two sorbents
class, Si‐based (polysiloxane coating) and C‐based (divinylbenzene and polyethylene glycol) type were
used. Additionally, some capillaries with homemade sorbents synthesized with metallic nanoparticles,
have been used (for more details see Section 3.4). All of these capillaries with an internal diameter of
320 µm.
Figure 14. IT-SPME assembly with 1 capillary.
Then, a subsequent washing step is required, in which a certain volume, usually the internal
volume of the capillary, of nanopure water is passed without changing the valve position. This process
removes the impurities and compounds from the matrix that were not absorbed in the extraction
phase and avoid its entrance in the chromatographic system. After that, the valve was rotated to the
injection position, whereby the mobile phase passed through the extraction capillary, desorbing the
previously retained analytes and transferring them to the analytical column.
Biological samples
For serum samples, 25 µL were diluted and acidified with 75 µL of 1% aqueous formic acid
solution and then mixed in a vortex for 30 seconds. 10 µL of saliva and 100 µL of urine samples were
acidified with 10 µL and 300 µL of the same solution used for serum samples (1% aqueous formic acid)
respectively. A step of dilution was required for saliva, diluted to 100 µL, and urine, diluted to 1 mL,
both with ultrapure water and mixed for 30 seconds. Finally, an aliquot of diluted samples was
processed by IT‐SPME coupled to CapLC.
Water samples
For water samples, include river, sea, and tap water, only if necessary a filtration procedure
using a 0.22 µm pore size PTFE filter before the analysis was carried out.

Chapter 3. Experimental methodology
58
Dietary supplements samples
Accurately weighted homogenized portions of the solid dietary supplements were placed in 5
mL glass vials and extracted with a proper volume of methanol. Then, the mixture was subjected to
mechanical agitation for 1 minute. After this time, the solution was placed in an ultrasonic bath for 5
minutes at 30°C. The supernatants were removed by filtration with 0.22 µm nylon membranes. Finally,
the extracts were acidified and mixed with 0.1 % hydrochloric acid solution in a proportion 1:10 (v/v)
and chromatographed.
Natural resins samples
Portions of resins previously homogenized mechanically in a mortar with a pestle were
accurately weighed (≈1‐15 mg) in 2 mL glass vials. Then, the samples were treated with 1 mL of
methanol and the mixture was vortexed for 1 minute. Subsequently, the result solutions were filtered
through 0.22 µm nylon membranes to remove any particulate that could be present. Finally, aliquots
of filtrated were chromatographed.
3.3.2 IT-SPME offline
For IT‐SPME off‐line a C‐based capillary column (VP‐HayeSep P 50 cm long) with an internal
diameter of 320 µm was connected to a 6‐port manual injection valve (Rheodyne). In the initial stage,
the capillary was conditioned with 1 mL of nanopure water, then 8 mL of standard and water sample
solutions were passed through the capillary with a precision glass syringe. For desorption of the
analytes, 50 µL of methanol was passed and this solvent was collected to inject in hand‐portable
NanoLC. Figure 15 shows a schematic representation of this procedure. As mentioned in the previous
section, for water samples, the previous procedure only involved filtration with 0.22 µm pore size
PTFE.
Figure 15. Schematic representation of IT-SPME off-line.

Chapter 3. Experimental methodology
59
3.3.3 SPE
The solid‐phase extraction procedure included five steps, which in this work were as follows:
(1) activation with 1 ml of methanol; (2) conditioning with 1 mL of nanopure water; (3) loading of the
standard and sample solutions; (4) cleaning‐up with0.1 mL of nanopure water; and (5) elution of the
analytes with two individual portions of 0.1 mL of methanol. Finally, the two fractions were separately
filtered and injected into the hand‐portable Nano LC system. Figure 16 shows the schematic SPE
procedure for the analysis of water samples.
Figure 16. Schematic SPE procedure for the analysis of water samples.
3.4 SYNTHESIS OF NEW PHASES FOR EXTRACTION
As previously stated, the implementation of new phases to improve extraction efficiency in
IT‐SPME is one of the main topics of this technique. In this work, fused silica capillaries were coated
with a silicon polymer using the sol‐gel process. Also, this polymer was doped with NPs of SiO2 and
various metals and metal oxides to improve its extraction capacity. The experimental procedures
carried out for the development of these extraction phases used in the studies in the framework of
the development of this thesis are discussed in the following sections.
3.4.1 Capillary columns coated with a silicon polymer
Capillary columns of uncoated fused silica with an internal diameter of 320 µm were modified
with silicon polymeric material using the procedure detailed by Silva et al. [250]. For this, in the first
instance, the inner wall of the capillary was activated by passing an alkaline solution of 2M NaOH and
placed for 2 hours at a temperature of 40°C. Next, the capillary was washed with a 0.1M HCl solution

Chapter 3. Experimental methodology
60
and left to act for 30 minutes at room temperature. After this time, it was subjected to heat for 3
hours at 60°C.
Subsequently, the residues were washed with nanopure water, and the polymer dispersion
was then passed. It was prepared with 65 mg of PEG, 50 µL of H2O, 100 µL of TEOS, 100 µL of MTEOS
and 2 mL of 0.1M NH4OH. Once the volume filling was assured inside the capillary column, the ends
of the cap were capped and warmed with a temperature program of 2 hours at 40°C and 12 hours at
120°C. Finally, the capillary was washed with water and acetonitrile to remove the excess of reagents
present in the capillary. Likewise, capillary columns were modified following the previous procedure,
incorporating nanoparticles of SiO2, TiO2, ZrO2, CuO, ZnO or Al2O3 (0.05 mg mL‐1) to the monomer
mixture [251].
3.5 PROCEDURES AND EXPERIMENTAL CONDITIONS
3.5.1 Chromatographic conditions
Experimental conditions employed for the chromatographic separation of all studies and
procedures developed for CapLC and hand‐portable NanoLC in the framework of this thesis are
presented in Table 10. In all experiments, the mobile phase was filtered before use with 0.45 µm pore
size nylon filters, and 0.22 µm for portable NanoLC.

Chapter 3. Experimental methodology
61
Tab
le 1
0. C
hro
ma
tog
rap
hic
co
nd
itio
ns
of
the
pro
ced
ure
s u
sed
in t
his
th
esis
.
LC
Syst
em
An
aly
tes
Sam
ple
tr
eatm
ent
tech
niq
ue
Sorb
ent
ph
ase
A
na
lyti
cal
colu
mn
M
ob
ile p
ha
se
Flo
w r
ate
(µ
L m
in-1
)
Vo
lum
e in
ject
ed o
f sa
mp
le s
olu
tio
n
Det
ecto
r Se
ctio
n
Cap
LC
Caf
fein
e P
arax
anth
ine
Theo
bro
min
e Th
eop
hyl
line
IT‐S
PM
E o
nlin
e
TRB
‐50
ZB
17
01
ZB
WA
X p
lus
ZB F
FAP
TE
OS‐
MTE
OS‐
SiO
2
TEO
S‐M
TEO
S‐Ti
O2
Zorb
ax S
B
C1
8 (
15
0 x
0
.5 m
m, 5
µ
m)
Wat
er ‐
Met
han
ol
(fo
r se
rum
an
d o
ral
flu
id)
1
% a
qu
eou
s ac
etic
ac
id‐
Met
han
ol (
for
uri
ne)
75
:25
(0
min
) 7
0:3
0 (
7 m
in)
50
:50
(1
3 m
in)
50
:50
(1
7 m
in)
10
0:0
(2
0 m
in)
15
Seru
m a
nd
sal
iva:
2
5 µ
L
Uri
ne:
4
00
µL
DA
D
(27
5 n
m)
4.1
Caf
fein
e Th
eob
rom
ine
Syn
eph
rin
e R
ibo
flav
in
Caf
feic
aci
d
Kae
mp
fero
l Li
mo
nen
e α
‐Pin
ene
Farn
esen
e M
yrce
ne
Li
nal
oo
l 5
‐CQ
A
3‐C
QA
4
‐CQ
A
3,5
‐diC
QA
3
,4‐d
iCQ
A
4,5
‐diC
QA
IT‐S
PM
E o
nlin
e Fu
sed
sili
ca
un
trea
ted
Zorb
ax S
B
C1
8 (
15
0 x
0
.5 m
m, 5
µ
m)
Met
ho
d A
: W
ater
‐ A
ceto
nit
rile
85
:15
(0
min
) 8
0:2
0 (
5 m
in)
50
:50
(9
min
) 2
5:7
5 (
11
min
) 0
:10
0 (
15
min
)
Met
ho
d B
: 0
.1 %
aq
ueo
us
ph
osp
ho
ric
acid
‐M
eth
ano
l
75
:25
(0
min
) 7
0:3
0 (
7 m
in)
50
:50
(1
5 m
in)
25
:75
(2
0 m
in)
0:1
00
(2
3 m
in)
Met
ho
d A
:
10
Met
ho
d B
:
12
12
µL
DA
D
M
eth
od
A
2
00
, 22
0,
27
5, 3
30
, 3
70
nm
Met
ho
d
B
33
0 n
m
4.3

Chapter 3. Experimental methodology
62
Tab
le 1
0. C
on
tin
ua
tio
n.
LC
Syst
em
An
aly
tes
Sam
ple
tr
eatm
ent
tech
niq
ue
Sorb
ent
ph
ase
A
na
lyti
cal
colu
mn
M
ob
ile p
ha
se
Flo
w r
ate
(µ
L m
in-1
)
Vo
lum
e in
ject
ed o
f sa
mp
le
solu
tio
n
Det
ecto
r Se
ctio
n
Cap
LC
Lim
on
ene
Lup
eno
ne
β‐a
myr
in
α‐a
myr
in
Lup
eol
IT‐S
PM
E o
nlin
e Fu
sed
sili
ca
un
trea
ted
Zorb
ax S
B
C1
8 (
15
0 x
0
.5 m
m, 5
µ
m)
Wat
er: A
ceto
nit
rile
8
5:1
5 (
Iso
crat
ic)
10
5
µL
DA
D
(20
0 n
m)
4.4
Caf
fein
e Th
eob
rom
ine
Theo
ph
yllin
e
IT‐S
PM
E o
nlin
e V
P‐H
ayeS
ep P
H
P‐P
LOT/
Q
Ph
eno
men
ex
Syn
ergi
Fu
sio
n C
18
(1
50
mm
x
0.5
mm
, 4
µm
)
W
ater
‐ A
ceto
nit
rile
80
:20
(0
min
) 5
0:5
0 (
5 m
in)
25
:75
(9
min
) 0
:10
0 (
13
min
) 0
:10
0 (
16
min
)
15
4
00
0 µ
L D
AD
(2
75
nm
) 4
.2
Han
d‐
po
rtab
le
Nan
oLC
C
affe
ine
Theo
bro
min
e Th
eop
hyl
line
IT
‐SP
ME
off
‐lin
e
SPE
V
P‐H
ayeS
ep P
C‐1
8
Ph
eno
men
ex
Syn
ergi
Fu
sio
n C
18
(1
50
mm
x
0.5
mm
, 4
µm
)
W
ater
‐ A
ceto
nit
rile
95
:5 (
0 m
in)
80
:20
(4
min
) 5
:95
(4
.5 m
in)
5:9
5 (
4.7
min
)
2
10
µL
UV
(2
55
nm
) 4
.2
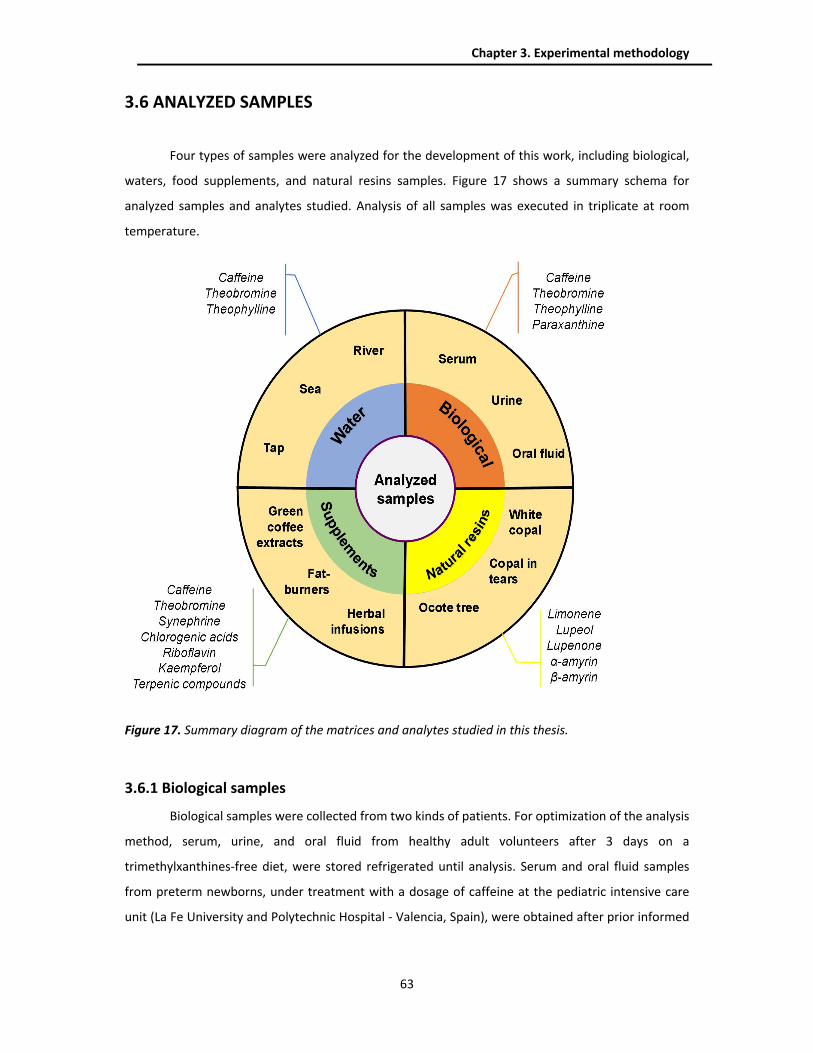
Chapter 3. Experimental methodology
63
3.6 ANALYZED SAMPLES
Four types of samples were analyzed for the development of this work, including biological,
waters, food supplements, and natural resins samples. Figure 17 shows a summary schema for
analyzed samples and analytes studied. Analysis of all samples was executed in triplicate at room
temperature.
Figure 17. Summary diagram of the matrices and analytes studied in this thesis.
3.6.1 Biological samples
Biological samples were collected from two kinds of patients. For optimization of the analysis
method, serum, urine, and oral fluid from healthy adult volunteers after 3 days on a
trimethylxanthines‐free diet, were stored refrigerated until analysis. Serum and oral fluid samples
from preterm newborns, under treatment with a dosage of caffeine at the pediatric intensive care
unit (La Fe University and Polytechnic Hospital ‐ Valencia, Spain), were obtained after prior informed

Chapter 3. Experimental methodology
64
consent from their parents. The collection and storage procedures for all specimens are detailed
below.
3.6.1.1 Serum
Blood samples, obtained in plastic tubes containing gel for a total volume of 0.8 mL of sample (Mini
Collect, Greiner Bio‐One, Kremsmünster, Austria), were filled. Then, the tube was inverted until the
blood completely mixed with the gel and centrifuged. Finally, the separated serum was stored frozen
at −20 ◦C pending analysis.
3.6.1.2 Urine
Urine samples were obtained in sterile flasks of 120 mL of capacity, centrifuged and stored
at −20 ◦C un�l analysis.
3.6.1.3 Oral fluid
Oral fluid samples were collected using cellulose spears devices (EYETEC, North Yorkshire, UK).
The devices were placed in the mouth of the patient for 1–10 minutes until the spears were saturated
with the fluid. Then, the saturated end of the spear was placed in the collection cone tube insert and
cut off. Subsequently, the tube was frozen at −20 ◦C, and just before analysis, a centrifuga�on step
was applied, and the supernatant was collected. A second procedure for the preservation of oral fluid
samples was performed, differentiating itself from the first, in that the centrifugation step was carried
out immediately after obtaining the sample. Although equivalent results were obtained for the same
sample processed by both procedures, the first procedure shows slightly better repeatability,
additionally fewer impurities were detected. With the idea of reducing the sample processing time,
the first procedure will only require one centrifugation step.
3.6.2 Waters
For the development of this thesis, different types of water have been collected and analyzed,
all of these taken at different points in the Comunidad Valenciana, Spain. All samples were collected
in amber glass bottles, of 250 mL of capacity, previously cleaned in the laboratory with acetonitrile,
methanol, and water, and rinsed with the sample water on‐site and filled completely up to the rim to
eliminate the headspace. The samples were transported from the sampling sites to the laboratory and
were kept cold (±4 °C) until the analysis, which was done one week later. In all these samples, the
presence of trimethylxanthines, including caffeine, theobromine, and theophylline, has been analyzed
as biomarkers of human activity.

Chapter 3. Experimental methodology
65
3.6.2.1 Superficial waters (river and sea water)
One‐time water samples were obtained from the Turia river, near Pinedo wastewater
treatment plant. Two sampling sites were established, the first one in front of WWTP and the second
one, downstream (500 m) of the WWTP. Three samples from the Magro river, in the southwest of
Valencia, were collected, following the same procedure above explained. Three sampling sites were
established, one just before the WWPT, one upstream (1 km), and a third one downstream (100 m) of
the wastewater treatment plant (WWTP). Finally, regarding the coastal water samples, these were
taken at different points on the Valencian coast.
3.6.2.2 Tap water
Tap water samples were collected in a house located at Burjassot town, in amber glass bottles,
following the same procedure for superficial samples. Then the bottles were transported to the
laboratory and stored in a refrigerator at ±4°C until the analysis.
3.6.3 Dietary supplements
Different types of dietary supplements acquired in local supermarkets were analyzed, three
brands of green coffee extract based products (GC), two fat burning formulations (FB), and finally, an
orange herbal preparation (HP). All these products with differences in labeling, some of them specify
the concentrations of the components present, and others only indicate the presence of some
substance.
3.6.3.1 Green coffee extracts
Green coffee extract (GC‐1), marketed in the form of bags, was prepared from extracts of
different plants, including green coffee, and reported the presence of limonene, theobromine, and
chlorogenic acids; the mean average mass of product per bag was 1.1 g. The sample GC‐2 only
reported 175 mg of decaffeinated green coffee extract per soft gelatin capsule (0.40 g). The label of
sample GC‐3 reported the presence of many compounds, including 200 mg of green coffee extract, 50
mg of green tea extract, 50 mg of Citrus aurantium (with 6 % synephrine), minor amounts of other
vegetal species, and 0.7 mg of riboflavin per soft gelatin capsule (mean average mass, 0.50 g).
3.6.3.2 Fat burning capsules
Sample FB‐1 reported the presence of a mixed extract of different plants including 125 mg of
Citrus aurantium (6 % synephrine) per soft gelatin capsule (0.50 g); kaempferol was claimed to be
present, although the amount was not reported. Sample FB‐2 reported among its ingredients 125 mg
of Citrus aurantium (also 6 % synephrine) and 55 mg of green tea per capsule (0.25 g), and some of
the vitamins of the B complex (pantothenic acid and pyridoxine).

Chapter 3. Experimental methodology
66
3.6.3.3 Herbal preparation
Sample HP (1.40 g per bag) was composed of a mixture of lime and leaves of orange trees
intended for the preparation of infusions; the presence of synephrine, chlorogenic acids, linalool, α‐
pinene, and limonene was declared to be present, among other compounds like flavonoids and
essential oils.
3.6.4 Natural resins
Different commercial samples of natural resins, identified as white copal and copal in tears,
as well as a resin obtained from ocote trees, were purchased in Sonora market (Ciudad de México,
México) in the year 2010. Figure 18 shows a photograph of the natural resins studied in this thesis.
Figure 18. Photograph of the natural resins studied in this thesis. A: Copal in tears; B: White copal; C:
Ocote tree copal.

CHAPTER 4. RESULTS AND DISCUSSION
Chapter 4. Results and discussion
68
4.1 CAFFEINE AND ITS METABOLITES IN BIOLOGICAL SAMPLES
As mentioned in the introductory section of this thesis, caffeine has been used as the drug of
the first choice in the treatment of apnea of prematurity. The results obtained in the development of
a procedure by IT‐SPME‐Cap LC for the determination of caffeine and its three main metabolites in
biological samples are described and discussed below, within the framework of the collaborative study
"CAFE‐CINETIC. Non‐invasive pharmacokinetic study of caffeine administered in newborns diagnosed
with apnea in prematurity", between our MINTOTA research group and Neonatal research unit.
The main objective of the study was to develop a methodology capable of quantifying the
serum and salivary concentrations of the target analytes to be used as a routine method in a hospital
laboratory for preterm infants, and which met some important requirements, such as the use of a
simple and green chemistry sample treatment technique, simple analytical procedure and a minimum
amount of sample.
4.1.1. Optimization of the chromatographic conditions
Chromatographic separation of these compounds in previous studies points to the use of
mobile phases containing aqueous dilutions of acids in conjunction with organic solvents such as
methanol and acetonitrile [252‐254]. In our study, better results, regarding efficiency and
chromatographic resolution, were obtained with a mixture of water and methanol and was used as
the mobile phase. Besides, different columns were tested to reach the total separation of the
compounds, and satisfactory results were found with the Zorbax SB C18 column.
Once the mobile phase and column were studied, several gradient elution programs were
analyzed to obtain a fast separation, as well as a good resolution of the four compounds, at the lower
pressure possible. High polarity of these compounds (pKa values between ‐0.8 and ‐0.02) requires the
use of a mobile phase mixture with low eluotropic power at the beginning of the chromatographic
separation (percentage of methanol less than 25%), as well as a gradient with a slow increase of the
organic phase.
The final conditions for the gradient were 25% of methanol at 0 min, after up to 30% in 7 min.
Next, the increase of organic solvent up to 50% was applied in 6 min. Afterward, this percentage was
held for 4 min to decrease to 0% at min 20. This last change was applied as a cleaning step, necessary
to clean impurities retained on the column, especially in saliva samples, otherwise, system pressure
increase with the number of samples processed. Finally, the initial conditions were obtained at 1 min
and hold for a stabilization time of 2 min. Suitable separation of the analytes before 14 min at a flow

Chapter 4. Results and discussion
69
of 15 µL min−1 was reached, as Figure 19 shows. In optimized conditions, a library of UV spectra of the
pure standard solutions was prepared to confirm the identity in biological real samples.
Figure 19. Chromatogram obtained in optimized conditions. Blue: Standard solution 20 µg mL−1; Red:
Oral fluid spiked at 20 µg mL−1; Green: Serum spiked at 50 µg mL−1
Subsequently, an evaluation of the separation of the analytes in fortified real samples was
carried out. Good results were achieved for serum and saliva samples (Figure 19). On the other hand,
urine analysis showed a high presence of impurities and endogenous substances of the matrix, in the
chromatogram. Therefore, an alternative mobile phase, with acidification of the aqueous phase with
acetic acid was required to minimize the matrix effect in urine samples. Figure 20 shows the
chromatograms of a fortified urine sample analyzed under conditions with the mobile phase at neutral
pH (black) and acidified (brown).
Figure 20. Chromatograms obtained in urine analysis optimization. Black: urine sample spiked at 20
µg mL−1 in mobile phase with neutral pH; Brown: urine sample spiked at 20 µg mL−1 in mobile phase
with acidification.
0
100
200
300
400
500
5 8 11 14
Time (min)
Absorb
ance (m
AU)
Theobro
min
e
Theophyllin
e
Caffein
e
Para
xanth
ine
0
300
600
900
5 7 9 11 13 15 17
Time (min)
Absorb
ance (m
AU
)
Theobro
min
e
Theophyl
line
Caff
ein
e
Para
xanth
ine
Chapter 4. Results and discussion
70
4.1.2. Optimization of IT-SPME
Once the chromatographic separation was optimized, the sample treatment technique was
optimized, for which the flow‐through mode of IT‐SPME was used. Here, a capillary column was used
instead of the conventional injection loop connected to a six‐port injection valve (Rheodyne®). The
different parameters of the technique were optimized to achieve high recovery values.
4.1.2.1. Capillary sorbent selection
The selection of the sorbent phase is the most important step in the optimization of IT‐SPME
since its nature defines the interaction of the analytes, and hence, the retention and preconcentration
of these in the sorption stage. In this work, conventional and modified phases, in decreasing order of
polarity, were tested: SiO2, TiO2, ZB‐FFAP (100% terephthalic modified PEG), ZB‐WAX plus (100%
polyethylene glycol (PEG)), TRB‐50 (polydimethylsiloxane (PDMS) with 50% of diphenyl groups) and
ZB1701 (polydimethylsiloxane with 14% of cyanopropylphenyl groups). To obtain the absolute
recoveries of the IT‐SPME procedure for each capillary column a 1 µg mL−1 solution of the analytes
was prepared and 100 µL of this solution was processed manually in all experiments.
The absolute recoveries were calculated by comparing the amount of analyte extracted (the
amount of the analyte transferred to the analytical column) to the total amount of analyte passed
through the extractive capillary column. The amount of analyte extracted was established from a
direct comparison of the peak areas in the resulting chromatographic analysis. The different
recoveries values obtained for all analytes with the six different capillaries tested are shown in Figure
21. The results obtained concluded that caffeine presents a higher recovery value with the FFAP
capillary, which can be attributed to the fact that this sorbent phase has the highest polarity, which
generates greater retention for these compounds. For the rest of the compounds, the obtained
percentages of recuperation were similar for FFAP and TRB‐50 capillaries. This behavior may be due
to the π‐π interactions of the TRB‐50 capillary, which increases the retention of these compounds in
IT‐SPME [255]. Finally, for all analytes, the lower recoveries were obtained with the capillary
containing cyanopropylphenyl groups, the less polar tested phase.

Chapter 4. Results and discussion
71
Figure 21. Absolute recoveries (%) obtained with the IT-SPME with the capillaries tested: ZB 1701
(blue), TRB-50 (yellow), ZB-WAX plus (gray), ZB-FFAP (purple), TiO2 (green) and SiO2 (red). The error
bars represent the standard deviation for n = 3.
4.1.2.2. Sample preparation, pH and ionic strength
Following the requirements initially established for the development of the analytical
procedure, concerning the use of the minimum sample volume of serum, saliva or urine, which is
conditioned by the amount of total sample available in preterm newborns patients, the sample
preparation optimization was carried out with the smallest volume that allows reaching an adequate
sensitivity. Furthermore, simplifying the preparation procedure, with minimum steps will also
facilitate its implementation in routine work in a clinical laboratory setting.
As mentioned in the introductory part of this thesis, the preparation of biological samples
requires the application of some pre‐treatment procedures to facilitate instrumental analysis. The
acidification commonly is used to precipitate proteins, as well as provide similar pH and ionic strength
for all the samples. Additionally, a sample pretreatment procedure commonly used before
instrumental analysis is the dilution, with special application in biological fluids with high viscosity, as
is the oral fluid. This high viscosity can cause increments in the pressure of the chromatographic
system, so the dilution of the sample is necessary, but it is important to take an account that this
procedure does not affect the sensitivity of analysis, as well as the analyte adsorption in the sorbent
phase of the capillary column. Normally, urine sample preparation includes dilution and precipitation
processes due to the high quantity of impurities present in this kind of sample.
Methanol, aqueous dilutions of phosphoric acid 1%, and formic acid 1% were tested as
modifiers for pH and dilution solvent. Better results were obtained with the formic acid dilution
because it improves the sensitivity of the compounds and also decreases the pressure in the
0
5
10
15
20
Theobromine Paraxanthine Theophylline Caffeine
Absolu
te r
ecove
ries (%
)
Compounds

Chapter 4. Results and discussion
72
chromatographic system, as results of precipitation of protein and endogenous interferences. Also, an
effect in buffer capacities both of ionic strength and pH regardless of the original sample nature was
obtained.
Subsequently, the quantity of diluted acid and dilution factors were optimized. For oral fluid,
ten microliters of the sample were mixed with the same volume of diluted formic acid, and for urine
samples, 300 microliters of the diluted acid were added to 100 microliters of the sample. In both cases,
a dilution factor of ten was employed using nano‐pure water. Serum samples only needed a dilution
factor of four with formic acid 1% solution. For this, 25 microliters of sample were mixed with 75
microliters of acid dilution.
4.1.2.3. Sample volume
As some papers of literature have reported, the extraction efficiency of IT‐SPME decrease
when the inner surface is saturated [17, 256], the extraction efficiency of IT‐SPME decrease when the
inner surface is saturated, so different sample volumes were prepared and processed to optimize this
parameter. No significant differences in the analytical signals from 100 µL of saliva, 500 µL for serum
and 1000 µL of urine to the values obtained with 10 µL, 25 µL, and 100 µL respectively.
Once the saturation of the sorbent phase is reached, even if the sample volume passed
through the capillary column is increased, no more retention of the analytes is obtained. Instead, only
possible interferences could be retained, but in our case, no effect of the impurities and endogenous
compounds of the sample in the retention of the analytes in the capillary was found. Based on these
results, and according to the initial objective of the work, reducing the amount of sample and
considering the therapeutic concentration range of real samples, the minimum possible volume was
selected.
4.1.2.4. Diluted sample volume processed
Since the diluted samples must be processed through IT‐SPME, the optimal volume was
obtained by comparison of the analytical signal of different volumes. This comparison showed that 25
µL of the diluted sample of oral fluid and serum generated a similar analytical signal to those obtained
when 100 µL was used. The same behavior was obtained for urine samples since 400 and 1000 µL of
the diluted sample produced equivalent signals.
It is possible to affirm that the absence of a preconcentration effect in the sorption phase for
these compounds is due to its high polarity that not allows great interactions with the terephthalic
modified PEG sorbent phase of the FFAP capillary. Therefore, for oral fluid and serum samples, 25 µL
of the diluted sample was selected as the optimal volume and 400 µL for urine samples. Despite no

Chapter 4. Results and discussion
73
preconcentration effect was observed, the signal values obtained in the optimized conditions were
satisfactory for the expected concentrations of the compounds in real samples, likewise, the absolute
recoveries obtained are agreed with IT‐SPME reported usually values [257].
4.1.2.5. Flushing of capillary
In IT‐SPME a capillary washing step is required to minimize the presence of impurities of the
sample in the chromatographic system due to endogenous substances and impurities of the matrix
that can be retained in the capillary together with the analytes [258]. However, the high polarity of
the trimethylxanthines studied limits the possibilities of using solvents with strong elution power such
as acetonitrile. Two solvents were tested: water and a mixture of equal parts of methanol and water.
In both cases the volume used was the internal volume of the capillary (25 µL). When the
methanol/water mixture was used, the chromatographic signal of the analytes decreased. On the
other hand, flushing with water before injection allowed the reduction of impurities without
decreasing the signal of the analytes. Figure 22 shows the optimized procedure of IT‐SPME for the
analysis of serum, oral fluid, and urine samples.
Figure 22. Schematic procedure of analysis.
4.1.2.6 Effect of proteins of oral fluid on the system pressure
Because the composition of saliva includes at least more than 400 types of protein, including
albumin, these solid components may differ from person to person, and can even vary in the same
individual at distinct times during a day [134]. For some oral fluid samples, a high presence of

Chapter 4. Results and discussion
74
precipitated matter (endogenous compounds) was observed, and in the analysis of these samples, the
chromatographic system pressure increased. The quantification of albumin by the Biuret method
[259] was applied to evaluate its effect on the overpressure.
10 µL of a bovine albumin solution prepared in nanopure water at 8 mg mL‐1, was mixed with
30 µL of water, 10 µL of sodium hydroxide (0.625 M) and 50 µL of biuret reactive. The biuret reactive
was prepared by mixing 0.9 g copper(II) sulfate pentahydrate, 8.6 g sodium citrate tribasic dihydrate
and 5.0 g sodium carbonate in 50 mL of nanopure water. The mixture was analyzed in a Carry‐60
microcell spectrophotometer in a wavelength range between 500 and 700 nanometers, and the
absorbance value of the complex formed was recorded at 545 nm. This procedure was repeated for
different oral fluid real samples.
High amounts of protein were found in the samples that increased the pressure of the
chromatographic system. Therefore, to avoid this effect, these samples were centrifuged twice. In any
case, this additional treatment did not cause changes in the found concentrations of caffeine.
4.1.3. Analytical performance
Different bioanalytical parameters were evaluated to establish that the optimized method is
suited to the analysis of the study samples with adequate performance, following the
recommendations of some official guides [260,261]. The results of this evaluation are discussed next.
4.1.3.1. Calibration curve and matrix effect
An important parameter for the evaluation of bioanalytical methods is the matrix effect study
since biological specimens contain varying levels of impurities and endogenous compounds, which
probably may interfere in the precision and recovery of the analytes. For this, fortified blank serum,
oral fluid, and urine samples were prepared and analyzed under the optimized procedure. For this
purpose calibration standard solutions of the four trimethylxanthines at concentration levels of 5, 10,
20, 30, and 50 µg mL−1 in oral fluid and urine, and 1, 5, 10, 20, and 30 µg mL−1 in serum, were prepared.
Then, the corresponding solutions were prepared in nano‐pure water at the same concentration, and
all the solutions were analyzed with the proposed method, following the procedure described in
Figure 22.
Calibration curves (peak area vs concentration) with five points, by duplicate, were prepared.
Correlation coefficients greater than 0.99 were observed for all compounds in all the matrix tested
(Table 11). Likewise, the comparison of slope values obtained for the same analyte in the different
matrices assayed was different and related to the dilution performed. Finally, the amount of diluted
sample processed was different in each case.

Chapter 4. Results and discussion
75
Table 11. Evaluation of linearity, limit of detection and quantification.
Analytes Parameter Serum Oral fluid Urine
Matrix Water Matrix Water Matrix Water
Theobromine
Slope 99 ±6 91 ±5 18.0 ±0.8 21 ±1 45 ±2 43 ±2
Intercept 890 ±100 100 ±80 50 ±30 ‐80 ±30 ‐130 ±80 ‐20 ±70
r 0.9949 0.9962 0.9971 0.9969 0.9956 0.9966
r2 0.989 0.9924 0.9942 0.9938 0.9912 0.9932
LOD 0.1 0.5 0.5
MQL 0.4 1.5 1.5
Paraxanthine
Slope
94 ±2
75±3
31.3 ±0.9
35.8 ±1.2
76.4 ±4
75 ±4
Intercept 70 ±40 110 ±60 20 ±20 ‐60 ±40 ‐70 ±110 ‐90 ±100
r 0.9991 0.9968 0.9987 0.9982 0.9962 0.9965
r2 0.998 0.9936 0.9974 0.9964 0.9924 0.9930
LOD 0.1 0.5 0.5
MQL 0.4 1.5 1.5
Theophylline
Slope
144 ±2
136 ±6
43.6 ±1.7
54.2 ±1.8
102 ±6
106 ±7
Intercept ‐50 ±40 70 ±100 100 ±50 ‐190 ±50 40 ±170 ‐160 ±190
r 0.9996 0.9971 0.9976 0.9983 0.9946 0.9937
r2 0.9992 0.9942 0.9952 0.9966 0.9892 0.9874
LOD 0.1 0.5 0.5
MQL 0.4 1.5 1.5
Caffeine
Slope
66 ±4
69 ±5
28.4 ±1.3
30.8 ±1.4
72.7 ±1.5
77 ±3
Intercept 150 ±70 98 ±80 ‐60 ±40 ‐80 ±40 ‐40 ±40 ‐180 ±80
r 0.9936 0.9930 0.9970 0.9967 0.9993 0.9979
r2 0.987 0.986 0.9940 0.9934 0.9986 0.9958
LOD 0.1 0.5 0.5
MQL 0.4 1.5 1.5
Concentrations in µg mL−1 (Linear range for saliva and urine 5–50 µg mL-1, for serum 1–30 µg mL-1)
(n=10). Equations expressed as y = ax +b. The values added after the ± sign represent the standard
deviation of the slope and the intercept respectively. r: correlation coefficient; r2: squared correlation
coefficient. LOD: Limit of detection; MQL: Method quantification limit.
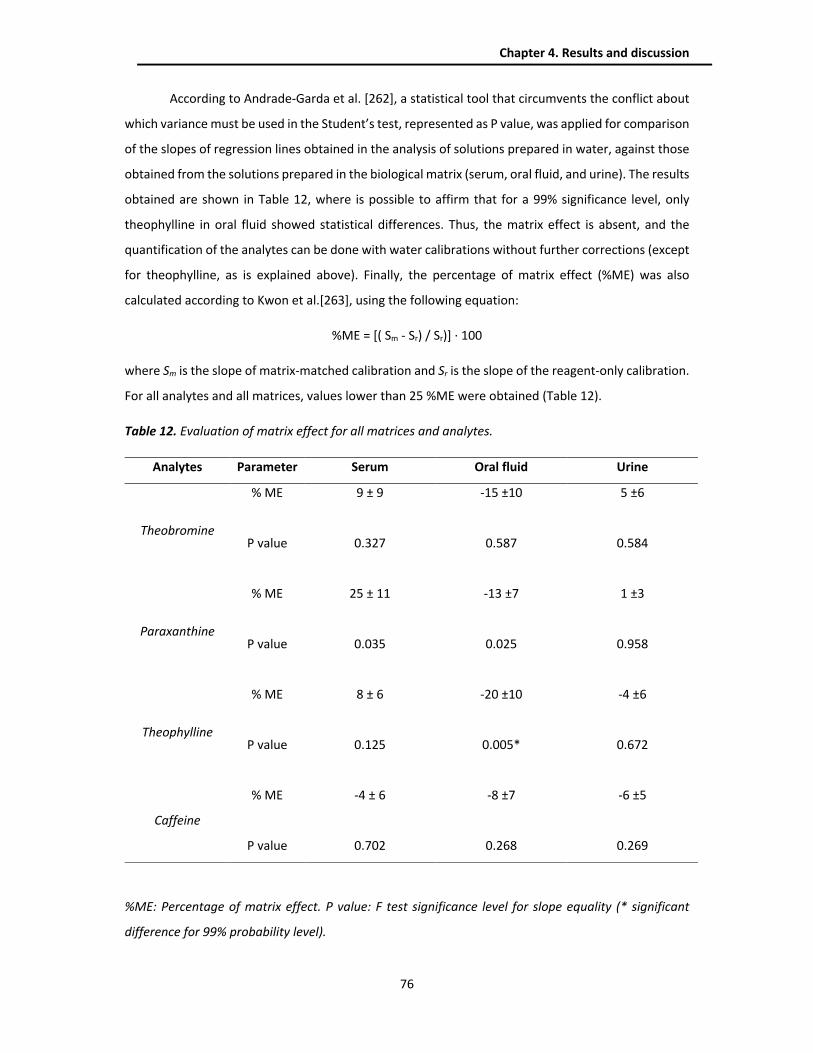
Chapter 4. Results and discussion
76
According to Andrade‐Garda et al. [262], a statistical tool that circumvents the conflict about
which variance must be used in the Student’s test, represented as P value, was applied for comparison
of the slopes of regression lines obtained in the analysis of solutions prepared in water, against those
obtained from the solutions prepared in the biological matrix (serum, oral fluid, and urine). The results
obtained are shown in Table 12, where is possible to affirm that for a 99% significance level, only
theophylline in oral fluid showed statistical differences. Thus, the matrix effect is absent, and the
quantification of the analytes can be done with water calibrations without further corrections (except
for theophylline, as is explained above). Finally, the percentage of matrix effect (%ME) was also
calculated according to Kwon et al.[263], using the following equation:
%ME = [( Sm ‐ Sr) / Sr)] · 100
where Sm is the slope of matrix‐matched calibration and Sr is the slope of the reagent‐only calibration.
For all analytes and all matrices, values lower than 25 %ME were obtained (Table 12).
Table 12. Evaluation of matrix effect for all matrices and analytes.
Analytes Parameter Serum Oral fluid Urine
Theobromine
% ME 9 ± 9 ‐15 ±10 5 ±6
P value
0.327
0.587
0.584
Paraxanthine
% ME 25 ± 11 ‐13 ±7 1 ±3
P value
0.035
0.025
0.958
Theophylline
% ME
8 ± 6
‐20 ±10
‐4 ±6
P value
0.125
0.005* 0.672
Caffeine
% ME
‐4 ± 6
‐8 ±7 ‐6 ±5
P value 0.702 0.268 0.269
%ME: Percentage of matrix effect. P value: F test significance level for slope equality (* significant
difference for 99% probability level).

Chapter 4. Results and discussion
77
4.1.3.2. Limit of detection and quantification
For the calculation of the limits of detection (LOD) a signal‐to‐noise ratio (S/N) of 3 was used,
and the method quantitation limits (MQLs) were estimated via S/N of 10. LOD for all analytes in oral
fluid and urine was 0.5 µg mL−1, instead, for serum samples was 0.1 µg mL−1, which can be explained
due to the lower dilution performed (dilution factor of 4). MQLs were 0.4 µg mL−1 for serum samples,
and 1.5 µg mL−1 for oral fluid and urine samples (Table 11).
4.1.3.3. Precision
For the study of the precision, evaluated in terms of repeatability, values of HorRat(r) were
calculated according to AOAC for intra laboratory studies [264], from the following equation:
HorRat(r) = (RSDr / PRSDR)
where the term RSDr is the Repeatability Relative Standard Deviation, it means the relative standard
deviation calculated from within‐laboratory data, and the term PRSDR is the Predicted Relative
Standard Deviation, that is the reproducibility relative standard deviation calculated from the Horwitz
formula. In that line, PRSDR is calculated according to Horwitz formula:
PRSDR = 2C−0.15
Where the term C is expressed as a mass fraction, Horwitz calculation is applicable only for analyses
that report the concentration in mass ratio units and was based on the statistics calculated for several
hundred collaborative studies, including several analyte/matrix/level combinations from studies
dating back to the early 20th century [265]. For repeatability, commonly acceptable HorRat(r) values
are in the range of 0.3–1.3 [260].
The intra‐day precisions using three determinations at two concentration levels for serum
samples, three concentration levels in oral fluid samples and one concentration level for urine samples
are shown in Table 13. According to the acceptance criteria pointed above, HorRat (r) values were
inside the acceptable limits, except for theophylline at a high concentration level in saliva (50 µg mL−1)
which a higher value was found, and for caffeine, at a low concentration level in serum (0.4 µg mL−1)
a slightly lower value was obtained. Finally, the mean HorRat(r) values for serum, oral fluid, and urine
were 0.65, 0.97 and 0.69 respectively, without significant differences among them.
For the inter‐day precisions, using three determinations for serum and oral fluid samples at
two concentration levels, and one concentration level of urine samples, the HorRat(r) values obtained
were inside the acceptable limits. In this case, the means HorRat(r) values for serum, oral fluid, and
urine were 0.63, 0.75 and 0.47, and just like for intra‐day precision no significant differences among
them were found.

Chapter 4. Results and discussion
78
Table 13. Precision parameters for methylxanthines in biological samples by IT-SPME
Analytes Parameter
Serum Oral fluid Urine
0.4 µg mL−1 20 µg mL−1 1.5 µg mL−1 5 µg mL−1 50 µg mL−1 20 µg mL−1
RSD% HorRat
(r) RSD%
HorRat
(r) RSD%
HorRat
(r) RSD%
HorRat
(r) RSD%
HorRat
(r) RSD%
HorRat
(r)
Theobromine
Intra‐day
assay 14.3 0.78 12.4 1.22 13.2 0.88 13.9 1.11 8.4 0.95 5.4 0.53
Inter‐day
assay 12.2 0.66 6.6 0.65 10.9 0.73 9.8 0.79 n.e 6.3 0.62
Paraxanthine
Intra‐day
assay 4.5 0.25 10.1 1.00 5.6 0.37 11.6 0.93 8.3 0.94 7.0 0.69
Inter‐day
assay 17.2 0.94 8.3 0.82 6.5 0.43 8.2 0.66 n.e 4.9 0.48
Theophylline
Intra‐day
assay 11.2 0.61 5.9 0.58 8.0 0.54 15.2 1.22 15.7 1.78 5.4 0.53
Inter‐day
assay 8.7 0.48 4.3 0.42 8.5 0.57 11.8 0.95 n.e 6.0 0.59
Caffeine
Intra‐day
assay 3.2 0.18 5.7 0.56 14.2 0.95 16.6 1.33 5.3 0.60 10.1 1.00
Inter‐day
assay 12.0 0.66 4.6 0.45 14.3 0.96 11.7 0.94 n.e 3.0 0.30
n.e: not evaluated. In all cases n = 3. Values in bold outside the allowed range.
4.1.3.4. Recovery
Recovery values were calculated as the relative recovery [266] (RR%), comparing the peak
area ratios of the analytes from the spiked serum, oral fluid, and urine blank samples to those obtained
from the working standard solutions (prepared with water) at the same concentration. Recovery was
tested at four different levels of concentrations, according to the FDA Guidance [261]. At the lower
limit of quantification was evaluated for serum (0.4 µg mL−1) and oral fluid (1.5 µg mL−1) samples. Low‐
concentration for all samples was estimated at 5 µg mL−1, instead, mid‐concentration assayed were
30 µg mL−1 for oral fluid and urine, while for serum was 10 µg mL−1. Finally, the high‐concentration in
serum was 30 µg mL−1 and 50 µg mL−1 for oral fluid and urine.
The relative recovery values obtained showed acceptable values in the range of 84‐114%, for
all the compounds at all levels of concentration evaluated, as it is shown in Table 14. For all
compounds, the mean recovery value in the oral fluid was 96.7%, in serum 102.9% and for urine
samples of 100.9%. Finally, regarding the compounds, the mean recoveries for all matrices were
104.3% for theobromine, 101.8% for paraxanthine, 95.1% for theophylline, and 99.3% for caffeine.

Chapter 4. Results and discussion
79
Table 14. Results of relative recovery for methylxanthines in biological samples by IT-SPME.
Serum Oral fluid Urine
Recovery (RR%)
Lower concentration 0.4 µg mL-1 1.5 µg mL-1
not evaluated
Theobromine
Paraxanthine
Theophylline
Caffeine
111.2 105.0
97.9 97.0
95.6 93.0
95.4 90.7
Low concentration 5 µg mL-1 5 µg mL-1 5 µ g mL-1
Theobromine 113.0 104.3 111.8
Paraxanthine 103.7 99.9 106.8
Theophylline 86.5 98.8 97.3
Caffeine 112.2 97.5 108.4
Mid concentration 10 µg mL-1 30 µg mL-1 30 µg mL-1
Theobromine 100.7 107.1 97.9
Paraxanthine 112.2 100.0 98.5
Theophylline 92.3 96.8 94.9
Caffeine 101.7 98.3 98.5
High concentration 30 µg mL-1 50 µg mL-1 50 µg mL-1
Theobromine 104.6 92.6 99.0
Paraxanthine 113.8 89.8 99.9
Theophylline 106.6 84.1 99.7
Caffeine 99.3 91.9 98.4
4.1.3.5. Specificity and selectivity
The specificity and selectivity of the method were established by the analysis of blank and
spiked samples from five individual sources, in which nonappearance of interferences at the retention
times of the analytes was shown. Furthermore, the absorption spectra of the corresponding peak for

Chapter 4. Results and discussion
80
the analytes in the enriched samples were compared with the spectra of a standard solution. Figure
23 shows the UV spectra recorded for the analytes studied.
Figure 23. UV spectra obtained for the trimethylxanthines studied.
4.1.3.6. Stability
For bioanalytical assays, the stability parameter evaluation includes, at the bench‐top, in
extracts, freeze‐thaw cycles, stock solution, and long‐term [261]. In this work, the freeze‐thaw and the
long‐term stability of the analytes were evaluated, being the only ones applicable to the IT‐SPME
procedure, due to the simplicity of this technique. For the freeze‐thaw stability, two concentration
levels, high and low, for serum (30 and 1 µg mL−1) and oral fluid (50 and 5 µg mL−1) with three cycles
of frozen for at least 12 hours between cycles and with three determinations in each cycle, were
tested. For all concentration levels, the recovery values were between 85.6‐108.4% of the fortified
concentration, being the acceptance criterion that the recovery at each level should be ± 15% of the
nominal concentration.
0
20
40
60
80
100
120
140
210 230 250 270 290 310 330 350
0
10
20
30
40
50
60
70
80
90
100
210 230 250 270 290 310 330 350
Theobromine
Theophylline Caffeine
Paraxanthine
0
20
40
60
80
100
120
210 230 250 270 290 310 330 350
0
10
20
30
40
50
60
70
80
90
100
210 230 250 270 290 310 330 350
λ (nm)
Ab
so
rba
nc
e (
m a
.u.)
λ (nm)λ (nm)
λ (nm)
Ab
so
rba
nc
e (
m a
.u.)
Ab
so
rba
nc
e (
m a
.u.)
Ab
so
rba
nc
e (
m a
.u.)
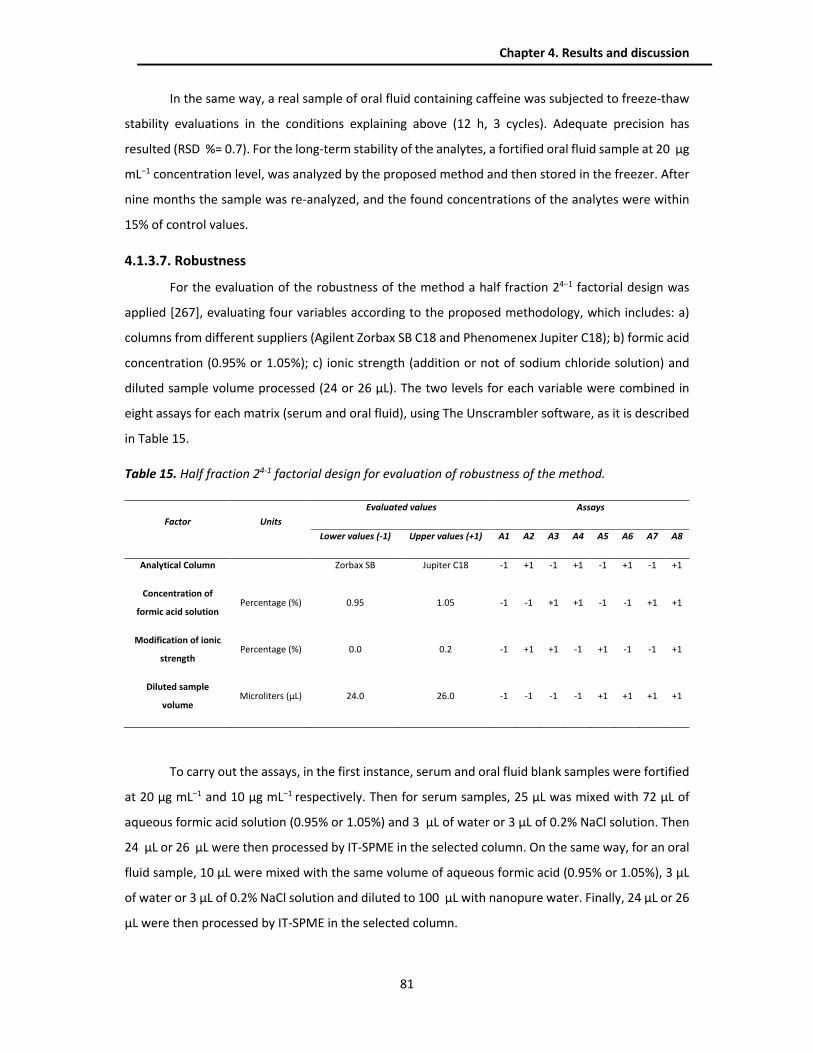
Chapter 4. Results and discussion
81
In the same way, a real sample of oral fluid containing caffeine was subjected to freeze‐thaw
stability evaluations in the conditions explaining above (12 h, 3 cycles). Adequate precision has
resulted (RSD %= 0.7). For the long‐term stability of the analytes, a fortified oral fluid sample at 20 µg
mL−1 concentration level, was analyzed by the proposed method and then stored in the freezer. After
nine months the sample was re‐analyzed, and the found concentrations of the analytes were within
15% of control values.
4.1.3.7. Robustness
For the evaluation of the robustness of the method a half fraction 24−1 factorial design was
applied [267], evaluating four variables according to the proposed methodology, which includes: a)
columns from different suppliers (Agilent Zorbax SB C18 and Phenomenex Jupiter C18); b) formic acid
concentration (0.95% or 1.05%); c) ionic strength (addition or not of sodium chloride solution) and
diluted sample volume processed (24 or 26 µL). The two levels for each variable were combined in
eight assays for each matrix (serum and oral fluid), using The Unscrambler software, as it is described
in Table 15.
Table 15. Half fraction 24-1 factorial design for evaluation of robustness of the method.
Factor Units
Evaluated values Assays
Lower values (-1) Upper values (+1) A1 A2 A3 A4 A5 A6 A7 A8
Analytical Column Zorbax SB Jupiter C18 ‐1 +1 ‐1 +1 ‐1 +1 ‐1 +1
Concentration of
formic acid solution Percentage (%) 0.95 1.05 ‐1 ‐1 +1 +1 ‐1 ‐1 +1 +1
Modification of ionic
strength Percentage (%) 0.0 0.2 ‐1 +1 +1 ‐1 +1 ‐1 ‐1 +1
Diluted sample
volume Microliters (µL) 24.0 26.0 ‐1 ‐1 ‐1 ‐1 +1 +1 +1 +1
To carry out the assays, in the first instance, serum and oral fluid blank samples were fortified
at 20 µg mL−1 and 10 µg mL−1 respectively. Then for serum samples, 25 µL was mixed with 72 µL of
aqueous formic acid solution (0.95% or 1.05%) and 3 µL of water or 3 µL of 0.2% NaCl solution. Then
24 µL or 26 µL were then processed by IT‐SPME in the selected column. On the same way, for an oral
fluid sample, 10 µL were mixed with the same volume of aqueous formic acid (0.95% or 1.05%), 3 µL
of water or 3 µL of 0.2% NaCl solution and diluted to 100 µL with nanopure water. Finally, 24 µL or 26
µL were then processed by IT‐SPME in the selected column.

Chapter 4. Results and discussion
82
According to Hund et al., the condition that interactions should be negligible is, in general,
assumed to be fulfilled in robustness tests [268], therefore, the peak areas (signal responses) for all
assays in each tested matrix, were statistically analyzed, and the studied variables were found not
significant (for a 95% probability level) for all four compounds. Finally, through Pareto graphs, the
visualization of the standardized effects of each variable studied is presented in Figures 24 and 25 for
serum and oral fluid matrix respectively. For all compounds, the standardized effect was less than the
established critical value (3.2).
Figure 24. Standardized effects determined using a half-fraction 24-1 factorial design in serum matrix:
a) Theobromine; b) Paraxanthine; c) Theophylline; and d) caffeine.

Chapter 4. Results and discussion
83
Figure 25. Standardized effects determined using a half-fraction 24-1 factorial design in oral fluid
matrix: a) Theobromine; b) Paraxanthine; c) Theophylline; and d) caffeine.
4.1.4. Analysis of real samples
Serum and oral fluid paired samples from preterm newborns were obtained in the framework
of the non‐invasive pharmacokinetic study of caffeine administered in preterm infants diagnosed with
apnea at the pediatric intensive care unit of La Fe University and Polytechnic Hospital ‐ Valencia, Spain,
to determinate the concentrations of caffeine, theobromine, paraxanthine, and theophylline, because
they are related as it has been reported in some papers of the literature [269‐271].
4.1.4.1. Concentration of caffeine in serum and saliva samples
The developed method was applied for the determination of 35 paired samples by duplicate.
Representative chromatograms of serum and oral fluid samples, as well as a standard solution, are
shown in Figure 26. In all samples, the presence of caffeine was determined and none of the
metabolites were found. The absence of metabolites in the samples can be explained, on the one
hand, due to the high doses of caffeine that are administered, as Nobile et al. reported [272], and on
the other hand, some papers have reported that the caffeine plasma half‐life can vary between 65
and 100 h, and the unmodified caffeine fraction eliminated in the urine is 86% in the first six days
[269]. In some serum samples, a peak with a retention time near to theobromine was observed.
However, by comparing the absorption spectrum, it was ruled out that it was one of the analytes
studied.

Chapter 4. Results and discussion
84
Figure 26. Representative chromatograms from preterm newborns samples: Blue: Standard solution
20 µg mL−1; Red: Oral fluid sample; Green: Serum sample.
Table 16 shows the caffeine average concentration found in the analyzed samples, with
concentration range values between 7.0 and 54.0 µg mL−1 in serum samples and between 5.5 and
56.2 µg mL−1 in oral fluid samples.
Table 16. Caffeine average concentration found in the analyzed paired samples.
Sample
identification
Caffeine concentration
(µg mL−1) Sample
identification
Caffeine concentration
(µg mL−1)
Serum Oral fluid Serum Oral fluid
P1/PK-C/M1 26.99 27.93 P20/PK-C/M1 29.84 20.81
P3/PK-C/M1 15.88 10.16 P20/PK-C/M2 12.90 8.47
P3/PK-C/M2 6.96 7.57 P21/PK-C/M1 23.97 12.23
P5/PK-C/M1 14.23 14.25 P21/PK-C/M2 31.63 26.17
P7/PK-C/M1 9.36 15.90 P22/PK-C/M1 14.05 11.20
P7/PK-C/M2 19.86 14.93 P23/PK-C/M1 24.23 18.32
P8/PK-C/M1 17.34 16.02 P23/PK-C/M2 17.68 15.41
P8/PK-C/M2 13.96 14.68 P25/PK-C/M1 23.07 15.17
P9/PK-C/M1 14.74 10.92 P25/PK-C/M2 15.83 13.52
P9/PK-C/M2 11.10 15.11 P26/PK-C/M1 22.81 17.08
P11/PK-C/M1 13.04 5.54 P26/PK-C/M2 26.06 16.59
P12/PK-C/M1 17.51 15.94 P27/PK-C/M1 35.00 20.81
P13/PK-C/M2 40.67 56.18 P27/PK-C/M2 24.63 20.32
P16/PK-C/M1 54.01 50.22 P31/PK-C/M2 27.17 17.35
P18/PK-C/M1 31.67 46.65 P31/PK-C/M3 20.82 13.98
P15/PK-C/M1 15.95 10.32 P32/PK-C/M1 17.67 14.57
P19/PK-C/M1 24.51 12.49 P32/PK-C/M2 19.08 10.16
P19/PK-C/M2 21.36 13.56
0
150
300
450
7 11 15
Time (min)
Absorb
ance (m
AU)
Theobro
mine
Theophyllin
e
Caffeine
Paraxa
nthine
Unkn
own
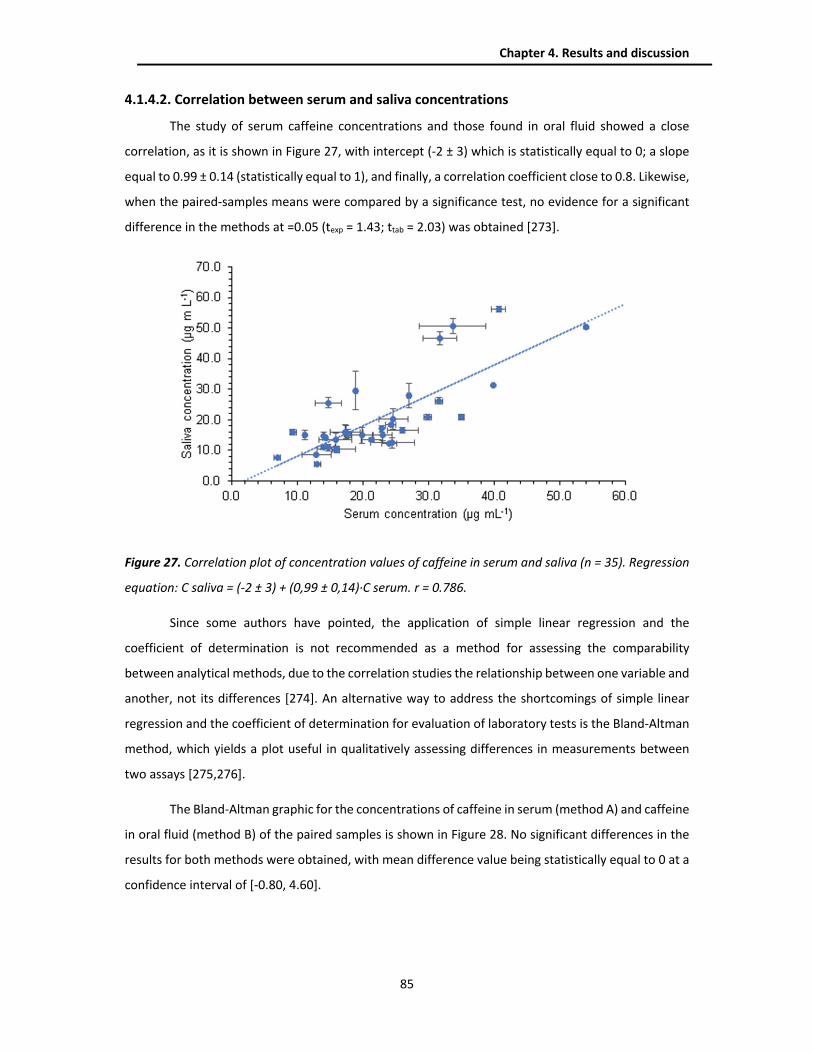
Chapter 4. Results and discussion
85
4.1.4.2. Correlation between serum and saliva concentrations
The study of serum caffeine concentrations and those found in oral fluid showed a close
correlation, as it is shown in Figure 27, with intercept (‐2 ± 3) which is statistically equal to 0; a slope
equal to 0.99 ± 0.14 (statistically equal to 1), and finally, a correlation coefficient close to 0.8. Likewise,
when the paired‐samples means were compared by a significance test, no evidence for a significant
difference in the methods at =0.05 (texp = 1.43; ttab = 2.03) was obtained [273].
Figure 27. Correlation plot of concentration values of caffeine in serum and saliva (n = 35). Regression
equation: C saliva = (-2 ± 3) + (0,99 ± 0,14)·C serum. r = 0.786.
Since some authors have pointed, the application of simple linear regression and the
coefficient of determination is not recommended as a method for assessing the comparability
between analytical methods, due to the correlation studies the relationship between one variable and
another, not its differences [274]. An alternative way to address the shortcomings of simple linear
regression and the coefficient of determination for evaluation of laboratory tests is the Bland‐Altman
method, which yields a plot useful in qualitatively assessing differences in measurements between
two assays [275,276].
The Bland‐Altman graphic for the concentrations of caffeine in serum (method A) and caffeine
in oral fluid (method B) of the paired samples is shown in Figure 28. No significant differences in the
results for both methods were obtained, with mean difference value being statistically equal to 0 at a
confidence interval of [‐0.80, 4.60].
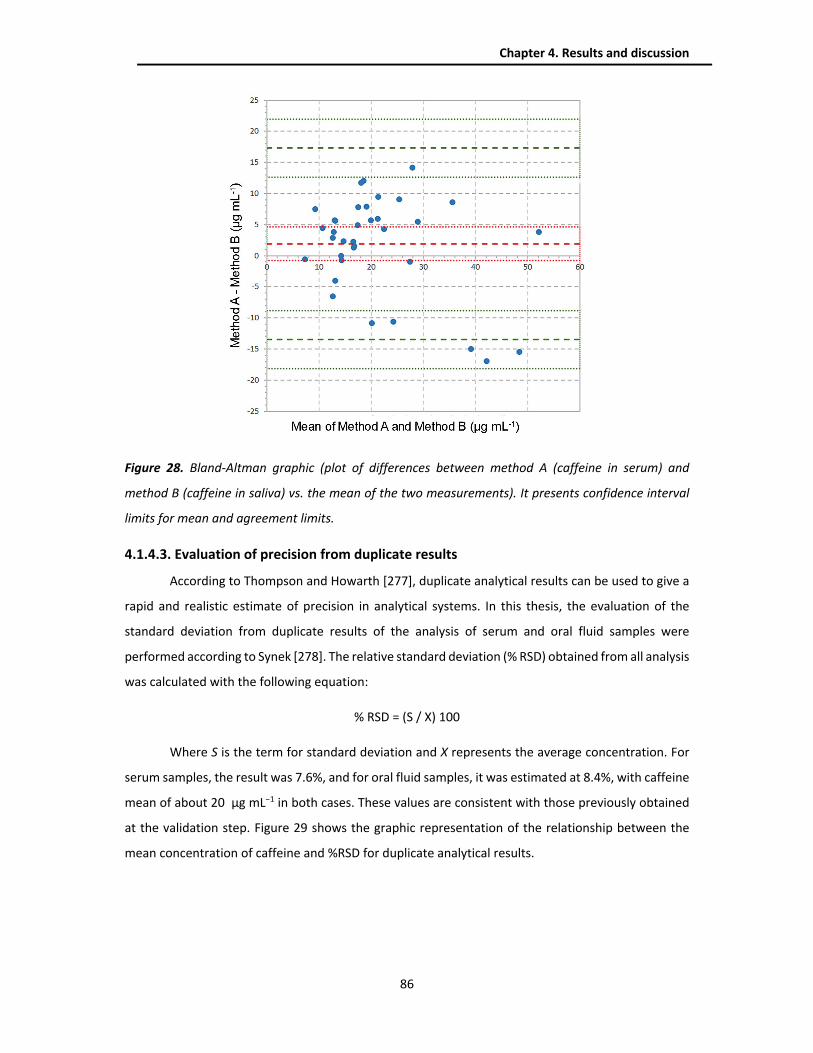
Chapter 4. Results and discussion
86
Figure 28. Bland-Altman graphic (plot of differences between method A (caffeine in serum) and
method B (caffeine in saliva) vs. the mean of the two measurements). It presents confidence interval
limits for mean and agreement limits.
4.1.4.3. Evaluation of precision from duplicate results
According to Thompson and Howarth [277], duplicate analytical results can be used to give a
rapid and realistic estimate of precision in analytical systems. In this thesis, the evaluation of the
standard deviation from duplicate results of the analysis of serum and oral fluid samples were
performed according to Synek [278]. The relative standard deviation (% RSD) obtained from all analysis
was calculated with the following equation:
% RSD = (S / X) 100
Where S is the term for standard deviation and X represents the average concentration. For
serum samples, the result was 7.6%, and for oral fluid samples, it was estimated at 8.4%, with caffeine
mean of about 20 µg mL−1 in both cases. These values are consistent with those previously obtained
at the validation step. Figure 29 shows the graphic representation of the relationship between the
mean concentration of caffeine and %RSD for duplicate analytical results.

Chapter 4. Results and discussion
87
Figure 29. Plot of the relationship between the mean concentration of caffeine and % RSD for duplicate
analytical results.
4.1.5. Conclusions
In the present work, the application of IT‐SPME, using a conventional capillary column with
terephthalic modified PEG as the sorbent phase, in line with Capillary LC‐DAD, demonstrated a
remarkable performance for the simultaneous quantitation of caffeine and its three primary
metabolites, theobromine, paraxanthine, and theophylline in serum, oral fluid, and urine samples. The
developed method offers a complete analysis in 20 min, with a low sample volume consumption, less
than 10 µL of serum, oral fluid, and urine samples for a single run. Likewise, no more preparation than
a dilution of the samples and injection in the IT‐SPME loop is necessary.
In terms of analytical parameters, high sensitivity was obtained, with limits of detection of 0.5
µg mL−1 in urine and oral fluid, and 0.1 µg mL−1 for serum, recovery values of RR% between 84–114%,
and adequate repeatability with a coefficient of variation lower than 15%. The characteristics of the
developed method make it useful for its implementation in a pediatric hospital laboratory in the case
of special patients, as it is the case of preterm newborns, where the sample availability and the
urgency of the results, are important analytical requirements.
The applicability of the newly developed method was demonstrated for the determination of
caffeine concentrations in paired samples of serum (invasive method) and oral fluid (non‐invasive
method) from preterm newborns who were given doses of caffeine for the treatment of apnea of
prematurity, providing similar results between them.
0
5
10
15
20
25
0 10 20 30 40 50 60
RS
D %
(x1 + x2) / 2

Chapter 4. Results and discussion
88
4.2 TRIMETHYLXANTHINES IN WATERS
As described earlier, the high consumption of coffee, tea, cola, energy drinks, processed cocoa
products, as well as medications, with trimethylxanthines as components, make possible the presence
of these substances in environmental matrices, such as water, so they are considered as emerging
pollutants, indicators of anthropogenic activity and lifestyle.
The application of miniaturized and portable liquid chromatography systems has a particular
interest in water analysis to obtain instant results in the site of sampling. In the development of this
thesis, two procedures for the analysis of caffeine, theobromine and theophylline in water samples
have been optimized, using two approaches. On one hand, IT‐SPME‐CapLC‐DAD, and on the other
hand, SPE with portable NanoLC. Both procedures were applied to the analysis of sea and river water
samples. The results and the comparison of the two approaches, in terms of advantages and
limitations, are presented in detail below.
4.2.1. Optimization of the chromatographic separation
4.2.1.1. Portable NanoLC
At the beginning of the optimization of chromatographic separation with the portable nano‐
LC system, initial mobile phase initial conditions were taken from manufacturer recommendations, a
mixture of water and acetonitrile, adding a 3% of each solvent in the reservoir of the other, which for
the water reservoir, can be explained as prevention for bacterial growth, and its corresponding
compensation in the proportions for acetonitrile reservoir.
A mixed standard solution of the analytes at 50 µg mL‐1 was prepared in acetonitrile as a
solvent and analyzed in the chromatograph. It was observed that the peak profiles obtained for the
analytes, especially for caffeine, in these conditions show a bad efficiency (split and double peaks).
From these results, the effect of the solvent in which the analyte solution is prepared was studied. For
this, caffeine solutions with a concentration of 50 µg mL‐1 were prepared in acetonitrile, water,
methanol and acetonitrile‐water mixtures with different proportions. The solutions were injected into
the chromatograph and the analyte chromatographic peak was observed, as shown in Figure 30.
All solutions prepared with acetonitrile showed a split and double peak, on the other hand,
those prepared in methanol and water showed improved results in terms of efficiency and signal
detection, however, the last was ruled out due to incompatibility with sample treatment techniques
applied. Consequently, methanol was the solvent used in further experiments.

Chapter 4. Results and discussion
89
Subsequently, the gradient elution program was optimized, for this, a mix standard solution
of the analytes at 10 µg mL‐1, prepared in methanol, was injected into the chromatograph. The high
polarity of the compounds requires a mobile phase composition with low elution strength at the
beginning of the program. Different percentages of acetonitrile and gradient ranges were assayed to
obtain the conditions that favor the detection of individual peaks of the compounds, in the shortest
possible run time.
Figure 30. Chromatograms obtained in the study of the effect of the solvent on the separation
efficiency. Solution of caffeine standard at 50 µg mL-1 prepared in different solvents. Green: in
acetonitrile; Black: in a mixture of acetonitrile and water (8:2); Blue: in a mixture of acetonitrile and
water (5:5); Orange: in a mixture of acetonitrile and water (2:8); Purple: in water; Red: in methanol.
The final gradient conditions started with a low percentage of acetonitrile (5%) increased to
20% at min 4, and to 95% at 4.5 min. This composition was kept constant for 0.2 min, and finally, initial
conditions were set in 0.3 min and hold until the end of the run (5.2 min). With these conditions,
satisfactory separation of the analytes in less than 4.5 minutes was obtained (Figure 31.Blue).
4.2.1.2. Capillary LC
For the separation of the three analytes in the CapLC system, the initial conditions were taken
from the results obtained for the analysis of trimethylxanthines in biological samples discussed in
section 4.1 of this thesis and the optimized conditions for the portable NanoLC system, explained
Time (min)
Ab
so
rbance (m
AU
)
0
10
20
30
40
50
4 4.5 5

Chapter 4. Results and discussion
90
above. A C18‐column (150 x 0.5 mm, 4 µm) and a mixture of water and acetonitrile in gradient elution
mode was used for the separation of studied compounds. The percentage of acetonitrile was
increased from 20 % at 0 min, to 50 % at 5 min, to 75% at 9 min, and to 100 % at 13 min; the mobile‐
phase flow rate was 15 µL min‐1 and the signal was monitored at 275 nm.
For manual injection, a 20 cm length and 0.32 mm i.d. segment of a fused‐silica capillary was
used as an injection loop, so that the sample volume injected was 16 µL (internal volume of the
capillary) of a standard solution prepared in nanopure water. In these conditions, the resolution was
also suitable, and the three analytes were separated in less than 8.5 min, as depicted in Figure 31
(Red). The chromatograms of Figure 31 show that the resolution between the analytes was much
better with the portable NanoLC as the peaks were much narrower.
Figure 31. Chromatograms obtained under the selected conditions with: (Blue) the portable nano LC;
(Red) CapLC systems. Concentration of each analyte: 10 µg mL-1 for Blue signal, and 10 ng mL-1 for
Red signal.
4.2.1.3. Comparison of analytical parameters achieved by Capillary LC and portable NanoLC
The comparison of the relevant features of the two tested chromatographic systems is
summarized in Table 17. From the experimental results is possible to affirm that the IT‐SPME‐Cap LC
could be applied to detect and measure lower concentrations of the analytes because instrumental
limits of detection (LODs) for this system were 20 times lower, which can be explained by the fact that
0
20
40
60
80
100
120
140
6 7 82
6
10
14
2.6 3.4 4.2
Time (min)
Ab
so
rba
nc
e (m
AU
)
Th
eo
bro
min
e
Th
eo
ph
yllin
e
Ca
ffe
ine
Th
eo
bro
min
e
Th
eo
ph
yllin
e
Ca
ffe
ine
Time (min)
Ab
so
rba
nc
e (m
AU
)

Chapter 4. Results and discussion
91
the sample volume injected into the CapLC system was just under 20 µL, whereas in NanoLC
chromatograph only 40 nL of the working solutions were sent to the analytical column.
Moreover, is important to note that with the NanoLC system, the chromatograms were
registered at 255 nm, whereas in the CapLC the signals were registered at 275 nm, which is the
maximum wavelength of the UV spectra for caffeine; likewise, the maxima of the UV spectra of
theophylline and theobromine was close to 275, as Figure 23 showns, and thus, the absorbances of
the three analytes at 275 nm were higher than those measured at 255 nm. Additionally, with Cap LC
is possible to register the spectrum of each analyte at any position of the corresponding
chromatographic peak, which improved selectivity about the measurement at 255 nm with portable
NanoLC system.
The instrumental linearity of each system was evaluated by processing standard solutions,
prepared in nanopure water, in the concentration ranges of 1‐50 µg mL‐1 and 50‐400 ng mL‐1 for the
portable NanoLC and CapLC systems, respectively. The determination coefficients for all compounds
in the two systems were higher than 0.99. By processing consecutively three replicates of the working
solutions, at 10 µg mL‐1 and 5 ng mL‐1 for the portable NanoLC and CapLC systems, respectively, the
instrumental precision, expressed as relative standard deviation (% RSD), was calculated for both
systems, and the values were slightly lower with the portable chromatograph.
On the other hand, the comparison of the analysis times showed that the chromatographic
separation was faster with the portable NanoLC system. This fact, accompanied by the lower mobile
phase flow rates, resulted in much lower mobile phase consumption with the portable system, being
of interest from a point of view of green analytical chemistry. Using a rough estimation of the mobile
phase consumption by injection carried out for both systems, it was possible to establish that the
portable system only needs 20 µL of the mobile phase per analyzed injection, conversely, the CapLC
chromatograph, require 10 mL for each injection. That means that the portable system reduces the
production of waste about 500 times less than the benchtop chromatograph.

Chapter 4. Results and discussion
92
Tab
le 1
7. C
om
pa
riso
n o
f th
e fe
atu
res
of
the
two
ch
rom
ato
gra
ph
ic s
yste
ms
use
d in
th
is s
tud
y.
Feat
ure
P
ort
able
Nan
oLC
C
apLC
Cal
ibra
tio
n e
qu
atio
n a
(n =
10
)
RSD
b, (
n =
3)
(%)
LOD
(ng
mL-1
)
Cal
ibra
tio
n e
qu
atio
n a ,
(n =
10
)
RSD
b, (
n =
3)
(%)
LOD
(ng
mL-1
)
An
alyt
ical
per
form
ance
Theo
bro
min
e
0.3
6 x
+0
.11
(R
2 =
0.9
98
) 1
3
00
1
.7 x
+ 1
0.4
(R
2 =
0.9
99
0)
7
15
Theo
ph
yllin
e
0.7
2 x
+ 0
.07
(R
2 =
0.9
99
0)
1
30
0
2.8
x ‐
35
.9
(R2 =
0.9
99
0)
6
15
Caf
fein
e 0
.55
x +
0.0
2
(R2 =
0.9
99
0)
2
30
0
1.6
x ‐
21
.2
(R2 =
0.9
97
) 6
1
5
Vo
lum
e o
f sa
mp
le
40
nL
20
µL
Tim
e o
f th
e ch
rom
ato
grap
hic
ru
n
5 m
in
16
min
Solv
ent
con
sum
pti
on
per
sam
ple
20
µL
10
mL
(a)
In t
he
1‐5
0 µ
g m
L‐1 a
nd
50
‐ 4
00
ng
mL‐1
co
nce
ntr
atio
n r
ange
s fo
r th
e p
ort
able
Nan
oLC
an
d C
apLC
sys
tem
s, r
esp
ecti
vely
; Eq
uat
ion
s ex
pre
ssed
as
y =
ax +
b
(b)
Mea
sure
d a
t a
con
cen
trat
ion
of
10
µg
mL‐1
an
d 5
ng
mL‐1
fo
r th
e p
ort
able
Nan
oLC
an
d C
apLC
sys
tem
s, r
esp
ect
ive
ly.

Chapter 4. Results and discussion
93
4.2.2. Sample treatment techniques
Once the chromatographic parameters were characterized, sample treatment was optimized
for the two chromatographic systems. Here, two possible strategies for sample conditioning suitable
for on‐site analysis with the portable NanoLC system were explored, namely off‐line IT‐SPME and
solid‐phase extraction (SPE) with cartridge format. On the other hand, for the CapLC system, IT‐SPME
on‐line was optimized.
4.2.2.1. On-line IT-SPME
As it is mentioned in the introductory part of this work, the selection of the extractive phase
for IT‐SPME is essential to obtain suitable extraction efficiency, and it is a key parameter especially for
highly polar compounds like trimethylxanthines studied. According to the explanation of section
4.1.2.1, various extractive capillaries coated with different sorbents were tested, namely
polydimethylsiloxane (PDMS) with diphenyl and with cyanopropylphenyl groups, polyethylene glycol
(PEG), terephthalic acid modified PEG, all of them conventional capillaries, and polymers obtained
from tetraethyl orthosilicate (TEOS) and triethoxymethylsilane (MTEOS) functionalized with SiO2 and
TiO2 nanoparticles. It was demonstrated that the best results, in terms of extraction efficiency, were
obtained with the terephthalic acid modified PEG phase.
As an attempt to enhance the analyte detectability by improving the limits of detection of the
analytes, a polystyrene‐divinylbenzene (PS‐DVB) phase was tested. According to Serra‐Mora et al. this
sorbent provided excellent results for the IT‐SPME of compounds with aromatic rings [279], and
considering that because of their structure, the analyzed compounds exhibit aromatic‐like properties
[280]. Additionally, Villamena et al. demonstrated the nonspecific yet selective adsorption of caffeine
by some polymers as the divinylbenzene (DVB) [281].
Two different PS‐DVB capillaries columns were tested, HP‐PLOT/Q and VP‐HayeSep P, with 20
µm and 10 µm thickness, respectively. In the first experiments, the effect of preconcentration on the
HP‐PLOT/Q capillary was tested. For this, a standard solution mixture of the analytes at 50 ng mL‐1 was
prepared in nanopure water and variable volumes of this solution were processed through the
capillary of 25 cm length. The signal intensity of the three analytes versus processed volume is
represented in Figure 32, and the results showed an increment of the signal when the volume of the
solution is increased. This behavior of preconcentration was especially marked for caffeine when 4 mL
of the solution was passed. Therefore, this volume was selected as the optimum.
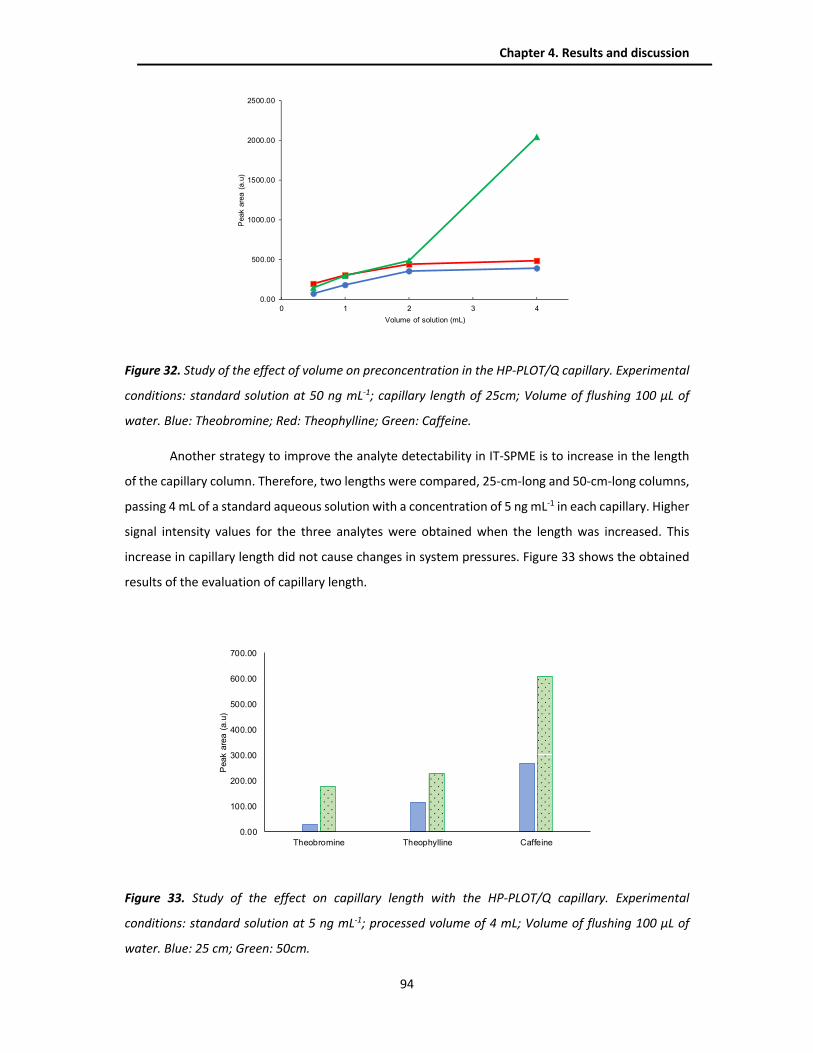
Chapter 4. Results and discussion
94
Figure 32. Study of the effect of volume on preconcentration in the HP-PLOT/Q capillary. Experimental
conditions: standard solution at 50 ng mL-1; capillary length of 25cm; Volume of flushing 100 µL of
water. Blue: Theobromine; Red: Theophylline; Green: Caffeine.
Another strategy to improve the analyte detectability in IT‐SPME is to increase in the length
of the capillary column. Therefore, two lengths were compared, 25‐cm‐long and 50‐cm‐long columns,
passing 4 mL of a standard aqueous solution with a concentration of 5 ng mL‐1 in each capillary. Higher
signal intensity values for the three analytes were obtained when the length was increased. This
increase in capillary length did not cause changes in system pressures. Figure 33 shows the obtained
results of the evaluation of capillary length.
Figure 33. Study of the effect on capillary length with the HP-PLOT/Q capillary. Experimental
conditions: standard solution at 5 ng mL-1; processed volume of 4 mL; Volume of flushing 100 µL of
water. Blue: 25 cm; Green: 50cm.
0.00
500.00
1000.00
1500.00
2000.00
2500.00
0 1 2 3 4
Peak a
rea (
a.u
)
Volume of solution (mL)
0.00
100.00
200.00
300.00
400.00
500.00
600.00
700.00
Theobromine Theophylline Caffeine
Peak a
rea (
a.u
)

Chapter 4. Results and discussion
95
Finally, when the parameters of IT‐SPME were optimized for HP‐PLOT/Q capillary, the
extraction efficiency was compared with the performance of VP‐HayeSep P capillary, in equal
conditions. For this, a standard solution mix of the analytes in nanopure water at 10 ng mL‐1 was
prepared and 4 mL of the solution were passed through both capillaries, with a length of 50 cm, while
the manual injection valve was in the loading position. After a flushing step with 100 µL of water, the
injection valve was changed to the injection position. The peak area intensity obtained for all
compounds in the two polymeric capillaries was compared with those achieved with the terephthalic
acid‐modified PEG‐coated capillary (FFAP). For the latter capillary, the IT‐SPME conditions included a
standard solution concentration of 1 µg mL‐1, 100 µL of the solution were processed, and 25 µL of
water for flushing.
Figure 34 compares the responses obtained with the three capillaries tested. As noted, the
PS‐DVB phase provided higher peak areas than those obtained with the PEG‐based phase, even
processing half the mass of the analytes. The comparison of the two polymeric capillaries shows that
no significant differences between PS‐DVB with coatings of 10 µm and 20 µm were observed.
However, due to the greater sorbent phase thickness, the 20 µm capillary column retained more
impurities from the matrix, therefore the background chromatograms were lower with the 10 µm
thickness capillaries, which were then selected for further work.
Figure 34. Analyte responses obtained SPME with the different capillaries tested coupled on-line to the
CapLC system. Concentration of each analyte: 1 µgmL-1 in the modified PEG (FFAP) and 10 ng mL-1 for
the polymeric phases (HP-PLOT/Q and VP-HayeSep P); Processed volume 0.1 mL for FFAP and 4 mL for
polymeric phases. Blue: Theobromine; Red: Theophylline; Green: Caffeine. Error bars represent
standard deviation for n = 3.
Sig
na
l in
tensity
(m A
U)
FFAP HP-PLOT/Q VP-HayeSep P
0
200
400
600
800
1000

Chapter 4. Results and discussion
96
4.2.2.2. Off-line IT-SPME
There are two important aspects to consider in the election of the sample treatment
technique previous the analysis in the portable NanoLC system. On one hand, the design of the
chromatography instrument constrains the sample treatment to off‐line procedures and, bearing in
mind that this equipment is intended to field tests, sample treatments should involve a minimum of
sample handling and, ideally, no additional instrumentation.
As is refers in the introduction part of this thesis, IT‐SPME off‐line does not required additional
instrumentation, as only a manual injection valve and syringes to load the samples and desorb the
trapped analytes are necessary. Additionally, as previously the IT‐SPME online procedure was
previously optimized for the CapLC system, off‐line IT‐ SPME was selected as the first choice as a
sample treatment technique for the portable NanoLC analysis.
Consequently, this approach was tested by using the capillary column selected in the previous
section, the PS‐DBV 10 µm thickness coated capillary. Initially, aliquots of the standard mix solution,
containing 500 µg mL‐1 of each analyte, prepared in nanopure water, were processed through the
capillary of 50 cm length (internal volume of 40 µL), followed by 40 µL of water, as a cleanup step.
Then, the capillary was flushed with a volume of methanol to desorb the retained analytes, and the
collected extracts were then filtered (0.22 μm nylon membranes) and, finally, injected into the
portable NanoLC system. The selection of methanol as a desorption solvent was due to the positive
results observed in the optimization of the chromatographic separation. The minimum volume of
methanol that led to reproducible volumes of the extracts was 100 µL; for this volume, the volume of
the collected extracts was about 50 µL.

Chapter 4. Results and discussion
97
Figure 35. Results obtained by off-line SPME/portable NanoLC: (A) effect of the sample volume on
analyte responses; (B) chromatogram obtained for a sample volume of 12 mL. Concentration of each
analyte, 500 µg mL-1. Capillary: VP-HayeSep P (50 cm). Volume of flushing: 40 µL of water. Desorption
volume: 100 µL methanol.
In those conditions, and to increase analytes detectability as much as possible, aliquots of the
standard solution of 4, 8, and 12 mL were processed though the IT‐SPME device. Increasing the volume
from 4 mL to 8 mL resulted in an increment in peak areas of the analytes, but a further increment to
12 mL had a modest effect (Figure 35.A). Even for the higher amount of processed volume of the
working solutions (12 mL), the peak of theobromine could not be detected, as observed in Figure 35B.
This could be most probably explained by the breakthrough of the analyte, as this was the most polar
of the three tested compounds (log Kow value equal to ‐0.8).
In the last attempt to improve the detection of the analytes, the capillary length was increased
from 50 to 100 cm was tested. However, this modifies the internal volume of the capillary, which in
turn increases the volume necessary to desorb the analytes. As expected, no improvement was seen
with the longest capillary, since in IT‐SPME the nature of the sorbent and the interactions of the
analytes with it is more important for the extraction efficiency than the quantity of sorbent phase
contained in the capillary [257].
Despite all the efforts made to reduce the detection limits, at this point the reached results
for the off‐line IT‐SPME procedure show that this sample treatment technique could detect levels
higher than 0.1 µg mL‐1 for caffeine, but it is expected that the trimethylxanthines could be at lower
0.00
4.00
8.00
12.00
2 7 12
Peak a
rea (
a.u
.)
Volume (mL)
A
2
4
6
8
10
2.8 3.6 4.4
Time (min)
Ab
sorb
an
ce (
mA
U)
Th
eo
ph
yllin
e
Ca
ffe
ine
B
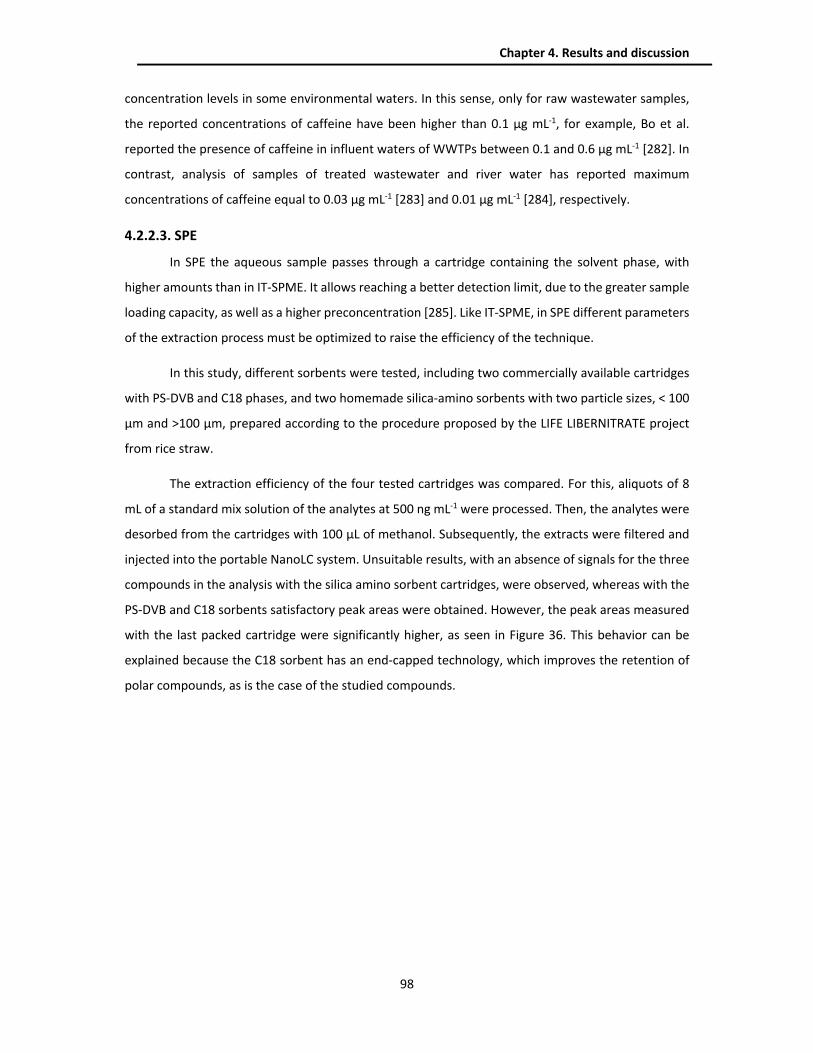
Chapter 4. Results and discussion
98
concentration levels in some environmental waters. In this sense, only for raw wastewater samples,
the reported concentrations of caffeine have been higher than 0.1 µg mL‐1, for example, Bo et al.
reported the presence of caffeine in influent waters of WWTPs between 0.1 and 0.6 µg mL‐1 [282]. In
contrast, analysis of samples of treated wastewater and river water has reported maximum
concentrations of caffeine equal to 0.03 µg mL‐1 [283] and 0.01 µg mL‐1 [284], respectively.
4.2.2.3. SPE
In SPE the aqueous sample passes through a cartridge containing the solvent phase, with
higher amounts than in IT‐SPME. It allows reaching a better detection limit, due to the greater sample
loading capacity, as well as a higher preconcentration [285]. Like IT‐SPME, in SPE different parameters
of the extraction process must be optimized to raise the efficiency of the technique.
In this study, different sorbents were tested, including two commercially available cartridges
with PS‐DVB and C18 phases, and two homemade silica‐amino sorbents with two particle sizes, < 100
µm and >100 µm, prepared according to the procedure proposed by the LIFE LIBERNITRATE project
from rice straw.
The extraction efficiency of the four tested cartridges was compared. For this, aliquots of 8
mL of a standard mix solution of the analytes at 500 ng mL‐1 were processed. Then, the analytes were
desorbed from the cartridges with 100 µL of methanol. Subsequently, the extracts were filtered and
injected into the portable NanoLC system. Unsuitable results, with an absence of signals for the three
compounds in the analysis with the silica amino sorbent cartridges, were observed, whereas with the
PS‐DVB and C18 sorbents satisfactory peak areas were obtained. However, the peak areas measured
with the last packed cartridge were significantly higher, as seen in Figure 36. This behavior can be
explained because the C18 sorbent has an end‐capped technology, which improves the retention of
polar compounds, as is the case of the studied compounds.

Chapter 4. Results and discussion
99
Figure 36. Analyte responses obtained with two of the four cartridges tested and the portable nanoLC
system. Concentration of each analyte: 500 ng mL-1; Processed volume: 8 mL. Blue: Theobromine; Red:
Theophylline; Green: Caffeine. Error bars represent standard deviation for n = 3.
Next, the load volume was optimized and different volumes, between 4 and 35 mL, of the
same solution of the analytes (500 ng mL‐1) were processed through the C18 packed cartridges. The
chromatograms of Figure 37 shows that increasing the sample volume up to 25 mL had a linear positive
behavior on the peak areas concerning the load volume for all compounds. However, no improvement
was observed when using higher volumes were used (35 mL).
Figure 37. Chromatograms of the analysis for different load volumes: Green: 8 mL; Blue: 16 mL; Red:
25 mL. Concentration of each analyte: 500 ng mL-1; cartridge: C18-U.
Peak
are
a(a
.u.)
C18-U SDB-L
0
4
8
12
16
0
10
20
30
40
3 3.5 4 4.5
Absorb
ance (m
AU
)
Time (min)
The
ophy
lline
The
obro
min
e
Caffein
e

Chapter 4. Results and discussion
100
The volume of elution is an important parameter in SPE, since a high volume of the desorption
solvent will dilute the concentration of the analytes, affecting the detectability in the instrumental
analysis, and on the other hand, with lower volumes, the analytes could be only partially eluted,
decreasing the extraction efficiency [286]. To optimize this volume, 25 mL of the standard mix solution
of 500 ng mL‐1, were processed and, then, three aliquots of 100 µL of methanol were successively
flushed through the cartridges and the extracts were then collected and processed individually.
It was observed that most of the theobromine eluted in the firsts 100 µL, whereas theophylline
and caffeine were predominant in the second part of the extract. Moreover, the signal of the analytes
found in the third part of the extract was negligible. Based on these results, another extraction, with
the same conditions, but using one only fraction of 200 µL of methanol to desorb the analytes was
carried out. However, the peak area found for caffeine was significantly lower than that observed
when processing the second eluting extract. The results of these experiments are shown in Figure 38.
In brief, processing separately the first eluting extract for theobromine and the second eluting
extract for theophylline and caffeine was selected as the best option, considering that each
chromatographic assay with the portable nanoLC chromatograph takes less than four and half
minutes. Under such conditions, not only the three analytes could be satisfactorily detected and
quantified, but also the peak areas measured for theophylline and caffeine were much higher than
those measured by the off‐line IT‐SPME approach.
Figure 38. Analyte responses obtained for the study of the volume of elution in SPE. Concentration of
each analyte: 500 ng mL-1; Load volume: 25 mL; cartridge: C18-U. Blue: Theobromine; Red:
Theophylline; Green: Caffeine.
0
6
12
18
24
Pe
ak a
rea
(a
. u)
200 µL 100 µL first fraction 100 µL second fraction

Chapter 4. Results and discussion
101
One strategy to increase analyte detectability commonly used in SPE is the evaporation of the
extract to dryness with subsequent reconstitution. However, in the present study, this option was
discarded, since it moves away from the portable NanoLC approach, intended to be used for on‐site
measurements.
Due to the high polarity of the analytes studied, the use of organic solvents for cleaning the
possible impurities of real samples retained in the sorbent was ruled out, so the effect of using water
at this stage was studied. For it, a seawater sample was fortified with a standard solution of the
analytes to obtain a final concentration of 500 ng mL‐1. Three extraction procedures, in optimized
conditions, were carried out as follows: first a sample without fortification or cleaning process; then a
fortified sample without cleaning process, and finally, a fortified sample and cleaning with 100 µL of
nanopure water (this volume has previously been shown to be sufficient for the amount of sorbent in
the cartridge).
Figure 39 shows the chromatograms for the analysis of the two fortified samples, with and
without the cleaning process. No difference for theophylline signal was obtained by the cleaning
process selected, and a minimal diminution effect was observed for theobromine and caffeine signals.
Moreover, no signals of the analytes were shown in the chromatogram of the seawater sample
without fortification. According to these results, a clean‐up stage with 100 µL of water was included
in the final procedure of SPE.
Consequently, SPE with C18 was the option selected for treating the samples when using the
portable nanoLC system. The conditions finally selected were as follows: C18 cartridges were
conditioned with 1 mL of methanol and 1 mL of water; next, 25 mL of the samples followed by 100 µL
of water were flushed through them. Finally, two portions of 100 µL of methanol were passed
successively through the cartridges, and the extracts were collected separately, filtered, and injected
into the portable NanoLC equipment.
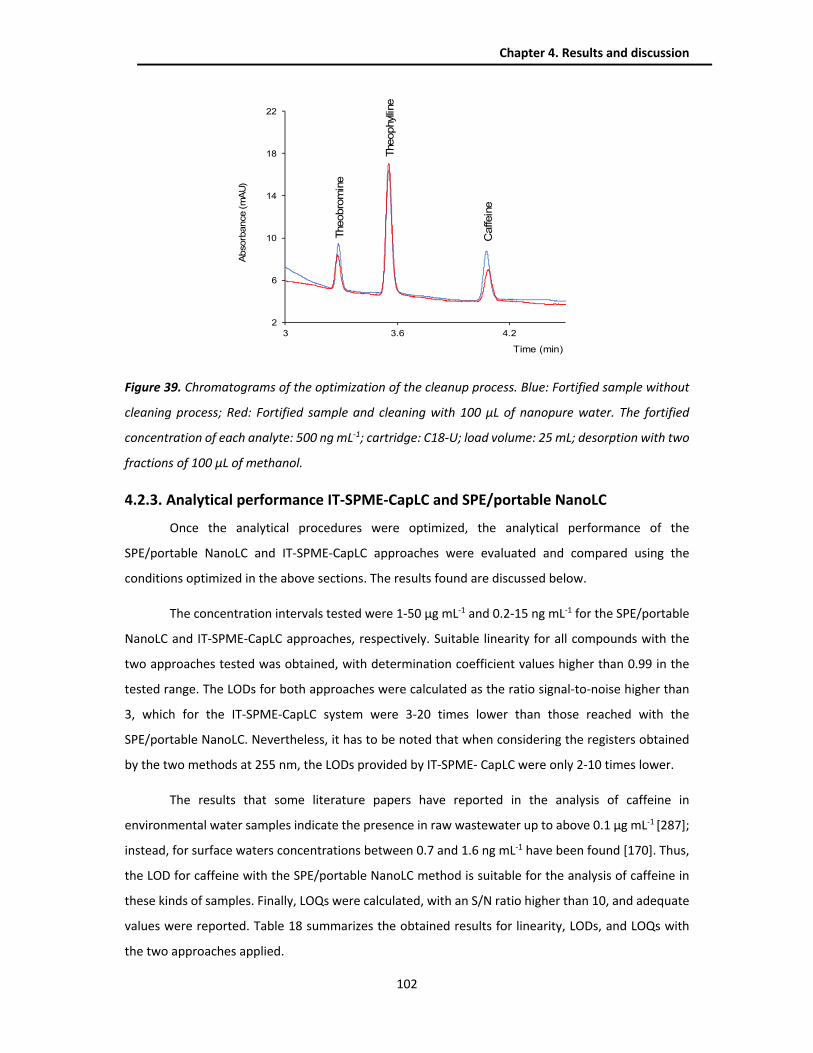
Chapter 4. Results and discussion
102
Figure 39. Chromatograms of the optimization of the cleanup process. Blue: Fortified sample without
cleaning process; Red: Fortified sample and cleaning with 100 µL of nanopure water. The fortified
concentration of each analyte: 500 ng mL-1; cartridge: C18-U; load volume: 25 mL; desorption with two
fractions of 100 µL of methanol.
4.2.3. Analytical performance IT-SPME-CapLC and SPE/portable NanoLC
Once the analytical procedures were optimized, the analytical performance of the
SPE/portable NanoLC and IT‐SPME‐CapLC approaches were evaluated and compared using the
conditions optimized in the above sections. The results found are discussed below.
The concentration intervals tested were 1‐50 µg mL‐1 and 0.2‐15 ng mL‐1 for the SPE/portable
NanoLC and IT‐SPME‐CapLC approaches, respectively. Suitable linearity for all compounds with the
two approaches tested was obtained, with determination coefficient values higher than 0.99 in the
tested range. The LODs for both approaches were calculated as the ratio signal‐to‐noise higher than
3, which for the IT‐SPME‐CapLC system were 3‐20 times lower than those reached with the
SPE/portable NanoLC. Nevertheless, it has to be noted that when considering the registers obtained
by the two methods at 255 nm, the LODs provided by IT‐SPME‐ CapLC were only 2‐10 times lower.
The results that some literature papers have reported in the analysis of caffeine in
environmental water samples indicate the presence in raw wastewater up to above 0.1 µg mL‐1 [287];
instead, for surface waters concentrations between 0.7 and 1.6 ng mL‐1 have been found [170]. Thus,
the LOD for caffeine with the SPE/portable NanoLC method is suitable for the analysis of caffeine in
these kinds of samples. Finally, LOQs were calculated, with an S/N ratio higher than 10, and adequate
values were reported. Table 18 summarizes the obtained results for linearity, LODs, and LOQs with
the two approaches applied.
2
6
10
14
18
22
3 3.6 4.2
Abso
rbance (m
AU
)
Time (min)
The
ophy
lline
The
obro
min
e
Caffe
ine

Chapter 4. Results and discussion
103
Tab
le 1
8. A
na
lyti
cal p
ara
met
ers
ob
tain
ed w
ith
th
e SP
E/p
ort
ab
le N
an
oLC
an
d IT
-SP
ME-
Ca
pLC
ap
pro
ach
es.
An
alyt
e
SPE/
po
rtab
le N
ano
LC
IT-S
PM
E-C
apLC
Cal
ibra
tio
n e
qu
atio
na , (
n =
9)
y =
ax +
b
LOD
(ng
mL-1
)
LOQ
(ng
mL-1
)
Cal
ibra
tio
n e
qu
atio
nb, n
=10
y =
ax +
b
LOD
c
(ng
mL-1
)
LOQ
(ng
mL-1
)
Theo
bro
min
e
0.0
5 x
+ 0
.02
(R2 =
0.9
94
)
10
3
0
20
.0 x
‐ 2
5.2
(R2 =
0.9
99
)
0.5
(1
) 2
Theo
ph
yllin
e
0.1
1 x
+ 0
.22
(R2 =
0.9
96
)
1.5
1
0
25
.9 x
+ 1
.1
(R2 =
0.9
99
)
0.5
(1
) 2
Caf
fein
e 0
.10
x +
0.0
8
(R2 =
0.9
95
)
1.5
1
0
78
.1 x
+7
.3
(R2 =
0.9
95
)
0.1
(0
.5)
0.5
(a)
In t
he
10
‐10
0 n
g m
L‐1 c
on
cen
trat
ion
ran
ges
for
theo
ph
yllin
e an
d c
affe
ine,
an
d 3
0‐1
00
ng
mL‐1
co
nce
ntr
atio
n r
ange
s fo
r th
eob
rom
ine.
(b
)In
th
e 2
‐15
ng
mL‐1
co
nce
ntr
atio
n r
ange
s fo
r th
eop
hyl
line
an
d t
heo
bro
min
e; a
nd
0.5
‐15
ng
mL‐1
co
nce
ntr
atio
n r
ange
s fo
r ca
ffei
ne.
(c
)Th
e va
lues
in b
rack
ets
are
the
LO
Ds
at 2
55
nm

Chapter 4. Results and discussion
104
To evaluate the intraday‐precision (expressed as % RSD), three aliquots of the samples at three
concentrations within the respective tested concentration ranges were processed consecutively. The
RSDs values obtained are listed in Table 19. The values obtained by the two approaches were rather
similar. Given the results of the features of the two chromatographic systems listed in Table 17, it can
be deduced that the variability associated with the SPE procedure is higher. This can be explained by
the fact that the manipulation of the sample with the IT‐SPME is reduced only to loading the sample.
Finally, the inter‐day precision values were obtained by the two methods and are also comparable, as
Table 19 shows.
Table 19. Precision of the two tested approaches, RDS (%); n=3.
Compound /
Concentration
(ng mL-1)
SPE/portable NanoLC IT-SPME - CapLC
Intraday Interday Intraday Interday
10 50 100 10 50 100 2 5 10 2 5 10
Theobromine ‐ 2 6 ‐ 7 6 5 5 2 4 5 6
Theophylline 8 4 4 6 5 5 2 4 4 2 6 4
Caffeine 3 4 7 5 5 4 4 4 4 5 3 6
The last parameter evaluated was the extraction recovery. For this, the seawater sample was
spiked to contain the analytes at three different concentration levels and then processed in order to
obtain the extraction recoveries. This sample was selected due to, as mentioned in the optimization
of cleanup solvent selection for SPE procedure, none of the analytes were found. The recovery
percentages were calculated by comparing the peak areas obtained from the spiked samples with
those measured for standard solutions with the analytes at the same concentration.
Figure 40 shows representative chromatograms obtained for the analysis of seawater, blank,
and fortified samples by the SPE/portable NanoLC and IT‐SPME – CapLC approaches. The obtained
values ranged within the 65‐89 % and 83‐103 % with the SPE/portable NanoLC and IT‐SPME‐CapLC
methods, respectively. Recovery values for the three analytes in all concentration levels, for the two
procedures, with n = 3, are listed in Table 20.
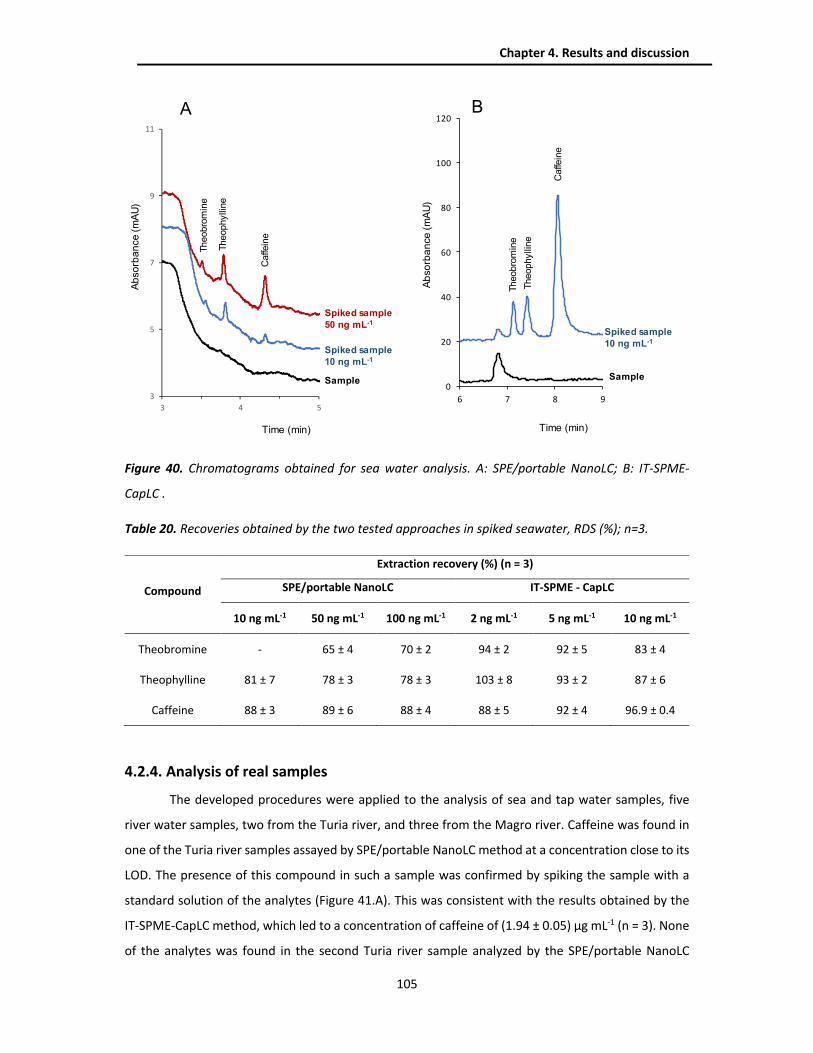
Chapter 4. Results and discussion
105
Figure 40. Chromatograms obtained for sea water analysis. A: SPE/portable NanoLC; B: IT-SPME-
CapLC .
Table 20. Recoveries obtained by the two tested approaches in spiked seawater, RDS (%); n=3.
Compound
Extraction recovery (%) (n = 3)
SPE/portable NanoLC IT-SPME - CapLC
10 ng mL-1 50 ng mL-1 100 ng mL-1 2 ng mL-1 5 ng mL-1 10 ng mL-1
Theobromine ‐ 65 ± 4 70 ± 2 94 ± 2 92 ± 5 83 ± 4
Theophylline 81 ± 7 78 ± 3 78 ± 3 103 ± 8 93 ± 2 87 ± 6
Caffeine 88 ± 3 89 ± 6 88 ± 4 88 ± 5 92 ± 4 96.9 ± 0.4
4.2.4. Analysis of real samples
The developed procedures were applied to the analysis of sea and tap water samples, five
river water samples, two from the Turia river, and three from the Magro river. Caffeine was found in
one of the Turia river samples assayed by SPE/portable NanoLC method at a concentration close to its
LOD. The presence of this compound in such a sample was confirmed by spiking the sample with a
standard solution of the analytes (Figure 41.A). This was consistent with the results obtained by the
IT‐SPME‐CapLC method, which led to a concentration of caffeine of (1.94 ± 0.05) µg mL‐1 (n = 3). None
of the analytes was found in the second Turia river sample analyzed by the SPE/portable NanoLC
3
5
7
9
11
3 4 5
Theobro
min
e
Theophylli
ne
Caffe
ine
Spiked sample10 ng mL-1
Sample
Spiked sample50 ng mL-1
Ab
so
rba
nce
(m
AU
)
Time (min)
A
Theobro
min
e
Theophylli
ne
Caffe
ine
0
20
40
60
80
100
120
6 7 8 9
Time (min)A
bso
rba
nce
(m
AU
)
B
Sample
Spiked sample10 ng mL-1

Chapter 4. Results and discussion
106
method; however, this sample was positive for caffeine when using the IT‐SPME‐CapLC method, being
its concentration (1.79 ± 0.11) µg mL‐1, (n=3).
In the rest of the samples, none of the analytes were found by any of both methodologies.
The application of the second approach allows confirming the presence of caffeine by the concordance
between the spectra of the suspected peak and that recorded for a standard solution of caffeine, as
Figure 41.B shows.
Figure 41. Chromatograms obtained for the Turia river water samples: (A) chromatograms obtained
by the SPE/portable NanoLC approach for a sample positive for caffeine, for an standard solution of
the analytes (10 ng mL-1, each compound), and detail of the registers obtained for the same sample
fortified with the analytes (2 ng mL-1, each); (B) registers obtained by the IT-SPME - CapLC approach
for the samples and for an standard solution of the analytes (10 ng mL-1), and normalized spectra of
the peak assigned to caffeine in sample 2 and the spectra corresponding to a standard solution of
caffeine.
4.2.5. Conclusions
In this thesis, a method for the detection and quantification of the emerging contaminant
caffeine and other trimethylxanthines (theophylline and theobromine) using a portable NanoLC
chromatograph has been developed. The results obtained along the study indicate that this
instrument can be applied for the analysis of the contaminants in water analysis, provided that the
proper sample treatment is applied to the samples.
A
Standard
Sample 1
21
3
Absorb
ance
(mA
U)
Time (min)
3
3
4
5
6
4 4.5 5
Sample
Fortified sample
mA
U
Time (min)
3
3
2
3
4
5
6
7
8
9
3 4 5
Sample 1
Sample 2
Standard
21
3
B
Time (min)
3
3
Absorb
ance
(mA
U)
0
0.5
1
220 270 320
Wav elength (nm)
No
rma
lize
d a
bs
orb
an
ce
Standard
Sample 2
1 - Theobromine
2 - Theophylline
3 - Caffeine
0
100
200
300
400
500
600
6 7 8
Chapter 4. Results and discussion
107
According to this, a protocol based on SPE has been developed which can be carried out on‐
site, as it involves neither extensive sample manipulation nor additional instrumentation (for solvent
evaporation, for instance).The proposed method is adequate to quantify the tested methylxanthines
at µg mL‐1 levels, and provides satisfactory linearity and precession similar to that of the IT‐SPME‐Cap
LC approach, although the sensitivity attainable is slightly lower. Additional advantages of the
SPE/NanoLC approach are better resolution, lower times of analysis, and a significant reduction in
solvents consumption. The work represents a pioneer study in the application of portable NanoLC
systems for the analysis of organic pollutants in different kinds of water samples.
4.3 ANALYSIS OF DIETARY SUPPLEMENTS
In the framework of the development of this thesis, the application of capillary liquid
chromatography with UV‐diode array detection (DAD) for the chemical characterization of botanical
dietary supplements was proposed. As is pointed in the introductory part of this work, the
development of analytical methods for this type of products can be useful to estimate its effectiveness
and safety through the consideration of the contents of major constituents such as caffeine,
chlorogenic acids, and synephrine, whereas minor compounds as theobromine, riboflavin, limonene,
α‐pinene, farnesene, myrcene, linalool, and kaempferol, with potential physiological effects, can be
used to evaluate the sensory characteristics of the samples.
The advantages that miniaturized chromatographic systems show in terms of high‐resolution
power and sensitivity attainable, make possible the determination of seventeen compounds that can
be found in dietary supplements at different concentration levels, under the approach of analysis of
both major and minor components in this kind of samples.
4.3.1. Optimization of the chromatographic separation
The structural and polarity variety of the compounds, with log Kow values with a wide range,
from ‐0.8 for theobromine to 6.1 for farnesene, denotes the need to apply a gradient separation.
Additionally, the reverse‐phase mechanism is the most appropriate for this type of chromatographic
separation, due to the variety of solvents and stationary phases available for this type of mechanism.
Based on the UV cutoff wavelength, defined as the wavelength at which solvent absorbs 1.0 AU in a
10‐mm cell [288], of some of the solvents commonly used in reverse‐phase, and the maximum
absorption wavelength of the analytes, some eluents such as alcohols, tetrahydrofuran or buffers
were found unsuitable as they present significant absorbances at the low wavelengths ranges (<210
nm) required for the detection of the terpenic compounds.

Chapter 4. Results and discussion
108
According to the graph in Figure 42, in addition to the effect of methanol, isopropanol, and
tetrahydrofuran, the use of aqueous solutions with acetic acid could affect the detection of
synephrine. For the rest of the compounds, minimal effects can be produced due to its absorption at
high wavelengths. Finally, the graph shows that water and acetonitrile turn out to be the best option
to optimize the chromatographic separation.
For the initial experiments, diluted standard solutions of the analytes were prepared at
concentrations of 1 µg mL‐1 for synephrine, caffeine, theobromine, riboflavin, caffeic acid, kaempferol,
and 5‐CQA, and 5 µg mL‐1 for the rest of analytes, all of them prepared in water. Different gradient
elution programs were tested to separate the seventeen compounds. However, caffeic acid and the
chlorogenic acids could not be satisfactorily resolved. It can be explained due to the similarity of their
chemical structures, and also, because the chlorogenic acids studied are, as stated earlier, structural
isomers, which increases the difficulty to separate all these analytes in a single run [289].
Consequently, two chromatographic separations were developed. The first one for the
determination of caffeic acid and chlorogenic acids, called the "chlorogenic acids method", and the
second one for the rest of compounds called the "multi‐class method". Both are discussed below.
Figure 42. Graphical evaluation of the effect of the UV cutoff wavelength of the solvents commonly
used as a function of the maximum absorption wavelength of the studied compounds.
Aceto
nitr
ile /
Wate
r
Meth
anol
/ Is
opro
panol
Tetr
ahyd
rofu
ran
200
220
240
260
280
300
320
340
360
380
250230210190 330310290270
Acetic
acid
1%
SynephrineMyrcene
TheobromineCaffeine
Riboflavin
260240220200 340320300280 370350 380360
Caffeic acid
5-CQA3-CQA4-CQA
3,4-diCQA3,5-diCQA4,5-diCQA
Kaempferol
LinaloolLimoneneα-Pinene
Farnesene
Theore
tical w
ave
length
of th
e a
naly
tes (
nm
)
UV cutoff wavelength of typical solvents (nm)
Form
ic a
cid
1%

Chapter 4. Results and discussion
109
4.3.1.1. Multi-class method
For the correct separation of the most polar compounds, such as synephrine and
theobromine, it is foreseeable to start the gradient with a low percentage of acetonitrile. On the other
hand, the terpenic compounds will require a higher percentage of the organic solvent (100%) at the
end of the separation. In that way, applying 15% of acetonitrile at the beginning of the separation,
and a slow increase in the first 5 minutes, allows the separation of the polar compounds.
However, poor peak profile for synephrine was found in all the conditions tested, which has
also been reported by some literature papers, such as the case of Roman et al., who have mentioned
that the high polarity of this biogenic amine causes poor retention in traditional reverse‐phase
systems, necessitating the use of an anionic ion‐pairing agent to achieve retention [290].
In that sense, the use of a modifier in the working standard solution was tested. Improved
peak profiles for synephrine were observed by acidifying. Different acids were assayed, included
phosphoric, formic, and hydrochloric acid, all of them at 1% (v/v). Figure 43 shows the resulting
chromatograms. Although all acidic solutions prevented peak split, better results, in terms of narrower
peak, were observed with the use of hydrochloric acid.
Figure 43. Chromatograms resulting from the study of the effect of acid modifiers on the
chromatographic efficiency of synephrine. Blue: without modifier; Red: with hydrochloric acid; Green:
with ortho-phosphoric acid; Purple: with formic acid. Concentration of synephrine: 1 µg mL-1.
0
100
200
300
400
500
600
4 5 6 7 8 9
Ab
so
rba
nc
e (m
AU
)
Time (min)

Chapter 4. Results and discussion
110
For hydrochloric acid, different proportions were assayed to find the adequate quantity that
allows a good chromatographic efficiency of the peak, without causing a decrease in the pH of the
solution below 2, to avoid negative effects on the stationary phase. Adequate results were observed
when adding 0.1 % hydrochloric acid to the working solutions in a proportion of 1:10 (v/v). Finally,
with the addition of the modifier, the retention times of the rest of the analytes were relatively
unaffected.
The elution program finally selected was started with a 15% of acetonitrile at zero min, and
linearly increased to 20% at 5 min, to 50% at 9 min, and to 75% at 11 min. Finally, the percentage of
acetonitrile was increased to 100 % at 15 min and kept constant until the end of the run. Figure 44
shows the chromatograms obtained under the selected conditions for a standard solution of the
analytes at 200, 220, 275, 300, and 370 nm. As observed most compounds were satisfactorily resolved,
unfortunately, caffeine and riboflavin overlapped.
Figure 44. Chromatograms obtained with the optimized gradient. Blue: at 200 nm; Red: at 220 nm;
Purple: at 275nm; Green: at 330 nm; Orange: at 370 nm. For a solution containing synephrine (1 µg
mL-1), theobromine (1 µg mL-1), caffeine (1 µg mL-1), Riboflavin (1 µg mL-1), 5-CQA (1 µg mL-1), caffeic
acid (1 µg mL-1), linalool (5 µg mL-1), myrcene (5 µg mL-1), limonene, (5 µg mL-1), α-pinene (5 µg mL-1),
farnesene (5 µg mL-1) and kaempferol (1 µg mL-1).
0
500
1000
1500
2000
2500
5 10 15 20
Absorb
ance (m
AU
)
Time (min)
Syn
ephrine
Myr
cene
Theobro
min
e
Farn
esene
Lin
alo
ol
Caffeine +Riboflavin
Caffeic acid +Chlorogenic acid
Kaem
pfe
rol
Riboflavin
Lim
onene
α-P
inene
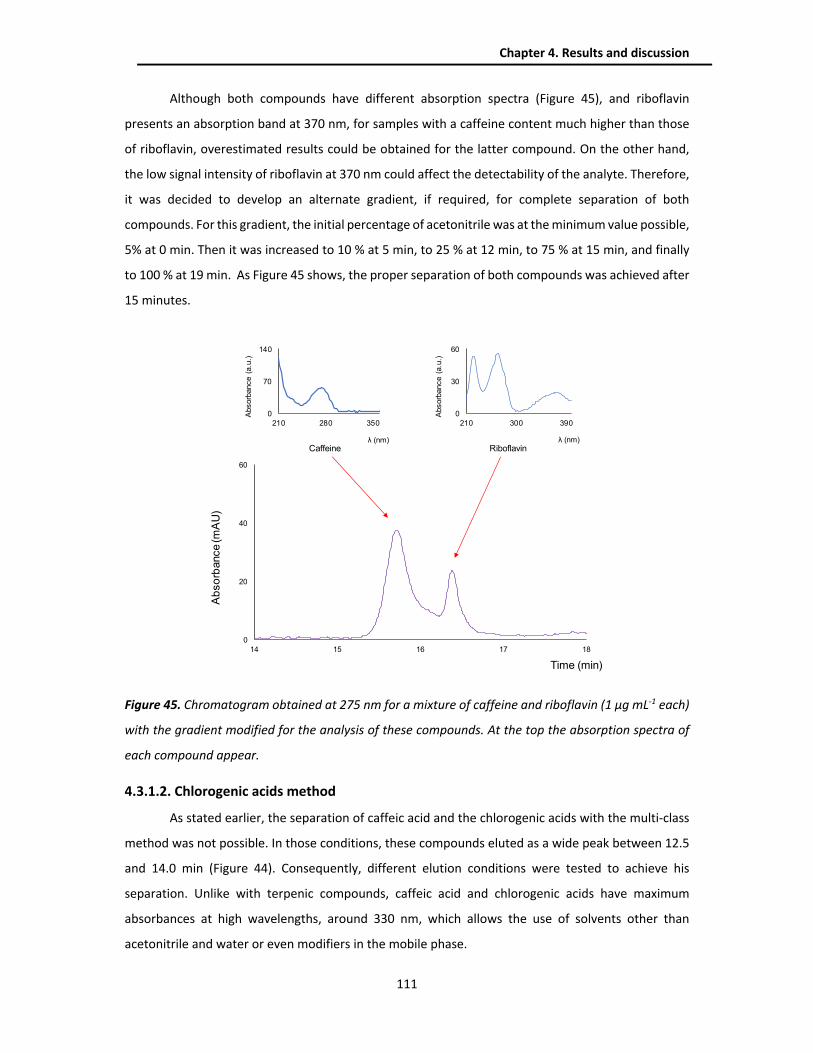
Chapter 4. Results and discussion
111
Although both compounds have different absorption spectra (Figure 45), and riboflavin
presents an absorption band at 370 nm, for samples with a caffeine content much higher than those
of riboflavin, overestimated results could be obtained for the latter compound. On the other hand,
the low signal intensity of riboflavin at 370 nm could affect the detectability of the analyte. Therefore,
it was decided to develop an alternate gradient, if required, for complete separation of both
compounds. For this gradient, the initial percentage of acetonitrile was at the minimum value possible,
5% at 0 min. Then it was increased to 10 % at 5 min, to 25 % at 12 min, to 75 % at 15 min, and finally
to 100 % at 19 min. As Figure 45 shows, the proper separation of both compounds was achieved after
15 minutes.
Figure 45. Chromatogram obtained at 275 nm for a mixture of caffeine and riboflavin (1 µg mL-1 each)
with the gradient modified for the analysis of these compounds. At the top the absorption spectra of
each compound appear.
4.3.1.2. Chlorogenic acids method
As stated earlier, the separation of caffeic acid and the chlorogenic acids with the multi‐class
method was not possible. In those conditions, these compounds eluted as a wide peak between 12.5
and 14.0 min (Figure 44). Consequently, different elution conditions were tested to achieve his
separation. Unlike with terpenic compounds, caffeic acid and chlorogenic acids have maximum
absorbances at high wavelengths, around 330 nm, which allows the use of solvents other than
acetonitrile and water or even modifiers in the mobile phase.
Absorb
ance (
a.u
.)
Absorb
ance (
a.u
.)
0
30
60
210 300 3900
70
140
210 280 350
λ (nm) λ (nm)
Ab
so
rbance (m
AU
)
Time (min)
Caffeine Riboflavin
0
20
40
60
14 15 16 17 18
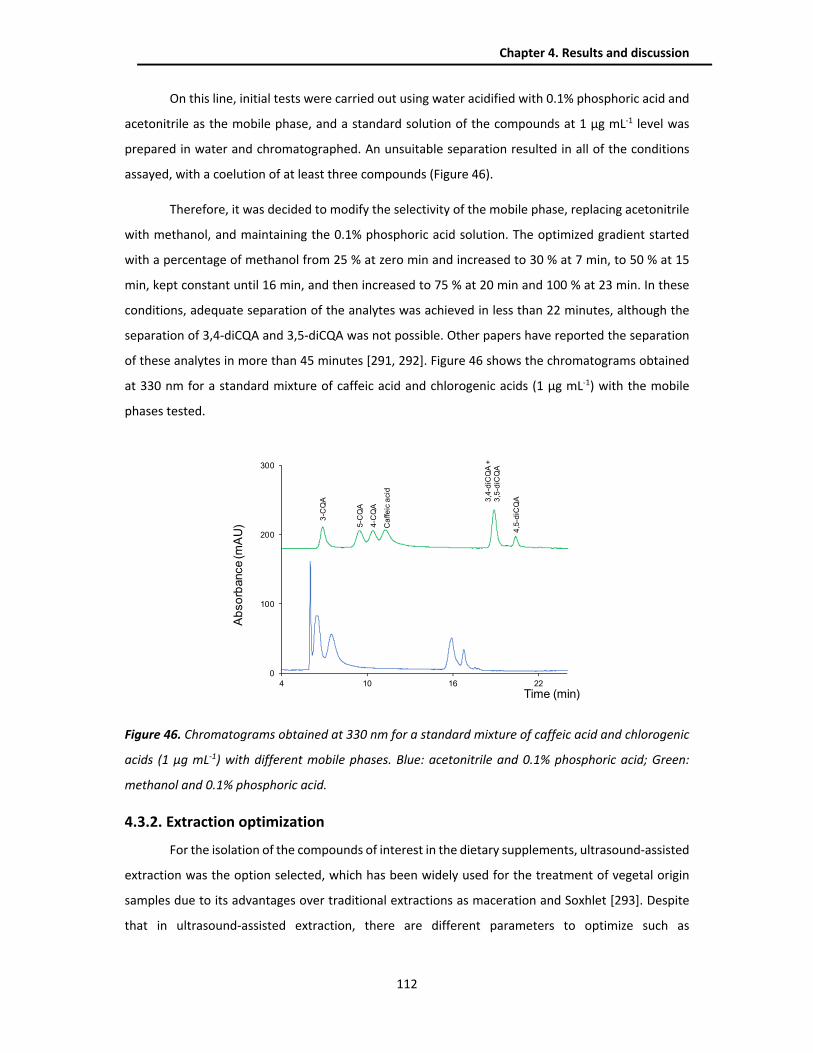
Chapter 4. Results and discussion
112
On this line, initial tests were carried out using water acidified with 0.1% phosphoric acid and
acetonitrile as the mobile phase, and a standard solution of the compounds at 1 µg mL‐1 level was
prepared in water and chromatographed. An unsuitable separation resulted in all of the conditions
assayed, with a coelution of at least three compounds (Figure 46).
Therefore, it was decided to modify the selectivity of the mobile phase, replacing acetonitrile
with methanol, and maintaining the 0.1% phosphoric acid solution. The optimized gradient started
with a percentage of methanol from 25 % at zero min and increased to 30 % at 7 min, to 50 % at 15
min, kept constant until 16 min, and then increased to 75 % at 20 min and 100 % at 23 min. In these
conditions, adequate separation of the analytes was achieved in less than 22 minutes, although the
separation of 3,4‐diCQA and 3,5‐diCQA was not possible. Other papers have reported the separation
of these analytes in more than 45 minutes [291, 292]. Figure 46 shows the chromatograms obtained
at 330 nm for a standard mixture of caffeic acid and chlorogenic acids (1 µg mL‐1) with the mobile
phases tested.
Figure 46. Chromatograms obtained at 330 nm for a standard mixture of caffeic acid and chlorogenic
acids (1 µg mL-1) with different mobile phases. Blue: acetonitrile and 0.1% phosphoric acid; Green:
methanol and 0.1% phosphoric acid.
4.3.2. Extraction optimization
For the isolation of the compounds of interest in the dietary supplements, ultrasound‐assisted
extraction was the option selected, which has been widely used for the treatment of vegetal origin
samples due to its advantages over traditional extractions as maceration and Soxhlet [293]. Despite
that in ultrasound‐assisted extraction, there are different parameters to optimize such as
0
100
200
300
4 10 16 22
Ab
so
rbance (m
AU
)
Time (min)
3-C
QA
5-C
QA
4-C
QA
Ca
ffe
ica
cid
3,4
-diC
QA
+
3,5
-diC
QA
4,5
-diC
QA
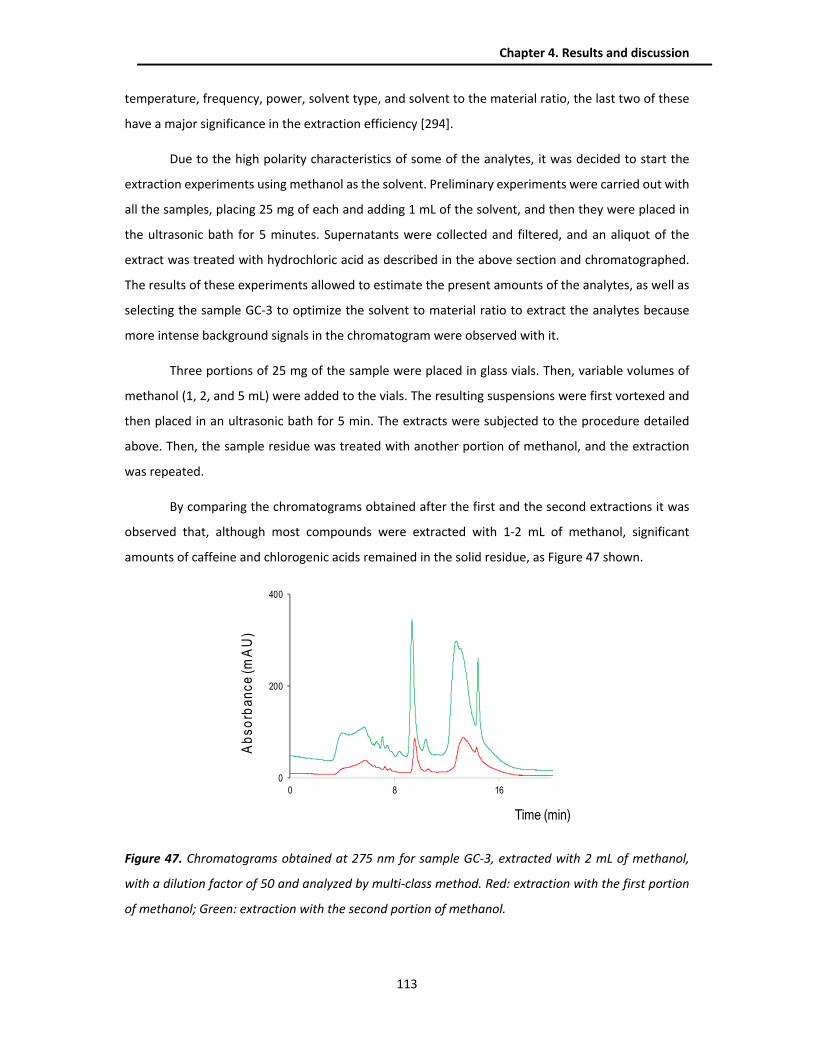
Chapter 4. Results and discussion
113
temperature, frequency, power, solvent type, and solvent to the material ratio, the last two of these
have a major significance in the extraction efficiency [294].
Due to the high polarity characteristics of some of the analytes, it was decided to start the
extraction experiments using methanol as the solvent. Preliminary experiments were carried out with
all the samples, placing 25 mg of each and adding 1 mL of the solvent, and then they were placed in
the ultrasonic bath for 5 minutes. Supernatants were collected and filtered, and an aliquot of the
extract was treated with hydrochloric acid as described in the above section and chromatographed.
The results of these experiments allowed to estimate the present amounts of the analytes, as well as
selecting the sample GC‐3 to optimize the solvent to material ratio to extract the analytes because
more intense background signals in the chromatogram were observed with it.
Three portions of 25 mg of the sample were placed in glass vials. Then, variable volumes of
methanol (1, 2, and 5 mL) were added to the vials. The resulting suspensions were first vortexed and
then placed in an ultrasonic bath for 5 min. The extracts were subjected to the procedure detailed
above. Then, the sample residue was treated with another portion of methanol, and the extraction
was repeated.
By comparing the chromatograms obtained after the first and the second extractions it was
observed that, although most compounds were extracted with 1‐2 mL of methanol, significant
amounts of caffeine and chlorogenic acids remained in the solid residue, as Figure 47 shown.
Figure 47. Chromatograms obtained at 275 nm for sample GC-3, extracted with 2 mL of methanol,
with a dilution factor of 50 and analyzed by multi-class method. Red: extraction with the first portion
of methanol; Green: extraction with the second portion of methanol.
0
200
400
0 8 16
Ab
so
rba
nc
e (m
AU
)
Time (min)

Chapter 4. Results and discussion
114
In contrast, no significant peaks were observed in the chromatograms obtained for residues
that had been treated with 5 mL of methanol (Figure 48). Therefore, extraction with 5 mL of methanol
was the option applied in further assays.
Figure 48. Chromatograms obtained at 275 nm for sample GC-3, extracted with 5 mL of methanol,
with a dilution factor of 100 and analyzed by multi-class method. Red: extraction with the first portion
of methanol; Green: extraction with the second portion of methanol.
4.3.3. Analytical performance
To evaluate the analytical performance of the two developed methods, different parameters
were studied for the estimation of the linearity, limits of detection (LOD) and limits of quantification
(LOQ), repeatability and reproducibility, and extraction recoveries, following the guide of Eurachem
group [295]. For these experiments, standard solutions of the analytes, blank, and fortified samples
were prepared.
4.3.3.1. Multi-class method
First, the concentration ranges were selected to obtain peak areas of approximately the same
order for all analytes at their respective working wavelengths, which were selected according to their
UV spectra. Figure 49 shows the UV spectra of compounds that have not been included so far, it is
important to underline the absence of characteristic absorption bands for terpenic compounds.
0
20
40
0 8 16
Ab
so
rba
nc
e (m
AU
)
Time (min)

Chapter 4. Results and discussion
115
Figure 49. UV spectra obtained for some of the compounds analyzed by the multi-class method.
The linearity was evaluated by processing in duplicate five concentrations within the tested
range. In all instances, satisfactory results were observed, with determination coefficients between
0.99 and 0.999. The limits of detection (LODs) and limits of quantification (LOQs) were established as
the concentrations of analyte that resulted in signal‐to‐noise ratios of 3 and 10, respectively. These
values were obtained by processing solutions with decreasing concentrations of the analytes; before
analyzing each solution, water was processed to confirm the absence of contaminants and/or memory
effects.
The LODs ranged from 0.005 to 0.25 µg mL‐1, with the lowest values being found for linalool,
caffeine, theobromine, and myrcene. On the other hand, as expected, the highest values were those
presented by terpenic compounds such as limonene, α‐pinene, and farnesene. The LOQs were in the
0.02‐1.0 µg mL‐1 interval. Finally, to establish the instrumental precision, a successive injection of three
replicates of standard solutions of the analytes at concentrations of 0.5‐5.0 µg mL‐1 was effected. Then
the relative standard deviations (RSDs) were obtained, and the values were ranged from 2‐11%. Table
21 shows the concentration ranges and wavelengths used, as well as the relevant analytical
parameters obtained.
0
50
100
150
210 290 370
Ab
so
rba
nc
e (
a.u
.)
λ (nm)
0
100
200
300
400
210 290 370
Ab
so
rba
nc
e (
a.u
.)
λ (nm)
0
100
200
300
210 290 370
Ab
so
rba
nc
e (
a.u
.)
λ (nm)
0
400
800
210 290 370
Ab
so
rba
nc
e (
a.u
.)
λ (nm)
Synephrine
Myrcene
Linalool
Kaempferol
0
50
100
210 290 370
Ab
so
rba
nc
e (
a.u
.)
λ (nm)
Limonene
0
100
200
210 290 370
Ab
so
rba
nc
e (
a.u
.)
λ (nm)
α-Pinene
0
70
140
210 290 370
Farnesene
Ab
so
rba
nc
e (
a.u
.)
λ (nm)

Chapter 4. Results and discussion
116
Tab
le 2
1. A
na
lyti
cal p
ara
met
ers
of
the
mu
lti-
cla
ss m
eth
od
.
Co
mp
ou
nd
W
ave
len
gth
(n
m)
Lin
ear
ity
(n =
10
) y
= ax
+b
y
= ax
+b
LO
D
(µg
mL-1
) LO
Q
(µg
mL-1
)
Pre
cisi
on
a , (n
=3)
RSD
%
C
on
cen
trat
ion
ra
nge
(µ
g m
L-1)
a ±
sa
b ±
sb
R2
Syn
eph
rin
e
22
0
0.2
‐ 5
.0
18
40
± 3
0
‐ 1
5 ±
35
0
.99
7
0.0
5
0.2
8
Theo
bro
min
e
27
5
0.0
5 ‐
1.0
2
36
0 ±
40
‐
21
± 2
0
0.9
98
0
.01
0
.04
7
C
affe
ine
2
75
0
.05
‐ 2
.5
18
40
± 3
0
‐ 1
5 ±
35
0
.99
7
0.0
1
0.0
4
4
Rib
ofl
avin
2
75
1
.0 ‐
7.0
3
91
± 6
‐
18
± 2
3
0.9
98
0
.10
0
.3
3
Kae
mp
fero
l 3
70
1
.0 ‐
5.0
2
70
± 1
0
‐ 5
0 ±
30
0
.99
0
0.2
5
1.0
1
0
Lin
alo
ol
20
0
0.0
2 ‐
1.0
2
02
00
± 2
00
6
7 ±
90
0
.99
9
0.0
05
0
.02
1
1
Myr
cen
e 2
20
0
.05
‐ 2
.5
53
0 ±
20
‐
20
± 2
0
0.9
92
0
.01
0
.04
2
Li
mo
nen
e 2
00
1
.0 ‐
10
.0
92
0 ±
40
‐
60
0 ±
30
0
0.9
93
0
.25
1
.0
3
α‐P
ine
ne
20
0
1.0
‐ 1
0.0
1
66
± 6
‐
60
± 3
0
0.9
93
0
.25
1
.0
11
Fa
rnes
ene
20
0
1.0
‐ 5
.0
90
0 ±
40
‐
20
0 ±
10
0
0.9
91
0
.25
1
.0
11
(a ) Es
tab
lish
ed a
t a
con
cen
trat
ion
of
0.5
µg
mL‐1
fo
r sy
nep
hri
ne,
5 µ
g m
L‐1 f
or
rib
ofl
avin
an
d 1
µg
mL‐1
fo
r th
e re
st o
f co
mp
ou
nd
s.

Chapter 4. Results and discussion
117
For the study of the recoveries, a green coffee sample was spiked with known amounts of the
analytes. The amount of each compound added to the sample was 0.25 µg g‐1. For compounds
expected at higher percentages, such as caffeine and synephrine, the samples were also spiked with
25 µg g‐1 of the analytes. The recoveries were calculated by comparing the increments of the peak
areas in the spiked samples with those obtained for standard solutions containing an equivalent
concentration of each compound. The values obtained are listed in Table 22. As observed, the main
recoveries showed adequate results ranged from 82 % to 109 %.
It has to be noted that with the recoveries values found and the LOQs presented in Table 21,
the theoretical minimum amounts of the analytes that could be quantified by the present method (for
a weight of 25 mg of the samples) ranged from 0.004 mg g‐1 for linalool to 0.2 mg g‐1 for limonene and
α‐pinene. If required, the minimum amounts could be further reduced by two possibilities. On one
hand, increasing the amount of sample, and on the other hand, by evaporating the methanolic extract
to dryness and subsequent redissolution in a lower volume of solvent.
Finally, to study the intra‐day precision of the entire procedure, three portions of the samples
were spiked with the analytes and processed consecutively. The inter‐day precision was obtained in
the same way, from six replicates of the spiked samples processed on different days. The results are
shown in Table 22. The RSD values obtained were of about the same order than those found for
standard solutions of the analytes (instrumental precision) listed in Table 21.
Table 22. Precision and recovery obtained in spiked green coffee samples for of the multi‐class
method.
Compound Added amount
(mg g-1)
Mean recovery, (n=6)
(%)
Precision, RSD (%)
Intra-day
(n=3)
Inter-day
(n=6)
Synephrine 0.25 109 11 12
25.0 82 7 3
Theobromine 0.25 105 15 12
Caffeine 0.25 94 11 10
25.0 93 6 5
Riboflavin 0.25 92 11 9
Kaempferol 0.25 93 10 11
Linalool 0.25 96 5 4
Myrcene 0.25 106 3 10
Limonene 0.25 95 11 13
α‐Pinene 0.25 98 10 13
Farnesene 0.25 105 7 6

Chapter 4. Results and discussion
118
4.3.3.2. Chlorogenic acids method
In a similar way that for the multiclass method, the same parameters were evaluated for the
chlorogenic acids method, measuring the peak areas at 330 nm as analytical signals, as their UV
spectra show (Figure 50). The values obtained are shown in Table 23. The analytical responses for all
compounds were linear within the tested concentration range, being the precision suitable (RSDs ≤ 8
%) and the determination coefficients between 0.990 and 0.998. The concentration range tested was
from 0.3 to 2.0 µg mL‐1 for all compounds, except for 3‐CQA and 5‐CQA, where the range was for 0.2
to 2.0 µg mL‐1.
Figure 50. UV spectra obtained for chlorogenic acid compounds analyzed under the chlorogenic acids
method.
The LODs and LOQs were of 0.05‐0.1 µg mL‐1 and 0.2‐0.3 µg mL‐1, respectively. It has to be
noted that the slopes of the calibration equations obtained for 3,4‐diCQA and 3,5‐diCQA (both eluted
at 18.1 min) were equivalent. Therefore, as Figure 46 (green) shows, the area of the obtained for the
peak observed at this retention time can be used as an estimation of the total amount of both
compounds in the samples.
0
100
200
210 300 390
0
30
60
210 300 3900
100
200
210 300 3900
60
120
210 300 390
0
20
40
210 300 390
0
15
30
210 300 3900
50
100
210 300 390
Ab
so
rba
nc
e (
a.u
.)
λ (nm)
Ab
so
rba
nc
e (
a.u
.)
λ (nm)
Ab
so
rba
nc
e (
a.u
.)
λ (nm)
Ab
so
rba
nc
e (
a.u
.)
λ (nm)
3-CQA
3,4-diCQA
5-CQA
Caffeic acid
Ab
so
rba
nc
e (
a.u
.)
λ (nm)
3,5-diCQA
Ab
so
rba
nc
e (
a.u
.)
λ (nm)
4,5-diCQA
4-CQA
Ab
so
rba
nc
e (
a.u
.)
λ (nm)

Chapter 4. Results and discussion
119
Tab
le 2
3. A
na
lyti
cal p
ara
met
ers
of
the
chlo
rog
enic
aci
ds
met
ho
d.
Co
mp
ou
nd
W
ave
len
gth
(n
m)
Lin
ear
ity
(n =
10
) y
= ax
+b
LO
D
(µg
mL-1
) LO
Q
(µg
mL-1
)
Pre
cisi
on
a , (n
=3)
RSD
%
C
on
cen
trat
ion
ra
nge
(µ
g m
L-1)
a ±
s a
b ±
sb
R2
3‐C
QA
3
30
0
.2 ‐
2.0
1
18
0 ±
20
‐
80
± 2
0
0.9
98
0
.05
0
.2
6
5‐C
QA
3
30
0
.2 ‐
2.0
1
16
0 ±
30
‐
11
0±
30
0
.99
6
0.0
5
0.2
2
4
‐CQ
A
33
0
0.3
‐ 2
.0
12
00
± 2
0
‐ 2
00
± 3
0
0.9
98
0
.10
0
.3
5
3,4
‐diC
QA
3
30
0
.3 ‐
2.0
6
50
± 4
0
‐ 9
0 ±
40
0
.99
0
0.1
0
0.3
6
3
,5‐d
iCQ
A
33
0
0.3
‐ 2
.0
67
0 ±
30
‐
20
± 3
0
0.9
90
0
.10
0
.3
4
4,5
‐diC
QA
3
30
0
.3 ‐
2.0
5
60
± 2
0
‐ 6
0 ±
20
0
.99
3
0.1
0
0.3
8
C
affe
ic a
cid
3
30
0
.3 ‐
2.0
2
30
0 ±
10
0
‐ 6
00
± 1
00
0
.99
3
0.1
0
0.3
8
(a ) Es
tab
lish
ed
at
a co
nce
ntr
atio
n o
f 1
µg
mL‐1
fo
r th
e al
l co
mp
ou
nd
s.

Chapter 4. Results and discussion
120
To obtain the recoveries and the precision in two aspects, intra‐ and inter‐day, the same green
coffee sample used above was spiked with 5 µg g‐1 of all compounds. Additionally, another sample
was spiked with 25 µg g‐1 of 5‐CQA, whose concentration in the samples is expected at higher
percentages, according to the preliminary experiments with the samples. The obtained results for
these parameters are shown in Table 24.
Table 24. Precision and recovery obtained in spiked green coffee samples for chlorogenic acids
method.
Compound Added amount
(mg g-1)
Mean recovery, (n=6)
(%)
Precision, RSD (%)
Intra-day
(n=3)
Inter-day
(n=6)
3‐CQA 5.0 87 3 6
5‐CQA 5.0 85 5 8
25.0 79 2 8
4‐CQA 5.0 90 2 6
3,4‐diCQA 5.0 87 1 1
3,5‐diCQA 5.0 89 3 2
4,5‐diCQA 5.0 89 3 2
Caffeic acid 5.0 85 3 7
4.3.4. Analysis of real samples
The proposed methods were applied to the analysis of different dietary supplements, namely
three green coffee extracts claimed to enhance physical performance, two fat‐burnings for losing
weight, and one herbal preparation (relaxant). Portions of 25 mg of the samples were treated with 5
mL of methanol, then vortexed for 30 seconds, and then they were placed in the ultrasonic bath for 5
minutes. Finally, the supernatants were collected and filtered. One aliquot of the extract was treated
with hydrochloric acid and diluted with water to adjust the peak areas of the analytes to their
respective linear intervals, and the resulting dilution was chromatographed by the multi‐class method.
Another aliquot of the extract only was diluted and injected with the optimized conditions of the
chlorogenic acids method. Figure 51 shows the schema of the procedure for the analysis of the
samples.
4.3.4.1. Multi-class method
As mentioned before, the preliminary studies allowed to identify the compounds of the
samples, what was established from the concordance between the retention times and spectra of the
suspected peak, and that of a standard solution, and it was further confirmed by spiking the extract
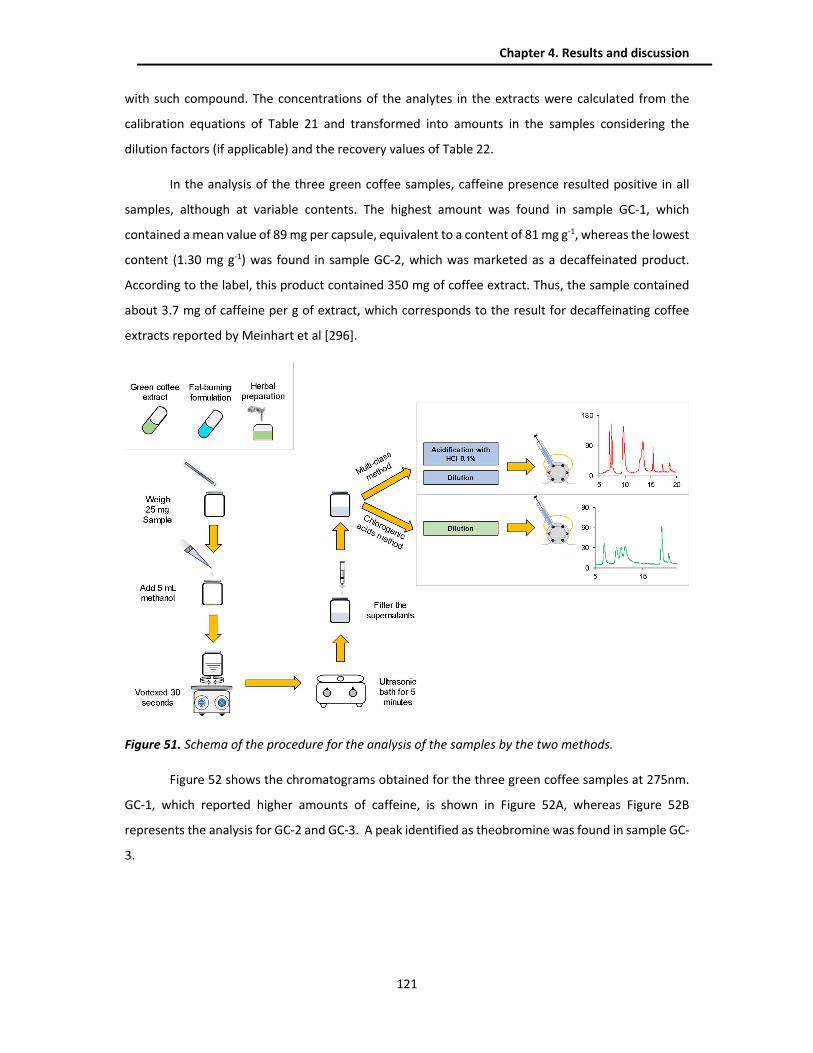
Chapter 4. Results and discussion
121
with such compound. The concentrations of the analytes in the extracts were calculated from the
calibration equations of Table 21 and transformed into amounts in the samples considering the
dilution factors (if applicable) and the recovery values of Table 22.
In the analysis of the three green coffee samples, caffeine presence resulted positive in all
samples, although at variable contents. The highest amount was found in sample GC‐1, which
contained a mean value of 89 mg per capsule, equivalent to a content of 81 mg g‐1, whereas the lowest
content (1.30 mg g‐1) was found in sample GC‐2, which was marketed as a decaffeinated product.
According to the label, this product contained 350 mg of coffee extract. Thus, the sample contained
about 3.7 mg of caffeine per g of extract, which corresponds to the result for decaffeinating coffee
extracts reported by Meinhart et al [296].
Figure 51. Schema of the procedure for the analysis of the samples by the two methods.
Figure 52 shows the chromatograms obtained for the three green coffee samples at 275nm.
GC‐1, which reported higher amounts of caffeine, is shown in Figure 52A, whereas Figure 52B
represents the analysis for GC‐2 and GC‐3. A peak identified as theobromine was found in sample GC‐
3.

Chapter 4. Results and discussion
122
Figure 52. Chromatograms obtained for the analysis of the green coffee samples at 275nm. A: GC-1
with dilution factor of 200; B: GC-2 (Blue) with dilution factor of 100; GC-3 (Purple) with dilution factor
of 100.
As observed in Figure 52 B of the GC‐3 sample, despite a large amount of caffeine found,
riboflavin could be identified, which matches with the declared value on its label. Thus, the alternate
gradient for the separation of caffeine and riboflavin was applied for this sample, and the found
concentration for riboflavin was 0.56 mg, whereas the declared amount was 0.7 mg. Figure 53 shows
these results.
Figure 53. Chromatogram obtained at 275 nm for sample GC-3 with the Multi-class method and the
modified gradient for the analysis of caffeine and riboflavin (purple), and normalized spectra of the
peak assigned to riboflavin in the sample (red) and the spectra corresponding to a standard solution
of riboflavin (blue). In green appears the spectra corresponding to the peak assigned to caffeine.
0
125
250
6 9 12 150
20
40
60
80
6 9 12 15
Absorb
ance (m
AU
)
Time (min)
Caffein
e +
Rib
ofla
vine
Theobro
min
e
Absorb
ance (m
AU
)
Time (min)
Caffein
e
Caffein
e
A B
0
40
80
16.5 16.75 17
0
0.5
1
210 260 310 360
Riboflavine
Caffeine
Norm
aliz
edAbsorb
ance
λ (nm)
Absorb
ance (m
AU)
Time (min)
0
70
140
210 260 310 360λ (nm)
Absorb
ance (m a.u
.)
Chapter 4. Results and discussion
123
It has to be noted that different peaks at retention times of 12.5‐14.0 min were observed for
the three samples assayed, as Figure 52 is shown. The UV spectra registered at different positions of
such peaks were indicative of the presence of caffeic and/or chlorogenic acids. Consequently, those
samples were further processed using the chlorogenic acids method. Besides, in sample GC‐3 was
also found a significant amount of synephrine. This product was labeled to contain 50 mg of Citrus
aurantium (dry extract) with 6 % of synephrine (w/w). Thus, the theoretical amount of synephrine
was 3 mg/capsule, being the percentage found equal to 86 % (2.6 mg/capsule).
Finally, limonene and myrcene were found in samples GC‐1 and GC‐3. It is interesting to note
that neither these compounds nor the other minor components were found in sample GC‐2, which
contained decaffeinated green coffee as the main ingredient. This suggests that minor volatile
compounds were likely lost during the decaffeination process, as some researchers have attributed
changes in the levels of important bioactive compounds during this process [297].
Synephrine was the most abundant compound in the fat‐burning supplements. The highest
amount of synephrine was found in sample FB‐1 (13.2 mg per capsule), which also contained a
significant amount of caffeine (0.9 mg per capsule), whereas the sample FB‐2 contained 2.56 mg of
synephrine per capsule. Figure 54 depicted the chromatogram registered at 220 nm for sample FB‐1
and FB‐2. Unlike the result found for sample GC‐3, the amounts of synephrine found did not match
with the declared values, which were 7.5 mg and 6.6 mg for FB‐1 and FB‐2, respectively. Interestingly,
the three products that used Citrus aurantium as ingredient reported the same percentage of
synephrine, 6 %. This suggests that this percentage is used as a mere reference or mean value for this
kind of extract. The results of our study indicate that the real concentrations may be significantly
different.

Chapter 4. Results and discussion
124
Figure 54. Chromatogram obtained at 220 nm with the multi-class method for the analysis of Fat-
burning supplements. Green: FB-1 with dilution factor of 1000; Red: FB-2 with dilution factor of 500.
At the top appears the spectra corresponding to the peak assigned to synephrine (blue).
Minor compounds of terpenic compounds, including limonene, myrcene, and linalool were
present at much lower percentages (<0.04 %) in fat‐burning supplements. As an example, the peak
identified as linalool in the chromatogram obtained at 200 nm for sample FB‐1 is shown in Figure 55A.
This figure also shows the registers obtained from an extract of the same sample fortified with linalool
and for a standard solution of this compound. Figure 55B shows the chromatogram obtained at 220
nm for sample FB‐2 and normalized spectra of the peak assigned to myrcene in the sample. As regards
the caffeic and chlorogenic acids, only a small peak was observed at 330 nm for sample FB‐1, which
result was confirmed by the chlorogenic acids method.
0
100
200
5.5 6 6.5 7 7.5
Syn
ephrine
λ (nm)
Absorb
ance (m
AU
)
Time (min)
Absorb
ance (m
a.u
.)
0
15
30
45
210 290 370
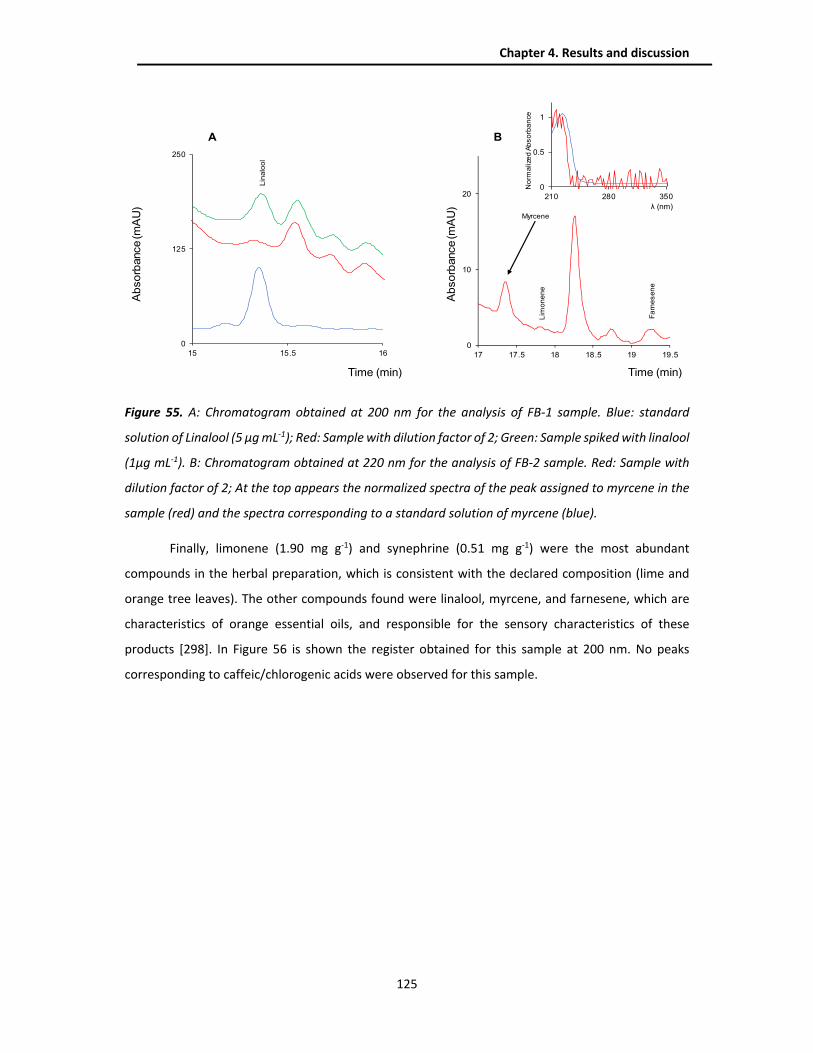
Chapter 4. Results and discussion
125
Figure 55. A: Chromatogram obtained at 200 nm for the analysis of FB-1 sample. Blue: standard
solution of Linalool (5 µg mL-1); Red: Sample with dilution factor of 2; Green: Sample spiked with linalool
(1µg mL-1). B: Chromatogram obtained at 220 nm for the analysis of FB-2 sample. Red: Sample with
dilution factor of 2; At the top appears the normalized spectra of the peak assigned to myrcene in the
sample (red) and the spectra corresponding to a standard solution of myrcene (blue).
Finally, limonene (1.90 mg g‐1) and synephrine (0.51 mg g‐1) were the most abundant
compounds in the herbal preparation, which is consistent with the declared composition (lime and
orange tree leaves). The other compounds found were linalool, myrcene, and farnesene, which are
characteristics of orange essential oils, and responsible for the sensory characteristics of these
products [298]. In Figure 56 is shown the register obtained for this sample at 200 nm. No peaks
corresponding to caffeic/chlorogenic acids were observed for this sample.
0
10
20
17 17.5 18 18.5 19 19.5
0
0.5
1
210 280 350
0
125
250
15 15.5 16
Ab
so
rbance (m
AU
)
Time (min)
Lin
alo
ol
A B
λ (nm)
Ab
so
rbance (m
AU
)
Time (min)
No
rma
lize
d A
bs
orb
an
ce
Myrcene
Fa
rne
se
ne
Lim
on
en
e

Chapter 4. Results and discussion
126
Figure 56. Chromatogram obtained at 200 nm for the analysis of HP sample without dilution. Peaks of
limonene and farnesene were identified. At the top appears the normalized spectra of the peak
assigned to limonene in the sample (red) and the spectra corresponding to a standard solution of
limonene (blue).
The results obtained from the six samples tested with the multi‐class method are listed in Table 25. In
total nine compounds were identified, of which eight could be correctly quantified.
4.3.4.2. Chlorogenic acids method
Once the samples were analyzed by the multi‐class method, those that resulted positive for
chlorogenic acids were analyzed using the chlorogenic acids method. These samples were the three
green coffee samples and sample FB‐1. The peaks corresponding to all the isomers included in the
study were detected in the three green coffee samples, whereas only 5‐CQA was found in FB‐1. On
the other hand, caffeic acid was not observed in any of the samples. Figure 57 shows the record
obtained from the four samples at 330 nm and the comparison between the spectra of the peak
assigned to 5‐CQA in sample FB‐1 with the theoretical spectrum of the compound.
0
300
600
16.5 17.5 18.5 19.5
0
0.5
1
210 270 330
Absorb
ance (m
AU
)
Time (min)
Limoneneλ (nm)
Norm
aliz
ed A
bsorb
ance
Farn
esene

Chapter 4. Results and discussion
127
Table 25. Results obtained for the real samples analyzed with the multi-class method (n=3).
Sample Found compounds Dilution
factor
Found amount
mg per unit a mg g-1
GC‐1
Chlorogenic acids
Caffeine
Limonene
Myrcene
200
200
2
2
detected
89 ± 4
0.350 ± 0.004
0.059 ± 0.003
‐
81 ± 4
0.318 ± 0.003
0.054 ± 0.003
GC‐2 Chlorogenic acids
Caffeine
100
100
detected
0.51 ± 0.01
‐
1.30 ± 0.03
GC‐3
Chlorogenic acids
Caffeine
Theobromine
Synephrine
Limonene
Myrcene
Riboflavin b
100
100
100
100
10
10
10
detected
3.34 ± 0.03
0.24 ± 0.02
2.71 ± 0.02
0.84 ± 0.01
1.3 ± 0.2
0.56 ± 0.06
‐
6.7 ± 0.1
0.48 ± 0.05
5.4 ± 0.3
1.68 ± 0.01
2.6 ± 0.3
1.1 ± 0.1
FB‐1
Chlorogenic acids
Synephrine
Caffeine
Limonene
Linalool
Myrcene
2
100
100
2
2
2
detected
13.2 ± 0.8
0.9 ±0.2
0.129 ± 0.001
0.0031 ± 0.0001
0.0200 ± 0.001
‐
27 ± 2
1.8 ± 0.4
0.258 ± 0.002
0.006 ± 0.001
0.039 ± 0.003
FB‐2
Synephrine
Limonene
Linalool
Myrcene
50
2
2
2
2.56 ± 0.08
0.130 ± 0.002
0.003 ± 0.001
0.003 ± 0.005
10.4 ± 0.3
0.520 ± 0.005
0.012 ± 0.001
0.012 ± 0.001
HP
Synephrine
Limonene
Linalool
Myrcene
Farnesene
5
‐
‐
‐
‐
0.71 ± 0.04
2.60 ± 0.05
< LOQ
0.150 ± 0.001
0.100 ± 0.003
0.51 ± 0.3
1.90 ± 0.04
< LOQ
0.110± 0.001
0.070 ± 0.002
(a) capsule or bag; (b) measured with modified gradient.

Chapter 4. Results and discussion
128
Figure 57. Chromatograms obtained at 330 nm for the analysis of GC-1, GC-2, GC-3, and FB-1 samples.
Green: standard solution (each compound at 1 µg mL-1); Blue: GC-2 sample with dilution factor of 300;
Red: GC-3 sample with dilution factor of 300; Purple: GC-1 sample with dilution factor of 100; Brown:
FB-1 sample with dilution factor of 5; at the top appears the normalized spectra of the peak assigned
to 5-CQA in the sample (red) and the spectra corresponding to a standard solution of 5-CQA (blue).
It has to be noted that besides the peaks of the chlorogenic acids included in this study, minor
peaks with spectra similar to chlorogenic acid were observed between 13 and 15 min (Figure 58). As
is pointed out in the introduction part of this thesis, there are three main subgroups of chlorogenic
acids, and each one of these groups has, at least, three isomers. Thus, these minor peaks can
correspond at feruloylquinic acids (FQA) group, which include the 3‐FQA, 4‐FQA, and 5‐FQA, and this
may coincide with the findings reported by Takahashi et al [299].
Figure 58. Chromatogram obtained at 330 nm for the analysis of the GC-1 sample with a dilution factor
of 100; at the top appears the UV spectra of the unknown peaks.
0
300
600
900
4 9 14 19 24
Absorb
ance (m
AU)
Time (min)
3-C
QA
5-C
QA
4-C
QA
Caffe
ic acid
3,4-d
iCQA +
3,5-d
iCQA
4,5-d
iCQA
0
0.5
1
210 270 330 390λ (nm)
Norm
aliz
ed Absorb
ance
Absorb
ance (
a.u
.)
0
12
24
36
13 13.5 14 14.5 15 15.5 16
Absorb
ance (m
AU
)
Time (min)
0
15
30
210 270 330 390
0
15
30
210 270 330 390
λ (nm)
Absorb
ance (
a.u
.)
λ (nm)

Chapter 4. Results and discussion
129
The concentrations of the analytes obtained after the proper dilution of the extracts are
summarized in Table 26. In this table, the total content of 3,4‐diCQA and 3,5‐diCQA is given expressed
as 3,5‐ diCQA, as indicated in section 4.3.3.2. The total amounts of chlorogenic acids found were 37.1,
39.0, and 87.5 mg per capsule or bag in samples GC‐1, GC‐2, and GC‐3, respectively. The amount of
chlorogenic acids found in this study for sample GC‐3 was slightly lower than the declared value (100
mg per capsule). The difference can be explained by the presence of other chlorogenic acids not
included in the present study observed at retention times of 13‐15 min.
Nevertheless, the value found for sample GC‐2 was much lower than the declared value (78.75
mg per capsule), which suggests that other factors (inaccurate label or sample deterioration) may be
also responsible for the discrepancy. Only a small amount of 5‐CQA was found in sample FB‐1. The
contents of chlorogenic acids in samples GC‐1 and FB‐1 were not provided by the suppliers of the
products.
Table 26. Results obtained for the real samples analyzed with the chlorogenic acids method (n=3).
Sample Found compounds Dilution
factor
Found amount
mg per unit a mg g-1
GC‐1
3‐CQA
5‐CQA
4‐CQA
3,4‐diCQA + 3,5‐diCQA
4,5‐diCQA
100
6.2 ± 0.7
12 ± 2
8.6 ± 0.2
4.1 ± 0.1
6.2 ± 0.1
5.6 ± 0.6
11 ± 1
7.8 ± 0.2
3.7 ± 0.1
5.6 ± 0.1
Total: 37.1 ± 3.1
GC‐2
3‐CQA
5‐CQA
4‐CQA
3,4‐diCQA + 3,5‐diCQA
4,5‐diCQA
300
8.4 ± 0.1
13 ± 1
9.3 ± 0.8
3.7 ± 0.2
4.6 ± 0.1
21.0 ± 0.3
33 ± 3
23 ± 2
9.3 ± 0.5
12.0 ± 3.0
Total: 39.0 ± 2.2
GC‐3
3‐CQA
5‐CQA
4‐CQA
3,4‐diCQA + 3,5‐diCQA
4,5‐diCQA
300
6.1 ± 0.4
39 ± 1
10 ± 1
16.6 ± 0.9
14 ± 1
12.2 ± 0.8
78 ± 2
20 ± 2
33 ± 2
28 ± 2
Total: 85.7 ± 4.3
FB‐1 5‐CQA 5 0.23 ± 0.01 0.46 ± 0.02
(a) capsule
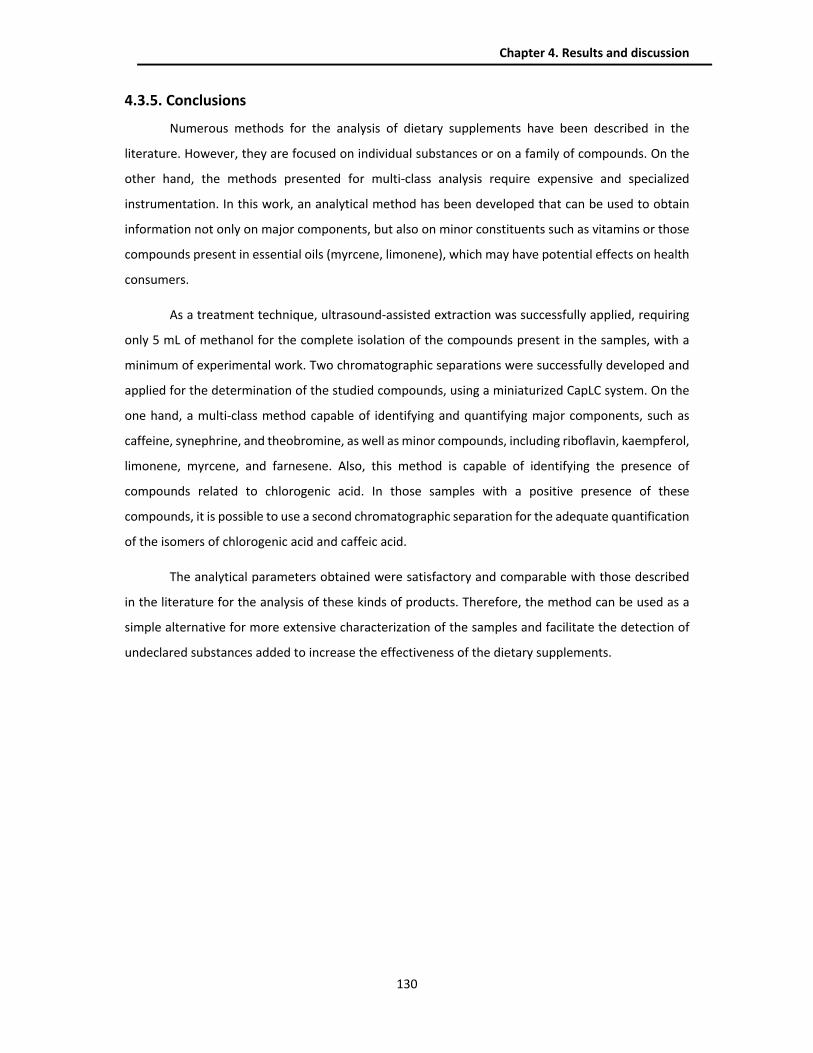
Chapter 4. Results and discussion
130
4.3.5. Conclusions
Numerous methods for the analysis of dietary supplements have been described in the
literature. However, they are focused on individual substances or on a family of compounds. On the
other hand, the methods presented for multi‐class analysis require expensive and specialized
instrumentation. In this work, an analytical method has been developed that can be used to obtain
information not only on major components, but also on minor constituents such as vitamins or those
compounds present in essential oils (myrcene, limonene), which may have potential effects on health
consumers.
As a treatment technique, ultrasound‐assisted extraction was successfully applied, requiring
only 5 mL of methanol for the complete isolation of the compounds present in the samples, with a
minimum of experimental work. Two chromatographic separations were successfully developed and
applied for the determination of the studied compounds, using a miniaturized CapLC system. On the
one hand, a multi‐class method capable of identifying and quantifying major components, such as
caffeine, synephrine, and theobromine, as well as minor compounds, including riboflavin, kaempferol,
limonene, myrcene, and farnesene. Also, this method is capable of identifying the presence of
compounds related to chlorogenic acid. In those samples with a positive presence of these
compounds, it is possible to use a second chromatographic separation for the adequate quantification
of the isomers of chlorogenic acid and caffeic acid.
The analytical parameters obtained were satisfactory and comparable with those described
in the literature for the analysis of these kinds of products. Therefore, the method can be used as a
simple alternative for more extensive characterization of the samples and facilitate the detection of
undeclared substances added to increase the effectiveness of the dietary supplements.
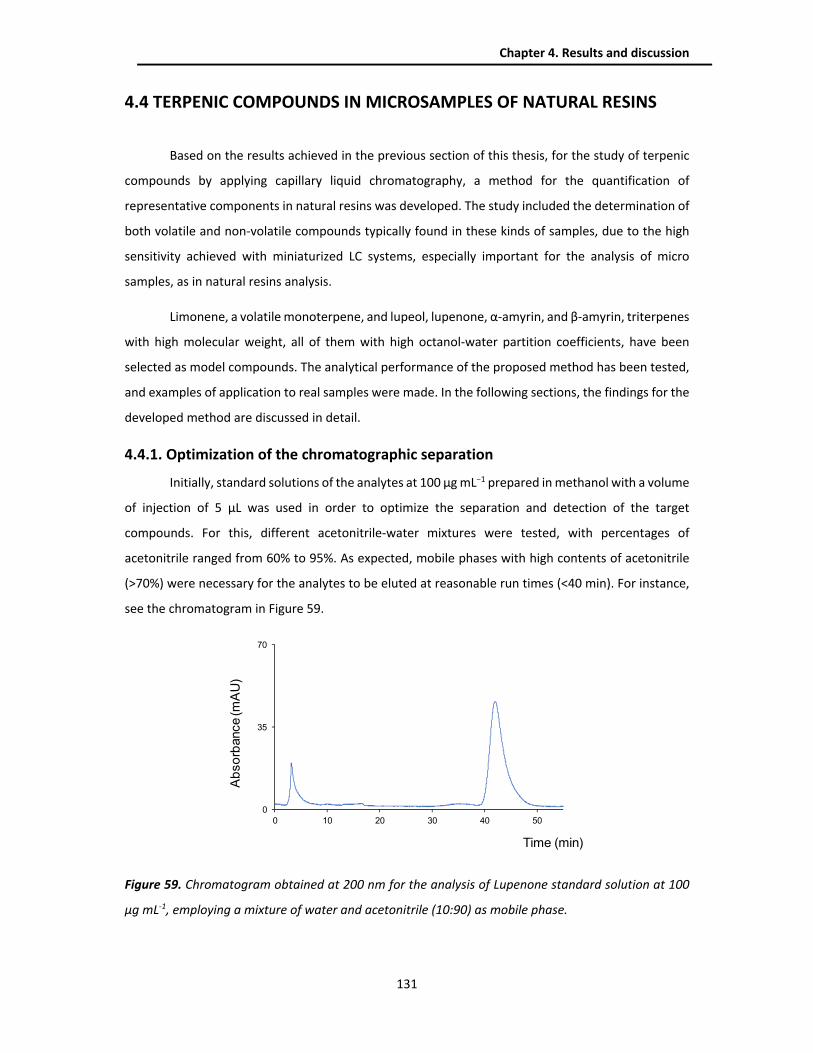
Chapter 4. Results and discussion
131
4.4 TERPENIC COMPOUNDS IN MICROSAMPLES OF NATURAL RESINS
Based on the results achieved in the previous section of this thesis, for the study of terpenic
compounds by applying capillary liquid chromatography, a method for the quantification of
representative components in natural resins was developed. The study included the determination of
both volatile and non‐volatile compounds typically found in these kinds of samples, due to the high
sensitivity achieved with miniaturized LC systems, especially important for the analysis of micro
samples, as in natural resins analysis.
Limonene, a volatile monoterpene, and lupeol, lupenone, α‐amyrin, and β‐amyrin, triterpenes
with high molecular weight, all of them with high octanol‐water partition coefficients, have been
selected as model compounds. The analytical performance of the proposed method has been tested,
and examples of application to real samples were made. In the following sections, the findings for the
developed method are discussed in detail.
4.4.1. Optimization of the chromatographic separation
Initially, standard solutions of the analytes at 100 µg mL−1 prepared in methanol with a volume
of injection of 5 µL was used in order to optimize the separation and detection of the target
compounds. For this, different acetonitrile‐water mixtures were tested, with percentages of
acetonitrile ranged from 60% to 95%. As expected, mobile phases with high contents of acetonitrile
(>70%) were necessary for the analytes to be eluted at reasonable run times (<40 min). For instance,
see the chromatogram in Figure 59.
Figure 59. Chromatogram obtained at 200 nm for the analysis of Lupenone standard solution at 100
µg mL-1, employing a mixture of water and acetonitrile (10:90) as mobile phase.
0
35
70
0 10 20 30 40 50
Ab
so
rbance (m
AU
)
Time (min)

Chapter 4. Results and discussion
132
At this point, the UV spectra of all compounds were obtained, and according to Figure 60, all
the analytes presented decreasing absorbances within the 190‐210 nm range and nearly null
absorbance at higher wavelengths. Thus, 200 nm was selected as the working wavelength.
Figure 60. UV spectra obtained for analyzed compounds.
For the following experiments, a standard solution mix of the analytes at 10 µg mL−1 was
prepared in methanol. For all the elution conditions assayed suitable separation of the analytes was
obtained except for limonene since its isolation was particularly difficult due to the presence of an
intense peak corresponding to the injection solvent (methanol). Due to its high intensity, such a peak
partially overlapped with that of limonene. An option to improve the resolution between the two
peaks could be to use a gradient elution program, but this will cause an increase in the total execution
time. For the rest of the compounds, a good resolution was obtained even with a mobile phase of
100% acetonitrile. With this eluent, the chromatographic run time was <20 min, as Figure 61 shows.
Besides the peaks of the solvent and analytes, two minor peaks were detected at 12.1 min and 15.3
min, which were identified as impurities of β‐amyrin.
0
10
20
210 300 3900
25
50
210 300 390
0
25
50
210 300 3900
25
50
210 300 390
Ab
so
rba
nc
e (
a.u
.)
λ (nm)
Ab
so
rba
nc
e (
a.u
.)
λ (nm)
Ab
so
rba
nc
e (
a.u
.)
λ (nm)
Lupenone
β-Amyrin
Lupeol
0
50
100
210 290 370
Ab
so
rba
nc
e (
a.u
.)
λ (nm)
Limonene
Ab
so
rba
nc
e (
a.u
.)
λ (nm)
α-Amyrin
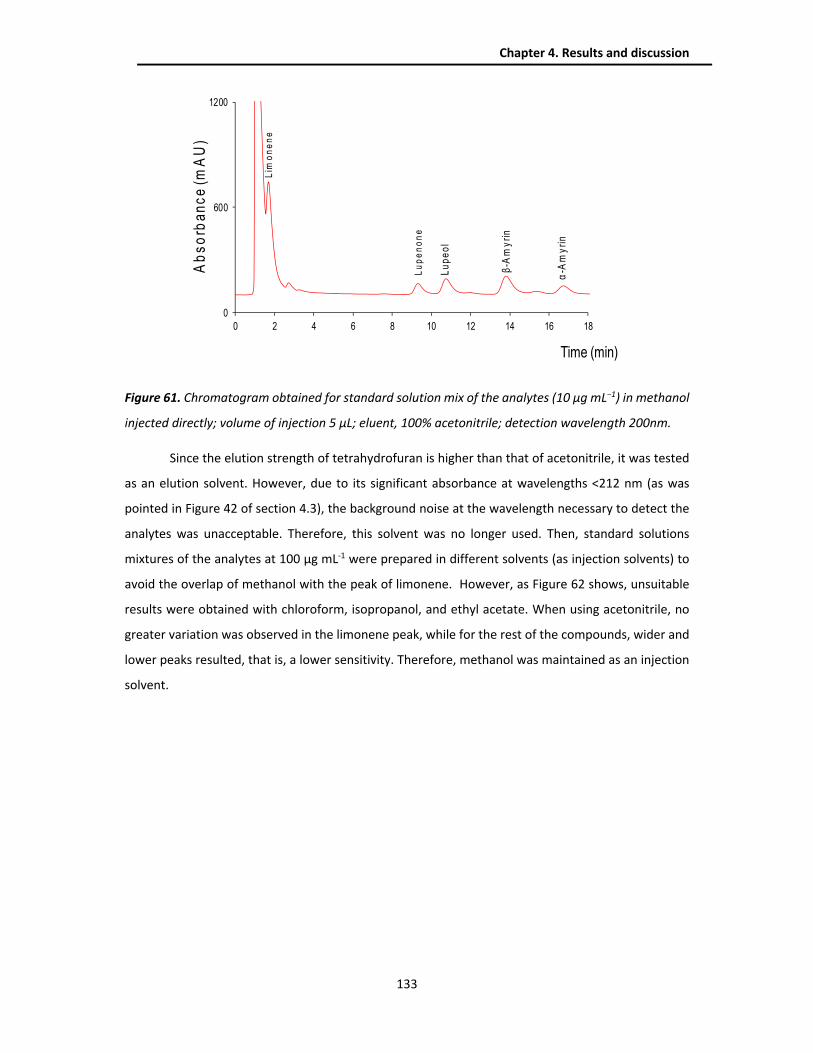
Chapter 4. Results and discussion
133
Figure 61. Chromatogram obtained for standard solution mix of the analytes (10 µg mL−1) in methanol
injected directly; volume of injection 5 µL; eluent, 100% acetonitrile; detection wavelength 200nm.
Since the elution strength of tetrahydrofuran is higher than that of acetonitrile, it was tested
as an elution solvent. However, due to its significant absorbance at wavelengths <212 nm (as was
pointed in Figure 42 of section 4.3), the background noise at the wavelength necessary to detect the
analytes was unacceptable. Therefore, this solvent was no longer used. Then, standard solutions
mixtures of the analytes at 100 µg mL‐1 were prepared in different solvents (as injection solvents) to
avoid the overlap of methanol with the peak of limonene. However, as Figure 62 shows, unsuitable
results were obtained with chloroform, isopropanol, and ethyl acetate. When using acetonitrile, no
greater variation was observed in the limonene peak, while for the rest of the compounds, wider and
lower peaks resulted, that is, a lower sensitivity. Therefore, methanol was maintained as an injection
solvent.
0
600
1200
0 2 4 6 8 10 12 14 16 18
Lu
pe
ol
α-A
my
rin
β-A
my
rin
Lim
on
en
e
Lu
pe
no
ne
Ab
so
rba
nc
e (m
AU
)
Time (min)

Chapter 4. Results and discussion
134
Figure 62. Chromatograms obtained at 200 nm for standard solution mix of the analytes (100 µg mL−1)
in: Red: methanol; Blue: acetonitrile; Green: Ethyl acetate; Purple: isopropanol; Brown: Chloroform.
Volume of injection 5 µL; eluent, 100% acetonitrile.
Another strategy to try to reduce the solvent peak and to improve the resolution of limonene
was to test different methanol‐water mixtures as a solvent. For this, standard solutions of the analytes
at 5 µg mL−1 prepared with mixtures of water‐methanol in percentages of 10, 20 and 35 were injected
(v/v). Ideally, in LC samples should be injected in an injection solvent with similar to or lower elution
strength than that of the mobile phase used to avoid peak‐shape problems [300]. However, the results
showed that the presence of water in the injected solutions caused a diminution of the peak areas of
some of the analytes, effect which was especially high for α‐amyrin, as Figure 63 shows. This behavior
suggested that at the working concentration the analytes were not completely dissolved in the
mixture of methanol‐ water, which is consistent with their high Kow values.
As an alternative, the introduction of an aliquot of water in the injection capillary loop was
tested before loading the sample, because it could prevent peak broadening at the entrance of the
chromatographic column. Variable volumes of water in the 5‐25 µL range were loaded in the injection
loop before loading 5 µL of the standard solution prepared in methanol. The resulting chromatograms
were compared with those observed for the same directly injected solution and are shown in Figure
61. As a result, the introduction of water into the injection capillary loop had a strong effect, on the
one hand, on the retention times of the analytes, and on the other hand, on the shapes of the analytes
peaks.
0
1000
2000
3000
4000
5000
0 5 10 15 20
Ab
so
rbance (m
AU
)
Time (min)

Chapter 4. Results and discussion
135
Figure 63. Analyte responses obtained for the study of the percentage of water in injection solvent.
Blue: 0% of water; Green: 10% of water; Red: 20% of water; Purple: 50% of water. Concentration of
each analyte: 5 µg mL-1; Volume of injection 5 µL; eluent, 100% acetonitrile.
As observed in Figure 64, in the chromatogram obtained after the consecutive introduction of
5 µL of nanopure water and 5 µL of the working solution all the analytes eluted about 1.5 min later.
This effect was particularly positive for the complete separation of the limonene peak from the solvent
peak. Furthermore, the presence of water had also a positive effect on the peak shapes of the other
compounds. Finally, no substantial differences in the chromatographic registers were observed when
the volume of water was increased up to 25 µL.
Figure 64. Chromatogram obtained for standard solution mix of the analytes (10 µg mL−1) in methanol
after loading 5 µL of nanopure water in the injection loop. Volume of injection 5 µL; eluent, 100%
acetonitrile; detection wavelength 200nm.
0
1200
2400
Limonene Lupenona Lupeol β-amyrin α-amyrin
Pe
ak
are
a(a
.u)
0
500
0 5 10 15 20
Lupeol
α-A
myrin
β-A
myrin
Lim
onene
Lupenone
Absorb
ance (m
AU
)
Time (min)
*Im
purity
*Im
purity
Chapter 4. Results and discussion
136
Finally, the effect of the injection volume was evaluated in the range of 5‐25 µL. Although the
absolute peak areas increased as the injection volume increased as expected, this increment also
resulted in wider peaks. Besides, the retention times of the compounds decreased, which may be due
to the increased volume of methanol entering the system. As Figure 65 shows, the increase in the
injection volume resulted in an unsuitable separation between lupeol and lupenone.
Figure 65. Chromatograms obtained for standard solution mix of the analytes (10 µg mL−1) in methanol
after loading 5 µL of nanopure water in the injection loop. Red: volume of injection 15 µL; Green:
volume of injection 5 µL. Eluent, 100% acetonitrile; detection wavelength 200nm.
Based on the above results, the successive injection into the loop of 5 µL of water and 5 µL of
the working and sample solutions was selected as the best option. For the mobile phase, as a
compromise between resolution and chromatographic run time, a mixture of acetonitrile:water 85:15
(v/v) was selected as optimum conditions.
4.4.2. Extraction optimization
Optimized chromatographic conditions were applied to the analysis of the target compounds
in three natural resins, namely white copal, copal in tears, and resin obtained from ocote trees. In the
first instance, different solubility studies with the resin samples were carried out to optimize the
solvent extraction. For this, homogenized portions between 1 and 15 mg of the three resins were
treated with 1 mL of extracting solvent. Then, the resultant solutions were vortexed for 1 minute and
finally filtered with 0.2 µm nylon membranes. Methanol, acetonitrile, ethyl acetate, isopropanol, and
chloroform were tested as extraction solvents.
According to the results presented in Figure 62 of the above section, the employment of ethyl
acetate, isopropanol, and chloroform was unsuitable. It was concluded that the use of such solvents
0
200
400
7 11 15 19
Ab
so
rbance (m
AU
)
Time (min)
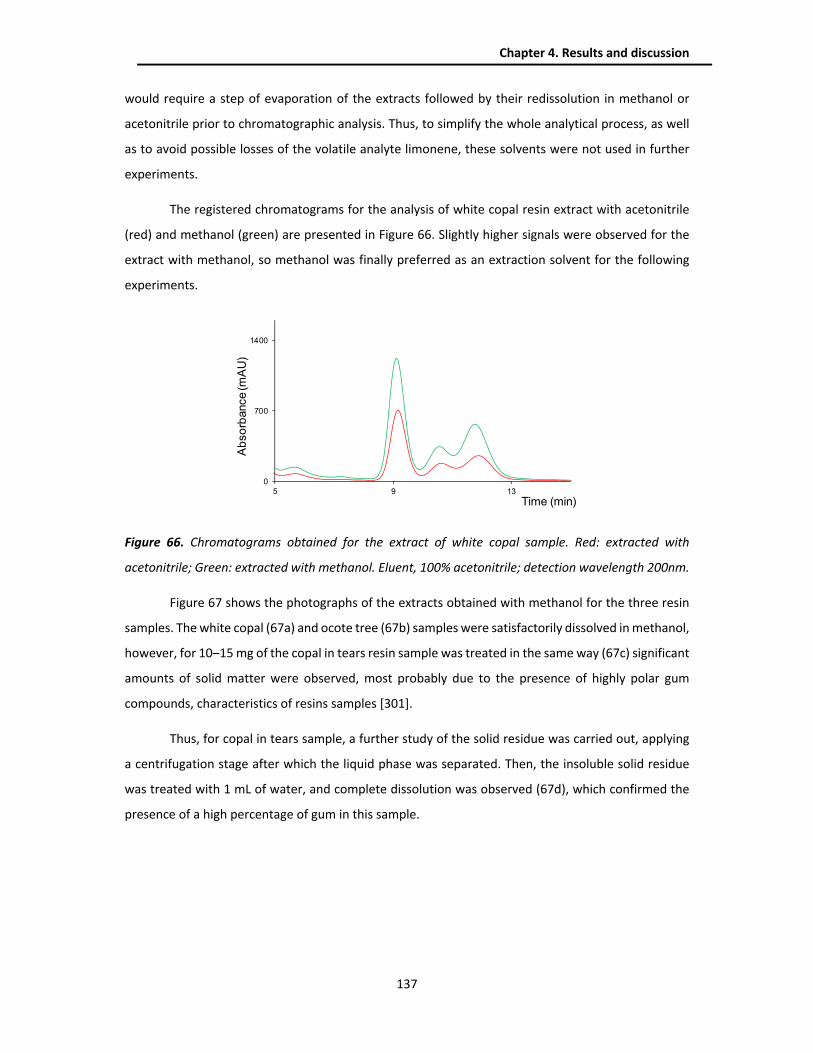
Chapter 4. Results and discussion
137
would require a step of evaporation of the extracts followed by their redissolution in methanol or
acetonitrile prior to chromatographic analysis. Thus, to simplify the whole analytical process, as well
as to avoid possible losses of the volatile analyte limonene, these solvents were not used in further
experiments.
The registered chromatograms for the analysis of white copal resin extract with acetonitrile
(red) and methanol (green) are presented in Figure 66. Slightly higher signals were observed for the
extract with methanol, so methanol was finally preferred as an extraction solvent for the following
experiments.
Figure 66. Chromatograms obtained for the extract of white copal sample. Red: extracted with
acetonitrile; Green: extracted with methanol. Eluent, 100% acetonitrile; detection wavelength 200nm.
Figure 67 shows the photographs of the extracts obtained with methanol for the three resin
samples. The white copal (67a) and ocote tree (67b) samples were satisfactorily dissolved in methanol,
however, for 10–15 mg of the copal in tears resin sample was treated in the same way (67c) significant
amounts of solid matter were observed, most probably due to the presence of highly polar gum
compounds, characteristics of resins samples [301].
Thus, for copal in tears sample, a further study of the solid residue was carried out, applying
a centrifugation stage after which the liquid phase was separated. Then, the insoluble solid residue
was treated with 1 mL of water, and complete dissolution was observed (67d), which confirmed the
presence of a high percentage of gum in this sample.
0
700
1400
5 9 13
Ab
so
rbance (m
AU
)
Time (min)

Chapter 4. Results and discussion
138
Figure 67. Photographs of the extracts obtained after adding 1 mL of methanol. a: white copal; b:
ocote; c: copal in tears; left vials in (a–c), 1 mg of homogenized samples; right vials in (a–c), 15 mg of
the homogenized samples. d: solution obtained after treating the residue insoluble in methanol of
copal in tears (10 mg) with 1 mL of water.
4.4.3. Analytical performance
The analytical performance of the proposed method was evaluated to establish its suitability
for the analysis of the natural resins [302]. Working solutions of the target compounds were prepared
in methanol at concentrations in the range 0.25‐10 µg mL−1 and then were analyzed. With the obtained
results parameters for linearity, limits of detection (LODs), limits of quantification (LOQs), accuracy,
and precision were studied.
For all tested compounds the peak areas showed a linear relationship with the concentration
within the range 0.25‐10.0 µg mL−1, with determination coefficients ranging from 0.994 to 0.997 (n
=15). For checking the accuracy, solutions of the target analytes were prepared and tested at low‐low‐
intermediate (2.5 µg mL−1) and high‐intermediate (7.5 µg mL−1) concentrations. The corresponding
calibration equations were used to establish the concentration of each compound and the relative
errors found ranged from −13% to +16%. These values were sa�sfactory according to the standards
set for these kinds of samples [303], and it was therefore concluded that the accuracy was adequate.
Table 27 shows the results obtained.

Chapter 4. Results and discussion
139
Table 27. Evaluation of the linearity and accuracy of the proposed method.
Compound
Linearity (n =15) y = ax +b Mean found concentration (n=3)
Concentration
range (µg mL-1) a ± sa b ± sb R2 2.5 µg mL −1 7.5 µg mL −1
Limonene 0.25 ‐ 10.0 433 ± 6 ‐ 77 ± 2 0.997 2.3 ±0.1 6.5 ±0.4
Lupenone 0.5 ‐ 10.0 63.9 ± 1.6 ‐ 22 ± 9 0.994 2.4 ±0.1 70. ±0.1
Lupeol 0.5 ‐ 10.0 111 ± 2 ‐ 42 ± 12 0.996 2.6 ±0.1 7.4. ±0.2
β‐Amyrin 0.5 ‐ 10.0 135 ± 3 ‐ 20 ± 17 0.995 2.3 ±0.1 7.5 ±0.6
α‐Amyrin 0.5 ‐ 10.0 313 ± 8 72 ± 42 0.994 2.9 ±0.2 8.4 ±0.1
a: intercept; sa: standard deviation of the intercept; b: slope; sb: standard deviation of the slope; R2: squared
correlation coefficient.
The precision was evaluated by calculating the relative standard deviations (RSDs) of the areas
measured for three consecutive injections (intra‐day RSD) and in three different working sessions
(inter‐day RSDs) for the same solutions used to determinate the accuracy. Intra‐ and inter‐day
precision were determined at 2.5 µg mL−1 and 7.5 µg mL−1, and although for α‐amyrin the RSDs were
slightly higher, values <8% were found for the rest of the compounds.
Although there are different options available to determinate the LODs and LOQs, in this study
these parameters were calculated as the concentrations that resulted from signal‐to‐noise ratios of 3
and 10, respectively [304]. The LODs and LOQs were obtained by injecting solutions with decreasing
concentrations of the analytes and to prevent errors coming from contaminants and/or memory
effects, before analyzing each solution, water was processed. The LODs were 0.1 µg mL−1 for limonene,
whereas for the rest of the analytes was 0.25 µg mL−1. On the other hand, the LOQs were 0.4 µg mL−1
for limonene and 0.8 µg mL−1 for the other analytes. Table 28 summarized the results obtained.
Table 28. Evaluation of the precision, LOD and LOQ of the proposed method.
Compound
Precision a, (n=3) RSD % LOD
(µg mL-1)
LOQ
(µg mL-1) Intraday Interday
2.5 µg mL −1 7.5 µg mL −1 2.5 µg mL −1 7.5 µg mL −1
Limonene 2 0.6 3 4 0.1 0.4
Lupenone 4 0.8 7 7 0.25 0.8
Lupeol 1.4 2 7 8 0.25 0.8
β‐Amyrin 3 8 8 8 0.25 0.8
α‐Amyrin 9 17 16 17 0.25 0.8
rsd: residual standard deviation.

Chapter 4. Results and discussion
140
For the study of the effect of the sample matrix in the analytical response, sample extracts
from copal in tears were fortified with known amounts of the analytes, and the recoveries were
calculated. The tested concentration was 5 µg mL−1 of each analyte. The increment on the peak areas
between the spiked and unspiked extracts was used to calculate the added concentration, using the
calibration equations of Table 27. The concentration values obtained were then compared with the
added concentrations to calculate the recoveries, and values ranging from 52% to 103% were found.
Figure 68 shows the chromatograms of the copal in tears sample with and without fortification,
besides the recovery values found for all analytes.
Figure 68. Chromatograms obtained in the matrix effect study for Copal in tears sample. Green: sample
without fortification; Purple: fortified sample with 5 µg mL−1 of the analytes. On the right, the
recoveries values found for all analytes (n=3).
According to the LOQs obtained and the recoveries values listed in Figure 68, the minimum
percentages of the analytes that could be measured were calculated for samples of 10 mg. These
values were ranged from 0.004% for limonene to 0.02% for β‐amyrin. These values were considered
low enough for most applications, making unnecessary extra pre‐concentration operations.
4.4.4. Analysis of real samples
Finally, the optimized method was applied for the quantitative analysis of the three resins
tested. For this purpose, different portions of the homogenized samples ranging from 1 to 15 mg were
analyzed under the conditions described in the previous sections. In all three natural resin samples,
the presence of the analytes was evaluated from the concordance between the retention times and
UV spectra of the suspected peaks and those observed for the standard solutions. Besides, the
presence of a compound was confirmed by fortifying the extracts with standard solutions of such
compounds.
0
100
200
300
8 12 16
Lupeol
α-A
myrin
β-A
myrin
Absorb
ance (m
AU
)
Time (min)
Compound Recovery %
Limonene 103 ±4
Lupenone 101 ±1
Lupeol 79 ±9
β-Amyrin 52 ±5
α-Amyrin 75 ±3

Chapter 4. Results and discussion
141
α‐amyrin was the only analyte found in the three resins samples analyzed, limonene was
found in the white copal and ocote resins, whereas lupeol and β‐amyrin were found only in the copal
in tears sample. As expected in these kinds of samples, in addition to the peaks of some of the
analytes, peaks of unknown compounds were observed in the samples, particularly at retention times
close to that of limonene, which means the polar fraction of the resins. However, they could be easily
differentiated from limonene through their respective UV spectra. On the other hand, the peaks of
the impurities found in the standard solutions of β‐amyrin were not identified in any sample.
To calculate the percentages of each of the analytes found in the samples, the peak areas of
the analytes were used, as well as the calibration equations of Table 27 and considering the recoveries
determined for each compound, listed in Figure 68. The final values are summarized in Table 29, and
as can be deduced from this table, the percentages of the triterpenic compounds (C=30) were <1%.
Therefore, for the quantification of these compounds, a higher amount of the sample was used (10‐
15 mg). Whit 1mg of white copal resin sample, the concentration of α‐amyrin was below its LOD, and
for ocote resin sample the concentration was between its LOD and LOQ. For this last resin, even when
processing 10 mg of the sample, the concentration of α‐amyrin in the extract was close to its LOQ.
Table 29. Percentages of the analytes found in the analyzed natural resin samples (n = 3).
Sample Percentage a (%), ( n = 3)
Limonene Lupenone Lupeol β‐Amyrin α‐Amyrin
White copal 1 mg 0.9 ± 0.2 <LOD <LOD <LOD <LOD
15 mg 1.2 ± 0.2 <LOD <LOD <LOD 0.020 ± 0.002
Copal in tears 10 mg <LOD <LOD 0.034 ± 0.001 0.069 ± 0.002 0.011 ± 0.001
Ocote 1 mg 9.3 ± 0.2 <LOD <LOD <LOD <LOQ
10 mg 9.3 ± 0.1 <LOD <LOD <LOD 0.093 ± 0.003
a: All values expressed with digits known plus the first uncertain digit.
Higher percentages of the monoterpene limonene were found in white copal and ocote
resins. In fact, for the quantification of this analyte in the ocote tree resin, the extract of the sample
had to be diluted with methanol whit a dilution factor equal to 20, to adjust the analyte concentration
to the linear working interval evaluated. Due to its relative abundance in white copal and ocote
samples ( ≥1%), the percentage of limonene could be established using both 1 mg and 10–15 mg of
the samples. The values obtained by using different amounts of the samples were then compared
statistically [305].
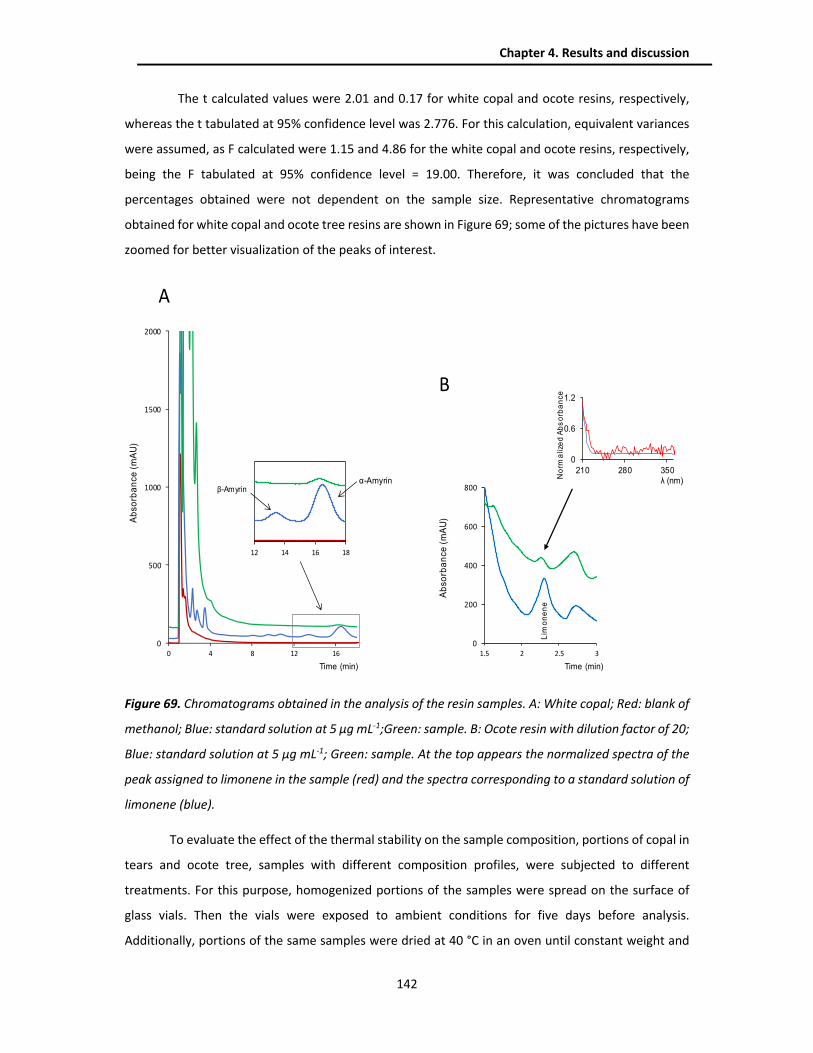
Chapter 4. Results and discussion
142
The t calculated values were 2.01 and 0.17 for white copal and ocote resins, respectively,
whereas the t tabulated at 95% confidence level was 2.776. For this calculation, equivalent variances
were assumed, as F calculated were 1.15 and 4.86 for the white copal and ocote resins, respectively,
being the F tabulated at 95% confidence level = 19.00. Therefore, it was concluded that the
percentages obtained were not dependent on the sample size. Representative chromatograms
obtained for white copal and ocote tree resins are shown in Figure 69; some of the pictures have been
zoomed for better visualization of the peaks of interest.
Figure 69. Chromatograms obtained in the analysis of the resin samples. A: White copal; Red: blank of
methanol; Blue: standard solution at 5 µg mL-1;Green: sample. B: Ocote resin with dilution factor of 20;
Blue: standard solution at 5 µg mL-1; Green: sample. At the top appears the normalized spectra of the
peak assigned to limonene in the sample (red) and the spectra corresponding to a standard solution of
limonene (blue).
To evaluate the effect of the thermal stability on the sample composition, portions of copal in
tears and ocote tree, samples with different composition profiles, were subjected to different
treatments. For this purpose, homogenized portions of the samples were spread on the surface of
glass vials. Then the vials were exposed to ambient conditions for five days before analysis.
Additionally, portions of the same samples were dried at 40 °C in an oven until constant weight and
0
500
1000
1500
2000
0 4 8 12 16
Ab
so
rba
nce
(mA
U)
Time (min)
A
12 14 16 18
α-Amyrinβ-Amyrin
Time (min)
0
200
400
600
800
1.5 2 2.5 3
B
Ab
sorb
an
ce
(mA
U)
0
0.6
1.2
210 280 350λ (nm)N
orm
alize
d A
bs
orb
an
ce
Lim
on
en
e
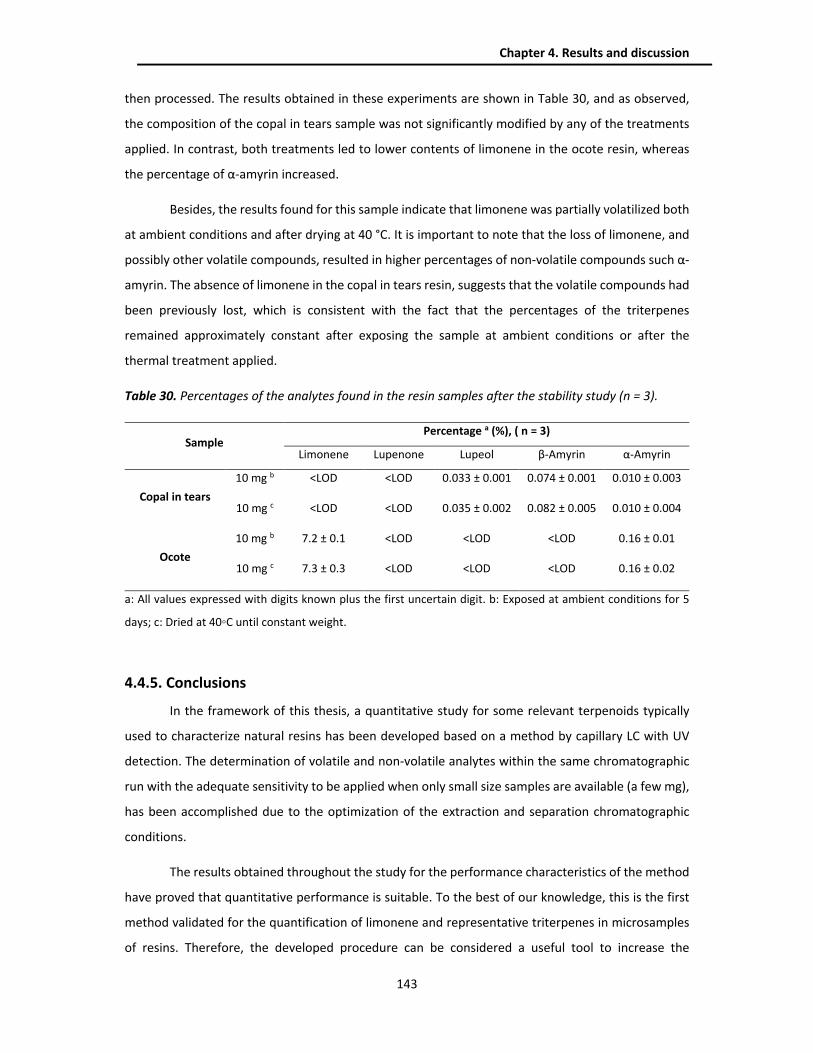
Chapter 4. Results and discussion
143
then processed. The results obtained in these experiments are shown in Table 30, and as observed,
the composition of the copal in tears sample was not significantly modified by any of the treatments
applied. In contrast, both treatments led to lower contents of limonene in the ocote resin, whereas
the percentage of α‐amyrin increased.
Besides, the results found for this sample indicate that limonene was partially volatilized both
at ambient conditions and after drying at 40 °C. It is important to note that the loss of limonene, and
possibly other volatile compounds, resulted in higher percentages of non‐volatile compounds such α‐
amyrin. The absence of limonene in the copal in tears resin, suggests that the volatile compounds had
been previously lost, which is consistent with the fact that the percentages of the triterpenes
remained approximately constant after exposing the sample at ambient conditions or after the
thermal treatment applied.
Table 30. Percentages of the analytes found in the resin samples after the stability study (n = 3).
Sample Percentage a (%), ( n = 3)
Limonene Lupenone Lupeol β‐Amyrin α‐Amyrin
Copal in tears
10 mg b <LOD <LOD 0.033 ± 0.001 0.074 ± 0.001 0.010 ± 0.003
10 mg c <LOD <LOD 0.035 ± 0.002 0.082 ± 0.005 0.010 ± 0.004
Ocote
10 mg b 7.2 ± 0.1 <LOD <LOD <LOD 0.16 ± 0.01
10 mg c 7.3 ± 0.3 <LOD <LOD <LOD 0.16 ± 0.02
a: All values expressed with digits known plus the first uncertain digit. b: Exposed at ambient conditions for 5
days; c: Dried at 40◦C until constant weight.
4.4.5. Conclusions
In the framework of this thesis, a quantitative study for some relevant terpenoids typically
used to characterize natural resins has been developed based on a method by capillary LC with UV
detection. The determination of volatile and non‐volatile analytes within the same chromatographic
run with the adequate sensitivity to be applied when only small size samples are available (a few mg),
has been accomplished due to the optimization of the extraction and separation chromatographic
conditions.
The results obtained throughout the study for the performance characteristics of the method
have proved that quantitative performance is suitable. To the best of our knowledge, this is the first
method validated for the quantification of limonene and representative triterpenes in microsamples
of resins. Therefore, the developed procedure can be considered a useful tool to increase the

Chapter 4. Results and discussion
144
knowledge about the chemical composition of natural resins, as most existing methods so far are
limited to obtaining their chemical fingerprints. Furthermore, it is important to note that, for
classification purposes, the quantitative composition of these kinds of samples can be used to obtain
information about the history (age and ambient conditions) of samples of similar origin.

CHAPTER 5. GENERAL CONCLUSIONS

Chapter 5. General conclusions
146
New knowledge was attained about miniaturized and portable liquid chromatography,
following the current trends of green analytical chemistry, and also its coupling to in‐tube solid‐phase
microextraction, as a sustainable sample treatment technique, for the analysis of different kinds of
matrices, including biological samples, environmental waters, dietary supplements, and natural resins.
The study of the ability and characterization of commercial and synthesized extractive phases
for in‐tube solid phase microextraction for the determination of highly polar compounds in serum,
urine, and oral fluid samples were carried out. A pioneer study with a portable NanoLC for the
determination on‐site of trimethylxanthines in environmental waters evaluating different strategies
for sample treatment was made. The high‐resolution power, sensitivity, and the viability to use a small
sample volume attainable with Capillary LC system were demonstrated from the analysis of natural
resins and dietary supplements for quantification of a wide number of compounds of very different
physic‐chemical properties.
Good results were achieved by the use of FFAP (100% nitroterephthalic modified polyethylene
glycol) as the extractive phase in In‐tube solid‐phase microextraction (IT‐SPME) coupled on‐line to
capillary liquid chromatography with diode array detection for the analysis of caffeine and its three
primary metabolites (theobromine, paraxanthine, and theophylline) in micro samples of serum, oral
fluid, and urine samples. With the optimized procedure, the sample amount required for one analysis
was only 2.5 µL of oral fluid, 6.25 µL of serum or 40 µL of urine, which is of special ability for its
implementation in a hospital laboratory for preterm newborns. Analytical performance of the
proposed method was similar to those proposed by other methodologies but using lower sample
volume and a faster and simpler sample treatment and analysis. Finally, paired samples of serum and
oral fluid from preterm newborns treated with caffeine were analyzed by the method, with statistically
equivalent results for caffeine concentrations.
For the analysis of environmental waters, two methods were proposed, for one hand, a fast
lab method based on IT‐SPME coupled online with a capillary liquid chromatograph (CapLC) with diode
array detection (DAD), and on the other hand, using a portable nano liquid chromatograph (NanoLC)
with UV detection at 255 nm for in‐place analysis. The analytical performance of both procedures for
the determination of trimethylxanthines as target analytes was done. Different strategies for sample
treatment technique was applied, included IT‐SPME online and off‐line, and, solid‐phase extraction
for improving instrumental parameters, related to detection capacity and selectivity. IT‐SPME or
SPE/portable NanoLC based methods were superior in terms of chromatographic resolution and
organic solvent consumption per sample, around 200 µL vs 10 mL for IT‐SPME‐CapLC‐DAD, instead,
Chapter 5. General conclusions
147
the lab method provided better LOD. Finally, both systems were tested for the analysis of real water
samples with suitable results.
The characterization of botanical dietary supplements by capillary liquid chromatography with
UV‐diode array detection (DAD) was achieved by the optimization of separation and quantification
conditions in order to analyze not only the major constituents such as caffeine, chlorogenic acids, and
synephrine, but also trace compounds as theobromine, riboflavin, limonene, α‐pinene, farnesene,
myrcene, linalool, and kaempferol. The proposed procedure was used for the analysis of different
types of products, including green coffee extract‐based supplements, fat burning formulations, and
herbal preparations; managing to estimate the effectiveness and safety of these products with a
stimulant, antioxidant, and slimming effects, through the consideration of the contents of major
compounds, whereas minor compounds can be used to evaluate the sensory characteristics of the
samples.
Despite the difficulties involved in the analysis of natural products such as vegetal resins, a
method was developed for the separation and quantification of terpenic compounds typically used as
markers in the chemical characterization of these kinds of samples, based on capillary liquid
chromatography with UV detection. Notwithstanding the analyzed compounds have different
polarities and volatilities, a simple sample treatment procedure, an adequate separation, and
remarkable detectability were achieved in a single chromatographic run for micro samples of three
resins namely, white copal, copal in tears, and ocote tree resin. According to the state of the art in the
analysis of this kind of samples, the proposed method can be considered complementary to existing
protocols aimed at establishing the chemical fingerprint, as a useful tool to increase the knowledge
about the chemical composition of natural resins.

BIBLIOGRAPHY

Bibliography
149
[1] Gałuszka, A., Migaszewski, Z. and Namieśnik, J. (2013). The 12 principles of green analytical
chemistry and the significance mnemonic of green analytical practices. Trac‐Trends Anal. Chem., 50,
78‐84.
[2] Nogueira, J.M.F. (2015). Stir‐bar sorptive extraction: 15 years making sample preparation more
environment‐friendly. Trac‐Trends Anal. Chem., 71, 214‐223.
[3] Madej, K. and Piekoszewski, W. (2019). Review Modern Approaches to Preparation of Body Fluids
for Determination of Bioactive Compounds. Separations, 6, 53.
[4] Silva Burato, J.S., Vargas Medina, D.A. Toffoli, A.L., Soares Maciel, E.V. and Lanças, F.M. (2020).
Recent advances and t rends in miniaturized sample preparation techniques. J Sep Sci., 43, 202–225.
[5] Cerutti, S., Pacheco, P.H, Gil, R. and Martinez, L.D. (2019). Green sample preparation strategies for
organic / inorganic compounds in environmental samples. Curr. Opin. Green Sustain. Chem., 19, 76‐
86.
[6] Arthur, C.L. and Pawliszyn, J. (1990). Solid‐phase microextraction with thermal desorption using
fused silica fibers. Anal. Chem., 62, 2145‐2148.
[7] Eisert, R. and Pawliszyn, J. (1997). Automated in‐tube solid‐phase microextraction coupled to high‐
performance liquid chromatography. Anal. Chem., 69, 3140‐3147.
[8] Campíns‐Falcó, P., Verdú‐Andrés, J., Sevillano‐Cabeza, A., Herráez‐Hernández, R., Molins‐Legua,
C. and Moliner‐Martínez, Y. (2010). In‐tube solid‐phase microextraction coupled by in valve mode to
capillary LC‐DAD: improving detectability to multiresidue organic pollutants analysis in several whole
waters. J. Cromatogr. A, 1227, 2695–2702.
[9] Moliner‐Martínez, Y., Herráez‐Hernández, R., Verdú‐Andrés, J., Molins‐Legua, C. and Campíns‐
Falcó, P. (2015). Recent advances of in‐tube solid‐phase microextraction. Trac‐Trends Anal. Chem.,
71, 205‐213.
[10] Liu, H.H. and Dasgupta, P.K. (1996). Analytical chemistry in a drop. Solvent extraction in a
microdrop. Anal. Chem., 68, 1817–1821.
[11] Rezaee, M.; Assadi, Y.; Milani, H.; Aghaee, E.; Ahmadi, F. and Berijani, S. (2006). Determination
of organic compounds in water using dispersive liquid‐liquid microextraction. J. Chromatogr. A, 1116,
1–9.
[12] Pedersen‐Bjergaard, S. and Rasmussen, K.E. (1999). Liquid‐liquid‐liquid microextraction for
sample preparation of biological fluids prior to capillary electrophoresis. Anal. Chem., 71, 2650–2656.

Bibliography
150
[13] Lord, H. and Pawliszyn, J. Evolution of solid‐phase microextraction technology. (2000). J.
Chromatogr. A, 885, 153–193.
[14] Abdel‐Rehim, M. (2004). New trend in sample preparation: On‐line microextraction in packed
syringe for liquid and gas chromatography applications I. Determination of local anaesthetics in
human plasma samples using gas chromatography–mass spectrometry. J. Chromatogr. B, 801, 317–
321.
[15] Brewer, W.E. (2003). Disposable Pipette Extraction. U.S. Patent 6,566,145 B2.
[16] Baltussen, E.; Sandra, P.; David, F. and Cramers, C. (1999). Stir bar sorptive extraction (SBSE), a
novel extraction technique for aqueous samples: Theory and principles. J. Microcolumn. Sep., 11,
737–747.
[17] Masiá, A., Moliner‐Martinez, Y., Munoz‐Ortuño, M., Pico, Y. and Campíns‐Falcó, P. (2013).
Multiresidue analysis of organic pollutants by in‐tube solid phase microextraction coupled to ultra‐
high performance liquid chromatography–electrospray‐tandem mass spectrometry. J. Chromatogr.
A, 1306 1‐11.
[18] Spietelun, A., Marcinkowski, L., De la Guardia, M., and Namiesnik, J. (2013). Review: Recent
developments and future trends in solid phase microextraction techniques towards green analytical
chemistry. J. Cromatogr. A, 1321, 1‐13.
[19] Serra‐Mora, P., Moliner‐Martinez, Y., Molins‐Legua, C., Herráez‐Hernández, R., Verdú‐Andrés, J.
and Campíns‐Falcó, P., In: Ibanez, E., Cifuentes, A., editors. Wilson and Wilson´s Comprehensive
Analytical Chemistry. Barceló, D., editor. Green Extraction Techniques: Principles, Advances and
Applications, vol. 76. Amsterdam: Elsevier; 2017.p. 427‐461.
[20] Cháfer‐Pericás, C., Campíns‐Falcó, P. and Prieto‐Blanco, M.C. (2008). Automatic in tube SPME
and fast liquid chromatography: A cost‐effective method for the estimation of dibuthyl and di‐2‐
ethylhexyl phthalates in environmental water samples. Anal. Chem. Acta, 610, 268‐273.
[21] Inukai, T., Kaji, S., and Kataoka, H. (2018). Analysis of nicotine and cotinine in hair by on‐line in‐
tube solid‐phase microextraction coupled with liquid chromatography‐tandem mass spectrometry as
biomarkers of exposure to tobacco smokeJ. Pharmaceut. Biomed. Anal., 156, 272‐277.
[22] Shamsayei, M., Yamini, Y. and Asiabi, H. (2018). Evaluation of highly efficient on‐line yarn‐in‐tube
solid phase extraction method for ultra‐trace determination of chlorophenols in honey samples. J.
Cromatogr. A, 1569, 70‐78.
Bibliography
151
[23] González‐Fuenzalida, R.A., López‐García, E., Moliner‐Martínez, Y. and Campíns‐Falcó, P. (2016).
Adsorbent phases with nanomaterials for in‐tube solid‐phase microextraction coupled on‐line to
liquid nanochromatography. J. Chromatogr. A, 1432, 17‐25.
[24] Aghaziarati, M., Yamini, Y. and Shamsayei, M. (2020). An electrodeposited terephthalic acid‐
layered double hydroxide (Cu‐Cr) nanosheet coating for in‐tube solid‐phase microextraction of
phthalate esters. Microchim Acta, 187:118
[25] Luo, X., Li, G. and Hu, Y. (2017). In‐tube solid‐phase microextraction based on NH2‐MIL‐53(Al)‐
polymer monolithic column for online coupling with high‐performance liquid chromatography for
directly sensitive analysis of estrogens in human urine. Talanta, 167, 377‐383.
[26] Moliner‐Martínez, Serra‐Mora, P, Verdú‐Andrés, J., Molins‐Legua, C., HerráezHernández, R. and
Campíns‐Falcó, P. (2017). Application of nanomaterials in solid and liquid microextraction. En M.
Valcárcel, S. Cárdenas y R. Lucena (ed), Analytical microextraction techniques (pp 135‐166), Sharjah,
Emiratos Árabes Unidos: Bentham Science Publishers.
[27] Campíns‐Falcó, P., Herráez‐Hernández, R. and Serra‐Mora, P. (2018). Liquid chromatography‐
instrumentation. En P. Worsfold, A. Townshend y C. Poole (ed), Encyclopedia of Analytical Science
2nd edition (pp 205‐213), Ámsterdam, Holanda: Elsevier.
[28] Xia, Z., Gan, T., Chen, H., Lv, R., Wei, W. and Yang, F. (2010). A new open tubular capillary
microextraction and sweeping for the analysis of super low concentration of hydrophobic
compounds. J. Sep. Sci., 33, 3221‐3230.
[29] Zhenga, M.M., Lin, B. and Feng, Y. (2007). Hybrid organic–inorganic octyl monolithic column for
in‐tube solid‐phase microextraction coupled to capillary high‐performance liquid chromatography. J.
Chromatogr. A, 1164, 48‐55.
[30] Asiabi, H., Yamini, Y., Seidi, S., Shamsayei, M., Safari, M and Rezaei, F. (2016). On‐line
electrochemically controlled in‐tube solid phase microextraction of inorganic selenium followed by
hydride generation atomic absorption spectrometry. Anal. Chim. Acta., 922, 37‐47.
[31] Pla‐Tolós, J., Serra‐Mora, P., Hakobyan, L., Molins‐Legua, C., Moliner‐Martinez, Y. and Campins‐
Falcó, P. (2016). A sustainable on‐line CapLC method for quantifying antifouling agents like irgarol‐
1051 and diuron in water samples: Estimation of the carbon footprint, Sci. Total Environ., 569‐570,
611‐618.

Bibliography
152
[32] Fernandez‐Amado, M., Prieto‐Blanco, M.C., Lopez‐Mahía, P., Muniategui‐Lorenzo, S. and Prada‐
Rodríguez, D. (2016). A novel and cost‐effective method for the determination of fifteen polycyclic
aromatic hydrocarbons in low volume rainwater samples, Talanta, 155, 175–184.
[33] H. Kataoka, H., Mizuno, K., Oda, E. and Saito, A. (2016). Determination of the oxidative stress
biomarker urinary 8‐hydroxy‐2´‐deoxyguanosine by automated on‐line in‐tube solid‐phase
microextraction coupled with liquid chromatography–tandem mass spectrometry, J. Chromatogr. B,
1019, 140‐146.
[34] Campins‐Falcó, P., Herráez‐Hernández, R., Verdú‐Andrés, J. and Cháfer‐Péricas, C. (2009). On‐
line determination of aliphatic amines in water using in‐tube solid‐phase microextraction‐assisted
derivatisation in in‐valve mode for processing large simple volumes in LC. Anal. Bioanal. Chem., 394,
557–565.
[35] Jornet‐Martínez, N., Bocanegra‐Rodríguez, S., González‐Fuenzalida, R.A., Molins‐Legua, C. and
Campíns‐Falcó, P. (2019). In: Grumezescu AM, Holban AM, editors. Processing and Sustainability of
Beverages, vol 2 chapter 9. Amsterdam : Elsevier; p. 275–317.
[36] Argente‐García, A., Hakobyan, L., Guillem, C. and Campíns‐Falcó, P. (2019) Estimating
diphenylamine in gunshot residues from a new tool for identifying both inorganic and organic
residues in the same sample. Separations, 6, 16.
[37] Argente‐García, A., Moliner‐Martínez, Y., López‐García, E., Campíns‐Falcó, P. and Herráez‐
Hernández, R. (2016). Application of carbon nanotubes modified coatings for the determination of
amphetamines by in‐tube solid‐phase microextraction and capillary liquid chromatography.
Separations, 3, 7.
[38] Moliner‐Martínez, Y., Molins‐Legua, C., Verdú‐Andrés, J., Herráez‐Hernández, R. and Campíns‐
Falcó, P. (2011). Advantages of monolithic over particulate columns for multiresidue analysis of
organic pollutants by in‐tube solid‐phase microextraction coupled to capillary liquid chromatography.
J. Chromatogr. A, 1218, 6256‐6262.
[39] Hakobyan, L., Pla‐Tolos, J., Moliner‐Martínez, Y., Molins‐Legua, C., Ruíz‐Ramon, J., Gordon, M.,
Ramírez‐Gallymore, P. and Campíns‐Falcó, P. (2018). Determination of meropenem in endotracheal
tubes by in‐tube solid phase microextraction coupled to capillary liquid chromatography with diode
array detection. J. Pharmaceut. Biomed. Anal., 151, 170‐177.
Bibliography
153
[40] Prieto‐Blanco, M.C., Argente‐García, A. and Campíns‐Falcó, P. (2016). A capillary liquid
chromatography method for banzalkonium chloride determination as a component or contaminant
in mixtures of biocides. J. Chromatogr. A, 1431, 176‐183.
[41] Serra‐Mora, P., Jornet‐Martinez, N., Moliner‐Martinez, Y. and Campíns‐Falcó, P. (2017). In tube‐
solid phase microextraction‐nano liquid chromatography: Application to the determination of intact
and degraded polar triazines in waters and recovered struvite. J. Chromgr. A, 1513, 51‐8.
[42] Dittrich, P. S. and Manz, A. (2006). Lab‐on‐a‐chip: microfluidics in drug discovery. Nature Reviews
Drug Discovery, 5, 210–218.
[43] Vitta, Y., Moliner‐Martínez, Y., Campíns‐Falcó, P. and Fernández‐Cuervo, A. (2010). An in‐tube
SPME device for the selective determination of chlorophyll a in aquatic systems. Talanta, 82, 952‐956.
[44] Moliner‐Martinez, Y., Herraez‐Hernández, R., Molins‐Legua, C. and Campins Falcó, P. (2010).
Improving analysis of apolar organic compounds by the use of a capillary titania‐based column:
application to the direct determination of faecal sterols cholesterol and coprostanol in wastewater
samples. J. Chromatogr. A, 1217, 4682‐4687.
[45] Prieto‐Blanco, M.C., Moliner‐Martínez, Y. and Campís‐Falcó, P. (2013). Combining
poly(dimethyldiphenylsiloxane) and nitrile phases for improving the separation and quantitation of
benzalkonium chloride homologues: in tube solid phase microextraction capillary liquid
chromatography‐diode array detection‐mass spectrometry for analyzing industrial samples. J.
Chromatogr. A, 1297, 226‐230.
[46] Kumazawa, T., Saeki, K., Yanagisawa, I., Uchigasaki, S., Hasegawa, C., Seno, H., Suzuki, O. and
Sato, K. (2009). Automated on‐line in‐tube solid‐phase microextraction coupled with HPLC/MS/MS
for the determination of butyrophenone derivatives in human plasma. Anal. Bioanal. Chem. 394,
1161‐1170.
[47] Silva, B.J.G., Lanças, F.M. and Queiroz, M.E.C. (2008). In‐tube solid‐phase microextraction
coupled to liquid chromatography (in‐tube SPME/LC) analysis of nontricyclic antidepressants in
human plasma. J. Chromatogr. B, 862, 181‐188.
[48] Kataoka, H., Itano, M., Ishizaki, A. and Saito, K. (2009). Determination of nicotine, cotinine, and
related alkaloids in human urine and saliva by automated in‐tube solid‐phase microextraction
coupled with liquid chromatography‐mass spectrometry. J. Chromatogr. A, 1216, 3746‐3750.
[49] Aufartová, J., Torres‐Padron, M.E., Sosa‐Ferrera, Z., Nováková, L., Solich, P. and Santana‐
Rodríguez, J.J. (2014). Development of a novel in‐tube solid phase microextraction based on micellar
Bibliography
154
desorption followed by LC‐DAD‐FD for the determination of some endocrine disruptor compounds in
environmental liquid samples, J. Liq. Chromatogr. Relat. Technol. 37, 1654‐1672.
[50] Saito, K., Ikeuchi, R. and Kataoka, H. (2012). Determination of ochratoxins in nuts and grain
samples by in‐tube solid‐phase microextraction coupled with liquid chromatographyemass
spectrometry, J. Chromatogr. A,1220, 1‐6.
[51] Yasuhara, R., Ehara, K., Saito, K. and Kataoka, H. (2012). Automated analysis of salivary stress‐
related steroid hormones by online in‐tube solid‐phase microextraction coupled with liquid
chromatography‐tandem mass spectrometry, Anal. Methods 4, 3625‐3630.
[52] Kataoka, H., Shiba, H. and Saito, K. (2012). Automated analysis of oseltamivir and oseltamivir
carboxylate in environmental waters by online in‐tube solid‐phase microextraction coupled with
liquid chromatography‐tandem mass spectrometry, Anal. Methods, 4, 1513‐1518.
[53] Munoz‐Ortuño, M., Argente‐García, A., Moliner‐Martínez, Y., Verdú‐Andrés, J., Herráez‐
Hernández, R., Picher, M.T. and Campíns‐Falcó, P. (2014). A cost‐effective method for estimating di(2‐
ethylhexyl)phthalate in coastal sediments, J. Chromatogr. A, 1324, 57‐62.
[54] Munoz‐Ortuño, M., Moliner‐Martínez, Y., Cogollos‐Costa, S., Herráez‐Hernández, R. and
Campíns‐Falcó, P. (2012). A miniaturized method for estimating di(2‐ethylhexyl) phthalate in bivalves
as bioindicators, J. Chromatogr. A, 1260, 169‐173.
[55] Prieto‐Blanco, M.C., Lopez‐Mahía, P. and Campíns‐Falcó, P. (2009). In‐tube solid‐phase
microextraction and liquid chromatography using a monolithic column for the selective
determination of residual ethylenediamine in industrial cationic polymers, Anal. Chem. 81, 5827‐
5832.
[56] Saito, K., Yagi, K., Ishizaki, A. and Kataoka, H. (2010). Determination of anabolic steroids in human
urine by automated in‐tube solid‐phase microextraction coupled with liquid chromatography mass
spectrometry, J. Pharm. Biomed. Anal. 52, 727‐733.
[57] Kataoka, H., Inoue, T., Ikekita, N. and Saito, K. (2014). Development of exposure assessment
method based on the analysis of urinary heterocyclic amines as biomarkers by on‐line in‐tube solid‐
phase microextraction coupled with liquid chromatographyetandem mass spectrometry, Anal.
Bioanal. Chem. 406,2171‐2178.
[58] Kataoka, H., Itano, M., Ishizaki, A. and Saito, K. (2009). Determination of patulin in fruit juice and
dried fruit samples by in‐tube solid‐phase microextraction coupled with liquid chromatography‐mass
spectrometry, J. Chromatogr. A, 1216, 3746‐3750.

Bibliography
155
[59] Saito, K., Uemura, E., Ishizaki, A. and Kataoka, H. (2010). Determination of perfluorooctanoic acid
and perfluorooctane sulfonate by automated in‐tube solid‐phase microextraction coupled with liquid
chromatography‐mass spectrometry, Anal. Chim. Acta 658, 141‐146.
[60] Ahmadi, M., Elmongy, H., Madrakian, T. and Abdel‐Rehim, M. (2017). Nanomaterials as sorbents
for sample preparation in bionalysis: A review. Anal. Chim. Acta, 958, 1‐21.
[61] González‐Fuenzalida, R.A., Jornet‐Martínez, N., Herráez‐Hernández, R. and Campíns‐Falcó, P.
(2019). Nanomaterials for sample preparation in LC‐MS bioanalysis. En L. Wenkui, J. Wenying y F.
Yunlin (ed), Sample preparation in LC‐MS bioanalysis (pp 128‐138), Hoboken, N.J., EE.UU.: John Wiley
& Sons.
[62] Manoudis, P.N., Tsakalof, A., Karapanagiotis, I., Zuburtikudis, I. and Panayiotou, C. (2009).
Fabrication of super‐hydrobobic surfaces for enhanced stone protection. Surf. Coat. Technol., 203,
1322‐1328.
[63] Castillo‐García, M.L., Aguilar‐Caballos, M.P. and Gómez‐Hens, A. (2016). Nanomaterials as tools
in chromatographic methods. Trac‐Trends Anal. Chem., 82, 385‐393.
[64] Azzaouz, A., Kailasa, S.A., Lee, S.S., Rascón, A.J., Ballesteros, E., Zhang, M. and Kim, K.H. (2018).
Review of nanomaterials as sorbent in solid‐phase extraction for environmental samples. Trac‐Trends
Anal. Chem., 108, 347‐369.
[65] Xu, J., Wu, P., Ye, E.C., Yuan, B.F. and Feng, I.Q. (2016). Metal oxides in sample pretreatment.
Trac‐Trends Anal. Chem., 80, 41‐56.
[66] Serra‐Mora, P., Herráez‐Hernández, R. and Campíns‐Falco, P. (2020). Minimizing the impact of
sample preparation on analytical results: In‐tube solid‐phase microextraction coupled on‐line to
nano‐liquid chromatography for the monitoring of tribenuron methyl in environmental waters. Sci.
Tot. Environ., 721, 137732.
[67] Serra‐Mora, P., Herráez‐Hernández, R. and Campíns‐Falco, P. (2020). Bimodal copper oxide
nanoparticles doped phase for the extraction of highly polar compounds by in‐tube solid‐phase
microextraction coupled on‐line to nano‐liquid chromatography. J. Chromatogr. A, In press.
[68] Li, K., Zhao, S., Zhang, D., Peng, M., Wang, Y., Gou, G. and Wang, X. (2019) In‐tube solid‐phase
microextraction capillary column packed with mesoporous TiO2 nanoparticles for phosphopeptide
analysis. Electrophoresis, 40, 1‐7.
[69] Moliner‐Martínez, Y., Prima‐García, H., Ribera, A., Coronado, E. and Campíns‐Falcó, P. (2012).
Magnetic in‐tube solid‐phase microextraction. Anal. Chem., 84, 7233‐7240.

Bibliography
156
[70] González‐Fuenzalida, R.A., Moliner‐Martínez Y., Prima‐García, H., Ribera, A., Campíns‐Falcó, P.
and Zaragozá, R. (2014). Evaluation of superparamagnetic silica nanoparticles for extraction of
triazines in magnetic in‐tube solid phase microextraction coupled to capillary liquid chromatography.
Nanomaterials, 4, 242‐255.
[71] Mei, M., Huang, X. and Chen, L. (2019). Recent development and applications of poly (ionic
liquid)s in microextraction techniques. Trac‐Trends Anal. Chem., 112, 123‐134.
[72] Masini, J.C. y Svec, F. (2017) Porous monoliths for on‐line sample preparation: A review. Anal.
Chim. Acta, 964, 24‐44.
[73] Feng, J., Wang, X., Tian, Y., Luo, C. and Sun, M. (2017). Poly(ionic‐liquids)‐coated stainless‐steel
wires packed into a polyether ketone tube for in‐tube solid‐phase microextraction. J. Sep. Sci., 40,
4773‐4779.
[74] Wang, R., Li, W. and Chen, Z. (2018). Solid phase microextraction with poly(deep eutectic solvent)
monolithic column online coupled to HPLC for determination of non‐steroidal anti‐inflammatory
drugs. Anal. Chim. Acta., 1018: 111‐118.
[75] Beloti, L.G.M., Miranda, L.F.C. and Queiroz, M.E.C. (2019). Butyl Methacrylate‐Co‐Ethylene Glycol
Dimethacrylate Monolith for Online in‐Tube SPME‐UHPLC‐MS/MS to Determine Chlopromazine,
Clozapine, Quetiapine, Olanzapine, and Their Metabolites in Plasma Samples. Molecules. 24: 310‐
323.
[76] Wu, F., Xu, C., Jiang, N., Wang, J. and Ding, C.F. (2018). Poly(methacrylic acid‐co‐diethenyl‐
benzene) monolithic microextraction column and its application to simultaneous enrichment and
analysis of mycotoxins. Talanta, 178, 1‐8.
[77] Pang, J., Mei, M., Yuan, D. and Huang, X. (2018). Development of on‐line monolith‐based in–tube
solid phase microextraction for the sensitive determination of tiazoles in environmental waters.
Talanta, 184, 411‐417.
[78] Wu, F., Yang, S., Wang, L., Wei, W. and Ding, C.F. (2019). Simultaneous enrichment and analysis
of tobacco alkaloids by microextraction coupled with mass spectrometry using poly (N‐isopropyl‐
acrylamide‐co‐divinyl‐benzene‐co‐ N,N’‐methylene diacrylamide) monolithic colum. Talanta, 198,
118‐127.
[79] Ansari, S. and Karimi, M. (2017). Recent progress, challenges and trends in trace determination
of drug analysis using molecularly imprinted solid‐phase microextraction technology. Talanta, 164,
612‐625.

Bibliography
157
[80] Lashgari, M. and Yamini, Y. (2019). An overview of the most common lab‐made coating materials
in solid phase microextraction. Talanta, 191, 283‐306.
[81] Lhotská, I., Kholová, A., Machyňáková, A., Hroboňová, K., Solich, P., Ŝvec, F. and Ŝatínský, D.
(2019). Preparation of citrinin‐selective molecularly imprinted polymer and its use for on‐line solid‐
phase extraction coupled to liquid chromatography. Anal. Bional. Chem., 411, 2395‐2404.
[82] Huang, L.F., Jia, B., Jiang, L., Liu, W.L., Xia, L.Y. and Lv, Y.K. (2018). Preparation of restricted‐acces
material precolums by grafting γ‐gluconolactone onto a hybrid silica monolithic column for on‐line
solid‐phase extraction of tetracycline residues from milk. J. Sep. Sci., 42, 843‐850.
[83] Souza, I.D., Melo, L.P., Jardim, I., Monteiro, J., Nakano, A.M. and Queiroz, M.E. (2016). Selective
molecularly imprinted polymer combined with restricted access material for in‐tube SPME/UHPLC‐
MS/MS of parabens in breast milk samples. Anal. Chim. Acta, 932, 49‐59.
[84] Fernandez‐Amado, M., Prieto‐Blanco, M.C., Lopez‐Mahía, P., Muniategui‐Lorenzo, S. and Prada‐
Rodríguez, D. (2016). Review: Strengths and weaknesses of in‐tube solid‐phase microextraction: A
scoping review. Anal. Chimi. Acta. 906, 41‐57.
[85] Prieto‐Blanco, M.C., Moliner‐Martínez, Y., Lopez‐Mahía, P. and Campíns‐Falco, P. (2013).
Determination of carbonyl compounds in particulate matter PM2.5 by in‐tube solid‐phase
microextraction coupled to capillary liquid chromatography/mass spectrometry. Talanta, 115, 876‐
880.
[86] Moliner‐Martínez, Y., Ribera, A., Coronado, E. and Campins‐Falcó, P. (2011). Preconcentration of
emerging contaminants in environmental water samples by using silica supported Fe3O4 magnetic
nanoparticles for improving mass detection in capillary liquid chromatography. J. Chromatogr. A,
1218, 2276–2283.
[87] Zarejousheghani, M., Möder, M. and Borsdorf, H. (2013) A new strategy for synthesis of an in‐
tube molecularly imprinted polymer‐solid phase microextraction device: selective off‐line extraction
of 4‐nitrophenol as an example of priority pollutants from environmental water samples. Anal. Chim.
Acta, 798, 48‐55.
[88] Hovárth, C.G., Preiss, B.A. and Lipsky, S.R. (1967). Fast liquid chromatography. Investigation of
operating parameters and the separation of nucleotides on pellicular ion exchange. Anal. Chem., 39,
1422‐1428.
[89] Tsuda, T. and Novotny, M. (1978). Band‐broadening phenomena in microcapillary tubes under
the conditions of liquid chromatography, Anal. Chem., 50, 632‐634.

Bibliography
158
[90] Sesták, J., Moravcová, D. and Kahle, V. (2015). Review. Instrument platforms for nano liquid
chromatography. J. Chromatogr. A, 1421, 1‐17.
[91] Nazario, C.E.D., Silva, M.R., Franco, M.S and Lanças, F.M. (2015). Evolution in miniaturized
column liquid chromatography instrumentation and applications: an overview. J. Chromatogr. A,
1421, 18‐37.
[92] Mejía‐Carmona, K., Soares da Silva Burato, J., Basolli Borsatto, J.V., Toffoli, A.L. and Lanças, F.M.
(2020). Miniaturization of liquid chromatography coupled to mass spectrometry 1. Current trends on
miniaturized LC column. Trac‐Trends Anal. Chem., 122, 115735.
[93] Blue, L.E., Franklin, E.G., Godinho, J.M., Grinias, J.P, Grinias, K.M., Lunn, D.B. and Moore, S.M.
(2017). Review: Recent advances in capillary ultrahigh pressure liquid chromatography. J.
Chromatogr. A, 1523, 17‐39.
[94] Majors, R.E. (2015). Future needs of HPLC and UHPLC column technology. LC‐GC Eur. 28, 658‐
665.
[95] Takeuchi, T., Tatsumi, S., Masuoka, S., Hirose, K., Uzu, H., Jin, J.‐Y., Fujimoto, C., Ohta, K., Lee, K.‐
P. and Ryo, J.‐J. (2003). Split flow and bypass flow systems for monolithic capillary columns in liquid
chromatography, J. Chromatogr. A, 1021, 55‐59.
[96] Blue, L.E., Franklin, E.G., Godinho, J.M., Grinias, J.P., Grinias, K.M., Lunn, D.B. and Moore,
S.M.(2017). Recent advances in capillary ultrahigh pressure liquid chromatography, J. Chromatogr. A,
1523, 17‐39.
[97] Lynch, K.B., Chen, A. and Liu, S. (2018).Miniaturized high‐performance liquid chromatography
instrumentation, Talanta 177, 94‐103.
[98] Li, L., Wang, X., Pu, Q. and Liu, S. (2019). Advancement of electroosmotic pump in microflow
analysis: a review, Anal. Chim. Acta, 1060, 1‐16.
[99] S. Sharma, S., Pilstil, A., Barnett, H.E., Tolley, H.D., Farnsworth, P.B., Stearns, S.D. and Lee, M.L.
(2015). Hand‐portable gradient capillary liquid chromatography pumping system, Anal. Chem. 87,
10457‐10461.
[100] Fanali, S. (2017). Review. Nano‐liquid chromatography applied to enantiomers separation. J.
Chromatogr. A, 1486, 20‐34.

Bibliography
159
[101] Xie, X., Tolley, L.T., Truong, T.X., Tolley, H.D., Farnsworth, P.B. and Lee, M.L. (2017).Dual
wavelength light‐emitting diode‐based ultraviolet absorption detector for nano‐flow capillary liquid
chromatography, J. Chromatogr. A, 1523, 242‐247.
[102] Li, L., Chen, T.‐C., Ren, Y., Hendricks, P.I., Cooks, R.G. and Ouyang, Z. (2014). Mini 12, miniature
mass spectrometer for clinical and other applications ‐ introduction and characterization, Anal. Chem.
86, 2909‐2916.
[103] Hendrickx, S., Uğur, D.Y., Yilmaz, Y.T., Şener, E., Schepdael, A.V., Adams, E., Broeckhoven, K.
and Cabooter, D. (2017). A sensitive capillary LC‐UV method for the simultaneous analysis of
olanzapine, chlorpromazine and their FMO‐mediated N‐oxidation products in brain microdialysates.
Talanta, 162, 268‐277.
[104] Gure, A., Lara, F.J., Moreno‐González, D., Megersa, N., del Olmo‐Iruela, M. and García‐
Cacmpaña, A.M. (2014). Salting‐out assisted liquid‐liquid extraction combined with capillary HPLC for
the determination of sulfonylurea herbicides in environmental water and banana juice samples.
Talanta, 127, 51‐58.
[105] Murtada, K., Andrés, F., Ríos, A. and Zougagh, M. (2018). A simple poly(styrene‐co‐
divinylbenzene)‐coated glass blood spot method for monitoring of seven antidepressants using
capillary liquid chromatography‐mass spectrometry. Talanta , 188, 772‐778.
[106] Albekairi, N., Aqel, A. and ALOthman, Z.A. (2019). Simultaneous Capillary Liquid
Chromatography Determination of Drugs in Pharmaceutical Preparations Using Tunable Platforms of
Polymethacrylate Monolithic Columns Modified with Octadecylamine. Chromatographia 82, 1003‐
1015.
[107] Jornet‐Martínez, N., Ortega‐Sierra, A., Verdú‐Andrés, J., Herráez‐Hernández, R. and Campíns‐
Falcó, P. (2018). Analysis of contact traces of cannabis by in‐tube solid‐phase microextraction coupled
to nanoliquid chromatography. Molecules, 23, 2359.
[108] Moreno‐González, D., Pérez‐Ortega, P., Gilbert‐López, B., Molina‐Díaz, A., García‐Reyes, J.F. and
Fernández‐Alba, A.R. (2017). Evaluation of nanoflow liquid chromatography high resolution mass
spectrometry for pesticide residue analysis in food. J. Chromatogr. A, 1512, 78‐87.
[109] Campíns‐Falcó, P., Herráez‐Hernández, R. and Serra‐Mora, P. Liquid Chromatography.
Instrumentation. In Encyclopedia of Analytical Science Worsfold, P., Townshend, A., Poole, . Third
Edition, 2019, 108‐116.
Bibliography
160
[110] Abonamah, J.V., Eckenrode, B.A. and Moini, M. (2019). On‐site detection of fentanyl and its
derivatives by fild portable nano‐liquid chromatography‐electron lonization‐mass spectrometry (nLC‐
EI‐MS). Forensic Chemistry 16 (2019) 100180.
[111] Sharma, S., Plistil, A., Simpson, R.S., Liu, K., Farnsworth, P.B., Stearns, S.D. and Lee, M.L. (2014).
Instrumentation for hand‐portable liquid chromatography, J. Chromatogr. A., 1327, 80–89.
[112] Sharma, S., Tolley, L.T., Tolley, H.D., Plistil, A., Stearns, S.D. and Lee, M.L. (2015). Review. Hand‐
portable liquid chromatographic instrumentation. J. Chromatogr. A, 1421, 38‐47.
[113] Baram, G.I. Portable liquid chromatograph for mobile laboratories I. Aims. (1996). J.
Chromatogr. A, 728, 387‐399.
[114] Lam, S.C., Coates, L.J., Hemida, M., Gupta, V., Haddad, P.R., Macka, M. and Paull, B. (2020).
Miniature and fully portable gradient capillary liquid chromatograph. Anal. Chem. Acta, 1101, 199‐
210.
[115] The Axcend Focus LC®. https://www.axcendcorp.com/. Accessed February 15 of 2020.
[116] Tulchinsky, V. M. and Angelo, D. E. S., (1998). A Practical Portable HPLC System ‐ MINICHROM,
a New Generation for Field HPLC. F. Anal. Chem. Technol., 2, 281–285.
[117] Ishida, A., Fujimoto, T., Yokogawa, S., Tani, H., Tokeshi, M. and Yanagisawa, I. (2012).
Proceedings of the 16th International Conference on Miniaturized Systems for Chemistry and Life
Sciences, MicroTAS 2012. Okinawa, Japan, 1183‐1185.
[118] Chatzimichail, S., Casey, D. and Salehi‐Reyhani, A., (2019). Zero electrical power pump for
portable high‐performance liquid chromatography. Analyst, 144, 6207–6213.
[119] Flanagan, R.J., Taylor, A., Watson, I.D. and Whelpton, R. (2007). Fundamentals of analytical
toxicology. West Sussex: John Wiley & Sons Ltd.
[120] Dinis‐Oliveira, R. J., Carvalho, F., Duarte, J. A., Remião, F., Marques, A., Santos, A. and
Magalhães, T. (2010). Collection of biological samples in forensic toxicology. Toxicology Mechanisms
and Methods, 20, 363‐414.
[121] Soltani, S. and Jouyban, A. (2014). Biological sample preparation: attempts on productivity
increasing in bioanalysis, Bioanalysis 6, 1691‐1710.
[122] Niu, Z., Zhang, W., Yu, C., Zhang, J. and Wen, Y. (2018). Recent advances in biological sample
preparation methods coupled with chromatography, spectrometry and electrochemistry analysis
techniques. Trac‐Trends Anal. Chem., 102, 123‐146.
Bibliography
161
[123] Namera, A. and Saito, T. (2013). Recent advances in unique sample preparation techniques for
bioanalysis, Bioanalysis 5, 915‐932‐
[124] Moodley, K., Sibanda, N., February, K. and Rossouw, T. (2014). It’s my blood” : ethical
complexities in the use, storage and export of biological samples: perspectives from South African
research participants. Medical Ethics 15:4.
[125] Langel K., Gjerde H., Favretto D., Lillsunde P., Øiestad E.L., Ferrara S.D. and Verstraete, A.G.
(2014). Comparison of drug concentrations between whole blood and oral fluid. Drug Test. Anal. 6,
461–471.
[126] Pawula, M., Hawthorne, G., Smith, G.T. and HillIn, H.M. Best Practice in Biological Sample
Collection, Processing, and Storage for LC‐MS in Bioanalysis of Drugs, Ch 13. In Handbook of LC‐MS
Bioanalysis: Best Practices, Experimental Protocols, and Regulations, Edited by Li, W., Zhang, J. and
Tse, F.L.S. 2013. John Wiley & Sons.
[127] Ialongo, C. (2016). Preanalytic of total antioxidant capacity assays performed in serum, plasma,
urine and saliva, Clin. Biochem. 50, 356‐363.
[128] Kohler, I. and Guillarme, D. (2014). Multi‐target screening of biological samples using LC‐
MS/MS: focus on chromatographic innovations, Bioanalysis 6, 1255‐1273.
[129] Fernandez‐Peralbo, M.A. and Luque de Castro, M.D. (2012). Preparation of urine samples prior
to targeted or untargeted metabolomics mass‐spectrometry analysis, TrAC Trend. Anal. Chem. 41,
75‐85.
[130] Ji, J.A., Jiang, Z., Livson, Y., Davis, J.A., Chu, J.X. and Weng, N. (2010). Challenges in urine
bioanalytical assays: overcoming nonspecific binding. Bioanalysis 2, 1573–1586.
[131] Delanghe, J.R. and Speeckaert, M.M. (2016). Preanalytics in urinalysis, Clin. Biochem. 49, 1346‐
1350.
[132] Nunes, L.A.S. and de Macedo, D.V. (2013). Saliva as a diagnostic fluid in sports medicine:
potential and limitations, J. Bras. Patol. Med. Lab. 49, 247‐255.
[133] Rehman, S.A., Khurshid, Z., Niazi, F.H., Naseem, M. , Al Waddani, H., Sahibzada, H.A. and Khan,
R.S. (2017). Role of salivary biomarkers in detection of cardiovascular diseases (CVD), Proteomes 5,
21.
[134] Liu, J. and Duan, Y (2012). Saliva: A potential media for disease diagnostics and monitoring. Oral
Oncology, 48, 569–577.

Bibliography
162
[135] Eftekhari, A., Hasanzadeh, M., Sharifi,S., Dizaj, S.M., Khalilov, R. and Ahmadian, E. (2019).
Bioassay of saliva proteins: The best alternative for conventional methods in non‐invasive diagnosis
of cancer. Int. J. Biol. Macromol. 124, 1246‐1255.
[136] Bellagambi, F.G., Lomonaco, T., Salvo, P., Vivaldi, F., Hangouet, M., Ghimenti, S., Biagini, D., Di
Francesco, D., Fuoco, R. and Errachid, R. (2020). Saliva sampling: Methods and devices. An overview.
Trac‐Trends Anal. Chem., 124, 115781.
[137] Priya, K.Y. and Prathibha, K.M. (2017). Methods of collection of saliva ‐ a Review, Int. J. Dent.
Oral. Health. 3, 149‐153.
[138] Abdel‐Rehim, M. (2014). Dried saliva spot as a sampling technique for saliva samples, Biomed.
Chromatogr. 28, 875‐877.
[139] M. Numako, M., Takayama, T., Noge, I., Kitagawa, Y., Todoroki, K., Mizuno, H., Min, J.Z. and
Toyo’oka, T. (2016). Dried saliva spot (DSS) as a convenient and reliable sampling for bioanalysis: an
application for the diagnosis of diabetes Mellitus, Anal. Chem. 88, 635‐639.
[140] Lledo‐Fernandez, C. and Banks, C.E. (2011). An overview of quantifying and screening drugs of
abuse in biological samples: Past and present. Anal. Methods., 3, 1227.
[141] Venkata Charan Tej, G.N. and Nayak, P.K. (2018). Mechanistic considerations in
chemotherapeutic activity of caffeine. Biomedicine & Pharmacotherapy., 105, 312‐319.
[142] Bikash Shrestha, B. and Jawa, G. (2017). Caffeine citrate‐ Is it a silver bullet in neonatology,
Pediatrics and Neonatology., 58, 391‐397.
[143] A.R. Spitzer, Evidence‐Based Methylxanthine Use in the NICU. (2012). Clin. Perinatol., 39, 137‐
148.
[144] Gileles‐Hillel, A., Erlichman, I. and Reiter. (2019). J. Apnea of Prematurity: An Update. J. Child.
Sci.,9, 50‐58.
[145] Aranda, J.V., Gorman, W., Bergsteinsson, H. and Gunn, T. (1977). Efficacy of caffeine in
treatment of apnea in the low‐birth‐weight infant. J. Pediatr., 90, 467‐472.
[146] Henderson‐Smart, D.J. and De Paoli, A.G. (2010). Methylxanthine treatment for apnoea in
preterm infants. Cochrane Database Syst. Rev., 12, CD000140.
[147] Dobson, N.R. and Hunt, C.E. (2018). Caffeine: an evidence‐based success story in VLBW
pharmacotherapy. Pediatr Res., 84, 333–340.

Bibliography
163
[148] Comité de Medicamentos de la Asociación Española de Pediatría. Pediamécum. Edición 2015.
ISSN 2531‐2464. Cafeína. Available at http://pediamecum.es/citrato‐de‐cafeina/ Accessed
07/03/2020.
[149] Perera, V., Gross, A.S. and McLachlan, A.J. (2010). Caffeine and paraxanthine HPLC assay for
CYP1A2 phenotype assessment using saliva and plasma, Biomed. Chromatogr., 24, 1136‐1144.
[150] Chiappin, S., Antonelli G., Gatti, R. and De Palo, E.F. (2007). Saliva specimen: A new laboratory
tool for diagnostic and basic investigation, Clin. Chim. Acta, 383, 30‐40.
[151] Scott, N.R., Chakraborty, J. and Marks, V. (1984). Determination of caffeine, theophylline and
theobromine in serum and saliva using high‐performance liquid chromatography, Ann. Clin. Biochem.
21, 120‐124.
[152] Priller, S., Unger, M. and Holzgrabec. (2005). Cytochrome P450 1A2 phenotyping for student
laborator ies Pharmacy Education, 00, 1–12.
[153] Landrigan, P.J., Fuller, R., Hu, H., Caravanos, J., Cropper, M.L., Hanrahan, D., Sandilya, K., Chiles,
T.C., Kumar, P. and Suk, W.A. (2018). Pollution and Global Health – An Agenda for Prevention. Environ.
Health Perspect., 126, 084501.
[154] Bhatta, B. (2010). Analysis of urban growth and sprawl from remote sensing data. Ed. Springer‐
Verlag, Heidelberg.
[155] DIRECTIVA 2013/39/UE DEL PARLAMENTO EUROPEO Y DEL CONSEJO de 12 de agosto de 2013.
Diario Oficial de la Unión Europea. www.boe.es › doue › 2013.
[156] Valsecchi, S., Polesello, S., Mazzoni, M., Rusconi, M.and Petrovic, M. (2015). On‐line sample
extraction and purification for the LC–MS determination of emerging contaminants in environmental
samples, Trends Environ. Anal. Chem. 8, 27–37.
[157] Mackula, T., Cernanský, S., Fehér, M., Birosová, L. and Gál, M. (2019). Pharmaceuticals, drugs,
and resistant microorganisms‐environmental impact on population health. Current Opinion in
Environmental Science & Health, 9, 40–48.
[158] Bahlmann, A., Carvalho, J.J., Weller, M.G., Panne, U. and Schneider, R.J. (2012). Immunoassays
as high‐throughput tools: Monitoring spatial and temporal variations of carbamazepine, caffeine and
cetirizine in surface and wastewaters, Chemosphere 89, 1278–1286.

Bibliography
164
[159] Archer, E., Petrie, B., Kasprzyk‐Hordern, B. and Wolfaardt, G.M. (2017). The fate of
pharmaceuticals and personal care products (PPCPs), endocrine disrupting contaminants (EDCs),
metabolites and illicit drugs in a WWTW and environmental waters, Chemosphere 174, 437‐446.
[160] Phil M. Choi, P.M‐, Tscharke, B.J., Donner, E., O'Brien, J.W., Grant, S.C., Kaserzon, S.L., Mackie,
R., O'Malley, E., Crosbie, N.D., Thomas, K.V. and. Mueller, J.F. (2018). Wastewater‐base d epidemio
logy biomarkers: Past, present and future. Trac‐Trends Anal. Chem., 105, 453‐469.
[161] Lorenzo, M. and Picó, Y. (2019). Wastewater‐based epidemiology: current status and future
prospects. Current Opinion in Environmental Science & Health 9,77–84.
[162] Naidu, R., Arias Espana, V.A., Liu, Y. and Jit, J. (2016). Emerging contaminants in the
environment: Risk‐based analysis for better management, Chemosphere 154, 350‐357.
[163] Gracia‐Lor, E., Rousis, N.I., Zuccato, E., Bade, R., Baz‐Lomba, J.A., Castrignanò, E., Causanilles,
A., Hernández, F., Kasprzyk‐Hordern, B., Kinyua, J., McCall, A.‐K., van Nuijs, A.L.N., Plósz, B.G., Ramin,
P., Ryu, Y., Santos, M.M., Thomas, K., de Voogt, P., Yang, Z. and Castiglioni, S. (2017). Estimation of
caffeine intake from analysis of caffeine metabolites in wastewater, Sci. Total Environ., 609, 1582‐
1588.
[164] Mahoney, C.R., Giles, G.E., Marriott, B.P., Judelson, J.A., Glickman, E.L., Geiselman, P.J. and
Lieberman, H.R. (2019). Intake of caffeine from all sources and reasons for use by college students.
Clinical Nutrition, 38,668‐675.
[165] Silva, C.P., Lima, D.L.D., D.L.D., Schneider, D.L.D., Otero, M. and Esteves, V.I. (2014). Evaluation
of the anthropogenic input of caffeine in surface waters of the north and center of Portugal by ELISA,
Sci. Total Environ., 479, 227–232.
[166] Weigel, S., Berger, U., Jensen, E., Kallenborn, R., Thoresen, H. and Huhnerfuss, H. (2004).
Determination of selected pharmaceuticals and caffeine in sewage and seawater from Tromsø
Norway with emphasis on ibuprofen and its metabolites, Chemosphere 56, 583–592.
[167] Sauvé, S., Aboulfadl, K., Dorner, S., Payment, P., Deschamps, G. and Prévost, M. (2012). Fecal
coliforms, caffeine and carbamazepine in stormwater collection systems in a large urban area,
Chemosphere, 86, 118–123.
[168] Mendoza, A., Zonja, B., Mastroianni, N., Negreira, N., López de Alda, M., Pérez, S., Barceló, D.,
Gil, A. and Valcárcel, Y. (2016). Drugs of abuse, cytostatic drugs and iodinated contrast media in tap
water from the Madrid region (central Spain): A case study to analyse their occurrence and human
health risk characterization, Environment International 86, 107‐118.

Bibliography
165
[169] Loos, R., Locoro, G., Comero, S., Contini, S., Schwesig, D., Werres, F., Balsa, P., Gans, O., Weiss,
S., Blaha, L., Bolchi, M. and Gawlik, B.M. (2010). Pan‐European survey on the occurrence of selected
polar organic persistent pollutants in ground water, Water Res., 44, 4115‐4126.
[170] Dafouz Ramírez, R. and Valcárcel Rivera, Y. (2017). Cafeína como contaminante ambiental, Rev.
Toxicol., 34, 136‐142.
[171] Andrew Lin, K.‐Y., Lai, H.‐K. and Tong, S. (2018). One‐step prepared cobalt‐based nanosheet as
an efficient heterogeneous catalyst for activating peroxymonosulfate to degrade caffeine in water. J.
Colloid Interface Sci., 514, 272–280.
[172] A.L. Batt, A.L., Furlong, E.T., Mash, H.E., Glassmeyer, S.T. and Kolpin, D.W. /2017). The
importance of quality control in validating concentrations of contaminants of emerging concern in
source and treated drinking water samples, Sci. Total Environ., 579, 1618‐1628.
[173] Fontanals, N., Pocurull, E., Borrull, F. and Marcé, R.M. (2019). Role of solid‐phase extraction in
wastewater‐based epidemiology. Current Opinion in Environmental Science & Health, 9,26‐33.
[174] Buchberger, W.W. (2011). Current approaches to trace analysis of pharmaceuticals and
personal care products in the environment, J. Chromatogr. A, 1218, 603‐618.
[175] Trenholm, R.A., Vanderford, B.J.and Snyder, S.A. (2009). On‐line solid phase extraction LC‐
MS/MS analysis of pharmaceutical indicators in water: A green alternative to conventional methods.
Talanta 79, 1425‐1432.
[176] C. Rivetti, B. Campos, M. Faria, N. De Castro Català, A. Malik, I. Muñoz, R. Tauler, A.M.V.M.
Soares, V. Osorio, S. Pérez, M. Gorga, M. Petrovic, N. Mastroianni, M. López de Alda, A. Masiá, J.
Campo, Y. Picó, H. Guasc, D. Barceló, C. Barata, Transcriptomic, biochemical and individual markers
in transplanted Daphnia magna to characterize impacts in the field, Sci. Tot. Environ. 503‐504 (2015)
200–212.
[177] Senta, I., Gracia‐Lor, E., Borsotti, A., Zuccato, E. and Castiglioni, S. (2015). Wastewater analysis
to monitor use of caffeine and nicotine and evaluation of their metabolites as biomarkers for
population size assessment. Water Res., 74, 23‐33.
[178] Martinez‐Haya, R., Gomis, J., Arques, A., Amat, A.M., Miranda, M.A. and Marin, M.L. (2017).
Direct detection of the triphenylpyrylium‐derived short‐lived intermediates in the photocatalyzed
degradation of acetaminophen, acetamiprid, caffeine and carbamazepine, J. Hazard. Mat. 323,156‐
165.

Bibliography
166
[179] He,K., Echigo, S., Asada, Y. and Itoh, S. (2018). Determination of caffeine and its metabolites in
wastewater treatment plants using soli‐phase extraction and liquid chromatography‐tandem mass
spectrometry. Anal. Sci., 34, 349‐354.
[180] Paula Paíga, P., Ramos, S., Jorge, S., Silva, J.G. and Delerue‐Matos, C. (2019). Monitoring survey
of caffeine in surface waters (Lis River) and wastewaters located at Leiria Town in Portugal. Environ.
Sci. Pollut., 26,33440‐33450.
[181] Song, F., Monroe, D., El‐Demerdash, A. and Palmer, C. (2014). Screening for multiple weight loss
and related drugs in dietary supplement materials by flow injection tandem mass spectrometry and
their confirmation by liquid chromatography tandem mass spectrometry. J. Pharm. Pharm. Sci., 88,
136‐143.
[182] [EPC] European Parliament and Council. 2001. Directive 2001/83/EC of the European
Parliament and of the Council of 6 November 2001 on the Community code relating to medicinal
products for human use. OJL. 311:67–128
[183] Paíga, P., Rodrigues, M.J.E., Correia, M., Amaral, J.S., Oliveira, M.B.P.P. and Delerue‐Matos, C.
(2017). Analysis of pharmaceutical adulterants in plant food supplements by UHPLC‐MS/MS. Eur. J.
Pharm. Sci., 99, 219‐227.
[184] Ríos‐Hoyo, A. and Gutiérrez‐Salmeán, G. (2016). New dietary supplements for obesity: what we
currently know. Curr. Obes. Rep., 5, 262‐270.
[185] Jakopin, Z. (2019). Risks associated with fat burners: A toxicological perspective. Review. Food
Chem. Toxicol., 123, 205‐224.
[186] Carine Viana, C., Zemolin, G.M., Müller, L.S., Dal Molin, T.R., Seiffert, H. and de Carvalho, L.M.
(2016). Liquid chromatographic determination of caffeine and adrenergic stimulants in food
supplements sold in Brazilian e‐commerce for weight loss and physical fitness. Food Addit. Contam.:
Part A, 33, 1‐9.
[187] Eussen, S.R.B.M., Verhagen, H., Klungel, O. H., Garssen, J., van Loveren, H., van Kranen, H. J. and
Rompelberg, C. J.M. (2011). Functional foods and dietary supplements: Products at the interface
between pharma and nutrition, Eur. J. Pharmacol., 668, 52‐59.
[188] Hachem, R., Assemat, G., Martins, N., Balayssac, S., Gilard, V., Martino, R. and Malet‐Martino,
M. (2016). Proton NMR for detection: identification and quantification of adulterants in 160 herbal
food supplements marketed for weight loss, J. Pharm. Biomed. Anal., 124, 34–47.

Bibliography
167
[189] E. Deconinck, E., Aouadi, C., Bothy, J.L. and Courselle, P. (2018) Detection and identification of
multiple adulterants in plant food supplements using attenuated total reflectance—Infrared
spectroscopy. , J. Pharm. Biomed. Anal., 152, 111–119.
[190] Kim, E. H., Seo, H. S., Ki, N. Y., Park, N.‐H., Lee, W., Do, J. A., Park, S., Baek, S. Y., Moon, B., Oh,
H. B. and Hong, J.(2017). Reliable screening and confirmation of 156 multi‐class illegal adulterants in
dietary supplements based on extracted common ion chromatograms by ultra‐high‐performance
liquid chromatography‐quadrupole/time of flight‐mass spectrometry, J Chromatogr. A, 1491, 43‐56.
[191] Kern, S.E., Nickum, E.A., Flurer, R.A., Toomey, V.M. and Litzau, J.J. (2014). Isolation and
structural characterization of a new tadalafil analog (2‐hydroxyethylnortadalafil) found in a dietary
supplement, J. Pharm. Biomed. Anal. 103, 99‐103.
[192] Vaclavik, L., Krynitsky, A.J. and Rader, J.I. (2014).Targeted analysis of multiple pharmaceuticals,
plant toxins and other secondary metabolites in herbal dietary supplements by ultra‐high
performance liquid chromatography–quadrupole‐orbital ion trap mass spectrometry. Anal. Chim.
Acta, 810, 45‐60.
[193] Chen, Y., Zhao, L., Lu, F., Chai, Y. and Wu, Y. (2009). Determination of synthetic drugs used to
adulterate botanical dietary supplements using QTRAP LC‐MS/MS. Food Addit. Contam. Part A Chem.
Anal. Control Expo. Risk Assess., 26, 595–603.
[194] Changchuan Guo, C., Shi, F. Jiang, S., Gong, L., Zhao, Y., Zhang, J. and Zeng, S. (2014).
Simultaneous identification, confirmation and quantitation of illegal adulterated antidiabetics in
herbal medicines and dietary supplements using high‐resolution benchtop quadrupole‐Orbitrap mass
spectrometry. J. of Chromatogra. B, 967, 174‐182.
[195] de Carvalho, L.M., Martini, M., Moreira, A.P.L., de Lima, A.P.S., Correia, D., Falcao, T., Garcia,
S.C., de Bairros, A.V., do Nascimento, P.C. and Bohrer, D. (2011). Presence of synthetic
pharmaceuticals as adulterants in slimming phytotherapeutic formulations and their analytical
determination. Forensic Sci. Int., 204, 6–12.
[196] DIRECTIVE 2002/46/EC of the European Parliament and of the Council of 10 June 2002, on the
approximation of the laws of the Member States relating to food supplements.
[197] N. Sarma, N., Giancaspro, G. and Venema, J. (2016). Dietary supplements quality analysis tools
from the United Staes Pharmacopeia, Drug Test. Anal. 8, 418‐423.
Bibliography
168
[198] Dillenburg Meinhart, A., Mateus Damin, F., Caldeirão, Filho, M.J., Cardoso da Silva, L., Silva
Constant, L., Teixeira Filho, J., Wagner, R. and Teixeira Godoy, H. (2019). Chlorogenic and caffeic acids
in 64 fruits consumed in Brazil, Food Chem., 286, 51‐63.
[199] Adriana Farah, A., Monteiro, M., Donangelo, C.M. and Lafay,S. (2008). Chlorogenic acids from
rreen coffee extract are highly bioavailable in humans. J. Nutr. 138, 2309‐2315.
[200] Craig, A.P., Fields, C., Liang, N., Kitts, D. and Erickson, A. (2016). Performance review of a fast
HPLC‐UV method for the quantifi cation of chlorogenic acids in green coffee bean extracts. Talanta,
154, 481‐485.
[201] Rosh, H., Nikpayam, O., Sedaghat, M. and Sohrab, G. (2018). Effects of green coffee extract
supplementation on anthropometric indices, glycaemic control, blood pressure, lipid profile, i nsulin
resistance and appetite in patients with the metabolic syndrome: a randomised clinical trial. Br. J.
Nutr., 119, 250‐258.
[202] Food and Drug Administration (FDA). Highly concentrated caffeine in dietary supplements:
Guidance for industry. [FDA‐2018‐D‐1189]. 2018.
[203] Rossato, L.G., Costa, V.M., Pereira Limberger, R., Bastos, M.L. and Remião, F. (2011).
Synephrine: From trace concentrations to massive consumption in weight‐loss. Food and Chemical
Toxicology, 49, 8‐16.
[204] Brow, A.C. (2018). Heart Toxicity Related to Herbs and Dietary Supplements: Online Table of
Case Reports. Part 4 of 5. J. Diet. Suppl., 15, 516‐555.
[205] Zheng, X., Guo, L., Wang, D. and Deng, X. (2014). p‐Synephrine: a novel agonist for neuromedin
U2 receptor., Biol. Pharm. Bull. 37, 764‐770.
[206] Bent, S., Padula, A. and Neuhaus, J. (2004). Safety and efficacy of Citrus aurantium for weight
loss. Am. J. Cardiol., 94, 1359‐1361.
[207] Stohs, S.J., Preuss, H.G. and Shara, M. (2012). A review of the human clinical studies involving
Citrus aurantium (bitter orange) extract and its primary protoalkaloid p‐synephrine. Int. J. Med. Sci.,
9, 527‐538.
[208] Jordan, S., Murty, M. and Pilon, K. (2004). Products containing bitter orange or synephrine:
suspected cardiovascular adverse reactions. Can. Med. Assoc. J., 171, 993‐994.
[209] Health‐Canada, 2010. Guidelines for the use of synephrine in natural health products. Available:
<http://www.hc‐sc.gc.ca>.
Bibliography
169
[210] Shara, M., Stohs, S. J. and Mukattash, T. L. (2016). Cardiovascular safety of oral p‐synephrine
(bitter orange) in healthy subjects: a randomized placebo‐controlled cross‐over clinical trial.
Phytother. Res., 30, 842‐847.
[211] Shara, M., Stohs, S.J. and M.M. Smadi, (2018). Safety evaluation of p‐ syneph rine following 15
days of oral administ ration to healthy subjects: A clinical study. Phytother. Res., 32,125‐131.
[212] Gariballa, S., Forster, S. and Powers, H. (2009). Riboflavin status in acutely ill patients and
response to dietary supplements, JPEN 33 (2009) 656‐661.
[213] Elliott , M. (2019). Assessing vitamins, minerals and Supplements marketed to children in
Canada. Int. J. Environ. Res. Public Health, 16, 4326.
[214] M. Imran, M., Rauf, A., Shah, Z.A., Saeed, F., Imran, A., Arshad, M.U., Ahmad, B., Bawazeer, S.,
Atif, M., Peters, D.G. and Mubarak, M.S. (2019). Review Chemo‐ preventive and therapeutic effect of
the dietary flavonoid kaempferol: A comprehensive review. Phytother. Res., 33, 263‐275.
[215] Chen, A.Y. and Chen, Y.C. (2013). A review of the dietary flavonoid, kaempferol on human health
and cancer chemoprevention. Food Chem., 138, 2099‐2107.
[216] Guimarães, A.G., Quintans, J.S. S.and Quintans‐Júnior, L.J. (2013). Monoterpenes with analgesic
activity‐A systematic review, Phytother. Res., 27, 1‐15.
[217] Silva de Araújo Couto, H.G., Fitzgerald Blank, A., de Oliveira e Silva, A.M., de Lima Nogueira,
P.C., Arrigoni‐Blank, M.F., de Castro Nizio, D.A. and de Oliveira Pinto, J.A. (2019). Essential oils of basil
chemotypes: Major compounds, binary mixtures, and antioxidant activity. Food Chem., 293, 446‐454.
[218] Mirghaed, A.T., Ghelichpour, M. and Hoseini, S.M. (2016).Myrcene and linalool as new
anesthetic and sedative agents in common carp, Cyprinus carpio ‐ Comparison with eugenol.
Aquaculture 464, 165 ‐170.
[219] Booth, J.K. and Bohlmann , J. (2019). Review: Terpenes in Cannabis sativa – From plant genome
to humans. Plant Sc., 284, 67‐72.
[220] Sowndhararajan, K., Cho, H., Yu, B. and Kim, S. (2015). Effect of olfactory stimulation of isomeric
aroma compounds, (+)‐limonene and terpinolene on human electroencephalographic activity. Eur. J.
Integr. Med., 7, 561‐566.
[221] A.P. Craig, A.P., Fields, , Liang, N., Kitts, D. and Erickson, A. (2016). Performance review of a fast
HPLC‐UV method for the quantification of chlorogenic acids in green coffee bean extracts. Talanta,
154, 481‐485.
Bibliography
170
[222] Hadad, G. M., Salam, R. A. A., Soliman, R. M. and Mesbah, M. K. (2012). Rapid and simultaneous
determination of antioxidant markers and caffeine in commercial teas and dietary supplements
by HPLC‐DAD, Talanta 101, 38‐44.
[223] Di Lorenzo, C., Dos Santos, A., Colombo, F., Moro, E., Dell’Agli M. and Restani, P. (2014).
Development and validation of HPLC method to measure active amines in plant food supplements
containing Citrus aurantium L, Food Control, 46, 136‐142.
[224] K. Saito, K., Yato, M., Kobayashi, Y. and Ito., R. (2019). Simultaneous determination of slimming
drugs in dietary supplements by liquid chromatography/time‐of‐flight mass spectrometry.
Chromatography, 40, 19‐24.
[225] Avula, B., Bae, J‐Y., Chittiboyina, A.G., Wang, Y‐H., Wang, M. and Khan. I.A. (2019). Liquid
chromatography‐quadrupole time of flight mass spectrometric method for targeted analysis of 111
nitrogen‐based compounds in weight loss and ergogenic supplements. J. Pharm. Biomed. Anal., 174,
305‐323.
[226] Langenheim, J.H. (2003) Plant Resins: Chemistry, Evolution, Ecology and Ethnobotany; Timber
Press: Portland, OR, USA.
[227] Case, R.J., Tucker, A.O., Maciarello, M.J. and Wheeler, K.A. (2003). Chemistry and ethnobotany
of commercial incense copals, copal blanco, copal oro, and copal negro, of North America. Econ. Bot.
57, 189–202.
[228] Gigliarelli, G., Becerra, J.X., Curini, M. and Marcotullio, M.C. (2015). Chemical Composition and
Biological Activities of Fragrant Mexican Copal (Bursera spp.). Molecules 2015, 20, 22383–22394.
[229] Becerra, J. (2003). Evolution of Mexican Bursera (Burseraceae) inferred from ITS, ETS, and 5S
nuclear ribosomal DNA sequences. Mol. Phyl. Evol. 26, 300‐309.
[230] Lucero‐Gómez, P., Mathe, C., Vieillescazes, C., Bucio‐Galindo, L., Belio‐Reyes, I. and Vega‐Aviña,
R. (2014). Analysis of Mexican reference standards for Bursera spp. Resins by gas‐chromatography‐
mass spectrometry and application to archaeological objects. J. Archaeol. Sci., 41, 679‐690.
[231] Stacey, R.J., Cartwright, C.R. and McEwan, C. (2006). Chemical characterization of ancient
Mesoamerican “copal” resins: preliminary results. Archaeometry, 48, 323–340.
[232] B. Rhourrhi‐Frih, B., West, C., Pasquier, L., André, P., Chaimbault, P. and Lafosse, M.
(2012).Classification of natural resins by liquid chromatography–mass spectrometry and gas
chromatography–mass spectrometry using chemometric analysis. J. Chromatogr. A, 1256, 177–190.

Bibliography
171
[233] Lopéz‐Luján, L. (1993). Las ofrendas del Templo Mayor de Tenochtitlan. Instituto Nacional de
Antropología e Historia, México.
[234] Sahagún, F.B. (2006). Historia general de las cosas de Nueva España. Colecc.: Sepan cuantos
300. Ed Porrua, México city.
[235] Orta‐Amaro, M. (2007). Copal: Microestructura, composición y algunas propiedades relevantes.
Thesis of Engineering in Chemistry. National Polytechnic Institute of Mexico, Mexico.
[236] Lucero‐Gómez, P., Mathe, C., Vieillescazes, C., Bucio‐Galindo, L., Belio‐Reyes, I. and Vega‐Aviña,
R. (2014). Archeobotanic: HPLC molecular profiles for the discrimination of copals in Mesoamerica
Application to the study of resins materials from objects of Aztec offerings. Archeo Sciences, revue
d’archéométrie, 38, 119‐133.
[237] Hernández Vázquez, L., Palazon, J. and Navarro‐Ocaña, A. (2012). The Pentacyclic Triterpenes
α, β‐amyrins: A Review of Sources and Biological Activities. In Phytochemicals—A Global Perspective
of Their Role in Nutrition and Health; Venketeshwer‐Estrada, R., Ed.; Intech Open: Rijeka, Croatia; pp.
487–502. ISBN 978‐953‐51‐0296‐0.
[238] Romero‐Estrada, A.; Maldonado‐Magaña, A.; González‐Christen, J.; Bahena, S.M.; Garduño‐
Ramírez, M.L.; Rodríguez‐López, V. and Alvarez, L. (2016). Anti‐inflammatory and antioxidative effects
of six pentacyclic triterpenes isolated from the mexican copal resin of bursera copallifera. BMC
Complement. Altern. Med. 2016.
[239] Schmidt, M.E.P., Pires, F.B., Bressan, L.P., da Silva, F.B., Jr., Lameira, O. and da Rosa, M.B. (2018).
Some triterpenic compounds in extracts of Cecropia and Bauhinia species for different sampling
years. Rev. Bras. Farmacogn. 28, 21–26.
[240] Villa‐Ruano, N., Pacheco‐Hernández, Y., Becerra‐Martínez, Y., Zárate‐Reyes, J.A. and Cruz‐
Durán, R. (2018). Chemical profile and pharmacological effects of the resin and essential oil from
Bursera slechtendalii: A medicinal “copal tree” of southern Mexico. Fitoterapia, 128, 86‐92.
[241] Hernández‐Vázquez, L., Mangas, S., Palazón, J. and Navarro‐Ocana, A. (2010). Valuable
medicinal plants and resins: Commercial phytochemicals with bioactive properties. Ind. Crops. Prod.
31, 476‐480.
[242] Brahmkshatriya , P.P.and Brahmkshatriy, P.S. (2013).Terpenes: Chemistry, Biological Role, and
Therapeutic Applications. Chapter 8. In Natural Products, Editors Ramawat, K.G. and Mérillon, J.M.
Springer‐Verlag Berlin Heidelberg.

Bibliography
172
[243] Martelanc, M., Vovk, I. and Simonovska, B. (2009). Separation and identification of some
common isomeric plant triterpenoids by thin‐layer chromatography and high‐performance liquid
chromatography. J. Chromatogr. A, 1216, 6662‐6670.
[244] Rüdiger, A.L., Siani, A.C. and Veiga Junior, V.V. (2007). The chemistry and pharmacology of the
South America genus Protium Burm. f. (Burseraceae). Phcog. Rev., 1, 93‐104.
[245] Merali, Z., Cayera, C., Kent, P., Liu, R., Cal, V., Harris, C.S. and Arnason, J.T. (2018). Sacred Maya
incense, copal (Protium copal ‐ Burseraceae), has antianxiety effects in animal models J.
Ethnopharmacol. 216, 63‐70.
[246] Kaal, J., Seijo, M.M., Oliveira, C., Wagner‐Wysiecka, E., McCoy, V.E., Solórzano Kraemer, M.M.,
Kerner, A., Wenig, P., Mayo, C. and Mayo, J. (2020). Golden artefacts, resin figurines, body adhesives
and tomb sediments from the pre‐Columbian burial site El Caño (Gran Coclé, Panamá): Tracing
organic contents using molecular archaeometry. J. Archaeol. Sci., 113, 105045.
[247] Ruiz‐Montañez, G., Ragazzo‐Sánchez, J.A., Calderón‐Santoyo, M., Velázquez‐de la Cruz, G.,
Ramírez de León, J.A. and Navarro‐Ocaña, A. (2014). Evaluation of extraction methods for preparative
scale obtention of mangiferin and lupeol from mango peels (Mangifera indica L.). Food. Chem., 159,
267–272.
[248] Bahadir‐Acıkara, Ö., Özbilgin, S., Saltan‐Iscan, G., Dall’Acqua, S., Rjaškov á, V., Özgökçe, F.,
Suchý, V. and Šmejkal, K. (2018). Phytochemical analysis of Podospermum and Scorzonera n‐hexane
extracts and the HPLC quantitation of triterpenes. Molecules 23, 1813.
[249] Herrera‐L ópez, M.G., Rubio‐Hernández, E.I., Leyte‐Lugo, M.A., Schinkovitz, A., Richomme, P.,
Calvo‐Irabién, L.M. and Peña‐Rodríguez, L.M. (2019). Botanical Origin of Triterpenoids from
Yucatecan Propolis. Phytochem. Lett. 29, 25‐29.
[250] Silva, R.G.C., Bottoli, C.B.G. and Collins, C.H. (2012). New silica gel‐based monolithic column for
Nano‐liquid chromatography used in the HILIC Mode. J. Chromatogr. Sci.,50, 649‐657.
[251] Serra‐Mora, P., Rodríguez‐Palma, C.E., Verdú ‐Andrés, J., Herráez‐Hernández, R. and Campíns‐
Falcó, P. (2018). Improving the on‐line extraction of polar compounds by IT‐SPME with silica
nanoparticles modified phases. Separations 5, 10.
[252] Ptolemy, A.S., Tzioumis, E., Thomke, A., Rifai, S. and Kellogg, M. (2010). Quantification of
theobromine and caffeine in saliva, plasma and urine via liquid chromatography–tandem mass
spectrometry: a single analytical protocol applicable to cocoa intervention studies, J. Chromatogr. B,
878, 409‐416.

Bibliography
173
[253] Dobson, N.R., Liu, X., Rhein, L.M., Darnall, R.A., Corwin, M.J., McEntire, B.L., Ward, R.M., James,
L.P., Sherwin, C.M.T., Heeren, T.C. and Hunt, C.E. (2016). Salivary caffeine concentrations are
comparable to plasma concentrations in preterm infants receiving extended caffeine therapy, Br. J.
Clin. Pharmacol., 82, 754‐761.
[254] Jordan, N.Y., Mimpen, J.Y., van den Bogaard, W.J.M., Flesch, F.M., van de Meent, M.H.M. and
Sastre‐Torano, J. (2015). Analysis of caffeine and paraxanthine in human saliva with ultra‐high‐
performance liquid chromatography for CYP1A2 phenotyping, J. Chromatogr. B, 995‐996, 70‐73.
[255] Ahmadi, S.H., Manbohi, A. and Heydat, K.T. (2015). Electrochemically controlled in‐tube solid
phase microextraction. Anal. Chim. Acta., 853, 335‐341.
[256] Rodrigues Chaves, A. and Costa Queiroz, M.E. (2013). In‐tube solid‐phase microextraction with
molecularly imprinted polymer to determine interferon alpha 2a in plasma sample by high
performance liquid chromatography. J. Chromatogr. A, 1318, 43‐48.
[257] Moliner‐Martinez, Y., Ballester‐Caudet, A., Verdú‐Andrés, J., Herráez‐Hernández, R., Molins‐
Legua, C. and Campíns‐Falcó, P. (2020). 14 ‐ In‐tube solid‐phase microextraction, Editor(s): Colin F.
Poole, In Handbooks in Separation Science, Solid‐Phase Extraction, Elsevier, Pages 387‐427.
[258] Jornet‐Martínez N., Antón‐Soriano, C. and Campíns‐Falcó, P. (2015). Estimation of the presence
of unmetabolized dialkyl phthalates in untreated human urine by an on‐line miniaturized reliable
method. , Sci. Tot. Environ. 532, 239‐244.
[259] Henry, R. J., Sobel, C. and Berkman, S. (1957). Interferences with Biuret Methods for Serum
Proteins Use of Benedict's Qualitative Glucose Reagent as a Biuret Reagent. Anal. Chem., 29, 1491‐
1495.
[260] Guidelines for Standard Method Performance Requirements, Appendix F: Guidelines for
Standard Method Performance Requirements. AOAC Official Methods of Analysis. 2016.
[261] U.S. Food and Drugs Administration, Bioanalytical Method Validation Guidance for Industry
(FDA‐2013‐D‐1020), 2018.
[262] Andrade‐Garda, J.M., Carlosena‐Zubieta, A., Soto‐Ferreiro, R.M., Teran‐Baamonde, J. and
Thompson, M. Chapter 2 ‐ classical linear regression by the least squares method, in: Andrade‐Garda,
J.M. (Ed.), Basic Chemometric Techniques in Atomic Spectroscopy, 2nd ed, RSC Analytical
Spectroscopy Monographs Number 13. The Royal Society of Chemistry, Cambridge, 2013, pp. 52–122.
Bibliography
174
[263] Kwon, H., Lehotay, S.J. and Geis‐Asteggiante, L. (2012). Variability of matrix effects in liquid and
gas chromatography–mass spectrometry analysis of pesticide residues after QuEChERS sample
preparation of different food crops, J. Chromatogr. A, 1270, 235–245.
[264] Horwitz, W. and Albert, R. (2006). The Horwitz Ratio (HorRat): A Useful Index of Method
Performance with Respect to Precision. J. AOAC international, 89, 1095‐1109.
[265] Wehling, P. and DeVries, J.W. (2012). On the Use of the Horwitz Ratio (HorRat) as an Acceptance
Criterion for Dietary Fiber Collaborative Studies. J. AOAC international, 95, 1541‐1546.
[266] Asiabi, H., Yamini, Y., Seidi, S. and Ghahramanifard, F. (2016). Preparation and evaluation of a
novel molecularly imprinted polymer coating for selective extraction of indomethacin from biological
samples by electrochemically controlled in‐tube solid phase microextraction, Anal. Chim. Acta 913,
76‐85.
[267] P.K. Sahu, N.R. Ramisetti, N.R.; Cecchi, T., Swain, S., Patro, C.S. and Panda, J.(2018). An overview
of experimental designs in HPLC method development and validation, J. Pharm. Biomed. Anal. 147,
590‐611.
[268] E. Hund, E., Vander Heyden, Y., Haustein, M., Massart, D.L. and Smeyers‐Verbeke, J. (2000).
Comparison of several criteria to decide on the significance of effects in a robustness test with an
asymmetrical factorial design, Anal. Chim. Acta, 404, 257‐271.
[269] Carrillo, J.A., Christensen, M., Ramos, S.I., Alm, C., Dahl, M.L., Benítez, J. and Bertilsson, L.
(2000). Evaluation of caffeine as an in vivo probe for CYP1 A2 using measurements in plasma, saliva,
and urine, Ther. Drug Monit., 22, 409‐417.
[270] Perera, V., Gross, A.S. and McLachlan, A.J. (2010). Caffeine and paraxanthine HPLC assay for
CYP1A2 phenotype assessment using saliva and plasma. Biomed. Chromatogr., 24, 1136–1144.
[271] Begas, E., Kouvaras, E., Tsakalof, A.K., Bounitsi, M. and Asprodini, E.K. (2015). Development and
validation of a reversed‐phase HPLC method for CYP1A2 phenotyping by use of a caffeine metabolite
ratio in saliva. Biomed. Chromatogr., 29, 1657–1663.
[272] Nobile, S. and Carnielli, V.P. (2015). Caffeine for preterm infants: current indications and
uncertainties, Acta Biomed., 86, 32‐35.
[273] D.T. Harvey, Chapter 4 Evaluating Analytical Data in D.T. Harvey, Analytical Chemistry 2.1,
https://chem.libretexts.org/Under_Construction/Purgatory/Book%3A_Analytical_Chemistry_2.0_(H
arvey)/04_Evaluating_Analytical_Data/4.5%3A_Statistical_Analysis_of_Data. Accessed 15/04/2020.

Bibliography
175
[274] Giavarina, D. (2015). Understanding Bland Altman analysis, Biochem. Med., 25, 141‐151.
[275] Bland, J.M. and Altman, D.G. (1999). Measuring agreement in method comparison studies. Stat.
Methods Med. Res.,8, 135‐160.
[276] Maksym Misyura, M., Sukha, M.A., Kulasignam, Y., Zhang, T., Kamel‐Reid, S. and Stockley, T.L.
(2018). Improving validation methods for molecular diagnostics: application of Bland‐Altman, Deming
and simple linear regression analyses in assay comparison and evaluation for next‐generation
sequencing. J. Clin. Pathol., 71, 117‐124.
[277] Thompson, M. and Howarth, R.J. (1979). Duplicate Analysis in Geochemical Practice. Analyst,
101, 690‐698.
[278] Synek, V. (2008). Evaluation of the standard deviation from duplicate results, Accred. Qual.
Assur., 13, 335–337.
[279] Serra‐Mora, P., García‐Narbona, P., Verdú‐Andrés, J., Herráez‐Hernández, R. and Campíns‐
Falcó, P. (2019). Exploring New Extractive Phases for In‐Tube Solid Phase Microextraction Coupled to
Miniaturized Liquid Chromatography. Separations, 6, 12.
[280] Gibson, C.M. and Fowler, P. W. (2014). Aromaticity of caffeine, xanthine and dimethyl
xanthines. Tetrahedron Lett., 55, 2078‐2081.
[281] Villamena, F.A. and de la Cruz, A.A. (2001). Caffeine Selectivity of Divinylbenzene Crosslinked
Polymers in Aqueous Media. J. App. Polymer Sci., 82, 195‐205.
[282] Bo, L., Feng, L., Fu, J., Li, X., Li, P. and Zhang, Y. (2015). The fate of typical pharmaceuticals in
wastewater treatment plants of Xi’an city in China. J. Environ. Chem. Eng., 3, 2203‐2211.
[283] Biel‐Maeso, M., Baena‐Nogueras, R.M., Corada‐Fernandez, C. and Lara‐Martin, P.A. (2018).
Occurrence, distribution and environmental risk of pharmaceutically active compounds (PhACs) in
coastal and ocean waters from the Gulf of Cadiz (SW Spain). Sci. Tot. Environ., 612, 649‐659.
[284] Maynard, I.F.N., Cavalcanti, E.B., da Silva, L.L., Martins, E.A.J., Pires, M.A.F., de Barros, M.L., et
al. (2019). Assessing the presence of endocrine disruptors andmarkers of anthropogenic activity in a
water supply system in northeastern Brazil. J. Environ. Sci. Health A Toxicol. Hazard Substain. Environ.
Eng., 54,891‐898.
[285] Fontanals, N., Marcé, R.M. and Borrull, F. (2019). Materials for Solid‐Phase Extraction of Organic
Compounds. Separations, 6, 56.

Bibliography
176
[286] Mohammad Faraji, M., Yamini, Y. and Gholami, M. (2019). Recent advances and trends in
applications of solid‐phase extraction techniques in food and environmental analysis.
Chromatographia, 82, 1207‐1249.
[287] Li, S., Wen, J., He, B., Wang, J.,Hu, X. and Liu, J. (2020). Occurrence of caffeine in the freshwater
environment: Implications for ecopharmacovigilance. Environ. Pollut., 263, 114371.
[288] Snyder, L.R., Kirkland, J.J. and Dolan, W.J. (2010). Appendix I: Properties of HPLC Solvents, In
Introduction to Modern Liquid Chromatography, Third Edition. 879 ‐886, John Wiley & Sons.
[289] De Luca, S., Ciotoli, E., Biancolillo, A., Bucci, R., Magrì, A.D. and Marini, F. (2018). Simultaneous
quantification of caffeine and chlorogenic acid in coffee green beans and varietal classification of the
samples by HPLC‐DAD coupled with chemometrics. Environ Sci Pollut R, 25,28748‐28759.
[290] Roman, M.C., Betz, J. M. and Hildreth, J. (2007). Determination of synephrine in bitter orange
raw materials, extracts, and dietary supplements by liquid chromatography with ultraviolet
detection: single‐laboratory validation, J. AOAC Int., 90, 68‐81.
[291] Vinson, J.A., Chen, X. and Garver, D.D. (2019). Determination of Total Chlorogenic Acids in
Commercial Green Coffee Extracts. J Med Food,22, 314‐320.
[292] Jeon, J.S., Kim, H.T., Jeong. I.H.,Hong, S.R:,Oh, M.S., Park, K.H.,Shim, J.H. and El‐Aty, A.M.A.
(2017). Determination of chlorogenic acids and caffeine in homemade brewed coffee prepared under
various conditions. J. Chromatogr. B, 1064, 115‐123.
[293] Dzaha, C.S., Duan, Y., Zhang, H., Wen, C.,Zhang, J.,Chen, G. and Ma, H. (2020). The effects of
ultrasound assisted extraction on yield, antioxidant, anticancer and antimicrobial activity of
polyphenol extracts: A review. Food Bioscience 35, 100547.
[294] Chmelová, D., Škulcová, D., Legerská, B., Horník, M. and Ondrejovič, M. (2020). Review.
Ultrasonic‐assisted extraction of polyphenols and antioxidants from Picea abies bark. J. Biotechnol.
314‐315, 25‐33.
[295] Magnusson, B.; Örnemark, U. (Eds.) Eurachem Guide: The Fitness for Purpose of Analytical
Methods: A Laboratory Guide to Method Validation and Related Topics, 2nd ed. 2014, p. 57. Available
online: https://www.eurachem.org/images/stories/Guides/pdf/MV_guide_2nd_ed_EN.pdf
(accessed on 10 May 2020).
[296] A. D. Meinhart, C. S. Bizzotto, C. A. Ballus, M. A. Prado, R. E. Bruns, J. T. Filho and H. T. Godoy.
(2010). Optimisation of a CE method for caffeine analysis in decaffeinated coffee, Food Chem. 120,
1155‐1161.
Bibliography
177
[297] Lima, A.R., Pereira, R.G. F. A., Abrahão, S.A., Zangeronimo, M.G., Paula, F.B.A and Duarte, S.M.S.
(2013). Effect of decaffeination of green and roasted coffees on the in vivo antioxidant activity and
prevention of liver injury in rats. Rev Bras Farrmacogn. 23, 506‐512.
[298] V. Kraujalytė, V., Pelvan, E. and Alasalvar, C. (2016). Volatile compounds and sensory
characteristics of various instant teas produced from black tea, Food Chem. 194, 864‐872.
[299] Takahashi, S., Wada, R., Muguruma, H. and Osakabe, N. (2020). Analysis of Chlorogenic Acids in
Coffee with a Multi‐walled Carbon Nanotube Electrode. Food Anal Methods 13, 923‐932.
[300] Keunchkarian, S., Reta, M., Romero, L. and Castells, C. (2006). Effect of sample solvent on the
chromatographic peak shape of analytes eluted under reversed‐phase liquid chromatographic
conditions. J. Chromatogr. A, 1119, 20‐28.
[301] Pagacz, J., Stach, P., Natkaniec‐Nowak, L., Naglik, B. and Drzewicz, P. (2019). Preliminary thermal
characterization of natural resins from different botanical sources and geological environments. J
Therm Anal Calorim, 138, 4279‐4288.
[302] Ribani, M., Grespan Bottoli, C.B., Collins, C.H., Sales Fontes Jardim, I.C. and Costa Melo, L.F.
(2004). Validacao em métodos cromatográficos e electroforéticos. Quim. Nova, 27, 771‐780.
[303] AOAC Official Methods of Analysis. (2013). Appendix K: Guidelines for Dietary Supplements and
Botanicals; AOAC, International: Gaithersburg, MD, USA,p. 8.
[304] Sanchez, J. (2018). Estimating detection limits in chromatography from calibration data:
Ordinary least squares regression vs. weighted least squares. Separations 5, 49.
[305] Kaminsk, L., Schepers, U. and Wätzig, H. (2010). Analytical method transfer using equivalence
tests with reasonable acceptance criteria and appropriate effort: Extension of the ISPE concept. J.
Pharm. Biomed. Anal., 53, 1124‐1129.


APPENDIX

Appendix
180
A.1 ABBREVIATIONS
AAS Atomic absorption spectroscopy
AIBN Azobisisobutironitrilo
AOP Apnea of prematurity
APTS 3‐(Aminopropil)trimetoxisilano
AU Absorbance units
CapLC Capillary liquid chromatography
CGA Chlorogenic acid
CTAC Cetrimonium chloride
d.i. Internal diameter
DAD Diode array detection
DBS Dried blood spot
DHEP Bis(2‐ethylhexyl) phthalate
di‐CQA dicaffeoylquinic
DLLE Dispersive liquid‐liquid Microextraction
DPX disposable pipette tip extraction
DSS Dried saliva spot
DVB Divinylbenzene
ESI Electrospray ionization
FD Fluorescence detector
FDA Food and drugs administration of USA
FFAP Polyethylene glycol modified with nitro terephthalic acid
FID Flame ionization detector
FQA Feruloylquinic

Appendix
181
GC Gas chromatography
HF‐LPME Hollow‐fiber liquid‐phase microextraction
HILIC Hydrophilic interaction liquid chromatography
HLB Hydrophile‐lipophile balance
HS‐SPME Head‐space solid‐phase microextraction
IgA Immunoglobulin A
ILs Ionics liquids
IT‐SPME In‐tube solid‐phase microextraction
LC Liquid chromatography
LLE Liquid‐liquid extraction
LLSME Liqui‐liquid‐solid microextraction
LOD Limit of detection
LOQ Limit of quantification
m/v Mass/volume
MEPS Microextraction by packed sorbent
MIP Molecular imprint polymer
MS Mass spectrometry
MS/MS Mass spectrum in tandem
MTEOS Triethoxymethylsilane
NanoLC Nano Liquid chromatography
NPs Nanoparticles
PAHs Polycyclic aromatic hydrocarbons
PDMS Polydimethylsiloxane
PEEK Polyether ether ketone
PEG Polyethylene glycol

Appendix
182
PETE Polyethylene terephthalate
PS‐DVB Divinylbenzene polystyrene
PTFE Polytetrafluoroethylene
QToF‐MS Quadrupole time‐of‐flight mass spectrometry
RAM Restricted access material
REC Research ethics committees
RNA Ribonucleic acid
RSD Relative standard deviation
SBSE Stir‐bar extraction
SDME Single‐drop microextraction
SPE Solid‐phase extraction
SPME Solid‐phase microextraction
TEOS Tetraethyl orthosilicate
TQD‐MS Triple quadrupole mass spectrometer
tR Retention time
TRB‐5 Polydimethylsiloxane modified with 5% phenyl groups
TRB‐20 Polydimethylsiloxane modified with 20% phenyl groups
TRB‐35 Polydimethylsiloxane modified with 35% phenyl groups
TRB‐50 Polydimethylsiloxane modified with 50% phenyl groups
ua Arbitrary units
UE European Union
UHPLC Ultra‐high pressure liquid chromatography
UPLC Ultra pressure liquid chromatography
UV‐vis Ultraviolet‐visible
v/v Volume/volume

Appendix
183
WWTP Wastewater treatment plant

Appendix
184
A.2 LIST OF FIGURES
Figure 1. Mnemonic SIGNIFICANCE of the twelve principles of green analytical chemistry by Gałuszka
et al [1]
Figure 2. Schematic summary of microextraction techniques.
Figure 3. Evolution in the number of works of the topic "in-tube solid-phase microextraction" since
1997. Source Web of Science (May 2020).
Figure 4. Schematic representation of configurations in IT-SPME-LC: A) draw/eject mode; B) in valve
with one pump and C) in valve with two pumps.
Figure 5. Classification of liquid chromatography systems and operational parameters.
Figure 6. Metabolic pathway of caffeine.
Figure 7. Evolution in the number of citations on caffeine and trimethylxanthines in the topic
environment in the last 30 years. Source Web of Science (May 2020).
Figure 8. Chemical structure and log Kow for major compounds found in dietary supplements.
Figure 9. Chemical structure and log Kow for trace compounds found in dietary supplements.
Figure 10. A) Cary-60 UV-vis spectrophotometer; B) Optical fiber.
Figure 11. Microscopic optical ECLIPSE E200LED MV.
Figure 12. Cap LC-DAD system, Agilent 1200 Series with binary pump.
Figure 13. Portable Nano LC, Focus LC Axcend Corp.
Figure 14. IT-SPME assembly with 1 capillary.
Figure 15. Schematic representation of IT-SPME off-line.
Figure 16. Schematic SPE procedure for the analysis of water samples.
Figure 17. Summary diagram of the matrices and analytes studied in this thesis.
Figure 18. Photograph of the natural resins studied in this thesis.
Figure 19. Chromatogram obtained in optimized conditions. Blue: Standard solution 20 µg mL−1; Red:
Oral fluid spiked at 20 µg mL−1; Green: Serum spiked at 50 µg mL−1.

Appendix
185
Figure 20. Chromatograms obtained in urine analysis optimization. Black: urine sample spiked at 20
µg mL−1 in mobile phase with neutral pH; Brown: urine sample spiked at 20 µg mL−1 in mobile phase
with acidification.
Figure 21. Absolute recoveries (%) obtained with the IT-SPME with the capillaries tested: ZB 1701
(blue), TRB-50 (yellow), ZB-WAX plus (gray), ZB-FFAP (purple), TiO2 (green) and SiO2 (red). The error
bars represent the standard deviation for n = 3.
Figure 22. Schematic procedure of analysis.
Figure 23. UV spectra obtained for the trimethylxanthines studied.
Figure 24. Standardized effects determined using a half-fraction 24-1 factorial design in serum matrix:
a) Theobromine; b) Paraxanthine; c) Theophylline; and d) caffeine.
Figure 25. Standardized effects determined using a half-fraction 24-1 factorial design in oral fluid
matrix: a) Theobromine; b) Paraxanthine; c) Theophylline; and d) caffeine.
Figure 26. Representative chromatograms from preterm newborns samples: Blue: Standard solution
20 µg mL−1; Red: Oral fluid sample; Green: Serum sample.
Figure 27. Correlation plot of concentration values of caffeine in serum and saliva (n = 35). Regression
equation: C saliva = (-2 ± 3) + (0,99 ± 0,14)·C serum. r = 0.786.
Figure 28. Bland-Altman graphic (plot of differences between method A (caffeine in serum) and
method B (caffeine in saliva) vs. the mean of the two measurements). It presents confidence interval
limits for mean and agreement limits.
Figure 29. Plot of the relationship between the mean concentration of caffeine and % RSD for duplicate
analytical results.
Figure 30. Chromatograms obtained in the study of the effect of the solvent on the separation
efficiency. Solution of caffeine standard at 50 µg mL-1 prepared in different solvents. Green: in
acetonitrile; Black: in a mixture of acetonitrile and water (8:2); Blue: in a mixture of acetonitrile and
water (5:5); Orange: in a mixture of acetonitrile and water (2:8); Purple: in water; Red: in methanol.
Figure 31. Chromatograms obtained under the selected conditions with: (Blue) the portable nano LC;
(Red) CapLC systems. Concentration of each analyte: 10 µg mL-1 for Blue signal, and 10 ng mL-1 for
Red signal.

Appendix
186
Figure 32. Study of the effect of volume on preconcentration in the HP-PLOT/Q capillary. Experimental
conditions: standard solution at 50 ng mL-1; capillary length of 25cm; Volume of flushing 100 µL of
water. Blue: Theobromine; Red: Theophylline; Green: Caffeine.
Figure 33. Study of the effect on capillary length with the HP-PLOT/Q capillary. Experimental
conditions: standard solution at 5 ng mL-1; processed volume of 4 mL; Volume of flushing 100 µL of
water. Blue: 25 cm; Green: 50cm.
Figure 34. Analyte responses obtained SPME with the different capillaries tested coupled on-line to the
CapLC system. Concentration of each analyte: 1 µgmL-1 in the modified PEG (FFAP) and 10 ng mL-1 for
the polymeric phases (HP-PLOT/Q and VP-HayeSep P); Processed volume 0.1 mL for FFAP and 4 mL for
polymeric phases. Blue: Theobromine; Red: Theophylline; Green: Caffeine. Error bars represent
standard deviation for n = 3.
Figure 35. Results obtained by off-line SPME/portable NanoLC: (A) effect of the sample volume on
analyte responses; (B) chromatogram obtained for a sample volume of 12 mL. Concentration of each
analyte, 500 µg mL-1. Capillary: VP-HayeSep P (50 cm). Volume of flushing: 40 µL of water. Desorption
volume: 100 µL methanol.
Figure 36. Analyte responses obtained with two of the four cartridges tested and the portable nanoLC
system. Concentration of each analyte: 500 ng mL-1; Processed volume: 8 mL. Blue: Theobromine; Red:
Theophylline; Green: Caffeine. Error bars represent standard deviation for n = 3.
Figure 37. Chromatograms of the analysis for different load volumes: Green: 8 mL; Blue: 16 mL; Red:
25 mL. Concentration of each analyte: 500 ng mL-1; cartridge: C18-U.
Figure 38. Analyte responses obtained for the study of the volume of elution in SPE. Concentration of
each analyte: 500 ng mL-1; Load volume: 25 mL; cartridge: C18-U. Blue: Theobromine; Red:
Theophylline; Green: Caffeine.
Figure 39. Chromatograms of the optimization of the cleanup process. Blue: Fortified sample without
cleaning process; Red: Fortified sample and cleaning with 100 µL of nanopure water. The fortified
concentration of each analyte: 500 ng mL-1; cartridge: C18-U; load volume: 25 mL; desorption with two
fractions of 100 µL of methanol.
Figure 40. Chromatograms obtained for sea water analysis. A: SPE/portable NanoLC; B: IT-SPME-
CapLC .
Figure 41. Chromatograms obtained for the Turia river water samples: (A) chromatograms obtained
by the SPE/portable NanoLC approach for a sample positive for caffeine, for an standard solution of
Appendix
187
the analytes (5 µg mL-1, each compound), and detail of the registers obtained for the same sample
fortified with the analytes (5 µg mL-1, each); (B) registers obtained by the IT-SPME - CapLC approach
for the samples and for an standard solution of the analytes (10 ng mL-1), and normalized spectra of
the peak assigned to caffeine in sample 2 and the spectra corresponding to a standard solution of
caffeine.
Figure 42. Graphical evaluation of the effect of the UV cutoff wavelength of the solvents commonly
used as a function of the maximum absorption wavelength of the studied compounds.
Figure 43. Chromatograms resulting from the study of the effect of acid modifiers on the
chromatographic efficiency of synephrine. Blue: without modifier; Red: with hydrochloric acid; Green:
with ortho-phosphoric acid; Purple: with formic acid. Concentration of synephrine: 1 µg mL-1.
Figure 44. Chromatograms obtained with the optimized gradient. Blue: at 200 nm; Red: at 220 nm;
Purple: at 275nm; Green: at 330 nm; Orange: at 370 nm. For a solution containing synephrine (1 µg
mL-1), theobromine (1 µg mL-1), caffeine (1 µg mL-1), Riboflavin (1 µg mL-1), 5-CQA (1 µg mL-1), caffeic
acid (1 µg mL-1), linalool (5 µg mL-1), myrcene (5 µg mL-1), limonene, (5 µg mL-1), α-pinene (5 µg mL-1),
farnesene (5 µg mL-1) and kaempferol (1 µg mL-1).
Figure 45. Chromatogram obtained at 275 nm for a mixture of caffeine and riboflavin (1 µg mL-1 each)
with the gradient modified for the analysis of these compounds. At the top the absorption spectra of
each compound appear.
Figure 46. Chromatograms obtained at 330 nm for a standard mixture of caffeic acid and chlorogenic
acids (1 µg mL-1) with different mobile phases. Blue: acetonitrile and 0.1% phosphoric acid; Green:
methanol and 0.1% phosphoric acid.
Figure 47. Chromatograms obtained at 275 nm for sample GC-3, extracted with 2 mL of methanol,
with a dilution factor of 50 and analyzed by multi-class method. Red: extraction with the first portion
of methanol; Green: extraction with the second portion of methanol.
Figure 48. Chromatograms obtained at 275 nm for sample GC-3, extracted with 5 mL of methanol,
with a dilution factor of 100 and analyzed by multi-class method. Red: extraction with the first portion
of methanol; Green: extraction with the second portion of methanol.
Figure 49. UV spectra obtained for some of the compounds analyzed by the multi-class method.
Figure 50. UV spectra obtained for chlorogenic acid compounds analyzed under the chlorogenic acids
method.
Figure 51. Schema of the procedure for the analysis of the samples by the two methods.

Appendix
188
Figure 52. Chromatograms obtained for the analysis of the green coffee samples at 275nm. A: GC-1
with dilution factor of 200; B: GC-2 (Blue) with dilution factor of 100; GC-3 (Purple) with dilution factor
of 100.
Figure 53. Chromatogram obtained at 275 nm for sample GC-3 with the Multi-class method and the
modified gradient for the analysis of caffeine and riboflavin (purple), and normalized spectra of the
peak assigned to riboflavin in the sample (red) and the spectra corresponding to a standard solution
of riboflavin (blue). In green appears the spectra corresponding to the peak assigned to caffeine.
Figure 54. Chromatogram obtained at 220 nm with the multi-class method for the analysis of Fat-
burning supplements. Green: FB-1 with dilution factor of 1000; Red: FB-2 with dilution factor of 500.
At the top appears the spectra corresponding to the peak assigned to synephrine (blue).
Figure 55. A: Chromatogram obtained at 200 nm for the analysis of FB-1 sample. Blue: standard
solution of Linalool (5 µg mL-1); Red: Sample with dilution factor of 2; Green: Sample spiked with linalool
(1µg mL-1). B: Chromatogram obtained at 220 nm for the analysis of FB-2 sample. Red: Sample with
dilution factor of 2; At the top appears the normalized spectra of the peak assigned to myrcene in the
sample (red) and the spectra corresponding to a standard solution of myrcene (blue).
Figure 56. Chromatogram obtained at 200 nm for the analysis of HP sample without dilution. Peaks of
limonene and farnesene were identified. At the top appears the normalized spectra of the peak
assigned to limonene in the sample (red) and the spectra corresponding to a standard solution of
limonene (blue).
Figure 57. Chromatograms obtained at 330 nm for the analysis of GC-1, GC-2, GC-3, and FB-1 samples.
Green: standard solution (each compound at 1 µg mL-1); Blue: GC-2 sample with dilution factor of 300;
Red: GC-3 sample with dilution factor of 300; Purple: GC-1 sample with dilution factor of 100; Brown:
FB-1 sample with dilution factor of 5; at the top appears the normalized spectra of the peak assigned
to 5-CQA in the sample (red) and the spectra corresponding to a standard solution of 5-CQA (blue).
Figure 58. Chromatogram obtained at 330 nm for the analysis of the GC-1 sample with a dilution factor
of 100; at the top appears the UV spectra of the unknown peaks.
Figure 59. Chromatogram obtained at 200 nm for the analysis of Lupenone standard solution at 100
µg mL-1, employing a mixture of water and acetonitrile (10:90) as mobile phase.
Figure 60. UV spectra obtained for analyzed compounds.
Figure 61. Chromatogram obtained for standard solution mix of the analytes (10 µg mL−1) in methanol
injected directly; volume of injection 5 µL; eluent, 100% acetonitrile; detection wavelength 200nm.

Appendix
189
Figure 62. Chromatograms obtained at 200 nm for standard solution mix of the analytes (100 µg mL−1)
in: Red: methanol; Blue: acetonitrile; Green: Ethyl acetate; Purple: isopropanol; Brown: Chloroform.
Volume of injection 5 µL; eluent, 100% acetonitrile.
Figure 63. Analyte responses obtained for the study of the percentage of water in injection solvent.
Blue: 0% of water; Green: 10% of water; Red: 20% of water; Purple: 50% of water. Concentration of
each analyte: 5 µg mL-1; Volume of injection 5 µL; eluent, 100% acetonitrile.
Figure 64. Chromatogram obtained for standard solution mix of the analytes (10 µg mL−1) in methanol
after loading 5 µL of nanopure water in the injection loop. Volume of injection 5 µL; eluent, 100%
acetonitrile; detection wavelength 200nm.
Figure 65. Chromatograms obtained for standard solution mix of the analytes (10 µg mL−1) in methanol
after loading 5 µL of nanopure water in the injection loop. Red: volume of injection 15 µL; Green:
volume of injection 5 µL. Eluent, 100% acetonitrile; detection wavelength 200nm.
Figure 66. Chromatograms obtained for the extract of white copal sample. Red: extracted with
acetonitrile; Green: extracted with methanol. Eluent, 100% acetonitrile; detection wavelength 200nm.
Figure 67. Photographs of the extracts obtained after adding 1 mL of methanol. a: white copal; b:
ocote; c: copal in tears; left vials in (a–c), 1 mg of homogenized samples; right vials in (a–c), 15 mg of
the homogenized samples. d: solution obtained after treating the residue insoluble in methanol of
copal in tears (10 mg) with 1 mL of water.
Figure 68. Chromatograms obtained in the matrix effect study for Copal in tears sample. Green: sample
without fortification; Purple: fortified sample with 5 µg mL−1 of the analytes. On the right, the
recoveries values found for all analytes (n=3).
Figure 69. Chromatograms obtained in the analysis of the resin samples. A: White copal; Red: blank of
methanol; Blue: standard solution at 5 µg mL-1;Green: sample. B: Ocote resin with dilution factor of 20;
Blue: standard solution at 5 µg mL-1; Green: sample. At the top appears the normalized spectra of the
peak assigned to limonene in the sample (red) and the spectra corresponding to a standard solution of
limonene (blue).

Appendix
190
A.3 LIST OF TABLES
Table 1. Examples of different procedures specified in LC systems with capillary columns methods used
in IT-SPME.
Table 2. Examples of application of different procedures based on miniaturized LC.
Table 3. Summary of modern and historical portable LC systems reported in the literature.
Table 4. Comparison of the characteristics, advantages, and disadvantages of biological samples
discussed. Adapted from [140].
Table 5. Chemical structure and log Kow of trimethylxanthines studied.
Table 6. Analytical methods in last five years for the determination of trimethylxanthines in
environmental water samples.
Table 7. Analytical methods found in the literature for the analysis of dietary supplements by LC.
Table 8. Chemical structure and log Kow values of terpenic compounds.
Table 9. List of reagents, chemical supply company and safety pictograms Flammable,
corrosive, toxic, high-dose side effects, dangerous for health, Dangerous for the
environment. 1) Sigma: Sigma-Aldrich; Dr. Ehrenst: Dr Ehrenstorfer; Cayman: Cayman Chemical;
Fisher: Fisher Scientific.
Table 10. Chromatographic conditions of the procedures used in this thesis.
Table 11. Evaluation of linearity, limit of detection and quantification.
Table 12. Evaluation of matrix effect for all matrices and analytes.
Table 13. Precision parameters for methylxanthines in biological samples by IT-SPME
Table 14. Results of relative recovery for methylxanthines in biological samples by IT-SPME.
Table 15. Half fraction 24-1 factorial design for evaluation of robustness of the method.
Table 16. Caffeine average concentration found in the analyzed paired samples.
Table 17. Comparison of the features of the two chromatographic systems used in this study.
Table 18. Analytical parameters obtained with the SPE/portable NanoLC and IT-SPME-CapLC
approaches.
Appendix
191
Table 19. Precision of the two tested approaches, RDS (%); n=3.
Table 20. Recoveries obtained by the two tested approaches in spiked seawater, RDS (%); n=3.
Table 21. Analytical parameters of the multi-class method.
Table 22. Precision and recovery obtained in spiked green coffee samples for of the multi‐class
method.
Table 23. Analytical parameters of the chlorogenic acids method.
Table 24. Precision and recovery obtained in spiked green coffee samples for chlorogenic acids
method.
Table 25. Results obtained for the real samples analyzed with the multi-class method (n=3).
Table 26. Results obtained for the real samples analyzed with the chlorogenic acids method (n=3).
Table 27. Evaluation of the linearity and accuracy of the proposed method.
Table 28. Evaluation of the precision, LOD and LOQ of the proposed method.
Table 29. Percentages of the analytes found in the analyzed natural resin samples (n = 3).
Table 30. Percentages of the analytes found in the resin samples after the stability study (n = 3).

Appendix
192
A.4 CONTRIBUTION IN PUBLICATIONS
1. Ponce‐Rodríguez, H.D., García‐Robles, A.A., Sáenz‐González, P., Verdú‐Andrés, J. and
Campíns‐Falcó, P. (2020). On‐line in‐tube solid phase microextraction coupled to capillary liquid
chromatography‐diode array detection for the analysis of caffeine and its metabolites in small
amounts of biological samples. Journal of Pharmaceutical and Biomedical Analysis, 178, 112914.
Impact Factor (JCR 2018): 2.983. Contribution 100 %.
2. Ponce‐Rodríguez, H.D., Herráez‐Hernández, R., Verdú‐Andrés, J. and Campíns‐Falcó, P. (2019).
Quantitative Analysis of Terpenic Compounds in Microsamples of Resins by Capillary Liquid
Chromatography. Molecules, 24, 4068. Impact Factor (JCR 2018): 3.060. Contribution 100 %.
3. Ponce‐Rodríguez, H.D., Verdú‐Andrés, J., Herráez‐Hernández, R. and Campíns‐Falcó, P. (2020).
Innovations in extractive phases for in‐tube solid‐phase microextraction coupled to miniaturized
liquid chromatography: A critical review. Molecules, 25, 2460. Impact Factor (JCR 2018): 3.060.
Contribution 100%.
4. Ponce‐Rodríguez, H.D., Verdú‐Andrés, J., Herráez‐Hernández, R. and Campíns‐Falcó, P. (2020).
Exploring hand‐portable nano‐liquid chromatography for in place water analysis: determination of
trimethylxanthines as a use case. Science of the Total Environment (In revision). Contribution 100 %.
5. Ponce‐Rodríguez, H.D., Verdú‐Andrés, J., Herráez‐Hernández, R. and Campíns‐Falcó, P. (2020).
Multi‐class analysis of botanical dietary supplements by capillary liquid chromatography. Pending
submit. Contribution 100 %.