
TESIS DOCTORAL - e-Spacio - UNED
455
TESIS DOCTORAL 2019 MULTIMODAL PERCEPTION OF ACOUSTIC PROMINENCE IN SPANISH MIGUEL JIMÉNEZ-BRAVO BONILLA PROGRAMA DE DOCTORADO EN FILOLOGÍA. ESTUDIOS LINGÜÍSTICOS Y LITERARIOS: TEORÍA Y APLICACIONES DIRECTOR/A: DR./DRA. VICTORIA MARRERO AGUIAR
-
Upload
khangminh22 -
Category
Documents
-
view
1 -
download
0
Transcript of TESIS DOCTORAL - e-Spacio - UNED
TESIS DOCTORAL
2019
MULTIMODAL PERCEPTION OF ACOUSTIC
PROMINENCE IN SPANISH
MIGUEL JIMÉNEZ-BRAVO BONILLA
PROGRAMA DE DOCTORADO EN FILOLOGÍA. ESTUDIOS
LINGÜÍSTICOS Y LITERARIOS: TEORÍA Y APLICACIONESDIRECTOR/A: DR./DRA. VICTORIA MARRERO AGUIAR

U.N.E.D.
D����������� �� L����� E������� � L���������� G������F������� �� F��������
Multimodal perception of acoustic
prominence in Spanish
M����� J�������B���� B������
D��������: V�������M������ A�����


This dissertation was typeset using LATEX.

I, Miguel Jiménez-Bravo Bonilla, declare that thework presented in this thesis
has been composed solely by myself and that it has not been submitted, in whole
or in part, in any previous application for a degree. Except where stated other-
wise by reference or acknowledgment, the work presented is entirely my own.

Agradecimientos
Hay ocasiones en que, ante situaciones difíciles, la constancia sobresale por
encima de otras virtudes. Esto es lo que este proyecto me ha demostrado y es,
quizá, lo más valioso de todo lo que he aprendido durante el transcurso de mi
investigación. Mi familia lo ha vivido conmigo y a ellos les quiero agradecer
su apoyo incondicional, pues saben bien los esfuerzos que ha conllevado llevar a
buen término esta tesis doctoral. Muchas otras personas han tenido que soportar
conmigo el peso de este trabajo y les doy las gracias por el esfuerzo compartido.
Hoy se me �gura, al mirar atrás, el cambio que ha operado en mí desde el co-
mienzo. Ahora soy otro. Muchos otros cambios, algunos muy sutiles, han ido
sucediendo y acumulándose. En la conciencia de cómo se han producido hay un
gran aprendizaje y un disfrute sincero. Vendrán más cambios, sin duda, algunos
tal vez como consecuencia de todo este trabajo, no lo sé; aunque en verdad no
me inquieta en absoluto en qué dirección me lleven.
Quiero agradecer, también, de forma especial a Raúl Rojas por su autenti-
cidad y porque él estuvo presente cuando dio comienzo este proyecto. A mi
grandísimo amigo José Riva por su capacidad única de comprenderme, por su
generosidad y porque vio cómo se gestaba el manuscrito �nal de esta tesis mien-
tras compartíamos los días en Casa Santina. A Gea Gómez Pablos por la música
inimitable que es y con la que sueña y por todos los momentos que tuvieron, y
algún día tengan, un once sobre diez. A Óscar Esquivias y Rafael Eguílaz, cuya

amistad me inspira siempre tanto y con quienes deseo vivir una “vida futura” que
sea hoy. A Yanina Carchak, por la lista de palabras donde la última entrada es
“vínculo”. A Manu Sanz, con quien tengo la con�anza de quienes comparten un
mismo cielo. A Yasmina Alcántara, por el descubrimiento perpetuo. A Pepe Mas,
porque su curiosidad es mi curiosidad. A mi Mai, con quien tengo la libertad de
reírme de todo.
Igualmente me gustaría dar las gracias todas las personas que me han ayu-
dado en algún momento de mi investigación, empezando por Victoria Marrero,
José María Lahoz, Pilar Prieto y Jaydene Elvin; al departamento de lingüística del
TiCC de la universidad de Tilburg, muy especialmente a Emiel Krahmer, Marc
Swerts, Martijn Goudbeek, Ingrid Masson y Lieke van Maastricht; y �nalmente
también a Marieke Hoetjes y Louis ten Bosch por su tiempo y generosidad.

Contents
1 Introduction 1
2 Literature review: prominence and language 9
2.1 Acoustic correlates of prominence . . . . . . . . . . . . . . . . . . 9
2.1.1 Introduction . . . . . . . . . . . . . . . . . . . . . . . . . . 10
2.1.2 Prominence: lexical stress and pitch accents . . . . . . . . . . . 11
2.1.3 The initial importance of f 0 . . . . . . . . . . . . . . . . . . . 13
2.1.4 An alternative: articulatory e�ort and intensity . . . . . . . . . . 15
2.1.5 Duration . . . . . . . . . . . . . . . . . . . . . . . . . . . . 17
2.1.6 Disentangling stress from accent . . . . . . . . . . . . . . . . . 19
2.1.7 Acoustic correlates of prominence revisited . . . . . . . . . . . 21
2.1.7.1 Reconsidering the role of intensity . . . . . . . . . . 21
2.1.7.2 Reconsidering the role of f 0 . . . . . . . . . . . . . 23
2.1.7.3 Reconsidering the role of duration . . . . . . . . . . 25
2.1.7.4 Reconsidering the perceptual threshold of prominence . 28
2.1.8 Correlates of prominence in Castilian Spanish . . . . . . . . . . 29
2.1.8.1 Cross-linguistic di�erences . . . . . . . . . . . . . . 29
2.1.8.2 The confusion of the Spanish acento . . . . . . . . . 31

Contents
2.1.8.3 The initial debate over the role of intensity . . . . . . 34
2.1.8.4 The fundamental role of f 0 observed in subsequent research 35
2.1.8.5 Di�erent insights from other methodologies . . . . . . 38
2.1.8.6 Disentangling stress and accent in Spanish . . . . . . 41
2.1.8.7 Support for Navarro Tomás’s acento de intensidad . . . 42
2.1.8.8 Later research into the correlates of prominence in Spanish 43
2.1.9 Summary . . . . . . . . . . . . . . . . . . . . . . . . . . . 46
2.2 Linguistic correlates of prominence . . . . . . . . . . . . . . . . . . 50
2.2.1 Introduction . . . . . . . . . . . . . . . . . . . . . . . . . . 50
2.2.2 Semantics, pragmatics and information structure . . . . . . . . . 52
2.2.2.1 Prosodic prominence and information structure . . . . 53
2.2.2.2 Accessibility: repetition, frequency, and probability . . 60
2.2.3 Syntactic structures and prominence . . . . . . . . . . . . . . . 63
2.2.4 Text-to-speech synthesis and prominence . . . . . . . . . . . . 71
2.2.5 Cross-linguistic di�erences . . . . . . . . . . . . . . . . . . . 73
2.2.6 Summary . . . . . . . . . . . . . . . . . . . . . . . . . . . 79
2.3 Gestural correlates of prominence . . . . . . . . . . . . . . . . . . 82
2.3.1 Introduction . . . . . . . . . . . . . . . . . . . . . . . . . . 83
2.3.2 The Kendon’s continuum . . . . . . . . . . . . . . . . . . . . 83
2.3.3 The study of gestures until the 20th century . . . . . . . . . . . 87
2.3.3.1 Antiquity . . . . . . . . . . . . . . . . . . . . . . 87
2.3.3.2 The Renaissance and the Enlightenment . . . . . . . 88
2.3.3.3 The 19th century . . . . . . . . . . . . . . . . . . 90
2.3.4 Gesture studies in the 20th century . . . . . . . . . . . . . . . . 93

Contents
2.3.4.1 The importance of spontaneous gestures . . . . . . . 93
2.3.4.2 Kinesics and linguistics . . . . . . . . . . . . . . . 95
2.3.4.3 Rede�nition of gesture categories . . . . . . . . . . . 96
2.3.4.4 Micro-analyses of gestures in relation to speech . . . . 98
2.3.4.5 Related hierarchy of gesture and speech . . . . . . . . 99
2.3.4.6 Gesture and the cognitive foundations of language . . . 103
2.3.5 Categorising gestures . . . . . . . . . . . . . . . . . . . . . . 108
2.3.6 Head movements and facial expressions . . . . . . . . . . . . . 114
2.3.7 Temporal coordination of gesture and speech . . . . . . . . . . . 118
2.3.7.1 Precedence of gesture . . . . . . . . . . . . . . . . 119
2.3.7.2 More accurate measurements . . . . . . . . . . . . . 120
2.3.7.3 On the applicability of the Phonological Synchrony Rule
(PSR) . . . . . . . . . . . . . . . . . . . . . . . . 122
2.3.7.4 Rede�ning alignment landmarks . . . . . . . . . . . 123
2.3.8 Audiovisual prosody . . . . . . . . . . . . . . . . . . . . . . 127
2.3.8.1 Multimodal prominence signalling . . . . . . . . . . 129
2.3.8.2 Studies using an animated agent . . . . . . . . . . . 130
2.3.8.3 Studies in experimental settings . . . . . . . . . . . 138
2.3.8.4 Studies using spontaneous speech . . . . . . . . . . 148
2.3.8.5 Gender di�erences in the audiovisual perception of speech 151
2.3.9 Summary . . . . . . . . . . . . . . . . . . . . . . . . . . . 152
3 Methodology 156
3.1 Previous methodological approaches . . . . . . . . . . . . . . . . . 156
3.1.1 Procedures . . . . . . . . . . . . . . . . . . . . . . . . . . . 158

Contents
3.1.2 Speech materials and type of stimuli . . . . . . . . . . . . . . . 161
3.1.3 Summary . . . . . . . . . . . . . . . . . . . . . . . . . . . 163
3.2 Review of statistical methods . . . . . . . . . . . . . . . . . . . . . 164
3.2.1 From ANOVAs towards Linear Mixed Models (LMMs) . . . . . . . 165
3.2.2 LMMs and non-normal distributions: Generalised LMMs . . . . . 175
3.2.3 Parameters estimation and statistical inference . . . . . . . . . . 179
3.2.4 Akaike Information Criterion and model selection . . . . . . . . 183
3.2.5 Summary . . . . . . . . . . . . . . . . . . . . . . . . . . . 191
3.3 Methodology used in this study . . . . . . . . . . . . . . . . . . . . 194
3.3.1 Rationale . . . . . . . . . . . . . . . . . . . . . . . . . . . . 194
3.3.2 Speech material . . . . . . . . . . . . . . . . . . . . . . . . 197
3.3.3 Stimuli creation . . . . . . . . . . . . . . . . . . . . . . . . 199
3.3.4 Participants . . . . . . . . . . . . . . . . . . . . . . . . . . 201
3.3.5 Gesture annotation . . . . . . . . . . . . . . . . . . . . . . . 202
3.3.6 Data analysis . . . . . . . . . . . . . . . . . . . . . . . . . . 204
3.3.7 Summary . . . . . . . . . . . . . . . . . . . . . . . . . . . 207
4 Experiment I 209
4.1 Introduction . . . . . . . . . . . . . . . . . . . . . . . . . . . . . . 209
4.2 Methodology . . . . . . . . . . . . . . . . . . . . . . . . . . . . . 211
4.2.1 Participants . . . . . . . . . . . . . . . . . . . . . . . . . . 211
4.2.2 Stimuli . . . . . . . . . . . . . . . . . . . . . . . . . . . . . 211
4.2.3 Experiment design . . . . . . . . . . . . . . . . . . . . . . . 213
4.2.4 Hypotheses . . . . . . . . . . . . . . . . . . . . . . . . . . 213
4.2.5 Procedure . . . . . . . . . . . . . . . . . . . . . . . . . . . 214

Contents
4.3 Results . . . . . . . . . . . . . . . . . . . . . . . . . . . . . . . . 216
4.3.1 Descriptive statistics . . . . . . . . . . . . . . . . . . . . . . 216
4.3.1.1 Prominence marks . . . . . . . . . . . . . . . . . . 216
4.3.1.2 Inter-rater agreement . . . . . . . . . . . . . . . . 217
4.3.1.3 Prominence and acoustic cues . . . . . . . . . . . . 218
4.3.1.4 Prominence and visual cues . . . . . . . . . . . . . 219
4.3.2 Inferential statistics . . . . . . . . . . . . . . . . . . . . . . . 224
4.3.2.1 Correlation . . . . . . . . . . . . . . . . . . . . . 224
4.3.2.2 Number of prominence marks . . . . . . . . . . . . 224
4.3.2.3 Model building and selection . . . . . . . . . . . . . 228
4.3.2.4 Details of minimal adequate model M18 . . . . . . . . 235
4.4 Discussion . . . . . . . . . . . . . . . . . . . . . . . . . . . . . . . 242
5 Experiment II 251
5.1 Introduction . . . . . . . . . . . . . . . . . . . . . . . . . . . . . . 251
5.2 Methodology . . . . . . . . . . . . . . . . . . . . . . . . . . . . . 253
5.2.1 Participants . . . . . . . . . . . . . . . . . . . . . . . . . . 253
5.2.2 Stimuli . . . . . . . . . . . . . . . . . . . . . . . . . . . . . 256
5.2.3 Experiment design . . . . . . . . . . . . . . . . . . . . . . . 256
5.2.4 Hypotheses . . . . . . . . . . . . . . . . . . . . . . . . . . 257
5.2.5 Procedure . . . . . . . . . . . . . . . . . . . . . . . . . . . 258
5.3 Results . . . . . . . . . . . . . . . . . . . . . . . . . . . . . . . . 261
5.3.1 Descriptive statistics . . . . . . . . . . . . . . . . . . . . . . 261
5.3.1.1 Prominence marks . . . . . . . . . . . . . . . . . . 261
5.3.1.2 Inter-rater agreement . . . . . . . . . . . . . . . . 261

Contents
5.3.1.3 Prominence and acoustic cues . . . . . . . . . . . . 263
5.3.1.4 Prominence and visual cues . . . . . . . . . . . . . 263
5.3.1.5 Prominence per sentence: P-score . . . . . . . . . . 265
5.3.2 Inferential statistics . . . . . . . . . . . . . . . . . . . . . . . 272
5.3.2.1 Number of prominence marks . . . . . . . . . . . . 272
5.3.2.2 Model building and model selection procedure . . . . 275
5.3.2.3 Analysis A: Control vs. experimental conditions . . . . 275
5.3.2.4 Analysis B: Control condition ‘Exp0’ . . . . . . . . . 287
5.3.2.5 Analysis C: First condition ‘Exp1’ (intensity and duration) 295
5.3.2.6 Analysis D: Second condition ‘Exp2’ (f 0 and duration) . 305
5.3.2.7 Analysis E: Third condition ‘Exp3’ (duration) . . . . . 315
5.4 Discussion . . . . . . . . . . . . . . . . . . . . . . . . . . . . . . . 328
6 General discussion and conclusions 343
Appendices 358
A Experiment I 358
B Experiment II 372

List of Figures
1 Kendon’s continuum . . . . . . . . . . . . . . . . . . . . . . . . . . 5
2 Nuclear pitch accents . . . . . . . . . . . . . . . . . . . . . . . . . . 123 Patterns of acoustic correlates in Spanish . . . . . . . . . . . . . . . . . 304 Kendon’s continuum in its relation to speech . . . . . . . . . . . . . . . 845 Kendon’s continuum in its relation to conventionalisation . . . . . . . . . 846 Example of gesture performed by a speaker . . . . . . . . . . . . . . . . 857 Kendon’s continuum in its relation to semiosis . . . . . . . . . . . . . . 878 Example of a gesture annotated by Kendon . . . . . . . . . . . . . . . . 1019 Gestural and intonational hierarchies . . . . . . . . . . . . . . . . . . . 10310 Precision grip gestures described by Kendon . . . . . . . . . . . . . . . 11011 Possible head movements . . . . . . . . . . . . . . . . . . . . . . . . 11612 Results of De Ruiter (1998) . . . . . . . . . . . . . . . . . . . . . . . . 12213 Results of Esteve-Gibert and Prieto (2013) . . . . . . . . . . . . . . . . . 12614 Animated agent in Granström et al. (1999) . . . . . . . . . . . . . . . . 13015 Animated agent in House et al. (2001) . . . . . . . . . . . . . . . . . . 13116 Animated agent in Krahmer et al. (2002a,b) . . . . . . . . . . . . . . . . 13217 Animated agent in Munhall et al. (2004) . . . . . . . . . . . . . . . . . . 13418 Animated agent in Al Moubayed and Beskow (2009) . . . . . . . . . . . . 13619 Results of Al Moubayed and Beskow (2009) . . . . . . . . . . . . . . . . 13620 Animated agent in Prieto et al. (2011; 2015) . . . . . . . . . . . . . . . . 13821 Stills of the recorded speakers in Swerts and Krahmer (2004) . . . . . . . . 13922 Results of Krahmer and Swerts (2007, experiment 3) . . . . . . . . . . . . 142

List of Figures
23 Stimuli presented in Swerts and Krahmer (2008, experiment 2) . . . . . . . 14424 Stimuli presented in Foxton et al. (2010) . . . . . . . . . . . . . . . . . . 147
25 P-scores calculated in Mo (2008a) . . . . . . . . . . . . . . . . . . . . . 16026 Di�erent possible structures for random e�ects . . . . . . . . . . . . . . 17327 Statistical methods in psycholinguistics and corpus linguistics . . . . . . . 17528 Normal density curve . . . . . . . . . . . . . . . . . . . . . . . . . . 17629 Logistic regression . . . . . . . . . . . . . . . . . . . . . . . . . . . 17830 Manipulation of f 0 . . . . . . . . . . . . . . . . . . . . . . . . . . . 20031 Sample screen of ELAN annotation . . . . . . . . . . . . . . . . . . . . 203
32 I. Sample screen of experimental task . . . . . . . . . . . . . . . . . . . 21633 I. Occurrences of gestures according to articulator . . . . . . . . . . . . . 22034 I. Sample of gesture sequence . . . . . . . . . . . . . . . . . . . . . . 22135 I. Correlation between prominence marks and sentence length . . . . . . . 22436 I. Signi�cant di�erences per modality and condition . . . . . . . . . . . . 22637 I. Signi�cant di�erences per gesture phase . . . . . . . . . . . . . . . . 22738 I. Odds ratios in model M18 . . . . . . . . . . . . . . . . . . . . . . . 23639 I. Main e�ects in model M18 . . . . . . . . . . . . . . . . . . . . . . . 23940 I. Interactions in model M18 . . . . . . . . . . . . . . . . . . . . . . . 241
41 II. Details of participants: age . . . . . . . . . . . . . . . . . . . . . . 25442 II. Details of participants: musical training . . . . . . . . . . . . . . . . 25543 II. Sample screens of experimental tasks . . . . . . . . . . . . . . . . . 26044 II. P-scores for target sentences . . . . . . . . . . . . . . . . . . . . . . 26845 II. Signi�cant di�erences per modality and condition . . . . . . . . . . . 27346 II. Signi�cant di�erences per gesture phase . . . . . . . . . . . . . . . . 27447 II. Odds ratios in model G17 . . . . . . . . . . . . . . . . . . . . . . . 28048 II. Main e�ects of minimal adequate model G17 . . . . . . . . . . . . . . 28349 II. Odds ratios comparison between Experiment I and Experiment II . . . . 28650 II. Odds ratios in model �020 . . . . . . . . . . . . . . . . . . . . . . . 29051 II. Main e�ects and interactions in model �020 . . . . . . . . . . . . . . . 29252 II. Odds ratios for competitive model �016 . . . . . . . . . . . . . . . . . 293

List of Figures
53 II. Odds ratios in model �113 . . . . . . . . . . . . . . . . . . . . . . . 29854 II. Main e�ects and interactions in model �113 . . . . . . . . . . . . . . . 30155 II. Odds ratios for competitive model �112 . . . . . . . . . . . . . . . . . 30356 II. Odds ratios in model �215 . . . . . . . . . . . . . . . . . . . . . . . 30857 II. Main e�ects in model �215 . . . . . . . . . . . . . . . . . . . . . . . 31058 II. Interactions in model �215 . . . . . . . . . . . . . . . . . . . . . . . 31159 II. Odds ratios for competitive model �216 . . . . . . . . . . . . . . . . . 31260 II. Participants according to gender in Exp2 . . . . . . . . . . . . . . . . 31461 II. Odds ratios in model �318 . . . . . . . . . . . . . . . . . . . . . . . 31962 II. Main e�ects in model �318 . . . . . . . . . . . . . . . . . . . . . . . 32063 II. Interaction in model �318 . . . . . . . . . . . . . . . . . . . . . . . 32164 II. Odds ratios for competitive model �319 . . . . . . . . . . . . . . . . . 32265 II. Participants according to gender in Exp3 . . . . . . . . . . . . . . . . 32566 II. Odds ratios comparison of Experiment II . . . . . . . . . . . . . . . . 32666 II. Odds ratios comparison of Experiment II . . . . . . . . . . . . . . . . 327
A1 I. Historgrams of f 0 . . . . . . . . . . . . . . . . . . . . . . . . . . . 367A2 I. Histograms of intensity . . . . . . . . . . . . . . . . . . . . . . . . 368A3 I. Histograms of duration . . . . . . . . . . . . . . . . . . . . . . . . 369A4 I. Plot of residuals in �18 . . . . . . . . . . . . . . . . . . . . . . . . 370A5 I. Informed consent form . . . . . . . . . . . . . . . . . . . . . . . . . 371
B1 II. Sample screens with the instructions for the online experiment . . . . . 377B2 II. Historgrams of f 0 . . . . . . . . . . . . . . . . . . . . . . . . . . . 380B3 II. Histograms of intensity . . . . . . . . . . . . . . . . . . . . . . . . 381B4 II. Histograms of duration . . . . . . . . . . . . . . . . . . . . . . . . 382B5 II. Plots of residuals in models �17, �020, �113,�215, and �318 . . . . . . . . 383

List of Tables
1 Acoustic correlates of prominence and perceptual cues . . . . . . . . . . . 3
2 Results of Mahrt et al. (2012) . . . . . . . . . . . . . . . . . . . . . . . 293 Results of Pamies (1997) . . . . . . . . . . . . . . . . . . . . . . . . . 404 Results of Vogel et al. (2016) . . . . . . . . . . . . . . . . . . . . . . . 465 Linguistic features in automatic detection of prominence . . . . . . . . . . 736 Summary of gesture classi�cations . . . . . . . . . . . . . . . . . . . . 1137 Results of Ambrazaitis and House (2017) . . . . . . . . . . . . . . . . . 150
8 Summary of previous methodologies . . . . . . . . . . . . . . . . . . . 1579 Fictitious data from a study on word recognition . . . . . . . . . . . . . 16710 Summary of estimation methods in GLMMs . . . . . . . . . . . . . . . . 18111 References for �� values . . . . . . . . . . . . . . . . . . . . . . . . . 18712 Hypothetical ranking of a set of models . . . . . . . . . . . . . . . . . . 18813 Acoustic measurements . . . . . . . . . . . . . . . . . . . . . . . . . 204
14 I. Experimental design . . . . . . . . . . . . . . . . . . . . . . . . . . 21415 I. Cross-table of prominence marks and inter-rater agreement . . . . . . . 21816 I. Distribution of marks of prominence . . . . . . . . . . . . . . . . . . 21817 I. Prominent words according to gesture phase . . . . . . . . . . . . . . 22218 I. Random e�ects for M9 and M10 . . . . . . . . . . . . . . . . . . . . 23119 I. Summary of AIC results for models . . . . . . . . . . . . . . . . . . . 23420 I. Results of �xed e�ects in model M18 . . . . . . . . . . . . . . . . . . 23721 I. Results of �xed e�ects in model M19 . . . . . . . . . . . . . . . . . . 241

List of Tables
22 II. Details of inter-rater agreement . . . . . . . . . . . . . . . . . . . . 26223 II. Distribution of prominence marks . . . . . . . . . . . . . . . . . . . 26324 II. Prominent words according to gesture phase . . . . . . . . . . . . . . 26425 II. Example of cumulative prominence marks . . . . . . . . . . . . . . . 26626 II. Summary of AIC results for models . . . . . . . . . . . . . . . . . . 27927 II. Results of �xed e�ects in model G17 . . . . . . . . . . . . . . . . . . 28228 II. Summary of AIC results for models . . . . . . . . . . . . . . . . . . 28929 II. Results of �xed e�ects in model �020 (Exp0) . . . . . . . . . . . . . . 29130 II. Results of �xed e�ects in model �016 (Exp0) . . . . . . . . . . . . . . 29331 II. Summary of AIC results for models . . . . . . . . . . . . . . . . . . 29732 II. Results of �xed e�ects in model �113 (Exp1) . . . . . . . . . . . . . . 29933 II. Results of �xed e�ects in model �112 (Exp1) . . . . . . . . . . . . . . 30234 II. Summary of AIC results for models . . . . . . . . . . . . . . . . . . 30735 II. Results of �xed e�ects in model �215 (Exp2) . . . . . . . . . . . . . . 30936 II. Results of �xed e�ects in model �216 (Exp2) . . . . . . . . . . . . . . 31237 II. Summary of AIC results for models . . . . . . . . . . . . . . . . . . 31738 II. Results of �xed e�ects in model �318 (Exp3) . . . . . . . . . . . . . . 31839 II. Results of �xed e�ects in model �319 (Exp3) . . . . . . . . . . . . . . 322
A1 I. Details of the 50 sentences from the corpus . . . . . . . . . . . . . . . 363A2 I. Details of prominence marks per speaker and listener . . . . . . . . . . 364A3 I. Details of prominence marks for words and word categories . . . . . . . 365A4 I. Details of gestures per articulator . . . . . . . . . . . . . . . . . . . . 366
B1 II. Details of participants . . . . . . . . . . . . . . . . . . . . . . . . . 375B2 II. Details of target sentences used . . . . . . . . . . . . . . . . . . . . 378B3 II. Details of prominence marks for words and word categories . . . . . . . 379

Introduction
While speaking, humans do not only communicate through speech, but they
also nuance, enhance, or disambiguate the information they convey by means
of gestures. It is this interplay between both modalities, the auditory and the
audiovisual, that gives language a fuller and more expressive dimension.
Gesture and speech are tightly integrated and both modalities belong to a
single system of communication (Kendon, 2004). The synchrony of gesture and
speech at a semantic, pragmatic, and phonological level is proof of this close
connection (McNeill, 1992), and the deep roots that both modalities share might
go back to early stages in the evolution of human language (Armstrong et al.,
1995; Burling, 1993; Cartmill et al., 2012; Gentilucci & Corballis, 2006; McNeill,
2012; Pika et al., 2007).
It has also been shown that gestures have much in common with prosody in
their potential for adding non-discrete nuances, thus serving interactive func-
tions and facilitating comprehension, for which the term audiovisual prosody
has been adopted (for a review see Krahmer & Swerts, 2009). Furthermore, ges-
tures have also been found to possess similar prominence-increasing e�ects to
those of speech (Swerts & Krahmer, 2008), and prominence marking is one of the
many possible interactions between audiovisual prosody and verbal prosody.
1

Introduction
The main topic of this investigation is prominence. As a perceptual concept,
prominence is a bottom-up phenomenon whose perception by the listener de-
pends on acoustic-phonetic, linguistic and contextual factors. The concept of
prominence is extensively present in the literature, but unfortunately it is not
possible to �nd a consistent de�nition of it. The word prominence often appears
as a synonym of a great variety of other terms such as emphasis, lexical stress,
nuclear accent, prosodic focus, pitch accent, intensity peak, etc., depending on
the perspective and the research framework under which it is invoked. As a �rst
attempt, the de�nition given by Terken and Hermes (2000, p. 89) might serve
as a generic template from which it is possible to further build a more precise
de�nition of prominence: “a linguistic entity is prosodically prominent when
it stands out from its environment by virtue of its prosodic characteristics”.
Thus, this template might be �ne-tuned within a certain research framework by
replacing the place-holders in italics with more precisely de�ned terms (Wag-
ner et al., 2015). Within the phonetic perspective used in this research, the term
prominence is equated with acoustic perceptual salience, so henceforth a word is
said to be prosodically prominent when it is acoustically salient within a sentence
(also known as phrasal stress, prosodic stress, or accent) by virtue of the interplay
between the acoustic correlates involved in its production and perception: fun-
damental frequency (f 0), intensity, and duration. Nevertheless, as described in
the literature, prominence can also refer to lexical stress—the acoustic perceptual
salience of a syllable within a word—, and research into prominence as phrasal
stress has often been addressed in relation to, and on occasions confounded with,
lexical stress.
The acoustic correlates of prominence just mentioned correspond to the per-
ceptual cues of pitch, loudness, and length, respectively, which are perceived by
2

Introduction
the listener from the speech signal (Table 1). However, other elements can also
be taken into account in an attempt to bring the complexity of the acoustic fea-
tures of prominence to a more tangible and measurable reality, e.g. excursion
and shape of f 0, spectral tilt, etc. Throughout this work, if possible, a distinc-
tion will be made between the terms ‘correlate’ and ‘cue’, the former referring
to production, the latter referring to perception. In the literature, however, the
acoustic cues of prominence are often named by the respective correlates in-
volved in their production, and instead of pitch, loudness, and length, the terms
f 0, intensity, and duration are preferred.
Perceptual cue Acoustic correlate to be measured Measure unit
Pitch Fundamental frequency (f 0) Hertz (Hz)
Loudness Intensity Decibels (dB)
Length Duration Seconds (s)
Table 1: Relation between the acoustic correlates of prominence and their corresponding perceptual
cues.
The production of prominence by the speaker through a speech signal that
contains di�erent acoustic features is a bottom-up phenomenon whose percep-
tion by the listener is never categorical but continuous. Thus, the acoustic cor-
relates are the physical realisation of prominence. The listener combines the
information that the correlates provide with his or her expectations based on the
knowledge they have of the language in order to decide which parts of the sen-
tence are of special interest in the communicative process and to consider them
as prominent.
From a linguistic-functional perspective, research on prominence mostly fo-
cuses on the linguistic functions it encompasses, e.g. information structure, con-
textual givenness, word order, etc. (e.g. Baumann & Roth, 2014; Bocci & Avesani,
3

Introduction
2011; D’Imperio, 1998; Vainio & Jarvikivi, 2006; Watson et al., 2008). In this case,
prominence is conveyed by the speaker according to their syntactic and lexical
knowledge and/or to their semantic and pragmatic intentions, and it is a common
recourse used inmany languages such as Spanish, English, or Dutch, for example,
to structure information and disambiguate a message (e.g. Gundel & Fretheim,
2004; Féry & Krifka, 2008; Vallduví & Engdahl, 1996). However, in many other
languages a di�erent word order or an alternative formulation is preferred (e.g.
Donati & Nespor, 2003; Leonetti & Escandell-Vidal, 2009; Szaszák & Beke, 2017;
Szendrői, 2001). So in Spanish, for example, where clitic pronouns (e.g. me, te,
se, etc.) do not often receive prominence, the sentence *Me vio (‘She saw me’) is
rather rendered by a di�erent structure: Me vio a mí / Fue a mí a quien vio (‘It
was me she saw’).
Apart from the literature on the acoustic correlates just mentioned, there
exists a growing body of research on the visual correlates of prominence (e.g.
Al Moubayed & Beskow, 2009; Granström et al., 1999; De Ruiter, 1998; Dohen &
Lœvenbruck, 2009; Krahmer et al., 2002a,b; Krahmer & Swerts, 2007; Leonard &
Cummins, 2010; Loehr, 2007; Munhall et al., 2004; Prieto et al., 2011). Not only
is the perception of prominence mediated by the interplay of acoustic correlates
such as f 0, intensity, and duration, but multimodal information in the form of
eyebrow movements, head nods, and manual co-speech gestures also provide
important cues to detect prominence.
Gesture is at our disposal, next to speech, as a medium of expression. How-
ever, the wide range of its expressive capacity cannot be easily pinned down
to a �xed typology. Recent interest in the subject has resulted in an extensive
criteria for classifying and dividing the phenomenon of gesture into di�erent
4

Introduction
types. In the literature, gesture is usually de�ned as spontaneous, often unwit-
ting body movements accompanying speech and performed with �ngers, hands,
arms, eyes, eyebrows, face, head, or trunk. These movements are also known as
gesticulation (Kendon, 1982) and di�er in fundamental ways from the gestures
performed in pantomime, from those known as emblems, and from the gestures
used sign languages. According to their increasing degree of conventionalisation
bodymovements can be classi�ed in the so-called Kendon’s continuum (McNeill,
1992)1 (Figure 1). The Kendon’s continuum will be dealt with in more detail in §
2.3.2.
Gesticulation � Emblems � Pantomime � Sign Language
Figure 1: Kendon’s continuum.
At the left end, gestures appear to be holistic in their mode of expression
and users rarely produce them consciously. At the right end, gestures of sign
languages show compositionality and lexical structure, and users produce them
conventionally to communicate. This study focuses on gesticulation, i.e. the
spontaneous movements performed by speakers with di�erent body parts while
speaking. In keeping with the literature the most commonly used term of ges-
tures will be used to refer to them. As for the term co-speech gestures, it is worth
noting that it is predominantly used in reference to those gestures performed
exclusively with the hands.
The perceptual e�ects of the acoustic correlates of prominence have tradi-
1 With this name McNeill pays homage to Kendon, who �rst described this ordering of ges-
tures in 1983 in a paper published in Kendon, 1988.
5

Introduction
tionally been identi�ed with those mostly produced by fundamental frequency
(f 0) (e.g. Beckman, 1986; Fry, 1958; Gussenhoven et al., 1997; Pierrehumbert,
1980). However, some controversy exists around how the perceptual salience
of a syllable or a word from their environment is produced by the participa-
tion of also intensity, and duration (e.g. Ortega-Llebaria & Prieto, 2011; Silipo &
Greenberg, 2000).
This study aims at analysing how gestures and speech relate to each other in
prominence perception. Recent research into the visual component of commu-
nication has started to cast light on the visual correlates of prominence and their
interactionwith verbal prosody (e.g. AlMoubayed et al., 2011; Beskow et al., 2006;
Foxton et al., 2010; Granström et al., 1999; Kim et al., 2014; Krahmer & Swerts,
2007; Kushch & Prieto Vives, 2016; Prieto et al., 2015; Scarborough et al., 2009;
Swerts & Krahmer, 2008). As a result, it has been observed that visual cues in
the form of manual and facial gestures result in both stronger production and
stronger perception of verbal prominence (e.g. Krahmer & Swerts, 2007; Swerts
& Krahmer, 2008).
So, the questions addressed in this study are:
1. How do the di�erent acoustic correlates relate to one another and to ges-
tures in the perception of prominence?
2. How do gestures contribute to the perception of prominence?
This investigation also wishes to contribute in two more ways to the on-
going research conducted in the �eld. Firstly, studies on the multimodal per-
ception of prominence exist for French (Dohen & Lœvenbruck, 2009), Swedish
6

Introduction
(House et al., 2001), Dutch (Krahmer & Swerts, 2004), and Catalan (Prieto et al.,
2011, 2015), but research on Spanish is still pending. For this reason, this invest-
igation has Castilian Spanish as its laguage of study. Secondly, most methods
applied to date to the study of multimodal prominence perception have used an-
imated agents (e.g. Krahmer et al., 2002a,b; Prieto et al., 2011) or experimental
settings with controlled speech stimuli (e.g. Dohen & Lœvenbruck, 2009; Krah-
mer & Swerts, 2007). Nevertheless, some limitations are inherent to both ap-
proaches, most notably, the ecological validity and the generalisation of results.
In addition, perception studies with both animated agents and elicited gestures
in controlled settings have limited themselves to analyse only certain gestures.
Consequently, this might be the reason why the interaction of the acoustic cor-
relates of prominence in multimodal perception is a research question that has
not been addressed yet. Therefore, in order to complement the current state of
the art and increase the ecological validity of experimental research, the present
study use spontaneous speech material. Such speech material has been extrac-
ted from a television talent show and is employed as stimuli in two experiments
involving prominence judgements by naïve listeners, i.e. listeners that have not
been previously trained in the phonetics and phonology of Spanish prosody.
Previous studies on prominence perception have applied a binary prominence-
marking task (prominent vs. non-prominent) for word pairs (House et al., 2001),
short sentences with two target words (Krahmer & Swerts, 2007), or read-aloud
sentences (Streefkerk et al., 1997). Similarly, some authors have conducted per-
ception experiments with naïve listeners (e.g. Cole et al., 2010; Mo, 2008a,b). In
this study on the multimodal perception of prominence in Spanish, naïve listen-
ers conduct a marking task in which words are labelled in a binary scale (prom-
inent vs. non-prominent). These words available for marking are presented in
sentences uttered by di�erent speakers engaged in a spontaneous converstation.
7

Introduction
In summary, this study aims at understanding the role played by di�erent
acoustic correlates in the perception of prominence in Spanish, both in the pres-
ence and absence of visual cues in the form of gestures performed with hands,
head, and eyebrows. The outline of this thesis is as follows: Chapter 2 reviews
the literature on the acoustic, linguistic, and gestural correlates of prominence,
respectively. Chapter 3 is devoted to review previous methodologies and statis-
tical methods, and it describes both the preparation of the stimuli and the ex-
perimental task devised for the experimental part. Chapter 4 presents the pilot
study on prominence perception conducted with naïve listeners in order to as-
sess the stimuli and the methodology—its goal is to evaluate the validity of this
new methodological approach and obtain some provisional results. Chapter 5
gives a detailed account of the second experiment, in which each experimental
condition is analyses separately in order to answer the research questions. The
conclusions are presented in chapter 6.
8

Literature review
Prominence and Language
2.1 Acoustic correlates of prominence
This section o�ers a brief review of some basic concepts stemming from pros-
ody research and gives an account of themost signi�cant acoustic landmarks that
characterise the linguistic phenomenon of prominence. The initial importance
ascribed to f 0 competed with the alternative view that it was rather vocal e�ort
and intensity the correlates that were responsible for the acoustic realisation of
prominence. The role of duration, as the third main correlate of prominence, is
also discussed. This is followed by a review of studies that reconsider the relative
role of f 0, intensity, and duration, as a result of the partial confusion between the
correlates of lexical stress and phrasal stress originated in prior experimental re-
search. Finally, the section closes with a description of the most relevant studies
dealing with prosodic prominence in Castilian Spanish.
9

Literature review: prominence and language
2.1.1 Introduction
Prominence perception is a complex process that results from the interaction
of several factors. Among them, prominence is perceived through the acoustic
information of the speech signal produced by the speaker. The listener combines
the information present in the speech signal with his or her expectations. The
knowledge of the language by the listener allows them to decide which parts
of the sentence are of special interest in the communicative process and can be
considered prominent.
In order to study acoustic prominence a correlation must be found between
its physical variables and the articulatory and perceptual criteria able to be meas-
ured (Table 1). In addition, experimental research must choose the appropriate
speech element to conduct the measurements on: whether word, syllable, syl-
labic group, or phoneme; elements that are always perceived as prominent re-
spect to their environment.
Research into the acoustic correlates of prominence has mainly focused on
the acoustic correlates of fundamental frequency (f 0), duration, intensity, and
to a lesser extent, spectral characteristics, and vowel quality. In addition, these
acoustic correlates of prominence involved in the realisation of prominence have
sometimes been assumed to hardly vary in the case of prominence perception.
As Heldner puts it: “The reliability of acoustic correlates is not the same as the
reliability of perceptual cues” (2003, p. 57). Di�erences in the production and
perception of prominence are important, as are also important the di�erences
between lexical stress and phrasal/sentential stress, two phenomena that have
been confounded on certain occacions (e.g. Huss, 1978; Ortega-Llebaria & Prieto,
2007; Sluijter et al., 1997).
10

Literature review: prominence and language
2.1.2 Prominence: lexical stress and pitch accents
In intonational languages, and di�erently frompitch-accent languages, where
lexical di�erences rely on pitch contrasts, prominence occurs at least at a word
level as well as at a phrase/sentence level. In the �rst case, stress is a phono-
logical characteristic of the lexical item and marks the relative prominence of
syllables within the word. For this reason, ‘stress’ is also known in the literature
as ‘lexical stress’ or ‘lexical prominence’. Early work on the acoustic correlates
of prominence focused on the acoustic di�erences of words such as object (noun)
and object (verb), two words contrasting in meaning according to their di�erent
stress patterns. Such stress contrasts also exist in Spanish, for example, in verbs,
which encode tense, person, and mode (e.g. paroxytone vs. oxytone words: llevo
vs. llevó, or even proparoxytone vs. paroxytone vs. oxytone: límite vs. limite vs.
limité)1.
In the case of phrase/sentence stress, the stressed syllable of a word may
also carry a pitch accent by virtue of either the position the word occupies or
by possessing some special semantic or pragmatic value. A pitch change mostly
involves a maximum or aminimum in f 0. This phenomenon is also known as ‘ac-
cent’, ‘sentence stress’, ‘prosodic stress’, or ‘prosodic prominence’. For example,
certain words can bear a pitch accent to emphasise their relative importance in
the sentence in a contrastive way, e.g. She was wearing ������ trousers vs. She
was wearing yellow ��������. Both words yellow and trousers can bear a promi-
nent pitch accent on their respective �rst syllables depending on which word is
the object of focus.
Additionally, another realisation of prominence is produced by f 0 excursions,
1 Llevo (1st person sg. present indicative, ‘to carry’) vs. llevó (3rd sg. person past indicative,
‘to carry’). Límite (noun, ‘limit’) vs. limite (1st / 3rd person sg. present subjunctive, ‘to limit’) vs.
limité (1st person sg. past, ‘to limit’).
11

Literature review: prominence and language
either as a rise or a fall, or as a combination of the two, associated to pitch ac-
cents in phrase boundaries (e.g. Beckman & Pierrehumbert, 1986; Pierrehumbert,
1980). The most common cross-linguistic pattern for f 0 excursions is to fall on
the primary stressed syllable in the rightmost content word of an intonational
unit, which if sentence-�nal, distinguishes between di�erent intonation patterns,
i.e. declaratives, yes-no questions, etc. For example, the two sentences Julia is
coming (declarative) and Julia is coming? (surprise question) are di�erent in their
realisation of the �nal pitch contour: a �nal pitch fall in the �rst case, and a �-
nal sudden pitch rise in the second (Figure 2). When this pattern occurs, pitch
accents, together with a boundary tone, are known as nuclear pitch accents and
are obligatory components of intonational units.
In the study of the acoustic correlates of prominence the methodological dis-
tinction betweenword level and phrase/sentence level was not initially addressed
(e.g. Fry, 1955, 1958; Bolinger, 1958; Huss, 1975; Nakatani & Aston, 1978; Sluijter
et al., 1997; Ortega-Llebaria, 2006; Ortega-Llebaria & Prieto, 2011). The initial use
of minimal noun/verb pairs (e.g. object vs. object) made the one-word-sentences
of experimental tasks become the bearers of a pitch accent, which confounded
the acoustic correlates involved in both types of prominence.
(a) Julia is coming. (b) Julia is coming?
Figure 2: Same sentence as a declarative sentence (a) with an �nal pitch fall and as a surprise
question (b) with a �nal pitch rise.
12

Literature review: prominence and language
2.1.3 The initial importance of f 0
Fundamental frequency re�ects the fundamental periodicity of the soundwave
of speech in cycles per second, i.e. the lowest frequency at which the vocal cords
vibrate, and it correspond to the �rst harmonic of the speech signal. It is usu-
ally abbreviated as f 0 and is measured in Hertz (Hz). Fundamental frequency is
tightly related to the perception of pitch, and the melodic contour of an utterance
can be set against measurable changes in the f 0 curve, yet there is not a linear re-
lationship between f 0 and perceived pitch. It is also possible to conduct measure-
ments using a musical scale and express Hertz in semitones. Nonetheless, other
units of measurement are possible, such as equivalent rectangular bandwidth
(ERB) and bark scale, for example, both re�ecting actual auditory perception.
The in�uential research conducted by Fry in the 50’s on lexical stress led him
to establish that a higher f 0 was more relevant for the production and percep-
tion of lexical stress than other prosodic features as duration and intensity. In a
�rst experiment, Fry (1955) measured duration and intensity of stressed vowels
in minimal noun/verb pairs (e.g. object vs. object) and then analysed listeners’
perception of synthesized words that varied along these parameters. Di�erences
in responses given by listeners were used to measure the e�ectiveness of the
varied parameters in cueing stress on the �rst syllable respect to the second one.
Thus, Fry found that a great variation in intensity from paroxytone to oxytone
words accounted for very few responses reporting stress on the �rst syllable.
This was not the case, however, for duration, whose variation made listeners
identify stress on the �rst syllable more consistently.
In a second experiment, Fry (1958) repeated the same procedure, but this time
he compared f 0 and duration. By combining di�erent patterns of duration and
f 0, he concluded that f 0 had an ‘all-or-none e�ect’, so that the syllable coinciding
13

Literature review: prominence and language
with a higher peak f 0 or a f 0 movement was consistently perceived as stressed,
while syllables with lower pitch accents were not. Since stressed syllables in
stress languages usually bear pitch accents towhich listeners are highly sensitive,
Fry considered that “sentence intonation is an over-riding factor in determining
the perception of stress and that in this sense the fundamental frequency may
outweigh the duration cue” (1958, p. 151). Thus, he considered intensity as a
weaker cue of stress than duration, and duration as a weaker cue than f 0.
Additionally, several studies conducted by Bolinger (1955; 1958) following
Fry’s work reinforced the idea that stress was mostly perceived as a result of
di�erent f 0 con�gurations and also considered intensity and duration as non-
relevant cues for the perception of prominence. Bolinger used the term ‘pitch
accent’ instead of ‘stress’ in order to o�er a more comprehensive account of the
phenomenon he studied. Bolinger developed a pitch accent theory and held that
three main tonal con�gurations were responsible for perceived prominence. For
him, di�erently from tenets held in the generative �eld (Chomsky &Halle, 1968),
pitch accents were a property of intonation.
Similar ideas for the main role of f 0 were supported also by other authors
(e.g. Beckman, 1986; Morton & Jassem, 1965; Pierrehumbert, 1980). Conversely,
in the discussion initially sparked by Fry, studies by Lehiste and Peterson (1959)
and Lieberman (1960) insisted on the interplay of f 0, intensity, and duration in
cueing lexical stress. For example, Lieberman defended that all three correlates
had to be considered together. In a study using similar methodologies as those
used earlier by Fry, Lieberman concluded that there was not possible to identify
a single acoustic correlate of stress, but it was consistently rendered by greater
duration and higher average of both f 0 and intensity.
14

Literature review: prominence and language
2.1.4 An alternative: articulatory e�ort and intensity
Although intensity and duration were generally considered as less relevant
than f 0 in the perception of prominence, the confusion between the correlates
of lexical stress and phrasal stress contributed to give f 0 a preponderant role.
However, around the same time Fry published his results, an alternative view
was put forward, which defended that stressed syllables were distinguished from
unstressed ones by means of the perceived articulatory e�ort their production
involved (Fónagy, 1958; Ladefoged et al., 1958; Lehiste & Peterson, 1959; Nav-
arro Tomás, 1964)2. This view was reminiscent of a linguistic tradition dating
back to the early 20th century, when the concept of force accent (also known in
French as accent d’insistence) was associated with physiological force and was
opposed to that of melodic accent (Sievers, 1901; Stetson, 1928; Sweet, 1877). In
this sense, little after the publication of Fry’s studies, Lehiste and Peterson (1959),
conducted an experiment using vowels recorded both with the same vocal e�ort
and with di�erent vocal e�ort but with the same intensity. The researchers asked
participants to judge the relative loudness of the vowels rather than their stress,
and they concluded that listeners identi�ed those vowels producedwith a greater
amount of vocal e�ort as louder than those with greater intensity. Similarly, Mol
and Uhlenbeck (1956) found that reversing the intensity values of the stressed
and unstressed syllables of a word did not a�ect listeners’ stress perception.
Initially, the role of vocal e�ort competed with the importance given to f 0 by
Fry and Bolinger. Although the perceptual e�ects of intensity were not deemed
important enough at the time, more recent studies have reconsidered its role in
the perception of prominence, and di�erent researchers have insisted on it being
2 Strictly speaking, this correlate is not acoustic but physiological and is responsible for
transforming aerodynamic energy into acoustic energy. Its importance in this debate and its
close relationship with the acoustic correlate of intensity justify its inclusion in this section.
15

Literature review: prominence and language
a reliable correlate of stress (Beckman, 1986; Kochanski et al., 2005; Kohler, 2005;
Lea, 1977; Ortega-Llebaria, 2006; Sluijter et al., 1997; Tamburini, 2003; Terken,
1991; Terken & Hermes, 2000; Turk & Sawusch, 1996).
Intensity, which is associated to variations in speech loudness, can also be
seen as amplitude changes in the speech signal. Thus, intensity corresponds to
the amount of energy present in a sound resulting from variations in the pres-
sure of air coming from the mouth either at a pulmonic, glottal, or articulatory
stage. Intensity is measured in decibels (dB), and di�erent ways to capture its
perceptual e�ect have been proposed: e.g. intensity maxima, corresponding to
peaks of amplitude in the speech signal; or overall intensity, which combined
peak amplitude and duration across the syllable (Beckman, 1986), which was
later criticized for confounding both correlates (Sluijter et al., 1997).
Despite the fact that listeners have been observe to be able to perceive small
changes in amplitude (e.g. Sorin, 1981), it has also been pointed out that inten-
sity seems too vulnerable to noise and other environmental factors for it to have
communicative signi�cance. The conditions and the quality of the recording,
the position of the speaker in relation to the recording microphone, and even the
emotional content of the utterance have been claimed to a�ect intensity percep-
tion (Sluijter et al., 1997). The initial idea put forward by several authors that
articulatory e�ort is more a reliable correlate of stress was reconsidered again in
the 90’s. For example, Sluijter and her colleagues (Sluijter & vanHeuven, 1996a,b;
Sluijter et al., 1997) suggested that it is actually the di�erent distribution of in-
tensity along the spectrum of frequencies what better captures the variation of
loudness in the production and perception of lexical stress. According to them,
“intensity in the mid-frequency range contributes more to perceived loudness
than intensity above 5 kHz and, especially, below 0.5 kHz” (1996a, p. 2472), and
re�ects more realistically articulatory e�ort. Thus, spectral tilt, i.e. the distri-
16

Literature review: prominence and language
bution of intensity throughout the spectrum (also known as ‘spectral slope’, or
‘spectral balance’), is the relation existing between the intensity found in the
higher frequencies of the spectrum respect to the intensity found in the lower
frequencies. Similarly, the term spectral emphasis is used with a very similar
meaning, i.e. the di�erence between the overall intensity and the intensity in a
low-pass �ltered signal (Eriksson & Heldner, 2015; Eriksson et al., 2016; Heldner,
2001, 2003).
2.1.5 Duration
As previously seen, duration was considered by Fry (1955; 1958) as second in
importance after f 0 but as a more reliable cue than intensity in signalling lexical
stress. Conversely, some authors considered duration as the most robust cue of
lexical stress (e.g Cutler & Darwin, 1981; Isenberg & Gay, 1978).
Duration is tightly linked to the concept of segmental length (also ‘segmental
quantity’) in metrical phonology theory, so that in many languages lexical stress
depends mostly on the segmental composition of the syllable rhyme (nucleus,
and optionally coda) (e.g Fudge, 1969; Halle & Vergnaud, 1987; van der Hulst,
1985; Prince & Smolensky, 1993). In stress-timed languages, such as English
(Pike, 1945), the sequence of a series of strong syllables together with weak
syllables is called a metrical foot (Halle & Vergnaud, 1987; Liberman & Prince,
1977). Conversely, in syllabic-timed languages, such a Spanish, where there are
no phonological di�erences in quantity/weight, this alternation does not exist,
and each metrical foot has the same length. In addition, in English, for example,
the unaccented vowels of weak syllables are subject to quantity reduction, which
can eventually lead to their partial or full deletion (Delattre, 1966).
Therefore, how di�erent language rhythms are realized as well as other fea-
tures of a language’s phonological system in�uences how duration exerts an ef-
17

Literature review: prominence and language
fect on both lexical and phrasal stress (e.g. Bagdasarian & Vanyan, 2011; Prieto
et al., 2012; Ramus et al., 1999). For example, Prieto et al. (2012) compared Eng-
lish (a stress-timed language) with Spanish (a syllable-timed language) and also
included Catalan, which is considered to possess rhythmic properties of both
languages. In their study, after controlling for syllable structure, they found that
di�erences in duration patterns for lexical stress were partly due to the rhythmic
di�erences of each language. A similar conclusion stress was reached by Bag-
dasarian and Vanyan (2011) for phrasal in a study comparing Armenian and Eng-
lish.
Despite the fact that in many languages stressed and accented syllables tend
to be longer than unstressed ones, it has been made clear that cross-linguistic
di�erences exist. For example, in Thai, a tone language, lexical stress is signalled
uniquely by duration (Potisuk et al., 1996) and not by f 0, as in Polish (Dogil,
1999). In addition, a study comparing segmental duration of stressed syllables in
Swedish, English, and French found di�erent patterns of segmental lengthening
for each of these languages (Fant et al., 1991). In French, lengthening was ob-
served in both the stressed vowel and the preceding consonant, while in Swedish
lengthening a�ected rather the stressed vowel and the following consonants. In
English, this lengthening was more balanced between the vowel and both the
preceding and following consonants. Besides, the duration of syllables was ob-
served to be more uniform in French, a syllable-timed language, due partly to
a shorter e�ect of the lengthening on the stressed syllable than in English and
Swedish.
Another e�ect of the rhythmic and phonological properties of languages on
prominence is vowel reduction. In many cases, and typically in stress-timed lan-
guages, unstressed syllables su�er vowel reduction. This is an e�ect of duration
and intensity a�ecting vowel quality, so that reduced vowels tend to be shorter
18

Literature review: prominence and language
and quieter than stressed opened vowels (e.g. van Bergem, 1993; Fry, 1965; Ri-
etveld & Koopmans-van Beinum, 1987). In English, for example, vowel quality
has proved a more reliable acoustic correlate of stress than in Dutch (Sluijter &
van Heuven, 1996a,b; Sluijter et al., 1997), a language that also has vowel reduc-
tion. It has also been observed that in post-focal unaccented contexts, the small
di�erences in duration between stressed and unstressed syllables do not allow
English listeners to perceive stress if it is not in the presence of reduced vowels
(Beckman & Edwards, 1994; Campbell & Beckman, 1997; Huss, 1978).
Duration can also interact with other correlates of prominence. For example,
when complex pitch con�gurations coincide on a single syllable, some languages
tend to truncate their pitch contour, while others opt for compressing it in order
to fully realise it (Grabe et al., 2000). From these di�erent strategies it has been
observed that syllables bearing a complex pitch accent are longer than those
bearing a simpler one in languages resorting to compressing their pitch contour
(Gili-Fivela, 2006; Prieto & Ortega-Llebaria, 2009).
2.1.6 Disentangling stress from accent
At some point it was evident that studies on prominence perception had used
target words occurring in the focal position of utterances, a position where both
word-level stress (lexical stress) and phrase-level stress (pitch accents) coincide
in languages typologically classi�ed as intonational languages such as English,
Dutch, or Spanish. In this prosodic context, stressed syllables tend to attract pitch
accents, while unstressed syllables do not. This type of co-variation between lex-
ical stress and pitch accent was observed to have an e�ect on stress perception,
and which may vary across languages, depending, for example, on the pitch ac-
cent distribution of each speci�c language (Hellmuth, 2007). The consequence
of this confusion was that research into the acoustic correlates of prominence
19

Literature review: prominence and language
confounded word-level and phrasal-level stress.
Some studies in the late 70’s addressed the issue by analyzing the correl-
ates of lexical stress in unaccented post-focal contexts (Huss, 1975, 1978; Na-
katani & Aston, 1978). For example, Nakatani and Aston (1978) used a similar
experimental paradigm to that of Fry. However, in their case, they embedded
disyllabic pseudo-words preceded by accented adjectives within meaningful sen-
tences. They observed that listeners perceived the manipulated stress patterns
of the target pseudo-words by means of duration rather than of f 0, while inten-
sity proved useless as a cue to stress. Similarly, Huss (1978) observed that f 0 lost
its e�ect as a correlate of lexical stress in unaccented contexts. Later, Beckman
and Edwards (1994) examined words with stressed and unstressed vowels both in
focal and post-focal contexts and concluded that duration was a consistent cor-
relate of stress at word level, while f 0 changes were mainly associated to phrasal
stress.
The evidence gainedwith these studieswere taken into account in subsequent
research and were later extended. Sluijter and van Heuven (1996a), for example,
addressed the issue and contested the theoretical position held by Beckman and
Edwards (1994) by stating that in stress-accent languages:
“Stress is a structural, linguistic property of a word that speci�es
which are the potential docking sites for accent placement. They
have an accent-lending pitch movement associated with them when
they occur within a single word in a narrow focus. In our view, stress
is therefore determined by the language system, and accent by lan-
guage behavior” (Sluijter & van Heuven, 1996a, p. 2471).
Therefore, subsequent studies on lexical stress in unaccented contexts for
other languages made that pitch movement was seen as a correlate of phrasal
20

Literature review: prominence and language
stress rather than of lexical stress. It was con�rmed that stressed syllables were
consistently longer than unstressed ones in the absence of pitch accents, and
duration became then a more important correlate in the realisation and percep-
tion of lexical stress (for German, Dogil & Williams, 1999; for Spanish, Ortega-
Llebaria, 2006; for Romanian, Manolescu et al., 2009; for Dutch, Sluijter & van
Heuven, 1996a; Sluijter et al., 1997).
In addition, it was also reported that pitch accents are not crucial for lexical
stress perception in both accented and unaccented contexts (Ortega-Llebaria &
Prieto, 2011; Sluijter et al., 1997; Turk & Sawusch, 1996). As a consequence, the
role of f 0, intensity, and duration as acoustic correlates of prominence—both
lexical stress and phrasal stress—were reconsidered.
2.1.7 Acoustic correlates of prominence revisited
2.1.7.1 Reconsidering the role of intensity
In several studies, Sluijter and van Heuven (1996a; 1996b; 1997) investigated
the hierarchical relations among various acoustic correlates of both lexical and
phrasal stress in Dutch and compared them with those of American English.
They showed that the stressed syllable of unaccented words was cued acoustic-
ally through di�erences in duration and spectral balance, while overall inten-
sity was a stronger cue of accent rather than stress—together with f 0—in both
languages (Sluijter & van Heuven, 1996b). Similarly, on the perceptual side, un-
accented stressed syllables in Dutch and American English were perceived by
means of longer duration, greater spectral balance, and absence of vowel reduc-
tion, even without the presence of a pitch accent (Sluijter et al., 1997).
In their turn, Kochanski and his colleagues (2005) also studied perceived
prominence in di�erent varieties of British English. In their experiment, four
21
Literature review: prominence and language
expert listeners marking for binary prominence at a syllable level without dis-
tinguishing between lexical and phrasal stress were more sensitive to intensity
and duration as acoustic cues of prominence than to f 0. Furthermore, one im-
portant �ndingmade by Turk and Sawusch (1996) was not only that duration and
intensity are processed as a unit in stress judgements by listeners, but also that
minimal variations of duration have a larger e�ect on the perception of loudness
than minimal variations of intensity in the perception of syllable length. In this
sense, it was observed that duration, or duration and intensity, can be correlates
of lexical stress but not intensity alone.
In this sense, the di�erent possible measurements re�ecting perceived loud-
ness have more recently been examined. Since the �rst proposals of articulatory
e�ort as an alternative to f 0, and due to the fact that the role of intensity has
always proved inconsistent, several authors proposed di�erent measurements
to operationalise perceived loudness. Beckman (1986), for example, measured
intensity as a combination of both peak intensity and duration across the syl-
lable, which was criticized for potentially confounding both intensity and dura-
tion (Sluijter et al., 1997). Instead, it was suggested that spectral tilt (or spectral
balance), i.e. the degree of intensity in the higher frequency regions in relation
to that in the lower frequency ones, is a better correlate of lexical stress, while
overall intensity is a stronger correlate of accent (Sluijter & van Heuven, 1996b;
Sluijter et al., 1997).
Later, Heldner (2003), in an experiment to automatically detect focal words
in Swedish, con�rmed that, next to overall intensity, spectral tilt was also an
acoustic correlate of accent. He also pointed out that overall intensity positively
co-varies with f 0, so that when f 0 increases so does intensity and vice versa.
On the other hand, in two studies to also automatically detect phrasal stress
in American English conducted by Silipo and Greenberg (1999; 2000), even the
22

Literature review: prominence and language
role of f 0 as an acoustic correlate of accent was questioned. Both authors used
two linguistically trained listeners that marked words on a 3-point scale, and
they concluded that intensity as well as duration of vowels were stronger cues
of phrasal stress than f 0 and f 0 range.
2.1.7.2 Reconsidering the role of f 0
After the initial importance given to f 0 and the subsequent research on the
role played by other acoustic correlates of prominence, a traditional view has
consistently defended the more crucial role of this correlate in cueing promi-
nence in English and other languages (e.g. for English and Japanese, Beckman,
1986; Pierrehumbert, 1980; for Dutch, Terken, 1991).
This view has gone hand in hand with studies using speech resynthesis, with
research into the automatic extraction and labelling of prosodic features, and
with the development of text-to-speech synthesis (e.g. Gussenhoven et al., 1997;
Gussenhoven & Rietveld, 1998; Kießling et al., 1996; Portele & Heuft, 1997; Silipo
& Greenberg, 1999; ten Bosch, 1993; Terken, 1996; van Kuijk & Boves, 1999;
Wightman & Ostendorf, 1994; Kohler, 2008). In such a research context, the
theoretical basis of a model of intonation was necessary for better understand-
ing how prominence is realized and perceived. Thus, the relationship between
pitch accents and f 0 was addressed from di�erent theoretical approaches, e.g.
IPO intonation grammar (’t Hart et al., 1990), auto-segmental metrical (AM) ap-
proach to intonation (Pierrehumbert, 1980; Silverman et al., 1992), the Kiel Into-
nationModel (KIM) (Kohler, 1991; Kohler et al., 1997; Kohler, 2006), theMixdor�-
FujisakiModel of German Intonation (MFGI) (Mixdor�, 1998;Mixdor�&Widera,
2001).
As a result, the study of prominence continued focusing almost exclusively
on the perceptual e�ects of changes in f 0. One of the �ndingsmade in the context
23

Literature review: prominence and language
of this research concerned the perceptual declination of f 0. By varying the height
of pitch accents, it was observed that the initial words in an utterance have to
have larger peak heights if they are to be perceived with the same prominence
as the words at the end (e.g. Cohen et al., 1982; Gussenhoven & Rietveld, 1988;
Pierrehumbert, 1979; Terken, 1996).
Additionally, Gussenhoven and Rietveld (1988) and Gussenhoven et al. (1997)
examined the relation between maxima and minima of f 0 and the perception of
relative prominence of accent in Dutch. They observed that the perception of
accent is in�uenced by the distance between each pitch maximum and the pro-
gressive degree of declination of the baseline. The perceptual e�ect of this phe-
nomenon was compared by Terken (1991; 1994) with the relative magnitude of
changes in f 0. Terken’s analyses revealed that neither the di�erence between
f 0 maxima nor the f 0 baseline can by itself drive the perception of accented syl-
lables in both sentence �nal and sentence non-�nal position, but that prominence
is actually cued by the complex interplay of both dimensions of f 0.
After the studies conducted in the 70’s to disentangle lexical from phrasal
stress (§ 2.1.6) and the contribution of Sluijter and van Heuven (1996a; 1996b;
1997) (§ 2.1.7.1), two experiments conducted by Heldner and Strangert (1997)
questioned the role of f 0 in the perception of phrasal stress. Both studies in-
volved the manipulation of the f 0 contour in naturally produced sentences in
Swedish. In the �rst study, the f 0 rise on focused words in phrase-medial posi-
tion was reduced; in the second one, the size of the f 0 rise of non-focused word
in phrase-medial position increased. Target words in narrow focus were embed-
ded in answer sentences prompted by questions. The results obtained showed
that phrasal stress can be perceived in the absence of an f 0 rise, and, by the same
token, that an f 0 rise can conversely be perceived as non-prominent.
Nevertheless, Kohler (2008) obtained results for the role of f 0 that were di�er-
24

Literature review: prominence and language
ent to those of e.g. Kochanski et al. (2005). Kohler conducted a study in German
with a methodology that was reminiscent of that of Fry’s minimal noun/verb
pairs. He synthesized the syllable ba and duplicated it in the disyllabic pattern
baba, whose levels of f 0, duration, and overall intensity he manipulated. The
perception experiment that he conducted revealed, in a similar way to Fry’s ex-
periments with isolated words, that f 0 was the most important cue to induce
listeners to shift prominence from the second to the �rst syllable, with a minor
role of duration and intensity. The role of the latter two correlates in cueing lex-
ical stress was later analysed by Kohler (2012) in another perception experiment
using the word pair Ka�e/Café in German in an unaccented context within a car-
rier sentence. Kohler concluded that no hierarchy can be determined as to what
correlate has a preponderant role. For him, it is the prosodic context created by
each segmental sequence what determines the interaction of correlates.
2.1.7.3 Reconsidering the role of duration
Besides, Kohler carried out another experiment (2005), in which he analysed
the acoustic correlates of phrasal stress focusing on a theoretical di�erence between
pitch accents and force accents using the Kiel Intonation Model (KIM) as a frame-
work. According to this model, next to a pitch accent, it is necessary to include
a ‘force accent’ category capturing the greater physiological and articulatory ef-
fort characteristic of emphatic and emotional speech (e.g. Kohler, 2003). Related
research conducted mainly in German has reported that force accents show a
di�erence in segmental duration respect to pitch accents, with longer onset seg-
ments in force accents but longer syllable nucleus in pitch accents (e.g. Peters,
2005). From the results of his perception experiment, Kohler concluded that:
“Force accents constitute a separate accent category with at least
three phonetic features – onset duration, energy, and voice quality –
25

Literature review: prominence and language
in speech production, and that they are equally relevant in percep-
tion, albeit only duration has been formally tested, the relevance of
the other two being deduced from the results.” (Kohler, 2005, p. 119).
In two successive perception experiments, Mo (2008a; 2008b) analysed the
acoustic correlates of phrasal stress (and phrase boundaries) in English as per-
ceived by naïve listeners. In her studies two elements stand out that set them
apart from previous research and that are also relevant for this investigation.
First of all, Mo used a corpus of English spontaneous speech (Buckeye corpus,
Pitt et al., 2007). Secondly, the perception of phrasal stress was operationalized
as the pooled transcriptions done in real time by 74 naïve listeners (see Mo et al.,
2008, for details), so that words marked as prominent in the sentence was as-
signed a probabilistic P(rominence)-score corresponding to the probability of its
prosodic perceptual salience (see e.g. Cole et al., 2010; Swerts, 1997, for similar
methods). After measuring the acoustic values of several correlates of promi-
nence, Mo (2008a) observed that the acoustic measures most strongly correlated
with prominent words were duration and spectral tilt. Next to duration, Mo
(2008b) also reported the uneven cueing e�ect that overall intensity had on prom-
inence perception in the case of certain vowels. Finally, an important conclusion
resulting from both studies was that neither duration nor intensity su�ced to
cue phrasal stress in all the analysed prosodic contexts (14 stressed vowels), but
that prominence was perceived by means of the interaction of various acoustic
cues.
Finally, a series of studies conducted by Ortega-Llebaria and Prieto analysed
the acoustic correlates of lexical and phrasal stress in Spanish andCatalan (Ortega-
Llebaria, 2006; Ortega-Llebaria & Prieto, 2007, 2009, 2011; Ortega-Llebaria et al.,
2007; Prieto & Ortega-Llebaria, 2006). Although the details of their research will
be discussed in more detail in the section devoted to the correlates of prominence
26

Literature review: prominence and language
in Castilian Spanish (§ 2.1.8.7), their results indicate that duration is a consistent
correlate in the realisation of lexical stress in both accented and unaccented con-
texts in Spanish. The researchers reported that accented stressed syllables were
longer than unaccented stressed syllables; and the latter were longer than unac-
cented unstressed syllables. Besides, they observed that di�erent phones had dif-
ferent lengthening e�ects in stressed syllables, which also conditioned listeners’
perception of lexical stress (Ortega-Llebaria, 2006; Ortega-Llebaria et al., 2007).
Furthermore, vowel quality and spectral tilt were found to play a role in cue-
ing lexical stress contrasts, while overall intensity was a reliable correlate of ac-
cent in Spanish (Prieto & Ortega-Llebaria, 2006). However, they pointed out that
the e�ect of overall intensity was independent of f 0, i.e. higher overall intensity
does not result from a positive co-variation with f 0 in Spanish (Ortega-Llebaria
& Prieto, 2007) as it has previously claimed (Heldner, 2003; Mo, 2008a). The role
of f 0 was found to be consistent in the realisation of pitch accents, so that while
unaccented stressed vowels showed a �at pitch contour—together with longer
segments than in unstressed syllables—, the presence of an accent changed f 0
to a rising trajectory and also lengthened the syllable (Ortega-Llebaria, 2006). A
similar conclusion was later reached for the lengthening e�ect of f 0 on syllable
duration through the realisation of a complex pitch pattern (Prieto & Ortega-
Llebaria, 2009)3.
3 However, in a di�erent study, Ortega-Llebaria and Prieto (2007) reported that the realisation
of a pitch accent did not necessarily involve the lengthening of the stressed syllable, and they
concluded that “while duration is a crucial acoustic cue tomark a lower level prominence contrast
(stressed vs. unstressed), it is a secondary (and thus optional) acoustic marker of a higher-level
prominence contrast (accented vs. unaccented)” (Ortega-Llebaria & Prieto, 2007, p. 172).
27

Literature review: prominence and language
2.1.7.4 Reconsidering the perceptual threshold of prominence
Later, Mo’s collaborators (Mahrt et al., 2011, 2012) used the prominence tran-
scriptions previously obtained by Mo (2008) from the Buckeye Corpus (Pitt et al.,
2007) to put to the test the traditional assumption that the di�erent acoustic cor-
relates involved in cueing phrasal stress are perceived in a binary way. The P-
scores obtained previously, which show the degree of prominence of a given
word, were found to usually cluster around a low P-score or a high P-score end
of a continuum. More precisely, Mahrt et al. found that not all correlates had the
same partition point along this P-score continuum, but some positively corre-
lated with a low, while others did so with a high P-score threshold. Thus, having
di�erent P-score thresholds, some of the tested correlates were best explained
by di�erent Gaussian distributions, i.e. two-Gaussian distributions with either
a low or a high P-score threshold. For example, intensity was observed to be
perceived in a binary way with a predominance of low P-scores (in the same
way as normalized log f 0). Conversely, raw f 0 values had a high P-score, and
word duration was best modelled by a single distribution along the continuum
(Table 2). Following their results, Mahrt et al. argued that some listeners might
be more attuned to di�erent acoustic features, but if perception is assumed to be
consistent across listeners, then a more logical conclusion is that prominence is
not binary, but either gradient or at least having a three-way distinction. Finally,
the authors further suggested that this fact might be due to a di�erent realisation
of prominence in the cases of contrastive focus and broad focus.
28

Literature review: prominence and language
Acoustic measure Threshold
Log word frequency Low
Duration of the last vowel Low
Max intensity of the last vowel Low
Root Mean Square (RMS) intensity of the last vowel Low
Min intensity of the last vowel Low
Min intensity of the stressed vowel Low
Log mean f 0 of the stressed vowel (z-scores) Low
Log max f 0 of the stressed vowel (z-scores) Low
Stressed vowel duration High
Max f 0 of the stressed vowel (z-scores) High
Mean f 0 of the stressed vowel (z-scores) High
Word duration None
Log word duration None
Table 2: Summary of Mahrt et al.’s results (2012) showing two-Gaussian distributions for the tested
acoustic measures, with either a low or a high P-score threshold.
2.1.8 Correlates of prominence in Castilian Spanish
2.1.8.1 Cross-linguistic di�erences
As mentioned in the previous section, the acoustic correlates of prominence
present cross-linguistic di�erences. It is generally accepted that both higher f 0
and larger f 0 excursions are associated to a prominence increase of syllables and
words in many languages (e.g. Astésano et al., 2004; Barbosa et al., 2013; Beck-
man & Pierrehumbert, 1986; Dogil, 1999; Gussenhoven et al., 1997; Pierrehum-
bert & Beckman, 1988; Terken, 1991, 1994). However, in other languages, as in
Italian, f 0 is lower throughout stressed syllables (Eriksson et al., 2016). In the
case of Castilian Spanish, similar to Italian, a �at pitch contour, together with
longer duration and stronger intensity, characterise stressed syllables in unac-
cented contexts, while accented stressed syllables are associated to higher f 0,
29
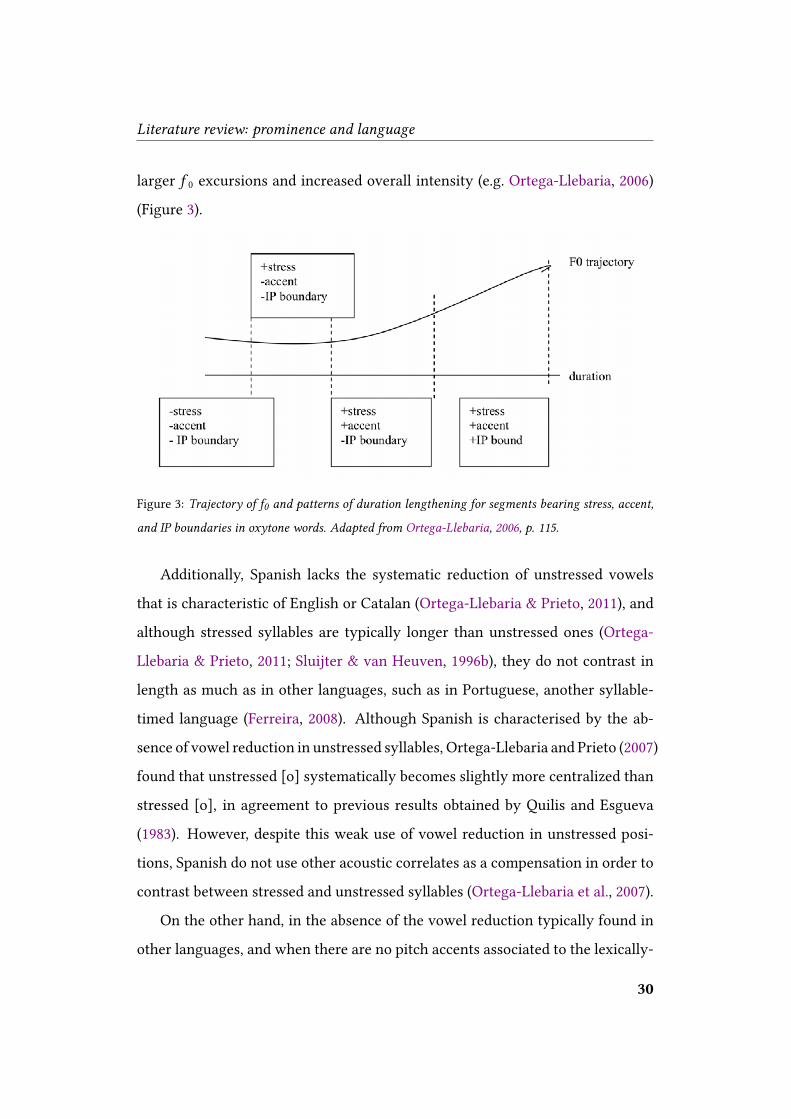
Literature review: prominence and language
larger f 0 excursions and increased overall intensity (e.g. Ortega-Llebaria, 2006)
(Figure 3).
Figure 3: Trajectory of f0 and patterns of duration lengthening for segments bearing stress, accent,
and IP boundaries in oxytone words. Adapted from Ortega-Llebaria, 2006, p. 115.
Additionally, Spanish lacks the systematic reduction of unstressed vowels
that is characteristic of English or Catalan (Ortega-Llebaria & Prieto, 2011), and
although stressed syllables are typically longer than unstressed ones (Ortega-
Llebaria & Prieto, 2011; Sluijter & van Heuven, 1996b), they do not contrast in
length as much as in other languages, such as in Portuguese, another syllable-
timed language (Ferreira, 2008). Although Spanish is characterised by the ab-
sence of vowel reduction in unstressed syllables, Ortega-Llebaria and Prieto (2007)
found that unstressed [o] systematically becomes slightly more centralized than
stressed [o], in agreement to previous results obtained by Quilis and Esgueva
(1983). However, despite this weak use of vowel reduction in unstressed posi-
tions, Spanish do not use other acoustic correlates as a compensation in order to
contrast between stressed and unstressed syllables (Ortega-Llebaria et al., 2007).
On the other hand, in the absence of the vowel reduction typically found in
other languages, and when there are no pitch accents associated to the lexically-
30

Literature review: prominence and language
stressed syllable in nuclear and pre-nuclear positions, lexical stress in Spanish is
perceived by means of duration and intensity cues, similarly to Dutch. However,
in perception Spanish speakers do not rely on spectral tilt like Dutch speakers
do but on overall intensity and duration (Ortega-Llebaria et al., 2007; Sluijter
et al., 1997). Nevertheless, the lengthening of duration cues by the e�ect of pitch
accents seems controversial, since Ortega-Llebaria and Prieto (2007) claim that
the presence of a pitch accent does not consistently trigger additive e�ects on
the duration cues4, although Sluijter and van Heuven consider that it does in the
case of English (1996a) and Dutch (1996b), while Beckman and Edwards (1994)
pointed out that the lengthening pattern varied across speakers and speech rates.
2.1.8.2 The confusion of the Spanish acento
Descriptions of Spanish used to refer to the acoustic correlate responsible
for cueing lexical stress with the term ‘acento de intensidad’, which was based
on earlier theoretical accounts of the physiological force associated to articu-
latory e�ort. This was opposed to the contrastive e�ects resulting from pitch,
which in Spanish was referred to as ‘acento de altura’, ‘acento melódico’, ‘acento
tonal’, or even ‘acento contextual’. Researchers insisting on this di�erence fol-
lowed closely the discussions held in other circles, as previously seen, in which
‘force accent’ was opposed to ‘melodic accent’ (e.g Sievers, 1901; Stetson, 1928;
Sweet, 1877). For example, Navarro Tomás (1918; 1964), along with some others
(e.g. Cuervo, 1874; Gallinares, 1944), considered that an increase in local inten-
sity was responsible for the Spanish ‘acento’, while other authors held that the
‘acento’ was realized by a slight lengthening of the stressed vowel, together with
a small f 0 rise (Bello, 1847/1860; Real Academia Española, 1959). In the former
4 But see results of Ortega-Llebaria (2006) for oxytonewords, which are summarised in Figure
3.
31

Literature review: prominence and language
view, vowel lengthening and f 0 rise were often thought to be a consequence
of the articulatory e�ort that the ‘acento de intensidad’ involved (Cuervo, 1874;
Martínez Amador, 1954).
In addition, research into the acoustic correlates of prominence in Spanish
has traditionally su�ered from the same confusion between lexical stress and
phrasal stress mentioned in the previous section (§ 2.1.6). Even more so since
the Spanish word ‘acento’ could equally refer to acento léxico (lexical stress) or
acento tonal (phrasal stress o pitch accent, a word with which ‘acento’ bears close
resemblance)5. Thus, this confusion did not help determine more clearly the role
played by the acoustic correlates of prominence in Spanish. For example, as late
as the mid-80’s a more accurate de�nition of the Spanish term was called for so
that research e�orts become more e�ective:
“Está claro que un enfoque experimental del problema del acento
requiere una formulación más rigurosa de la de�nición y utilización
del término”6 (Solé, 1984, p. 138).
And a clari�cation of the term was o�ered in the subsequent lines, where it
is equated with ‘lexical stress’:
“Por una parte empecemos por determinar que el acento es un fenó-
meno que se da en las sílabas, y que las sucesivas variaciones en la
relación entre las sílabas acentuadas y no acentuadas constituyen el
esquema rítmico de la frase, de la misma manera que las variaciones
5 Throughout this section, the Spanish word ‘acento’ is purposefully used to illustrate this
ambiguity.6 ‘It is without doubt that an experimental approach to the issue of the “acento” demands a
more accurate formulation of its de�nition as well as a more precise use of the term.’
32

Literature review: prominence and language
en las relaciones de tono forman el esquema entonativo”7 (Solé, 1984,
p. 138-139).
Yet, although it was generally accepted that lexical stress and phrasal stress
were two separate but interrelated phenomena, the precise nature of their rela-
tion was not clear:
“Cualquier intento de estudiar los factores en la percepción del acento
sin tratar de contestar algunas preguntas sobre la entonación de las
frases es incompleto. La pregunta más importante es si la entonación
de frase es tan fuerte como para prevalecer sobre los otros factores
en la percepción acentual”8 (Solé, 1984, p. 150).
A case in point of this confusion can be found in the �rst acoustic study on
the correlates of prominence for Spanish, which was conducted by Bolinger and
Hodapp (1961) following the work on English carried out by Bolinger himself a
few years earlier (Bolinger, 1955, 1958). In their study, Bolinger and Hodapp set
out to study the Spanish ‘acento’ by means of an experiment in which a series
of sentences were recorded with di�erent combinations of tone realisations and
intensity levels for vowels occurring more than once in the sentence. In the
experimental task, and according to the di�erent acoustic cues applied in the
stimuli, participants had to identify the narrow focus that disambiguated the
7 ‘For a start, let’s establish that “acento” (i.e. lexical stress) is a phenomenon of stressed
syllables, and the continuous variations between stressed and unstressed syllables make up the
rhythmic pattern of the sentence in the same way as variations in tone make up the intonational
pattern.’8 ‘Any attempt to analyse the elements involved in the perception of the “acento” (i.e. lexical
stress) without trying to give an answer to some aspects of intonation is incomplete. The most
important question is whether sentence intonation is so strong as to prevail over the elements
responsible for stress perception.
33

Literature review: prominence and language
sentence they had been presented with. Bolinger and Hodapp, also with the
help of spectrograms, concluded that the perceptual e�ects of f 0 (more precisely,
changes in the f 0 trajectory) were a stronger correlate of ‘acento’ than intensity,
and also duration. However, what Bolinger and Hodapp actually tested was the
e�ects of the acoustic correlates of phrasal stress resulting from pitch accents.
More than thirty years later, when Solé (1984) conducted a study named “Ex-
perimentos sobre la percepción del acento” (‘Experiments of the perception of
the acento’) (italics added), she surprisingly cited Bolinger and Hodapp’s study
as the �rst acoustic study of this phenomenon in Spanish. However, di�erently
from Bolinger and Hodapp, Solé analysed the perceptual e�ects of the acous-
tic correlates of lexical stress, for which she used synthesized pseudo-words in a
similar experimental paradigm to that of Fry (1955; 1958).
2.1.8.3 The initial debate over the role of intensity
The work by Bolinger and Hodapp (1961) prompted a series of studies on
the role of the acoustic correlates of prominence in Spanish. Later, Contreras
(1963), drawing on Bolinger and Hodapp’s study, analysed the perception of
lexical stress in Spanish in both isolated words and target words in short de-
clarative sentences. Firstly, Contreras recorded three pairs of disyllabic words
whose meanings depended on di�erent levels of f 0, intensity, and duration on
the stressed syllable (e.g. papa vs. papá, paro vs. paró, and pego vs. pegó). After
a �rst perception experiment, Contreras repeated the same procedure with the
sameword pairs, although this time she extracted the words from the carrier sen-
tence they had been pronounced in. The results contradicted those of the �rst
experiment and showed that the participants had mixed up some of the word
pairs. For this reason, a third experiment was carried out in a similar way, but
Contreras provided this time the context that the carrier sentences o�ered. In
34

Literature review: prominence and language
her conclusion, Contreras made of f 0 the main correlate of lexical stress in Span-
ish, in line with Bolinger and Hodapp’s initial, and she questioned the alternative
view that the perceptual e�ects of the ‘acento de intensidad’ were more relevant
than those of the ‘acento melódico’.
Interestingly enough, the subsequent discussion over the role of f 0 and inten-
sity was sparked o� when one year later Navarro Tomás (1964) suggested that
Contreras’s results for the perceptual e�ects of f 0 actually re�ected di�erent in-
tonation accents—which was replied shortly after by Contreras (1964)—, and he
insisted on the idea that lexical stress in Spanish was actually mainly produced
by an increase in local intensity.
2.1.8.4 The fundamental role of f 0 observed in subsequent research
After these initial studies on the acoustic correlates of the Spanish ‘acento’,
subsequent research on the topic remained scarce for several decades. In this
sense, the di�erent views on the topic evolved together with the advances in
phonetics. In Quilis’s words:
“En una primera etapa [al acento] se le considera como un es-
fuerzo �siológico y una impresión auditiva: ambos criterios en el
marco de la fonética articulatoria (y auditiva). En el segundo esta-
dio se buscan sus rasgos acústicos dentro de la fonética instrumental.
Por último, se investiga sobre el papel de los índices acústicos contro-
lando las variables que se puedan presentar por medio de la síntesis
del lenguaje y juzgándolas en diversas pruebas de percepción: foné-
tica experimental y psicofonética”9 (Quilis, 1981, p. 321).
9 ‘In a �rst moment, [the Spanish “acento”] is considered a physiological e�ort and an audi-
tory impression: both criteria belong to articulatory (and auditory) phonetics. Later, its acoustic
features are sought within instrumental phonetics. Finally, research is conducted on its acoustic
35

Literature review: prominence and language
Quilis himself addressed the acoustic realisation of lexical stress in Spanish
with a �rst analysis of the vowel quantity in di�erent contexts, including stressed
and unstressed syllables (Quilis, 1965). In a later study on the production and
perception of lexical stress, he focused on the acoustic values of stressed vow-
els using spectrograms, i.e. the �rst harmonic, vowel duration, intensity, and
área de intensidad (‘area of intensity’)10 (Quilis, 1971). The results of these stud-
ies brought him closer to the views held by Bolinger and Hodapp (1961) and
Contreras (1963; 1964), and he concluded that the most important correlate in
both production and perception of the Spanish acento (in this case lexical stress)
was f 0, whether as higher f 0 or as a change in the f 0 trajectory, or even as the
combination of both. Quilis, as Fry (1958) considered that “el índice más impor-
tante para la percepción del acento español es la frecuencia fundamental [...]. La
duración sería el segundo componente”11 (Quilis, 1981, p. 332).
Another perceptual study was conducted later by Solé (1984), as mentioned
above. In a �rst experiment, she analysed the e�ects of duration and intensity
in the perception of synthesized pseudo-words as either oxytone or paroxytone.
With an experimental paradigm similar to Fry’s (1955; 1958), Solé reported that
correlates—while controlling for the variables associated to speech synthesis—, which are ana-
lysed in di�erent perception tests within experimental and functional phonetics.’10 This measurement, whichwas also used in several other studies (e.g Delgado-Martins, 1973;
Santerre & Bothorel, 1969), consisted in editing the oscillogram on graph paper and counting the
squared millimetres under all the amplitude peaks of a cycle. The rationale behind it intended
to account for the perceptual di�erences that might arise by the interaction of di�erent levels
of intensity over time. A similar insight led later Beckman (1986) to put forward an alternative
measure of intensity over duration that was criticized precisely for potentially confounding both
correlates (Sluijter et al., 1997).11 ‘The most important cue for the perception of the Spanish “acento” is fundamental fre-
quency; duration is the second one.’
36

Literature review: prominence and language
small di�erences in both acoustic correlates (only 5 dB in intensity and 10 ms
in duration) were enough for listeners to change their judgment about stress
from the �rst (paroxytone) to the second syllable (oxytone). However, she stated
that both correlates, although su�cient for listeners to identify a change in stress
pattern, were not decisive in cueing lexical stress, but others correlates not tested
in this �rst experiment might also have played a role.
In order to gain more solid insight, Solé conducted a second experiment, in
which, next to the previous two correlates, she also tested the perceptual e�ects
of both f 0 levels and changes in the f 0 trajectory in vowels. Interestingly enough,
based on work previously done by Delattre (1969), Solé considered as minimal
the perceptual e�ects caused by vowel reduction in Spanish and did not explore
further their role in cueing stress. She recorded three pairs of pseudo-words
with di�erent values for the correlates to be tested and administered them to
the participants. Her results showed that f 0—both as f 0 peaks and as changes
in the f 0 trajectory—had a larger perceptual e�ect in cueing lexical stress when
compared both one-to-one to the other tested correlates (intensity and duration)
as well as in any possible combination with them.
Some subsequent studies also supported the role of f 0 as the main acoustic
correlate of lexical stress. This is the case of a perceptual study conducted by
Enríquez and his colleagues (1989) using synthetic speech. By manipulating f 0,
duration, and intensity in isolated words with di�erent stress patterns (oxytone,
paroxytone, and proparoxytone words), they reported that f 0 was the only cor-
relate systematically used by listeners to identify stressed syllables. In addition,
Enríquez and his colleagues concluded that stress identi�cation was also partly
due to the di�erent stress patterns. They observed that duration was an incon-
sistent correlate of stress, especially since segment lengthening in oxytonewords
due to stress was perceived as a prepausal lengthening. Along these lines, it has
37

Literature review: prominence and language
been suggested that listeners are sensitive to di�erent stress patterns because
stress perception in Spanish is partly driven by syllable weight (Face, 2000).
Similar results to those of Enríquez et al. (1989) for the preponderant role
of f 0 were obtained by other authors (e.g. Figueras & Santiago, 1993a,b; Llisterri
et al., 2003b, 2005). For example, Llisterri et al. (2003b; 2005) conducted a series
of studies testing di�erent stress patterns similar to the study of Enríquez and
his colleagues, although Llisterri et al. used resynthesized words from natural
speech instead of arti�cially synthesized words. They also observed that f 0 was
the most robust cue, but only in combination with either duration or intensity.
2.1.8.5 Di�erent insights from other methodologies
Nevertheless, the perceptual e�ect of f 0 in signalling lexical stress in Spanish
was later questioned, especially in studies using methodologies di�erent from
those based on testing isolated words that di�ered in their stress pattern (e.g
Garrido et al., 1993; Pamies, 1997; Ruiz & Pereira, 2010). For example, Garrido
and his colleagues (1993; 1995) compared the role of f 0 in two di�erent contexts,
namely, in read sentences presented both in isolation and within a paragraph.
Their results revealed that f 0 peaks did not fall on the lexically stressed syllable,
but their realisation was delayed, so that f 0 maxima were often aligned on the
adjacent unstressed syllable:
“Los valores máximos de f 0 no parecen ser un correlato impor-
tante a la hora de marcar las sílabas tónicas en la lectura, puesto que
un 80% de las sílabas tónicas no se corresponde con un valor máximo
de f 0. Cabe indicar también que los valores máximos de f 0 aparecen
principalmente en la sílaba posterior a la tónica”12 (Garrido et al.,
1995, p. 189).
12 ‘The maximum values of f 0 do not seem to have one speci�c correlate, since 80% of stressed
38

Literature review: prominence and language
This phenomenon, known as peak delay (also f 0 shift or f 0 displacement), had
been previously observed in Spanish (Navarro Tomás, 1944) and has been docu-
mented as well in other languages (e.g Arvaniti et al., 1998; Gibbon, 1998; Jong,
1994; Xu, 1999)13. The insight that f 0 maxima are not consistently aligned with
stressed syllables, together with the di�erences in duration they found between
stressed and unstressed syllables, made Garrido and his colleagues (1993; 1995)
conclude that duration was a more robust cue of lexical stress in Spanish than f 0,
a view that was also shared by other authors (Canellada & Madsen, 1987; Ríos,
1991).
Another view that questioned the preponderant role of f 0 in the Spanish
‘acento’ was the one held by Pamies (1997), who carried out acoustic measure-
ments on the lexically stressed syllables of several utterances from a multilingual
corpus that had been previously developed (Pamies, 1994). In his methodology,
Pamies applied a coe�cient of syllabic prominence resulting from comparing the
three tested correlates measured in the stressed vowel with those of adjacent un-
stressed vowels. Thus, the positive coe�cient obtained for each correlate—either
alone or in combination—for a given syllable was interpreted as the proof that
stress had been successfully realised.
syllables do not show a f 0 maximum. It is also worth mentioning that f 0 maxima mainly fall on
the post-stressed syllable.’13 This was �rst addressed in the tonal alignment literature partly due to the studies on into-
nation conducted by Bruce (1977) and Pierrehumbert (1980). In the resulting notation developed
within the Auto-segmental Metrical (AM) framework and known as ToBI (Tone and Break In-
dices), peak delay was represented as the L*+H notation, in which the asterisk represents the
alignment of a low tone with the stressed syllable, and the subsequent high tone represents the
rising f 0 trajectory that occurs on the adjacent unaccented syllable. Although the realisation of
f 0 maxima as a delayed peak is often caused by phonetic and contextual factors, cross-linguistic
variation exists (see Gussenhoven, 2004; Prieto et al., 2005, for details).
39

Literature review: prominence and language
Surprisingly enough, among the seven analysed languages, Pamies observed
that negative coe�cients for at least some of the correlates appeared associated
with stressed vowels. This made di�cult to consider just one correlate as the
leading perceptual cue in the face of the other correlates, since each of them
yielded negative coe�cients at some point. For Spanish, stress was cued by only
two correlates in 28% of the cases, and by just one of them in 44% of the cases.
In addition, the no-realisation of stress was observed in 25% of the cases, i.e. the
coe�cient of syllabic prominence was negative for each acoustic correlate alone
and for any possible combination of them. It is worth mentioning that Pamies
excluded from his analysis those cases of stress realised both in sentence-�nal
position and in positions adjacent to another stressed syllable. Finally, from his
results he concluded that, even if Spanish stress is not the result of just one single
acoustic correlate—but an ad hoc combination of more than one—, duration was
found to be the most consistent of all three (Table 3).
Acoustic correlate Alone Combined
Fundamental frequency (f 0) 5% 14%
Intensity 10% 29%
Duration 28% 49%
Table 3: Summary of Pamies’s (1997) results for the role of each tested correlate in cueing lexical
stress in Spanish. Adapted from Pamies, 1997, p. 18.
Studies like these of Garrido (1993; 1995) and Pamies (1997) show that aware-
ness of the interaction between stress and tonal peaks was slowly entering the
debate over the correlates of the Spanish ‘acento’ (e.g. Pamies, 2003; Toledo et al.,
2001), as it had previously occurred for other languages (e.g. Sluijter et al., 1997)
(§ 2.1.6).
40
Literature review: prominence and language
2.1.8.6 Disentangling stress and accent in Spanish
The di�erent role played by the acoustic correlates of prominence both at
lexical and phrasal levels was initially addressed in Spanish by Ortega-Llebaria
(2006), who studied the production of lexical stress in three di�erent contexts,
namely, in unstressed words, in stressed unaccented words, and in stressed ac-
cented words. In her study, target pseudo-words were embedded in di�erent
carrier sentences that had to be repeated by �ve participants with the same into-
nation. In order to test the e�ect of accented and unaccented contexts, Ortega-
Llebaria used declarative sentences with an Intermediate Phrase (IP) boundary
occurring after the stressed accented syllable. She also used parenthetic sen-
tences lacking any IP boundaries, in which the �at intonation and low pitch pre-
vented stressed syllables from bearing a pitch accent. Ortega-Llebaria con�rmed
that in oxytone words lexical stress was produced by means of di�erent acoustic
cues and observed that a stressed syllable followed by an IP boundary su�ered
vowel lengthening and changed its f 0 level (Figure 3).
One important conclusion drawn from Ortega-Llebaria’s study (2006), which
puts in perspective several decades of research into the acoustic correlates of the
Spanish ‘acento’, is that lexical stress should not be studied in isolation outside
the prosodic structure where it occurs and which a�ects its realisation, especially
because stressed syllables serve as anchor points for pitch accents. In this sense,
it has been claimed that “typically (although not always), every lexically stressed
syllable bears a pitch accent of some sort in a Spanish declarative sentence” (Hu-
alde, 2002, p. 5), which contrasts with other languages such as European Por-
tuguese (Frota, 2002).
Despite the fact that research on lexical stress in Spanish has bene�tted from
this insight (e.g. Llisterri et al., 2016), not many studies have further explored or
tried to replicate Ortega-Llebaria’s results (e.g. Ortega-Llebaria & Prieto, 2011;
41
Literature review: prominence and language
Torreira et al., 2014; Vogel et al., 2016). For example, in their study, Llisterri and
his colleagues (2016) complemented the results they had previously obtained for
the acoustic correlates of lexical stress with isolated words (e.g. Llisterri et al.,
2003b, 2005). This time they analysed listeners’ perception of stress by compar-
ing pseudo-words uttered in isolation with the same items extracted from the
carrier sentences in which they had been uttered. The researchers observed that
the perception of lexical stress largely depended both on the lexical stress pat-
tern (oxytone, paroxytone, proparoxytone) and on the relationship between the
acoustic parameters of the stressed vowel and those of adjacent unstressed vow-
els.
2.1.8.7 Support for Navarro Tomás’s acento de intensidad
In addition to the results of Ortega-LLebaria (2006) already mentioned for
Spanish, she also took up one of the questions concerning the perception of Span-
ish stress that had been raised in the early 60’s, namely, the role played by inten-
sity in signalling lexical stress. As previously discussed (§ 2.1.8.4), Bolinger and
Hodapp’s (1961) and Contreras (1963) supported f 0 as the main acoustic correlate
of lexical stress. Little support had been found the idea of stress being prompted
by an increase in overall local intensity, as proposed by Navarro Tomás (1918).
However, Ortega-Llebaria and Prieto found partial support for Navarro Tomás’s
initial hypothesis (2007; 2011, Prieto & Ortega-Llebaria, 2006).
The follow-up study conducted byOrtega-Llebaria et al. (2006),actually o�ered
evidence for the role of intensity in stress perception in Spanish. The research-
ers asked twenty listeners to identify oxytone words in unaccented contexts by
means of the carrier sentence: Hola —saluda (target word) contenta14. In this
case, the target words mamá and mimí varied along two oxytone-paroxytone
14 Hello —says (target word) happily.
42

Literature review: prominence and language
continua: one of them using duration and overall intensity, and the other one,
duration and spectral tilt as acoustic cues.
Ortega-Llebaria et al.’s �ndings (2007) showed that Spanish listeners ignored
di�erences in spectral tilt in unaccented stressed syllables despite contrary res-
ults obtained in production studies: “Thus, in the absence of an accent, cues like
duration and spectral tilt are crucial in the production of Spanish stress” (italics
added) (Ortega-Llebaria & Prieto, 2007, p. 174). On the contrary, they observed
that listeners detected stress contrasts on the basis of di�erences in duration and
overall intensity between stressed syllables and unstressed adjacent syllables.
This is not the case for Dutch, for example, where spectral tilt is preferred along-
side longer duration to perceive lexical stress in unaccented contexts (Sluijter
et al., 1997).
Furthermore, in the same study, Ortega-Llebaria and her colleagues also showed
that vowel type in�uenced stress perception, so that oxytone words were more
easily detected when the stressed vowel was [a] rather than [i]. Their interpre-
tation was that duration and overall intensity are used in an additive manner to
perceive stress contrast for vowel [a], whereas for vowel [i], duration is resorted
to by listeners if overall intensity is not available.
2.1.8.8 Later research into the correlates of prominence in Spanish
The e�orts to disentangle speech from accent in Spanish had led to use par-
enthetic sentences to provide unaccented contexts (e.g. La masa del átomo es
medible —(determino / determinó) complacida15, Ortega-Llebaria & Prieto, 2011).
However, some doubts were raised about the e�ective control of intonation in
such parenthetic phrases. On the one hand, it was argued that this kind of re-
porting sentences rarely appeared in conversational Spanish and, on the other
15 The atom’s mass is measurable —I (con�rm / con�rmed) satis�ed.
43

Literature review: prominence and language
hand, the same unaccented context was better rendered by sentences where tar-
get words occupy a phrasal-medial position (Torreira et al., 2014; Vogel et al.,
2016).
For example, in their study, Torreira et al. (2014) analysed whether the un-
accented context provided in phrasal-medial position leads to the neutralisation
of stress contrasts (oxytone vs. paroxytone) with sentences such as Siempre que
(miro / miró) la hora, ...16. In a study that combined both production and percep-
tion experiments, they con�rmed that lexical stress contrasts were maintained in
the absence of a pitch accent, although they observed a considerable amount of
phonetic overlap between stress patterns. Although longer duration and stronger
intensity characterized the production of lexically stressed words as well as its
perception, the available acoustic correlates were very similar between oxytone
and paroxytone words:
“In production, roughly a quarter of the data could not be clas-
si�ed correctly by a model containing several features such as du-
ration, intensity, voicing and F1; and, in the perception experiment,
listenersmade identi�cation errors in a two-alternative forced-choice
task in 37.1% of the trials” (Torreira et al., 2014, p. 200).
In this sense, Torreira and his colleagues concluded that phonetic contrasts
signalling stress tend to be reduced in spontaneous speech, for which possibly
contextual information is necessary to discriminate lexical stress patterns. The
lack of robust cues that they observed was related to the predictability of stress,
even if Spanish is a free-stress language.
Finally, a cross-linguistic study conducted by Vogel and her colleagues (2016)
contradicted some of the previous studies on prominence production in Spanish.
16 Every time (I look up / she looked up) the time, ....
44

Literature review: prominence and language
The researchers elicited a series of sentences in dialogues providing accented and
unaccented contexts in order to analyse both lexical and phrasal stress. Measure-
ments on a series of vowels (/i/, /a/, /u/) in target words included several acoustic
measurements: mean f 0, f 0 increase over the entire vowel, vowel centralization,
mean duration, and mean intensity.
In the �rst dialogue the target vowel appeared the position of contrastive fo-
cus and therefore bore a pitch accent. In the second dialogue, by shifting phrasal
stress to a post-focus position, the target vowel appeared in an unaccented con-
text. In the examples provided here, the focused word is in boldface, and the
target vowel, on which measurements were taken, is underlined17:
1. Phrasal stress [+accent / ± stress]:
Q: What did Maria say in the afternoon?
A: Maria said “CVCV́CV” / “CVCV́CV” in the afternoon.
2. Lexical stress [-accent / ± stress]:
Q: Did Maria say “CVCV́CV” in the morning?
A: No, Maria said “CVCV́CV” / “CVCV́CV” in the afternoon, not in the
morning.
Applying linear regression, Vogel and her colleagues reported the degree to
which each speci�c context (i.e. ± accent / ± stress) was successfully predicted
by their statistical model, and they speci�ed the contribution of each of the cor-
relates involved in the production of prominence (Table 4).
In the case of Spanish, lexical stress was found to be fundamentally cued by
17 Example adapted from Vogel et al., 2016, p. 13. The actual Spanish dialogue was not
provided by the researchers, who o�ered this English template as a model of the dialogues con-
ducted in each of the tested languages.
45

Literature review: prominence and language
Context Predicted Correlates
[+accent / +stress] 78% Duration (73%), Intensity (65%), Vowel centralization (60%)
[+accent / -stress] 67% Duration (60%), f 0 (60%), Vowel centralization (59%), �f 0 (58%)[-accent / +stress] 89% f 0 (82%), �f 0 (76%)[-accent / -stress] 86% f 0 (86%), �f 0 (81%), Duration (55%)
Table 4: Summary of Vogel et al.’s (2016) results for both phrasal stress and lexical stress. Adapted
from Vogel et al., 2016, pp. 17-18.
mean f 0, which hardly varied between both accented and unaccented contexts,
with a modest contribution of duration in the presence of an accent. In the case
of phrasal stress in an unaccented context, duration was more important, with
a small contribution of f 0 and vowel centralization, but reaching values slightly
above chance level (50%) in the absence of a pitch accent. However, when a pitch
accent was also present, f 0 seemed to play no role and prominence was cued by
duration, intensity, and vowel centralization.
2.1.9 Summary
Acoustic correlates of prominence
For several decades research into the acoustic correlates of prominence has
been linked to a very precise methodology that sought to determine what acous-
tic cues made listeners detect the stressed syllable within a word. Fry (1955;
1958) and Bolinger (1958) paved the way with their seminal experiments for sub-
sequent research and stated that f 0 was more relevant for the production and
perception of lexical stress than duration and intensity.
It was later observed that the target words used in such a methodological
paradigm occurred at the focal position of utterances, so that lexical stress and
the phrasal stress cued by pitch accents were confounded. Huss (1975; 1978)
46

Literature review: prominence and language
and Nakatani and Aston (1978) observed that, in unaccented contexts, f 0 lost
its perceptual e�ect, and duration was more relied upon by listeners to perceive
lexical stress. The perceptual e�ects of f 0 were then considered to cue phrasal
stress through the realisation of pitch accents. Studies in other languages dif-
ferent from English con�rmed that duration was a more important correlate of
lexical stress in the absence of pitch accents (e.g. Dogil &Williams, 1999; Ortega-
Llebaria, 2006; Sluijter & van Heuven, 1996a; Sluijter et al., 1997).
Intensity was also observed to have a more fundamental role than initially
thought, and it was reported to interact with duration in the perception of lexical
stress in unaccented contexts (Turk & Sawusch, 1996; Sluijter et al., 1997). In
addition, spectral balance—the intensity in the higher frequency regions respect
to the that in the lower ones—was considered as a relevant acoustic correlate
of prominence next to overall intensity and was observed to be crucial in cueing
lexical stress in unaccented context together with duration in English and Dutch.
In its turn, overall intensity cued accent (Prieto & Ortega-Llebaria, 2006; Sluijter
& van Heuven, 1996b), together with f 0, rather than stress. Similarly, on the
perceptual side, unaccented stressed syllables were perceived by means of longer
duration, greater spectral balance, and also by the absence of vowel reduction
(Sluijter & van Heuven, 1996a,b; Sluijter et al., 1997).
These results were later con�rmed by Kochanski et al. (2005), although in
their study no di�erence was made between lexical and phrasal stress; and by
Heldner (2003), who included spectral balance as a correlate cueing also phrasal
stress. Subsequently, the role of f 0 was even questioned as an acoustic corre-
late of phrasal stress (Silipo & Greenberg, 2000), while other researchers using a
methodology reminiscent of Fry’s insisted on it being a reliable acoustic cue of
lexical stress (Kohler, 2008).
Duration seemed to play a consistent role as a reliable correlate of lexical
47
Literature review: prominence and language
stress in most studies; also its role as a correlate of phrasal stress was vindicated
by several authors. For example, in sentences from a corpus of spontaneous
speech, Mo (2008a) reported that duration and spectral tilt were the two acoustic
correlates that drove prominence perception in naïve listeners. Ortega-Llebaria
(2006), in her turn, observed that both f 0 and duration increased in the presence
of a pitch accent in Spanish.
On a slightly di�erent note, Kohler (2005) defended that duration is a strong
correlate of what he dubbed as ‘force accents’, a separate catergory of pitch ac-
cents capturing the greater physiological and articulatory e�ort characteristic of
emphatic and emotional speech. For Kohler, force accents are characterised by
longer onset segments—but longer syllable nucleus in pitch accents—aswell as by
stronger energy and articulatory e�ort. In line with Kohler’s proposition, Mahrt
et al. (2011; 2012) explored the possibility that in di�erent contexts, prominence—
e.g. contrastive focus, broad focus—might be produced and perceived through
di�erent acoustic correlates.
Correlates of prominence in Castilian Spanish
The acoustic correlates of prominence present cross-linguistic di�erences. In
the case of Spanish, prominence is rendered by a �at pitch contour, together
with longer duration and stronger intensity for unaccented stressed syllables;
while accented stressed syllables are cued by longer duration, higher f 0, larger
f 0 excursions, and increased overall intensity (Ortega-Llebaria, 2006).
A similar confusion as that observed for other languages between lexical
stress and phrasal stress determined the research into the acoustic correlates of
prominence in the case of Spanish. For example, the important study by Bolinger
and Hodapp (1961) aimed at analysing the correlates of acento (i.e. lexical stress),
but it actually tested the perceptual e�ects of phrasal stress resulting from pitch
48

Literature review: prominence and language
accents. Following into their footsteps, very much as in the debate conducted
for English, most researchers defended the role of f 0 (e.g Contreras, 1963, 1964;
Martínez Amador, 1954; Quilis, 1971), while Navarro Tomás (e.g. 1964) supported
the role of intensity, i.e. ‘acento de intensidad’ as the main correlate of stress.
More recent research has further explored the production and perception of
lexical stress and similar conclusions in favour of f 0 have been made (e.g. Solé,
1984; Enríquez et al., 1989; Figueras & Santiago, 1993a,b; Llisterri et al., 2003b,
2005). Conversely, studies using a di�erent methodology from previous research
observed that: (a) f 0 peaks did not fall on the lexically stressed syllable, but were
often aligned on the adjacent unstressed syllable (e.g. Garrido et al., 1993, 1995;
Llisterri et al., 2003a), and (b) duration was a more important correlate of lexical
stress than previously held (Garrido et al., 1993, 1995; Pamies, 1997).
The confusion between lexical stress and phrasal stress was addressed by
Ortega-Llebaria (2006), who con�rmed that lexical stress should not be studied
in isolation outside the prosodic structure where it occurs. Following this in-
sight, it was reported that Spanish listeners ignored di�erences in spectral tilt
in unaccented stressed syllables (Ortega-Llebaria et al., 2007), di�erently from
�ndings in English and Dutch (Campbell & Beckman, 1997; Sluijter et al., 1997)
and despite contrary results obtained in production studies for Spanish (Prieto
& Ortega-Llebaria, 2006). Rather, Spanish listeners detected contrasts in stress
patterns using duration and overall intensity as cues of lexical stress (Ortega-
Llebaria et al., 2007).
Subsequent research taking into account the prosodic context observed that
the available acoustic correlates of duration and intensitywere very similar between
oxytone and paroxytone words in lexical stress contrasts, as observed in sponta-
neous speech (Torreira et al., 2014).
Finally, the preponderant role of duration, both as a correlate of lexical stress
49

Literature review: prominence and language
and phrasal stress, was con�rmed by Vogel et al. (2016), although they also ob-
served that f 0 contributed to cue both stressed and unstressed syllables in the
absence of pitch accents and that intensity helped duration in cueing accented
stressed syllables, but not accented unstressed ones.
2.2 Linguistic correlates of prominence
This section �rstly presents a summary of basic concepts from studies on
discourse analysis and information structure and provides some context on the
speci�c theoretical frameworks associated to them. Later, the role of prosodic
prominence is discussed in relation to two distinctions commonly made in the
literature: that of given vs. new information and that of (back)ground vs. focus.
In addition, the concept of information ‘accessibility’ is presented as the third
element a�ecting the acoustic realisation of prominence. The second part of
this section deals with the way prosodic prominence is a�ected by the syntactic
structures of utterances. Finally, cross-linguistic di�erences are presented with
especial attention to the case of Spanish.
2.2.1 Introduction
Generally, some particular linguistic elements, such as syllables and words,
stand out from their environment, and this phenomenon is determined by se-
mantic and pragmatic factors and/or a syntactic and lexical component of the
utterance.
Prosody has a perceptual e�ect on the listener’s processing of speech, so that
it often conveys information about the pragmatic content and themeaning inten-
ded by the speaker. As previously seen, prosodic prominence signals the most
salient element in the utterance, whose main role is generally accepted to be
50
Literature review: prominence and language
marking the status of a constituent within the discourse.
It is necessary to mention that one of the key concepts on which the de-
bate turns around in the literature on discourse analysis and pragmatics is sa-
lience (e.g. Chiarcos et al., 2011). The theoretical basis of the term ‘salience’
lies in the notion that those parts of the utterance that are perceived as being
relevant in discourse planning and processing are more activated or accessible
in memory than others. However, in phonetics, phonology, and prosody re-
search, the term ‘prominence’ is more widely used to refer to a contextual re-
lation between the prominent unit and its context. Thus, the term ‘prominence’
will be used throughout this section, even while discussing aspects related to
discourse analysis, semantics and pragmatics.
In the case of syntax, the relationship between prosody and utterance struc-
ture has been addressed from di�erent theoretical frameworks, as in the Auto-
segmental Metrical model (e.g Ladd, 2008; Pierrehumbert, 1980). In this regard,
initial research on the interaction between syntax and prosody, led Chomsky and
Halle (1968) to claim that prominence was assigned to the sentence by means of
phonological rules when its deep structure was transformed to a surface struc-
ture. Bolinger (1972), however, held the di�erent view that there is no systematic
relationship between the prosodic realisation of an utterance and its syntactic
structure. He went on to argue that any theory attempting to deal with promi-
nence assignment in purely syntactic terms was bound to make vacuous claims.
Nevertheless, syntactic and lexical correlates of prominence have been later
used, most notably, in text-to-speech synthesis. In this line of research, one of the
key concepts is that of ‘predictability’. Top-down expectations are based on the
linguistic competence of the listener, and the syntactic marking of prominence
is mainly predicted by word class, word length, and the position a word occupies
in the utterance.
51

Literature review: prominence and language
2.2.2 Semantics, pragmatics and information structure
Prosody is used di�erently across many languages to signal prominence, and
it is structurally linked to the information structure of the utterance (also known
as ‘information packaging’). In its turn, the information in an utterance is organ-
ised in relation to the discourse, i.e. any “coherent multi-utterance dialogue or
monologue text” (Kruij�-Korbayová & Steedman, 2003, p. 249). In this sense, in-
formation structure can be de�ned as theway inwhich each new utterance relates
to an existing discourse, e.g. by altering it or updating the already given infor-
mation. In order to give a successful interpretation of an utterance it is not only
necessary to interprete its logico-semantic meaning—propositional meaning—,
but also its informational meaning—extrapropositional meaning. For example,
alternative syntactic structures with di�erent constituent order and/or intona-
tional structure may express the same propositional content, but “they are not
interpretively equivalent in absolute terms, but rather add some extraproposi-
tional contribution to meaning” (Vallduví & Engdahl, 1996, p. 459).
(1) a. Eva played the piano splendidly at the concert.
b. ��� played the piano splendidly at the concert.
c. It was Eva who played splendidly the piano at the concert.
For example, sentence (1a) is syntactically identical to (1b), but the realisa-
tion of a pitch accent on ‘Eva’ (as showed by the small caps)18 adds a di�erent
extrapropositional meaning, namely, that Eva, and no other person, played the
piano splendidly at the concert. Similarly, the same e�ect is achieved in (1c) by
means of an initial it-cleft clause.
18 Following the literature, in the following examples small caps re�ect prosodic prominence
through the realisation of a pitch accent.
52

Literature review: prominence and language
The relationship and interaction of discourse structure and information struc-
ture is complex, and yet “a theory relating IS [information structure] and DS [dis-
course structure] is essential for accurate natural language processing” (Kruij�-
Korbayová & Steedman, 2003, p. 250).
Despite the abundant approaches and the di�erent terminology, all attempts
to describe information structure make a basic distinction between a more in-
formative part of an utterance and a less informative one. Basically, the nature
of this split and the place where it occurs in the utterance are the matter of con-
tention among di�erent theories. According to Vallduví:
“[...] [I]t could be said that information is concentrated on a sub-
part of the sentence, while the remainder is licensed only as an an-
choring vehicular frame for that informative part to guarantee an
optimal entry into the hearer’s knowledge-store” (Vallduví, 1992, p.
35).
Di�erent theoretical approaches to information structure have referred to
this basic distinction by means of di�erent opposing terms, e.g. theme/rheme
(Firbas, 1964; Halliday, 1967b), topic/comment (Hockett, 1958; Gundel, 1974), topic/focus
(Sgall &Hajičová, 1977, 1978), focus/presupposition (Jackendo�, 1972) or focus/open-
proposition (Prince, 1981).
2.2.2.1 Prosodic prominence and information structure
It is generally accepted that information structure and discourse status in-
teract, although there is a considerable debate over the exact nature of this in-
teraction. Nonetheless, in many languages prosody plays a crucial role in this
process by marking the information status of words and constituents in the ut-
terance. For example, Bolinger (1958; 1961) had remarked that pitch accents serve
53

Literature review: prominence and language
to mark semantic contrasts, and he introduced a distinction between a fall-rise
accent and a falling accent as a way to contrast information in English.
(2) {What about Andrea? Who did she come with?}
[T ������ ] [C came with [F ����� ]].
This di�erence in intonation was related by other authors to topic and focus,
respectively (e.g. Jackendo�, 1972), as in (2), where the topic ‘Andrea’ is uttered
together with a fall-rise pitch accent, and ‘Lucas’ is pronounced with a falling
accent for being the focused item within the comment.
Given/new distinction
Halliday (e.g. 1967a; 1967b) also drew attention to the role of pitch accents
in signalling the basic division between given and new information in English.
According to him, words carrying a pitch accent are commonly seen as referring
to new information, whereas words that are perceived as information already
given in the discourse are said to be ‘deaccented’. However, Halliday (1967b,
p. 204) considered new information as that which “the speaker presents [...] as
not being recoverable from the preceding discourse”, regardless of whether its
referent has been mentioned before.
Experimental research has observed that speech processing was enhanced
when new information was provided to listeners by a co-occurring pitch accent.
For example, Cutler (1976) and Cutler and Foss (1977) con�rmed that the pro-
cessing speed of new information in a focal position was higher if it was ac-
cented. Additionally, Terken and Nooteboom (1987) found that not only speed
processing, but also comprehension improved when this accentuation pattern
was applied. Similarly, a perception experiment on the evaluation and com-
prehension of sentences conducted by Birch and Clifton (1995) found that, for
54

Literature review: prominence and language
simple question-answer pairs, listeners consistently considered more prosodic-
ally appropriate the pattern of accented new information and deaccented given
information.
Nevertheless, it has also been observed that previousmention of a word in the
discourse is not su�cient for already conveyed information to be deaccented, es-
pecially when the simple sentences used as examples in a theoretical framework
are confronted to the spontaneous speech samples of more empirical approaches.
For example, in a study analysing task-oriented speech, Brown (1983) reported
that, although speakers tended to place pitch accents on new information, an
item of given information may be re-introduced into the discourse after some
digressions and be marked by a pitch accent.
Furthermore, in an analysis of a series of corpora for the development of text-
to-speech systems conducted by Hirschberg (1993), it was also observed that,
contrary to expected, previously mentioned information was often found to be
highlighted through a pitch accent. Later, Terken andHirschberg (1994) extended
this observation by studying the deaccentuation of given information in relation
to the syntactic position of an item in the utterance and its grammatical function.
They reported that speakers were likely to accent an item of given infor-
mation if both grammatical function and syntactic position were di�erent from
the antecedent in the immediate context. Conversely, the information item was
more likely to be deaccented if it occupied the same position and had the same
grammatical function as its antecedent.
Another study by Dahan et al. (2002) exploited a visual paradigm using eye-
tracking to analyse the perception and comprehension of pitch accents in the
given/new distinction. In this paradigm, participants are usually presented with
a series of items, and the verbal instructions they receive allow researchers to
track the �xation of their eyes. These instructions are manipulated according to
55

Literature review: prominence and language
the purpose of the study, so that this input is crucial for participants to complete
the task.
In their case, Dahan and her colleagues used this paradigm to study on-line
comprehension of accented information. They asked participants to move two
di�erent objects to di�erent locations on a screen. Two of these objects shared
their initial segments, e.g. ‘candy’ and ‘candle’. By manipulating the given/new
status of one of the items in the instructions provided to participants (3), they
observed how pitch accents were processed to resolve the introduced ambiguity.
(3) a. Put the candle/candy below the triangle.
b. Now put the ������/candle above the square.
Dahan et al. observed that participants tended to �xate their eyes more often
on an new referent when it was uttered with a pitch accent. Conversely, when
the critical target wordwas deaccented, they �xed their eyes in the given referent
instead. Themeasured eye reactions and the di�erences between both conditions
revealed that pitch accents are rapidly detected and quickly integrated into the
discourse representation.
Interestingly enough, deaccentuation of an utterance item that has the poten-
tial to carry a pitch accent can also be used by speakers on some occasions with
an informative purpose. For example, it has been observed that information that
has been previously mentioned or information that can be easily inferred—and
is not contrastive—shows weaker prominence than expected, or it completely
lacks prominence cues (e.g. Féry & Kügler, 2008). This is often exploited with a
humorous e�ect19:
(4) A: I heard you had to call a plumber over to your house this morning!
B: Yeah, he’s still here and I’m ready to ������ the ���������!
19 Example adapted from Wennerstrom, 2011, p. 317.
56

Literature review: prominence and language
The last word in (4), ‘orangutan’, is deaccented (as shown by the subscript
text), although it would normally receive the nuclear pitch accent of the sentence.
The humorous e�ect results from the listener’s conclusion that this information
should actually be understood as already introduced in the discourse, and thus,
a co-referential relation between the plumber and the animal is created.
Focus
The given/new distinction is tightly related to that of (back)ground/focus.
The term ‘focus’ was initially used by Halliday (1967b) and was introduced later
in the generative literature by Jackendo� (1972) as part of the focus/presupposition
distinction. In Jackendo�’s work, ‘presupposition’ “denote[s] the information in
the sentence that is assumed by the speaker not to be shared by him and the
hearer” (Jackendo�, 1972, p. 230).
According to Ladd (2008, Chapter 6), it was this notion of ‘focus’ developed
in the framework of the generative syntax (Jackendo�, 1972) which was adop-
ted, together with Pierrehumbert’s (1980) de�nition of ‘pitch accent’ based on
Bolinger’s work. In this sense, Vallduví and Engdahl (1996, p. 462) de�ne ‘fo-
cus’ as “an informative, newsy, dominant, or contrary-to-expectation” part of
the utterance as opposed to the expected one20. Gussenhoven (1983a) coined
the expression ‘Focus-To-Accent’ (FTA) approach to refer to the attempts to nar-
row the gap between the semantic/pragmatic notion of ‘focus’ and the phone-
tic/phonological notion of ‘accent’. In FTA, the key issue turned around the rela-
tion between which parts of the utterance are focused and how a given pattern
20 However, another tradition in the literature (Grosz & Sidner, 1986) employs the term ‘focus’
in a di�erent way: a discourse entity is considered ‘in focus’ when it is the topic of the conversa-
tion, i.e. ‘in focus’ is equivalent of ‘given’ information rather than ‘new’ information and, thus,
it is likely to be deaccented.
57

Literature review: prominence and language
of focus is conveyed by the location of the accent. However, Ladd remarks that:
“The speaker’s decision about which word or constituent to fo-
cus is subject to all kinds of contextual in�uences which are at best
poorly understood: these are the factors with which Bolinger, Chafe,
Halliday, and others have always been concerned. However, once we
specify the focused part of the utterance [...], the location of accent
on a speci�c word within the focused constitutent follows more or
less automatically by language-speci�c rules or structural principles”
(Ladd, 2008, p. 218).
Actually, there exists a strong correlation between metrical structure and the
realisation of a nuclear pitch accent on a word introducing new information or
a word with narrow focus. In Cole’s terms:
“A word located in a strong position in the phrase-level metrical
structure is prominent relative to a word in a weak (or hierarchically
lower) position, and the rightmost prominent word in the phrase is
the head or nucleus of the phrase—unless a precedingword has a nar-
row or contrastive focus, in which case the focused word is assigned
the nuclear prominence [...]. The nucleus is assigned an obligatory
pitch accent. Additional pitch accents are optionally assigned to pre-
nuclear words [...] based on their informativeness” (Cole, 2015, p. 9).
Thus, despite the role played by phonological rules in accent assignment, the
notion ‘informativeness’ that Cole refers to makes that the location of a pitch
accent is ultimately dependent on the context, as Ladd pointed out. For example:
(5) We saw a tiger on the ����.
(6) a. A: What did you see on the road?
58

Literature review: prominence and language
b. B: #We saw a tiger on the ����.
c. B: We saw a ����� on the road.
In sentence (5)21, the realisation of a pitch accent as a nuclear pitch accent
indicates the focused constituent of the utterance, in this case as narrow focus.
However, this leads to an infelicitous answer in (6b), where the focus shifts to
‘tiger’ according to the context provided in (6c).
An important aspect discussed in research is how focus interacts with syn-
tax and phonology, in what is known as focus projection (Gussenhoven, 1983b;
Selkirk, 1984). For example, it was observed that the nuclear accent occurring
towards the end of a phrase may not only highlight the information conveyed
by the accented word, but it can also work as a prosodic head that ‘projects’ to
larger units, even to the whole verbal phrase (Birch & Clifton Jr., 1995). This is
most evident in cases of broad focus.
(7) a. A: What happened?
B: The bus driver [F stopped at the �������. ]
b. A: Where did the bus driver stop?
B: The bus driver stopped at [F the �������. ]
For instance, in (7a)22, broad focus is realised through a nuclear pitch accent
on the word ‘station’, which projects to the whole verbal phrase ‘stopped at the
station’. In (7b) narrow focus is realized also through a nuclear pitch accent, but
due to the context provided by the question, only the information about the place
of the action is new to the hearer; consequently, there is no focus projection. Be-
sides, both intonational contours are likely to di�er, and in a natural conversation
21 Example adapted from Féry & Krifka, 2008, p. 124.22 Example adapted from Falk, 2014, § 2.2.1.
59

Literature review: prominence and language
the responding person in (7b) would probably just give the requested informa-
tion: ‘at the station’.
In the case of contrastive focus, for example, it is assumed that a pitch accent
usually falls on the single word being the contrasting information to a set of
alternatives. However, according to Zimmermann (2007, p. 154), contrastive
focus rather “express[es] a contrast between the information conveyed by the
speaker in asserting [a certain information] and the assumed expectation state
of the hearer.”
(8) a. A: What did you drink at the dinner party?
B: We drank ����.
b. A: Surely you drank ����!
B: No, we drank ������!
For Zimmermann, contrastive focus is typically absent in answers to wh-
questions (8a)23, but is present in correcting statements (8b). He further explains:
“The most likely speech act following on a wh-question is an an-
swer providing the required information. The speaker can also as-
sume that the hearer will not be surprised by the choice of [wine]
[...] and therefore will have no problems with updating the com-
mon ground accordingly. Hence, no need for contrastive marking.
In [(8b)], in contrast, it follows from hearer A’s assertion that she
does not expect to be contradicted” (Zimmermann, 2007, p. 155).
2.2.2.2 Accessibility: repetition, frequency, and probability
A di�erent strategy to better understand notions of ‘givenness’ and ‘focus’
has been to assume that, as a discourse proceeds, information varies in its overall
23 Example adapted from Zimmermann, 2007, pp. 154-155.
60

Literature review: prominence and language
level of activation. In this sense, the relationship between prominence cues and
information status has also been analysed according to the accessibility of the
referents to the listener. Information that is highly activated tends to be highly
accessible and is referred to by means of pronouns or shortened expressions,
while less accessible material is referred to with full referring expressions (e.g.
Grosz et al., 1995; see Arnold, J. E., 2010, for a review).
Accessibility is in�uenced by syntax, topicality, recency ofmention, and other
factors. It is possible that accessibility plays a role in accenting as well as in
the choice between full noun phrases and pronouns, i.e. accessible information
is deaccented, while non-accessible information is accented. This approach can
capture given/new distinctions, since given information is likely to be accessible,
while new information is not. Similarly, it also captures apparent exceptions, es-
pecially when accessibility to non-previously mentioned information can be in-
ferred or derived from the discourse context. In addition, previously mentioned
information is not always accessible, and thus, its reintroduction in the discourse
would probably require an accent.
Di�erent theories have tried to account for e�ects of the overall informative-
ness and predictability of words in speech production: the Probabilistic Reduc-
tion Hypothesis (PRH) (Jurafsky et al., 2001), the Smooth Signal Redundancy Hy-
pothesis (SSRH) (Aylett & Turk, 2004), the Uniform Information Density (UID)
(Levy & Jaeger, 2007). Basically, all share the fundamental insight that word
forms are shortened and reduced when they have a higher probability of oc-
currence and recognition. For example, the Probabilistic Reduction Hypothesis
(PRH) (Jurafsky et al., 2001) simply argues that word forms are reduced when
they have a higher probability of occurrence. In this sense, lexical predictability
can account for the reduction of word forms, as indicated by segment shortening.
For example, using spontaneous speech, Fowler and Housum (1987) analysed the
61

Literature review: prominence and language
acoustic correlates of prominence (f 0, intensity, and duration) of the �rst two
occurrences of words uttered in a broadcast radio monologue. They reported
that duration was altered, but not f 0 or intensity, so that 71% of words uttered
a second time were shorter. Secondly, in a subsequent perception experiment
with extracts excised from the same monologue, they observed that listeners
better identi�ed speech items uttered for the �rst time, i.e. those introducing
new information.
A similar study was conducted by Bard et al. (2000). This time the status
of ‘given’ and the loss of intelligibility was tested in four di�erent experiments
according to whether speakers were aware or not of what listeners did and did
not know. In a series of task-oriented dialogues, speakers and listeners reported
to each other visual landmarks on their respective maps, which di�ered in some
cases. Bard and her colleagues reported that repeated mentions of map land-
marks by speakers became less clear, regardless whether listeners had heard (ex-
periment 1) or seen the referent (experiment 2). In their turn, speakers reduced
intelligibility when repeating a map landmark that had �rst been mentioned by
the listener, including those cases in which speakers themselves could and could
not see the referent (experiments 3 and 4).
Not only referent repetition, but also lexical frequency is related to the real-
isation of prominence. For example, shorter duration has been reported for high-
frequency words when compared to low-frequency words. For example, Fosler-
Lussier and Morgan (1999) carried out a corpus-based analysis of speaking rate
and word frequency and observed that both factors were responsible for a dif-
ferent pronunciation of frequent words from the canonical, most likely pronun-
ciation. In their turn, Pluymaekers et al. (2005) observed that lexical frequency
also a�ected a�x duration. A�xes that were attached to high-frequent words
were shorter than those attached to low-frequent frequent words and, therefore,
62

Literature review: prominence and language
less prominent.
Furthermore, next to repetition and lexical frequency, di�erent forms of trans-
itional probabilities can also a�ect the acoustic realisation of prominence. Gregory
et al. (1999), for example, developed a probabilisticmodel including several meas-
ures such as lexical frequency, type of word collocation, and both discourse repe-
tition and semantic relatedness. In the discussion of their results, they concluded
that all these factors can be seen as part of the same process of prominence de-
crease, so that word duration tends to be reduced by all these factors. In a sub-
sequent study, the same team analysed the contribution that each of them had
separately to the observed shortening e�ect (Bell et al., 2009).
In their turn, Watson et al. (2008) observed an acoustic di�erence in the real-
isation of both less predictable words and important words in context. In the
�rst case, words were uttered with longer duration and a greater pitch excur-
sion, whereas in the second case, words were pronounced with greater intensity.
By the same token, Gahl and Garnsey (2004) reported an important di�erence
in prominence realisation according to verb argument structure, i.e. verbs like
‘believe’ usually occurs more frequently with sentential complements than with
direct objects, while verbs like ‘con�rm’ are more often accompanied by direct
objects rather than sentential complements. Thus, Gahl and Garnsey observed
that verbs occurring with dispreferred arguments tended to be lengthened and
preceded a longer pause when uttered.
2.2.3 Syntactic structures and prominence
The mentioned studies linking the realisation of prominence to a series of
factors a�ecting intelligibility and word duration are also closely related to the
syntactic structure of utterances. Initially, this was Chomsky and Halle’s (1968)
view, who put forward the idea that phrasal stress was independently determined
63

Literature review: prominence and language
by a recursive algorithm that converted syntactic deep structures into a phonolo-
gical transcription introducing prominence according to a series of phonological
rules. Then, in order to relate a sentence to its context, i.e. signal the focus and
presupposition structure, the interface system made use of the available stress
prompted by syntax (Jackendo�, 1972). This view was explored further by Halle
and Vergnaud (1987), who developed a metrical approach to this rule following
the metrical tree notation proposed by Liberman (1979). However, Chomsky and
Halle’s view was contested by Bolinger, who insisted that prominence is realized
through accents that re�ect both the speaker’s intentions and the information
structure of the utterance:
“The distribution of sentence accents is not determined by syn-
tactic structure [...]. Syntax is relevant indirectly in that some struc-
tures are more likely to be highlighted than others” (Bolinger, 1972,
p. 644).
Alongwith Bolinger, several other authors discussed the relationship between
prominence and syntactic structure. For example, Schmerling (1976) questioned
the syntactic account of sentence stress assignment and proposed that promi-
nence realisation was a�ected by a number of semantic constraints. Schmerling
noticed that argument structure played an important role in phrasal stress. She
also remarked that in languages such as German and English the direct object
of a verbal phrase is always prominent, regardless of whether word order is OV
or VO. Argument structure was also analysed by Gussenhoven (1984), who in-
corporated this semantic generalisation and proposed that a phrase carrying a
single pitch accent may include a second argument if it is semantically justi�ed
and both are adjacent to each other. This was captured in his Sentence Accent
Assignment Rule (SAAR) (1983a), which can be summarised as follows:
64

Literature review: prominence and language
“If focused, every predicate, argument, and modi�er must be ac-
cented, with the exception of a predicate that, discounting unfocused
constituents, is adjacent to an argument” (Gussenhoven, 1992, p. 84).
Around the same time, the relationship between phonology and syntax in the
Standard Theory outlined by Chomsky and Halle (1968) was revised by Selkirk
(1984), who adopted the pitch accent view of intonation developed by Pierre-
humbert (1980) a few years earlier. As a consequence, Selkirk’s work met with
considerable success in accounting for patterns of phrasing in a variety of lan-
guages. Later on, the syntax-prosodymapping was addressed in some cases from
the constraint-oriented framework of Optimality Theory proposed by Prince and
Smolensky (1993) (e.g. Schwarzschild, 1999; Szendrői, 2001; Truckenbrodt, 1999).
The debate on the relationship between syntactic structure, semantics, and
prosody mainly centered on the role of syntax (and semantics) in determining
focus and accent. Gussenhoven’s (1983a; 1983c) views, di�erently from Selkirk’s
(1984), were based on the surface position of the constituents and semantic roles
they could take on. As a result, several studies investigated NP focus projec-
tion to other constituents (e.g. Birch & Clifton Jr., 1995; Bock & Mazzella, 1983;
Nooteboom & Kruyt, 1987). In this regard, as mentioned earlier (§ 2.2.2.1), it was
observed that focused prosodic heads can project to larger units, even to a whole
verbal phrase (Birch & Clifton Jr., 1995).
In the relationship between prosody and syntactic structure, it has been pointed
out (Szaszák&Beke, 2017) that the syntax-phonology interface is, to some extent,
exploitable to disambiguate ambiguous sentences that have interpretations that
di�er in their surface structure. Several grammatically correct prosodic phras-
ing and accentuation patterns may exist for a given syntactic representation. For
example, the link between syntactic structure and prosodic breaks is formalized
in the grammar as prosodic structure, which provides cues to syntactic structure
65

Literature review: prominence and language
through knowledge of the grammar (Truckenbrodt, 1999). This is pretty much
the opposite, however, when mapping prosody to syntax, since the ambiguity is
by no means so easily resolved. Similar to studies reporting on the important
role of prosodic breaks in resolving syntactic ambiguities, Schafer and her coll-
leagues (2000) conducted a series of experiments to analyse the disambiguation
of syntactic structure by means of prosodic prominence.
(9) a. I asked the pretty girl who is ����.
b. I asked the pretty girl ��� is cold.
In their �rst experiment, Schafer et al. compared the role of a pitch accent
when signalling the word ‘cold’ in (9a) and when signalling the interrogative
pronoun who belonging to an embedded question in (9b). Schafer and her col-
leagues ran the experiment using a short and long version of the same sentence
(i.e. ‘I asked the pretty girl who is cold’ vs. ‘I asked the pretty girl who is very
cold’) with di�erent intonations, and they observed that syntactic analysis of
such ambiguous sentences are disambiguated in favor of an embedded question
by placing a pitch accent on the interrogative phrase.
A more complex view on prosody is also considered, so that together with
syntax, other factors also have an in�uence on prosodic structure (e.g. Watson
& Gibson, 2004). Besides, some languages need more intervention of prosody
to mark phrasal stress, as English; while in other languages, such as Hungarian,
syntax is more independent and �exible to convey information structure, thus
allowing prosody to adopt functions not driven by syntax (e.g. Genzel et al., 2015).
These cross-linguistic di�erences (see amore detailed discussion in § 2.2.5) can be
grouped into a languages with rigid word order, which allow prosodic marking of
focus at di�erent locations in the sentence; and languages with a more �exible
word order, which is exploited to mark focused constituents and exhibits less
variation in the location of prosodic prominence (e.g. Donati & Nespor, 2003).
66

Literature review: prominence and language
Non-canonical syntactic structures
Among the strategies used by intonational languages to mark information
structure and focused constituents, there exists a three-way distinction. Accord-
ing to Skopeteas and Fanselow (2010), strategies follow a scale of structural com-
plexity from less complex to more complex: (1) in situ, e.g. through prosody, (2a)
ex situ, e.g. through word order, and (2b) ex situ, e.g. through cleft construc-
tions24. In the case of ex situ marking of prominence, non-canonical syntactic
constructions result in di�erent word order patterns, especially in languages
with a more rigid word order such as English. For example, argument reversal
can be realised as inversions and passive constructions, while cleft constructions
include fronting (also ‘front-focus’ or ‘preposing’) and locate the highlighted con-
stituent in sentence-initial position. In the subsequent examples, constituents in
non-canonical positions are in boldface.
In the case of inversions (10), the prepositional phrase appears to the left of
the verb, a position where the subject would canonically appear.
(10) a. In one of the �rst-class carriages there is a baby [...]. There is a rusty
old divine, in gilt-rimmed spectacles and a jowl, reading theGuardian.
[...] And lastly, a little young lady, sitting facing the engine, with
the dusty blast driving hot and full in her face, blinking, coughing,
choking, with the utmost patience. On her lap lies a huge bunch of
red and yellow roses and heavy-scented double-stocks, all limp and
drooping and soiled. (Broughton, 1870, p. 73)
b. He successively taught me by words, by diagrams, and on the ground
[...]. The nights frequently passed in this occupation, so much did
24 There also exist focus-related morphemes that are uncommon in intonational languages
and will be omitted in this review with English examples.
67

Literature review: prominence and language
this study absorb us, so well did my teacher know how to make it
interesting. (Goodall, 2014, p. 45)
c. No evidence for evolution pleased Darwin more than the presence
in nearly all organisms of rudimentary or vestigial structures. (Gould,
1980, p. 29)
Passive constructions (11) promote the object to subject position, and a by-
phrase introduces the logical subject, which is often omitted, as it conveys in-
formation considered irrelevant or given. In the following examples the passive
verb is underlined.
(11) a. Parisian director Paul Verhoeven is suing the Cannes �lm festival,
claiming that his 2009 drama Teenagers was not accepted because of
sexual prejudice. The lawsuit is the �rst ever �led against the festival.
The low-budget �lm, which details the relationship between two
teenage boys, was shown at other festivals around the world but it
was rejected when submitted to Cannes. (The Guardian, March 2nd,
2015)
b. Addressing the author as “Dear Orwell”, Eliot, then a director at pub-
lishing �rm Faber & Faber, writes on 13 July 1944 that the publisher
will not be acquiring Animal Farm for publication. [...]. Animal
Farm, a beast fable that satirised Stalinism and depicted Stalin as a
traitor, was rejected by at least four publishers, with many, like Eliot,
feeling it was too controversial at a time when Britain was allied with
the Soviet Union against Germany. (The Guardian, May 26th, 2016)
Cleft-sentences (12) split a given sentence into two di�erent clauses. In the
following examples it is possible to �nd cases in which the cleft-clause contains
the focus, although this is not always the case. In cleft-sentences, prosody often
68

Literature review: prominence and language
interacts with syntax to focus di�erent constituents25. In order to illustrate this
interaction, focus in the next examples is indicated in upper case, other prosod-
ically salient words are indicated in small caps, and other pitch accented words
are indicated in regular lower case italics.
(12) a. A: Oh, boss, I guess we made a mistake.
B: Stupid, it was the CAR we were supposed to �����!
b. What these warnings have achieved is political �������� for
OFFICIALS. [03/11/01]
b�. What THESE warnings have achieved is political �������� for
o�cials.
c. It’s got to be standardized, and THAT’S what the President’s proposal
will ��. [26/10/01]
c�. It’s got to be standardized, and that’s what the President’s PRO-
POSAL will do.
In the it-cleft sentence (12a), the focused information, ‘the car’, appears at the
beginning of the sentence. The wh-cleft in (12b) and (12b�) shows a di�erence inthe prosodic realisation of the cleft clause, as showed by the highlighted narrow
focus ‘these’ in (12b�), while in (12b) ‘o�cials’ is the focused constituent. In (12c),
a pitch accent is located on ‘that’s’ in the cleft clause, and the sentence concludes
with a nuclear pitch accent on the verb ‘do’. Conversely, in (12c�) the narrow
focus is realized through prosodic prominence on ‘proposal’.
Similarly, fronting (13) also places the focal constituent in sentence-initial
position, but it does not split the sentence.
25 The examples showing a date in square brackets (e.g. [03/11/01]) have been adapted from
Hedberg & Fadden, 2007 and appear as they cite them from the corpus they collected from the
broadcast television program The McLaughlin Group.
69

Literature review: prominence and language
(13) a. A: Could I have a piece of pie?
B: Sorry, we’re all out of pie. I can o�er you [F a ������. ]
B: Sorry, we’re all out of pie. A ������ I can give you.
b. A: Shall we start?
B: Nobody knows [F ���� ] they will arrive.
B: ���� they will arrive nobody knows.
In addition, fronting is super�cially similar to clitic left-dislocation. How-
ever, in the case of left-dislocation (14), which is not part of the subsequent main
clause, a coreferential pronoun appears in the canonical position of the constitu-
ent (underlined).
(14) a. That girl, I saw her yesterday at Sally’s party?
b. One of the guys at the party, he got so drunk that he couldn’t even
remember his name.
Both fronting and left-dislocation are considered as structures resulting in
topicalisation, i.e. the promotion of a constituent to the topic of the utterance.
For example, in the fronting case (13a), the focused constituent ‘a mu�n’ is top-
icalised, as in the case of left-dislocation (14a) and (14b): the focus ‘her’ and the
topic ‘he’ are highlighted. Leonetti and Escandell-Vidal note further that:
“Focalisation di�ers from clitic dislocation in a number of syn-
tactic properties: there are no resumptive clitics, there is only one
contrastive focus slot, and the construction shows all the typical
features of operator-variable con�gurations, such as sensitivity to
island contexts and weak cross-over e�ects” (Leonetti & Escandell-
Vidal, 2009).
70

Literature review: prominence and language
2.2.4 Text-to-speech synthesis and prominence
Depending on the syntactic di�erences among languages, top-down expecta-
tions corresponding to knowledge of syntactic structures by native speakers have
been observed to in�uence prominence perception (Wagner, 2005). This insight
has received support by research from text-to-speech synthesis, where devel-
opment of algorithms usually include word class (part-of-speech), word length,
and position in the sentence. For example, Lea (1980) developed an algorithm ar-
ranging word categories according to prominence reduction, but his algorithm
tended to place a pitch accent on almost all content words when applied in Text-
to-Speech synthesizers. This initial classi�cation was later re�ned by Altenberg
(1987), who established a less strict hierarchy of word class, in which, for ex-
ample, some word classes, such as nouns, that are often accented may not re-
ceive prominence on some occasions. Along the same lines, Quené and Kager
(1993) improved the set of function words that do not carry a pitch accent and
extended it by including speci�c content words which were considered as having
little semantic information, e.g. maand (‘month’) and jaar (‘year’). In addition,
they also included two rules: deaccent the middle one of three adjacent content
words, and deaccent words conveying given information, as in adjectives before
a proper name, e.g. koningin Beatrix (‘queen Beatrix’).
Later, Streefkerk (2002) also conducted a series of experiments to analyse the
lexical and syntactic correlates of prominence in order to derive a set of rules
later evaluated for prediction accuracy. Firstly, she labelled a set of training sen-
tences according to word class, in which she included both lexical probability
and contextual probability. Apart from con�rming the di�erence previously re-
marked between content words and function words: she observed that verbs
and adverbs were less prominent than the other analysed content words, while
71

Literature review: prominence and language
nouns, adjectives, numerals, and negations showed the highest prominence val-
ues. Besides, in terms of word length, longer words tended to bemore prominent,
regardless of whether they were function words (usually monosyllabic) or con-
tent words (usually polysyllabic). Streefkerk also tested the position of words in
the sentence and reported that nouns, adjectives, numerals, and negations tended
to carry more prominence at the beginning of the sentence than at the middle or
at the end. Finally, nouns were generally less prominent when preceded by an
adjective than when standing alone, which implied that adjectives followed by a
noun were to a great extent the most prominent item of the two.
The role played by aspects such as part-of-speech, word length, and position
in the sentence were also complemented in other studies by modelling probabil-
ities of word collocation, as previously mentioned (§ 2.2.2.2) (e.g. Bell et al., 2009;
Gregory et al., 1999). In this regard, Gregory and Altun remark:
“Part of speech and the informativeness of a word do not capture
all aspects of accentuation, as we see in this example taken from
Switchboard, where a function word gets accented (accented words
are in uppercase):
‘I, I have STRONG OBJECTIONS to THAT’.
[...] Additionally, whether the immediately surrounding words
bear [a] pitch accent also a�ect the likelihood of accentuation. In
other words, a word that might typically be accented may be unac-
cented because the surroundingwords also bear pitch accent” (Gregory
& Altun, 2004, p. 1).
Thus, for example, in order to account for word collocations, unigram and bi-
gram probabilities were used by Nenkova et al. (2007) among a variety of other
features in the prediction of prominence, which included: information status of a
72

Literature review: prominence and language
word, i.e. new vs. old; part-of-speech; word length; position of word in the utter-
ance; utterance length; anymacy of nouns and pronouns, i.e. concrete, human,
non-human, etc.; accent ratio, i.e. the likelihood of a word being accented; dialog
act, i.e. statement, opinion, etc.; and some others. Similarly, di�erent models for
the automatic detection of phrasal stress have included a feature of di�erent n-
gram word probabilities (e.g. Gregory & Altun, 2004; Kakouros & Räsänen, 2015;
Ananthakrishnan & Narayana, 2008) (see Table 5 for a summary).
Acoustic Lexical Syntactic Semantic/Pragmatic
Fundamental frequency (f 0) n-gram probability Part-of-speech Dialogue act
Intensity Reverse n-gram probability Position in the sentence Semantic relatedness
Duration Joint probability Animacy Information status
Spectral tilt Accent ratio Kontrast
Table 5: Examples of acoustic, lexical, syntactic, and semantic/pragmatic features included in
text-to-speech synthesis and automatic detection of prominence (e.g. Gregory & Altun, 2004;
Ananthakrishnan & Narayana, 2008; Nenkova et al., 2007). Adapted from Kakouros, 2017, p. 46.
2.2.5 Cross-linguistic di�erences
The intonational system of each particular language determines how the
combination of focus and prominence is achieved. It is the case, for example,
that West-Germanic languages such as English, German, or Dutch usually mark
contextually important information by means of prosody without resorting to
syntactic operations (e.g. Gussenhoven, 2005). However, in certain Asian and
African languages, pitch accents are hardly relevant. For example, in the case of
Korean (e.g. Jun, 2005) or Japanese (e.g. Venditti et al., 2008) prosodic phrasing
can completely replace the pitch accents that are characteristic of intonation lan-
guages, with one extreme case of prosodic marking, ellipsis, in which only the
focused part of a sentence is pronounced, while the given part is just omitted.
73

Literature review: prominence and language
Conversely, in most Romance languages such as Catalan, Spanish, or Italian,
the same result is achieved mainly through altering word order, while intonation
is less important (e.g. Estebas-Vilaplana & Prieto, 2010). More precisely, changes
in word order in Romance languages allow particular items to be focused and to
phonologically receive an accent. In this case, non-canonical word order patterns
may also be accompanied by prosodic prominence.
It is widely accepted that most languages make use of some of the strategies
observed cross-linguistically, and typically do not use them concurrently. Ladd
(2008, Chapter 6) enumerates three main cases in which cross-linguistic di�er-
ences in prominence marking are most evident: both yes-no questions (YNQs)
and wh-questions (WHQs); deaccenting and ‘semantic weight’; and predicates
(verbs and predicate nouns or adjectives) vs. arguments (noun phrases syntactic-
ally linked to a predicate). In his detailed review, Ladd exposes di�erences that
lie at the core of the debate aroundwhether there exist cross-linguistic universals
in highlighting information.
Nevertheless, in the case of intonational languages, asmentioned above, there
are obvious di�erences in the use of prosodic and syntactic strategies to mark
prominence. Swerts et al. (2002), for example, conducted a comparative study of
accentuation strategies in adjective-noun phrases with Dutch and Italian speak-
ers. The researchers elicited dialogues in which the information status within
the noun phrase appeared in four di�erent ways: all new information, single
contrast in the adjective, single contrast in the noun, and double contrast in both
adjective and noun.
The results were compared in three di�erent analyses. Firstly, they observed
that both new and contrastive information were always accented in Dutch, but
given information was not. Conversely, in Italian, pitch accent marking was not
observed to be a signi�cant factor to distinguish information status, since in the
74

Literature review: prominence and language
elicited noun phrases both adjective and nounwere always accented, irrespective
of the status of the discourse context. Secondly, Swerts et al. also observed that
information status in Dutch was re�ected in the prosodic prominence, and single
contrastive accentswere perceived as themost emphatic, while givenwordswere
perceived as the least emphatic. In Italian this was not so evident. Finally, a
functional analysis of accent patternswas conducted to explorewhether listeners
were able to rely on acoustic prominence cues to reconstruct the context of a
given utterance. The researchers reported that, consequently, Italian listeners
did not manage to interpret acoustic cues in terms of the dialogue history.
Later on, Krahmer and Swerts (2004) conducted a follow-up study in which
gestural cues were added to the acoustic cues of prominence that they had pre-
viously analysed (see § 2.3.8.2 for a description). In another study with Dutch
and Spanish speakers, van Maastricht and her colleagues (van Maastricht et al.,
2016) similarly observed that Spanish learners of Dutch neglected the role of
pitch accents in the target language and always used the same intonation pat-
tern throughout the experimental task irrespective of the focus location of the
utterance.
Non-canonical word order in Spanish
The di�erences described by Swerts et al. (2002) can be explained in Vallduví’s
(1992) terms of plastic and nonplastic languages, i.e. whether or not the prosodic
patterns of a given language can easily adapt and re�ect information structure.
Romance languages are considered to be nonplastic languages. Spanish, for
example, is considered to mark focal constituents both syntactically and prosod-
ically, often combining both strategies. Contrastive focus in prenuclear position
(15a) is achieved through a high pitch accent, in which a low accent occurs in
pre-tonic syllable, the f 0 peak falls within the stressed syllable rather than in the
75

Literature review: prominence and language
post-tonic syllable, and it is also possibly accompanied by longer duration and
intensity (e.g. Face, 2001; de la Mota, C., 1997). This is followed by a low bound-
ary tone, which results in a L+H* L% intonational pattern (Estebas-Vilaplana &
Prieto, 2010). However, if contrastive focus occurs in nuclear position (15b), the
pitch accent can also be high or low.
(15) a. A: Me dijeron que Tania quiere comprar un violonchelo.
‘They told me Tania wants to buy a cello.’
B: Yo entendí que quería [F ������� ] un violonchelo.
‘I understood she wanted to [F ���� ] a cello.’
b. A: Oí que Ana vino el martes.
‘I heard Ana came on Tuesday.’
B: No, (Ana vino) [F el �����. ]
‘No, (Ana came) [F on ������. ]’
Contrastive focus can also be marked by means of cleft constructions. Nu-
clear stress on the focus can highlight either the subject (16a) or object (16b) in
this non-canonical word order. Additionally, it can also appear in fronting con-
structions with a similar involvement of prosodic prominence (17).
(16) a. A: Manuel se comió el chocolate, ¿no?
‘Manuel ate the chocolate, didn’t he?’
B: No, [F fue ������ ] quien se comió el chocolate.
‘No, [F it was ������ ] who ate the chocolate.’
b. A: Manuel se comió el chocolate, ¿no?
‘Manuel ate the chocolate, didn’t he?’
B: No, [F fue la ����� ] lo que se comió (Manuel).
‘No, [F it was the ���� ] what (Manuel) ate.’
76

Literature review: prominence and language
(17) A: ¿Han traído traído ya el paquete?
‘Have they brought the parcel yet?’
B: [F La ����� ] han traído.
‘[F The ������ ] they brought.’
It has traditionally been claimed that only contrastive focus can be fronted
(e.g. Zubizarreta, 1998), but Vanrell and Fernádez Soriano (2013) observed in a
production experiment that also narrow focus is fronted in Spanish (18)26.
(18) A: ¿Qué le dio el marinero al viejo?
‘What did the sailor give to the old man?’
B: [F La ����� ] le dio el marinero al viejo.
‘[F The ������ ] gave the sailor to the old man.’
However, Leonetti and Escandell-Vidal comment that:
“In the case of fronted lexical de�nites, there is also a strong re-
quirement that the propositional content has been made accessible
in the immediate context. Thus, a sentence like [(19)], uttered out of
the blue, with no connection to any previous relevant information,
is quite di�cult to contextualise” (Leonetti & Escandell-Vidal, 2009,
p. 171).
(19) A: ¿Y qué hiciste ayer?
‘And what did you do yesterday?’
B: # [F Un ����� ] leí.
‘[F A ���� ] I read.’
26 Example adapted from Vanrell & Fernández Soriano, 2013, p. 261.
77

Literature review: prominence and language
Along the same lines, it has been claimed that the prosodic realisation of
broad focus would be very similar to that of contrastive focus, even if the fronted
phrase does not express any contrast.
(20) A: ¿Y qué te han traído a ti?
‘And what did they bring to you?’
[F Unas ���������� ] me han traído.
‘[F A pair of �������� ] they brought me.’
Leonetti and Escandell-Vidal (2009, p. 163) report in (20) an example of fronted
broad focus pointed out to them by an anonymous reviewer. However, in their
interpretation, the researchers argue that “this [(20)] is still a case of contrastive
focalisation and represents a marked way to convey the additional idea that the
new piece of information is surprising or unexpected” (2009, p. 163)27.
In their paper, Leonetti and Escandell-Vidal actually discussed a type of front-
ing in (21) that had hardly been discussed in the previous literature.
(21) a. ���� debe saber.
‘S/he must know ���������.’
b. ���� te puedo decir.
‘������ can I say to you.’
c. Lo ����� digo (yo).
‘I say the ����.’
The previous examples, in which quanti�ers are fronted (as shown in bold-
face), are interpreted by them as cases of verum focus fronting, i.e. focus on the
truth value of the sentence (also ‘sentential polarity focus’ or simply ‘polarity
27 This view is very close to that expressed by Zimmermann (2007) (§ 2.2.2.1).
78

Literature review: prominence and language
focus’). Thus, they interpret the sentences just seen in (21) as28:
(22) a. ���� debe saber. � Sí/seguro que sabe algo.
‘S/he must know ���������.’ � ‘Yes/sure that s/he knows something.’
b. ���� te puedo decir. � Sí/Es cierto que yo te puedo decir poco.
‘������ can I say to you.’ � ‘Yes/It’s true that I can say little to you.’
c. Lo ����� digo (yo). � Sí/Es cierto que yo digo lo mismo.
‘I say the����.’ � ‘Yes/It’s true that I say the same.’
2.2.6 Summary
Semantics, pragmatics and information structure
When syllables and words stand out from their environment, they do so due
to semantic and pragmatic factors and/or syntactic and lexical elements in the
utterance. Prosodic prominence signals themost salient element in the utterance,
whose main role is generally accepted to be marking the status of a constituent
within the discourse.
Di�erent approaches to information structure take into account the poten-
tial of the semantics of sentences to change the previous context of the discourse.
Three distinctions contribute to alter the common ground shared between speaker
and hearer: given/new, topic/comment, and background/focus.
Information structure and the status of elements in the discourse interact in
a process in which prosody plays a crucial role in many languages. Pitch accents
can mark semantic contrasts, and words carrying a pitch accent are traditionally
seen as referring to new information, while deaccented words were perceived as
information already given in the discourse (e.g. Birch &Clifton Jr., 1995; Bolinger,
28 Verum focus fronting is also considered to be one of the strategies used in Spanish to express
irony (Escandell-Vidal & Leonetti, 2014).
79

Literature review: prominence and language
1958, 1961; Cutler, 1976; Dahan et al., 2002). However, previous mention of a
word in the discourse is not su�cient for already conveyed information to be
deaccented (Brown, 1983; Terken & Hirschberg, 1994).
The distinction of background/focus is closely related to that of given/new.
‘Focus-To-Accent’ (FTA) approaches, a term coined by Gussenhoven (1983a), at-
tempted to narrow the gap between the semantic/pragmatic notion of ‘focus’ and
the phonetic/phonological notion of ‘accent’. The way that focus—signalled by
pitch accents—interacts with syntax and phonology is at the core of this rela-
tionship. It was observed that nuclear accents may work as prosodic heads that
‘project’ to larger units, even to the whole verbal phrase they occur in, in what
is know as ‘focus projection’ (Birch & Clifton Jr., 1995).
Additionally, a pitch accent, traditionally considered to fall on the single word
that provides contrasting information to a set of alternatives (i.e. contrastive fo-
cus) has been claimed to actually express a contrast between the information
conveyed by the speaker and the informational expectation of the hearer (Zim-
mermann, 2007; Leonetti & Escandell-Vidal, 2009).
The concepts of givenness and focus have been also addressed according to
the accessibility by the listener to the referents uttered in the discourse: informa-
tion that is highly activated is also highly accessible and is referred to through
pronouns or shortened expressions (e.g. Arnold, J. E., 2010; Grosz et al., 1995).
This approach can capture given/new distinctions—given information is likely
to be accessible, while new information is not—as well as apparent exceptions.
The Probabilistic Reduction Hypothesis (PRH) (Jurafsky et al., 2001), the Smooth
Signal Redundancy Hypothesis (SSRH) (Aylett & Turk, 2004), and the Uniform
Information Density (UID) (Levy & Jaeger, 2007) are the best-known frameworks
aiming at explaining the e�ects of overall informativeness and predictability of
words in speech production.
80

Literature review: prominence and language
Lexical predictability can also account for the reduction of word forms, i.e.
temporal shortening of segment (e.g. Bard et al., 2000; Fosler-Lussier & Morgan,
1999; Fowler & Housum, 1987; Pluymaekers et al., 2005). However, next to pre-
dictability and lexical frequency, di�erent forms of transitional probabilities can
also a�ect the acoustic realisation of prominence (e.g. Bell et al., 2009; Gregory
et al., 1999; Watson et al., 2008).
Syntactic structures and prominence
In order to signal the focus and the presupposition structure of an utterance,
prosody makes use of the stress made available by syntactic means. This was
the idea put forward by Jackendo� (1972) based on Chomsky and Halle’s work
(1968), although it was soon contested by Bolinger (1972) and Schmerling (1976).
In the mid-80’s Selkirk (1984) reviewed the Standard Theory based on Pierrehum-
bert’s (1980) notion of pitch accent. Later, the syntax-prosody mapping was also
addressed from the constraint-oriented framework of Optimality Theory (Prince
& Smolensky, 1993).
The syntax-phonology interface can be exploited to disambiguate ambiguous
sentences whose interpretations di�er in their surface structure (e.g. Trucken-
brodt, 1999; Schafer et al., 2000). However, the interaction between prosody and
syntax is also seen as a more complex one, so that other factors have also an
in�uence on prosodic structure apart from syntax (Watson & Gibson, 2004).
Additionally, non-canonical syntactic structures are used by intonational lan-
guages tomark information structure and focused constituents. If in situmarking
of prominence involves prosody, ex situ involves either a di�erent word order or
cleft constructions. A di�erent word order can be realised for example as inver-
sions or passive sentences, while cleft constructions—including fronting—locate
the highlighted constituent in sentence-initial position.
81

Literature review: prominence and language
Syntax was also initially exploited in text-to-speech to develop algorithms
to automatically detect prominence (Lea, 1980; Altenberg, 1987; Quené & Kager,
1993; Streefkerk, 2002). These algorithms usually included word class (part-of-
speech), word length, and position in the sentence and transitional probabilities
(e.g. Ananthakrishnan & Narayana, 2008; Bell et al., 2009; Gregory et al., 1999;
Gregory & Altun, 2004; Kakouros & Räsänen, 2015; Nenkova et al., 2007).
Cross-linguistic di�erences
The intonational system of each particular language determines how the
combination of focus and prominence is achieved. Thus, in some languages pros-
ody plays a more important role, while in other languages word order and non-
canonical syntactic constructions are preferred (e.g. Gussenhoven, 2005; Ladd,
2008; Venditti et al., 2008). In the case of intonational languages, there are obvious
di�erences in the use of prosodic and syntactic strategies to mark prominence,
as the di�erences observed between Dutch and Italian (Swerts et al., 2002).
In Spanish, a language whose prosody cannot easily adapt to re�ect infor-
mation structure, focal constituents can be marked both syntactically and pros-
odically. Both strategies are often combined, as in the case of cleft construc-
tions, including fronting. Thus, contrastive and broad focus can be realised in
non-canonical syntactic constructions through a pitch accent (e.g. Leonetti &
Escandell-Vidal, 2009; Vanrell & Fernández Soriano, 2013).
2.3 Gestural correlates of prominence
In this section, an overview of gesticulation, located at one of the extremes of
the so-called Kendon’s continuum, is o�ered. This is followed by a brief review
of some of the most conspicuous studies on gestures prior to the 20th century and
82

Literature review: prominence and language
by a detailed account of those carried out in the 20th century. Di�erent criteria to
categorise gestures are later discussed, especially the one developed by McNeill
(1992). Subsequently, head nods and eyebrow raises are also dealt with in more
detail, which leads to a discussion on the temporal coordination of gesture and
speech. Finally, a large subsection is devoted to the phenomenon of audiovi-
sual prosody, i.e. the interaction of gestures and verbal prosody, with especial
attention to studies on the interaction between gesture and speech in signalling
prominence.
2.3.1 Introduction
Apart from speech, humans also perform gestures in their communication,
which are usually de�ned as spontaneous, and often unwitting, bodymovements
accompanying speech. These gestures, performed with hands, �ngers, arms,
head, face, eyes, eyebrows, or trunk, are also known in the literature as gesticula-
tion (Kendon, 1982) and di�er in fundamental ways from the gestures performed
in pantomime, from those gestures known as emblems, or from the gestures of
sign languages. In this case, and in keeping with most of the literature, the word
gesture is used to refer to gesticulation.
2.3.2 The Kendon’s continuum
Following McNeill (1992; 2000), di�erent gestures can be classi�ed according
to the relationship that body movements have to speech, and they can be or-
ganised depending on their increasing degree of conventionalisation along the
so-called Kendon’s continuum (as mentioned in the introduction § 1, Figure 1).
In their relation to speech, body movements at the left end of the continuum
are produced unawarely together with speech. Conversely, at the right end, the
83

Literature review: prominence and language
movements performed in sign languages are produced consciously to commu-
nicate, which typically occurs in the absence of speech (Figure 4).
Gesticulation � Emblems � Pantomime � Sign Language
Obligatory Optional Obligatory Obligatory
presence of presence of absence of absence of
speech speech speech speech
Figure 4: Gestures in their relationship to speech in the Kendon’s continuum. This one and the
following continua are adapted from McNeill, 2000, pp. 2-5 and Loehr, 2004.
However, McNeill considers several other dimensions of body movements in
this continuum. In their relation to linguistic properties, he points out that at
the left end, movements have neither a lexicon of agreed-upon symbols nor a
phonological, morphological, and syntactic system to combine its constituents.
In this sense, the gestures at the left end are not conventionalised, i.e. there is not
a conventional code for their correct realisation, while sign languages at the right
end share a conventionally structured code that is necessary for communication
(Figure 5).
Gesticulation � Pantomime � Emblems � Sign Language
Absence Absence Presence Presence
of linguistic of linguistic of some linguistic of linguistic
properties properties properties properties
(Not conventionalised) (Not conventionalised) (Partly conventionalised) (Fully conventionalised)
Figure 5: Linguistic properties and degree of conventionalisation of gestures in the Kendon’s con-
tinuum.
Finally, according to the semiotic characteristics of body movements along
the continuum, it is observed that when a meaning is conveyed, it can be done
in either a segmented or in a global way. In the former case, the meaning of the
whole is determined by the combination of its smaller parts, as morphemes do
when they are combined into larger meanings in spoken language (bottom-up).
84

Literature review: prominence and language
In the latter case, conversely, themeaning of the parts is determined by thewhole
(top-down). McNeill illustrates this last case by means of an example in which
an individual utters the sentence ‘he grabs a big oak and he bends it way back’.
Upon the words ‘bends it way back’, the speaker’s hand appears to grip some-
thing in front of him and to pull it back and down towards his shoulder (Figure
6). The speaker’s hand, its movement and the direction can be understood as
the parts making up the gesture, although they cannot be combined independ-
ently as morphemes in speech. The movements back and down performed by
the speaker’s hand acquire their meaning by the whole gesture’s enactment of
bending back a tree. It is in this sense that McNeill refers to global semiosis as a
case in which the meaning of the parts depend on the meaning of the whole.
Figure 6: Depiction of the gesture performed by a speaker while uttering the sentence ‘he grabs an
oak and he bends it way back’. Adapted from McNeill, 1992, p. 12.
Furthermore, a gesture is considered synthetic when it combines di�erent
meanings into one symbol stretching across several words. In the previous ex-
ample o�ered by McNeill, the single gesture performed by the speaker captured
the aspects of actor, action, and manner corresponding to the uttered words ‘he’,
85

Literature review: prominence and language
‘bends’, and ‘back’. By the same token, a sentence is analytic in that each suc-
cessive word is a symbol.
At the far right of the spectrum, for example, movements performed in sign
language are conventionalised, i.e. they are agreed-upon linguistic symbols. Be-
sides, signs are analytic because their meaning is encoded in a series of symbols,
not in a single one. In sign languages, elements such as hand form and direction
typically contribute to the meaning of the sign, as morphemes do in speech, and
so signs in sign languages are segmented (bottom-up meaning).
In the case of pantomime, however, there is not a series of conventional-
ised symbols. The movements performed by a mime occur in the absence of
speech, yet their meaning is understandable. Pantomime is also analytic be-
cause each movement has meaning of its own. However, and di�erently from
sign languages, each of the parts that make up the movement do not contribute
separately to the global meaning; instead, they are understood according to the
movement as a whole (top-down meaning).
Emblems, in their turn, are conventionalised symbols and, although they
can be understood in the absence of speech, they often accompany speech and
present some linguistic properties. For example, an emblem that is widespread
across many cultures is the ‘OK’ movement corresponding to a clenched �st with
the thumb extended upwards29. This movement modi�es the noun or situation
being communicated, and it is synthetic because it encodes the meaning of its
own. Nevertheless, emblems are considered by McNeill as a case of segmented
semiosis, presumably because larger meanings can result from the combination
29 As symbols with an agreed-upon meaning, emblems usually di�er according to each cul-
ture. For example, the ‘OK’ sign is usually rendered in North America by means of the thumb
and the index in contact forming a circle, which in turn means ‘money’ in Japan, ‘sex’ in Mexico,
and ‘zero’ in France (Aronson et al., 2010, p. 90).
86

Literature review: prominence and language
of several of them.
Finally, at the left end of the spectrum, gestures are holistic because they
depend on speech for their meaning to be adequately understood. They also
stretch throughout space and time and lack linguistic properties (Figure 7).
Gesticulation � Pantomime � Emblems � Sign Language
Global and Global and Segmented and Segmented and
synthetic analytic synthetic analytic
Figure 7: Semiotic characteristics of gestures in the Kendon’s continuum.
2.3.3 The study of gestures until the 20th century30
2.3.3.1 Antiquity
In the Antiquity, gestures were recognised as a fundamental feature of hu-
man expression. For example, in the Indo valley manual gestures accompanied
the ritualistic pronunciation of the Sanskrit Vedas, so that the height of tonal
accents were matched by the height of the performed gestures (Shukla, 1996). In
the Greek and Roman tradition, gestures were performed with a more purpose-
ful goal, and public speakers considered them as part of the theatrical techniques
applied in the oratory to sway the feelings of the crowds. Among other com-
mentators on the role of gestures, such as Cicero, it was the Roman rhetorician
Quintilian (ca. 35-100), in the �rst century AD, who discussed in depth the role
of gesture in his Instutio oratoria (‘Education of the orator’). By the use of the
Latin word ‘gestus’, Quintilian not only referred to the movements performed
with arms and hands, but also to those aspectos of the nonverbal communica-
30 In this review of studies on gesture before the 20th century, I basically follow Kendon, 2004,
pp. 17-61.
87

Literature review: prominence and language
tion that can have an in�uence on the audience, such as the carriage of the body
and its posture, the movements of the head and the face, and the glance.
2.3.3.2 The Renaissance and the Enlightenment
Beyond the rhetoric e�orts of public speaking, gestures became more rele-
vant in relation to how to conduct and express oneself during the Renaissance.
Social position given by birth was not anymore the only way for courtiers to ac-
quire social status, but it was something to achieve now by meeting the new civil
standards set by works such as Il libro del cortegiano (‘The book of the courtier’,
1528) or Il Galateo, overo de’ costumi (‘Galateo: the rules of polite behaviour’,
1558), which circulated among the European courts. Around the same time, the
�rst European contacts with America arose the interest in gestures as a universal
means of communication in the absence of a common language. However, it was
L’arte de’ Cenni (‘The Art of Signs’, 1616) by Giovanni Bonifaccio, which was the
�rst work to address the topic of gesture systematically.
Previously, and also later, gestures were considered to be a ‘natural’, a more
‘primitive’ language, and as a consequence they were seen to form a universal
way of communication in the face of the numerous languages that the fall of
Babel gave rise to. These ideas prompted a series of philosophical re�ections on
the nature and origin of language. Even if Giambattista Vico is sometimes con-
sidered as one of the �rst thinkers to have written on a possible gestural origin of
language (1725/1744, see Danesi, 1993, for a review), such an idea became more
well-known through the work Essai sur l’origine des connaissances humaines (‘Es-
say on the origin of human knowledge’, 1746), by the French philosopher Étienne
Bonnot de Condillac. One of Condillac’s main arguments focused on how acci-
dental signsmay have become conventionalised. Thus, after a �rst stage inwhich
the natural gestures done by another individual may be interpreted as having
88

Literature review: prominence and language
communicative content, gestures are thought to have been produced voluntar-
ily and transformed into instituted sings. This �rst form of linguistic expression
would have been previous to any vocal sounds, which may have arisen at a later
stage (see Burling, 2000, for a modern account of sign conventionalisation and
its possible role in the origin of language).
Around the same time, in his Lettre sur les sourds et les muets (‘Letter on the
Deaf and Dumb’, 1751) the famous philosopher Diderot also showed interest in
the relation that gestures had to thought and speech. For him, thought was a
re�ection of the linear nature of spoken language, and so he wondered about the
structure of thought that gestures might impose on people deprived of the ability
to hear. The constraints imposed on thought by speech seemed to him more
arti�cial when compared to those of gesture, which he considered a medium
better suited for the expression of thought.
Interest in the gestures that deaf people make to communicate were started
to be seen as signs in their own right, i.e. as elements conveying meaning. Con-
sequently, the deaf could be regarded as having normal intelligence and even
able to be educated, once they learnt a proper system to communicate. This was
the task that the Abbé Charles-Michel de l’Épée committed himself to as the edu-
cator of deaf children. Helped by a group of deaf children who had already cre-
ated their own signs, de l’Épée developed a method to teach a system of manual
signs to French deaf children so that they could later develop their own system
of signs (1776). Nevertheless, the idea of sign languages like those developed by
de l’Épée and his successor, the Abbé Roch-Ambroise Cucurron de Sicard, was
not new, since John Bulwer had earlier developed a �nger-spelling alphabet and
dedicated a series of works to communication and the body (1644).
However, the idea that gestures, as those in sign languages, could be the basis
for a universal language was criticised later by Joseph Marie de Gérando in his
89

Literature review: prominence and language
work Des signes et de l’art de penser, considérés dans leurs rapports mutuels (‘On
signs and on the art of thinking considered in their relations to each other’),
which was published in 1800.
2.3.3.3 The 19th century
In the 19th century, the fundamental interests that had previously been mani-
fested in relation to gestures continued: the possibility of considering a gestural
stage previous to speech in the origin of language; the relationship between the
medium of communication and thought; and whether gestures can be seen as
a more fundamental form of expression. However, in the 19th century di�erent
disciplines opened up new perspectives, and archaeology, geology, and biology
made important contributions to the study of gestures.
For example, the archaeological discoveries that had been made at Hercu-
laneum and Pompeii unburied artifacts and mosaics depicting old Romans. This
had an important impact on howmodern common people living in the same area
saw themselves, which was made evident in the work La mimica degli antichi in-
vestigiata nel gestire napolitano (‘Gestural expression of the ancients in the light
of Neapolitan gesturing’), published in 1832 by Andrea de Jorio. The book o�ered
an explanation of the gestural expressions of the modern inhabitants of Naples,
which, for de Jorio, were a continuation of the cultural and gestural practices
that had been maintained since old Roman times. The abundant descriptions of
the gestures used in de Jorio’s time in Naples are still an important sample of
ethnographic research.
The relationship between the observed cultural di�erences and the basic unity
of the humanmindwas discussed by Edward Tylor in his Researches into the Early
History of Mankind (1865). Tylor, who was later regarded as one of the founders
of what later came to be known as cultural anthropology, began his book with a
90

Literature review: prominence and language
re�ection on language. Tylor’s underlying argument was that the expression of
thoughts and ideas by human beings through speech can also be achievedmainly
through gestures, pictures, and writing. Tylor proposed that gesture-language
and picture-writing share an ability to represent meaning. In the development
of this argument, he reviewed di�erent examples in which the gestures of sign
languages were used to communicate, as seen in the communication of the deaf,
in the sign language used by Native American Indians in speci�c situations, and
in the gestural behaviour of everyday life. By highlighting the striking similar-
ities among such groups, Tylor discussed in detail the conveyance of meaning.
Similarly, Garrick Mallery, a US colonel involved in the military campaigns
against the Native American Indians in the late 19th century he was assigned
to the US Bureau of Ethnology. In such a position he dealt with the sign lan-
guage that Native Americans used on certain occasions. The progress report on
his studies on this matter was published in 1881 as Sign Language Among North
American Indians Compared with that Among other Peoples and Deaf Mutes. In
this work, Mallery discussed the nature of the primordial language, as argued in
the biblical tradition, and defended that abstract thought and reason were pos-
sible for humans even before they were capable of speech. For him, concepts
can be formed and expressed by other means di�erent to sound, as it is the case
with gestures. Mallery concluded that, although both voice and gesture might
have aisen in parallel in the origin of language, gesture could have been more
important at an early stage.
Also in the 19th century, Charles Darwin’s book The Descent of Man (1871,
p. 56) included a comment on the origin of language, in which gestures were
referred to as the aid of “man’s own distinctive cries”, some of which are made
in “imitation of natural sounds”. Darwin understood human gesture in a purely
biologist manner as part of the nonverbal communication that is genetically de-
91

Literature review: prominence and language
termined in our species. In his The Expression of the Emotions in Man and An-
imals, published one year later (1872), he developed the idea that body move-
ments, and especially facial expressions, were, therefore, universal and tightly
linked to the expression of emotion. Darwin proposed an evolutionary account
of these facial expressions and argued that they were useful to the individual
for the performance of some basic actions. He went on to explain that raising
the eyebrows would increase the range of vision, but such an action would be
also of great adaptive advantage to human beings, for example, for communic-
ating. For Darwin, facial expressions were linked to our emotions and cannot be
language-speci�c, but universal.
Finally, at the end of the century, language started to be studied as a psycho-
logical phenomenon. Although Wilhelm Wundt was not the �rst researcher to
carry out psychological experiments, he was the �rst to open a laboratory of-
�cially designated for experimental psychology. His initial studies on sensation
and attention gave way to the study of social phenomena, and a full range of top-
ics were covered in his ambitious treatise Völkerpsychologie. Eine Untersuchung
der Entwicklungsgesetze von Sprache, Mythus und Sitte (‘Social psychology. An in-
vestigation of the laws of evolution of language, myth, and custom’), published
between 1904-1920.
In his Völkerpsychologie, Wundt devoted the �rst volume to human language,
and whose second chapter dealt with gestures. He presented a large review on
the topic and included examples of the sign language of the deaf that he had
personally encountered in several places; the sign language of Native America
as Mallery had described it; the gestural tradition of Naples—based on de Jorio’s
work—; and the sign language used by Cistercian monks. Wundt o�ered a classi-
�cation of the di�erent types of gesture and argued that, contrary to words, the
origin of gestures can be easily identi�ed, once the principles of expressivemove-
92

Literature review: prominence and language
ment is understood. For him, these basic expressive movements correspond to
the a�ective states that the individual experiences, which induce similar feelings
when observed by others. Communication is therefore the way these feelings
are conveyed. Beyond this, humans also share their conceptualised experiences,
which are shared bymeans of bodymovements in the form of voluntary gestures.
The conceptual reference so expressed is, for Wundt, what gestures add to the
emotional content of expressive movements. Thus, Wundt argued that gesture
is a primitive form language prior to speech because it combines both concept
and emotional content so that it relates naturally to its conveyed meaning.
2.3.4 Gesture studies in the 20th century
2.3.4.1 The importance of spontaneous gestures
Around the turn of the century, interest in gesture and language decreased.
Until Critchley’s work The Language of Gesture, which was published in the late
30’s (1939), there were few relevant publications on the topic. Nevertheless, little
after, Efron’s Gesture, Race, and Culture (1941/1972) was published, a work that
is considered the �rst modern study devoted to spontaneous gestures.
At the height of the racist theories purported in Nazi Germany, Efron studied
the hand movements performed by the Jewish and Italian immigrants that had
recently settled down in New York. One of his main conclusions was that ges-
ticulation di�ered among cultures, although the gesticulation of the immigrants’
children and grandchildren did not show any di�erences, as they had already
been assimilated by the Anglo-American culture.
One of Efron’s main contributions was the development of a careful method-
ology intended to account for his object of study. Efron classi�ed gestures into
twomain categories: gestures whosemeaningwas independent of speech, which
93
Literature review: prominence and language
he named objective gestures; and gestures tightly linked to themeaning conveyed
in speech, which he called logical-discursive gestures. Previously, gestures had
been classi�ed in relation to some particular aspect: for example, Wundt, sim-
ilar to Efron, had also based his classi�cation on semiotic principles and on the
relation between gestures and meaning.
Efron never presented his classi�cation in a systematic way, although his
work was the basis for later classi�cations, especially that of Ekman and Friesen
(§ 2.3.4.3). Nevertheless, a comprehensive summary of Efron’s typology can
be found in Ekman’s introduction to the reissue of Efron’s work in the 70’s
(1941/1972). In his classi�cation, Efron mainly focused on the di�erent perspect-
ives from which gestures can be considered as well as on the di�erent ways they
can be used.
Efron studied gesture, as performed with arms and hands, from three main
perspectives: a spatio-temporal perspective, dealing with the kinesic features of
movements; an inter-locutional perspective, focused on the interactional func-
tions of gestures; and �nally, a linguistic perspective, based on how gestures
convey meaning. He divided his linguistic perspective into gestures that have
an ‘objective’ meaning and those that have a ‘logical’ or ‘discursive’ meaning.
In addition, his category of objective gestures included deictic gestures, those
that point to an object; physiographic gestures, those that depict the form or the
spatial relationship of an object (iconographic gesture) or of a bodily action (kin-
etographic gesture). Finally, next to the categories of logical-discursive and objec-
tive, Efron also focused onwhat he called symbolic or emblematic gestures, which
correspond to the conventionalised emblems mentioned above, which possess
agreed-upon meanings (§ 2.3.1).
The second category proposed by Efron, logical-discursive gestures, become
relevant together with the speech they co-occur with. For him, they actually
94

Literature review: prominence and language
re�ect the cognitive process involved in speaking. Thus, rather that referring to
an object, the type of logical-discursive gestures, dubbed by him as batons in a
comparison to a conductor’s baton, reveal the linguistic mental activity of the
speaker. Finally, within this second category, Efron further considered what he
called ideographic gestures, i.e. gestures that depict in the space a sketch of the
abstract movements carried out by the speaker in their thinking process.
2.3.4.2 Kinesics and linguistics
Around the same time as Efron published his work, an interest beyond ges-
ture arose and extended into nonverbal communication (also ‘nonverbal behav-
iour’), which became a topic of research at the crossroads of linguistics, psy-
chology, and psychiatry. The use of simultaneous audio- and video-recordings
soon made obvious that far more than words were involved in communication:
tones of voice and vocal quality, patterns of intonation, style of talking, modes
of hesitation, body posture and body movements, facial expressions, etc.
Amultidisciplinary project called theNatural History of an Interview (Bateson,
1958; McQuown, 1971) brought together the linguists McQuown and Hockett
(and, at a later stage, Trager and Smith) with a team of psychotherapists and an-
thropologists (Birdwhistell among them) to analyse in detail the body behaviour
and the speech used in social interactions. Using an interview previously re-
corded by one of the researchers, a detailed description of everything that could
be observed in an interaction with a psychiatric patient was analysed. Among
the numerous observations made by the group, McQuown not only noted that
behaviour was re�ected in prosody (e.g. a narrowed pitch register could be sug-
gestive of depression, apathy, or boredom), but also that speech and body move-
ments were tightly linked.
The interest in the relationship between language and motion had �rstly led
95

Literature review: prominence and language
Birdwhistell to conduct research into kinesics (1952; 1970), and he proposed a
classi�cation of movements that included kines, allokines, kinemes, and kinemor-
phemes, in an analogy to the linguistic categories of phones, allophones, phon-
emes, and morphemes. His contention was that “linguists [had to] turn to body
motion for data to make sense out of a number of areas now hidden in the parts
of speech” (1970, p. 127). This undoubtedly called for a shift in the traditional
framework that was applied in linguistics to account for unresolved theoretical
issues. In his attempt to extend his analogy between kinesics and linguistics,
Birdwhistell also pointed out the close relationship between body movements
and intonation, although he did not pursue that line of research.
In his collaborationwith Birdwhistell, the psychiatrist Albert Sche�en, de�ned
a series of body movements according to the role they played in social interac-
tions (Sche�en, 1964). For example, Sche�en observed that head shifts used to
accompany di�erent arguments made by the speaker and torso shifts were as-
sociated with larger units of conversation. Similarly, Sche�en and Birdwhistell
also described how eyeblinks, head nods, and hand movements coincided with
the end of clauses. One of their main insights was that the movements made by
speakers are highly patterned and show structural features that are analogous to
those of speech.
2.3.4.3 Rede�nition of gesture categories
At a moment when the concept of ‘nonverbal behaviour’ had become known,
and psychiatrists had started to get interested in the topic, Freedman and Ho�-
man (1967) developed a classi�cation of hand movements as observed in psy-
chiatric interviews. They divided hand movements into two broad categories:
body-focused movements, in which the hands touch the body and are not speech-
related (e.g. grooming); and those related to speech, dubbed by them as object-
96

Literature review: prominence and language
focused movements. The latter category included �ve gesture types along a
continuum of increasing information content and decreasing integration with
speech: punctuating movements, which accentuate the accompanying speech,
but do not add any information to it; minor qualifying movements, which are
simply a “turning of the hand from the wrists” and add some information to the
speech content; literal-reproductive movements, which often portray a concrete
object or an event; literal-concretization, which also describe an event, but have
no physical referent, e.g. an emotion; and �nally, major-qualifying movements,
which are poorly integrated with speech and are often disruptive to it.
In their turn, Ekman and Friesen (1969) o�ered a well structured view of ges-
tures. Their work described a series of studies on body and face movements
observed in social interactions as well as in cross-cultural situations. They re-
de�ned and extended the previous classi�cation of gestures developed by Efron
and developed a classi�cation that included �ve categories of body movement.
Their �rst category corresponded to the previously mentioned emblem, a term
introduced by them, andwhich refers, as previously noted, to a signwhosemean-
ing is conventionalised and culture-speci�c. They also included, under the cat-
egory of illustrators, six types of movement, most of which were borrowed from
Efron’s classi�cation: batons, used to mark emphasis; pictographs, movements
imitating some of the characteristics possessed by their referents; kinetographs,
portraying a bodily action; ideographs, depicting the course of thought; deictics,
gestures physically pointing towards their referent; and spatials, illustrating spa-
tial relationships. Next to these, a seventh type of gesture was later added by Ek-
man, rhythmic movements, which depict the rhythm or pacing of an event. The
third category, regulators, include the movements that regulate the interaction
and determine turn-taking.
The �nal two categories developed by Ekman and Friesen fell out the cat-
97
Literature review: prominence and language
egory of gesture as de�ned by Efron. The �rst of these two categories was a�ect
displays, movements revealing the a�ective or emotional state of the speaker,
which are mostly performed by the face, as in the case of an expression of en-
thusiasm. The initial idea was that these may be universal, and Ekman later
renamed this category as emotional expressions (Ekman, 1999). The second one,
dubbed by them as adaptors, are movements performed to adapt to the environ-
ment; they include movements such as yawning or adjusting one own’s glasses,
for example, and were later renamed asmanipulators by Ekman (1999) (see Table
6, § 2.3.5, for an overview of di�erent gesture classi�cations).
2.3.4.4 Micro-analyses of gestures in relation to speech
So far, studies on gesture and classi�cations by di�erent authors encom-
passed a wide range of body movements and did not explicitly focused on ges-
ticulation (e.g. emblems were also analysed), even if in the second half of the
20th century important insights were gained into how the body movements of
gesticulation were related to speech.
Condon’s initial studies started in the early 1960’s and were intended, simi-
larly as inMcQuown’swork, to contribute to psychiatric studies. Condonworked
together with William Ogston, and both relied on �lmed interactions, as previ-
ous studies had done. However, di�erently from them, Condon and Ogston used
a time-aligned oscilloscope to thoroughly analyse how the body parts moved in
combination and formed hierarchical units in relation to speech. They observed
that large movements such as those performed by the head or the arms encom-
passed smaller ones, such as the tiny movements of eyebrows and hands, which
were recognisable in subtle changes of direction and speedwithin the continuous
movement (Condon & Ogston, 1966, 1967).
Condon and Ogston also noticed that some of the rhythmic patterns of body
98

Literature review: prominence and language
movements were performed at the smallest level of the linguistic hierarchy, i.e.
the phone, while some others corresponded to syllables and words. They de-
scribed two more levels of bodily rhythmic behaviour, which coincided with
verbal stress, and occurred at a half-second cycle and at one-second cycle (Con-
don, 1976), respectively. This tight relationship between movement and speech
was seen by them as a case of self-synchrony.
Nevertheless, Condon (1976) observed that not onlywere the speaker’smove-
ments synchronised with their speech, but also that “the listener moves in syn-
chrony with the speaker’s speech almost as the speaker does” (Condon, 1976, p.
305)31, even in the case of infants as young as 20 minutes old. This e�ect was
named interactional synchrony by Condon, who presumed that it might result
from a basic and common neurological processing of movement in both speak-
ing and listening, thus allowing a listener to entrain their own rhythmic patterns
to those of the speaker.
2.3.4.5 Related hierarchy of gesture and speech
Kendon drew on much of Condon and Ogston’s work and focused on the
spontaneous gestures that accompany speech. Using the same methodology,
which also combined �lmed material and the use of an oscilloscope, he took
a step forward in the classi�cation of the hierarchical units of body movements,
especially manual gestures (Kendon, 1972). In his study, Kendon con�rmed that
a nested hierarchy of speech phrases was matched by a similar nested hierarchy
of gesture units.
31 For a more recent account of how listeners’ gestures adapt to those of speakers in face-to-
face conversation see Mol et al., 2012. This adaptation to another individual’s gestures seems to
be mediated by a motor copy of the observed body movement through the mirror neuron system
(e.g. Montgomery et al., 2007).
99

Literature review: prominence and language
For Kendon, the smallest gesture unit and nucleus of the gesture was the
stroke, which is the distinct e�ort of the gesture that spans over a small inter-
val of time. Strokes may be preceded by a preparatory phase and are typically
followed by a retraction phase. In the optional preparation, the articulator, for
example the hand, is brought to the point where the stroke is initiated; and in
the retraction (also called ‘recovery’), the articulator is brought back to a resting
position, either to its starting point or to any other point from where the next
gesture can eventually be initiated. The typical combination of a preparation and
a stroke was de�ned by Kendon as a gesture phrase, which forms a gesture unit
when the retraction is included and the articulator comes back to a resting posi-
tion (Figure 8). Furthermore, several gestural units, de�ned as successive rests of
the articulator, can be grouped by a common feature, typically a repeated head
movement. Finally, a consistent body posture and a consistent use of the artic-
ulator involved, for example the arm, were proposed by Kendon as the highest
level of the nested gestural hierarchy.
As observed in Figure 8, the entire gesture unit begins when the speaker
starts moving his hand away from its resting position on the table and ends
when he returns his hand to the table. During the course of this gesture unit,
the speaker carries out the stroke. The preparation of the gesture is initiated
when the speaker lifts his hand away from the table to a position in front of him
where the stroke is to be performed; for this, the orientation of the hand and the
position of the �ngers also change. After the stroke, the recovery starts, and the
hand returns to its resting position, which is included in the gesture unit but not
in the gesture phrase.
The speaker performs a manual action for ‘scattering’ that co-occurs with
the verb ‘throw’ and which is semantically coherent (‘co-expressive’ in McNeill’s
terms) with the meaning of the verb. Thus, the verbal expression of the utter-
100

Literature review: prominence and language
Figure 8: On the left, picture A shows the speaker’s rest position before and after the stroke. On the
right, picture B shows the stroke of the speaker’s gesture phrase. RH stands for right hand; in the
displayed sentence, (. . . ) stands for a pause in speech together with its length in tenths of a second;
the stressed syllable appears in capital letters. Adapted from Kendon, 2004, p. 114.
ance is exempli�ed by the movement of the hand. However, the speaker does
not necessarily express the same meaning through both modalities. In this case,
the verb ‘throw’ has a general and abstract meaning, and the way in which the
action of throwing is carried out ultimately depends on the shape, size, weight
and material of what is being thrown. The manual gesture speci�es the action of
throwing and makes it more precise. The preparation for the gesture is under-
taken before the verb is uttered in a combined expression, which shows how the
101

Literature review: prominence and language
speaker gets ready to perform the gesture prior to the verbal component of the
utterance.
Also, Kendon described in detail the alignment of this gestural hierarchywith
intonation. He observed that the stroke coincided with the onset of the stressed
syllable, or was just previous to it; while a tone group corresponded to a gestural
phrase. In the case of gestural units, which included a recovery phase next to
the preparation and the stroke, the intonation equivalence was a complete sen-
tence (or locution, in Kendon’s terminology). Finally, consistent head movement,
and consistent arm use and body posture corresponded to a locution group (i.e. a
group of sentences with a common intonational pattern), and to a locution cluster
(i.e. a paragraph), respectively. As observed in Figure 9, the larger the intona-
tion unit, the greater the change in the gestural hierarchy, perhaps as a form of
working memory control.
The gestural hierarchy proposed by Kendon was later extended. Kita (1993)
observed the occasional occurrence of both a pre-stroke hold and a post-stroke
hold. Strokes may optionally be preceded by a brief hold before its beginning
or followed also by a hold in which the articulator is maintained in the position
at which it arrived and allows the stroke to be prolonged. Similarly, subsequent
studies called for a more precise analysis of the nucleus of the gesture, and the
category of apex was introduced (Levelt et al., 1985) as a subphase within strokes
corresponding to the peak of e�ort that occurs at an instant in time, i.e. the
“kinetic ‘goal’ of the stroke” (Loehr, 2004, p. 89). Finally, Kipp (2003) pointed out
that in certain occasions, after a forceful stroke, the hand lashes back from the
end position of the stroke, and the resulting movement can be interpreted as a
recoil phase.
The existing synchrony of certain gestural structures with certain phono-
logical structures led Kendon to conclude that there exists a highly specialised
102

Literature review: prominence and language
Consistent arm use and body posture
(Locution cluster)
Consistent head movement
(Locution group)
Gesture unit
(Locution)
Retraction
Gesture phrase
(Tone group)
Stroke
(Stressed syllable)
Optional preparation
Figure 9: Gestural hierarchy, matched by the intonational hierarchy (in brackets), as developed by
Kendon (1972). Gestural phrases cannot exist without a stroke, the nucleus of the gesture, which
appears underlined in the diagram. Adapted from McNeill, 1992, p. 82.
coordination of body movement and speech. Kendon developed this idea further
and went on to suggest that both speech output and kinesic output are two as-
pects of the same process, i.e. both are the visible forms of a single underlying
utterance (Kendon, 1972, 1980) and form an idea unit.
2.3.4.6 Gesture and the cognitive foundations of language
The synchrony of spontaneous gestures and speech was started to be seen
as a relationship that revealed important aspects of the cognitive foundations of
language. Based on Kendon’s work, this relationship was explored by McNeill
(e.g. 1985; 1992), who also posited that gesticulation is so tightly linked with
speech that both must be seen as two aspects of an utterance.
103

Literature review: prominence and language
For McNeill, this dialectic relationship is seen in cognitive processes involved
in speech, imagistic thinking, and linguistic categorial thinking. He proposed the
term growth point to refer to the starting point from which the utterance unfolds
and develops into a combination of visible gesture and speech:
“The growth point is the speaker’s minimal idea unit that can
develop into a full utterance together with a gesture [...]. The content
of the growth point tends to be the novel departure of thought from
the presupposed background. It is the element of thought that stands
out in the context and may be the point of greatest relevance.
The concept of the growth point unites image, word and prag-
matic content into a single unit. In this way it is a unit with the prop-
erties of the whole and could initiate the microgenetic process of the
utterance formation. It is also a unit that encompasses properties of
an opposite character—both imagistic and linguistic, idiosyncratic
and social, global and segmented, holistic and analytic—and this is a
source of instability [which is the foundation of its dialectic nature]”
(McNeill, 1992, p.220).
This view is against the idea that an utterance is built in a linear way, piece by
piece, as proposed by Levelt (1989). Rather it defends that an utterance contains
from its very beginning what is to be expressed and combines di�erent modes
of representation at an early computational stage. Both imagistic thinking and
thinking involving linguistic categories engage in a cognitive process that grows
towards a shared expressive end.
In McNeill’s view, several facts support the notion of a common initial stage
of gesture and speech. On the one hand there exist structural and functional
parallels between both modes of expression, and language acquisition shows
104

Literature review: prominence and language
the synchronised development of speech and gesture. It has also been observed
that di�erent types of aphasia may manifest themselves similarly in gesture and
speech. On the other hand a synchrony between both modes of expression can
be observed at di�erent levels. McNeill formulated several rules that account
for this synchrony. His phonological synchrony rule is based on Kendon’s (1972;
1980) observation that the stroke of the gesture is prior to, or coincides with, the
stressed syllable, but it never occurs after it. Also, McNeill’s semantic synchrony
rule predicts that gestures and speech relate to the same idea unit and convey
the same meaning simultaneously. According to McNeill, although spontaneous
gestures can theoretically convey an unrelated meaning to that of speech, it de-
mands an e�ort to produce a gesture contradicting the conveyed idea unit. Nev-
ertheless, pauses, multiple gestures, and gestures corresponding to more than
one clause can blur the limits of the semantic synchrony rule. Finally, the prag-
matic synchrony rule reveals, in a similar way, the underlying cognitive connec-
tion between gesture and speech. For McNeill, gestures and speech perform the
same pragmatic function when they co-occur. This is evident mainly in the case
of metaphoric gestures, which may not necessarily relate to the semantic con-
tent, but rather have the same pragmatic function. For example, in the spoken
utterance ‘the lesson went on and on’, a circular movement performed with the
hand co-expresses the same idea on a pragmatic level.
Nevertheless, McNeill’s views on the shared computational stage of gesture
and speech and their interdependence were later called into question. For ex-
ample, it was argued that in order to understand the cognitive relation between
both modes of expression it was necessary to analyse in more detail the pre-
cise nature of their temporal coordination (Butterworth, 1989; Feyereisen, 1987).
Along similar lines, it has been claimed that:
“Simultaneity of two events is not evidence that the two events
105

Literature review: prominence and language
aremore tightly coupled (i.e. with less variance) than two events that
occur at a �xed lag. Evidence that two events exhibit a functional
linkage or couplingmust come from examining variability” (Leonard
& Cummins, 2010, p. 69).
In this sense, according to McNeill (2005), synchrony between gesture and
speech lies in the process of conceptualization, which is not necessarily re�ected
in a strict synchrony in production. Yet, Leonard and Cummins (2010) found
evidence of the phonological synchrony rule. In their study, they observed that
listeners systematically detected mismatches in co-speech beat gestures if they
occurred only 200 ms later than naturally produced ones32. Similar experiments
analysed and con�rmed synchrony of gesture and speech at semantic, functional,
and prosodic levels (e.g. Esteve-Gibert & Prieto, 2013; Ishi et al., 2014; Kim et al.,
2014; Loehr, 2012; Özyürek et al., 2007; Rochet-Capellan et al., 2008).
Following McNeill’s insights, others have also put forward a di�erent theo-
retical model to account for the cognitive integration of gesture and speech. For
example, Kita (2000) suggested that both modalities do not belong to the same
cognitive process, but are separate processes whose close coordination results
from their interaction at an early stage, when information is packaged, organ-
ised, and distributed across both modalities. Di�erent from McNeill’s growth
point, in Kita’s Information Packaging hypothesis, gestures are produced by what
he calls ‘spatio-motoric thinking’, as opposed to the ‘analytic thinking’ of speech
suggested byMcNeill. Kita’s view assumes that gesture is involved in the concep-
tualisation of information for speaking and both forms of thinking are combined
into a single utterance. Thus, an increased use of gesture is predicted by a di�-
culty in conceptualizing information (Kita & Davies, 2009). This increased use of
gesture is also predicted in the case speakers have strong visuo-spatial skills but
32 See note 38.
106

Literature review: prominence and language
weak verbal skills (Hostetter & Alibali, 2007), or even when new information is
introduced into the dialogue (Bergmann & Kopp, 2006).
In De Ruiter’s view (2000), and contrary to McNeill, gesture and speech do
not relate to each other in a dialectic way at an early computational stage. In
his view, which is an extension of Levelt’s (1989) linear information processing
model, gestures arise in a process that is parallel to the di�erent stages that pro-
duce an utterance. Each stage is realised by individual modules, which are con-
nected to one another in a linear sequence. According to De Ruiter, the parallel
generation of gestures expresses the parts of the idea unit that cannot be ex-
pressed linguistically, in a process that he calls sketching.
Di�erently from the previous views, the production of gestures have also
been associated to verbal dis�uencies and to hesitation pauses or pauses before
words indicating problems with lexical retrieval (Butterworth & Beattie, 1978;
Dittmann & Llewelyn, 1969). Based on this evidence, the Lexical Retrieval hypo-
thesis (Krauss &Hadar, 1999) postulates that both gesture production and speech
production are rooted in separate memory representations, i.e. visuo-spatial and
propositional, respectively. In this case, the semantic features of both gesture and
speech are thought to be activated and processed by each computational system
without any coordination between them. Cross-modal interaction of gesture and
speech is believed to result when features happen to be processed by both sys-
tems at a later stage, when a selected gesture can prime words during lexical re-
trieval. Nevertheless, di�erent studies have yielded results that contradict some
of the basic principles of the Lexical Retrieval hypothesis. For example, it was
observed that speakers performed fewer gestures, not more, when there were
�lled pauses—pauses used by the speaker to search the next word, i.e. interrup-
tions in the �ow of speech such as ‘uh’, ‘ah’, ‘er’, and ‘um’ (Christenfeld et al.,
1991). Similarly, in an experiment where speakers where forced not to gesture,
107

Literature review: prominence and language
speech was not found to be altered (Hoetjes et al., 2014). At any rate, the formu-
lation of the Lexical Retrieval hypothesis came to stir up the debate around the
primary role of gestures, i.e. whether they are a fundamental part of the speech
production process or whether rather they serve an expressive communicative
purpose.
2.3.5 Categorising gestures
Di�erent schemes aiming at ordering and classifying gestures may be traced
back to the Antiquity, as in the case of Quintilian’s categorisation based on the
body part involved in the execution of the gesture and its functional character.
More recently, the renewed interest that the subject experienced since the middle
of the 20th century made this classi�catory e�ort more explicitly categorical. The
criteria used for classifying the phenomenon of gesture are extensive; however,
most authors include a basic division between gestures referring to an object by
pointing at it (deictic gestures) and gestures characterizing the object in some
way (representational gestures). Several authors also include a category for ex-
pressive gestures accounting for a state of mind or a mental attitude, and in many
cases, they discuss gestures that punctuate or make reference to aspects of the
structure of the discourse, either to its phrasal organization or to its logical struc-
ture. Thus, the terminology used in the literature is changing, and authors di�er
in the emphasis they place on di�erent possible criteria, which may include:
“[W]hether [gestures] are voluntary or involuntary; natural or
conventional; whether their meanings are established indexically,
iconically, or symbolically; whether they have literal ormetaphorical
signi�cance; how they are linked to speech; their semantic domain
– for example, gestures have been divided into those that are ‘objec-
tive’, serving to refer to something in the external world, and those
108

Literature review: prominence and language
that are ‘subjective’, serving to express the gesturer’s state of mind.
Gestures have also been classi�ed according to whether they con-
tribute to the propositional content of discourse, whether they serve
in some way to punctuate, structure or organise the discourse, or
indicate the type of discourse that is being engaged in; and whether
they play a primary role in the interactional process, as in salutation,
as a regulator in the process of turn-taking in conversation, and the
like” (Kendon, 2004, p. 84).
Kendon (2004) himself, for example, analysed spontaneous gestures along
several categories; for example, in relation to their referential meaning, and in
relation to their function. In the latter case, he distinguished between substantial
gestures, which contribute to the semantic content of the utterance, and prag-
matic gestures, i.e. those that convey aspects of the situational embedding.
Kendon also described four gestures families based on their kinesic charac-
teristics and their formation patterns: �rstly, two precision grip actions, i.e. grap-
polo (or g-family), in which all the �ngers are brought together until they are in
contact; and the ring (or r-family), in which the thumb and index �nger are put
into contact at their tips (Figure 10).
And secondly, two families of the open hand, in which the hand shape is
‘open’ but �ngers are not spread, i.e. the palm-down family, in which the fore-
arm is always in a prone position, so that the palm of the hand faces either toward
the ground or away from the speaker (used when something is denied, negated,
interrupted or stopped, whether explicitly or by implication); and �nally, the
palm-up family, in which the forearm is always supine, so that the palm of the
hand faces upwards (used when the speaker is o�ering, giving or showing some-
thing or requesting the reception of something).
109

Literature review: prominence and language
Figure 10: Examples of the precision grip actions described by Kendon (2004): in the upper row,
the kinesics of the grappolo family (g-family), with a variant on the right; in the lower row, three
examples of the ring family (r-family).
McNeill’s classi�cation
In previous sections, the classi�cations developed by some authors in the 20th
century have been brie�y discussed, e.g. Efron (§ 2.3.4.1), Ekman and Friesen (§
2.3.4.3), and Freedman and Ho�man (§ 2.3.4.3). Efron’s work, for example, al-
though did not categorise gestures systematically, was the starting point for Ek-
man and Friesen’s own classi�cation. Both have important similarities, such as
the various ways in which gestures relate to speech and how they convey mean-
ing. On the contrary, the classi�cation of Freedman and Ho�man has a di�erent
orientation, mainly because it was based on gestures that were observed during
psychotherapy sessions. For example, Freedman and Ho�man’s object-focused
movements were categorised according to their degree of information content
and their integration with speech. Di�erently, McNeill worked on gestures per-
formed by participants engaged in storytelling. His classi�cation, which has been
widely adopted, followed the tradition of both Efron, and Ekman and Freedman,
and is based on the symbolical expressiveness of spontaneous gestures in relation
110

Literature review: prominence and language
to the context created by the speech they co-occur with.
As previously mentioned, McNeill made a series of distinctions based on
Kendon’s work, which are splendidly summarised in the Kendon’s continuum.
They include: (1) how gestures relate to speech (Figure 4); (2) the extent to which
they have linguistic properties (Figure 5); (3) the extent to which they are con-
ventionalised (Figure 5); and (4) how they contrast in terms of their semiotic
properties (Figure 7).
At the left end of the continuum, gesticulation always appears temporally co-
ordinated with speech, lacks linguistic properties, and its kinesic features are not
conventionalised. Consequently, they have special semiotic characteristics, i.e.
they are both global and synthetic: the whole meaning of a gesture determines
themeanings of each of its parts, and each of its parts are synthesised into a single
gesture. These gestures, as studied by McNeill (1992), do not combine with each
other to form larger, hierarchically structured gestures; rather, when they occur
successively within a clause, each corresponds to an idea unit. Additionally, the
fact that gestures at the left end of the continuum are both created at the time
of speaking and are not determined by a code makes them incorporate only the
most salient aspects of the context in which they occur. Thus, a speaker’s gesture
for a precise referent may show several forms to highlight a variety of contextual
aspects at di�erent moments. As a result, this lack of standards in the produc-
tion makes gestures become idiosyncratic, i.e., they largely vary from speaker to
speaker.
In his classi�cation, McNeill established a fundamental division between ima-
gistic gestures and non-imagistic gestures. The former are those that depict the
shape of an object, display an action or represent some pattern of movement.
Depending on whether they are concrete or abstract, they can be grouped into:
iconic, which display, in the form and manner of their execution, aspects of the
111
Literature review: prominence and language
same concrete scene that is presented in speech; and metaphoric, which display
an image, either as a shape or a movement, that represents or stands for some
abstract concept.
Non-imagistic gestures include pointing gestures, rhythmic gestures that high-
light either segments of the discourse or its rhythmic structure, and gestures
associated to speech failures. Firstly, pointing movements, i.e. deictic gestures,
are prototypically performed with the pointing �nger, although any extensible
object or body part can be used, including the head, nose, chin, as well as manip-
ulated artifacts. Deictic gestures relate utterances to the circumstances of space
and time in which they occur. Secondly, within rhythmic gestures, McNeill in-
cludes beats, which are movements that do not represent a discernible meaning
and are simple up-and-down or back-and-forth movements of the hand; and co-
hesives, which are used by the speaker to to join together thematically related,
but temporally separated, parts of the discourse. For McNeill, cohesives can be
imagistic or can be performed as pointing gestures. A �nal category is what
McNeill calls butterworths, which are typically made when a speaker is trying to
recall a word or another verbal expression (Table 6).
Although McNeill’s classi�cation has been widely used by scholars, several
points concerning his categorisation have been raised. For example, Kita con-
sidered that iconics and abstract deictics should be grouped into the category of
representational gestures:
“Representational gestures are de�ned here as iconic gestures
and abstract deictic gestures (McNeill, 1992). In an iconic gesture
there is a certain degree of isomorphism between the shape of the
gesture and the entity that is expressed by the gesture. An abstract
deictic gesture points to a seemingly empty space in front of the
body, as if establishing a virtual object in the gesture space or point-
112

Literature review: prominence and language
McNeill Efron Ekman and Friesen Freedman and Ho�manBrief description
Non-imagistic Logical-discursive Illustrators Object-focused
Deictics Deictics Deictics Literal-reproductive33 Pointing gestures
Beats BatonsBatons Punctuating Bi-phasic movements without meaning
Rhythmics Minor and major qualifying Rhythmic movement
Cohesives — — — Movements to join separate parts of the discourse
Butterworths — — Speech failures Movements made in a speech failure
Imagistic
Metaphorics IdeographicsIdeographs Literal-concretization Movements portraying an abstract idea or emotion
Spatials — Movements depicting spatial relationships
Objective
Physiographics:
Iconics– Iconographics Pictographs
Literal-reproductiveMovements portraying a referent
– Kinetographics Kinetographs Movements depicting a bodily action
Table 6: Summary of gesture classi�cations that correspond to McNeill’s categories for spontaneous
co-speech gestures, i.e. manual gesticulation. Adapted from McNeill, 1992, p. 76 and Loehr, 2004, p.
31.
ing at such a virtual object. Because these gestures have a relatively
transparent form-function relationship, they play an important role
in communication” (Kita, 2000, p. 162).
Di�erent views on what iconic gestures should include are abundant. In this
sense, it has been pointed out that ‘iconicity’ is a concept from the �eld of semi-
otics, which has its “own speci�c, and at times complex, meaning in the history
33 Ekman and Friesen themselves comment on Freedmamn and Ho�man’s category: “They
included [. . . ] literal-reproductive movements (which would include our sub-types of deictic,
iconographic, kinetographic, pictographic), and literal-concretization (which would be our ideo-
graphic)” (Ekman & Friesen, 1969, p. 68). However, in this extract, Ekman and Friesen’s sur-
prisingly mentioned an inexisting ‘iconographic’ category within their illustrators. It is possible
that they might have meant spatials or that they referred to one of the possible aspects of coding
meaning in gestures.
113

Literature review: prominence and language
of ideas” (Mittelberg & Evola, 2013, p. 1740). Thus, it is possible to �nd di�erent
iconic relations between gesture and speech. AsMittelberg and Evola themselves
(2013, p. 1741) sum up, these iconic relations can occur:
1. Between an individual gestural sign carrier and what it evokes or repre-
sents, e.g.iconic gestures, representational gestures.
2. Between gestures and the concurrent speech content as well as prosodic
contours.
3. Gestural behavior of interlocutors, e.g. mimicry (Kimbara, 2006).
4. As iconic patterns emerging from gestural forms recurringwithin the same
discourse, e.g. locution clusters (Kendon, 1972).
5. Across discourses and speakers, e.g. recurrent gestures (e.g. Bressem, 2013)
and geometric and image-schematic patterns in gesture space (e.g. Cienki,
2005).
6. Across di�erent languages (e.g. Özyürek et al., 2005).
7. Across di�erent age groups, clinical groups, social groups, or cultures (e.g.
Cocks et al., 2013).
2.3.6 Head movements and facial expressions
Most of the work discussed above concentrated on the arm and hand move-
ments typically found in gesticulation, and researchers consequently based their
classi�cations on them. There have also been some e�orts to classify gestures
performed with the head, especially as part of the nonverbal behaviour studied
114

Literature review: prominence and language
in psychiatry (e.g. Freedman&Ho�man, 1967). Head gestures performed in face-
to-face conversation, similar to manual gestures, are non-conventionalised and
lie at the left end of the Kendon’s continuum.
Analyses of head gestures have reported that consistent head movements are
associated to the production of several sentences sharing a common intonation
pattern (e.g. ‘locution group’, a group of sentences with a common intonational
pattern) (Kendon, 2004). The interrelation between head movements and speech
was explored in detail by McClave (2000), who identi�ed semantic, discourse,
and communicative functions associated to head gesturing, following the well-
established tradition of micro-analysing movements using video-recordings:
“Speakers predictably change the position of their heads at the
beginning of direct quotes, and for alternatives or items in a list.
In narration head orientation functions to locate a referent in ab-
stract space. Because such deictic head movements precede verbal-
ization itself, they cannot be nonverbal translations of speech. Thus,
like manual gestures such movements are manifestations of core
concepts that are expressed both nonverbally and verbally (McNeill,
1992). Some speaker head nods have been shown to have an interact-
ive function in triggering backchannels. Listeners are extraordinar-
ily sensitive to such signals and respond within a second” (McClave,
2000, p. 876).
For McClave, both head nodding and head shaking, associated to positive
and negative responses, respectively, are the most common semantic function
together with a sweeping lateral movement of the head to refer to ‘everyone’ or
‘anything’. In her study, McClave �nally concluded that there might exist cross-
linguistic di�erences in some of the head movements she studied, especially in
115

Literature review: prominence and language
the nods functioning as backchannel requests (i.e. phatic communication from
the listener), while some other movements might be universal, such as deictic
movements performed with the head that serve to locate referents in abstract
space.
Nonetheless, di�erently from manual gestures, and partly due to the bio-
mechanical constraints of head gesturing (Figure 11), movements performedwith
the head are often regarded as serving pragmatic rather than semantic functions.
Figure 11: Schematic overview of the biomechanics of the head. Movements along the three axes
and their respective rotations are accompanied by examples of gestures performed in head gesturing.
Adapted from Wagner et al., 2014, p. 212.
Head gestures are performed around the three axes X, Y, Z corresponding to
rotations known as ‘roll’, ‘pitch’, and ‘yaw’, respectively. Rotation around the X
axis in up-down movements, i.e. nods, and down-up movements, i.e. jerks, are
responsible for a head gesturing predominantly performed by the listener as a
backchannel signal. Despite the fact that head nods and jerks are more numer-
ous in the role of listener, they can also be performed by speakers, probably with
important cross-linguistc di�erences, as in the case of Japanese head nods in con-
versations (Ishi et al., 2014). Similarly, lateral head shakes are performed around
116

Literature review: prominence and language
the Y axis, and angular rotations around the Z axis result in a tilt movement, ie.
the lateral bending of the head. Apart from the direction, the ‘cyclicity’ of some
head movements also play an important role in distinguishing among appar-
ently similar head gestures. For example, repeated lateral head shakes contrast
with single turns of the head to either side (Heylen, 2008). In this sense, di�er-
ences between linear and cyclic movements are associated to di�erent pragmatic
functions, e.g. single and repeated nods relate to turn-taking and responses to
questions, respectively, which again show cross-linguistic di�erences (e.g. for
Swedish, Cerrato, 2007; for English, Hadar et al., 1985; for Japanese, Ishi et al.,
2014).
Head movements also convey attitudinal and emotional information. For ex-
ample, a single and rapid head nod might signal impatience (Hadar et al., 1985).
In this sense, head gestures closely interact with facial expressions, especially
eyebrow movements.
The expressivity of the face in conversation was initially addressed by Ek-
man and Friesen (1969), who created the category ‘a�ect displays’. In a line that
can be traced back to Darwin (1872) (§ 2.3.3.3), Ekman and Friesen proposed
the existence of several universal primary a�ects that are expressed through the
movements of the facial muscles: happiness, surprise, fear, sadness, anger, dis-
gust, and interest. Being aware of the criticisms that their categorisation might
raise, Ekman and Friesen stated that the question of these universals “is not as
yet a proven fact, and many would disagree”34 (1969, p. 73). For Ekman and
Friesen, these primary a�ects play several roles in communication:
“Facial behavior in general, and a�ective displays in particular,
34 Certainly, the controversy was considerable at the time, although the debate around which
emotions constitute universal facial expressions is still open. See, for example, Crivelli et al., 2016
or Jack et al., 2012.
117

Literature review: prominence and language
receive great attention and external feedback from the other inter-
actant" [...]. A�ect displays can be related to verbal behavior in a
number of ways. They can repeat, qualify or contradict a verbally
stated a�ect, or be a separate, unrelated channel of communication”
(Ekman & Friesen, 1969, p. 77).
However, a di�erent line of research from the study of the communicative
e�ect of emotions as expressed through facial expressions came from the ob-
servations that gesture and speech are temporally coordinated. Initial insights
gained in the 60’s and 70’s pointing to this synchrony were previously discussed
(§ 2.3.4.4 and § 2.3.4.5). In the next section, a more detailed account of the time-
alignment between manual gestures and speech is o�ered. The interaction of
both head and eyebrow movements with speech will be dealt with in § 2.3.8.1.
2.3.7 Temporal coordination of gesture and speech
As mentioned earlier, the claimed synchrony between gesture and speech
was put to the test for a better understanding of how both modes of expression
relate to each other. Both gesture production and speech production had been
shown to have a certain degree of synchronisation (e.g. Kendon, 1972), which led
to hypothesise about their cognitive interdependence (e.g. Kita, 2000; McNeill,
1992). Subsequently, the task of preciselymeasuring the alignment of gesture and
speech was based on the estimation of gesture e�ort maxima35 that co-occurred
35 In this regard, several criteria appeared in the literature. For example, Kita et al. argued
that: “Di�erent types of phases can be identi�ed by di�erent foci of ‘e�ort’ [...]. In a preparation
and a retraction, the e�ort is focused on reaching their respective end points (the beginning of
the following stroke and the resting position). In contrast, in a stroke, the e�ort is focused on
‘the form of the movement itself – its trajectory, shape, posture.’ (McNeill, 1992, p. 376)” (Kita
et al., 1998, p. 27).
118

Literature review: prominence and language
with speech: either with stressed syllables (e.g. McClave, 1991; Tuite, 1993), with
the lexical a�liates of the gesture (e.g. Levelt et al., 1985; Morrel-Samuels &
Krauss, 1992; Scheglo�, 1984), with focused words (e.g. Butterworth & Beattie,
1978), with intonation peaks (e.g. De Ruiter, 1998, experiment 2), or both simply
co-occurred without being temporally aligned (McClave, 1994). Methodological
di�erences yielded inconsistent results on the precise temporal coordination of
gesture and speech, and as a result several views on the matter were put forward.
2.3.7.1 Precedence of gesture
Initially, Butterworth and Beattie (1978) observed that iconic gestures tended
to start in a pause just before the corresponding focused word, whether noun,
verb, adverb, or adjective. In a similar way, words in a contrastive focus condi-
tion were found by Roustan and Dohen (2010) to coincide with the apex of point-
ing gestures. They concluded that apexes were aligned with articulatory vocalic
targets (in their case, peak of amplitude of either lip opening or lip protrusion)
and not with acoustic correlates (peaks of f 0 and intensity), so that “focus and
manual gestures are coordinated in the sense that focus ‘attracts’ the manual
gesture” (Roustan & Dohen, 2010, p. 4).
Other studies also reported that the onset of gestures generally precedes that
of speech. For example, Schelo� (1984) analysed the temporal relationship of
gestures with their lexical a�liates (either the accompanying word or a phrase
sharing a commonmeaning with the gesture) and observed that the stroke phase
of deictic gestures were generally produced in anticipation (similar results were
obtained by Ferré, 2010). Interestingly enough, Morrel-Samuels and Kraus (1992)
reported that the precedence of gesture to speech was reduced in proportion to
the speaker’s familiarity with the uttered word. Besides, this familiarity was
also related to the duration of the gesture, which was observed to be shorter as
119

Literature review: prominence and language
the word was more familiar to the speaker. The role played in the temporal co-
ordination of gesture and speech by the semantic content was also explored by
Bergmann and her colleagues (2011). They found that the asynchrony of ges-
ture and speech decreased when both modalities were redundant and expressed
the same content, while it increased when gesture complemented the semantic
content of speech.
2.3.7.2 More accurate measurements
In an attempt to gain precision, Loehr (2004; 2012) measured the temporal
coordination between accented stressed syllables occurring in spontaneous dia-
logues and the apex of several types of gestures: deictics, iconics, metaphorics,
beats, head movements, and emblems. In his results, Loehr observed that apexes
of all gestures (a more exact temporal measure within strokes corresponding
to an e�ort maximum) signi�cantly tended to align with accented stressed syl-
lables. Similary, in a study conducted by Jannedy and Mendoza-Denton (2005)
using �lmed material of a political speech, there were almost no apexes that
did not coincide with a pitch accent. Additionally, Flecha-García (2006; 2007),
using spontaneous speech material, found statistical signi�cance for the time-
alignment of eyebrow raises and surrounding pitch accents, especially following
accents. In a similar way, alignment between pitch and intensity maxima of ac-
cented stressed syllables was also reported by Nobe (1996, experiment 4), who
analysed deictic, iconic, and metaphoric gestures, following McNeill’s methodo-
logy of recording the narration of cartoon �lms by participants.
Furthermore, Rochet-Capellan and her colleagues (2008), in a study to estab-
lish more accurately the synchronization between gesture and speech, analysed
the alignment of deictic gestures with jaw movement. They measured the jaw-
opening maximum in the stressed syllable of oxytone and paroxytone words and
120
Literature review: prominence and language
what they called the ‘pointing plateau’, i.e. the amount of time the �nger re-
mained pointing at the target. Their results showed that the alignment varied
according to the di�erent stress patterns: in paroxytone words, the maximum
opening of the jaw aligned with the beginning of the pointing plateau, while in
the case of oxytone words, it aligned with the end.
Conversely, De Ruiter (1998) obtained contradictory results for the in�uence
of di�erent stress patterns in the temporal coordination of gesture and speech.
In a �rst experiment analysing the alignment of deictic gestures with di�erent
stress patterns in disyllabic and trisyllabic words, he observed that the temporal
alignment of the apexes was not a�ected by stress position. However, in a second
experiment, De Ruiter found that the stress pattern did a�ect the temporal co-
ordination of gesture and speech in a context of contrastive focus in adjective-
noun phrases. He actually observed that the duration between the beginning
of the preparation and the apex was longer in the case of oxytone words that
were accented in phrase-�nal position. Additionally, this was the only context
in which the apex preceded the stresses syllable without overlap (Figure 12).
A similar study in a context of contrastive pitch accents and di�erent syl-
lable position was conducted some time later by Rusiewicz (2010) in her doc-
toral thesis. She analysed the alignment of the apex of deictic gestures with the
utterance of disyllabic compound words (e.g. words sharing the �rst syllable:
bathrobe, bathtub; and sharing second syllable: suitcase, briefcase) whose stress
patterns weremanipulated in production by participants with a contrasting pitch
accent. Di�erently from De Ruiter (1998), Rusiewicz observed that the timing of
the gesture was not in�uenced by the actual stress pattern because the apex of
gestures was time-aligned with the onset of the target word rather than with the
prosodically prominent syllables.
36 As De Ruiter explains: “The reason that the stressed syllable in adjectives with �nal stress
121

Literature review: prominence and language
Figure 12: Results of De Ruiter’s (1998, experiment 2). Apex becomes longer towards stress location
4, where there is not overlapping. Abbreviations: Stressloc (stress location; 1 and 2 correspond to
contrastive focus in adjectives, and 2 and 3, in nouns), BP (beginning of preparation), BU (beginning
of utterance). The black bar corresponds to the temporal location of the stressed syllable36. Adapted
from De Ruiter, 1998, p. 64.
2.3.7.3 On the applicability of the Phonological Synchrony Rule (PSR)
Some of the obtained results in di�erent studies called into question the strict
application ofMcNeill’s (1992) ‘phonological synchrony rule’ (PSR). For example,
around the time McNeills formulated the rule, McClave (1991; 1994) conducted
a series of experiments and did not �nd any evidence of temporal coordination;
actually she observed that beat gestures occurred with stressed syllables as fre-
quently as with unstressed syllables.
Consequently, Karpiński et al. (2009) set out to explore the applicability of
McNeill’s rule in an analysis of the temporal coordination of gesture phrases and
are not at the end of the word is that in Dutch, adjectives are in�ected when they are preceded
by de�nite articles. For example, the root form /vi-o-lEt/ then becomes /vi-o-lE-t@/” (De Ruiter,
1998, p. 64).
122

Literature review: prominence and language
intonational phrases in Polish task-oriented dialogues. The temporal coordina-
tion between the stroke of gestures and what they labelled as ‘strong prosodic
prominence’37 was observed in only 5% of cases for a short di�erence of 100 ms38
between the beginning of the stroke and the beginning of the prominent syllable,
and in 40% of cases for a 200-milisecond di�erence. They reported several reasons
for the failed occurrence of the phonological synchrony rule, e.g. stroke repeti-
tions, inertial echoes, ambiguous hand excursions. For gestural phrases and in-
tonational phrases, Karpiński and his colleagues found these did not synchronise
very precisely, although more coordination was observed between them, espe-
cially because gestures partly overlapped with co-occurring major intonational
phrases.
2.3.7.4 Rede�ning alignment landmarks
Such inconsistent results called for a closer examination of the landmarks that
could serve as targets of coordination between gesture and speech. Four studies
o�ered stronger evidence of the exact nature of this temporal coordination.
Firstly, as mentioned above, Leonard and Cummins (2010), in a production-
perception study, analysed the variability of several kinematic landmarks of beat
gestures together with three potential anchor points in the co-occurring speech.
Their choice of beats (also known as ‘batons’) was motivated by the fact that beat
gestures integrate more precisely into the continuous stream of speech due both
to their lack of meaningful content compared to iconic and metaphoric gestures
37 In the absence of a more precise de�nition of their categories ‘strong’ and ‘weak’ prosodic
prominence, it is possible that ‘strong prosodic prominence’ might refer to the accented stressed
syllables of the intonational phrases they analysed.38 For the sake of comparison, and as Rusiewicz conveniently puts it: “100ms is the benchmark
for software developers so that processingwill seem instantaneous and is also the human reaction
time for advanced athletes” (Rusiewicz, 2010, p. 203).
123

Literature review: prominence and language
and to its distinct kinematic strength and time of occurrence. Authors selected
�ve kinematic landmarks for each gesture, i.e. the onset of the gesture, the peak
velocity of the extension phase, the point of maximum extension of the hand be-
fore recovery, the peak velocity of the recovery phase, and the end of the gesture.
Each of these was compared to three landmarks of speech, i.e. the vowel onset
of the stressed syllables, the estimated P(erceptual)-centre (also known as ‘stress
beat’)39, and the maximum pitch of the stressed syllable. Leonard and Cummins,
by analysing the variability of each landmark, observed that not all gesture land-
marks related equally to the measured speech landmarks. For example, the apex
of beat gestures showed the least variability in its relative timing regardless of
the examined anchor points of speech. Besides, the pitch maximum of accented
stressed syllables was found to be the closest speech landmark to the apex of beat
gestures, in line with Loehr’s (2004) previous observations.
Secondly, a study by Esteve-Gibert and Prieto (2013) reviewed previous re-
search on the topic and pointed out that the di�erences found in the literature
stem from a heterogeneity of temporal measures. In their turn, they conducted
an analysis of temporal coordination of deictic gestures and speech in Catalan,
similar to previous studies involving contrastive focus in three di�erent stress
patterns, i.e. oxytone, paroxytone, and monosyllabic words (e.g. De Ruiter, 1998,
experiment 2; Rusiewicz, 2010). Then, di�erently from Rusiewicz, for example,
who took the vowel midpoint as speech landmark in her comparison with the
di�erent gesture landmarks, Esteve-Gibert and Prieto chose the f 0 peak of the
accented stressed syllable, i.e. the intonation peak. Additionally, they measured
the onset and the duration of the preparation, stroke, and retraction phases of
39 “P-centres are obtained by estimating the energy over the frequency range of the �rst two
formants to identify the sonority rise at the onset of the nuclear vowel. A [stress] beat [i.e. a
P-centre] is de�ned as occurring halfway through this rise” (Cummins & Port, 1998).
124

Literature review: prominence and language
gestures together with the point in time when the apex occurred. In their results
they observed that, on the one hand, the position of the apex and that of the
intonation peak were the two measurements with the strongest correlation, i.e.
gesture apexes were anchored in intonation peaks. On the other hand, Esteve-
Gibert and Prieto also reported that the timing of gesture apexes and intonation
peaks was similar and was determined by the prosodic structure of the utter-
ance, in line with previous results obtained by Shattuck-Hufnagel et al., 2007;
Yasinnik et al., 2004. In their case, they found that both apexes and intonation
peaks anticipated respect to the end of the accented syllable in phrase-�nal po-
sition (monosyllables and oxytone words), while both were retracted when the
accented syllable was in non-phrase-�nal position (paroxytone words) (Figure
13).
Thirdly, Krivokapić et al. (2015; 2016) conducted a series of studies to also
analyse the temporal alignment of gesture and speech including di�erent pros-
odic structures, i.e. contrastive focus, narrow focus, broad focus, and also a deac-
cented context (a detailed account of all experiments and results is in Krivokapić
et al., 2017). Krivokapić and her colleagues contributed to the debate on gesture-
speech alignment with the recording of the simultaneous kinematics of both arm
movement during the production of a deictic gesture and vocal articulatory ges-
tures by means of motion tracking and electromagnetic articulography (EMA),
respectively. Target words di�ering in their stress patterns (oxytone vs. paroxy-
tone) were elicited in the four prosodic structures mentioned. Similar to other ex-
perimental tasks (e.g. Esteve-Gibert & Prieto, 2013; Rochet-Capellan et al., 2008),
participants (N = 2 for the data collection used in all three experiments; see
Krivokapić et al., 2017 for details) had to read sentences on a screen and point
with their index �nger at the pictures displayed as they read the associated target
words.
125

Literature review: prominence and language
Figure 13: Results of Esteve-Gibert and Prieto (2013, pp. 857-858) showing the time di�erence (in
milliseconds) of both the intonation peak (upper panel) and the gesture apex (lower panel) respect to
the end of the accented syllable for each of the analysed stress patterns (monosyllabic, paroxytone,
and oxytone words). Error bars indicate 95% con�dence intervals.
In their �rst experiment, the authors investigated the e�ects of phrase-level
stress; in their second experiment, they analysed the e�ects of phrase-initial
prosodic boundaries; and in their third experiment, they focused on the e�ects of
phrase-�nal prosodic boundaries. Overall, their main �nding, similar to that of
Esteve-Gibert and Prieto (2013), was that the realisation of both manual and vo-
cal gestures was in�uenced by prosodic structure. In their case, Krivokapić and
her colleagues reported lengthening in both modalities at prosodic boundaries,
with a local e�ect that increased with boundary strength.
126

Literature review: prominence and language
Finally, and di�erently from the previous studies just mentioned, an exper-
iment conducted by Parrell et al. (2014) reinforced the idea of the temporal co-
ordination of gesture and speech. In a motor task that involved �nger tapping
synchronously with speech, speakers were unable to desynchronize tapping and
emphatic stress. They observed that emphasis in either speech or manual behav-
ior automatically resulted in lengthening the production in the other domain.
2.3.8 Audiovisual prosody
There has also been a large number of studies on the interaction between
gesture and speech that have corroborated the strong connection between the
production of movements and the production of speech. For example, eyebrow
movements have been found to correlate with f 0 (Cavé et al., 1996), although res-
ults for manual beat gestures were more ambiguous (McClave, 1998), which was
related to the fact that manual gestures and articulatory gestures are controlled
by the same brain areas (e.g. Bernardis & Gentilucci, 2006).
As for speech perception, one line of research has focused on the perceptual
e�ects of the visual component of speech. For example, the so-called McGurk
e�ect (McGurk & MacDonald, 1976) initially established that visual information,
more precisely, lip movements, a�ect speech perception. Later, not only lips, but
also the rest of the face (e.g Pelachaud et al., 1996) was reported to a�ect speech
perception. As a consequence, it was observed that both facial expressions and
body movements play an important role in conveying functions traditionally as-
sociated to prosody, such as phrasing and emphasis. In parallel, an interest in
the visual aspects of speech was developed by researchers working on audiovi-
sual speech synthesis. On the other hand, the use of talking heads resulted in
the development of adequate animations not only of lip movement, but also of
facial movements to help identify, for example, the most prominent words of the
127

Literature review: prominence and language
utterance and its information structure (e.g. Beskow, 1995).
These two lines of research have converged in the study of how the informa-
tion conveyed in the visual modality interacts with prosody. Partly due to the
advances in technical equipment and computer power, this kind of research has
become easier and has also gained more attention. Swerts and Krahmer (2005),
for example, explored the verbal and visual cues that reveal the listeners’ know-
ledge of precise information after being asked a question. In their paper, they
de�ned the term audiovisual prosody in the following terms:
“So far, research has focussed primarily on analyses of verbal fea-
tures, such as particular intonation patterns, that are encoded in the
speech signal itself. Visual cues, such as a wide range of gaze pat-
terns, gestures, and facial expressions, are a natural and important
ingredient of communication as well. It seems a reasonable hypo-
thesis that these might be informative just as verbal features are,
though this issue is largely unexplored [...]. [For t]he basis of com-
binations of verbal and visual features, [...] we will use the term
audiovisual prosody” (Swerts & Krahmer, 2005, pp. 81-82).
Audiovisual information has been shown to play a crucial role in awide range
of communicative functions. Generally, the interplay between visual cues and
verbal cues has been found to in�uence both speech intelligibility and compre-
hension. It is also involved in signalling higher-level pragmatic aspects such as
emotion, attitude, and engagement (e.g. Cafaro et al., 2012; de Gelder & Vroomen,
2000; Ekman, 1999). Besides, it has been observed that visual cues can also ex-
press communicative elements such as uncertainty and frustration (e.g Barkhuysen
et al., 2005; Swerts & Krahmer, 2005). Such pragmatic aspects are also expressed
prosodically in dimensions that include valency and arousal rather than in dis-
crete categories such as anger, fear or joy (Schröder et al., 2001).
128

Literature review: prominence and language
Bothmodes of expression share the potential for nuancing these non-discrete
elements of communication. For example, the pitch accent on an utterance can be
produced with more or less excursion along an intonation phrase, thus express-
ing the novelty or importance of the corresponding item to various degrees.
One of the main functions associated to communicative visual cues is that
of enhancing traditional prosodic functions, e.g. phrasing, face-to-face ground-
ing, question intonation, and prominence signalling (e.g. Barkhuysen et al., 2008;
Hadar et al., 1983; Krahmer & Swerts, 2007; Nakano et al., 2003; Srinivasan &
Massaro, 2003). In this sense, not only manual gestures, but also head move-
ments and eyebrowmovements contribute to the prominence lending properties
of prosody in order to highlight certain parts of the utterance (e.g Granström
et al., 1999). For example, eyebrow raises, head nods, and beat gestures increase
the perceived prominence of the words they co-occur with, and reduce that of
the surrounding words, although this is not restricted to hand or head gestures
but any body part can assume this highlighting function (Bull & Connelly, 1985).
2.3.8.1 Multimodal prominence signalling
Mostmethods applied to study the interaction of audiovisual and verbal prom-
inence have so far made use of both lip-synchronised animated agents and exper-
imental settings in which gestures are elicited with controlled speech stimuli. In
the former case, one of the main advantages of animated agents is the possibility
of manipulating visual cues while preserving acoustic information. Conversely,
research in prominence by means of elicited gestures in experimental settings
also presents some di�culties. Only a minor number of studies have applied
spontaneous speech to the study of perception of multimodal prominence. In
any case, all these approaches have restricted themselves to analyses of head
movements and facial expression, especially eyebrow movements, while just in
129

Literature review: prominence and language
some cases the role of hand gestures have been analysed.
2.3.8.2 Studies using an animated agent
Head nod vs. eyebrow raise
Granström and his colleagues (1999), for example, conducted a perception
experiment in Swedish, in which an eyebrow raise performed by an animated
agent was created and presented with di�erent content words of a given sen-
tence. The eyebrow raising was subtle, so that its perception was distinctive but
not too obvious (Figure 14). In total, it lasted 500 ms and included a dynamic
raising part (100 ms), a static raised period (200 ms), and a dynamic lowering
part (200 ms).
Figure 14: Animated agent with neutral expression (left) and showing an eyebrow raise (right).
Adapted from Granström et al., 1999.
In their results, Granström et al. reported that those words co-occurring with
an eyebrow raise were generally perceived as more prominent, even if no strong
acoustic cues of prominence existed. Besides, di�erences were found for a sub-
group of non-native Swedish speakers, who tended to give more prominence
marks for those words with a concomitant eyebrow raise.
The same team of researchers carried out a second experiment, which this
time also included head nods (House et al., 2001). The objective of the study was
to test the strength of head nods vs. eyebrow raises as visual cues of prominence
130

Literature review: prominence and language
as well as the perceptual sensitivity in their time-alignment with the syllable
they co-occurred with. This time, eyebrow movements were shorter than in the
previous experiment, and they lasted a total of 300 ms, divided in three time
spans of 100 ms (Figure 15).
Figure 15: 3D animated agent used in House et al.’s experiment. Adapted from House et al., 2001.
As the researchers observed, the combination of head nods and eyebrow
raiseswas a powerful cue of prominencewhen they co-occurredwith the stressed
vowel of a potentially prominent word, although head nods were perceptually
more relevant than eyebrow raises. Additionally, Granström and his colleagues
reported that the integration window of both visual cues with the co-occurring
syllable lay around 100 ms, much in line with previous studies on the gesture-
speech synchrony (e.g. Karpiński et al., 2009)40.
Eyebrow raise as a cue of contrastive focus
In their turn, Krahmer and his colleagues (2002a; 2002b) tested further the
role of eyebrow movements in their interaction with pitch accents when cueing
contrastive focus. In the creation of their stimuli, they established the duration
of eyebrow movements as House et al. (2001) did, in a three-fold sequence of 100
ms per movement phase (Figure 16).
40 See note 38.
131

Literature review: prominence and language
Figure 16: Krahmer et al.’s talking head while uttering a stimulus sentence. It shows an eyebrow
raise (left) and a neutral expression (right). Adapted from Krahmer et al., 2002a.
In addition, they used a disyllabic adjective-noun phrase, in which either one
of the two words or both words had a pitch accent. Eyebrow raises co-occurred
with the �rst or the second word, so that both the pitch accent and the eyebrow
raise sometimes coincided on the sameword, sometimes they were placed on dif-
ferent words; sometimes both words carried a pitch accent but only one eyebrow
raise on either the �rst or the second word.
In their �rst analysis (Krahmer et al., 2002a), participants were asked to report
what the preceding (contrasting) utterance might have been, given the informa-
tion structure of the presented stimuli, e.g. to the stimulus blaue vierkant (‘blue
square’), the possible contrasting sentences were ‘red square’ (focus on the �rst
word), ‘blue triangle’ (focus on the second word), and ‘red triangle’ (focus on
both words). The researchers reported that both auditory and visual cues had
an important in�uence on focus, although this e�ect was di�erent in magnitude:
pitch accents had a larger e�ect than that of eyebrow raises. Subsequently, in a
second analysis (Krahmer et al., 2002b), participants were asked to choose their
preferred animation from a pair of similar stimuli as those described above. In
this case, the results showed that listeners preferred the occurrence of the eye-
brow raise coinciding with a pitch accent, although there was a slight preference
for both acoustic and visual cues co-occurring on the �rst word when both words
were accented. In addition, Krahmer et al. (2002b) also observed that visual cues
132

Literature review: prominence and language
had an additive e�ect in the perception of prominence when they coincide with
auditory cues, although a clashing e�ect happened when visual cues appeared
immediately before or after an accented word.
Interestingly, the same researchers, using a similar procedure to the one just
mentioned, conducted a third experiment and found cross-linguistic di�erences
betweenDutch and Italian (Krahmer & Swerts, 2004). In the case of Dutch, speak-
ers tended to prefer audiovisual stimuli when the eyebrow raise co-occurredwith
the word carrying a pitch accent rather than with the unaccented word (as they
had already observed, Krahmer et al., 2002a,b). Conversely, Italians consistently
preferred the eyebrow movement co-occurring on the �rst word, regardless of
which of the two words in the phrase was accented. By the same token, it was
observed that Dutch listeners were able to detect the focus of the utterance, but
Italians were not, as previously observed for auditory cues alone (Swerts et al.,
2002) (see § 2.2.5 for a brief description), and similar results were later obtained
with Dutch and Spanish speakers (van Maastricht et al., 2016). Finally, the role
of eyebrow raises in enhancing acoustic prominence was clearer in Dutch than
in Italian. All these di�erences were explained by prosodic di�erences between
both languages. Thus, Krahmer and Swerts concluded that the location of eye-
brow raises was found to be language-dependent and their functional contribu-
tion can vary according to each speci�c language.
Word recognition mediated by realistic 3D facial expressions
A subsequent study on the perception of audiovisual prosody, also using an
animated agent, was conducted by Munhall et al. (2004). The researchers pre-
pared a realistic 3D talking-head animation and analysed how head movements
interacted with speech in word recognition. More precisely, although they did
not test the prominence e�ects of head movements, Munhall and his colleagues
133

Literature review: prominence and language
analysed whether head movements could improve the intelligibility of Japanese
sentences in a speech-in-noise task.
Di�erently from the studies just mentioned (Granström et al., 1999; House
et al., 2001; Krahmer et al., 2002a,b), the realistic animated agent was modelled
this time from the face and head motions of a Japanese speaker, which had been
obtained in a previous study. Using this realistic talking head, which was de-
picted wearing sunglasses due to the di�culty of modelling eye movement (Fig-
ure 17), four conditions were created: (i) normal head motion, (ii) a head mo-
tion with twice the amplitude in all directions of normal head motion, (iii) no
head motion, and (iv) a blackened screen with audio-only as available promi-
nence cues. Munhall and his colleagues reported that identi�cation of individual
words in a set of statement sentences was improved in all the �rst three con-
ditions compared to the audio-only condition. In their analysis, they remarked
that both f 0 and intensity were highly correlated with the kinematics of the head
in their animation, which had been preserved from the original recording used
to create the 3D avatar.
Figure 17: Realistic 3D animated agent while pronouncing di�erent speech sounds corresponding to
a di�erent position and orientation. Adapted from Munhall et al., 2004.
Both eyebrow movements and head movements and their interaction with
speech prosody were also studied by Al Moubayed and his team in two di�erent
experiments (Al Moubayed & Beskow, 2009; Al Moubayed et al., 2010). In their
case, they used animations of a talking head that had been previously developed
134

Literature review: prominence and language
by his colleagues (House et al., 2001) (Figure 18).
In their �rst experiment, Al Moubayed and Beskow selected 40 sentences
from a corpus—of which they do not provide further details—ranging between
6 and 10 words. These auditory stimuli were manipulated with a noise-excited
vocoder and then lip-synchronised with an accompanying animated agent. The
sentences had been previously annotated by an expert listener on a 4-point scale.
Participants were administered 30 sentences in 5 blocks of 6 sentences (after a
�rst 10-sentence trial), with each block possessing di�erent visual cues of promi-
nence: (i) no gesture, i.e. only visible lips and jawmovements, (ii) a 350-millisecond-
long head nod located on the most prominent syllable of the sentence, (iii) an
equally-long eyebrow raise also located on the most prominent syllable of the
sentence, (iv) an eyebrow raise placed on steep pitch movements, (v) and eye-
brow raise placed randomly on syllables in order to test whether these random
gestures improved or hindered the perception of prominence41. In their results,
they observed that participants better identi�ed those words in vocoded sen-
tences that were accompanied by a head nod or an eyebrow raise (Figure 19).
41 Al Moubayed and his team later published a book chapter (2011), where they included a
sixth condition in the description of their experiment: (vi) ‘automatically detected prominence
with eyebrows’, in which an eyebrow raise was coupled with prominent syllables that were
automatically detected using an automatic prominence detection model explained in their book
chapter.
135

Literature review: prominence and language
Figure 18: Three di�erent views of the animated agent used in Al Moubayed and Beskow’s exper-
iment. The animated character shows no gesture (left), a head nod (centre), and an eyebrow raise
(right). Adapted from Al Moubayed & Beskow, 2009.
Figure 19: Results of Al Moubayed and Beskow (2009, p. 45) showing normalised percentage score of
correct word recognition for the �ve tested conditions: (N)o gesture; (R)andom eyebrow raise; eyebrow
raise on steep (P)itch movement; (E)ye(B)row raise on prominent syllable; (H)ead nod on prominent
syllable.
Focus detection using auditory and visual cues
Finally, two more perception experiments analysing the detection of focus by
means of both auditory and visual cues were conducted by Prieto and her col-
leagues (2011)42. The perception of narrow focus and contrastive focus were
explored using a mismatch paradigm between visual cues and auditory cues.
Firstly, the intonation peak of the stressed syllable was manipulated so that it
42 A more detailed version of both experiments was published later as a journal paper (Prieto
et al., 2015).
136

Literature review: prominence and language
ranged, in four successive 1.5-semitone steps, from a narrow focus statement
to a contrastive focus statement. Secondly, the visual cues conveyed by an an-
imated agent were changed from a neutral state to a more expressive one by
progressively increasing the movement of an eyebrow raise in combination with
a head nod. In a forced-choice task, participants were asked to identify narrow
focus (as a ‘statement’ sentence) and contrastive focus (as a ‘correction’ sen-
tence). In their results, Prieto et al. found that the combination of clear visual
cues, i.e. those with the largest movement excursion or with the highest into-
nation peaks, allowed participants to best detect contrastive focus. Interestingly,
visual cues proved stronger cues than auditory ones. Besides, the analysis of re-
action times showed that none of the presented combinations of visual cues and
auditory cues were perceived by participants as incongruent.
In their second experiment, Prieto and her colleagues studied the independ-
ent contribution of both eyebrow raise and head nods to the perception of con-
trastive focus. For this, they created visual-only stimuli with the combination of
both types of gesture involving four degrees of activation, from less pronounced
movement to more pronounced movement (Figure 20). The same participants
tended to detect contrastive focus more easily this time using the cues conveyed
by the movement of the head rather than that of the eyebrows.
137

Literature review: prominence and language
Figure 20: Sixteen stills showing combinations of an eyebrow raise and a head nod varying in their
degree of intensity. The four head con�gurations are displayed in the X axis and the four eyebrow
con�gurations are in the Y axis. Adapted from Prieto et al., 2015, p. 51.
2.3.8.3 Studies in experimental settings
The study of audiovisual prosody in experimental settings involves the elici-
tation of gestures either by means of dialog-oriented tasks or by overtly request-
ing participants—sometimes even professional actors—to produce gestures while
uttering a series of given sentences.
138

Literature review: prominence and language
‘Producing beats, hearing beats, seeing beats’
Swerts and Krahmer, for example, conducted a series of studies in an ex-
perimental setting to explore di�erent e�ects of audiovisual prosody in speech
production and perception (Krahmer & Swerts, 2007; Swerts & Krahmer, 2004,
2008, 2010). Di�erently, from their previous research using an animated agent,
Swerts and Krahmer (2004) initially recorded participants uttering a sequence of
three nonsense syllables (Figure 21).
Figure 21: Stills showing two of the recorded speakers uttering a three-syllable word. On the left,
both speakers appear pronouncing an unaccented syllable; on the right, an accented one. Adapted
from Swerts & Krahmer, 2004, p. 70.
Using these stimuli, they conducted two experiments on stress perception. In
the �rst case, the stimuli were administered to listeners in three di�erent condi-
tions, auditory, visual, and audiovisual. In the second experiment, the research-
ers created a mismatch between both modalities in the audiovisual recordings,
so that auditory cues and visual cues never occurred on the same syllables. In
139

Literature review: prominence and language
their results, they observed that listeners had no problem to detect the stressed
syllable in the �rst experiment, and that auditory cues were stronger cues of
prominence when compared to visual cues in the second experiment.
In a subsequent, larger study, Krahmer and Swerts (2007) centered on beat
gestures in order to analyse: the realisation, the auditory perception, and the
audiovisual perception of beat gestures. In the �rst experiment of their study,
‘producing beats’, they asked participants to utter a four-word sentence with
one visual beat performed with hands, head, or eyebrows, so that the beat ges-
ture coincided with a pitch accent on either of the two target words (underlined)
or on none of them: Amanda gaat naar Malta (‘Amanda goes to Malta’). For this,
participants were allowed to train until they felt they could not improve the real-
isation of the gesture accompanying the uttered sentence. In some cases, they
were also asked to produce a mismatch between the gesture and the pitch accent,
so that each fell on a di�erent target word.
Firstly, Krahmer and Swerts con�rmed that the realisation of a pitch accent
resulted in signi�cant higher f 0 and intensity, and longer segment duration. Ad-
ditionally, they observed that prominent vowels accompanied by a beat gesture
were produced with more prominent acoustic features than those without a ges-
ture, regardless of the position of the pitch accent. Additionally, words accom-
panied by a gesture had longer segmental duration and lower second formant
(F2), suggesting that pitch accents and visual beat have similar emphasizing func-
tions43.
In order to analyse whether these results were perceptually relevant, the re-
searchers conducted two more experiments. In the �rst one, ‘hearing beats’, the
audiovisual recordings obtained in the previous experiment were administered
43 Alteration of F2 has been explained as a transfer of the social intention from the gesturing
e�ort to a more marked tongue protrusion (Barbieri et al., 2009; Bernardis & Gentilucci, 2006).
140

Literature review: prominence and language
to three trained listeners only in the auditory modality for prominence marking.
Marking for prominence was conducted on a 3-point scale: 0 for no prominence,
1 for a minor pitch accent, and 2 for a clearly perceived pitch accent. Total per-
ceived prominence was thus computed adding the given prominence score per
word, so that a maximum score of 6 points was possible (corresponding to a clear
pitch accent marked by all three trained listeners). The statistical analysis was
conducted on the ‘perceived prominence di�erence score’, which resulted from
subtracting the prominence score of the �rst target word to that of the second
one. Additionally, agreement—computed as Pearson’s correlation of the three
listeners—ranged between 0.58 to 0.65 for the �rst word and 0.66 to 0.70 for the
second word. In their results, Krahmer and Swerts observed that the production
of a visual beat on a certain word had a clear impact on the prominence perceived
in the auditory modality, so that the relative spoken prominence of that target
word increased, while it decreased in the other one.
Finally, a third experiment, ‘seeing beats’, was conducted to assess the per-
ceptual e�ect of visual beat gestures—in this third experiment, head nods were
excluded from the experiment and only those gestures performedwith hands and
eyebrowswere included. Three of the audiovisual recordings obtained in the �rst
experiment were administered to participants in both audio-only and audiovisual
modality. The experimental task consisted in marking prominence, �rst on one,
then on the other target word, using a 10-point scale (1 for ‘no prominence’ and
10 for ‘strong prominence’). Similar to the experiment just mentioned, research-
ers computed a ‘visual di�erence score’ for perceived prominence by subtracting
the prominence score obtained in the audio-only modality from the score in the
audiovisual modality: a positive result would suggest that the visual cues were
responsible for an increase in perceived prominence.
Krahmer and Swerts concluded in this third experiment that seeing visual
141

Literature review: prominence and language
beats actually had an e�ect on the perception of prominence. Besides, when
participants saw a beat gesture on one word, the perceived prominence of the
otherword automatically decreased, and this e�ectwas stronger in the case of the
�rst word. As for gestures, manual beat gestures were observed to play a more
important role than rapid eyebrow movements, and the perceived prominence
also depended on the way each of the three speakers gestured (Figure 22).
Figure 22: Average prominence scores obtained by Krahmer and Swerts (2007, experiment 3) for
both target words after subtracting the score of the audio-only modality from that of the audiovisual
modality. A positive score re�ects an increase in prominence perception due to the occurrence of
visual cues. Left chart shows hand beats; right chart shows eyebrow beats. Adapted from Krahmer
& Swerts, 2007, p. 409.
A follow-up study conducted by the same researchers registered participants’
reaction times to analyse both the e�ects of modality and face area in the audiovi-
sual perception of prominence (Swerts & Krahmer, 2008). Six native speakers of
Dutch (two of them the researchers themselves) were recorded uttering variants
of a sentence containing three target words (underlined)Maarten gaat maandag
142

Literature review: prominence and language
naar Mali (‘Maarten goes Monday to Mali’), which corresponded to the di�erent
narrow focus versions: ‘Who will go on Monday to Mali?’; ‘When will Maarten
go to Mali?’; ‘Where will Maarten go on Monday?’; plus one prosodic neutral
version corresponding to broad focus.
The stimuli were then manipulated to create audiovisual mismatches. Par-
ticipants’ reaction times were recorded for an experimental task consisting in
recognising the most prominent target word in the sentence. In their results, the
researchers observed that congruent auditory and visual cues of prominence, i.e.
those occurring on the same words, were identi�ed more rapidly than incongru-
ent cues. Additionally, a second experiment inwhich the audiovisual information
was partially blackened, revealed that the upper face had a stronger prominence
cueing e�ect than the bottom part of the face, and so was the left part respect to
the right part (Figure 23).
No mismatch, but degraded speech
Dohen and Lœvenbruck (2009), using a careful controlled experimental set-
ting, tested the role of visual cues in the audiovisual perception of contrastive
focus44.
In their rationale, they explained that the auditory perception of contrastive
focus in French usually shows a ceiling e�ect, i.e. close to 100% of successful iden-
ti�cation. For this reason either audiovisual mismatches or acoustically degraded
stimuli were necessary to assess the potential enhancement of prominence per-
ception associated to the visual modality. Since audiovisual mismatches had been
previously used by Swerts and Krahmer (2004; 2008), Dohen and Lœvenbruck
used whispered speech stimuli. In this experimental paradigm, there is no inton-
44 Their study extended the results of a previous experiment (Dohen & Lœvenbruck, 2005)
with a slightly di�erent methodology
143

Literature review: prominence and language
Figure 23: Di�erent versions of the stimuli presented in Swerts and Krahmer’s study (2008, exper-
iment 2) to analyse the e�ect of prominence cued by several face areas. Adapted from Swerts &
Krahmer, 2008, p. 229.
ational (f 0) information because there is no vibration of the vocal cords, although
duration and intensity remain intact. In this way, it is more di�cult to perceive
prosodic focus auditorily.
Two French native speakers were recorded in a correction task, in which
narrow focus sentences were elicited in whispered speech using four question-
answer pairs. The resulting sentences were used as stimuli, which were admin-
istered to 13 listeners in all three conditions, i.e. audiovisual, audio-only, and
visual-only; and two di�erent angles, i.e. front and pro�le views of the speaker.
144

Literature review: prominence and language
Listeners were instructed to identify the focused word.
In the results of this �rst experiment, Dohen and Lœvenbruck reported that
detection of focus was signi�cantly better in the audiovisual condition than in
both audio-only and visual-only conditions, with no di�erences between the lat-
ter two. In their second experiment, similar stimuli were elicited as those in ex-
periment one, with the exception that the narrow focus sentences were uttered
in both normal speech and whispered speech and the speaker was recorded only
from a frontal angle. Their stimuli, consisting this time in two sentences uttered
in two speech modes in three focus conditions, were administered to 31 listeners
in the same way as in their �rst experiment.
Dohen and Lœvenbruck observed that focus was more easily perceived in
the normal speech condition as well as in the audiovisual modality, as it was in
their �rst experiment. In addition, no di�erences were found in normal speech
between modalities (audio-only vs. audiovisual), while in whispered speech cor-
rect answers were signi�cantly higher in the audiovisual modality. By the same
token, perception of focus was more di�cult in whispered speech than in normal
speech in the audio-only modality, but it was easier in the visual-only modality.
Analysis of reaction times also showed that listeners processed speech faster in
the audiovisual modality in whispered speech when compared to when they just
heard speech (audio-only) or saw the speaker (visual-only). Such a di�erence
in reaction times disappeared, however, in normal speech when the audiovisual
modality was compared to the audio-only modality—although it persisted when
the audiovisual modality was compared to the visual-only modality.
Do visual cues help detect f0 changes or intensity changes?
Another study on the perception of audiovisual prosody conducted with con-
trolled speech stimuli in an experimental setting was conducted by Foxton et al.
145

Literature review: prominence and language
(2010). In their case, the researchers investigated the role of visual information
on the detection of threshold-level di�erences in f 0 and intensity. For the cre-
ation of the experimental stimuli, a female French actress was instructed to utter
the two-word phrase si chic (‘so smart’) three times: emphasizing the �rst word,
the second word, or none of them, paying attention to pronouncing each of them
with the same duration. As for the visual cues, the joint movement of eyebrows
and head were �lmed as naturally co-occurring on the emphasised word.
The researchers �rst homogeneised the acoustic parameters of f 0 and inten-
sity in the ‘no-emphasis’ condition, and they also matched the duration of the
vocalic segments. Subsequently, stimuli with f 0 and intensity di�erences were
created, ranging stepwise from 0.1 to 24 semitones and from 0.2 to 25 dB, re-
spectively. In a set of congruent stimuli, f 0 and intensity had the same values as
in the original recording, while in a di�erent set of incongruent stimuli they did
not match (Figure 24).
The recordings were presented to participants in a forced-choice task both
in the audiovisual modality and in the audio-only modality. Participants had to
identify which of the stimuli contained an emphasised word (either by increased
f 0 or increased intensity), although the audiovisual information was congruent
only in half of the stimuli, a factor that was not present in the audio-only condi-
tion.
Foxton and her colleagues observed that participants were able to detect both
f 0 changes and intensity changes in both modalities, although they reported
that congruent visual cues of prominence helped participants to better detect
the thresholds of auditory cues than when they could only hear the stimuli, and
this especially so for intensity thresholds. This is in line with previous results
suggesting that amplitude changes are more a�ected by visual prosodic informa-
tion than pitch changes (Scarborough et al., 2009), since intensity is thought to
146

Literature review: prominence and language
be more perceptible in articulatory gestures than f 0 changes.
Figure 24: Example of two audiovisual stimuli belonging to the congruent and the incongruent set
of stimuli, respectively, used for the task of prominence perception cued by intensity. The capitalised
word on top of each video image corresponds to the realisation of the visual cues of prominence that
participants saw in the video, while the oscillogram extract below the video image shows the acoustic
cues that partcipants heard. Adapted from Foxton et al., 2010, p. 74.
147

Literature review: prominence and language
2.3.8.4 Studies using spontaneous speech
Prominence perception using spontaneous speech stimuli
Swerts and Krahmer (Swerts & Krahmer, 2010) envisaged to analyse the ef-
fects of facial expressions on speech production using spontaneous stimuli ob-
tained from TV newsreaders, after their previous studies on audiovisual prom-
inence (see § 2.3.8.2 and § 2.3.8.3 for details). They had previously noticed the
need to “supplement the current �ndings [Krahmer & Swerts, 2007] with data
about gestures (both manual and facial) in spontaneous speech, although it is
di�cult to see how incongruent utterances could be triggered naturally” (2007,
p. 411). Their call for spontaneous speech makes evident that, in most studies,
stimuli often contain only one gesture, which is very far from the natural inter-
weaving of gestures performed with hands, head, and eyebrows typically found
in everyday spoken language.
For their analyses, the researchers selected 60 fragments from the recordings
of two male and two female Dutch TV newsreaders in which utterances ranged
between 4s and 12s. The stimuli were then presented to a group of 35 participants
in the auditory modality for binary prominence marking (prominent vs. non-
prominent). The responses were later used to create a prominence scale, based
on the idea that prominence can be related to the proportion of subjects that
agrees on a word being prominent, as done in previous studies (Mo et al., 2008;
Streefkerk, 2002; Swerts, 1997). Thus, if a word did not received any mark of
prominence, it was categorised as having no accent, while if it received at least
half of the possible marks, it was considered as having a strong accent. Word
falling in between these two extremes were classi�ed as having a weak accent.
Subsequently, two independent researchers visually annotated the stimuli for
eyebrow and head movements.
148
Literature review: prominence and language
Swerts and Krahmer’s analysis of the distribution of gestures and pitch ac-
cents showed that the joint movements of eyebrows and head were used together
with auditory cues to mark certain words as prominent. More precisely, words
categorised as ‘strong accent’ mostly occurred with an accompanying eyebrow
movement; however, the mere presence of an eyebrow movement did not imply
the presence of a strong accent: only 47 out of 303 eyebrow movements cor-
responded to a strong accent. The distribution of head movements followed a
similar pattern, so that 60 out of 228 head nods were associated to a strong ac-
cent. Interestingly, strong accents were especially marked by combinations of
eyebrow and head movements (in 67.2% of the cases); conversely, single eye-
brow or head movements hardly coincided with strong accents, while the joint
movement of eyebrow and head occurred on 19 out of 138 words having a strong
accent.
Distribution of gestures in spontaneous speech samples
Similarly, Ambrazaitis and House (2017) also used spontaneous speech from
several TV newsreaders to explore the audiovisual realisation of multimodal
prominence. Di�erently from Swerts and Krahmer (2010), the researchers did
not conduct a task to perceptually detect prominence. In their study on the in-
teraction between beats performed with head and/or eyebrows and pitch accents
signalling focal constituents, the TV recordings were annotated for gestural and
acoustic cues of prominence by two independent annotators plus the main au-
thor of the study (Table 7).
Inter-rater agreement, measured as Fleiss’s kappa (1971), ranged between
0.69 and 0.77. Interestingly, occurrences of head movements not always coin-
cided with a focal accent, di�erently from observations from previous studies
(e.g. Swerts & Krahmer, 2010; Yasinnik et al., 2004), which the researchers relate
149

Literature review: prominence and language
Prominence marker Occurrences % of words
FA only 128 12.98
FA+HB 126 12.78
FA+EB 3 0.30
FA+HB+EB 39 3.96
HB only 58 5.88
HB+EB 10 1.01
EB only 15 1.52
None 607 61.56
Total 986 100.00
Total
FA (focal accent) 296 30.02
HB (head beat) 233 23.63
EB (eyebrow beat) 67 6.80
Table 7: Distribution of the prominence markers FA (focal accent), HB (head beats), and EB (eyebrow
beats). The upper part of the table shows the total distribution of markers including individual and
combined occurrences. Adapted from Ambrazaitis & House, 2017, p. 105.
to the purpose of their annotating only focal or ‘big’ [sic] accents. In the case of
words annotated as containing only a head beat, a post-hoc annotation of pitch
accents was conducted by two raters to determine whether the word in question
carried a minor pitch accent or was completely deaccented. In this second round,
inter-rater agreement ranged between 0.46 and 0.52, and many annotations pre-
viously considered as head beats unrelated to pitch accents were now linked to
minor, non-focal pitch accents (labelled by the authors as ‘small’ accents).
Subsequently, Ambrazaitis and House carried out a functional analysis in-
cluding a comparative assessment of the combined prominence markers. The
researchers found patterns for the usage prominence markers, which focused
on how they were used across di�erent news topics, on repetitions of topics by
the same speaker, and on their use by di�erent speakers. Text and information
structure were the two main analysis criteria together with speaker expressivity.
150
Literature review: prominence and language
In their results, Ambrazaitis and House reported a di�erent distribution of focal
accents and head beats (but not eyebrow beats) within a news story uttered by
the newsreader. In this case, focal accents were preferably used in the �rst half
of the text, while head beats and the combination of focal accents and head beats
occurred during the second half of the text. This was explained as a consequence
of information structure, since the initial part of a text often presents the theme
or de�ne a common ground, while the second part usually corresponds to the
rheme. Thus, head beats seemed to highlight the most important information in
a piece of news once it had already been presented in the �rst half of the text.
2.3.8.5 Gender di�erences in the audiovisual perception of speech
Finally, behavioural and neuroanatomical di�erences between men and wo-
men have been reported for the audiovisual perception of speech (Dancer et al.,
1994; Öhrström & Traunmüller, 2004; Ruytjens et al., 2006, 2007; Watson et al.,
1996; see Alm & Behne, 2015, for a summary). More precisely, women have been
observed to perform better at speech-reading than males (e.g. Dancer et al., 1994;
Strelnikov et al., 2009), which has been related to the fact that women could be
more active gazers thanmen (e.g. Johnson et al., 1988). Additionally, women have
been reported to be more sensitive to visual cues than men in audiovisual speech
perception (Aloufy et al., 1996; Irwin et al., 2006; Öhrström& Traunmüller, 2004).
For example, Öhrström and Traunmüller (2004) showed that women were signif-
icantly more in�uenced by the visual modality than men in perceiving incongru-
ent Swedish vowels embedded in a syllable. Similar results were reported by Ir-
win et al. (2006), who studied the in�uence of visual speech for the syllable /ba/.
Irwin et al. suggested that such a gender di�erence might be due to a di�erent
pattern in language processing, with a stronger activation in bilateral brain areas
causing a more e�cient audiovisual language processing in women (e.g. Baynes
151

Literature review: prominence and language
et al., 1994; Coney, 2002).
Furthermore, neuroanatomical di�erences point to a stronger activation of
brain areas associated with speech perception in women (Ruytjens et al., 2006,
2007). In addition, it has been claimed that gender di�erences in audiovisual
speech perceptionmay emerge in the context of challenging stimuli (Jaeger et al.,
1998), which can be related to the results observed in the third experimental con-
dition Exp3, where duration was the only acoustic cue available to participants.
2.3.9 Summary
The Kendon’s continuum classi�es gestures according to the relationship that
body movements have to speech and their increasing degree of conventionalisa-
tion. In their relation to speech, bodymovements at the left end of the continuum
are produced unawarely together with speech and are known as ‘gesticulation’.
Conversely, at the right end, the movements performed in sign languages are
produced consciously to communicate typically in the absence of speech. Ges-
ticulation does not have agreed-upon movements conveying meaning or any
phonological, morphological, and syntactic system to combine its constituents.
Therefore, these type of gestures are not conventionalised, while sign languages
at the right end share a conventionally structured code necessary for commu-
nication. Similarly, gestures at the left end convey meaning in a global way, i.e.
they can not be segmented; while at the right end, sign languages convey mean-
ing by combining smaller parts, as morphemes do when they are combined into
larger meanings in spoken language.
Gesture studies
Research on gestures experienced a renewed interest since the mid-20th cen-
tury, partly due to the convergence of linguistic, psychological, and psychiatric
152

Literature review: prominence and language
studies. Nevertheless, di�erent aspects of gestures can be traced back to the
Antiquity. One of the main questions arisen at di�erent moments in history is
the role played by gestures in the cognitive foundations of language. For ex-
ample, some authors, such as Giambattista Vico (1725/1744) and Étienne Bon-
not de Condillac (1746), already considered gestures as a fundamental aspect of
human communication underlying the evolution of the language faculty. Such
an idea has been later reformulated (e.g. Armstrong et al., 1995; Corballis, 2002;
Stokoe, 2001), partly buttressed by neurophysiological evidence con�rming the
sharing of neural circuits between speech and gesture (e.g. Meister et al., 2003).
Also, a theoretical framework to account for their cognitive integration has
been put forward by McNeill (1992), although similar accounts have also been
o�ered by other authors, e.g. Kita (2000) and De Ruiter (2000). The particular-
ities of each of them turn around the stage at which the interaction of gesture
and speech takes place, although their interaction is not questioned for language
production and language perception (Biau & Soto-Faraco, 2013; Biau et al., 2015).
Subsequently, the temporal coordination of both phenomena has been argued to
re�ect their close connection. Quite a large number of studies have tried to pin
down the precise time-alignment of gesture and speech and its implications for a
wider perspective on language (e.g. Esteve-Gibert & Prieto, 2013; Karpiński et al.,
2009; Krivokapić et al., 2015, 2016; Loehr, 2004; Morrel-Samuels & Krauss, 1992;
Rochet-Capellan et al., 2008).
Furthermore, di�erent criteria have been used in an attempt to order and
classify gestures. Important researchers on the phenomenon of gesture have
contributed in the 20th century with several classi�cations (Ekman & Friesen,
1969; Ekman, 1999; Efron, 1941/1972; Freedman & Ho�man, 1967; Kendon, 1972;
McNeill, 1992). One of the most widespread distinction among authors is based
on semiotic principles, and gestures are divided into those which refer to an
153

Literature review: prominence and language
object by pointing at it and those which characterise the object in some way.
Nowadays, the most widely accepted classi�cation of gestures is that developed
by McNeill (1992).
In his classi�cation, McNeill established a fundamental division between ima-
gistic gestures and non-imagistic gestures. The former are those that depict the
shape of an object, display an action or represent some pattern of movement.
Depending on whether they are concrete or abstract, they can be grouped into:
iconic andmetaphoric. Non-imagistic gestures include pointing gestures, rhythmic
gestures that highlight either segments of the discourse (cohesives) or its rhythmic
structure (beats), and gestures associated to speech failures (butterworths).
Some have also explored the interaction between gestures and verbal pros-
ody. It has been observed that gestures have much in common with prosody
in their potential, for example, for adding non-discrete nuances that serve in-
teractive functions and facilitate comprehension (Foxton et al., 2010; Munhall
et al., 2004). Furthermore, gestures have been also found to possess similar
prominence-increasing e�ects to those of speech, with prominence marking as
one of themany possible interactions between bothmodalities (Krahmer& Swerts,
2007).
Temporal coordination of gesture and speech
The temporal coordination of gesture and speech has also been studied, and
knowledge on their precise synchronisation has come a long way in the last dec-
ades. The ‘phonological synchrony rule’, as stated by McNeill (1992), has been
contested and put to the test (e.g. McClave, 1991, 1994; Karpiński et al., 2009),
although several studies have proved the tight time-alignment between gesture
and speech (Esteve-Gibert & Prieto, 2013; Krivokapić et al., 2015, 2016; Leonard
& Cummins, 2010; Loehr, 2004).
154

Literature review: prominence and language
Audiovisual prosody
On the other hand, research on the visual component of communication has
begun to give an account of how the visual correlates of prominence (e.g. ges-
tures performed with hands, eyebrows, or head) interact with verbal prosody
(e.g. Al Moubayed et al., 2010; Granström et al., 1999; Kim et al., 2014; Krah-
mer & Swerts, 2007; Prieto et al., 2011; Scarborough et al., 2009). In the case of
prominence perception, visual cues result in stronger production and perception
of verbal prominence (Krahmer & Swerts, 2007); in this way, facial gesturing,
for example, has been found to systematically in�uence the perception of verbal
prominence (Dohen & Lœvenbruck, 2009; House et al., 2001; Swerts & Krahmer,
2008).
Most studies having addressed the interaction of visual and verbal promi-
nence have so far made use of both lip-synchronised animated agents (e.g. Al
Moubayed & Beskow, 2009; Granström et al., 1999; House et al., 2001; Krahmer
et al., 2002a,b; Prieto et al., 2011) and experimental settings in which gestures are
elicited with controlled speech stimuli (e.g. Dohen & Lœvenbruck, 2009; Fox-
ton et al., 2010; Krahmer & Swerts, 2007). In both cases, the visual cues of
prominence—limited to beats produced by eyebrow raises and head nods, and oc-
casionally also by hand gestures (Krahmer & Swerts, 2007)—have been observed
to enhance verbal prominence perception.
Finally, a di�erence exists between men and women in the audiovisual per-
ception of speech, which has been supported by neuroanatomical di�erences,
with a stronger activation in bilateral brain areas causing a more e�cient audio-
visual language processing in women (Dancer et al., 1994; Öhrström & Traun-
müller, 2004; Ruytjens et al., 2006, 2007; Watson et al., 1996).
155

Methodology
This chapter �rstly presents a review of the methods found in previous stud-
ies on prominence perception. Then, the statistical background applied in the
experimental analysis conducted in this study is discussed. After these two sec-
tions, the details of the methodology applied in the experimental part of this
study is discussed and lays out the theoretical grounds on which it is based (§
3.3.1). An account is given of the spontaneous speech materials used in both
experiments as well as of the process by which the stimuli were created. Follow-
ing this, some aspects of the methodology that are common to both experiments
are referred, e.g. participants, gesture annotation of stimuli, and data analysis.
Logically, the speci�c details di�ering between experiments, such as experiment
design, procedure, etc., will be discussed particularly in their respective sections.
3.1 Previous methodological approaches
The review of the methodology is summarised here below in Table 8. This
table shows the details reported in studies on prominence perception published
between 1992 and 2017. For example, the number of participants in the over
twenty experiments reviewed ranged between 3 and 74, and theymostly included
naïve listeners, but also, to a lesser extent, trained listeners.
156

Methodology
Autho
rN–Listen
ers
Task
Trials
Scale
N–Stim
uli
Presen
tation
Mod
ality
Speech
material
Streefkerk
etal.,1997
(exp
erim
ent1
)8–naïve
Markeveryprom
inent
syllablein
thesentence
30–
181
sentences
Aud
ioandprintedsentence
APo
lyph
oneCo
rpus
(teleph
onespeech)
Streefkerk
etal.,1997
(exp
erim
ent2
)8–naïve
Markeveryprom
inent
wordin
thesentence
30–
181
sentences
Aud
ioandprintedsentence
APo
lyph
oneCo
rpus
(teleph
onespeech)
Streefkerk
etal.,1998
10–naïve
Markeveryprom
inent
wordin
thesentence
10–
1500sentences
Aud
ioandprintedsentence
APo
lyph
oneCo
rpus
(teleph
onespeech)
Granström
etal.,1999
21–naïve
Two-alternative
forced
choice
30–
120
sentences
2target
words
inasix-wordsentence
Animated
agent
AVSy
nthesisedspeech
Hou
seet
al.,2001
33–naïve
Two-alternative
forced
choice
adlib
.0–
112
sentences
2target
words
inaeigh
t-wordsentence
Animated
agent
AVSy
nthesisedspeech
Eriksson
etal.,2001
18–naïve
Markeveryprom
inent
syllablein
thesentence
adlib
.0–
100
13syllables
inanine-w
ordsentence
Aud
ioandprintedsentence
AElicite
dspeech
Krahmer
etal.,2002a,b
25–naïve
Three-alternative
forced
choice
adlib
.(2002a)
2(2002b)
0–1
36sentences
1tw
o-wordsentence
Animated
agent
AVElicite
dspeech
Swerts&Kr
ahmer,2004
55–naïve
Markthemostp
rominent
syllablein
theword
30–
120
words
1three-syllablepseudo
-word
Aud
ioandprintedsentence
Speakero
nscreen
A-V-AV
Elicite
dspeech
Kochanskieta
l.,2005
2–trained(m
arking
from
corpus)
1naïve–1trained
Markeveryprom
inent
syllablein
thesentence
n.a.
0–1
13437syllables
(sentencenu
mberisn
otgiven)
Sentence
waveform
Aud
ioandprintedsentence
AIViE
Corpus
(spo
ntaneous
speech)
Krahmer
&Sw
erts,2007
(exp
erim
ent2
)3–trained
Markeveryprom
inent
wordin
thesentence
adlib
.0–
2360sentences
2target
words
inafour-w
ordsentence
Sentence
waveform
Aud
ioandprintedsentence
AElicite
dspeech
Krahmer
&Sw
erts,2007
(exp
erim
ent3
)20
–naïve
Markthetarget
wordin
thesentence
10–
1072
sentences
2target
words
inafour-w
ordsentence
Aud
ioSp
eakero
nscreen
A-AV
Elicite
dspeech
Swerts&Kr
ahmer,2008
(exp
erim
ents1and2)
42–66
–naïve
Three-alternative
forced
choice
10–
154
sentences
3target
words
ina�v
e-wordsentence
Speakero
nscreen
AVElicite
dspeech
Mo,2008a
74–naïve
Markeveryprom
inent
wordin
thesentence
20–
118
excerptsof
abou
t20second
slon
gAud
ioandprintedsentence
ABu
ckeyeCo
rpus
(spo
ntaneous
speech)
Coleet
al.,2014
15–naïve
Markeveryprom
inent
wordin
thesentence
n.a.
0–1
16excerptsof
abou
t18second
slon
gAud
ioandprintedsentence
ABu
ckeyeCo
rpus
(spo
ntaneous
speech)
AlM
oubayedet
al.,2010
(labelling
)1–trained
Markeveryprom
inent
wordin
thesentence
n.a.
0–3
30sentencesr
anging
betw
een6and10
words
Printedsentence
Animated
agent
AVCo
rpus
(nofurther
details
provided)
Doh
en&Lœ
venb
ruck,2009
(exp
erim
ent1
)13
–naïve
Four-alte
rnative
forced
choice
10–
1192sentences
4sentencesr
anging
betw
een4and5words
Aud
ioandprintedsentence
Speakero
nscreen
A-V-AV
Elicite
d(w
hispered)speech
Doh
en&Lœ
venb
ruck,2009
(exp
erim
ent2
)31
–naïve
Four-alte
rnative
forced
choice
10–
1192sentences
2sentencesr
anging
betw
een4and5words
Aud
ioandprintedsentence
Speakero
nscreen
A-V-AV
Elicite
d(w
hispered)speech
Swerts&Kr
ahmer,2010
(exp
erim
ent1
:‘auditory
mark-up
’)35
–naïve
Markeveryprom
inent
wordin
thesentence
adlib
.0–
160
sentencesr
anging
betw
een4and12
second
sPrintedsentence
AAud
iovisualrecordings
from
TVnewsreader
(spo
ntaneous
speech)
Ambrazaitis
&Hou
se,2017
3–n.a.
Markfocalaccentsand
head
andeyebrowbeats
n.a.
0–1
31newsitemsr
anging
betw
een1and3sentences
Sentence
waveform
Speakero
nscreen
A-AV
Aud
iovisualrecordings
from
TVnewsreader
(spo
ntaneous
speech)
Table8:
Methodologicald
etailsof
previous
stud
ies.Sw
ertsan
dKrahm
er’sstud
y(2004)
istheonly
oneexploringlexicalstress.Abbreviations:n
.a.(not
available)ad
lib.(ad
libitu
m,‘no
limit’).
157
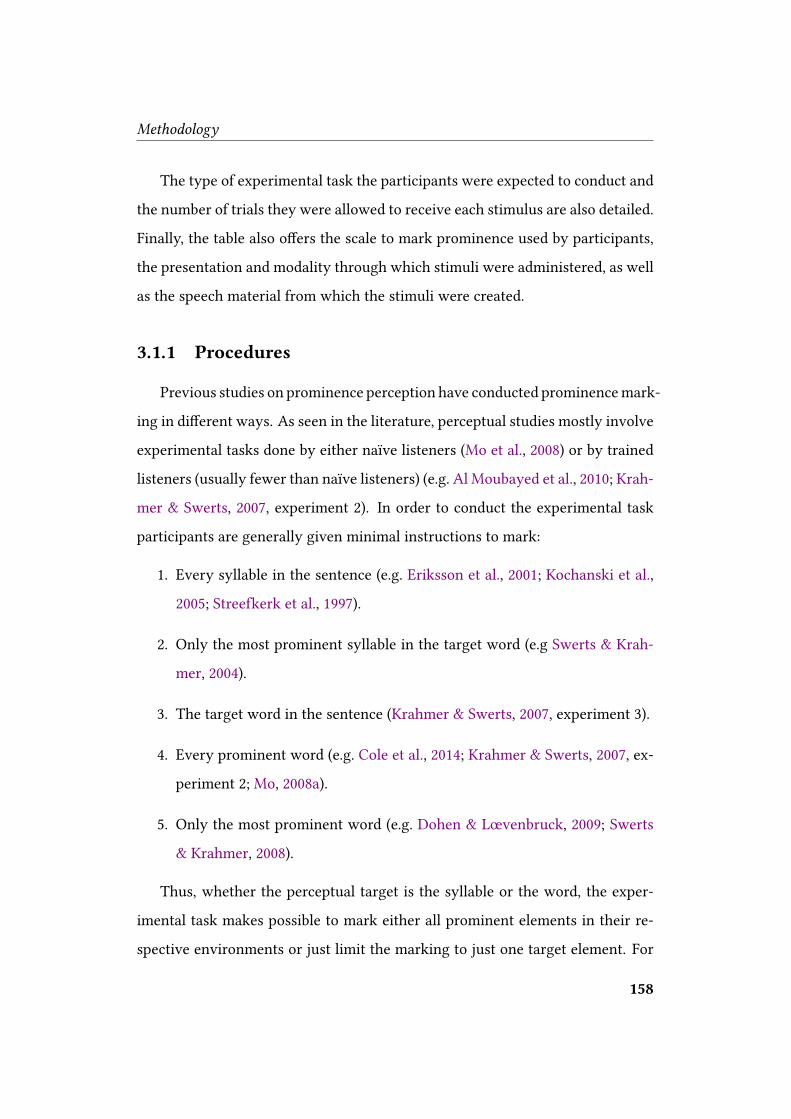
Methodology
The type of experimental task the participants were expected to conduct and
the number of trials they were allowed to receive each stimulus are also detailed.
Finally, the table also o�ers the scale to mark prominence used by participants,
the presentation and modality through which stimuli were administered, as well
as the speech material from which the stimuli were created.
3.1.1 Procedures
Previous studies on prominence perception have conducted prominencemark-
ing in di�erent ways. As seen in the literature, perceptual studies mostly involve
experimental tasks done by either naïve listeners (Mo et al., 2008) or by trained
listeners (usually fewer than naïve listeners) (e.g. Al Moubayed et al., 2010; Krah-
mer & Swerts, 2007, experiment 2). In order to conduct the experimental task
participants are generally given minimal instructions to mark:
1. Every syllable in the sentence (e.g. Eriksson et al., 2001; Kochanski et al.,
2005; Streefkerk et al., 1997).
2. Only the most prominent syllable in the target word (e.g Swerts & Krah-
mer, 2004).
3. The target word in the sentence (Krahmer & Swerts, 2007, experiment 3).
4. Every prominent word (e.g. Cole et al., 2014; Krahmer & Swerts, 2007, ex-
periment 2; Mo, 2008a).
5. Only the most prominent word (e.g. Dohen & Lœvenbruck, 2009; Swerts
& Krahmer, 2008).
Thus, whether the perceptual target is the syllable or the word, the exper-
imental task makes possible to mark either all prominent elements in their re-
spective environments or just limit the marking to just one target element. For
158

Methodology
this, it is possible to use a binary scale, e.g. prominent vs. non-prominent (e.g.
Cole et al., 2014), or a gradient scale, e.g. a Likert scale, a 4-point scale, a 10-point
scale, etc. (Krahmer & Swerts, 2007, experiment 3); however binary prominence
marking has also been conducted using 2-, 3- and 4-alternative forced-choice
tasks (e.g. Granström et al., 1999; Dohen & Lœvenbruck, 2009; Krahmer et al.,
2002a,b) (Table 8).
The choice between target syllables and words, on the one hand, as well as
between a binary scale and a gradient scale for marking, on the other hand, de-
pends on several factors: the nature and length of the stimuli, the cognitive e�ort
required from the listeners, and the �ne-grained detail of the expected results.
Marking words for binary prominence in short sentences, for example, requires
less cognitive e�ort from listeners than marking every syllable on a gradient
scale in longer sentences, and it also results in a more consistent agreement on
the prominent elements. In this sense, Streefkert et al. (1997), for example, com-
pared their results for both syllables and words using the same speech material.
She and her colleagues observed remarkable di�erences in agreement among
listeners, with words being more meaningful units than syllables in an experi-
mental task consisting in marking phrasal stress by naïve listeners. Additionally,
Rosenberg and Hirschberg (2009) reached similar conclusions for the automatic
identi�cation of pitch accents.
It is also possible either to choose certain target syllables or words within a
sentence or to make all elements available for marking in the sentence. For ex-
ample, using short sentences, House et al. (2001) and Krahmer and Swerts (2007)
presented two target words to listeners for marking. However, Streefkert et al.
(1997) used read-aloud sentences from a corpus and, in two di�erent experiments
made �rstly all syllables and then all words available for marking. Conversely,
Dohen and Lœvenbruck (2009) applied a four-alternative forced-choice task in a
159

Methodology
series of �ve-word sentences for listeners to detect contrastive focus. Other stud-
ies employed a gradient scale to determine prominence, mostly on small samples
of speech material (Eriksson et al., 2001). In their turn, Al Moubayed et al. (2010),
for example used a 4-point scale in an experiment on the multimodal perception
of prominence using an animated agent (Table 8).
Figure 25: Example of P-scores resulting from pooling together the prominence marks given by a
large number of listeners, which is then transformed into a probabilistic score. Adapted from Mo,
2008a, p. 260.
From this analysis of the literature, it can be observed that, despite the higher
accuracy achieved by nuanced gradient scales, the use of a binary scale is more
straight-forward to naïve listeners, thus reducing greatly the complexity of the
experimental task. Additionally, binary prominence marking presents the ad-
vantage that it can be easily made into a more �ne-grained scale by adding up the
individual scores obtained from listeners. Cumulative marks of prominence are
an elegantway to analyse prominence inmore detail (Cole et al., 2010; Krahmer&
Swerts, 2007; Mo, 2008a; Swerts, 1997). Thus, the proportion of listeners agreeing
on prominent elements can be computed through a probabilistic P(rominence)-
score that re�ects the probability of a given word to be prosodically perceived as
prominent (Figure 25).
160

Methodology
3.1.2 Speech materials and type of stimuli
Not only the setup of an optimal experimental task, but also the experimental
paradigm to be used represents a great challenge for the study of prominence per-
ception, especially in its relation to the visual cues of prominence. Undoubtedly,
methodological di�culties lie at the heart of all attempts to account for the in-
teraction of visual cues and acoustic cues in prominence perception. So far, most
methods applied to study the interaction of auditory and visual cues of prom-
inence have made use of both animated agents (e.g. Al Moubayed et al., 2010;
Granström et al., 1999; House et al., 2001; Krahmer et al., 2002a,b; Prieto et al.,
2015) and elicited gestures with controlled speech stimuli in experimental set-
tings (e.g. Dohen & Lœvenbruck, 2009; Krahmer & Swerts, 2007), as previously
explained (§ 2.3.8.2 and § 2.3.8.3).
Despite their proved usefulness, both animated agents and elicited gestures
and speech in the laboratory present some shortcomings for the study of the
multimodal perception of prominence. Certainly, the use of animated agents has
been shown to provide intelligibility (e.g. Agelfors et al., 1998), and they make
possible to manipulate visual cues while preserving acoustic information. How-
ever, they have been limitedmainly to the study of eyebrow and headmovements
(Krahmer et al., 2002a,b; Prieto et al., 2011), so that no gestures performed with
hands, for instance, have been studied yet using animated agents, let alone a
combination of manual, facial, and head gestures.
Additionally, stimuli created in experimental settings usually involve audio-
visual recordings, in which it is di�cult to elicit spontaneous gestures (e.g. Krah-
mer & Swerts, 2007). Although face expressions and head nods have been con-
sistently analysed, manual gestures have been more systematically neglected.
Speakers do not always behave as naturally when asked to in front of a camera
161

Methodology
as when they gesticulate in natural conversations. Hence, the ecological validity
of methods used in experimental settings is somewhat reduced, and the general-
isation of results obtained with animated agents is to some degree limited.
It is also worth noting that the speech materials used are sometimes charac-
terised by being carefully produced (e.g. Dohen & Lœvenbruck, 2009; Krahmer
& Swerts, 2007; Krahmer et al., 2002a,b), thus lacking some of the acoustic phe-
nomena of spontaneous speech (Face, 2003; Laan, 1997). For example, Krahmer
and Swerts (2007) created their audiovisual stimuli by instructing participants to
utter a four-word sentence and produce subsequently a quick visual beat with
either hand, head, or eyebrows on one of the two target words of the sentence.
Participants were also allowed to rehearse until they were not able to improve
the combination of gesture and speech. Then the researchers administered these
stimuli to a group of naïve listeners for prominence marking. Similarly, Foxton
and her colleagues (2010) instructed a French actress to pronounce a two-word
utterance to study the perception of co-occurring facial gestures.
Di�erently, several studies have employed spontaneous speech in the study
of audiovisual prosody, and stimuli have been created either from speech corpora
applied to animated agents (AlMoubayed et al., 2010) or from audiovisual record-
ings (Ambrazaitis & House, 2017; Flecha-García, 2006, 2007; Loehr, 2004; Swerts
& Krahmer, 2010; Yasinnik et al., 2004). For example, Loehr (2004) �lmed four
subjects in natural conversation with friends for the study of the temporal co-
ordination of visual and auditory prosody; Yasinnik (2004) �lmed three academic
lecturers in short monologues also with a similar purpose; and Flecha-García
(2006) elicited task-oriented dialogues with which she analysed the participants’
eyebrowmovements in relation to discourse structure and utterance function. In
their turn, Ambrazaitis and House (2017) and Swerts and Krahmer (2010) resor-
ted to TV recordings of newsreaders, and both analysed eyebrowmovements and
162

Methodology
head movements, although only Swerts and Krahmer (2010, experiment 1: ‘au-
ditory mark-up’) explored prominence perception, and this, only in the auditory
modality.
From this it can be gleaned that previous methods present some important
shortcomings. Similarly, it is also apparent that spontaneous speech has not
been fully exploited. Therefore, the creation of stimuli from spontaneous speech
samples can both extend the research questions to be addressed and increase the
ecological validity of results obtained in the multimodal perception of promi-
nence.
3.1.3 Summary
Studies on prominence perception have set up experimental procedures in
several ways, di�ering in the perceptual target unit: whether syllable or word
(e.g. Streefkerk et al., 1997); the nature of the marking: binary scale (e.g. Swerts &
Krahmer, 2004), binary scale in a forced-choice task (e.g. Granström et al., 1999),
a 4-point scale (e.g. Al Moubayed et al., 2010), or a10-point scale (e.g. Krahmer
& Swerts, 2007, experiment 3); and the presentation of stimuli: audio-only (e.g.
Streefkerk, 2002), visual-only, (e.g. Swerts & Krahmer, 2004), and audiovisual
(e.g. Dohen & Lœvenbruck, 2009).
Next to this, some important di�erences among studies are seen in the par-
ticipants conducting the task: naïve (e.g Mo, 2008a) or trained (e.g. Krahmer &
Swerts, 2007, experiment 2), and the speech material stimuli are created from:
elicited speech (e.g. Dohen & Lœvenbruck, 2009), synthesised speech (e.g. House
et al., 2001), or corpus speech (e.g. Mo, 2008a). Only a small fraction of studies
have used spontaneous speech, but none to study the multimodal perception of
prominence.
From the literature, it seems that, despite the higher accuracy achieved by
163

Methodology
nuanced gradient scales, the use of a binary scale is more straight-forward to
naïve listeners. Binary prominence marking also presents the advantage that it
can be easily made into a more �ne-grained scale by adding up the individual
scores obtained from listeners (e.g. Cole et al., 2010; Mo, 2008a).
Furthermore, shortcomings are associated to the methodological paradigms
used in the study of the multimodal perception of prominence. For example,
studies conducted using animated agents have been limited mainly to the study
of eyebrow and head movements (e.g. Krahmer et al., 2002a,b; Prieto et al., 2011).
Therefore, gestures performed with hands, for instance, have not been studied
using animated agents, let alone a combination of manual, facial, and head ges-
tures. On the other hand, it is usually di�cult to elicit spontaneous gestures in
experimental settings (e.g. Krahmer & Swerts, 2007), and manual gestures have
also often been omitted from analysis. As a result, the ecological validity and the
generalisation of results are to some degree limited.
Although several corpora of spontaneous speech have been used in the study
of prominence perception—only in the audio-only modality (e.g. Mo, 2008a)—,
only few studies have used spontaneous speech in the audiovisual modality (e.g.
Flecha-García, 2006, 2007; Loehr, 2004; Yasinnik et al., 2004) and still fewer have
done so in the study of the multimodal perception of prominence (Ambrazaitis
& House, 2017; Swerts & Krahmer, 2010).
3.2 Review of statistical methods
In this section, �rst, the details of linear mixed models (LMMs) are discussed.
LMMs are then extended and generalised linear mixed models (GLMMs) han-
dling non-normal distributions are presented, with special emphasis on the bi-
nomial distribution. The di�erent estimation methods for GLMMs are explained
164

Methodology
together with the model selection procedure that permits to establish the model,
from a set of estimated models, that best accounts for the data. Finally, an intro-
duction to theAkaike information criterion (AIC), as amethod to comparemodels,
is o�ered. AIC, di�erently from traditional p-values, simply provides an ordinal
value assessing the quality of models respect to their complexity, thus lacking
any meaning of its own except as a way to rank models form a set (Akaike,
1973).
3.2.1 From ANOVAs towards Linear Mixed Models (LMMs)
Statistical analyses in the �eld of psycholinguistics have traditionally ap-
plied analyses of variance (ANOVAs) often involving full factorial designs with
repeated measures. Such experimental designs aimed at increasing statistical
power and precision. Typically a particular sample of participants gave responses
to a �xed set of stimuli. By rotating stimuli over experimental conditions un-
desired repetition e�ects were avoided.
In such designs, the collection of more than one response per participant
necessarily breaks the assumption of independence of observations—more pre-
cisely, independence of residuals. This principle is inherent to any linear regres-
sion model, since more than one response from a given participant is usually
correlated and, therefore, responses are not independent. Logically, several ob-
servations from the same participant are tend to be more similar to each other
than two observations obtained from di�erent participants. For example, in an
experiment measuring reaction times for word recognition under three di�erent
experimental conditions, e.g. words, pseudo-words, and words from a known
second-language. In the case that each condition included 15 stimuli, each parti-
cipant would contribute with 45 di�erent observations that are non-independent.
One way to handle such correlated data is by explicitly modelling this de-
165

Methodology
pendency. For example, it is possible to explicitly declare in the model that
some responses were given by the same individuals. Linear mixed-e�ects models
(henceforth LMMs) (e.g. Baayen et al., 2008), also known simply as ‘mixed mod-
els’, include these correlated data into the model via stating a random e�ect for
participants (typically known as ‘by-subject’ random e�ects). This is also true of
experiments in which some variables are clustered or nested within other vari-
ables; that is, when units of observations are clustered in groups such as students
grouped within schools, or patients within hospitals. In such situations, it is also
logical to expect observations within each group to be more similar to each other
than observations across groups.
Following the example mentioned before, if taking words as the unit of ob-
servation1, words in the �rst experimental condition (native words) are expected
to be recognised much faster than those of the second (pseudo-words) and third
experimental conditions (second-language words). Therefore, observations for
those stimuli belonging to the same experimental condition are expected to be
more similar to each other. As a result, once more, the assumption of independ-
ence is not met. In this case, this between-group variability is controlled for by
means of a second random e�ect (known as ‘by-item’ random e�ects), which
corresponds to stimuli nested in three di�erent experimental conditions in our
hypothetical example: native words, pseudo-words, and second-language words
(Table 9).
It was noted long ago that the sample of linguistic items from which gener-
alisation to the larger population of linguistic material is made also possesses an
inherent variability that breaks the assumption of independence (Clark, 1973)—
even if stimuli are not necessarily grouped within di�erent experimental condi-
1 Di�erently from many psychology experiments, in which the unit of observation is the
participant.
166

Methodology
Reaction Times Participant Condition Item
0.108 1 Word 1
0.456 1 Pseudo-word 1
0.353 1 Second Language-word 1
0.110 1 Word 2
0.432 1 Pseudo-word 2
0.310 1 Second Language-word 2
... ... ... ...
0.112 1 Word 15
0.390 1 Pseudo-word 15
0.311 1 Second Language-word 15
0.187 2 Word 1
0.403 2 Pseudo-word 1
0.315 2 Second Language-word 1
0.120 2 Word 2
0.412 2 Pseudo-word 2
0.229 2 Second Language-word 2
... ... ... ...
0.115 2 Word 15
0.385 2 Pseudo-word 15
0.210 2 Second Language-word 15
... ... ... ...
0.150 20 Word 15
0.350 20 Pseudo-word 15
0.268 20 Second Language-word 15
Table 9: Fictitious data from a study on word recognition. Responses are non-independent, i.e. each
participant provides 3 responses per item over three conditions; and every item in each condition
receives 20 responses, one per participant, adding up to a total of 900 responses (15 items x 3 conditions
x 20 participants).The respective by-subject and by-item random e�ects capture these two sources of
variability.
tions, as in the provided example. As a solution, Clarke proposed to account, in
two di�erent analyses, for item variability (F2) across subjects (F1) by comput-
ing the quasi-F (F’) and min-F’ statistics (see Quené & van den Bergh, 2008, for
167

Methodology
a review).
In the case of LMMs, which are a generalisation of ordinary regression mod-
els, such by-subject and by-item dependencies of observations can be explicitly
declared as random e�ects2. Thus, mixed models (also known as ‘hierarchical re-
gression’, ‘multi-level regression’, or ‘variance component model’), include three
elements: �xed e�ects, random e�ects, and a last term for unaccounted variabil-
ity, which contributes linearly to the dependent variable. An ordinary regression
model can be speci�ed by the following expression:
��,�,� = �0 + �1��,�,� + ��,�,� ,��,�,� � N (0, � 2). (1)
In this model (1), ��,�,� is the outcome to be predicted by the model, and the��,�,� is the predictor corresponding the to the observation made by a subject i for
an item j in a certain condition k. Predictions are summarised by a straight line,
which is de�ned by two parameters known as regression coe�cients: the intercept,�0, the point at which the line crosses the Y axis; and the slope, �1, the gradientof the straight line �tted to the data. Any model includes an observation-level
error ��,�,� , which is normally distributed with mean 0 and variance � 2.However, model (1) is not a mixed-e�ects model because it does not capture
the violation of independence that has just been mentioned and that corresponds
to the several observations made by each subject. This can be accounted for by
including a new term �0� corresponding to the deviation from �0 for each subject
i.
2 In this section I mainly follow the detailed expositions made by Barr et al., 2013 and Sing-
mann & Kellen, in press.
168

Methodology
��,�,� = (�0 + �0�) + �1��,�,� + ��,�,� ,��,�,� � N (0, � 2),�0� � N (0, � 2). (2)
In this case, the parameters �0 and �1 in model (2) are �xed e�ects, i.e. terms
of interest to the researcher, which reveal the e�ects of the independent vari-
able(s) on the population-level average, either as main e�ects or as interactions.
Conversely, �0� is a random e�ect and re�ects the stochastic variability of a cat-
egorical variable. In this case, the random factor ‘subject’ corresponds to the
random sample extracted from a population in order to eventually generalise
over it. This implies that the sample would certainly have a di�erent composi-
tion if the same experiment were carried out another time. Due to the fact that
this random e�ect estimates the population distribution from which the �0� ef-fects were drawn, it is assumed that it follows a normal distribution with mean
0 and variance � 2.If we take our previous example, we could see di�erences among participants
in their reaction times for word recognition, some being slower and some being
faster than the average. Nevertheless, such di�erences are not re�ected in model
(1), which assumes a single intercept �0 for all of them. Model (2), on the contrary,
allows for idiosyncratic averages per participant by introducing the term �0� . Thisterm captures the displacement of each participant from the grand mean, i.e. the
intercept �0. For this reason, this model is known as a random-intercept model,
and ‘subject’ is the grouping factor for which random intercepts are estimated.
Furthermore, although model (2) assumes that di�erences in reaction times
can be due to variability between subjects, it does not include a second source
of variability, i.e. the di�culty inherent to each condition. For example, even if
169

Methodology
all subjects were beginner learners of Dutch as a second language, recognition
of second-language words in Dutch might be more challenging for some parti-
cipants depending on their second-language competence. In such a case, a new
term capturing this variability within participants for the condition e�ect of �1,word type, is introduced into the model:
��,�,� = (�0 + �0�) + (�1 + �1�)��,�,� + ��,�,� ,��,�,� � N (0, � 2). (3)
As previously seen in model (2), �0� represents the displacement of the ith
participant from �0, while now, in model (3), �1� corresponds to the displacement
of that same participant i from the mean associated to the e�ect of the exper-
imental condition represented by �1. As repeated observations from the same
participants are correlated, the several observations made for the same experi-
mental condition are correlated. The two random e�ects �0� and �1� are assumed
to have a mean 0 and a variance-covariance matrix � that lists both the variances
(on the diagonal) and the covariances between conditions (o� the diagonal):
(�0� , �1�) � N ����0,� = ����� 20 ��0,�1��0,�1 � 21
�������� (4)
The resulting variance-covariance matrix in (4) re�ects the dependencies that
emerge when both random e�ects by-subject are correlated. For example, some
participants with lower reaction times in word recognitionmight also have a bet-
ter command of Dutch as a second language and, thus, show less di�erences, for
example, between the ‘word’ and ‘second-language word’ conditions. This vari-
ability is re�ected in regression parameters varying in �1 for each participant;
that is, varying in slope. In other words, in model (3) participants have di�erent
170
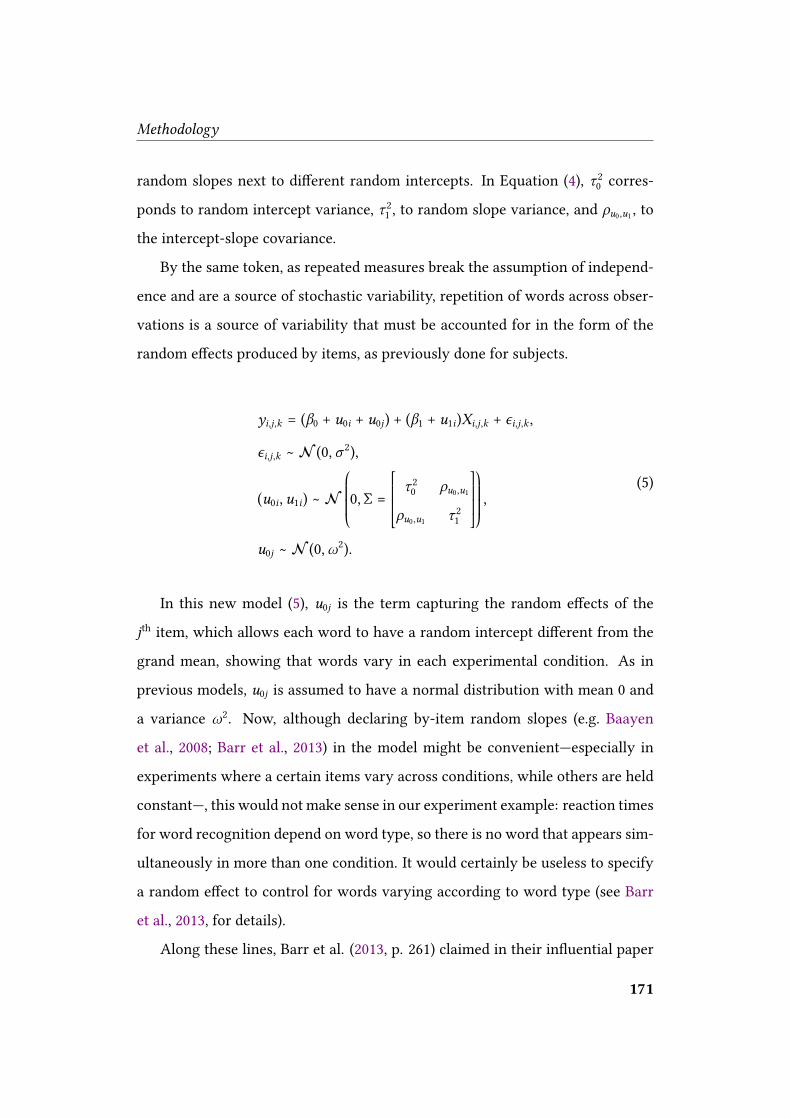
Methodology
random slopes next to di�erent random intercepts. In Equation (4), � 20 corres-
ponds to random intercept variance, � 21 , to random slope variance, and ��0,�1 , tothe intercept-slope covariance.
By the same token, as repeated measures break the assumption of independ-
ence and are a source of stochastic variability, repetition of words across obser-
vations is a source of variability that must be accounted for in the form of the
random e�ects produced by items, as previously done for subjects.
��,�,� = (�0 + �0� + �0�) + (�1 + �1�)��,�,� + ��,�,� ,��,�,� � N (0, � 2),(�0� , �1�) � N ����0,� = ����
� 20 ��0,�1��0,�1 � 21�������� ,�0� � N (0,�2).
(5)
In this new model (5), �0� is the term capturing the random e�ects of the
jth item, which allows each word to have a random intercept di�erent from the
grand mean, showing that words vary in each experimental condition. As in
previous models, �0� is assumed to have a normal distribution with mean 0 and
a variance �2. Now, although declaring by-item random slopes (e.g. Baayen
et al., 2008; Barr et al., 2013) in the model might be convenient—especially in
experiments where a certain items vary across conditions, while others are held
constant—, this would not make sense in our experiment example: reaction times
for word recognition depend on word type, so there is no word that appears sim-
ultaneously in more than one condition. It would certainly be useless to specify
a random e�ect to control for words varying according to word type (see Barr
et al., 2013, for details).
Along these lines, Barr et al. (2013, p. 261) claimed in their in�uential paper
171

Methodology
that the declaration of random e�ects must include all predictors speci�ed as
�xed e�ects, i.e. the ‘maximal’ random e�ects structure justi�ed by the experi-
mental design. However, they go on to suggest that:
“Although the maximal model best captures all the dependencies
in the sample, sometimes it becomes necessary for practical reasons
to simplify the random e�ects structure. Fitting LMEMs [(Linear
Mixed E�ects Models)] typically involves maximum likelihood es-
timation, where an iterative procedure is used to come up with the
‘best’ estimates for the parameters given the data. As the name sug-
gests, it attempts to maximize the likelihood of the data given the
structure of the model. Sometimes, however, the estimation proce-
dure will fail to ‘converge’ (i.e., to �nd a solution) within a reason-
able number of iterations. The likelihood of this convergence failure
tends to increase with the complexity of the model, especially the
random e�ects structure” (Barr et al., 2013, p. 261).
It is in this sense that Bates and his colleagues (2015a) later criticised Barr et
al.’s position by stating that:
“The advice to ‘keep it maximal’ often creates hopelessly over-
speci�ed random e�ects” (2015a, p. 24) and “failure to converge is not
due to defects of the estimation algorithm, but is a straightforward
consequence of attempting to �t a model that is too complex to be
properly supported by the data” (Bates et al., 2015a, p. 25).
Furthermore, one important feature of mixed models is that they permit to
declare di�erent random e�ects according to the way they are hierarchically
grouped when more than two levels exist. Thus, single random e�ects (Figure
26a) can be crossed (Figure 26b) or nested (Figure 26c) when there is a higher
172

Methodology
grouping factor (see Schielzeth & Nakagawa, 2012, for details). For example,
as previously seen, words in by-item random e�ects were grouped according
to word type, thus having only one factor and three levels: ‘word’, ‘pseudo-
word’, and ‘second language-word’. However, these levels may also be grouped
within an upper level factor, such as word length, e.g. 1-syllable, 2-syllable, and
3-syllable words. In this case random e�ects are said to be nested (Figure 26c).
Factor A
�1 �2 �3Factor B
�4 �5 �6(a)
Factor A
�1 �2 �3Factor B
�4 �5 �6
Level �1 Level �2Factor C
(b)
1 syll.
Word
�1 �2 �3Ps-W
�4 �5 �6SL-W
�7 �8 �9
2 syll.
Word
�10 �11 �12Ps-W
�13 �14 �15SL-W
�16 �17 �18
3 syll.
Word
�19 �20 �21Ps-W
�22 �23 �24SL-W
�25 �26 �27(c)
Figure 26: Di�erent types of random e�ects: (a) single random e�ects, (b) crossed random e�ects, (c)
nested random e�ects with the example experiment of word recognition used earlier for three levels:
syllable length, word type, and word item. Observations are labelled as �� . In nested random e�ects,
observations made for items appear only once within the lowest level of the grouping factors.
173

Methodology
Reasons for avoiding ANOVAs
Mixed models present more advantages compared to repeated measures ana-
lyses of variance (RM-ANOVAs), between-subjects ANCOVAs or mixed-model
ANOVAs (e.g. Baayen et al., 2008; Gueorguieva & Krystal, 2004; Quené & van
den Bergh, 2008). Apart from the fact that mixed models can handle designs
that break the assumption of independence, they are also suitable to deal with
unbalanced designs such as Latin-square designs, especially because many ex-
periments require counterbalancing of subjects across experimental conditions
in order to control for confounding variables and carry-over e�ects. Another
important advantage of mixed models is their potential for integrating numeric
predictors without needing to convert them previously into factors, such as low,
medium, and high levels of a hypothetical factor, for example.
Finally, mixed models present also many advantages for all behavioural sci-
ences, including linguistics (Figure 27). This is especially the case for analyses of
categorical data, which are extremely common in behavioural sciences, whether
they include a binary dependent variable or any other outcome that results in cat-
egorical grouping. In the case of a binary outcome, ordinary logistic regression
has traditionally been conducted, while ANOVAs analyses have been applied
with categorical outcomes after an arcsine-square-root transformation (known
as ‘arcsine transformation’) of the dependent variable (e.g. Loftus et al., 1978;
Mirković & Gaskell, 2016; see Warton & Hui, 2011, for a review). However, it
has been noted that mixed models perform much better analyses than ANOVA
by combining the strengths of logistic regression with random e�ects, at the
same time as they bene�t from the advantages of ordinary regression models
(see Jaeger, 2008, for details). In this case, mixed models are said to be part of
the generalised linear mixed model (henceforth GLMM) framework that makes
possible to analyse di�erent types of outcomes.
174

Methodology
None or purely
descriptive statistics
Monofactorial
statistical tests
Multifactorial
modelling(G)LMMs
Psycholinguistics
Corpus Linguistics
Figure 27: Evolution of statistical methods in psycholinguistics and corpus linguistics. Solidity of
lines represents frequency of use. Adapted from Gries, 2015, p. 98.
3.2.2 LMMsandnon-normal distributions: Generalised LMMs
As seen in the previous section, linear mixed models are just standard linear
regression models that allow to declare random e�ects to account for stochastic
variability and non-independence due to repeated measures. Apart from han-
dling unbalanced designs, it allows to model non-normal distributions. Gener-
ally speaking, the two main types of distributions are discrete and continuous
distributions, usually notated as ‘X �’ to mean ‘X is distributed as’. The Normal
(also known as ‘Gaussian’) distribution is a continuous distribution with a sym-
metric bell-shaped curve in which the probability for an event to fall beyond 2 or
3 standard deviations from the mean is really small, i.e. 5% and 0.3%, respectively
(Figure 28).
Di�erently, the binomial distribution is a discrete distribution that represents
the probability of success p of an number of events in a sequence of n independent
trials. In the case of n being equal to 1, i.e. one single trial, it is a Bernouilli
distribution. If n is bigger than 1, the binomial distribution is equivalente to
the sum of a number of independent Bernoulli experiments. For example, the
probability of getting a number from one to six when tossing a dice is 1/6 (a
Bernouilli experiment, i.e. a single roll of the dice). However, if we wish to
determine the probability of getting a certain number over 20 trials, it follows a
binomial distribution:
175

Methodology
Figure 28: Normal or Gaussian density curve. The area under the curve corresponds to the probability
for an event to occur, which is extremely low beyond 3 standard deviations from the mean. Adapted
from Wikimedia Commons.
� � Binomial (�, �), (6)
where n is the number of consecutive successes and p, the probability of success
in each trial. Thus, the probability of getting, let’s say, a six, in two separate
rollings of the dice P(x=2) is 19%, given 20 trials with a probability of 1/6 per
trial, as seen in:
� (� |�, �) = ������ (1 � �)��� ,� (2|20, 1/6) = 20!2!(20 � 2)!0.162(1 � 0.16)2�0.16 = 0.19 (7)
176

Methodology
More on binomial distributions
Statistical models dealing with binary outcomes—that is, data following a
binomial distribution and therefore taking on the values 0 (no event) or 1 (success
of event)—are known as logistic regression models. For the categorical outcome
to be expressed in a linear way, a logarithmic transformation is needed. For
this reason the logistic regression equation is expressed in logarithmic terms—
i.e. log-odds, called the logit of the outcome—in order to overcome the violation
of the assumption of linearity. For example, di�erently from linear regression,
logistic regression predicts the value of y from a certain predictor variable �1(or several Xs) by transforming the calculated probability of y occurring (8) into
log-odds (9):
� (�) = 11 + ��(�0+�1�1+����) = logit�1(���) (8)
logit (p) = ln� �1 � �� = �0 + �1�1 + ���� (9)
Furthermore, the outcome expressed in log-odds (Equation 9), which are the
natural logarithm of the odds ratio, can be plotted as a regression line that es-
timates the occurrence of an outcome y as a function of a certain predictor ��;and its cumulative predicted probability, i.e. the inverse of the logit function
(Equation 8), can be plotted as an s-shaped curve (29).
In logistic regression, the regression coe�cient �1 amounts to the estimated
increase of the outcome per unit increase in the predictor �1. As just mentioned,
this is expressed in log-odds, and it re�ects a linear relationship. However, odds
ratio—the exponential of log-odds—is more commonly used as an indicator of the
change in odds resulting from a unit change in the predictor and is also usually
177

Methodology
Figure 29: Example of the e�ect of a given predictor X on a categorical outcome y both as a linear
logit function (left) and as an s-shaped curve re�ecting cumulative predicted probability (right).
Adapted from Jaeger, 2008, p. 438.
reported as an indicator of e�ect size.
As Andy Field et al. concisely explain in their brilliant e�ort tomake statistics
clear and straightforward, “the odds of an event occurring are de�ned as the
probability of an event occurring divided by the probability of that event not
occurring” (Field et al., 2012, p. 320):
odds = � (success of event)� (no event)(10)
Thus, odds ratio re�ects this increase in odds resulting from a unit increase
in the predictor, so that if the value is greater than 1, the odds of the outcome
occurring increase as the predictor increases. Conversely, if the odds ratio is
inferior to 1, it indicates that, as the predictor increases, the odds of the outcome
occurring decrease (Field et al., 2012, p. 320):
�odds = odds after a unit change in the predictororiginal odds
(11)
As previously discussed, GLMMs are an extension of linearmixedmodels that
178

Methodology
allow to handle non-normal distributions. They include a link function relating
a linear predictor to a given type of outcome, and to a speci�c data distribution.
In the case of a binary outcome:
��,�,� � Binomial (��,�,���,�,�)��,�,� = ������1(��,�,��) (12)
In GLMMs the linear combination of �xed e�ects and random e�ects for
subjects and items is achieved by declaring a term Z containing the values of
the explanatory variables for the random e�ects, which are associated to the
random-e�ect vector b corresponding to their coe�cients. The latter term, b, is
characterised by a multivariate normal distribution, with mean 0 and a variance-
covariance matrix �:��,�,� � Binomial (��,�,���,�,�)logit (p) = �� + ��� � N (0,�) (13)
The parameters obtained for GLMMs must �t the data so that the resulting
model describes the data in an optimal way; however, di�erently from LMMs,
there are not perfect solutions for the exact optimisation in GLMMs. In order to
�nd the optimal parameters for the likelihood of data di�erent estimation meth-
ods can be applied (see Bolker et al., 2009, for details).
3.2.3 Parameters estimation and statistical inference
In the case of GLMMs, optimisation involves integrating the likelihoods of
estimated parameters over all possible values of the random e�ects. Due to the
179

Methodology
practical di�culties of carrying out such an optimisation, various ways have
been proposed to approximate the likelihood of GLMMs’ estimated parameters.
In their useful review of best practices for GLMMs, Bolker and his colleagues
(2009) point out the fundamental di�erence between two ways to achieve such
a goal: standard maximum likelihood (ML) and restricted maximum likelihood
(REML) estimation. In the �rst case, maximum likelihood in GLMMs “estimates
the standard deviations of the random e�ects assuming that the �xed-e�ect es-
timates are precisely correct”, while REML is “a variant that averages over some
of the uncertainty in the �xed-e�ect parameters” (Bolker et al., 2009, p. 128).
Maximum likelihood estimation in GLMMs is based on Fisher’s (1922) work,
which establishes that the best estimation of an unknown parameter is obtained
through the logarithm of the following likelihood function:
L(� |data, model) = L(�|� , �, binomial) = ������ (1 � �)��� (14)
where the likelihoodL of a particular numerical value of the unknown parameter� (expressed as p in the actual parameter estimation) can be obtained ‘given’ (this
is what the vertical line means) the empirical data (x observations in a sample n),
and an approximating binomial model. Thus, maximum likelihood estimation
would become log(L� |data, model).
Estimation methods for GLMMs were introduced in the 1990’s (Aitkin, 1996;
Breslow & Clayton, 1993; Schall, 1991, e.g.) based on maximum likelihood es-
timation. In a nutshell, they include: (a) analytic optimization of approxima-
tions of the true log-likelihood (called ‘quasi-log-likelihood’) such as: pseudo- and
penalised quasi-likelihood (PQL) (Schall, 1991), Gauss-Hermite quadrature (GHQ)
(Aitkin, 1996), and Laplace (Breslow & Clayton, 1993) and nested Laplace approx-
imation (Rue et al., 2009); as well as (b) numerical simulations such as Bayesian
180

Methodology
methods based on the Markov chain Monte Carlo (MCMC) technique (Zeger &
Karim, 1991) (Table 10).
Estimation Advantages Disadvantages Software – Function
PQL • Flexible • Likelihood inference inappropriate • SAS©– PROC GLIMMIX
• Widely implemented • Biased in random e�ects • GenStat© – GLMM
for large variances or small means • R (2018) – glmmPQL
– glmer
Laplace • It approximates the true likelihood • Slower and less �exible than PQL • SAS©– PROC GLIMMIX
rather than quasi-likelihood • R – glmer
• It allows the use of inference – glmm.admb
based on true likelihood • AD Model Builder (2012)
• HLM©
GHQ • More accurate than Laplace • Slower than Laplace • SAS©– PROC GLIMMIX
• Limited to 2 or 3 random e�ects • R – glmer
– glmmML
MCMC • Highly accurate • Very slow • WinBUGS (2000)
• Large number or random e�ects • Technically challenging • JAGS (2003)
• Accurate • Beyesian framework • R – MCMCpack
– MCMCglmm
• AD Model Builder
Table 10: Overview of di�erent estimation methods. Abbreviations: PQL (penalised quasi-
likelihood); GHQ (Gauss-Hermite quadrature); MCMC (Markov chain Monte Carlo). Adapted from
Bolker et al., 2009, p. 130.
The next step after estimating parameters in GLMMs involves carrying out
statistical inferences whether for hypothesis testing, evaluation of goodness-of-
�t among di�erent models, or model selection. According to Bolker et al. (2009,
pp. 131-132) the only test statistics appropriate for hypothesis testing in GLMMs
are the Wald Z, � 2, t, and F tests. One of the problems for choosing a test statistic
lies in assessing whether the model shows overdispersion, i.e. whether the vari-
ance of the response y is greater than the variance predicted by the model. This
is partly due to the fact that the mean and the variance in models dealing with
non-normal distributions are related and depend on the same parameter being
predicted through the independent vector. Thus, the uncertainty in the estimates
181

Methodology
as a result of overdispersion can be dealt with by Wald t and F tests, while Wald
Z and � 2 can only be applied to models without overdispersion.
Furthermore, the assessment of the goodness-of-�t of a statistical model can
be carried out by comparing two models (a null model against an alternative
model), often through the likelihood ratio (LR) test, which assesses the weight of
a single e�ect, whether �xed or random. The LR test computes to what extent
the likelihood of the alternative data is di�erent from that of the null model. It
yields a p-value that, compared to a critical value, allows to assess the statisti-
cal signi�cance of the predictor under study and to reject the null model. This
is achieved by comparing the �t of each model through the di�erence in their
respective log-likelihoods:
LR = 2(logLmodel null � logLmodel 1) = �2(logLmodel 1 � logLmodel null) (15)
In addition, since a LR test yields a p-value, it has been widely used in model
selection as well, via comparison of a series of nested models, in a procedure
known as stepwisemultiple regression (also ‘stepwisemodelling’). However, Bolker
et al. warn against the usage of the LR test in GLMMs3:
“Although widely used throughout statistics, the LR test is not
recommended for testing �xed e�ects in GLMMs, because it is unre-
liable for small to moderate sample sizes (note that LR tests on �xed
e�ects, or any comparison of models with di�erent �xed e�ects, also
require ML, rather than REML, estimates) [...]. We have found little
3 For an argument in favor of LR test in model selection using also non-nested models, see
Lewis et al., 2011.
182

Methodology
guidance and no concrete rules of thumb in the literature on this is-
sue, and would recommend against using the LR test for �xed e�ects
unless the total sample size and numbers of blocks are very large [...].
The LR test is generally appropriate for inference on random factors,
although corrections are needed [...]” (Bolker et al., 2009, p. 132).
Criticisms have suggested that model selection based on information criteria
(IC) is a better practice than stepwise modelling based on LR testing, which is not
limited to pairwise comparisons (e.g. Burnham & Anderson, 2002; Whittingham
et al., 2006).
3.2.4 Akaike Information Criterion and model selection
Information criteria are often preferred to LR testing in model selection. Ac-
cording to Whittingham and his colleagues (2006), some of the problems arising
in stepwise modelling include: biased parameters, model over-�tting, and incor-
rect signi�cance tests (false positive results, i.e. Type I errors). Instead, stepwise
modelling is replaced by model selection based on the principle of parsimony
(Burnham & Anderson, 2002), which aims at identifying a model with the min-
imum number of predictors that satis�es a certain criterion. In this case, the
minimal adequate model is that which best explains the data by containing only
predictors that are signi�cant at some speci�c probability level.
Procedures based on information criteria avoid the mentioned problems and
permit to compare a large number of models that do not necessarily have to
di�er in one factor, i.e. nested models. Model selection based on information
criteria, rather than estimating p-values, uses deviance as a measure of �t. Thus,
multiple models are ranked based on their di�erences in predictive power. For
183

Methodology
example, the Akaike Information Criterion (AIC) (Akaike, 1973)4 expresses the
goodness-of-�t based on the natural logarithm of the likelihood function of the
model:
AIC = 2� � 2logL( �� |�) (16)
where 2K corresponds to a ‘penalisation for complexity’, actually an asymptotic
bias-correction term based on the number of estimable parameters K (degrees
of freedom); and L( �� |�) is the likelihood at its maximum point for the estimated
model. Later on, Hurvich and Tsai (1989) introduced a correction for models
with a small sample size (AICc) through the introduction of n in the following
equation:
AICc = AIC + 2� (� + 1)� � � � 1 (17)
The fundamentals underlying AIC can be traced back to Kullback–Leibler’s
(1951) ‘distance’ between two models. Kullback and Leibler established that the
information loss I of a given model g when trying to approximate a certain phe-
nomenon, a full reality f, is de�ned by the integral:
� (� , �) = � � (�)log� � (�)�(� |�)� �� (18)
where � (� , �) is the distance from the model g to the perfect model or full real-
ity f. This equation can be extended to discrete distributions, such as Poisson,
4 For the mathematical details of the information criterion developed by Akaike, I mainly
follow the excellent review done by Burnham & Anderson, 2002, ch. 2.
184

Methodology
binomial, or multinomial, thus becoming:
� (� , �) = ���=1 �� � log������ (19)
where k are the possible outcomes of the underlying random variable, �� is thetrue probability of the ith outcome, and �� , the approximating probability distri-
bution, more precisely, the approximating model.
The novelty introduced by Akaike in the development of his information cri-
terion was the estimation of Kullback–Leibler’s distance between two models by
means of Fisher’s maximised log-likelihood (see Equation 14). Accordingly, the
computed AIC values are not relevant per se, unless several AIC values from a
set of models are compared. As Burnham and Anderson point out in their major
revision of AIC and other information criteria:
“It is not the absolute size of the AIC value, it is the relative val-
ues over the set of models considered, [...] and particularly the AIC
di�erences (��), that are important” (Burnham & Anderson, 2002, p.
63 and p.71).
The AIC value is only informative as a way to rank models. Therefore, model
selection usually proceeds by building a set of models di�ering in the progressive
introduction of factors relevant for, and justi�ed by, the research. Each model
candidate to be the model that best accounts for the data, i.e. the minimal ad-
equate model, shows di�erences in their AIC values (AICi) respecto to the lowest
AIC value in the set of models (AICmin). These di�erences are expressed as ��:�� = AICi � AICmin (20)
185

Methodology
Burnham andAnderson themselves explain the details ofmodel ranking through
di�erences in �� in the following terms:
“As an example, candidate models �1, �2, �3, and �4 have AIC
values of 3,400, 3,560, 3,380, and 3,415, respectively. Then one would
select model �3 as the best single model as the basis for inference
because �3 has the smallest AIC value. Because these values are on a
relative (interval) scale, one could subtract, say, 3,380 (the minimum
of the 4 values) from each AIC value and have the following rescaled
AIC values: 20, 180, 0, and 35. Of course, such rescaling does not
change the ranks of the models, nor the pairwise di�erences in the
AIC values [...]. We can say with considerable con�dence that in real
data analysis with several or more models and large sample size (say
n > 10 × K for the biggest model) a model having �� = 20, such as
model �4, would be a very poor approximating model for the data at
hand” (Burnham & Anderson, 2002, p. 71).
If ordered from smallest to largest, the�� values used in the example provided
by Burnham and Anderson would be ranked as 0, 20, 35, and 180. According to
this, the second �� value (i.e. 20), corresponding to the di�erence between model�1 andmodel �3 re�ects that some substantial variation is not expressed bymodel�3.Burnham and Anderson consider that models with �� > 10 can be omitted
from further consideration when compared to the model with the lowest AIC
value, the minimal adequate model (Table 11), and they brie�y conclude:
“The larger �� is, the less plausible it is that the �tted model��(� | ��) is the K[ullback]–L[eibler] bestmodel, given the data x” (Burnham
& Anderson, 2002, p. 70).
186

Methodology
�� Close to the AICmin
0-2 Yes
4-7 Considerably less
> 10 No
Table 11: References for �� values used in model selection when compared to the model with the
lowest AIC value. Adapted from Burnham & Anderson, 2002, p. 70.
Arnold (2010), however, warns that in cases where a model �� is within ��<2units respect to the AICmin model, it is possible that its additional uninforma-
tive parameters do not fairly represent a larger �� di�erence from the minimal
adequate model. Thus, it is possible to present erroneously a model �� as beingas good as the minimal adequate model. In order to avoid such a problem, he
suggests reporting and discussing all models within �� < 2 (Arnold, T. W., 2010)
(see § 3.2.4).
A step further in model selection is to quantify the plausibility of each model
as being the model that best accounts for the data. For this, two additional values
are computed: model likelihood and its normalisation as Akaike weights. In the
�rst case, the concept of likelihood of the parameters L(� |� , ��) (given both the
data and the model, as previously seen in Equation 14), can be extended for a
certain model given the observed data L(�� |�). The details are expressed in the
following equation, where ‘�’ means ‘proportional to’:
L(�� |�) � exp��12��� (21)
Model likelihood can be normalised through the assignment of so-calledAkaike
weights to each of themodels being compared, which is a useful and e�ectiveway
to interpret �� values. In such a case, the Akaike weight of each model, �� , canbe seen as the evidence for each of them to be the one that best accounts for the
187

Methodology
data. Overall, the computed likelihood of the set of models is normalised to add
up to 1. Thus, each particular �� depends on the entire set of models, i.e. if a
model is either added or dropped from the set, �� must be recalculated again for
the new set of models (Table 12).
Model �� L(�� |�) Akaike weight ��1 0 1 0.431
2 1.2 0.54881 0.237
3 1.9 0.38674 0.167
4 3.5 0.17377 0.075
5 4.1 0.12873 0.056
6 5.8 0.05502 0.024
7 7.3 0.02599 0.010
Table 12: Hypothetical ranking of a set of models given a certain data. Di�erences in AIC values are
expressed as �� . Akaike weights �� , which result from the normalisation of the likelihood of models,
o�ers evidence in favour of each model to be the one that best accounts for the data. Adapted from
Burnham & Anderson, 2002, p. 77.
The relative likelihood of model pairs, i.e. L(�� |�)/L(�� |�), or the equivalentratio of Akaike weights ��/�� , allows to compare two models from the initial set
of models, so that it “represent[s] the evidence about �tted models as to which
is better in a K[ullback]–L[eibler] information sense” (2002, p. 78). For example,
in the hypothetical ranking displayed in Table 12, the evidence ratio in favour
of model �1 respect to �2 is just about 2 (�1/�2 = 0.431/0.237 = 1.82). In other
words, the evidence ratio of model �1 means that it is 1.82 times more likely to
be the best model in Kullback and Leibler’s terms. Furthermore, evidence ratios
can also be expressed in normalised probability through the expression:
ER = �2�1 + �2 , (22)
188

Methodology
which in the example provided above between model �1 and model �2 would be
equal to 0.645 (64.5%).
Practical challenges of AIC
Despite the insightful exposition made by Burnham and Anderson (2002)
into the fundamentals of the Akaike Information Criterion, researchers are often
faced with some common practical obstacles when modelling using an infor-
mation theoretic approach. Grueber et al. (2011), for example, address some of
the di�culties that may arise using AIC and suggest some solutions. However,
even if Grueber et al.’s paper is mainly concerned with issues encountered in
biological and evolutionary statistical modelling, their contribution is intended
to encompass other �elds also applying an IT approach.
Firstly, the actual predictors used in the model, which logically may include
interactions and polynomial terms must be chosen from the possible input vari-
ables to include, i.e. the raw parameters as they are measured. For this, ir order
to avoid overparameterization, only predictors must be chosen that are justi�ed
by previous research or by the speci�c questions to be addressed. Thus, although
there is a large number of second- and higher-order interactions, they should be
included into the predictors set only if there is a priori reason for it. Addition-
ally, in line with Bates et al. (2015a), Grueber and her colleagues recommend
“attempting to �t both random intercepts and slopes unless the model does not
converge, in which case �tting a random intercept only is preferable to not in-
cluding the random variable at all” (Grueber et al., 2011, p. 703).
Secondly, after declaring predictors in the model, a set of models is created
by deriving all possible submodels focusing on the predictors of interest, but not
necessarily including all of them. In order to avoid non-convergence errors, it is
advisable to avoid overparameterizing the initial global model.
189

Methodology
Thirdly, a common problem encountered when models are ranked according
to their AIC value is that there is no single best model. In this case, several of
them may be within 2 AIC points (Burnham & Anderson, 2002)5 from the top-
ranked model, di�ering by a small amount in their goodness-of-�t. Grueber and
her colleagues then suggest averaging the subset of models within this cut-o� of
2 AIC points. As a result, it may happen that a particular factor of interest is not
present within this top model set, in which case they state that:
“Solutions in such cases are to either conclude that there is little
evidence that the factor of interest explains variation in the response
variable or extend the cut-o� criteria to include at least one model
that contains the factor of interest [...]. The latter solution may re-
sult in very large model sets, and/or inconsistent cut-o� criteria for
di�erent response variables” (Grueber et al., 2011, p. 704).
Despite this, Burnham and Anderson remind that models that are not truly
competitive with the best model and include predictors with poor explanatory
power do appear within 2 AIC points of the model with the best goodness-of-�t:
“[These models] should be examined to see whether they di�er
from the best model by 1 parameter and have essentially the same
values of the maximized log-likelihood as the best model. In this
case, the larger model is not really supported or competitive, but
rather is ‘close’ only because it adds 1 parameter and therefore will
be within 2 �� units, even though the �t, as measured by the log-
likelihood value, is not improved” (Burnham & Anderson, 2002, p.
454).
5 Other authors set this cut-o� criterion to 6 AIC points (Richards, 2008).
190

Methodology
Furthermore, Arnold (2010), in his turn, insists that in such a case:
“If a truly limited set of a priori models are considered from the
outset, then it probably makes sense to report and discuss all models,
including those with one additional but uninformative parameter.
However, the reporting should not be that these models are compet-
itive with the higher ranked models, but rather that the additional
variable(s) received little to no support, depending on the level of re-
duction in deviance versus the top-supported model” (Arnold, T. W.,
2010, p. 1177)
And he goes on to state that:
“When a sequential modeling approach is used to evaluate a large
suite of potential models, as is often done in exploratory context after
�rst considering a more limited set of a priori models, some authors
have adopted an a priori modeling approach that allows models with
uninformative parameters to be discarded without further consider-
ation” (2010, p. 1177)
In this sense, these works provide valuable insights into the role played by
information criteria inmodel selection that will serve as a guideline for the statis-
tical analyses conducted in the experimental part of this research. Most notably,
the importance of not including second- and higher-order interactions unless
there is a priori reason for it, and the additional reporting of a second-best model
when it is found to lie within 2 �-points from the minimal adequate model.
3.2.5 Summary
The traditional use of di�erent types of analyses of variance (ANOVAs) in
psycholinguistics has experienced a paradigm change over the last decades, and
191

Methodology
linear mixed-e�ects models (LMMs) have taken over as the main statistical ana-
lysis conducted, especially in cases of repeated measures, unbalanced designs,
and categorical data (e.g. Gries, 2015; Jaeger, 2008). Linear mixed models are just
standard linear regression models that allow to declare a set of �xed e�ects—
coe�cients of predictors not grouped by any factor—together with random ef-
fects capturing stochastic variability and non-independence due to repeatedmeas-
ures, i.e. coe�cients grouped by a certain factor and therefore estimated with
partial pooling.
Most common random e�ects include by-subject and by-item random e�ects
to deal with the correlation of responses. Thus, random e�ects allow each subject
and item to have their own intercept value di�ering from the grand mean, the
model intercept. This results in so-called random-intercept models. In addition,
similar to the deviation from the grand mean corresponding to the regression
coe�cient �0, each subject or item may also have di�erent slope coe�cients ��for the e�ect of a given predictor X i. This is what lies at the core of random-slope
models.
Despite the fact that it has been suggested that random e�ects should be fully
declared by including slopes for all �xed e�ects (Barr et al., 2013), it has been
criticised on the grounds that this often leads to overspecifying the structure of
random e�ects, and it often results in convergence failures, i.e. the impossibility
to estimate parameters within a reasonable number of iterations) (Bates et al.,
2015a).
LMMs are extended to deal with non-normal distributions, such as poission
or binomial distributions. In such a case, LMMs are often referred to as gener-
alised linear mixed models (GLMMs). The estimation of parameters for GLMMs
must �t the data so that the resulting model describes the data in an optimal
way. Unlike LMMs, there are not perfect solutions for the exact optimisation
192

Methodology
in GLMMs, and di�erent estimation methods can be applied. Most are based
on Fisher’s (1922) maximum likelihood, and they have di�erent advantages and
disadvantages.
Traditionally, the goodness-of-�t of (G)LMMs have been tested through the
likelihood ratio (LR) test. In the LR test, the �tted model is compared to a so-
called null model to assess the weight of a single e�ect, whether �xed or random,
and the resulting p-value allows to assess its statistical signi�cance. However, it
has been warned against this procedure (Bolker et al., 2009), and some of the
problems associated to LR tests are biased parameters, model over-�tting, and
incorrect signi�cance tests (Burnham & Anderson, 2002).
A better practice based on information criteria (IC) has been suggested, which
in addition is not restricted to pairwise comparisons with models di�ering in just
one factor. Procedures based on information criteria avoid the mentioned prob-
lems and permit to compare a large number of models. The Akaike Information
Criterion (AIC) (Akaike, 1973), for example, allows to compare a set of mod-
els based on the number of estimable parameters of each model. The grounds
of (AIC) goes back to Kullback–Leibler’s (1951) ‘distance’ between two models.
Thus, the AIC value is only informative as a way to rank models, and model
selection usually proceeds by building a set of models di�ering in the progres-
sive introduction of factors relevant for, and justi�ed by, the research. Finally,
AIC di�erences among models are expressed as �� values, which in turn can be
standardised as Akaike weights �� , i.e. the evidence for each model to be the one
that best accounts for the data.
The practical obstacles that might arise when using AIC for model selection
have been described on several occasions (e.g. Arnold, T. W., 2010; Burnham &
Anderson, 2002; Grueber et al., 2011): it is important to declare an initial model
containing a set of predictors justi�ed by the research questions or by previous
193

Methodology
studies; it is equally important to avoid overparameterization in the subset of
models built from the initial global model; and �nally, models within 2AIC points
from the top-ranked model should be also considered and reported or potentially
averaged with the best ranked-model.
3.3 Methodology used in this study
3.3.1 Rationale
After having reviewed in detail the literature, a rationale logically emerges
from the shortcomings of previous methodological approaches (§ 3.1.2). In order
to overcome such limitations, a di�erent methodology is applied using spontane-
ous speech in Castilian Spanish, aimed at addressing the two research questions
addressed in this study: (1) how the di�erent acoustic correlates of prominence
relate to one another and to gestures, and (2) how gestures contribute to the
perception of prominence.
On the one hand, results obtained so far using animated agents and elicited
gestures in controlled experimental settings, although enlightening, have been
limited in their explanatory potential. Some of the problems associated to both
approaches lie in the di�culty of eliciting spontaneous gestures while keeping
experimental control over the acoustic cues of prominence. Additionally, the
range of body movements previously analysed have mostly been restricted to
head and eyebrows.
On the other hand, and probably due to the methodological shortcomings
previously discussed, the relation of visual cues—as in the gestures of hands,
eyebrows, and head—to the di�erent acoustic correlates of prominence has not
been fully addressed yet. This is in line with the preponderant role tradition-
ally given to f 0, where, for example, the relation between eyebrow raise and f 0
194

Methodology
has been largely studied. The lesser importance given to intensity and duration
on the one hand, and the still controversial interaction of the di�erent acous-
tic correlates of prominence on the other hand, have prevented from analysing
how f 0, intensity, and duration relate both to one another and to gestures in the
perception of prominence.
Additionally, Castilian Spanish is the language of research in this study, dif-
ferently from previous research, which has focused on several other languages
(e.g. Dohen & Lœvenbruck, 2009, for French; Granström et al., 1999; House et al.,
2001, for Swedish; Krahmer & Swerts, 2007, for Dutch; Prieto et al., 2015, for
Catalan).
The use of spontaneous speech in the study of prominence is not new. Both
Ambrazaitis and House (2017) and Swerts and Krahmer (2010, experiment 1: ‘au-
ditory mark-up’) have resorted to recordings of TV newsreaders, although their
research questions were di�erent from one another and also di�erent from those
addressed here. The former researchers analysed eyebrow and head movements
in their relation to information structure and pitch accent distribution; the latter
studied prominence perception in the auditory modality.
Krahmer and Swerts (2007, p. 411) themselves had previously noted the ne-
cessity for spontaneous speech material to complement current research in the
study of the multimodal perception of prominence (§ 2.3.8.4). The research lying
at the origin of this dissertation is partly based on Krahmer and Swerts’s call
for spontaneous speech. Thus, the use of spontaneous speech material in this
research is intended to overcome the experimental paradigm in which one stim-
ulus typically contains one gesture, which is clearly very far from the natural
interweaving of gestures performed with hands, head, and eyebrows found in
everyday spoken language.
Apart from TV newsreaders, audiovisual recordings from reality television—
195

Methodology
especially from television talent shows—are another possible source of sponta-
neous speech stimuli. Spontaneous speech from reality television has already
been used, with a high degree of ecological validity, in discourse analysis, prag-
matic studies, and linguistic variation (Bednarek, 2013; Eberhardt &Downs, 2015;
Sonderegger, 2012). In this research, it is argued that within reality television,
some television talent shows (e.g. Factor X in UK, Operación Triunfo in Spain),
di�erently from TV newsreaders or interviews conducted on TV sets, o�er an
optimal source of audiovisual speech material: contestants of talent shows are
likely to speak and act more naturally over the long periods of time while they
are recorded with hidden cameras than other speakers in more conventional re-
cording sessions; their conversations have a high degree of spontaneity; and the
amount of recorded material is large and easily accessible.
Finally, as Dohen and Lœvenbruck (2009) noted, a possible way of explor-
ing audiovisual prosody in prominence perception involves creating audiovi-
sual mismatches, i.e. incongruent stimuli in which the audio and visual cues
convey contradictory information, as previously done by Swerts and Krahmer
(2004; 2008). Yet, Krahmer and Swerts (2007) expressed skepticism about the
possibilities o�ered by spontaneous speech stimuli in a mismatch paradigm. In
their turn, Dohen and Lœvenbruck, studying audiovisual prominence percep-
tion, opted for designing auditorily degraded prosodic stimuli and, consequently,
elicited whispered speech in an experimental setting. This method proved useful
in their study and paved the way for similar studies using auditorily degraded
stimuli.
In this research, di�erently from both Krahmer and Swerts and Dohen and
Lœvenbruck, but following the same logic pointed out by the latter researchers,
auditorily degraded stimuli are created and administered in three experimental
conditions corresponding to the neutralisation of the acoustic correlates of prom-
196

Methodology
inence: f 0, intensity, and both f 0 and intensity. The multimodal perception of
acoustic prominence is analysed in two di�erent stages (Experiment I § 4 and
Experiment II § 5) following Streefkerk’s (2002) research by means of a binary
prominence-marking task conducted at word level.
3.3.2 Speech material
The speech materials, publicly available on the website youtube.com, were
extracted from audiovisual recordings captured with hidden cameras in the tal-
ent show Operación Triunfo (1st edition). The recordings show the contestants
of the talent show engaged in spontaneous conversation. From these TV re-
cordings, a small corpus of 50 videoclips was created. The criteria for the se-
lection was that each videoclip showed one single speaker uttering a sentence
without being interrupted while gesticulating with either hands, eyebrows, or
head, or with several of these body parts simultaneously. Thus, from these cri-
teria the collected corpus re�ect very well the natural interweaving of gestures
performed with hands, head, and eyebrows typically found in everyday spoken
language. Actually, it was relatively di�cult to �nd utterances containing only
one or two distinct gestures performed with one articulator. Conversely, speak-
ers were found to be engaged in conversation without needing to gesticulate and
then they would suddenly engage in abundant gesticulation while uttering full
meaningful sentences. This last example was the basis for our corpus. Therefore,
the speaker in each videoclip is always seen throughout the utterance perform-
ing some gesture in any of its phases at all times, so that and their gestures follow
each other in a continuous fashion. It is in this sense that the corpus could be de-
scribed as a ‘hypergestural’, where hardly any words occur without the presence
of a gesture.
Out of these 50 videoclips, 30 were manipulated and used as target sentences,
197
Methodology
10 were used as stimuli without any manipulation, and the remaining 10 were
used as trial sentences for participants to get familiar with the experimental task
(Appendix A). Subsequently, the 30 audio tracks of the videoclips used as target
sentences were extracted, and their speech signal was manipulated with PRAAT
(Boersma & Weenink, 2018)6. The audio tracks resulting from the manipulation
were used to replace the original speech signal in the videoclips by means of the
iMovie© software of Apple©. The manipulation of the stimuli allowed to present
them to participants in three conditions and in two modalities: audio-only and
audiovisual.
The speech material for Experiment I were the 30 sentences, out of the 50
sentences collected in this small corpus, that corresponded to 10 speakers (5 men,
5 women) that uttered a total of 531 words. Sentences ranged between 9 and 32
words (M = 17.7, SD = 5.83), with a duration between 2.51 and 9.49 seconds (M =
4.60, SD = 1.58). The speech rate was calculated for each sentence as the relation
between words and seconds (M = 4.00 words/sec, SD = 1.15), with a minimum of
1.15 and a maximum of 6.4 words per second (Appendix A1).
For Experiment II, however, 13 sentences were selected from the initial cor-
pus. Out of these, four were manipulated and used as target sentences. These
four sentences were chosen so that there were one female and one male speaker,
each uttering two sentences—one shorter and one longer—that were equivalent
for both speakers in length and speech rate. The four sentences ranged between 9
and 18 words (M =13.5, SD = 3.69), with a duration between 2.51 and 3.38 seconds
(M = 2.81, SD = 0.38). The mean speech rate was 4.68 words per second (SD =
0.92) (Appendix B2). Out of the 13 sentences, 4 were used for instructions and
trials, 2 were non-manipulated stimuli, and the remaining 3 were used as �ller
sentences.
6 This material is publicly available at http://dx.doi.org/10.17632/jkvftnpr5j.1
198
Methodology
3.3.3 Stimuli creation
Following the idea of Dohen and Lœvenbruck (2009) of using degraded speech
as an alternative to a mismatch paradigm, the acoustic correlates of prominence
were manipulated to neutralise the prominence-lending properties of both f 0
and intensity. This allows to analyse how the resulting available cues relate to
each other in the perception of prominence. The available cues in each condition
are: (0) all acoustic cues—control condition; (1) intensity and duration; (2) f 0 and
duration; (3) only duration.
The manipulation of stimuli, conducted with PRAAT, was done in the follow-
ing way: in the �rst experimental condition, f 0 was smoothed for each speaker
within a frequency range of 20 Hz in the intonation curve in Experiment I, which
corresponded to an average of 2.22 semitones (ST) (SD = 0.68 ST) for all sentences.
In both experiments, the resulting smoothed intonation curve was resynthesised
using linear predictive coding (LPC) (Figure 30).
Di�erently, in Experiment II, the manipulation of the intonation curve was
made using a semitone scale instead. This seemed more adequate, since the per-
ception of pitch intervals is not linear but logarithmic; for example, the di�erence
between 100 and 200 Hz is not the same as that between 150 and 300 Hz, i.e. twice
the frequency does not correspond to a twofold increase in pitch. Nevertheless,
a precise standard of just noticeable di�erences (JNDs) for the perception of f 0 is
not agreed upon. For example, one study with disyllabic structures [baba] de-
termined that 2 ST is the threshold beyond which it is di�cult not to perceive
intonation di�erences (Pamies et al., 2002). However, ’t Hart (1981) raises this
threshold to 3 ST, while Rietveld and Gussenhoven (1985) reduce it to 1.5 ST.
For the neutralization of f 0 in Experiment II, following Pamies et al. (2002), the
intonation curve was strictly kept within a maximum di�erence of 2 ST.
199

Methodology
Figu
re30:E
xampleof
f 0man
ipulationforo
neof
thesentencesinEx
perim
entI,showingthefund
amentalfrequ
ency
ofboth:the
originalspeech
signa
l
(dashedlin
e)an
daftern
eutralizationwith
ina20
Hzrange(solid
line),w
hich
inthisexam
plecorrespond
edto
2.05
ST.
200

Methodology
3.3.4 Participants
The sample size of participants in Experiment I was N = 12, and they were
recruited among university students in Madrid. In an attempt to strike a gender
balance, 6 male and 6 female participants were selected. None reported having
any visual or hearing impairment. In Experiment II, due to the between-subjects
design, the initial sample size of participants increased to N = 320, from which
only 240—68 men and 172 women—met a certain set of criteria and whose re-
sponses were �nally selected. In this case, participants were recruited via social
media and several Internet forums. After conducting the online test, information
about them was collected—such as place of birth, country of residence, mother
tongue, age, and musical training. Additionally, in both experiments two trained
listeners with academic background in phonetics independently also provided
marks of prominence for both modalities relying on all acoustic cues of promi-
nence, which served as a ‘gold standard’ against which to compare the responses
given by participants. Speci�c details about participants in each experiment will
be provided in the respective sections (§ 4.2.1 and § 5.2.1).
Additionally, the two experiments on prominence perception of this research
have taken into consideration studies revealing important perceptive di�erences
resulting from the musical competence of participants. For example, neuropsy-
chological research has observed that both pitch contour and rhythmic grouping
are aspects shared by both music and speech (Patel et al., 1998). Similarly, it
has been reported a transfer of abilities between music and linguistic prosody
for perceiving pitch and rhythmic variations (Thompson et al., 2004). Further-
more, several studies have explored the extent to which musical training might
a�ect prosody perception. For example, Hutka et al. (2015) conducted a study
using EEG and determined that pitch discrimination was enhanced in trained
201

Methodology
musicians as well as in speakers of tone languages when compared to native
English-speaking non-musicians. Similar results were obtained by e.g. Liang et
al. (2016) and Zioga et al. (2016).
Therefore, information on the musical competence of participants was col-
lected in both experiments. In Experiment I, as a pilot study, the small sample
size, N = 12, did not include any participants having musical training. Con-
versely, in Experiment II, which had a much larger sample size, N = 240, the
musical training of participants was included as a variable in the statistical mod-
els.
3.3.5 Gesture annotation
As for gestures, all sentences were annotated with ELAN (Brugman & Rus-
sel, 2004) according to the body part involved in the production of the ges-
ture, both separately (hand, eyebrows, and head) and in combination (hand-
eyebrows, hand-head, eyebrows-head, hand-eyebrows-head) (second tier in Fig-
ure 31). Since it was considered irrelevant in this research, any further categor-
isation of gestures as beats, deictic, iconic, metaphoric, etc. was omitted Rather,
their di�erent phases were annotated: preparation, stroke, apex, hold, recoil, and
retraction (third tier in Figure 31).
The annotation of the di�erent gesture phases presented some di�culties,
especially when gestures included several articulators. Thus, when the gesture
was performed with hands together with any other articulator, the annotation
followed the most visible movement of the hands, since the second articulator—
or possibly the remaining two articulators, i.e. head and eyebrows—hardly pre-
sented any preparation or stroke phase, but the gesture was sudden and its apex
coincided with that of the apex phase of the hand gesture. Alternatively, the
annotation of a gesture performed uniquely with either head or eyebrows could
202

Methodology
Figure 31: Sample screen of ELAN annotation. The still shows the speaker on the left performing an
eyebrow raise in its e�ort peak (apex). The cursor position in the bottom right corner shows how the
apex phase is embedded within the stroke of a gesture performed as an eyebrow raise. The four tiers
used in annotation appear at the bottom: TextGrid with syllabic segmentation, gesture articulator,
gesture phase, and apex.
include the preparation and stroke phases with the words they co-occurred with
(Figure 31), although in most cases these two phases were relatively short and
stretched over a small fraction of an uttered word. In this sense, for example, if a
head nod or an eyebrow raise included a short preparation followed by a stroke
co-occurring both in the same word, it was preferred to annotate the perceptu-
ally more relevant phase of the gesture—i.e. apex instead of stroke, and stroke
instead of preparation.
As previously discussed, both strokes and apexes of gestures align with dif-
ferent intonational units (Esteve-Gibert & Prieto, 2013; Kendon, 1972; Loehr,
2012). The annotation of gestures into their di�erent phases included prepara-
tion, stroke, apex, post-stroke hold (or simply ‘hold’), recoil, and retraction (see
§ 2.3.4.5). The segmentation of gesture into its di�erent phases aims at better
203

Methodology
understanding the role of each of them in the perception of audiovisual prom-
inence, especially strokes, corresponding to the central unit of the gesture and
spanning over an interval of time (Kendon, 1972, 1980); and apexes, the peak ef-
fort within the stroke, corresponding to an instant in time (e.g. Loehr, 2004, 2007)
(fourth tier in Figure 31).
3.3.6 Data analysis
The data collected in this researchwas �rstly annotated acoustically and visu-
ally. The acoustic measurements are conducted in all sentences for all acoustic
correlates of prominence: (a) maximum f 0 of stressed vowels—on some occa-
sions, the vowel of the adjacent syllable due to f 0 shift, as previously noted (e.g.
Garrido et al., 1993, 1995); (b) mean intensity of the stressed vowel; and (c) mean
duration of stressed syllable, in which all segments of the syllable are taken into
account (Face, 2000). In Experiment II, next to these acoustic measures, spec-
tral balance was also added, as the di�erence between the amplitude of the �rst
harmonic and the second harmonic, H1–H27 (e.g. Heldner, 2003) (Table 13).
Acoustic correlate Acoustic measure Measure unit Experiment
Fundamental frequency (f 0) Max. f 0 in stressed vowel(or vowel in adjacent syllable)
Hertz (Hz) 1 – 2
IntensityMean intensity of stressed vowel Decibels (dB) 1 – 2
Spectral balance: H1–H2 Decibels (dB) 2
Duration Mean duration of stressed syllable Seconds (s) 1 – 2
Table 13: Acoustic measures conducted for the acoustic correlates of prominence in both Experiment
I and Experiment II.
In each experiment the results obtained from the data are then �rstly analysed
7 I thank Dr. José María Lahoz Bengoechea for his helpful insights on this point and his
generosity in sharing his PRAAT scripts.
204

Methodology
in a Descriptive statistics section (4.3.1 and § 5.3.1). This provides a �rst approx-
imation to the results and allows to understand how the marks of prominence
given by participants are distributed. After such an initial description, an section
devoted to Inferential statistics follows in each experiment (§ 4.3.2 and § 5.3.2).
Participants’ prominence marks are �rst assessed inferentially in their degree of
agreement through averaged Cohen’s kappa (1960) for all pairs of participants,
as done in previous studies (e.g. Buhmann et al., 2002; Streefkerk, 2002). Co-
hen’s kappa yields a coe�cient for the agreement of a pair of raters taking into
account agreements by chance. Alternatively, some authors have used Fleiss’s
kappa (1971), which goes beyond pairwise comparisons and provides a single
value for agreement among more than two raters (e.g. Mo, 2008a; Cole et al.,
2010). In this research, the Cohen’s kappa statistic is preferred, since the re-
sponses of two trained listeners relying on all acoustic cues of prominence serve
as a ‘gold standard’ in both experiments. Their marks are compared pairwise to
those of each participant across experimental conditions and modalities. Thus,
at a �rst stage, mean Cohen’s kappa is computed separately for participants and
for the two trained listeners. Then, Cohen’s kappa is calculated comparing the
responses of each participant to those of the trained listeners in order to assess
how they deviate from this ‘gold standard’. The resulting mean is o�ered and
compared to the value calculated previously for only participants.
Subsequently, as explained above (§ 3.2.2), generalised linear mixed models
(GLMMs) are computed for a certain number of variables predicting prominence
perception. The reasons for avoiding a traditional analysis of variance (ANOVA)
have been previously stated (§ 3.2.1). In both experiments, the binary outcome
of the dependent variable y (prominent vs. non-prominent) is estimated through
a logit link function. For this, statistical modelling is conducted using the open
source statistical software R (2018)—and its integrated development environment
205

Methodology
(IDE), RStudio (2016)—using the function glmer from the lme4 package (Bates
et al., 2015b). It is worth mentioning that, in the statistical models, the di�er-
ent gesture phases were introduced as separate variables using dummy coding,
rather than as di�erent levels of one single variable. This was done so partly due
to the absence of a reliable baseline against which to compare each gesture phase,
since very few words in the corpus were uttered in the absence of a gesture. (In
this sense, as just mentioned (§ 3.3.2), the sentences uttered by speakers in the
corpus were selected because they had a complete sense and were accompan-
ied by an intertwined succession of gestures, which resulted in very few words
co-occurring with no gestures). Additionally, by introducing each gesture phase
as a separate variable, it was possible to compare the e�ect that the presence of
each of the phases had in relation to their absence.
The use of GLMMs allows to account for the e�ects of �xed and random pre-
dictors on the binary outcome, which are estimated throughmaximum likelihood
method (Laplace Approximation). The di�erent �tted models are then compared
in a model selection procedure using Akaike information criterion (AIC) (Akaike,
1973), as explained above (§ 3.2.4). Model selection by means of AIC permits
to establish the model, from a set of estimated models, that best accounts for
the data; this ‘minimal adequate model’ is the model that cannot be improved
by either adding or dropping any predictor. AIC, di�erently from traditional p-
values, simply provides an ordinal value assessing the quality of models respect
to their complexity, thus lacking any meaning of its own except as a way to rank
models form a set. Finally, details of the respective minimal adequate model re-
sulting from the selection are discussed.
206

Methodology
3.3.7 Summary
The methodology applied in this research intends to overcome some of the
limitations inherent to methodologies used in previous studies in order to ad-
dress the questions of how the di�erent acoustic correlates of prominence relate
to one another and to gestures, and how gestures contribute to the perception
of prominence. For this, spontaneous speech samples were collected from the
talent show Operación Triunfo (1st edition) that were publicly available on the
website youtube.com, and which show close shots of speakers engaged in spon-
taneous conversations. From these TV recordings a small corpus of 50 videoclips
was created. In the Experiment I, 30 of these videoclips were manipulated to be
used as target sentences, while 10 were used as non-manipulated stimuli and the
remaining 10, as trial sentences. In Experiment II, only 13 sentences were se-
lected from this initial corpus: 4 were manipulated and used as target sentences,
4 were used for instructions and trials, 2 were non-manipulated stimuli, and the
remaining 3 were used as �ller sentences for an extra experimental task di�erent
from prominence marking.
The speech signal of target sentenceswasmanipulated to reduce the prominence-
lending properties of the f 0 and intensity, so that the available cues in each con-
dition were: (0) all acoustic cues—control condition; (1) intensity and duration;
(2) f 0 and duration; (3) only duration. The manipulation of intensity involved
smoothing intensity to a constant value of 69 dB, and smoothing f 0 within a
range of 20 Hz in Experiment I and within a range of 2 semitones in Experiment
II.
The sample size of participants was di�erent in each experiment. In Exper-
iment I, as a pilot study, participants added up to 12 individuals (6 men and 6
women), while in Experiment II the sample size added up to 320 individuals, out
207

Methodology
of which only 240 were selected (68 men and 172 women). In both experiments,
information about participants was collected including place of birth, country
of residence, mother tongue, age, and musical training. Additionally, in both
experiments two trained listeners with academic background in phonetics in-
dependently provided marks of prominence for both modalities relying on all
acoustic cues of prominence. This served as a ‘gold standard’ against which to
compare the responses given by participants.
All gestures were annotated according to the body part involved in their pro-
duction both separately (hands, eyebrows, and head) and in combination, as well
as as their di�erent phases: preparation, stroke, apex, hold, recoil, and retrac-
tion. Similarly, acoustic measurements for all acoustic correlates of prominence
in each sentence of the corpus were conducted as: (a) maximum f 0 of stressed
vowels—on some occasions, the vowel of the adjacent syllable due to f 0 shift; (b)
mean intensity of the stressed vowel; and (c) mean duration of stressed syllable.
In Experiment II, next to these acoustic measures, spectral balance was also ad-
ded, as the di�erence between the amplitude of the �rst harmonic and the second
harmonic, H1–H2.
The results were reported in a Descriptive statistics section, followed by a In-
ferential statistics section, in which generalised linear mixed models (GLMMs)
were �rst estimated and then compared through the Akaike Information Cri-
terion. Finally, the minimal adequate model from the set of estimated models
was assessed in order to determine the weight of each predictor variable in pre-
dicting the marks of prominence given by participants.
208

Experiment I
4.1 Introduction
In a �rst attempt to address the two questions of this research (Question 1
and Question 2), a pilot study on the multimodal perception of prominence in
Spanish1 was initially envisaged.
Here a new methodology is presented, which uses spontaneous speech as a
way to overcome some of the limitations of previous methodological approaches
(§ 3.1). As stated there, the shortcomings of previous methods make it di�cult
to address how the di�erent acoustic correlates of prominence relate to one an-
other and also to gestures. On the one hand, studies on prominence perception
with animated agents in the form of talking heads have limited themselves to
reproduce eyebrow and head movements but have excluded hand movements
(e.g. House et al., 2001; Prieto et al., 2011). On the other hand, stimuli used in ex-
perimental settings have mostly been created through audiovisual recordings in
a controlled environment (e.g. Dohen & Lœvenbruck, 2009; Krahmer & Swerts,
2007). For example, the participants of Krahmer and Swerts’ study were instruc-
ted to utter a short sentence and produce concomitantly a quick visual gesture
1 This section is to appear with some minor changes in Jiménez-Bravo and Marrero (submit-
ted).
209

Experiment I
with either hand, eyebrows, or head on a speci�c target word. Participants were
also allowed to train until they felt they could not improve the realisation of the
gesture accompanying the uttered sentence. The audiovisual recordings so ob-
tained were later used as stimuli in an experiment on the e�ect of gestures to
prominence perception.
Di�erently from this practice, in this research spontaneous speech samples
are used as stimuli in an experiment on multimodal prominence perception. In
this sense, the goal of this study was precisely to assess the validity of the de-
scribed methodology and obtain some initial results. For this, a small corpus was
created with videoclips extracted from a Spanish talent show, and stimuli were
neutralised in the prominence-lending properties of their acoustic cues. In this
pilot study, stimuli were administered to 12 naïve listeners under three conditions
in two modalities, i.e. audio-only and audiovisual. Participants marked words
for binary prominence at word level (prominent vs. non-prominent). Addition-
ally, two trained listeners with academic background in phonetics independently
provided marks for both modalities relying on all acoustic cues of prominence,
which were used as a control condition. The obtained responses were modelled
in R using generalised linear mixed models (GLMMs) through a logit link func-
tion with di�erent �xed and random e�ects. The resulting models were then
compared using the Akaike Information Criterion (AIC) (Akaike, 1973). Finally
the minimal adequate model was summarised in order to establish the e�ects of
the tested variables on the prominence-marking task.
210

Experiment I
4.2 Methodology
4.2.1 Participants
Twelve naïve listeners rated a total of 6372 words available for marking (531
words per participant). All were Spanish native speakers (6 men and 6 women,
Mage = 21.5 years, SD = 2.31) from Madrid, and none of them had formal musical
education (§ 3.3.4). They were �nancially compensated with 10€, and all were
unaware of the purpose of the study. Additionally, two trained listeners with
academic background in phonetics also marked the same stimuli as participants
and relied on all non-manipulated acoustic cues of prominence.
4.2.2 Stimuli
The recordings that served as the source of speech samples showed the con-
testants of the television talent show Operación Triunfo (1st edition) speaking
spontaneously with each other (§ 3.3.2). From these recordings a small corpus of
50 videoclips was created. Stimuli included 30 manipulated videoclips2, 10 non-
manipulated videoclips, and the remaining 10 were used for instructions and tri-
als. In each videoclip a single speaker was visible while uttering a sentence in a
spontaneous conversation and gesturing with either hands, head, or face, or with
several of these articulators simultaneously. As previously mentioned (§ 3.3.5),
the basis for our corpus was examples of speakers engaged in active gesturing
while uttering full meaningful sentences. So the speaker in each videoclip is al-
ways seen throughout the utterance performing some gesture in any of its phases
at all times, so that and their gestures follow each other in a continuous fashion.
It is in this sense that the corpus could be described as a ‘hypergestural’, where
2 This material is publicly available at http://dx.doi.org/10.17632/jkvftnpr5j.1
211

Experiment I
hardly any words occur without the presence of a gesture.
As previously discussed, both strokes and apexes of gestures align with dif-
ferent intonational units (Esteve-Gibert & Prieto, 2013; Kendon, 1972; Loehr,
2012). The annotation of gestures into their di�erent phases included prepara-
tion, stroke, apex, post-stroke hold (or simply ‘hold’), recoil, and retraction (see
§ 2.3.4.5). The segmentation of gesture into its di�erent phases aims at better un-
derstanding the role of each of them in the perception of audiovisual prominence,
especially strokes, corresponding to the central unit of the gesture and spanning
over an interval of time (Kendon, 1972, 1980); and apexes, the peak e�ort within
the stroke, corresponding to an instant in time (e.g. Loehr, 2004, 2007) (fourth
tier in Figure 31). The annotation of the di�erent gesture phases presented some
di�culties, especially when gestures included several articulators (see § 3.3.5 and
Figure 31).
In the �rst experimental condition (C1), the acoustic cue of f 0 was neutral-
ised, and intensity ranged between 50-82 dB (M = 71.20, SD = 6.01) for stressed
vowels, while duration ranged between 0.023-0.454 seconds for stressed syllables
(M = 0.120, SD = 0.061). In the second experimental condition (C2), intensity was
homogenised at an average of 69 dB (SD = 0.11 dB) for all speakers, while f 0
ranged between 93-344 Hz (M = 194.65, SD = 48.89) for maximum f 0 in stressed
vowels (or the vowel in the adjacent syllable), and duration kept the same values
as in C1. In the third condition (C3), both f 0 and intensity were neutralised with
the same criteria as in C1 and C2, while duration maintained the same values as
in C1. In each of the conditions, the acoustic cues available to participants were
intensity and duration in C1, f 0 and duration in C2, and just duration in C3.
212

Experiment I
4.2.3 Experiment design
The experiment had awithin-subjects design inwhich the 30 target sentences
were �rst grouped in six blocks (from A to F) containing �ve clips each. Blocks
were sorted following a Latin square pattern. Additionally, non-manipulated
stimuli were included and randomised across all blocks. The 30 target sentences
were administered in two parts corresponding to each modality, �rst audio-only
and then audiovisual, or vice versa. Initially, participants received the �rst half
of the stimuli, which corresponded to one modality, in three blocks (a total of 15
clips, i.e. �ve clips per condition, plus 5 non-manipulated sentences). Later, the
next three blocks (a total of 15 clips plus 5) for the remaining modality were sim-
ilarly presented. Since the experiment was designed for 6 participants, the same
procedure was repeated twice until collecting responses from 12 participants. All
of them marked all stimuli but never the same stimulus in di�erent conditions.
The order of the three conditions and the two modalities was counterbalanced
to avoid carry-over e�ects (Figure 14).
4.2.4 Hypotheses
1. Methodology
The spontaneous nature of the speech samples used in this research will
prove adequate to the experimental task, and the manipulations conducted
on them will not hinder participants to detect prominence beyond chance,
i.e. participants will show su�cient agreement.
2. Acoustic correlates of prominence
2.1 Signi�cant di�erences will be found for the experimental conditions
when compared to the control condition.
213

Experiment I
Table 14: Scheme showing the experiment design with a Latin square to reorder stimuli blocks cor-
responding to 30 target sentences. 10 non-manipulated sentences were randomly placed across all
blocks.
2.2 The perception of prominence will be rendered through a combina-
tion of acoustic correlates, i.e. no single correlate will su�ce for par-
ticipants to detect prominence.
3. Gestural correlates of prominence
3.1 There will be signi�cant di�erences between the audio-only modality
and the audiovisual modality.
3.2 Prominence perception will mostly be driven by the apex phase of
gestures.
4.2.5 Procedure
Participants were brie�y instructed about the nature of the task so as to de-
termine the word or words in each sentence that were prosodically emphasised.
214

Experiment I
For this, prominence was informally de�ned as ‘words which were produced
with clear auditory emphasis’. Participants were provided with the minimal ne-
cessary information to conduct the task successfully.
After this, participants were individually presented with the stimuli through
headphones in a sound-proof cabin. The stimuli were administered under super-
vision at the phonetics laboratory of UNED by means of the online software Sur-
veyGizmo3 on a MacBook Pro. Following Streefkerk and her colleagues (1997),
a binary-marking experimental task was used, in which all words of the sen-
tence were available for marking. Participants could mark any number of words
they perceived as prominent in the sentence and leave non-prominent words un-
marked. For participants to become familiar with the task and to ensure they had
understood it properly, they were given a practice (2 trials) before each modality.
After this practice, the marking task involved two stages: when presented with
a stimulus, participants could watch or listen to it by playing back the clip up to
three times. Then, the corresponding words of the sentence were displayed on
the computer screen together with check-boxes for marking. At that moment,
they were allowed to play back the stimulus again up to four more times until
they made a �nal decision with the prominent words they had marked in the
sentence (Figure 32). Participants needed approximately 45 minutes to complete
the task.
3 https://www.surveygizmo.com.
215

Experiment I
Figure 32: Sample screen of the experimental task that was conducted by participants in the audiovi-
sual modality. After an initial screen displaying only the instructions and the audiovisual stimulus,
check-boxes appeared at the bottom for participants to conduct marking.
4.3 Results
4.3.1 Descriptive statistics
4.3.1.1 Prominence marks
The 531 words available for marking per participant added up to 8496 words
(including also the words marked by two trained listeners). Out of these, 2058
(24.22%) were marked as prominent. Prominence marks per sentence ranged
between 2.75 and 6.50 (M = 4.51, SD = 1.01). The 10 speakers received on aver-
age 165.2 (SD = 104.5) marks of prominence, while the 12 participants marked
on average 135.41 words as prominent (SD = 38.76) (Table A2). Additionally, in-
terjections (64.5%), adjectives (48.9%), and nouns (45.2%) were the word classes
that received the highest percentage of prominence marks (see Appendix A3 for
details).
216

Experiment I
4.3.1.2 Inter-rater agreement
Similar to other studies computing inter-rater agreement (Buhmann et al.,
2002, e.g), cross-tables for all pairs of participants were made (Table 15a). Then,
overall inter-rater agreement throughmean Cohen’s kappa (1960) was computed
in order to take into account agreement of participants beyond chance, as ex-
plained above (§ 3.3.6).
Inter-rater agreement for all paired combinations of participants for all stim-
uli across conditions and in both modalities had a value of � = .39. When agree-
ment was computed for each participant respect to the ‘gold standard’ provided
by two trained listeners, mean Cohen’s kappa was slightly lower, � = .38. Thislower mean re�ects the extent to which participants’ responses diverged from
those of the two trained listeners, whose independent agreement was high (� =.83) (Table 15b).Participant 11 Participant 12 Agreement
Non-prom Prom Total
Non-prom 364 85 44979%
Prom 22 60 82
Total 386 145 531 � = .41(a) Example of cross-table with non-prom(inent) and prom(inent) marks given by participants 11
and 12. Agreement shows percentage of coincidental responses for both participants and Cohen’s
kappa coe�cient.
217

Experiment I
Participant 1 2 3 4 5 6 7 8 9 10 11 12 TL 1 TL 2
1 - .42 .35 .28 .42 .28 .40 .38 .29 .33 .40 .44 .37 .35
2 - - .34 .26 .39 .38 .40 .48 .24 .39 .26 .39 .34 .31
3 - - - .29 .33 .28 .21 .34 .27 .31 .32 .37 .30 .24
4 - - - - .26 .25 .26 .24 .33 .18 .32 .33 .34 .33
5 - - - - - .48 .47 .35 .44 .39 .49 .40 .43 .42
6 - - - - - - .36 .35 .27 .33 .36 .40 .33 .31
7 - - - - - - - .36 .42 .42 .42 .44 .40 .37
8 - - - - - - - - .25 .34 .30 .45 .31 .32
9 - - - - - - - - - .31 .38 .28 .38 .38
10 - - - - - - - - - - .29 .40 .37 .36
11 - - - - - - - - - - - .41 .37 .36
12 - - - - - - - - - - - - .41 .39
TL 1 - - - - - - - - - - - - - .83
TL 2 - - - - - - - - - - - - - -
Mean Cohen’s kappa .39 .38
(b) Inter-rater agreement expressed as mean Cohen’s kappa for all pairs of participants including
two trained listeners (TL).
Table 15: Cross-table of prominence marks and inter-rater agreement.
4.3.1.3 Prominence and acoustic cues
As it is apparent from Table 16, words considered prominent regardless of
modality increased across conditions respect to the control condition.
Modality Words for marking percondition and modality
Prominent words (%)
C0 C1 C2 C3
2124 434 (20.4) 539 (25.3) 530 (24.9) 555 (26.1)
A 1062 198 (18.6) 269 (25.3) 259 (24.4) 267 (25.1)
AV 1062 236 (22.2) 270 (25.4) 271 (25.5) 288 (27.1)
AV (±%) +3.6 +0.1 +1.1 +2.0
Table 16: Distribution of marks of prominence per experimental condition for both modalities com-
bined (n = 2124) and for each modality separately (n = 1062): audio-only (A) and audiovisual (AV).
Acoustic cues were intensity and duration (C1), f0 and duration (C2), and only duration (C3). All
three acoustic cues of prominence were available in the control condition (C0). Total words for mark-
ing added up to N = 8496.
218

Experiment I
The total 2124 words for marking were teased apart to better understand the
distribution of prominence marks per condition in both modalities: the audio-
only and audiovisual modalities, each with a total of 1062 words available for
marking. The audiovisual modality consistently showed a higher number of
words marked as prominent. The di�erence betweenmodalities was highest pre-
cisely in C3, with a relative number of prominence marks of 27.12%, increasing
by 1.98% respect to the audio-only modality in the same condition. The largest
di�erence between modalities (3.6%) was found in C0. On the contrary, modali-
ties hardly di�ered in both C1 and C2.
Overall, all experimental conditions showed a higher number of marks of
prominence, and the highest di�erence with C0 was found in C3 (5.7%); how-
ever, when compared to C1 and C3, the di�erence was smaller (0.75% and 1.13%,
respectively).
4.3.1.4 Prominence and visual cues
In the case of gestures, sentences were annotated with ELAN (Brugman &
Russel, 2004), as discussed earlier (§ 3.3.5). Out of the 170 annotated gestures of
the 30 target sentences (see Appendix A4 for details), those performed uniquely
with hands were more numerous (40 – 23.5% of occurrences) than those per-
formed with either head (17 – 10%), or eyebrows (4 – 2.3%). However, the highest
number of gestures were those performed simultaneously by the joint movement
of hands and head (87 – 51.1% of the occurrences). Conversely, the minimum
number of occurrences corresponded to eyebrows and head (2 – 1.1%) and hands
and eyebrows (1 – 0.6%). Gestures performed simultaneously with hands, eye-
brows, and head were (19 – 11.1%) (Figure 33).
219

Experiment I
Figure 33: Occurrences of gestures according to the body part involved in their production, sepa-
rately: hand, eyebrows, head; and combined: hand and eyebrows (HA.EY), hand and head (HA.HE),
eyebrows and head (EY.HE), and hand, eyebrows, and head (HA.EY.HE).
It was also observed that gesture phases tended to be synchronised for the
di�erent articulators involved in the production of gestures. Thus, the apex of a
simultaneous gesture of hand and head, for example, tended to coincide for both
gesture articulators (Figure 34).
220

Experiment I
Figu
re34:Sam
pleof
gesturesequ
ence
performed
simultaneously
asaha
ndan
dhead
movem
ent.
221

Experiment I
As it can be seen in Table 17, among phases coinciding with words given a
mark of prominence, apexes consistently obtained the highest number of prom-
inence marks in C3, with a maximum 128 occurrences out of 270 (47.4%).
Gesturephase
Words for marking percondition and modality
Prominent words (%)
C0 C1
A AV AV (±%) A AV AV (±%)
Preparation 258 19 (7.3) 25 (9.6) +2.3 41 (15.8) 48 (18.6) +2.8
Stroke 174 6 (3.4) 17 (9.7) +6.3 13 (7.5) 20 (11.5) +4.0
Apex 270 109 (40.4) 126 (46.6) +6.2 113 (41.9) 110 (40.7) –1.2
Hold 164 29 (17.7) 28 (17.0) –0.7 54 (32.9) 45 (27.4) –5.5
Recoil 78 19 (24.4) 19 (24.3) –0.1 23 (29.5) 24 (32.1) +2.6
Retraction 118 16 (13.6) 21 (17.8) +4.2 25 (21.2) 23 (19.5) –1.7
Total 1062 198 (18.6) 236 (22.2) + 3.6 269 (25.3) 270 (25.4) +0.1
(a) Prominent words according to gesture phase for C0 and C1
Gesturephase
Words for marking percondition and modality
Prominent words (%)
C2 C3
A AV AV (±%) A AV AV (±%)
Preparation 258 45 (17.4) 36 (13.9) –3.5 40 (15.5) 42 (16.2) +0.7
Stroke 174 18 (10.3) 31 (17.8) +7.5 12 (6.9) 26 (14.9) +8.0
Apex 270 114 (42.2) 122 (45.2) –3.0 126 (46.7) 128 (47.4) +0.7
Hold 164 45 (27.4) 46 (28.0) +0.6 38 (23.2) 43 (26.2) +3.0
Recoil 78 19 (24.4) 20 (25.6) +1.2 23 (29.5) 25 (32.1) +2.6
Retraction 118 18 (15.3) 16 (13.6) –1.7 28 (23.7) 24 (20.3) –3.4
Total 1062 259 (24.4) 271 (25.5) +1.1 267 (25.1) 288 (27.1) +2.0
(b) Prominent words according to gesture phase (cont.) for C2 and C3
Table 17: Di�erent gesture phases coinciding with words marked as prominent per condition and
modality (n = 1062; N = 8496). Values for the audio-only modality, where no visual information
was available, served to compare the marks given by participants in the audiovisual modality. This
di�erence is expressed as AV (±%). Acoustic cues were intensity and duration (C1), f0 and duration
(C2), and only duration (C3). All three acoustic cues of prominence were available in the control
condition (C0).
222

Experiment I
Conversely, strokes had the lowest percentage of prominence marks in C0,
with a minimum of 6 out of 174 (3.4%). However, words accompanied by strokes
increased across conditions respect to C0, as they also increased consistently in
the audiovisual respect to the audio-only modality, with a maximum di�erence
between modalities of 8% in C3. Interestingly, this di�erence is the largest for
any gesture phases across conditions between both modalities. It is also worth
mentioning that thosewords co-occurringwith a recoil phase received numerous
prominence marks, with a maximum of 25 out of 78 (32.1%) in the audiovisual
modality of C3. In the case of the hold phase, it received fewer marks in the
audiovisual modality in C0 (–0.7%) and C1 (–5.5%), and slightly more in the au-
diovisual modality of C2 (+0.6%) and C3 (+3.0%). In total, the number of words
given a mark of prominence in the audiovisual modality increased in all condi-
tions, with a minimum di�erence of 0.1% in C1, and maxima of 3.6% and 2.0% in
C0 and C3, respectively.
223

Experiment I
4.3.2 Inferential statistics
4.3.2.1 Correlation
Firstly, a correlation test was conducted in relation to hypothesis 1 in order to
assess whether the di�culty of the task increased with sentence length so as to
make impossible for participants to mark prominence above chance, especially
in longer sentences given the variability of to the spontaneous speech stimuli
and the manipulations on the acoustic correlates of prominence. The correlation
showed a signi�cant positive relationship between words considered prominent
and the number of words per sentence r = .71, p < .01 (Figure 35).
Figure 35: Correlation between sentence length and marks of prominence given by participants.
4.3.2.2 Number of prominence marks
Furthermore, the di�erences observed in the number of marks of prominence
given per condition and modality were assessed through chi-square tests. The
224

Experiment I
results revealed that the higher number of marks given in the audiovisual mo-
dality were signi�cantly di�erent from those of the audio-only modality in C0,� 2 (1) = 3.96, p < .05 (Figure 36a). When the number of marks were compared
among conditions, all experimental conditions contrasted with C0, and signi�c-
ant di�erences were found between C0 and C1, � 2 (1) = 14.41, p < .001; between
C0 and C2, � 2 (1) = 12.11, p < .001; and between C0 and C3, � 2 (1) = 18.79, p <
.001. No signi�cant di�erences were found among experimental conditions.
Additionally, these di�erences were analysed per modality: in the audio-only
modality the control condition contrasted signi�cantly with the higher number
of prominence marks given in C1, � 2 (1) = 13.45, p < .001; in C2, � 2 (1) = 10.03,
p < .01; and C3, � 2 (1) = 12.73, p < .001; while no di�erences were found among
experimental conditions (Figure 36b). Conversely, in the audiovisual modality,
di�erences were found only between the control condition and C3, � 2 (1) = 6.58,
p < .01 (Figure 36c).
(a) All conditions in both modalities
225

Experiment I
(b) Audio-only modality (c) Audiovisual modality
Figure 36: Signi�cant di�erences in the number of prominence marks per modality and condition.
Acoustic cues were intensity and duration (C1), f0 and duration (C2), and only duration (C3). All
three acoustic cues of prominence were available in the control condition (C0).
As for gesture phases, di�erences between the audio-only and the audiovisual
modality were found only for words considered prominent that were accompan-
ied by a stroke in C0, � 2 (1) = 4.65, p < .05 and C3, � 2 (1) = 4.99, p < .05 (Figure
37b). Additionally, di�erences for all gesture phases were analysed only in the
audiovisual modality among conditions. In the case of the preparation phase,
di�erences were observed between C0 and C1, � 2 (1) = 7.72, p < .01; and between
C0 and C3, � 2 (1) = 4.08, p < .05 (Figure 37a). For strokes, di�erences were only
found between C0 and C2, � 2 (1) = 9.68, p < .01 (Figure 37b). For holds, words
given a mark of prominence di�ered signi�cantly between C0 and C1, � 2 (1) =4.51, p < .05; and between C0 and C2, � 2 (1) = 5.04, p < .05 (Figure 37c). No dif-
ferences were found between modalities nor conditions for the gesture phases of
apex, recoil, and retraction.
226

Experiment I
(a) Preparation (b) Stroke
(c) Hold
Figure 37: Graphs showing signi�cant di�erences in the number of prominence marks with di�erent
gesture phases per modality and per condition in the audiovisual modality. No di�erences were found
for the gesture phases of apex, recoil, and retraction. Acoustic cues were intensity and duration (C1),
f0 and duration (C2), and only duration (C3). All three acoustic cues of prominence were available
in the control condition (C0).
227
Experiment I
4.3.2.3 Model building and selection
In order to determine which variables in�uenced participants’ marks for bin-
ary prominence atword level, di�erent generalised linearmixedmodels (GLMMs)
with a logit link function were estimated for a binomial distribution (see Jae-
ger, 2008, for details). As previously seen (§ 3.2.2), GLMMs are an extension of
linear mixed models (LMMs) for non-normal distributions, and both have been
previously applied in linguistic research (e.g Adamou et al., 2018; Gries, 2015;
Masson-Carro et al., 2017; Quené, 2008). Mixed-models are considered more ro-
bust statistical tools than conventional analysis of variance (ANOVAs) (Jaeger,
2008), especially in cases of repeated measures, unbalanced designs, nested data,
or categorical variables (see Singmann & Kellen, in press, for a review).
One important advantage of mixed-models is that they allow to include ran-
domvariables capturing the variability inherent to participants and stimuli (Baayen
et al., 2008). In this pilot study, this was done using the lme4 package (Bates et al.,
2015b) in R (2018). All models were built using maximum likelihood (Laplace Ap-
proximation) and optimised with BOBYQA (Powell, 2009) to increase iterations
and avoid convergence errors, in a process explained earlier (Barr et al., 2013) (§
3.2.1).
In this pilot study, the binary dependent variable prominence was modelled
through categorical independent variables: speaker (n = 12), sentence (n = 30),
word (n = 531), modality (n = 2), and condition (n = 4). Also, as categorical inde-
pendent variables, each gesture phasewas introduced separately, so as to indicate
their co-occurrence with the words being marked by participants: preparation (n
= 2), stroke (n = 2), apex (n = 2), hold (n = 2), recoil (n = 2), and retraction (n = 2).
Finally, as independent continuous variables, fundamental frequency, intensity,
and duration were fed into the model, which corresponded to the acoustic val-
ues of the 531 words available for marking, as explained above (see Table 13 in §
228

Experiment I
3.3.6). The di�erent gesture phases were introduced as separate variables using
dummy coding, rather than as di�erent levels of one single variable. This was
done so partly due to the absence of a reliable baseline against which to com-
pare each phase, since very few words in the corpus were uttered in the absence
of a gesture. (As mentioned earlier § 3.3.2, all full meaningful sentences uttered
by speakers in the corpus were accompanied by an intertwined succession of
gestures). On the other hand, by introducing each gesture phase as a separable
variable, it was possible to compare the e�ect that the presence of each of the
phases had in relation to their absence.
In addition, several adjustments were conducted to both control for con-
founding variables and avoid convergence errors in the estimation of parameters
due to the di�erent scales of the acoustic correlates of prominence. The continu-
ous variables of f 0, intensity, and duration were fed into the model as z-scores, a
scale that keeps the same relationship of each data point respect to their mean.
The standardisation for each acoustic correlate was conducted according to the
speci�c sentence in which they occurred, especially since words are assumed
to be perceived as prominent relative to the environment in which they were
uttered. Thus, intensity and duration were standardised per sentence, as well
as f 0. Additionally, in this case of f 0, pitch bias resulting from speaker gender
was eliminated through standardisaion based on the gender of the speaker (see
Appendix A1, A2, and A3 for details of their respective distributions).
Model building proceeded by specifying �xed e�ects in model 1 (M1) with
the predictors: modality, condition, preparation, stroke, apex, hold, recoil, � (fun-
damental frequency), intensity, and duration. By-subject random e�ects were de-
clared through the variable participant, and by-item random e�ects were spe-
ci�ed through the nested variables of word within sentence within speaker, as
previously discussed (§ 3.2.1, Figure 26c). Using the formula notation of the lme4
229

Experiment I
package developed for R by Bates et al (2015b):
In this model,M1, intercepts in random e�ects are signalled through the nota-
tion (1 | ...). In the case of by-subject and by-item random e�ects, this becomes
(1 | participant) and (1 | speaker/sentence/word), respectively.
The set of models was then built using the Akaike Information Criterion
(AIC) (as explained in § 3.2.4) using R (2018) and compared through the pack-
age AICcmodavg (Mazerolle, 2017). The Akaike Information Criterion (AIC) is
an ordinal score assessing the quality of the model with no meaning of its own
except as a way to rank models (Akaike, 1973; see Burnham & Anderson, 2002,
for details). From models M1 to M5, di�erent non-signi�cant predictors were
progressively removed. Model M6 included a �rst-order interaction of modality
with all the predictors of all gesture phases and all acoustic correlates:
The resulting AIC value in M6, which included a �rst-order interaction, de-
creased by more than 30 points (Table 19). Subsequently, from models M6 to
M9, di�erent non-signi�cant predictors were removed from the interaction. The
lowest AIC value (AIC = 6776.1) was achieved by model M9. In this model, the
predictors preparation and z-intensity proved non-signi�cant and were omitted.
As an alternative to �6, a second interaction was declared in M8 between con-
dition and the continuous variables of z-fundamental frequency, z-intensity, and
z-duration, but the resulting AIC value (AIC = 6789.05) did not improve the �t of
model M6:
230

Experiment I
Subsequently, theAIC value ofM9 became still lowerwhen speaker was omit-
ted from the nested by-item random e�ects in M10 (AIC = 6774.1) (Table 18).
Random e�ects Variance Std. Deviation AIC
Model 9 (M9) 6776.1
participant 0.313 0.560
word/sentence/speaker 2.385 1.544
sentence/speaker 0.003 0.059
speaker 0.002 0.046
Model 10 (M10) 6774.1
participant 0.313 0.560
word/sentence 2.385 1.544
sentence 0.005 0.071
Table 18: Intercept random e�ects for M9 and M10, showing the decrease of the AIC value when the
redundant upper level factor speaker was omitted from the nested random e�ects is omitted.
The variance of by-item random e�ect M9 was almost entirely captured by
the subsequent two levels of sentence and word. Its omission resulted in a de-
crease of precisely 2 AIC points, as mentioned by Burnham and Anderson (2002,
p. 454), equivalent to one estimable parameter (§ 3.2.4). This was important for
the later declaration of random slopes (Table 19).
In the subsequent models, fromM11 toM25, di�erent random structures were
explored. Logically, variability in participants’ responses captured by the inter-
cepts of by-subject random e�ects—expressed by the number one in (1 | parti-
cipants)—may also vary in slope. Di�erent slopes were expected to result from
the levels of modality, since each participant rated stimuli in both modalities4.
Similarly, items, i.e. thewordsmarked by participants, declared as by-itemnested
4 In the case of the variability associated to the levels of condition, this is more problematic,
since the unbalanced design of the experiment made that the two trained listeners in the control
condition marked words only in one of the three manipulated conditions. Thus, AIC values with
maximal by-subject random e�ects (i.e. condition and modality) did not reduce the �� di�erencerespect to the AICmin.
231

Experiment I
random e�ects (1 | speaker/sentence/word), were expected to vary among condi-
tions and modalities.
Additionally, the di�erence observed for models M9 and M10 expressed as�� was less than 2 AIC points (see § 3.2.4, Table 11). This fact was explored
in all subsequent models, M11 to M25, which were �tted alternatively with and
without the upper level of the nested random e�ects speaker, as it can be seen
in models M11 and M12, M13 and M14, etc. Actually, in these two pairs of mod-
els, when trying to declare slopes in by-subjects random e�ects, the removal of
speaker in by-items random e�ects resulted in a non-convergence error. A con-
vergence problem also appeared for a similar reason in models M24* and M25*5.
Conversely, in the cases where speaker was declared, the goodness-of-�t of the
model worsened considerably, as in modelM17 respect to modelM18 (Table 19).
As it is apparent from Table 19, the minimal adequate model in Burnham and
Anderson’s (2002) terms was M18, with an AIC value of 6697.18. This model,
when compared to the rest of the �tted models of the set, had the highest Akaike
weight �� = 0.51, closely followed by modelM19 (�� = 0.37), andM20 (�� = 0.08).On the one hand, the di�erence between M18 and M19 was due to the re-
moval of the non-signi�cant predictor gesture-recoil inM19, but this did not lead
to a lower AIC value (AIC = 6697.83) in M19. On the other hand, the AIC di�er-
ence between bothM18 andM20, which corresponded to 3.68 points, was due to
their di�erent by-subject structures. Although slopes for the random e�ects of
modality were speci�ed for participants inM20, the intercept by-subject random
e�ects of M18—as signalled by (1 | participants)—resulted in a lower AIC value.
In addition, the single predictors of modality and condition in the random struc-
ture of by-item random e�ects of modelM18 were extended to be included in the
structure of by-subject random e�ects, but this random slope model,M18’ failed
5 Models labelled with an asterisk failed to converge.
232

Experiment I
Mod
elPr
ominen
ceas
afunc
tion
of(�)�x
ede�
ects,w
ithby
-sub
ject
andby
-item
rand
ome�
ects
LogL
ikelihoo
dK
AIC
� �� �
M1
mod
ality
+cond
ition
+prep
+stroke
+apex
+ho
ld+recoil+retractio
n+z-�+z-intensity
+z-du
ratio
n+
+(1
|partic
ipant)+(1
|speaker/sentence/word)
–3384.70
186805.40
108.22
0.00
M2
mod
ality
+prep
+stroke
+apex
+ho
ld+recoil+retractio
n+z-�+z-intensity
+z-du
ratio
n+
+(1
|partic
ipant)+(1
|speaker/sentence/word)
–3391.77
156813.53
116.35
0.00
M3
cond
ition
+prep
+stroke
+apex
+ho
ld+recoil+retractio
n+z-�+z-intensity
+z-du
ratio
n+
+(1
|partic
ipant)+(1
|speaker/sentence/word)
–3387.41
176808.82
111.65
0.00
M4
prep
+stroke
+apex
+ho
ld+recoil+retractio
n+z-�+z-intensity
+z-du
ratio
n+
+(1
|partic
ipant)+(1
|speaker/sentence/word)
–3395.83
116813.67
116.49
0.00
M5
apex
+ho
ld+recoil+z-�+z-du
ratio
n+
+(1
|partic
ipant)+(1
|speaker/sentence/word)
–3396.44
106812.87
115.69
0.00
M6
mod
ality
x(con
ditio
n+prep
+stroke
+apex
+ho
ld+recoil+z-�+z-intensity
+z-du
ratio
n)+
+(1
|partic
ipant)+(1
|speaker/sentence/word)
–3362.73
286781.47
84.29
0.00
M7
mod
ality
x(con
ditio
n+stroke
+apex
+ho
ld+recoil+z-�+z-intensity
+z-du
ratio
n)+
+(1
|partic
ipant)+(1
|speaker/sentence/word)
–3362.83
266777.66
80.48
0.00
M8
mod
ality
x(con
ditio
n+stroke
+apex
+ho
ld+recoil+z-�+z-du
ratio
n)+cond
ition
x(z-�
+z-intensity
+z-du
ratio
n)+
+(1
|partic
ipant)+(1
|speaker/sentence/word)
–3360.52
346789.05
91.87
0.00
M9
mod
ality
x(con
ditio
n+stroke
+apex
+ho
ld+recoil+z-�+z-du
ratio
n)+
+(1
|partic
ipant)+(1
|speaker/sentence/word)
–3364.04
246776.09
78.91
0.00
M10
mod
ality
x(con
ditio
n+stroke
+apex
+ho
ld+recoil+z-�+z-du
ratio
n)+
+(1
|partic
ipant)+(1
|sentence/word)
–3364.05
236774.10
76.92
0.00
(a)S
ummaryof
AIC
results
forthe
GLM
Mrand
om-in
terceptm
odels.
233

Experiment I
Mod
elPr
ominen
ceas
afunc
tion
of(�)�x
ede�
ects
withby
-sub
ject
andby
-item
rand
ome�
ects
LogL
ikelihoo
dK
AIC
� �� �
M11
mod
ality
x(con
ditio
n+stroke
+apex
+ho
ld+recoil+z-�+z-du
ratio
n)+
+(con
ditio
n|partic
ipant)+(1
|speaker/sentence/word)
–3359.69
336785.37
88.20
0.00
M12*
mod
ality
x(con
ditio
n+stroke
+apex
+ho
ld+recoil+z-�+z-du
ratio
n)+
+(con
ditio
n|partic
ipant)+(1
|sentence/word)
–3359.69
326783.37
86.20
0.00
M13
mod
ality
x(con
ditio
n+stroke
+apex
+ho
ld+recoil+z-�+z-du
ratio
n)+
+(m
odality
+cond
ition
|partic
ipant)+(1
|speaker/sentence/word)
–3359.39
386794.78
97.60
0.00
M14*
mod
ality
x(con
ditio
n+stroke
+apex
+ho
ld+recoil+z-�+z-du
ratio
n)+
+(m
odality
+cond
ition
|partic
ipant)+(1
|sentence/word)
–3359.39
376792.78
95.60
0.00
M15
mod
ality
x(con
ditio
n+stroke
+apex
+ho
ld+recoil+z-�+z-du
ratio
n)+
+(con
ditio
n|partic
ipant)+(con
ditio
n|sentence/word)
–3307.82
506715.63
18.45
0.00
M16
mod
ality
x(con
ditio
n+stroke
+apex
+ho
ld+recoil+z-�+z-du
ratio
n)+
+(con
ditio
n|partic
ipant)+(con
ditio
n|speaker/sentence/word)
–3307.69
606735.38
38.20
0.00
M17
mod
ality
x(con
ditio
n+stroke
+apex
+ho
ld+recoil+z-�+z-du
ratio
n)+
+(1
|partic
ipant)+(m
odality
+cond
ition
|speaker/sentence/word)
–3296.42
666724.84
27.66
0.00
�18mod
alityx(con
dition
+stroke
+ap
ex+ho
ld+reco
il+z-�+z-du
ration
)++(1
|participa
nt)+
(mod
ality+co
ndition|sen
tenc
e/word)
–3297.59
5166
97.18
0.00
0.51
M19
mod
ality
x(con
ditio
n+stroke
+apex
+ho
ld+z-�+z-du
ratio
n)+
+(1
|partic
ipant)+(m
odality
+cond
ition
|sentence/word)
–3229.91
496697.83
0.65
0.37
M20
mod
ality
x(con
ditio
n+stroke
+apex
+ho
ld+recoil+z-�+z-du
ratio
n)+
+(m
odality
|partic
ipant)+(m
odality
+cond
ition
|sentence/word)
–3297.43
536700.86
3.68
0.08
M21
mod
ality
x(con
ditio
n+stroke
+apex
+ho
ld+recoil+z-�+z-du
ratio
n)+
+(m
odality
|partic
ipant)+(m
odality
+cond
ition
|speaker/sentence/word)
–3296.22
686728.43
31.25
0.00
M22
mod
ality
x(con
ditio
n+stroke
+apex
+ho
ld+recoil+z-�+z-du
ratio
n)+
+(con
ditio
n|partic
ipant)+(m
odality
+cond
ition
|speaker/sentence/word)
–3290.23
756730.45
33.27
0.00
M23
mod
ality
x(con
ditio
n+stroke
+apex
+ho
ld+recoil+z-�+z-du
ratio
n)+
+(con
ditio
n|partic
ipant)+(m
odality
+cond
ition
|sentence/word)
–3291.38
606702.76
5.58
0.03
M24*
mod
ality
x(con
ditio
n+stroke
+apex
+ho
ld+recoil+z-�+z-du
ratio
n)+
+(m
odality
+cond
ition
|partic
ipant)+(m
odality
+cond
ition
|speaker/sentence/word)
–3290.11
806740.23
43.05
0.00
M25*
mod
ality
x(con
ditio
n+stroke
+apex
+ho
ld+recoil+z-�+z-du
ratio
n)+
+(m
odality
+cond
ition
|partic
ipant)+(m
odality
+cond
ition
|sentence/word)
–3295.51
656721.02
23.84
0.00
(b)S
ummaryof
AIC
results
forthe
GLM
Mrand
om-slope
models.
Table19:S
ummaryof
AIC
results
fortheGLM
Msmodellin
gthemarking
ofprom
inence
byparticipan
tsas
afunctio
nof
predictorsdeclared
as�x
ed
e�ects.Allmodelsinclud
eby-subject
andby-item
rand
ome�ects.Table(a)showsrand
om-in
terceptm
odels;Table(b)showsdi�erent
structures
in
rand
ome�ects.Kindicatestheestim
ated
parametersin
themodel.Th
estatisticsassociated
toeach
modelareAkaikeInform
ationCriterio
n(AIC),
increase(� �)of
each
modelrespecttotheminim
umAIC
value,thelog-lik
elihoodof
themodel,and
theAkaikeweight(� �)fo
reachcand
idatemodelto
betheminim
aladequa
temodel.M
odelslabelledwith
anasteriskfailedto
converge.
234

Experiment I
to converge and was not included in the set of models.
Following Arnold’s (2010) guidelines, bothmodelsM18 andM19 are reported,
which di�ered in 2 estimated parameters that corresponded to the interaction of
predictor recoil. Firstly the results of the top-ranked model M18 (AIC = 6697.18)
are o�ered; then the �-values forM19 (AIC = 6697.83) are displayed for compar-
ison, showing that the di�erence in their AIC value did not result in a di�erence
in the estimates for the predictors included in M18.
4.3.2.4 Details of minimal adequate modelM18
The minimal adequate model, M18, did not show overdispersion (�Pearson =
0.55, p > .05; see Appendix A4 for details)6. It revealed a strong e�ect of the
acoustic correlates of f 0 (� = 0.46, SE = 0.07, z = 2.27, p <.001, OR = 1.59) and
syllable duration (� = 0.98, SE = 0.09, z = 10.9, p <.001, OR = 2.68) in the perception
of prominence for all three conditions as well as for the marks of two trained
listeners in the control condition (Figure 38, Table 20).
Following the standard procedure, the e�ect size of these variables is ex-
pressed as the odds ratio (OR) coe�cient. Thus, as standardized variables, 1
standard deviation increase in the continuous variables of f 0 (SD = 23.85 Hz)
and in duration (SD = 0.055 s) made words 1.59 and 2.68 times more likely, re-
spectively, to be considered prominent.
When compared to the control group, all experimental conditions showed a
signi�cant increase in the probability of marking words as prominent. A word
marked in C1, where f 0 had been neutralised, was 6.30 times more likely to be
given a mark of prominence (� = 1.84, SE = 0.52, z = 3.49, p <.001), although6 The occurrence of more variance in the data than predicted by a statistical model, a phe-
nomenon known as overdispersion, is reported here and in the subsequent �tted models that are
discussed later.
235

Experiment I
Figure 38: Forest plot showing odds ratios for main e�ects and interactions predicting prominence
in M18 (AIC = 6697.18). For OR < 1, e�ect size equals 1/OR. Error bars are 95% CI.
odds reached a maximum in C3, so that words were 7.15 times more likely to
be considered prominent in this condition (� = 1.96, SE = 0.51, z = 3.81, p <.001),where both f 0 and intensity had been neutralised and duration served as the only
acoustic cue of prominence. In the case of C2, the condition where intensity had
been neutralised, and both f 0 and duration were available to listeners, the e�ect
size was slightly less strong, and odds decreased to 3.65 (� = 1.29, SE = 0.50, z =
2.54, p <.05) (Figure 39).Also, marking a word as prominent coincided signi�cantly with the occur-
rence of the apex phase (� = 1.58 SE = 0.27, z = 5.67, p <.001) and the hold phase of236

Experiment I
gestures (� = 0.77, SE = 0.24, z = 3.20, p <.001). Interestingly, the odds for marking
words as prominent were 1.71 higher in the audiovisual than in the audio-only
modality (� = 0.53, SE = 0.23, z = 2.27, p <.05), although this e�ect was nuanced
for all three experimental conditions, which seemed to be more conservative in
marking prominent words in the audiovisual modality.
Predictor � (SE) p 95% CI for odds ratio
Lower limit Odds ratio Upper limit
Intercept –4.00 (0.50) < .001*** 0.01 0.02 0.05
Modality (0=A, 1=AV) 0.53 (0.23) < .05* 1.08 1.71 2.73
Condition 1 1.84 (0.52) < .001*** 2.24 6.30 17.70
Condition 2 1.29 (0.50) < .05* 1.35 3.65 9.91
Condition 3 1.96 (0.51) < .001*** 2.60 7.15 19.67
z-F0 (standardized f 0) 0.46 (0.07) < .001*** 1.37 1.59 1.84
z-Duration (standardized duration) 0.98 (0.09) < .001*** 2.25 2.68 3.20
Stroke (0=no, 1=yes) –0.25 (0.26) .33 0.47 0.78 1.30
Apex (0=no, 1=yes) 1.58 (0.28) < .001*** 2.82 4.87 8.42
Hold (0=no, 1=yes) 0.77 (0.24) < .01** 1.35 2.17 3.50
Recoil (0=no, 1=yes) 0.59 (0.31) .06 0.97 1.81 3.38
Modality AV x Condition 1 –0.73 (0.24) < .01** 0.30 0.48 0.77
Modality AV x Condition 2 –0.28 (0.22) .19 0.49 0.75 1.16
Modality AV x Condition 3 –0.60 (0.23) < .05* 0.34 0.55 0.87
Modality AV x z-F0 –0.33 (0.08) < .001*** 0.60 0.71 0.85
Modality AV x z-Duration –0.19 (0.08) < .05* 0.70 0.82 0.97
Modality AV x Stroke 0.83 (0.28) < .01** 1.31 2.30 4.03
Modality AV x Apex –0.83 (0.28) < .01** 0.25 0.43 0.76
Modality AV x Hold –0.12 (0.24) .61 0.54 0.88 1.43
Modality AV x Recoil 0.02 (0.31) .93 0.56 1.02 1.88
Table 20: Results of �xed e�ects in model�18 (AIC = 6697.18) predicting the marking of prominence
from the variablesmodality, condition, fundamental frequency, duration, gesture-stroke, gesture-
apex, gesture-hold, and gesture-recoil.
237

Experiment I
(a) z-f 0 (b) z-Duration
238

Experiment I
(c) Modality (d) Condition
(e) Apex (f) Hold
Figure 39: Main e�ects of M18 (AIC = 6697.18) for continuous variables: (a) fundamental frequency,
and (b) duration; and for categorical variables: (c) condition and (d) modality. Shading and error
bars and are 95% CI.
Interactions
This interaction between the audiovisual modality and the experimental con-
ditions revealed that words were less likely to be considered prominent in the
audiovisual modality by 2.08 times (� = –0.60, SE = 0.23, z = –2.52, p <.05) and1.81 times (� = –0.73, SE = 0.24, z = –3.02,p <.05) in C1 and C3, respectively. No
signi�cant interaction, however, was found for C2.
Not only did the audiovisual modality interact with the experimental condi-
tions C1 and C3, but it also made that the visual and the acoustic cues of promi-
nence were perceived di�erently. On one hand, apexes coinciding with a word in
239

Experiment I
the audiovisual modality were 2.32 times less likely to be given a mark of prom-
inence than in the audio-only modality (� = –0.83, SE = 0.28, z = –2.93, p <.05).Precisely the opposite, however, was found for strokes, which increased the odds
of prominence for the words they co-occurred with by 2.30 (� = –0.83, SE = 0.28,
z = 2.91, p <.05, OR = 2.30). On the other hand, words considered prominent in
the audiovisual modality were 1.40 times less likely to be predicted by the e�ect
of f 0 (� = –0.33, SE = 0.08, z = –3.87,p <.001), and 1.21 times less likely by the
e�ect of duration (� = –0.19, SE = 0.08, z = –2.29, p <.05) when compared to the
audio-only modality (Figure 40).
(a) z-f 0 (b) z-Duration
(c) f 0 in Hertz (d) Duration in seconds
240

Experiment I
(e) Apex (f) Stroke
Figure 40: Interactions between modality and predictors in model M18. Graphs (b) and (c) show
interactions corresponding to the acoustic values of �0 and duration, respectively, as a function of
participants’ responses (non-prominent vs. prominent).
ModelM19, inwhich the non-signi�cant predictor gesture-recoilwas removed,
showed �-values that hardly varied for the same signi�cant predictors as M18
(Table 21).
Predictor � (SE) p 95% CI for odds ratio
Lower limit Odds ratio Upper limit
Intercept –3.91 (0.50) < .001*** 0.01 0.02 0.05
Modality (0=A, 1=AV) 0.55 (0.23) < .05* 1.11 1.73 2.71
Condition 1 1.84 (0.53) < .001*** 2.27 6.39 17.99
Condition 2 1.31 (0.51) < .05* 1.37 3.71 10.10
Condition 3 1.98 (0.51) < .001*** 2.63 7.24 19.97
z-F0 (standardized f 0) 0.46 (0.07) < .001*** 1.37 1.59 1.85
z-Duration (standardized duration) 0.98 (0.09) < .001*** 2.24 2.67 3.19
Stroke (0=no, 1=yes) –0.34 (0.25) .33 0.43 0.71 1.17
Apex (0=no, 1=yes) 1.56 (0.28) < .001*** 2.77 4.80 8.31
Hold (0=no, 1=yes) 0.68 (0.23) < .01** 1.25 1.98 3.16
Modality AV x Condition 1 –0.73 (0.24) < .01** 0.30 0.48 0.77
Modality AV x Condition 2 –0.28 (0.22) .19 0.49 0.75 1.15
Modality AV x Condition 3 –0.60 (0.24) < .05* 0.34 0.55 0.87
Modality AV x z-F0 –0.33 (0.08) < .001*** 0.60 0.72 0.85
Modality AV x z-Duration –0.19 (0.08) < .05* 0.70 0.82 0.97
Modality AV x Stroke 0.82 (0.27) < .01** 1.32 2.28 3.94
Modality AV x Apex –0.83 (0.28) < .01** 0.25 0.43 0.76
Modality AV x Hold –0.13 (0.24) .61 0.55 0.87 1.40
Table 21: Results of �xed e�ects in model�19 (AIC = 6697.83), in which the non-signi�cant predictor
gesture-recoil was removed.
241

Experiment I
4.4 Discussion
This experiment aimed at contributing with a new methodological proposal
to the study of the multimodal perception of prominence as well as at o�er-
ing new insights into Castilian Spanish as language of study. By doing so, it
sought to overcome some of the limitations of previous methodologies having
used either animated agents or elicited gestures with controlled speech stim-
uli in experimental settings. The obtained results showed that the methodology
proved successful and that participants tended to mark more words in the exper-
imental conditions—where they relied only on certain acoustic cues—than the
two trained listeners who marked words in the control condition; in this sense,
participants also seemed to respond di�erently than the control in the audiovi-
sual modality as a result of the perceptual e�ect of the visual cues of prominence.
Stimuli creation
On the one hand, studies on prominence perception with animated agents
in the form of talking heads have limited themselves to reproduce eyebrow and
head movements but have excluded hand movements (e.g. House et al., 2001; Pri-
eto et al., 2011). On the other hand, stimuli used in experimental settings have
mostly been created through audiovisual recordings in a controlled environment
(e.g. Dohen & Lœvenbruck, 2009; Krahmer & Swerts, 2007). For example, the par-
ticipants of Krahmer and Swerts’ study were instructed to utter a short sentence
and produce concomitantly a quick visual gesture with either hand, eyebrows,
or head on a speci�c target word. They were also allowed to train until they felt
they could not improve the realisation of the gesture accompanying the uttered
sentence. These audiovisual recordings were later used as stimuli in an experi-
ment on the e�ect of gestures to prominence perception.
242

Experiment I
The shortcomings of previous methods make it di�cult to address how the
di�erent acoustic correlates of prominence relate to one another and also to
gestures. In this study, the speech signal was manipulated to neutralise the
prominence-lending properties of f 0 and intensity in three di�erent experimental
conditions. Whereas the manipulation of intensity did not present much of a
problem, manipulation of f 0 easily resulted in the complete �attening of f 0 con-
tours, thus eliminating the naturalness of the speech stimulus. As a result, into-
nation peaks were reduced while respecting minimal f 0 contours within a nar-
row range of 20 Hz for all sentences, corresponding to 2.22 ST (SD = 0.68 ST).
In this case, a 20-Hz di�erence between the highest and lowest peak was used,
which gave an average of 2.22 ST for all sentences, thus falling within the per-
ceptual threshold proposed by ’t Hart (1981), although just noticeable di�erences
(JND’s) for perceiving f 0 changes in intonation di�er among researchers (’t Hart,
1981; Klatt, 1973; Rietveld & Gussenhoven, 1985). Nevertheless, a semitone scale
was used in Experiment II, as explained above (§ 3.3.3). Themanipulation of stim-
uli was limited in that it was not possible to conceive of a suitable way to also
manipulate duration in the audiovisual modality without creating a mismatch
between the neutralised duration of syllables and the articulatory gestures of
speakers.
Hypothesis 1: methodology
Initially, a correlation testwas conducted, and participants’ agreement through
Cohen’s kappa was calculated in order to assess the feasibility of the experi-
mental task despite the variability inherent to the spontaneous speech stimuli
and the manipulations on the acoustic correlates of prominence. The correl-
ation test showed consistency between the prominence marks given by parti-
cipants and sentence length, especially in longer sentences. Agreement among
243

Experiment I
participants’ marks of prominence was calculated through mean Cohen’s kappa,
which yielded a value of � = .39. This low agreement re�ects the disparity of
judgements across the three experimental conditions in both modalities, which
included very di�erent acoustic and visual cues of prominence, especially when
compared to the inter-rater agreement obtained by two trained listeners (� = .83),who counted on all acoustic cues of prominence in their marking. When parti-
cipants’ prominence marks were compared pairwise to those of the two trained
listeners, mean Cohen’s kappa decreased slightly (� = .38), thus revealing a de-
viance from this ‘gold standard’. Nevertheless, previous studies using stimuli
lacking any acoustic manipulations, and presented in the audio-only modality,
reached just slightly higher values. For example, Streefkerk (2002) obtained a
mean Cohen’s kappa of � = .56 for prominence marking at a word level, and of� = .48 for prominence marking at a syllable level, while Mo et al. (2008), using
Fleiss’s kappa for agreement among multiple raters obtained a value of � = .39.In this experiment, prominence marking was conducted at a word level be-
cause the length of most sentences would have made it di�cult for participants
to label syllables or syllabic groups. Besides, it has been observed that words are
more meaningful units than syllables for prominence marking by naive listeners
(e.g. Rosenberg & Hirschberg, 2009; Streefkerk, 2002), as previously discussed (§
3.1.1). Similarly, it was opted for binary marking (prominent vs. non-prominent)
in order to simplify the experimental task. In other studies on the perception of
prominence, binary prominence marking was conducted, for example, for two
targetwords (House et al., 2001), short sentenceswith several targetwords (Krah-
mer& Swerts, 2007), or read-aloud sentences from a telephone corpus (Streefkerk
et al., 1997) (see Table 8 for a summary). In the procedure applied here, similar to
Streefkerk et al.’s (1997) study, all words in the sentence were made available for
marking, which could also demand a great e�ort from the participants depend-
244

Experiment I
ing on sentence length. However, although this was compensated by o�ering the
possibility to participants to play back each stimulus several times until comple-
tion of the marking, it was possible that participants relied excessively on reas-
oning rather than on perceptual processes. Therefore, a single playback of the
stimuli in the marking task might be a better option in a subsequent experiment,
together with the use of short sentences as stimuli. By doing so, participants can
rely more on short-term memory in their judgements (see Quak et al., 2015, for
details). Besides, it was observed that the experimental task, consisting on binary
prominence marking, should also include �ller sentences that require constant
attention from participants on the screen, especially during the audiovisual mo-
dality. It was the case that raters, knowing that they were to rate for prominence
during the experimental task, often closed their eyes in advance to concentrate
on the speech input and disregarded the visual cues of prominence at their dis-
posal.
In order to understand which variables determined prominence marking in
this pilot study, di�erent generalised linear mixed models (GLMMs) were built,
and they were later compared by means of the Akaike Information Criterion
AIC (Akaike, 1973) (see Table 19). Despite the fact that model building and se-
lection based on AIC are still relatively uncommon in the �eld of linguistics (e.g.
Adamou et al., 2018), this procedure has being gaining popularity over the last
decade in other �elds such as biology, ecology, or evolution, where it is now
often applied (see e.g. Arnold, T. W., 2010; Grueber et al., 2011, for details). In
this study, the estimation and comparison of di�erent models showed that in
the minimal adequate model, M18, prominence marking was determined by the
predictors modality, condition, fundamental frequency, duration, gesture-stroke,
gesture-apex, gesture-hold, together with the interactions of modality with: con-
dition, fundamental frequency, duration, gesture-stroke, and gesture-apex. Neither
245
Experiment I
intensity nor gesture-retraction were included in the �nal model, and although
gesture-recoil was, it proved non-signi�cant.
Although random slopes have been suggested to be included inmixedmodels
for all signi�cant predictors to assess the signi�cance of �xed e�ects (e.g. Baayen
et al., 2008; Barr et al., 2013), it becomes increasingly di�cult to specify a max-
imal random-e�ects structure as suggested by Barr et al. (2013). For example,
di�erences in the random e�ects between modelM18 and modelM19—the latter
included random slopes formodality and condition in by-subject random e�ects—
did not result in a lower AIC value. Additionally, when trying to declare random
e�ects in thisM18 including bothmodality and condition, the model,M18’, failed
to converge and was dropped out. This problem has previously been pointed out
by Bates et al. (2015a), since attempting to incorporate main e�ects and inter-
actions for subjects and items often requires the estimation of a high number of
variance-covariance parameters (see § 3.2.1).
Hypothesis 2: acoustic correlates of prominence
As predicted in hypothesis 2.1, the di�erences in prominence marks of all ex-
perimental conditions were signi�cant when compared to the control condition.
The highest number of marks was found in C3, when listeners relied on min-
imal acoustic cues of prominence in the speech signal. These di�erences proved
also signi�cant in the statistical model�18, the minimal adequate model, which
con�rmed that words were more likely to be marked as prominent in all three
experimental conditions.
As for hypothesis 2.2, it is beyond the scope of this pilot study to pinpoint the
variables responsible for the marks of prominence given in each condition. In ad-
dition, the similar pattern observed in C1 andC3might be due to the fact that par-
ticipants lacked the cues of prominence provided by f 0. Fundamental frequency
246

Experiment I
has traditionally been considered a reliable cross-linguistic cue of prominence
and has also often been held as perceptually more important than duration for
prominence perception (e.g. Beckman& Edwards, 1994; Kohler, 2008; Pierrehum-
bert, 1980; Terken, 1996). Nevertheless, in the responses given by participants,
duration had a stronger e�ect than f 0, maybe due to the fact that it was the only
correlate available across conditions. The crucial role of duration in the percep-
tion of phrasal prominence is also supported by previous studies (e.g. Kochanski
et al., 2005; Ortega-Llebaria, 2006; Mo, 2008a; Silipo & Greenberg, 2000). Inter-
estingly enough, both correlates were found to have an e�ect on the probability
of words being given a mark of prominence through the predictormodality, and
they seemed to play a less important role in prominence perception in the audio-
visual modality. Seen from a di�erent perspective, the stressed syllable of words
needed to be higher in pitch and longer in duration in the audio-only than in the
audiovisual modality to be considered prominent (Figure 40c and Figure 40d).
Hypothesis 3: gestural correlates of prominence
In the case of hypothesis 3.1 regarding the role of the audiovisual modality,
it was observed that the number of marks given by participants when the visual
cues of prominence were present increased in all conditions respect to the audio-
only modality, although none of these di�erences was signi�cant (Figure 36a).
In this sense, all conditions proved signi�cant when compared to the control in
the audio only modality (Figure 36b), but in the audiovisual modality only C3
did (Figure 36c), i.e. the marks given in the audiovisual modality did not increase
proportionately in all conditions respect to the audio-only modality, as happened
in the control condition, but achieved similar values.
Furthermore, as seen in the statistical modelM18, generally words were more
likely to be considered prominent when the visual cues of prominence were
247

Experiment I
present. However, in the interaction between modality and condition, this ef-
fect was reversed and listeners were less likely to mark words in C1 and C3 in
the audiovisual modality than in C0. This was not the case for C2, which did
not proved signi�cantly di�erent from the control condition when both modal-
ities where compared. Possibly, the uncertainty caused by the absence of clear
the acoustic cues resulted inmore randommarking of prominence, and the visual
information might help participants concentrate their prominence marks around
the more clearly perceived visual cues of prominence.
Since most gestures were performed with more than one articulator, the ana-
lysis did not focus on di�erences among gesture articulators, but rather on ges-
ture phases. Themarks of prominence given to each gesture phasewere observed
to vary among conditions and modalities. Hypothesis 3.2 was not supported by
the results, which showed that stroke seemed to be the only phase that signi�-
cantly received more marks of prominence in the audiovisual modality (Table 17
and Figure 37b). This was con�rmed in model �18 by an interaction between
stroke and modality revealing that participants were more likely to mark words
coinciding with this gesture phase than with apexes in the audiovisual modal-
ity. Conversely, apexes made words much less likely to be considered prominent
in the audiovisual modality. The time-alignment between apexes and pitch ac-
cents has been consistently reported (e.g. Esteve-Gibert & Prieto, 2013; Jannedy
& Mendoza-Denton, 2005; Leonard & Cummins, 2010; Loehr, 2004), so it is pos-
sible that the manipulations conducted in the speech signal might be responsible
for this di�erence. To a lesser extent, participants also considered prominent
words that coincided with the gesture phase of hold, probably because the still
movement of articulators—mainly hands—a�orded a perceptually clear cue.
Additionally, this Experiment I has con�rmedAmbrazaitis andHouse’s (2017)
results for the prevalence of gestures simultaneously performed with more than
248

Experiment I
one articulator. In their study, Ambrazaitis and House analysed use of eyebrow
and head movements to convey information structure using recordings of TV
newsreaders and found that eyebrow movements were rarely produced in isola-
tion but occurred much more frequently together with a head movement. Simi-
larly, in this study using spontaneous speech material, it was observed that ges-
tures were mostly produced by combining di�erent body parts, especially hands
and head (51.1% of the occurrences); and, to a much lesser extent, hands, eye-
brows, and head (11.1%). In the case of gestures that were produced with a single
body part, it was mostly the hands that performed the gesture (23.5%). Interest-
ingly enough, and di�erently fromAmbrazaitis and House, very few occurrences
of gestures produced with eyebrows and head (1.1%) were found, which might
be due to the limited expressivity of newsreaders compared to more expressive
samples from the speech material used in this study, i.e. spontaneous speech
from television talent shows.
All in all, this pilot study indicates that the methodology here proposed can
be successfully applied to the study of the multimodal perception of prominence.
Spontaneous speech extracted from television talent shows was used to create
stimuli applying the neutralization of both f 0 and intensity as acoustic cues of
prominence. This and the use of a binary marking at a word level—provided
variability is controlled for—have proved reliable in a prominence-marking task.
Thus, a large-scale study is envisaged in Experiment II to better understand the
multimodal perception of prominence in each experimental condition, which is
to con�rm the results obtained here, which have provisionally con�rmed some
of the hypotheses that were initially formulated. On the other hand, research on
how acoustic and visual cues of prominence interact presents some limitations
249

Experiment I
both as to how naturally elicit gestures in controlled settings and as to what ex-
tentmultimodal perception studies with animated agents can be generalised. The
approach o�ered here can contribute in this sense by adding ecological validity
to previous studies and can serve as a useful method in the more general research
of multimodal interactions.
250

Experiment II
5.1 Introduction
The aim of this second experiment was to build on the methodology laid out
in the previous pilot study in order to analyse how the acoustic cues of promi-
nence are used by listeners with and without visual cues to detect phrasal prom-
inence in Castilian Spanish.
The acoustic correlates of prominence present cross-linguistic di�erences.
In the case of Spanish, lexical prominence is rendered by a �at pitch contour,
together with longer duration and stronger intensity for unaccented stressed
syllables; while phrasal prominence, i.e. accented stressed syllables, is cued by
longer duration, higher f 0, larger f 0 excursions, and increased overall intensity
(Ortega-Llebaria, 2006). Furthermore, the preponderant role of duration, both
as a correlate of lexical stress and phrasal stress, was con�rmed by Vogel et al.
(2016), although they also observed that f 0 contributed to cue both stressed and
unstressed syllables in the absence of pitch accents and that intensity helped
duration in cueing accented stressed syllables, but not accented unstressed ones.
On the other hand, it has been observed that the visual correlates of prom-
inence (e.g. gestures performed with hands, eyebrows, or head) interact with
verbal prosody (e.g. Al Moubayed et al., 2010; Granström et al., 1999; Kim et al.,
251

Experiment II
2014; Krahmer & Swerts, 2007; Prieto et al., 2011; Scarborough et al., 2009). In
the case of prominence perception, visual cues result in stronger production and
perception of verbal prominence (Krahmer & Swerts, 2007); and in the case of
facial gesturing, for example, it has been found to systematically in�uence the
perception of verbal prominence (Dohen & Lœvenbruck, 2009; House et al., 2001;
Swerts & Krahmer, 2008).
Most studies having addressed the interaction of visual and verbal promi-
nence have so far made use of both lip-synchronised animated agents (e.g. Al
Moubayed & Beskow, 2009; Granström et al., 1999; House et al., 2001; Krahmer
et al., 2002a,b; Prieto et al., 2011) and experimental settings in which gestures are
elicited with controlled speech stimuli (e.g. Dohen & Lœvenbruck, 2009; Fox-
ton et al., 2010; Krahmer & Swerts, 2007). In both cases, the visual cues of
prominence—limited to beats produced by eyebrow raises and head nods, and oc-
casionally also by hand gestures (Krahmer & Swerts, 2007)—have been observed
to enhance verbal prominence perception.
Certain studies have pointed out di�erences between men and women in the
audiovisual perception of speech, which has been supported by neuroanatomical
di�erences, with a stronger activation in bilateral brain areas causing a more ef-
�cient audiovisual language processing in women (Dancer et al., 1994; Öhrström
& Traunmüller, 2004; Ruytjens et al., 2006, 2007; Watson et al., 1996).
Additionally, di�erent gesture phases align with di�erent intonational units,
and a strong temporal connection has been reported between apexes and pitch
accents (Esteve-Gibert & Prieto, 2013; Kendon, 1972; Jannedy&Mendoza-Denton,
2005; Loehr, 2012), giving support to the phonological synchrony rule (PSR) pos-
ited by McNeill (1992).
This Experiment II is based on the pilot study conducted on Experiment I,
however in this case some methodological di�erences exist from Experiment
252

Experiment II
I. First of all, the study was conducted online, and stimuli were presented to
participants in two modalities: audio-only and audiovisual in four independent
experiments corresponding to four experimental conditions, which involved the
neutralization of the acoustic correlates of prominence—similar as in Experiment
I (§ 3.3.3). The neutralization was conducted on (a) f 0 in Exp1, (b) intensity in
Exp2, and (c) both f 0 and intensity in Exp3; no neutralisation in the control con-
dition, Exp0. Similar to Experiment I the prominence marks provided by two
trained listeners served as ‘gold standard’ for agreement comparisons.
Since obtaining details of the variables predicting prominence perception
in each experimental condition was not possible in Experiment I, the between-
subjects design of this Experiment II allowed to conduct analyses separately for
each experimental condition in order to better understand the factors involved in
themultimodal perception of acoustic prominence. Due to the provisional nature
of the results in Experiment I, all initial hypothesis are maintained. The aspects
common to both experiments have been previously discussed: speech material
(§ 3.3.2), participants (§ 3.3.4), gesture annotation (§ 3.3.5), and data analysis (§
3.3.6); however, details of the current experiment di�ering from Experiment I are
reported in each speci�c section.
5.2 Methodology
5.2.1 Participants
Participants were mainly recruited through social media to take part in an
online study that was advertised as an experiment on memory and perception.
For their participation they were not �nancially compensated.
Several criteria were used to assure the reliability of the collected data: parti-
cipants had to have Castilian Spanish as their mother tongue; be settled in Spain
253

Experiment II
at the moment of participation (according to their IP-addresses); and have taken
at least 6minutes to complete the experimental task, but nomore than 13minutes
(mean time for completion was 9’ 17”, SD = 2’ 32”), since the intention was to pre-
vent them from overly relying on logical inferences in their marking for promi-
nence. After applying these criteria the answers provided by 240 naïve listeners
(68 men and 172 women) were used—30 per modality and condition—, adding up
to total of 12960 rated words. The declared age of participants ranged between
18 and 66 years (M = 36.98, SD =10.55; Mmen = 39.80, SD = 10.75; Mwomen = 35.86,
SD = 10.26), with a predominance of participants under 50 years of age (Figure
41, see Appendix B1a for details).
Figure 41: Details of participants’ age per condition.
254

Experiment II
At the end of the experiment, information about participants’ mother tongue
and musical training was collected. For the reasons previously explained (§
3.3.4), it was decided to control for the e�ect of participants’ ability to perceive
small changes of frequency in the prominence-marking task, especially given the
nature of the stimuli, in which f 0 was neutralised in two of the four conditions
by keeping the intonation curve within a short range of 2 ST. Thus, participants
were grouped according to their level of musical training into those with no mu-
sical training (none), up to 5 years of formal musical training (little), and over 5
years of formal musical training (much) (Figure 42, see Appendix B1b for details).
Figure 42: Details of participants’ level of musical training per condition.
255

Experiment II
5.2.2 Stimuli
Four target sentences were manipulated to neutralize f 0 and intensity as
acoustic correlates of prominence and were administered in three di�erent ex-
perimental conditions, as described above (§ 3.3.3). The only di�erence respect to
Experiment I is that neutralised f 0 was manually smoothed within a 2-semitone-
range between the highest and lowest values of the resulting intonation curve. A
fourth, condition was included with a control group relying on all acoustic cues
of prominence.
In experimental condition Exp1, where f 0 was neutralised, the values for in-
tensity ranged between 62-80 dB (M = 73.11, SD = 3.54) for the stressed vowel
and for duration, 0.027-0.379 seconds for the syllable (M = 0.110, SD = 0.069). In
Exp2, the values for intensity were averaged at 69 dB, while f 0 ranged between
140-307 Hz (M = 199.31, SD = 40.04) for maximum f 0 in the stressed vowel (or
vowel in adjacent syllable), with the same values as in Exp1 for duration. Finally,
in Exp3, both f 0 and intensity were neutralised as in the previous two conditions,
and duration served as the only acoustic cue of prominence, with the same val-
ues as in Exp1 and Exp2. In the control condition, Exp0, participants relied on all
non-manipulated acoustic cues of prominence. Additionally, as in Experiment
I, two trained listeners also annotated the non-manipulated stimuli both in the
audio-only and in the audiovisual modality (§ 4.2.2).
5.2.3 Experiment design
This Experiment II was designed to be conducted via the Internet (§ 5.2.1) as
four independent experiments, one for each of the conditions to be tested. Due to
the time limitations that carrying out an experiment on the Internet may involve,
the experiment was designed in such a way that 30 participants only rated once
256

Experiment II
the same stimulus in one of the modalities and in one of the conditions. This
also avoided unwanted learning e�ects in participants. The resulting between-
subjects design had 60 participants taking part in each experimental condition:
half of them rated the stimuli in only one of the two modalities, while the other
half did so in the remaining modality. Adding up the four conditions, a total of
240 participants rated the same stimuli.
Stimuli were randomised for each condition, and they included 4manipulated
target sentences, 2 non-manipulated sentences, and 3 �ller sentences asking par-
ticipants to report on either a visual element in the images they had just seen, or
a word from the sentence they had just heard (see Appendix B for details). Filler
sentences were intended to make participants pay close attention to the images
displayed on the screen. It had been observed in the previous experiment, similar
to Krahmer and Swert’s (2007) experience, that participants tended to close their
eyes and concentrate on the acoustic cues of prominence once they had got used
to the experimental task, thus neglecting the images on the screen that were at
their disposal in the audiovisual modality.
5.2.4 Hypotheses
For this Experiment II, all three hypotheses 1, 2, and 3 previously formu-
lated for Experiment I are retained, even if some were not fully supported in the
results presented there. Due to the provisional nature of the results obtained in
Experiment I, it is intended to o�er more solid arguments in this Experiment II in
order to �nally refute of con�rm the hypotheses initially formulated. Apart from
them, two more hypotheses are now added for individual variables that were not
possible to analyse due to the small sample size:
4. Musical training
257

Experiment II
Participants having had formal musical training will perform signi�cantly
di�erent than those with little or no musical training when prominence
marking involves pitch discrimination skills, especially when f 0 is avail-
able as an acoustic cue.
5. Participant gender
Womenwill perform signi�cantly di�erently frommen at the experimental
task in the audiovisual modality.
5.2.5 Procedure
The experiment was conducted using the online survey software SmartSur-
vey1. At the recruitment stage, participants were asked to take around 10minutes
to conduct the experiment on a computer in a quiet environment through head-
phones. In each experimental condition, they were �rstly presented with a brief
set of instructions explaining that the experiment involved two di�erent tasks:
on the one hand, binary prominence marking, in which they had to mark any
words they considered prominent in the sentence; and on the other hand, a
memory task, in which they had to report on certain visual elements that had
been displayed on the screen, or certain words in the sentence they had just
heard (see Appendix B1 for details). After instructions, participants had the op-
portunity to get acquainted with the experiment in a series of trials.
As for both experimental tasks, they were conducted in two stages: �rstly,
participants were presented with a sentence on the screen (Figure 43a); then,
a second screen revealed the task they were required to complete, whether a
prominence task (Figure 43b) or a memory task, i.e. �ller sentences (Figure 43c).
In the case of prominence marking, participants were allowed to play back the
1 https://smartsurvey.co.uk.
258

Experiment II
clip just once more in order to decide which words were prominent and click on
the check-boxes displayed under the words uttered by the speaker. In the case
of the memory task, they had to answer a multiple choice question.
Importantly, participants were not allowed to go back to a previous screen
through the ‘back-arrow’ icon on their web browsers. If they did, the experi-
ment was immediately invalidated. Participants were not allowed either to skip
a questionwithout giving a response, as the red asterisk at the end of the question
displayed on the screen indicated (Figure 43).
259

Experiment II
(a)
(b)
(c)
Figure 43: Three sample screens corresponding to the two experimental tasks of the experiment in the
audiovisual modality. Screens (a) and (b) correspond to the same stimulus for prominence marking:
(a) shows a videoclip for participants to watch just once. After clicking on Página siguiente (‘Next
page’) at the bottom, screen showed in (b) is displayed to mark prominence, as indicated by check-
boxes. Screen (c) shows an example of the memory task, with a question about any visual element
displayed on the screen. Screen (c), same as (b), is displayed after having watched a videoclip just
once like that in (a).
260

Experiment II
5.3 Results
5.3.1 Descriptive statistics
5.3.1.1 Prominence marks
The four target sentences included 54 words available for marking to each
participant and added up to 12960 words, out of which 3202 (24.7%) received
a mark of prominence. Prominence marks per sentence ranged between 2.76
and 3.97 (M = 3.33, SD = 1.98). The two speakers received, respectively, 1619
marks of prominence out of 7440 words (21.7%), and 1583 out of 5520 (28.6%) (see
Appendix B2 for details). In addition, Negation was the word class that ranked
highest, receiving a mark of prominence in 65.8% of the cases (see Appendix B3
for details).
5.3.1.2 Inter-rater agreement
Inter-rater agreement was calculated as in Experiment I (§ 4.3.1.2, Table 15).
Mean Cohen’s kappa (1960) was computed for all pairs of participants (N = 240)
according to their marks per experimental condition and modality (n = 30) (Fig-
ure 22).
The highest agreement was reached by the 30 participants that rated the
audio-only modality in Exp0 (� = .42), which contrasted with the poorer agree-
ment of the 30 participants that rated the same condition in the audiovisual mo-
dality (� = .34). In addition, the agreement calculated independently for two
trained listeners relying on all acoustic cues of prominence in both the audio-
only (� = 1.0) and the audiovisual modality (� = .89) was very high.
261

Experiment II
Condition Modality
Audio-only (A) A-TL Audiovisual (AV) AV-TL
Exp0 0.422 0.430 0.343 0.287
Exp1 0.290 0.297 0.269 0.222
Exp2 0.283 0.291 0.380 0.386
Exp3 0.350 0.366 0.356 0.368
Trained listeners 1.00 0.89
Table 22: Details of inter-rater agreement expressed as mean Cohen’s kappa for all pairs of parti-
cipants per condition and modality: audio-only (A) and audiovisual (AV). Additionally, mean values
for pairwise comparisons of all participants’ marks including those of two trained listeners in both
modalities are given as A-TL and AV-TL.
With the neutralization of the acoustic cues of prominence, agreement of par-
ticipants was generally poorer in the three experimental conditions. In the case
of Exp1, a similar decrease as in Exp0 was also found in the audiovisual modality
(� = .27), which represents the lowest agreement overall. Conversely, this was
reversed in Exp2, where the visual cues made participants increase their agree-
ment not only over the audio-onlymodality (� = .38), but also over the agreement
of the control condition in the audiovisual modality. In Exp3, agreement values
were almost identical in the audio-only (� = .350) and in the audiovisual modality
(� = .356).
Interestingly, when the marks of all participants were compared pairwise to
those of two trained listeners, which served as a ‘gold standard’, mean Cohen’s
kappa increased slightly for Exp0 in the audio-only modality (� = .43), but de-
creased considerably in the audiovisual modality (� = .28). A similar pattern was
observed for the other three conditions in the audio-only modality. This was
not the case, however, in the audiovisual modality, where this increase was min-
imal for Exp2 and Exp3, while it decreased in Exp1. This reveals that agreement
of participants’ responses was higher when compared one-to-one to the ‘gold
standard’ in the audio-only than in the audiovisual modality.
262

Experiment II
5.3.1.3 Prominence and acoustic cues
In order to observe in more detail the distribution of marks, the total words
available for marking was broken down per modality and condition. As it can be
observed in Table 23, words received fewer prominence marks in the audiovisual
modality across conditions. This was not the case for the control condition, Exp0,
which received the highest number of marks in the audiovisual modality (26.7%)
as well as the lowest number of marks in the audio-only modality (21.0%). When
compared to control, all experimental conditions received fewer marks, with a
maximum di�erence of 5.5% observed in Exp2.
Modality Words for marking percondition and modality
Prominent words (%)
Exp0 Exp1 Exp2 Exp3
3240 774 (23.8) 820 (25.3) 829 (25.5) 779 (24.0)
A 1620 341 (21.0) 415 (25.6) 459 (28.3) 403 (24.8)
AV 1620 433 (26.7) 405 (25.0) 370 (22.8) 376 (23.2)
AV (±%) +5.7 –0.6 –5.5 –1.6
Table 23: Distribution of marks of prominence per experimental condition for both modalities com-
bined (n = 3240) and for each modality separately (n = 1620): audio-only (A) and audiovisual (AV).
Participants relied on intensity and duration in Exp1, on f0 and duration in Exp2, and on duration in
Exp3. In Exp0, participants relied on all acoustic cues of prominence. Total words for marking added
up to N = 12960.
5.3.1.4 Prominence and visual cues
Prominence was also analysed per gesture phase for all conditions. In this
case, the audio-only modality, where participants did not rely on the visual cues
of prominence served as the baseline to compare the marks given to words co-
inciding with the di�erent gesture phase in the audiovisual modality. Due to the
small sample size of stimuli in this Experiment II, gestures were not analysed ac-
263

Experiment II
cording the articulator withwhich theywere performed. Overall, it was observed
that fewer words coinciding with each di�erent gesture phases were considered
prominent in the audiovisual condition (Table 24).
Gesturephase
Words for marking percondition and modality
Prominent words (%)
C0 C1
A AV AV (±%) A AV AV (±%)
Preparation 270 25 (9.2) 28 (10.3) +2.9 35 (12.9) 32 (11.8) +5.5
Stroke 420 19 (4.5) 27 (6.4) +1.9 28 (6.6) 43 (10.2) +3.6
Apex 540 213 (39.4) 262 (48.5) +9.1 232 (42.9) 225 (41.6) –1.3
Hold 210 55 (26.2) 64 (30.4) +4.2 74 (35.2) 58 (27.6) –7.6
Recoil 180 21 (11.6) 19 (10.5) –1.1 31 (17.2) 28 (15.5) –1.7
Total 1620 341 (21.0) 433 (26.7) + 5.7 415 (25.6) 405 (25.0) –0.6
(a) Prominent words according to gesture phase for Exp0 and Exp1
Gesturephase
Words for marking percondition and modality
Prominent words (%)
C2 C3
A AV AV (±%) A AV AV (±%)
Preparation 258 42 (15.5) 28 (10.3) –3.4 18 (13.4) 27 (18.3) +4.9
Stroke 174 22 (5.2) 67(15.9) +10.7 26 (6.1) 42 (10.0) +3.9
Apex 270 246 (45.5) 238 (44.0) –1.5 232 (42.9) 217 (40.1) –2.8
Hold 164 79 (37.6) 47 (22.3) –15.3 74 (35.2) 66 (31.4) –3.8
Recoil 78 25 (13.8) 22 (12.2) –1.6 37 (20.5) 26 (14.4) –6.1
Total 1062 459 (28.3) 370 (22.8) –5.5 403 (24.8) 376 (23.2) –1.6
(b) Prominent words according to gesture phase (cont.) for Exp2 and Exp3
Table 24: Di�erent gesture phases coinciding with words given a mark of prominence per condition
and modality (n = 1620; N = 12960). Values for the audio-only modality, where no visual information
was available, served to compare the marks given by participants in the audiovisual modality. This
di�erence is expressed as AV (±%). Acoustic cues were intensity and duration (Exp1), f0 and duration
(Exp2), and only duration (Exp3). All three acoustic cues of prominence were available in the control
condition (Exp0).
This di�erence was highest in Exp2 for the hold phase, where marks de-
creased by 15.3% between the audio-only modality (79 occurrences, 37.6%) and
264

Experiment II
the audiovisualmodality (43 occurrences, 22.3%). Interestingly, preparation, apex,
and hold consistently decreased in all conditions in the audiovisual modality,
while strokes is the only phase that increased in all experimental conditions.
The gesture phase with the highest marks of prominence was apex, which
received 262 marks out of 540 occurrences (48.5%) in the audiovisual modality in
the control condition (Exp0). A minimum was observed for strokes also for Exp0
in the audiovisual modality, with 6 out of 174 occurrences (3.4%).
5.3.1.5 Prominence per sentence: P-score
One of the advantages of presenting four target sentences to participants
was the possibility of observing in detail how the marks of prominence were
distributed for all sentences across conditions and modalities. Thus, prominence
marks were pooled to achieve a more �ne-grained scale of prominence. The
proportion of participants who considered a word as prominent was expressed
as a prominence score (P-score) ranging between 0 and 1 (e.g. Cole et al., 2010;
Mo, 2008a; Swerts, 1997). This was calculated as the number of marks given to
a certain word within a sentence for each condition and modality divided by the
number of possible marks for that word (n = 30) (Table 25).
265

Experiment II
Word Total marks Marks per condition and modality P-score(e.g. Exp3-AV)
Ex0 Exp1 Exp2 Exp3
A AV A AV A AV A AV
y 32 4 5 3 6 10 4 0 0 .00
más 208 28 30 24 25 27 29 22 23 .76
si 5 1 1 0 0 0 1 0 2 .06
lo 4 0 0 2 0 0 0 0 0 .00
has 16 1 4 3 1 1 2 3 1 .03
hecho 40 4 6 5 5 7 4 5 4 .13
con 23 1 3 3 3 3 5 3 2 .06
conciencia 159 16 19 22 22 16 20 22 22 .73
de 5 1 0 2 1 1 0 0 0 .00
lo 4 1 1 2 1 0 1 0 0 .00
que 9 1 1 3 1 0 2 1 0 .00
estabas 65 5 9 11 7 10 9 9 5 .16
haciendo 94 9 9 11 10 12 11 17 15 .50
Table 25: Example of cumulative marks of prominence given by 240 participants (60 per condition,
30 per condition and modality) to a target sentence that illustrate how P-scores are calculated (e.g.
condition Exp3 in the audiovisual modality).
These valueswere then comparedwith the P-scores calculated for two trained
listeners as a ‘gold standard’ for all target sentences (Figure 44). Generally, the
P-scores of participants seemed to coincide with those of trained listeners, espe-
cially for clearly prominent words, most of which co-occurred with the apex of
a gesture. This can be seen, for example, in words of: sentence 1 /"nunka/; sen-
tence 2 /"unos/ and /"otRos/; sentence 3 /"sako/; and sentence 4 /mas/. This is not
the case, however, for all prominent words coinciding with an apex, as in /"ido/
in sentence 3 and /kon"TienTia/ and /mal/ in sentence 4, where the P-scores of
participants are consistently lower than those of trained listeners.
Di�erently, words with low or none prominence in the ‘gold standard’ often
reached higher P-scores when marked by participants, as the last words of sen-
266

Experiment II
tence 1 /"una "mala pa"labRa/; both the initial sequence in sentence 2, /te"nemos
mas afini"da/, and the ending words prior to the last word coinciding with an
apex, /ke kon/; the beginning of sentence 3, /i lo pRi"meRo/; and the end of sen-
tence 4, /es"tabas a"Tiendo/.
267

Experiment II
Figu
re44:G
raph
swith
P-scores
fortarget
sentencesresulting
from
thecumulativemarks
of240participan
ts(30percond
ition
andmodality
).Solid
blacklin
esshow
sP-scores
ofthe‘goldstan
dard’(GS)
provided
bytwotrainedlisteners.Dottedgrey
lines
correspond
toscores
intheau
dio-only
(A)
modality
,whiledotte
dredlin
esrepresentscoresintheau
diovisu
al(AV)
modality
.The
lowerX-axisshow
sphonetic
tran
scrip
tion,an
dtheup
perx
-axis,
thegesturearticulator
andtheph
asecoinciding
with
each
word(HA:h
and;HA.HE:
hand
andhead;H
A.EY.HE:
hand
,eyebrow
s,an
dhead).In
control
cond
ition
(Exp0),allacousticcues
wereavailableforparticipan
ts.T
heyreliedon
intensity
anddu
ratio
nin
Exp1,onf 0
anddu
ratio
nin
Exp2,and
on
duratio
nin
Exp3.
268
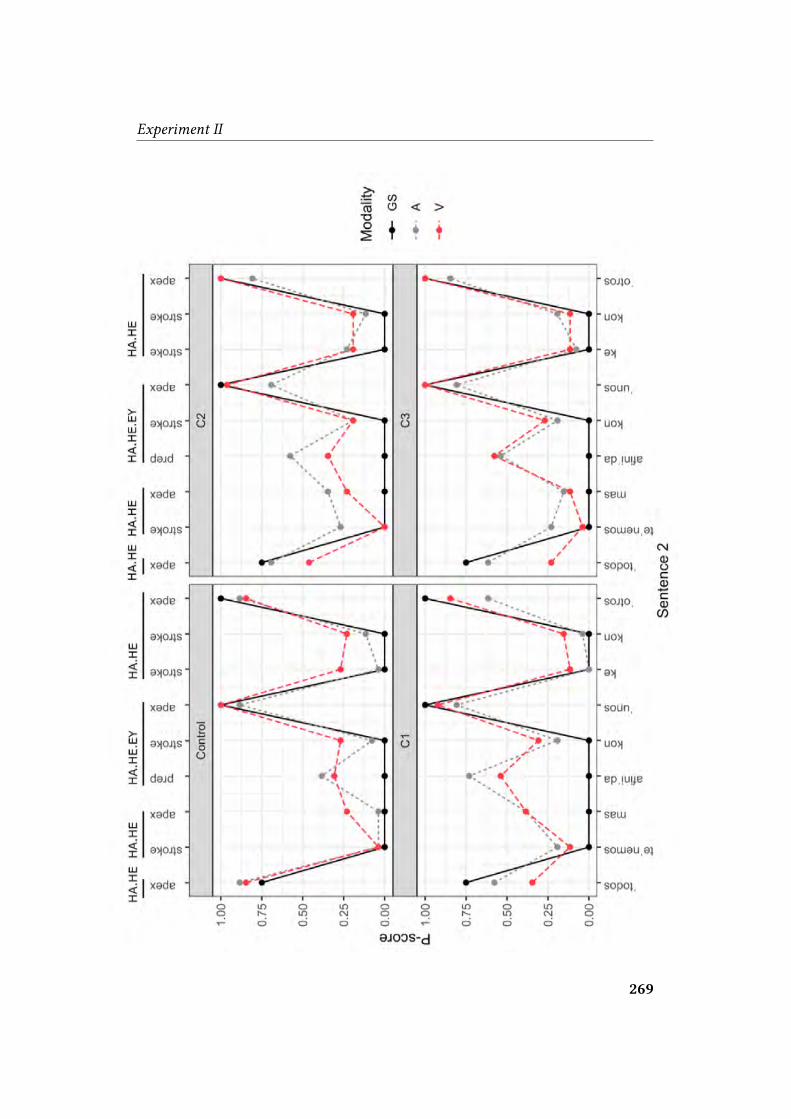
Experiment II
269

Experiment II
270

Experiment II
271

Experiment II
5.3.2 Inferential statistics
5.3.2.1 Number of prominence marks
The di�erence found between the marks given to each of the two speakers
(6.9%) was not signi�cant, � 2 (1) = 0.45, p > .05. However, when prominence
marks given by participants were compared between the audio-only and the au-
diovisual modality, a signi�cant di�erence was found in Exp0, � 2 (1) = 14.05, p <
.05, and Exp2, � 2 (1) = 12.55, p < .05. No overall di�erences were found between
the control condition and each experimental condition nor among experimental
conditions (Figure 45a). Furthermore, when the audio-only modality was inde-
pendently analysed, signi�cant di�erences were found between the control con-
dition Exp0 and Exp1, � 2 (1) = 9.19, p < .01; between Exp0 and Exp2, � 2 (1) = 22.72,p < .001; and between Exp0 and Exp3, � 2 (1) = 6.49, p < .01; as well as between
Exp2 and Exp3, � 2 (1) = 4.78, p < .01 (Figure 45b). In the audiovisual modality,
signi�cant di�erences were only found between Exp0 and Exp2, � 2 (1) = 6.36, p
< .05; and between Exp0 and Exp3, � 2 (1) = 5.16, p < .05 (Figure 45c).
(a) All conditions in both modalities
272

Experiment II
(b) Audio-only modality (c) Audiovisual modality
Figure 45: Signi�cant di�erences in the number of prominence marks per modality and condition.
Participants relied on intensity and duration in Exp1, on f0 and duration in Exp2, and on duration
in Exp3. In Exp0, participants relied on all acoustic cues of prominence.
Similarly, marks given to words coinciding with each gesture phase were
tested both between modalities in each condition and among conditions only in
the audiovisual modality. Signi�cant di�erences between modalities were found
for words coinciding with strokes in Exp0, � 2 (1) = 13.13, p < .01; and Exp2, � 2 (1)= 10.72, p < .01 (Figure 46a). Also apexes showed signi�cant di�erences between
modalities in Exp0, � 2 (1) = 8.65, p < .01 (Figure 46b). As for holds, di�erences
were found in Exp2, � 2 (1) = 10.89, p < .01 (Figure 46c). No di�erences between
modalities were found for preparation nor recoil in any condition.
Signi�cant di�erences in the audiovisual modality for strokes were found
between Exp0 and Exp2, � 2 (1) = 6.83, p < .01; between Exp0 and Exp3, � 2 (1)= 4.09, p < .05; as well as between Exp1 and Exp2, � 2 (1) = 7.87, p < .01; Exp1
and Exp3, � 2 (1) = 4.92, p < .05 (Figure 46a). In the case of the apex phase of
gestures, signi�cant di�erences in the audiovisual modality among conditions
were found between Exp0 and Exp1, � 2 (1) = 4.84, p < .05; and between Exp0 and
Exp3, � 2 (1) = 7.26, p < .01 (Figure 46b). The only di�erence for holds was found
273

Experiment II
between Exp2 and Exp3, � 2 (1) = 3.92, p < .05 (Figure 46c). No di�erences in the
audiovisual modality among conditions were found for preparation nor recoil.
(a) Stroke (b) Apex
(c) Hold
Figure 46: Graphs showing signi�cant di�erences per condition and modality in the number of
prominence marks coinciding with di�erent gesture phases. Participants relied on intensity and
duration in Exp1, on f0 and duration in Exp2, and on duration in Exp3. In Exp0, participants relied
on all acoustic cues of prominence.
274

Experiment II
5.3.2.2 Model building and model selection procedure
Similar to Experiment I, several GLMMswith a logit link functionwere estim-
ated for a binomial distribution. GLMMs are an extension of linear mixed models
(LMMs) for non-normal distributions, and both have been previously applied in
linguistic research (e.g. Adamou et al., 2018; Gries, 2015; Masson-Carro et al.,
2017; Quené, 2008). Mixed-models are more robust statistical tools than conven-
tional analysis of variance (ANOVAs) (Jaeger, 2008), as previously discussed (§
3.2.1 and § 3.2.1).
The between-subjects experiment design allowed not only to conduct partial
comparisons of each experimental condition with the control condition, as done
in Experiment I, but also to analyse each condition separately: control condi-
tion (§ 5.3.2.4), Exp1 (intensity and duration as acoustic cues § 5.3.2.5), Exp2 (f 0
and duration § 5.3.2.6), and Exp3 (only duration § 5.3.2.7). All models were built
through the lme4 package (Bates et al., 2015b) in R (2018), and all were estim-
ated using maximum likelihood (Laplace Approximation) were optimised with
BOBYQA (Powell, 2009) to increase iterations and avoid convergence errors.
5.3.2.3 Analysis A: Control vs. experimental conditions
Initially, a �rst set of models was built aiming at comparing all conditions
to the control, Exp0, using the same procedure as in Experiment I (§ 4.3.2.3).
The dependent variable prominence was modelled using the same variables of:
speaker (n = 2), sentence (n = 4), word (n = 54), modality (n = 2), and condition
(n = 5). Unlike Experiment I, the latter variable included a control in which 60
participants—30 per modality—relied on all acoustic cues of prominence. Addi-
tionally, the ‘gold standard’ provided by the marks of two trained listeners was
also included in the comparison, so as to have a reference for the marks given by
participants in the control condition, Exp0.
275

Experiment II
Together with these variables, each gesture phase was introduced separately
into the model in order to indicate their co-occurrence with the words receiving
a mark of prominence: preparation (n = 2), stroke (n = 2), apex (n = 2), hold (n
= 2), recoil (n = 2). The gesture phase retraction was not included because no
occurrences of this phase were found in the four target sentences.
Finally, as independent continuous variables, fundamental frequency, inten-
sity, spectral balance, and duration were fed into the model. These continuous
variables included the acoustic values of the 54 words available for marking (see
§ 3.3.6 for details on the conducted measurements). The continuous variables
were standardised as z-scores per sentence, since the acoustic values made par-
ticipants give a mark of prominence relative to the phrasal environment in which
words were uttered. The variable fundamental frequency was additionally stand-
ardised per speaker to avoid bias in pitch due to gender di�erences (see Appendix
B2, B3, and B4 for their respective distributions).
Fixed e�ects were declared in model G1withmodality predicting prominence
through an interaction with the gestures phases preparation, stroke, apex, hold,
recoil, and the standardised acoustic values of � (fundamental frequency), inten-
sity, spectral balance and duration. The decision to declare this as the initial model
was motivated by the results obtained in Experiment I (§ 4.3.2) and the research
questions. The predictors participant gender and musical training were also ad-
ded in this �rst model.
Random e�ects were declared with intercepts through the notation (1 | ...)
for both participants (1 | participant) and words (1 | speaker/sentence/word). By-
item random e�ects were declared as the nested variables ofword within sentence
within speaker, as previously discussed (§ 3.2.1, Figure 26c). In the formula nota-
tion of the lme4 package developed for R (2018) by Bates et al. (2015b), model G1
was declared as:
276

Experiment II
The set of resulting models was compared using the Akaike Information Cri-
terion AIC in R (2018) through the package AICcmodavg (Mazerolle, 2017). The
Akaike Information Criterions serves as an ordinal score to compare the quality
of the model. The AIC computes a correction based on the number of estimable
parameters, a so-called ‘penalisation for complexity’, and the AIC value has no
meaning of its own except as a way to rank models (Akaike, 1973; Burnham &
Anderson, 2002) (§ 3.2.4). Model building proceeded from models G1 to G13 by
removing progressively di�erent non-signi�cant predictors, and the AIC value
of models decreased accordingly (Table 28). From these, G11 yielded the lowest
value (AIC = 9940.89), followed by G10 (AIC = 9941.55) and G12 (AIC = 9941.78),
both within 2 AIC points from the top-ranked model (Table 28).
In the subsequent models, from G13 to G21 di�erent random structures were
declared, in which the upper level speaker of the nested by-item random e�ect
was removed, as in model G13. Thus models G14, G15, and G16 were extensions
of models G10, G11, and G12, respectively, in which slopes for the e�ects of mo-
dality were introduced in by-items random e�ects. Then, models G17 and G15,
their only di�erence being the declaration of random slopes in G18 for the ef-
fect of the variable condition, with an increase of the AIC value. In model G18,
the e�ect of the predictor gesture-preparation was removed, and in the last two
models, the predictor z-duration was removed from the interaction with modal-
ity. Finally the minimal adequate model from the set of estimated models was
G17, with an AIC value of 9929.41 (�� 0.73) and random slopes for the e�ect of
modality on by-item random e�ects.
277

Experiment II
Mod
elPr
ominen
ceas
afunc
tion
of(�)�x
ede�
ects,w
ithby
-sub
ject
andby
-item
rand
ome�
ects
LogL
ikelihoo
dK
AIC
� �� �
G1
mod
ality
x(con
ditio
n+prep
+stroke
+apex
+ho
ld+recoil+retractio
n+z-�+z-intensity
+z-H1H
2+z-du
ratio
n)+
+(1
|partic
ipant)+(1
|speaker/sentence/word)
–4942.24
329948.49
19.08
0.00
G2
mod
ality
x(con
ditio
n+prep
+stroke
+apex
+ho
ld+recoil+z-�+z-intensity
+z-H1H
2+z-du
ratio
n)+recoil+
+(1
|partic
ipant)+(1
|speaker/sentence/word)
–4944.39
319950.78
21.37
0.00
G3
mod
ality
x(con
ditio
n+prep
+stroke
+apex
+ho
ld+z-�+z-intensity
+z-du
ratio
n)+recoil+z-H1H
2+
+(1
|partic
ipant)+(1
|speaker/sentence/word)
–4944.43
309948.86
19.45
0.00
G4
mod
ality
x(con
ditio
n+prep
+stroke
+apex
+ho
ld+z-�+z-H1H
2+z-du
ratio
n)+recoil+z-intensity
++(1
|partic
ipant)+(1
|speaker/sentence/word)
–4944.56
309949.13
19.72
0.00
G5
mod
ality
x(con
ditio
n+prep
+stroke
+apex
+ho
ld+z-�+z-du
ratio
n)+recoil+z-H1H
2+z-intensity
+recoil+
+(1
|partic
ipant)+(1
|speaker/sentence/word)
–4944.60
299947.21
17.80
0.00
G6
mod
ality
x(con
ditio
n+stroke
+apex
+ho
ld+z-�+z-du
ratio
n)+prep
+recoil+z-H1H
2+z-intensity
++(1
|partic
ipant)+(1
|speaker/sentence/word)
–4944.94
289945.87
16.46
0.00
G7
mod
ality
x(con
ditio
n+stroke
+apex
+ho
ld+z-du
ratio
n)+prep
+recoil+z-H1H
2+z-intensity
+z-�+
+(1
|partic
ipant)+(1
|speaker/sentence/word)
–4945.28
279944.55
16.46
0.00
G8
mod
ality
x(con
ditio
n+stroke
+ho
ld+z-du
ratio
n)+prep
+apex
+recoil+z-H1H
2+z-intensity
+z-�+
+(1
|partic
ipant)+(1
|speaker/sentence/word)
–4945.91
269943.83
14.41
0.00
G9
mod
ality
x(con
ditio
n+stroke
+z-du
ratio
n)+prep
+apex
+ho
ld+recoil+z-H1H
2+z-intensity
+z-�+
+(1
|partic
ipant)+(1
|speaker/sentence/word)
–4946.70
259943.39
13.98
0.00
G10
mod
ality
x(con
ditio
n+stroke
+z-du
ratio
n)+prep
+apex
+ho
ld+z-H1H
2+z-intensity
+z-�+
+(1
|partic
ipant)+(1
|speaker/sentence/word)
–4947.78
249941.55
12.14
0.00
G11
mod
ality
x(con
ditio
n+stroke
+z-du
ratio
n)+prep
+apex
+ho
ld+z-H1H
2+z-�+
+(1
|partic
ipant)+(1
|speaker/sentence/word)
–4947.44
239940.89
11.48
0.00
G12
mod
ality
x(con
ditio
n+stroke
+z-du
ratio
n)+apex
+ho
ld+z-H1H
2+z-�+
+(1
|partic
ipant)+(1
|speaker/sentence/word)
–4948.89
229941.78
12.37
0.00
(a)S
ummaryof
AIC
results
forthe
GLM
Mrand
om-in
terceptm
odels.
278

Experiment IIMod
elPr
ominen
ceas
afunc
tion
of(�)�x
ede�
ects,w
ithby
-sub
ject
andby
-item
rand
ome�
ects
LogL
ikelihoo
dK
AIC
� �� �
G13
mod
ality
x(con
ditio
n+stroke
+z-du
ratio
n)+apex
+ho
ld+z-H1H
2+z-�+
+(1
|partic
ipant)+(1
|sentence/word)
–4948.89
219939.79
10.37
0.00
G14
mod
ality
x(con
ditio
n+stroke
+z-du
ratio
n)+prep
+apex
+ho
ld+z-H1H
2+z-intensity
+z-�+
+(1
|partic
ipant)+(m
odality
|sentence/word)
–4940.91
279935.94
12.14
0.00
G15
mod
ality
x(con
ditio
n+stroke
+z-du
ratio
n)+prep
+apex
+ho
ld+z-H1H
2+z-�+
+(1
|partic
ipant)+(m
odality
|sentence/word)
–4941.66
269935.52
6.11
0.03
G16
mod
ality
x(con
ditio
n+stroke
+z-du
ratio
n)+apex
+ho
ld+z-H1H
2+z-�+
+(1
|partic
ipant)+(m
odality
|sentence/word)
–4942.84
259935.68
12.37
0.00
G17
mod
alityx(con
dition
+stroke
)+pr
ep+ap
ex+ho
ld+z-H1H
2+z-�+z-du
ration
++(1
|participa
nt)+
(mod
ality|sen
tenc
e/word)
–491
5.71
4999
29.41
0.00
0.73
G18
mod
ality
x(con
ditio
n+stroke)+
prep
+apex
+ho
ld+z-H1H
2+z-�+z-du
ratio
n+
+(1
|partic
ipant)+(con
ditio
n+mod
ality
|sentence/word)
–4905.41
619932.82
3.41
0.13
G19
mod
ality
x(con
ditio
n+stroke)+
apex
+ho
ld+z-H1H
2+z-�+z-du
ratio
n+
+(1
|partic
ipant)+(m
odality
|sentence/word)
–4942.84
259935.68
12.37
0.00
G20
mod
ality
x(con
ditio
n)+prep
+stroke
+apex
+ho
ld+z-H1H
2+z-�+z-du
ratio
n+
+(1
|partic
ipant)+(m
odality
|sentence/word)
–4943.24
249934.47
5.06
0.06
G21*
mod
ality
x(con
ditio
n)+prep
+stroke
+apex
+ho
ld+textitz
-H1H
2+z-�+z-du
ratio
n+
+(1
|partic
ipant)+(con
ditio
n+mod
ality
|sentence/word)
–4904.14
829972.29
42.88
0.00
(b)S
ummaryof
AIC
results
forthe
GLM
Mrand
om-slope
models.
Table2
6:SummaryofAIC
results
forthe
GLM
Msrelatingthem
arking
ofprom
inenceby
participan
tsas
afunctio
nofpredictorsdeclared
as�x
ede�ects.
Allmodelsinclud
eby-subject
andby-item
rand
ome�ects.Table(a)showsrand
om-in
terceptm
odels;Table(b)showsdi�erent
structures
inrand
om
e�ects.Kindicatestheestim
ated
parametersin
themodel.Th
estatisticsassociated
toeach
modelareAkaikeInform
ationCriterio
n(AIC),increase
(� �)ofeachmodelrespecttotheminim
umAIC
value,thelog-lik
elihoodof
themodel,and
theAkaikeweight(� �)fo
reachcand
idatemodelto
bethe
minim
aladequa
temodel.M
odelslabelledwith
anasteriskfailedto
converge.
279

Experiment II
Details of minimal adequate model G17
Model G17 was initially checked for overdispersion with a negative result
(�Pearson = 0.83, p > .05; see Appendix B5a for details). The estimates for the
predictors of G17 revealed that marking words as prominent was determined by
the acoustic correlates of f 0 and duration, so that one standard deviation of f 0
(SD = 29.19 Hz) and of duration (SD = 0.063 s) increased by 1.29 (� = 0.25, SE =
0.08, z = 3.05, p <.01) and 2.02 (� = 0.70, SE = 0.14, z = 4.92, p <.001) the odds ofwords to be considered prominent, respectively. Intensity and spectral balance
did not show to contribute signi�cantly in the markings of prominence made by
participants (Figure 48, Table 27).
Figure 47: Forest plot showing odds ratios for main e�ects and interactions predicting prominence
in G17 (AIC = 9929.41). For OR < 1, e�ect size equals 1/OR. Error bars are 95% CI.
280

Experiment II
The control condition served as the baseline against which to compare all
experimental conditions. Additionally, the marks given by two trained listeners,
which were used as ‘gold standard’, were additionally used to assess the mark-
ings of the 60 participants belonging to the control group. Firstly, no signi�cant
di�erences were found between the control and the ‘gold standard’ (� = –1.97, SE= 1.55, z = –1.27, p >.05). Secondly, in both Exp1 and Exp2 conditions–which had
intensity and duration, and f 0 and duration as their respective acoustic cues—
words were 2.03 times (� = 0.70, SE = 0.29, z = 2.43, p <.05) and 1.95 times (� =
0.66, SE = 0.27, z = 2.47, p <.05) more likely to be marked as prominent respect to
the control condition. This was not the case, however for Exp3, where only du-
ration was available among the acoustic cues, although the results showed that
it fell short of signi�cance (� = 0.52, SE = 0.29, z = 2.43, p = .07).
Prominence marks tended signi�cantly to coincide with the gesture phases
of stroke and hold, so that words coinciding with a stroke were 2.54 more likely to
be marked as prominent (� = 0.93, SE = 0.46, z = 2.00, p <.05), while the odds forthose words coinciding with a hold increased up to 3.08 (� = 1.12, SE = 0.40, z =
2.74, p <.01). No other gesture phase—not even apexes—revealed any signi�cant
di�erences.
281
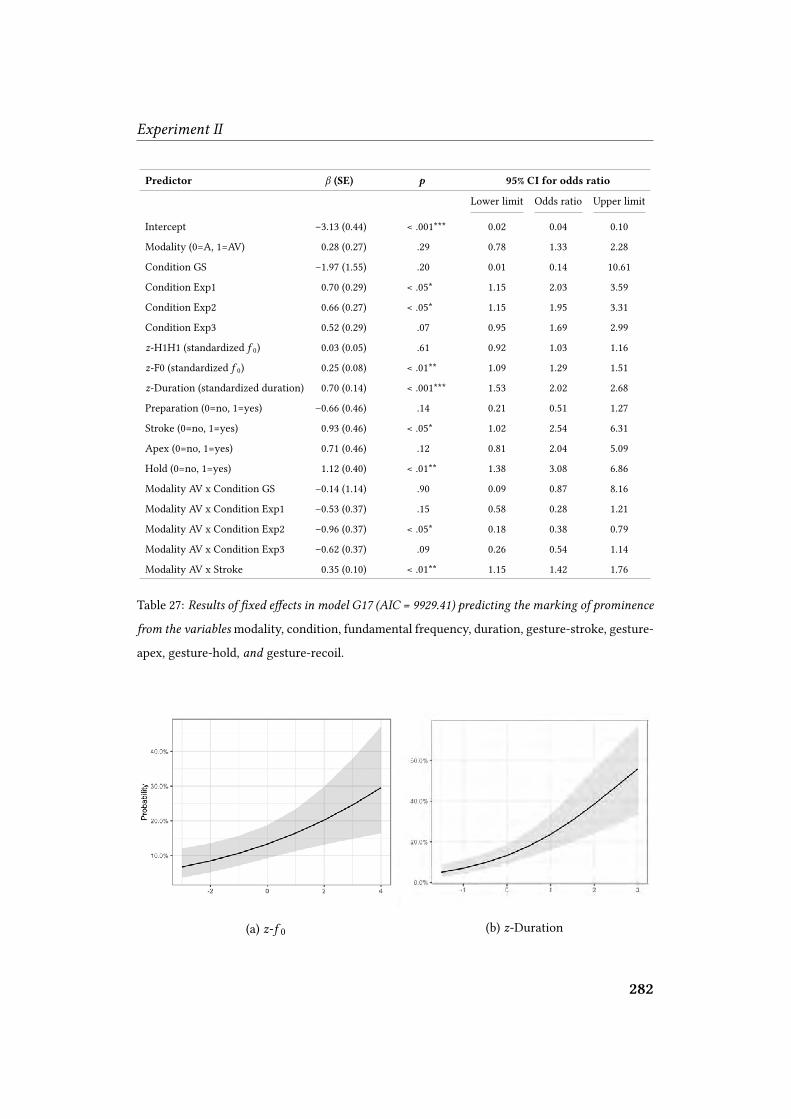
Experiment II
Predictor � (SE) p 95% CI for odds ratio
Lower limit Odds ratio Upper limit
Intercept –3.13 (0.44) < .001*** 0.02 0.04 0.10
Modality (0=A, 1=AV) 0.28 (0.27) .29 0.78 1.33 2.28
Condition GS –1.97 (1.55) .20 0.01 0.14 10.61
Condition Exp1 0.70 (0.29) < .05* 1.15 2.03 3.59
Condition Exp2 0.66 (0.27) < .05* 1.15 1.95 3.31
Condition Exp3 0.52 (0.29) .07 0.95 1.69 2.99
z-H1H1 (standardized f 0) 0.03 (0.05) .61 0.92 1.03 1.16
z-F0 (standardized f 0) 0.25 (0.08) < .01** 1.09 1.29 1.51
z-Duration (standardized duration) 0.70 (0.14) < .001*** 1.53 2.02 2.68
Preparation (0=no, 1=yes) –0.66 (0.46) .14 0.21 0.51 1.27
Stroke (0=no, 1=yes) 0.93 (0.46) < .05* 1.02 2.54 6.31
Apex (0=no, 1=yes) 0.71 (0.46) .12 0.81 2.04 5.09
Hold (0=no, 1=yes) 1.12 (0.40) < .01** 1.38 3.08 6.86
Modality AV x Condition GS –0.14 (1.14) .90 0.09 0.87 8.16
Modality AV x Condition Exp1 –0.53 (0.37) .15 0.58 0.28 1.21
Modality AV x Condition Exp2 –0.96 (0.37) < .05* 0.18 0.38 0.79
Modality AV x Condition Exp3 –0.62 (0.37) .09 0.26 0.54 1.14
Modality AV x Stroke 0.35 (0.10) < .01** 1.15 1.42 1.76
Table 27: Results of �xed e�ects in model G17 (AIC = 9929.41) predicting the marking of prominence
from the variablesmodality, condition, fundamental frequency, duration, gesture-stroke, gesture-
apex, gesture-hold, and gesture-recoil.
(a) z-f 0 (b) z-Duration
282

Experiment II
(c) Stroke (d) Hold
(e) Stroke in AV modality
Figure 48: Main e�ects of minimal adequate model G17 (AIC = 9929.41) are displayed in graphs (a),
(b), (c), and (d). Graph (e) shows an interaction between modality and stroke.
As for the overall role of the audiovisual modality, no di�erences were found
in the marks given by participants compared to the audio-only modality. This
was also the case when experimental conditions were compared to the control
condition except in Exp2, where marking for prominence was 0.38 times less
likely to occur than in the audiovisual modality (� = –0.96, SE = 0.37, z = –2.59,
p <.01). This di�erence had already proved signi�cant in the chi-square test (see
283

Experiment II
Figure 45a). Finally, words that coincided with a stroke were 1.42 more likely
to be perceived as prominent in the audiovisual modality (� = 0.35, SE = 0.11,
z = 3.21, p <.01), but no other interactions were found between the audiovisual
modality and the visual cues of prominence.
Summary
In this �rst analysis, a set of models was built with the aim of comparing
the markings provided by participants across conditions and modalities in a sim-
ilar way as done in Experiment I (§ 4.3.2.3). The minimal adequate model, G17,
was chosen from a set of 21 models, and it revealed that participants tended to
mark more words as prominent when they lacked some of the acoustic cues of
prominence. Additionally, the control group, relying on all acoustic cues, did
not perform di�erently from two trained listeners whose marks served as a ‘gold
standard’ and against which their performance was compared.
Although the chi-square test did not show any signi�cant di�erence in the
number of marks given to all three conditions when compared to the control,
model G17 made evident that a trend exists for all conditions to increase the
probability of words to be marked as prominent. This trend proved signi�cant
in Exp1 and Exp2, but not in Exp3, which fell short of signi�cance (Table 27).
This re�ects a similar pattern as that observed in Experiment I (§ 4.3.2.4), where
participants tended to ‘overmark’ words in all experimental conditions. Simi-
larly, the audiovisual modality showed an opposite trend when some acoustic
cues of prominence were absent in the experimental conditions, although model
G17 only showed signi�cant di�erences for Exp2.
As for the acoustic correlates of prominence, model G17 shows that both f 0
and duration played a major role in the marks given by participants. However,
none of these two acoustic correlates showed any signi�cant di�erence in the au-
284
Experiment II
diovisual modality, contrary to what was observed in Experiment I. Additionally,
model G17 shows that, overall, words given a mark of prominence signi�cantly
coincidedwith the gesture phases of stroke and hold, but not apex. In Experiment
I, conversely, participants had marked words coinciding with apex and holds but
not strokes (see Figure 49 for a comparison). It is possible that the hold phase of
gestures o�er a reliable cue of prominence under adverse acoustic conditions, al-
though the di�erent procedure in each experiment, i.e. the number of times par-
ticipants were allowed to receive the stimulus and the subsequent processes of
logical inference, might also have had an in�uence on the di�erences for strokes
and apexes observed in both experiments. However, in both experiments strokes
seemed to signi�cantly increase the number of marks of prominence given to the
words they co-occur with in the audiovisual modality. This is not the case for the
apex phase of gestures, which seemed to reduce this probability in Experiment
I, although no such di�erence was observed in Experiment II.
Unlike Experiment I, where it was not possible to obtain details of the vari-
ables predicting prominence perception in each experimental condition, the between-
subjects design of Experiment II allowed to conduct analyses separately for each
of them in order to better understand the role of the factors involved in the mul-
timodal perception of acoustic prominence.
285
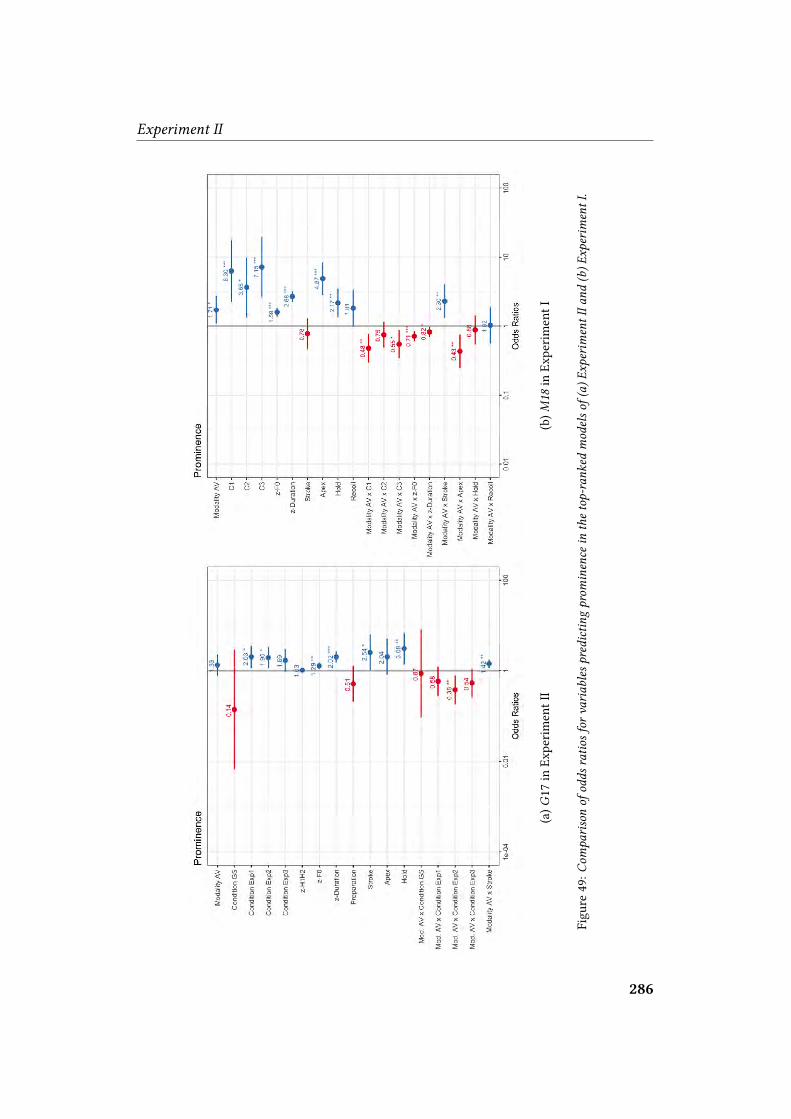
Experiment II
(a)�17
inEx
perim
entII
(b)M
18in
Experim
entI
Figu
re49:C
omparison
ofodds
ratio
sfor
varia
bles
predictin
gprom
inence
inthetop-rank
edmodelso
f(a)
Experim
entIIa
nd(b)E
xperim
entI.
286

Experiment II
5.3.2.4 Analysis B: Control condition ‘Exp0’
In this analysis, a set of models was built with the responses given by the 60
participants that, taking part in the experiment, provided marks of prominence
for either the audio-only or the audiovisual modality serving as control condi-
tion. They relied on all acoustic cues of prominence. The dependent variable
prominence was modelled as done previously (§ 4.3.2.3 and § 5.3.2.3). An inter-
action was declared between modality and the remaining variables: condition,
the gesture phases, and the standardized acoustic values of f 0, intensity, H1H2,
and duration. Additionally, this time also the variablesmusical-training and par-
ticipant gender were initially included in the global model:
Model building proceeded initially frommodel �01 to model �014 by removing
non-signi�cant predictors. Models �012, �013, and �014 achieved a very similar
AIC value. These three models were extended, and random slopes were declared
for each of them from �015 to �021. The minimal adequate model was model �020(AIC = 2334.54), the extension of model �014, in which slopes for the e�ect of
modality on by-item random e�ects had been declared. However, when slopes
were estimated for the e�ect ofmodality on participants, theAIC value increased.
Finally, a competitive model, �016 reached a close value (AIC = 2235.76), and
although twomore models �013 and �014 also showed close values, they were notfurther considered since they did not include slopes for by-item random e�ects
(Table 28)
287

Experiment II
Mod
elPr
ominen
ceas
afunc
tion
of(�)�x
ede�
ects,w
ithby
-sub
ject
andby
-item
rand
ome�
ects
LogL
ikelihoo
dK
AIC
� �� �
� 01mod
ality
x(prep+stroke
+apex
+ho
ld+recoil+z-�+z-intensity
+z-H1H
2+z-du
ratio
n+musical-training+participant-gend
er)+
+(1
|partic
ipant)+(1
|speaker/sentence/word)
–1150.42
302360.85
26.31
0.00
� 02mod
ality
x(prep+stroke
+apex
+recoil+z-�+z-intensity
+z-H1H
2+z-du
ratio
n+musical-training)
+ho
ld+participant-gend
er+
+(1
|partic
ipant)+(1
|speaker/sentence/word)
–1150.44
282356.88
22.34
0.00
� 03mod
ality
x(prep+stroke
+apex
+recoil+z-�+z-intensity
+z-H1H
2+z-du
ratio
n)+ho
ld+musical-training+participant-gend
er+
+(1
|partic
ipant)+(1
|speaker/sentence/word)
–1151.89
262355.78
21.24
0.00
� 04mod
ality
x(prep+stroke
+apex
+recoil)
+ho
ld+z-�+z-intensity
+z-H1H
2+z-du
ratio
n+musical-training+participant-gend
er+
+(1
|partic
ipant)+(1
|speaker/sentence/word)
–1153.18
222350.35
15.82
0.00
� 05mod
ality
x(prep+stroke
+apex
+recoil)
+ho
ld+z-�+z-intensity
+z-H1H
2+z-du
ratio
n+
+(1
|partic
ipant)+(1
|speaker/sentence/word)
–1153.93
192345.85
11.32
0.00
� 06mod
ality
x(strok
e+apex
+recoil)
+prep
+ho
ld+z-�+z-intensity
+z-H1H
2+z-du
ratio
n+
+(1
|partic
ipant)+(1
|speaker/sentence/word)
–1154.24
182344.47
9.93
0.00
� 07mod
ality
x(strok
e+apex
+recoil)
+prep
+ho
ld+z-�+z-H1H
2+z-du
ratio
n+
+(1
|partic
ipant)+(1
|speaker/sentence/word)
–1154.24
172342.47
7.93
0.01
� 08mod
ality
x(strok
e+apex
+recoil)
+ho
ld+z-�+z-H1H
2+z-du
ratio
n+
+(1
|partic
ipant)+(1
|speaker/sentence/word)
–1154.29
162340.59
6.05
0.02
� 09mod
ality
x(strok
e+apex)+
hold
+recoil+z-�+z-H1H
2+z-du
ratio
n+
+(1
|partic
ipant)+(1
|speaker/sentence/word)
–1154.53
152339.07
4.53
0.03
� 010mod
ality
x(strok
e+apex)+
hold
+recoil+z-�+z-du
ratio
n+
+(1
|partic
ipant)+(1
|speaker/sentence/word)
–1155.67
142339.34
4.80
0.03
� 011mod
ality
x(strok
e+apex)+
hold
+z-�+z-du
ratio
n+
+(1
|partic
ipant)+(1
|speaker/sentence/word)
–1156.80
132339.59
5.05
0.03
� 012mod
ality
x(strok
e)+apex
+ho
ld+z-�+z-du
ratio
n+
+(1
|partic
ipant)+(1
|speaker/sentence/word)
–1157.03
122338.05
3.52
0.05
� 013mod
ality
x(strok
e)+apex
+z-�+z-H1H
2+z-du
ratio
n+
+(1
|partic
ipant)+(1
|speaker/sentence/word)
–1155.21
132336.42
1.89
0.12
� 014mod
ality
x(strok
e)+apex
+ho
ld+z-�+z-H1H
2+z-du
ratio
n+
+(1
|partic
ipant)+(1
|speaker/sentence/word)
–1155.21
132336.42
1.89
0.12
(a)S
ummaryof
AIC
results
forthe
GLM
Mrand
om-in
terceptm
odels.
288

Experiment II
Mod
elPr
ominen
ceas
afunc
tion
of(�)�x
ede�
ects,w
ithby
-sub
ject
andby
-item
rand
ome�
ects
LogL
ikelihoo
dK
AIC
� �� �
� 015mod
ality
x(strok
e)+apex
+ho
ld+z-�+z-du
ratio
n+
+(1
|partic
ipant)+(m
odality
|speaker/sentence/word)
–1152.54
182341.08
6.55
0.05
� 016mod
ality
x(strok
e)+apex
+ho
ld+z-�+z-du
ratio
n+
+(1
|partic
ipant)+(m
odality
|sentence/word)
–1152.88
152335.76
1.23
0.17
� 017mod
ality
x(strok
e)+apex
+z-�+z-H1H
2+z-du
ratio
n+
+(1
|partic
ipant)+(m
odality
|speaker/sentence/word)
–1157.83
132351.66
21.24
0.00
� 018*mod
ality
x(strok
e)+apex
+z-�+z-H1H
2+z-du
ratio
n+
+(1
|partic
ipant)+(m
odality
|sentence/word)
–1158.45
152346.9
12.36
0.08
� 019mod
ality
x(strok
e)+apex
+ho
ld+z-�+z-H1H
2+z-du
ratio
n+
+(1
|partic
ipant)+(m
odality
|speaker/sentence/word)
–1150.98
192339.97
5.43
0.02
� 020mod
alityx(strok
e)+ap
ex+ho
ld+z-�+z-H1H
2+z-du
ration
++(1
|participa
nt)+
(mod
ality|sen
tenc
e/word)
–115
1.27
1623
34.54
0.00
0.31
� 021mod
ality
x(strok
e)+apex
+ho
ld+z-�+z-H1H
2+z-du
ratio
n+
+(m
odality
|partic
ipant)+(m
odality
|sentence/word)
–1155.21
132337.439
2.85
0.08
(b)S
ummaryof
AIC
results
forthe
GLM
Mrand
om-slope
models.
Table28:Sum
maryofAIC
results
forthe
GLM
Msincond
ition
Exp0.T
hemarking
ofprom
inence
byparticipan
tsismodelledas
afunctio
nofpredictors
declared
as�x
ede�ects.A
llmodelsinclude
by-subjectan
dby-item
rand
ome�ects.T
able(a)showsran
dom-in
terceptm
odels;Table(b)showsd
i�erent
structuresinrand
ome�ects.K
indicatesthe
estim
ated
parametersinthem
odel.T
hestatisticsa
ssociatedtoeach
modelareA
kaikeInformationCriterio
n
(AIC),increase
(� �)ofeachmodelrespecttotheminim
umAIC
value,thelog-lik
elihoodof
themodel,and
theAkaikeweight(� �)fo
reach
cand
idate
modelto
betheminim
aladequa
temodel.M
odelslabelledwith
anasteriskfailedto
converge.
289

Experiment II
Details of minimal adequate model �020Model �020 did not show overdispersion (�Pearson = 0.80, p > .05; see Appendix
B5b for details). It is apparent from this model that the prominence marks given
by participants were strongly determined by the acoustic correlates of f 0 (� =
0.45, SE = 0.13, z = 3.42, p <.001) and duration (� = 0.91, SE = 0.16, z = 5.46, p<.001). This means that an increase of 1 standard deviation in f 0 (SD = 36.84
Hz) and duration (SD = 0.064 s) increased the odds of words to be perceived as
prominent by 1.57 and 2.50 times, respectively. The acoustic cue of intensity
did not proved signi�cant, but spectral balance—measured as the di�erence in
amplitude between H1and H2—was close to signi�cance (� = 0.25, SE = 0.14, z =
1.79, p = .07) (Table 29).
Figure 50: Forest plot showing odds ratios for main e�ects and interactions predicting prominence
in model �020 (AIC = 2334.54). Error bars are 95% CI.
290

Experiment II
Predictor � (SE) p 95% CI for odds ratio
Lower limit Odds ratio Upper limit
Intercept –3.70 (0.44) < .001*** 0.01 0.02 0.06
Modality (0=A, 1=AV) 0.28 (0.33) .39 0.69 1.33 2.54
z-H1H2 (standardized spectral balance) 0.25 (0.14) .07 0.98 1.29 1.70
z-F0 (standardized f 0) 0.45 (0.13) < .001*** 1.21 1.57 2.04
z-Duration (standardized duration) 0.91 (0.16) < .001*** 1.80 2.50 3.48
Stroke (0=no, 1=yes) 0.83 (0.46) .07 0.93 2.31 5.72
Apex (0=no, 1=yes) 1.09 (0.43) < .05* 1.28 2.99 6.98
Hold (0=no, 1=yes) 2.09 (0.56) < .001*** 2.68 8.10 24.51
Modality AV x Stroke 0.62 (0.26) < .05* 1.12 1.87 3.12
Table 29: Results of �xed e�ects in model �020 (AIC = 2334.54) predicting the marking of prom-
inence from the variables modality, spectral balance, fundamental frequency, duration, gesture-
stroke, gesture-apex, gesture-hold.
Participants marked words that signi�cantly coincided with the apex phase
(� = 1.09, SE = 0.43, z = 2.53, p <.05) and the hold phase of gestures (� = 2.09, SE =
0.56, z = 3.70, p <.001), so that words coinciding with both phases were 2.99 and
8.10, respectively, more likely to receive a mark of prominence than words not
coinciding with any of these gesture phases.
No signi�cant main e�ect of the predictor modality was observed, although
an interaction of the audiovisual modality and the stroke of gestures proved sig-
ni�cant and the odds for words to be perceived as prominent increased by 1.87.
No other gesture phases were found to signi�cantly determine prominence per-
ception in the audiovisual modality.
291

Experiment II
(a) z-f 0 (b) z-Duration
(c) Hold (d) Stroke in AV modality
Figure 51: Graphs (a), (b), and (c) show main e�ects in model �020 (AIC = 2334.54). Graph (d) shows
an interaction between modality and stroke.
A competitive model, �016 (AIC = 2335.76), reached an AIC value 1.23 �-pointsworse than �020. Thismodel omitted the non-signi�cant predictor z-H1H2,
and as a result the estimated parameter stroke reached signi�cance (� = 0.93, SE
= 0.46, z = 2.02, p <.05) (Table 30).
292

Experiment II
Predictor � (SE) p 95% CI for odds ratio
Lower limit Odds ratio Upper limit
Intercept –3.65 (0.44) < .001*** 0.01 0.03 0.06
Modality (0=A, 1=AV) 0.31 (0.33) .35 0.71 1.36 2.62
z-F0 (standardized f 0) 0.48 (0.13) < .001*** 1.26 1.63 2.11
z-Duration (standardized duration) 0.95 (0.16) < .001*** 1.87 2.59 3.59
Stroke (0=no, 1=yes) 0.93 (0.46) < .05* 1.03 2.54 6.29
Apex (0=no, 1=yes) 1.05 (0.43) < .05* 1.24 2.87 6.67
Hold (0=no, 1=yes) 1.84 (0.54) < .001*** 2.18 6.32 18.28
Modality AV x Stroke 0.58 (0.26) < .05* 1.06 1.79 3.02
Table 30: Results of �xed e�ects in model �016 (AIC = 2335.76), which predicts the marking of
prominence from the same variables as the minimal adequate model �020, but it omits z-H1H2,
causing the predictor stroke to reach signi�cance.
Figure 52: Odds ratios for main e�ects and interactions predicting prominence in Exp0 for compet-
itive model �016. For OR < 1, e�ect size equals 1/OR. Error bars are 95% CI.
Summary
The set of models built to analyse the potential of variables for predicting
prominence marking provided a minimal adequate model �020, which was fol-
293

Experiment II
lowed by model �016 within 2 �-points. The minimal adequate model di�ered
from its competitor in the non-signi�cance of its predictors z-H1H2 and stroke.
Nevertheless, stroke proved signi�cant in the second-best model �016 when z-
H1H2 was removed. In the results section both models were reported, as sugges-
ted by T. W. Arnold (2010), but only the minimal adequate model was discussed,
since it achieved a best AIC value despite including more predictors (see § 3.2.4).
Model �020 revealed that participants relying on all acoustic cues of promi-
nence used f 0 and duration to identify prominentwords, but not intensity. Rather,
they relied more on spectral balance, although this fell short of signi�cance (p =
.07). The marks of prominence provided by participants in this control condition
signi�cantly coincided with both the gesture phase of apex and, especially, with
the gesture phase of hold. Interestingly, also strokes were found signi�cant in
the second-best model �016 (Table 30).Additionally, di�erences in agreement among participants showed that the
audiovisualmodalitywasmore challenging than the audio-onlymodality to judge
prominence. In this sense, participants got closer in their ratings to the ‘gold
standard’ when they had to mark prominent words auditorily rather than visu-
ally (Figure 22). Nevertheless, although no di�erences were observed for the
overall e�ect of the audiovisual modality on the marks of prominence, parti-
cipants gave more marks to words coinciding with the stroke phase of gestures
when the visual cues of prominence were available to them. This di�erence is
in line with the signi�cant di�erence between modalities that the chi-square test
revealed for strokes (Figure 46a). Interestingly, even if the chi-square test conduc-
ted for apexes also showed a similar di�erence between modalities (Figure 46b),
the minimal adequate model did not revealed any signi�cant di�erence between
modalities for apexes.
294
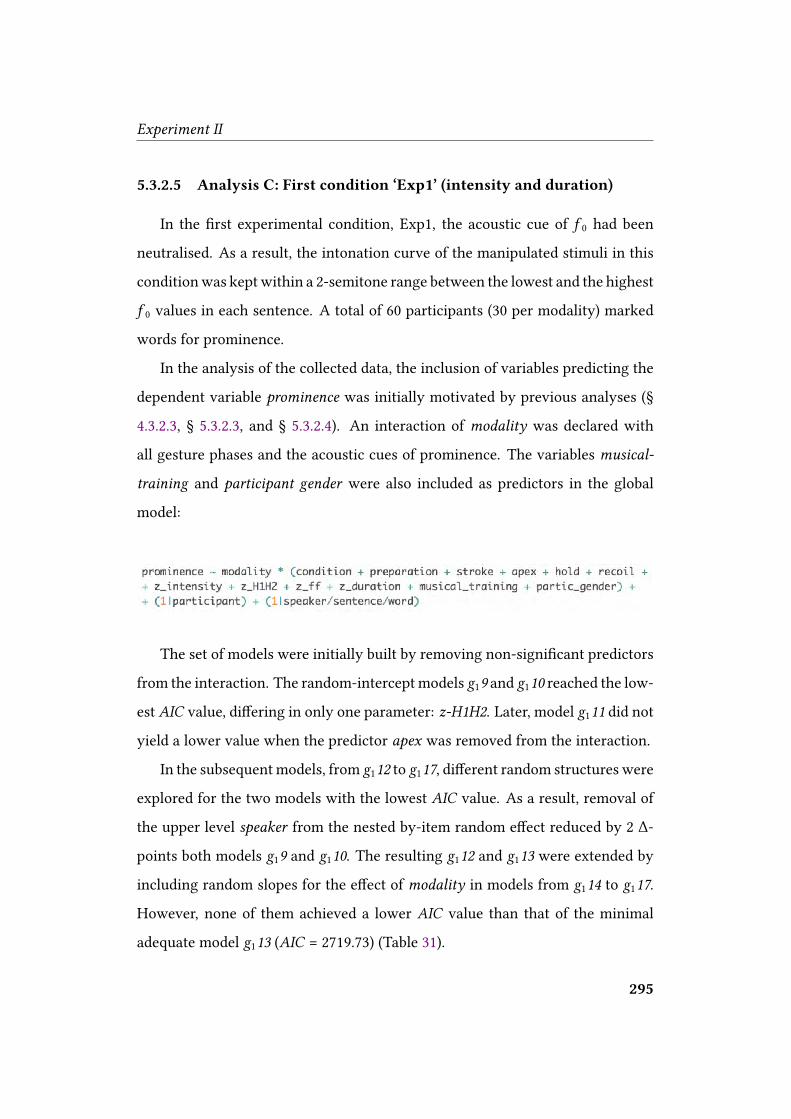
Experiment II
5.3.2.5 Analysis C: First condition ‘Exp1’ (intensity and duration)
In the �rst experimental condition, Exp1, the acoustic cue of f 0 had been
neutralised. As a result, the intonation curve of the manipulated stimuli in this
conditionwas keptwithin a 2-semitone range between the lowest and the highest
f 0 values in each sentence. A total of 60 participants (30 per modality) marked
words for prominence.
In the analysis of the collected data, the inclusion of variables predicting the
dependent variable prominence was initially motivated by previous analyses (§
4.3.2.3, § 5.3.2.3, and § 5.3.2.4). An interaction of modality was declared with
all gesture phases and the acoustic cues of prominence. The variables musical-
training and participant gender were also included as predictors in the global
model:
The set of models were initially built by removing non-signi�cant predictors
from the interaction. The random-intercept models �19 and �110 reached the low-est AIC value, di�ering in only one parameter: z-H1H2. Later, model �111 did notyield a lower value when the predictor apex was removed from the interaction.
In the subsequentmodels, from �112 to �117, di�erent random structures were
explored for the two models with the lowest AIC value. As a result, removal of
the upper level speaker from the nested by-item random e�ect reduced by 2 �-points both models �19 and �110. The resulting �112 and �113 were extended by
including random slopes for the e�ect of modality in models from �114 to �117.However, none of them achieved a lower AIC value than that of the minimal
adequate model �113 (AIC = 2719.73) (Table 31).
295

Experiment II
Mod
elPr
ominen
ceas
afunc
tion
of(�)�x
ede�
ects,b
y-su
bjecta
ndwithby
-item
rand
ome�
ects
LogL
ikelihoo
dK
AIC
� �� �
� 11mod
ality
x(prep+stroke
+apex
+ho
ld+recoil+z-�+z-intensity
+z-H1H
2+z-du
ratio
n+musical-training+participant-gend
er)+
+(1
|partic
ipant)+(1
|speaker/sentence/word)
–1338.53
302737.06
17.33
0.00
� 12mod
ality
x(prep+stroke
+apex
+ho
ld+recoil+z-�+z-intensity
+z-H1H
2+z-du
ratio
n+musical-training)
+participant-gend
er+
+(1
|partic
ipant)+(1
|speaker/sentence/word)
–1338.80
292735.60
15.87
0.00
� 13mod
ality
x(prep+stroke
+apex
+ho
ld+recoil+z-intensity
+z-�+z-du
ratio
n+musical-training)
+z-H1H
2+participant-gend
er+
+(1
|partic
ipant)+(1
|speaker/sentence/word)
–1338.87
282733.73
14.00
0.00
� 14mod
ality
x(prep+stroke
+apex
+ho
ld+recoil+z-�+z-du
ratio
n+musical-training)
+z-intensity
+z-H1H
2+participant-gend
er+
+(1
|partic
ipant)+(1
|speaker/sentence/word)
–1339.14
272732.29
12.56
0.00
� 15mod
ality
x(prep+stroke
+apex
+ho
ld+z-du
ratio
n+musical-training)
+recoil+z-�+z-intensity
+z-H1H
2+participant-gend
er+
+(1
|partic
ipant)+(1
|speaker/sentence/word)
–1339.21
252728.42
8.69
0.00
� 16mod
ality
x(prep+stroke
+apex
+z-�+z-du
ratio
n+musical-training)
+ho
ld+recoil+z-intensity
+z-H1H
2+participant-gend
er+
+(1
|partic
ipant)+(1
|speaker/sentence/word)
–1139.21
262730.77
11.04
0.00
� 17mod
ality
x(strok
e+apex
+ho
ld+z-du
ratio
n+musical-training)
+prep
+recoil+z-intensity
+z-H1H
2+z-�+participant-gend
er+
+(1
|partic
ipant)+(1
|speaker/sentence/word)
–1339.48
262730.96
11.23
0.00
� 18mod
ality
x(strok
e+apex
+musical-training)
+prep
+ho
ld+recoil+z-intensity
+z-H1H
2+z-�+z-du
ratio
n+participant-gend
er+
+(1
|partic
ipant)+(1
|speaker/sentence/word)
–1341.21
222726.43
6.70
0.01
� 19mod
ality
x(strok
e+apex
+musical-training)
+prep
+z-intensity
+z-H1H
2+z-�+z-du
ratio
n+
+(1
|partic
ipant)+(1
|speaker/sentence/word)
–1342.09
192722.19
2.46
0.11
� 110mod
ality
x(strok
e+apex
+musical-training)
+prep
+z-intensity
+z-�+z-du
ratio
n+
+(1
|partic
ipant)+(1
|speaker/sentence/word)
–1342.86
182721.73
2.00
0.14
� 111mod
ality
x(strok
e+musical-training)
+prep
+apex
+z-intensity
+z-�+z-du
ratio
n+
+(1
|partic
ipant)+(1
|speaker/sentence/word)
–1345.92
172725.84
6.11
0.02
� 112mod
alityx(strok
e+ap
ex+mus
ical-training)
+pr
ep+z-intens
ity+z-H1H
2+z-�+z-du
ration
++(1
|participa
nt)+
(1|sen
tenc
e/word)
–1342.09
1827
20.19
0.46
0.31
� 113mod
alityx(strok
e+ap
ex+mus
ical-training)
+pr
ep+z-intens
ity+z-�+z-du
ration
++(1
|participa
nt)+
(1|sen
tenc
e/word)
–1342.86
1727
19.73
0.00
0.38
(a)S
ummaryof
AIC
results
forthe
GLM
Mrand
om-in
terceptm
odels.
296

Experiment II
Mod
elPr
ominen
ceas
afunc
tion
of(�)�x
ede�
ects,w
ithby
-sub
ject
andby
-item
rand
ome�
ects
LogL
ikelihoo
dK
AIC
� �� �
� 114mod
ality
x(strok
e+apex
+musical-training)
+prep
+z-intensity
+z-H1H
2+z-�+z-du
ratio
n+
+(1
|partic
ipant)+(m
odality
|speaker/sentence/word)
–1341.95
252733.89
14.16
0.00
� 115mod
ality
x(strok
e+apex
+musical-training)
+prep
+z-intensity
+z-H1H
2+z-�+z-du
ratio
n+
+(1
|partic
ipant)+(m
odality
|sentence/word)
–1342.03
222728.06
8.33
0.01
� 116*mod
ality
x(strok
e+apex
+musical-training)
+prep
+z-intensity
+z-�+z-du
ratio
n+
+(1
|partic
ipant)+(m
odality
|speaker/sentence/word)
–1342.73
242733.46
13.73
0.00
� 117mod
ality
x(strok
e+apex
+musical-training)
+prep
+z-intensity
+z-�+z-du
ratio
n+
+(1
|partic
ipant)+(m
odality
|sentence/word)
–1342.81
212727.61
7.88
0.01
(b)S
ummaryof
AIC
results
forthe
GLM
Mrand
om-slope
models.
Table31:Sum
maryofAIC
results
forthe
GLM
Msincond
ition
Exp1.T
hemarking
ofprom
inence
byparticipan
tsismodelledas
afunctio
nofpredictors
declared
as�x
ede�ects.A
llmodelsinclude
by-subjectan
dby-item
rand
ome�ects.T
able(a)showsran
dom-in
terceptm
odels;Table(b)showsd
i�erent
structuresinrand
ome�ects.K
indicatesthe
estim
ated
parametersinthem
odel.T
hestatisticsa
ssociatedtoeach
modelareA
kaikeInformationCriterio
n
(AIC),increase
(� �)ofeachmodelrespecttotheminim
umAIC
value,thelog-lik
elihoodof
themodel,and
theAkaikeweight(� �)fo
reach
cand
idate
modelto
betheminim
aladequa
temodel.M
odelslabelledwith
anasteriskfailedto
converge.
297

Experiment II
Details of minimal adequate model �113The minimal adequate model �113 was checked for overdispersion (�Pearson =
0.79, p > .05; see Appendix B5c for details) with similar negative results as the
tests conducted for previous models. In this case, in which f 0 had been neutral-
ised, the marking of prominence was determined by the sole acoustic correlate
of duration (� = 0.74, SE = 0.15, z = 4.82, p <.001), so that an increase of 1 stand-
ard deviation (SD = 0.064 s) raised the odds by 2.11 for words to be considered
prominent. Spectral balance did not seem to be relied on by participants, while
maximum intensity of vowels contributed positively together with duration to
perceive prominence, although it fell short of signi�cance (� = 0.22, SE = 0.11, z
= 1.90, p = .05) (Figure 53, Table 32).
Figure 53: Forest plot showing odds ratios for main e�ects and interactions predicting prominence
in �113 (AIC = 2719.73). For OR < 1, e�ect size equals 1/OR. Error bars are 95% CI.
298
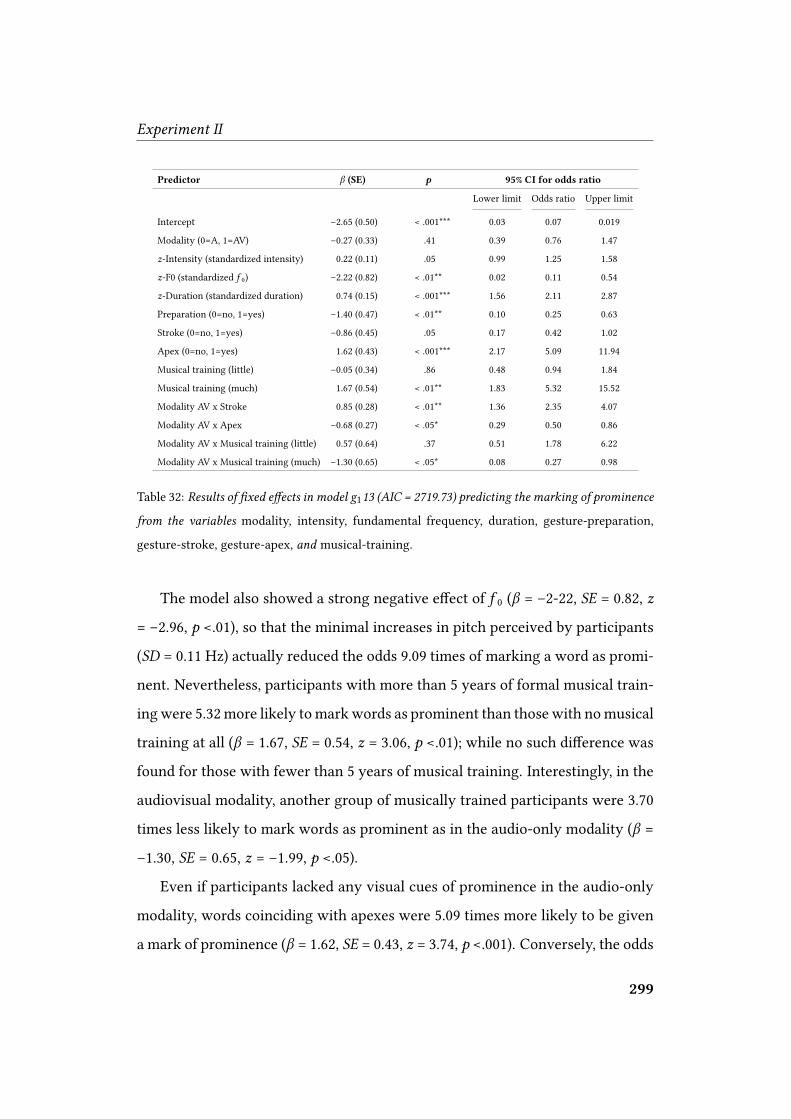
Experiment II
Predictor � (SE) p 95% CI for odds ratio
Lower limit Odds ratio Upper limit
Intercept –2.65 (0.50) < .001*** 0.03 0.07 0.019
Modality (0=A, 1=AV) –0.27 (0.33) .41 0.39 0.76 1.47
z-Intensity (standardized intensity) 0.22 (0.11) .05 0.99 1.25 1.58
z-F0 (standardized f 0) –2.22 (0.82) < .01** 0.02 0.11 0.54
z-Duration (standardized duration) 0.74 (0.15) < .001*** 1.56 2.11 2.87
Preparation (0=no, 1=yes) –1.40 (0.47) < .01** 0.10 0.25 0.63
Stroke (0=no, 1=yes) –0.86 (0.45) .05 0.17 0.42 1.02
Apex (0=no, 1=yes) 1.62 (0.43) < .001*** 2.17 5.09 11.94
Musical training (little) –0.05 (0.34) .86 0.48 0.94 1.84
Musical training (much) 1.67 (0.54) < .01** 1.83 5.32 15.52
Modality AV x Stroke 0.85 (0.28) < .01** 1.36 2.35 4.07
Modality AV x Apex –0.68 (0.27) < .05* 0.29 0.50 0.86
Modality AV x Musical training (little) 0.57 (0.64) .37 0.51 1.78 6.22
Modality AV x Musical training (much) –1.30 (0.65) < .05* 0.08 0.27 0.98
Table 32: Results of �xed e�ects in model �113 (AIC = 2719.73) predicting the marking of prominence
from the variables modality, intensity, fundamental frequency, duration, gesture-preparation,
gesture-stroke, gesture-apex, and musical-training.
The model also showed a strong negative e�ect of f 0 (� = –2-22, SE = 0.82, z
= –2.96, p <.01), so that the minimal increases in pitch perceived by participants
(SD = 0.11 Hz) actually reduced the odds 9.09 times of marking a word as promi-
nent. Nevertheless, participants with more than 5 years of formal musical train-
ingwere 5.32more likely tomarkwords as prominent than those with nomusical
training at all (� = 1.67, SE = 0.54, z = 3.06, p <.01); while no such di�erence was
found for those with fewer than 5 years of musical training. Interestingly, in the
audiovisual modality, another group of musically trained participants were 3.70
times less likely to mark words as prominent as in the audio-only modality (� =
–1.30, SE = 0.65, z = –1.99, p <.05).Even if participants lacked any visual cues of prominence in the audio-only
modality, words coinciding with apexes were 5.09 times more likely to be given
a mark of prominence (� = 1.62, SE = 0.43, z = 3.74, p <.001). Conversely, the odds299

Experiment II
for words to be considered prominent when they coincided with the preparation
phase of gestures decreased by 4. Also, a negative e�ect for words being marked
as prominent was observed for the stroke phase of gestures, which fell short of
signi�cance (� = –0.86, SE = 0.45, z = –1.91, p = .05). However, when participants
could rely on the visual cues of prominence available in the audiovisual modality,
words coinciding with apexes were 2 times less likely to be given a mark of
prominence (� = –0.69, SE = 0.27, z = –2.50, p <.05), while strokes actually made
participants increase their prominence marks 2.35 times (� = 0.85, SE = 0.28, z =
3.06, p <.01).
(a) z-Duration (b) Neutralised z-f 0
(c) Preparation (d) Apex
300

Experiment II
(e) Musical training
(f) Stroke in AV modality (g) Apex in the AV modality
(h) Musical training in AV modality
Figure 54: Main e�ects and interactions in model �113 (AIC = 2719.73).
301

Experiment II
Next to the top-ranked model just described, the competitive model, �112(AIC = 2720.19), was within 2 �-points and included the predictor z-H1H2. The
coe�cient estimates of this model were very similar to those of the minimal ad-
equate model, with the exception that in this second-best model the predictor
stroke reached signi�cance (� = –1.02, SE = 0.46, z = –2.20, p <.05) (Table 33).Predictor � (SE) p 95% CI for odds ratio
Lower limit Odds ratio Upper limit
Intercept –2.57 (0.50) < .001*** 0.03 0.08 0.020
Modality (0=A, 1=AV) –0.27 (0.33) .76 0.39 0.76 1.47
z-Intensity (standardized intensity) 0.24 (0.11) < .05* 1.01 1.28 1.61
z-H1H2 (standardized spectral balance) 0.22 (0.17) .20 0.88 1.25 1.75
z-F0 (standardized f 0) –2.38 (0.83) < .01** 0.02 0.09 0.47
z-Duration (standardized duration) 0.74 (0.15) < .001*** 1.56 2.11 2.85
Preparation (0=no, 1=yes) –1.48 (0.48) < .01** 0.09 0.23 0.58
Stroke (0=no, 1=yes) –1.02 (0.46) < .05* 0.14 0.36 0.89
Apex (0=no, 1=yes) 1.68 (0.43) < .001*** 2.30 5.37 12.55
Musical training (little) –0.05 (0.34) .86 0.48 0.94 1.85
Musical training (much) 1.67 (0.54) < .01** 1.83 5.33 15.54
Modality AV x Stroke 0.85 (0.28) < .01** 1.36 2.36 4.07
Modality AV x Apex –0.68 (0.27) < .05* 0.29 0.50 0.86
Modality AV x Musical training (little) 0.57 (0.64) .37 0.51 1.78 6.23
Modality AV x Musical training (much) –1.30 (0.65) < .05* 0.08 0.27 0.98
Table 33: Results of �xed e�ects in model �112 (AIC = 2720.19) predicting the marking of promi-
nence from the variables modality, intensity, spectral balance, fundamental frequency, duration,
gesture-preparation, gesture-stroke, gesture-apex, and musical-training.
302

Experiment II
Figure 55: Odds ratios for main e�ects and interactions predicting prominence in Exp1 for compet-
itive model �112. For OR < 1, e�ect size equals 1/OR. Error bars are 95% CI.
Summary
In this �rst experimental condition Exp1, in which f 0 had been neutralised,
model building proceeded by including all variables as predictors, also musical
training and participant gender. The minimal adequate model from the set of
built models was model �113 (AIC = 2719.73), followed by model �112 (AIC =
2720.19) within less than 2 �-points. The minimal adequate model was more
parsimonious than its competitor and did not include the variable z-H1H2 (Figure
55).
In model �113, it was observed that, in the absence of f 0 as acoustic cue of
prominence, syllable durationwas heavily relied on by participants to givemarks
of prominence. Although intensity fell short of signi�cance, it may have also
303

Experiment II
played an important role in perceiving prominence in the absence of f 0, espe-
cially since it proved signi�cant in model �112 (Table 33).Participants marked words that consistently coincided with the apex phase
of gestures. However, those words coinciding with the preparation phase were
much less likely to be considered prominent. Despite the fact that modality
proved non-signi�cant, the visual cues of prominence were found to in�uence
themarks provided by participants. Surprisingly, words coincidental with apexes
were considerably less likely to be perceived as prominent in the audiovisual mo-
dality. In their turn, strokes of gestures were slightly more relied on in the audio-
visual modality to mark prominent words, while their overall negative e�ect for
the words they coincided with fell short of signi�cance (p = .05). Interestingly,
this pattern in which strokes seem to have the lead when participants marked
words in the audiovisual modality is in line with the results obtained in the pre-
vious analyses, as in Experiment I (§ 4.3.2.4, Figures 40e and 40f) and Exp0 (§
5.3.2.4, Figure 51d), while apexes seem to have had a minor role. Similar as in
Exp0, participants found more challenging to agree on the marks they gave to
words in the audiovisual modality, and overall they agreed much less than in the
control condition for both modalities (Figure 22).
Furthermore, maybe the most surprising result was the signi�cance of the
predictormusical training. In the audio-only modality participants who declared
having received formal music training for more than 5 years were much more
likely to give marks of prominence than participants with no musical training.
However, when the visual cues of prominence were available, the performance
of musically trained participants was di�erent, and they were considerably less
likely to give marks of prominence than in the audio-only modality.
304

Experiment II
5.3.2.6 Analysis D: Second condition ‘Exp2’ (f 0 and duration)
The condition in which intensity had been neutralised as an acoustic cue of
prominence was carried out as an independent between-subjects experiment, as
were the other experimental conditions in this Experiment II.
Similarly as in Exp1, the declaration of the global model included an interac-
tion between the predictormodality and all gesture phases and the acoustic cues
of prominence. The variables musical training and participant gender were also
included as predictors:
In models from �21 to �214 non-signi�cant predictors were progressively re-
moved in order to reach a more parsimonious model. Initially, models �29 (AIC= 2235.70) and �210 (AIC = 2536.10) reached the lowest AIC value. The only
di�ered between each other was the removal of the predictor hold from the in-
teraction with modality. Although these two models were closely followed by
models �28 and �214, in which both more and fewer parameters were estimated,
di�erent random structures were explored for �29 and �210 in the subsequent
models, from model �215 to model �220. However, the minimal adequate model
was �215 (AIC = 2533.70), in which the upper level, speaker, of the nested by-item
random e�ects was removed. It was followed by the competitive model �216 (AIC= 2234.10), in which the absence of hold from the interaction with modality was
the only di�erence from the minimal adequate model (Table 34).
305

Experiment IIMod
elPr
ominen
ceas
afunc
tion
of(�)�x
ede�
ects,w
ithby
-item
andby
-sub
ject
rand
ome�
ects
LogL
ikelihoo
dK
AIC
� �� �
� 21mod
ality
x(prep+stroke
+apex
+ho
ld+recoil+z-�+z-intensity
+z-H1H
2+z-du
ratio
n+musical-training+participant-gend
er)+
+(1
|speaker/sentence/word)
+(1
|partic
ipant)
–1243.56
302547.11
13.42
0.00
� 22mod
ality
x(prep+stroke
+apex
+ho
ld+recoil+z-�+z-intensity
+z-H1H
2+z-du
ratio
n+musical-training)
+participant-gend
er+
+(1
|speaker/sentence/word)
+(1
|partic
ipant)
–1243.56
292545.12
11.43
0.00
� 23mod
ality
x(prep+stroke
+apex
+ho
ld+z-intensity
+z-du
ratio
n+musical-training)
+recoil+z-�+z-H1H
2+participant-gend
er+
+(1
|speaker/sentence/word)
+(1
|partic
ipant)
–1244.69
262541.37
7.68
0.01
� 24mod
ality
x(prep+stroke
+apex
+ho
ld+z-intensity
+z-du
ratio
n+musical-training)
+z-�+z-H1H
2+participant-gend
er+
+(1
|speaker/sentence/word)
+(1
|partic
ipant)
–1244.80
252539.60
5.91
0.01
� 25mod
ality
x(strok
e+apex
+ho
ld+z-intensity
+z-du
ratio
n+musical-training)
+prep
+z-�+z-H1H
2+participant-gend
er+
+(1
|speaker/sentence/word)
+(1
|partic
ipant)
–1246.10
242540.20
6.51
0.01
� 26mod
ality
x(prep+apex
+ho
ld+z-intensity
+z-du
ratio
n+musical-training)
+stroke
+z-�+participant-gend
er+
+(1
|speaker/sentence/word)
+(1
|partic
ipant)
–1246.63
232539.26
5.56
0.01
� 27mod
ality
x(prep+apex
+ho
ld+z-intensity
+z-du
ratio
n+musical-training)
+z-�+participant-gend
er+
+(1
|speaker/sentence/word)
+(1
|partic
ipant)
–1246.80
222537.60
3.90
0.03
� 28mod
ality
x(apex+ho
ld+z-intensity
+z-du
ratio
n+musical-training)
+prep
+z-�+participant-gend
er+
+(1
|speaker/sentence/word)
+(1
|partic
ipant)
–1247.10
212536.19
2.50
0.06
� 29mod
ality
x(apex+ho
ld+z-intensity
+z-du
ratio
n)+prep
+z-�+participant-gend
er+
+(1
|speaker/sentence/word)
+(1
|partic
ipant)
–1250.85
172535.70
2.00
0.07
� 210mod
ality
x(apex+z-intensity
+z-du
ratio
n)+prep
+ho
ld+z-�+participant-gend
er+
+(1
|speaker/sentence/word)
+(1
|partic
ipant)
–1252.05
162536.10
2.41
0.06
� 211mod
ality
x(apex+z-intensity
+z-du
ratio
n)+prep
+ho
ld+z-�+musical-training+participant-gend
er+
+(1
|speaker/sentence/word)
+(1
|partic
ipant)
–1250.85
182537.70
4.00
0.03
� 212mod
ality
x(apex+z-du
ratio
n)+prep
+ho
ld+z-�+z-intensity
+participant-gend
er+
+(1
|speaker/sentence/word)
+(1
|partic
ipant)
–1253.69
152537.38
3.68
0.03
� 213mod
ality
x(apex+z-intensity
+z-du
ratio
n)+ho
ld+z-�+participant-gend
er+
+(1
|speaker/sentence/word)
+(1
|partic
ipant)
–1253.44
152536.88
3.19
0.04
� 214mod
ality
x(apex+z-du
ratio
n)+ho
ld+z-�+participant-gend
er+
+(1
|speaker/sentence/word)
+(1
|partic
ipant)
–1255.28
132536.56
2.86
0.05
� 215mod
alityx(ape
x+ho
ld+z-intens
ity+z-du
ration
)+pr
ep+z-�+pa
rticipan
t-ge
nder
++(1
|sen
tenc
e/word)
+(1
|participa
nt)
–125
0.85
1625
33.70
0.00
0.20
� 216mod
alityx(ape
x+z-intens
ity+z-du
ration
)+pr
ep+ho
ld+z-�+pa
rticipan
t-ge
nder
++(1
|sen
tenc
e/word)
+(1
|participa
nt)
–125
2.05
1525
34.10
0.41
0.16
(a)S
ummaryof
AIC
results
forthe
GLM
Mrand
om-in
terceptm
odels.
306

Experiment II
Mod
elPr
ominen
ceas
afunc
tion
of(�)�x
ede�
ects,w
ithby
-item
andby
-sub
ject
rand
ome�
ects
LogL
ikelihoo
dK
AIC
� �� �
� 217mod
ality
x(apex+ho
ld+z-intensity
+z-du
ratio
n)+prep
+ho
ld+z-�+participant-gend
er+
+(m
odality
|sentence/word)
+(1
|partic
ipant)
–1249.60
202539.20
5.50
0.01
� 218mod
ality
x(apex+ho
ld+z-intensity
+z-du
ratio
n)+prep
+ho
ld+z-�+participant-gend
er+
+(m
odality
|speaker/sentence/word)
+(1
|partic
ipant)
–1249.60
232545.20
11.50
0.00
� 219mod
ality
x(apex+z-intensity
+z-du
ratio
n)+prep
+ho
ld+z-�+participant-gend
er+
+(m
odality
|sentence/word)
+(1
|partic
ipant)
–1250.25
192538.49
4.80
0.02
� 220mod
ality
x(apex+z-intensity
+z-du
ratio
n)+prep
+ho
ld+z-�+participant-gend
er+
+(m
odality
|speaker/sentence/word)
+(1
|partic
ipant)
–1250.31
222544.62
10.92
0.00
(b)S
ummaryof
AIC
results
forthe
GLM
Mrand
om-slope
models.
Table34:Sum
maryofAIC
results
forthe
GLM
Msincond
ition
Exp2.T
hemarking
ofprom
inence
byparticipan
tsismodelledas
afunctio
nofpredictors
declared
as�x
ede�ects.A
llmodelsinclude
by-subjectan
dby-item
rand
ome�ects.T
able(a)showsran
dom-in
terceptm
odels;Table(b)showsd
i�erent
structuresinrand
ome�ects.K
indicatesthe
estim
ated
parametersinthem
odel.T
hestatisticsa
ssociatedtoeach
modelareA
kaikeInformationCriterio
n
(AIC),increase
(� �)ofeachmodelrespecttotheminim
umAIC
value,thelog-lik
elihoodof
themodel,and
theAkaikeweight(� �)fo
reach
cand
idate
modelto
betheminim
aladequa
temodel.
307

Experiment II
Details of minimal adequate model �215The minimal adequate model, �215, did not show overdispersion (�Pearson =
0.87, p > .05; see Appendix B5d for details) and revealed a strong e�ect of f 0 (� =
0.45, SE = 0.13, z = 3.44, p <.001) and duration (� = 0.74, SE = 0.17, z = 4.42, p <.001)predicting prominence. Thus, as standardized variables, 1 standard deviation
increase in the continuous variables of f 0 (SD = 36.84 Hz) and in duration (SD =
0.064 s)madewords 1.57 and 2.11 times, respectively, more likely to be considered
prominent (Figure 56 and Table 35).
Figure 56: Forest plot showing odds ratios for main e�ects and interactions predicting prominence
in �215 (AIC = 2533.70). For OR < 1, e�ect size equals 1/OR. Error bars are 95% CI.
The marks of prominence given by participants signi�cantly coincided with
the gesture phases of apex (� = 1.12, SE = 0.41, z = 2.70, p <.01) and hold (� =
308

Experiment II
Predictor � (SE) p 95% CI for odds ratio
Lower limit Odds ratio Upper limit
Intercept –2.91 (0.60) < .001*** 0.02 0.05 0.18
Modality (0=A, 1=AV) –0.82 (0.42) .05 0.19 0.44 1.02
z-Intensity (standardized intensity) –0.22 (0.64) .72 0.22 0.80 2.82
z-F0 (standardized f 0) 0.45 (0.13) < .001** 1.22 1.57 2.04
z-Duration (standardized duration) 0.74 (0.17) < .001*** 1.52 2.11 2.95
Preparation (0=no, 1=yes) –0.66 (0.40) < .09 0.23 0.51 1.13
Apex (0=no, 1=yes) 1.12 (0.41) < .01** 1.36 3.09 7.01
Hold (0=no, 1=yes) 1.12 (0.47) < .05* 1.21 3.07 7.79
Participant gender 0.75 (0.34) < .05* 1.09 2.13 4.16
Modality AV x Apex 0.55 (0.23) < .05* 1.09 1.75 2.79
Modality AV x Hold –0.48 (0.30) .11 0.34 0.62 1.13
Modality AV x z-Intensity –0.72 (0.38) .06 0.23 0.49 1.04
Modality AV x z-Duration 0.32 (0.11) < .01** 1.10 1.38 1.73
Table 35: Results of �xed e�ects in model �215 (AIC = 2533.70) predicting the marking of prominence
from the variables modality, intensity, fundamental frequency, duration, gesture-preparation,
gesture-apex, gesture-hold, and participant gender.
1.12, SE = 0.47, z = 2.36, p <.05), so that words coincidental with apexes and holdswere 3.09 and 3.07 times, respectively, more likely to be considered prominent.
Additionally, the odds for words rated by women were 2.13 times more likely to
be considered prominent than those words rated by men (� = 0.75, SE = 0.34, z =
2.20, p <.05)
(a) z-f 0 (b) z-Duration
309

Experiment II
(c) Apex (d) Hold
(e) Participant gender
Figure 57: Main e�ects in model �215 (AIC = 2533.70).
The audiovisual modality, where there was a slight tendency for words to
be given fewer marks of prominence, fell short of signi�cance (� = –0.82, SE =
0.42, z = –1.90, p = .05). However, words co-occurring together with an apex
in this modality increased their odds of being perceived as prominent by 1.75
(� = 0.55, SE = 0.23, z = 2.32, p <.05). Similarly, the presence of the visual cues
of prominence made that duration increased the odds of marking a words as
prominent by 1.38 (� = 0.32, SE = 0.11, z = 2.80, p <.01). A contrary trend was
observed for intensity, although this interaction did not reach signi�cance (� =
–0.72, SE = 0.38, z = –1.86, p = .06).
310

Experiment II
(a) z-Duration in AV modality(b) Duration in seconds
(c) Apex in AV modality
Figure 58: Interactions between modality and duration, and modality and apex in model �215.The second-best model, �216 (AIC = 2534.10), was within 2 �-points from
the minimal adequate model, di�ering from it in the removal of the predictor
hold from the interaction withmodality, which made that the predictormodality
reached signi�cance (Figure 59 and Table 36). The goodness of �t of both models
was not a�ected by the removal of the upper level speaker from the nested by-
item random e�ects.
311

Experiment II
Predictor � (SE) p 95% CI for odds ratio
Lower limit Odds ratio Upper limit
Intercept –2.87 (0.60) < .001*** 0.02 0.06 0.018
Modality (0=A, 1=AV) –0.96 (0.42) < .05* 0.38 0.17 0.88
z-Intensity (standardized intensity) –0.24 (0.64) .70 0.22 0.78 2.77
z-F0 (standardized f 0) 0.45 (0.13) < .001** 1.22 1.57 2.04
z-Duration (standardized duration) 0.76 (0.17) < .001*** 1.54 2.15 2.99
Preparation (0=no, 1=yes) –0.67 (0.40) < .09 0.23 0.51 1.13
Apex (0=no, 1=yes) 1.07 (0.41) < .05* 1.29 2.92 6.60
Hold (0=no, 1=yes) 0.93 (0.46) < .05* 1.04 2.55 6.27
Participant gender 0.75 (0.34) < .05* 1.09 2.13 4.17
Modality AV x Apex 0.71 (0.22) < .001** 1.32 2.03 3.13
Modality AV x z-Intensity –0.71 (0.38) .06 0.23 0.49 1.05
Modality AV x z-Duration 0.29 (0.11) < .01** 1.07 1.34 1.67
Table 36: Results of �xed e�ects in model �216 (AIC = 2534.10) predicting the marking of prominence
from the variables modality, intensity, fundamental frequency, duration, gesture-preparation,
gesture-apex, gesture-hold, and participant gender.
Figure 59: Odds ratios for main e�ects and interactions predicting prominence in Exp2 for compet-
itive model �216. For OR < 1, e�ect size equals 1/OR. Error bars are 95% CI.
312

Experiment II
Summary
The analysis of this second experimental condition Exp2, where intensity had
been neutralised as an acoustic cue of prominence, started with the declaration
of a global model. Initially, several models proved competitive and included both
more and fewer predictors. From these, models �29 (AIC = 2535.70) and �210 (AIC= 2536.10) had the lowestAIC value. The removal of the upper level speaker from
their nested by-item random e�ects resulted in the minimal adequate model �215and its competitor �216. These two were reported, but only the minimal adequate
model was discussed.
This minimal adequate model revealed that participants’ marks of promi-
nence were in�uenced by the acoustic correlates of f 0 and duration. Besides,
their marks signi�cantly coincided with words accompanied by the apex and
hold phases of gestures. Unlike the results obtained so far, apexes were actually
observed tomake participants increase their marks of prominence in the audiovi-
sual modality, while neither strokes nor holds played any role in the audiovisual
modality in this second condition Exp2.
In this sense, the audiovisual modality showed a tendency for participants to
reduce their marks of prominence when compared to the audio-only modality
and although this e�ect fell short of signi�cance (p = .05), it proved signi�cant
in the second-best model �216 (Table 36) when the predictor hold was removed
from the interaction withmodality (Figure 59). Interestingly, and also di�erently
from the analyses of the previous conditions, participants seemed to get closer to
the ‘gold standard’ in both modalities, and they even reached a higher agreement
on their marks of prominence in the audiovisual than in the audio-only modality.
Probably the most surprising result found in this condition Exp2 is the sig-
ni�cant di�erence found between men and women, where the latter were much
more likely to consider words as prominent. However, this did not seem to be
313

Experiment II
determined by the visual cues of prominence, since no interaction was found
between the predictors participant gender and modality. Despite this, when the
distribution of participants according to their genderwas analysed inmore detail,
it was observed that a clear unbalance existed between both modalities (Figure
60). Therefore, it is possible that this fact could underlie the signi�cant di�erence
observed in the performance of male and female participants.
Figure 60: Number of participants in both modalities according to their gender in Exp2.
314

Experiment II
5.3.2.7 Analysis E: Third condition ‘Exp3’ (duration)
The third experimental condition, Exp3, for which a separate process of data
collection was carried out with a group of 60 participants, involved the neutral-
isation of both f 0 and intensity. The modelling of participants’ responses started
by declaring an initial model as done in the previous experimental conditions (§
5.3.2.4, § 5.3.2.5, § 5.3.2.6):
Model selection proceeded progressively by removing non-signi�cant pre-
dictors from model �31 to model �317. From these, several models appeared
within less than 2 �-points from the last model, �317 (AIC = 2408.90), all hav-
ing between one and three more predictors, i.e. �316, �315, �314, and �313.In the subsequent models, from �318 to �323, random e�ects structures for
the model with the lowest AIC value, �317, and for its immediate competitor,
were explored. Models �318 and �319 omitted the upper level speaker of by-item
random e�ects. Then, random slopes were declared for the e�ect of the variable
modality on by-item random e�ects in the remaining four models, from �320 to�323. In these four models the upper level speaker that had just been removed
from by-item random e�ects was alternatively reintroduced to test whether the
AIC value decreased. However, the resulting AIC value did not improve that of
the random-intercept models �318 (AIC = 2407.50) and �319 (AIC = 2407.77). From
these two competitors, model �318 was preferred for being the more parsimoni-
ous of the two as well as for having a lower AIC value (Table 37).
315

Experiment II
Mod
elPr
ominen
ceas
afunc
tion
of(�)�x
ede�
ects,w
ithby
-sub
ject
andby
-item
rand
ome�
ects
LogL
ikelihoo
dK
AIC
� �� �
� 31mod
ality
x(prep+stroke
+apex
+ho
ld+recoil+z-�+z-intensity
+z-H1H
2+z-du
ratio
n+musical-training+participant-gend
er)+
+(1
|partic
ipant)+(1
|speaker/sentence/word)
–1185.27
302430.55
23.05
0.00
� 32mod
ality
x(prep+stroke
+apex
+ho
ld+recoil+z-�+z-intensity
+z-H1H
2+z-du
ratio
n+musical-training)
+participant-gend
er+
+(1
|partic
ipant)+(1
|speaker/sentence/word)
–1185.87
292429.74
22.24
0.00
� 33mod
ality
x(prep+stroke
+apex
+ho
ld+recoil+z-intensity
+z-�+z-du
ratio
n+musical-training)
+z-H1H
2+participant-gend
er+
+(1
|partic
ipant)+(1
|speaker/sentence/word)
–1185.88
282327.77
20.27
0.00
� 34mod
ality
x(prep+stroke
+apex
+ho
ld+recoil+z-intensity
+z-�+z-du
ratio
n)+z-H1H
2+musical-training+participant-gend
er+
+(1
|partic
ipant)+(1
|speaker/sentence/word)
–1187.13
262426.27
18.77
0.00
� 35mod
ality
x(strok
e+apex
+ho
ld+recoil+z-�+z-intensity
+z-du
ratio
n)+prep
+z-H1H
2+musical-training+participant-gend
er+
+(1
|partic
ipant)+(1
|speaker/sentence/word
–1187.17
252424.33
16.83
0.01
� 36mod
ality
x(strok
e+ho
ld+recoil+z-�+z-intensity
+z-du
ratio
n)+prep
+apex
+z-H1H
2+musical-training+participant-gend
er+
+(1
|partic
ipant)+(1
|speaker/sentence/word)
–1187.24
242422.47
14.97
0.01
� 37mod
ality
x(strok
e+ho
ld+recoil+z-�+z-du
ratio
n)+prep
+apex
+z-intensity
+z-H1H
2+musical-training+participant-gend
er+
+(1
|partic
ipant)+(1
|speaker/sentence/word)
–1187.27
232420.55
13.05
0.01
� 38mod
ality
x(strok
e+ho
ld+recoil+z-�)+
prep
+apex
+z-intensity
+z-H1H
2+z-du
ratio
n+musical-training+participant-gend
er+
+(1
|partic
ipant)+(1
|speaker/sentence/word)
–1187.28
222418.56
11.06
0.00
� 39mod
ality
x(strok
e+ho
ld+recoil+z-�)+
prep
+apex
+z-H1H
2+z-du
ratio
n+musical-training+participant-gend
er+
+(1
|partic
ipant)+(1
|speaker/sentence/word)
–1187.29
212416.58
9.08
0.00
� 310mod
ality
x(strok
e+ho
ld+recoil+z-�)+
prep
+apex
+z-H1H
2+z-du
ratio
n+participant-gend
er+
+(1
|partic
ipant)+(1
|speaker/sentence/word)
–1188.00
192414.01
6.51
0.01
� 311mod
ality
x(strok
e+ho
ld+recoil)
+prep
+apex
+z-�+z-H1H
2+z-du
ratio
n+participant-gend
er+
+(1
|partic
ipant)+(1
|speaker/sentence/word)
–1188.26
182412.53
5.03
0.02
� 312mod
ality
x(strok
e+ho
ld+recoil)
+apex
+z-�+z-H1H
2+z-du
ratio
n+participant-gend
er+
+(1
|partic
ipant)+(1
|speaker/sentence/word)
–1188.66
172411.32
3.82
0.04
� 313mod
ality
x(strok
e+ho
ld+recoil)
+apex
+z-�+z-du
ratio
n+participant-gend
er+
+(1
|partic
ipant)+(1
|speaker/sentence/word)
–1188.93
162409.85
2.35
0.08
� 314mod
ality
x(strok
e+ho
ld+recoil)
+apex
+z-du
ratio
n+participant-gend
er+
+(1
|partic
ipant)+(1
|speaker/sentence/word)
–1189.58
152409.16
1.66
0.11
� 315mod
ality
x(strok
e+recoil)
+apex
+ho
ld+z-du
ratio
n+participant-gend
er+
+(1
|partic
ipant)+(1
|speaker/sentence/word)
–1191.24
142410.48
2.98
0.06
� 316mod
ality
x(hold+recoil)
+stroke
+apex
+z-du
ratio
n+participant-gend
er+
+(1
|partic
ipant)+(1
|speaker/sentence/word)
–1191.19
142410.38
2.88
0.06
� 317mod
ality
x(recoil)+stroke
+apex
+ho
ld+z-du
ratio
n+participant-gend
er+
+(1
|partic
ipant)+(1
|speaker/sentence/word)
–1191.45
132408.90
1.40
0.13
� 318mod
alityx(recoil)+stroke
+ap
ex+ho
ld+z-du
ration
+pa
rticipan
t-ge
nder
++(1
|participa
nt)+
(1|sen
tenc
e/word)
–1191.75
1224
07.50
0.00
0.25
� 319mod
alityx(strok
e+ho
ld+reco
il)+ap
ex+z-du
ration
+pa
rticipan
t-ge
nder
++(1
|participa
nt)+
(1|sen
tenc
e/word)
–1189.88
1424
07.77
0.27
0.22
(a)S
ummaryof
AIC
results
forthe
GLM
Mrand
om-in
terceptm
odels.
316

Experiment II
Mod
elPr
ominen
ceas
afunc
tion
of(�)�x
ede�
ects,w
ithby
-sub
ject
andby
-item
rand
ome�
ects
LogL
ikelihoo
dK
AIC
� �� �
� 320mod
ality
x(recoil)+stroke
+apex
+ho
ld+z-du
ratio
n+participant-gend
er+
+(1
|partic
ipant)+(m
odality
|sentence/word)
–1190.91
162413.82
6.32
0.01
� 321mod
ality
x(recoil)+stroke
+apex
+ho
ld+z-du
ratio
n+participant-gend
er+
+(1
|partic
ipant)+(m
odality
|speaker/sentence/word)
–1190.44
192418.87
11.37
0.00
� 322mod
ality
x(strok
e+ho
ld+recoil)
+apex
+z-du
ratio
n+participant-gend
er+
+(1
|partic
ipant)+(m
odality
|speaker/sentence/word)
–1198.66
182415.31
7.81
0.01
� 323mod
ality
x(strok
e+ho
ld+recoil)
+apex
+z-du
ratio
n+participant-gend
er+
+(1
|partic
ipant)+(m
odality
|sentence/word)
–1185.27
212420.12
12.62
0.00
(b)S
ummaryof
AIC
results
forthe
GLM
Mrand
om-slope
models.
Table37:Sum
maryofAIC
results
forthe
GLM
Msincond
ition
Exp3.T
hemarking
ofprom
inence
byparticipan
tsismodelledas
afunctio
nofpredictors
declared
as�x
ede�ects.A
llmodelsinclude
by-subjectan
dby-item
rand
ome�ects.T
able(a)showsran
dom-in
terceptm
odels;Table(b)showsd
i�erent
structuresinrand
ome�ects.K
indicatesthe
estim
ated
parametersinthem
odel.T
hestatisticsa
ssociatedtoeach
modelareA
kaikeInformationCriterio
n
(AIC),increase
(� �)ofeachmodelrespecttotheminim
umAIC
value,thelog-lik
elihoodof
themodel,and
theAkaikeweight(� �)fo
reach
cand
idate
modelto
betheminim
aladequa
temodel.
317

Experiment II
Details of minimal adequate model �318Theminimal adequate model �318 (AIC = 2407.50) did not present overdisper-
sion (�Pearson = 0.77, p > .05; see Appendix B5e for details). This model revealed
that participants strongly relied on the only acoustic cue available to them in the
task of binary prominence marking (� = 0.91, SE = 0.19, z = 4.74, p < .001). Thus,
1 standard deviation in syllable duration (SD = 0.064 s) increased 2.49 times the
odds for marking words as prominent (Table 38).
Predictor � (SE) p 95% CI for odds ratio
Lower limit Odds ratio Upper limit
Intercept –4.39 (0.56) < .001*** 0.00 0.01 0.04
Modality (0=A, 1=AV) –0.11 (0.24) .63 0.55 0.89 1.44
z-Duration (standardized duration) 0.91 (0.20) < .001*** 1.71 2.49 3.62
Stroke (0=no, 1=yes) 1.83 (0.50) < .001*** 2.36 6.25 16.55
Apex (0=no, 1=yes) 1.30 (0.54) < .05* 1.27 3.67 10.62
Hold (0=no, 1=yes) 2.67 (0.71) < .001*** 3.61 14.56 58.70
Recoil (0=no, 1=yes) 1.56 (0.75) < .05* 1.10 4.76 20.69
Participant gender 0.65 (0.24) < .01** 1.19 2.49 3.62
Modality AV x Recoil –0.70 (0.34) < .05* 0.25 0.49 0.97
Table 38: Results of �xed e�ects in model �318 (AIC = 2407.50) predicting the marking of prominence
from the variables modality, duration, gesture-stroke, gesture-apex, gesture-hold, gesture-recoil
and participant gender.
Participants’ marks signi�cantly coincided with all gesture phases except for
the preparation phase of gestures. Those words coinciding with strokes were
6.25 times more likely to receive a mark of prominence (� = 1.83, SE = 0.50, z =
3.68, p < .05); odds raised up to 3.67 times for words coinciding with apexes (�= 1.30, SE = 0.54, z = 2.40, p < .001); for holds, odds increased the probability of
words to be considered prominent by 14.56 times (� = 2.67, SE = 0.71, z = 3.76, p< .05); and �nally, words coinciding with the recoil phase of gestures were 4.76
318

Experiment II
times more likely to be given a mark of prominence (� = 1.56, SE = 0.75, z = 2.08,
p < .001).
In the audiovisual modality, however, participants did not perform di�er-
ently from the audio-only modality, and only the recoil phase of gestures seemed
to have an in�uence on the way participants marked prominence. In this case,
words coincided with recoils in the audiovisual modality were 2.04 times less
likely to receive a mark of prominence (� = –0.70, SE = 0.34, z = –2.06, p < .05).
Finally, a moderate e�ect was observed for the way women marked promi-
nent words when compared to men. As it is apparent in this minimal adequate
model, as well as in its competitor, �319, women were 1.93 times more likely than
men to give a word a mark of prominence.
Figure 61: Forest plot showing odds ratios for main e�ects and interactions predicting prominence
in �318 (AIC = 2407.50). For OR < 1, e�ect size equals 1/OR. Error bars are 95% CI.
319

Experiment II
(a) Stroke (b) Apex
(c) Hold (d) Recoil
(e) z-Duration (f) Participant gender
Figure 62: Main e�ects in model �318 (AIC = 2407.50).
320

Experiment II
Figure 63: Interaction in model �318 (AIC = 2407.50) between recoil and modality.
After the minimal adequate model, �318, the next model within 2 �-pointswas model �319 (AIC = 2407.77). This competitor included two more estimated
parameters, which corresponded to the predictors stroke and hold in an interac-
tion withmodality. None of these two gesture phases proved signi�cant through
the e�ect of modality, and although both fell short of signi�cance, they showed
a tendency to make participants mark fewer prominent words coinciding with
them (strokes, � = –0.63, SE = 0.34, z = –1.83, p = .06; and holds, � = –1.16, SE =
0.41, z = –2.78, p = .06). The sign and signi�cance of the remaining odds ratios
remained the same in this competitor model, even if the e�ect size for some of
them varied, which especially a�ected the predictors apex, hold, and recoil (Table
39).
321

Experiment II
Predictor � (SE) p 95% CI for odds ratio
Lower limit Odds ratio Upper limit
Intercept –4.71 (0.60) < .001*** 0.00 0.01 0.03
Modality (0=A, 1=AV) –0.49 (0.40) .21 0.75 1.64 3.55
z-Duration (standardized duration) 0.91 (0.19) < .001*** 1.71 2.49 3.63
Stroke (0=no, 1=yes) 2.16 (0.53) < .001*** 3.05 8.73 24.98
Apex (0=no, 1=yes) 1.30 (0.54) < .05* 1.26 3.65 10.57
Hold (0=no, 1=yes) 3.06 (0.74) < .001*** 4.97 21.42 92.29
Recoil (0=no, 1=yes) 1.81 (0.76) < .05* 1.37 6.12 27.44
Participant gender 0.65 (0.24) < .01** 1.19 1.93 3.11
Modality AV x Stroke –0.63 (0.34) .06 0.27 0.53 1.05
Modality AV x Hold –0.75 (0.40) .06 0.21 0.47 1.04
Modality AV x Recoil –0.70 (0.34) < .05* 0.14 0.31 0.71
Table 39: Results of �xed e�ects in model �319 (AIC = 2407.77) predicting the marking of prominence
from the variables modality, duration, gesture-stroke, gesture-apex, gesture-hold, gesture-recoil
and participant gender.
Figure 64: Odds ratios for main e�ects and interactions predicting prominence in Exp3 for compet-
itive model �319 (AIC = 2407.77). For OR < 1, e�ect size equals 1/OR. Error bars are 95% CI.
322

Experiment II
Summary
In this third experimental condition Exp3, both f 0 and intensity had been
neutralised as acoustic cues of prominence. The initial model �tted to analyse
the prediction of prominence with the variables of interest also included the pre-
dictorsmusical training and participant gender. Among the di�erentmodels�tted
in the model set, the AIC value of a few of them was within a narrow range from
each other. From the subset of these competitive models, the two with the lowest
AIC value, �314 (AIC = 2409.16) and �317 (AIC = 2408.90), and fewer predictors—
15 and 13, respectively—, were subsequently declared with di�erent by-item ran-
dom e�ects structures. The minimal adequate model was the random-intercept
model �318 (AIC = 2407.50), whose by-item random e�ects did not include the
upper level speaker in its nested structure.
The minimal adequate model revealed that syllable duration, as the only
acoustic cue of prominence available to participants, had a strong e�ect on them
for marking words as prominent. Furthermore, di�erently from Exp1, where also
f 0 had been neutralised, in this Exp3 participants declaring having receivedmore
than 5 years of formal musical training did not seem to perform di�erently from
other participants.
As for the gesture phases coincidental with words, almost all of them in-
creased the probabilities of participants’ giving those words a mark of promi-
nence: strokes, apexes, holds, and recoils—only preparation did not show any
e�ect. On the one hand, a previous comparison of this Exp3 against the con-
trol condition in model G17 (Figure 48) showed a tendency for participants to
consider more words as prominent in all experimental conditions, although this
time the di�erence in this Exp3 fell short of signi�cance (p = .07) (Table 27). On
the other hand, agreement in both the audio-only (� = .350) and the audiovisual(� = .356) modalities was very similar, with a very slight tendency in both mo-
323

Experiment II
dalities to improve when compared to the ‘gold standard’ (� = .366 for the audio-only and � = .368 for the audiovisual modality), revealing a closer agreement to
the marks of two trained listeners than the agreement observed for participants
in other conditions. In this Exp3 participants achieved a higher agreement than,
for example, in Exp1, despite counting on fewer cues of prominence.
These results suggest that prominence marks in this Exp3 were di�erently
distributed when compared to the previous conditions, possibly with a stronger
reliance on the visual cues of prominence, although this did not result in a better
agreement among participants in the audiovisual modality. Interestingly, among
the gestures phases, only recoil showed di�erences between modalities. More
precisely, recoils were observed to reduce the probability of words to be con-
sidered prominent when participants could count on the visual cues of promi-
nence. Next to recoil, a similar trend was found in model �319 for strokes and
hold (Figure 64), although neither reached signi�cance (p = .06 for both stroke
and hold, Table 39).
This might be interpreted as evidence of the lesser in�uence of recoil on per-
ceiving prominent words when the visual cues were available to participants.
Following this line of reasoning, the gesture phases coincidental with words that
might have randomly receivedmarks of prominence in the audio-onlymodality—
e.g. strokes, holds, recoils—, seem to have been less likely to drive participants’
prominence perception in the audiovisual modality. Therefore, a trend is appar-
ent for words which were perceived as prominent in the audio-only modality to
be considered non-prominent when participants could observe the visual cues
they co-occurred with.
Finally, as observed in the second experimental condition Exp2, where inten-
sity had been neutralised, women seemed much more likely than men to mark
words as prominent, and this e�ect was not observed to interact with the vari-
324

Experiment II
able modality. In order to better understand this di�erence, the distribution of
participants in each of these two experimental conditions was analysed (Figure
65), as in Exp2. However, while in Exp2, this di�erence might have been due to
an unbalanced distribution of men and women between both modalities, such a
signi�cant di�erence in this Exp3 does not seems likely to be due to the same
fact, especially since the number of male and female participants is very similar
in both the audio-only modality and the audiovisual modality.
Figure 65: Number of participants in both modalities according to gender in Exp3.
325

Experiment II
(a)� 020
inEx
p0(b)� 113
inEx
p1
Figu
re66:C
omparison
ofodds
ratio
sfor
varia
bles
predictin
gprom
inence
inthetop-rank
edmodelso
f(a)
Exp0,(b)
Exp1,(c)Ex
p2,and
(d)E
xp3.
326

Experiment II
(c)� 215
inEx
p2(d)� 318
inEx
p3
Figu
re66:C
omparison
ofodds
ratio
sfor
varia
bles
predictin
gprom
inence
inthetop-rank
edmodelso
f(a)
Exp0,(b)
Exp1,(c)Ex
p2,and
(d)E
xp3.
327

Experiment II
5.4 Discussion
Perception of acoustic phrasal prominence is mediated by the visual cues of
prominence, as observed in previous research (e.g. Krahmer & Swerts, 2007; Pri-
eto et al., 2011), and the interplay between both modalities has become to be
known as audiovisual prosody (Krahmer & Swerts, 2009). Building on the meth-
odology used in Experiment I, the aim of this Experiment II was to gain insight
precisely into the multimodal perception of acoustic prominence and analyse
how exactly the di�erent acoustic correlates of prominence are used by listeners,
with and without relying on visual cues, in Castilian Spanish. For this, four inde-
pendent perceptual experiments were conducted via the Internet, each involving
a di�erent manipulation of the acoustic correlates of prominence: manipulation
of f 0 in condition ‘Exp1’; of intensity in condition ‘Exp2’; and of both f 0 and
intensity in ‘Exp3’—the control condition ‘Exp0’ did not involve any manipula-
tion of the speech signal. Each experiment was also presented to participants
in either the audio-only or the audiovisual modality. A total of 240 participants
rated 12960 words, corresponding to four target sentences used as stimuli, so
that 30 participants rated just one experimental condition in only one of the two
modalities. The Internet has been previously used in similar perceptual studies
successfully (e.g. Kok et al., 2016; Masson-Carro et al., 2017). For example, in a
study on the functional role of gestures, Kok and his colleagues (2016) admin-
istered a series of online videos to participants to rate the gestures they observed
using a 7-point Likert scale. For this, participants were �nancially compensated
through the online platform Crowd�ower2.
Experiment II followed a similar way of administering stimuli to participants
via the Internet, although it involved no remuneration, and it employed the same
2 Now Figure Eight, https://www.�gure-eight.com/.
328

Experiment II
methodology used in Experiment I (§ 3.3.2 and § 3.3.3). A small corpus of 50
sentences had been previously built for Experiment I using spontaneous speech
samples extracted from a Spanish television talent show (Operación Triunfo, 1st
edition). From this corpus, a set of 13 sentences were selected to be used as
stimuli, so that the necessary time to complete this online Experiment II did not
take much longer than 10 minutes.
Hypothesis 1: methodology
Di�erently from the methodology applied in this research, previous meth-
odologies used animated agents (e.g. Al Moubayed & Beskow, 2009; Krahmer
et al., 2002a) or multimodal stimuli elicited in experimental settings (e.g. Foxton
et al., 2010; Krahmer & Swerts, 2007) to study multimodal prominence percep-
tion. Apart from these, very few studies employed spontaneous speech, from
which only Swerts and Krahmer (2010, experiment 1: ‘auditory mark-up’) con-
ducted a perceptual experiment, although only in the auditory modality. The
limitations inherent to these methods, already mentioned (§ 3.3.1), have not pre-
viously allowed to study in detail how the di�erent acoustic correlates of promi-
nence relate to one another and what is the exact role played by gestures in this
process.
Experiment I, using spontaneous speech to overcome some of the mentioned
limitations, showed that spontaneous speech material could be used successfully
in the study of the multimodal perception of prominence. Besides, it permitted to
explore some of the issues that still remained unanswered and added ecological
validity to the study of multimodal prominence perception. The results obtained
in Experiment I were a �rst approximation to the two research questions ad-
dressed in this study. These results were partly replicated in this Experiment II,
and theywere also extended using amuchmore larger sample size of participants
329

Experiment II
and a smaller sample size of target sentences.
After describing the collected data, agreement among participants was cal-
culated separately per condition and modality and expressed as mean Cohen’s
kappa. Participants’ agreement values across conditions was generally low and
ranged between � = .28 and � = .42 in the audio-only modality, and between �= .27 and � = .38 in the audiovisual modality. However, despite the low values
reached in some experimental conditions, agreement reached the highest value
(� = .42) in the audio-only modality in the control condition Exp0—in which par-
ticipants relied on all acoustic cues of prominence. This shows a slightly higher
agreement than that obtained in studies under similar conditions, i.e. prominence
rating in the audio-only modality of non-manipulated stimuli from a corpus of
spontaneous speech, as in Mo et al. (2008) (� = .38).
Certainly, Mo and her colleagues used Fleiss’s kappa, a statistic that goes
beyond pairwise comparisons and provides a single value for agreement among
more than two raters. In this research, mean Cohen’s kappa was preferred, since
the responses of two trained listeners relying on all acoustic cues of prominence
were used as a ‘gold standard’ to compare pairwise to the responses of each
participant. This allowed to assess how agreement among participants devi-
ated or got closer to this ‘gold-standard’ depending on whether the values of
mean Cohen’s kappa decreased or increased in the comparison when responses
by the two trained listeners were computed (details are in 22). Despite the low
agreement obtained in some conditions, such as in Exp1—neutralised f 0—, par-
ticipants agreement was generally closer to that of the two trained listeners in
the audio-only modality than in the audiovisual modality. From a mere percep-
tual perspective, it might be possible that agreement was lower due to the higher
cognitive load involved in processing the speech in the audiovisual modality.
Inter-rater agreement in this Experiment II (between � = .28 and � = .42)
330

Experiment II
was similar to that obtained in Experiment I (� = .39). As just mentioned, des-
pite being low, agreement is not lower than those obtained in studies under bet-
ter and more homogenized perceptual conditions. This suggests that such low
agreement cannot be exclusively ascribed to the di�culty of the task or the neut-
ralization of the acoustic cues, but to the general di�culty that experiments on
prominence perception seem to involve.
However, it is interesting to note that in this Experiment II the observed dif-
ferences among modalities tended to decrease with the neutralization of acoustic
cues, with a very similar agreement between modalities in Exp3 (only duration
as cue). Actually, there was a consistently higher agreement in the audio-only
modality than in the audiovisual modality, except in Exp2 (where intensity had
been neutralized), where this trend was reversed (Figure 22). The lowest agree-
ment was obtained in the audiovisual modality of Exp1 (where intensity had been
neutralized). This seems to indicate that the visual cues of prominence did not
su�ce for participants to clearly agree on the prominent words of the sentences
when the perceptual weight of f 0 was absent. Interestingly, such a low agree-
ment was not observed in Exp3 (only duration), where participants’ responses
were more similar–and therefore with a higher inter-rater agreement—not only
when compared to one another, but also when compared between modalities.
Also, in the audio-only modality the participants’ responses tended to get
closer to the ‘gold standard’ of the responses given by two trained listeners, while
they got farther in two of the four experimental conditions (Exp0 and Exp1) in
the audiovisual modality. This could be interpreted, as previously mentioned, as
a di�culty to process the higher cognitive load involved in processing the speech
in the audiovisual modality. In this respect, it is respect, it is worth noting that
the highest agreement was certainly in the audio-only modality of the control
condition, Exp0, which makes it slightly higher than the value o�ered by Mo et
331

Experiment II
al. under similar conditions (2008).
As for model building and selection based onAIC, it was successfully applied,
as in Experiment I. Although the introduction of information criteria approaches
in statistical analysis that make use of mixed models is still relatively uncommon
in the �eld of linguistics (e.g. Adamou et al., 2018), it has being gaining popularity
over the last decade in other �elds such as biology, ecology, or evolution, where it
is now often applied (see e.g. Arnold, T. W., 2010; Grueber et al., 2011, for details).
In this Experiment II, all three experimental conditions, carried out as in-
dependent experiments on the Internet in each modality, were �rstly compared
against the control condition as done in Experiment I (§ 4.3.2.4 and § 4.3.2.3).
Next to the control group, the ‘gold standard’ was also used to assess the per-
formance of participants in the control condition, who could rely on all acoustic
cues of prominence. Secondly, the between-subjects design of the experiment
allowed to independently analyse the role of the di�erent variables that made
participants consider words prominent in each experimental condition.
For this, di�erent generalised linear mixed models were �tted to assess the
variables of interest, which included the gestures phases of preparation, stroke,
apex, hold, and recoil, as well as the acoustic correlates of f 0, intensity, spectral
balance, and duration. From the set of built models, the minimal adequate model,
i.e. that with the lowest AIC value, was reported (§ 5.3.2.3) and discussed (§
5.3.2.3).
Hypothesis 2: acoustic correlates of prominence
The manipulations conducted on the speech signal allowed to administer the
stimuli in three di�erent conditions. In the case of f 0, the intonation curve was
kept within a range of 2 ST between the lowest and the highest f 0 values; and
intensity was neutralised to a constant amplitude of 69 dB. Duration was not
332

Experiment II
manipulated, partly because there did not seem to be an easy way to neutralise
its prominence-lending properties without incurring in a perceptual mismatch
between the sound of the speech signal and the articulation movements per-
formed by the speaker in the image.
Hypothesis 2.1 was supported by the results of this Experiment II, as it was
in Experiment I. However, hypothesis 2.2 was rejected, since duration was con-
sistently found to strongly in�uence participants’ marking performance, and
also drive the process of prominence perception, even when it was the only
available cue. Together with duration, in conditions where f 0 was available to
participants—Exp0 and Exp2—this acoustic correlate also had a strong e�ect on
the way participants marked prominent words. In its turn, intensity seemed to
have a lesser e�ect than f 0 and duration on participants’ perception. Thus, when
all acoustic cues were available in Exp0, intensity did not prove signi�cant, and
participants gave prominence marks led by the perceptual e�ects of f 0 and du-
ration (see Figure 66 for a comparison).
However, also in the control condition Exp0, spectral balance seemed to play
a more important role than intensity, even if it did not reach signi�cance
(p = .07, see Table 29). Interestingly, in Exp1, where f 0 had been neutralised,
intensity did seem to be more relied on by participants, next to duration, despite
the fact that this e�ect wasmoremodest than that observed for the other acoustic
correlates of prominence. More precisely, in the two models reported in this �rst
condition Exp1, intensity fell short of signi�cance in the �rst one (p = .05) and
proved signi�cant in the second one, while spectral balance did not seem to play
any important role in this experimental condition (Figure 55). In the case of the
second condition Exp2, both f 0 and duration, as the only acoustic cues available
to participants, were signi�cantly used by participants in the process of rating.
Finally, in the third experimental condition Exp3, where both f 0 and intensity
333

Experiment II
had been neutralised, duration proved su�cient for participants to consistently
mark prominent words.
This is in linewith previous results supporting the cross-linguistic role played
by duration in producing and perceiving phrasal prominence in combination
with the perceptual e�ects of at least another correlate (Kohler, 2005; Mo, 2008b;
Ortega-Llebaria, 2006; Vogel et al., 2016). For example, in a similar study on the
perception of phrasal prominence conducted in English—but only the in the au-
ditory modality—, Mo (2008a) concluded that duration determined participants’
marks of prominence; and she also reported a strong e�ect of spectral balance
next to that of duration. In the case of Spanish, Ortega-Llebaria (2006) observed
that syllables became longer when they were realised together with a pitch ac-
cent (Figure 3). Additionally, this correlation between f 0 and duration was also
reported for Spanish by Vogel et al. (2016) in the context of unstressed vowels,
who concluded that duration had the lead in cueing phrasal prominence (Figure
4).
As mentioned earlier, the results obtained in Experiment II show that the
perceptual e�ect of intensity in combination with duration seems less strong
than the joint e�ect of f 0 and duration. This might be due to the mentioned
lengthening e�ect of pitch accents on stressed syllables. However, evidence for
the combined role of duration and intensity/spectral balance on the production
and perception of phrasal prominence has also been reported by several authors,
(e.g. for English Kochanski et al., 2005; Mo, 2008a; Silipo &Greenberg, 1999, 2000;
for Dutch Sluijter & van Heuven, 1996b; Sluijter et al., 1997). Although in both
cases the importance of duration seems unquestioned, the support for either f 0
or intensity/spectral balance as an auxiliary cue to duration is reminiscent of the
long-standing debate that confronted advocates of the melodic accent against
those defending the role of loudness/articulatory e�ort (e.g. Sievers, 1901; Stet-
334

Experiment II
son, 1928; Navarro Tomás, 1964) (§ 2.1.4 and § 2.1.8.7).
Hypothesis 3: gestural correlates of prominence
The results obtained in this Experiment II show little di�erence between mo-
dalities when all experimental conditions were compared to the control as in
Experiment I, in which an overall di�erence between modalities was observed.
More precisely, Experiment I revealed a lower perceptual threshold in parti-
cipants for f 0 and duration in the audiovisual modality (Figure 40a and Figure
40b). However, unlike Experiment I, this was not observed when the three exper-
imental conditions were compared against the control condition in Experiment
II; although an e�ect of modality on duration was found in the second condition
Exp2 in the opposite direction. In this second condition, where intensity had
been neutralised, the same increase in syllable length in both modalities had a
stronger perceptual e�ect on participants relying on the visual cues of promi-
nence (Figure 58a). In other words, for a word to be considered prominent parti-
cipants needed it to be longer in the audiovisual modality than in the audio-only
modality, despite counting on the visual cues of prominence. In this sense, previ-
ous studies have observed that the visual cues of prominence have an in�uence
on the perception of both f 0 and intensity (Foxton et al., 2010; Scarborough et al.,
2009), with a slightly stronger e�ect in the case of intensity, which Foxton et al.
related to its more clearly perception as a result of visible articulatory e�ort.
However, the di�erences observed between Experiment I and Experiment II
for the e�ect of the visual cues of prominence on the perception of the acoustic
cues of f 0 and duration might be due to a di�erence in the number of stimuli
and their range of acoustic values. On the other hand, the results obtained in
Experiment II indicate that in the absence of intensity—as in Exp2—perception of
syllable length seems to vary betweenmodalities. In this sense, the neutralisation
335

Experiment II
of intensity might be responsible for this di�erence, especially because of the
perceptual e�ect pointed out for the combination of intensity and duration (Turk
& Sawusch, 1996).
Furthermore, the results for the e�ect of modality on the perception of prom-
inence only overlapped partially in both Experiment I and Experiment II. Despite
the lack of overall main e�ect of modality, hypothesis 3.1 was supported by the
role played by the visual cues of prominence in the marks given by participants.
On the one hand, there was a general tendency for participants to mark more
words in the audiovisual modality, but unlike Experiment I, this was not found
signi�cant in Experiment II. On the other hand, when participants could not
rely on all acoustic cues of prominence in Experiment I, this trend decreased and
words were less likely to be considered prominent in the audiovisual modality. In
Experiment I this had proved signi�cant in the cases where f 0 had been neutral-
ised in C1 and when both f 0 and intensity had been neutralised in C3. However,
despite observing a similar trend in Experiment II in all experimental conditions,
this e�ect only reached signi�cance in the second condition Exp2—neutralised
intensity (Figure 49).
One possible interpretation of this trend is that the uncertainty caused by the
absence of clear acoustic cues—as when both f 0 and intensity were neutralised—
result in more randommarking of prominence. It is possible that the information
available in the audiovisual modality makes participants concentrate their prom-
inence marks around the more clearly perceived visual cues of prominence. The
role played by the di�erent gesture phases in the audiovisual modality showed
a tendency for words to be considered less prominent when accompanied by
strokes, holds, and recoils, but only the recoil phase of gestures was found signi-
�cant. Several authors have underlined the role played by visual cues, especially
beat gestures conducted with head, eyebrows, or hands, in enhancing the per-
336

Experiment II
ception of acoustic prominence (e.g. Al Moubayed & Beskow, 2009; Granström
et al., 1999; House et al., 2001; Krahmer et al., 2002a,b; Krahmer & Swerts, 2007;
Prieto et al., 2011). Additionally, some studies on the neural integration and pro-
cessing of gesture and speech have also pointed out that one of the functions
of beat gestures might be driving listeners’ attention and helping them process
relevant aspects of the spoken signal (Biau & Soto-Faraco, 2013; Biau et al., 2015).
In this sense, the contribution of visual cues to participants’ processing of
acoustic prominence has been mainly driven by the stroke phase of gestures,
which rejects hypothesis 3.2, as reported in Experiment I. In the general com-
parison of the experimental conditions against the control group, strokes were
observed to increase the chances of marking prominence in the audiovisual mo-
dality. This e�ect was also observed in a similar comparison in Experiment I
(Figure 40f) and both in the control condition Exp0 (Figure 51d) and in the �rst
condition Exp1 (Figure 54f) of Experiment II.
Interestingly, participants’ marks in the audiovisual modality did not seem
to be generally prompted by apexes, which actually reduced the chances of the
words they co-occurred with to be considered prominent. This seeming hinder-
ing e�ect of apexes was observed both in Experiment I for the comparison of all
conditions against the control (Figure 40e) and in Exp1 of Experiment II, where
f 0 had been neutralised (Figure 54g). However, a contrary e�ect for the role of
apexes was found when f 0 and duration were the only acoustic cues of promi-
nence in Exp2. In this case, apexes actually made words more likely to be con-
sidered prominent in the audiovisual modality (Figure 58c). This might be due
to the more preponderant role of f 0 as an acoustic cue of prominence, especially
since a temporal coordination between apexes and f 0 peaks has been consist-
ently observed in di�erent studies (e.g. Esteve-Gibert & Prieto, 2013; Leonard &
Cummins, 2010; Loehr, 2004). Curiously, in the control condition Exp0, where
337

Experiment II
participants relied on all acoustic cues of prominence including f 0, this same
e�ect of apexes was not observed; rather, words tended to be perceived more
prominent in the audiovisual modality when they co-occurred with strokes, as
just mentioned (Figure 51d).
Hypothesis 4: musical training
In this Experiment II also a di�erent performance of participants according to
their level of musical training was observed, which was not tested in Experiment
I due to the small sample size of participants. Since behavioural and neural di�er-
ences have been reported in numerous studies for the e�ect of musical training in
the auditory domain (e.g Hutka et al., 2015; Parbery-Clark et al., 2009; Thompson
et al., 2004), information about participants’ level of formal musical training was
collected through a questionnaire after the experimental session.
A di�erence due to participants’ level of musical training was only found
in the �rst condition Exp1, in which the prominence-lending cues of f 0 had
been manipulated by keeping the intonation curve within a 2-semitone range.
Interestingly, no such e�ect was observed in the control condition or in Exp3,
where f 0, together with intensity, had also been neutralised. In Exp1, despite the
neutralisation of f 0, those participants having more than 5 years of formal mu-
sical training showed more probability to mark words as prominent than those
without any musical training and with fewer than �ve years of formal musical
training.
Musical training also had an in�uence on words considered prominent when
modalities were compared, so that a similar group of highly-trained musicians
showedmuch less probability tomarkwords as prominent in the audiovisual mo-
dality. It seems that participants with musical training strongly relied on their
developed pitch-discriminatory skills—despite the narrow f 0 range—in order to
338

Experiment II
mark prominent words in the audio-only modality; however, a similar group of
participants in the audiovisual modality did not. This is in line with the beha-
vioural di�erences previously observed in skilled musicians when performing
pitch discrimination tasks (e.g. Hutka et al., 2015). In these results, musicianship
seems to play a role in certain adverse acoustic conditions, although the fact that
this was restricted to the neutralised e�ect of f 0 only in the �rst experimental
condition needs further research.
Behavioural di�erences previously observed in musicians have been related
to distinct neural mechanisms from those of non-musicians both in music (e.g.
Amemiya et al., 2014; Liang et al., 2016) and speech (e.g. Hutka et al., 2015). Nev-
ertheless, musicianship has also been observed to have an e�ect on the mul-
timodal perception of speech. Generally, the McGurk e�ect—by which an audi-
tory /ba/ combined with a visual /ga/ is generally perceived as /da/ (McGurk &
MacDonald, 1976)—has been observed to modulate the cortical processing of au-
ditory signals at an early stage (Colin et al., 2002; van Wassenhove et al., 2005);
similarly, an early modulation of auditory speech information has been reported
for manual gestures (Biau & Soto-Faraco, 2013; Biau et al., 2015, 2016). How-
ever, people having extensive musical training have been reported to di�erently
integrate auditory and visual input when compared to non-musicians (Lee &
Noppeney, 2011; Paraskevopoulos et al., 2012); and such a di�erence has also
been observed for the McGurk e�ect in the multimodal perception of speech
(Proverbio et al., 2016). In the study conducted by Proverbio and her colleagues,
musicians were less sensitive to the McGurk e�ect than non-musicians, i.e. their
musical training helped them to correctly identify phonemes despite incongruent
visual information. In this sense, the �ndings obtained in this research are in line
with the observation that musical training improves speech-in-noise perception
(e.g. Strait & Kraus, 2011), and that the cognitive processing of pitch shows a shift
339

Experiment II
in the neural networks when perceiving speech in adverse acoustic conditions
(e.g. Zendel et al., 2015).
Hypothesis 5: participant gender
Finally, it was surprising to also observe a di�erence due to gender in some
experimental conditions. More precisely, in Exp2 and Exp3—with f 0 and dura-
tion, and only duration as respective acoustic cues—women were observed to
be more likely to consider words as prominent, although this di�erence did not
show any interactionwithmodality. At �rst sight, this di�erence was interpreted
in Exp2 as possibly stemming from the unbalanced distribution of participants’
gender across modalities, with 27 women versus 3 men in the audio-only mo-
dality (Figure 60). Since the results revealed a general trend for participants to
mark fewer words in the audiovisual modality, the observed gender di�erence
seemed to be due to an actual di�erence between modalities. Nevertheless, the
same gender di�erence was found in the third experimental condition Exp3, even
though no such an unbalanced gender distribution across modalities existed (Fig-
ure 65). In this case, unlike Exp2, no similar di�erence between modalities was
observed.
Previous research has reported behavioural and neuroanatomical di�erences
between men and women in the utilisation of visual cues from lip and facial
movements when recognising di�erent speech sounds (e.g. Dancer et al., 1994;
Öhrström & Traunmüller, 2004; Ruytjens et al., 2006, 2007; Watson et al., 1996;
see Alm & Behne, 2015, for a summary).
Although the existence of gender di�erences in language perception is far
from settled, women have been observed to perform better at speech-reading
than males (e.g. Dancer et al., 1994; Strelnikov et al., 2009), which has been re-
lated to the fact that women could be more active gazers than men (e.g. Johnson
340

Experiment II
et al., 1988). Additionally, women have been reported to be more sensitive to
visual cues than men in audiovisual speech perception (Aloufy et al., 1996; Ir-
win et al., 2006; Öhrström & Traunmüller, 2004). For example, Öhrström and
Traunmüller (2004) showed that women were signi�cantly more in�uenced by
the visual modality than men in perceiving incongruent Swedish vowels em-
bedded in a syllable. Similar results were reported by Irwin et al. (2006), who
studied the in�uence of visual speech for the syllable /ba/. Irwin et al. sugges-
ted that such a gender di�erence might be due to a di�erent pattern in language
processing, with a stronger activation in bilateral brain areas causing a more e�-
cient audiovisual language processing in women (e.g. Baynes et al., 1994; Coney,
2002).
Furthermore, neuroanatomical di�erences point to a stronger activation of
brain areas associated with speech perception in women (Ruytjens et al., 2006,
2007). In addition, it has been claimed that gender di�erences in audiovisual
speech perceptionmay emerge in the context of challenging stimuli (Jaeger et al.,
1998), which can be related to the results observed in the third experimental con-
dition, Exp3, in Experiment II, where durationwas the only acoustic cue available
to participants.
Limitations
One of the limitations of this Experiment II lies in the small number of sen-
tences rated by participants. The very experimental design, which was imposed
by the large number of participants taking part in the experiment and the com-
pletion of the experimental task via the Internet, made necessary to reduce the
time of the experimental task and consequently reduce the number of stimuli.
Additionally, unlike Experiment I, where participants rated a much larger num-
ber of stimuli under supervision, the experimental task in Experiment II was
341

Experiment II
not conducted in a sound-proof cabin in the laboratory. The uncertainty asso-
ciated to the conditions in which participants conducted the experimental task
is a downside to the use of the Internet in the methodology employed in this
Experiment II.
342
General discussion and conclusions
Previous insights gained into the multimodal perception of acoustic promi-
nence have been reinforced by the experimental research conducted in this study.
The two experiments presented here have showed that it is possible to add eco-
logical validity to prior studies by using spontaneous speech samples extracted
from television. It is also the �rst time that a study like this one has been con-
ducted for Castilian Spanish.
The results yielded by the two experiments conducted in the course of this
research have been able to cast light on the questions that gave rise to it:
1. How do the di�erent acoustic correlates relate to one another and to ges-
tures in the perception of prominence?
2. How do gestures contribute to the perception of prominence?
These two questions arose from the shortcomings found in previous meth-
odologies and were intended to analyse multimodal prominence perception in a
very di�erent context from that of studies using controlled speech with either
animated agents or elicited gestures in the laboratory.
Probably, one of the most interesting conclusions that can be drawn from
this research is the importance of the temporal aspect in the perception of prom-
343

General discussion and conclusions
inence, i.e. the e�ect that both the acoustic correlate of duration and the stroke
phase of gestures may play in multimodal prominence perception when com-
pared to other perceptually relevant information.
In this research, the marks of prominence given to words by participants in
the di�erent experimental conditions showed that identi�cation of phrasal stress
was possible even if duration was available as the only acoustic cue. In addition,
whichever the acoustic cues available in each condition, they were consistently
used by participants to provide marks of prominence, whether it was only du-
ration, f 0 and duration or intensity and duration. However, di�erently from in-
tensity, spectral balance did not play any role when combined with duration.
Rather, spectral balance was more strongly relied on when all acoustic cues of
prominence were present, even if it did not prove signi�cant.
The results obtained in this research support previous �ndings for the role
of duration as a main cue to phrasal stress. Initially, duration was considered
in previous research second to f 0 in the perception of lexical stress (Bolinger,
1958; Fry, 1955, 1958). When the acoustic correlates of lexical stress and phrasal
stress were later analysed separately, new results advanced that duration was a
consistent role of lexical stress, while the perceptual e�ects of f 0 were considered
to cue phrasal rather than lexical stress (e.g. Sluijter & vanHeuven, 1996a; Sluijter
et al., 1997). However, several authors also reported the importance of duration
in cueing phrasal stress in German (Kohler, 2005), in English (Mo, 2008a), and in
Spanish (Vogel et al., 2016).
In the case of Spanish, research has been in�uenced by a strong tradition of
studies on lexical stress. Ortega-Llebaria pointed out the necessity to study the
acoustic correlates of lexical stress in the context they occur (Ortega-Llebaria,
2006). Thus, she made evident that duration tended to increase in the presence
of pitch accents and nuclear pitch accents for oxytone words (Ortega-Llebaria,
344

General discussion and conclusions
2006). The lengthening e�ect that the realisation of a pitch accent—thus, po-
tentially signalling phrasal prominence—has on duration was found controver-
sial, with cross-linguistic di�erences that have been accounted for on di�erent
grounds (Beckman & Edwards, 1994; Ortega-Llebaria & Prieto, 2007; Sluijter &
van Heuven, 1996a,b) (§ 2.1.8.1). The perceptual results obtained here point to a
consistent use of durational cues to detect phrasal prominence in the control con-
dition, actually accounting for slightly stronger perceptual weight than f 0. Thus,
it was observed that the latter two cues were consistently used by participants,
while overall intensity and spectral balance were not perceptually relevant to
detect prominence under normal acoustic conditions. This partially con�rms
the results obtained by Vogel et al. (2016), who observed that duration and f 0
were consistent perceptual cues of unstressed vowels accompanied by a pitch
accent, although they found a stronger perceptual e�ect than that found in this
research for intensity rather of f 0 in the case of stressed vowels accompanied by
a pitch accent (§ 4). This di�erence can be put down to the more �ne-grained res-
ults they obtained for both stressed and unstressed vowels in Spanish sentences,
while the present results did not target any speci�c environment but the general
perceptual e�ect of each cue to detect prominence.
The approach used here is more in line with the one used by Mo (2008a) in
her study on prominence perception, in which it was concluded that duration
determined participants’ marks of prominence, although Mo also found a strong
e�ect of spectral balance next to that of duration. Even if the results presented
here did not show any role for spectral balance or intensity to cue prominence
under normal acoustic conditions, intensity was very likely a relevant cue when
the perceptual e�ects of f 0 had been neutralised (Figure 53 and Figure 55). In this
sense, it was found that the perceptual e�ect of intensity in combination with
duration seems less strong than the joint e�ect of f 0 and duration. This might be
345

General discussion and conclusions
due to the mentioned lengthening e�ect of pitch accents on stressed syllables. In
any case, it is worth noting that in the degraded-speech paradigm used here, it
was observed that whichever the acoustic cues available to participants in each
condition, they were used to provide marks of prominence, whether it was only
duration, f 0 and duration or intensity and duration.
On the other hand, the results obtained in this research showed that the per-
ceptual e�ect of the acoustic correlates of prominence was a�ected by the pres-
ence of visual information. This was the case of both f 0 and duration in certain
contexts, showing that the perceptual threshold for these two acoustic correlates
may vary in the presence of the visual cues of prominence. For example, in Ex-
periment I the stressed syllable of words needed to be higher in pitch and longer
in duration in the audio-only than in the audiovisual modality to be considered
prominent. The fact that this di�erence was not observed in the same way in
Experiment II might be due to the small sample of target sentences used in this
second experiment. Nevertheless, these di�erences observed in the results of
both experiments require further research.
As for the e�ect of the visual information on the marks of prominence given
by participants, markingwas di�erent betweenmodalitieswhen the experimental
conditions were compared to the control group. On the one hand, the results of
both comparisons Experiment I and Experiment II showed di�erences in modal-
ity as a main e�ect. On the other hand, as observed in the comparison between
both experiments, the visual cues of prominence generally tended to increase the
chances of words to be perceived as prominent; while in adverse acoustic con-
ditions, when some acoustic cues of prominence were missing, this trend was
reversed, and the visual cues of prominence generally tended to make words less
likely to be considered prominent. Possibly, the uncertainty caused by the ab-
sence of clear the acoustic cues resulted in more randommarking of prominence;
346

General discussion and conclusions
thus, the visual information might help participants concentrate their promi-
nence marks around the more clearly perceived visual cues of prominence. In
other words, under normal acoustic conditions, the audiovisual modality makes
the listener consider more words as prominent than the audio-only modality.
However, in the experimental conditions, with fewer cues to detect prominence,
the perception of prominence becomes more challenging in the audio-only mo-
dality, and the e�ect of the visual cues of prominence does not induce to consider
more words as prominent. For example, in Experiment I, 3.6% more words were
marked in the audiovisual modality in the control condition (Table 16), and this
di�erence reached 5.7% in Experiment II (Table 23), while smaller, even negative
di�erences were observed between modalities in the experimental conditions in
both experiments.
There has been a large number of studies on the interaction between gesture
and speech that have corroborated the strong connection between them. For ex-
ample, not only are gestures temporally aligned to speech, but they also enhance
the perceptual e�ects of the acoustic correlates of prominence (e.g. De Ruiter,
1998; Krahmer & Swerts, 2007, experiment 1; Krivokapić et al., 2015, 2016; Le-
onard&Cummins, 2010; Rochet-Capellan et al., 2008; Rusiewicz, 2010). Similarly,
a more reduced number of studies (Krahmer & Swerts, 2007, experiments 2 and
3) have found that a visual cues have an in�uence on how speech stimuli are
perceived acoustically. Such �ndings are supported by the results obtained in
this research, showing that, under normal acoustic conditions, the gesture phase
of strokes increased the chances of marking prominence in the audiovisual mo-
dality. Surprisingly, apexes did not seem to lead prominence perception in this
case. By the same token, by using in a degraded-speech paradigm, it was made
evident that the apex phase of gestures seems to account for less perceived prom-
inence than strokes when f 0 was neutralised—and intensity and duration were
347

General discussion and conclusions
still present as acoustic cues. This might be due partly to the temporal coordina-
tion of both apexes and f 0, which could play an important role in the perception
of prominence. Similarly, when intensity was neutralised, and f 0 and duration
were the only acoustic cues, apexes strongly contributed to lead the perception of
prominence in the audiovisual modality. So this shows how the di�erent phases
of gestures contribute di�erently to enhance the perceptual e�ects of the acoustic
correlates of prominence.
Initially, the perceptual e�ects of the visual component of speech focused on
the so-called McGurk e�ect (McGurk &MacDonald, 1976), by which articulatory
lip movements a�ect speech perception. Also the rest of the face (e.g Pelachaud
et al., 1996) was later reported to a�ect speech perception, and as a result, it was
observed that both facial expressions and body movements play an important
role in conveying functions traditionally associated to prosody, such as phrasing
and emphasis. This interaction between the visual correlates of prominence and
speech prosody was dubbed as ‘audiovisual speech’ (Swerts & Krahmer, 2005),
and research on this visual component of communication has systematically ex-
plored the nature of this interaction (e.g. Al Moubayed et al., 2010; Granström
et al., 1999; Kim et al., 2014; Krahmer & Swerts, 2007; Prieto et al., 2011; Scar-
borough et al., 2009). More precisely, visual cues were observed to result in a
stronger production and perception of verbal prominence (Krahmer & Swerts,
2007), and facial gesturing was also found to systematically in�uence the per-
ception of verbal prominence (Dohen & Lœvenbruck, 2009; House et al., 2001;
Swerts & Krahmer, 2008).
The temporal coordination of gesture and speech has previously been ana-
lysed in detail, and the phonological synchrony rule put forward by McNeill
(McNeill, 1992) has been supported by di�erent studies (e.g. Esteve-Gibert & Pri-
eto, 2013; Krivokapić et al., 2015, 2016; Leonard & Cummins, 2010; Loehr, 2004).
348
General discussion and conclusions
A temporal alignment has been con�rmed between pitch accents and the apex
phase of gestures—the peak of e�ort that occurs at an instant in time, i.e. the
“kinetic goal of the stroke” (e.g. Jannedy & Mendoza-Denton, 2005; Loehr, 2004).
In this study, the criteria for the collection of a corpus with speech material
from a TV talent show re�ected very well the natural interweaving of gestures
performed with hands, head, and eyebrows typically found in everyday spoken
language. Thus, the corpus abounded in gestures, so that hardly any words in
the corpus occurred without the presence of one. The annotation omitted the
classi�cation of gesture types, but included annotation of gesture phases. This
annotation presented some di�culties, especially when gestures included several
articulators. Thus, when the gesture was performed with hands together with
any other articulator, the annotation followed the most visible movement of the
hands, since the second articulator—or possibly the remaining two articulators,
i.e. head and eyebrows—hardly presented any preparation or stroke phase, but
the gesture was sudden and its apex coincided with that of the apex phase of the
hand gesture.
In this respect, the prominence marks given by participants in the two ex-
periments conducted in this research seem to have been consistently driven by
the stroke phase of gestures rather than the apex when the visual cues of promi-
nence were available to them, despite di�erences between Experiment I and Ex-
periment II in the number of marks given to strokes (Table 37b and Table 46a). As
previously mentioned, apexes had a stronger e�ect than strokes when intensity
had been neutralised and f 0 and duration were the only acoustic cues of prom-
inence. In addition, neither of these two gesture phases seemed to play any de-
terminant role when bothmodalities were compared in themost adverse acoustic
conditions—only duration as an acoustic cue—, which suggests that such chal-
lenging conditions made very di�cult for participants to clearly rely on either
349

General discussion and conclusions
gesture phase to consider words as prominent.
Thus, it is possible to conclude that the temporal aspect common to both the
acoustic correlate of duration and the stroke phase of gestures may play a fun-
damental role in multimodal prominence perception when compared to other
perceptually relevant information. In this sense, previous studies have under-
lined the importance of prosodic lengthening in signalling focused constituents
(Baumann et al., 2007, for German; Eady et al., 1986; Watson et al., 2008, for
English; Jun & Lee, 1998, for Korean), an e�ect that has also been found to be
correlated to higher f 0. However, in the case of Spanish, lengthening has been
observed in syllables carrying nuclear stress that also keep the typical low f 0
of declarative sentences (Escandell-Vidal, 2011). Such observations were made
in cases of verum focus, which has been associated to the values of impatience
and insistence introduced by the repetition of given information (Escandell-Vidal
et al., 2014). The conclusion pointed out by Escandell and her colleagues about
the independence of duration from f 0 when signalling prominence is supported
by the results obtained in this research. Similarly, the stroke phase of gestures
has traditionally be considered as the nucleus of the gesture and is temporally
aligned with stressed syllables (Kendon, 1972; McNeill, 1992). Despite the fact
that apexes have been seen to align more precisely with pitch accents (Loehr,
2004; Jannedy & Mendoza-Denton, 2005), the present research suggests that the
longer duration of strokes a�ordmore perceptual salience in themultimodal pro-
cessing of speech.
These interesting �ndings were also complemented by the observation of a
di�erent distribution of gestures according to the articulator involved in their
production when compared to the distribution of gestures reported in a previous
study using spontaneous speech (Ambrazaitis & House, 2017). Previous meth-
odological approaches had limited themselves to the study of isolated gestures,
350

General discussion and conclusions
mostly beat gestures performed with either head or eyebrows, and to a lesser
extent hands (e.g. Al Moubayed et al., 2010; House et al., 2001; Krahmer et al.,
2002a,b; Prieto et al., 2011; Swerts & Krahmer, 2010). In their study, Ambrazaitis
and House (2017) analysed the use of eyebrow and head movements to convey
information structure using recordings of TV newsreaders and found that eye-
brow movements were rarely produced in isolation but occurred much more fre-
quently together with a headmovement. In Experiment I, the use of spontaneous
speech material, similar to the study of Ambrazaitis and House, allowed to use
stimuli containing more than one single gesture, thus re�ecting more faithfully
the natural interweaving of gestures performed with hands, head, and eyebrows
typically found in everyday spoken language. However, the results obtained here
showed that gestures were mostly produced by combining especially hands and
head (51.1% of the occurrences); and, to a much lesser extent, hands, eyebrows,
and head (11.1%). In the case of gestures that were produced with a single body
part, it was mostly the hands that performed the gesture (23.5%). In this sense,
di�erently from the results o�ered by Ambrazaitis and House, very few occur-
rences of gestures were produced with eyebrows and head (1.1%) (Figure 33).
This di�erence might be due to the limited expressivity of the source of sponta-
neous speech chosen by Ambrazaitis and House—TV newsreaders—, especially
when compared to more expressive samples from the speech material used in
this study, i.e. spontaneous speech from television talent shows. Therefore, fur-
ther research is needed to analyse the role of each articulator separately and in
combination in themultimodal perception of prominence, possibly with a similar
methodology using spontaneous speech stimuli obtained from a similar source.
In addition, the results obtained here clearly show that themusical training of
participants should be taken into account in any study on prominence perception
depending on the perceptual e�ects of f 0. Although the exact advantages of a
351

General discussion and conclusions
musically-trained ear in the perception of multimodal prominence needs further
investigation, it is evident that the prominence-lending properties of f 0 can be
exploited by individuals with solid musical training, especially when they rely
on minimal variations of pitch to detect prominence.
Previously, behavioural di�erences have been observed in musicians when
compared to non-musicians. This has been related to distinct neural mechan-
isms resulting from consistent musical training (e.g. Amemiya et al., 2014; Hutka
et al., 2015; Liang et al., 2016). Furthermore, consistent musical training has also
been reported to have an e�ect on the multimodal perception of speech. The
McGurk e�ect (McGurk & MacDonald, 1976) has been observed to modulate the
cortical processing of auditory signals at an early stage (Colin et al., 2002; van
Wassenhove et al., 2005); and by the same token, an early modulation of auditory
speech information has been reported for manual gestures (Biau & Soto-Faraco,
2013; Biau et al., 2015, 2016). Nevertheless, people having consistent musical
training integrate auditory and visual input in a di�erent way when compared
to non-musicians (Lee & Noppeney, 2011; Paraskevopoulos et al., 2012), and such
a di�erence has also been observed for the McGurk e�ect in the multimodal per-
ception of speech (Proverbio et al., 2016). Thus, the �ndings obtained in Exper-
iment II are in line with the observation that musical training improves speech-
in-noise perception (e.g. Strait & Kraus, 2011), and that the cognitive processing
of pitch shows a shift in the neural networks when perceiving speech in adverse
acoustic conditions (e.g. Zendel et al., 2015). Nevertheless, a more clear picture
of the role of consistent musical training in the multimodal perception of prom-
inence will be yielded by future research.
On the other hand, the di�erent way of conducting the marking task ob-
served inwomen andmen in certain conditions point to a stronger reliance on the
visual cues of prominence by women, especially in adverse acoustic conditions,
352

General discussion and conclusions
although no di�erences between modalities were found. Previous research has
reported behavioural and neuroanatomical di�erences between men and women
for the audiovisual perception of speech (Dancer et al., 1994; Öhrström & Traun-
müller, 2004; Ruytjens et al., 2006, 2007; Watson et al., 1996). More precisely, wo-
men have been observed to perform better at speech-reading than males, which
has been related to the fact that women could be more active gazers than men
(e.g. Johnson et al., 1988). Additionally, women have been reported to be more
sensitive to visual cues than men in audiovisual speech perception (Aloufy et al.,
1996; Irwin et al., 2006; Öhrström & Traunmüller, 2004). As for neuroanatomical
di�erences, a stronger activation of brain areas associated with speech percep-
tion has been reported for women (Ruytjens et al., 2006, 2007); and it has been
claimed that gender di�erences in audiovisual speech perception may emerge in
the context of challenging stimuli (Jaeger et al., 1998), which can be related to the
results observed in the third experimental condition Exp3, where duration was
the only acoustic cue available to participants. However, a more detailed account
of such a behavioural di�erence deserves further analysis.
As for the methodological details of this research, it is worth mentioning that
the estimation of generalised linear mixed models (GLMMs) and their compar-
ison bymeans of the Akaike Information CriterionAIC (Akaike, 1973) has proved
crucial to determine which variables determined the marks of prominence given
by participants. Despite the fact that such a statistical approach based on infor-
mation criteria is still relatively uncommon in the �eld of linguistics (e.g. Adamou
et al., 2018), it has being gaining popularity over the last decade in other �elds
such as biology, ecology, or evolution, where it is now often applied (see e.g.
Arnold, T. W., 2010; Grueber et al., 2011, for details).
The implications of these insights are expected to fruitfully contribute to the
debate on the role played by the di�erent acoustic and visual cues in the percep-
353

General discussion and conclusions
tion of phrasal prominence. Also important is the fact that the results derived
from this experimental research have been obtained for Castilian Spanish, which
is certainly to be of great interest for the �eld of Hispanic linguistics. Thus, these
results not only o�er a better understanding of the multimodal perception of
prominence, but also suggest that musical training and gender can play an im-
portant role in this process. Even though further research is needed to provide a
more solid account of some of the elements involved in the auditory and visual
perception of speech, it has been possible to observe that, in the course of this re-
search, a di�erent methodology could help to answer some questions that needed
to be addressed.
More generally, this research is added to the e�orts of current studies invest-
igating the visual aspect of speech and communication, and they o�ering a more
complete and complex picture than that we have until recently had. The visual
component of speech serves important communicative functions that cannot be
neglected, with important implications in pragmatic issues. Body movements
performed as eyebrow raises, head nods, and manual gestures are a crucial part
of everyday interactions, and are tightly linked not only to prosodic functions,
such as prominence, phrasing, intonation, salience, turn-taking, and grounding
in face-to-face interactions (e.g. Krahmer & Swerts, 2007; Kushch & Prieto Vives,
2016; Nakano et al., 2003; Prieto et al., 2011; Srinivasan & Massaro, 2003), but
often they are also a necessary expressive resource in the conveyance of ideas,
abstract and concrete alike (e.g. Cienki, 2005; Novack & Goldin-Meadow, 2017).
These visual cues are also fundamental in signalling a�ective speech, including
emotions considered as universal—happiness, surprise, fear, sadness, anger, dis-
gust, and interest—as well as emotions emerging in social contexts that may in-
clude uncertainty and frustration, so commonly expressed in human interactions
(e.g. Barkhuysen et al., 2005; Ekman, 1999; Swerts & Krahmer, 2005).
354

General discussion and conclusions
With the insights gained here, this research intends to humbly contribute to
a more comprehensive knowledge of the broader phenomenon of communica-
tion, in which the role of the visual component of speech has been put in relation
with both the ontogenesis and the phylogenesis of language. The integration of
gesture and speech is more and more often taken into account in studies on lan-
guage development (e.g. Igualada et al., 2015; Iverson & Goldin-Meadow, 2005).
Some of the communicative milestones achieved by infants are mediated by the
use of hand movements and the joint use of deictic gestures and speech in social
interactions. Infants’ ability to selectively use this multimodal communicative
strategy is crucial in drawing the adult’s attention towards referential cues, an
aspect that has proved decisive in the acquisition and development of the semi-
otic component of language (e.g. Carpenter et al., 1998; Rodríguez et al., 2015).
In the same way as Labov’s (1968) concept of speech community implies the
“uniformity of abstract patterns of variation”, one might wonder whether similar
patterns of variation also emerge in gesturing, and thus, whether it is possible
to speak of ‘gesture communities’. Cross-cultural variation in gestures accompa-
nying speech, as well as emblems, is well-attested (e.g. Kita, 2009)—which seems
to con�rm the popular belief that Spaniards or Italians do gesticulate more than
northern Europeans. Thus, the question arises whether speech communities do
also show similar patterns of variation in their gestural behaviour. The repertoire
of body movements involved in gesticulation seems to have a highly idiosyn-
cratic character that may also be formed in narrow contact with the repertoire
of gestures displayed by those individuals taking part in one’s daily communic-
ative interactions (e.g. Mol et al., 2012; Noland, 2009; Ricci Bitti, 2013; Schwarts,
1995).
This social aspect of human communication—in which gestures are not to
be considered as less important than speech—has led to reconsider the role of
355

General discussion and conclusions
gestures in its relation to language (e.g. McNeill, 1992; Kita, 2000). In this sense,
several events in the last decades have revived the idea of a possible gestural evol-
ution of language (e.g. Armstrong et al., 1995). On the one hand, the re�ections
made by Bickerton in the 90’s on infant speech, pidgin and creole languages,
and primate communication brought into the middle of the linguistic debate the
qualitative leap existing between primate communication and our articulated
language, a leap known as the continuity paradox (Bickerton, 1990). The tradi-
tional view that primate vocal calls were the antecedent of articulated speech
was contested when the gestural communication of primates started to be better
understood and primates were observed to intentionally use arm and hand ges-
tures to in�uence the behaviour of other members of their groups (e.g. Tomasello
& Call, 1997). On the other hand, the discovery of mirror neurons also showed
that themotor neural networks controlling themovements of both arm and vocal
tract partially overlap in Broca’s area (Gentilucci et al., 2008), a structure that is
related, on evolutionary principles, to the equivalent area in the brain of primates
and responsible for motor functions controlling arm and mouth (Gallese et al.,
1996; Mukamel et al., 2010).
This sensorimotor link between gesture and speech and its evolutionary im-
plications are complex. Such a tight relationship is re�ected in the shared brain
mechanisms in language and motor functions such as the activation of certain
brain areas during language tasks (e.g. premotor area), which are typically as-
sociated with motor functions; the activation of brain areas during motor tasks
that are typically associated with language behaviour (e.g. Broca’s area); and
the patterns of clinical conditions a�ecting to both language and motor function
(Iverson & Thelen, 1999).
An important number of studies published since the second half of the 20th
have not only made that gestures are considered more seriously in their close re-
356

General discussion and conclusions
lationship with speech in communication, but they have also made that gestures
become to be seen an essential piece to solve the riddle of the emergence of hu-
man language. In this sense, this experimental research represents a necessary
step towards a more complete understanding of the multimodal perception of
speech and, by focusing on the perception the so-called audiovisual prosody, it
has also contributed to o�er amore complete picture of the role that gestures play
in communication. This dissertation has o�ered some important insights into the
research topic as well as it has also opened up new perspectives to be taken up
in future research. The attempt to overcome some limitations inherent to pre-
vious methodologies by proposing a new methodological approach has proved
satisfactory, but it has also made evident that there is room for �ne-tuning and
for more original ideas that permit to study address problems from new angles.
357

Appendix A.
Experiment I
358

Experiment I
Sentences of the corpus: trial sentences correspond to sentences 1 to 10. Sen-
tences 11 to 21 are the non-manipulated stimuli, and the remaining sentences, 21
to 50, served as stimuli target sentences after neutralising their acoustic cues of
prominence (f 0 and intensity). As they were presented to participants, no punc-
tuation marks were used.
Trial sentences:
(1) A veces pequeñas enfermedades ocasionales como caídas un no sé qué
unas anginas.
(2) Cada uno valoramos la situación de distinta manera.
(3) Eso eso es una cosa que es sola y no lo digo por nadie ni lo quiero decir
en general lo dejo lo dejo caer.
(4) Y y yo lo entiendo porque a mí me pasa y por eso te he dicho por eso te
he dicho que no o sea que hemos hecho exactamente lo mismo.
(5) Y es fantástico que además lo asumas y que encima vayas y le pidas dis-
culpas fantástico me parece maravilloso.
(6) Y hay días que estamos tristes y estamos tos tristes.
(7) Ha habido un mogollón eh de cosas a la vez que te han dicho.
(8) Igual él tiene una vidamás independiente y esasmanías igual que le puede
pasar a ella.
(9) Pero claro hay veces que dudo y esa inseguridad está porque quizás a
veces lo he sentido así.
(10) A veces soy muy echá palante pero es lo que tú dices yo soy así por algo.
Non-manipulated stimuli:
359

Experiment I
(11) Cómo se puede sentir alguien que tenga di�cultad de presentarse de una
manera extrovertida pues agradable etcétera que sea alguien más tímido.
(12) Para ver cómo somos para ver si somos con�ictivos si podemos valer si
no.
(13) Nosotros no nos hemos portao mal hemos interrumpido no hemos no nos
hemos comportao bien en el aspecto ese de que igual entrábamos cuando
no teníamos que entrar.
(14) No te preocupes no sé qué dándola ánimos y ahora es justamente la al al
revés no.
(15) Porque confundimos la mano izquierda con la hipocresía y el ser hipócrita
es una cosa y el ser diplomático es otra muy diferente.
(16) Tú lo has dicho explícito yo no lo he dicho explícito.
(17) Que haya algo una idea de alguien que esté plasmada en una estrofa o
una línea o algo así para que todos tengan aquí la cuestión.
(18) Pero claro hay veces que dudo y esa inseguridad está porque quizás a
veces lo he sentido así.
(19) También podían haber esto hecho esto cerrado y que los lunes saliera una
gala no.
(20) Hay días que que estás contento y está todo el mundo contento.
Manipulated stimuli1:
(21) Yo no tengo que pagar lo que hacen otros es lo único que digo.
(22) Y me veía y la y la observaba y me cortaba o sea no me salía.
(23) A que me nominan por no concentrarme porque es que hay que medir lo
que dices.
1 This material is publicly available at http://dx.doi.org/10.17632/jkvftnpr5j.1
360

Experiment I
(24) Sencillamenteme parece una persona absolutamente que nunca tiene una
mala palabra para nadie.
(25) Aparte del sobresfuerzo ha tenido que luchar contra ella o sea contra ella
misma.
(26) Yo me lo he currao igual que Rosa sabes y yo lo he pasao mal igual que
Rosa.
(27) En ese tipo de relaciones es la donde más fácil te puedes encontrar la
mentira.
(28) Cantar lógicamente es lo más importante es el punto número uno si no
no estaríamos aquí no.
(29) Te lo te lo he dicho o no te lo he dicho al igual que le he dicho joder esto
te ha salido muy bien te sale bonito.
(30) Y cuando leía los esto decía esto me lo ha escrito to mi padre.
(31) Pero una vez nos lo han dicho es que no ha vuelto a suceder.
(32) Fíjate tú te sentiste inhibido por una personalidad pues extrovertida.
(33) Yo me puedo llevar mejor no sé con cierta gente que con otra gente en un
momento determinado.
(34) Todos tenemos más a�nidad con unos que con otros.
(35) O sea a ver pongamos las cosas en su sitio vale perfecto que tú no tienes
que reaccionar así.
(36) Yo creo que ellas buscan cómo eres si les puedes interesar una persona
que están tratando contigo a lo mejor tres años grabando ciertos discos.
(37) Siempre he pecado mucho de lo que de lo que le ha pasado a a Javián y
he perdido un montón de gente por eso.
361
Experiment I
(38) Estés delante de ocho millones estés delante de veinte siempre habrá uno
que no le vas a gustar y eso te tienes que acostumbrar.
(39) Y lo primero que has ido es a saco a preguntarle a Verónica si le ha sentao
mal.
(40) Tienes que tener un comportamiento básico tienes que saberte compor-
tarte lógicamente.
(41) Pues eso es lo que estoy intentando hacer por eso estoy concentrao y
mirando el papel a ver si puedo poner algo.
(42) El otro día estábamos leyendo los emails los de allí y yo decía a mí quién
me va a escribir.
(43) Porque yo la conozco a Verónica y Verónica tiene mucho carácter y sabe
perfectamente cuando le gusta algo y cuando no.
(44) Yo no soy el que está interrumpiendo al compañero son ellos díselo a ellos
como me lo dirías a mí y no me lo digas a mí.
(45) Vale él es muy impulsivo y también eso también le sale del corazón.
(46) O cualquier cosa se lo digo a este porque sé que me va a decir la verdad
si se lo digo al otro por quedar bien puede que no me la diga.
(47) Y te identi�cas con la persona con la que le preguntas para al mismo
tiempo esa persona tenga con�anza en ti y revelarte.
(48) La semana pasada y esta semana Rosa es diferente.
(49) Y más si lo has hecho con conciencia de lo que estabas haciendo.
(50) Yo mira yo de hecho había apostado en primer lugar por los dos David
por Alex o por Rosa tenía esos cuatro.
362

Experiment I
Sentence Words Seconds Speech rate
1 13 2.51 5.18
2 16 3.66 4.37
3 16 3.40 4.71
4 14 4.94 2.83
5 13 4.66 2.79
6 18 4.11 4.38
7 15 4.84 3.10
8 17 4.21 4.04
9 28 4.68 5.98
10 14 4.34 3.23
11 13 2.96 4.39
12 10 5.26 1.90
13 18 4.29 4.20
14 9 2.70 3.33
15 18 5.05 3.56
16 25 9.49 2.63
17 24 4.71 5.10
18 24 5.99 4.01
19 18 3.38 5.33
20 11 4.11 2.68
21 20 3.61 5.54
22 20 6.67 3.00
23 20 5.70 3.51
24 27 4.97 5.43
25 13 2.96 4.39
26 32 5.00 6.40
27 23 5.49 4.19
28 9 3.27 2.75
29 13 2.65 4.91
30 20 8.52 2.35
Table A1: Details of the 50 sentences from the corpus used as stimuli in Experiment I.
363

Experiment I
Speaker Words rated as prominent Total words % Prominence
1 244 900 27.11
2 91 264 34.47
3 326 1404 23.22
4 327 1392 23.49
5 157 612 25.65
6 109 408 26.72
7 176 636 27.67
8 84 300 28.00
9 60 216 27.78
10 51 240 21.25
(a)
Listener Words rated as prominent Total words % Prominence
1 156 531 29.38
2 193 531 36.35
3 148 531 27.87
4 90 531 16.95
5 148 531 27.87
6 160 531 30.13
7 108 531 20.34
8 185 531 34.84
9 75 531 14.12
10 135 531 25.42
11 82 531 15.44
12 145 531 27.31
(b)
Table A2: Details of prominence marks per speaker (a) and per listener (participant) (b).
364

Experiment I
Word Class Prominence marks Total words %
mí Pron 36 48 75.0
mucho Adv 24 32 75.0
otros Pron 23 32 71.8
Rosa Noun 44 64 68.7
mal Adv 22 32 68.7
más Adv 40 64 62.5
lógicamente Adv 19 32 59.3
bien Adv 19 32 59.3
uno Adj 19 32 59.3
ellos Pron 18 32 56.2
Verónica Noun 25 48 52.0
(a)
Word class Prominence marks Total words %
Interjection 31 48 64.5
Adjective 234 478 48.9
Noun 383 846 45.2
Adverb 251 590 42.5
Negation 98 256 38.2
Verb 530 2234 23.7
Pronoun 364 1818 20
Conjunction 89 892 9.9
Determiner 36 402 8.9
Preposition 74 906 8.1
(b)
Table A3: Details of precise words and word categories receiving the highest number of prominence
marks.
365

Experiment I
Sentence HAND EYEBROWS HEAD HA.EY HA.HE EY.HE HA.EY.HE
1 3 0 0 0 2 0 2
2 3 0 0 0 2 0 0
3 4 0 0 0 1 0 0
4 0 1 0 0 3 0 0
5 1 0 0 0 6 0 0
6 0 0 1 0 3 0 0
7 0 0 0 0 4 0 0
8 2 0 1 0 0 0 0
9 0 0 0 0 4 0 0
10 1 1 1 1 6 0 1
11 0 1 0 0 5 0 2
12 0 0 0 0 3 0 1
13 0 0 1 0 4 0 1
14 0 1 0 0 7 0 0
15 0 0 1 0 1 0 2
16 2 0 0 0 1 0 0
17 2 0 1 0 0 0 1
18 1 0 0 0 4 0 1
19 4 0 0 0 3 0 0
20 1 0 2 0 0 0 1
21 0 0 0 0 0 0 1
22 3 0 0 0 2 0 0
23 1 0 0 0 4 1 3
24 1 0 1 0 3 0 1
25 3 0 0 0 5 0 0
26 1 0 1 0 3 0 1
27 3 0 3 0 4 1 1
28 1 0 1 0 4 0 0
29 1 0 3 0 1 0 0
30 2 0 0 0 2 0 0
Total 40 4 17 1 87 2 19
Table A4: Occurrences of gestures performed with di�erent articulators per sentence (n = 170). Ab-
breviations: hand and eyebrows (HA.EY); hand and head (HA.HE); eyebrows and head (EY.HE); hand,
eyebrows, and head (HA.EY.HE).
366

Experiment I
(a) Non-manipulated stimuli (b) Normalisation in non-manipulated stimuli
(c) Manipulated stimuli (d) Normalisation in manipulated stimuli
Figure A1: Histograms of f0 measured as maximum frequency of stressed vowel (or vowel in adjacent
syllable) for non-manipulated stimuli (a) and its normalization per speaker and sentence as z-scores
(b). Distribution corresponding to neutralised f0 is showed in (c) together with its normalization (d).
Histograms (a) and (b) are representative of conditions C0 and C2. Histograms (c) and (d) correspond
to conditions C1 and C3.
367

Experiment I
(a) Non-manipulated stimuli (b) Normalisation in non-manipulated stimuli
(c) Manipulated stimuli (d) Normalisation in manipulated stimuli
Figure A2: Histograms of intensity measured as maximum amplitude of stressed vowel for non-
manipulated stimuli (a) and its normalization per sentence as z-scores (b). Distribution correspond-
ing to neutralised intensity is showed in (c). Histograms (a) and (b) are representative of conditions
C0 and C2. Histograms (c) and (d) correspond to conditions C1 and C3..
368

Experiment I
(a) Non-manipulated stimuli (b) Normalisation in non-manipulated stimuli
Figure A3: Histograms of duration measured as mean duration of the stressed syllable (a) and its
normalization per sentence as z-scores (b). Both histograms (a) and (b) are representative of duration
in all conditions.
369

Experiment I
Figure A4: Details of the residuals of the �tted model �18. Plots have been created with the R
package DHARMa (Hartig, 2018) to assess goodness-of-�t. On the left Q-Q plot showing no devi-
ation of residuals from normality: Kolmogorov-Smirnov test (KS test) showed that deviation was
non-signi�cant (ns). On the right, nothing unusual in the plot showing residuals vs. predicted
values.
370

Experiment I
Figure A5: Informed consent form presented to participants before taking part in the experiment.
371

Appendix B.
Experiment II
372

Experiment II
Sentences from the initial corpus that were used in Experiment II, as showed
to the participants without punctuation marks.
Trial sentences:
(1) Y me veía y la y la observaba y me cortaba o sea no me salía.
(2) O sea a ver pongamos las cosas en su sitio vale perfecto que tú no tienes
que reaccionar así.
(3) En ese tipo de relaciones es la donde más fácil te puedes encontrar la
mentira.
(4) Yo me lo he currao igual que Rosa sabes y yo lo he pasao mal igual que
Rosa.
Non-manipulated sentences:
(1) Vale él es muy impulsivo y también eso también le sale del corazón.
(2) Tú lo has dicho explícito yo no lo he dicho explícito.
Manipulated sentences:
(1) Y lo primero que has ido es a saco a preguntarle a Verónica si le ha sentao
mal.
(2) Sencillamenteme parece una persona absolutamente que nunca tiene una
mala palabra para nadie.
(3) Todos tenemos más a�nidad con unos que con otros.
(4) Y más si lo has hecho con conciencia de lo que estabas haciendo.
Filler sentences:
(1) Porque confundimos la mano izquierda con la hipocresía y el ser hipócrita
es una cosa y el ser diplomático es otra muy diferente.
373

Experiment II
(2) Te lo te lo he dicho o no te lo he dicho al igual que le he dicho joder esto
te ha salido muy bien te sale bonito.
(3) Yo mira yo de hecho había apostado en primer lugar por los dos David
por Alex o por Rosa tenía esos cuatro.
374

Experiment II
Age Men Women Total
Exp0 Exp1 Exp2 Exp3 Exp0 Exp1 Exp2 Exp3
18-29 4 4 4 2 20 19 10 8 71
30-39 4 1 7 5 15 12 16 10 70
40-49 2 6 5 11 10 12 12 9 67
50-59 0 2 3 5 4 4 3 5 26
60 1 0 0 2 0 0 0 3 6
Total 11 13 19 25 49 47 41 35 240
(a)
Musical training Condition Total
Exp0 Exp1 Exp2 Exp3
None 34 33 39 36 142
Little 19 14 11 10 54
Much 7 13 10 14 44
Total 60 60 60 60 240
(b)
Table B1: Details of participants per condition in Experiment II: (a) age range and (b) musical train-
ing.
375

Experiment II
(a)
(b)
(c)
376

Experiment II
(d)
(e)
Figure B1: Sample screens from (a) to (e) showing the instructions given to participants.
Instructions:
(a) ‘This is a little perception experiment where you will watch some video-
clips and then answer some easy questions. You will notice that we have taken
extracts from a TV programme that you might know. For this reason, we hope
the quality of image and sound will not be a problem for you to answer correctly
the questions.’1
(b) ‘In some cases, you will have to decide what words have a stronger em-
1 This last instruction was intended to prepare the participants for the conducted stimuli
manipulations.
377
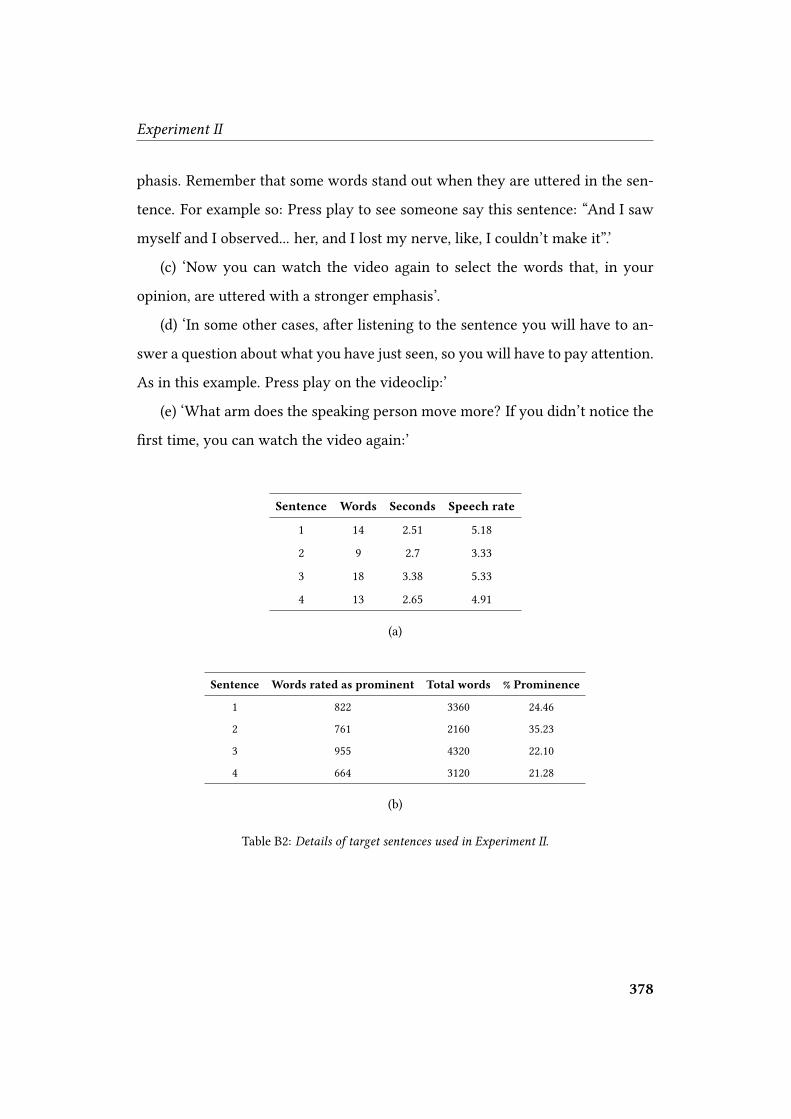
Experiment II
phasis. Remember that some words stand out when they are uttered in the sen-
tence. For example so: Press play to see someone say this sentence: “And I saw
myself and I observed... her, and I lost my nerve, like, I couldn’t make it”.’
(c) ‘Now you can watch the video again to select the words that, in your
opinion, are uttered with a stronger emphasis’.
(d) ‘In some other cases, after listening to the sentence you will have to an-
swer a question about what you have just seen, so you will have to pay attention.
As in this example. Press play on the videoclip:’
(e) ‘What arm does the speaking person move more? If you didn’t notice the
�rst time, you can watch the video again:’
Sentence Words Seconds Speech rate
1 14 2.51 5.18
2 9 2.7 3.33
3 18 3.38 5.33
4 13 2.65 4.91
(a)
Sentence Words rated as prominent Total words % Prominence
1 822 3360 24.46
2 761 2160 35.23
3 955 4320 22.10
4 664 3120 21.28
(b)
Table B2: Details of target sentences used in Experiment II.
378

Experiment II
Word Class Prominence marks Total words %
saco Noun 205 240 85.4
nunca Neg 197 240 82.0
unos Pron 184 240 76.6
otros Pron 178 240 74.1
conciencia Noun 159 240 66.2
mal Adv 130 240 54.1
más Adv 257 480 53.5
todos Pron 121 240 50.4
nadie Neg 119 240 49.5
Verónica Noun 115 240 47.9
(a)
Word class Prominence marks Total words %
Neg 316 480 65.8
Noun 760 1440 52.7
Adv 593 1440 41.1
Num 78 240 32.5
Pron 565 2640 21.4
Verb 561 3120 21.2
Prep 192 1680 11.4
Conj 117 1440 8.1
Art 20 480 4.1
(b)
Table B3: Details of precise words and word categories receiving the highest number of prominence
marks.
379

Experiment II
(a) Non-manipulated stimuli (b) Normalisation in non-manipulated stimuli
(c) Manipulated stimuli (d) Normalisation in manipulated stimuli
Figure B2: Histograms of f0 measured as maximum frequency of stressed vowel (or vowel in adjacent
syllable) for non-manipulated stimuli (a) and its normalization per speaker and sentence as z-scores
(b). Distribution corresponding to neutralised f0 is showed in (c) together with its normalization
(d). Histograms (a) and (b) are representative of conditions Exp0 and Exp2. Histograms (c) and (d)
correspond to conditions Exp1 and Exp3.
380

Experiment II
(a) Non-manipulated stimuli (b) Normalisation in non-manipulated stimuli
(c) Manipulated stimuli (d) Normalisation in manipulated stimuli
Figure B3: Histograms of intensity measured as maximum amplitude of stressed vowel for non-
manipulated stimuli (a) and its normalization per sentence as z-scores (b). Distribution correspond-
ing to neutralised intensity is showed in (c). Histograms (a) and (b) are representative of conditions
Exp0 and Exp2. Histograms (c) and (d) corresponded to conditions Exp1 and Exp3.
381
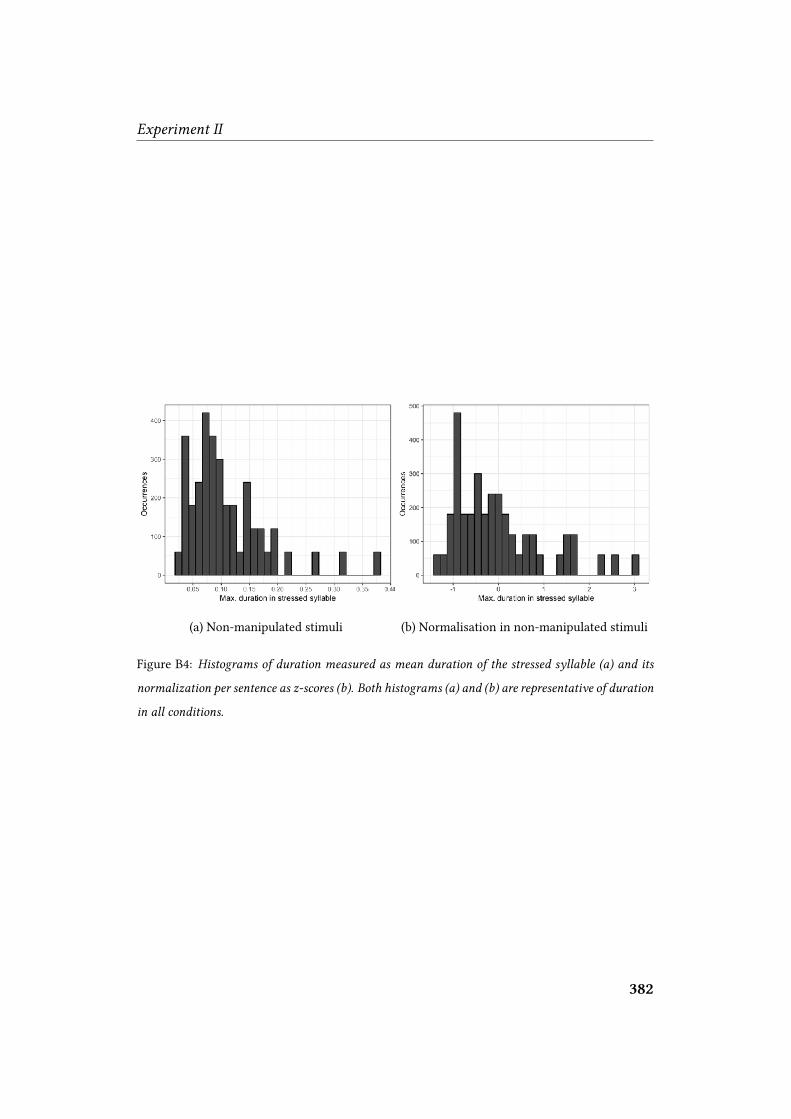
Experiment II
(a) Non-manipulated stimuli (b) Normalisation in non-manipulated stimuli
Figure B4: Histograms of duration measured as mean duration of the stressed syllable (a) and its
normalization per sentence as z-scores (b). Both histograms (a) and (b) are representative of duration
in all conditions.
382

Experiment II
(a) Model �17 (b) Model �020
(c) Model �113 (d) Model �215
(e) Model �318Figure B5: Details of the residuals of the minimal adequate models �tted in Experiment II. Plots have
been created with the R package DHARMa (Hartig, 2018) to assess goodness-of-�t.
383

Bibliography
Adamou, E., Gordon, M., & Gries, S. T. (2018). Prosodic andmorphological focus marking
in Ixcatec (Otomanguean). In E. Adamou, K. Huade, & M. Vanhove (Eds.) Information
Structure in Lesser-described Languages (Studies in Language Companion Series, 199),
(pp. 51–84). Amsterdam: John Benjamins.
Agelfors, E., Beskow, J., Dahlquist, M., Granström, B., Lundeberg, M., Spens, K., & Öh-
man, T. (1998). Synthetic faces as a lipreading support. In Proceedings of the 5th Interna-
tional Conference on Spoken Language Processing (ICSLP98), (pp. 3047–3050). Sydney,
Australia.
Aitkin, M. (1996). A general maximum likelihood analysis of overdispersion in general-
ized linear models. Statistics and computing, 6(3), 251–262.
Akaike, H. (1973). Information theory as an extension of the maximum likelihood prin-
ciple. In B. N. Petrov, & F. Csaki (Eds.) Proceedings of the 2nd International Symposium
on Information Theory, (pp. 267–281). Budapest: Akadéemiai Kiadó.
Al Moubayed, S., & Beskow, J. (2009). E�ects of visual prominence cues on speech in-
telligibility. In Proceedings of the International Conference on Auditory Visual Speech
Processing (AVSP09), (pp. 43–46). Norwich, England.
Al Moubayed, S., Beskow, J., & Granström, B. (2010). Auditory visual prominence.
Journal of Multimodal User Interfaces, 3(4), 299–309.
384

Bibliography
Al Moubayed, S., Beskow, J., Granström, B., & House, D. (2011). Audio-visual prosody:
Perception, detection, and synthesis of prominence. In A. Esposito, A. M. Esposito,
R. M. Martone, V. C. Müller, & G. Scarpetta (Eds.) Towards Autonomous, Adaptive,
and Context-Aware Multimodal Interfaces. Theoretical and Practical Issues, (pp. 55–71).
Berlin/Heidelberg/New York: Springer-Verlag.
Alm, M., & Behne, D. (2015). Do gender di�erences in audio-visual bene�t and visual
in�uence in audio-visual speech perception emerge with age? Frontiers in Psychology,
6:1014.
Aloufy, S., Lapidot, M., & Myslobodsky, M. (1996). Di�erences in susceptibility to the
“blending illusion” among native Hebrew and English speakers. Brain and Language,
53(1), 51–57.
Altenberg, B. (1987). Prosodic patterns in spoken English: studies in the correlation between
prosody and grammar for text-to-speech conversation. Lund: Lund University Press.
Ambrazaitis, G., & House, D. (2017). Multimodal prominences: Exploring the patterning
and usage of focal pitch accents, head beats and eyebrow beats in Swedish television
news readings. Speech Communication, 95, 100–113.
Amemiya, K., Karino, S., Ishizu, T., Yumoto, M., & Yamasoba, T. (2014). Distinct neural
mechanisms of tonal processing between musicians and non-musicians. Clinical
Neurophysiology, 125(4), 738–747.
Ananthakrishnan, S., & Narayana, S. S. (2008). Automatic prosodic event detection us-
ing acoustic, lexical, and syntactic evidence. IEEE Transactions on Audio, Speech, and
Language Processing, 16(1), 216–228.
Armstrong, D. F., Stokoe, W. C., & Wilcox, S. E. (1995). Gesture and the Nature of Lan-
guage. Cambridge: Cambridge University Press.
Arnold, J. E. (2010). How speakers refer: The role of accessibility. Language and Linguistic
Compass, 4(4), 187–203.
385

Bibliography
Arnold, T. W. (2010). Uninformative parameters and model selection using Akaike’s
Information Criterion. Journal of Wildlife Management, 74(6), 1175–1178.
Aronson, E., Wilson, T., & Akert, R. (2010). Social Psychology. New Jersey: Pearson
Education Inc.
Arvaniti, A., Ladd, D. R., & Mennen, I. (1998). Stability of tonal alignment: the case of
Greek prenuclear accents. Journal of Phonetics, 36(1), 3–25.
Astésano, C., Magne, C., Morel, M., Coquillon, A., Espesser, R., Besson, M., & Lacheret-
Dujour, A. (2004). Marquage acoustique du focus contrastif non codé syntaxiquement
en français. In Proceedings of the Journées d’Etude sur la Parole (JEP). Fez, Morocco.
Aylett, M., & Turk, A. (2004). The smooth signal redundancy hypothesis: A functional
explanation for relationships between redundancy, prosodic prominence, and dura-
tion in spontaneous speech. Language and Speech, 47 (1), 31–56.
Baayen, R. H., Davidson, D. J., & Bates, D. (2008). Mixed-e�ects modeling with crossed
random e�ects for subjects and items. Journal of Memory and Language, 59(4), 390–
412.
Bagdasarian, S. A., & Vanyan, L. V. (2011). On the interrelation of rhythm and phrasal
accent: A contrastive study. In Proceedings of the 17th International Congress of Phonetic
Sciences (ICPhS11), (pp. 272–275). Hong Kong, China.
Barbieri, F., Buonocore, A., Dalla Volta, R., & Gentilucci, M. (2009). How symbolic ges-
tures and words interact with each other. Brain and Language, 110(1), 1–11.
Barbosa, P. A., Eriksson, A., & Åkesson, J. (2013). Cross-linguistic similarities and di�er-
ences of lexical stress realisation in Swedish and Brazilian Portuguese. In E. L. Asu,
& P. Lippus (Eds.) Nordic Prosody. Proceedings of the 11th conference, Tartu 2012, (pp.
97–106). Frankfurt am Main: Peter Lang.
386

Bibliography
Bard, E. G., Anderson, A. H., Sotillo, C., Aylett, M., Doherty-Sneddon, G., & Newlands,
A. (2000). Controlling the intelligibility of referring expressions in dialogue. Journal
of Memory and Language, 42(1), 1–22.
Barkhuysen, P., Krahmer, E., & Swerts, M. (2005). Problem detection in human-machine
interactions based on facial expressions of users. Speech Communication, 45(3), 343–
359.
Barkhuysen, P., Krahmer, E., & Swerts, M. (2008). The interplay between the auditory
and visual modality for end-of-utterance detection. Journal of the Acoustical Society
of America, 123(1), 354–365.
Barr, D. J., Levy, R., Scheepers, C., & Tily, H. J. (2013). Random e�ects structure for
con�rmatory hypothesis testing: Keep it maximal. Journal of Memory and Language,
68(3), 255—278.
Bates, D., Kliegl, R., Vasishth, S., & Baayen, R. H. (2015a). Parsimonious mixed models.
ArXiv e-prints, ArXiv:1506.04967 .
Bates, D., Maechler, M., Bolker, B., & Walker, S. (2015b). Fitting linear mixed-e�ects
models using lme4. Journal of Statistical Software, 67 (1), 1–48.
Bateson, G. (1958). Language and Psychotherapy, Frieda Fromm-Reichmann’s Last Pro-
ject. Psychiatry, 21(1), 91–95.
Baumann, S., Becker, J., & Mücke, D. (2007). Tonal and articulatory marking of focus in
German. In Proceedings of the 16th International Congress of Phonetic Sciences (ICPhS07).
Saarbrücken, Germany: University of Saarbrücken.
Baumann, S., & Roth, A. (2014). Prominence and coreference – on the perceptual relev-
ance of F0 movement, duration and intensity. In Proceedings of the 7th International
Conference on Speech Prosody (SP2014), (pp. 227–231). Dublin, Ireland.
387

Bibliography
Baynes, K., Funnell, M. G., & Fowler, C. A. (1994). Hemispheric contributions to the
integration of visual and auditory information in speech perception. Perception and
Psychophysics, 55(6), 633–641.
Beckman, M. E. (1986). Stress and Non-Stress Accent. Berlin/Boston: De Gruyter.
Beckman, M. E., & Edwards, J. (1994). Articulatory evidence for di�erentiating stress
categories. In P. A. Keating (Ed.) Phonological Structure and Phonetic Form: Phonology
and Phonetic Evidence, (pp. 7–33). Cambridge: Cambridge University Press.
Beckman, M. E., & Pierrehumbert, J. B. (1986). Intonational structure in Japanese and
English. Phonology Yearbook, 3, 255–309.
Bednarek, M. (2013). “There’s no harm, is there, in letting your emotions out”: a mul-
timodal perspective on language, emotion and identity in MasterChef Australia. In
N. Lorenzo-Dus, & P. Garcés-Conejos Blitvich (Eds.) Real Talk: Reality Television and
Discourse Analysis in Action, (pp. 88–114). London: Palgrave Macmillan UK.
Bell, A., Brenier, J., Gregory, M., Girand, C., & Jurafsky, D. (2009). Predictability e�ects on
durations of content and function words in conversational English. Journal of Memory
and Language, 60(1), 92–111.
Bello, A. (1847/1860). Gramática de la lengua castellana destinada al uso de los americanos.
Santiago de Chile: Imprenta del Progreso, 5a ed.
Bergmann, K., Aksu, V., & Kopp, S. (2011). The relation of speech and gestures: Temporal
synchrony follows semantic synchrony. In Proceedings of the 2ndWorkshop on Gesture
and Speech in Interaction (GESPIN - 2011). Bielefeld, Germany.
Bergmann, K., & Kopp, S. (2006). Verbal or visual? How information is distributed across
speech and gesture in spatial dialogue. In D. Schlangen, & R. Fernández (Eds.) Pro-
ceedings of the 10th Workshop on the Semantics and Pragmatics of Dialogue, (pp. 90–97).
Potsdam: Universitätsverlag.
388

Bibliography
Bernardis, P., & Gentilucci, M. (2006). Speech and gesture share the same communication
system. Neuropsychologia, 44(2), 178–190.
Beskow, J. (1995). Rule-based visual speech synthesis. In Proceedings of the 4th European
Conference on Speech Communication and Technology (Eurospeech - 1995), (pp. 299–
302). Madrid, Spain.
Beskow, J., Granström, B., & House, D. (2006). Visual correlates to prominence in several
expressive modes. In Proceedings of the Annual Conference of the International Speech
Communication Association, INTERSPEECH - 2006, (pp. 1272–1275). Pittsburgh, USA.
Biau, E., Morís Fernández, L., Holle, H., Avila, C., & Soto-Faraco, S. (2016). Hand gestures
as visual prosody: BOLD responses to audio–visual alignment are modulated by the
communicative nature of the stimuli. Neuroimage, 132, 129–137.
Biau, E., & Soto-Faraco, S. (2013). Beat gestures modulate auditory integration in speech
perception. Brain and Language, 124(2), 143–152.
Biau, E., Torralba, M., Fuentemilla, L., de Diego Balaguer, R., & Soto-Faraco, S. (2015).
Speaker’s hand gestures modulate speech perception through phase resetting of on-
going neural oscillations. Cortex, 68, 76–85.
Bickerton, D. (1990). Language and Species. Chicago: University Chicago Press.
Birch, S., & Clifton Jr., C. (1995). Focus, accent, and argument structure: E�ects on
language comprehension. Language and Speech, 38(4), 365–392.
Birdwhistell, R. (1952). Introduction to kinesics. An annotation system for analysis of body
motion and gesture. Louisville, KY: University of Louisville.
Birdwhistell, R. (1970). Kinesics and context. Philadelphia: University of Pennsylvania
Press.
389

Bibliography
Bocci, G., & Avesani, C. (2011). Phrasal prominences do not need pitch movements:
Postfocal phrasal heads in Italian. In Proceedings of the Annual Conference of the In-
ternational Speech Communication Association, INTERSPEECH - 2011, (pp. 1357–1360).
Florence, Italy.
Bock, J. K., & Mazzella, J. R. (1983). Intonational marking of given and new information:
Some consequences for comprehension. Memory and Cognition, 11(1), 64–76.
Boersma, P., & Weenink, D. (2018). Praat: Doing phonetics by computer. Computer
program. Version 6.0.43, retrieved 8 September 2018 from http://www.praat.org/.
Bolinger, D. L. (1955). Intersections of stress and intonation. Word, 11(2), 195–203.
Bolinger, D. L. (1958). A theory of pitch accent in English. Word, 14(2-3), 109–149.
Bolinger, D. L. (1961). Contrastive accent and contrastive stress. Language, 37 , 83–96.
Bolinger, D. L. (1972). Accent is predictable (if you’re a mind-reader). Language, 48(3),
633–644.
Bolinger, D. L., & Hodapp, M. (1961). Acento melódico. Acento de intensidad. Boletín del
Instituto de Filología de la Universidad de Chile, 13, 33–48.
Bolker, B. M., Brooks, M. E., Clark, C. J., Geange, S. W., Poulsen, J. R., Stevens, M. H. H., &
White, J.-S. S. (2009). Generalized linear mixed models: A practical guide for ecology
and evolution. Trends in Ecology and Evolution, 24(3), 127–135.
Bonifaccio, G. (1616). L’arte de’ Cenni [The art of signs]. Vicenza: Francesco Grossi.
Breslow, N. E., & Clayton, D. G. (1993). Approximate inference in generalized linear
mixed models. Journal of the American Statistical Association, 88(421), 9–25.
Bressem, J. (2013). A linguistic perspective on the notation of form features in gestures.
In C. Müller, A. Cienki, E. Fricke, S. H. Ladewig, D. McNeill, & S. Tessendorf (Eds.)
Body – Language – Communication. An International Handbook on Multimodality in
390

Bibliography
Human Interaction (Handbooks of Linguistics and Communication Science 38.1.), (pp.
1079–1098). Berlin/Boston: De Gruyter.
Broughton, R. (1870). Red as a rose is she: a novel. London: Richard Bentley.
Brown, G. (1983). Prosodic structure and the given/new distinction. In D. R.
Ladd, & A. Cutler (Eds.) Prosody: Models and Measurements, (pp. 67–78). Ber-
lin/Heidelberg/New York: Springer-Verlag.
Bruce, G. (1977). Swedish word accents in sentence perspective. Lund: CWK Gleerup.
Brugman, H., & Russel, A. (2004). Annotating multimedia/multi-modal resources with
elan. In Fourth International Conference on Language Resources and Evaluation (LREC
- 2004). Nijmegen: Max Planck Institute for Psycholinguistics.
Buhmann, J., Caspers, J., van Heuven, V. J., Hoekstra, H., Martens, J.-P., & Swerts, M.
(2002). Annotation of prominent words, prosodic boundaries and segmental length-
ening by non-expert transcribers in the Spoken Dutch Corpus. In Proceedings of the
3rd International Conference on Language Resources and Evaluation (LREC02), (pp. 779–
785).
Bull, P., & Connelly, G. (1985). Body movement and emphasis in speech. Journal of
Nonverbal Behavior , 9(3), 169–187.
Bulwer, J. (1644). Chirologia or the Natural Language of the Hand, etc. [and] Chironomia,
or, The art of manual Rhetoric, etc.. London: Thomas Harper.
Burling, R. (1993). Primate calls, human language, and nonverbal communication. Cur-
rent Anthropology, 34(1), 25–53.
Burling, R. (2000). Comprehension, production and conventionalisaton in the origins of
language. In C. Knight, M. Studdert-Kennedy, & J. Hurford (Eds.) The Evolutionary
Emergence of Language, (pp. 27–39). Cambridge: Cambridge University Press.
391

Bibliography
Burnham, K. P., & Anderson, D. R. (2002). Model Selection and Multimodel Inference:
a Practice Information-Theoretic Approach. Berlin/Heidelberg/New York: Springer-
Verlag.
Butterworth, B. (1989). Lexical access in speech production. In W. Marslen-Wilson (Ed.)
Lexical Representation and Process, (pp. 108–135). Cambridge, MA: MIT Press.
Butterworth, B., & Beattie, G. (1978). Gesture and silence as indicators of planning in
speech. In R. N. Campbell, & P. T. Smith (Eds.) Recent Advances in the Psychology of
Language: Formal and Experimental Approaches. NATO Conference Series, vol 4b, (pp.
347–360). Boston: Springer-Verlag.
Cafaro, A., Vilhjálmsson, H. H., Bickmore, T., Heylen, D., Jóhannsdóttir, K. R., & Val-
garðsson, G. S. (2012). First impressions: Users’ judgments of virtual agents’ person-
ality and interpersonal attitude in �rst encounters. In Y. Nakano, M. Ne�, A. Paiva, &
M.Walker (Eds.) Intelligent Virtual Agents. IVA 2012. Lecture Notes in Computer Science,
vol. 7502, (pp. 67–80). Berlin/Heidelberg/New York: Springer-Verlag.
Campbell, N., & Beckman, M. E. (1997). Accent, stress, and spectral tilt. Journal of the
Acoustical Society of America, 101(5), 3195–3195.
Canellada, M. J., & Madsen, J. K. (1987). Pronunciación del español. Lengua hablada y
literaria. Madrid: Castalia.
Carpenter, M., Nagell, K., & Tomasello, M. (1998). Social cognition, joint attention, and
communicative competence from 9 to 15 months of age. Monographs of the Society for
Research in Child Development, 63(4), i–vi, 1–174.
Cartmill, E. A., Beilock, S., & Goldin-Meadow, S. (2012). A word in the hand: Action,
gesture and mental representation in humans and non-human primates. Philosophical
Transactions of the Royal Society of London. Series B - Biological Sciences, 367 (1585),
129–143.
392

Bibliography
Castiglione, B. (1528). Il libro del cortegiano [The book of the courtier]. Firenze: Philippo
di Giunta, eredi.
Cavé, C., Guaïtella, I., Bertrand, R., Santi, S., Harlay, F., & Espesser, R. (1996). About
the relationship between eyebrow movements and f 0 variations. In Proceedings of the
4th International Conference on Spoken Language Processing (ICSLP96), vol. 2175–2179.
Philadelphia, USA.
Cerrato, L. (2007). Investigating Communicative Feedback Phenomena across Languages
and Modalities. Ph.D. thesis, KTH Computer Science and Communication.
Chiarcos, C., Barry, C., &Grabski, M. (Eds.) (2011). Salience: Multidisciplinary perspectives
on its function in discourse. Berlin/New York: de Gruyter.
Chomsky, N., & Halle, M. (1968). The sound pattern of English. New York: Harper & Row.
Christenfeld, N., Schachter, S., & Bilous, F. (1991). Filled pauses and gestures: It’s not
coincidence. Journal of Psycholinguistic Research, 20(1), 1–10.
Cienki, A. (2005). Image schemas and gesture. In B. Hampe (Ed.) From Perception to
Meaning: Image Schemas in Cognitive Linguistics, (pp. 421–442). Berlin: De Gruyter.
Clark, H. H. (1973). The language-as-�xed-e�ect fallacy: A critique of language statistics
in psychological research. Journal of Verbal Learning and Verbal Behavior , 12(4), 335—
359.
Cocks, N., Dipper, L., Pritchard, M., & Morgan, G. (2013). The impact of impaired se-
mantic knowledge on spontaneous iconic gesture production. Aphasiology, 27 (9),
1050–1069.
Cohen, A., Collier, R., & ’t Hart, J. (1982). Declination: Construct or intrinsic feature of
speech pitch? Phonetica, 39(4-5), 254–273.
Cohen, J. (1960). A coe�cient of agreement for nominal scales. Educational and Psycho-
logical Measurement, 20(1), 37–46.
393

Bibliography
Cole, J. (2015). Prosody in context: a review. Language, Cognition and Neuroscience,
30(1-2), 1–31.
Cole, J., Mahrt, T., & Hualde, J. I. (2014). Listening for sound, listening for meaning: Task
e�ects on prosodic transcription. In Proceedings of the 7th International Conference on
Speech Prosody (SP2014), (pp. 859–863). Dublin, Ireland.
Cole, J., Mo, Y., & Hasegawa-Johnson, M. (2010). Signal-based and expectation-based
factors in the perception of prosodic prominence. Laboratory Phonology, 1(2), 425–
452.
Colin, C., Radeau, M., Soquet, A., Demolin, D., Colin, F., & Deltenre, P. (2002). Mis-
match negativity evoked by the McGurk-MacDonald e�ect: A phonetic representa-
tion within short-term memory. Clinical Neurophysiology, 113(4), 495–506.
Condillac, E. B. d. (1746). Essai sur l’origine des connaissances humaines [Essay on the
origin of human knowledge]. Amsterdam: Pierre Mortier.
Condon, W. S. (1976). An analysis of behavioral organization. Sign Language Studies, 13,
285–318.
Condon, W. S., & Ogston, W. D. (1966). Sound �lm analysis of normal and pathological
behavior patterns. Journal of Nervous and Mental Disease, 143(4), 338–347.
Condon,W. S., & Ogston,W. D. (1967). A segmentation of behavior. Journal of Psychiatric
Research, 5(3), 221–235.
Coney, J. (2002). Lateral asymmetry in phonological processing: Relating behavioral
measures to neuroimaged structures. Brain and Language, 80(3), 355–365.
Contreras, H. (1963). Sobre el acento español. Boletín del Instituto de Filología de la
Universidad de Chile, 15, 223–237.
Contreras, H. (1964). ?’tiene el español un acento de intensidad? Boletín del Instituto de
Filología de la Universidad de Chile, 16, 237–239.
394

Bibliography
Corballis, M. C. (2002). From Hand to Mouth: The Origins of Language. Princeton/Oxford:
Princeton University Press.
Crichtley, M. (1939). The Language of Gesture. London: Edward Arnold.
Crivelli, C., Jarillo, S., Russell, J. A., & Fernández-Dols, J. M. (2016). Reading emotions
from faces in two indigenous societies. Journal of Experimental Psychology: General,
145(7), 830–843.
Cuervo, R. J. (1874). Gramática de la lengua castellana destinada al uso de los americanos.
Ed. con notas de R. J. Cuervo. Bogotá: Hermanos Echeverría.
Cummins, F., & Port, R. (1998). Rhythmic constraints on stress timing in English. Journal
of Phonetics, 26(2), 145–171.
Cutler, A. (1976). Phoneme-monitoring reaction time as a function of preceding intona-
tion contour. Perception and Psychophysics, 20(1), 55–60.
Cutler, A., & Darwin, C. J. (1981). Phoneme-monitoring reaction time and preceding
prosody: E�ects of stop closure duration and of fundamental frequency. Perception &
Psychophysics, 29(3), 217–224.
Cutler, A., & Foss, D. J. (1977). On the role of sentence stress in sentence processing.
Language and Speech, 20(1), 1–10.
Dahan, D., Tanenhaus, M. K., & Chambers, C. G. (2002). Accent and reference resolution
in spoken-language comprehension. Journal of Memory and Language, 47 (2), 292–314.
Dancer, J., Krain, M., Thompson, C., Davis, P., & Glen, J. (1994). A cross-sectional in-
vestigation of speechreading in adults: E�ects of age, gender, practice, and education.
Volta Review, 96, 31–40.
Danesi, M. (1993). Vico, Metaphor, and the Origin of Language. Bloomington: Indiana
University Press.
395

Bibliography
Darwin, C. R. (1871). The Descent of Man and Selection in Relation to Sex. London: John
Murray.
Darwin, C. R. (1872). The Expression of the Emotions in Man and Animals. London: John
Murray.
de Gelder, B., & Vroomen, J. (2000). The perception of emotions by ear and by eye.
Cognition and Emotion, 14(3), 289–311.
de Jorio, A. (1832). La mimica degli antichi investigiata nel gestire napolitano [Gestural
expression of the ancients in the light of Neapolitan gesturing]. Naples: Fibreno.
de la Mota, C. (1997). Prosody of sentences with contrastive new information in Spanish.
In A. Botinis, G. Kouroupetroglou, & G. Carayiannis (Eds.) Intonation: theory, models
and applications, (pp. 75–78). Athens, Greece.
De Ruiter, J. (2000). The production of gesture and speech. In D. McNeill (Ed.) Language
and Gesture, (pp. 248–311). Cambridge: Cambridge University Press.
De Ruiter, J. P. (1998). Gesture and speech production. Ph.D. thesis, Katholieke Universiteit
Nijmegen.
Delattre, P. (1966). A comparison of syllable length conditioning among languages. IRAL
- International Review of Applied Linguistics in Language Teaching, 4(1-4), 183–198.
Delattre, P. (1969). An acoustic and articulatory study of vowel reduction in four lan-
guages. IRAL - International Review of Applied Linguistics in Language Teaching, 7 (4),
295–325.
Delgado-Martins, M. R. (1973). Análise acústica das vogais orais tônicas em português
[acoustic analysis of stressed vowels in Portuguese]. Boletim de Filologia (University
of Lisbon), 2, 303–3014.
Della Casa, G. (1558). Il Galateo, overo de’ costumi [Galateo: the rules of polite behavior].
Venice: Nicolo Bevilacqua.
396

Bibliography
Diderot, D. (1751). Lettre sur les sourds et muets á l’usage de ceux qui entendent et qui
parlent [Letter on the deaf and dumb]. s. l.: s. n.
Dittmann, A. T., & Llewelyn, L. G. (1969). Body movement and speech rhythm in social
conversation. Journal of Personality and Social Psychology, 23(2), 283–292.
Dogil, G. (1999). The phonetic manifestation of word stress in Lithuanian, Polish, Ger-
man and Spanish. In H. van der Hulst (Ed.) Word prosodic systems in the languages of
Europe, (pp. 273–311). Berlin: De Gruyter.
Dogil, G., & Williams, B. (1999). The phonetic manifestation of word stress. In H. van
der Hulst (Ed.)Word prosodic systems in the languages of Europe, (pp. 273–311). Berlin:
De Gruyter.
Dohen, M., & Lœvenbruck, H. (2005). Audiovisual production and perception of con-
trastive focus in French: A multispeaker study. In Proceedings of the Annual Confer-
ence of the International Speech Communication Association, INTERSPEECH - 2005, (pp.
2413–2416). Lisbon, Portugal.
Dohen, M., & Lœvenbruck, H. (2009). Interaction of audition and vision for the percep-
tion of prosodic contrastive focus. Language and Speech, 52(2-3), 177–206.
Donati, C., & Nespor, N. (2003). From focus to syntax. Lingua, 113(11), 1119–1142.
D’Imperio, M. (1998). Acoustic-perceptual correlates of sentence prominence in italian
questions and statements. Journal of the Acoustical Society of America, 104(3), 1779–
1779.
Eady, S., Cooper, W. E., Klouda, G., Mueller, P., & Lotts, D. (1986). Acoustical character-
istics of sentential focus: Narrow vs. broad and single vs. dual focus environments.
Language and Speech, 29(3), 233–251.
Eberhardt, M., & Downs, C. (2015). “(r) you saying yes to the dress?”: Rhoticity on a
bridal reality television show. Journal of English Linguistics, 43(2), 118–142.
397

Bibliography
Efron, D. (1941/1972). Gesture, Race, and Culture. New York: King’s Crown Press.
Ekman, P. (1999). Emotional and conversational nonverbal signals. In L. S. Messing, &
R. Campbell (Eds.)Gesture, Speech, and Sign, (pp. 45–55). New York: Oxford University
Press.
Ekman, P., & Friesen, W. V. (1969). The Repertoire of Nonverbal Behavior: Categories,
Origins, Usage, and Coding. Semiotica, 1(1), 49–98.
Enríquez, E., Casado, C., & Santos, A. (1989). La percepción del acento en español.
Lingüística Española Actual (LEA), 11, 241–269.
Épée, C.-M. A. d. l. (1776). Institution des sourds et muets, par la voie des signes
méthodiques; ouvrage qui contient le projet d’une langue universelle, par l’entremise des
signes naturels assujettis á une méthode [The instruction of the deaf and dumb by means
of methodical signs]. Paris: Nyon.
Eriksson, A., Bertinetto, P. M., Heldner, M., Nodari, R., & Lenoci, G. (2016). The acoustics
of word stress in Italian as a function of stress level and speaking style. In Proceed-
ings of the Annual Conference of the International Speech Communication Association,
INTERSPEECH - 2016, (pp. 1059–1063). San Francisco, USA.
Eriksson, A., & Heldner, M. (2015). The acoustics of word stress in English as a func-
tion of stress level and speaking style. In Proceedings of the Annual Conference of the
International Speech Communication Association, INTERSPEECH - 2015, (pp. 41–45).
Dresden, Germany.
Eriksson, A., Thunberg, G. C., & Traunmüller, H. (2001). Syllable prominence: A mat-
ter of vocal e�ort, phonetic distinctness and top-down processing. In Proceedings of
the Annual Conference of the International Speech Communication Association, INTER-
SPEECH - 2001, (pp. 399–402). Aalborg, Denmark.
Escandell-Vidal, V. (2011). Verum focus y prosodia: cuando la duración (sí que) importa.
Oralia, 14, 181–201.
398
Bibliography
Escandell-Vidal, V., & Leonetti, M. (2014). Fronting and irony in Spanish. In A. Dufter, &
A. S. Octavio de Toledo y Huerta (Eds.) Left Sentence Peripheries in Spanish: Diachronic,
Variationist and Comparative Perspectives (Linguistics Today, 214), (pp. 309–342). Am-
sterdam: John Benjamins.
Escandell-Vidal, V., Marrero Aguiar, V., & Pérez Ocón, P. (2014). Prosody, information
structure and Evaluation. In G. Thompson, & L. Alba-Juez (Eds.) Evaluation in Context
(Pragmatics and Beyond New Series, 242), (pp. 153–178). Amsterdam: John Benjamins.
Estebas-Vilaplana, E., & Prieto, P. (2010). Castilian Spanish intonation. In P. Prieto,
& P. Roseano (Eds.) Transcription of intonation of the Spanish Language, (pp. 17–48).
Munich: Lincom Europa.
Esteve-Gibert, N., & Prieto, P. (2013). Prosodic structure shapes the temporal realiza-
tion of intonation and manual gesture movements. Journal of Speech, Language, and
Hearing Research, 56(3), 850–864.
Face, T. (2001). Focus and early peak alignment in Spanish intonation. Probus, 13(2),
223–246.
Face, T. (2003). Intonation in Spanish declaratives: Di�erences between lab speech and
spontaneous speech. Catalan Journal of Linguistics, 2, 115–131.
Face, T. L. (2000). The role of syllable weight in the perception of Spanish stress. In
H. Campos, E. Herburger, A. Morales-Front, & T. J. Walsh (Eds.) Hispanic Linguistics
at the Turn of the Millennium. Papers from the 3rd Hispanic Linguistics Symposium, (pp.
1–13). Somerville: Cascadilla Press.
Falk, S. (2014). On the notion of salience in spoken discourse - prominence cues shaping
discourse structure and comprehension. TIPA. Travaux interdisciplinaires sur la parole
et le langage, 30. [mis en ligne le 18 décembre 2014]. URL: http://journals.openedition.
org/tipa/1303.
399
Bibliography
Fant, G., Kruckenberg, A., & Nord, L. (1991). Durational correlates of stress in Swedish,
French and English. Journal of Phonetics, 19(3-4), 351–365.
Ferré, G. (2010). Timing relationships between speech and co-verbal gestures in spon-
taneous French. In Language Resources and Evaluation, Workshop on Multimodal Cor-
pora, May 2010, vol. W6, (pp. 86–91). Malta.
Ferreira, L. (2008). High initial tones and plateaux in Spanish and Portuguese neutral
declaratives: Consequences to the relevance of f0, duration and vowel quality as stress
correlates. Ph.D. thesis, University of Illinois at Urbana-Champaign.
Féry, C., & Krifka, M. (2008). Unity and Diversity of Languages. In P. van Sterkenburg
(Ed.) Information Structure: Notional Distinctions, Ways of Expression, (pp. 123–136).
Amsterdam: John Benjamins.
Féry, C., & Kügler, F. (2008). Pitch accent scaling on given, new and focused constituents
in German. Journal of Phonetics, 36(4), 680–703.
Feyereisen, P. (1987). Gestures and speech, interactions and separations: A reply to
McNeill (1985). Psychological Review, 94(4), 493–498.
Field, A., Miles, J., & Field, Z. (2012). Discovering Statistics using R. London: SAGE.
Figueras, C., & Santiago, M. (1993a). Investigaciones sobre la naturaleza del acento a
través del Visi-pitch. Estudios de fonética experimental, 5, 21–45.
Figueras, C., & Santiago, M. (1993b). Producción del rasgo acentual mediante síntesis de
voz. Estudios de fonética experimental, 5, 113–128.
Firbas, J. (1964). On de�ning the theme in functional sentence perspective. Travaux
linguistiques de Prague, 1, 267–280.
Fisher, R. A. (1922). On the mathematical foundations of theoretical statistics. Philosoph-
ical Transactions of the Royal Society of London. Series A - Mathematical, Physical and
Engineering Sciences, 222(594-604), 309–368.
400

Bibliography
Flecha-García, M. L. (2006). Eyebrow raising in dialogue: Discourse structure, utterance
function, and pitch accents. Ph.D. thesis, University of Edinburgh.
Flecha-García, M. L. (2007). Non-verbal communication in dialogue: Alignment between
eyebrow raises and pitch accents in English. In Proceedings of the Annual Meeting of
the Cognitive Science Society, vol. 29, (p. 1753). Austin, USA.
Fleiss, J. L. (1971). Measuring nominal scale agreement amongmany raters. Psychological
Bulletin, 75(5), 378–382.
Fónagy, I. (1958). Elektrophysiologische beiträge zur Akzentfrage. Phonetica, 2, 12–58.
Fosler-Lussier, E., & Morgan, N. (1999). E�ects of speaking rate and word frequency on
pronunciations in conventional speech. Speech Communication, 29(2-4), 137–158.
Fournier, D. A., Skaug, H. J., Ancheta, J., Ianelli, J., Magnusson, A., Maunder, M. N.,
Nielsen, A., & Sibert, J. (2012). AD Model Builder: Using automatic di�erentiation
for statistical inference of highly parameterized complex nonlinear models. Op-
timization Methods and Software, 27 (2), 233–249. Computer program. URL: http:
//www.admb-project.org/.
Fowler, C. A., & Housum, J. (1987). Talkers’ signaling of “new” and “old” words in speech
and listeners’ perception and use of the distinction. Journal of Memory and Language,
26(5), 489–504.
Foxton, J. M., Riviere, L.-D., & Barone, P. (2010). Cross-modal facilitation in speech
prosody. Cognition, 115(1), 71–78.
Freedman, N., & Ho�man, S. P. (1967). Kinetic behavior in altered clinical states: Ap-
proach to objective analysis of motor behavior during clinical interviews. Perceptual
and Motor skills, 24, 527–539.
Frota, S. (2002). Nuclear falls and rises in European Portuguese: A phonological analysis
of declarative and question intonation. Probus, 14(1), 113–146.
401

Bibliography
Fry, D. B. (1955). Duration and intensity as physical correlates of linguistic stress. Journal
of the Acoustical Society of America, 27 (4), 765–768.
Fry, D. B. (1958). Experiments in the perception of stress. Language and Speech, 1(2),
126–152.
Fry, D. B. (1965). The dependence of stress judgments on vowel formant structure. In
Proceedings of the 5th International Congress Phonetic Sciences (ICPhS65), (pp. 306–311).
Münster.
Fudge, E. C. (1969). Syllables. Journal of Linguistics, 5(2), 253–286.
Gahl, S., & Garnsey, S. M. (2004). Knowledge of grammar, knowledge of usage: Syntactic
probabilities a�ect pronunciation variation. Language, 80(4), 748–775.
Gallese, V., Fadiga, L., Fogassi, L., & Rizzolatti, G. (1996). Action recognition in the
premotor cortex. Brain, 119(2), 593–609.
Gallinares, J. (1944). Nuevos concepto de la acentuación española. Boletín de Filología de
la Universidad de Montevideo, 4, 33–48.
Garrido, J. M., Llisterri, J., de la Mota, C., & Ríos, A. (1993). Prosodic di�erences in
reading style: Isolated vs. contextualized sentences. In Proceedings of the 3rd European
Conference on Speech Communication and Technology (Eurospeech - 1993), (pp. 573–
575). Berlin, Germany.
Garrido, J. M., Llisterri, J., de la Mota, C., & Ríos, A. (1995). Estudio comparado de
las características prosódicas de la oración simple en español en dos modalidades de
lectura. In A. Elejabeitia, &A. Iribar (Eds.) Phonetica. Trabajos de fonética experimental,
(pp. 177–193). Bilbao: Laboratorio de fonética, Universidad de Deusto.
Gentilucci, M., & Corballis, M. C. (2006). From manual gesture to speech: A gradual
transition. Neuroscience & Biobehavioral Reviews, 30(7), 949–960.
402

Bibliography
Gentilucci, M., Dalla Volta, R., & Gianelli, C. (2008). When the hands speak. Journal of
Physiology, 102, 21–30.
Genzel, S., Ishihara, S., & Surányi, B. (2015). The prosodic expression of focus, contrast
and givenness: A production study of Hungarian. Lingua, 165(B), 183–204.
Gérando, J.-M. B. d. (1800). Des signes et de l’art de penser considérés dans leurs rapports
mutuels [On signs and on the art of thinking considered in their relations to each other].
Paris: Goujon �ls, Fuchs, Henrichs.
Gibbon, D. (1998). Intonation in German. In D. Hirst, & A. di Cristo (Eds.) Intonation
systems: A survey of twenty languages, (pp. 78–95). Cambridge: Cambridge University
Press.
Gili-Fivela, B. (2006). Scaling e allineamento dei bersagli tonali: L’identi�cazione di due
accenti discendenti [the coding of pitch target alignment and scaling: Identi�cation
of two falling pitch accents]. In S. Atti del Convegno Nazionale AISV (Associazione
Italiana di Scienze della Voce) (Ed.) Analisi prosodica: teorie, modelli e sistemi di an-
notazione, (pp. 214–232). Torriana, RN: EDK.
Goodall, P. (2014). The History of Strategic Thought. Xlibris UK.
Gould, S. J. (1980). The Panda’s Thumb. New York/London: W. W. Norton & Co.
Grabe, E., Post, B., Nolan, F., & Farrar, K. (2000). Pitch accent realization in four varieties
of British English. Journal of Phonetics, 28(2), 161–185.
Granström, B., House, D., & Lundeberg, M. (1999). Prosodic cues in multimodal speech
perception. In Proceedings of the 14th International Congress of Phonetic Sciences
(ICPhS99), vol. 1, (pp. 655–658). San Francisco, USA.
Gregory, M. L., & Altun, Y. (2004). Using conditional random �elds to predict pitch ac-
cents in conversational speech. In Proceedings of the Annual Meeting of the Association
for Computational Linguistics, ACL - 2004, vol. P04-1086. Barcelona, Spain.
403

Bibliography
Gregory, M. L., Raymond, W. D., Bell, A., Fosler-Lussier, E., & Jurafsky, D. (1999). The
e�ects of collocational strength and contextual predictability in lexical production. In
Proceedings of the Chicago Linguistic Society, vol. 35, (pp. 151–166). Chicago, USA.
Gries, S. T. (2015). The most under-used statistical method in corpus linguistics: Multi-
level (and mixed-e�ects) models. Corpora, 10(1), 95—125.
Grosz, B. J., Joshi, A. K., & Weinstein, S. (1995). Centering: A framework for modeling
the local discourse. Computational Linguistics, 21(2), 203–225.
Grosz, B. J., & Sidner, C. L. (1986). Attention, intentions, and the structure of discourse.
Computational Linguistics, 12(3), 175–204.
Grueber, C. E., Nakagawa, S., Laws, R. J., & Jamieson, I. G. (2011). Multimodel inference
in ecology and evolution: Challenges and solutions. Journal of Evolutionary Biology,
24(4), 699–711.
Gueorguieva, R., & Krystal, J. H. (2004). Move over ANOVA: Progress in analyzing
repeated-measures data and its re�ection in papers published in the Archives of Gen-
eral Psychiatry. Archives of General Psychiatry, 61(3), 310—317.
Gundel, J. K. (1974). The role of topic and comment in linguistic theory. Ph.D. thesis,
University of Texas.
Gundel, J. K., & Fretheim, T. (2004). Topic and focus. In L. R. Horn, & G. Ward (Eds.) The
Handbook of Pragmatics, (pp. 175–196). Malden, MA: Blackwell Publishers.
Gussenhoven, C. (1983a). Focus, mode, and the nucleus. Journal of Linguistics, 19(2),
377–417.
Gussenhoven, C. (1983b). A semantic analysis of the nuclear tones of English. Blooming-
ton, IN: Indiana University Linguistics Club.
Gussenhoven, C. (1983c). Testing the reality of focus domains. Language and Speech,
26(1), 61–80.
404

Bibliography
Gussenhoven, C. (1984). On the Grammar and Semantics of Sentence Accents. Cinnamin-
son, NJ: Foris.
Gussenhoven, C. (1992). Sentence accents and argument structure. In I. M. Roca (Ed.)
Thematic Structure: Its Role in Grammar , (pp. 79–106). Berlin/New York: Foris.
Gussenhoven, C. (2004). The Phonology of Tone and Intonation. Research Surveys in
Linguistics. Cambridge: Cambridge University Press.
Gussenhoven, C. (2005). Transcription of Dutch Intonation. In S.-A. Jun (Ed.) Prosodic
Typology: The Phonology of Intonation and Phrasing, (pp. 118–145). Oxford: Oxford
University Press.
Gussenhoven, C., Repp, B., Rietveld, A., Rump, H., & Terken, J. (1997). The percep-
tual prominence of fundamental frequency peaks. Journal of the Acoustical Society of
America, 102(5), 3009–22.
Gussenhoven, C., & Rietveld, A. (1988). Fundamental frequency declination in Dutch:
Testing three hypotheses. Journal of Phonetics, 16, 355–369.
Gussenhoven, C., & Rietveld, A. (1998). On the speaker-dependence of the perceived
prominence of F0 peaks. Journal of Phonetics, 26(4), 371–380.
Hadar, U., Steiner, T. J., Grant, E. C., & Rose, F. C. (1983). Head movement correlates of
juncture and stress at sentence level. Language and Speech, 26(2), 117–129.
Hadar, U., Steiner, T. J., & Rose, C. F. (1985). Head movement during listening turns in
conversation. Journal of Nonverbal Behavior , 9(4), 214–228.
Halle, M., & Vergnaud, J.-R. (1987). Stress and the cycle. Linguistics Inquiry, 18(1), 45–84.
Halliday, M. A. K. (1967a). Intonation and Grammar in British English. The Hague/Paris:
Mouton.
405

Bibliography
Halliday, M. A. K. (1967b). Notes on transitivity and theme in English, part II. Journal of
Linguistics, 3(2), 199–244.
Hartig, F. (2018). Dharma: Residual diagnostics for hierarchical (multi-level / mixed)
regression models. R package version 0.2.0, URL: http://�orianhartig.github.io/
DHARMa/.
Hedberg, N., & Fadden, L. (2007). The information structure of it-clefts, wh-clefts and
reverse wh-clefts in English. In N. Hedberg, & R. Zacharski (Eds.) The Grammar-
Pragmatics Interface. Essays in Honor of Jeanette K. Gundel (Pragmatics & Beyond, 155),
(pp. 19–48). Amsterdam: John Benjamins.
Heldner, M. (2001). Spectral emphasis as a perceptual cue to prominence. TMH-QPSR,
42(1), 51–57.
Heldner, M. (2003). On the reliability of overall intensity and spectral emphasis as acous-
tic correlates of focal accents in Swedish. Journal of Phonetics, 31(1), 39–62.
Heldner, M., & Strangert, E. (1997). To what extent is perceived focus determined by
f 0-cues? In Proceedings of the 5th European Conference on Speech Communication and
Technology (Eurospeech - 1997), (pp. 875–877). Rhodes, Greece.
Hellmuth, S. (2007). The relationship between prosodic structure and pitch accent dis-
tribution: Evidence from Egyptian Arabic. The Linguistic Review, 24(2), 289–214.
Heylen, D. (2008). ListeningHeads. In I.Wachsmuth, &G. Knoblich (Eds.)Modeling Com-
munication with Robots and Virtual Humans, (pp. 241–259). Berlin/Heidelberg/New
York: Springer-Verlag.
Hirschberg, J. (1993). Pitch accent in context predicting intonational prominence from
text. Arti�cial Intelligence, 63(1-2), 305–340.
Hockett, C. F. (1958). A Course in Modern Linguistics. New York: Macmillan.
406

Bibliography
Hoetjes, M., Krahmer, E., & Swerts, M. (2014). Does our speech change when we cannot
gesture? Speech Communication, 57 , 257–267.
Hostetter, A. B., & Alibali, M. W. (2007). Raise your hand if you’re spatial: Relations
between verbal and spatial skills and gesture production. Gesture, 7 (1), 73–95.
House, D., Beskow, J., & Granström, B. (2001). Timing and interaction of visual cues for
prominence in audiovisual speech perception. In Proceedings of the Annual Conference
of the International Speech Communication Association, INTERSPEECH - 2001, (pp. 387–
390). Aalborg, Denmark.
Hualde, J. I. (2002). Intonation in Romance: Introduction to the special issue. Probus,
14(1), 1–7.
Hurvich, C., & Tsai, C.-L. (1989). Regression and time series model selection in small
samples. Biometrica, 76(2), 297–293.
Huss, V. (1975). Neutralisierung englischer Akzentunterschiede in der Nachkontur
[Neutralisation of English stress contrasts in post-nuclear position]. Phonetica, 32,
278–291.
Huss, V. (1978). Englishword stress in the post-nuclear position. Phonetica, 35(2), 86–105.
Hutka, S., Bidelman, G. M., & Moreno, S. (2015). Pitch expertise is not created equal:
Cross-domain e�ects of musicianship and tone language experience on neural and
behavioural discrimination of speech and music. Neuropsychologia, 71, 52–63.
Igualada, A., Bosch, L., & Prieto, P. (2015). Language development at 18 months is related
to multimodal communicative strategies at 12 months. Infant Behavior and Develop-
ment, 39, 42–52.
Irwin, J. R., Whalen, D. H., & Fowler, C. A. (2006). A sex di�erence in visual in�uence on
heard speech. Perception and Psychophysics, 68(4), 582–592.
407

Bibliography
Isenberg, D., & Gay, T. (1978). Acoustic correlates of perceived stress in an isolated
synthetic disyllable. Journal of the Acoustical Society of America, 64(S21).
Ishi, C. T., Ishiguro, H., &Hagita, N. (2014). Analysis of relationship between headmotion
events and speech in dialogue conversation. Speech Communication, 57 , 233–243.
Iverson, J. M., & Goldin-Meadow, S. (2005). Gesture paves the way for language devel-
opment. Psychological Science, 16(5), 367–371.
Iverson, J. M., & Thelen, E. (1999). Hand, mouth and brain: The dynamic emergence of
speech and gesture. Journal of Consciousness Studies, 6(11-12), 19–40.
Jack, R. E., Garrod, O. G., Yu, H., Caldara, R., & Schyns, P. G. (2012). Facial expressions of
emotion are not culturally universal. Proceedings of the National Academy of Sciences
of the United States of America, 109(19), 7241–7244.
Jackendo�, R. (1972). Semantic Interpretation in Generative Grammar . Cambridge, MA:
MIT Press.
Jaeger, J. J., Lockwood, A. H., van Valin, R. D., Kemmerer, D. L., Murphy, B. W., & Wack,
D. S. (1998). Sex di�erences in brain regions activated by grammatical and reading
tasks. NeuroReport, 9(12), 2803–2807.
Jaeger, T. F. (2008). Categorical data analysis: Away from ANOVAs (transformation or
not) and towards logit mixed models. Archives of General Psychiatry, 59(4), 434—446.
Jannedy, S., & Mendoza-Denton, N. (2005). Structuring information through gesture and
intonation. Interdisciplinary Studies on Information Structure, 3, 199–244.
Jiménez-Bravo, M., & Marrero, V. (submitted). Multimodal perception of acoustic prom-
inence in Spanish: A methodological proposal. Speech Communication.
Johnson, F. M., Hicks, L. H., Goldberg, T., , & Myslobodsky, M. S. (1988). Sex di�erences
in lipreading. Bulletin of the Psychonomic Society, 26(2), 106–108.
408

Bibliography
Jong, K. d. (1994). Initial tones and prominence in Seoul Korean. Ohio State University
Working Papers in Linguistics, 43, 1–14.
Jun, S.-A. (2005). Korean intonational phonology and prosodic transcription. In S.-A.
Jun (Ed.) Prosodic Typology: The Phonology of Intonation and Phrasing, (pp. 201–229).
Oxford: Oxford University Press.
Jun, S.-A., & Lee, H.-J. (1998). Phonetic and phonological markers of contrastive focus
in Korean. In Proceedings of the 5th International Conference on Spoken Language Pro-
cessing (ICSLP 98), (pp. 1295–1298). Sydney, Australia.
Jurafsky, D., Bell, A., Gregory, M., & Raymond, W. D. (2001). Probabilistic relations
between words: Evidence from reduction in lexical production. In J. L. Bybee, & P. J.
Hopper (Eds.) Frequency and the Emergence of Linguistic Structure (Typological Studies
in Language, 45), (pp. 229–254). Amsterdam: John Benjamins.
Kakouros, S. (2017). Cognitive and probabilistic basis of prominence perception in speech.
Ph.D. thesis, School of Electrical Engineering, Aalto University.
Kakouros, S., & Räsänen, O. (2015). Automatic detection of sentence prominence in
speech using predictability of word-level acoustic features. In Proceedings of the An-
nual Conference of the International Speech Communication Association, INTERSPEECH
- 2015, (p. 568–572). Dresden, Germany.
Karpiński, M., Jarmołowicz-Nowikow, E., & Malisz, Z. (2009). Aspects of gestural and
prosodic structure of multimodal utterances in Polish task-oriented dialogues. Speech
and Language Technology, 11, 113–122.
Kendon, A. (1972). Some relationships between body motion and speech: An analysis
of an example. In A. W. Siegman, & B. Pope (Eds.) Studies in Dyadic Communication,
(pp. 177–210). New York: Pergamon.
409

Bibliography
Kendon, A. (1980). Gesticulation and speech: Two aspects of the process of utterance.
In M. R. Key (Ed.) The Relationship of Verbal and Nonverbal Communication, (pp. 207–
227). The Hague: Mouton.
Kendon, A. (1982). Coordination and framing in face-to-face interaction. In M. Davis
(Ed.) Interaction Rhythms, (pp. 351–363). New York: Human Sciences Press.
Kendon, A. (1988). How gestures can become likewords. In F. Poyatos (Ed.)Cross-cultural
perspectives in nonverbal communication, (pp. 133–141). Toronto: Hogrefe.
Kendon, A. (2004). Gesture: Visible Action as Utterance. Cambridge: Cambridge Univer-
sity Press.
Kießling, A., Kompe, R., Batliner, A., Niemann, H., & Nöth, E. (1996). Classi�cationn of
boundaries and accents in spontaneous speech. In Proceedings of the CRIM/FORWISS
Workshop, (pp. 104–113). Montreal.
Kim, J., Cvejić, E., & Davis, C. (2014). Tracking eyebrows and head gestures associated
with spoken prosody. Speech Communication, 57 , 317–330.
Kimbara, I. (2006). On gestural mimicry. Gesture, 6(1), 36–61.
Kipp, M. (2003). Gesture Generation by Imitation: From Human Behavior to Computer
Character Animation. Ph.D. thesis, Saarland University.
Kita, S. (1993). Language and thought interface: A study of spontaneous gestures and
Japanese mimetics. Ph.D. thesis, University of Chicago.
Kita, S. (2000). How representational gestures help speaking. In D. McNeill (Ed.) Lan-
guage and Gesture, (pp. 162–185). Cambridge: Cambridge University Press.
Kita, S. (2009). Cross-cultural variation of speech-accompanying gesture: A review. Lan-
guage and Cognitive Processes, 24(2), 145–167.
410

Bibliography
Kita, S., & Davies, T. S. (2009). Competing conceptual representations trigger co-speech
representational gestures. Language and Cognitive Processes, 24(5), 795–804.
Kita, S., van Gijn, I., & van der Hulst, H. (1998). Movement phases in signs and co-speech
gestures, and their transcription by human coders. In I. Wachsmuth, & M. Fröhlich
(Eds.) Gesture and Sign Language in Human-Computer Interaction, (pp. 23–35). Ber-
lin/Heidelberg/New York: Springer-Verlag.
Klatt, D. H. (1973). Discrimination of fundamental frequency contours in synthetic
speech: Implications for models of pitch perception. Journal of the Acoustical Soci-
ety of America, 53(1), 8–16.
Kochanski, G., Grabe, E., Coleman, J., & Rosner, B. (2005). Loudness predicts prominence:
Fundamental frequency lends little. Journal of the Acoustical Society of America, 118(2),
1038—1054.
Kohler, K. J. (1991). Amodel of German intonation. In K. J. Kohler (Ed.) Studies in German
Intonation, (pp. 295–360). Kiel: IPDS.
Kohler, K. J. (2003). Neglected categories in the modelling of prosody pitch timing and
non-pitch accents. In Proceedings of the 15th International Congress of Phonetic Sciences
(ICPhS03), (pp. 2925–2928). Barcelona, Spain.
Kohler, K. J. (2005). Form and function of non-pitch accents. In K. J. Kohler, F. Kleber, &
P. Benno (Eds.) AIPUK , vol. 35a, (pp. 97–123). Kiel: IPDS.
Kohler, K. J. (2006). Paradigms in experimental prosodic analysis: From measurement to
function. In S. e. Sudho� (Ed.) Methods of Empirical Prosody Research, (pp. 123–152).
Berlin/New York: De Gruyter.
Kohler, K. J. (2008). The perception of prominence patterns. Phonetica, 65(4), 257–269.
Kohler, K. J. (2012). The perception of lexical stress in German: E�ects of segmental
duration and vowel quality in di�erent prosodic patterns. Phonetica, 69(1), 1–26.
411

Bibliography
Kohler, K. J., Pätzold, M., & P., S. A. (1997). The Kiel corpus of read/spontaneous speech
– Acoustic data base, processing tool and analysis results. From the acoustic data
collection to a labelled speech data bank of spoken standard German. In A. P. Simpson,
K. J. Kohler, & T. Rettstadt (Eds.) AIPUK , vol. 32, (pp. 97–123). Kiel: IPDS.
Kok, K., Bergmann, K., Cienki, A., & Kopp, S. (2016). Mapping out the multifunctionality
of speakers’ gestures. Gesture, 15(1), 37–59.
Krahmer, E., Ruttkay, Z., Swerts, M., & Wesselink, W. (2002a). Pitch, eyebrows and the
perception of focus. In Proceedings of the 1st International Conference on Speech Prosody
(SP2002), (pp. 443–446). Aix-en-Provence, France.
Krahmer, E., Ruttkay, Z., Swerts, M., & Wesselink, W. (2002b). Perceptual evaluation of
audiovisual cues for prominence. In Proceedings of the Annual Conference of the In-
ternational Speech Communication Association, INTERSPEECH - 2002, (pp. 1933–1936).
Denver, USA.
Krahmer, E., & Swerts, M. (2004). More about brows: A cross-linguistic analysis-by-
synthesis study. In Z. Ruttkay, & C. Pelachaud (Eds.) From brows to trust: Evaluating
Embodied Conversational Agents. Human-Computer Interaction Series, No. 7 , (pp. 191–
216). Dordrecht: Kluwer Academic Publishers.
Krahmer, E., & Swerts, M. (2007). The e�ects of visual beats on prosodic prominence:
Acoustic analyses, auditory perception and visual perception. Journal of Memory and
Language, 57 (3), 396–414.
Krahmer, E., & Swerts, M. (2009). Audiovisual prosody–Introduction to the special issue.
Language and Speech, 52(2-3), 129–133.
Krauss, R. M., & Hadar, U. (1999). The role of speech-related arm/hand gestures in word
retrieval. In R. N. Campbell, & L. Messing (Eds.)Gesture, Speech, and Sign, (pp. 93–116).
Oxford: Oxford University Press.
412

Bibliography
Krivokapić, J., Tiede, M. K., & Tyrone, M. E. (2015). A kinematic analysis of prosodic
structure in speech and manual gestures. In Proceedings of the 18th International Con-
gress of Phonetic Sciences (ICPhS15), (pp. 1240–1244). Glasgow, UK: University of Glas-
gow.
Krivokapić, J., Tiede, M. K., & Tyrone, M. E. (2017). A kinematic study of prosodic struc-
ture in articulatory and manual gestures: Results from a novel method of data collec-
tion. Laboratory Phonology, 8(1), 1–26.
Krivokapić, J., Tiede, M. K., Tyrone, M. E., & Goldenberg, D. (2016). Speech and manual
gesture coordination in a pointing task. In Proceedings of the 8th International Confer-
ence on Speech Prosody (SP2016), (pp. 1240–1244). Boston, USA.
Kruij�-Korbayová, I., & Steedman, M. (2003). Discourse and information structure.
Journal of Logic, Language and Information, 12(3), 249–259.
Kullback, S., & Leibler, R. A. (1951). On information and su�ciency. Annals of Mathem-
atical Statistics, 22(1), 79–86.
Kushch, O., & Prieto Vives, P. (2016). The e�ects of pitch accentuation and beat gestures
on information recall in contrastive discourse. In Proceedings of the 8th International
Conference on Speech Prosody (SP2016), (pp. 922–925). Boston, USA.
Laan, G. P. M. (1997). The contribution of intonation, segmental durations, and spec-
tral features to the perception of a spontaneous and a read speaking style. Speech
Communication, 2(1), 43–65.
Labov, W. (1968). The re�ection of social processes in linguistic structures. In J. A. Fish-
man (Ed.) Readings in the Sociology of Language, (pp. 240–251). The Hague: Mouton.
Ladd, D. R. (2008). Intonational phonology. Cambridge, MA: Cambridge University Press,
2nd ed.
413

Bibliography
Ladefoged, P., Draper, M. H., & Whitteridge, D. (1958). Syllables and stress. In Miscel-
lanea Phonetica III , (pp. 1–14). London: International Phonetic Association, University
College.
Lea, W. A. (1977). Acoustic correlates of stress and juncture. In L. M. Hyman (Ed.)
Studies in stress and accent. Southern California Occasional Papers in Linguistics, 4, (pp.
83–119). Los Angeles, CA: University of southern California.
Lea, W. A. (1980). Prosodic aids to speech recognition. InW. A. Lea (Ed.) Trends in Speech
Recognition, (pp. 83–119). New Jersey: Prentice Hall.
Lee, H., &Noppeney, U. (2011). Long-termmusic training tunes how the brain temporally
binds signals from multiple senses. Proceedings of the National Academy of Sciences of
the United States of America, 108(51), E1441–E1450.
Lehiste, I., & Peterson, G. E. (1959). Vowel amplitude and phonemic stress in American
English. Journal of the Acoustical Society of America, 31(4), 428–435.
Leonard, T., & Cummins, F. (2010). The temporal relation between beat gestures and
speech. Language and Cognitive Processes, 26(10), 1457–1471.
Leonetti, M., & Escandell-Vidal, V. (2009). Fronting and verum focus in spanish. In
A. Dufter, & D. Jacob (Eds.) Focus and Background in Romance Languages (Studies in
Language Companion Series, 112), (pp. 155–204). Amsterdam: John Benjamins.
Levelt, W. J. M. (1989). Speaking: From intention to articulation. Cambridge, MA: MIT
Press.
Levelt, W. J. M., Richardson, G., & La Heij, W. (1985). Pointing and voicing in deictic
expressions. Journal of Memory and Language, 24(2), 133–164.
Levy, R. P., & Jaeger, T. F. (2007). Speakers optimize information density through syn-
tactic reduction. In B. Schölkopf, J. C. Platt, & T. Ho�man (Eds.) Advances in Neural
Information Processing Systems, (pp. 849–856). Cambridge, MA: MIT Press.
414

Bibliography
Lewis, F., Butler, A., & Gilbert, L. (2011). A uni�ed approach to model selection using
the likelihood ratio test. Methods in Ecology and Evolution, 2(2), 155–162.
Liang, C., Earl, B., Thompson, I., Whitaker, K., Cahn, S., Xiang, J., Fu, Q.-J., & Zhang,
F. (2016). Musicians are better than non-musicians in frequency change detection:
Behavioral and electrophysiological evidence. Frontiers in Neuroscience, 10:464.
Liberman, A. M., & Prince, A. (1977). On stress and linguistic rhythm. Linguistic Inquiry,
8, 249–336.
Liberman, M. (1979). The intonational system of English. New York: Garland Press.
Lieberman, P. (1960). Some acoustic correlates of word stress in American English.
Journal of the Acoustical Society of America, 32(4), 451–454.
Llisterri, J., a, M. J., de la Mota, C., Riera, M., & Ríos, A. (2003b). The perception of lexical
stress in Spanish. In Proceedings of the 15th International Congress of Phonetic Sciences
(ICPhS03), (pp. 2023–26). Barcelona, Spain.
Llisterri, J., Machuca, M. J., de la Mota, C., Riera, M., & Ríos, A. (2003a). Algunas cues-
tiones en torno al desplazamiento acentual en español. In E. Z. Herrera, & P. Martín
Butragueño (Eds.) La tonía. Dimensiones fonéticas y fonológicas, (pp. 163–185). Ciudad
de México: Colegio de México.
Llisterri, J., Machuca, M. J., de la Mota, C., Riera, M., & Ríos, A. (2005). La percepción del
acento léxico en español. In Filología y lingüística. Estudios ofrecidos a Antonio Quilis,
vol. 1, (pp. 271–297). Madrid: CSIC - UNED - Universidad de Valladolid.
Llisterri, J., Machuca, M. J., Ríos, A., & Schwab, S. (2016). La percepción del acento léxico
en un contexto oracional. Loquens, 3(2), e033.
Loehr, D. (2007). Aspects of rhythm in gesture and speech. Gesture, 7 (2), 179–214.
Loehr, D. P. (2004). Gesture and Intonation. Ph.D. thesis, Georgetown University.
415

Bibliography
Loehr, D. P. (2012). Temporal, structural, and pragmatic synchrony between intonation
and gesture. Laboratory Phonology, 3(1), 71–89.
Loftus, E. F., Miller, D. G., & Burns, H. J. (1978). Semantic integration of verbal informa-
tion into a visual memory. Journal of Experimental Psychology, 4(1), 19–31.
Lunn, D. J., Thomas, A., Best, N., & Spiegelhalter, D. (2000). WinBUGS - A Bayesian mod-
elling framework: Concepts, structure, and extensibility. Statistics and Computing,
10(4), 325–337. Computer program. URL: https://www.mrc-bsu.cam.ac.uk/software/
bugs/the-bugs-project-winbugs/.
Mahrt, T., Cole, J., Fleck, M., & Hasegawa-Johnson, M. (2012). F0 and the perception
of prominence. In Proceedings of the Annual Conference of the International Speech
Communication Association, INTERSPEECH - 2012, (pp. 2421–2424). Portland, USA.
Mahrt, T., Huang, J.-T., Mo, Y., Fleck, M., Hasegawa-Johnson, M., & Cole, J. (2011). Op-
timal models of prosodic prominence using the Bayesian information criterion. In
Proceedings of the Annual Conference of the International Speech Communication Asso-
ciation, INTERSPEECH - 2011, (pp. 2037–2040). Florence, Italy.
Mallery, G. (1881). Sign language among North American Indians compared with that
among other peoples and deaf mutes. In First Annual Report of the Bureau of Ethnology
to the Secretary of the Smithsonian Institution, 1879-1880, (pp. 263–552). Washington:
Government Printing O�ce.
Manolescu, A., Olson, D., & Ortega-Llebaria, M. (2009). Cues to contrastive focus in
Romanian. In M. Vigário, S. Frota, & M. J. Freitas (Eds.) Phonetics and Phonology:
Interactions and Interrelations. Current Issues in Linguistic Theory, vol. 306, (pp. 71–
90). Amsterdam: John Benjamins.
Martínez Amador, E. M. (1954). Diccionario gramatical. Barcelona: Ramón Sopena.
416

Bibliography
Masson-Carro, I., Goudbeek, M., & Krahmer, E. (2017). How what we see and what
we know in�uence iconic gesture production. Journal of Nonverbal Behavior , 41(4),
367–394.
Mazerolle, M. J. (2017). AICcmodavg: Model selection and multimodel inference based
on (Q)AIC(c). R package version 2.1-1, URL: https://cran.r-project.org/package=
AICcmodavg.
McClave, E. (1991). Intonation and Gesture. Ph.D. thesis, Georgetown University.
McClave, E. (1994). Gestural beats: The rhythm hypothesis. Journal of Psycholinguistic
Research, 23(1), 45–66.
McClave, E. (1998). Pitch and manual gestures. Journal of Psycholinguistic Research,
27 (1), 69–89.
McClave, E. (2000). Linguistic functions of head movements in the context of speech.
Journal of Pragmatics, 32(7), 855–878.
McGurk, H., & MacDonald, J. (1976). Hearing lips and seeing voices. Nature, 264, 746–
748.
McNeill, D. (1985). So you think gestures are nonverbal? Psychological Review, 92(3),
350–371.
McNeill, D. (1992). Hand and Mind: What Gestures Reveal about Thought. Chicago:
University of Chicago Press.
McNeill, D. (2000). Introduction. In D. McNeill (Ed.) Language and Gesture, (pp. 1–10).
Cambridge: Cambridge University Press.
McNeill, D. (2005). Gesture and Thought. Chicago: University Chicago Press.
McNeill, D. (2012). How Language Began. Cambridge, MA: Cambridge University Press.
417
Bibliography
McQuown, N. A. (1971). The Natural History of an Interview. Chicago: University of
Chicago Library.
Meister, I. G., Boroojerdi, B., Foltys, H., Sparing, R., Huber, W., & Töpper, R. (2003).
Motor cortex hand area and speech: Implications for the development of language.
Neuropsychologia, 41(4), 401–406.
Mirković, J., & Gaskell, M. G. (2016). Does sleep improve your grammar? Preferential
consolidation of arbitrary components of new linguistic knowledge. PLoS ONE, 11(4),
e0152489.
Mittelberg, I., & Evola, V. (2013). Iconic and representational gestures. In C. Müller,
A. Cienki, E. Fricke, S. H. Ladewig, D. McNeill, & J. Bressem (Eds.) Body – Language
– Communication. An International Handbook on Multimodality in Human Interac-
tion (Handbooks of Linguistics and Communication Science 38.2.), (pp. 1732–1746). Ber-
lin/Boston: De Gruyter.
Mixdor�, H. (1998). Intonation Patterns of German - Model-based. Quantitative Analysis
and Synthesis of F0-Contours. Ph.D. thesis, TU Dresden.
Mixdor�, H., & Widera, C. (2001). Perceived prominence in terms of a linguistically
motivated quantitative intonation model. In Proceedings of the Annual Conference of
the International Speech Communication Association, INTERSPEECH - 2001, (pp. 403–
406). Aalborg, Denmark.
Mo, Y. (2008a). Acoustic correlates of prosodic prominence for naïve listeners of Amer-
ican English. Annual Meeting of the Berkeley Linguistics Society, 34(1), 257–267.
Mo, Y. (2008b). Duration and intensity as perceptual cues for naïve listeners’ prominence
and boundary perception. In Proceedings of the 4th International Conference on Speech
Prosody (SP2008), (pp. 739–742). Campinas, Brazil.
418
Bibliography
Mo, Y., Cole, J., & Lee, E.-K. (2008). Naïve listeners’ prominence and boundary perception.
In Proceedings of the 4th International Conference on Speech Prosody (SP2008), (pp. 735–
738). Campinas, Brazil.
Mol, H. C., & Uhlenbeck, G. M. (1956). The linguistic relevance of intensity in stress.
Lingua, 5, 205–213.
Mol, L., Krahmer, E., Maes, A., & Swerts, M. (2012). Adaptation in gesture: Converging
hands or converging minds? Journal of Memory and Language, 66(1), 249–264.
Montgomery, K. J., Isenberg, N., & Haxby, J. V. (2007). Communicative hand gestures and
object-directed hand movements activated the mirror neuron system. Social Cognitive
and A�ective Neuroscience, 2(2), 114–122.
Morrel-Samuels, P., & Krauss, R. M. (1992). Word familiarity predicts temporal asyn-
chrony of hand gestures and speech. Journal of Experimental Psychology: Human
Learning and Memory, 18(3), 615–622.
Morton, J., & Jassem, W. (1965). Acoustic correlates of stress. Language and Speech, 8(3),
159–181.
Mukamel, R., Ekstrom, A. D., Kaplan, J., Iacoboni, M., & Fried, I. (2010). Single-neuron
responses in humans during execution and observation of actions. Current Biology,
20(8), 750–756.
Munhall, K. G., Jones, J. A., Callan, D. E., Kuratate, T., & Vatikiotis-Bateson, E. (2004).
Visual prosody and speech intelligibility. Psychological Science, 15(2), 133–137.
Nakano, Y. I., Reinstein, G., Stocky, T., & Cassell, J. (2003). Towards a model of face-to-
face grounding. In Proceedings of the Annual Meeting of the Association for Computa-
tional Linguistics (ACL), (pp. 354–365). Sapporo, Japan.
Nakatani, L., & Aston, C. (1978). Perceiving stress patterns of words in sentences. Journal
of the Acoustical Society of America, 63, S55.
419

Bibliography
Navarro Tomás, T. (1918). Manual de pronunciación española. Madrid: RFE.
Navarro Tomás, T. (1944). Manual de entonación española. New York: Hispanic Institute
in the United States.
Navarro Tomás, T. (1964). La medida de la intensidad. Boletín del Instituto de Filología de
la Universidad de Chile, 16, 231–235.
Nenkova, A., Brenier, J., Kothari, A., Calhoun, S., Whitton, L., Beaver, D., & Jurafsky, D.
(2007). To Memorize or to Predict: Prominence Labeling in Conversational Speech. In
Human Language Technology Conference of the North American Chapter of the associ-
ation of Computational Linguistics, (pp. 9–16). Rochester, NY, USA.
Nobe, S. (1996). Representational gestures, cognitive rhythms, and acoustic aspects of
speech: A network/threshold model of gesture production. Ph.D. thesis, University of
Chicago.
Noland, C. (2009). Agency and Embodiment. Performing Gestures/Producing Culture. Cam-
bridge, MA: Harvard University Press.
Nooteboom, S. G., & Kruyt, J. G. (1987). Accents, focus distribution, and the perceived
distribution of given and new information: An experiment. Journal of the Acoustical
Society of America, 82(2), 1512–1524.
Novack, M. A., & Goldin-Meadow, S. (2017). Gesture as Representational Action: A paper
about function. Psychonomic Bulletin and Review, 24(3), 652–665.
Öhrström, N., & Traunmüller, H. (2004). Audiovisual perception of Swedish vowels with
and without con�icting cues. In P. Branderud, & H. Traunmüller (Eds.) Proceedings of
FONETIK 2004: The 17th Swedish Phonetics Conference, (pp. 40–43). Dept. of Linguistics,
Stockholm University.
420

Bibliography
Ortega-Llebaria, M. (2006). Phonetic cues to stress and accent in Spanish. In M. Díaz-
Campos (Ed.) Selected Proceedings of the 2nd Conference on Laboratory Approaches to
Spanish Phonology, (pp. 104–118). Somerville, USA: Cascadilla Press.
Ortega-Llebaria, M., & Prieto, P. (2007). Disentangling stress from accent in Spanish:
Production patterns of the stress contrast in deaccented syllables. In P. Prieto, J. Mas-
caró, & M.-J. Solé (Eds.) Segmental and Prosodic Issues in Romance Phonology (Current
Issues in Linguistic Theory, 282), (pp. 155–176). Amsterdam: John Benjamins.
Ortega-Llebaria, M., & Prieto, P. (2009). Perception of word stress in Castilian Spanish.
In M. Vigário, S. Frota, & M. J. Freitas (Eds.) Phonetics and Phonology: Interactions and
interrelations, (pp. 35–50). Amsterdam: John Benjamins.
Ortega-Llebaria, M., & Prieto, P. (2011). Acoustic correlates of stress in central Catalan
and Castilian Spanish. Language and Speech, 54(1), 73–97.
Ortega-Llebaria, M., Prieto, P., & Vanrell, M. (2007). Perceptual evidence for direct acous-
tic correlates of stress in Spanish. In Proceedings of the 16th International Congress of
Phonetic Sciences (ICPhS07), (pp. 1121–1124). Saarbrücken, Germany.
Özyürek, A., Kita, S., Allen, S., Furman, R., & Brown, A. (2005). How does linguistic fram-
ing of events in�uence co-speech gestures? Insights from cross-linguistic variations
and similarities. Gesture, 5(1-2), 219–240.
Özyürek, A., Willems, R. M., Kita, S., & Hagoort, P. (2007). On-line integration of se-
mantic information from speech and gesture: insights from event-related brain po-
tentials. Journal of Cognitive Neuroscience, 19(4), 605–616.
Pamies, A. (1994). Acento, ritmo y lenguaje. Ph.D. thesis, Universidad de Granada.
Pamies, A. (1997). Consideraciones sobre la marca acústica del acento fonológico. Estu-
dios de Fonética Experimental, 8, 11–50.
421

Bibliography
Pamies, A. (2003). The relation between stress and tonal peaks. In Proceedings of the
15th International Congress of Phonetic Sciences (ICPhS03), (pp. 2013–2034). Barcelona,
Spain.
Pamies, A., Fernández, A. M., Martínez, E., Ortega, A., & Amorós, M. C. (2002). Umbrales
tonales en el español peninsular. In J. Díaz García (Ed.)Actas del II Congreso de Fonética
Experimental, (pp. 272–278). Sevilla, Spain.
Paraskevopoulos, E., Kuchenbuch, A., S.C., H., & Pantev, C. (2012). Musical expertise in-
duces audiovisual integration of abstract congruency rules. Clinical Neurophysiology,
32(50), 18196–18203.
Parbery-Clark, A., Skoe, E., Lam, C., & Kraus, N. (2009). Musician enhancement for
speech-in-noise. Ear and Hearing, 30(6), 653–661.
Parrell, B., Goldstein, L., Lee, S., & Byrd, D. (2014). Spatiotemporal coupling between
speech and manual motor actions. Journal of Phonetics, 42, 1–11.
Patel, A. D., Peretz, I., Tramo, M., & Labrecque, R. (1998). Processing prosodic and music
patterns: A neuropsychological investigation. Brain and Language, 61(1), 123–144.
Pelachaud, C., Badler, N., & Steedman, M. (1996). Generating facial expressions for
speech. Cognitive Science, 20(1), 1–46.
Peters, B. (2005). The database – the Kiel corpus of spontaneous speech. In K. J. Kohler,
F. Kleber, & P. Benno (Eds.) AIPUK , vol. 35a, (pp. 1–6). Kiel: IPDS.
Pierrehumbert, J. B. (1979). The perception of fundamental frequency declination.
Journal of the Acoustical Society of America, 62(2), 363–369.
Pierrehumbert, J. B. (1980). The phonology and phonetics of English intonation. Ph.D.
thesis, Massachusetts Institute of Technology.
Pierrehumbert, J. B., & Beckman, M. E. (1988). Japanese Tone Structure. Cambridge, MA:
MIT Press.
422

Bibliography
Pika, S., Liebal, K., Call, J., & Tomasello, M. (2007). The gestural communication of
apes. In K. Liebal, C. Müller, & S. Pika (Eds.) Gestural Communication in Nonhuman
and Human Primates (Benjamins Current Topics, 10), (pp. 35–49). Amsterdam: John
Benjamins.
Pike, L. (1945). The intonation of American English. Ann Arbor, MI: University of
Michigan Press.
Pitt, M., Dilley, L., Johnson, K., Kiesling, S., Raymond, W., Hume, E., & Fosler-Lussier, E.
(2007). Buckeye Corpus of Conversational Speech (2nd release). Columbus: Department
of Psychology, Ohio State University (Distributor). URL: https://www.buckeyecorpus.
osu.edu.
Plummer, M. (2003). JAGS: A program for analysis of Bayesian graphical models us-
ing Gibbs sampling. In Proceedings of the 3rd International Workshop on Distrib-
uted Statistical Computing (DSC - 2003). Vienna, Austria. Computer program. URL:
https://www.http://mcmc-jags.sourceforge.net/.
Pluymaekers, M., Ernestus, M., & Baayen, R. H. (2005). Lexical frequency and acoustic
reduction in spoken Dutch. Journal of the Acoustical Society of America, 118(4), 2561–
2569.
Portele, T., & Heuft, B. (1997). Towards a prominence-based synthesis system. Speech
Communication, 21(1), 61–72.
Potisuk, S., Gandour, J., & Harper, M. (1996). Acoustic correlates of stress in Thai. Phon-
etica, 53(4), 200–220.
Powell, M. J. D. (2009). The BOBYQA algorithm for bound constrained optimization
without derivatives. Department of Applied Mathematics and Theoretical Physics, Cam-
bridge England, technical report NA2009/06.
423

Bibliography
Prieto, P., D’Imperio, M., & Gili-Fivela, B. (2005). Pitch accent alignment in romance:
Primary and secondary associations with metrical structure. Language and Speech,
48(4), 359–396.
Prieto, P., & Ortega-Llebaria, M. (2006). Stress and accent in Catalan and Spanish: Pat-
terns of duration, vowel quality, overall intensity, and spectral balance. In Proceedings
of the 3rd International Conference on Speech Prosody (SP2006), (pp. 337–340). Dresden,
Germany.
Prieto, P., & Ortega-Llebaria, M. (2009). Do complex pitch gestures induce syllable
lengthening in Catalan and Spanish? In M. Vigário, S. Frota, & M. J. Freitas (Eds.)
Phonetics and Phonology: Interactions and Interrelations (Current Issues in Linguistic
Theory, 306), (pp. 51–70). Amsterdam: John Benjamins.
Prieto, P., Puglesi, C., Borràs-Comes, J., Arroyo, E., & Blat, J. (2011). Crossmodal pros-
odic and gestural contribution to the perception of contrastive focus. In Proceedings
of the Annual Conference of the International Speech Communication Association, IN-
TERSPEECH - 2011, (pp. 977–980). Florence, Italy.
Prieto, P., Puglesi, C., Borràs-Comes, J., Arroyo, E., & Blat, J. (2015). Exploring the con-
tribution of prosody and gesture to the perception of focus using an animated agent.
Journal of Phonetics, 49, 41–54.
Prieto, P., Vanrell, M. d. M., Astruc, L., Payne, E., & Post, B. (2012). Phonotactic and
phrasal properties of speech rhythm: Evidence from Catalan, English, and Spanish.
Speech Communication, 54(6), 681–702.
Prince, A., & Smolensky, P. (1993). Optimality theory: Constraint interaction in gener-
ative grammar. Rutgers Center for Cognitive Science Technical Report TR-2.
Prince, E. F. (1981). Topicalization, focus-movement, and Yiddish-movement: A prag-
matic di�erentiation. In Proceedings of the 7th Annual Meeting of the Berkeley Linguist-
ics Society, (pp. 249–264). Berkeley, USA.
424

Bibliography
Proverbio, A. M., Massetti, G., Rizzi, E., & Zani, A. (2016). Skilled musicians are not
subject to the McGurk e�ect. Scienti�c Repots, 6, 30423.
Quak, M., London, R. E., & Talsma, D. (2015). A multisensory perspective of working
memory. Frontiers in Human Neuroscience, 9:197 .
Quené, H. (2008). Multilevel modeling of between-speaker and within-speaker variation
in spontaneous speech tempo. Journal of the Acoustical Society of America, 123(2),
1103–1113.
Quené, H., & Kager, R. (1993). Prosodic sentence analysis without exhaustive parsing.
In V. J. van Heuven, & L. C. W. Pols (Eds.) Analysis and synthesis of speech: Stra-
tegic research towards high-quality TTS generation, (pp. 115–130). Berlin/New York:
De Gruyter.
Quené, H., & van den Bergh, H. (2008). Examples of mixed-e�ects modeling with crossed
random e�ects and with binomial data. Journal of Memory and Language, 59(4), 413—
425.
Quilis, A. (1965). Phonologie de la quantité en espagnol. Phonetica, 13, 82–85.
Quilis, A. (1971). Caracterización fonética del acento español. Travaux de Linguistique
et de Littérature, 9, 53–72.
Quilis, A. (1981). Fonética acústica de la lengua española. Madrid: Gredos.
Quilis, A., & Esgueva, M. (1983). Realización de los fonemas vocálicos españoles en
posición fonética normal. In M. Esgueva, & M. Cantarero (Eds.) Estudios de Fonética
I , (pp. 159–252). Madrid: Consejo Superior de Investigaciones Cientí�cas (CSIC).
R Development Core Team (2018). R: A language and environment for statistical comput-
ing. R Foundation for Statistical Computing, Vienna, Austria. Computer program.
Version 3.5.1 retrieved 2 July 2018 from https://www.R-project.org/.
425

Bibliography
Ramus, F., Nespor, M., & Mehler, J. (1999). Correlates of linguistic rhythm in the speech
signal. Cognition, 73(3), 265–292.
Real Academia Española (1959). Gramática de la lengua española. Madrid: Espasa-Calpe.
Ricci Bitti, P. E. (2013). Facial expression and social interaction. In C. Müller, A. Cienki,
E. Fricke, S. H. Ladewig, D. McNeill, & J. Bressem (Eds.) Body – Language – Communi-
cation. An International Handbook on Multimodality in Human Interaction (Handbooks
of Linguistics and Communication Science 38.2.), (pp. 1342–1349). Berlin/Boston: De
Gruyter.
Richards, S. A. (2008). Dealing with overdispersed count data in applied ecology. Journal
of Applied Ecology, 45(1), 218–227.
Rietveld, A., & Gussenhoven, C. (1985). On the relation between pitch excursion size and
prominence. Journal of Phonetics, 13(3), 299–308.
Rietveld, A., & Koopmans-van Beinum, F. (1987). Vowel reduction and stress. Speech
Communication, 6(3), 217–229.
Ríos, A. (1991). Caracterización acústica del ritmo del castellano. Trabajo de investigación
de tercer ciclo. Ph.D. thesis, Universidad Autónoma de Barcelona.
Rochet-Capellan, A., Laboissière, R., Galván, A., & Schwartz, J.-L. (2008). The speech
focus position e�ect on jaw-�nger coordination in a pointing task. Journal of Speech,
Language, and Hearing Research, 51(6), 1507–1521.
Rodríguez, C., Moreno-Núñez, A., Basilio, M., & Sosa, N. (2015). Ostensive gestures come
�rst: Their role in the beginning of shared reference. Cognitive Development. Special
Issue: Semiotic and Cognition in Human Development, 36, 142–149.
Rosenberg, A., & Hirschberg, J. (2009). Detecting pitch accents at the word, syllable and
vowel level. In Human Language Technologies – The 2009 Annual Conference of the
426

Bibliography
North American Chapter of the Association for Computational Linguistics (HLT NAACL
- 2009), (pp. 81–84). Boulder CO, USA.
Roustan, B., &Dohen, M. (2010). Co-production of contrastive prosodic focus andmanual
gestures: Temporal coordination and e�ects on the acoustic and articulatory correl-
ates of focus. In Proceedings of the 5th International Conference on Speech Prosody
(SP2010), 100110, (pp. 1–4). Chicago, USA.
RStudio Team (2016). RStudio: Integrated Development Environment for R. RStudio, Inc.,
Boston, MA. Computer program. Version 1.1.456 retrieved 19 July 2018 from http:
//www.rstudio.com/.
Rue, H., Martino, S., & Chopin, N. (2009). Approximate bayesian inference for latent
gaussian models by using integrated nested laplace approximations. Journal of the
Royal Statistical Society: Series B (Statistical Methodology), 71(2), 319–392.
Ruiz, M., & Pereira, Y. (2010). Acento léxico: tendencias de los correlatos acústicos.
Onomázein, 22(2), 43–58.
Rusiewicz, H. L. (2010). The role of prosodic stress and speech perturbation on the temporal
synchronization of speech and deictic gestures. Ph.D. thesis, University of Pittsburgh.
Ruytjens, L., Albers, F., van Dijk, P., Wit, H., & Willemsen, A. (2006). Neural responses
to silent lipreading in normal hearing male and female subjects. European Journal of
Neuroscience, 24(6), 1835–1844.
Ruytjens, L., Georgiadis, J. R., Holstege, G., Wit, H. P., Albers, F. W., & Willemsen, A. T.
(2007). Functional sex di�erences in human primary auditory cortex. European Journal
of Nuclear Medicine and Molecular Imaging, 34(12), 2073–2081.
Santerre, L., & Bothorel, A. (1969). Mesure et interprétation de la ligne d’intensité sur
les sonogrames. Travaux de l’institut de phonétique de Strasbourg, 2, 82–90.
427

Bibliography
Scarborough, R., Keating, P., Mattys, S. L., Cho, T., & Alwan, A. (2009). Optical phonetics
and visual perception of lexical and phrasal stress in English. Language and Speech,
52(2-3), 135–175.
Schafer, A., Carlson, K., Clifton Jr., C., & Frazier, L. (2000). Focus and the interpretation
of pitch accent: Disambiguating embedded questions. Language and Speech, 43(1),
75–105.
Schall, R. (1991). Estimation in generalized linear models with random e�ects. Biomet-
rika, 78(4), 719–727.
Sche�en, A. E. (1964). The Signi�cance of Posture in Communication Systems. Psychi-
atry, 27 (4), 316–331.
Scheglo�, E. A. (1984). On some gestures’ relation to talk. In J. M. Atkinson (Ed.)
Structures of Social Action: Studies in Conversation Analysis, (pp. 266–295). Cambridge:
Cambridge University Press.
Schielzeth, H., & Nakagawa, S. (2012). Nested by design: Model �tting and interpretation
in a mixed model era. Methods in Ecology and Evolution, 4(1), 14–24.
Schmerling, S. F. (1976). Aspects of English sentence stress. Austin, TX: University of
Texas Press.
Schröder, M., Cowie, R., Douglas-Cowie, E., Westerdijk, M., & Gielen, S. (2001). Acoustic
correlates of emotion dimensions in view of speech synthesis. In Proceedings of the An-
nual Conference of the International Speech Communication Association, INTERSPEECH
- 2001, (pp. 87–90). Aalborg, Denmark.
Schwarts, D. L. (1995). The emergence of abstract representations in dyad problem solv-
ing. Journal of the Learning Science, 4(3), 321–354.
Schwarzschild, R. (1999). GIVENness, AvoidF and other constraints on the placement of
accent. Natural Language Semantics, 7 (2), 141–177.
428
Bibliography
Selkirk, E. O. (1984). Phonology and syntax: the relation between sound and structure.
Cambridge, MA: MIT Press.
Sgall, P., & Hajičová, E. (1977). Focus on focus (Part I). The Prague Bulletin of Mathem-
atical Linguistics, 28, 5–54.
Sgall, P., & Hajičová, E. (1978). Focus on focus (Part II). The Prague Bulletin of Mathem-
atical Linguistics, 29, 23–41.
Shattuck-Hufnagel, S., Yasinnik, Y., Veilleux, N., & Renwick, M. (2007). A method for
studying the time alignment of gestures and prosody in American English: ’hits’ and
pitch accents in academic-lecture-style speech. In A. Esposito, M. Bratanić, E. Keller,
& M. Marinaro (Eds.) Fundamentals of Verbal and Nonverbal Communication and the
Biometric Issue, NATO Publishing Sub-Series E: Human and Societal Dynamics, vol. 18,
(pp. 1079–1098). Amsterdam: IOS Press.
Shukla, S. (1996). Śikşa:s, pra:tiśa:khyas, and the Vedic accent. In K. R. Jankowsky (Ed.)
Multiple Perspectives on the Historical Dimensions of Language, (pp. 269–279). Münster:
Nodus Publikationen.
Sievers, E. (1901). Grundzüge der Phonetik. Bibliothek indogermanischer Grammatiken 1.
Leipzig: Breitkopf und Härtel.
Silipo, R., & Greenberg, S. (1999). Automatic transcription of prosodic stress for spon-
taneous English discourse. In Proceedings of 14th International Congress of Phonetic
Sciences (ICPhS99), (pp. 2351–2354). San Francisco, USA.
Silipo, R., & Greenberg, S. (2000). Prosodic stress revisited: Reassessing the role of funda-
mental frequency. In Proceedings of the NIST Speech Transcription Workshop. College
Park, USA.
Silverman, K., Beckman, M. E., Pitrelli, J. F., Ostendorf, M., W. Wightman, C. W., Price,
P. J., Pierrehumbert, J. B., & Hirschberg, J. (1992). ToBI: A standard for labeling Eng-
429

Bibliography
lish prosody. In Proccedings of the 2nd International Conference on Spoken Language
Processing (ICSLP92), (pp. 981–984). Ban�, Canada.
Singmann, H., & Kellen, D. (in press). An introduction to mixed models for experimental
psychology. In D. H. Spieler, & E. Schumacher (Eds.) NewMethods in Neuroscience and
Cognitive Psychology. Psychology Press.
Skopeteas, S., & Fanselow, G. (2010). Focus types and argument asymmetries: a cross-
linguistic study in language production. In C. Breul, & E. Göbbel (Eds.) Contrastive
information structure (Linguistics Today Series, 165), (pp. 169–197). Amsterdam: John
Benjamins.
Sluijter, A. M. C., & van Heuven, V. J. (1996a). Spectral balance as an acoustic correlate
of linguistic stress. Journal of the Acoustical Society of America, 100(4), 2471–85.
Sluijter, A. M. C., & van Heuven, V. J. (1996b). Acoustic correlates of linguistic stress
and accent in Dutch and American English. In Proceedings of the 4th International
Conference on Spoken Language Processing (ICSLP96), (pp. 630–633). Philadelphia, USA.
Sluijter, A. M. C., van Heuven, V. J., & Pacilly, J. J. A. (1997). Spectral balance as a cue in
the perception of linguistic stress. Journal of the Acoustical Society of America, 101(1),
503–513.
Solé, M. J. (1984). Experimentos sobre la percepción del acento. Estudios de Fonética
Experimental, 1, 134–243.
Sonderegger, M. (2012). Phonetic and phonological dynamics on reality television. Ph.D.
thesis, University of Chicago.
Sorin, C. (1981). Functions, roles and treatments of intensity in speech. Journal of Phon-
etics, 9, 359–374.
430

Bibliography
Srinivasan, R., & Massaro, D. (2003). Perceiving prosody from the face and voice: Dis-
tinguishing statements from echoic questions in English. Language and Speech, 46(1),
1–22.
Stetson, R. H. (1928). Motor Phonetics. Amsterdam: North-Holland.
Stokoe, W. C. (2001). Language in hand: Why sign came before speech. Washington, DC:
Gallaudet University Press.
Strait, D. L., & Kraus, N. (2011). Can you hear me now? Musical training shapes func-
tional brain networks for selective auditory attention and hearing speech in noise.
Frontiers in Psychology, 13(2), 113.
Streefkerk, B. (2002). Acoustic and lexical/syntactic correlates. Ph.D. thesis, LOT (Lan-
delijke Orientatiecursus Theaterscholen), Utrecht.
Streefkerk, B. M., Pols, L. C. W., & ten Bosch, L. F. M. (1997). Prominence in read-
aloud sentences, as marked by listeners and classi�ed automatically. In Proceedings
of the Institute of Phonetic Sciences of the University of Amsterdam, 21, (pp. 101–116).
Amsterdam, the Netherlands: University of Amsterdam.
Streefkerk, B. M., Pols, L. C. W., & ten Bosch, L. F. M. (1998). Automatic detection of
prominence (as de�ned by listeners’ judgements) in read aloud sentences. In Proceed-
ings of the 5th International Conference on Spoken Language Processing (ICSLP 98), (pp.
683–686). Sydney, Australia.
Strelnikov, K., Rouger, J., Lagleyre, S., Fraysse, B., Deguine, O., & Barone, P. (2009). Im-
provement in speech-reading ability by auditory training: evidence from gender dif-
ferences in normally hearing, deaf and cochlear implanted subjects. Neuropsychologia,
47 (4), 972–979.
Sweet, H. (1877). A Handbook of Phonetics. Oxford: Clarendon.
431

Bibliography
Swerts, M. (1997). Prosodic features at discourse boundaries of di�erent strength. Journal
of the Acoustical Society of America, 101(1), 514–521.
Swerts, M., & Krahmer, E. (2004). Congruent and incongruent audiovisual cues to prom-
inence. In Proceedings of the 2nd International Conference on Speech Prosody (SP2004),
(pp. 69–72). Nara, Japan.
Swerts, M., & Krahmer, E. (2005). Audiovisual prosody and feeling of knowing. Journal
of Memory and Language, 53(1), 81–94.
Swerts, M., & Krahmer, E. (2008). Facial expression and prosodic prominence: E�ects of
modality and facial area. Journal of Phonetics, 36(2), 219–238.
Swerts, M., & Krahmer, E. (2010). Visual prosody of newsreaders: E�ects of information
structure, emotional content and intended audience on facial expressions. Journal of
Phonetics, 38(2), 197–206.
Swerts, M., Krahmer, E., & Avesani, C. (2002). Prosodic marking of information status in
Dutch and Italian: A comparative analysis. Journal of Memory and Language, 30(4),
629–654.
Szaszák, G., & Beke, A. (2017). An empirical approach for comparing syntax and prosody
driven prominence marking. The Phonetician, 114(1), 46–57.
Szendrői, K. (2001). Focus and the Syntax-Phonology Interface. Ph.D. thesis, University
College London.
’t Hart, J. (1981). Di�erential sensitivity to pitch distance, particularly in speech. Journal
of the Acoustical Society of America, 69(3), 811–821.
’t Hart, J., Collier, R., & Cohen, A. (1990). A perceptual study of intonation: An
experimental-phonetic approach to speech melody. Cambridge: Cambridge University
Press.
432

Bibliography
Tamburini, F. (2003). Prosodic prominence detection in speech. In Conference: Signal
Processing and Its Applications, 2003. Proceedings. Seventh International Symposium,
vol. 1, (pp. 385–388). Paris, France.
ten Bosch, L. F. M. (1993). On the automatic classi�cation of pitch movements. In
Proceedings of the 3rd European Conference on Speech Communication and Technology
(Eurospeech - 1993), (pp. 781–784). Berlin, Germany.
Terken, J. (1991). Fundamental frequency and perceived prominence of accented syl-
lables. Journal of the Acoustical Society of America, 89(4), 1768–1776.
Terken, J. (1994). Fundamental frequency and perceived prominence of accented syl-
lables. (II. Non�nal accents). Journal of the Acoustical Society of America, 95(6), 3662–
3665.
Terken, J. (1996). Variation of accent prominence within the phrase: Models and spon-
taneous speech data. In Y. Sagisaka, C. N., & N. Higuchi (Eds.) Computing Prosody.
Approaches to a Computational Analysis and Modelling of the Prosody of Spontaneous
Speech, (pp. 95–111). Berlin/Heidelberg/New York: Springer-Verlag.
Terken, J., & Hermes, D. (2000). The perception of prosodic prominence. In M. Horne
(Ed.) Prosody: Theory and experiment. Studies presented to Gösta Bruce, (pp. 89–127).
Dordrecht: Kluwer Academic Publishers.
Terken, J., & Hirschberg, J. (1994). Deaccentuation of words representing ‘given’ infor-
mation: E�ects of persistence of grammatical function and surface position. Language
and Speech, 37 (2), 125–145.
Terken, J., & Nooteboom, S. G. (1987). Opposite e�ects of accentuation and deaccentu-
ation on veri�cation latencies for given and new information. Language and Cognitive
Processes, 2(3-4), 145–163.
Thompson, W. F., Schellenberg, E. G., & Husain, G. (2004). Decoding speech prosody:
Do music lessons help? Emotion, 4(1), 46–64.
433

Bibliography
Toledo, G. A., Fernández Planas, A. M., Romera, L., Ortega, A., &Matas, J. (2001). Tiempo
y tono en español peninsular. In M. Díaz García (Ed.) Actas del II Congreso Nacional
de Fonética Experimental, (pp. 318–323). Sevilla: Universidad de Sevilla.
Tomasello, M., & Call, J. (1997). Primate Cognition. Oxford: Oxford University Press.
Torreira, F., Simonet, M., & Hualde, J. I. (2014). Quasi-neutralization of stress contrasts in
Spanish. In Proceedings of the 7th International Conference on Speech Prosody (SP2014),
(pp. 197–201). Dublin, Ireland.
Truckenbrodt, H. (1999). On the relation between syntactic phrases and phonological
phrases. Linguistic Inquiry, 30(2), 219–255.
Tuite, K. (1993). The production of gesture. Semiotica, 93(1-2), 83–105.
Turk, A., & Sawusch, J. (1996). The processing of duration and intensity cues to promi-
nence. Journal of the Acoustical Society of America, 99(6), 3782–90.
Tylor, E. B. (1865). Researches into the Early History of Mankind and the Development of
Civilization. London: John Murray.
Vainio, M., & Jarvikivi, J. (2006). Tonal features, intensity, and word order in the percep-
tion of prominence. Journal of Phonetics, 34(3), 319–342.
Vallduví, E. (1992). The informational component. Ph.D. thesis, University of
Pennsylvania.
Vallduví, E., & Engdahl, E. (1996). The linguistic realization of information packaging.
Linguistics, 34(3), 459–520.
van Bergem, D. R. (1993). Acoustic vowel reduction as a function of sentence accent,
word stress, and word class. Speech Communication, 12(1), 1–23.
van der Hulst, H. (1985). Syllable Structure and Stress in Dutch. Dordrecht: Foris.
434

Bibliography
van Kuijk, D., & Boves, L. (1999). Acoustic characteristics of lexical stress in continuous
telephone speech. Speech Communication, 27 (2), 95–111.
van Maastricht, L., Krahmer, E., & Swerts, M. (2016). Prominence patterns in a second
language: Intonational transfer from Dutch to Spanish and vice versa. Language
Learning, 66(1), 124–158.
van Wassenhove, V., Grant, K. W., & Poeppel, D. (2005). Visual speech speeds up the
neural processing of auditory speech. Proceedings of the National Academy of Sciences
of the United States of America, 102(4), 1181–1186.
Vanrell, M., & Fernández Soriano, O. (2013). Variation at the interfaces in Ibero-Romance.
Catalan and Spanish prosody and word order. Catalan Journal of Linguistics, 12, 253–
282.
Venditti, J., Maekawa, K., & Beckman, M. E. (2008). Korean intonational phonology
and prosodic transcription. In S. Miyagawa, & M. Saito (Eds.) Handbook of Japanese
Linguistics, (pp. 456–512). Oxford: Oxford University Press.
Vico, G. (1725/1744). Scienza nuova [New science]. Naples: Stamperia Muziana.
Vogel, I., Athanasopoulou, A., & Pincus, N. (2016). Prominence, Contrast and the Func-
tional LoadHypothesis: an acoustic investigation. In J. Heinz, R. Goedemans, &H. van
der Hulst (Eds.) Dimensions of Phonological Stress, (pp. 123–167). Cambridge: Cam-
bridge University Press.
Wagner, P. (2005). Great expectations – introspective vs. perceptual prominence ratings
and their acoustic correlates. In Proceedings of the Annual Conference of the Inter-
national Speech Communication Association, INTERSPEECH - 2005, (pp. 2381–2384).
Lisbon, Portugal.
Wagner, P., Malisz, Z., & Kopp, S. (2014). Gesture and speech in interaction: An overview.
Speech Communication, 57 , 209–232.
435

Bibliography
Wagner, P., Origlia, A., Avesani, C., Christodoulides, G., Cutugno, F., D’Imperio, M., Es-
cudero Mancebo, D., Gili Fivela, B., Lacheret, A., Ludusan, B., Moniz, H., Ní Chasaide,
A., Niebuhr, O., Rousier-Vercruyssen, L., Simon, A. C., Simko, J., Tesser, F., & Vainio,
M. (2015). Di�erent parts of the same elephant: A roadmap to disentangle and connect
di�erent perspectives on prosodic prominence. In Proceedings of the 18th International
Congress of Phonetic Sciences (ICPhS15). Glasgow, UK: University of Glasgow.
Warton, D. I., & Hui, F. K. (2011). The arcsine is asinine: the analysis of proportions in
ecology. Ecology, 92(1), 3–10.
Watson, C. S., Qiu,W.W., Chamberlain, M.M., & Li, X. (1996). Auditory and visual speech
perception: con�rmation of a modality-independent source of individual di�erences
in speech recognition. Journal of the Acoustical Society of America, 100(2), 1153–1162.
Watson, D., & Gibson, E. (2004). The relationship between intonational phrasing and
syntactic structure in language production. Language and Cognitive Processes, 19(6),
713–755.
Watson, D. G., Arnold, J. E., & Tanenhaus, M. K. (2008). Tic Tac TOE: E�ects of predict-
ability and importance on acoustic prominence in language production. Cognition,
106(3), 1548–1557.
Wennerstrom, A. (2011). Rich pitch. The humorous e�ects of deaccent and L+H* pitch
accent. Pragmatics and Cognition, 19(2), 310–332.
Whittingham, M. J., Stephens, P. A., Bradbury, R. B., & Freckleton, R. P. (2006). Why do
we still use stepwise modelling in ecology and behaviour? Journal of Animal Ecology,
75(5), 1182–1189.
Wightman, C. W., & Ostendorf, M. (1994). Automatic labeling of prosodic patterns. IEEE
Transactions on Speech and Audio Processing, 2(4), 469–481.
Wundt, W. M. (1904-1920). Völkerpsychologie : eine Untersuchung der Entwicklungsge-
setze von Sprache, Mythus und Sitte [Social psychology. An investigation of the laws of
436
Bibliography
evolution of language, myth, and custom]. Leipzig: Engelmann, vols. 1-5; Kröner, vols.
5-10.
Xu, Y. (1999). E�ects of tone and focus on the formation and alignment of contours.
Phonetica, 27 , 55–105.
Yasinnik, Y., Renwick, M., & Shattuck-Hufnagel, S. (2004). The timing of speech-
accompanying gestures with respect to prosody. In Proceedings of From Sound to Sense:
50+ years of discoveries in speech communication, (pp. 97–102). Boston, USA.
Zeger, S. L., & Karim, M. R. (1991). Generalized linear models with random e�ects; a
Gibbs sampling approach. Journal of the American Statistical Association, 86(413), 79–
86.
Zendel, B. R., Tremblay, C. D., Belleville, S., & Peretz, I. (2015). The impact of musician-
ship on the cortical mechanisms related to separating speech from background noise.
Journal of Cognitive Neuroscience, 27 (5), 1044–1059.
Zimmermann, M. (2007). Contrastive focus. In C. Féry, G. Fanselow, & M. Krifka (Eds.)
Interdisciplinary Studies on Information Structure 6. The notions of information struc-
ture, (pp. 147–159). Potsdam: Universitätsverlag Potsdam.
Zioga, I., Di Bernardi Luft, C., & Bhattacharya, J. (2016). Musical training shapes neural
responses to melodic and prosodic expectation. Brain Research, 1650, 267–282.
Zubizarreta, M. L. (1998). Prosody, focus, and word order . Cambridge, MA: MIT Press.
437