Tesi di Laurea Magistrale Functionalization and coatings on Ti ...
192
POLITECNICO DI TORINO Corso di Laurea Magistrale in Ingegneria dei Materiali Tesi di Laurea Magistrale Functionalization and coatings on Ti surface for a better integration with soft tissues Relatrici Prof.ssa Silvia Maria Spriano Ing. Sara Ferraris Candidata Angelica Luceri 29 Marzo 2019
-
Upload
khangminh22 -
Category
Documents
-
view
0 -
download
0
Transcript of Tesi di Laurea Magistrale Functionalization and coatings on Ti ...

POLITECNICO DI TORINO
Corso di Laurea Magistrale in Ingegneria dei Materiali
Tesi di Laurea Magistrale
Functionalization and coatings on Ti surface for a better
integration with soft tissues
Relatrici
Prof.ssa Silvia Maria Spriano
Ing. Sara Ferraris
Candidata
Angelica Luceri
29 Marzo 2019

Alla mia famiglia

"Devo liberarmi del tempo e vivere il presente giacché non esiste altro tempo che questomeraviglioso istante."
Alda Merini

Ringraziamenti
Un grazie sincero alla Professoressa Silvia Spriano e Sara Ferraris per la disponibilità e gentilezza.Vorrei ringraziare Alessio Varesano e Claudia Vineis del Centro Nazionale Ricerche (CNR-OSMAC) di Biella, per la collaborazione e i preziosi consigli e a Mirko Prato dell'Istituto Italianodi Tecnologia (IIT) di Genova, per la disponibilità. Ringrazio anche il Centro Nazionale Ricerche(CNR) di Torino, per avermi permesso di utilizzare i laboratori.Un ringraziamento all'Institute of Polymers Composites and biomaterials (CNR-IPCB) di Napoli,per la collaborazione.
Grazie di cuore ad Anna, Cecilia, Laura e Francesca, per la loro presenza costante, ottimeamiche e compagne di viaggio, che mi hanno ascoltato e supportato nei momenti di crisi.Grazie a Luisa, Guido, Paolo, Tommaso, Leandro, Paolo, Michele, Pietro e Alberto, che, tra unapizza e un ca�è, mi hanno fatto sentire a casa.Grazie a tutti "i Gialli", per avermi fatto crescere e cambiare, per avermi fatto capire cosasigni�ca essere un gruppo. Siete stati tutti un punto di riferimento importante.
Grazie zia Rosaria, una zia speciale, una seconda mamma. Grazie per esserci sempre anchese in maniera discreta e silenziosa.
Grazie a chi è lassù, per avermi lasciato il regalo più importante.Grazie Fede per avermi sempre spronata e aiutata. Grazie per esserci quando ho bisogno, per
avermi fatto da guida e poi avermi lasciata proseguire da sola. Sei un esempio. Anche se non lodimostro, ti voglio bene.
In�ne grazie alle due persone più importanti. Grazie papà per tutto: per tutti i sacri�ci chehai fatto, per tutte le volte in cui ti sei svegliato all'alba per andare a lavorare, per tutte le voltein cui hai fatto anche ciò che non volevi pur di farci felici.
Grazie mamma, grazie per tutte le ore passate al telefono per consolarmi o tirarmi su, grazieper aver fatto ogni cosa pur di aiutare me e Fede a realizzare i nostri sogni, grazie per essertirimboccata le maniche e avermi permesso di vivere quest'esperienza senza nessuna rinuncia.Spero un giorno di poter ripagare tutti i sacri�ci che avete fatto.Grazie anche per tutti i dolci e i pacchi che mi hai mandato, unica fonte di gioia nelle mie (e nonsolo) giornate di studio.
Grazie di cuore a tutti.Vi voglio bene!
3

4

Contents
Introduction iii
1 Keratin 3
1.1 Biochemistry of α- and β- keratin . . . . . . . . . . . . . . . . . . . . . . . . . . . 51.2 Properties . . . . . . . . . . . . . . . . . . . . . . . . . . . . . . . . . . . . . . . . 7
1.2.1 Physicochemical properties . . . . . . . . . . . . . . . . . . . . . . . . . . 71.2.2 Mechanical properties . . . . . . . . . . . . . . . . . . . . . . . . . . . . . 8
1.3 Extraction . . . . . . . . . . . . . . . . . . . . . . . . . . . . . . . . . . . . . . . . 121.3.1 Oxidative methods . . . . . . . . . . . . . . . . . . . . . . . . . . . . . . . 121.3.2 Reductive methods . . . . . . . . . . . . . . . . . . . . . . . . . . . . . . . 131.3.3 Sulphitolysis method . . . . . . . . . . . . . . . . . . . . . . . . . . . . . . 141.3.4 Use of ionic liquids . . . . . . . . . . . . . . . . . . . . . . . . . . . . . . . 151.3.5 Chemical-free hydrolysis . . . . . . . . . . . . . . . . . . . . . . . . . . . . 16
1.4 Oral bacteria and keratin . . . . . . . . . . . . . . . . . . . . . . . . . . . . . . . 161.4.1 Oral bacteria . . . . . . . . . . . . . . . . . . . . . . . . . . . . . . . . . . 161.4.2 Interaction between bacteria and keratin . . . . . . . . . . . . . . . . . . . 17
1.5 Fibroblasts and keratin . . . . . . . . . . . . . . . . . . . . . . . . . . . . . . . . . 181.5.1 Fibroblasts . . . . . . . . . . . . . . . . . . . . . . . . . . . . . . . . . . . 181.5.2 Wound healing . . . . . . . . . . . . . . . . . . . . . . . . . . . . . . . . . 181.5.3 Interaction between �broblasts and keratin . . . . . . . . . . . . . . . . . 19
1.6 Keratin-based biomaterials . . . . . . . . . . . . . . . . . . . . . . . . . . . . . . 20
2 Coating 25
2.1 Coating deposition process and techniques . . . . . . . . . . . . . . . . . . . . . . 252.2 Theory of adhesion . . . . . . . . . . . . . . . . . . . . . . . . . . . . . . . . . . . 32
2.2.1 Mechanical interlocking theory . . . . . . . . . . . . . . . . . . . . . . . . 322.2.2 Chemical/adsorbition theory . . . . . . . . . . . . . . . . . . . . . . . . . 322.2.3 Acid-base theory . . . . . . . . . . . . . . . . . . . . . . . . . . . . . . . . 332.2.4 Di�usion or interdi�usion theory . . . . . . . . . . . . . . . . . . . . . . . 342.2.5 The electrostatic attraction theory . . . . . . . . . . . . . . . . . . . . . . 34
2.3 Thermodynamic theory of adhesion . . . . . . . . . . . . . . . . . . . . . . . . . . 362.4 Macroscopic adhesion testing . . . . . . . . . . . . . . . . . . . . . . . . . . . . . 37
2.4.1 Cause of failure . . . . . . . . . . . . . . . . . . . . . . . . . . . . . . . . . 382.4.2 Adhesion test . . . . . . . . . . . . . . . . . . . . . . . . . . . . . . . . . . 39
2.5 In�uence of di�erent factors on coating adhesion . . . . . . . . . . . . . . . . . . 452.6 Other considerations . . . . . . . . . . . . . . . . . . . . . . . . . . . . . . . . . . 52
i

ii CONTENTS
3 Dental implants 55
3.1 Oral cavity . . . . . . . . . . . . . . . . . . . . . . . . . . . . . . . . . . . . . . . 553.2 Structure of teeth . . . . . . . . . . . . . . . . . . . . . . . . . . . . . . . . . . . . 55
3.2.1 Peridontum . . . . . . . . . . . . . . . . . . . . . . . . . . . . . . . . . . . 563.2.2 Peridontal disease . . . . . . . . . . . . . . . . . . . . . . . . . . . . . . . 57
3.3 Types of dental implants . . . . . . . . . . . . . . . . . . . . . . . . . . . . . . . 583.4 General features of dental implants . . . . . . . . . . . . . . . . . . . . . . . . . . 62
3.4.1 Mechanical stability . . . . . . . . . . . . . . . . . . . . . . . . . . . . . . 623.4.2 Biological stability . . . . . . . . . . . . . . . . . . . . . . . . . . . . . . . 643.4.3 Morphological stability . . . . . . . . . . . . . . . . . . . . . . . . . . . . . 65
4 Materials and Methods 67
4.1 Cutting, marking and polishing of samples . . . . . . . . . . . . . . . . . . . . . . 674.2 Washing of samples . . . . . . . . . . . . . . . . . . . . . . . . . . . . . . . . . . . 68
4.2.1 Preparation of titanium cylinders . . . . . . . . . . . . . . . . . . . . . . . 684.3 Surface activation with plasma . . . . . . . . . . . . . . . . . . . . . . . . . . . . 704.4 Surface activation with UV . . . . . . . . . . . . . . . . . . . . . . . . . . . . . . 704.5 Coating deposition and functionalitation . . . . . . . . . . . . . . . . . . . . . . . 72
4.5.1 Solution of keratin at 7% wt . . . . . . . . . . . . . . . . . . . . . . . . . . 734.5.2 Solution of keratin at 3% wt . . . . . . . . . . . . . . . . . . . . . . . . . . 734.5.3 Solution of keratin at 1% wt . . . . . . . . . . . . . . . . . . . . . . . . . . 744.5.4 Electrospinning . . . . . . . . . . . . . . . . . . . . . . . . . . . . . . . . . 76
4.6 Thermal treatment . . . . . . . . . . . . . . . . . . . . . . . . . . . . . . . . . . . 814.7 Surface characterization . . . . . . . . . . . . . . . . . . . . . . . . . . . . . . . . 86
4.7.1 Tape test . . . . . . . . . . . . . . . . . . . . . . . . . . . . . . . . . . . . 864.7.2 Scratch test . . . . . . . . . . . . . . . . . . . . . . . . . . . . . . . . . . . 884.7.3 SEM . . . . . . . . . . . . . . . . . . . . . . . . . . . . . . . . . . . . . . . 894.7.4 FESEM . . . . . . . . . . . . . . . . . . . . . . . . . . . . . . . . . . . . . 914.7.5 Roughness and homogeneity . . . . . . . . . . . . . . . . . . . . . . . . . . 934.7.6 Wettability . . . . . . . . . . . . . . . . . . . . . . . . . . . . . . . . . . . 974.7.7 Stability in water . . . . . . . . . . . . . . . . . . . . . . . . . . . . . . . . 974.7.8 Zeta potential . . . . . . . . . . . . . . . . . . . . . . . . . . . . . . . . . . 994.7.9 FT-IR . . . . . . . . . . . . . . . . . . . . . . . . . . . . . . . . . . . . . . 1024.7.10 XRD . . . . . . . . . . . . . . . . . . . . . . . . . . . . . . . . . . . . . . . 1044.7.11 XPS . . . . . . . . . . . . . . . . . . . . . . . . . . . . . . . . . . . . . . . 106
5 Results and discussions 109
5.1 Adhesion test . . . . . . . . . . . . . . . . . . . . . . . . . . . . . . . . . . . . . . 1115.1.1 Tape test . . . . . . . . . . . . . . . . . . . . . . . . . . . . . . . . . . . . 1115.1.2 Scratch test . . . . . . . . . . . . . . . . . . . . . . . . . . . . . . . . . . . 115
5.2 Thickness and homogeneity of the coating . . . . . . . . . . . . . . . . . . . . . . 1175.3 Wettability . . . . . . . . . . . . . . . . . . . . . . . . . . . . . . . . . . . . . . . 1215.4 Stability in water . . . . . . . . . . . . . . . . . . . . . . . . . . . . . . . . . . . . 1245.5 Zeta potential . . . . . . . . . . . . . . . . . . . . . . . . . . . . . . . . . . . . . . 1265.6 FT-IR . . . . . . . . . . . . . . . . . . . . . . . . . . . . . . . . . . . . . . . . . . 1295.7 XRD . . . . . . . . . . . . . . . . . . . . . . . . . . . . . . . . . . . . . . . . . . . 1345.8 XPS . . . . . . . . . . . . . . . . . . . . . . . . . . . . . . . . . . . . . . . . . . . 1365.9 Roughness of titanium cylinder . . . . . . . . . . . . . . . . . . . . . . . . . . . . 166
Conclusions 169

CONTENTS iii
Bibliography 171

iv CONTENTS

Introduction
In orthodontics, the fundamental aim is that to ensure goodness and success of a dental implant.Lot of studies have been conducted with regard to the portion of prothesis in contact with thebone tissue, obtaining good results, but the main problem is releated to the adhesion of theprothesis to soft tissue, linked to the reduction of bacterial proliferation, due to the fact that theinterface between trans-mucosal tissue and prothesis, the part of collar and abutment, is widelydi�erent from interface between gingiva and theet.Because geometry, shape and topography in�uence interaction between dental implant and softtissue, it is important to design the prothesis, with the purpose of promoting adhesion andproliferation of gingival �broblasts, reducing bacterial adhesion.
From a bibliography research, it has been found that commercially pure titanium is the bestmaterial for dental applications, due to its biocompatibility, in addition an important role isplayed by keratin, a protein wich exhibits anti-bacterial properties and is capable to promoteproliferation of �broblasts. The main problem is adhesion of keratin to substrate: infact weakbonds are created between coating and substrate, that easily causes the detachment from thetitanium.
The aim of this dissertation is to analyze behavior of coated and functionalized titaniumsurfaces, treated in di�erent ways, by keratin solution, in order to improve it's adhesion to thesubstrate.Keratin was deposited on disks of commercially pure titanium (grade 2), and its adhesion prop-erties were studied.The surface treatments on Ti carried out were:
• Polishing;
• Plasma treatment;
• Irradiation with UV.
Keratin adhesion was analyzed by using tape test and scratch test, and surface characterizationwas conducted: wettability, zeta potential, roughness, FT-IR, XRD, XPS analysis.In addition, some titanium samples were functionalized by keratin and their characteristics werestudied.Adhesion properties of keratin nano�bers, deposited by Electrospinning technique at CentroNazionale delle Ricerche (CNR-ISMAC) of Biella were analyzed. In order to evaluate keratinnano�bers behavior aligned on dental prothesis, titanium cylinders were plasma-treated and elec-trospun nano�bers were deposited on the lateral surface, with SEM microscope, the morphologyand the disposition of the �bers were analyzed: biological test will be conducted on this samples.
1

2 Introduction

Chapter 1
Keratin
The term keratin, from the Greek κερας, meaning �horn�, indicates a group of �lament-formingproteins of epithelia and is the most important biopolymer in animals (1). Keratins, representedin Figure 1.1, have a molecular weight between 40 and 70 kDa. Their structure is approximately40% hydrophilic and 60% hydrophobic (2). They are characterized by a three-dimensional �brillarhierarchical structure, and consists of small, nanometric amino acids that polymerise in a well-known sequence. Each keratin protein can be vary in the number and sequence of amino acids, incharge, size and polarity. The amino acid sequence in�uences molecular structure and propertiesof secondary, tertiary and quaternary keratin proteins, the three-dimensional structure, and thetype of the bonds (3).
Several functional groups are present in keratin, as disulphide (-S-S), carboxyl acid (-COOH)and amino (−NH2), which make keratin chemically reactive under certain conditions (4). Inparticular keratins are characterized by a large amount of sulfur-containg amino acid cysteine,with the thiol functional group, -SH. The thiol groups tend to pair up and, through oxidation,form a covalent sulfur-sulfur bond, a disul�de, known also as SS-bond or disul�de bridge, shownin Figure 1.2. The high content of cysteine makes keratin stable by forming network structurethrough joining adiacent polypeptides by disolfur cross-links, as shown in Figure 1.3. This disul-�de bridges give important properties to keratin, infact confer additional strength and rigidityby permanent, thermally cross-linked (5). Keratins also contain a high portion of glycine, thesmallest of the 20 amino acids, characterized by a side-group formed by a hydrogen atom, anda high portion of alanine, whose functional side group is a methyl group. In Figure 1.4 is repre-sented a general structure of amino acid molecule: for glycine -R is repleaced by -H, for alanine,instead, by methyl group −CH3. The amino group (−NH2) and the carboxyl group (-COOH)are the other functional groups of the molecule. In Table 1.1 the amino acid amount of extractedsamples compared with the original wool is shown (6).
3

4 CHAPTER 1. KERATIN
Figure 1.1: (A) unit of polypeptide, (B) sequence of amino acid, (C) α-helix keratin structure, (D)β-sheets keratin structure (F1)

1.1. BIOCHEMISTRY OF α- AND β- KERATIN 5
Figure 1.2: Disul�de bond (-S-S) (F2)
Figure 1.3: Representation of the diamino-acid cysteine residue linking two poltpeptide chains by covalentbonding (F3)
1.1 Biochemistry of α- and β- keratin
Generally keratins are divided into two groups:
• Alpha-keratins: they have an alpha-helical tertiary structure and are found in all verte-brates, in hair, horns, claws.
• Beta-keratins: they are formed by β-sheets and are found in reptile shells, claws of bird,nails (7).
α-keratin can constitute its �lamentous state through the coiled coil assembly and, heteropoly-meric pair formation of type I or acidic keratins and type II or basic keratins protein molecules.This two chains represent the monomeric unit of the keratin (Figure 1.5 (a)): each of one isconstituited by a central alpha-helical rod (of a length of 46 nm), with a non helical C- andN- terminal regions, which create bonds with other intermediate �laments and matrix. In thecentral rod region, there are points without helical links, named in �gure L1, L12, L2.In order to form the α-keratin structure, as shown in Figure 1.6 (a), hydrogen bonds, formed

6 CHAPTER 1. KERATIN
Figure 1.4: General structure of amino acid molecule F4
between two isolated right-handed chain, stabilize the structure and cause the chain to twistand form a left-handed coiled-coil, called dimer, of length of 45 nm, by disulphide cross link,utilising the many cystein amino acids found in α-keratin. Then dimers create proto�lament,with a diameter of 2 nm, by aggregating end-by-end and staggering side-by-side via disulphidebonds. Two proto�laments create a proto�bril and four proto�brils create a helical shape witha diameter of 7 nm. Then this structure packs in a supercoiled conformation and links with thematrix proteins rich of cysteine or glycine (1).Based on the amount of disul�de bonds, α-keratin can be classi�ed in: hard alpha-keratins,characterized by high cysteine content, which causes an increase in solfur-solfur bonds creationimproving mechanical properties, and in soft alpha-keratins, characterized by a smaller contentof disul�de bonds, making the structure more �exible (7).
The unit molecule of β-keratin consists of three regions, shown in Figure 1.5 (b): centraldomains, which is the central part of a polypeptide chain, folding several times and formingβ-sheet and C- and N- regions with di�erent lengths and compositions. In beta-keratin 32 aminoacids form central rod domain, 23 and 47 amino acids form respectively head and tail domains.The plated sheets arrange into �laments, C- and N- terminal constituits the matrix and windaround central region, in order to create β-keratin (1).
The β-sheet structure, shown in Figure 1.7 (a), is characterized by inter-chain hydrogenbonds which packed β-strands which can be parallel or antiparallel. The formation of β-keratinis a process which involves a central region of a one polypeptide chain to form four lateralstrands linked by hydrogen bonds, creating a pleated sheet. Then two pleated sheets are related,superpose and run in opposite direction creating a �lament of 4 nm of diameter (Figure 1.7 (b)).The terminal part of the peptide creates the matrix (1).
An X-ray di�raction shows that keratin can be distinguish in feather pattern and amor-phous pattern: the feather pattern and β-keratins have the same characteristic re�ection, whilethe amorphous pattern forms the amorphous matrix of α-keratinous tissues (1). As shown inFigure 1.8, α-keratin gives a pattern with an equatorial re�ection of spacing 0.98 nm, whichcorresponds to the distance between α-helical axes, and a meridional re�ection of spacing 0.515nm which relates to the a-helix pitch projection. The β-keratin has a prominent axial repeat of0.31 nm re�ection, which is the distance between residues along the chain in a β-sheet, the 0.47nm equatorial arc, which is the distance between chains in a β-sheet and the broad equatorialre�ection at 0.97 nm, corresponding to intersheet distance.
As said before, each keratin protein is characterized by a chain of amino acids, as the primarystructure: the amino acid sequence and the particular position of an amino acid in the chain canin�uence the three-dimensional structure of the molecule and its properties.
Post-translational modi�cations of keratin, such as the formation of disulphide bonds, phos-phorylation, glycosylation, inter- or intrachain peptide bonds, in�uence the conformation of

1.2. PROPERTIES 7
Table 1.1: Comparison between amino acid extracted and contained in wool (T1)
keratin molecule, and molecular weight and pI values. Phosphorylation and dephosphorylationare perhaps the most important post-translational modi�cations of keratins: prevent the inter-action of keratins with other molecules, cause changes in solubility, modify the conformation ofkeratin �laments.
All intermediate �laments are proteins with a tripartite secondary structure made up byN-terminal head domain, a α-helical rod domain and a C-terminal tail domain. Each domain isdivided in subdomains. Domains and subdomains interact with those of other keratin molecules,forming heterodimers, tetramers and then keratin �lament. This structure can change underphysical forces, such as tension or compression, or under chemical processes.
The tertiary structure is a heterodimer formed by the rod domains of one acidic and onebasic keratin in parallel orientation. This constituites the �rst building block of keratin �laments.They are heteropolymer containing equimolar amount of type I and type II keratins. Keratinsare characterized by the capacity for creating a complex quaternary structure, including theformation of a tetramer, an octamer and a "unit length �lament" (3).
1.2 Properties
1.2.1 Physicochemical properties
The presence of intermolecular and intramolecular disul�de bridges and interchain peptide link-ages make keratins insoluble. In order to obtain keratin derivatives, di�erent methods have beenproposed: for alpha-keratinous materials, reduction, oxidation and sulphitolysis methods havebeen used, while, for beta-karatinous materials, alkaline thioglycollate and a combination of adisul�de bond-breaking reagent and a protein denaturant have been used. This method are used

8 CHAPTER 1. KERATIN
Figure 1.5: (a) Molecular unit of α-keratin �lament, (b) Molecular unit of β-keratin �lament (F5)
in keratin extraction processes and will be explained later.Generally to determine physicochemical properties of keratins, they have to be placed in solu-tions of urea and reductant agents.Based on molecular weight and pI, this solubilized keratins are separated through electrophoresisphenomena.As said before, based on two-dimensional gel-electrophoresis technique, it was found two goupsof keratins, type I and type II: type I keratin proteins tend to be smaller, characterized by amolecular weight between 40 and 56,5 kDa and containing more acidic amino acids, such asaspartic acid; whereas type II keratin proteins are larger, with a molecular weight in the rangeof 50-70 kDa and containing more basic amino acids, such as lycine (3). Bowden et al. founddi�erent pI values for keratins of type I and type II: type I keratins have a pI in the rangebetween 4.9�5.4, whereas type II keratins have a pI in the range between 6.5�8.5. Di�erencesin molecular weight and pI values of keratin proteins in various species are based on: genescontained in keratin, post-transcriptional processing of the messenger RNA, post-translationalprocessing of the protein or variations in the number of phosphorylated or glycosylated aminoacid residues (3).
1.2.2 Mechanical properties
Mechanical properties of the karatinous materials change according to the host animals origi-nated, to the di�erent organization of cells at micro and macroscale and to hydratation level. Ingeneral the β-sheet has a higher sti�ness than α-helix, and is possible to see a transition fromα-helix to β-sheet under tensile load. Figure 1.9 shows a scheme of this transition during whichhydrogen bonds are reformed: a progressive unraveling of the α-helical coiled coil domains, arefolding of the stretched α-helices into β-sheets, and a spatial expansion of the β-structuredzones occur (1).

1.2. PROPERTIES 9
Figure 1.6: (a) Structure of α-keratin �laments. Hydrogen bond is shown. (b) Formation of an interme-diate �lament starting from a α-helix chain (F6)
The tensile stress-strain curve exhibits three regions:
• a near linear Hookean region in which chains are stretched, with bond arrangement alteredbut without changes in structure;
• a yield region in which the α-helical coiled coils start unraveling and forming β-pleatedsheets;
• a post-yield region with increasing slope where a majority of β-sheets are formed.
In general, Young's modulus changes in a range between 0,005 to 4,5 GPa, whereas strengthchanges between 12 and 221 MPa, under the same humidity conditions.Figure 1.10 shows stress-strain curves of di�erent keratinous material. The curves are character-ized by:
• an eleastic region, with a Young's modulus in the range between 1 and 5 GPa;
• a plastic region, with a lower slope;
• a change in slope, which represents strengthening of failure, if the slope increases or de-creases.

10 CHAPTER 1. KERATIN
Figure 1.7: (a) structure of β-keratin �lament. (b) formation of β-keratin �lament (F7)
Figure 1.8: (a)X-ray di�raction pattern of α-keratin and (b) X-ray di�raction pattern of β-keratin (F8)
Di�erent responses are a consequence of the structural organizations of the �laments and matrix,the arrangements of keratinized cells and/or sample preparation (1).Because keratin is a �lament form protein, orientation, packing and volume fraction of �lamentsin�uence the mechanical behavior of α and β keratins.It's possible to increase hardening by mineralization with calcium or others salts. Szewciw etal. studied the contribute of calci�cation to whale baleen α-keratin. Altough little is knownabout whale baleen, it is the highly calci�ed keratinous material (with a content of calcium of 41mg/g while wool contains 2,8 mg/g). Calcium salt crystallite are deposited between intermediate�laments, this increases sti�ness and strength. Tensile tests on di�erent baleen bristles and woolreveal that calci�cation increases sti�ness of the baleen. In Figure 1.11 are reported whalebaleen bristles from sei, humpback and minke whales compared with wool �bers, (b) natural anddecalci�ed wool �bers, (c) natural and decalci�ed sei baleen bristles, (d) natural and decalci�edhumpback baleen bristles, and (e) natural and decalci�ed minke baleen bristles. The sei andhumpback baleen have a higher content of calcium salt than minke, and it explains higher Young'smodulus and yield strength. Figure 1.11 (b), (c), (d) and (e) shows how decalci�cation changes

1.2. PROPERTIES 11
Figure 1.9: Transition from α-helix to β-sheet keratin under tensile load (F9)
mechanical properties of wool and three baleen bristles: it is possible to note that decalci�cationresults in a decrease of Young's modulus (9).
Mechanical properties of α and β-keratin can change with di�erent level of humidity. Anhumidity increase causes a decrease in sti�ness and strength and an increase in breaking strength.It is possible to note that matrix protein are water sensitive, whereas intermediate �laments arecrystalline and they are not a�ected by water content. Water can interact with protein moleculesin di�erent way:
• molecules of water are arranged between chains, acting as a cross link and swelling agentand causing a reduction of interaction due to the increse between interchain space;
• water can cause an increase in the mobility of the chain because it repleaces secondarybond, such as hydrogen bond, between chains;
• a three dimensional water-keratin molecule network is formed. It reduce sti�ness andincrease the segmental mobility of the molecules (1).
Figure 1.12 show a schematic diagram of this mechanisms.Keratin is viscoelastic. Viscoelasticity plays an important role in keratinous material, because itfavours energy absorption and damps load �uctuation. A viscoelastic material undergoes creep,which represents deformation in relation to time with a constant load, and stress relaxation,which represents stress reduction in relation of time with strain constant. As a consequence

12 CHAPTER 1. KERATIN
Figure 1.10: Tensile stress-strain curves of di�erent keratinous materials (F10)
of this, the material has strain rate sensitivity, i.e. strain rate in�uences mechanical propertiesand a transition from ductile to brittle fracture behaviour is possible, if strain rate increases.Generally, in keratinous tissues, an increase of strain rate produces an increase in sti�ness andstrength with decrease of breaking strain (1).
1.3 Extraction
To extract keratin, disulphide bonds have to be broken. Keratin can be extracted by:
• unprotected solubilization: this way is characterized by the degradation of both the back-bone peptide bonds and the interchain disul�de bridges;
• protected solubilization: in this case keratin macromolecules are intact, due to a preferentialcleavage of the disul�de bridges, and a disruption of the intermolecular hydrogen bonds.
In both cases, there is the di�culty of mantaining the solubilized polypeptides in a colloidal state.Solubilized keratins tend to precipitate because of their hydrophobicity and disul�de bridges tendto reassemble from the newly resulted sulfhydryl groups (10). To extract keratin, disulphidebonds have to be break, for this reason di�erent method have been proposed: oxidative, reductive,sulphitolisis, chemical-free method and using ionic liquids.
1.3.1 Oxidative methods
An oxidative solubilization of keratin occurs with the use of oxidizing agents, such as hydrogenperoxide, organic peracids, inorganic persalts. In general, it is seen as a cooperative e�ectof oxidative agents and alkali. Today, the most system used is made up by peracetic acid andperoxide inorganics and alkali, due to its e�ciency and the fact that is environmentally ecofriendly(11).Yamanda et al. found a method to solubilizied hair and wool in only one-stage, using hydrogenperoxide in concentration between 25-35% in weak alkaline medium, at a pH value in the range

1.3. EXTRACTION 13
Figure 1.11: Baleen bristles from sei, humpback and minke whales compared with wool �bers, (b) naturaland decalci�ed wool �bers, (c) natural and decalci�ed sei baleen bristles, (d) natural and decalci�edhumpback baleen bristles, and (e) natural and decalci�ed minke baleen bristles (F11)
of 8-9. This method has a solubilization yield of 99,7% and the keratin obtained has a molecularweight between 25 and 67 kDa (12).
1.3.2 Reductive methods
Niloofar et al. studied a method to extract keratin from wool and feather, based on enzymatictreatment with a reducing agent. They washed wool and feather in an aqueous solution containinga non-ionic detergent and sodium carbonate. Then the fatty matter was removed and the solventwas evaporated in ambient condition, then the samples were washed in distilled water. The �berswere cut and and dried at 100◦C for an hour. It was discovered that to obtain the maximumextraction is important to use 1 g/L sodium dodecyl sulfate as surfactant, and 2,6% (v/v)protease as savinase, in addiction to 8.6 and 6.4 g/L sodium hydrogen sul�te as reducing agentfor wool and feathers, respectively, at liquor to �ber ratio of 25 mL/g for 4 hr. Extracted keratinwere composed of high-sulfur matrix protein and β-keratin. FT-IR analysis shows that there arenot signi�cant changes in the structure of �ber after enzymatic hydrolysis (13).

14 CHAPTER 1. KERATIN
Figure 1.12: (I) water act as cross links and a swelling agent (II) water may replace the hydrogen bondsand (III) in the matrix, water may form a three dimensional keratin�water network (F12)
Wang et al. used sodium sulphide to dissolve human hair and to extract keratin. Wastehuman hair were washed, dryed and cut into 5-10 mm pieces. 1 g of hair is put into a mixedsolution containing 60 g/L sodium sulphide Na2S · H2O, 2 g/L of urea and 10 g/L of sodiumdodecyl sulfate. The solution was stirred every 30 minutes, to prevent the hair from sticking.After 120 minutes the solution was cooled and then �ltered, and the dried residue was weighed.The �ltrate was centrifuged and the supernatant liquid were dialysised for 48 h (every 12 h changedistilled water), then dried, and the keratin powder was obtained. In this condition dissolutionrate was more than 92,29%, and was found that increases with sodium sol�te concentration andwith an increase of dissolution temperature. The extraction rate of keratin was 62,98% (14).
Also Jiang Shui-qing et al. used sodium sul�te as two disul�de bond reducing agent, sodiumhydroxide as stratum corneum disrupting agent, twelve sodium dodecyl sulfate as keratin stabi-lizing agent. They found the e�ect of NaOH amount, of Na2SO3 and of reaction time on theyield of keratin. The yield of keratin increases with the increasing of NaOH amount (Figure 1.13)(15).
1.3.3 Sulphitolysis method
Sul�tolysis describes the cleavage of a disul�de bond by sul�te, in order to give a thiol and aS-sulfonate anion. Varesano et al. extracted keratin from wool by sulphitolysis with sodiummetabisul�te. First the �ber were washed in order to eliminate fatty matter. A solution of 300mL consisting of urea and Na2S2O5 was prepared, the cleaned �bers were added to this solutionand the pH value was adjusted to 6,5 with NaOH. The solution was shaked for 2 hours at 65◦C,then was �ltered (�lters had pore size of 30 µm and 5 µm) and dialyzed against distilled water,

1.3. EXTRACTION 15
Figure 1.13: FT-IR spectra of (a) wool and (b) feather (F13)
at room temperature for 3 days. After this time the keratin solution was frozen and lyophilizedin order to obtain keratin powder (16).
1.3.4 Use of ionic liquids
To accelerate dissolution of natural polymer, ionic liquids, a group of salts existing as liquids atlow temperatures, are used. They have di�erent advantages: are eco-friendly, non �ammability,chemical and therma stable, inexpensive and easly recyclable, in addition they have remarkablesolubility due to their own ionic structure comparing with traditional solvents.Yimei et al. selected common water-soluble imidazole ionic liquids to dissolve poultry feather andto extract keratin. Generally some additives are used, in order to improve extraction e�cency.In this case Na2SO3 is used to unfold the disulphide bonds and to accelerate the dissolution ofkeratin. Duck feather were used, after they were washed, dried and cut into small pieces. Theoptimum extraction conditions for keratin are: 20 wt.% of water in IL�water, 10 wt% Na2SO3
in liquid phase, the weight ratio of liquid/feather = 20, extraction temperature at 90◦C, andextraction time of 60 min. They found that amino acids of keratin and feather were the same:arginine, threonine, serine, glutamic acid, and cystine. They compared molecular weight valueof extracted ketarin with those of published data and found correspondance (17).

16 CHAPTER 1. KERATIN
1.3.5 Chemical-free hydrolysis
This method is environmental ecofriendly and is an alternative to traditional method: the use ofheat and pressure can break disul�de bridges and attacks the peptide backbone. It is possible tochoose between steam hydrolysis/steam explosion and superheat water. Steam explosion involveshot steam, between 180◦C and 240◦C, and a pressure of 1-3,5 MPa. The biomass is treated in thisconditions, and a compressive explosion follows, leading to a mixture of water-soluble peptides,free amino acids and a solid residue (18).Yin et al. proposed a method to extract keratin using water at 220◦C for 120 minutes. Inthis way total cystine bridges are cleavaged. The resulting oligopeptides had the ability toself-assemble in needle-like crystals which tend to nucleate heterogeneously and develop highlyrepetitive structures (19).
1.4 Oral bacteria and keratin
1.4.1 Oral bacteria
The oral cavity is formed by di�erent surfaces, each coated with a plethora of bacteria, calledbacteria bio�lm. Some of this bacteria are the cause of oral diseases, such as caries and periodon-titis, which are the most common (20). This characteristic microorganisms �nd in oral cavitya good environment to grow, thanks to the presence of water and nutrients and a moderatetemperature. Resident microbes of the water adhere to teeth and gum and are able to resistto �ow that would take them from mouth to stomach, where same of them are destroyed byhydrochloric acid (21).In oral cavity, an important role is played by saliva. It consist of approximately 99% water,containing various electrolytes, such as sodium, potassium, calcium, chloride, magnesium, bio-carbonate phosphate and proteins, enzymes, immunoglobulins, polypeptydes and oligopeptides.It has important functions in protection and lubri�cation of oral cavity, is responsible for initialdigestion, is critical for maintaining the chemical-physical integrity of tooth enamel, due to min-eralization and demineralization, and for tissue repair. Saliva has also antibacterical properties,due to the presence of: immunoglobulin A, which neutralize viruses, bacterial, enzyme toxins,lysozyme, which hydrolyze cellular wall of same bacteria, lactoferrin, which causes bacteriocidalor bacteriostatic e�ects on several microorganisms, perioxidase, which o�ers antimicrobial activ-ity (22).In oral cavity of healthy individuals, it is possible to distinguish two types of bacteria: Gram-positive and Gramnegative (Table 1.2), according to the result in the Gram stain test, used toclassify bacteria into two groups according to their cell wall. During the test a crystal violetstain is used: if bacteria take up the stain and appear to be purple-colored at microscope is aGram-positive bacteria; whereas if bacteria cannot retain the violet stain is a Gram-negativebacteria.
In the �rst case, the peptidoglycan layer in the bacterial cell wall is thick and rigid and retainsthe stain after the decolorization stage of the test; in the second case, alcohol degrades the outermembrane of gram-negative cells and makes the cell wall porous.In gram-negative bacteria, the peptidoglycan layer is between an inner cell membrane and bac-terial outer membrane. Gram-positive bacteria are more receptive to antibiotics than gram-negative bacteria because of the absence of outer membrane (23).

1.4. ORAL BACTERIA AND KERATIN 17
Table 1.2: Gram-positive and Gram-negative bacteria (T2)
1.4.2 Interaction between bacteria and keratin
A lot of studies show that keratin has the capacity to promote �broblasts proliferation and isresistant to enzymes that break down other proteins, such as trypsin, but there is a group ofenzymes capable of degrading keratin. Same of this are: protease, keratinase and beta-keratinase(24).In general degradation is con�ned to gram-positive bacteria, such as Bacillus, Lysobacter, Nester-nokia, Kocurica and Microbacterium, but recently it is discovered that also gram-negative bacte-ria have the same e�ect on keratin. These keratinolytic micro-organisms live in di�erent ecologicaland environment conditions and have di�erent capacities to degrade keratin.
Keratinolytic activity was studied by Mikx et al. using �uorescein isothiocyanate (FITC)-labeled keratin, obtained mixing keratin and FITC in 200 ml of 0.2 M carbonate bicarbonatebu�er and stirred for 4 h at room temperature. Labeled keratin was pelleted, washed in bio-carbonate bu�er and sterilized with acetone. Cells of several bacteria were grown, whashed andsuspended in 2.5 ml of 0.2 M phosphate bu�er with 1 mM dithiothreitol (DTT). To this sus-pension 0.5 ml of 0.4% (wt/vol) FITC-labeled keratin in the same bu�er was added, and thesuspension was then incubated for 24 h at 37◦C. The degradation of keratin was estimatedby measuring the �uorescence of the degradation products in the supernatant of the reactionmixtures in a luminescence spectrometer. It was been exploited the insoluble nature of substrateto separate it from FITC-labeled degradations products which are measurable in the surfactantof the reaction mixture. Di�erent high-molecular-weight products were released by the bacteriatested, indicating endokeratinolytic activity. DTT stimulated the activity and might have madethe keratin more accessible to enzymatic degradation by reduction of S-S bridges. Keratinolyticactivity varied among the di�erent bacteria and between strains of the same species (25).
Ri�el et al. studied a method to select and characterize microorganisms with keratinolyticactivity isolated from a poultry processing plant. Identi�cation is based on morphological andbiological tests and on the analysis of Gram-stained cells, and the results are compared withdata of standard species. Three isolates were Gram-negative, one was Gram-positive. Theyanalyzed the e�ect of temperature on growth and protheolytic activity. Bacterial strains wereisoleted from feather waste and were inoculated onto plates and incubated at 22◦C, 30◦C, 37◦C,46◦C, 55◦C for 24 hours. Bacteria presented di�erent temperature range of growth and optimalproteolytic activities between 30◦C and 37◦C. The capacity to degrade di�erent keratin wasteswas also eveluated: keratinase was producted on all substrate, but maximum value was obtainedon feather meal and feathers. Some of isolated showed maximum keratinolytic activity in shorter

18 CHAPTER 1. KERATIN
time than those of others. In addition, during feather degradation, pH values increased witha trend similar to other keratinolytic microorganisms and this represents an indication of thekeratinolytic potential of microorganisms (26).
Matikeviciene et al. selected keratin-degrading bacteria from poultry processing plant wastew-ater and studied their capacity to degrade chicken feathers. Keratinolytic activity was monitoredfor 24, 48 and 72 hours. All microorganisms were growth at 37◦C and showed di�erent levels ofkeratonylic activities, depending on cultivation time. The highest activity was observed after 48hours, except for one bacteria whose keratinolytic activity maximum was after 24 hours. After72 hours, keratonylic activity drecreased by all bacteria (27).
Cochis et al. studied antibacterial activity of Ag-doped keratin nano�bers. They analyzeduncoated mirror polished titanium surface, polished titanium surface with keratin nano�ber coat-ing and polished titanium surface with Ag-doped keratin nano�ber coating and studied bacterialadhesion after 24, 48 and 72 hours. Polished titanium surface was the most contaminated spec-imens. Polished Ti surface with keratin nano�ber has a behavior similar to the previous case.Good results have been obtained with the use of silver ions as antibacterial agent. It was foundthat silver damages bacterial cell membranes and can stop DNA transcription and cellular res-piration. Ag+ interacts with thiol groups and inhibits respiratory enzymes. The e�ect of silveris very rapid, a good result has been obtained after 24 hours and after 48 and 72 hours the Agantibacterial e�ect increases (28).
1.5 Fibroblasts and keratin
1.5.1 Fibroblasts
Fibroblasts, the principal active cells of connective tissue, �rst studied in the nineteen century,are large, �at and spindle-shape. Fibroblasts and �brocytes are two states of the same cells,the �rst refers to activate state, the latter to less active state. They derive from mesenchymalcells and have important functions in physiological process: synthesis of extracellular matrix andcollagen, epithelial di�erentiation, regulation of wound healing. They primarily contribute tothe secretion of extrarenal-matrix prophylaxis material to maintain the structural integrity ofconnective tissues. They secrete the necessary precursors for the production of all extracellularmatrix compounds, including the base material and its strands.Historically, human �broblasts lines were used to discover the pathogenesis of several diseases.In recent years, various studies have been conducted to verify the capacity of �broblasts toregenerate the skin structure (29).
1.5.2 Wound healing
The most important function of �broblasts is wound healing: in wounds, �broblasts are stimu-lated by di�erent factors, like epidermal growth factor (EGF) or transforming growth factor-β(TGF-β). Fibroblasts generate extracellular matrix, which represent a sca�old for other cellsand have cytosckeletal elements which reduce the size of lesion and promote wound healing (30).Wound healing process consist of 4 stages (Figure 1.14):
• Hemostasis: in the �rst minutes of injury, platelets in blood adhere to the injured site,assume amorphous shape, more suitable for clotting. In this way the activation of �b-rin occurs, which brings platelets to each other: a clot is formed, which prevent furtherbleeding;
• In�ammation: in this phase phagocytosis process occurs, in which white blood cells breakup damaged and dead cells, debris and bacteria;

1.5. FIBROBLASTS AND KERATIN 19
• Proliferation: this phase is characterized by angiogenesis, collagen deposition, granulationtissue formation, epithealization and wound contraction. In this stage �broblasts growthand form extracellular matrix, using collagen and �bronectin. Concurrently, epithelial cellsproliferate and form a cover on new tissue at the top of wound. The size of wound decreases;
• Maturation (remodeling): in the �nal stage collagen is realigned and cell no longer neededare removed (31).
Figure 1.14: Di�erent stages of wound healing: hemostasis, in�ammation, proliferation and maturation(F14)
1.5.3 Interaction between �broblasts and keratin
Wang et al. exploited the capacity of keratin to polymerize in aqueous solution to form hydrogels,whose properties were studied and compared with those of collagen hydrigels. Keratin, extractedby human hair, was mixed with 5 µl LDS bu�er and 2 µl sample reducing agent and made upto 20 µl with deionized water. The samples were heated at 75◦C for 10 minutes prior to gelelectrophoresis. After washing, membranes were blocked with 5% dry milk in phosphate-bu�eredsaline (PBS) containing 0.05% Tween20 (PBST) for 30 minutes and then incubated. The keratinsolution was adjusted to a concentration of 10 mg/ml and sterile-�ltered with a 0.2-µm cellulose�lter. Keratin gelation was started by mixing the required volume of keratin solution with 1MCaCl2 solution at a ratio of 50:1 (v/v). The mixture was kept in an incubator at 37◦C and5% CO2 overnight for complete gelation. To prepare collagen hydrogel the required volume ofcollagen was neutralized with 1 M NaOH in PBS and allowed to gel at 37◦C for 30 minutes.From a physical point of view, both structure are porous, but as it is possible to see in ScanningElectron Spectroscopy image, keratin hydrogel are characterized by smaller and interconnectedporous, whereas collagen hydrogel present a networks of long �brous bundles and a larger porousstructure, as shown in Figure 1.15. To study cell proliferation, the total amount of double-stranded DNA (dsDNA) was monitored. After 1 day from cell seeding, almost equal amountsof dsDNA were recorded in all samples, after 2 days, cell proliferation in keratin hydrogel waslower than in collagen hydrogels and controls. Between day 2 and day 4, dsDNA levels in keratinsample incresed by four time, in collagen and controls samples by seven and ten times. After 10days, cells proliferation reached a plateau in both hydrogels types. In keratin dsDNA levels was76% of that in collagen hydrogels. From a physical point of view, it is possible to see di�erecesbetween cells proliferate on keratin, collagen and control groups (Figure 1.16):
• cells in control group: assumed spindle shape from day 2 of culture, and mainteined thismorphology over day 4 and 6 (Figure 1.16 (a, d, g));

20 CHAPTER 1. KERATIN
Figure 1.15: Di�erent structure of Keratin and collagen hydrogels (F15)
• cells on keratin hydrogels: assumed spindle shape at day 6 of culture, before were round(Figure 1.16 (b, e, h));
• cells on collagen hydrogels: a small portion of cells exhibited spindle shape at day 4 ofculture, most cells at day 6 (Figure 1.16 (c, f, i)).
It is also possible to see that, in control and collagen groups, cells were homogeneously distributedon the whole surface, whereas in keratin group they were distributed in localized zones.Over the culture period of 6 days, the areas on the hydrogel surfaces on which cells were seededcontracted, whereas the rest of the surface area remained stable, resulting in the formation of aring on the hydrogel surfaces. (32)
1.6 Keratin-based biomaterials
Keratin is employed as biomaterial in di�erent applications, thanks to its physical, chemical andbiological behavior. Many studies have been done to fabricate and characterized keratin-basedproducts, such as �lms, �bers, coating materials, gels. The discovery of methods for modulatingphysical and mechanical properties led to the creation of biomaterials with the appropriatecharacteristics for their applications of interest (33).
Keratin �bers
Generally keratin is used in composites and nonwoven fabrics. Recently, the electrospinningprocess, used to create �ber of biopolymer with a very small diameters (in the range betweenmicro and nano scale), has been used with regenerated keratin extracted from hair and wool.Ferraris et al. tried to align keratin sub-micrometric �bers onto nanogrooved titanium surface inorder to study host tissue response. In this way, aligned keratin �bers impart both topographicaland chemical stimuli to �broblasts. In this case, it is suggested in dental implants, to improvesoft tissue healing around transmucolal implants and to create a seal against bacteria penetration(33).Nano�bers are mostly involved in tissue engineering, a great research area which involves the useof living cells with the aim of promoting remodeling of tissues in some active manners, or repair-ing, replacing, maintain, enhancing their functions. Speci�c characteristics for materials to be

1.6. KERATIN-BASED BIOMATERIALS 21
Figure 1.16: Fibroblast morphology and distribution: Cells growth on tissue culture plastic surface after2,4,6 days (a,d,g); cells grown on keratin hydrogel after 2,4,6 days (b,e,h); cells grown on collagen hydrogelafter 2,4,6 days (c,f,i) (F16)
used in medical applications are required: high porosity, with appropriate pore size distribution,high surface area, biodegradability, structural integrity, in order to avoid the collapse of poresduring neo-tissue formation. Electrospinning process allows to obtain complex �bers, seamlessand three-dimensional, that favor cells growth.
Esparza et al. used electrospun keratin nano�bers to produce sca�old for tissue engineeringapplications. To prepare the solution for electrospinning process, 5 g of PVA were dissolved into50 mL of deionized water, and was stirred overnight at 80◦C. After cooling 1,2 g of citric acidwas added as PVA crosslinking agent, and with the addition of NaOH the pH value was adjustedat 6,0. A keratin solution ( 1.0 g of freeze dried keratin powder was added in 10 mL of deionizedwater at room temperature), was added. The solusion was stirred and used in electrospinningprocess. The result is shown in Figure 1.17. A DSC analysis (Figure 1.18) showed that PVAmaintained crystalline structure after electrospinning and crosslinking, but caused shift in glasstransition and melting temperatures. Theraml treatment imparted water stability to nano�bers.Then cell proliferation tests were conducted: after 14 days of incubation, cell proliferation onmats containing feather keratin is higher than on PVA alone. It depends on the presence ofkeratin: proteins increase the adhesion and proliferation cells due to their integrin bond, keratinalso increased hydrophilicity, which leads to an increase in cell proliferation (34).Xinxin Zhao et al. tried to create a keratin-PCL sca�old with calcium phosfate coating for bonetissue rigeneration. A solution of 10% wt of PCL and keratin extracted from human hair wasprepared in HFIP, which allowed to obtain "beadless" �bers. Di�erent sca�olds were produced:PCL, PCL-keratin, CaP-PCL, CaP-keratin-PCL, HA-PCL.

22 CHAPTER 1. KERATIN
Figure 1.17: Electrospun PVA + feather keratin �bers (F17)
Mechanical tests, Figure 1.19, revealed that the presence of crosslinked keratin and CaP increasedmechanical strength of sca�olds. Also biological test were permormed: a culture of hMSCs was
Figure 1.18: DSC analysis of neat PVA, citric acid, and crosslinked PVA electrospun �ber mats (F18)
made on this sca�olds and analyzed after 4 days. This tests showed the cell viability on keratin-PCL e CaP-keratin-PCL was higher than PCL and HA-PCL, due to the presence of LDV cellbinding motifs on keratin in promoting cell adhesion (35).
Keratin �lms
Another important application of keratin involves the production of �lms, but they have a mainlimit: poor strength and �exibility. A lots of method have been studied in order to increasephysical strength and �exibility, maintaining biological activity.For example, Yamauchi created glycerol containing keratin �lms, with the addition of chitosan:mechanical strength was improved and the system showed antibacterial properties.

1.6. KERATIN-BASED BIOMATERIALS 23
Figure 1.19: Stress-strain curves of sCaP�cKeratin�PCL, cKeratin�PCL, PCL, sCaP�PCL, HA�PCL(F19)
Tonin et al. studied properties of poly(ethylene oxide) (PEO) and keratin blended �lms: keratininhibits PEO crystallization and PEO interferes with the keratin self-assembly at appropriatelevel by inducing β-sheet secondary protein structure with high thermal stability and good struc-tural properties (18).Atri et al. tried to improve mechanical properties of keratin �lms by dia�ltration. Keratin,extracted by wool, was puri�ed by conventional dialysis and a dia�ltration against a 10 kDamembrane with double distilled water was done. Several analysis were performed in order toevaluate any changes in keratin structure: dia�ltration did not change the components of keratinextract, the polypetide chains were arranged to β-sheet plate in form of crystallites. Mechanicaltest showed that dia�ltration has signi�cantly improved the mechanical properties of keratin �lmwith Young's modulus of about 13 MPa and 40% extensibility. Dia�ltration might also removesome polar amino acids such as tyrosine, this might a�ect the swelling, water absorption andconsequently mechanical properties of the keratin �lms (6).An alternative method to solution-cast keratin �lms is compression molding of S-sulfo keratinpowder, it allows to obtain translucent and �exible �lm with di�erent shape (4). Keratin �lmscan be applied in di�erent �eld.
Hamouche et al. used a keratin �lm to produce a humidity sensor. To produce the �lm, adroplet of keratin solution was placed on a glass-substrate and heated at 60◦C. After dryingthe �lm adhered to the surface and was transparent. The �lm obtained had not homogeneousthickness and was characterized by high surface roughness, was pourus and contained residualcuticle and cortical cells. The most important characteristics given by keratin �lm was thehydrophilic property critical for high-speed humidity sensor (36).
Sanchez Ramirez et al. used keratin and citric acid to produce a transparent �lm, to be usedin packaging for food industry. Keratin, extracted by wool, and citric acid were dissolved indistilled water and shaken. The solution was poured in a polyethylene bowl, then the �lm wasseparated from the support and cut. This �lm had a high elongation to break, but the mostimportant property of the �lm obtained was excellent antibacterial property, given by the actionof citric acid (37).
Keratin as biosorbent
Recently keratin has been used in application for the puri�cation of metal contaminated water.Conventional water treatment techniques require complicated operational set-up, are expensiveand selective for few materials. A lots of studied shows a binding of keratin wool to heavy metal

24 CHAPTER 1. KERATIN
ions. Keratin wool is used to remove metals such as mercury, copper, silver, chromium andaluminum. A type of keratin, called mohair, is used to remove copper from aqueous stream (4).
Zang studied biosorption capacities of keratin extracted from di�erent source: in particularit was found that the bleached and dyed hair were most capable to remove heavy metal ionsfrom aqueous solution.
Fadillah et al. used α-keratin-coated alginate Biosorbent for adsorption of Fe ions. To obtaina biosorbent human hair were used: a mixture of hair and alginate with some composition wasdissolved in 50 mL of water. The obtained α-keratin-alginate solution, encapsulated with CaCl22 % (w/v) solution immersed in ice cubes. The result was �ltered and dried at 60 oC for 8 hours.Then, the optimal composition was carried out by adsorption test on Fe ions in aqueous solutionat the optimum condition of pH (7.0) and contact time (60 minutes). It was showed that thecomposition between keratin and alginate can a�ect the density of the resulting composite. Thein�uence of pH and time is shown in Figure 1.20. As it is possible to see, the optimum pH valueis 7,0. The pH e�ect can be explained considering the carboxylic (�COOH) from alginate andamino (˘NH2) groups present from α-keratin on the biosorbent. At lower pH, the carboxylicgroups retain their protons and amino groups get protonated, thereby, reducing the probabilityof binding to any positively charged ions. In addition, at lower pH, this is mostly due to thecompetition of H+ ion adsorption with metal ions so it caused the adsoprtion capacity at lowpH is relatively small. While, at the pH more than 8 case the precipitation of iron hydroxide,Fe(OH)3 (38).
Figure 1.20: (a) In�uence of pH solution and (b) contact time to adsorption of Fe ions (F20)

Chapter 2
Coating
The term �coating� is used to indicate a solid or liquid material which is deposited on a substrateas a continuous or discontinuous �lm. The aim of coatings can be functional or aesthetic, orboth. Coatings are used to improve or change the surface properties of the substrate, such aswettability, corrosion or wear resistance, or to add completely new properties, such as magneticor electrical behavior, whereas aesthetic coatings are used to improve appearance. It is possibleto distinguish between coatings which cover the entire surface of the substrate, all-over coatings,and coatings which only cover parts of it, non-all-over coatings (39).
2.1 Coating deposition process and techniques
Coating deposition processes can be divided into di�erent groups, depending on the modes inwhich the coating is deposited:
• Vapor deposition: with this process a layer is deposited atom-by-atom or molecule-by-molecule. The thickness changes between one atom to millimeters and is possible to obtainmultiple layer by deposing di�erent materials. There are two main techniques for vapordeposition: PVD and CVD. In Physical Vapor Deposition (PVD) process, shown in Fig-ure 2.1 the material is vaporized from a solid or liquid source, atoms or molecules obtainedare transported in the form of vapor on the substrate and here they condense. This processoccurs in vacuum or low pressure. This technique allows to deposit thin �lms in the rangeof few nanometers to several nanometers. It is possible to deposit a single element, butalso an alloy by reactive deposition process: the reaction between the deposing materialsand the gas of the environment, or with a co-depositing material, occurs and compoundsare formed.
Di�erent materials can be used as coating or substrate: in Figure 2.2 is shown an exampleof PVD deposited coating: the substrate is a carbon �ber, which is covered with AlNcoating. It is possible to see the di�erences in surface characteristics between the uncoated�bre (b) and the �ber with AlN coating (a).
There are di�erent categories of PVD process, reassumed in Figure 2.3: vacuum deposition,sputter deposition, arc vapor deposition, ion plating.In vacuum deposition, also known as vacuum evaporation, the material to be deposited isevaporated from a thermally heated source and reaches the substrate without, or with littlecollisions with gas molecules. The vacuum allows to reduce contamination in the depositionsystem. The rate of this process is very high compared with that of others method.
In sputter deposition process, particles are physically ejected from a solid surface, called
25

26 CHAPTER 2. COATING
Figure 2.1: Scheme of Phisical Vapor Deposition (PVD) process (F21)
Figure 2.2: (a) AlN coating on carbon �bers, (b) uncoated �ber (F22)
target, by energetic bombarding particles, usually a gaseous ion accelerated by a plasma.The process occurs in vacuum in which there are few or no collisions of sputtered particles.
Arc vapor deposition involves the use of high current, low voltage arc, in order to vaporizean electrode (cathodic or anodic) and deposit the vaporized material on the substrate.
Another technique is the electron-beam physical vapor deposition (EBPVD), in which anelectron beam is used to bombard a target anode. Atoms are ejected from the target andtransformed into the gaseous phase which precipitate in solid form, creating a coating onthe substrate.
Ion plating, also known as ion-assisted deposition (IAD) or ion vapor deposition (IVD),involves current or bombarding particles, to deposit material vaporized by evaporation,sputtering, erosion or decomposition of a chemical vapor precursor (40).
Chemical vapor deposition (CVD) is a method which utilizes chemical vapor precursors,transformed in atoms or molecules by reduction or decomposition, which react on thesurface creating the coating. The atoms can also react with the gas in the system in orderto obtain a compound which is deposited on the substrate (39).Generally metals and ceramics are used as coating materials, deposited on various substrate.

2.1. COATING DEPOSITION PROCESS AND TECHNIQUES 27
Figure 2.3: PVD processing tecnhique:(a) Vacuum Evaporation, (b) e (c) Sputter Deposition in Plasmaenvironment, (d) Sputter Deposition in a vacuum, (e), (f), (g) Ion Planting in Plasma environmentwith a Thermal Evaporation Source, with a Sputtering source, with an Arc Vaporization source, (h) IonBeam-Assisted Deposition (IBAD) (F23)
In Figure 2.4 is shown a TiO2 coating on a glass substrate, deposited by CVD method.
It is possible to classify this process according to the value of pressure in: atmosphericpressure CVD, low pressure CVD and high pressure CVD, or in hot wall and cold wallCVD, if the chamber is heated by an external source and the substrate is heated by heatof the chamber, or if only the substrate is heated by induction or by a current, while thechamber is at room temperature (39)(40).
An important technique is the Plasma-enhanced chemical vapor deposition (PECVD) (Fig-ure 2.5): it is a chemical vapor deposition process in which chemical reactions, involved inthe process, occur after creation of a plasma of the reacting gases. The plasma is generallycreated by radio frequency (RF). PECVD process allows deposition at lower temperatures,which is often critical in manufacturing of semiconductors and of organic coatings, such asplasma polymers, that have been used for nanoparticle surface functionalization (41).
• Spraying: a coating can also be sprayed on a surface by a device which uses compressedgas, usually air, to atomized and direct the particles. Generally this technique is use tocover large surface with a uniform coating of liquid. Coating materials are in the form ofpowder, wire, or rod and are fed to a torch or gun with which they are heated to near orsomewhat above their melting point.
There are di�erent variants of this process. In general thermal spraying is a technique inwhich coating materials are melted by electrical or chemical means and sprayed in formof micrometers-size particles onto the surface (Figure 2.6). The coating obtained has athickness between few microns to several millimetres.

28 CHAPTER 2. COATING
Figure 2.4: TiO2 coating on glass substrate deposited by CVD technique (F24)
Plasma spray process (Figure 2.7) uses a DC electric arc to generate a stream of hightemperature ionized plasma gas, which acts as the spraying heat source. The powder ofthe material to deposit is injected outside of the gun nozzle into the plasma, where it ismelted, and hurled by the gas onto the substrate surface. The drops reach the substrate,then they �atten, solidify and form the coating. Changing di�erent parameters, such asplasma gas composition, �ow rate, feedstock type, distance between substrate and nozzle,is possible to obtained coating with the desired characteristics.
A variant is Vacuum plasma spraying: the process is done in a chamber at low pressure,the plasma is energized by an electrical �eld. In general the volatile plasma by-products areevacuated by the vacuum pump. Advantages of this low-pressure plasma technique includeimproved bonding and density of the deposit, improved control over coating thickness andallows higher deposit e�ciency.
The high velocity oxy-fuel spray (HVOF) (Figure 2.8) process is relatively recent. Thesystem involves a combustion chamber in which a mixture of gaseous and liquid fuel andoxygen are ignited and combusted. The combustion of the gases produces a high tempera-ture and high pressure in the chamber. The hot gas travels inside the nozzle and a powderof feed stock is injected in the gas stream and is accelerated towards the surface to becoated. Due to the high velocity of the particles, the resultant coatings are generally verydense, adherent and contain inclusions (42).
An example of the surface obtained by spraying technique is shown in Figure 2.9. In thiscase, Ni20Cr is used as material coating, deposited by plasma spray method.
• Other techniques: it is possible to mention converting coatings in which the surface of thematerial is subjected to a chemical and electrochemical reaction by the coating material.Planting is also important, in which a metal is deposited on a conductive surface. Thereare di�erent technique for this method, one of this involves a metal sheet placed on a solidsurface, and then it melts by applying heat and pressure. Examples include chromateconversion coatings, phosphate conversion coatings, bluing, black oxide coatings on steel

2.1. COATING DEPOSITION PROCESS AND TECHNIQUES 29
Figure 2.5: Scheme of Plasma-enhanced chemical vapor deposition (PECVD) (F25)
Figure 2.6: Scheme of Thermal spray process (F26)
(Figure 2.10). .
Another method is electroplating, in which metal in the ionic form creates a non-ioniccoating with the support of electrons. The system consists of: a chemical solution withthe ionic form of the metal, an anode and a cathode, where electrons are supplied toproduce the non-ionic coating. It is also possible to obtain a non-galvanic plating, exploitingsimultaneous reactions in an aqueous solution (39). This technique is used to obtain betteraesthetic characteristics or to improve properties of di�erent materials used as substrate.In Figure 2.11 is shown an aluminum substrate covered by electroplating, using bromidesalts to improve corrosion resistance.
In industrial processes, dip coating can be used to obtain thin �lm from sol-gels precursor.The process is divided in di�erent steps: the substrate is immersed in a solution of thecoating material and has remained inside the solution for a while. The thin layer depositsitself on the substrate while it is pulled up. The excess liquid will drain from the surface:with evaporation of the solvent, the thin layer is formed.An example is shown in Figure 2.12, which represents a rhodium dipping on yellow gold.

30 CHAPTER 2. COATING
Figure 2.7: Scheme of Plasma spray process (F27)
Figure 2.8: Scheme of High-Velocity Oxy-Fuel spray technique HVOF (F28)
Figure 2.9: Morphology of plasma spray Ni20Cr coating deposited by plasma spray method (F29)
Figure 2.10: Phosphate coating (F30)

2.1. COATING DEPOSITION PROCESS AND TECHNIQUES 31
Figure 2.11: Aluminum electroplating using bromide salts (F31)
Figure 2.12: Rhodium dipping on yellow gold (F32)

32 CHAPTER 2. COATING
2.2 Theory of adhesion
In a coating/substrate system, two di�erent materials are in contact and to make adhesionpossible, intrinsic adhesion forces must be generated at the interface. Surface chemistry, fracturemechanics, rheology, mechanics of materials and other subjects are involved in the descriptionof adhesive phenomenon.
To describe the theory of adhesion is important to note the di�erence between �intrinsicadhesion� and �measured adhesion�: the �rst refers to direct molecular forces of attraction be-tween coating and substrate, the second refers to the strength of bond which can be measuredwith methods that will be described later. There are several models that describe the adhesionmechanisms (43).
2.2.1 Mechanical interlocking theory
This model proposes adhesion as a result of the mechanical interlocking of the coating into thesuper�cial asperities and the pores of the substrate. In this theory, an important role is played byroughness, porosity and wettability of the substrate. The tensile strength depends on the creviceangle on the adhered surface, whereas shear strength is improved by a roughness increase.
Leeden and Frens indicated three di�erent type of super�cial irregularities (Figure 2.13), butonly defect "b" is important for interlocking adhesion, while the role of defects "a" and "c"depends on the direction of the applied force. In addition, coating material must have properviscosity in order to penetrate into the pores (43).
Figure 2.13: Three types of super�cial defects (F33)
Mechanical interlock is the dominant mechanicism that describes adhesion strength in asystem made up by metal substrate and polymeric coating. It was studied by Won-Seock at al.for steel/carbon �ber reinforced polymer system (Figure 2.14). They found that the adhesionstrength increases with an increase in roughness, and the mechanical interlock provokes energydissipation processes during fracture (44).
2.2.2 Chemical/adsorbition theory
This model, proposed by Sharpe and Schonhorn, is based on the interatomic and intermolecularforces established between atoms and molecules of the two surfaces. This forces include secondarybonds, such as Van der Waals bonds and hydrogen bonds, and primary bonds, like covalent, ionicand metallic bonds.Paint systems containg reactive functional groups, such as hydroxyl or carbonyl, tend to adheremore tenaciusly to substrate characterized by the same groups. For this reason, bi-fuctionalmolecules are used as adhesion promoters: one end has functionality which can react with paint,

2.2. THEORY OF ADHESION 33
Figure 2.14: Cross section of a steel/composite bonded interface (F34)
and the other end has funcionality wich can react with substrate, creating strong and durablebondings. They are based on silane and are employed as additive in paint formulation and asprimers on glass and metal substrates. An example of the covalent bond created at the interfacewith steel surface through chemisorption is represented in Figure 2.15 (45).
Figure 2.15: Chemical reaction of silane adhesion promoter with steel surface (F35)
Adsorption theory is also known as thermodynamic theory and involves wetting, rheological andchemical knowledge.In order to obtain a good wetting, the substrate must have a surface energy higher that that ofthe liquid coating, as it will be explained later. Metal, glass and certain polymers have highersurface energy than that of paint binders, so this materials can be used as substrate. In samecases, certain plastic substrates with very low surface energy, such as polypropylene, siliconrubber, �uoroplastics, can be used as substrate if they undergo surface preparation processes,(chemical treatment, �ame, corona treatment), which increase surface energy. (45)
2.2.3 Acid-base theory
Fowkes et al. proposed acid-base interactions as a major type of intrinsic adhesion force. Thetwo surfaces can be behavior as an acid by accepting electron (a Lewis acid) or proton donation(Bronsted acid), as a Lewis base by donating electrons or accepting protons, or possessing bothacid and basic behavior (43)(46).This mechanisms were studied by Neubauer et al. analysing the acid-base interection of aromaticsulfur heterocycles adsorbing on Ag-Al2O3. As it is possible to see in Figure 2.16, three types ofbond are created: π-Ag, S-H and S-Ag. The �rst type, π-Ag, has a high adsorption energy and isformed by two mechanisms: the silver cations form the usual σ-bonds with their s orbitals, and

34 CHAPTER 2. COATING
the d orbitals of the silver cations can back-donate electron density to the antibonding π-orbitalof the sulfur heterocycles. S-Ag interaction is based on the hard and soft acid base (HSAB)theory: the silver cation of Ag-Al2O3 is a soft acid, while the sulfur heterocycles are Lewis base,where the S-atom has two lone pairs of electrons: a σ lone-pair and one π lone-pair electron. AlsoS-Ag interaction is described by HSAB theory: the silver cation acts as soft acid and interactswith the sulfur heterocycle as a soft base (47).
Figure 2.16: Creation of π-Ag, S-H and S-Ag bonds (F36)
2.2.4 Di�usion or interdi�usion theory
In this theory, adhesion is the result of interdi�usion of the macromolecules of the two materials(Figure 2.17). Some characteristics are required: molecules at the interface must be mobileenough to mix with one other, the two materials must have similar solubility parameters andmust be miscible and compatible (43). In general, this type of adhesion occurs between twopolymers: a transient zone is formed by the interaction of the macromolecules of the super�ciallayers. Macromolecules play an important role in determinating the strength of the bond, which isin�uenced by chain length of the macromolecule, polymer structure, contact time, concentrationand temperature (43).
Figure 2.17: Di�usion theory of adhesion (F37)
2.2.5 The electrostatic attraction theory
The electrostatic attraction theory is based on the mutual sharing of electrons at the interfacebetween the two materials. In this case an electrostatically charged double layer of ions is formedat the interface and the system is seen as a capacitor. This model is applicable between twoincompatible materials, such as metal and polymer, as shown in Figure 2.18. The attraction

2.2. THEORY OF ADHESION 35
forces occur when one surface carries a net positive charge and the other a net negative charge.The forces at the interface depends on the charge density (43). For example, this type of adhe-sion bond is created between low density polyethylene (LDPE) and Aluminum substrate. Thepresence of the electric double layer a�ects the mechanical behavior at the inteface. This model
Figure 2.18: Electrical double layer formed at the interface between a polymer and a metal (F38)
is applicable in the case of incompatible materials, such as polymer and metal.

36 CHAPTER 2. COATING
2.3 Thermodynamic theory of adhesion
From a thermodynamic point of view, the adhesion of a coating to a substrate depend on di�erentparameters, such as free energy of the surface, wettability, forces of attraction.
When a liquid drop is deposited on a surface, the liquid can spontaneously spreads on thesurface forming a thin �lm or can form a sessile droplet on the surface. In the �rst case, anintimate molecular contact is established and results in the elimination of air pockets and inthe penetration of the liquid in the asperities of the surface. In the second case, the adhesionof the �lm to the substrate is worse. The behavior depends on the surface tension of the twocomponents and it is possible to de�ne a contact angle by the Young's equation:
γs = γsl + γl cos θ
where γs is the surface tension of the solid substrate in equilibrium with the saturated vapor ofthe liquid, γsl is the interfacial surface tension of the solid and the liquid drop, γl is the surfacetension of the liquid in equilibrium with its own saturated vapor and θ is the contact angle formedbetween the solid-liquid interface (Figure 2.19). Depending on the value of the super�cial tension,and consequently of the contact angle, it is possible to de�ne if a surface is wettable by a liquidand this is important for the formation of adhesive bond: coating with surface energy less thanthat of the substrate will wet the surface and if an intimate contact between coating and substrateis achieved, a physical interaction develops, forming strong bonds. It is necessary to specify thatspreading is not the only requisite for a good adhesion, but it is highly desirable for maximizingcontact area and minimizing interfacial �aws and defects.
When molten powders are deposited on the surface, coalescence must occur (Figure 2.20): itdepends on surface tension, radius of curvature, and viscosity of the molten powder. In order tominimize coalescence time, low viscosity, small particles and low surface tension are required.
Figure 2.19: Liquid drop on solid surface in equilibrium (F39)
Figure 2.20: Coalescence of molten powders (F40)
Another important aspect, that must be taken into account, is represented by the forcesof attraction or Van der Waals forces: when atoms or molecules are brought su�ciently close,exhibit attraction for each other. In some cases, repulsion can occur: if there are �xed electricalcharge distribution or �xed magnetic polarization, or when the matter is compressed enough

2.4. MACROSCOPIC ADHESION TESTING 37
that outer electron orbits begin to interpenetrate each other. Van der Waals forces are thesum of three contributes. �London forces� or �dispersion forces� are caused by the �uctuationin the electron density that produces temporary electrical dipoles, which generate attraction(Figure 2.21). This forces are common to all the matter in fact, despite being weak interactions,cumulative e�ect is great. The second contribute is given by the so-called �Keesom forces�, which
Figure 2.21: London forces (F41)
represent the attraction between permanent dipoles and depend on the dipole moments of thetwo molecules (Figure 2.22).
Figure 2.22: Keesom forces (F42)
The third contribute is given by �Debey forces� which represent dipole-induced dipoles forces,caused by a permanent dipole which induces a dipole in a neighboring molecule, and in this casethe potential energy of interaction is proportional to molecular polarizability (Figure 2.23).
Also acid-base interactions lead to strong bonding, for example are hydrogen bonding, Lewisacid�base interactions, and Brønsted-type acid�base interactions (43)(46)(48).
2.4 Macroscopic adhesion testing
As it has been said before, coatings are used to improve or to add properties or certain charac-teristics of the substrate. To achieve this goal, it is important that the coating is adherent to

38 CHAPTER 2. COATING
Figure 2.23: Debey forces (F43)
substrate without degrading the behavior of the system. To evaluate it, adhesion tests are madeon the coating and the substrate, in this way adhesion level is analyzed. When the adhesionof coating is evaluated, it is possible to study the pre-treatment of the piece and how di�erentparameters can a�ect the coating behavior.
The American Society for Testing and Material (ASTM), de�nes adhesion as "the state inwhich two surfaces are held together by interfacial forces which may consist of valence forces orinterlocking forces or both" (49). The experimental adhesion can be de�ned as the maximumforce per unit area exerted when two materials are separated; or as the work done in separatingtwo materials from one another. In practice, plastic phenomena always occur and this does notallow to evaluate the true work of adhesion (50).
The weak boundary layer theory explain the fact that bond failure at the interface is causedby either a cohesive break or a weak boundary layer. Failure can occur in the adhesive oradherend, if impurities are concentratesd near the bonding surface and form weak attachmentto the substrate.
Bikerman indicated seven di�erent classes of weak boundary layers (Figure 1.10), such as airpores, impurities at the interface, and reactions between two components (43)(51).
Figure 2.24: Theory of weak boundary layers. (1) air pores, (2) and (3) impurities at the interface, (4),(5), (6), and (7) reactions between the two materials (F44)
2.4.1 Cause of failure
Di�erent factors, acting alone or in combination, can put under stress the bonding betweencoating and substrate, causing the destruction of the system (Figure 2.25). One of the �rst

2.4. MACROSCOPIC ADHESION TESTING 39
cause of failure is represented by mechanical stress, which can involves the bulk of the systemand the interface zone. In this case, the two common types of stress are tensile stress, actingperpendiculary to the surface and shear stress, acting on the plane of contact. Also changes intemperature can cause the failure of the system: if the two materials have di�erent coe�cientsof expansion, at the interface stress condition occur, this event is disadvantageous because thee�ect of the temperature is less evident than mechanical or chemical e�ects. It is also possiblea chemical cause, if some molecules such as water, gases or ions, penetrate in the coating andachieve the interface zone, causing the loss of adhesion (48). Depending on substrate and coating
Figure 2.25: Cause of failure of coating/substrate system (F45)
properties, di�erent types of possible failure can occur in any adhesion test, and, from the surface,the failure can propagate into the substrate (Figure 2.26)(50).
2.4.2 Adhesion test
Adhesion test methods are divided into three groups: nucleation methods, mechanical methodsand miscellaneous methods. In nucleation methods, it is evaluated the breaking of individualcoating-substrate atomic bond and the sum of the individual atomic forces constitutes the macro-scopic adhesion. This methods are based on measurement of nucleation rate, critical condensationand residence time of the depositing atoms. Mechanical methods use di�erent technique to re-move the coating from the substrate. It is possible to divide this methods into two groups, ifthere is a detachment normal of lateral of the �lm from the substrate. Miscellaneous methods aretechniques that cannot be labelled as practical test, but can have a academic interest (50)(52).
The most common technique are:
• Pull-o� test: it is the simplest and most used test to evaluate coating-substrate adhesion.The ASTM D4541 standard describes test apparatus and protocols: a dolly is glued ontothe coated surface and then is pulled exerting a perpendicular forces on the surface inorder to remove the coating (Figure 2.27) (52). Generally, to glue the dolly to the coatinga two-component epoxy-adhesive are used. Using this test, it is possible to evaluate:
1. The maximum perpendicular force that can be applied on surface area before a pieceof material is detached;
2. If, at a de�ned load, the coating remains intact or not.

40 CHAPTER 2. COATING
Figure 2.26: Types of failure of coating/substrate system (F46)
This method presents di�erent disadvantages: the forces involved are a sum of tensileand shear forces, so is di�cult to distinguish and interpret them, it is necessary a perfectalignment on the interface, in order to obtain a uniform loading, it is possible that theadhesive or the solvent using during the test may penetrate the coating, changing itscharacteristics and behavior.
A pull-o� test was conducted by Yanli Cai et al. on magnesium-containing hydroxyapatite(MgxFHA) coating on Ti-6Al-4V substrate. The test was performed using a Al-rod gluedonto the coating surface with an epoxy resin and was cured at room temperature for 24 h.SEM analysis was used to evaluate the failure mode at the fracture interface. Figure 2.28shows the results of pull-test on Mg0FHA (a) and on Mg2FHA (b) on Ti-6Al-4V. As itis possible to note, cohesive fracture occurs in both cases (53).
A variant of this method is the tangential shear or lap shear technique, in which a parallelforce is applied on the surface and the shear stress measured represent the tangential forceper unit area required to break the bond between coating and substrate.
• Ultracentrifugal method: this method is used in order to avoid the use of adhesive or solder.The sample is spun at extremely high speed. At a critical high speedy rotation, coatingseparates from the substrate, because can no longer withstand the centrifugal stress.
• Cross-cut test: in this case, to evaluate the adhesion of the coating, a lattice pattern is cutinto it, using di�erent cutting tools. The test is based on the ammount of coating �akesseparated from the substrate (48). An example is shown in Figure 2.29.
• Scratch test: the standard ASTM C1624-05 for scratch adhesion testing de�nes modes toevaluate strength and failure of coatings on metallic or ceramic substrates. In this test, adiamond stylus is used to create a scratch on the coating surface, applying a stepwise or
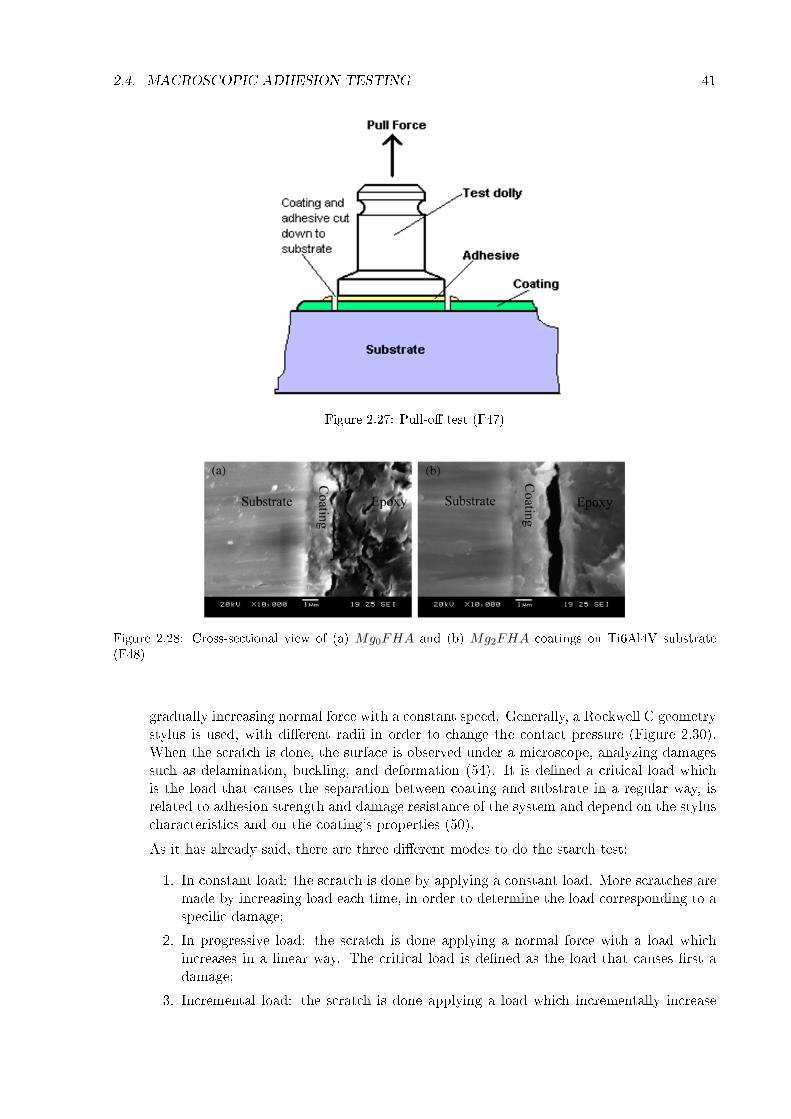
2.4. MACROSCOPIC ADHESION TESTING 41
Figure 2.27: Pull-o� test (F47)
Figure 2.28: Cross-sectional view of (a) Mg0FHA and (b) Mg2FHA coatings on Ti6Al4V substrate(F48)
gradually increasing normal force with a constant speed. Generally, a Rockwell C geometrystylus is used, with di�erent radii in order to change the contact pressure (Figure 2.30).When the scratch is done, the surface is observed under a microscope, analyzing damagessuch as delamination, buckling, and deformation (54). It is de�ned a critical load whichis the load that causes the separation between coating and substrate in a regular way, isrelated to adhesion strength and damage resistance of the system and depend on the styluscharacteristics and on the coating's properties (50).
As it has already said, there are three di�erent modes to do the starch test:
1. In constant load: the scratch is done by applying a constant load. More scratches aremade by increasing load each time, in order to determine the load corresponding to aspeci�c damage;
2. In progressive load: the scratch is done applying a normal force with a load whichincreases in a linear way. The critical load is de�ned as the load that causes �rst adamage;
3. Incremental load: the scratch is done applying a load which incrementally increase

42 CHAPTER 2. COATING
Figure 2.29: Cross-cut test (F49)
Figure 2.30: Scratch test (F50)
(54).
The Figure 2.31 shows the scratchs obtained applying the di�erent techniques. It is possi-
Figure 2.31: Three di�erent scratchs obtained by applying constant load, progressive load and incrementalload (F51)
ble to use an acoustic emission sensor to detect any high-frequency elastic waves generatedin coating/substrate system, which indicates delamination, cracking, chipping.Choudhary and Mishra studied adhesion of Aluminum Nitride coatings, deposited at dif-ferent temperatures on a stainless steel substrate, using acoustic emission during scratchtest. In Figure 2.32 (a), it is possible to see the acoustic emission curves recorded duringscratch test, at three di�erent substrate temperatures: the acoustic emission kept low andwas less than 1.5%. This indicates that the coating is relatively ductile and has lower de-fect density, such as voids and cracks and also possesses low intrinsic stresses. The ductilenature of AlN coating increases with temperature, infact the depth of penetration of the

2.4. MACROSCOPIC ADHESION TESTING 43
indenter increases in coating formed at higher temperatures, as shown in Figure 2.32 (b).Figure 2.33 shows optical images of scratch test in progressive mode on coating obtainedat 400◦C. It can be easily observed that till the end load (20 N), there is no adhesivedelamination in the coating. Moreover, at the end load (20 N), only �ne pores could beseen along the scratch track (55).
Figure 2.32: (a) acoustic emission and (b) penetration depth curves obtained by scratch test on AlNcoatings formed at di�erent temperature (F52)
• Indentation and shockwave-loading methods: a crack at the interface coating-substrate ismechanically created using conventional indentation procedures. In this case, most of thedeformation occurs within the �lm, but there is a certain debonding e�ect at the interface.The adhesion is related to the crack propagation resistance. The bond between coatingand substrate is uniquely related to the fracture resistance, which involves the residualstress and the strength controlling defect. According to this test, if at the interface of theplastic zone created by indentation, cracks are formed, this area has a lower thickness thanthe coating and substrate. If the coating or the substrate breaks before the separationat the interface occurs, the interface toughness is at least as large as that of the weakercomponent. In the Figure 2.34 it is shown a scheme of the indentation coating adhesion�lm and how the crack size changes with load increasing. In some techniques, the aim is toproduce delamination by shockwave loading methods. It is possible to use erosive particlesor a laser beam and the results depending on the energy absorption by the coating.The laser method involves a laser which probes the coating surface and the absorbedenergy induces a stress way which can be monitored. If the incident probe is pulsed, the

44 CHAPTER 2. COATING
Figure 2.33: Optical stratch images obtained on AlN coating at di�erent loads (F53)
propagation of thermal way is used to detect zone with cracks or debonded regions (50).This test was conducted by Campos-Silva et al. in order to analyze adhesion betweenFeB/Fe2B on the surface of borided AISI 316 steel. Boriding is a thermochemical processwith the aim of improving hardness through a di�usion of boron in a clean metal steelsurface at high temperature. Vickers interfacial indentation tests were performed withindentation selected from a range of 0.49 to 2.9 N based on the FeB layer thickness. Theresults are shown in Figure 2.35 and show that the fracture resistance at the interface is afunction of the FeB layer thickness: if the FeB layer deep increase, the capacity to resistthe initiation and propagation of a crack at the interface increases. The same behavior wasobserved across the set of boriding conditions for the adherence of the FeB/Fe2B system.In addition, it was evaluated that the compressive behavior and intensity of residual stressesdecreased as the FeB coating thickness increased (56).
• Impact test: it is important for determining the stone-chip resistance of coatings. A steelball hits the surface and the transfer of forces through the coating leads to a debonding.In the debonding area, there are two types of stress: compressive stess in the center ofthe circular detachment zone and shear stress in the annular region. Considering thedimensions of the debonding area, it is possible to evaluate adhesion forces of the coating(Figure 2.36). The e�ect of di�erent factors must be taken into account: coating thickness,mass, diameter and speed of the steel ball and its time of impact (48).
Bouzakis et al. studied adhesion of TiAlN coating obtained by PVD, with nano-impacttest: the indenter reaches the surface and is re-accelerated from a small distance againstthe �lm. An appropriate automation enables repetitive impacts at the same position onthe sample surface at a set frequency. The evolution of the indentation depth duringthe repetitive impacts is continuously monitored. The results were compared with thoseobtained by FEM calculation. These results show that, by the developed FEM simulationmodel, the �lm loading, fracture initiation and evolution can be accurately described (57).
• Thermographic detection of defect: with this method, a mapping of the distribution oftemperature on the surface is obtained. It is possible to detect defects and debondingareas: the heat �ux proceeds toward the surface, and it is constant, if it does not encountera defect or debonding area, that produces variations in the surface temperature, as it ispossible to see in Figure 2.37 (48).
• Blister method: in this method, a �uid is injected at the interface between coating andsubstrate. An increase of the hydrostatic pressure causes the separation of the coating from

2.5. INFLUENCE OF DIFFERENT FACTORS ON COATING ADHESION 45
Figure 2.34: Indentation coating test (F54)
the surface (58).
• X-ray method: it is a nondestructive method in which a X-ray spectroscopy is used tostudy qualitatively the adhesion of epitaxial coating deposited on single-crystal substrateand the strength of the bond. It is possible to use this technique only under conditions, inaddition no numerical values are obtained (58).
• Pulsed-laser or electron beam method: the substrate is only partially covered by the coatingand a laser or an electron beam is used to generate a compressive stress waves in the surfacenon covered. The wave propagates through the sample and it is re�ected by the coatedsurface and inverted into a tensile wave (58).
2.5 In�uence of di�erent factors on coating adhesion
In all applications, the performance of the �nal product depends on the bond created betweencoating and substrate. For this reason, several studies have been done with the aim of determingthe factors which controls adhesion and improve the characteristics of the system. For example,surface treatments allow to obtain a good coating/substrate interfacial adhesion.
A properly prepared surface provides a better adhesion of the coating and the formation ofstrong bond at the interface. First of all, the surface has to be clean: it is necessary to eliminateabsorbed molecules which can evaporate at the contact with the coating, creating splashing andpores, causing a decrease in mechanical behavior of the coating and substrate and low adherence(59).

46 CHAPTER 2. COATING
Figure 2.35: Vickers interfacial fracture toughness on FeB/Fe2B system: (a) 0.98 N, (b) 1.96 N, and (c)2.94 N (F55)
Moura e Silva et al.(60) studied the adhesion problems of two systems: two coatings of W-Ti-N and W-DLC:H (W-Diamon Like Carbon) deposited by a reactive unbalanced magnetronsputtering semi-industrial equipment, on pieces of (111) mono-oriented Si and Aisi M2 highspeed steel used as substrates. Substrates were cleaned in acetone and ethanol ultrasonic bathsand then where placed in the deposition chamber. Before deposition they were cleaned by ionbombardment. They compared the results with analysis developed previously on the same typeof coatings at laboratory level.Results from scratch-test reveal that critical load, function of the partial pressure of the reactivegas, of the coating W-Ti-N is lower in industrially deposition if compared with those laboratorydeposited ones. The same result has been found for W-DLC:H coatings. To explain the problemof adhesion, an RBS/ERDA (Rutherford Backscattering Spectrometry/Elastic Recoil DetectionAnalysis) elemental spectra of a W-DLC:H is done and reveals the presence of W accumulationat the substrate/interlayer interface. Regarding W-Ti-N coating, in order to understand if atthe interface there is contamination due to the presence of oxygen in the residual atmosphere
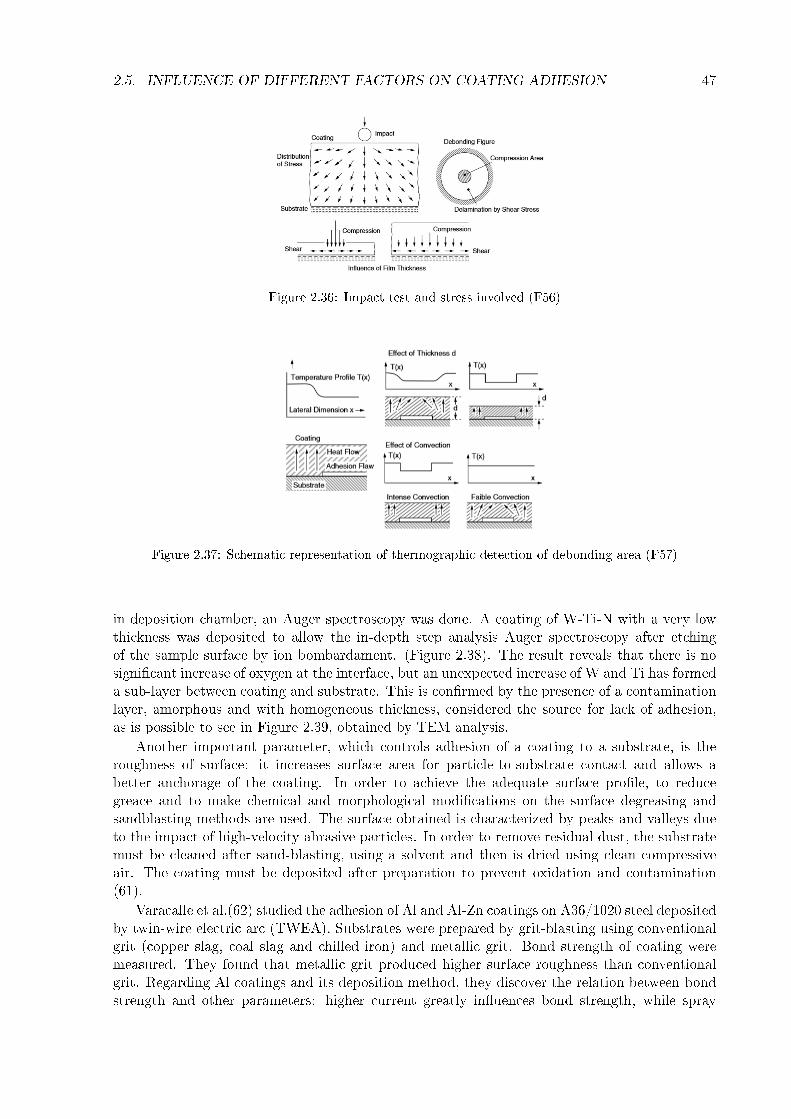
2.5. INFLUENCE OF DIFFERENT FACTORS ON COATING ADHESION 47
Figure 2.36: Impact test and stress involved (F56)
Figure 2.37: Schematic representation of thermographic detection of debonding area (F57)
in deposition chamber, an Auger spectroscopy was done. A coating of W-Ti-N with a very lowthickness was deposited to allow the in-depth step analysis Auger spectroscopy after etchingof the sample surface by ion bombardament. (Figure 2.38). The result reveals that there is nosigni�cant increase of oxygen at the interface, but an unexpected increase of W and Ti has formeda sub-layer between coating and substrate. This is con�rmed by the presence of a contaminationlayer, amorphous and with homogeneous thickness, considered the source for lack of adhesion,as is possible to see in Figure 2.39, obtained by TEM analysis.
Another important parameter, which controls adhesion of a coating to a substrate, is theroughness of surface: it increases surface area for particle-to-substrate contact and allows abetter anchorage of the coating. In order to achieve the adequate surface pro�le, to reducegreace and to make chemical and morphological modi�cations on the surface degreasing andsandblasting methods are used. The surface obtained is characterized by peaks and valleys dueto the impact of high-velocity abrasive particles. In order to remove residual dust, the substratemust be cleaned after sand-blasting, using a solvent and then is dried using clean compressiveair. The coating must be deposited after preparation to prevent oxidation and contamination(61).
Varacalle et al.(62) studied the adhesion of Al and Al-Zn coatings on A36/1020 steel depositedby twin-wire electric arc (TWEA). Substrates were prepared by grit-blasting using conventionalgrit (copper slag, coal slag and chilled iron) and metallic grit. Bond strength of coating weremeasured. They found that metallic grit produced higher surface roughness than conventionalgrit. Regarding Al coatings and its deposition method, they discover the relation between bondstrength and other parameters: higher current greatly in�uences bond strength, while spray

48 CHAPTER 2. COATING
Figure 2.38: Auger in-depth pro�le chemical composition results of a W�Ti coating (F58)
Figure 2.39: HR-TEM micrographs of the interface substrate/interlayer zone of a W�DLC:H coating(F59)
distance and low pressure contribute less to the increase of the adhesion force. Consideringsubstrates covered with Al-Zn, it is possible to note that bond strength is higher in surfacetreated using metallic grit, in the same way of previous case.
But grit-blasting process presents some disadvantages: it causes a microcracks on the sub-strate and the decrease of mechanical properties, in addition disposal of chemical waste must beconsidered (63). As it has already said, inclusion of sand on the surface can have the oppositee�ect and can decrease the coating adhesion. In order to avoid this problems, physical andchemical modi�cations, required to have better adhesion, are obtained with new pretreatmentssolutions.
Danlos et al.(63) tried an alternative method to clean and prepare the surface of the substrateby using a laser. This new method is characterized by the combination of cleaning and heatinglaser process and is conducted before the deposition of a coating by thermal spay method,two lasers are used: a �rst millisecond laser heats the surface and a nanosecond ablation lasercleans it (Figure 2.40). In order to optimize the process and to bene�t from the maximumsurface temperature, a delay between the two lasers is chosen. The laser preheating actionis fundamental to avoid the distortion of the substrate or soot deposition which occurs withtraditional methods. They studied two substrates: Aluminum alloy 2107 and titanium alloyTi-6Al-4V, both were mechanically polished to a mirror surface, before being subjected to lasertreatment. The morphologies of the two surfaces were analyzed by a SEM and are shown inFigure 2.41: it is possible to see the di�erence between Aluminum 2107 (1) and Ti-6Al-4V (2)substrates, before the treatment (a), sandblasted (b), after a preheated by laser (c) and after
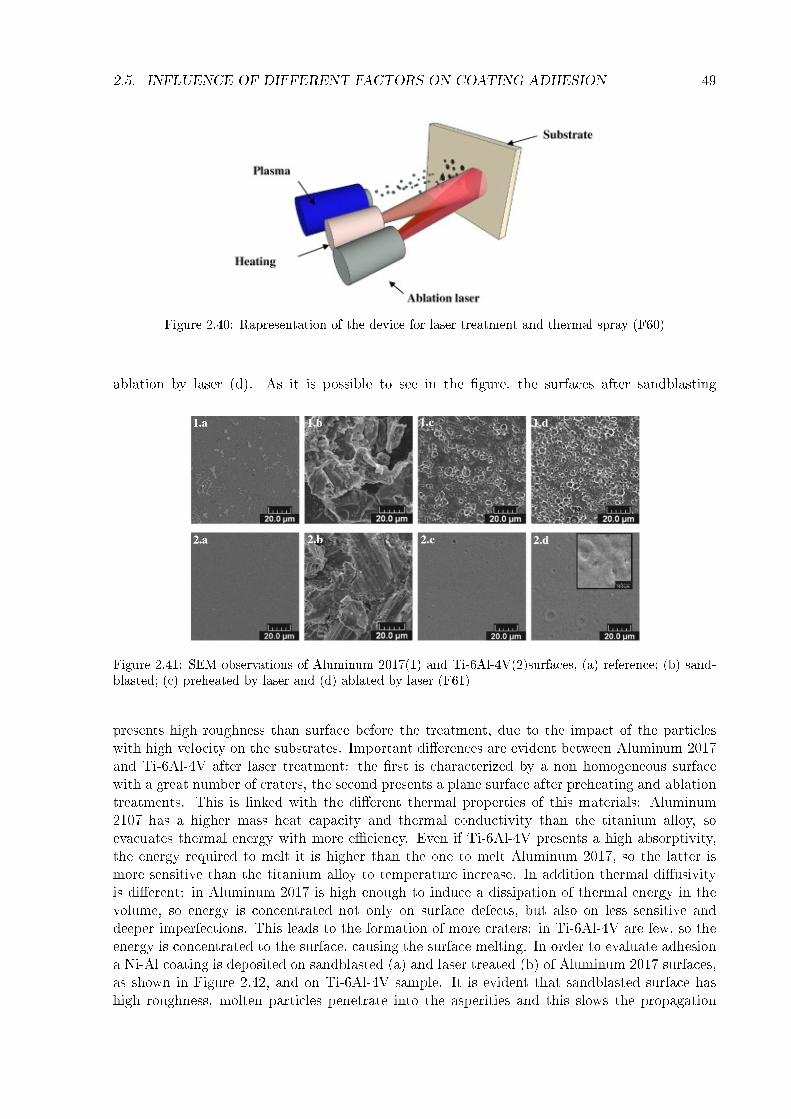
2.5. INFLUENCE OF DIFFERENT FACTORS ON COATING ADHESION 49
Figure 2.40: Rapresentation of the device for laser treatment and thermal spray (F60)
ablation by laser (d). As it is possible to see in the �gure, the surfaces after sandblasting
Figure 2.41: SEM observations of Aluminum 2017(1) and Ti-6Al-4V(2)surfaces, (a) reference; (b) sand-blasted; (c) preheated by laser and (d) ablated by laser (F61)
presents high roughness than surface before the treatment, due to the impact of the particleswith high velocity on the substrates. Important di�erences are evident between Aluminum 2017and Ti-6Al-4V after laser treatment: the �rst is characterized by a non homogeneous surfacewith a great number of craters, the second presents a plane surface after preheating and ablationtreatments. This is linked with the di�erent thermal properties of this materials: Aluminum2107 has a higher mass heat capacity and thermal conductivity than the titanium alloy, soevacuates thermal energy with more e�ciency. Even if Ti-6Al-4V presents a high absorptivity,the energy required to melt it is higher than the one to melt Aluminum 2017, so the latter ismore sensitive than the titanium alloy to temperature increase. In addition thermal di�usivityis di�erent: in Aluminum 2017 is high enough to induce a dissipation of thermal energy in thevolume, so energy is concentrated not only on surface defects, but also on less sensitive anddeeper imperfections. This leads to the formation of more craters: in Ti-6Al-4V are few, so theenergy is concentrated to the surface, causing the surface melting. In order to evaluate adhesiona Ni-Al coating is deposited on sandblasted (a) and laser treated (b) of Aluminum 2017 surfaces,as shown in Figure 2.42, and on Ti-6Al-4V sample. It is evident that sandblasted surface hashigh roughness, molten particles penetrate into the asperities and this slows the propagation

50 CHAPTER 2. COATING
Figure 2.42: Cross section of Ni�Al coatings on Aluminum 2107 surfaces sandblasted (a) and preheated(b) (F62)
of the cracks, but it is possible to see that coating is not totally adhered to the surface, butat interface there are voids and grain inclusions. Conversely the irradiated surface is smootherand there is a good contact between coating and substrate. The adhesion of the coating to thesubstrate is evaluated by interfacial indentation. The results show that the adhesion seems to bedirectly connected with roughness: interfacial adhesion is higher on sandblasted surface. From amorphological point of view, by the same laser treatment, surface of Ti-6Al-4V is smoother thansurface of Aluminum 2107, considering the adhesion value, the results reveal that in addition tophysical anchorage, an important rule is played by chemical a�nity. In aluminum surface anoxide layer has been observed, which increases bagnability of the surface and consequently theadhesion of the coating, whereas no oxygen has been detected in Aluminum 2107 surface. So amixture of mechanical anchorage and chimical a�nity seems to be most favourable to increasethe adhesion at the interface.
Another laser treatment used to incease strength of bond at the interface is the texturinglaser, which consists in creating holes on the surface, with precise diameters following a presetpattern (Figure 2.43). Its e�ciency depends on laser and scanner parameters such as hole'sgeometry, the frequency and power of the laser. The chemical and mechanical modi�cationsinduced, increase the contact area between coating and substrate.
Figure 2.43: Schematic representation of laser textured surface (F63)
Kromer et al. studied the adhesion of a Ni-Al coating, deposing by atmospheric plasmaspray, on 2017 aluminum surfaces treated in two di�erent ways: the �rst one by grit-blasting
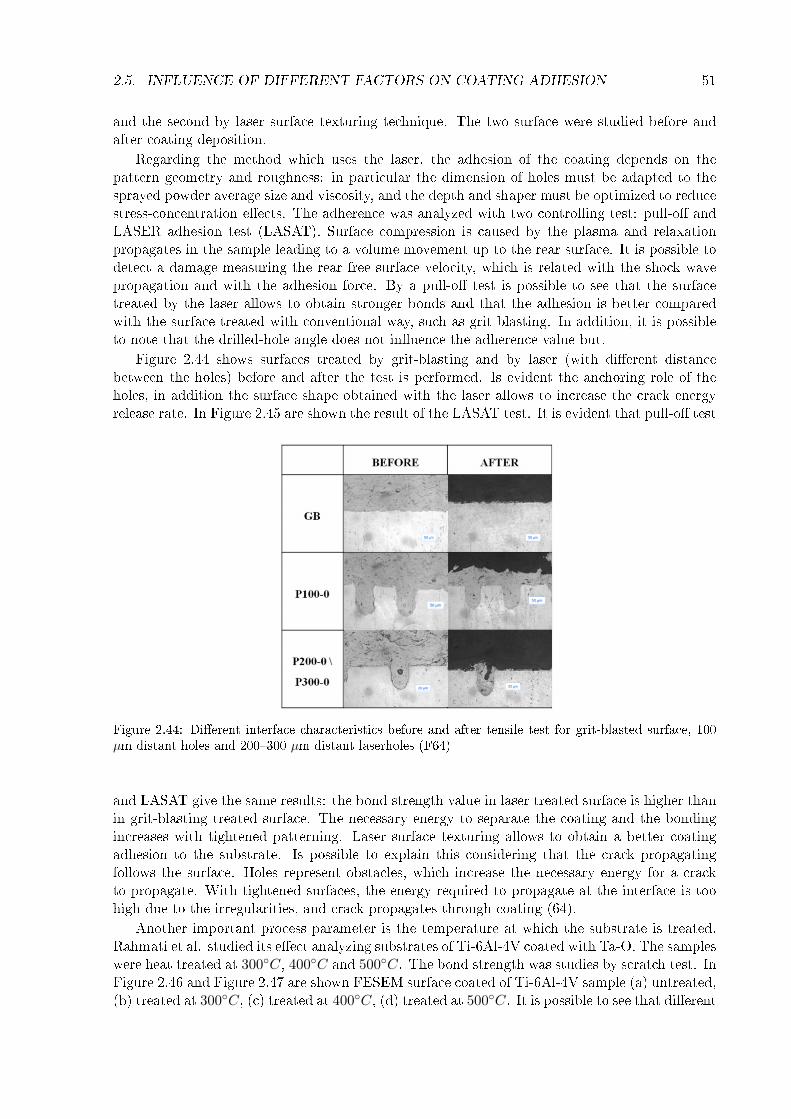
2.5. INFLUENCE OF DIFFERENT FACTORS ON COATING ADHESION 51
and the second by laser surface texturing technique. The two surface were studied before andafter coating deposition.
Regarding the method which uses the laser, the adhesion of the coating depends on thepattern geometry and roughness: in particular the dimension of holes must be adapted to thesprayed powder average size and viscosity, and the depth and shaper must be optimized to reducestress-concentration e�ects. The adherence was analyzed with two controlling test: pull-o� andLASER adhesion test (LASAT). Surface compression is caused by the plasma and relaxationpropagates in the sample leading to a volume movement up to the rear surface. It is possible todetect a damage measuring the rear free surface velocity, which is related with the shock wavepropagation and with the adhesion force. By a pull-o� test is possible to see that the surfacetreated by the laser allows to obtain stronger bonds and that the adhesion is better comparedwith the surface treated with conventional way, such as grit blasting. In addition, it is possibleto note that the drilled-hole angle does not in�uence the adherence value but.
Figure 2.44 shows surfaces treated by grit-blasting and by laser (with di�erent distancebetween the holes) before and after the test is performed. Is evident the anchoring role of theholes, in addition the surface shape obtained with the laser allows to increase the crack energyrelease rate. In Figure 2.45 are shown the result of the LASAT test. It is evident that pull-o� test
Figure 2.44: Di�erent interface characteristics before and after tensile test for grit-blasted surface, 100µm distant holes and 200�300 µm distant laserholes (F64)
and LASAT give the same results: the bond strength value in laser treated surface is higher thanin grit-blasting treated surface. The necessary energy to separate the coating and the bondingincreases with tightened patterning. Laser surface texturing allows to obtain a better coatingadhesion to the substrate. Is possible to explain this considering that the crack propagatingfollows the surface. Holes represent obstacles, which increase the necessary energy for a crackto propagate. With tightened surfaces, the energy required to propagate at the interface is toohigh due to the irregularities, and crack propagates through coating (64).
Another important process parameter is the temperature at which the substrate is treated.Rahmati et al. studied its e�ect analyzing substrates of Ti-6Al-4V coated with Ta-O. The sampleswere heat treated at 300◦C, 400◦C and 500◦C. The bond strength was studies by scratch test. InFigure 2.46 and Figure 2.47 are shown FESEM surface coated of Ti-6Al-4V sample (a) untreated,(b) treated at 300◦C, (c) treated at 400◦C, (d) treated at 500◦C. It is possible to see that di�erent

52 CHAPTER 2. COATING
Figure 2.45: Debonding strengths determined from LASAT of di�erent surfaces (F65)
treatment temperatures lead to di�erent morphology: with an increase in temperature, coatingbecames denser and smoother. An energy dispersive X-Ray analysis shows that the surfacetrated at higher temperature has the higher percentage of oxygen, while the lowest percentageis present in the surface before thermal treatment occurs: this means that oxidation increasesgradually during thermal treatment. A scratch test indicates that high value of adhesion coatingis that of the system treated at 500◦C, and in general adhesion increases with an increase intemperature. This is due to the morphology of the system: the coating became denser with hightemperature and this improves its adhesion to the substrate. In addition, an important role isplayed by the rise of oxygen element in the system: the free oxygen in the furnance reacts withTa and Ta2O5 is formed (65).
Figure 2.46: FESEM cross-sectional micrographs of coated samples: (a) untreated surface, (b) treatedsurface at 300◦C, (c) treated surface at 400◦C, and (d) treated surface at 500◦C (F66)
2.6 Other considerations
During the coating deposition process some problems can occur. To obtain a good bond at theinterface it is important to know the possible problems that may occur and �nd a solution.
One is represented by sagging and slumping. This phenomena occur in coatings applied toinclined surfaces, in particular, to vertical surfaces. Because of the e�ect of gravity, a downward�ow occurs and leads to sagging or slumping, depending on the nature of the coating �uid. Toresolve this situation, it is important to control the viscosity of the coating: in particular purelyNewtonian or shear thinning system occur.
During coating deposition, the material deposited is not homogeneous, but imperfectionssuch as waves or furrows usually appear. In this phenomena, an important role is played bysurface tension and by the viscosity of the coating. The solution is the leveling, which leads to areduction of the surface tension of the �lm. Concerning a corner, when a �lm is deposited aroundit, surface tension may increase or decrease the thickness of the coating (Figure 2.48) (50).

2.6. OTHER CONSIDERATIONS 53
Figure 2.47: FESEM surface topography of Ti-6Al-4V: (a) untreated surface, (b) treated surface at300◦C, (c) treated surface at 400◦C, and (d) treated surface at 500◦C (F67)
If the surface presents a surface tension gradient, local distorsion can occurs. The �ow ofa liquid from a region of lower to higher surface tension caused by the surface tension gradientresults in the formation of depressions of the liquid surface. The increase in the polymer concen-tration and the cooling due to solvent evaporation cause the surface tension and surface densityto exceed those of the bulk. This creates an unstable con�guration, which tends to move intoa more stable one in which the material at the surface has a lower surface tension and density.Releted to this, the formation of craters, which are circular depressions on a liquid surface, canbe caused by the presence of a low surface tension component at the �lm surface. The spreadingof this low surface tension component causes the bulk transfer of �lm materials, resulting in theformation of crater.

54 CHAPTER 2. COATING
Figure 2.48: (a) Newly applied thick �lm at a corner; (b) decrease in the �lm thickness at the corner dueto surface tension at a corner; (c) newly applied thin �lm at a corner; (d) increase in the �lm thicknessat the corner due to surface tension (F68)

Chapter 3
Dental implants
3.1 Oral cavity
The oral cavity, or mouth, shown in Figure 3.1, is a part of the oral region, constitutes an inletfor the digestive system but has also a respiratory function. It is constituted by the hard and softpalates, the cheeks and the retro molar regions (66). The inside of the oral cavity is composedby dental arches of upper jaw and lower jaw, i.e. rows of teeth supported by alveolar bone. It isnecessary to distinguish between �oral cavity� and �vestibulum oris�: the oral cavity is the frontand the lateral part of the space delimited by teeth and occupied by the tongue, the vestibulumoris is the part between the teeth and the lips or cheeks. The entire oral cavity is coated by theoral mucosa which contains sensory receptors for temperature and touch, on the tongue thereare also receptors for the sense of taste (1).
Figure 3.1: Oral cavity (F69)
3.2 Structure of teeth
The structure of the teeth is represented in Figure 3.2. It is possible to distinguish the structureof the teeth in three di�erent part: crown, root and tooth collar. The crown is the visible part of
55

56 CHAPTER 3. DENTAL IMPLANTS
Figure 3.2: Tooth anatomy (F70)
teeth, it can take di�erent shapes depending on the type of the teeth: in canine tooth is pointed,in incisor tooth is �attened, in molar and premolar tooth it is characterized by grooves.
The root is the non-visible part of the teeth, it is contained within the bone and has thefunction of supporting the tooth itself. Di�erent types of teeth have di�erent number of roots:canine tooth, incisors and lower premolars have one root, upper premolars can have one or tworoots, and lower molars have two roots while upper molars have three roots. In the tooth regioncalled "apical" there is a small opening (apical foramen) through which blood vessels, lymphvessels and nerves pass, entering the tooth to provide nourishment and innervation.
The tooth collar is the intermediate part between crown and root, gums develops around it.The teeth consists of di�erent tissues, three are hard substances: enamel, cement and dentine,
and a soft substance: dental pulp.The enamel consists of calcium, magnesium, phosphorus, carbonate, and potassium com-
pounds, in addition of water and organic substances and represents the 96% of the material. Itis translucent and is the most external part of the tooth.
The cement, as will be explained later, is a thin and resistant layer, which covers root's surfaceand has a protective function. It is made up of 65% by inorganic compounds, like calcium andphosphate. Cement is produced by cementoblasts.
Dentine is the substance which constitutes the tooth, is composed of about 70% by inorganicsubstances, and the remaining 30% by organic material and water. It is surrounded by enamelat the coronal level and, in the root area, is covered with cement. Dentine is produced byodontoblasts.
The pulp is a soft tissues which includes the nerve, blood vessels and other cells includingodontoblast. It is inside the crown (crown pulp), it continues along the roots (root pulp) up tothe apex of the tooth (67).
3.2.1 Peridontum
The periodontum, which literally means �around the tooth�, is the tissue which surrounds andsupports the teeth. It has an important role: it damps the forces acting on the teeth, in fact

3.2. STRUCTURE OF TEETH 57
there is a constant state of balance between the periodontal structures and the external forces.It is formed by gums, periodontal ligament, cementum, alveolar bone proper; each of thesecomponent has di�erent properties, and are distinguished from the location and the architecture.
Gums (or gingiva) is a soft tissue which surrounds and protects the teeth, providing a sealaround them and creating a barrier against infection. It is formed by an outer epithelium,which is keratinized and an inner network of connective tissue, within which there are gingival�broblasts, cells important for the tissue repair and in�ammatory response (68).
Periodontal ligament, also known as PDL, is a soft connective tissue, with the function ofconnecting the cementum of teeth to the gums and alveolar bone. It is formed by collagen bandsand �broblasts are the main cells in it, important for maintaining, repairing and forming alveolarbone and cementum (69).
Cementum, also known as root cementum, is a mineralized layer which cover the entire rootsurface, is similar to bone tissue, but, unlike the bone, is avascular and doesn't undergo dynamicremodelling. The most important cells in cementum are the cementocytes that lies in its lacuna(70).
Alveolar bone is an intramembranous bone forming with the formation of mandible andmaxilla. It is important to distinguish between �alveolar process� and �alveolar bone�. Alveolarprocess is that part which contains the teeth and the alveoli, it is characterized by a spongybone, which is protected by cortical plate of compact bone. Alveolar bone, composed by corticalbone with blood vessels, lines the alveolus, contained in the alveolar process (71).
3.2.2 Peridontal disease
Periodontal disease is an infection of the part that surrounds the teeth: gums, cementum thatcovers the root, periodontal ligament and alveolar bone (Figure 3.3).
The �rst stage is gingivitis, that a�ects only gums, but it can progress to a�ect the bonearound the teeth. In this case there are more severe forms of disease: periodontitis and advancedperiodontitis. In gingivitis stage, the bacteria in dental plaque, which is a substance that forms
Figure 3.3: Di�erence between normal tooth and periodontitis (F71)
on teeth, causes the in�ammation and damage of the gums. In this step neither the teeth northe bone are damaged. If gingivitis is left untreated, it can became periodontitis. In this casepockets are formed around the teeth, after the inner layer of bone and gum pulls away fromteeth. In this pockets debris accumulates, causing infection: the body's immune system �ghts

58 CHAPTER 3. DENTAL IMPLANTS
the bacteria while the plaque grows below the line gum. Toxins produced by the bacteria inplaque make the pockets deeper and more gum tissue and bone are destroyed. In this case teethare no anchored and tooth loss occurs.From what has been said, it is clear the plaque is the �rst reason of periodontal disease, butthere are also other factors:
• bad habits, such as smoking;
• poor oral hygiene habits, such as not brushing teeth daily;
• Hhormonal changes;
• illnesses, which include cancer, HIV or diabetes;
• history of family disease (72).
3.3 Types of dental implants
Dental implantology is a branch of dentistry which has the aim of replacing the missing teethwith synthetic root anchored to the bone, in order to restore normal function and aesthetics ofthe system. Dental implants (Figure 3.4) are surgically positioned in the jaw bone underneaththe gums, and during healing period osseointegration occurs.
Figure 3.4: Dental implant (F72)
The concept of tissue-integrated prosthesis was studied at university of Lund and at labo-ratory for experimental biology at the University of Goteberg. A good osseointegration leadsto permanent, interactive and functional interaction between implant and bone, when a to-pographically and precise recipient site is prepared in the bone. The anchorage stability, thehealing period, di�erent sizes and designs of implant, human microcirculation and intravascularbehaviour of blood cells, were studied to obtain the better result.The healing process consists of formation of blood clots because of the blood present between

3.3. TYPES OF DENTAL IMPLANTS 59
�xture and bone. These clots are transformed by phagocytic cells, such as leukocytes, lymphoidcells, and macrophages. At this time, implant is placed and bone remodelling occurs. Haversianbone calci�es becoming dense and homogenous, and the surrounding bone is stimulated. If thedevices is well designed for a good stress distribution and osseointegration happened correctly,cortical bone forms along the �xture surface with a thickness of few millimetres. A network ofcollagen bundles surround the osteocytes and a 100 Angstrom glycoprotein layer is formed. TheHaversian bone becomes well organized and forms osteon (73).
The �rst researchers who implanted titanium devices in animals were Bothe at al. whoremarked the tendency of this metal to fuse with bone.In 1951 Leventhal studied how titanium screws placed in rat femurs after 16 weeks were di�cultto remove and how the trabeculation was very similar to normal trabecular bone (74).In 1951 Branemark et al. implanted titanium screw in dog's jaw bone and after 16 weeks theyobtained the same result: it is possible to establish a bone-to-titanium contact.In 1953 he called this mechanism �osseointegration�, de�ned as "a direct connection betweenliving bone and a load-carrying endosseous implant at the light microscopic level" (75) (76).Then the research focused on how to improve bone-to-titanium interaction, to increase the lifetime of the implant and reduce bacterial adhesion.
There are di�erent types of prosthesis:
• Subperiosteal implants: they are metallic structures surgically placed between surface boneand the periosteum, the implant pillars pierce the mucosa that covers them (Figure 3.5).They have low percentages of success because they are very di�erent from the naturalroots shape, and it makes the osteointegration process di�cult and for this reason they areseldom used;
Figure 3.5: Subperiosteal implant (F73)

60 CHAPTER 3. DENTAL IMPLANTS
• Endosseous implants: the implant is directly inserted in the bone; they can be closed, placedunder the periosteum and cannot communicate with the oral cavity; or open, which areequipped with a pillar having this function (Figure 3.6). There is another type of endosseusimplant which is covered by an epithelial layer for a long period (several months) and thenis exposed. This types of implant are very common for the simplicity of surgical techniqueand the possibility to replace it in case of failure;
Figure 3.6: Endosseous implant (F74)
• Subperiostal endosseous implants: they are a combination of the two previous type, inwhich one part is inside the bone, one is above it;
• Transosseous implants: are speci�c to the jaw and through vertically it (Figure 3.7);
• Transdental implants: they have the function of stabilizing the teeth in which are placed,so thay are called endodontics. They have a kind of "biological collar" for the anchoragebetween the separation seal with the oral cavity and the periodontium of a natural tooth;
• Intramucosal implants: they are inserted into the mucosa by �xing to a base prostheticand because they do not perforate the lining epithelium and do not remain permanentlyin the implant site (Figure 3.8), they are more suitable for classical prosthesis rather thanimplant prostheses (77).
A dental implant is constituted by three parts, represented in Figure 3.9:
• Implant: similar to a screw, in general made in titanium, which is anchored directly intothe jawbone;
• Abutment: metallic structure which connect prosthesis to implant, is �xed on the top ofexposed implant post (78);

3.3. TYPES OF DENTAL IMPLANTS 61
Figure 3.7: Transosseous implant (F75)
• Crown: arti�cial crown which replaces natural tooth (it can be a bridge or a dentaturefor people missing many or all teeth). Dental impressions, x-rays and other techniques areused in order to obtain a functional and look natural implant (79).

62 CHAPTER 3. DENTAL IMPLANTS
Figure 3.8: Intramucosal implant (F76)
3.4 General features of dental implants
The success or failure of implant is determined by the interface zone between the prosthesisand the receiving tissue: when the implant is positioned, blood clots form at the wound siteand protein adsorption occurs, then �broblasts proliferate in the blood clots creating an extra-cellular matrix. After one week, it is possible to see new bone around the implant surface throughosseoconduction. The implants and the materials used must have extraordinary requirements.
Dental implant must have the ability to provide its intended function from an engineeringviewpoint, so certain mechanical and physical properties are required. They must be biocom-patible, because of the interaction between the foreign material and the host living tissue. Inmost of medical applications, an implant devices is expected to function for the life of the pa-tient. So, one of the many universal implant requirements is the ability to form a suitably stablemechanical unit with the neighbouring hard or soft tissues (80).
3.4.1 Mechanical stability
An important aspect that must be taken into account is the mechanical compatibility of dentalimplants, also called primary stability, which deals with biting force acting on the implant,transferring of these forces to the interfacial tissue, and with the biological reaction of the interface

3.4. GENERAL FEATURES OF DENTAL IMPLANTS 63
Figure 3.9: Di�erent parts of a dental implant (F77)
to stress transfer conditions.To make progress in this technology, it is necessary to study the manner in which mechanical
stress are transferred, in order to avoid relative motion between implant and bone, which cancause abrasive phenomena and the destroy of the implant. It is studied that bite forces actingin patients with implants and in patients with natural teeth are the same, so it is importantthat neither bone nor implant be stressed beyond the long term fatigue capacity. In this case,fracture mechanisms time is considered the prime factor since damages accumulate over time(80). The behaviour and life of the implant is determined by stress concentrations and �xationof the implant. Osseointegration plays an important role in the success of the implant: it isbased on the placement and the quality and quantity of trabecular bones. The reduction insize and in density of the bone can cause problem to the pleacemnet of the implant. To controlthis, di�erent factors must be taken into account, such as applied loads, length and diameterof the implant, its geometry and surface and inteface between implant and bone. In general, ifthe elastic modulus is similar to that of the bone, a load applied causes stress and much moredeformation on the implant, this provides a smooth transmission of the stress from the implantto the bone and decreases energy magnitude.Fatma et al. studied how mechanical properties cause stress distribution on implant made withdi�erent materials: AISI 316L, CoCr alloys, ZTA (Zirconia-toughened allumina), YSZ (Yttria-stabilized zirconia), Ti-cp with nanotubular TiO2. The equivalent Von Mises stress values andtheir concentration was evaluated: the results revealed that the critical zone is related to threadregion, which can be fractured or can have a failure (Figure 3.10). Stress value is in the rangebetween 226.95 MPa and 239,05 MPa. In order to guarantee an e�cient stress transfer fromimplant to bone and to avoid the stress-shielding e�ect, Young's modulus must be as close aspossible to that of the bone. All the materials studied have a low value of Young's modulus, inparticular nanotubular titania has the lowest elastic modulus value and the closest one to thevalue bone.
Another important factor that must be taken into account is the amount of penetrationof implant onto the bone: the highest value is that of cp-Ti with nanotubular TiO2 surface(0,013626 mm), the lowest was assigned by CoCr alloy (0,0037389 mm).
Also tests releted to fatigue life were conducted: the life prediction is based on the term of the
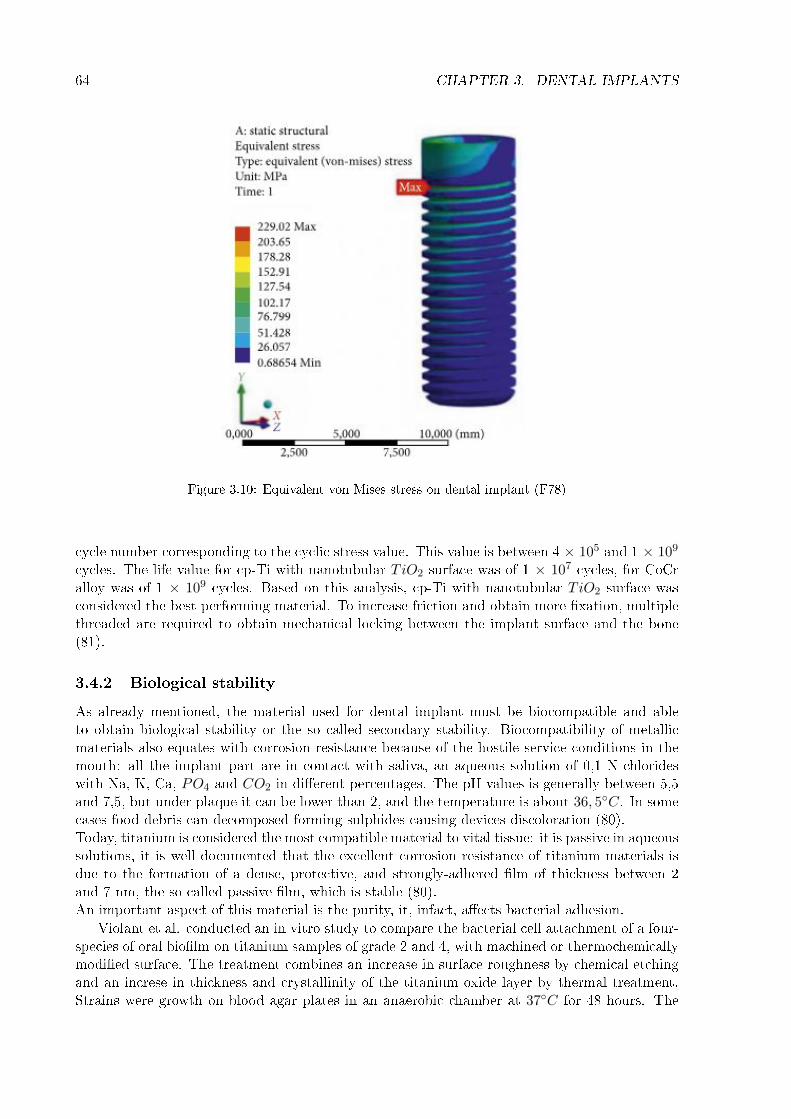
64 CHAPTER 3. DENTAL IMPLANTS
Figure 3.10: Equivalent von Mises stress on dental implant (F78)
cycle number corresponding to the cyclic stress value. This value is between 4 × 10⁵ and 1 × 10⁹
cycles. The life value for cp-Ti with nanotubular TiO2 surface was of 1 × 10⁷ cycles, for CoCralloy was of 1 × 10⁹ cycles. Based on this analysis, cp-Ti with nanotubular TiO2 surface wasconsidered the best performing material. To increase friction and obtain more �xation, multiplethreaded are required to obtain mechanical locking between the implant surface and the bone(81).
3.4.2 Biological stability
As already mentioned, the material used for dental implant must be biocompatible and ableto obtain biological stability or the so called secondary stability. Biocompatibility of metallicmaterials also equates with corrosion resistance because of the hostile service conditions in themouth: all the implant part are in contact with saliva, an aqueous solution of 0,1 N chlorideswith Na, K, Ca, PO4 and CO2 in di�erent percentages. The pH values is generally between 5,5and 7,5, but under plaque it can be lower than 2, and the temperature is about 36, 5◦C. In somecases food debris can decomposed forming sulphides causing devices discoloration (80).Today, titanium is considered the most compatible material to vital tissue: it is passive in aqueoussolutions, it is well documented that the excellent corrosion resistance of titanium materials isdue to the formation of a dense, protective, and strongly-adhered �lm of thickness between 2and 7 nm, the so called passive �lm, which is stable (80).An important aspect of this material is the purity, it, infact, a�ects bacterial adhesion.
Violant et al. conducted an in vitro study to compare the bacterial cell attachment of a four-species of oral bio�lm on titanium samples of grade 2 and 4, with machined or thermochemicallymodi�ed surface. The treatment combines an increase in surface roughness by chemical etchingand an increse in thickness and crystallinity of the titanium oxide layer by thermal treatment.Strains were growth on blood agar plates in an anaerobic chamber at 37◦C for 48 hours. The

3.4. GENERAL FEATURES OF DENTAL IMPLANTS 65
four strains were used to product bio�lms in layers over sterilized titanium discs.The titanium samples were divided in four groups: Ti of grade 2/machined surface, Ti of grade2/treated surface, Ti of grade 4/machined surface, Ti grade 4/treated surface. Nine implantsof each surface was exposed to the multispecies bio�lm. After six days of incubation, cellsproliferation was evaluated using 1, 2 ,3, 5% triphenyltetrazolium and spectrophotometry.Figure 3.11 shows mean cells viability of the bio�lm formed on the di�erent implant afetr 7 daystested with TTC 1% solution. Figure 3.12 shows the bactrial attchment on the di�erent implantssurfaces.
Figure 3.11: Bacterial cell viability assay (1% TTC assay) (F79)
Figure 3.12: Bacterial attachment on implant surfaces (F80)
The tests revealed that titanium surface of grade 2 had a less bacterial load adhesion ratherthan titanium of grade 4, whereas both smooth surfaces showed lower bio�lm adhesion. This leadsto an important conclusion: the implant surface morphology and chemical properties in�uencebacterial adhesion and bio�lm thickness, but not bio�lm composition (82).
3.4.3 Morphological stability
Also morphological compatibility is necessary for the e�ectiveness of a dental product: it isimportant to consider the implant's surface, because it is the part which is in contact with the

66 CHAPTER 3. DENTAL IMPLANTS
bioenviroment, is very di�erent morphologically and compositionally from the bulk, and thesurface properties determines stability between implant and bone and the biological response.For examples, surface roughness determine cell attachment and cell proliferation and play animportant role in antibacterial response (80).
Considering two surface roughness parameters Ra and Sa, which are de�ned as the arithmeticmean deviation of a linear pro�le or a surface, some studies demonstrate that surfaces with Sa= 1-2 µm showed stronger bone response than surfaces with Sa > 2 µm. Moreover qualitativeand quantitative measurements of bio�lms did not change if Ra < 0,2 µm, which represents theso-called �Threshold Ra� (83).
Teughels et al studied that an increase of surface roughness above Ra=0,2 µm favouritesplaque adhesion and accumulation (84).

Chapter 4
Materials and Methods
4.1 Cutting, marking and polishing of samples
In this thesis work, commercially pure titanium of grade 2 has been used (ASTM B348, Gr2,Titanium Consulting and Trading). The samples are in the form of disks with the dimensions of10 mm of diameter and 2 mm of thickness, obtained by cutting cylindrical bars.As shown in Figure 2.1, the samples were characterized by evident signs of machining, for thisreason polishing operations have been performed following this protocol: both faces of eachsamples were polished with SiC abrasive paper 320 grit. Then, one of the two faces was markedusing an electric pen, in order to easily recognize the samples treated in di�erent ways. Theunmarked faces were polished with SiC abrasive paper 600, 800, 1000, 3200 and 4000 grit.After polishing, two of the samples were made rough, using paper 1000 for 10" in a single directionas previously reported (85).
Figure 4.1: Samples before and after polishing
67

68 CHAPTER 4. MATERIALS AND METHODS
4.2 Washing of samples
In order to remove contaminations due to the previous treatments, disks were washed. In a �rststep, samples were immersed in a beaker containing acetone, with the marked face in contactwith the bottom of the beaker. This operation has been carried out under laminar �ow cabinetand with HEPA �lter. After covering the beaker with aluminum foil, it was transferred in asonicator (Figure 4.2) by setting 5-minute working time.In a second step, the samples were transferred in aboundant ultrapure water, while the acetonewas recovered. The beaker was inserted in the sonicator for 10 minutes. At the end of tenminutes, the operation was repeated a second time, using new ultrapure water.The use of sonicator is important to separe residuals and contaminations of various sorts, due tothe trasmission of mechanical vibrations ampli�ed by a high frequency electric current (about 20kHz) in a tank containing water, in which the beakers containing samples were placed. Electricenergy is trasformed into an acoustic impact energy between the water and the surfaces to becleaned.At the end of tihs operations, the samples were dried under a laminar �ow cabinet and then theywere packed in appropiate envelopes.
Figure 4.2: Ultrasonic machine
4.2.1 Preparation of titanium cylinders
In order to analyze how keratin nano�bers can be arranged on a dental implant, small titaniumcylinders were used. In this case, titanium bars, producted by a dental implant company, werepolished and made rough by O.C.M. A. S. Cervai Sas.For the polishing process, papers of di�erent grain were attached to a lathe, which was rotatedin contact with the samples. The protocol followed was:
• 40" at 1500 rpm with paper of 40 µm;
• 40" at 1500 rpm with paper of 30 µm;
• 40" at 1500 rpm with paper of 20 µm;
• 40" at 1500 rpm with paper of 16 µm;

4.2. WASHING OF SAMPLES 69
• 40" at 1500 rpm with paper of 9 µm;
• 40" at 1500 rpm with paper of 5 µm;
• 40" at 1500 rpm with paper of 3 µm;
• 40" at 1500 rpm with paper of 1 µm;
Then the bars have been made rough in the same way, using a paper of grain 1000, at the samevelocity but for 10".Then the bars were cut into small cylinders of length of 4 mm, using the cut-o� machine Brillant220, shown in Figure 4.3, and an alumina blade. The small cylinder obtained was shown in
Figure 4.3: Cut-o� machine
Figure 4.4.In order to eliminate impurities due to previous work, the samples were washed, following thesame protocol described before and used for titanium disks:
• an acetone washing in sonicator for 5 minutes;
• two ultrapure water washings in sonicator for 10 minutes.
Figure 4.4: Titanium cylinder obtained by cutting bars

70 CHAPTER 4. MATERIALS AND METHODS
4.3 Surface activation with plasma
Plasma activation is a method of surface modi�cation employing plasma processing. This treat-ment is done on various materials, such as metals, ceramics, glass, polymers and natural materialsand has the aim to improve surface adhesion properties. A combination of reduction of metalsoxides, ultra-�ne surface cleaning from organic contaminants, modi�cation of the surface to-pography and deposition of funcional chemical groups occur on the samples surface during thetreatment. Plasma activation can be performed at atmospheric pressure using air or typicalindustrial gases such as hydrogen, oxygen or nitrogen (86).In particular, in biomedical applications it is used to remove the organic layer from titaniumimplants, in order to make osseointegration faster, to remove organic residuals at atomic levelafter the classical industrial washes and to sterilize heat-sensitive materials. (87)In this work, a plasma surface attivation in air was carried out, in order to make the surfaceof samples more reactive for the subsequent deposition of keratin coating. The plasma systemused is shown in Figure 4.5. Afetr cleaning the chamber and setting the process conditions,the samples were placed on a appropriate tray, covered with aluminum foil, and were insertedmanually into the chamber.The process takes place in air, for 10 minutes at a power of 100 Watt. Inside the chamber, theplasma generated creates reactive ion species that act on the surfaces to be treated. When theprocess was �nished, the samples were sealed in aluminum foil and stored at room temperaturebefore the deposition of the coating.The samples which were plasma-treated were:
• Polished Ti;
• Titanium cylinders.
Figure 4.5: Plasma system
4.4 Surface activation with UV
To improve coating adhesion to a substrate, UV treatment can also be used. It is based onreactivity of titanium: if it is exposed to an atmosphere or to an environment containg freeoxygen, on its surface a thin and tenacius oxide �lm is formed, due to the oxidation reactionsthat occur on the surface. This passive oxide layer, which has a thickness of few nanometers,

4.4. SURFACE ACTIVATION WITH UV 71
gives to the material important properties, such as corrosion resistance (88). The nano-structeredtitanium dioxide is characterized by photocatalytic properties: it can absorb the light-emitting,generating photo-catalytic e�ects, it can use the electromagnetic radiation energy absorbed tocause chemical reactions in other molecules that are close to surface of metal paricles. In order toobtain this process, is necessay to use ultraviolet radiation, with a wavelength λ in the range of 400nm and 10 nm. When UV radiation is absorbed by TiO2, generates an electron-gap pairs, infactan electron is promoted to the conduction band, and a pair of negatively-charged free electron anda positively-charged electron hole is created. The molecules of water are decomposed by titaniumdioxide gap in hydrogen and hydroxyl ions/radicals, whereas the electron reacts with the oxygenmolecules to form superoxide ions. For this reason, UV treatment of titanium, expecially TiO2,before functionalization can make improvemtents due to an increase in super�cial OH groups.This mechanism, known as photocatalysis, is represented in Figure 4.6.Di�erent studies have been conducted with the aim of understanding advantages of using UV-pretreated titanium (89).Iwasa et al. studied osteoblasts attachment to UV-treated and to untreated titanium surfaces.They found that UV treatment enaches cells attachment and tried to explain this e�ect.
Figure 4.6: Mechanism of photocatalysis (F81)
As shown in Figure 4.7 (A), titanium surface has a net negative charge, wherease a UV-treatedtitanium surface has a positive charge, due to exited electrons from valence bands to conductionbands. In the �rst case the negative charge must be bridged by divalent cations such as Ca2+ toattract anionic proteins, whereas monovalent cations such as Na+ and K+ may block the anionsites of titanium surface for Ca2+, this explain why titanium is considered a bioinert material. Inthe case of UV-treated titanium, UV irradiation causes an excitement of an electron from valenceband to conductive band, leaving the surface electropositive. In this way, cells and proteins candirectly attach on this surface (Figure 4.7 (B)). This treatment gives to titanium surface highbioactivity.Titanium samples were UV irradiated for 1 hour before keratin coating deposition (90). Theinstrument used is shown in Figure 4.8

72 CHAPTER 4. MATERIALS AND METHODS
Figure 4.7: (A) Hypotetical electric status of untreated and UV-treated Ti surface, (B) Intercation ofuntreated and UV-treated Ti surface with ions, cells, proteins (F82)
4.5 Coating deposition and functionalitation
In this thesis work, di�erent keratin solutions were prepared, modifying the keratin concentration:solutions of keratin at 7% wt, at 3% wt and 1% wt. Keratin �akes, extracted by wool, were used.To prepare the keratin solution at 7% wt, was used:
• 5 ml of water;
• 0,35 g of keratin �akes.
To prepare the keratin solution at 3% wt, was used:
• 3 ml of water;
• 0,09 g of keratin �akes.
To prepare the keratin solution at 1% wt, was used:
• 15 ml of water;
• 0,15 g of keratin �akes (Figure 1.8).
The keratin �akes were immersed into di�erent beakers containing the three di�erent volumesof water. In order to mantain the solutions in agitation, magnetic stirrers were used, as shownin Figure 4.10. The three solutions remained in agitation for a whole night. When the solutionswere well mixed, they were used for samples conting and functionalization.

4.5. COATING DEPOSITION AND FUNCTIONALITATION 73
Figure 4.8: UV system
4.5.1 Solution of keratin at 7% wt
The solution of keratin at 7% wt was used to obtain a coating on the surface of samples.In this case were also used particulary samples, producted at the Techical University of Graz.Some of them are characterized by a particular structure, an hexagonal pattern, others arecharacterized by grooves, obtained by means of Electric Beam Welding (EBW) techinque.The solution was manually deposited on the surfaces of di�erent samples:
• Polished Ti;
• Ti + plasma;
• Ti + UV;
• Ti with hexagonal patterns;
• Ti with grooves.
In the case of polished and plasma- and UV- treated samples, the keratin solution was depositedand was spread in order to cover all the surface.In the case of Ti with hexagonal patterns and grooves, a keratin layer was deposited on thesurface of the two samples, then the excess solution was removed from the surface, in orderto leave only the solution inside the wells of the hexagonal patterns and inside the grooves.Due to the high density of the keratin solution, the deposition of this coating did not occurhomogeneously, infact it was impossible to deposit the same quantity of solution on the di�erentsurfaces, and was di�cult to cover the whole surface of the single sample with a coating ofhomogeneous thickness.For this reason a keratin solution, with a less concentration of keratin (3% wt) was prepared.
4.5.2 Solution of keratin at 3% wt
The solution of keratin at 3% wt was used to obtain a coating to be deposited in a simpler andmore homogeneous way than the previous solution. In this case, the coating was deposited on:
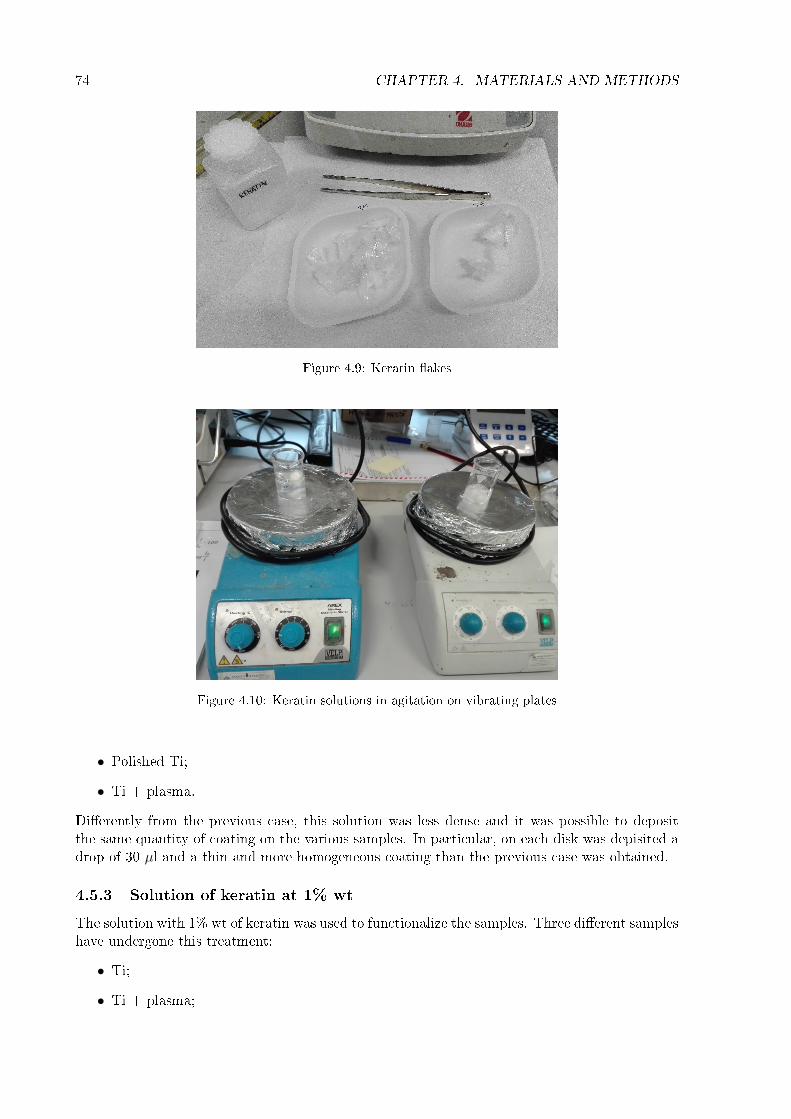
74 CHAPTER 4. MATERIALS AND METHODS
Figure 4.9: Keratin �akes
Figure 4.10: Keratin solutions in agitation on vibrating plates
• Polished Ti;
• Ti + plasma.
Di�erently from the previous case, this solution was less dense and it was possible to depositthe same quantity of coating on the various samples. In particular, on each disk was depisited adrop of 30 µl and a thin and more homogeneous coating than the previous case was obtained.
4.5.3 Solution of keratin at 1% wt
The solution with 1% wt of keratin was used to functionalize the samples. Three di�erent sampleshave undergone this treatment:
• Ti;
• Ti + plasma;

4.5. COATING DEPOSITION AND FUNCTIONALITATION 75
• Ti + UV.
In order to functionalize the samples, the keratin solution at 1% wt obtained was divided intothree beakers, each of which contained 5 ml of solution. The samples were immersed in thesolution with the marked face in contact with the bottom of the beaker, then the beakers wereclosed and remained at room temperature for an hour. Past this time, the samples were washedin water milli-Q for a few seconds. The aim of this operation is to leave on the surface only themolecules chemically bound on the substrate and to eliminate the not bounded ones.
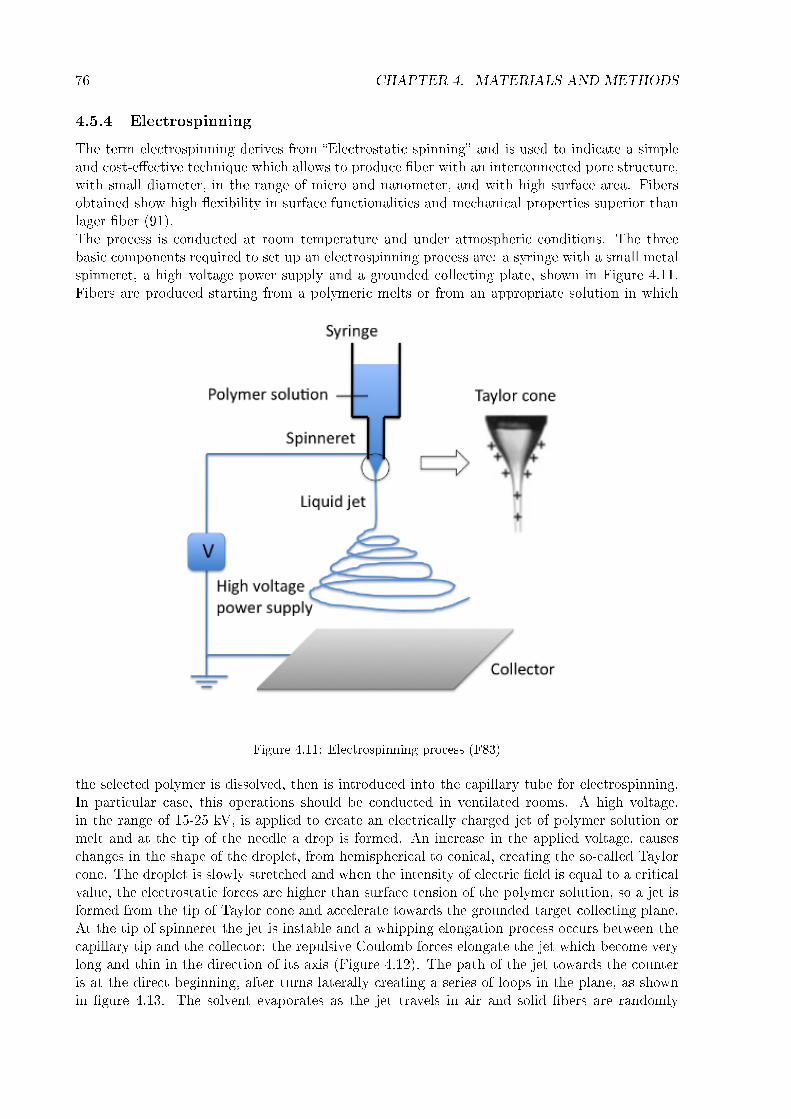
76 CHAPTER 4. MATERIALS AND METHODS
4.5.4 Electrospinning
The term electrospinning derives from �Electrostatic spinning� and is used to indicate a simpleand cost-e�ective technique which allows to produce �ber with an interconnected pore structure,with small diameter, in the range of micro and nanometer, and with high surface area. Fibersobtained show high �exibility in surface functionalities and mechanical properties superior thanlager �ber (91).The process is conducted at room temperature and under atmospheric conditions. The threebasic components required to set up an electrospinning process are: a syringe with a small metalspinneret, a high voltage power supply and a grounded collecting plate, shown in Figure 4.11.Fibers are produced starting from a polymeric melts or from an appropriate solution in which
Figure 4.11: Electrospinning process (F83)
the selected polymer is dissolved, then is introduced into the capillary tube for electrospinning.In particular case, this operations should be conducted in ventilated rooms. A high voltage,in the range of 15-25 kV, is applied to create an electrically charged jet of polymer solution ormelt and at the tip of the needle a drop is formed. An increase in the applied voltage, causeschanges in the shape of the droplet, from hemispherical to conical, creating the so-called Taylorcone. The droplet is slowly stretched and when the intensity of electric �eld is equal to a criticalvalue, the electrostatic forces are higher than surface tension of the polymer solution, so a jet isformed from the tip of Taylor cone and accelerate towards the grounded target collecting plane.At the tip of spinneret the jet is instable and a whipping elongation process occurs between thecapillary tip and the collector: the repulsive Coulomb forces elongate the jet which become verylong and thin in the direction of its axis (Figure 4.12). The path of the jet towards the counteris at the direct beginning, after turns laterally creating a series of loops in the plane, as shownin �gure 4.13. The solvent evaporates as the jet travels in air and solid �bers are randomly

4.5. COATING DEPOSITION AND FUNCTIONALITATION 77
Figure 4.12: Modi�cation in drop shape with an increasing of applied voltage (F84)
Figure 4.13: Behaviour of the electrospun jet (F85)
deposited on collector (92).
Parameters
During the electrospinning process di�erent parameters are involved, which must be controlledin order to obtain �bers with desired diameter or morphology. This factor can be classi�ed aselectrospinning parameters, solution and environmental parameters.
Electrospinning parameters are:
• Applied voltage: as already said, when applied voltage reaches a critical value, small-diameter nano�ber formation occurs, due to the stretching of the polymer solution incorrelation with the charge repulsion within the polymer jet. If the applied voltage isbeyond the critical value, beads or beaded nano�bers results. In addition an increase inapplied voltage causes an increase in the diameter of the �ber;
• Solution �ow rate: morphology of electrospun �bers depends on solution �ow rate. Foreach polymeric system a critical �ow rate is determined, increasing �ow rate above thisvalue causes the formation of beads in the �bers obtained;

78 CHAPTER 4. MATERIALS AND METHODS
• Distance between needle and collector: it in�uences deposition time, evaporation rate,whipping or instability interval. A critical distance needs to be maintained to preparesmooth and uniform nano�bers. Severals studied have been demonstrated that when thedistance is kept small, nano�bers are characterized by a large-diameter, whereas if thisdistance increase, nano�bers obtained have a small diameter.
Solution parameters are:
• Polymer concentration and polymer viscosity: if the concentration of the polymeric so-lution is low, polymer chains break into framments before reaching the collector becauseof the applied electric �eld and surface tension, creating beads. An increase in polymerconcentration causes an increase in viscosity. It is possible to say that a critical value ofconcentration/viscosity must be determined for polymeric system.
• Solution conductivity: it can in�uence formation of Taylor cone and diameter �bers. Ifthe solution has low conductivity, the surface of the drople has no charge, so there will notthe formation of the Taylor's cone, whereas increasing its conductivity, the charge on thedroplet increase and the electrospun nano�bers have a small diameter, but overcoming acritical value Taylor's cone formation will be hampered.
• Polymer molecular weight and structure: it is seen that the more easily �lamented polymersgenerally have high molecular weights, otherwise beads can be formed. As the molecularweight increases, the �ber diameter also increases. In addition a linear structure polymeris easier to thread, because of major inter-chain interactions.
• Solvent: the choise of an appropriate solvent is important to obtained smooth and beadless�bers. They should have a moderate boiling point: if they are highly volatile, the dryingof the jet at the needle tip occurs, hindering electrospinning process, at the same time lessvolatile solvent are avoids because the high boiling point prevent their drying.
Environmental parameters are:
• Humidity: it causes changes in morphology of nano�ber because in�uence solidi�cationprocess. In addition humidity plays an important role in porous nano�bers formation,obtained using binary solvent system.
• Temperature: an increase in temperature leads to an increase in the rate of evaporation ofthe solvent and a decrease in the viscosity of solution (93).
In this work titanium samples underwent electrospinning technique at the laboratories of CNR-ISMAC (Institute for Macromolecular Studies) of Biella, Piedmont. The instrument used forelectrspinning was Spellman High Voltage Electronics Corporation, SL 50, Power supply, KDS200, KD Scienti�c Inc., shown in Figure 4.14.
Keratin used in electrospinning process was extracted from wool by sul�tolysis with sodiummetabisul�te. Washed wool �bers were mixed with urea and Na2S2O5 for 2h at 65◦C. Themixture was �ltered and the aqueous solution was dyalized at room temperature for 3 days.Then the karatin solution was frozen and lyophilized. The solution used was at 15% by weightof keratin in formic acid (HCOOH) (16). It was prepared the day before the deposition, and wasmixed with a magnetic stirrer. 4 mL of solution was inserted into a plastic syringe and connectedwith a stainless-stell capillary (with internal diameter of 0,2 mm and external diameter of 0,4mm),and was insetered in the electrospinning system. The collector was covered with aluminum foil,in order to avoid that keratin jet get it dirty. The sample were placed on the collector using aconductive adhesive, (Figure 4.15)
The process parameters were:

4.5. COATING DEPOSITION AND FUNCTIONALITATION 79
Figure 4.14: Electrospinning instrument
• Voltage: 25 kV;
• Rate of 0,003 ml/min;
• Distance between collector and capillary: 15 cm;
• Deposition time: 5 minutes;
• Temperature: 22,0 ± 0, 3◦C;
• UR 31,8 ± 1,0%.
The �rst electrospinning phase was carried out without samples on the collector, in order totest the deposition process. The white platina obtained on the aluminum foil indicated that thespinning process could begin.The samples covered with keratin nano�bers were:
• Smooth Ti + plasma;
• Rough Ti;
• Rough Ti + plasma.

80 CHAPTER 4. MATERIALS AND METHODS
Figure 4.15: Samples placed on metal collector covered with aluminum foil
For the deposition on the rough samples two process parameters were changed: the rate was setat 0,01 ml/min and capillaty-collector distance was set at 20 cm, in order to avoid that somedroplets of solvent reached the samples, as happened during the deposition on smooth titaniumsamples. Because the aim of this work is to evaluate adhesion of keratin nano�bers to substratewith di�erent characteristics the change of parameters do not bring di�erences in adhesion value.
In order to evaluate how nano�bers arrenges on lateral surface of titanium cylinder, a electro-spun nano�bers deposition was carried out at Centro Nazionale Ricerche- Institute of PolymersComposites and biomaterials (CNR-IPCB) at Napoli.

4.6. THERMAL TREATMENT 81
4.6 Thermal treatment
After the deposition of the coating and of the keratin nano�bers, and the functionalitation, thesamples were placed in Petri dishes and have been subjected to a thermal treatment in an ovenat 180◦C for two hours.The goal of the this operation is to stabilize the keratin coating. The samples after thermal treat-ment are shown in Figure 4.16, Figure 4.17, Figure 4.18, Figure 4.19, Figure 4.20, Figure 4.21,Figure 4.22, Figure 4.23.
Figure 4.16: (a):Ti with grooves with keratin coatin 7% wt: (b)plasma-treatedTi with keratin coating7%
Figure 4.17: (a): UV treated-Ti with keratin coating 7%5wt; (b) Ti with exagonal structure with keratincoating 7% wt

82 CHAPTER 4. MATERIALS AND METHODS
Figure 4.18: (a): Polished Ti with keratin coating 7% wt; (b) Polished Ti functionalized with keratin 1%wt
Figure 4.19: (a): UV-treated Ti functionalized with keratin 1% wt; (b) plasma-treated Ti functionalizedwith keratin 1% wt

4.6. THERMAL TREATMENT 83
Figure 4.20: Titanium samples with keratin coating at 3% wt after thermal treatment
Figure 4.21: Rough Ti with keratin nano�ber

84 CHAPTER 4. MATERIALS AND METHODS
Figure 4.22: Rough plasma-treated Ti with keratin nano�ber
Figure 4.23: Smooth plasma-treated Ti with keratin nano�ber

4.6. THERMAL TREATMENT 85
In order to evaluate the thickness of the keratin coating, a particular sample was prepared inthe followed way: an adhesive paper was used to cover an half surface of a plasma-treated sample,whereas on the other half a keratin solution at 3% wt was deposited, using a micropipette.After thermal stabilization at room temeprature, the adhesive paper was removed and the samplewas theramal treated in a oven at 180◦C for 2 hours, as the previous cases. The aim of thisopeartion is that to obtain a sample characterized by a coating deposited on half surface: in thisway it is possible to measure the di�erence in height between surface with and without coating,in order to evaluated the thickness of the coating.The result is shown in Figure 4.24 and a scheme of the cross section is represented in Figure 4.25
Figure 4.24: Plasma-treated sample with coating on half surface
Figure 4.25: Scheme of the cross section of the sample

86 CHAPTER 4. MATERIALS AND METHODS
4.7 Surface characterization
4.7.1 Tape test
As already said in the chapter about coating, several tests are carried out in order to analyze theadhesion of a coating to a substrate. In this work a tape test was performed and was conductedby reference to the Standard Test Methods for Measuring Adhesion by Tape Test, ASTM D3359-97. The experimental procedure includes the following operations:
• A cut is created with a sharpe tool in order to produce edges from which the coating canbe lifted. It is possible to create di�erent cut patterns. In this case grid pattern is used;
• An adhesive tape, conforming to EN ISO 2409, is applied to the zone to be analyzed anda certain pressure is performed in order to guarantee a good adhesion;
• The adhesive tape is removed from the sample, with a moviment parallel to the surface;
• The tested area is examinated with a magnifying glass and the evaluation of the adhesionstrength is based on the amount of the coating removed.
The Figure 4.26 shows the table used for the evaluation of the results, according to the normASTM D 3359-97.
In this work a Elcometer 107 Cross Hatch Cutter (Figure 4.27) was used, it is made up of 6blades with a cutting distance of 1 mm, suitable for up to 60 µm on hard surfaces, in accordancewith ASTM regulation. The samples tested with this test were:
• Ti + Keratin 7% wt;
• Ti + plasma + keratin 7% wt;
• Ti + UV + keratin 7% wt;
• Ti + keratin 3% wt
• Ti + plasma + keratin 3% wt.
• Ti + plasma + keratin nano�bers.

4.7. SURFACE CHARACTERIZATION 87
Figure 4.26: Classi�cation of test adhesion results (F86)
Figure 4.27: Elcometer 107 Cross Hatch Cutter (F87)

88 CHAPTER 4. MATERIALS AND METHODS
4.7.2 Scratch test
As already said, scratch test is a method used to evaluate coating adhesion to a substrate, usinga sphero-conical stylus. A Rockwell diamond indenter, with a tip radious of 200 µm is used toscratch the sample, placed into the chamber.The test consists of three steps:
• in the �rst step a prescan is done to measure of the surface is performed under the lowerpossible pressure, in order to not damage surface sample;
• a scratch is performed according to load, speed, depth conditions of the test;
• in the last step a postscan is performed in order to measure residual topografy in damagedarea.
Scratch test can be performed in di�erent ways: with constant, progressive and incrementalload. The output is misured in term of acoustic emission, penetration depth and frictionalforce. Analyzing the morphology of the scratch track and transvers cracks, it is possible tohave information about failure mechanisms such as cohesive, interfacial, conformal and brittlechipping (Figure 4.28).An important parameter is the so-called "load critical value", i.e. the load at which the �rstcrack appears. This value is a measure of the coeshion of the coating. The value of load at whichtotal peeling-o� of the coating from the substrate surface occurs is called "upper critical load".This is a measure of the adhesion strength between coating and substrate (94).
Figure 4.28: Scratch test (F88)
This test was conducted at CNR - Area di Ricerca di Torino del Consiglio Nazionale diRicerche. A CSM Micro Scratch instrument scratch testerwas used and the following conditionswere setup:
• scratch lehngth: 5 mm;
• applied load: progressive load increased from 1 N to 10 N;
• rate: 50 N/m.
The analysis was performed at room temperature on:
• Polished Ti;
• Ti + plasma + keratin at 3% wt.

4.7. SURFACE CHARACTERIZATION 89
4.7.3 SEM
Scanning Electron Microscopy (SEM) is used to study external morphology, chemical compositionand crystalline structure of the surface of the a sample.A focus beam of high-energy electrons is used and it is possible to obtain a 2-D images, with amagni�cation in a range between 20x to 30000x, and a spatial resolution of 50 to 100 nm.The instrumentation (Figure 4.29) is made up by:
• Electron Source Gun: electron beam is emitted from an electron gun �tted with a tungsten�lament cathode, expoiting its highest melting point and lowest vapor pressure comparedwith that of all metals, but in other case is possible to use lanthanum hexaboride (Lab6).The electron beam has an energy between 0,2-40 KeV;
• Electron lenses: the beam is accelerated down and passed through a combination of lensesand apertures: in this way is focused on a spot of about 0,4 to 5 nm. The beam passesthrough pairs of scanning coils or pairs of de�ector plates in the electron column, and isde�ected in the x and y axes so that it scans in a raster fashion over a rectangular area ofthe sample surface.
• Sample chamber: the sample is mounted on a stage in the chamber area and both thecolumn and the chamber are evacuated by a combination of pumps. The level of thevacuum will depend on the design of the microscope.
• Electron detector: when the primary electron beam reaches the sample, electrons loseenergy, due to randomly and repeated interactions with surface sample. The size of theinteraction volume depends on the electron's landing energy, the atomic number of thespecimen and the specimen's density. This energy exchange between the electron beamand the sample causes the re�ection of high-energy electrons by elastic scattering, emissionof secondary electrons by inelastic scattering and the emission of electromagnetic radiation:specialized detectors analyse them. Electronic ampli�ers can be used to amplify the signals.
• Computer and display: the signals detected by the detector generate images on the com-puter monitors.
Figure 4.30 shows the interaction between electron beam and the sample: in particular, theformation of secondary electrons and backscattered electrons (95) (96).
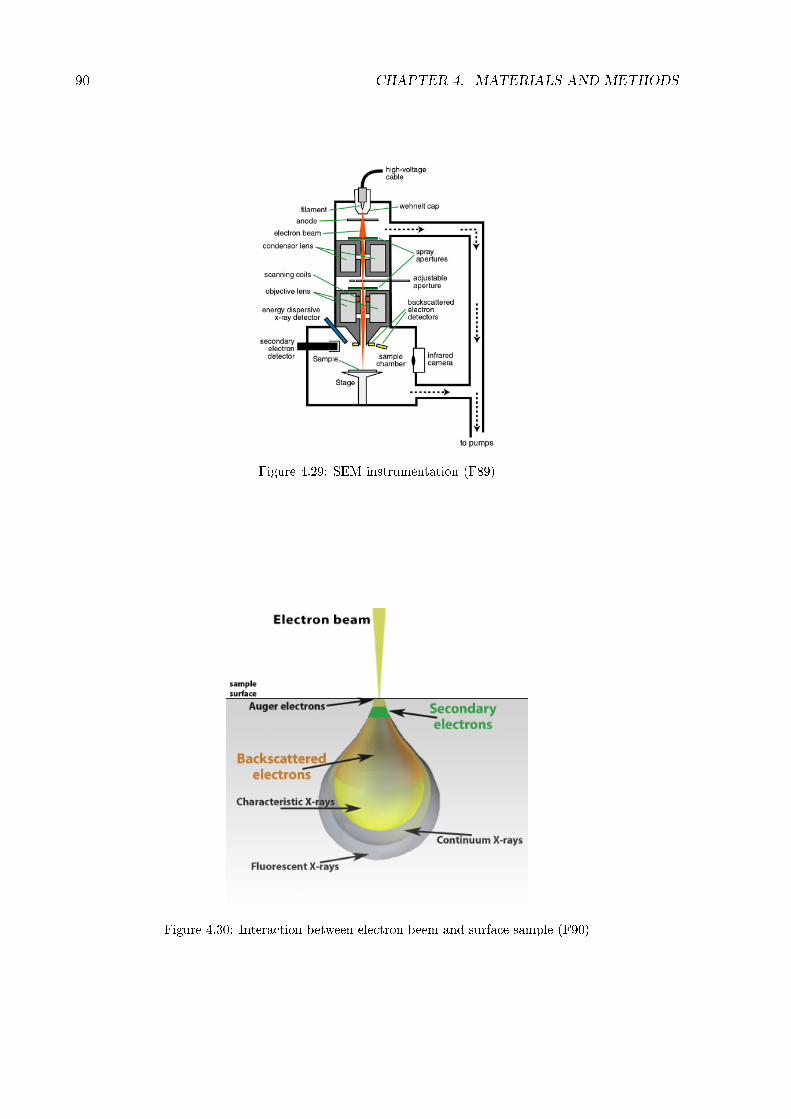
90 CHAPTER 4. MATERIALS AND METHODS
Figure 4.29: SEM instrumentation (F89)
Figure 4.30: Interaction between electron beem and surface sample (F90)

4.7. SURFACE CHARACTERIZATION 91
4.7.4 FESEM
Field Emission Scanning Electron Microscope (FESEM) is generally used to study topographicdetails of a surface. A focus beam of electrons is used to analyze the samples. In Figure 4.31 isshown a scheme of the instrument.
Figure 4.31: FESEM instrumentation (F91)
The set up is made up by:
• Source of electrons: a thin and sharp tungsten needle, with a tip diameter of 10−7- 10−8
m, is used as a cathode in front of a primary and secondary anode. Generally the voltagebetween anode and cathode is between 0,5 and 30 KV. It is necessary an extreme vacuum,10−8 Torr, in the column of the microscope, for this reason a pump is used, in addition toa device that regularly decontaminates the electron source by a current �ash;
• Column with lenses and aperture: electromagnetic lenses are used to focus the electronbeam. Based on the current in the condenser, the diameter of the beam can be higher orsmaller. Scan coils de�ect the beam on the sample, following a zig-zag pattern and at thesame time the image is formed on the monitor. The scan velocity determines the amountof noise in the image: rapid scan causes much noise.The objective lens is the lowest lens in the column. If the distance between lens and sampleis small, the objective lens needs to apply a greater force to de�ect the electron beam: thiscauses the smallest beam diameter, the best resolution, but also the poorest depth of �eld.Stigmator coils are used to correct irregularities in the x and y de�ection of the beam andthus to obtain a perfectly round-shaped beam.
• Sample chamber: the sample, covered by a conductive layer is monted on a holder andplaced into a chamber in high vacuum. The sample can be moved in horizontal and verticaldirection, can be tilted, rotated. The �secondary electron emission� detector is located atthe rear of the object holder in the chamber.
When the primary probe bombards the sample, secondary electrons are emitted from the objectsurface with a certain velocity that is determined by the levels and angles at the surface of theobject. Properties of secondary electrons depend on location and intensity of illumination of the

92 CHAPTER 4. MATERIALS AND METHODS
mirror. The signal produced by the scintillator is ampli�ed (97). It is possible to view the imagesin two modalities:
• Secondary Electron (SE): it is used to map the surface of a sample; a detector located inthe optical path is necessary to detect secondary electrons. A second detector is placed onthe wall of the chamber that contains the sample and allows to detect secondary electronshaving a small backscattered component
• Backscattered electron (BSE): it is used to show the compositional di�erences within thesample. The presence of elements with di�erent atomic numbers and their distributioncauses contrast in BSE images.
With FESEM analysis, it is possible to obtain topographical and elemental information atmagni�cation of 10 x to 300000x, with virtually unlimited depth of �eld. The samples must be�rst of all resistant to low pressures and not very volatile and moreover they must be conductors;if these are not, a very thin metallization (50-100 Å) is used with a conductive material. It isnecessary that the material can discharge to the ground the voltage that accumulates during thescanning with the electron beam, to avoid that artifacts are created in the image and that thesample degrades (98). FESEM analysis was conducted on:
• Smooth Ti + keratin nano�bers;
• Rough Ti + keratin nano�bers.

4.7. SURFACE CHARACTERIZATION 93
4.7.5 Roughness and homogeneity
Pro�lometer
Surface roughness is quanti�ed by the deviation in the direction of the normal vector of a realsurface from its ideal form. It can be calculated on a pro�le or on a surface.There are di�erent parameters, included in BS EN ISO 4287:2000 British standard, identicalwith the ISO 4287:1997 standard:
• Ra (arithmetical mean roughness value): the arithmetical mean of the absolute values ofthe pro�le deviations (Zi) from the mean line of the roughness pro�le;
• Rmr (c) (material component of the pro�le): the fraction of a line, which, insectioning apro�le, cuts through material at a stipulated height c above the mean line (in µm). Statedas a percentage;
• RSm (mean peak width): mean value of the width of the pro�le elements Xsi (previouslySm); horizontal and vertical counting thresholds are stipulated for this evaluation;
• Rt (total height of the roughness pro�le): di�erence between height Zp of the highest peakand depth Zv of the deepest valley within the evaluation length;
• Rzi (greatest height of the roughness pro�le): sum of the height of the highest pro�le peakand the depth of the deepest pro�le valley, relative to the mean line, within a samplinglength lri;
• Rzi1max (maximum roughness depth): largest of the �ve Rzi values from the �ve samplinglengths lri within the evaluation length ln;
• Rz (mean roughness depth): mean value of the �ve Rzi values from the �ve samplinglengths lri within the evaluation length ln.
The most common used is Ra, represented in Figure 4.32 (99).
Figure 4.32: Arithmetical mean roughness value Ra (F92)
In order to evaluate the roughness of titanium bars, a contact pro�lometer was used at CNR- Area di Ricerca di Torino del Consiglio Nazionale di Ricerche. A diamond stylus, with a smallradius, is moved in contact with the sample, for a certain distance and at determined contactforce. A detector tip, equipped with the stylus, electrically detects the motion of the stylusand the signals go to an ampli�cation and a digital conversion process occurs (Figure 4.33). Inthis way, small surface variations are measured as vertical stylus displacement in function of theposition. In this work it was used for:
• Ti bars before polishing and being rough;
• Ti bars after polishing and being rough;
• Ti + plasma + keratin 3% wt.

94 CHAPTER 4. MATERIALS AND METHODS
Figure 4.33: Contact-type surface pro�lometer (F93)
LSM
In order to characterize 2D and 3D microstructure and surface, a confocal laser scanning micro-scope was used. This tecnique was born to overcome some limitations of traditional wide-�eld�uorescence microscopes: in a conventional system, the entire sample is �ooded in light andall the parts in the optical path are exited, causing a �uorescence detected by a microscope'sphotodetector; whereas a confocal microscope uses the pinhole, i.e. the aperture of a confocalmicroscope, to block the out-of-focus informations and to detect only in focus informations.One of the most advantages of this tecnique is represented by the better image's optical resolution,expacially in depth direction. In this way, because much of the light from sample �uorescenceis blocked by pinhole, the intensity of the signal is lower, for this reason sensitive detectors,usually a photomultiplier tube (PMT) or avalanche photodiode, are used, transforming the lightsignal into electrical one. The scanning of the sample is performed in a rectangular pattern, inthe horyzontal plane, using one or more oscillating mirrors. During the analysis the distancebetween sample and objective lens is changed, so the sample is optical sectioned and an imagestack is generated. By analyzing the intensity distribution of a single pixel through the imagestack, it is possible to calculate the corresponding height: a height map is formed conbining theinformation of the whole stack over the whole �eld of view.The scheme of the system, the image stack and the intensity of a one pixel are shown in Fig-ure 4.34.
There are four types of confocal microscopes:
• Confocal laser scanning microscopes use 2 or 3 mirrors to scan the laser across the samplelinearly along the x- and the y- axes, and "descan" the image across a �xed pinhole anddetector;
• Spinning-disk confocal microscopes uses a series of moving pinholes on a disk to scan spotsof light. Each pinhole is allowed to hover over a speci�c area for a longer amount of time,reducing the excitation energy needed to illuminate a sample when compared to laserscanning microscopes: phototoxicity and photobleaching of a sample are reduced, so thissystem is used for imaging live cells or organisms;
• Microlens enhanced or dual spinning-disk confocal microscopes are similar to the previouscase, but a second spinning-disk containing micro-lenses is placed before the spinning-diskcontaining the pinholes. The microlens, associated to a single pinhole, capture a broad

4.7. SURFACE CHARACTERIZATION 95
Figure 4.34: (a) Scheme of the confocal laser scanning microscope; (b) Image stack; (c) Intensity of onepixel (F94)
band of light, causing an increase in the amount of light directed into each pinhole andreducing the amount of light blocked by the spinning-disk;
• Programmable array microscopes (PAM) uses an electronically controlled spatial light mod-ulator (SLM) that produces a set of moving pinholes.
With this instrument, it is possible to analyse also biological samples, that have to be treatedwith �uorescent deys, in order to make selected parts visible. In other cases, it is possible totrack single �uorescent molecules (100).
It is also possible to detect structure with weak contrast, due to the trasparency of lowre�ection of the sample, using Circular Di�erential Interference Contrast (C-DIC), which is apolarization technique, that uses circularly polarized light, to include comprehensive geometric,functional and roughness studies, and create detailed surface analysis reports, surface textureanalysis, contour analysis, grains and particle analysis, 3D Fourier analysis, analysis of surfaceevolution, and statistics.It is generally used to analyse coatings, multi-layer structures, surface texture, or to conducttribology or failure analysis (101).
In this work a laser scanning microscope ZEISS LSM 800 was used (Figure 4.35).The sample tested were:
• Ti + plasma + keratin 3% wt on half surface;
• Titanium bars after polishing and being rough.
The protocol used to calculate surface roughness of titanium bars is shown in Figure 4.36: leastsquare method is use to level the surface, using a polynomial expression of degree 3, form isremoved, then using Gaussian �lter of 2,5 and 244 µm, the roughness is measured.

96 CHAPTER 4. MATERIALS AND METHODS
Figure 4.35: Confocal laser scanning microscope ZEISS LSM 800 (F95)
Figure 4.36: Method of measurement of roughness

4.7. SURFACE CHARACTERIZATION 97
4.7.6 Wettability
Wettability is de�ned as the ability of a liquid to remain in contact with a solid surface, thanksto the interactions at molecular level between liquid and solid interface. In order to evaluate thedegree of wettability of a material, the contact angle θ is measured. It depends on the values offree energies per unit surface area of the solid-vapor, liquid-vapor, and solid-liquid interfaces, asalready seen. Based on the contact angle value, it is possibile to de�ne if the surface is wettableor not, and consequently how strong are the bonds at the interface: small contact angle, θ < 90◦,correspond to high wettability, while large contact angle, θ > 90◦, correspond to low wettability(Figure 4.37), if θ = 180◦ the surface is not wettable, whereas θ = 0◦, the surface is completelywettable (102).
Figure 4.37: Illustration of contact angle (F96)
The aim is to evaluate if keratin coating changes hydrophilic or hydrofobic characteristics ofthe surface sample.The instrument used was a KRUSS DSA 100 (Figure 4.38). The sample to be analyzed, wasplaced on a horizontal plate and with a front microscope it possible to capture sample imagesduring the test. The measurements were made depositing at a distance from each other, 5 µl ofthe solution with the aid of a micropipette. Once captured, the images were processed with thecomputer software and the static contact angle measurement was made.This test was conducted using water on:
• Polished Ti;
• Ti + plasma + keratin 3% wt.
Then using a keratin solution at 3% wt, the contact angle test was performed on:
• Polished Ti;
• Ti + plasma.
4.7.7 Stability in water
In order to analyze how keratin coating reacts to a long period in contact with water, a test ofthe stability in water was conducted on:
• Ti + plasma + keratin at 3% wt.
For this test, two beakers were �lled with 10 ml of ultrapure water. In each beaker a samplewas placed, with the uncovered face in contact with the bottom of the beaker. Then they wereplaced in incubator at 37◦C. After 24 hours, the beakers were taken from the incubator. After

98 CHAPTER 4. MATERIALS AND METHODS
Figure 4.38: KRUSS DSA 100
taking out the samples, the two beakers were washed with ultrapure water, while each samplewas dried in order to evaluate any macroscopical change in the appearence in the coating. Atthis point the beaker were �lled with other 10 ml of water and the samples were immersed intoin the same way of previous case. Then the beaker were placed in the incubator. This operationswere repeated after 7, 14, 21, 28 days with the same conditions.

4.7. SURFACE CHARACTERIZATION 99
4.7.8 Zeta potential
Generally the ζ potential is used to describe the behavior of colloidal system, such as particledispersions or emulsions and to evaluate their stability. But, based on the same theoreticalbackground, zeta potential can be applied to the analysis of macroscopic solid surface, havinga di�erent meaning. In this case the charging behavior at solid-liquid interface is described,using the model of electrical double layer (EDL): on a solid surface, in contact with an aqueoussolution, a charge is assumed, the charged solid surface causes a di�erent charge distributionin the liquid phase. A double layer are formed, in fact is possible to distinguish the stationaryimmobile layer and the di�use mobile layer of counterions. The plane which separe the two layersis the "shear plane" and the electrical potential at this point is the zeta potential (Figure 4.39).When zeta potential is measured, electrokinetic e�ects are involved, observed at the interface
Figure 4.39: Model of the electrical double layer at solid-liquid interface (F97)
between a solid, liquid or gas phase with a liquid phase. In particular, if an aqueous solution�ows into a capillary system, an electrical response is generate: a DC current or a continuousvoltage is generated, depending on the measurement conditions. When the aqueous solution�ows into the capillar, which can have a regular or irregular shape, on the solid surface a chargeis generated, compensated by counterions in the aqueous solution: in this case shear force aregenerated on counterions, which �ows in the direction of the �ow. An electric force, opposedto the liquid �ow is generated, due to the charge separation between capillary inlet and outlet.This generate an electrical potential di�erence detected by electrodes.
Di�erent parameters can in�uence the measurment:
• The shear rate at solid-liquid interface, depending by the size of the capillary and the �owrate of the solution, a�ects the charge separation;
• The formation of a charge separation depends on the number of ions present in the aqueoussolution and on their strength;
• The geometry of the capillary, such as capillary dimensions, in�uences the current or thevoltage generated.
Generally the set-up for streaming potential is made up by a measuring cell, eletrodes, voltmeter,a container which measuring liquid, a grounded metal cage to protect the system from exernalelectromagnetic �elds, a pump, pressure transducers and probes for pH measurement and con-ductivity of the solution.

100 CHAPTER 4. MATERIALS AND METHODS
The charge formation at solid-liquid interface occurs due to the acid-base reactions and due tophysical adsorbition of water ions. Both mechanisms depend on the pH value of the aqueous so-lution, so this is the most important parameter which in�uences the zeta potential. Figure 4.40shows how zeta potential for solid surfaces with acidic, basic and amphoteric functionalities,changes at di�erent pH value. It is possible to see that at a certain pH, zeta potential is 0 mVand reverses its sign. This point is known as isoelectric point (IEP), which is de�ned as the pHvalue of the aqueous solution at which there is an equilibrium between positively and negativelycharged surface groups. The IEP is a good indicator of the chemistry of the functional groups
Figure 4.40: pH dependence of the zeta potential for surfaces whid acidic, basic and amphoteric behavior(F98)
present on the surface of a solid. If the zeta potential is described as a function of pH by well-de�ned curves, surfaces exhibit only one type of functional group. The curve presents a plateauin di�erent position depending on whether the surface has an acid, basic or amphoteric behavior.
However, in most cases, the samples analyzed show a heterogeneous composition of functionalgroups and hence the curve that will be obtained will be more complex. Furthermore, there isno evidence that the zeta potential is dependent on the size of the sample and the roughness ofthe surface (105).
In this work the ζ potential analysis was conducted on the following couples of samples:
• Polished Ti;
• Ti + plasma;
• Ti + plasma + keratin 3% wt.
The aim was to analyze how di�erent surface treatments and the presence of a keratin coatingin�uence the formation of a charge of the samples surface.The test was conducted with the Surpass electrokinetic analyzer, Anton Paar, shown in Fig-ure 4.41.
Prior to start the analysis, the instrument was washed with ultrapure water by interposinga connecting tube between the two electrodes, then performing the closed loop �lling procedurewithout titration, using as electrolyte solution 45 mg of KCl in 600 ml of ultrapure water. Thecouple of samples to analyze were �xed using an appropriate adhesive to a samples holder, whichhave been inserted in the appropriate space in the measuring cell, leaving a small gap betweenthe two samples. This space was brought by rotating one of the graduated wheels included inthe cell at 100 µm in the initial step of adjusting the measurement parameters. With the use ofa software, �ow is controlled: it is possible to see the �ow, expressed in [ml/min], as a function

4.7. SURFACE CHARACTERIZATION 101
Figure 4.41: Electrokinetic analyzer for zeta potential measurement
of the pressure, expressed in [mbar], by tracing two curves: the �rst is relative to the �ow fromleft to right and the second to the �ow in the opposite direction, thus allowing the detection ofthe pressure value to be set for a �ow of 100 ml/min. The �rst measurement was done withouttitration to �nd the zeta potential of the sample at the pH of the electrolyte.
The analysis was divided into two steps: the �rst is represented by the acid tritation analisys,the second by the basic tritation analysis. For acid titration, an increase in ml of 0.05 M HCl wasset to add during the measurement and for each step the software returned four measurementswith corresponding average value. After the �rst analysis the samples were removed from thecell, the machine was washed with the same protocol described before; on the sample holder twoothers samples are �xed and placed in the cell, in this way for each analysis two di�erent couplesof samples were used. The the basic tritation analysis was conducted with NaOH 0.05 M, in thesame way of the previous case.The parameters that were measured are: pH, conductivity, temperature, �ow current, pressureand �ow.
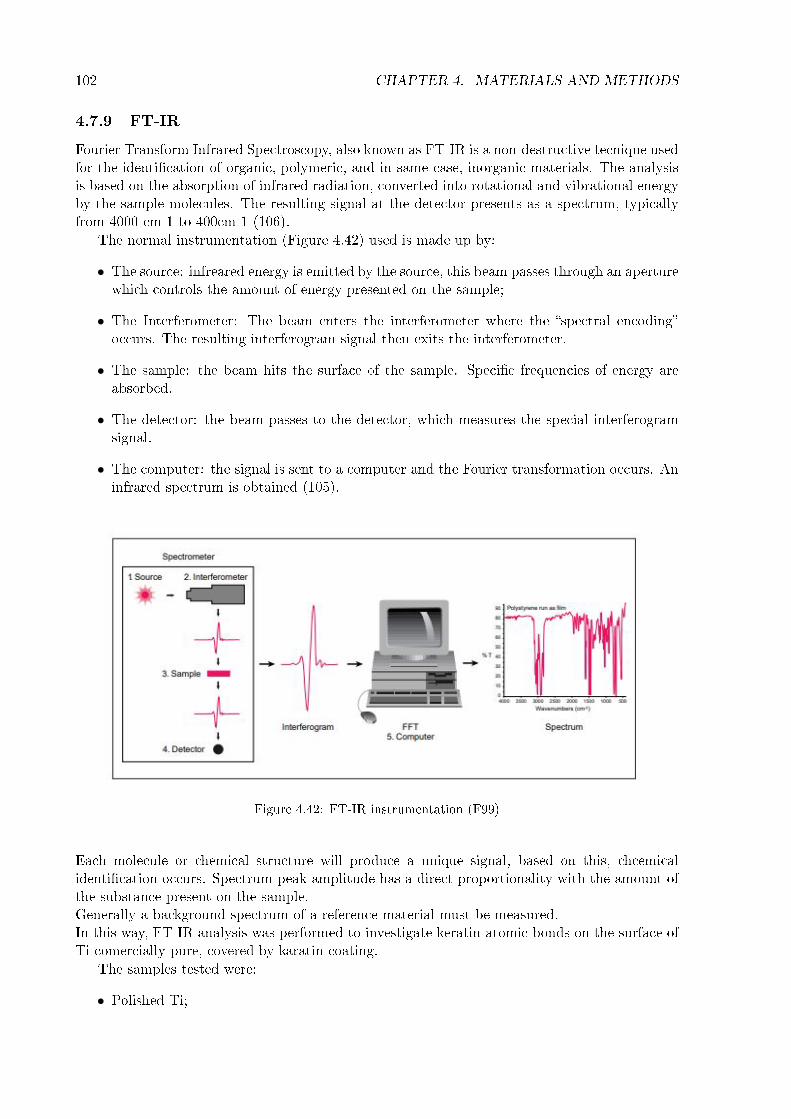
102 CHAPTER 4. MATERIALS AND METHODS
4.7.9 FT-IR
Fourier Transform Infrared Spectroscopy, also known as FT-IR is a non-destructive tecnique usedfor the identi�cation of organic, polymeric, and in same case, inorganic materials. The analysisis based on the absorption of infrared radiation, converted into rotational and vibrational energyby the sample molecules. The resulting signal at the detector presents as a spectrum, typicallyfrom 4000 cm-1 to 400cm-1 (106).
The normal instrumentation (Figure 4.42) used is made up by:
• The source: infreared energy is emitted by the source, this beam passes through an aperturewhich controls the amount of energy presented on the sample;
• The Interferometer: The beam enters the interferometer where the �spectral encoding�occurs. The resulting interferogram signal then exits the interferometer.
• The sample: the beam hits the surface of the sample. Speci�c frequencies of energy areabsorbed.
• The detector: the beam passes to the detector, which measures the special interferogramsignal.
• The computer: the signal is sent to a computer and the Fourier transformation occurs. Aninfrared spectrum is obtained (105).
Figure 4.42: FT-IR instrumentation (F99)
Each molecule or chemical structure will produce a unique signal, based on this, chcemicalidenti�cation occurs. Spectrum peak amplitude has a direct proportionality with the amount ofthe substance present on the sample.Generally a background spectrum of a reference material must be measured.In this way, FT-IR analysis was performed to investigate keratin atomic bonds on the surface ofTi comercially pure, covered by karatin coating.
The samples tested were:
• Polished Ti;

4.7. SURFACE CHARACTERIZATION 103
• Polished Ti + keratin 7% wt;
• Ti + plasma + keratin 7% wt;
• Ti + UV + keratin 7% wt;
• Ti grooves + keratin 7% wt;
• Ti hexagonal + keratin 7% wt;
• Ti + plasma + keratin 3% wt;
• Polished Ti + keratin 1% wt;
• Ti + plasma + keratin 1% wt;
• Ti + UV + keratin 1% wt.

104 CHAPTER 4. MATERIALS AND METHODS
4.7.10 XRD
X-ray di�raction is a nondestructive technique, used to analyze crystalline phases in the material.It gives informations about structures, phases, preferred crystal orientations, average grain size,crystallinity, strain, and crystal defects.The setup is made up by X-ray tube, a sample holder and X-ray detector (Figure 4.43).
Figure 4.43: Scheme of XRD analysis (F100)
X-rays monochromatic beam is generated in the cathode ray tube, it has a de�ned λ. Thebeam irradiates the sample, the radiations di�racted by the sample are collected by a detectorthat transforms them into electrical impulses, which are then ampli�ed and sent to a computerthat allows them to be processed.This analysis is based on the Bragg equation: nλ = 2d sin θ. In this equation n is an integer,λ is the characteristic wavelength of the X-rays, d is the interplanar spacing between rows ofatoms, and θ is the angle of the X-ray beam with respect to these planes (Figure 4.44). When
Figure 4.44: Scheme of X-rays irradiating the sample and re�ected by itself (F101)
this equation is satis�ed, X-rays scattered by the atoms in the plane of a periodic structure arein phase and di�raction occurs in the direction de�ned by the angle θ. Comparing the spectrum

4.7. SURFACE CHARACTERIZATION 105
obtained to a database of known patterns is possible to make chemical identi�cation. A XRDspectrum gives the following informations:
• from the angular position of the peak, it is possible to de�ne the interplanar distance andthe parameters of the materials;
• from the intensity of the peaks, it is possible to know the position of the atoms in theelmentary cell;
• from the width of the peaks or the mid-height amplitude (FMHW), it is possible to obtaininformations on the size of the crystals and on the possible deformation su�ered by them(107).
This test was conducted on:
• keratin �lm at 7% wt in water;
• keratin �lm at 3% wt in water,
and the results were compared with the spectra of keratin �lm in formic acid.

106 CHAPTER 4. MATERIALS AND METHODS
4.7.11 XPS
X-Ray Photonelectron Spectroscopy (XPS) is a quantitative analysis technique used to measurethe chemical composition of a surface. It gives informations about the elements present on thesurface and how they are bonded to the other elements.The analysis is based on the photoemission e�ect (Figure 4.45): when an atom or moleculeabsorbs an X-ray photon, an electron can be ejected, the kinetic energy (KE) of the electrondepends upon the photon energy (hν) and the binding energy (BE) of the electron. By measuringthe kinetic energy of the emitted electrons, it is possible to determine which elements are presentin material's surface, their chemical states and the binding energy of the electron. The bindingenergy depends upon a number of factors, including the element from which the electron isemitted, the orbital from which the electron is ejected and the chemical environment of the atomfrom which the electron was emitted.
Figure 4.45: Photoemission e�ect involves in XPS analysis (F104)
A monocromatic beam of X-ray irradiates the sample, electrons are emittided by the samplewith a certain kinetic energy. Measuring the number and the kinetic energy of the electronsemitted, it is possible to de�ne their binding energy and allows the chemical composition of thesample. An hemispherical electron energy analyzer allows to select a certain value of kineticenergy, controlling the inner and outer potential, and a detector counts the number of electronshaving that kinetic energy.In Figure 4.46 is shown a scheme of the XPS analysis. This technique is de�ne super�cial, becausethe depth of analysis is about 1-10 nm, and requires a high or ultra-high vacuum conditions.A typical XPS spectrum, known as Survey spectrum, shows the number of electron detected asa function of the binding energy. Each chemical element produces a characteristics set of peaksat speci�c energy values. The number of electrons with certain kinetic energy is releated withthe ammount of that element on the surface of the sample. The best way to compare XPS inten-sities is by atomic percentage concentrations, since not all electrons emitted by the sample aredetected by the instrument. In this way, intensities are represented as a percentage, correlatingthe intensity of interest to the total intensity of the electrons involved in the measure.It is also possible to perform a high-resolution analysis: is possible to distinguish di�erent ele-ments that show overlapping in Survey spectrum, but is also useful to know the oxydation state

4.7. SURFACE CHARACTERIZATION 107
Figure 4.46: Scheme of XPS analysis (F105)
and the chemical around of an element.It was possible to accurately determine the chemical composition of the �rst super�cial layers andto add more information about the chemical elements of interest. The high-resolution spectrumrevealed the types of chemical bond in which the keratin is involved (107) (108).
The analysis was conducted at Istituto Italiano di Tecnologia (IIT), Genova.The samples analyzed were:
• Polished Ti,
• Ti + plasma;
• Ti + UV;
• Ti + plasma + keratin 3% wt;
• Polished Ti + keratin 1% wt;
• Ti + plasma + keratin 1% wt;
• Ti + UV + keratin 1% wt.

108 CHAPTER 4. MATERIALS AND METHODS

Chapter 5
Results and discussions
The aim of this work is to analyse functionalized titanium samples and study adhesive propertiesof a keratin coating on titanium surfaces, treated in di�erent ways, in order to �nd the surfacetreatment which can better improve the strength of bonds between coating and substrate. Thissystem can be used in dental applications, due to the biocompatibility of titanium and due tothe important role played by keratin in wound healing and proliferation of �broblasts.After adhesion test, the surface was charcaterized with di�erent tecniques, in order to investigatethe features of the coating.The samples used during the tests are shown in Figure 5.1 Two types of coating were studied:
Figure 5.1: Summary of the samples used
109

110 CHAPTER 5. RESULTS AND DISCUSSIONS
keratin coating at 7% wt and keratin coating at 3% wt. As it is possible to see in the table, theapperance of the two coatings is completely di�erent: in the case of keratin solution at 7% wt,it is non homogenous and characterized by bubbles, whereas the coating obtained with keratinsolution at 3% wt is more homogenous and smooth.Samples functionalized with keratin solution at 1% wt, have similar apperance, they do not showchanges in appearance before and after functionalization, so it is impossible to distinguish dif-ferent treatments performed.Electrospun keratin nano�bers have a particular appearance: after deposition and thermal treat-ment, they are similar to a white �lm on the sample.Samples with grooves or hesagonal pattern were also analyzed, using a coating of keratin at 7%wt, while titanium cylinder, after plasma treatment, was coated with alligned nano�bers.

5.1. ADHESION TEST 111
5.1 Adhesion test
5.1.1 Tape test
In this work, the adhesion of a thin coating of keratin on substrates of commercially pure titaniumwas evaluated, in order to identify the surface treatments that can better improve adhesionproperties.
A Tape Test was conducted on the following samples:
• Polished Ti + keratin 7% wt;
• Ti + plasma + keratin 7% wt;
• Ti + UV + keratin 7% wt;
• Ti + keratin 3% wt;
• Ti + plasma + keratin 3% wt.
As it is possible to note from Figure 5.7, there are a lot of di�erences between the samples whichdo not undergone any surface treatment and the samples which were treated with plasma orirradiated with UV. For each sample is possible to see: an image of the sample before tape test,an image after tape test, and an image of tape after peeling, which can have a di�erent amountof removed coating on it.In the case of polished Ti, it is evident that most of the coating was removed by the adhesiveused during the test, it means that very weak bonds were created between coating and substrate.In the case of samples treated with UV and with plasma, an improvement in adhesion propertiesis clear. In both this cases, a small part of the keratin coating has detached during the engravingof the grid, but most remained adhered to the substrate after tape test: plasma surface treatmentand UV irradiation have been improved bonds strength.As already said, the keratin solution at 7% wt was dense and it was di�cult to obtain anhomogeneous coating. For this reason a keratin solution at 3% wt was prepared and depositedon polished Ti and on plasma-treated samples and, in both cases, tape test was conducted.Although excellent results have been obtained with both treatment, UV and plasma, it wasdecided to continue this analysis only on the plasma-trated samples for various reasons: observingsamples after tape test, it is possible to see that on the Ti surface treated with plasma a morehomogeneous coating is present, in addition the plasma performs a double function, as it activatesand decontaminates the sample; moreover it has been thought that generally the companies thatproduce dental prothesis have avaible and use the plasma.
Regarding untreated surface coated with keratin at 3%, it is possible to see that part of thecoating has been detached from the substrate, but in smaller quantities than the case of keratinat 7% wt: it is possible to note that, an homogeneous coating has improved adhesion properties.In the case of plasma-treated Ti with keratin coating at 3%, tape test con�rms that plasmatreatement improves adhesion between substrate and coating, infact the only coating portionremoved from the sample is that detached during engraving the grid, in a similar way of previouscase.

112 CHAPTER 5. RESULTS AND DISCUSSIONS
Figure 5.2: Tape test on Polished + ker 7% wt
Figure 5.3: Tape test on Ti + plasma + ker 7% wt
Figure 5.4: Tape test on Ti + UV + ker 7% wt
Figure 5.5: Tape test on polished Ti + ker 3% wt
Figure 5.6: Tape test on Ti + plasma + ker 3% wt
Figure 5.7: Tape test on keratin coating

5.1. ADHESION TEST 113
In order to compare the behavior of keratin in form of �lm and in form of �bers, anothertape test was conducted on a titanium samples, treated with plasma in the same conditions ofthe previous cases, but coated with keratin nano�bers, obtained by electrospinning technique.The results was shown in Figure 5.8.
Figure 5.8: Tape test on Ti + plasma + keratin nano�bers
In this case, as it is possible to see, all the nano�bers were detached by the adhesive duringthe test, so the plasma treatment did not imrpove the nano�ber adhesion, but weak bonds werecreated between substrate and nano�bers.To explain this behavior, a FESEM analysis was carried out on:
• Smooth Ti + keratin nano�bers;
• Rough Ti + keratin nano�bers.
Figure 5.9 and Figure 5.10 show the FESEM images at di�erent magni�cations. The lack ofadhesion can be explained considering the numerous beads present: it is possible to see the pres-ence of this defects on both samples, probably due to the conditions in which the test occurred.This defects have greatly reduced the adhesion capacity of keratin on titanium substrate, despitethe plasma treatment.

114 CHAPTER 5. RESULTS AND DISCUSSIONS
Figure 5.9: FESEM images of keratin nano�bers on smooth Ti at di�erent at di�erent magni�cations
Figure 5.10: FESEM images of keratin nano�bers on rough Ti at di�erent at di�erent magni�cations

5.1. ADHESION TEST 115
5.1.2 Scratch test
In order to better understand adhesion properties of keratin coating, a scratch test was conducted.It was decided to analyse with this tecnique only plasma-treated titanium surface with keratincoating at 3% wt, because it was the sample with the better behavior during tape test. Theresult was compared with a titanium surface.In Figure 5.11 a comparision between the scratch on keratin coating and on titanium surface isshown.
Figure 5.11: Scratch test on keratin coating and titanium surface
As it is possible to see, there are di�erences between the two tests. The analysis started witha load of 1N: at this load no trace can be seen on keratin coating, while on titanium surface ispossible to see a crack at the beginning of the test.Another important di�erence is the morfology of the scratch at 3,82 N for keratin and at 1,64N for titanium. In the �rst case, the crack is homogeneous, with particular morphology in thecenter, while on titanium surface stripings characterized all the crack and became more packedwith the increase of the load.It is important to note the appearance of the scratch in keratin coating at 8,21 N. This pointcorresponds with the peak of acoustic emission: from the zoom, it seems that keratin coatinghas spread along the edge of the crack, but the titanium substrate is not exposed.
For both the samples, the friction coe�cient was evaluated and the result are shown in Fig-

116 CHAPTER 5. RESULTS AND DISCUSSIONS
ure 5.12. As it is possible to see, the two curves have di�erent trend: in the case of titanium, thestrating value is higher (COF=0,4), compared with that of keratin, and increasing the distance,for titanium it assumes values very high (COF=0,6), while keratin curve presents a plateau ata value around 0,3. This means the keratin has a lower friction coe�cient and, probably, thisexplain the appearance of coating at LC2. It can be said that keratin coating has an importantfunction in protecion of titanium substrate, in fact the only part damaged was that of keratincoating.
Figure 5.12: COF of titanium and keratin

5.2. THICKNESS AND HOMOGENEITY OF THE COATING 117
5.2 Thickness and homogeneity of the coating
From the results obtained by tape test, it is evident that keratin coating at 3% wt has betteradhesion properties on titanium substrate. For this reason it was decided to evaluate the thicknessof this coating: the sample with an half surface coated was used.Two di�erent types of test were conducted, generally used to estimate the roughness of a sample:a pro�lometer and a confocal laser scanning microscope. Then the results were compared.
Regarding the pro�lometer, the test was conducted taking the uncoated titanium surface asreference and measuring the height of the step. Four measures ware performed and the resultsare shown in Table 5.1. Avarage and standard deviation were also measured.
Table 5.1: Values of thickness of keratin coating at 3% wt
As it is possible to see, the thickness of the coating is around 11 µm. Figure 5.13 shows thepro�le of the sample and the measure of the thickness of the coating.
Figure 5.13: Measure of the thickness of the keratin coating
Using the same pro�lometer, it was evaluate the roughness of the keratin coating. Threetests were conducted and the results are shown in Table 5.2. Avarage and standard deviationare calculated. As it possible to see, the value of the roughness of the coating is around 0,5 µm.
Then a confocal laser scanning microscope was used: it gives informations about keratincoating, in particular it evaluates the homogenity of the coating on the substrate and its thickness.Figure 5.14 and Figure 5.15 show the keratin coating images obtained by LSM: in the �rst imageis possible to see that the thickness of coating is homogeneous, except for some areas that have aslightly lower thickness. In this case, it is important to underline that cut o� were used in orderto eliminate weak signals. The second image shows that keratin coating is homogeneous in 3-D.

118 CHAPTER 5. RESULTS AND DISCUSSIONS
Table 5.2: Values of roughness of keratin coating at 3% wt
Figure 5.14: Scan of the coating in �uorescence detector
In Figure 5.16 shows the LSM image in wide�eld of coated substrate: in �gure (a), becausethe coating is trasparent, the substrate is visible, in �gure (b) is possible to see the coating in�uorescence, which results to be homogeneous in two-directions.
Regarding the thickness of the coating, the image obtained by LSM is shown in Figure 5.17.As it is possible to see, there are two peaks: they refers to the re�ection of light at the interfacebetween coating and substrate and at external surface of the coating. The distance between thetwo peaks is correlated to the thickness of the coating.Five analysis were conducted and the results are shown in Table 5.3. Avarage and Standarddeviation were calculated. To do the analysis a re�ective index of 1,55 was used, as found inliterature. It was found that the thickness of the coating was around 6 µm.

5.2. THICKNESS AND HOMOGENEITY OF THE COATING 119
Figure 5.15: Scan of the coating in �uorescence detector
Figure 5.16: Scan of the coating in wide�led
Table 5.3: Values of thickness of the coating evaluated with LSM

120 CHAPTER 5. RESULTS AND DISCUSSIONS
Figure 5.17: Measure of the thickness of the keratin coating using LSM

5.3. WETTABILITY 121
5.3 Wettability
In order to understand how surface treatments change the hydrophilic/hydropfobic characteristsof the materials, two wettability tests were performed, under ambient conditions.In the �rst analysis, was studied the wettability properties, using ultrapure water on:
• Polished Ti;
• Ti + plasma + keratin 3% wt.
Table 5.4 shows the values of contact angles for the two samples. In both cases, the mean andstandard deviation of the values obtained were calculated and the data were reported on a bargraph, in order to have a comparision of the di�erent behaviour of two surfaces, in contact withthe same liquid (Figure 5.18).
Table 5.4: Values of contact angles of water on polished Ti and Ti + plasma + ker 3% wt
It was found that the contact angle on polished titanium surface is around 70◦, in accordancewith literature data (109), while the contact angle of water on keratin coating is around 60◦:keratin shows hydrophilic properties, confermed by literature values (36).
As it can be seen, the contact angle of samples with keratin coating is lower than that withoutcoating. This means that the presence of keratin in the form of thin homogeneous coating makestitanium substrate more hydrophilic, due to the funcional groups exposed by keratin layer. Thisrepresents an important results, because the decrease in contact angle causes an increase inadhesion properties.

122 CHAPTER 5. RESULTS AND DISCUSSIONS
Figure 5.18: Avarage of the values of contact angles for polished Ti and Ti + plasma + ker 3% wt
Table 5.5: Values of contact angles of keratin solution 3% wt on polished Ti and Ti + plasma
Then a second test was performed. In this case, it was evaluated how surfaces with di�erenttreatments are wet by keratin solution at 3% wt. The contact angle was measured on:
• Polished Ti;
• Ti + plasma.
In this case, only one measure was carried out for each sample, and the results are shown inTable 5.5. The angle contact value for the non-treated surface is higher than that of plasma-treated surface: the surface treatment has improved wettability. This is an important result,because wettability, and consequently θ, gives information about surface energies, which arereleated with the formation of adhesive bonds. The value of θ a�ects coating adhesion: if it islow, it causes an increase in the strength of bonds. In Figure 5.9 and Figure 5.10 are shownthe images of the drop on keratin solution on the two surfaces: it is clearly possible to see thedi�erent wettability of the surfaces and, consequently, the di�erent shape of the drop and inangle contact values.

5.3. WETTABILITY 123
Figure 5.19: Keratin 3% wt drop on polished Ti
Figure 5.20: Keratin 3% wt drop on plasma-treated Ti

124 CHAPTER 5. RESULTS AND DISCUSSIONS
5.4 Stability in water
In order to evaluate the behavior of keratin in contact with water, a test of stability in waterwas performed on two plasma-treated samples, coated with keratin coating (3% wt). The sam-ples were immersed in ultrapure water and the macroscopical changes in their appearance wereanalyzed after 1, 7, 14, 21 and 28 days.In Figure 5.22, Figure 5.22, Figure 5.23, Figure 5.24, Figure 5.25 and Figure 5.26 are reportedthe images of the two samples (called 1 and 2) before the immersion and during the test. As itis possible to see, after one day of immersion the keratin appereance changes: it seem to haveswollen, but there are not signi�cative changes between its apperance after 1 day or 28 days,except for sample 2 at 28 days.After thermal stabilization at room temperature, the apperance changes (Figure 5.27): the ker-atin coatings have assumed the appearance of a dry thin �lm, that in some parts has lost adhesionwith the substrate.
Figure 5.21: Samples 1 and 2 before immersion
Figure 5.22: Samples 1 and 2 after 1 day of immersion
Figure 5.23: Samples 1 and 2 after 7 days of immersion

5.4. STABILITY IN WATER 125
Figure 5.24: Samples 1 and 2 after 14 days of immersion
Figure 5.25: Samples 1 and 2 after 21 days of immersion
Figure 5.26: Samples 1 and 2 after 28 days of immersion
Figure 5.27: Samples 1 and 2 after dried at room temperature

126 CHAPTER 5. RESULTS AND DISCUSSIONS
5.5 Zeta potential
In order to investigate the surface charge, ζ-potential tests were performed on the followingsamples:
• Polished Ti;
• Ti + plasma;
• Ti + plasma + keratin 3% wt.
Figure 5.28 shows a comparison of the curves of the di�erent samples tested. As it is possibleto see, all of them have a value of IEP identi�ed for acidic pH, betwwen 3,5 and 5,5, andconsequently all the surfaces are negatively charged at physiological pH.
Figure 5.28: ζ-potential of polished Ti-cp, Ti-cp + plasma and Ti-cp + plasma + ker 3% wt
Figure 5.29 shows the curve obtained during the analysis of samples of polished Ti. As it ispossible to see, the IEP is in relation with a pH value of 4, according to previous works (110).In the �gure are reported the deviation standard values of zeta-potential.
Figure 5.30 shows the curve obtained for a plasma-treated Ti sample. As it is possible tonote, an anomaly is present for pH values around 5,5: it can be ascribed to an experimentalerror in the measurement. In any case, it is clear that a shift toward the basic range is due tothe surface treatment that exposes an enhanced number of surface functional group with basicbehavior. Also in this case, deviation standard values of zeta-potential are shown.

5.5. ZETA POTENTIAL 127
Figure 5.29: ζ-potential of polished Ti-cp
Figure 5.31 shows the curve obtained for a plasma-treated Ti sample, on which a coating ofkeratin at 3% wt was deposited. In this case, the IEP value is identi�ed for a pH value of 3,5.The deviation standard values are shown. It is also represented the molecular stucture of keratin,for a better understanding of the functional groups present. It is important to underline that thepH value at room temperature for a keratin solution at 3% wt is around 5. A signi�cant plateaucan be observed in the basic region. It can be associated with the presence of homogeneousfunctional groups with acidic behavior (probably COOH groups looking at keratin structure andXPS results), while NH2 groups, present in the structure, behave as weak base and do notgenerate a plateau in acidic range.
The di�erent values of IEP for plasma-treated Ti and for keratin coating can have importantconsequences in adhesion properties: infact the �rst sample presents groups with basic behav-ior, while the latter presents group with acidic behavior, favouring the formation of acid-basereactions, resulting in good adhesion between coating and substrate. It was demonstrated byFowkes, that strenght of adhesive bonds depends on the thermodynamic work of adhesion andconsequently on acid-base interactions. (111)

128 CHAPTER 5. RESULTS AND DISCUSSIONS
Figure 5.30: ζ-potential of plasma-treated Ti-cp
Figure 5.31: ζ-potential of plasma-treated Ti-cp with keratin coating (3% wt) and molecular structureof keratin

5.6. FT-IR 129
5.6 FT-IR
The FT-IR analysis was carried out to observe the presence and the type of bonds on the samplesurface. The following samples were tested:
• Polished Ti;
• Ti + keratin 7% wt;
• Ti + plasma + keratin 7% wt;
• Ti + UV + keratin 7% wt;
• Ti + plasma + keratin 3% wt;
• Ti + keratin 1% wt;
• Ti + plasma + keratin 1% wt;
• Ti + UV + keratin 1% wt;
• Ti with grooves + keratin 7% wt;
• Ti with hesagonal pattern + keratin 7% wt.
The results are reported in di�erent graphs.Figure 5.32 shows the FT-IR spectrum obtained for a polished Ti surface. As it is possible tosee, no signi�cant peak can be identi�ed: the surface is clean.
Figure 5.32: FT-IR characterization of polished Ti sample
Figure 5.33 represents the curves obtained for samples characterized by keratin coating. Themolecular structure of keratin is also shown, in order to make simpler the identi�cation of thepeak.
It is possible to note the presence of peaks at certain value of wavenumber and each peakcorrespond to the presence of a functional group (112):

130 CHAPTER 5. RESULTS AND DISCUSSIONS
Figure 5.33: FT-IR characterization of samples with keratin coating (7% wt) and molecular structure ofkeratin (F106)
• S-O at 1000 cm−1;
• C-N at 1221 cm−1;
• C=C at 1523-1542 cm−1;
• -COOH at 1650 cm−1;
• CO2 at 2355 cm−1;
• C-H, O-H at 2921 cm−1;
• N-H, O-H at 3278 cm−1.
From literature (113) it is possible to see that keratin shows characteristics adsorbition bandsreleated to the bond present:
• the amide A band is connected with the streching vibration of N-H bonds, at a wavenumberof 3282 cm−1;
• the amide I is connected to the stretching vibration of the carbonyl group, at a wavenumberbetween 1700-1600 cm−1;
• the amide II derives mainly from in-plane NH bending with some contribution of CNstretching vibrations, at a wavenumber between 1580�1510 cm−1;
• the amide III is a very complex band dependent on the nature of side chains and hydrogenbonding, at a wavenumber of 1300�1220 cm−1.
From Figure 5.33, it is possible to see that most of the peaks present in the spectra of the samplescoated with keratin are identifying the same types of bonds, although the intensity is sometimesdi�erent. This may be due not only to a homogeneous distribution of the keratin coating but

5.6. FT-IR 131
also to its thickness, which could prevent the detection of di�erent chemical bonds despite thedi�erent treatments carried out on the surfaces of the samples. The only di�erences in the threecurves are identi�ed for wavenumber in the range between 1000 and 1500 cm−1, and between3000 and 3500 cm−1: the curve which represents the samples irradiated by UV shows a di�erenttrend, compared with the other two curves, infact presents a signi�cative peak, while in the sameregions, polished Ti and plasma-treated Ti show a plateau. It can be ascribed to an experimentalerror.
Morover, the curves show the typical peaks of keratin present in literature. In addition, thepeak at 2355 cm−1 represents CO2.
In Figure 5.34 is shown the spectrum obtained for a plasma-treated Ti with keratin coatingat 3% wt. In this case, due to the thickness of the coating, the analysis was conducted with agrazing angle, in order to detect all the informations. As it is possible to see, the typical peak forS-O, C-N, C=C, -COOH, C-O and O-H bonds are well identi�ed, added to that of CO2. In theregion characterized by a wavenumber of 3000 - 4000 cm−1, it is di�cult to distinguish di�erentpeaks.
Figure 5.34: FT-IR characterization of plasma-treated Ti with keratin coating (3% wt)
In Figure 5.35 are reported the curves of functionalized samples. All the curves present thesame trend and are characterized by the absence of peaks, except for those at 500 cm−1 and 2400cm−1 It is probably caused by the too thin keratin layer, which cannot be analyzed by FT-IRtechnique.
In Figure 5.36 is reported the FT-IR characterization of the titanium samples characterizedby the hesagonal pattern. In this case, the peaks typical of keratin are well distighuised, addedto that typical for CO2. This indicates that for this system, keratin coated wells of the structure.
In Figure 5.37 it is reported the FT-IR curve obtained fot titanium sample characterized bythe presence of grooves. In this case, it is more di�cult to see the keratin peaks: it is possibleto see a peak for a wavenumber between 1700-1500 cm−1 and one at 3200 cm−1. This can beexplained considering the fact that, after the deposition of the keratin solution on the surface,

132 CHAPTER 5. RESULTS AND DISCUSSIONS
Figure 5.35: FT-IR characterization of samples functionalized with keratin solution (1% wt)
the excess was manually removed. Because grooves are less depth than hesagonal wells, all thekeratin depositated was probably removed, for this reason there are not keratin typical peaks,di�erently from the previous case.

5.6. FT-IR 133
Figure 5.36: FT-IR characterization of Ti samples with hesagonal pattern and keratin solution (7% wt)
Figure 5.37: FT-IR characterization of Ti samples with grooves and keratin solution (7% wt)
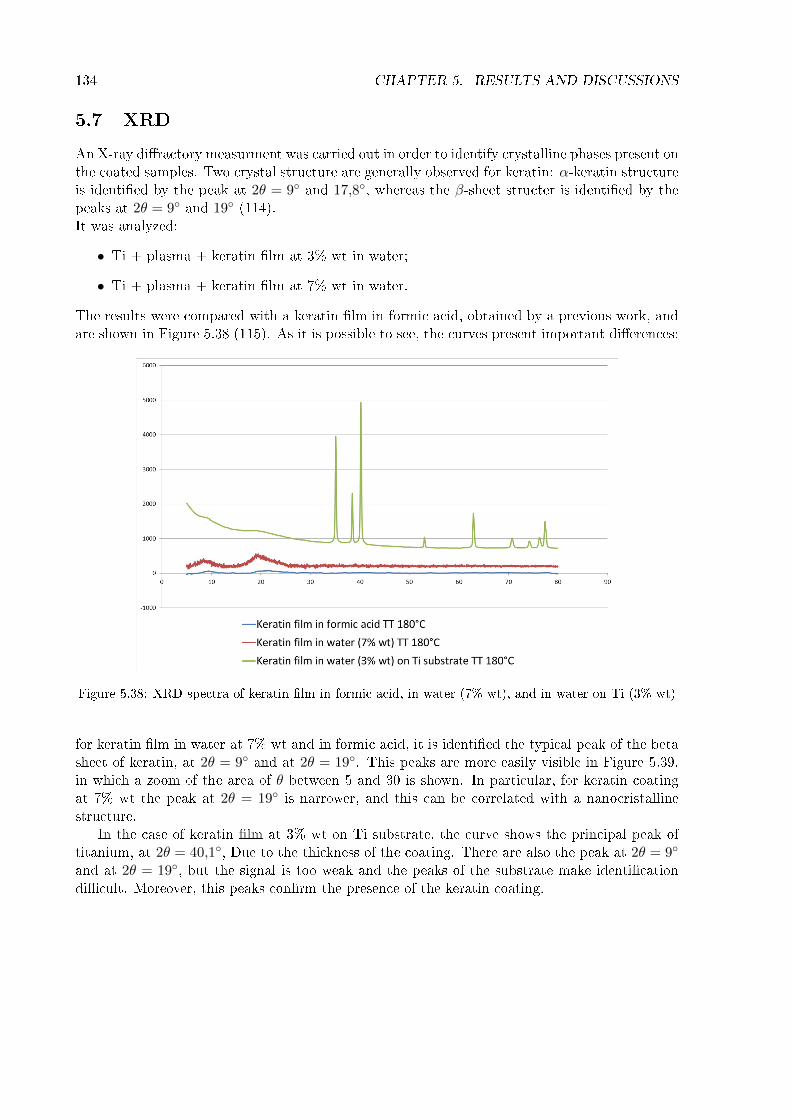
134 CHAPTER 5. RESULTS AND DISCUSSIONS
5.7 XRD
An X-ray di�ractory measurment was carried out in order to identify crystalline phases present onthe coated samples. Two crystal structure are generally observed for keratin: α-keratin structureis identi�ed by the peak at 2θ = 9◦ and 17,8◦, whereas the β-sheet structer is identi�ed by thepeaks at 2θ = 9◦ and 19◦ (114).It was analyzed:
• Ti + plasma + keratin �lm at 3% wt in water;
• Ti + plasma + keratin �lm at 7% wt in water.
The results were compared with a keratin �lm in formic acid, obtained by a previous work, andare shown in Figure 5.38 (115). As it is possible to see, the curves present important di�erences:
Figure 5.38: XRD spectra of keratin �lm in formic acid, in water (7% wt), and in water on Ti (3% wt)
for keratin �lm in water at 7% wt and in formic acid, it is identi�ed the typical peak of the betasheet of keratin, at 2θ = 9◦ and at 2θ = 19◦. This peaks are more easily visible in Figure 5.39,in which a zoom of the area of θ between 5 and 30 is shown. In particular, for keratin coatingat 7% wt the peak at 2θ = 19◦ is narrower, and this can be correlated with a nanocristallinestructure.
In the case of keratin �lm at 3% wt on Ti substrate, the curve shows the principal peak oftitanium, at 2θ = 40,1◦, Due to the thickness of the coating. There are also the peak at 2θ = 9◦
and at 2θ = 19◦, but the signal is too weak and the peaks of the substrate make identi�cationdi�cult. Moreover, this peaks con�rm the presence of the keratin coating.

5.7. XRD 135
Figure 5.39: Zoom of XRD spectra for θ between 5 and 30 for keratin �lm in water and in formic acid

136 CHAPTER 5. RESULTS AND DISCUSSIONS
5.8 XPS
In order to evaluate the di�erent chemical groups present on the surface, di�erent samples weresubjected to a XPS analysis: from this test, it is possible to know which elements are present onthe surface, their atomic percentage and their chemical surroundings.
The analysis was conducted on:
• Polished Ti;
• Ti + plasma;
• Ti + UV;
• Ti + plasma + keratin coating 3% wt;
• Polished Ti functionalized with keratin at 1% wt;
• Ti + plasma functionalized with keratin at 1% wt;
• Ti + UV functionalized with keratin at 1% wt.
In Table 5.6 are shown the atomic percentages obtained from the Survey spectra of the varioussamples.
Table 5.6: Atomic percentages from Survey spectra
It is possible to see that carbon is always present on the surfaces of the seven samples, butin di�erent percentages: on titanium samples without keratin the percentages are lower thanthose of samples with keratin coating or functionalization, infact in the �rst case, the range isbetwwen 18-33%, whereas in the second case, the atomic percentage is between 48-68%. It can beexplained considering the fact that titanium is super�cial reactive, in addition the large carboncontent in the last four samples is due to the presence of the keratin. It is also possible to notea signi�cant amount of nitrogen in the samples with keratin coating or funcionalized, while very

5.8. XPS 137
little amount is present in the samples without keratin.Comparing titanium samples activated with plasma and UV, it is possible to note how plasmatreatments have a cleaning function, infact plasma-treated Ti is the sample characterized bythe lower percentage of carbon and other contaminant elements. In the case of plasma-treatedtitanium with keratin coating at 3% wt, it is possible to see that atomic percentage of Ti is0,00: it is due to the thickenss of the coating. As already said, the coating has a thickness ofabout 11µm, while the XPS has a depth analysis of 1-10 nm: this means that, in this case,the X-ray beam does not reach the titanium surface, so the percentage of titanium detected iszero. The amount of sulfur is moderate, and it concerns samples covered or functionalized, soit is attribuible to keratin presence. Zinc, silicon, calcium, sodium, �uorine and aluminum arepresent in very little percentages as contaminations. In Figure 5.40, Figure 5.41, Figure 5.42,Figure 5.43, Figure 5.44, Figure 5.45, Figure 5.46 the Survey spectra for the seven samples areshown.
Figure 5.40: Survey spectrum for polished Ti
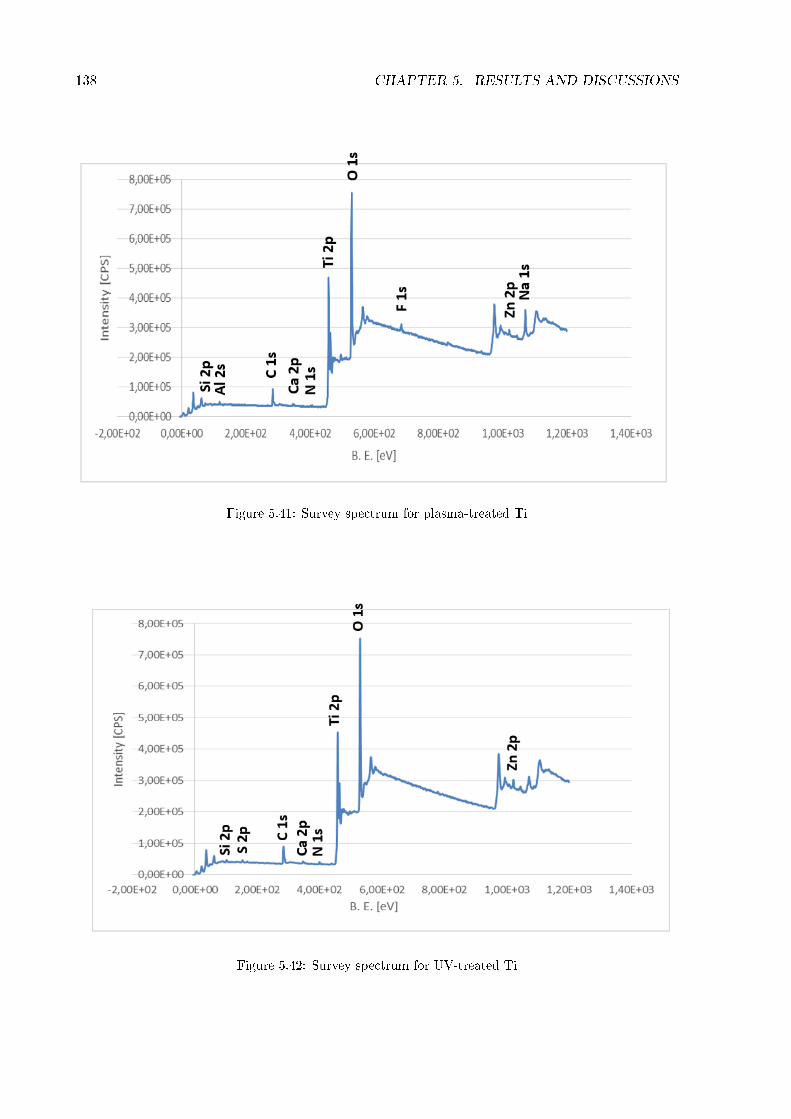
138 CHAPTER 5. RESULTS AND DISCUSSIONS
Figure 5.41: Survey spectrum for plasma-treated Ti
Figure 5.42: Survey spectrum for UV-treated Ti
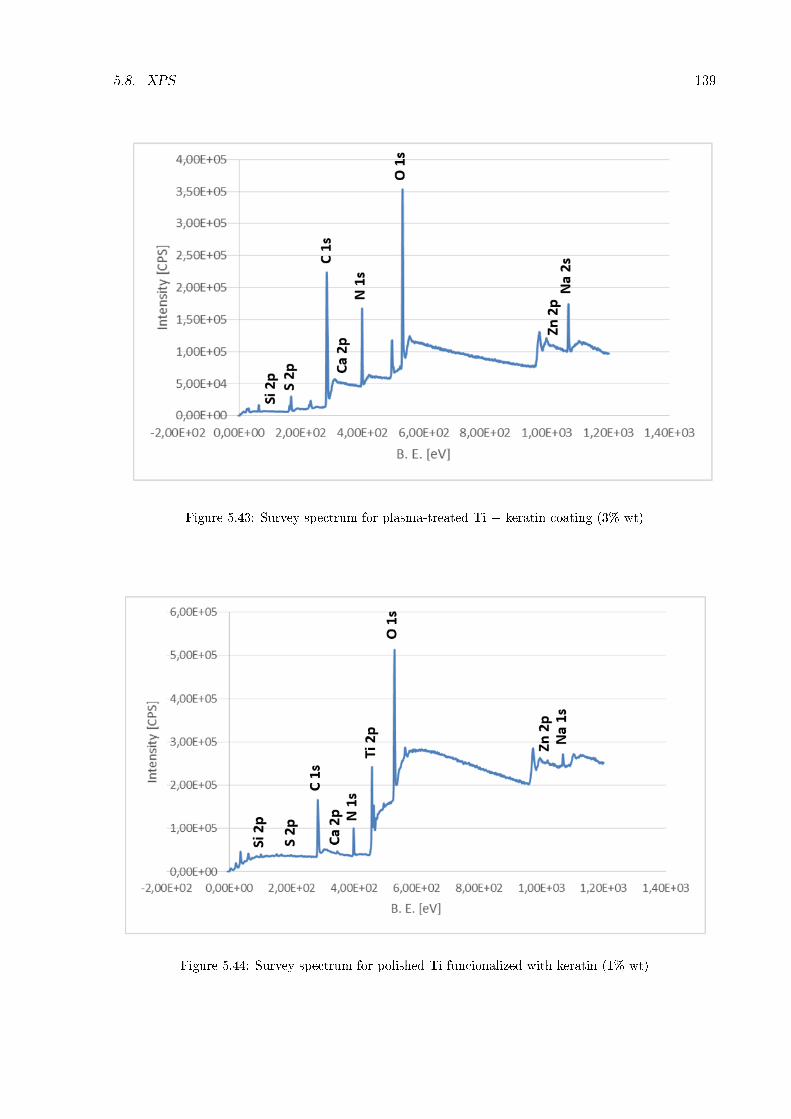
5.8. XPS 139
Figure 5.43: Survey spectrum for plasma-treated Ti + keratin coating (3% wt)
Figure 5.44: Survey spectrum for polished Ti funcionalized with keratin (1% wt)

140 CHAPTER 5. RESULTS AND DISCUSSIONS
Figure 5.45: Survey spectrum for plasma-treated Ti funcionalized with keratin (1% wt)
Figure 5.46: Survey spectrum for UV-treated Ti funcionalized with keratin (1% wt)

5.8. XPS 141
For each sample, the HR spectra of oxygen, nitrogen, carbon, titanium and sulfur were thenanalyzed. The possible attribution of each peak was made on what is reported in literature.Considering oxygen, three speci�c peaks are identi�ed, corresponding to a certain oxygen bond.Table 5.7 shows the Energy Binding values associated to di�erent types of bond (116) (117)(118).
Table 5.7: Energy Binding for di�erent chemical bonds for O
In Figure 5.47, Figure 5.48, Figure 5.49, Figure 5.50, Figure 5.51, Figure 5.52 and Figure 5.53are shown the HR oxygen spectra for the di�erent samples.
Figure 5.47: HR oxygen spectrum for polished Ti

142 CHAPTER 5. RESULTS AND DISCUSSIONS
Figure 5.48: HR oxygen spectrum for plasma-treated Ti
Figure 5.49: HR oxygen spectrum for UV-treated Ti

5.8. XPS 143
Figure 5.50: HR oxygen spectrum for plasma-treated Ti + keratin coating (3% wt)
Figure 5.51: HR oxygen spectrum for polished Ti functionalized with keratin (1% wt)

144 CHAPTER 5. RESULTS AND DISCUSSIONS
Figure 5.52: HR oxygen spectrum for plasma-treated Ti functionalized with keratin (1% wt)
Figure 5.53: HR oxygen spectrum for UV-treated Ti functionalized with keratin (1% wt)

5.8. XPS 145
In Table 5.8 are shown the percentages of area for each sample. It is possible to see that, forpolished Ti and plasma- and UV- treated Ti, the relative abundace for Ti-O, C-O, C=O, -OHis similar.Considering plasma-treated Ti with keratin coating, it is possible to note a very small peakattributed to Ti-O, due probably to the thickness of the coating, whereas the percentage of C=Odouble bond and O-H hydroxyl groups is higher, derived probably by the presence of keratincoating.Regarding functionalized samples, the presence of keratin causes peak's area for C=O, C-O and-OH higher than that of samples without keratin. This means that a small layer of keratin onTi surfaces is present, con�rming the success of functionalizing process.
Table 5.8: Percentages areas for HR oxygen spectra

146 CHAPTER 5. RESULTS AND DISCUSSIONS
Regarding nitrogen, two speci�c peaks are identi�ed, corresponding to a certain nitrogenbonds. Table 5.9 shows the Energy Binding values associated to di�erent types of bond (116)(117) (118).
Table 5.9: Energy Binding for di�erent chemical bonds for N
In Figure 5.54, Figure 5.55, Figure 5.56, Figure 5.57, Figure 5.58, Figure 5.59, Figure 5.60 areshown the HR spectra of N for the di�erent samples.
Figure 5.54: HR nitrogen spectrum for polished Ti

5.8. XPS 147
Figure 5.55: HR nitrogen spectrum for plasma-treated Ti
Figure 5.56: HR nitrogen spectrum for UV-treated Ti

148 CHAPTER 5. RESULTS AND DISCUSSIONS
Figure 5.57: HR nitrogen spectrum for plasma-treated Ti + keratin coating (3% wt)
Figure 5.58: HR nitrogen spectrum for polished Ti functionalized with keratin (1% wt)

5.8. XPS 149
Figure 5.59: HR nitrogen spectrum for plasma-treated Ti functionalized with keratin (1% wt)
Figure 5.60: HR nitrogen spectrum for UV-treated Ti functionalized with keratin (1% wt)
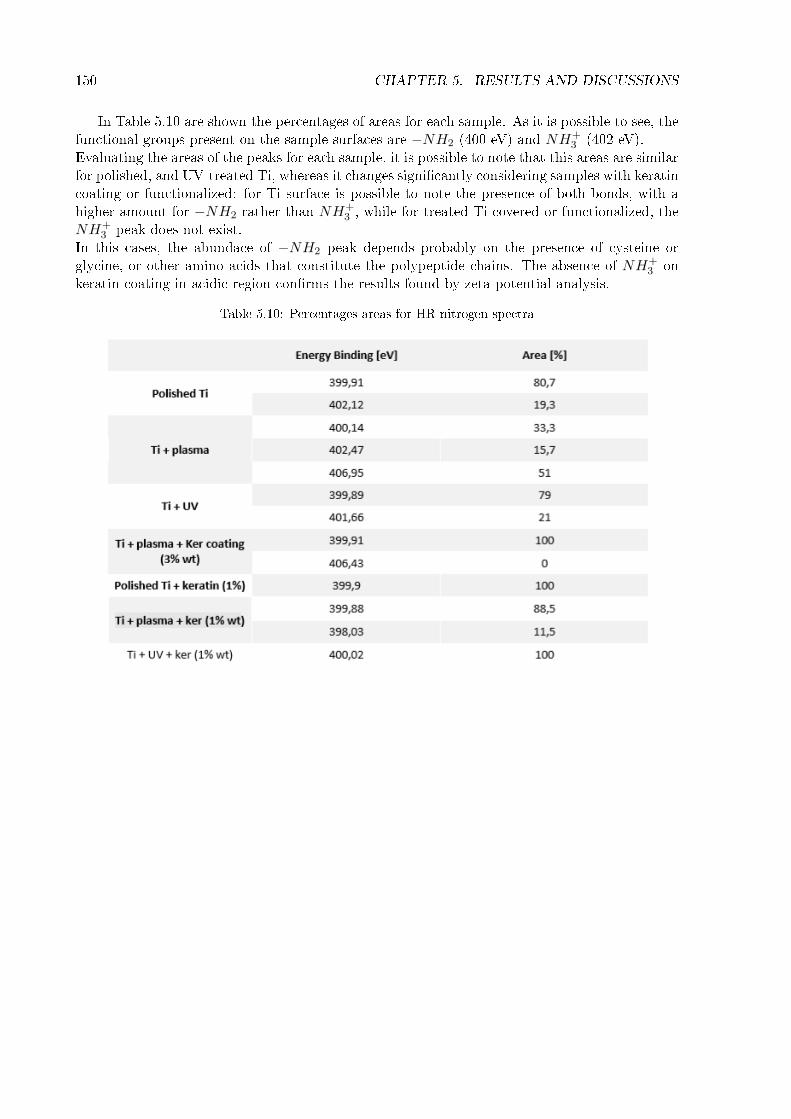
150 CHAPTER 5. RESULTS AND DISCUSSIONS
In Table 5.10 are shown the percentages of areas for each sample. As it is possible to see, thefunctional groups present on the sample surfaces are −NH2 (400 eV) and NH+
3 (402 eV).Evaluating the areas of the peaks for each sample, it is possible to note that this areas are similarfor polished, and UV-treated Ti, whereas it changes signi�cantly considering samples with keratincoating or functionalized: for Ti surface is possible to note the presence of both bonds, with ahigher amount for −NH2 rather than NH+
3 , while for treated Ti covered or functionalized, theNH+
3 peak does not exist.In this cases, the abundace of −NH2 peak depends probably on the presence of cysteine orglycine, or other amino acids that constitute the polypeptide chains. The absence of NH+
3 onkeratin coating in acidic region con�rms the results found by zeta-potential analysis.
Table 5.10: Percentages areas for HR nitrogen spectra

5.8. XPS 151
Regarding carbon, di�erent speci�c peaks are identi�ed, corresponding to a certain carbonbonds. Table 5.11 shows the Energy Binding values associated to di�erent types of bond (116)(117) (118).
Table 5.11: Energy Binding for di�erent chemical bonds for C
In Figure 5.61, Figure 5.62, Figure 5.63, Figure 5.64, Figure 5.65, Figure 5.66, Figure 5.67 areshown the HR spectra of C for the di�erent samples.
Figure 5.61: HR carbon spectrum for polished Ti

152 CHAPTER 5. RESULTS AND DISCUSSIONS
Figure 5.62: HR carbon spectrum for plasma-treated Ti
Figure 5.63: HR carbon spectrum for UV-treated Ti

5.8. XPS 153
Figure 5.64: HR carbon spectrum for plasma-treated Ti + keratin coating (3% wt)
Figure 5.65: HR carbon spectrum for polished Ti functionalized with keratin (1% wt)

154 CHAPTER 5. RESULTS AND DISCUSSIONS
Figure 5.66: HR carbon spectrum for plasma-treated Ti functionalized with keratin (1% wt)
Figure 5.67: HR carbon spectrum for UV-treated Ti functionalized with keratin (1% wt)

5.8. XPS 155
In Table 5.12 are shown the percentages of area for each sample. In this case, the C-C,C-H, C-O and C=O bonds present are attribuible to the presence of carbon as contaminant, butthey are present also in the primary structure of keratin, in addition, also C-S and C-N bondscharacterized keratin structure: the contribution to this peaks is twofold.From the �gures, it is possible to see a relative aboundance of C-C, C-H and C-S for all thesamples, wherease the peak which correspond to C-N bonds is higher in Ti covered and func-tionalized, because, in this cases, the keratin contribution have to be taken into account.Regarding C=O double bond, it is possible to see that it is present in all the samples, but indi�erent percentages: its contribution to the peak is visible in more evident way for sampleswhich are covered or functionalized with keratin, so the abundace amount of C=O is due to thepresence of keratin.
Table 5.12: Percentages areas for HR carbon spectra

156 CHAPTER 5. RESULTS AND DISCUSSIONS
Regarding titanium, di�erent speci�c peaks are identi�ed, corresponding to a certain titaniumbonds, but as it is possible to see, for all the sample two are the most important. Table 5.13shows the Energy Binding values associated to di�erent types of bond (119).
Table 5.13: Energy Binding for di�erent chemical bonds for Ti
In Figure 5.68, Figure 5.69, Figure 5.70, Figure 5.71 anf Figure 5.72 are shown the HR spectraof Ti for the di�erent samples.
Figure 5.68: HR titanium spectrum for Polished Ti

5.8. XPS 157
Figure 5.69: HR titanium spectrum for plasma-treated Ti
Figure 5.70: HR titanium spectrum for UV-treated Ti

158 CHAPTER 5. RESULTS AND DISCUSSIONS
Figure 5.71: HR titanium spectrum for polished Ti functionalized with keratin (1% wt)
Figure 5.72: HR titanium spectrum for UV-treated Ti functionalized with keratin (1% wt)

5.8. XPS 159
In Table 5.14 are shown the percentages of area for each sample. As it is possible to see, thegraph is characterized by a lot of peaks, but for each sample, two are the most important: peakat 458 eV and at 464 eV, corresponding to Ti 2p 3/2 and to Ti 2p 1/2. They are related to Ti4+
in the TiO2 bonds, it is probably correlated with the presence of oxygen on the titanium surface.The other peaks di�er from each other for very little energy values. For the plasma-treatedsample coated with keratin at 3% wt, it was impossible to obtain a HR titanium spectrum,because the signal was too weak. As already said, it can be explained considering that, in thiscase, the coating has a thickness higher than the depth of the XPS analysis, for this reason, theelectron beam did not reaches the titanium surface, so it was impossible to detect a signal.It is also possible to see that for the plasma-treated titanium functionalized with keratin at 1%,the signal of titanium was too weak to obtain a curve.

160 CHAPTER 5. RESULTS AND DISCUSSIONS
Table 5.14: Percentages areas for HR titanium spectra

5.8. XPS 161
Regarding sulfur, di�erent speci�c peaks are identi�ed, corresponding to a certain sulfurbonds. Generally, two peaks are well-identi�ed, which are the most important. Table 5.15 showsthe Energy Binding values associated to di�erent types of bond (116) (117) (118).
Table 5.15: Energy Binding for di�erent chemical bonds for S
In Figure 5.73, Figure 5.74, Figure 5.75, Figure 5.76, Figure 5.77, Figure 5.78 are shown the HRspectra of S for the di�erent samples.
Figure 5.73: HR sulfur spectrum for plasma-treated Ti

162 CHAPTER 5. RESULTS AND DISCUSSIONS
Figure 5.74: HR sulfur spectrum for UV-treated Ti
Figure 5.75: HR sulfur spectrum for plasma-treated Ti + keratin coating (3% wt)

5.8. XPS 163
Figure 5.76: HR sulfur spectrum for polished Ti functionalized with keratin (1% wt)
Figure 5.77: HR sulfur spectrum for plasma-treated Ti functionalized with keratin (1% wt)

164 CHAPTER 5. RESULTS AND DISCUSSIONS
Figure 5.78: HR sulfur spectrum for UV-treated Ti functionalized with keratin (1% wt)

5.8. XPS 165
In Table 5.16 are shown the percentages of area for each sample. Generally, two peaks arewell known: that attribiuted to S-O bond (168 eV) and that attribiuted to S-S bond (163 eV).As it is possible to see, on polished Ti there is no type of sulfur bond, the signal was to weak thatis was impossible to de�ne an HR spectrum and the di�erent peaks. In addiction, for most ofthe samples, the spectra exhibit a noisy signal, due probably to the weakness of the signal. As itis possible to note, for the samples uncovered the only bond present is that of S-O, whereas theS-S peak appears in the spectra of Ti with coating or functionalized: it can be explain considerthe fact that keratin chain is characterized by a high aboundance of disul�de bonds, so this isthe greater contribution to this peaks.
Table 5.16: Percentages areas for HR sulfur spectra

166 CHAPTER 5. RESULTS AND DISCUSSIONS
5.9 Roughness of titanium cylinder
The roughness was mearured on the titanium bars. The aim was to evaluate surface features ofthe samples, in order to understand if they can be used as dental implant structure. For thistype of application, the surface roughness should be lower than 0,2 µm, in order to limit bacteriacontamination and to give a topoghaphycal stimuli to �broblast to growth, important for ane�ective tissue healing (120).Roughness measurements were carried out on the bars before and after surface treatments. Sev-eral measurements were conducted, and the mean value and the standard deviation were calcu-lated. It was found that the samples had a mean roughness of 0,21 µm, and a deviation standardof 0,11 µm.After the polishing and the treatment to make surface rough, roughness is lower than the previ-ous case, infact the mean value was 0,16 µm and a deviation standard of 0,02 µm. A comparisonof the surfaces of the bars before and after treatments is possible to see in Figure 5.79, in whichare represented the mean values of roughness in a bar graph.
Figure 5.79: Surface roughness of titanium bars before and after surface treatments
Then a confocal laser scanning microscope was used, in order to obtain images of the surfaceafter treatments. In Figure 5.80 (a) is shown the lateral surface of the cylinder, obtained inbright �eld: it is possible to see the signs, caused by treatments made to obtain rough surface.A topographic image of the same surface is shown in Figure 5.80 (b).
Then the value of Sa and Ra were calculated: Sa indicates the roughness evaluated on asurface, while Ra represents the roughness evaluated on a line. In this case, Sa value is of 0,27µm. Regarding Ra, the value found is 0,82 µm: Ra value is higher if the line on which the measureis conducted go through topographic inhomogenities. In Figure 5.81 is shown the measure of theroughness on a line.

5.9. ROUGHNESS OF TITANIUM CYLINDER 167
Figure 5.80: (a) Image of the lateral surface of the cylinder in bright �eld, (b) Topographic image of theroughness of cylinder
Figure 5.81: Measure of the roughness on a line
After being cut and plasma-treated, a deposition of keratin nano�bers around the surface ofthe cylinder was performed at CNR-IPCB Institute of Polymers Composites and Biomaterials,Napoli.The result is shown in Figure 5.82, at two di�erent magni�cation: 1600 x and 600 x. Thedeposition was conducted in low vacuum, in order to avoid sputtering phenomena on the sample.The nano�bers deposited are well distinguishable with respect to the substrate. They presentan heterogenity in the deposition on the surface of the cylinder, due probably to the methodof deposition used: the sample does not rotate around its own axis, but around the axis of thecollector.On this system biological tests will be carried out, in order to evaluate how plasma in�uencesthe nano�bers behaviour and how cells adhesion is a�ected by the presence of keratin nano�bersarranged around a cylindrical samples.

168 CHAPTER 5. RESULTS AND DISCUSSIONS
Figure 5.82: SEM image of nano�bers deposited on lateral surface of Ti cylinder at (a) 1600x and (b)600x

Conclusions
The aim of this work is to �nd the better surface treatment, which improve keratin adhesion.Di�erent keratin solutions are prepared:
• keratin solution at 7% wt;
• keratin solution at 3% wt;
• keratin solution at 1% wt;
• Electrospun keratin nano�bers.
Surface treatments carried out on samples were:
• Polishing;
• Plasma treatment;
• UV treatment.
It was evident that keratin solution at 7% wt produced a non homogeneous coating, while thatobtained with keratin solution at 3% wt was homogenous and thin, with a thickness of about 6-10µm. Tape test reveals that plasma treatment and UV irradiation improve adhesion of keratin totitanium substrate. Despite optimal results of UV treatments, it was decided to conducted othersanalysis on plasma-treated surface for its role in decontamination and activation on surface.Scratch test was performed on polished Ti and on plasma-treated Ti with keratin coating, show-ing a particular behavior of keratin coating. Frictional Coe�cient was measured, and it wasshown that for keratin coating it was lower than that of titanium.To test hydrophilic/hydrophobic properties wettability tests were conducted: they show thatkeratin coating make titanium surface more hydro�lic. It was also evaluated di�erences in wet-tability properties between untreated and plasma-treated titanium sample in contact with keratinsolution at 3% wt: on plasma-treated sample, the contact angle decreases, in this way coatingcreates stronger bonds with substrate, and this in�uences adhesion properties.Then stability in water was analyzed: samples with keratin coating were imersed in water andafter 1, 7, 14, 21, 28 days, their appearance was analyzed. It was possible to see how keratincoating changes appearance after one day, infact it seemed to have swallen, but in the follow-ing days it has not undergone signi�cant transformation. After drying at room temperature itsappearance changes: keratin became a very little �lm and lost adhesion in some regions.
From a zeta-potential test, conducted on polished Ti, plasma-treated Ti and plasma-treatedTi with keratin coating, it was found that the surface has negative charge and a IEP in the rangeof pH between 3,5 and 5,5.
From an XRD analysis conducted on keratin at 3% and 7% wt in water, was found the typicalpeak of the beta sheet of keratin. An FT-IR analysis was conducted: graphs obtained show thetypical peak of keratin for coated samples, while no signals were deteched in functionalized Ti,
169

170 Conclusions
but XPS analysis gives important information about this sample. It shows that plasma- andUV- treated Ti surfaces were well functionalized by keratin solution at 1% wt. Thanks to thisanalysis, it was also possible to con�rm the role of plasma treatments in decontamination process.
Adhesive properties were studied also for keratin nano�bers deposited by electrospinningprocess at Centro Nazionale Ricerche CNR-ISMAC, Biella. Tape test gives bad results: all thecoating was removed during the test. A FESEM analysis show the reason: no �bers were de-posited on titanium surface, but the presence of numerous beads causes very weak bond at theinterface between keratin and titanium.The cylinder sample was used: after evaluating the roughness of titanium bars before and aftersurface treatments, in order to obtain a determined value of roughness (< 2 µm), electrospunnano�bers were deposited on the lateral surface of the sample, and a SEM analysis show howthey are arranged on the surface.In conclusion, it is possible to see that treating titanium surface with plasma can improve ad-hesion of keratin coating on dental implant: in this way, it is possible to exploit its stimuli to�broblast pro�lation.
Future works could be focused on adhesion properties of keratin nano�bers arranged on lateralsurface of dental implant, and its in�uence on bacterial proliferation.

Bibliography
[1] Wang B, Yang W, McKittrick J, Meyers MA. Keratin: Structure, mechanical properties, oc-currence in biological organisms, and e�orts at bioinspiration, 2015, University of California,San Diego, La Jolla, United States;
[2] Staron P, Banach M, Kowalski Z. Keratin � origins, properties, application, Institute ofInorganic Chemistry and Technology, Cracow University of Technology, Cracow. CHEMIK2011, 65, 10, 1019-1026;
[3] Bragulla H, Homberger D.G. Structure and functions of keratin proteins in simple, strati�ed,keratinized and corni�ed epithelia. 2015, University of California, San Diego, La Jolla, UnitedStates;
[4] Khosa M, Ullah A. A Sustainable Role of Keratin Biopolymer in Green Chemistry: A Review.Journal of Food Processing & Beverages, September 2013 Vol.:1, Issue:1;
[5] https://www.newworldencyclopedia.org/entry/Keratin;
[6] Atri H, Bidram E, Dunstan DE. Reconstituted Keratin Biomaterial with Enhanced Ductility.Materials 2015, 8(11), 7472-7485;
[7] https://en.wikipedia.org/wiki/Keratin;
[8] Jacob J T, Coulombe P A,Kwan R,Omary M B. Types I and II Keratin Intermediate Fila-ments. Cold Spring Harb Perspect Biol. 2018 Apr 2;
[9] Szewciw L, de Kerckhove D G, Grime G W, Fudge D. Calci�cation provides mechanicalreinforcement to whale baleen keratin. Proceeding of the Royal Society B: Biological Sciences277(1694): 2597-605, April 2010;
[10] Bhavsar P, Zoccola M, Patrucco A, Montarsolo A, Mossotti R, Rovero G, Giansetti M, ToninC. Superheated Water Hydrolysis of Waste Wool in a Semi-Industrial Reactor to ObtainNitrogen Fertilizers. ACS Sustainable Chemistry & Enineering, September 2016, 4 (12), pp6722�6731;
[11] Savige W E, Eager J, Maclaren J A, Roxburgh C and M The S-monoxides of cystine,cystamine and homocystine. Tetrahedron Lett., vol. 5, no. 44, pp. 3289�3293, 1964;
[12] Yamada M, Narita S,Kondo T, Nojima M ì Yamamoto R, Nishino T, Sakai C. Process forsolubilizing animal hair. Google patent, US5276138A United States; 1964;
[13] Eslahi N, Dadashian F, Hemmati Nejad N. An investigation of keratin extraction fromwool and feather waste by enzymatic hydrolysis. Volume 43, 2013, issue 7, PreparativeBiochemistry and Biotechnology, pp 624-648;
171

172 BIBLIOGRAPHY
[14] Wang Q Q, Zhang L, Wang Q Q, Liu J, Zhu P, Jiang Z. Sodium sulphide extraction ofhuman keratin. Ferroelectrics, June 2018, 529:1, 105-112;
[15] Shui-qing J, Lin Z, Haixia W, Gang C. Study on e�ective extraction of keratin from humanhair wastes. Integrated Ferroelectrics 180(1):102-107, May 2017;
[16] Varesano A, Vineis C, Tonetti C, Sanchez Ramirez D O, Mazzuchetti G. Chemical andPhysical Modi�cations of Electrospun Keratin Nano�bers Induced by Heating Treatments.Journal of Applied Polymer Science, October 2013;
[17] Yimei J, Chen J, Jingxiao L, Zhilian L, Luyao X, Siyuan D. Extraction of keratin with ionicliquids from poultry feather. Separation and Puri�cation Technology Volume 132, 20 August2014, Pages 577-583;
[18] Tonin C, Zoccola M, Aluigi A, Varesano A, Montarsolo A, Vineis C, Zimbardi F. Study onthe conversion of wool keratin by steam explosion. Biomacromolecules 2006, 7, 12, 3499-3504;
[19] Yin J, Rastogi S, Terry A E, Popescu C. Self-organization of oligopeptides obtained ondissolution of feather keratins in superheated water. Biomacromolecules, vol. 8, no. 3, pp.800�806, 2007;
[20] Aas J A, Paster B J, Stokes L N, Olsen I, Dewhirst F E. De�ning the Normal BacterialFlora of the Oral Cavity. Journal of clinical microbiology, November 2005, Vol. 43, No. 11,p.5721-5732;
[21] https://en.wikipedia.org/wiki/Oral microbiology;
[22] Trindade Gregio A M, Naval Machado M A, Lima A, Reis Azevedo L. Saliva composition andfunctions: A comprehensive review. The Journal of contemporary dental practice, February208;
[23] https://en.wikipedia.org/wiki/Gram-positive bacteria;
[24] https://www.google.com/patents/US6214576;
[25] Mikx F H M, De Jong M H. Keratinolytic activity of cutaneous and oral bacteria. Infectionand Immunity 55 (1987), pp 621-625;
[26] Ri�el A, Brandelli A. Keratinolityc bacteria isolated from feather waste. Brazilian Journalof Microbioly, Vol. 37, No. 3, July/Sept. 2006;
[27] Matikeviciene V, Masiliuniene D, Dtigiskis S. Degradation of keratin containing wastes withkeratinolytic activity. Environment, Technology, Resourcesv Vol. 1;
[28] Cochis A, Ferraris S, Sorrentino R, Azzimonti B, Novara C, Geobaldo F, Tru�a GiachetF, Vineis C, Varesano A, Abdelgeliel A S, Spriano S, Rimondin L. Silver-doped keratinnano�bers preserve a titanium surface from bio�lm contamination and favor soft-tissue heal-ing. Journal of Material Chemistry B, 2017, 5, 8366;
[29] Nilforoushzadeh M A, Ashtiani H R A, Ja�ary F, Jahangiri F, Nikkhah N, MahmoudbeykM, Ansari Z, Zare S. Dermal Fibroblast Cells: Biology and Function in Skin Regeneration.Journal of Skin and Stem Cell, June;
[30] Fernandes I R, Russo F B, Pignatari G C, Evangelinellis M M, Tavolari S, Muotri A R,Beltrão-Braga P C B. Fibroblast sources: Where can we get them? Journal List, Cytotech-nology, 2016 Mar; 68(2): 223�228;

BIBLIOGRAPHY 173
[31] https://en.wikipedia.org/wiki/Wound_healing;
[32] Wang S, Taraballi F, L. Poh, Woei TK. Human keratin hydrogels support �broblast attach-ment and proliferation in vitro. Cell and Tissue Research, 347(3):795-802, January 2012;
[33] Ferraris S, Guarino V, Cochis A, Varesano A,Cruz Maya I, Vineis C, Rimondini L, SprianoS. Aligned Keratin submicrometric-�bers for �broblasts guidance onto nanogrooved titaniumsurfaces for transmucosal implants. Materials Letters 229 (2018) 1�4;
[34] Esparza Y, Ullah A, Boluk Y, Wu J. Preparation and characerization of thermally crosslinkedpoly(vinyl alcohol)/featherkeratin nano�ber sca�olds. Materials and Designs 133(2017) 1-9;
[35] Zhao X, Lui Y S, Chuen Choo C K, Sow W T, Huang C L, Woei Ng K, Poh Tan L, ChyeLoo J S. Calcium phosphate coatedkeratin-PCL sca�oldsfor potential bonetissue regeneration.MaterialsSciences and Engeneering: C, April 2015, Vol 24, pp 746-753;
[36] Hamouche H, Mahklouf S, Chaouchi A, Laghrouche M. Humidity Sensor Based on Keartinbio Polymer Film. Sensor and Actuators A, 282 (2018), pp 132-141;
[37] Sanchez Ramirez D O, Carletto R A, Tonetti C, Tru�a Giachet F, Varesano A, Vineis C.Wool keratin �lm plasticized by citric acid for food packaging. Food Packaging and ShelfLife Volume 12, June 2017, pp 100-106;
[38] Fadillah G, Putri E N K, Febrianastuti S, Maylinda E V, Purnawan C. Adsorption of Fe Ionsfrom Aqueous Solution Using α-Keratin-Coated Alginate Biosorbent. International Journalof Environmental Science and Development, Vol. 9, No. 3, March 2018;
[39] https://en.wikipedia.org/wiki/Coating;
[40] Mattox D M. Handbook of Physical Vapor Deposition (PVD) Processing. Oxford UK Else-vier, 2010;
[41] https://en.wikipedia.org/wiki/Chemical_vapor_deposition;
[42] http://www.wikiwand.com/en/Chemical_vapor_deposition;
[43] Amin S, Panchal H. A Review on Thermal Spray Coating Processes. International Journalof Current Trends in Engineering & Research (IJCTER) e-ISSN 2455�1392 Volume 2 Issue4, April 2016 pp. 556 � 563;
[44] Won-Seock K, Il-Han J, Jung-Ju L, Hee-Tae J. Evaluation of mechanical interlock e�ecton adhesion strength of polymer�metal interfaces using micro-patterned surface topography.International Journal of Adhesion and Adhesives 30(6):408-417, September 2010;
[45] https://www.materialstoday.com/metal-�nishing/features/ fundamentals-of-paint-adhesion;
[46] Baldan A Adhesion phenomena in bonded joints International. Journal of Adhesion & Ad-hesives 38 (2012) 95�116;
[47] Neubauer R, Moritz Husmann S, Weinländer C, Kienzl N, Leitner E, Hochenauer C. Acidbase interaction and its in�uence on the adsorption kinetics and selectivity order of aromaticsulfur heterocycles adsorbing on Ag-Al2O3. Institute of Thermal Engineering (3070);
[48] Simpson V. Foundamental studies of adhesion. Master Thesis, University of Wollongong,1997;

174 BIBLIOGRAPHY
[49] Ebnesajjad C F. Surface Treatment of Materials for Adhesion Bonding. Elvisier, Secondedition, 2014;
[50] Tracton A. Coating technology handbook. Taylor & Francis Group, LLC 2006;
[51] https://www.astm.org/Standards/D4541.htm;
[52] Chalker P R, Bull S J, Rickerby D S. A review of the methods for the evaluation of coating-substrate adhesion. Materials Science and Engineering, A 140 ( 1991 ) 583-592;
[53] Cai Y, Zhang S, Zeng X, Qian M, Sun D,WengW. Interfacial study of magnesium-containing�uoridated hydroxyapatite coatings. Thin Solid Films, 519 (2011) 4629�4633;
[54] Fletcher J F, Barnes D J. Pull-o� adhesion testing of coating- improve your technique.Elcometer Limited;
[55] Choudhary R K, Mishra P. Use of Acoustic Emission During Scratch Testing for Under-standing Adhesion Behavior of Aluminum Nitride Coatings. Journal of Materials Engineeringand Performance, June 2016, Volume 25, Issue 6, pp 2454�2461;
[56] Campos-Silva I, Martínez-Trinidad J, Doñu-Ruíz M A, Rodríguez-Castro G. Hernández-Sánchez E, Bravo-Bárcenas O. Interfacial indentation test of FeB/Fe2B coatings.Surfaceand Coatings Technology, Vol. 206, Issue 7, 25 December 2011, pp 1809-1815;
[57] Bouzakis K D, Gerardis S Skordaris G, Bouzakis E. Nano-impact test on a TiAlN PVDcoating and correlation between experimental and FEM results. Surface and Coatings Tech-nology, Vol. 206, Issue 7, 25 December 2011, pp 1936-1940;
[58] Mittal K L. Adhesion Measurement of thin �lms. Electrocomponent Science and Technology1976, Vol. 3, pp. 21-42;
[59] Martin P M. Handbook of Deposition Technologies for Films and Coatings Science. Appli-cations and Technology Book, 3rd Edition, 2010;
[60] Moira e Silva CW, Alves E, Ramos AR, Sandu CS, Cavaleiro A. Adhesion failures on hardcoatings induced by interface anomalies. Vacuum 83 (2009) 1213-1217;
[61] Poorna Chander K, Vashista M, Sabiruddin K, Paul S, Bandyopadhyay P P. E�ects of gritblasting on surface properties of steel substrates. Materials and design 30 (2009) 2895-2902;
[62] Varacalle D J, Guillen D, Deason D M, Rhodaberg W. E�ect of Grit-Blasting on SubstrateRoughness and Coating Adhesion. Journal of Thermal Spray Technology, 15(3):348-355,September 2006;
[63] Danlos Y, Costil S, Liao H, Coddet C. In�uence of Ti-6Al-4Vand Al 2107substrate morphol-ogy on Ni-Al coating adhesion-impacts of laser treatment. Surface and coating technology,205(2011) 2702-2708;
[64] Kromer R, Costil S, Cormier J, Courapied D, Berthe L, Peyre P, Boustie M. Laser surfacepatterning to enhance adhesion of plasma sprayed coatings. Surface and coatings technology,278 (2015) 171-182;
[65] Rahamati B, Zalnezhad E, Sarhan A A D, Kamiab Z, Nasiri Tabrizi B, Abas W A B W.Enhancing the adhesion strength of tantalum oxide ceramic thin �lm coating on biomedicalTi-6Al-4V alloy by thermal surface treatment. Ceramics international, 41 (2015) 13055-13063;

BIBLIOGRAPHY 175
[66] https://www.medeco.de/it/odontostomatologia/anatomia/cavita-orale/struttura-della-cavita-orale/;
[67] https://freesmile.com/anatomia-della-bocca/anatomia-dei-denti/;
[68] https://it.wikipedia.org/wiki/Gingiva;
[69] Mortazavi H, Baharvand M. Review of common conditions associated with periodontal liga-ment widening. Imaging Science in Dentistry, 2016 Dec; 46(4): 229-237;
[70] Yamamoto T, Hasegawa T, Yamamoto T, Hongo H, Amizuka N. Histology of human ce-mentum: Its structure, function, and development. Journal List, Jpn Dent Sci Rev. 2016Aug; 52 (3): 63-74;
[71] https://www.dental.pitt.edu/bone-structural-characteristics;
[72] https://www.webmd.com/oral-health/guide/gingivitis-periodontal-disease;
[73] Jayesh R S, Dhinakarsamy V. Osseointegration. Dental science- Research article, 2015, Vol.7; Issue 5; p. 226-229;
[74] https://en.wikipedia.org/wiki/Osseointegration;
[75] Branemark P I. The Osseointegration Book - From Calvarium to Calcaneus. USA:Quintessence Books; 2005. p. 24;
[76] Branemark P I. Tissue-Integrated Prostheses. Chicago: Quintessence Publishing Co.; 1985.p. 11-76;
[77] Signoriello F, Fallschussel G K H. Implantologia odontoiatrica: teoria e pratica. Edinava,198;
[78] http://www.ing.unitn.it/ colombo/Materiali%20per% 20l'implantologia%20dentale/9.%20L'implantologia%20dentale.htm;
[79] https://www.smilesolutionsbyemmidental.com/blog/the-anatomy-of-a-dental-implant;
[80] Oshida Y, Tuna E B, Aktoren O, Gençay K. Dental Implant Systems. International Journalof Molecular Sciences, 2010, 11, 1580-1678;
[81] Fatma B, Cengiz Y. The Mechanical Behaviors of Various Dental Implant Materials underFatigue. Hindawi Advances in Materials Science and Engineering Volume 2018, Article ID5047319, 10 pages;
[82] Violan D,Galofre M, Nart J, Teles R P. In vitro evaluation of a multispecies oral bio�lm ondi�erent implant surfaces. Biomed Mater 2014;9:035007;
[83] Han A, Tsoi J K H, Pires Rodrigues F, Leprince J G, Palin W M. Bacterial adhesionmechanisms on dental implant surfaces and the in�uencing factor. International Journal ofAdhesion and Adhesive 69 (2016) 58-71;
[84] Teughels W, Van Assche N, Sliepen I, Quirynen M. E�ect of material characteristics and/orsurface topography on bio�lm development. Clinical Oral Implants Research, 2016, 17, 68-81;
[85] Cerone G. TESI:Trattamenti super�ciali alla nanoscala (topogra�a e nano�bre di cheratina)su titanio per incrementare l'adesione di �broblasti gengivali e ridurre l'adesione batterica.Master degree thesis, Politecnico di Torino, Ottobre 2016;

176 BIBLIOGRAPHY
[86] https://en.wikipedia.org/wiki/Plasma_activation;
[87] https://www.gambetti.it/portfolio-articoli/tucano-plasma-a-bassa-pressione/;
[88] https://it.scribd.com/doc/312685009/titanio-ti-6al-4v;
[89] http://www.tecnotex.it/documenti/Pure-Health_brochure.pdf;
[90] Iwasa F, Hori N, Ueno T, Minamikawa H, Yamada M, Ogawa T. Enhancement of osteoblastadhesion to UV-photofunctionalized titanium via an electrostatic mechanism. Biomaterials31 (2010) 2717�2727;
[91] Beachley V, Wenab X. E�ect of electrospinning parameters on the nano�ber diameter andlength. Materials Science and Engineering: C, Vol. 29, Issue 3, 30 April 2009, pp 663-668;
[92] Kurecic M. Electrospinning:Nano�bre Production Method. Tekstilec, 56(1):4-12, March 2013;
[93] Haider A, Haider S, Kanga I.A comprehensive review summarizing the e�ect of electrospin-ning parameters and potential applications of nano�bers in biomedical and biotechnology.Arabian Journal of Chemistry, Vol. 11, Issue 8, December 2018, pp 1165-1188;
[94] Kalidindi R S R, Subasri R.Sol-gel nanocomposite hard coatings. Anti-Abrasive Nanocoat-ings, Current and Future Applications, 2015, pp 105-136;
[95] https://www.nanoscience.com/techniques/scanning-electron-microscopy/;
[96] https://en.wikipedia.org/wiki/Scanning_electron_microscope;
[97] http://www.vcbio.science.ru.nl/public/pdf/fesem_info_eng.pdf;
[98] http://www.chimica.uni�.it/upload/sub/LAUREA/PUB/20122013/ELABORATI/anichini_cosimo-e.pdf;
[99] Mitutoyo.Quick guide to surface roughness measurement. Reference guide for laboratory andworkshop. Bulletin No. 2229;
[100] https://en.wikipedia.org/wiki/Confocal_microscopy;
[101] ZEISS LSM800 for Materials brochure;
[102] Toshihiro T, Joonho L, Piotr R S. Interfacial Free Energy and Wettability. Treatise onProcess Metallurgy Volume 2: Process Phenomena 2014, pp 61-77;
[103] Luxbacher T. The Zeta Potential for Solid Surface Analysis. 1st edition, Austriam March2014;
[104] http://rtilab.com/techniques/ftir-analysis/
[105] Introductionto FourierTransform InfraredSpectrometry, Thermo Nicolet Corporation, 2001;
[106] https://it.wikipedia.org/wiki/Legge_di_Bragg;
[107] https://xpssimpli�ed.com/whatisxps.php;
[108] http://www.casaxps.com/help_manual/manual_updates/xps_spectra.pdf;
[109] Sartori A. Surface modi�cation of titanium for improvement of soft tissue adhesion andreduction of bacterial contamination. Master thesis, Politecnico di Torino, April 2018;

BIBLIOGRAPHY 177
[110] Mekayarajjananonth T, Winkler S. Contact angle measurement on dental implant bioma-terials. Journal of Oral Implantology, 25 (1999), pp. 230-236;
[111] Fowkes F M. Acid-base interaction in polymer adhesion. Surface and Coatings Research,Lehigh University, Bethlehem, Pa 18015;
[112] https://webspectra.chem.ucla.edu/irtable.html;
[113] Aluigi A, Corbellini A, Rombaldoni F, Zoccola M, Canetti M. Morphological and structuralinvestigation of wool derived keratin nano�bres crosslinked by thermal treatment. Interna-tional Journal of Biological Macromolecules 57 (2013) 30-37;
[114] Wang K, Li R, Ma J, Jian Y. Extracting keratin from wool by using L-cysteine.GreenChemistry 18(2), July 2015;
[115] Tesi
[116] Molina R, Espinos J P, Yubero F, Erra P, Gonzalez-Elipe A R. XPS analysis of down-stream plasma treated wool: In�uence of the nature of the gas on the surface modi�cation ofwool. Applied Surface Science, 252, (2005) 1417�1429;
[117] Michael J R, Johnston H. Sorption and binding of nanocrystalline gold by Merino wool�bres�An XPS study. Journal of Colloid and Interface Science 310 (2007) 425�430;
[118] http://www.xps�tting.com;
[119] Trino L D, Bronze-Uhle E S George A,Mathewc M T, Lisboa-Filho P N.Surface Physic-ochemical and Structural Analysis of Functionalized Titanium Dioxide Films.Colloids andSurfaces A: Physicochemical and Engineering Aspects Volume 546, 5 June 2018, Pages168-178;
[120] Ferraris S, Tru�a Giachet F, Miola M, Bertone E, Varesano A, Vineis C, Cochis A, Sor-rentino R, Rimondini L, Spriano S.Nanogrooves and keratin nano�bers on titanium surfacesaimed at driving gingival �broblasts alignment and proliferation without increasing bacterialadhesion.Materials Science and Engineering C, 76 (2017) 1-12;

178 BIBLIOGRAPHY
Images
F1 Khosa M, Ullah A. A Sustainable Role of Keratin Biopolymer in Green Chemistry: AReview. Journal of Food Processing & Beverages, September 2013 Vol.:1, Issue:1;
F2 https://www.newworldencyclopedia.org/entry/Keratin;
F3 Alberts B, Bray D, Lewis J, Ra� M, Roberts K, Watson J D. Molecular Biology of theCell, 1994, 3rd edition, Garland Press, New York;
F4 https://www.newworldencyclopedia.org/entry/Keratin;
F5 Wang B, Yang W, McKittrick J, Meyers MA. Keratin: Structure, mechanical properties,occurrence in biological organisms, and e�orts at bioinspiration, 2015, University ofCalifornia, San Diego, La Jolla, United States;
F6 Wang B, Yang W, McKittrick J, Meyers MA. Keratin: Structure, mechanical properties,occurrence in biological organisms, and e�orts at bioinspiration, 2015, University ofCalifornia, San Diego, La Jolla, United States;
F7 Wang B, Yang W, McKittrick J, Meyers MA. Keratin: Structure, mechanical properties,occurrence in biological organisms, and e�orts at bioinspiration, 2015, University ofCalifornia, San Diego, La Jolla, United States;
F8 Wang B, Yang W, McKittrick J, Meyers MA. Keratin: Structure, mechanical properties,occurrence in biological organisms, and e�orts at bioinspiration, 2015, University ofCalifornia, San Diego, La Jolla, United States;
F9 Wang B, Yang W, McKittrick J, Meyers MA. Keratin: Structure, mechanical properties,occurrence in biological organisms, and e�orts at bioinspiration, 2015, University ofCalifornia, San Diego, La Jolla, United States;
F10 Wang B, Yang W, McKittrick J, Meyers MA. Keratin: Structure, mechanical proper-ties, occurrence in biological organisms, and e�orts at bioinspiration, 2015, Universityof California, San Diego, La Jolla, United States;
F11 Szewciw L, de Kerckhove D G, Grime G W, Fudge D. Calci�cation provides mechanicalreinforcement to whale baleen keratin. Proceeding of the Royal Society B: BiologicalSciences 277(1694): 2597-605, April 2010;
F12 Wang B, Yang W, McKittrick J, Meyers MA. Keratin: Structure, mechanical proper-ties, occurrence in biological organisms, and e�orts at bioinspiration, 2015, Universityof California, San Diego, La Jolla, United States;
F13 Shui-qing J, Lin Z, Haixia W, Gang C. Study on e�ective extraction of keratin fromhuman hair wastes. Integrated Ferroelectrics 180(1):102-107, May 2017;
F14 https://www.inovanewsroom.org/ilh/2017/05/wound-healing-center-at-inova-loudoun-treats-complex-wound-and-ostomy-cases/;
F15 Wang S, Taraballi F, L. Poh, Woei TK, Human keratin hydrogels support �broblastattachment and proliferation in vitro, Cell Tissue Res (2012) 347, pp 795�802;
F16 Wang S, Taraballi F, L. Poh, Woei TK, Human keratin hydrogels support �broblastattachment and proliferation in vitro, Cell Tissue Res (2012) 347, pp 795�802;
F17 Esparza Y, Ullah A, Boluk Y, Wu J. Preparation and characerization of thermallycrosslinked poly(vinyl alcohol)/featherkeratin nano�ber sca�olds. Materials and De-signs 133(2017) 1-9;
F18 Esparza Y, Ullah A, Boluk Y, Wu J. Preparation and characerization of thermallycrosslinked poly(vinyl alcohol)/featherkeratin nano�ber sca�olds. Materials and De-signs 133(2017) 1-9;

BIBLIOGRAPHY 179
F19 Zhao X, Lui Y S, Chuen Choo C K, Sow W T, Huang C L, Woei Ng K, Poh Tan L,Chye Loo J S. Calcium phosphate coatedkeratin-PCL sca�oldsfor potential bonetissueregeneration. MaterialsSciences and Engeneering: C, April 2015, Vol 24, pp 746-753;
F20 Fadillah G, Putri E N K, Febrianastuti S, Maylinda E V, Purnawan C. Adsorption of FeIons from Aqueous Solution Using α-Keratin-Coated Alginate Biosorbent. InternationalJournal of Environmental Science and Development, Vol. 9, No. 3, March 2018;
F21 https://www.sigmaaldrich.com/materials-science/material-science products. html?TablePage;
F22 Pajkic Z, Wolf H, Gerdes T, Willert-Porada M. Microwave plasma �uidized bed arc-PVD coating of particulate materials, Surface and Coatings Technology, May 2008,202(16):3927-3932;
F23 Mattox D.M. Handbook of Physical Vapor Deposition (PVD) Processing, Oxford UKElsevier, 2010;
F24 Mathur S, Shen H, Altmayer J. Nanostructured funcional ceramic coatings by molecule-based chemical vapor deposition., Reviews on Advanced Materials Science, 15(2007)16-23;
F25 https://www.slideshare.net/anshukg/chemical-vapor-deposition-cvd;
F26 https://www.researchgate.net/�gure/Thermal-spray-process-principle-Source-An-Introduction-to-Thermal-Spray-Issue-4-C_�g1_307944165;
F27 Amin S, Panchal H. A Review on Thermal Spray Coating Processes. InternationalJournal of Current Trends in Engineering & Research (IJCTER) e-ISSN 2455�1392Volume 2 Issue 4, April 2016 pp. 556 � 563;
F28 http://www.advanced-coating.com/english/spraying-hvof.htm;
F29 Li J,Li C, Yang G, Li C. E�ect of vapor deposition in shrouded plasma spraying onmorphology and wettability of the metallic Ni20Cr coating surface.Elsevier Journal ofAlloys and Compounds, Vol. 735, 25 February 2018, pp 430-440;
F30 https://www.indiamart.com/proddetail/phosphate-coating-16503155030.html;
F31 Aluminum Electroplating Using Bromide Salts, FEBRUARY 1, 2018, MANUFACTUR-ING & PROTOTYPING, MATERIALS;
F32 http://jfjonesjewelers.com/rhodium-plating/;
F33 . Amin S, Panchal H. A Review on Thermal Spray Coating Processes. InternationalJournal of Current Trends in Engineering & Research (IJCTER) e-ISSN 2455�1392Volume 2 Issue 4, April 2016 pp. 556 � 563;
F34 . Amin S, Panchal H. A Review on Thermal Spray Coating Processes. InternationalJournal of Current Trends in Engineering & Research (IJCTER) e-ISSN 2455�1392Volume 2 Issue 4, April 2016 pp. 556 � 563;
F35 Baldan A Adhesion phenomena in bonded joints International. Journal of Adhesion &Adhesives 38 (2012) 95�116;
F36 Neubauer R, Moritz Husmann S, Weinländer C, Kienzl N, Leitner E, Hochenauer C.Acid base interaction and its in�uence on the adsorption kinetics and selectivity order ofaromatic sulfur heterocycles adsorbing on Ag-Al2O3. Institute of Thermal Engineering(3070);
F37 Baldan A Adhesion phenomena in bonded joints International. Journal of Adhesion &Adhesives 38 (2012) 95�116;

180 BIBLIOGRAPHY
F38 Baldan A Adhesion phenomena in bonded joints International. Journal of Adhesion &Adhesives 38 (2012) 95�116;
F39 Baldan A Adhesion phenomena in bonded joints International. Journal of Adhesion &Adhesives 38 (2012) 95�116;
F40 Tracton A. Coating technology handbook. Taylor & Francis Group, LLC 2006;
F41 Ray A. Intermolecular forces give rise to cohesion in water molecules.Jul 16, 2017;
F42 Ray A. Intermolecular forces give rise to cohesion in water molecules.Jul 16, 2017;
F43 Ray A. Intermolecular forces give rise to cohesion in water molecules.Jul 16, 2017;
F44 Baldan A Adhesion phenomena in bonded joints International. Journal of Adhesion &Adhesives 38 (2012) 95�116;
F45 Tracton A. Coating technology handbook. Taylor & Francis Group, LLC 2006;
F46 Chalker P R, Bull S J, Rickerby D S. . A review of the methods for the evaluation ofcoating-substrate adhesion. Materials Science and Engineering, A 140 ( 1991 ) 583-592;
F47 https://dfdinstruments.com/astm-d4541-iso-4624/;
F48 Cai Y, Zhang S, Zeng X, Qian M, Sun D, Weng W. Interfacial study of magnesium-containing �uoridated hydroxyapatite coatings. Thin Solid Films, 519 (2011) 4629�4633;
F49 Tracton A. Coating technology handbook. Taylor & Francis Group, LLC 2006;
F50 http://www.substech.com/dokuwiki/doku.php?id=adhesion_tests;
F51 Sergici Onur A, Randall N. Scratch Testing of Coatings. Advanced Materials and Pro-cesses, April 2006;
52 Choudhary R K, Mishra P. Use of Acoustic Emission During Scratch Testing for Un-derstanding Adhesion Behavior of Aluminum Nitride Coatings. Journal of MaterialsEngineering and Performance, June 2016, Volume 25, Issue 6, pp 2454�2461;
F53 Choudhary R K, Mishra P. Use of Acoustic Emission During Scratch Testing for Un-derstanding Adhesion Behavior of Aluminum Nitride Coatings. Journal of MaterialsEngineering and Performance, June 2016, Volume 25, Issue 6, pp 2454�2461;
F54 Tracton A. Coating technology handbook. Taylor & Francis Group, LLC 2006;
F55 Campos-Silva I, Martínez-Trinidad J, Doñu-Ruíz M A, Rodríguez-Castro G.Hernández-Sánchez E, Bravo-Bárcenas O. Interfacial indentation test of FeB/Fe2Bcoatings.Surface and Coatings Technology, Vol. 206, Issue 7, 25 December 2011, pp1809-1815;
F56 Tracton A. Coating technology handbook. Taylor & Francis Group, LLC 2006;
F57 Tracton A. Coating technology handbook. Taylor & Francis Group, LLC 2006;
F58 Moira e Silva CW, Alves E, Ramos AR, Sandu CS, Cavaleiro A. Adhesion failures onhard coatings induced by interface anomalies. Vacuum 83 (2009) 1213-1217;
F59 Moira e Silva CW, Alves E, Ramos AR, Sandu CS, Cavaleiro A. Adhesion failures onhard coatings induced by interface anomalies. Vacuum 83 (2009) 1213-1217;
F60 Varacalle D J, Guillen D, Deason D M, Rhodaberg W. E�ect of Grit-Blasting onSubstrate Roughness and Coating Adhesion. Journal of Thermal Spray Technology,15(3):348-355, September 2006;
F61 Varacalle D J, Guillen D, Deason D M, Rhodaberg W. E�ect of Grit-Blasting onSubstrate Roughness and Coating Adhesion. Journal of Thermal Spray Technology,15(3):348-355, September 2006;

BIBLIOGRAPHY 181
F62 Varacalle D J, Guillen D, Deason D M, Rhodaberg W. E�ect of Grit-Blasting onSubstrate Roughness and Coating Adhesion. Journal of Thermal Spray Technology,15(3):348-355, September 2006;
F63 Kromer R, Costil S, Cormier J, Courapied D, Berthe L, Peyre P, Boustie M. Lasersurface patterning to enhance adhesion of plasma sprayed coatings. Surface and coatingstechnology, 278 (2015) 171-182;
F64 Kromer R, Costil S, Cormier J, Courapied D, Berthe L, Peyre P, Boustie M. Lasersurface patterning to enhance adhesion of plasma sprayed coatings. Surface and coatingstechnology, 278 (2015) 171-182;
F65 Kromer R, Costil S, Cormier J, Courapied D, Berthe L, Peyre P, Boustie M. Lasersurface patterning to enhance adhesion of plasma sprayed coatings. Surface and coatingstechnology, 278 (2015) 171-182;
F66 Rahamati B, Zalnezhad E, Sarhan A A D, Kamiab Z, Nasiri Tabrizi B, Abas W AB W. Enhancing the adhesion strength of tantalum oxide ceramic thin �lm coating onbiomedical Ti-6Al-4V alloy by thermal surface treatment. Ceramics international, 41(2015) 13055-13063;
F67 Rahamati B, Zalnezhad E, Sarhan A A D, Kamiab Z, Nasiri Tabrizi B, Abas W AB W. Enhancing the adhesion strength of tantalum oxide ceramic thin �lm coating onbiomedical Ti-6Al-4V alloy by thermal surface treatment. Ceramics international, 41(2015) 13055-13063;
F68 Tracton A. Coating technology handbook. Taylor & Francis Group, LLC 2006;
F69 https://headandneckcancerguide.org/adults/introduction-to-head-and-neck-cancer/oral-cancers/basics/anatomy/;
F70 https://www.alamy.de/zahn-anatomie-infogra�ken-realistische-weisse-zahn-mockup-oral-care-health-concept-medizinische-banner-oder-poster-vector-illustration-image212420561.html;
F71 https://dentalspecialistsmk.com/gum-treatment/;
F72 https://www.aomsurgery.com/dental-implants/cost-of-implants/;
F73 Panda A. Types of Dental Implants: Endosteal, Transosteal & Subperiosteal. DentalBraces, Health Tips, Feb 2017;
F74 Sakaguchi R, Powers JCraig's Restorative Dental Materials. 13rd edition, Mosby, 2012,Pages 355-367;
F75 https://www.slideshare.net/AElhlawany/dental-implants-47922112
F76 https://pt.slideshare.net/marcusharris086/types-of-dental-implant;
F77 https://www.friscooralsurgery.com/procedures/dental-implants/
F78 Fatma B, Cengiz Y. The Mechanical Behaviors of Various Dental Implant Materialsunder Fatigue. Hindawi Advances in Materials Science and Engineering Volume 2018,Article ID 5047319, 10 pages;
F79 Violan D,Galofre M, Nart J, Teles R P. In vitro evaluation of a multispecies oral bio�lmon di�erent implant surfaces. Biomed Mater 2014;9:035007;
F80 Violan D,Galofre M, Nart J, Teles R P. In vitro evaluation of a multispecies oral bio�lmon di�erent implant surfaces. Biomed Mater 2014;9:035007;
F81 Ramesh T, Nayak K, Amirbahman A, Tripp C P, Mukhopadhyayd s. Applicationof ultraviolet light assisted titanium dioxide photocatalysis for food safety: A review.Innovative Food Science & Emerging Technologies Volume 38, Part A, December 2016,pp 105-115;

182 BIBLIOGRAPHY
F82 Iwasa F, Hori N, Ueno T, Minamikawa H, Yamada M, Ogawa T. Enhancement ofosteoblast adhesion to UV-photofunctionalized titanium via an electrostatic mechanism.Biomaterials 31 (2010) 2717�2727;
F83 Ghorani B, Tucker N. Fundamentals of electrospinning as a novel delivery vehicle forbioactive compounds in food nanotechnology. Food Hydrocolloids Volume 51, October2015, Pages 227-240;
F84 https://nptel.ac.in/courses/116102006/20;
F85 Angammana C J, Jayaram, S H. A theoretical understanding of the physical mecha-nisms of electrospinning. Proceedings of ESA Annual Meeting on Electrostatics 2011pp. 1-9, Cleveland, USA, June 2011, 2011;
F86 https://www.steeldoor.org/T-DOC/ansi-250-3.php
F87 https://www.elcometer.com/en/coating-inspection/adhesion-testers/cross-hatch-adhesion-testers/elcometer-107-cross-hatch-cutter.html;
F88 Kalidindi R S R, Subasri R.Sol-gel nanocomposite hard coatings. Anti-AbrasiveNanocoatings, Current and Future Applications, 2015, pp 105-136;
F89 https://www2.nau.edu/micro-analysis/wordpress/index.php/instrumentation/;
F90 https://www.nanoscience.com/techniques/scanning-electron-microscopy/;
F91 Jusman Y, Cheok Ng S, Osman N A A. Investigation of CPD and HMDS SamplePreparation Techniques for Cervical Cells in Developing Computer-Aided ScreeningSystem Based on FE-SEM/EDX. The Scienti�c World Journal,September 2014;
F92 Mitutoyo.Quick guide to surface roughness measurement. Reference guide for labora-tory and workshop. Bulletin No. 2229;
F93 https://www.keyence.com/ss/products/microscope/roughness/equipment/line_01.jsp;
F94 ZEISS LSM800 for Materials brochure;
F95 ZEISS LSM800 for Materials brochure;
F96 Toshihiro T, Joonho L, Piotr R S. Interfacial Free Energy and Wettability. Treatise onProcess Metallurgy Volume 2: Process Phenomena 2014, pp 61-77;
F97 Luxbacher T. The Zeta Potential for Solid Surface Analysis. 1st edition, AustriamMarch 2014;
F98 Luxbacher T. The Zeta Potential for Solid Surface Analysis. 1st edition, AustriamMarch 2014;
F99 https://photobioschool.ru/en/methods-en/ftir-spectroscopy/;
F100 Bunaciu A A, Udris Tioiu E G, Aboul-Enein H Y. X-Ray Di�raction: Instrumenta-tion and Applications.Critical Reviews in Analytical Chemistry 45(4), April 2015;
F101 https://it.wikipedia.org/wiki/Legge_di_Bragg;
F102 https://xpssimpli�ed.com/whatisxps.php;
103 http://imma-eneas.schematic.lautschriftmagazin.de/diagram/xps-instrumentation.html;
F104 https://www2.nau.edu/micro-analysis/wordpress/index.php/instrumentation/;
F105 https://www.nanoscience.com/techniques/scanning-electron-microscopy/;
F106 https://www.indiamart.com/proddetail/hydrolyzed-keratin-17905041862.html;

BIBLIOGRAPHY 183
Tables
T1 Rajabinejad H, Zoccola M, Patrucco A, Montarsolo A, Rovero G and Tonin C. Physico-chemical properties of keratin extracted from wool by various methods. Textile ResearchJournal 1�10 ;
T2 https://en.wikipedia.org/wiki/Gram-positive bacteria;