Proposed Angola LNG Project Environmental, Socioeconomic ...
Upload
khangminh22Category
view
2download
0
1
POLITECNICO DI TORINO
Corso di Laurea Magistrale in Petroleum and Mining Engineering
Tesi di Laurea Magistrale
Optimization of an LNG Storage Tank for the Minimization of the BOG for Three Different Liquid
Filling Levels
firma del relatore firma del candidato
............Michel Obeid...........
.........Laura Savoldi...............
Relatore /i Candidat o/i prof. Nome e Cognome
Nome e Cognome
2
Acknowledgment This study would not have been possible without the support and encouragement of
Professor Laura Savoldi to whom I wish to express my deepest gratitude for her inspiring guidance,
valuable discussion and for giving me the opportunity to do this thesis in the prestigious
Politecnico di Torino. I owe a sincere thanks to my co-advisor Yifeng Zhang, Associate Professor
at DTU, Technical University of Denmark for his constant support and feedback.
I would like to express my deep gratitude to my parents and my brother, if it was not for their
unconditional support and help from the very beginning till the completion of this work I would
not have been able to finish this project.
Last but not least, I would like to thank my friends in Italy and abroad who did not hesitate to help
me whenever I needed them.
Finally, I would like to thank the department of Petroleum and Mining Engineering and the
University of Politecnico di Torino for teaching and giving me a baggage of skills to kick start my
career.
3
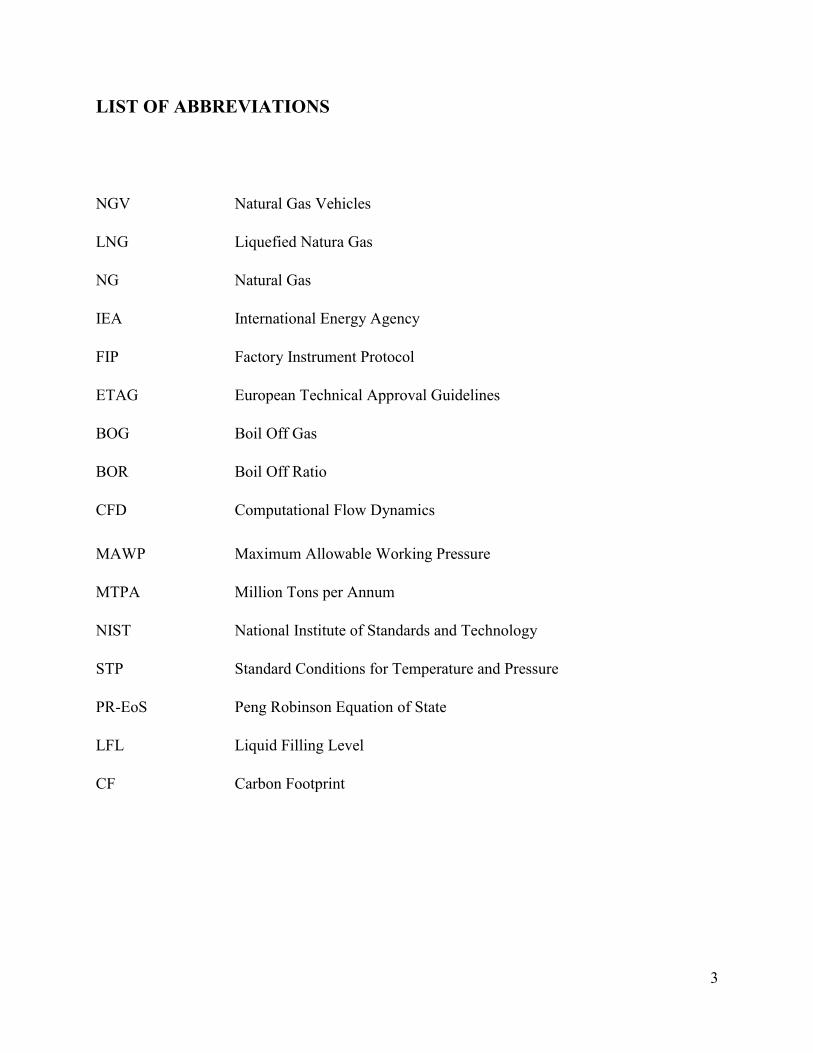
LIST OF ABBREVIATIONS
NGV Natural Gas Vehicles
LNG Liquefied Natura Gas
NG Natural Gas
IEA International Energy Agency
FIP Factory Instrument Protocol
ETAG European Technical Approval Guidelines
BOG Boil Off Gas
BOR Boil Off Ratio
CFD Computational Flow Dynamics
MAWP Maximum Allowable Working Pressure
MTPA Million Tons per Annum
NIST National Institute of Standards and Technology
STP Standard Conditions for Temperature and Pressure
PR-EoS Peng Robinson Equation of State
LFL Liquid Filling Level
CF Carbon Footprint

4
Abstract The thermal performance of a 260000 𝑚3LNG storage tank was studied for three different liquid
filling levels. Thermodynamic equilibrium and non-equilibrium approaches were used to estimate
BOG while incorporating a thermal resistance-capacitance network. After setting the tank
parameters and initial fluid properties, convection and conduction heat transfers were calculated
for the different parts of the tank as well as the vapor and liquid phases. It was possible then to
compute the BOG and BOR of the three LFL of the tank. Our results indicate that the total heat
leak variation disregards the liquid level of the tank, yet the BOG generated which is linked to the
heat leak to the liquid phase of the tank increases with the decreasing filling level. For the 80%
and 50% liquid filling levels the BOR was found to be 0.012 and 0.03wt%/day, respectively while
for the 10% LFL a larger value equal to 0.152 was found which barely exceeds the threshold set
in operating conditions that need to be furtherly treated. These results imply that vapor to liquid
heat transfer has a major role in proper BOG calculation knowing that the heat ingress to the liquid
phase is directly linked to this generation. Furthermore, with the data provided, the manufacturing
carbon footprint of this tank was calculated and found to be 88.5 × 10³ carbon in tons CO2-eq.
5
Table of Contents Acknowledgment ............................................................................................................................ 2
LIST OF ABBREVIATIONS ......................................................................................................... 3
Abstract ........................................................................................................................................... 4
LIST OF TABLES .......................................................................................................................... 7
LIST OF FIGURES ........................................................................................................................ 8
Background ..................................................................................................................................... 9
Chapter 1: Introduction ................................................................................................................. 11
1.1 Fuel Importance.............................................................................................................. 11
1.2 Transportation Fuel ........................................................................................................ 11
1.3 LNG Importance ............................................................................................................ 12
1.4 LNG Terminal ................................................................................................................ 15
1.5 LNG Tanks ..................................................................................................................... 16
1.6 Literature Review on BOG studies and Thesis Aim ...................................................... 19
Chapter 2: Physical Phenomena Occurring in a LNG Tank ......................................................... 21
2.1 BOG Generation ......................................................................................................... 21
2.2 BOG Importance......................................................................................................... 22
2.3 BOR ............................................................................................................................ 24
2.4 Weathering .................................................................................................................. 24
2.5 Liquid Filling Level Effect ......................................................................................... 28
2.6 Thermophysical Properties of Liquid Phase ............................................................... 29
2.7 Thermophysical Properties of Vapor Phase ............................................................... 30
Chapter 3: Model Development .................................................................................................... 32
3.1 Methodologies and Assumptions ................................................................................... 32
3.2 Mass Balance Analogy ................................................................................................... 33
3.3 Energy Balance Analogy ................................................................................................ 35
3.4 Heat Transfer through Tank Shell .................................................................................. 37
3.4.1 Bottom..................................................................................................................... 37
3.4.2 Roof .............................................................................................................................. 38
3.4.3 Walls ....................................................................................................................... 38
3.5 Heat transfer rate at the liquid vapor interface ............................................................... 41
Chapter 4: Case Study ................................................................................................................... 43
6
4.1 Tank Parameters and Materials ...................................................................................... 44
4.2 Numerical Development ................................................................................................ 47
4.3 Model Results ................................................................................................................. 53
4.3.1 Tank filled with 80% LNG ..................................................................................... 53
4.3.2 Tank filled with 50% LNG ..................................................................................... 54
4.3.3 Tank filled with 10% LNG ..................................................................................... 55
4.4 Discussion ...................................................................................................................... 56
4.5 Comparison with previous results .................................................................................. 58
Chapter 5: Environmental aspect of technology presented........................................................... 60
5.1 Future improvements and limitations ......................................................................... 62
Chapter 6: Conclusion................................................................................................................... 63
Appendices ................................................................................................................................... 65
References ..................................................................................................................................... 69
7
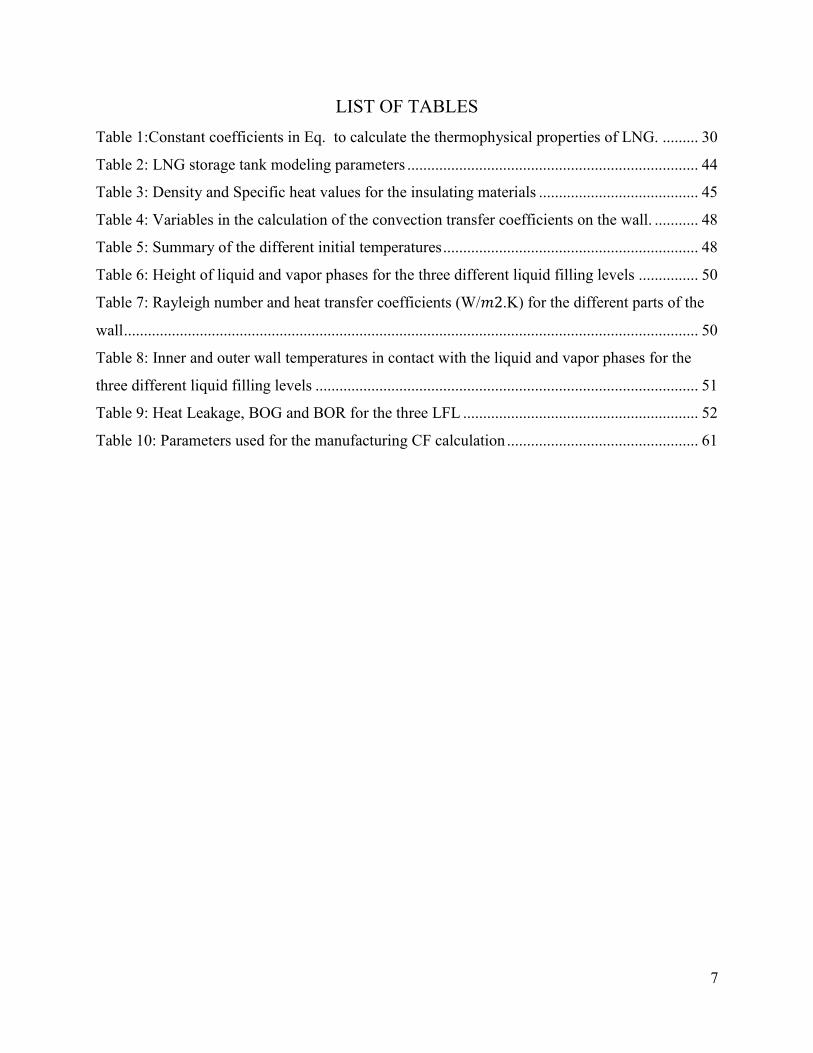
LIST OF TABLES Table 1:Constant coefficients in Eq. to calculate the thermophysical properties of LNG. ......... 30
Table 2: LNG storage tank modeling parameters ......................................................................... 44
Table 3: Density and Specific heat values for the insulating materials ........................................ 45
Table 4: Variables in the calculation of the convection transfer coefficients on the wall. ........... 48
Table 5: Summary of the different initial temperatures ................................................................ 48
Table 6: Height of liquid and vapor phases for the three different liquid filling levels ............... 50
Table 7: Rayleigh number and heat transfer coefficients (W/𝑚2.K) for the different parts of the
wall ................................................................................................................................................ 50
Table 8: Inner and outer wall temperatures in contact with the liquid and vapor phases for the
three different liquid filling levels ................................................................................................ 51
Table 9: Heat Leakage, BOG and BOR for the three LFL ........................................................... 52
Table 10: Parameters used for the manufacturing CF calculation ................................................ 61
8
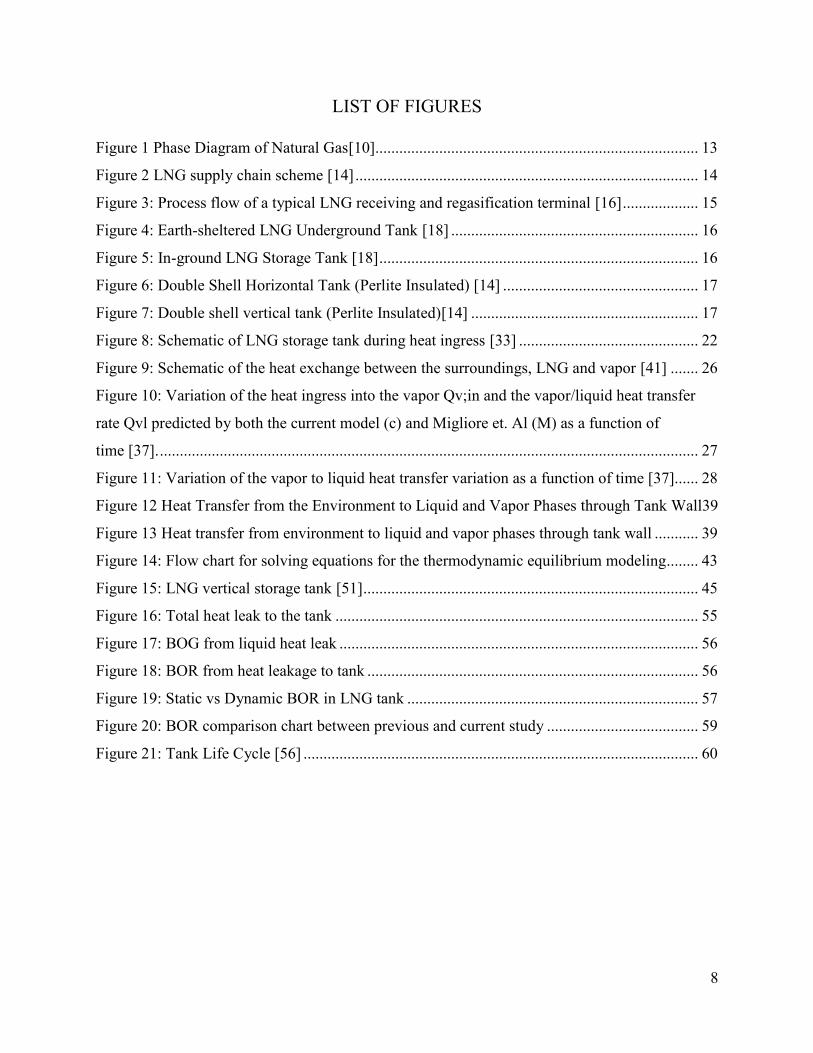
LIST OF FIGURES
Figure 1 Phase Diagram of Natural Gas[10] ................................................................................. 13
Figure 2 LNG supply chain scheme [14] ...................................................................................... 14
Figure 3: Process flow of a typical LNG receiving and regasification terminal [16] ................... 15
Figure 4: Earth-sheltered LNG Underground Tank [18] .............................................................. 16
Figure 5: In-ground LNG Storage Tank [18] ................................................................................ 16
Figure 6: Double Shell Horizontal Tank (Perlite Insulated) [14] ................................................. 17
Figure 7: Double shell vertical tank (Perlite Insulated)[14] ......................................................... 17
Figure 8: Schematic of LNG storage tank during heat ingress [33] ............................................. 22
Figure 9: Schematic of the heat exchange between the surroundings, LNG and vapor [41] ....... 26
Figure 10: Variation of the heat ingress into the vapor Qv;in and the vapor/liquid heat transfer
rate Qvl predicted by both the current model (c) and Migliore et. Al (M) as a function of
time [37]. ....................................................................................................................................... 27
Figure 11: Variation of the vapor to liquid heat transfer variation as a function of time [37]...... 28
Figure 12 Heat Transfer from the Environment to Liquid and Vapor Phases through Tank Wall39
Figure 13 Heat transfer from environment to liquid and vapor phases through tank wall ........... 39
Figure 14: Flow chart for solving equations for the thermodynamic equilibrium modeling........ 43
Figure 15: LNG vertical storage tank [51] .................................................................................... 45
Figure 16: Total heat leak to the tank ........................................................................................... 55
Figure 17: BOG from liquid heat leak .......................................................................................... 56
Figure 18: BOR from heat leakage to tank ................................................................................... 56
Figure 19: Static vs Dynamic BOR in LNG tank ......................................................................... 57
Figure 20: BOR comparison chart between previous and current study ...................................... 59
Figure 21: Tank Life Cycle [56] ................................................................................................... 60

9
Background
Energy supply is and will always be the biggest concern threatening the modern world. The
increasing demand of resources to meet the needs of more than 7 billion people drives researchers
to understand better the humans’ consumption of the Earth’s ecosystem [1]. To face this challenge,
humans are constantly searching for energy sources and creating storage facilities to provide for
the masses. Traditional energy sources used in the past years until now consist of the hydrocarbon
family such as oil, natural gas, and coal. While the planet’s survival depends on this increasing
production and consumption cycle, a shortage of such resources has to take place in the near future
but will not be due to availability problems. To be more precise, this shortage will challenge oil
and gas producers significantly in order to address climate change and the rise in temperature
envisioned by the Paris agreement. In a study developed by Neal Anderson, president, and CEO
of Wood Mackenzie the world’s leading energy and consulting firm, in 2040, hydrocarbon will
still provide 80% of the world’s energy use, mainly coal, natural gas and crude oil [2]. Efforts to
reduce such projection are being pursued with sustainability and energy efficiency is seen as the
ultimate goals; unfortunately, green technologies are still a bit behind when it comes to answering
the masses demand due to their lower efficiency, insufficient technical development and market
handicap. Looking forward to achieving a complete sustainable eco-friendly future, for the time
being, acting fast and handling energy and environmental policies have to be coupled together to
achieve a vital energy transition in order to ensure such a future [3]. Knowing that this energy shift
is promising, it is not wrong to take a look at what is present and try to improve the oil and gas
industry as much as possible aiming towards a zero-carbon emission technologies. A solid example
that highlights a big entity in favor of this shift, is the Paris Agreement characterized as a legally
conclusive treaty on climate change adopted by 196 parties in late 2015 and entered into force on

10
November 2016 [4]. The Paris Agreement defines a global goal on adaptation to the climate change
while preventing a global warming above 2ᵒC with constant effort to hold the global temperature
rise below 1.5ᵒC. By implying a transparency framework, the Paris Agreement parties would be
sharing information about climate change impacts and acclimation as well as actions that should
be taken to reduce greenhouse gas emissions; therefore, a collective effort towards mitigation sets
a firm path towards achieving short and long term goals. Whether in the production, refining or
storage and transportation sector, improvements can be and must be made in parallel with the
alternative energy campaign.
11
Chapter 1: Introduction
1.1 Fuel Importance
While earth’s natural resources are not fully known or even fixed in any sense, beneath layers
of rock and sediments lies the remains of plants and other organisms, decomposed over millennia
into carbon-rich deposits known as fossil fuel. Fossil fuels include coal, oil shales, petroleum,
bitumen, tar sands, heavy oils, and natural gas. Each of these fossil fuels can be burned in presence
of oxygen in order to provide heat that can be either employed directly in households (furnaces,
room heater), or applied to produce steam for generators to further supply electricity. These fuels
are being consumed at an increasing rate counting from the industrial revolution in Great Britain
in the late 1700s up until the present moment where they consist of more than 80% of the world’s
energy supply [5]. Being one of the most widely-used energy sources, fuel burning has many
applications such as providing electricity for houses and facilities as well as powering engines,
vehicles, airplanes, and ships.
1.2 Transportation Fuel
All energy sources derived from petroleum, biomass, and synthetic fuel that power any mean
of transport are considered transportation fuel. Gasoline and diesel account for the highest share
of the total transportation fuel consumed by road transport. On the other hand, the aviation industry
focuses on aviation turbine fuel while the railway industry consumes diesel or electricity. These
fuels are nothing but the end products of crude oil refining and account for almost 90% of the
transportation fuel worldwide [6]. This spiking dependency on crude oil is reflected negatively
when it comes to high emission levels and greenhouse gas emissions into the atmosphere, the main
stimulants for climate change. Government and organizations around the world started developing
12
and promoting the use of cleaner eco-friendly fuels. Among those fuels, natural gas stands on the
verge between traditional fuel and green energy, especially that it is considered the cleanest
burning fossil fuel due to its chemical composition, emitting half as much CO2 as coal to produce
the same amount of energy[7]. The use of natural gas as an alternative fuel in the transportation
sector goes way back to the 1930’s when it was used to fuel vehicles. Recently with technological
advancement, proliferation of natural gas cars and buses has become available which is
contributing to cleaner vehicles and transportation facilities in the world [8]. In fact, natural gas
vehicles (NGVs) have many pros such as improving air quality and reducing noise pollution in
urban regions, creating a divergence from consuming oil into exporting it but also improving
energy security and reduce spending on public transportation. Being considered as a clean and
low emission energy source, natural gas or even liquefied natural gas (LNG) production is
becoming the new hotspot in the oil and gas market, and the results are being observed in the
transportation industry where companies and governments are putting more investments and
attention to NG/LNG [9].
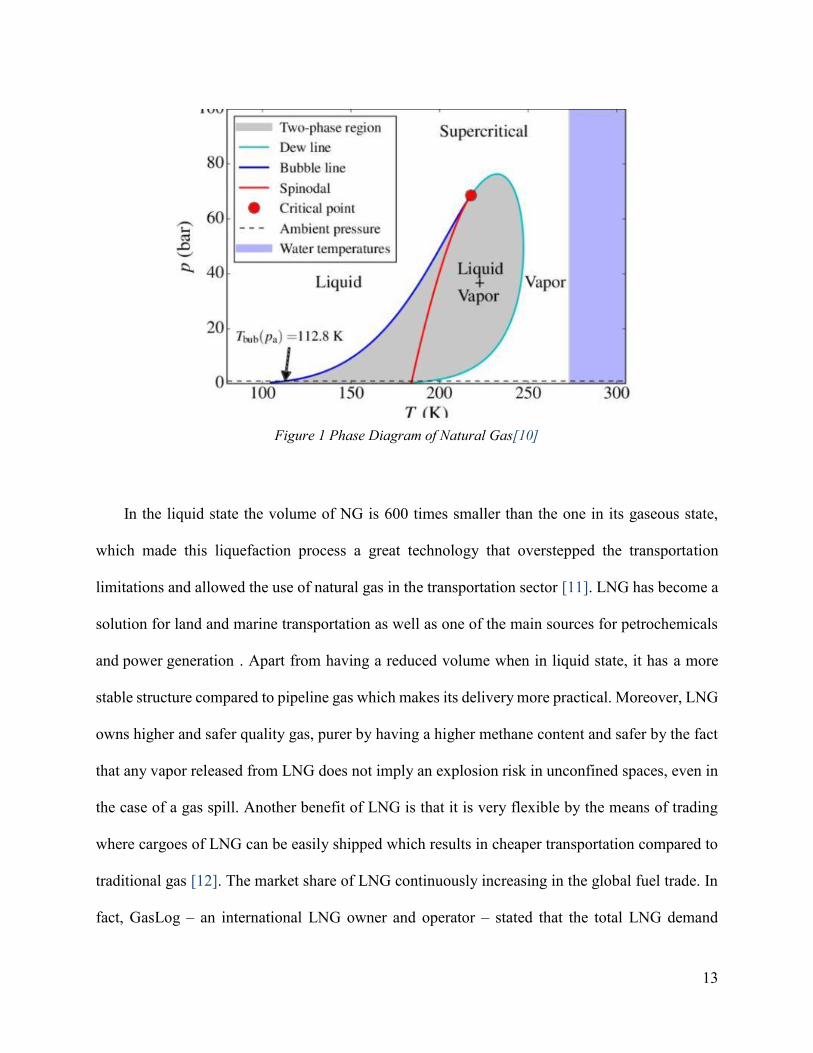
1.3 LNG Importance
Liquefied natural gas (LNG) is the liquid state of natural gas after dropping its temperature to
-161ᵒC. The phase diagram of a normal natural gas composition can be seen in Figure 1
13
In the liquid state the volume of NG is 600 times smaller than the one in its gaseous state,
which made this liquefaction process a great technology that overstepped the transportation
limitations and allowed the use of natural gas in the transportation sector [11]. LNG has become a
solution for land and marine transportation as well as one of the main sources for petrochemicals
and power generation . Apart from having a reduced volume when in liquid state, it has a more
stable structure compared to pipeline gas which makes its delivery more practical. Moreover, LNG
owns higher and safer quality gas, purer by having a higher methane content and safer by the fact
that any vapor released from LNG does not imply an explosion risk in unconfined spaces, even in
the case of a gas spill. Another benefit of LNG is that it is very flexible by the means of trading
where cargoes of LNG can be easily shipped which results in cheaper transportation compared to
traditional gas [12]. The market share of LNG continuously increasing in the global fuel trade. In
fact, GasLog – an international LNG owner and operator – stated that the total LNG demand
Figure 1 Phase Diagram of Natural Gas[10]
14
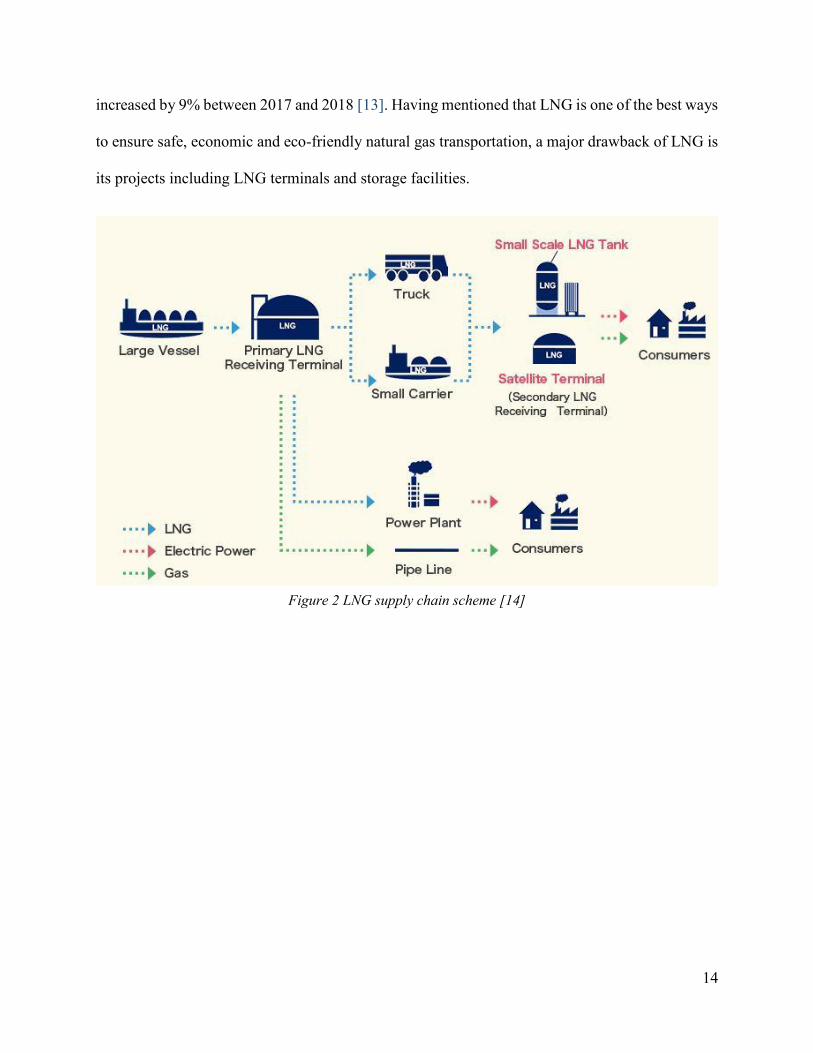
increased by 9% between 2017 and 2018 [13]. Having mentioned that LNG is one of the best ways
to ensure safe, economic and eco-friendly natural gas transportation, a major drawback of LNG is
its projects including LNG terminals and storage facilities.
Figure 2 LNG supply chain scheme [14]
15
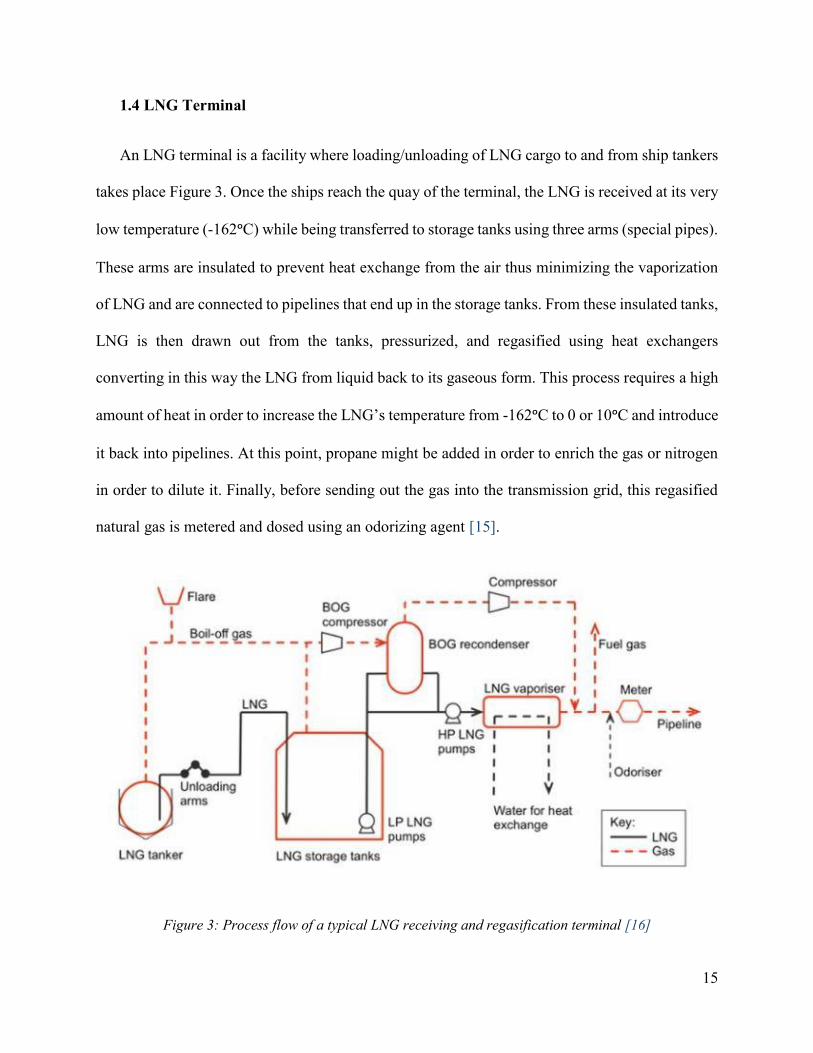
1.4 LNG Terminal
An LNG terminal is a facility where loading/unloading of LNG cargo to and from ship tankers
takes place Figure 3. Once the ships reach the quay of the terminal, the LNG is received at its very
low temperature (-162ᵒC) while being transferred to storage tanks using three arms (special pipes).
These arms are insulated to prevent heat exchange from the air thus minimizing the vaporization
of LNG and are connected to pipelines that end up in the storage tanks. From these insulated tanks,
LNG is then drawn out from the tanks, pressurized, and regasified using heat exchangers
converting in this way the LNG from liquid back to its gaseous form. This process requires a high
amount of heat in order to increase the LNG’s temperature from -162ᵒC to 0 or 10ᵒC and introduce
it back into pipelines. At this point, propane might be added in order to enrich the gas or nitrogen
in order to dilute it. Finally, before sending out the gas into the transmission grid, this regasified
natural gas is metered and dosed using an odorizing agent [15].
Figure 3: Process flow of a typical LNG receiving and regasification terminal [16]

16
1.5 LNG Tanks
This sprouting in LNG use over the recent years required a simultaneous development and
design of LNG storage tanks essential for receiving and safely storing the liquefied gas. These
particularly engineered massive tanks are designed using a double-walled construction approach
with insulating materials that can sustain very low temperatures (162ᵒC). Other than maintaining
the temperature constant, the storage structure has to be rigorous and robust taking into account
their ability to sustain stress, strain, or any unexpected deformation. These tanks are usually
constructed and installed under firmly controlled conditions and regulations with hardware
requiring official certifications. In a receiving terminal, tanks could be installed both underground
– here 2 types can be distinguished: Earth-sheltered LNG underground tank where the tank is
completely buried with its roof Figure 4 with a huge storage capacity and In-ground LNG storage
tank Figure 5 where the storage part is buried while the roof remains on the surface [18]– and above
ground being either horizontal Figure 6 or vertical Figure 7 tanks [14].
Figure 4: In-ground LNG Storage Tank[17]
Figure 4: Earth-sheltered LNG Underground Tank [18]
Figure 5: In-ground LNG Storage Tank [18]
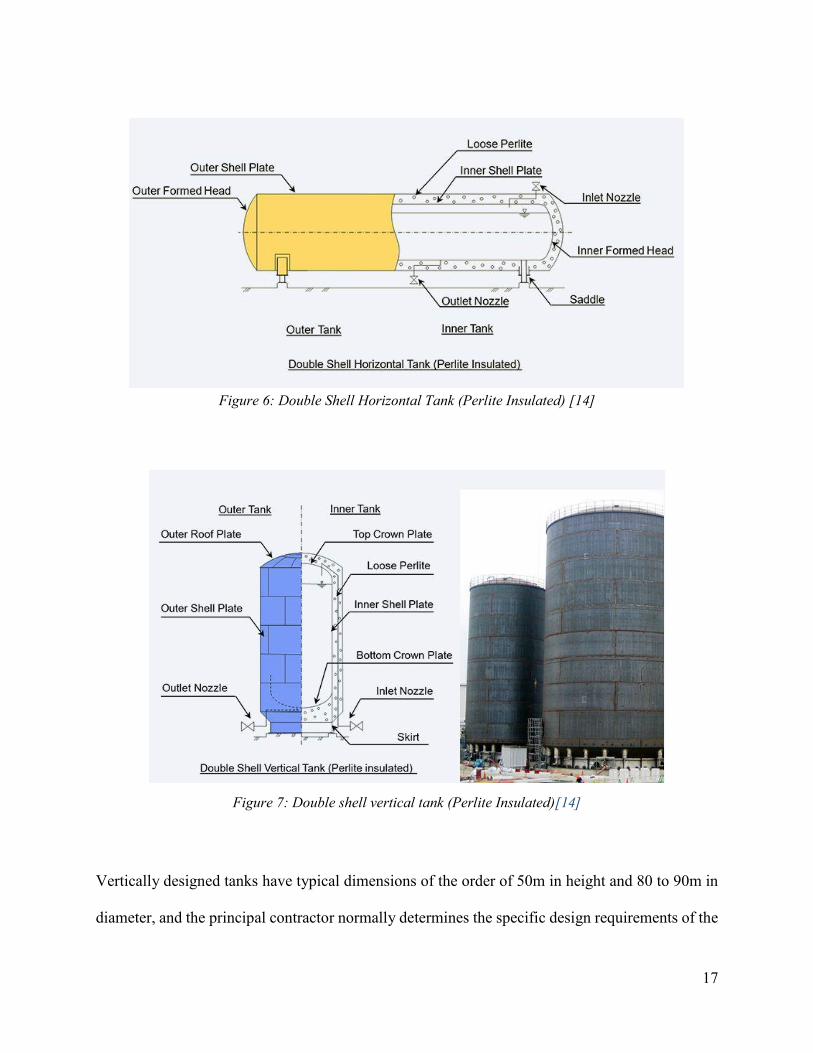
17
Vertically designed tanks have typical dimensions of the order of 50m in height and 80 to 90m in
diameter, and the principal contractor normally determines the specific design requirements of the
Figure 7: Double shell vertical tank (Perlite Insulated)[14]
Figure 6: Double Shell Horizontal Tank (Perlite Insulated) [14]
18
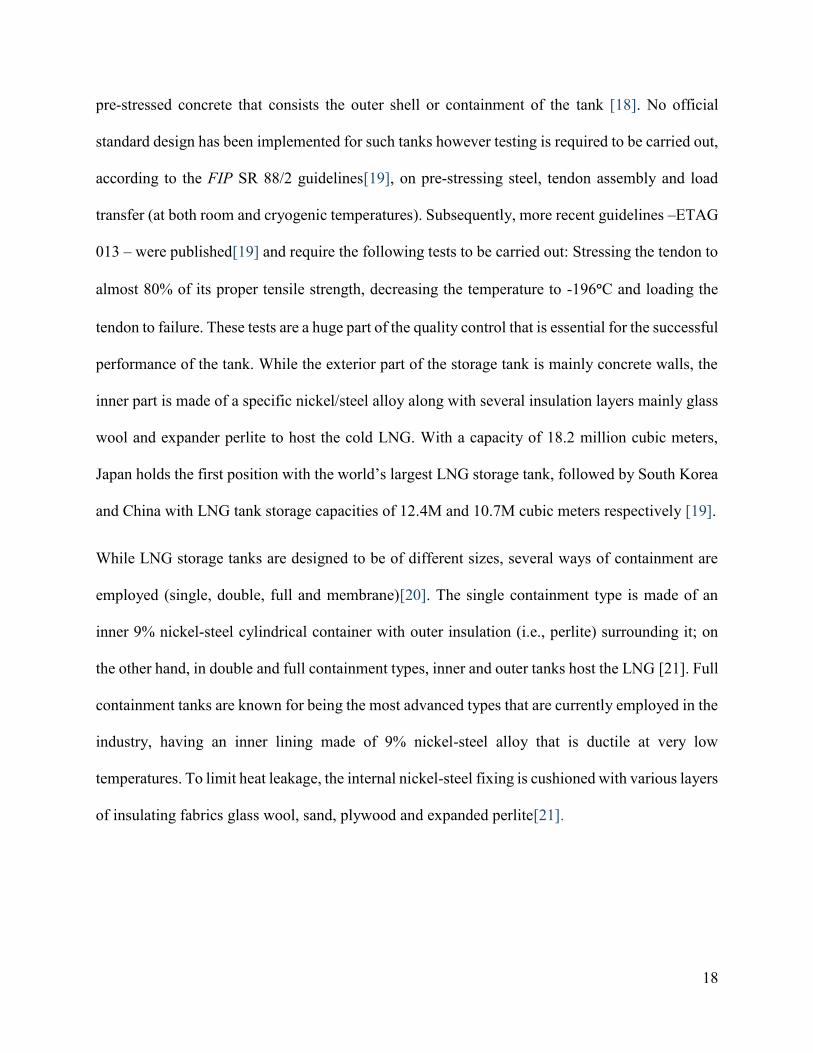
pre-stressed concrete that consists the outer shell or containment of the tank [18]. No official
standard design has been implemented for such tanks however testing is required to be carried out,
according to the FIP SR 88/2 guidelines[19], on pre-stressing steel, tendon assembly and load
transfer (at both room and cryogenic temperatures). Subsequently, more recent guidelines –ETAG
013 – were published[19] and require the following tests to be carried out: Stressing the tendon to
almost 80% of its proper tensile strength, decreasing the temperature to -196ᵒC and loading the
tendon to failure. These tests are a huge part of the quality control that is essential for the successful
performance of the tank. While the exterior part of the storage tank is mainly concrete walls, the
inner part is made of a specific nickel/steel alloy along with several insulation layers mainly glass
wool and expander perlite to host the cold LNG. With a capacity of 18.2 million cubic meters,
Japan holds the first position with the world’s largest LNG storage tank, followed by South Korea
and China with LNG tank storage capacities of 12.4M and 10.7M cubic meters respectively [19].
While LNG storage tanks are designed to be of different sizes, several ways of containment are
employed (single, double, full and membrane)[20]. The single containment type is made of an
inner 9% nickel-steel cylindrical container with outer insulation (i.e., perlite) surrounding it; on
the other hand, in double and full containment types, inner and outer tanks host the LNG [21]. Full
containment tanks are known for being the most advanced types that are currently employed in the
industry, having an inner lining made of 9% nickel-steel alloy that is ductile at very low
temperatures. To limit heat leakage, the internal nickel-steel fixing is cushioned with various layers
of insulating fabrics glass wool, sand, plywood and expanded perlite[21].
19
1.6 Literature Review on BOG studies and Thesis Aim
Even though LNG is stored in highly insulated storage tanks, LNG vaporization denoted as
boil-off gas (BOG) is commonly faced in tanks due to the parasitic load from the environment.
BOG undermines the compression work involved in natural gas (NG) liquefaction, and its
minimization improves the economics of the LNG value chain. While BOG depends on the heat
ingress, its assessment depends on the modelling and measuring capability while the tank design
and operating conditions affect the difficulty of this accurate assessment. Numerous experimental
studies aiming to accurately predict the BOG ad BOR in storage tanks have been carried out over
the years, however, the liquefied gas was inert such as nitrogen or helium due to the risk of
explosion [22]. On the other hand, in real industrial practices this gas is active such as natural gas
or hydrogen while being hard to handle experimentally. In addition, experimental studies are based
on lab-scale approaches that cannot reflect the genuine state of large static pressure of industrial-
scale tanks. This inconsistency in static pressure causes the boiling temperature to be also
discrepant with actual practices. Furthermore, these studies based on scaling down and up, will of
course affect the surface area to volume ratios which will directly have an influence on the heat
transfer characteristics and internal flow dynamics inside the tank [22]. Knowing that such errors
are unavoidable, investigating the BOG and BOR experimentally seems a bit impractical. For this
reason, studying the BOG and BOR more accurately is preferred to be done theoretically using
conventional numerical analysis and implying them into computational fluid dynamics (CFD)
simulations that enable graphic visualization of fluid motion. CFD methods were applied to solve
multi-phase problems in multiple areas such as chemical processes, nuclear energy, automotive,
and aerospace industries. Hassanvan et al. developed the CFD simulation of the vaporization of
gasoline in a car tank during splash loading with a solid comparison between numerical results and
20
theoretical values [23]. Lee et al. and Fu et al. were the ones that simulated the vaporization of
cryogenic liquid using the phase change model. Lee et al. [24] simulated the LNG leakage from a
membrane tank while applying a diffusion model to monitor the phase change of the LNG through
the porous membrane. Then, after developing the phase change model using ANSYS Fluent, the
codes were improved through several researches. Fu et al. [25] were able to link the vaporization
effect to the internal tank pressure by carrying CFD simulation of the phase change of liquid
hydrogen in spacecraft fuel tank, this change due to gravity and surface tension. Zakaria et al. [26]
were able to find the BOG of a full-scale ship tank using ANSYS Fluent however the study was
missing the geometry description and the numerical analysis. Ahammad et al. developed numerical
research on the vaporization frequency of LNG and nitrogen on a film boiling inside a storage tank
and visualized the physics for the analysis [27]. Saleem et al.[28] carried out a CFD simulation on
the BOG inside a full-scale LNG storage tank and reported the effects of the numerical data of the
phase change on the results. Almost all of the mentioned studies carried out the effect of input
parameters of the phase change and boundary conditions modifications.
This project aims to estimate the BOG generation and the BOR in a 2.6 × 10⁵𝑚3 tank for
different LNG filling levels (80%, 50%, and 10%). In the present study, a thermodynamic
equilibrium and non-equilibrium approach based on the resistance-capacitance link will be used
to investigate the thermal performance of this LNG storage tank. Also a brief carbon footprint of
this technology is carried out.

21
Chapter 2: Physical Phenomena Occurring in a LNG Tank
2.1 BOG Generation
As previously mentioned LNG is stored in storage tanks as a cryogenic liquid or in other words
extremely cold liquid. Just like any other liquid, when the boiling temperature is reached
evaporation is an expected phenomenon that might take place. Liquefied natural gas evaporates at
temperatures exceeding its boiling point and generates Boil Off Gas or BOG [29]. This boil off is
caused by heat ingress into the liquid whether during storage, transportation, loading, and
unloading operations. BOG quantity is based also on the design of storage tanks as well as the
operating conditions [29]. BOG is the main reason behind the overall tank pressure increase. In
fact, while the 2 phase mixture is at rest at a constant volume, heat ingress will cause a part of the
liquefied natural gas to evaporate and return to its gaseous state having a larger volume and leading
to the pressure increase in the tank. In order to avoid over-pressurization, and maintain the pressure
below the maximum allowable working pressure (MAWP) the BOG generated is continuously
removed by BOG compressors. However, the BOG released gradually decreases the methane
concentration which can affect the combustion quality of LNG. For this reason, studying this
vaporization and estimating an accurate BOG amount will for sure be a basis for developing
potential uses of this BOG.
22
2.2 BOG Importance
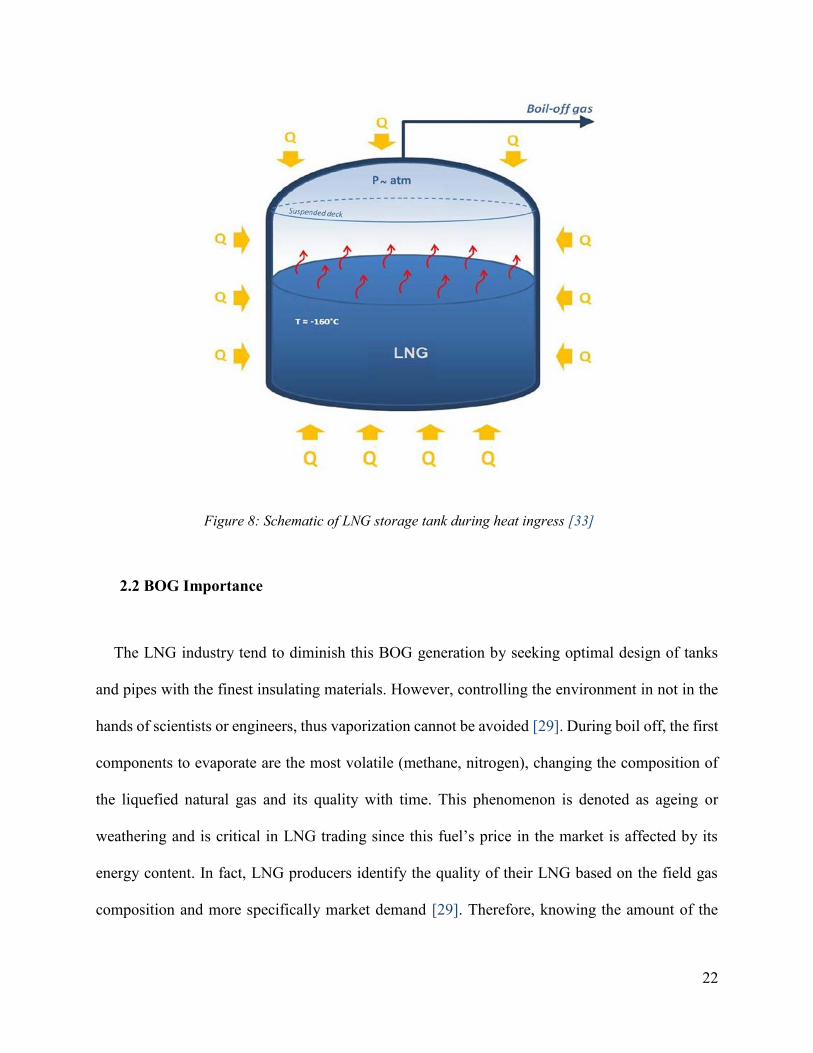
The LNG industry tend to diminish this BOG generation by seeking optimal design of tanks
and pipes with the finest insulating materials. However, controlling the environment in not in the
hands of scientists or engineers, thus vaporization cannot be avoided [29]. During boil off, the first
components to evaporate are the most volatile (methane, nitrogen), changing the composition of
the liquefied natural gas and its quality with time. This phenomenon is denoted as ageing or
weathering and is critical in LNG trading since this fuel’s price in the market is affected by its
energy content. In fact, LNG producers identify the quality of their LNG based on the field gas
composition and more specifically market demand [29]. Therefore, knowing the amount of the
Figure 8: Schematic of LNG storage tank during heat ingress [33]
23
BOG generated or even the Boil-Off Rate (BOR) in a storage tank gives more or less an inclusive
image about the LNG quality. The BOG rate (kg/s) can be defined as
(1)
𝑩𝑶𝑮(𝒌𝒈
𝒉) =
𝑸(𝒌𝑱𝒔 )
𝝀 (𝒌𝑱𝒌𝒈
)∗ 𝟑𝟔𝟎𝟎
Where 𝑄𝑙𝑖𝑞𝑢𝑖𝑑 is the total heat leakage (kJ/s) to the liquid through the walls and the heat indirectly
received from the vapor phase [28] and λ the latent heat of vaporization of LNG (kJ/kg). Although
heat is also exchanged at the vapor liquid interface, its contribution is negligible compared to the
heat ingress to the liquid through the tank walls
While the global LNG regasification capacity increased to 825 MTPA (million tons per annum) as
of February 2019, and around 130 MTPA are currently under development [30] , it is the upmost
necessary to accurately estimate BOG generations under different operating conditions, followed
by placing cost-effective procedures for the recycling and application of this gas [31]. To be more
precise, in the LNG supply chain the boil off gas generated can be considered as a fuel thus directly
used for power generation or heat, re-liquefied back into the storage tank or burned in a gasification
unit. While this last alternative poses environmental problems, it is absolutely preferable to use
this boil off gas to power an electric generator or be re-liquefied. The power provided using this
BOG can be estimated using 𝑃 = (𝑚𝜌
𝑀) ∗ ∆𝐻𝑐 ∗ 𝜀𝑤 where ∆𝐻𝑐 is the heat of combustion of CH4
and 𝜀𝑤is the methane electricity conversion efficiency [32]. In some cases, given that the BOG
24
flow rate is considered an indicator instead of tracking the pressurization that requires a long time
to be accurately detected [34].
2.3 BOR
The Boil-off rate (BOR), LNG vaporization of the total LNG mass per day [wt%] is defined as:
(2)
𝑩𝑶𝑹 =𝑩𝑶𝑮𝑸𝒍𝒊𝒒 × 𝟐𝟒
𝑻𝒐𝒕𝒂𝒍_𝑳𝑵𝑮_𝒎𝒂𝒔𝒔∗ 𝟏𝟎𝟎
BOR is defined as the quantity of liquid being evaporated from its storage container due to heat
ingress and it is expressed in % of the total liquid volume per unit time. Typically BOR values are
equal or less than 0.15%/day, the lower the percentage the better [35].
2.4 Weathering
Before starting any mathematical development, it is important to state that the liquid is
evaporating. It is therefore essential to know the behavior of such evaporation.
In fact, evaporation causes LNG to become denser thus changing its composition. This change
in composition will influence the thermophysical properties and its heating value essential for
export to grid stability [36]. This progressive alteration of thermophysical properties of stored
LNG through vaporization is summarized by ‘weathering’.
Weathering estimation of stored LNG is of a major importance to the industry especially in the
operation of regasification facilities. Increase in LNG storage time is being induced by sudden
variation in gas prices and seasonality, for this reason predicting accurately the weathering taking
place is essential in evaluating the accordance between the stored LNG and the supplied gas system
25
to final consumers. Also, when the LNG undergoes a significant weathering in the tank it will
become richer in heavy components; as a consequence, its density and boiling temperature will
increase which might call for action to introduce a new LNG batch that is lighter and cooler. This
process comes with a number of undesirable events such as stratification, sudden vapor liberation
and roll-over which might put at risk the business as usual [33].
Initial weathering models based on the ingress of heat started in the 1960s assuming an under
steady state in order to find the wall temperature profile and to get an estimation of the maximum
BOR [37]. Thirty years later, the first transient model of weathering was developed (the Shah and
Aarts model) which revived the LNG storage modelling [38]. In fact, this model was included in
several research tending to improve the thermodynamic model. At the same time, Chen et al.
focused on pure methane evaporation in storage tanks to follow the pressure and temperature
trends[32] while Adom et al. worked on a model that relates the operating pressure on boil off gas
rates [39]. It was Pellegrini et al. [40] that simplified the vapor liquid phase calculations by
removing the constant thermophysical properties assumption which helped Migliore and co-
workers [33] to develop a weathering model focused on pure heat transfer and phase equilibria
sub-models taking out the constant heat ingress assumption. Thermal equilibrium between liquid
and vapor natural gas was the common assumption in all of the above mentioned studies. Recently,
weathering models got rid of this assumption between liquid and vapor phases after industrial
proof of vapor superheating. This means that the vapor acts as an additional heating source
knowing that it has a higher temperature than the liquid after treating the heat ingress into the vapor
section separately from the liquid one.
26
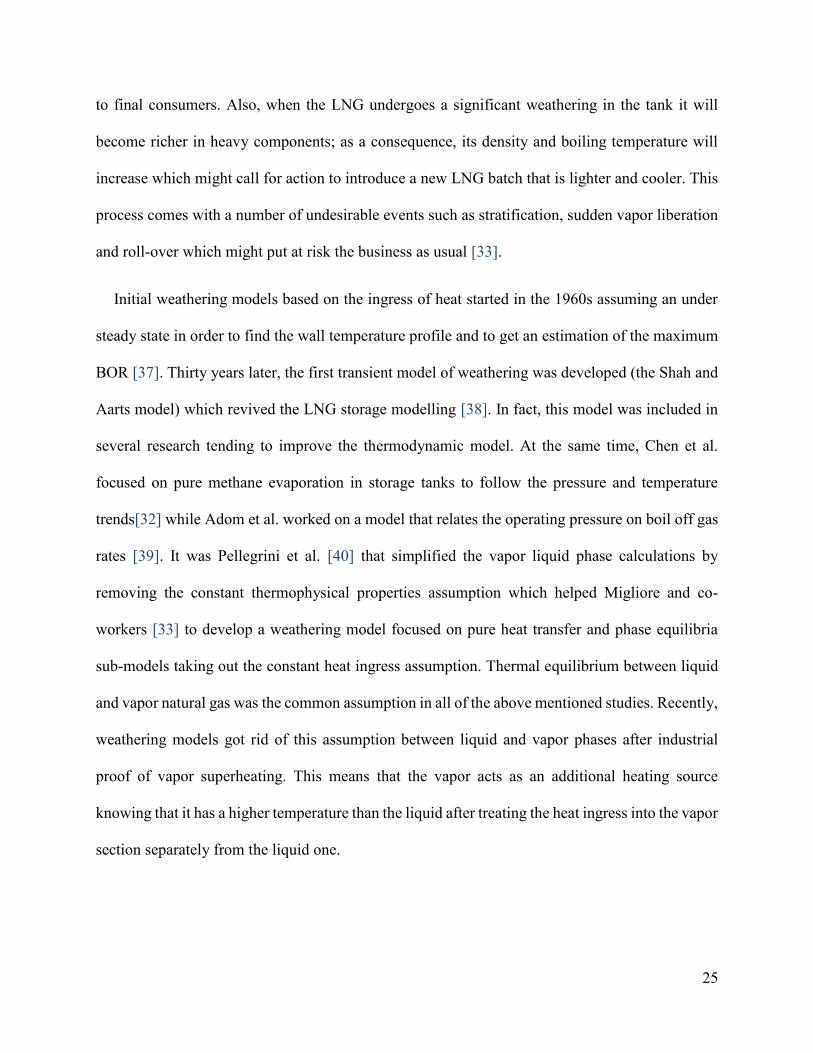
In order to better understand this mechanism, a closer look on the vapor liquid heat transfer
analysis shows the following:
As it is clear in Figure 9, the heat entering the tank is treated separately between the vapor
and liquid phases. Heat entering the liquid phase 𝑄𝑙𝑖𝑛will slowly increase its boiling temperature
whether due to the change of LNG composition (richer in heavy components) or due to the increase
in pressure. Also, heat entering the vapor phase 𝑄𝑣𝑖𝑛 will increase its temperature. Therefore,
𝑇𝑣𝑎𝑝 ≥ 𝑇𝑙𝑖𝑞 and the superheated vapor acts as an additional heating source for the liquid, leading
to heat transfer from the vapor phase to the liquid phase, 𝑄𝑣𝑙. This vapor liquid heat transfer rate
does not only depend on the temperature difference but also on the heat transfer mechanism in the
vapor and the interface. First, Effendy et al. [42] studied the LNG storage procedure in a
regasification terminal while considering the vapor heated by pure convection. It was Migliore et
al. [41] that considered two limiting scenarios for the heat transfer within vapor, convection and
Figure 9: Schematic of the heat exchange between the surroundings, LNG and vapor [41]

27
conduction after developing a non-equilibrium weathering model. As a result of their work, the
vapor temperature witnesses an average increase of 8K per year induced by a conductive vapor to
liquid heat transfer for a tank filled with LNG [41]. This goes in parallel with obvious industrial
evidence on vapor superheating which goes beyond words to acknowledge that conduction is the
dominant heat transfer mechanism in the vapor phase.
On another note, in a study developed by Felipe Huerta and Velisa Vesovic [37] that takes the
previous model of Migliore et al. (who developed the non-equilibrium weathering model for an
LNG storage tank), temperature profiles and heat transfer scenarios were monitored.
In Figure 10, the low 𝑄𝑣𝑙 trend predicted by the current model (Felipe and Velisa), match with the
CFD model developed by Roh and Son [43] that shows that 𝑄𝑣𝑙 contributed to 0.01% of the heat
ingress thus negligible, and the experimental observations of Lin et al. that confirm these
Figure 10: Variation of the heat ingress into the vapor Qv;in and the vapor/liquid heat transfer rate Qvl predicted by both the current model (c) and Migliore et. Al (M) as a
function of time [37].
28
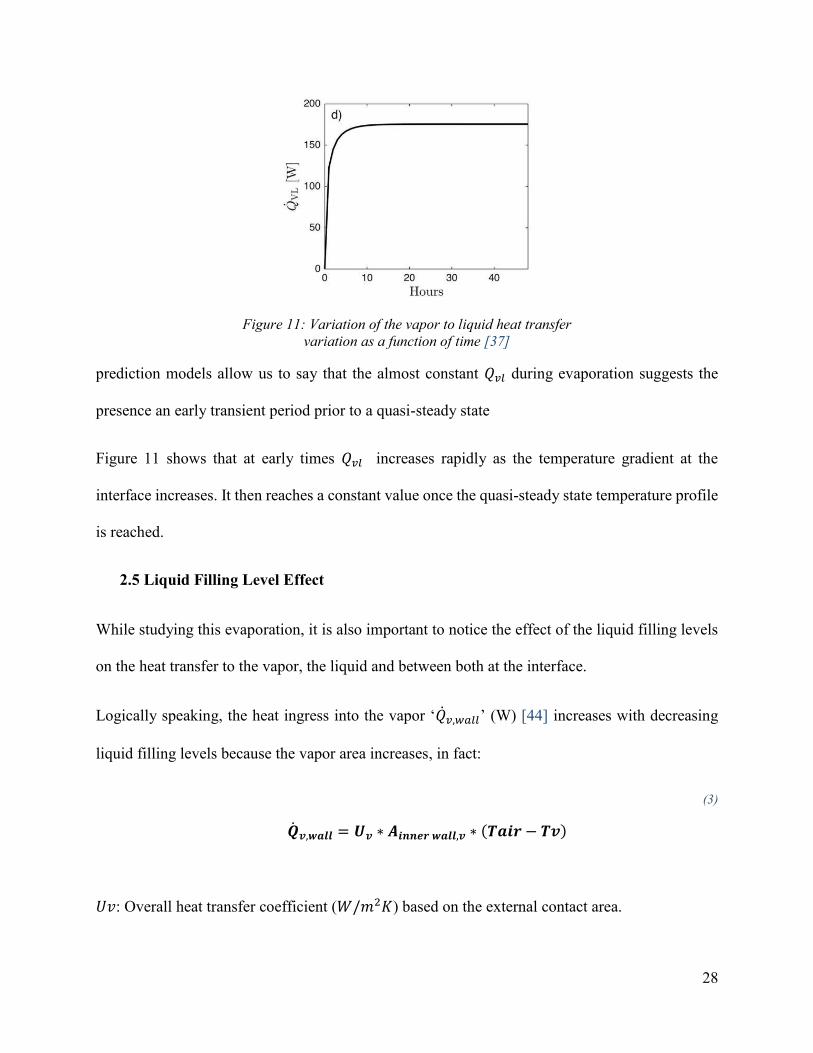
prediction models allow us to say that the almost constant 𝑄𝑣𝑙 during evaporation suggests the
presence an early transient period prior to a quasi-steady state
Figure 11 shows that at early times 𝑄𝑣𝑙 increases rapidly as the temperature gradient at the
interface increases. It then reaches a constant value once the quasi-steady state temperature profile
is reached.
2.5 Liquid Filling Level Effect
While studying this evaporation, it is also important to notice the effect of the liquid filling levels
on the heat transfer to the vapor, the liquid and between both at the interface.
Logically speaking, the heat ingress into the vapor ‘�̇�𝑣,𝑤𝑎𝑙𝑙’ (W) [44] increases with decreasing
liquid filling levels because the vapor area increases, in fact:
(3)
�̇�𝒗,𝒘𝒂𝒍𝒍 = 𝑼𝒗 ∗ 𝑨𝒊𝒏𝒏𝒆𝒓 𝒘𝒂𝒍𝒍,𝒗 ∗ (𝑻𝒂𝒊𝒓 − 𝑻𝒗)
𝑈𝑣: Overall heat transfer coefficient (𝑊/𝑚2𝐾) based on the external contact area.
Figure 11: Variation of the vapor to liquid heat transfer variation as a function of time [37]
29
𝐴𝑖𝑛𝑛𝑒𝑟 𝑤𝑎𝑙𝑙,𝑣: Area of cylinder (𝑚2) with the inner diameter of the tank and a height equivalent to
the vapor phase.
Thus for a lower liquid filling level (50% or 10%) more vapor area is available for heat transfer
compared to a higher liquid filling level (80%). Consequently, more heat transfer will induce a rise
in temperature of the vapor which will cause a heat transfer from this vapor to the LNG via the
vapor-liquid interface. So, the initial vapor to liquid heat transfer ‘𝑄𝑣𝑙’ increases with decreasing
liquid levels due to larger temperature gradients at the interface, however the variation is small
compared to the decrease of ‘𝑄𝑙’ (when the area of liquid is smaller).
To sum up, the smaller the initial liquid filling, the higher the heat transfer to the vapor, from vapor
to the liquid as well and therefore a higher BOG rate is expected.
2.6 Thermophysical Properties of Liquid Phase
The main thermo-physical properties of liquid natural gas are present as a function of LNG
temperature 𝑇𝑙. These thermos-physical properties are the specific heat capacity 𝐶𝑝,𝑙 , the
density 𝜌𝑙, the viscosity 𝜇𝑙, conductivity 𝑘𝑙, and thermal expansion coefficient 𝛽𝑙. These functions
are fitted with the data provided by the National Institute of Standards and Technology (NIST) [45]
following this equation:
(4)
𝒇(𝑻𝒍) = 𝒄𝟎 + 𝒄𝟏𝑻𝒍 + 𝒄𝟐𝑻𝒍𝟐 + 𝒄𝟑𝑻𝒍
𝟑 + 𝒄𝟒𝑻𝒍𝟒 + 𝒄𝟓𝑻𝒍
𝟓 + 𝒄𝟔𝑻𝒍𝟔
The constant coefficients in this equation are given in Table 1 below:
30
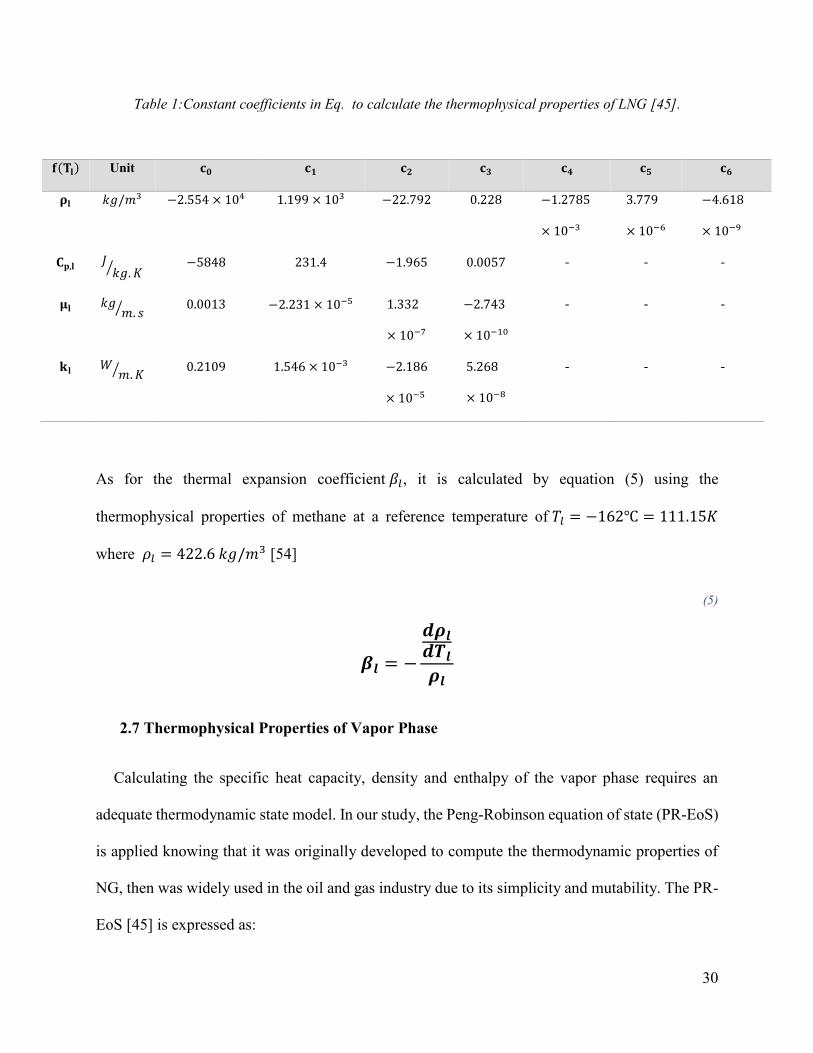
Table 1:Constant coefficients in Eq. to calculate the thermophysical properties of LNG [45].
As for the thermal expansion coefficient 𝛽𝑙, it is calculated by equation (5) using the
thermophysical properties of methane at a reference temperature of 𝑇𝑙 = −162℃ = 111.15𝐾
where 𝜌𝑙 = 422.6 𝑘𝑔/𝑚3 [54]
(5)
𝜷𝒍 = −
𝒅𝝆𝒍
𝒅𝑻𝒍
𝝆𝒍
2.7 Thermophysical Properties of Vapor Phase
Calculating the specific heat capacity, density and enthalpy of the vapor phase requires an
adequate thermodynamic state model. In our study, the Peng-Robinson equation of state (PR-EoS)
is applied knowing that it was originally developed to compute the thermodynamic properties of
NG, then was widely used in the oil and gas industry due to its simplicity and mutability. The PR-
EoS [45] is expressed as:
𝐟(𝐓𝐥) Unit 𝐜𝟎 𝐜𝟏 𝐜𝟐 𝐜𝟑 𝐜𝟒 𝐜𝟓 𝐜𝟔
𝛒𝐥 𝑘𝑔/𝑚3 −2.554 × 10⁴ 1.199 × 10³ −22.792 0.228 −1.2785
× 10−3
3.779
× 10−6
−4.618
× 10−9
𝐂𝐩,𝐥 𝐽𝑘𝑔. 𝐾⁄ −5848 231.4 −1.965 0.0057 - - -
𝛍𝐥 𝑘𝑔𝑚. 𝑠⁄ 0.0013 −2.231 × 10⁻⁵ 1.332
× 10−7
−2.743
× 10−10
- - -
𝐤𝐥 𝑊𝑚.𝐾⁄ 0.2109 1.546 × 10⁻³ −2.186
× 10−5
5.268
× 10−8
- - -
31
(6)
𝑷 =𝑹𝑻
(𝒗 − 𝒃)−
𝒂
𝒗𝟐 + 𝟐𝒃𝒗 − 𝒃𝟐
Where,
(7)
𝒂 = 𝟎. 𝟒𝟓𝟐𝟕𝟐𝟒𝑹𝒖
𝟐𝑻𝒄𝟐
𝑷𝒄[𝟏 + 𝒇𝝎 (𝟏 − 𝑻𝒓
𝟏𝟐)]
𝟐
(8)
𝒃 = 𝟎. 𝟎𝟕𝟕𝟖𝑹𝒖𝑻𝒄
𝑷𝒄
(9)
𝒇𝝎 = 𝟎. 𝟑𝟕𝟒𝟔𝟒 + 𝟏. 𝟓𝟒𝟐𝟐𝟔𝝎 − 𝟎. 𝟐𝟔𝟗𝟗𝟐𝝎𝟐
((10)
𝑻𝒓 =𝑻
𝑻𝒄
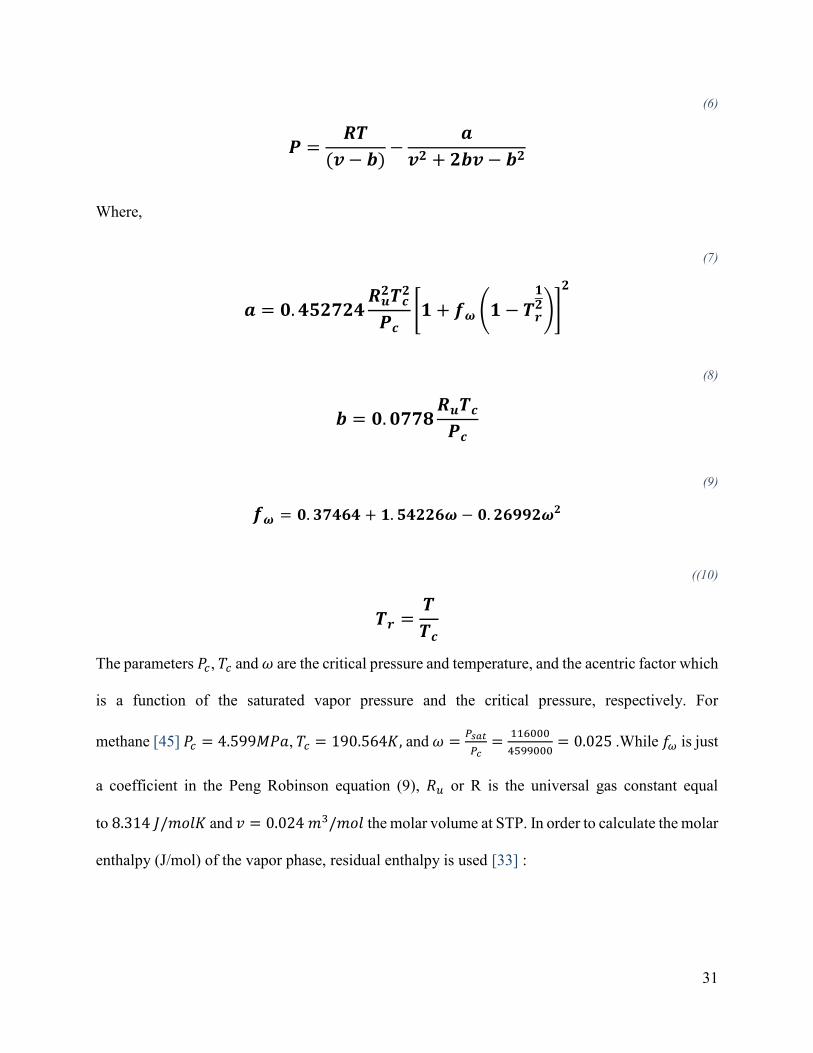
The parameters 𝑃𝑐, 𝑇𝑐 and 𝜔 are the critical pressure and temperature, and the acentric factor which
is a function of the saturated vapor pressure and the critical pressure, respectively. For
methane [45] 𝑃𝑐 = 4.599𝑀𝑃𝑎, 𝑇𝑐 = 190.564𝐾, and 𝜔 =𝑃𝑠𝑎𝑡
𝑃𝑐=
116000
4599000= 0.025 .While 𝑓𝜔 is just
a coefficient in the Peng Robinson equation (9), 𝑅𝑢 or R is the universal gas constant equal
to 8.314 𝐽/𝑚𝑜𝑙𝐾 and 𝑣 = 0.024 𝑚3/𝑚𝑜𝑙 the molar volume at STP. In order to calculate the molar
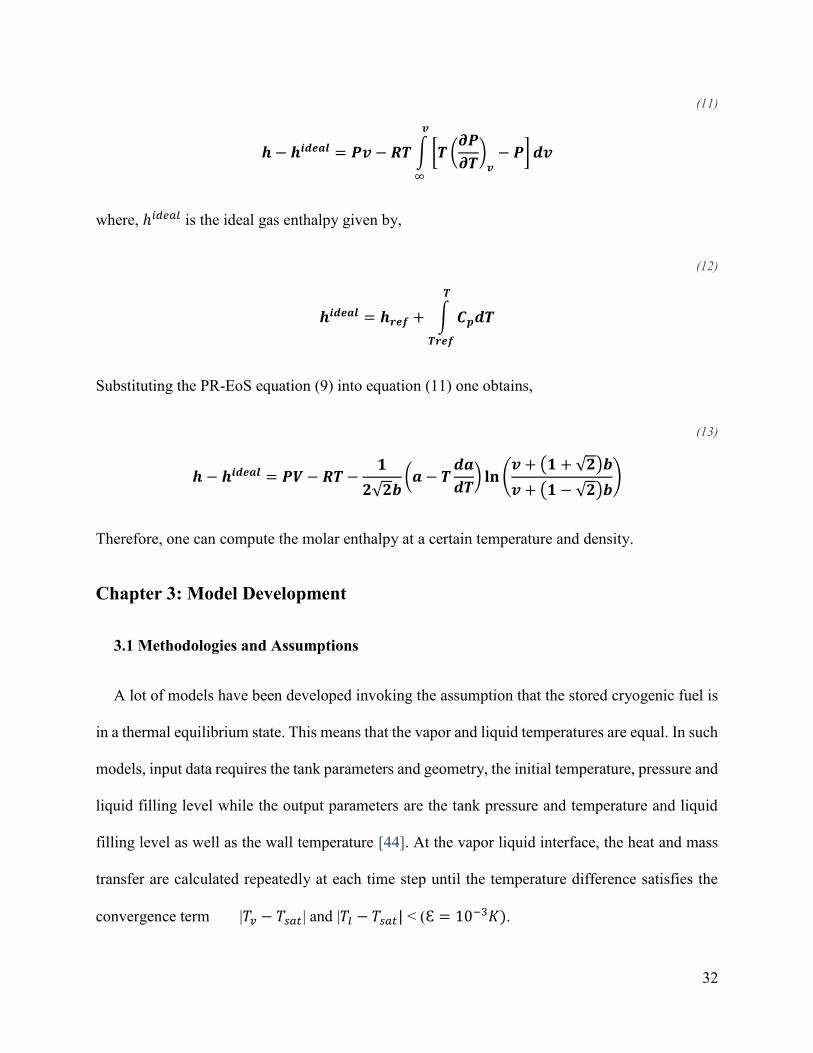
enthalpy (J/mol) of the vapor phase, residual enthalpy is used [33] :
32
(11)
𝒉 − 𝒉𝒊𝒅𝒆𝒂𝒍 = 𝑷𝒗 − 𝑹𝑻 ∫ [𝑻 (𝝏𝑷
𝝏𝑻)𝒗− 𝑷]𝒅𝒗
𝒗
∞
where, ℎ𝑖𝑑𝑒𝑎𝑙 is the ideal gas enthalpy given by,
(12)
𝒉𝒊𝒅𝒆𝒂𝒍 = 𝒉𝒓𝒆𝒇 + ∫ 𝑪𝒑𝒅𝑻
𝑻
𝑻𝒓𝒆𝒇
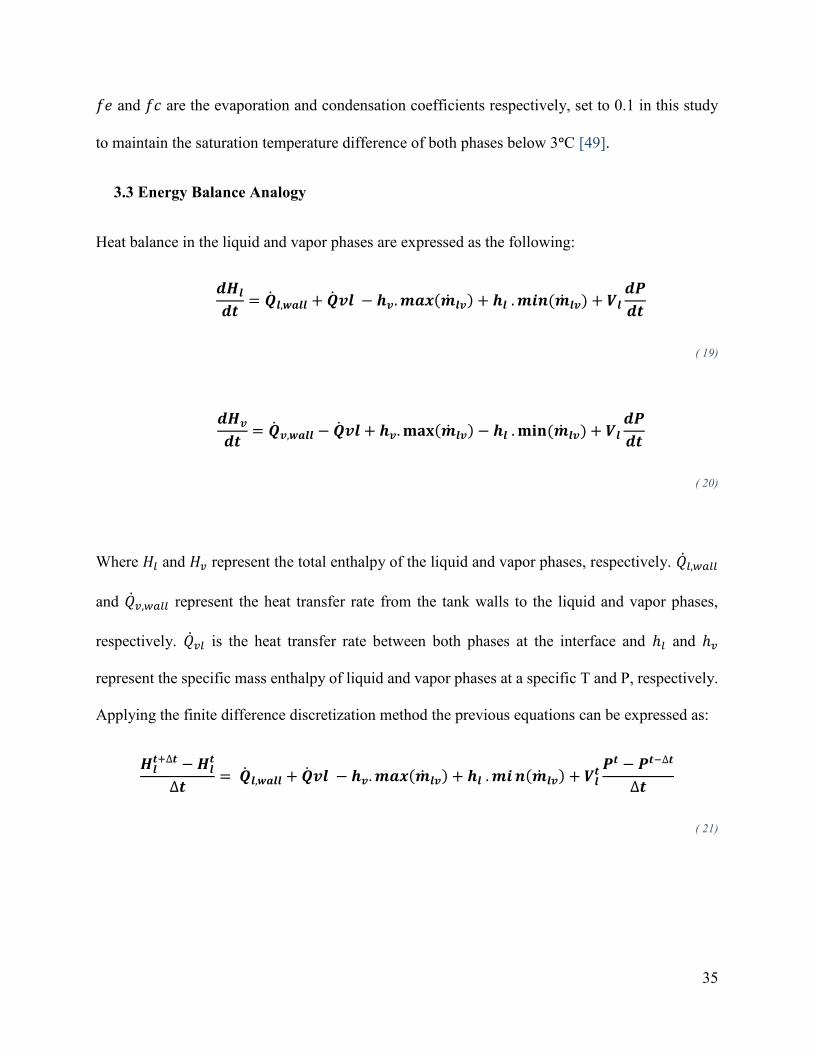
Substituting the PR-EoS equation (9) into equation (11) one obtains,
(13)
𝒉 − 𝒉𝒊𝒅𝒆𝒂𝒍 = 𝑷𝑽 − 𝑹𝑻 −𝟏
𝟐√𝟐𝒃(𝒂 − 𝑻
𝒅𝒂
𝒅𝑻) 𝐥𝐧 (
𝒗 + (𝟏 + √𝟐)𝒃
𝒗 + (𝟏 − √𝟐)𝒃)
Therefore, one can compute the molar enthalpy at a certain temperature and density.
Chapter 3: Model Development
3.1 Methodologies and Assumptions
A lot of models have been developed invoking the assumption that the stored cryogenic fuel is
in a thermal equilibrium state. This means that the vapor and liquid temperatures are equal. In such
models, input data requires the tank parameters and geometry, the initial temperature, pressure and
liquid filling level while the output parameters are the tank pressure and temperature and liquid
filling level as well as the wall temperature [44]. At the vapor liquid interface, the heat and mass
transfer are calculated repeatedly at each time step until the temperature difference satisfies the
convergence term |𝑇𝑣 − 𝑇𝑠𝑎𝑡 | and |𝑇𝑙 − 𝑇𝑠𝑎𝑡| < (Ɛ = 10−3𝐾).
33
In the non-equilibrium model, the two phases have different temperatures. While the input and
output parameters are similar to the case of equilibrium modeling, the heat and mass transfer at
the vapor liquid interface are solved once at each time step without equalizing 𝑇𝑙 and 𝑇𝑣. A non-
equilibrium model such as the one developed by Migliore et al. [41] justifies how the vapor acts
as an additional heating source where 𝑇𝑣 ≥ 𝑇𝑙, leading to an additional heat transfer at the liquid-
vapor interface 𝑄𝑣𝑙.
However, in the study developed by Wang et al. [44], where a thermodynamic non-equilibrium
model was introduced to assess the thermal performance of an LNG storage tank, results proved
that both equilibrium and non-equilibrium models have the same accuracy into predicting the
variation of pressure and temperature in vertical and horizontal LNG tanks. Furthermore, as
previously mentioned in section 2.4, the study developed by Felipe Huerta and Velisa Vesovic [37]
shows that 𝑄𝑣𝑙 only contributed to 0.01% of the heat ingress which can be considered negligible
for an almost full tank, in our case 80% liquid filling level.
For this reason, our study will treat the stored LNG as a fuel being under a thermal equilibrium
state where vapor and liquid temperatures are equal for the 80% filling level whereas a non-
equilibrium approach for the other 2 filling levels will be used.
3.2 Mass Balance Analogy
The change in the masses of liquid and vapor natural gas can be attributed to the evaporation
and condensation phenomena happening at the vapor liquid interface and can be calculated using
�̇�𝒍𝒗 = (�̇�𝒆𝒗𝒂𝒑′′′ − �̇�𝒄𝒐𝒏𝒅
′′′ )𝑽 [kg/s]
( 14)

34
where V represents the liquid and vapor volumes involved in the evaporation and condensation
processes and is found by this equation
𝑽 = 𝑺𝒊𝒏𝒕𝒆𝒓𝒇𝒂𝒄𝒆. 𝜹
( 15)
where, 𝑺𝒊𝒏𝒕𝒆𝒓𝒇𝒂𝒄𝒆 is the area (𝑚2) of the liquid and 𝜹 (m) the vapor thickness that are both affected
during the evaporation and condensation. For our work, the thickness of the vapor is considered to
be 0.005 m according to experiments conducted by Beduz and Scurlock [47].
In order to evaluate the evaporation and condensation rates at the liquid vapor interface with
respect to 𝑇𝑠𝑎𝑡 the saturation temperature, the Lee model [48] is applied. The saturation
temperature being the temperature at which the liquid evaporates for a corresponding saturation
pressure, the two of them being related using Antoine equation:
𝐥𝐨𝐠 (𝑷
𝟏𝟎𝟓) = 𝑨𝟏 −
𝑩𝟏
𝑪𝟏 + 𝑻𝒔𝒂𝒕
( 16)
𝐴1, 𝐵1 𝑎𝑛𝑑 𝐶1 are methane specific coefficients equal to 3.9895, 443.028 and -0.49
respectively [46].
If 𝑇𝑙 > 𝑇𝑠𝑎𝑡 then �̇�𝒆𝒗𝒂𝒑 = 𝒇𝒆. 𝝆𝒍.𝑻𝒍−𝑻𝒔𝒂𝒕
𝑻𝒔𝒂𝒕 [𝒌𝒈/(𝒎𝟑 𝒔)]
( 17)
If 𝑇𝑣 < 𝑇𝑠𝑎𝑡 then �̇�𝒄𝒐𝒏𝒅 = 𝒇𝒄. 𝝆𝒗.𝑻𝒔𝒂𝒕−𝑻𝒍
𝑻𝒔𝒂𝒕 [𝒌𝒈/(𝒎𝟑 𝒔)]
( 18)
35
𝑓𝑒 and 𝑓𝑐 are the evaporation and condensation coefficients respectively, set to 0.1 in this study
to maintain the saturation temperature difference of both phases below 3ᵒC [49].
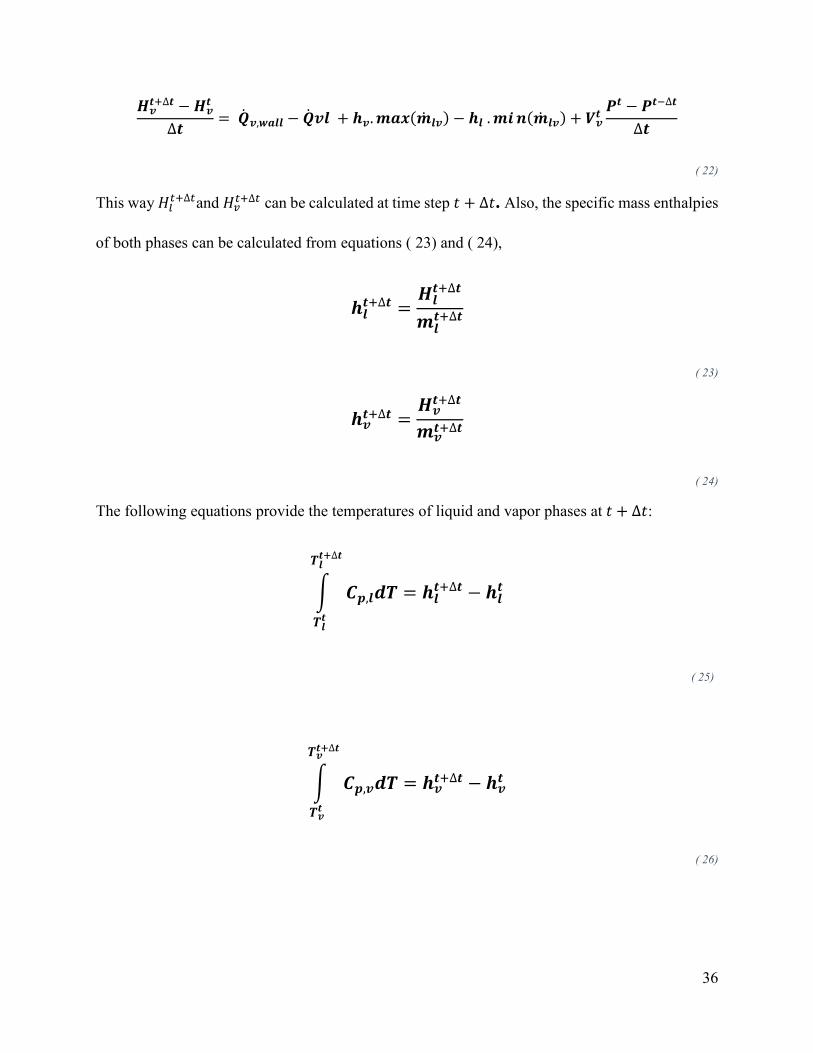
3.3 Energy Balance Analogy
Heat balance in the liquid and vapor phases are expressed as the following:
𝒅𝑯𝒍
𝒅𝒕= �̇�𝒍,𝒘𝒂𝒍𝒍 + �̇�𝒗𝒍 − 𝒉𝒗.𝒎𝒂𝒙(�̇�𝒍𝒗) + 𝒉𝒍 .𝒎𝒊𝒏 (�̇�𝒍𝒗) + 𝑽𝒍
𝒅𝑷
𝒅𝒕
( 19)
𝒅𝑯𝒗
𝒅𝒕= �̇�𝒗,𝒘𝒂𝒍𝒍 − �̇�𝒗𝒍 + 𝒉𝒗.𝐦𝐚𝐱(�̇�𝒍𝒗) − 𝒉𝒍 .𝐦𝐢𝐧 (�̇�𝒍𝒗) + 𝑽𝒍
𝒅𝑷
𝒅𝒕
( 20)
Where 𝐻𝑙 and 𝐻𝑣 represent the total enthalpy of the liquid and vapor phases, respectively. �̇�𝑙,𝑤𝑎𝑙𝑙
and �̇�𝑣,𝑤𝑎𝑙𝑙 represent the heat transfer rate from the tank walls to the liquid and vapor phases,
respectively. �̇�𝑣𝑙 is the heat transfer rate between both phases at the interface and ℎ𝑙 and ℎ𝑣
represent the specific mass enthalpy of liquid and vapor phases at a specific T and P, respectively.
Applying the finite difference discretization method the previous equations can be expressed as:
𝑯𝒍𝒕+∆𝒕 − 𝑯𝒍
𝒕
∆𝒕= �̇�𝒍,𝒘𝒂𝒍𝒍 + �̇�𝒗𝒍 − 𝒉𝒗.𝒎𝒂𝒙(�̇�𝒍𝒗) + 𝒉𝒍 . 𝒎𝒊𝒏(�̇�𝒍𝒗) + 𝑽𝒍
𝒕 𝑷𝒕 − 𝑷𝒕−∆𝒕
∆𝒕
( 21)
36
𝑯𝒗𝒕+∆𝒕 − 𝑯𝒗
𝒕
∆𝒕= �̇�𝒗,𝒘𝒂𝒍𝒍 − �̇�𝒗𝒍 + 𝒉𝒗.𝒎𝒂𝒙(�̇�𝒍𝒗) − 𝒉𝒍 .𝒎𝒊𝒏(�̇�𝒍𝒗) + 𝑽𝒗
𝒕𝑷𝒕 − 𝑷𝒕−∆𝒕
∆𝒕
( 22)
This way 𝐻𝑙𝑡+∆𝑡and 𝐻𝑣
𝑡+∆𝑡 can be calculated at time step 𝑡 + ∆𝑡. Also, the specific mass enthalpies
of both phases can be calculated from equations ( 23) and ( 24),
𝒉𝒍𝒕+∆𝒕 =
𝑯𝒍𝒕+∆𝒕
𝒎𝒍𝒕+∆𝒕
( 23)
𝒉𝒗𝒕+∆𝒕 =
𝑯𝒗𝒕+∆𝒕
𝒎𝒗𝒕+∆𝒕
( 24)
The following equations provide the temperatures of liquid and vapor phases at 𝑡 + ∆𝑡:
∫ 𝑪𝒑,𝒍𝒅𝑻
𝑻𝒍𝒕+∆𝒕
𝑻𝒍𝒕
= 𝒉𝒍𝒕+∆𝒕 − 𝒉𝒍
𝒕
( 25)
∫ 𝑪𝒑,𝒗𝒅𝑻
𝑻𝒗𝒕+∆𝒕
𝑻𝒗𝒕
= 𝒉𝒗𝒕+∆𝒕 − 𝒉𝒗
𝒕
( 26)
37
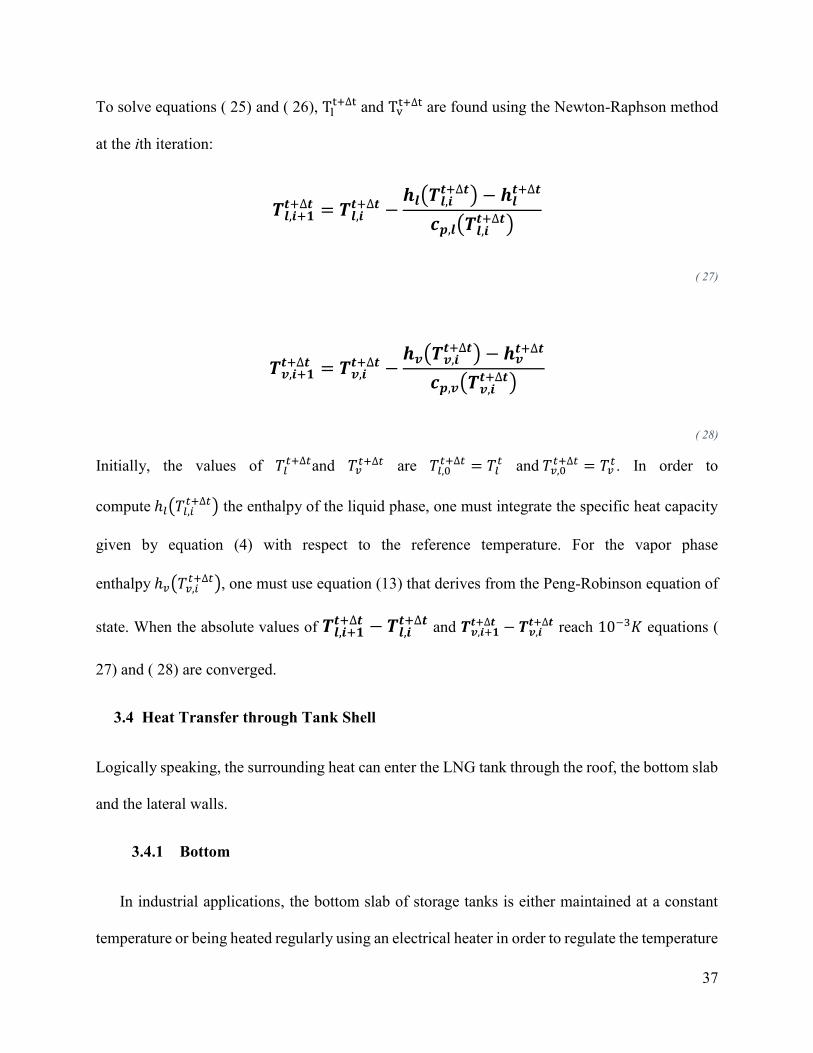
To solve equations ( 25) and ( 26), Tlt+∆t and Tv
t+∆t are found using the Newton-Raphson method
at the ith iteration:
𝑻𝒍,𝒊+𝟏𝒕+∆𝒕 = 𝑻𝒍,𝒊
𝒕+∆𝒕 −𝒉𝒍(𝑻𝒍,𝒊
𝒕+∆𝒕) − 𝒉𝒍𝒕+∆𝒕
𝒄𝒑,𝒍(𝑻𝒍,𝒊𝒕+∆𝒕)
( 27)
𝑻𝒗,𝒊+𝟏𝒕+∆𝒕 = 𝑻𝒗,𝒊
𝒕+∆𝒕 −𝒉𝒗(𝑻𝒗,𝒊
𝒕+∆𝒕) − 𝒉𝒗𝒕+∆𝒕
𝒄𝒑,𝒗(𝑻𝒗,𝒊𝒕+∆𝒕)
( 28)
Initially, the values of 𝑇𝑙𝑡+∆𝑡and 𝑇𝑣
𝑡+∆𝑡 are 𝑇𝑙,0𝑡+∆𝑡 = 𝑇𝑙
𝑡 and 𝑇𝑣,0𝑡+∆𝑡 = 𝑇𝑣
𝑡. In order to
compute ℎ𝑙(𝑇𝑙,𝑖𝑡+∆𝑡) the enthalpy of the liquid phase, one must integrate the specific heat capacity
given by equation (4) with respect to the reference temperature. For the vapor phase
enthalpy ℎ𝑣(𝑇𝑣,𝑖𝑡+∆𝑡), one must use equation (13) that derives from the Peng-Robinson equation of
state. When the absolute values of 𝑻𝒍,𝒊+𝟏𝒕+∆𝒕 − 𝑻𝒍,𝒊
𝒕+∆𝒕 and 𝑻𝒗,𝒊+𝟏𝒕+∆𝒕 − 𝑻𝒗,𝒊
𝒕+∆𝒕 reach 10−3𝐾 equations (
27) and ( 28) are converged.
3.4 Heat Transfer through Tank Shell
Logically speaking, the surrounding heat can enter the LNG tank through the roof, the bottom slab
and the lateral walls.
3.4.1 Bottom
In industrial applications, the bottom slab of storage tanks is either maintained at a constant
temperature or being heated regularly using an electrical heater in order to regulate the temperature
38
and prevent ground freezing. Thus, in this study, the heat transfer through the bottom is taking
place with a constant feeding temperature equal to the surrounding one 𝑇𝑏𝑜𝑡𝑡𝑜𝑚 =
𝑇𝑜,𝑏𝑜𝑡𝑡𝑜𝑚 𝑤𝑎𝑙𝑙,𝑙 = 298.15𝐾. Also, insulating materials of the tank bottom must have a load bearing
capacity as well as suitable thermal properties. To enhance the thermal resistance, a thin layer of
plywood and sand is installed between the main insulation and the nickel steel tank. Details
concerning the thickness and thermal conductivity of the insulation materials covering the bottom
of tank are explained in chapter 4 Table 3. The inner bottom wall temperature is assumed to
be 𝑇𝑖,𝑏𝑜𝑡𝑡𝑜𝑚 𝑤𝑎𝑙𝑙,𝑙 = 123.2𝐾, which is convenient for a tank with insulations having low thermal
conductivities as in the case of the non-equilibrium thermodynamic model studied by Wang et
al.[44].
3.4.2 Roof
As for the roof, the inner face of the concrete part is not in direct contact with the cryogenic
atmosphere. This is due to the presence of the suspended deck along with its insulation. Therefore,
predicting the inner face temperature of the roof requires one of 2 alternatives either considering a
conduction-radiation-conduction approach (radiation taking place between the roof hangers) or a
pure conduction approach neglecting the radiation effect. In both cases, the inner roof section is
separated from the rest of the tank by a suspended deck followed by several insulating materials
(see Table 3), and 𝑇𝑜,𝑟𝑜𝑜𝑓 𝑤𝑎𝑙𝑙 = 298.15𝐾 while the inner roof temperature is assumed to
be 𝑇𝑖,𝑟𝑜𝑜𝑓 𝑤𝑎𝑙𝑙,𝑣 = 123.2𝐾 equal to the inner wall temperature [44].
3.4.3 Walls
The heat ingress through the tank shell is also assigned to the one entering through the tank
walls to the liquid and vapor phases from the environment. Assuming no heat is accumulated in

39
the tank wall, conjugate heat transfer can be neglected. Usual industrial performance requires to
precondition the inner wall before filling the LNG until the wall temperature reaches a constant
value [50]. In the preconditioning process the tank’s outer wall is on direct contact with air, thus
steady state heat transfer in the tank wall occurs and neglecting conjugate heat transfer will lead
to a slight overestimation of the heat entrance to the vapor phase. For this reason, it is better to
consider that heat enters the outer wall by natural convection from air at first, then goes through
the insulation materials in the radial direction by conduction until reaching the inner wall. In the
end, natural convection takes place and heat is transferred to the two phases. As convection and
conduction mechanisms are both present, the heat transfer mechanism can be seen in Figure 13,
the heat transfer rate through the walls can be expressed by using an equivalent resistance-
capacitance network.
The resistance-capacitance network can be solved using Kirchhoff’s circuit law approach [52].
Thus the outer wall temperature of the tank in contact with the liquid and vapor phases at time 𝑡 +
∆𝑡 can be expressed as,
Figure 13 Heat transfer from environment to liquid and vapor phases through tank wall
Figure 12 Heat Transfer from the Environment to Liquid and Vapor Phases through Tank Wall

40
𝑇𝑜,𝑣𝑡+∆𝑡 =
(𝑇0,𝑣
𝑡
∆𝑡 )𝐶1 +𝑇𝑎𝑖𝑟
𝑅1+
𝑇𝑖,𝑣𝑡+∆𝑡
𝑅2+
𝑇𝑜,𝑟𝑜𝑜𝑓,𝑣𝑡
𝑅3+
𝑇𝑜,𝑙𝑡
𝑅4
𝐶1
∆𝑡+
1𝑅1
+1𝑅2
+1𝑅3
+1𝑅4
( 29)
𝑇𝑜,𝑙𝑡+∆𝑡 =
(𝑇0,𝑙
𝑡
∆𝑡 )𝐶2 +𝑇𝑎𝑖𝑟
𝑅5+
𝑇𝑖,𝑙𝑡+∆𝑡
𝑅6+
𝑇𝑜,𝑏𝑜𝑡𝑡𝑜𝑚,𝑙𝑡
𝑅7+
𝑇𝑜,𝑙𝑡
𝑅4
𝐶2
∆𝑡+
1𝑅5
+1𝑅6
+1𝑅7
+1𝑅4
( 30)
Then, the inner wall temperatures in contact with the two phases can be explicitly calculated as,
𝑇𝑖,𝑣𝑡+∆𝑡 =
(𝑇𝑖,𝑣
𝑡
∆𝑡 )𝐶3 +𝑇𝑜,𝑣
𝑡+∆𝑡
𝑅2+
𝑇𝑣𝑡
𝑅8+
𝑇𝑖,𝑟𝑜𝑜𝑓,𝑣𝑡
𝑅9+
𝑇𝑖,𝑙𝑡
𝑅10
𝐶3
∆𝑡+
1𝑅2
+1𝑅8
+1𝑅9
+1
𝑅10
( 31)
𝑇𝑖,𝑙𝑡+∆𝑡 =
(𝑇𝑖,𝑙
𝑡
∆𝑡)𝐶4 +
𝑇𝑜,𝑙𝑡+∆𝑡
𝑅6+
𝑇𝑙𝑡
𝑅11+
𝑇𝑖,𝑏𝑜𝑡𝑡𝑜𝑚,𝑙𝑡
𝑅12+
𝑇𝑖,𝑣𝑡
𝑅10
𝐶4
∆𝑡+
1𝑅2
+1
𝑅11+
1𝑅12
+1
𝑅10
( 32)
Heat transfer rates from the surroundings to the vapor and liquid phases of the tank walls are
computed following equations ( 33) and ( 34). The summation of these two provides the total heat
transfer rate to the tank

41
�̇�𝑣,𝑤𝑎𝑙𝑙 =𝑇𝑖,𝑟𝑜𝑜𝑓,𝑣 − 𝑇𝑣
𝑅13+
𝑇𝑖,𝑣 − 𝑇𝑣
𝑅8
( 33)
�̇�𝑙,𝑤𝑎𝑙𝑙 =𝑇𝑖,𝑏𝑜𝑡𝑡𝑜𝑚,𝑙 − 𝑇𝑙
𝑅14+
𝑇𝑖,𝑙 − 𝑇𝑙
𝑅11
( 34)
The details of the thermal resistance-capacitance scheme shown in are present in appendices
3.5 Heat transfer rate at the liquid vapor interface
For calculation purposes, a natural convection heat transfer across the interphase has been assumed
and is found by
�̇�𝑣𝑙 = ℎ𝑣𝑙,𝑖𝑛𝑡𝑒𝑟𝑓𝑎𝑐𝑒(𝑇𝑣 − 𝑇𝑙)𝐴𝑖𝑛𝑡𝑒𝑟𝑓𝑎𝑐𝑒
( 35)
A rigorous CFD simulation of an LNG storage tank presented by Saleem et al. [28] in 2018
where an extensive investigation has been made that takes into account internal flow dynamics
and complex boiling phenomena that occur in an LNG tank, a steady state interfacial heat transfer
coefficient was estimated to be 4 𝑊/𝑚2𝐾 which will be used in our study.
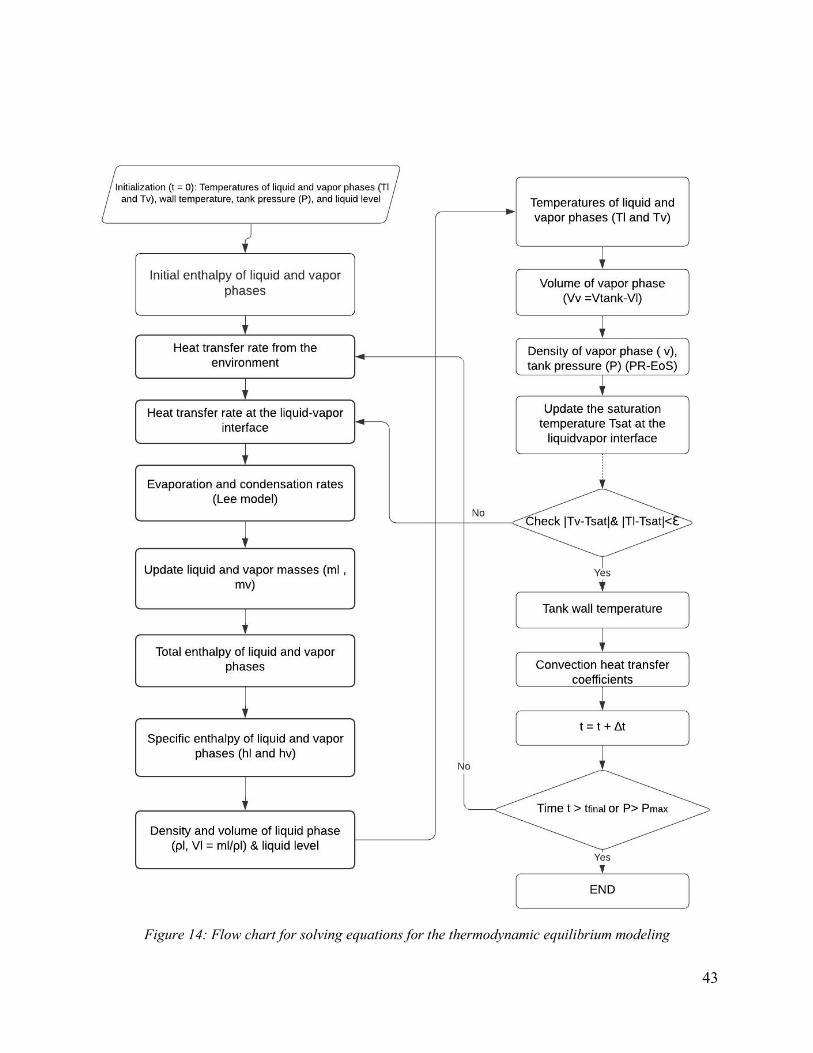
To better understand the algorithm of solving the previously mentioned equations for the
assumed thermal equilibrium state, Figure 14 presents a chart describing the flow of equations that
are solved using Excel and Matlab. This flow chart has been taken from a non-equilibirum
thermodynamic study on an LNG tank [44] and adapted to our study. The input parameters to this
model involve the tank geometry and parameters that will be furtherly cited in Chapter 4, along

42
with the initial temperature and pressure of LNG tank. Also the LNG level in the tank will be set
as an input parameter and will be altered between 80%, 50% and 10% liquid filling level.
43
Figure 14: Flow chart for solving equations for the thermodynamic equilibrium modeling
44
Chapter 4: Case Study
4.1 Tank Parameters and Materials
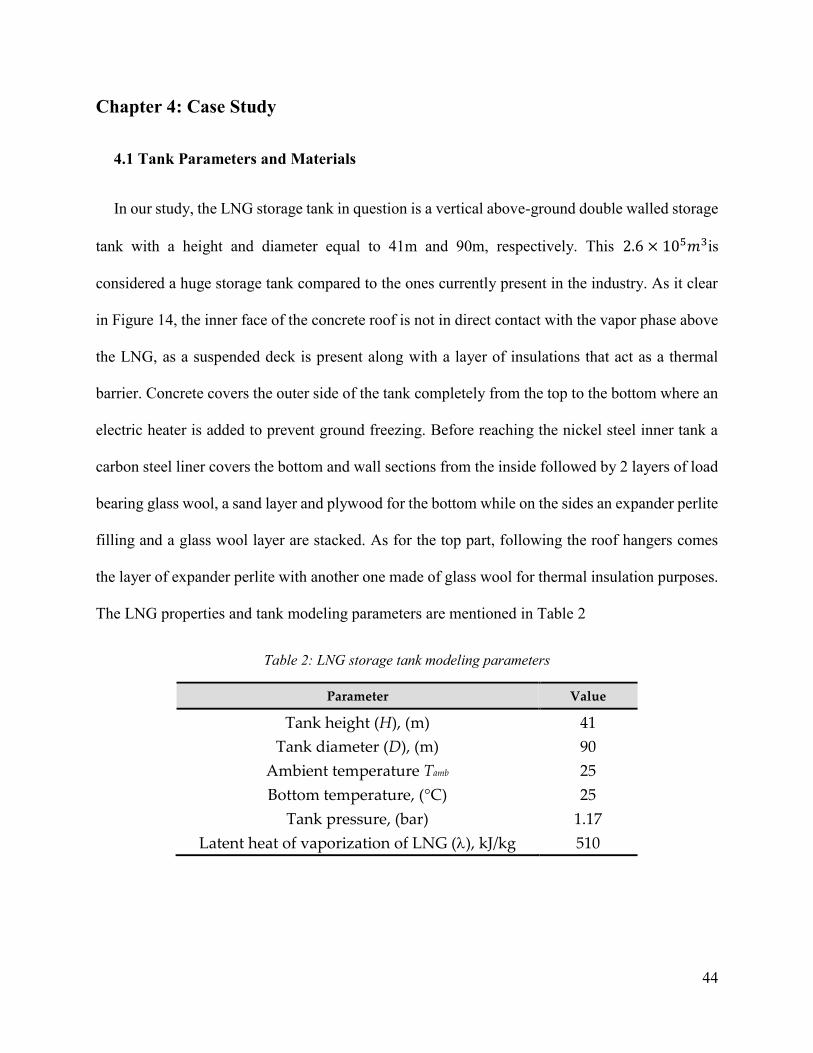
In our study, the LNG storage tank in question is a vertical above-ground double walled storage
tank with a height and diameter equal to 41m and 90m, respectively. This 2.6 × 10⁵𝑚3is
considered a huge storage tank compared to the ones currently present in the industry. As it clear
in Figure 14, the inner face of the concrete roof is not in direct contact with the vapor phase above
the LNG, as a suspended deck is present along with a layer of insulations that act as a thermal
barrier. Concrete covers the outer side of the tank completely from the top to the bottom where an
electric heater is added to prevent ground freezing. Before reaching the nickel steel inner tank a
carbon steel liner covers the bottom and wall sections from the inside followed by 2 layers of load
bearing glass wool, a sand layer and plywood for the bottom while on the sides an expander perlite
filling and a glass wool layer are stacked. As for the top part, following the roof hangers comes
the layer of expander perlite with another one made of glass wool for thermal insulation purposes.
The LNG properties and tank modeling parameters are mentioned in Table 2
Table 2: LNG storage tank modeling parameters
Parameter Value
Tank height (H), (m) 41
Tank diameter (D), (m) 90
Ambient temperature Tamb 25
Bottom temperature, (°C) 25
Tank pressure, (bar) 1.17
Latent heat of vaporization of LNG (), kJ/kg 510
45
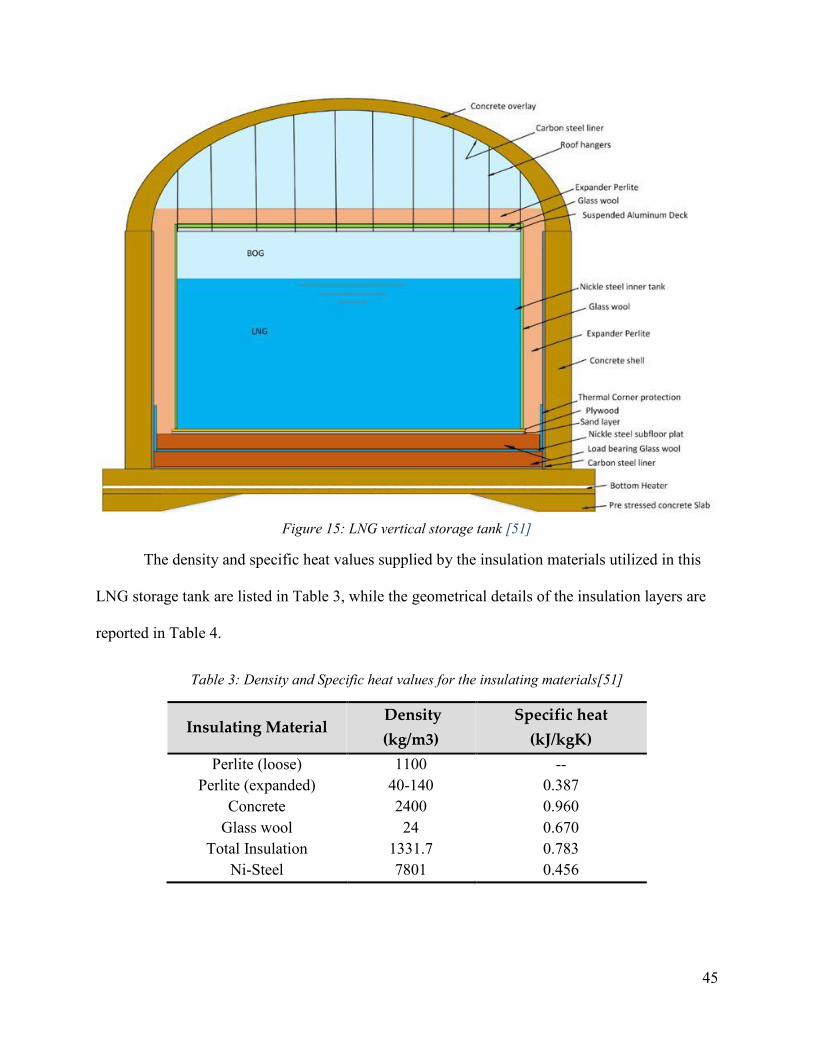
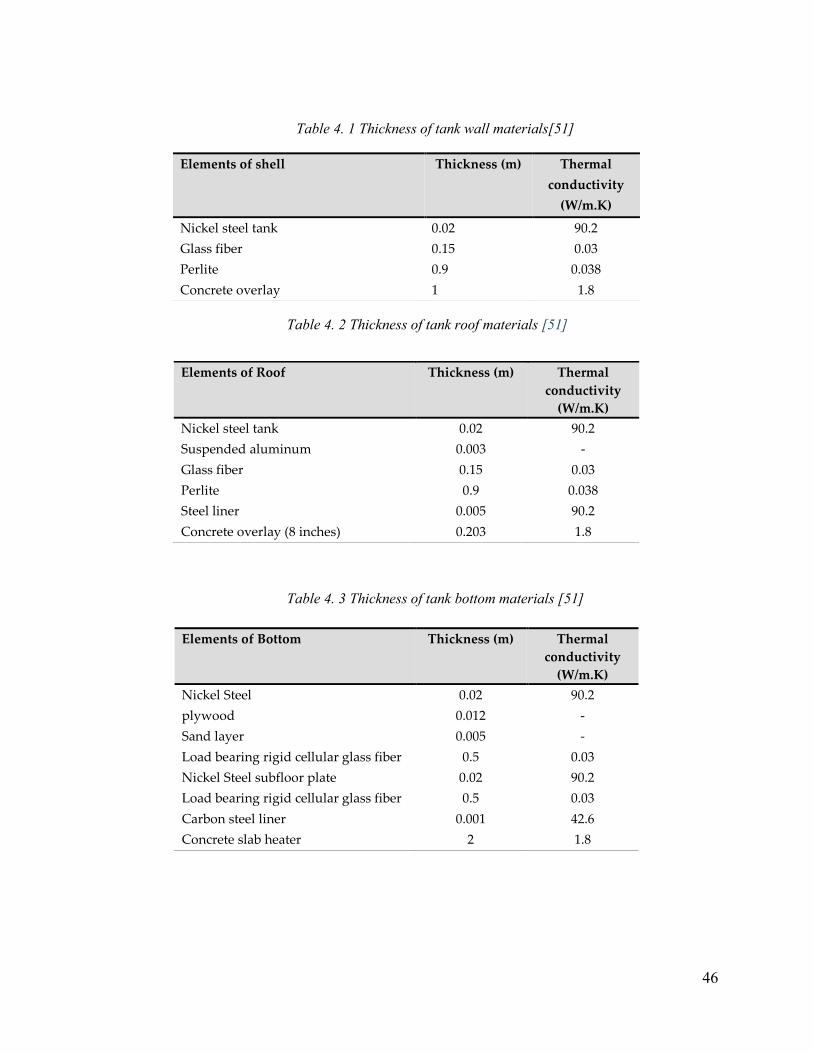
The density and specific heat values supplied by the insulation materials utilized in this
LNG storage tank are listed in Table 3, while the geometrical details of the insulation layers are
reported in Table 4.
Table 3: Density and Specific heat values for the insulating materials[51]
Insulating Material Density
(kg/m3)
Specific heat
(kJ/kgK)
Perlite (loose) 1100 -- Perlite (expanded) 40-140 0.387
Concrete 2400 0.960 Glass wool 24 0.670
Total Insulation 1331.7 0.783 Ni-Steel 7801 0.456
Figure 15: LNG vertical storage tank [51]
46
Elements of shell Thickness (m) Thermal
conductivity
(W/m.K)
Nickel steel tank 0.02 90.2
Glass fiber 0.15 0.03
Perlite 0.9 0.038
Concrete overlay 1 1.8
Table 4. 1 Thickness of tank wall materials[51]
Elements of Roof Thickness (m) Thermal
conductivity
(W/m.K)
Nickel steel tank 0.02 90.2
Suspended aluminum 0.003 -
Glass fiber 0.15 0.03
Perlite 0.9 0.038
Steel liner 0.005 90.2
Concrete overlay (8 inches) 0.203 1.8
Elements of Bottom Thickness (m) Thermal
conductivity
(W/m.K)
Nickel Steel 0.02 90.2
plywood 0.012 -
Sand layer 0.005 -
Load bearing rigid cellular glass fiber 0.5 0.03
Nickel Steel subfloor plate 0.02 90.2
Load bearing rigid cellular glass fiber 0.5 0.03
Carbon steel liner 0.001 42.6
Concrete slab heater 2 1.8
Table 4. 3 Thickness of tank bottom materials [51]
Table 4. 2 Thickness of tank roof materials [51]
47
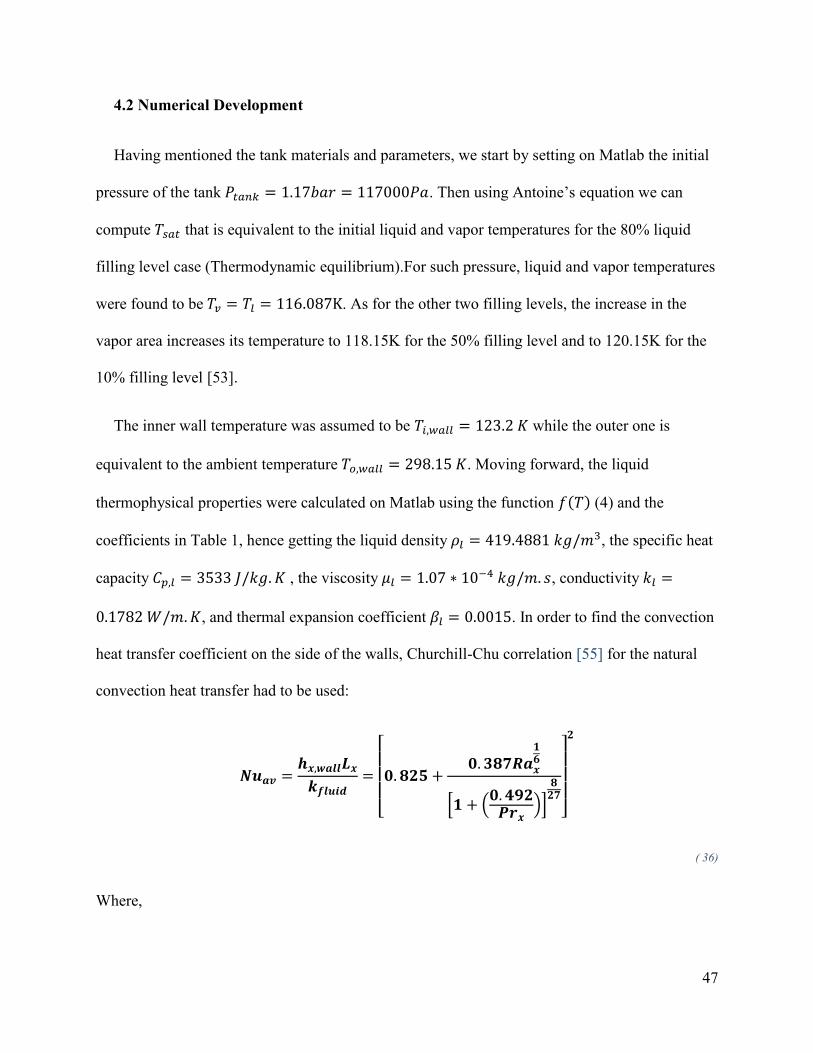
4.2 Numerical Development
Having mentioned the tank materials and parameters, we start by setting on Matlab the initial
pressure of the tank 𝑃𝑡𝑎𝑛𝑘 = 1.17𝑏𝑎𝑟 = 117000𝑃𝑎. Then using Antoine’s equation we can
compute 𝑇𝑠𝑎𝑡 that is equivalent to the initial liquid and vapor temperatures for the 80% liquid
filling level case (Thermodynamic equilibrium).For such pressure, liquid and vapor temperatures
were found to be 𝑇𝑣 = 𝑇𝑙 = 116.087K. As for the other two filling levels, the increase in the
vapor area increases its temperature to 118.15K for the 50% filling level and to 120.15K for the
10% filling level [53].
The inner wall temperature was assumed to be 𝑇𝑖,𝑤𝑎𝑙𝑙 = 123.2 𝐾 while the outer one is
equivalent to the ambient temperature 𝑇𝑜,𝑤𝑎𝑙𝑙 = 298.15 𝐾. Moving forward, the liquid
thermophysical properties were calculated on Matlab using the function 𝑓(𝑇) (4) and the
coefficients in Table 1, hence getting the liquid density 𝜌𝑙 = 419.4881 𝑘𝑔/𝑚3, the specific heat
capacity 𝐶𝑝,𝑙 = 3533 𝐽/𝑘𝑔. 𝐾 , the viscosity 𝜇𝑙 = 1.07 ∗ 10−4 𝑘𝑔/𝑚. 𝑠, conductivity 𝑘𝑙 =
0.1782 𝑊/𝑚.𝐾, and thermal expansion coefficient 𝛽𝑙 = 0.0015. In order to find the convection
heat transfer coefficient on the side of the walls, Churchill-Chu correlation [55] for the natural
convection heat transfer had to be used:
𝑵𝒖𝒂𝒗 =𝒉𝒙,𝒘𝒂𝒍𝒍𝑳𝒙
𝒌𝒇𝒍𝒖𝒊𝒅=
[
𝟎. 𝟖𝟐𝟓 +𝟎. 𝟑𝟖𝟕𝑹𝒂𝒙
𝟏𝟔
[𝟏 + (𝟎. 𝟒𝟗𝟐𝑷𝒓𝒙
)]
𝟖𝟐𝟕
] 𝟐
( 36)
Where,

48
𝑹𝒂𝒙 =𝒈𝜷𝒇∆𝑻𝒙𝑳𝒙
𝜶𝒇𝒗𝒇
( 37)
𝑷𝒓𝒙 =𝒗𝒇
𝜶𝒇
( 38)
In equations ( 36) and ( 37), 𝒙 is the increment that represents the different parts of the wall. This
is more explained in the Table 4
Table 4: Variables in the calculation of the convection transfer coefficients on the wall.
x Fluid 𝑳𝒙(m) ∆𝑻𝒙(K) 𝑻𝒓𝒆𝒇(K)
Outer wall,v Air Length of outer wall (vapor part)
𝑇𝑎𝑖𝑟 − 𝑇𝑜,𝑤𝑎𝑙𝑙,𝑣 0.5(𝑇𝑎𝑖𝑟 + 𝑇𝑜,𝑤𝑎𝑙𝑙,𝑣)
Outer wall,l Air Length of outer wall (liquid part)
𝑇𝑎𝑖𝑟 − 𝑇𝑜,𝑤𝑎𝑙𝑙,𝑙 0.5(𝑇𝑎𝑖𝑟 + 𝑇𝑜,𝑤𝑎𝑙𝑙,𝑙)
Inner wall,v Vapor phase Length of inner wall (vapor part)
𝑇𝑖,𝑤𝑎𝑙𝑙,𝑣 − 𝑇𝑣 0.5(𝑇𝑖,𝑤𝑎𝑙𝑙,𝑣 + 𝑇𝑣)
Inner wall,l Liquid phase Length of inner wall (liquid part)
𝑇𝑖,𝑤𝑎𝑙𝑙,𝑙 − 𝑇𝑙 0.5(𝑇𝑖,𝑤𝑎𝑙𝑙,𝑙 + 𝑇𝑙)
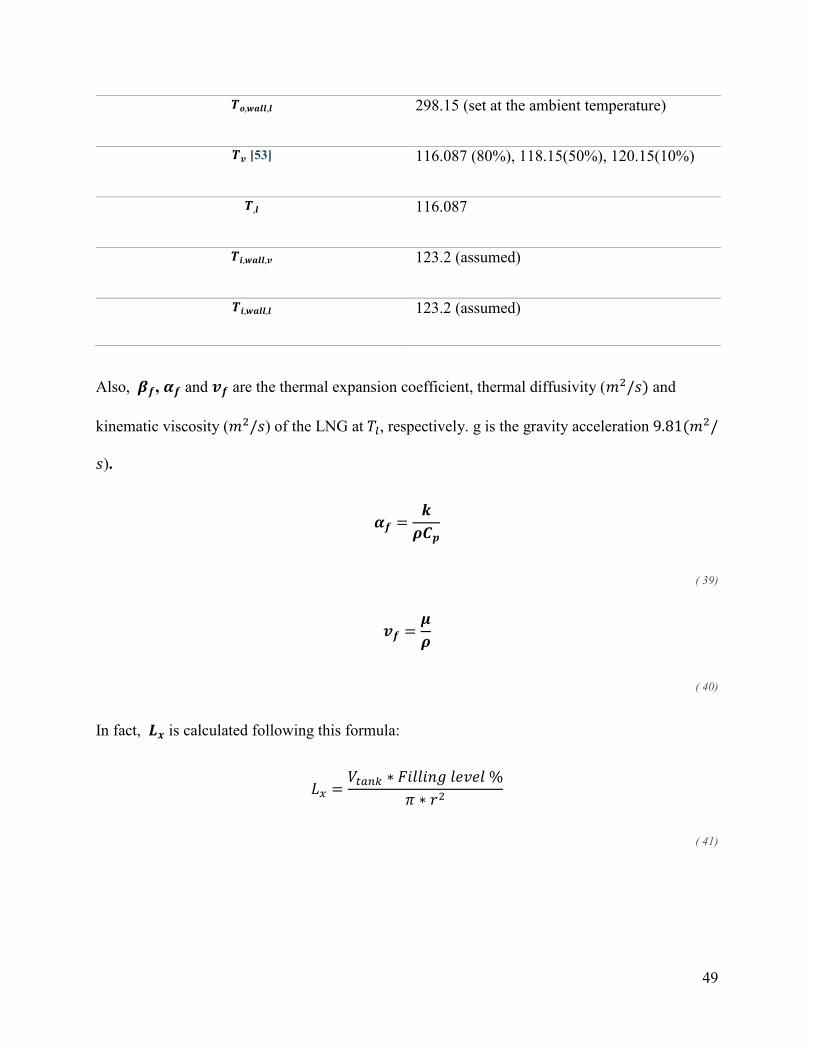
Table 5: Summary of the different initial temperatures
Temperatures (K)
𝑻𝒂𝒊𝒓 298.15 (given)
𝑻𝒐,𝒘𝒂𝒍𝒍,𝒗 298.15 (set at the ambient temperature)
49
Also, 𝜷𝒇, 𝜶𝒇 and 𝒗𝒇 are the thermal expansion coefficient, thermal diffusivity (𝑚2/𝑠) and
kinematic viscosity (𝑚2/𝑠) of the LNG at 𝑇𝑙, respectively. g is the gravity acceleration 9.81(𝑚2/
𝑠).
𝜶𝒇 =𝒌
𝝆𝑪𝒑
( 39)
𝒗𝒇 =𝝁
𝝆
( 40)
In fact, 𝑳𝒙 is calculated following this formula:
𝐿𝑥 =𝑉𝑡𝑎𝑛𝑘 ∗ 𝐹𝑖𝑙𝑙𝑖𝑛𝑔 𝑙𝑒𝑣𝑒𝑙 %
𝜋 ∗ 𝑟2
( 41)
𝑻𝒐,𝒘𝒂𝒍𝒍,𝒍 298.15 (set at the ambient temperature)
𝑻𝒗 [53] 116.087 (80%), 118.15(50%), 120.15(10%)
𝑻,𝒍 116.087
𝑻𝒊,𝒘𝒂𝒍𝒍,𝒗 123.2 (assumed)
𝑻𝒊,𝒘𝒂𝒍𝒍,𝒍 123.2 (assumed)
50
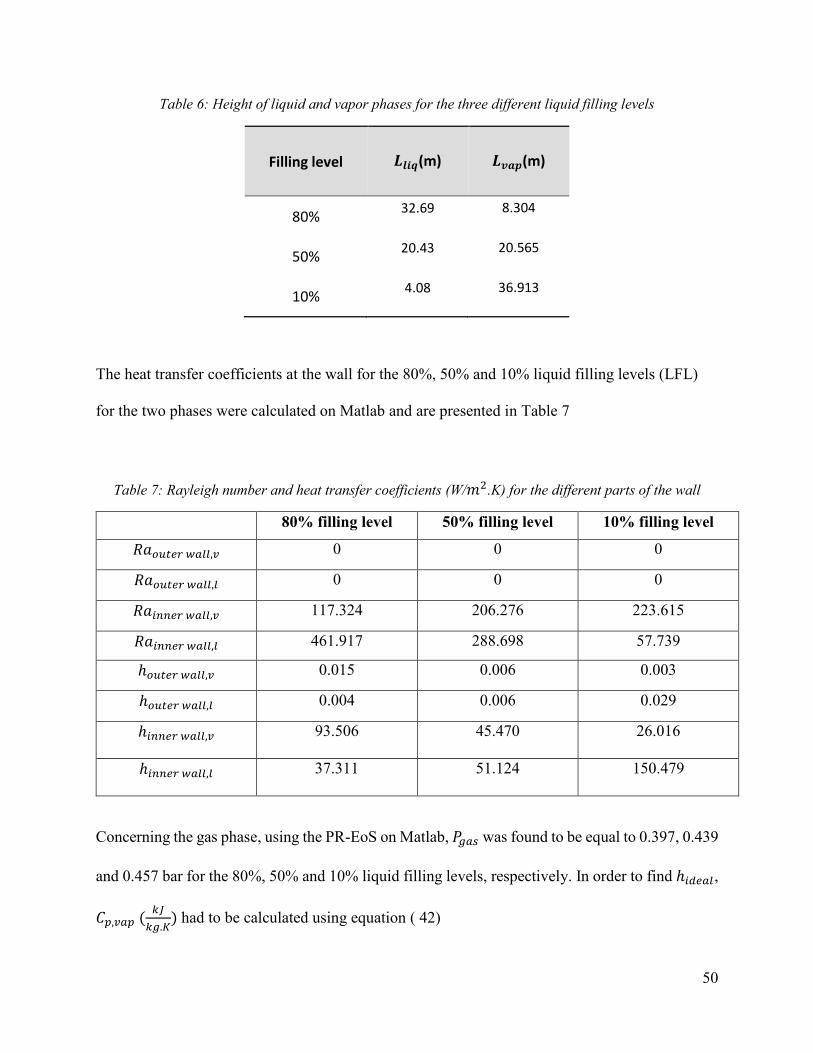
Table 6: Height of liquid and vapor phases for the three different liquid filling levels
Filling level 𝑳𝒍𝒊𝒒(m) 𝑳𝒗𝒂𝒑(m)
80% 32.69
8.304
50% 20.43
20.565
10% 4.08
36.913
The heat transfer coefficients at the wall for the 80%, 50% and 10% liquid filling levels (LFL)
for the two phases were calculated on Matlab and are presented in Table 7
Table 7: Rayleigh number and heat transfer coefficients (W/𝑚2.K) for the different parts of the wall
80% filling level 50% filling level 10% filling level
𝑅𝑎𝑜𝑢𝑡𝑒𝑟 𝑤𝑎𝑙𝑙,𝑣 0 0 0
𝑅𝑎𝑜𝑢𝑡𝑒𝑟 𝑤𝑎𝑙𝑙,𝑙 0 0 0
𝑅𝑎𝑖𝑛𝑛𝑒𝑟 𝑤𝑎𝑙𝑙,𝑣 117.324 206.276 223.615
𝑅𝑎𝑖𝑛𝑛𝑒𝑟 𝑤𝑎𝑙𝑙,𝑙 461.917 288.698 57.739
ℎ𝑜𝑢𝑡𝑒𝑟 𝑤𝑎𝑙𝑙,𝑣 0.015 0.006 0.003
ℎ𝑜𝑢𝑡𝑒𝑟 𝑤𝑎𝑙𝑙,𝑙 0.004 0.006 0.029
ℎ𝑖𝑛𝑛𝑒𝑟 𝑤𝑎𝑙𝑙,𝑣 93.506
45.470
26.016
ℎ𝑖𝑛𝑛𝑒𝑟 𝑤𝑎𝑙𝑙,𝑙 37.311
51.124
150.479
Concerning the gas phase, using the PR-EoS on Matlab, 𝑃𝑔𝑎𝑠 was found to be equal to 0.397, 0.439
and 0.457 bar for the 80%, 50% and 10% liquid filling levels, respectively. In order to find ℎ𝑖𝑑𝑒𝑎𝑙,
𝐶𝑝,𝑣𝑎𝑝 (𝑘𝐽
𝑘𝑔.𝐾) had to be calculated using equation ( 42)
51
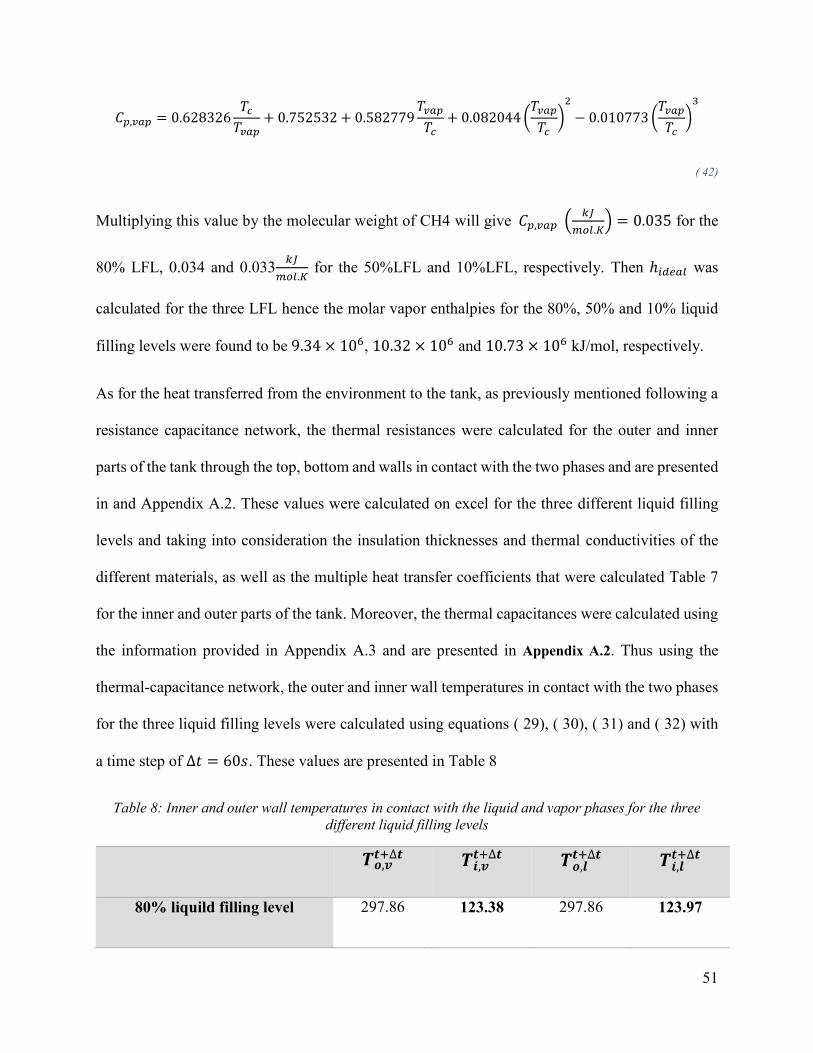
𝐶𝑝,𝑣𝑎𝑝 = 0.628326𝑇𝑐
𝑇𝑣𝑎𝑝+ 0.752532 + 0.582779
𝑇𝑣𝑎𝑝
𝑇𝑐+ 0.082044(
𝑇𝑣𝑎𝑝
𝑇𝑐)2
− 0.010773(𝑇𝑣𝑎𝑝
𝑇𝑐)3
( 42)
Multiplying this value by the molecular weight of CH4 will give 𝐶𝑝,𝑣𝑎𝑝 (𝑘𝐽
𝑚𝑜𝑙.𝐾) = 0.035 for the
80% LFL, 0.034 and 0.033 𝑘𝐽
𝑚𝑜𝑙.𝐾 for the 50%LFL and 10%LFL, respectively. Then ℎ𝑖𝑑𝑒𝑎𝑙 was
calculated for the three LFL hence the molar vapor enthalpies for the 80%, 50% and 10% liquid
filling levels were found to be 9.34 × 10⁶, 10.32 × 10⁶ and 10.73 × 10⁶ kJ/mol, respectively.
As for the heat transferred from the environment to the tank, as previously mentioned following a
resistance capacitance network, the thermal resistances were calculated for the outer and inner
parts of the tank through the top, bottom and walls in contact with the two phases and are presented
in and Appendix A.2. These values were calculated on excel for the three different liquid filling
levels and taking into consideration the insulation thicknesses and thermal conductivities of the
different materials, as well as the multiple heat transfer coefficients that were calculated Table 7
for the inner and outer parts of the tank. Moreover, the thermal capacitances were calculated using
the information provided in Appendix A.3 and are presented in Appendix A.2. Thus using the
thermal-capacitance network, the outer and inner wall temperatures in contact with the two phases
for the three liquid filling levels were calculated using equations ( 29), ( 30), ( 31) and ( 32) with
a time step of ∆𝑡 = 60𝑠. These values are presented in Table 8
Table 8: Inner and outer wall temperatures in contact with the liquid and vapor phases for the three different liquid filling levels
𝑻𝒐,𝒗
𝒕+∆𝒕 𝑻𝒊,𝒗𝒕+∆𝒕 𝑻𝒐,𝒍
𝒕+∆𝒕 𝑻𝒊,𝒍𝒕+∆𝒕
80% liquild filling level 297.86 123.38 297.86 123.97
52
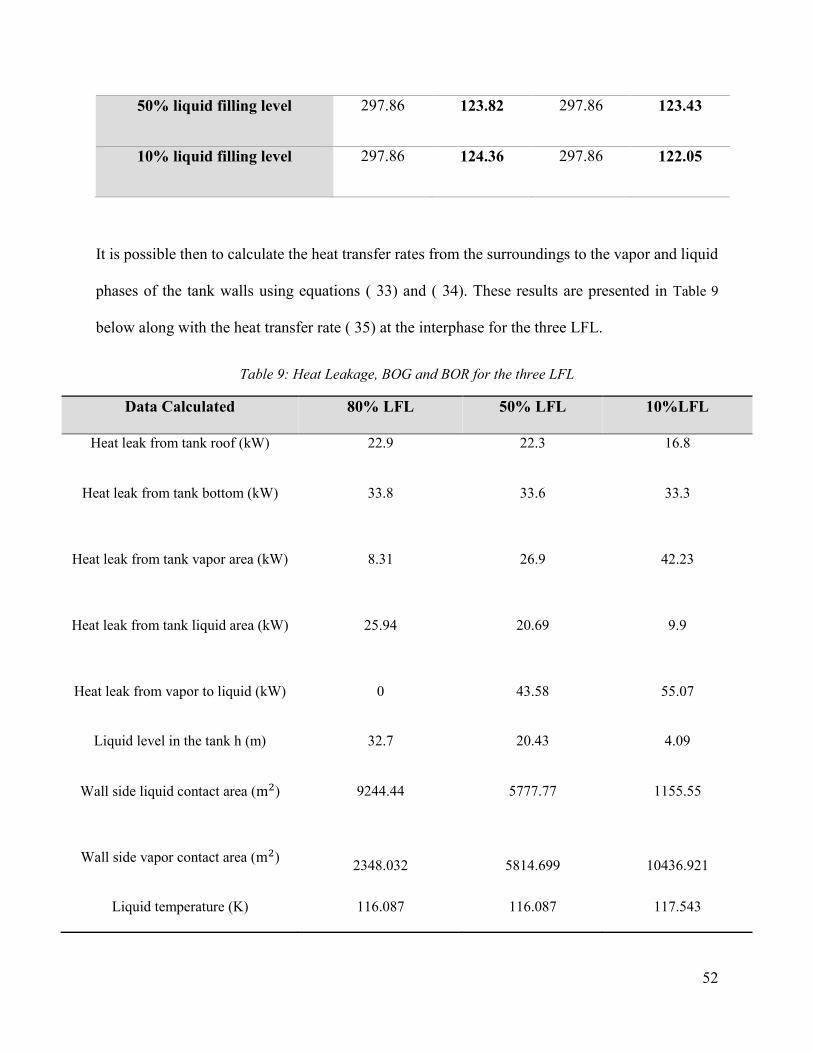
50% liquid filling level 297.86 123.82 297.86 123.43
10% liquid filling level 297.86 124.36 297.86 122.05
It is possible then to calculate the heat transfer rates from the surroundings to the vapor and liquid
phases of the tank walls using equations ( 33) and ( 34). These results are presented in Table 9
below along with the heat transfer rate ( 35) at the interphase for the three LFL.
Table 9: Heat Leakage, BOG and BOR for the three LFL
Data Calculated 80% LFL 50% LFL 10%LFL
Heat leak from tank roof (kW) 22.9 22.3 16.8
Heat leak from tank bottom (kW) 33.8 33.6 33.3
Heat leak from tank vapor area (kW) 8.31 26.9 42.23
Heat leak from tank liquid area (kW) 25.94 20.69 9.9
Heat leak from vapor to liquid (kW) 0 43.58 55.07
Liquid level in the tank h (m) 32.7 20.43 4.09
Wall side liquid contact area (m2) 9244.44 5777.77 1155.55
Wall side vapor contact area (m2) 2348.032 5814.699 10436.921
Liquid temperature (K) 116.087 116.087 117.543
53
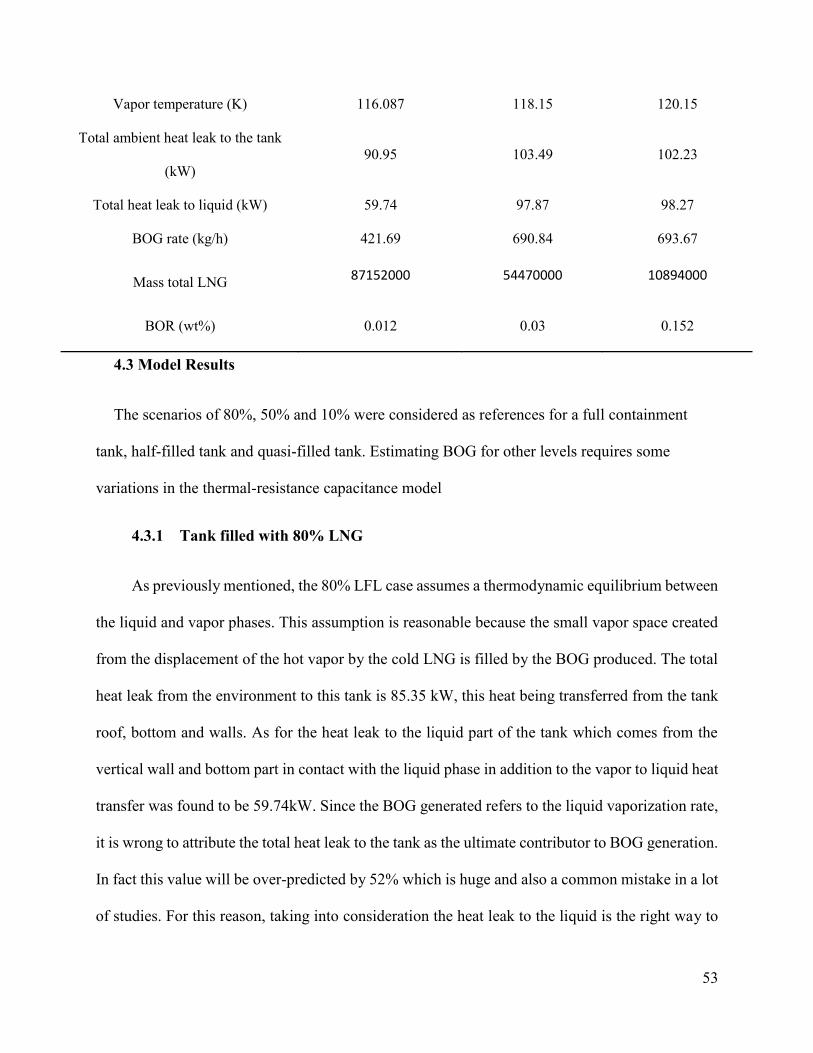
Vapor temperature (K) 116.087 118.15 120.15
Total ambient heat leak to the tank
(kW) 90.95 103.49 102.23
Total heat leak to liquid (kW) 59.74 97.87 98.27
BOG rate (kg/h) 421.69 690.84 693.67
Mass total LNG 87152000
54470000
10894000
BOR (wt%) 0.012 0.03 0.152
4.3 Model Results
The scenarios of 80%, 50% and 10% were considered as references for a full containment
tank, half-filled tank and quasi-filled tank. Estimating BOG for other levels requires some
variations in the thermal-resistance capacitance model
4.3.1 Tank filled with 80% LNG
As previously mentioned, the 80% LFL case assumes a thermodynamic equilibrium between
the liquid and vapor phases. This assumption is reasonable because the small vapor space created
from the displacement of the hot vapor by the cold LNG is filled by the BOG produced. The total
heat leak from the environment to this tank is 85.35 kW, this heat being transferred from the tank
roof, bottom and walls. As for the heat leak to the liquid part of the tank which comes from the
vertical wall and bottom part in contact with the liquid phase in addition to the vapor to liquid heat
transfer was found to be 59.74kW. Since the BOG generated refers to the liquid vaporization rate,
it is wrong to attribute the total heat leak to the tank as the ultimate contributor to BOG generation.
In fact this value will be over-predicted by 52% which is huge and also a common mistake in a lot
of studies. For this reason, taking into consideration the heat leak to the liquid is the right way to
54
find the BOG which is 429.61 kg/h leading to a BOR (% of liquid vaporization of the total liquid
volume per day) of 0.012%/day which is way less than normal conditions 0.15%/day as stated in
section 2.3
4.3.2 Tank filled with 50% LNG
For a 50% LFL tank, heat leak from the vapor part is bigger since for such level, more vapor
area is provided for heat to be transferred compared to the 80% LFL. The vapor temperature is
then increased to 118.15K which can be attributed to the higher heat capacity of LNG. Thus the
temperature difference between the liquid and vapor phases is somehow considerable (≈2K) and
causes around 88.5% of the heat ingress to the vapor phase to be transferred to liquid phase via the
vapor liquid interphase. If all heat leakage to the tank is assigned to the BOG generation, the BOG
will be over-predicted by 5.7% which is way smaller than the over-prediction of the 80% LFL
case, due to the vapor liquid heat transfer at the interface that contributes to the liquid heat leak
and therefore the BOG. At this heat transfer rate, the tank BOR is 0.03%/day which is also within
the safe margin.
55
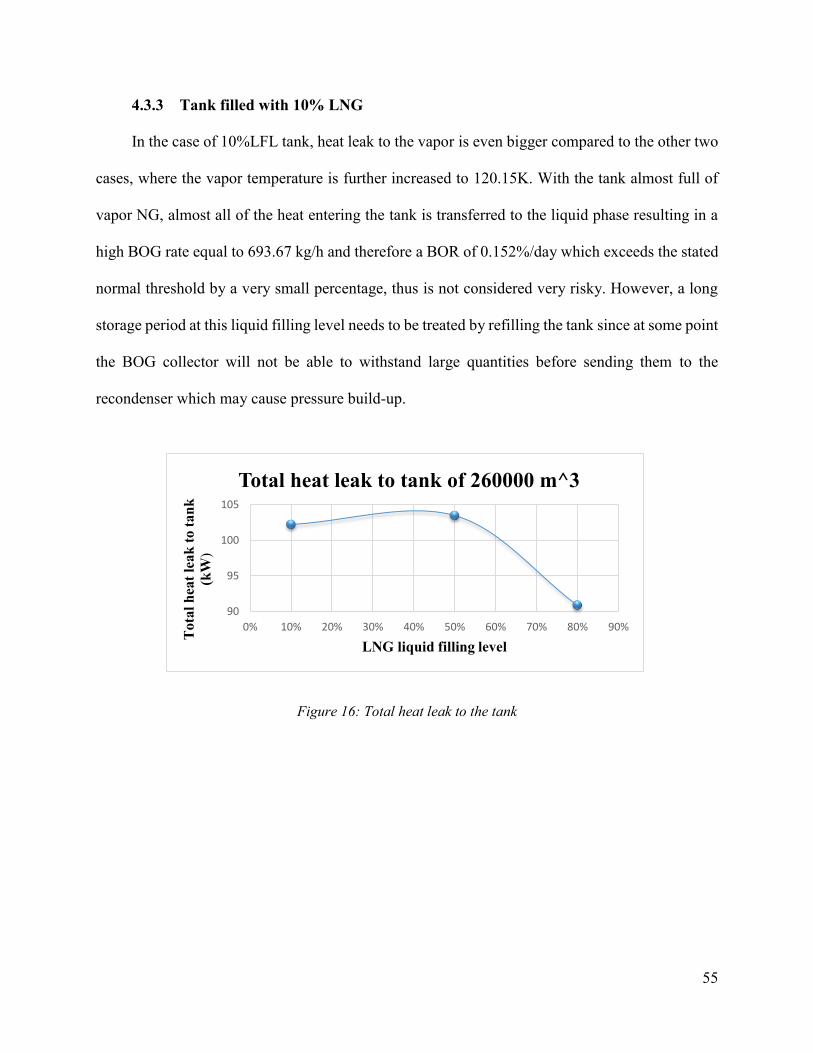
4.3.3 Tank filled with 10% LNG
In the case of 10%LFL tank, heat leak to the vapor is even bigger compared to the other two
cases, where the vapor temperature is further increased to 120.15K. With the tank almost full of
vapor NG, almost all of the heat entering the tank is transferred to the liquid phase resulting in a
high BOG rate equal to 693.67 kg/h and therefore a BOR of 0.152%/day which exceeds the stated
normal threshold by a very small percentage, thus is not considered very risky. However, a long
storage period at this liquid filling level needs to be treated by refilling the tank since at some point
the BOG collector will not be able to withstand large quantities before sending them to the
recondenser which may cause pressure build-up.
90
95
100
105
0% 10% 20% 30% 40% 50% 60% 70% 80% 90%Tot
al h
eat l
eak
to ta
nk
(kW
)
LNG liquid filling level
Total heat leak to tank of 260000 m^3
Figure 16: Total heat leak to the tank

56
4.4 Discussion
As previously mentioned, BOR is defined as the LNG vaporized per day of the total liquid mass
present in the tank. Frequently, the operator or vendor assigns a gross value of 0.05wt% for the
maximum tank filling level as the BOR. This assumption is reliable in the case where the total heat
leakage into the tank is constant (static BOR), and unrelated to the liquid filling level inside. This
0
0.02
0.04
0.06
0.08
0.1
0.12
0.14
0.16
0% 10% 20% 30% 40% 50% 60% 70% 80% 90%
BO
R (w
t%/d
ay)
LNG liquid filling level
BOR (wt%/day)
Figure 18: BOR from heat leakage to tank
0
200
400
600
800
0% 20% 40% 60% 80% 100%
BO
G g
ener
ated
from
liq
uid
LNG liquid filling level
BOG (kg/h)
Figure 17: BOG from liquid heat leak

57
can be seen in Figure 16 where for each LNG volume inside the tank a specific heat transfer rate
can be attributed, and only a 12% increase in the total heat ingress is present between the 80% and
10% LFL. However, this assumption does not highlight the fact that heat is distributed between
the liquid and vapor phases, and the effect of the liquid level variation on the BOG and BOR which
needs to be addressed.
It is evident now that the BOR is not static even though the total heat ingress to the tank is nearly
constant, instead it is strongly dependent on the liquid filing level inside the tank.
Upstream units such as recondensors and compressors should be designed taking into
consideration the dynamic BOR instead of the static one for accurate BOG handling. In other
words, adequate preparation is required to address BOG based on the worst case scenario (high
BOR), such does this work by studying the 10% LFL.
0
0.02
0.04
0.06
0.08
0.1
0.12
0.14
0.16
0% 10% 20% 30% 40% 50% 60% 70% 80% 90%
BO
R (w
t%/d
ay)
LNG liquid filling level
BOR (wt%/day)
Dynamic BOR (Liq lvl Effect) Static BOR (Contractor)
Figure18: Static vs Dynamic BOR in LNG tank Figure 19: Static vs Dynamic BOR in LNG tank
58
4.5 Comparison with previous results
In numerous studies, conduction and convection heating models were run to estimate heat ingress
to LNG storage tanks in order to assess the BOG generation inside, the holding time and the
decrease of liquid levels on the long term. However, structural designs of LNG tanks were
complicated in order to perform an accurate thermal analysis. With the use of a thermal resistance
capacitance network, thermodynamic equilibrium and non-equilibrium model were implemented
in a recent study by Wang et al. [44] and the results were compared with two sets of experimental
data which validated the fact that non equilibrium model accurately predict the thermophysical
properties of the tank under dynamic operating conditions. Similarly in our study, this non-
equilibrium model was used for two LFL (50% and 10%) while for the 80% case, the
thermodynamic equilibrium model was the proper choice for an almost full tank, with vapor and
liquid having the same temperature (initial conditions). In another study that tackles the BOG
prediction and the BOR in an LNG storage tank [51] having the same parameters and geometry as
our study, it was proven that the total heat transfer to the tank practically remains constant which
also validates our results. Moreover, over-prediction cases of BOG were analyzed whenever the
heat leak is completely assigned to the liquid phase, which aligns with what resulted from our
study, that vapor temperature increases and this unequal distribution of heat in both phases will
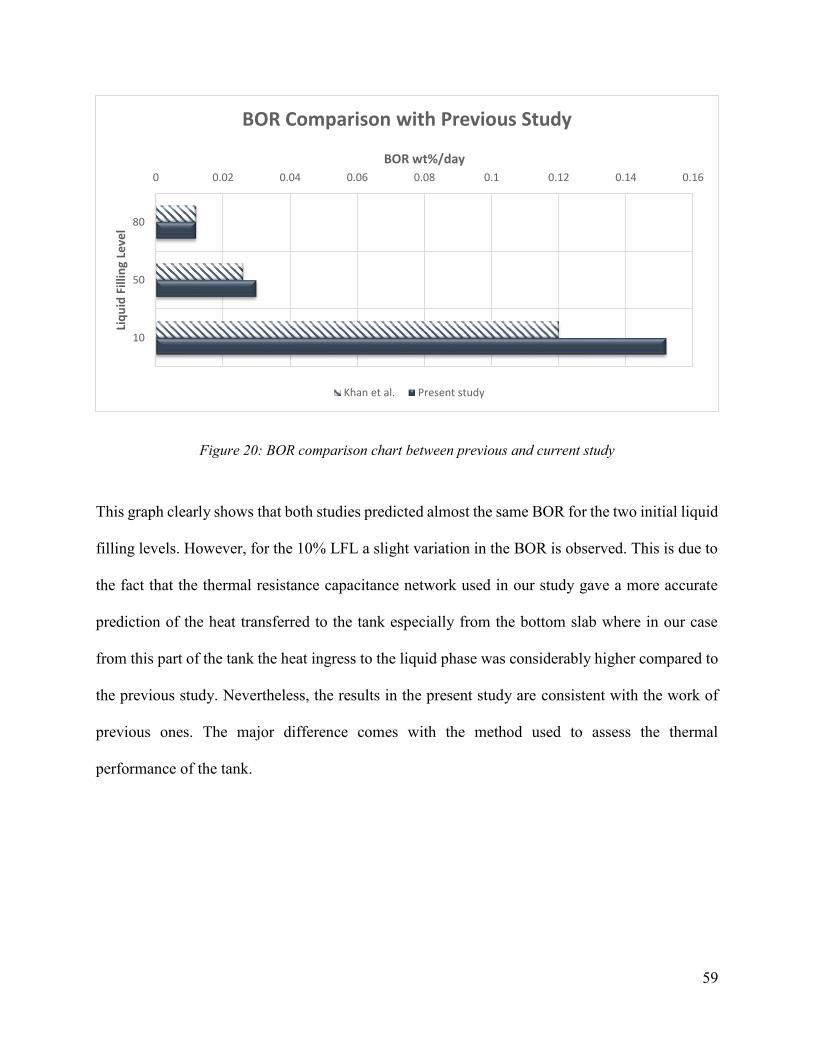
alter the BOG. The following graph visualizes a comparison between the BOR in the Khan et
al.[51] study and this present one:
59
Figure 20: BOR comparison chart between previous and current study
This graph clearly shows that both studies predicted almost the same BOR for the two initial liquid
filling levels. However, for the 10% LFL a slight variation in the BOR is observed. This is due to
the fact that the thermal resistance capacitance network used in our study gave a more accurate
prediction of the heat transferred to the tank especially from the bottom slab where in our case
from this part of the tank the heat ingress to the liquid phase was considerably higher compared to
the previous study. Nevertheless, the results in the present study are consistent with the work of
previous ones. The major difference comes with the method used to assess the thermal
performance of the tank.
0 0.02 0.04 0.06 0.08 0.1 0.12 0.14 0.16
80
50
10
BOR wt%/day
Liq
uid
Fill
ing
Leve
lBOR Comparison with Previous Study
Khan et al. Present study
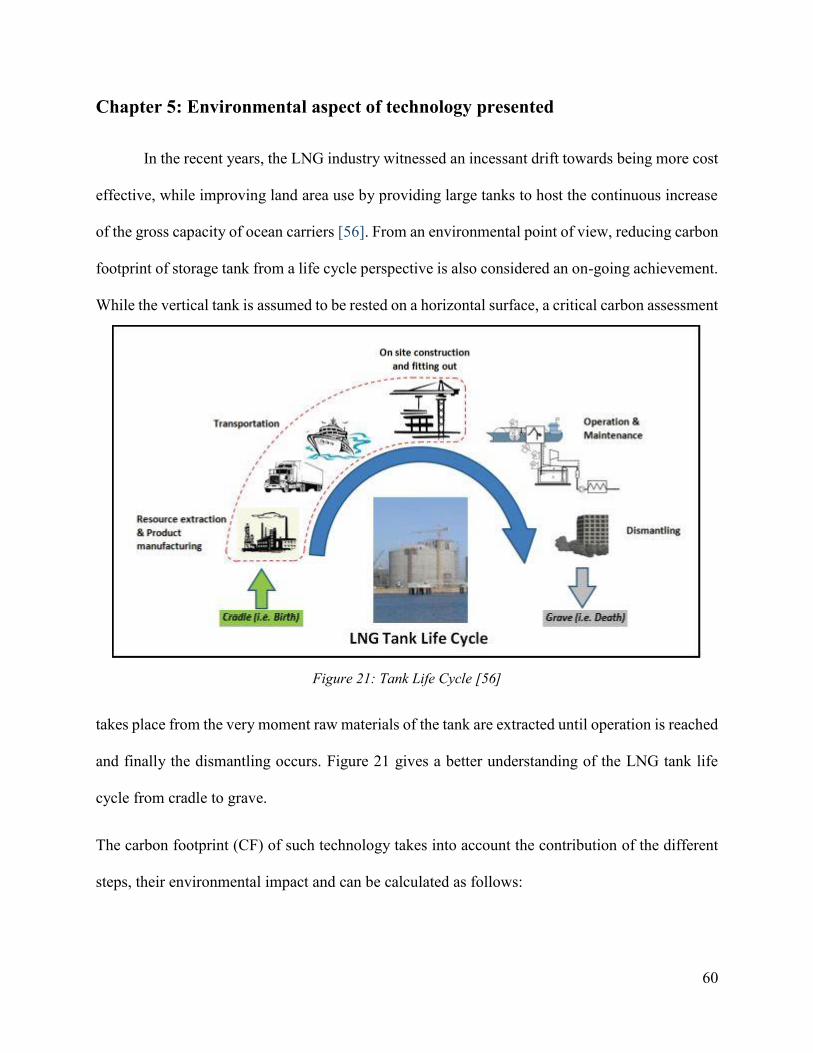
60
Chapter 5: Environmental aspect of technology presented
In the recent years, the LNG industry witnessed an incessant drift towards being more cost
effective, while improving land area use by providing large tanks to host the continuous increase
of the gross capacity of ocean carriers [56]. From an environmental point of view, reducing carbon
footprint of storage tank from a life cycle perspective is also considered an on-going achievement.
While the vertical tank is assumed to be rested on a horizontal surface, a critical carbon assessment
takes place from the very moment raw materials of the tank are extracted until operation is reached
and finally the dismantling occurs. Figure 21 gives a better understanding of the LNG tank life
cycle from cradle to grave.
The carbon footprint (CF) of such technology takes into account the contribution of the different
steps, their environmental impact and can be calculated as follows:
Figure 21: Tank Life Cycle [56]

61
𝐶𝐹 = 𝐶𝐹𝑚𝑎𝑛𝑢𝑓𝑎𝑐𝑡𝑢𝑟𝑖𝑛𝑔 + 𝐶𝐹𝑡𝑟𝑎𝑛𝑠𝑝𝑜𝑟𝑎𝑡𝑖𝑜𝑛 + 𝐶𝐹𝑐𝑜𝑛𝑠𝑡𝑟𝑢𝑐𝑡𝑖𝑜𝑛 + 𝐶𝐹𝑂&𝑀/𝐷𝑖𝑠𝑚𝑎𝑛𝑡𝑙𝑖𝑛𝑔
( 43)
Maintenance of a static storage tank (present study) is non-existent or negligible. Manufacturing
of the materials, their transportation and the final construction of the tank contribute the most to
the carbon emissions. While the carbon footprint of the manufacturing is calculated following
equation ( 44) along with the information presented in Table 10, its calculation for the two other
next steps was not done in this study for the lack of information such as the location and travelling
distances of the materials as well as the workers.
𝐶𝐹𝑚𝑎𝑛𝑢𝑓𝑎𝑐𝑡𝑢𝑟𝑖𝑛𝑔 = ∑𝑖𝑊𝑖 ∗ 𝐹𝑖
( 44)
Where 𝑊𝑖 is the material weight and 𝐹𝑖 is the per unit global warning potential in ton CO2-eq for
the production of 1 ton of the material.
The following table summarizes these two parameters
Table 10: Parameters used for the manufacturing CF calculation
Tank Section
Type of material
Material grade
Volume (m^3) Density(kg/m^3) Mass
(ton) Per unit global warning potential in tons CO2-eq
Concrete Tank
Concrete Roof
Concrete
1292.7
2400
3102 1.7 Concrete
Walls 5482.865 13158 1.7
Prestressed Concrete Slab 12723.450 30536 1.7
In tank
Metals
Carbon Steel 38.16 7850 299 1.7
Nickel Steel 439.42 7801 3427 2.3
Aluminum 17.36 2710 47 8
Insulation Perlite 10091 90 908.19 - Glass Fiber 5789.71 24 138.95 1.6
62
Therefore the manufacturing CF for the LNG tank in this study is equivalent to 88,541 carbon in
tons CO2-eq.
5.1 Future improvements and limitations
A proper estimation of the tank’s BOR for the three different liquid filling levels has been
carried out in this study after finding the heat leakage from the tank’s roof, bottom and walls and
its proper distribution among the vapor and liquid phases. However, it should be noted that this
study is being performed assuming an average ambient temperature of 25ᵒC, which is not always
the case. In fact, heat leaking from the outside can always be either higher or lower depending on
weather conditions, where temperatures vary as well as day and night conditions. Also, the LNG
composition is mainly considered as pure methane, or light LNG for calculation purposes.
However, sometimes stored LNG can be containing ethane, propane and also nitrogen to further
drop its boiling temperature. Moreover, normal operations are not taken into consideration such as
active filling of the tank or discharge of LNG into loading trucks or carriers. The tank is considered
to be closed and under static conditions for the three different filling levels, therefore heat ingress
is the only contributor to the BOG generation. Therefore, the thermal design in this study can act
as a starting stage for further heat leakage projects by simply changing the initial thermophysical
properties depending on the LNG content and the operating conditions. On the other hand, having
found that for a low liquid filling level, a higher BOG is induced. This study provides a basis for
accurate BOG and BOR calculations to further address the situation and avoid hazardous
problems.
63
Chapter 6: Conclusion
In this study, an equilibrium and non-equilibrium thermodynamic approach were
developed depending on three different liquid fillings of an LNG tank using a resistance-
capacitance network. After investigating the thermal performance of the tank including the heat
transferred from the environment at an average temperature of 25°𝐶 by natural convection and
conduction through the insulating materials, the total heat ingress to the tank turned out to be barely
changing with the different filling levels. The results showed that for an 80% liquid level, the heat
leak is mostly attributed to the liquid part of the tank resulting in a BOR of 0.012wt%/day. Instead,
a 50% filled tank, where heat leak is almost equivalent between the two phases, results in a BOR
of 0.03wt%/day noting that a vapor liquid heat transfer happened at the interface. Similarly for a
10% filled tank, while reasonably heat leak should be attributed to the abundant vapor phase, heat
transferred to liquid is nonetheless the biggest; this is due to the interface heat transfer. For this
filling level a BOR of 0.152wt%/day was found which may on the long term exceed the ventilating
ability of the storage tank resulting in pressure build-up and hazardous effects. Furthermore, results
showed that heat ingress is not fully happening to the liquid phase and heat leakage occurs at the
different parts of the tank disregarding the fluid phase. However, BOG calculation is linked
properly to the liquid heat ingress instead of the total one or an over-prediction of the BOR will
happen. It is therefore important to say that BOR strongly depends on the liquid level of the tank,
the heat distribution between the liquid and vapor phases but also the interface heat transfer. This
goes to say that for a low liquid level, BOG is under-predicted using a static BOR approach.
Environmentally speaking, with the data provided, the manufacturing carbon footprint of
the 260000 𝑚3 LNG storage tank was calculated and found to be 88,541 carbon in tons CO2-eq.

64
More data is required for an accurate estimation of the total carbon footprint and emissions of this
technology.
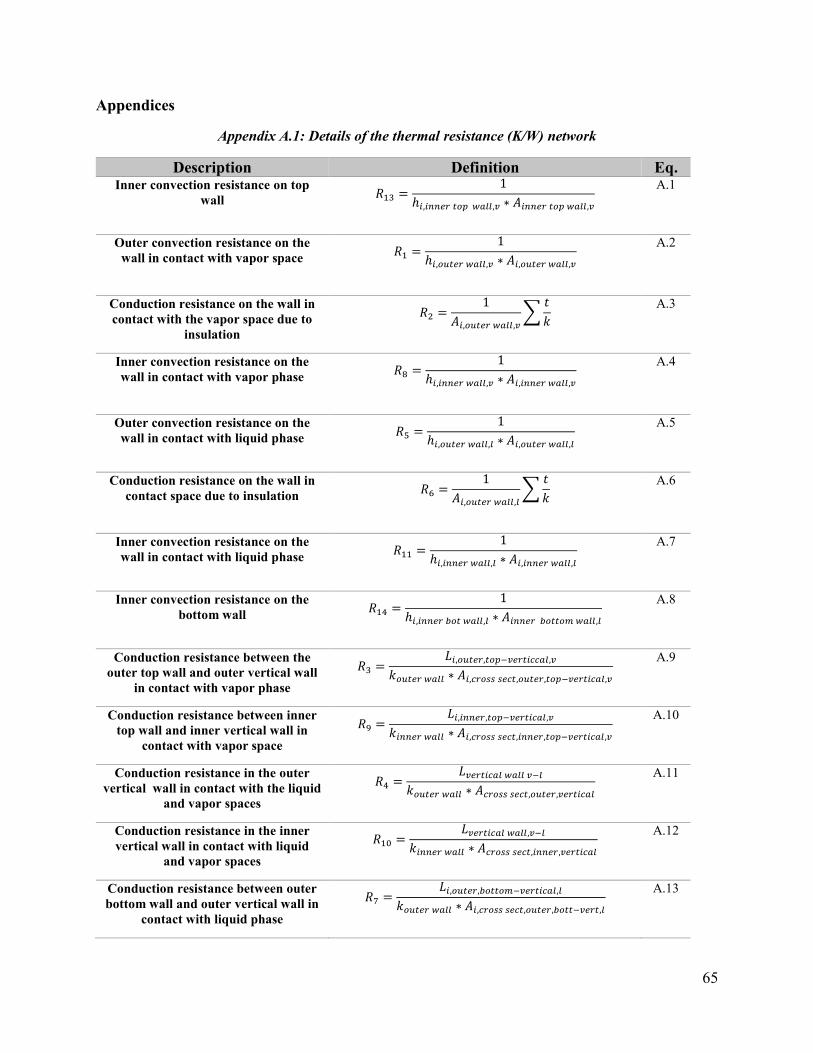
65
Appendices
Appendix A.1: Details of the thermal resistance (K/W) network
Description Definition Eq. Inner convection resistance on top
wall 𝑅13 =1
ℎ𝑖,𝑖𝑛𝑛𝑒𝑟 𝑡𝑜𝑝 𝑤𝑎𝑙𝑙,𝑣 ∗ 𝐴𝑖𝑛𝑛𝑒𝑟 𝑡𝑜𝑝 𝑤𝑎𝑙𝑙,𝑣
A.1
Outer convection resistance on the wall in contact with vapor space 𝑅1 =
1
ℎ𝑖,𝑜𝑢𝑡𝑒𝑟 𝑤𝑎𝑙𝑙,𝑣 ∗ 𝐴𝑖,𝑜𝑢𝑡𝑒𝑟 𝑤𝑎𝑙𝑙,𝑣
A.2
Conduction resistance on the wall in contact with the vapor space due to
insulation
𝑅2 =1
𝐴𝑖,𝑜𝑢𝑡𝑒𝑟 𝑤𝑎𝑙𝑙,𝑣
∑𝑡
𝑘
A.3
Inner convection resistance on the wall in contact with vapor phase 𝑅8 =
1
ℎ𝑖,𝑖𝑛𝑛𝑒𝑟 𝑤𝑎𝑙𝑙,𝑣 ∗ 𝐴𝑖,𝑖𝑛𝑛𝑒𝑟 𝑤𝑎𝑙𝑙,𝑣
A.4
Outer convection resistance on the wall in contact with liquid phase 𝑅5 =
1
ℎ𝑖,𝑜𝑢𝑡𝑒𝑟 𝑤𝑎𝑙𝑙,𝑙 ∗ 𝐴𝑖,𝑜𝑢𝑡𝑒𝑟 𝑤𝑎𝑙𝑙,𝑙
A.5
Conduction resistance on the wall in contact space due to insulation 𝑅6 =
1
𝐴𝑖,𝑜𝑢𝑡𝑒𝑟 𝑤𝑎𝑙𝑙,𝑙
∑𝑡
𝑘
A.6
Inner convection resistance on the wall in contact with liquid phase 𝑅11 =
1
ℎ𝑖,𝑖𝑛𝑛𝑒𝑟 𝑤𝑎𝑙𝑙,𝑙 ∗ 𝐴𝑖,𝑖𝑛𝑛𝑒𝑟 𝑤𝑎𝑙𝑙,𝑙
A.7
Inner convection resistance on the bottom wall 𝑅14 =
1
ℎ𝑖,𝑖𝑛𝑛𝑒𝑟 𝑏𝑜𝑡 𝑤𝑎𝑙𝑙,𝑙 ∗ 𝐴𝑖𝑛𝑛𝑒𝑟 𝑏𝑜𝑡𝑡𝑜𝑚 𝑤𝑎𝑙𝑙,𝑙
A.8
Conduction resistance between the outer top wall and outer vertical wall
in contact with vapor phase 𝑅3 =
𝐿𝑖,𝑜𝑢𝑡𝑒𝑟,𝑡𝑜𝑝−𝑣𝑒𝑟𝑡𝑖𝑐𝑐𝑎𝑙,𝑣
𝑘𝑜𝑢𝑡𝑒𝑟 𝑤𝑎𝑙𝑙 ∗ 𝐴𝑖,𝑐𝑟𝑜𝑠𝑠 𝑠𝑒𝑐𝑡,𝑜𝑢𝑡𝑒𝑟,𝑡𝑜𝑝−𝑣𝑒𝑟𝑡𝑖𝑐𝑎𝑙,𝑣
A.9
Conduction resistance between inner top wall and inner vertical wall in
contact with vapor space 𝑅9 =
𝐿𝑖,𝑖𝑛𝑛𝑒𝑟,𝑡𝑜𝑝−𝑣𝑒𝑟𝑡𝑖𝑐𝑎𝑙,𝑣
𝑘𝑖𝑛𝑛𝑒𝑟 𝑤𝑎𝑙𝑙 ∗ 𝐴𝑖,𝑐𝑟𝑜𝑠𝑠 𝑠𝑒𝑐𝑡,𝑖𝑛𝑛𝑒𝑟,𝑡𝑜𝑝−𝑣𝑒𝑟𝑡𝑖𝑐𝑎𝑙,𝑣
A.10
Conduction resistance in the outer vertical wall in contact with the liquid
and vapor spaces
𝑅4 =𝐿𝑣𝑒𝑟𝑡𝑖𝑐𝑎𝑙 𝑤𝑎𝑙𝑙 𝑣−𝑙
𝑘𝑜𝑢𝑡𝑒𝑟 𝑤𝑎𝑙𝑙 ∗ 𝐴𝑐𝑟𝑜𝑠𝑠 𝑠𝑒𝑐𝑡,𝑜𝑢𝑡𝑒𝑟,𝑣𝑒𝑟𝑡𝑖𝑐𝑎𝑙
A.11
Conduction resistance in the inner vertical wall in contact with liquid
and vapor spaces
𝑅10 =𝐿𝑣𝑒𝑟𝑡𝑖𝑐𝑎𝑙 𝑤𝑎𝑙𝑙,𝑣−𝑙
𝑘𝑖𝑛𝑛𝑒𝑟 𝑤𝑎𝑙𝑙 ∗ 𝐴𝑐𝑟𝑜𝑠𝑠 𝑠𝑒𝑐𝑡,𝑖𝑛𝑛𝑒𝑟,𝑣𝑒𝑟𝑡𝑖𝑐𝑎𝑙
A.12
Conduction resistance between outer bottom wall and outer vertical wall in
contact with liquid phase
𝑅7 =𝐿𝑖,𝑜𝑢𝑡𝑒𝑟,𝑏𝑜𝑡𝑡𝑜𝑚−𝑣𝑒𝑟𝑡𝑖𝑐𝑎𝑙,𝑙
𝑘𝑜𝑢𝑡𝑒𝑟 𝑤𝑎𝑙𝑙 ∗ 𝐴𝑖,𝑐𝑟𝑜𝑠𝑠 𝑠𝑒𝑐𝑡,𝑜𝑢𝑡𝑒𝑟,𝑏𝑜𝑡𝑡−𝑣𝑒𝑟𝑡,𝑙
A.13
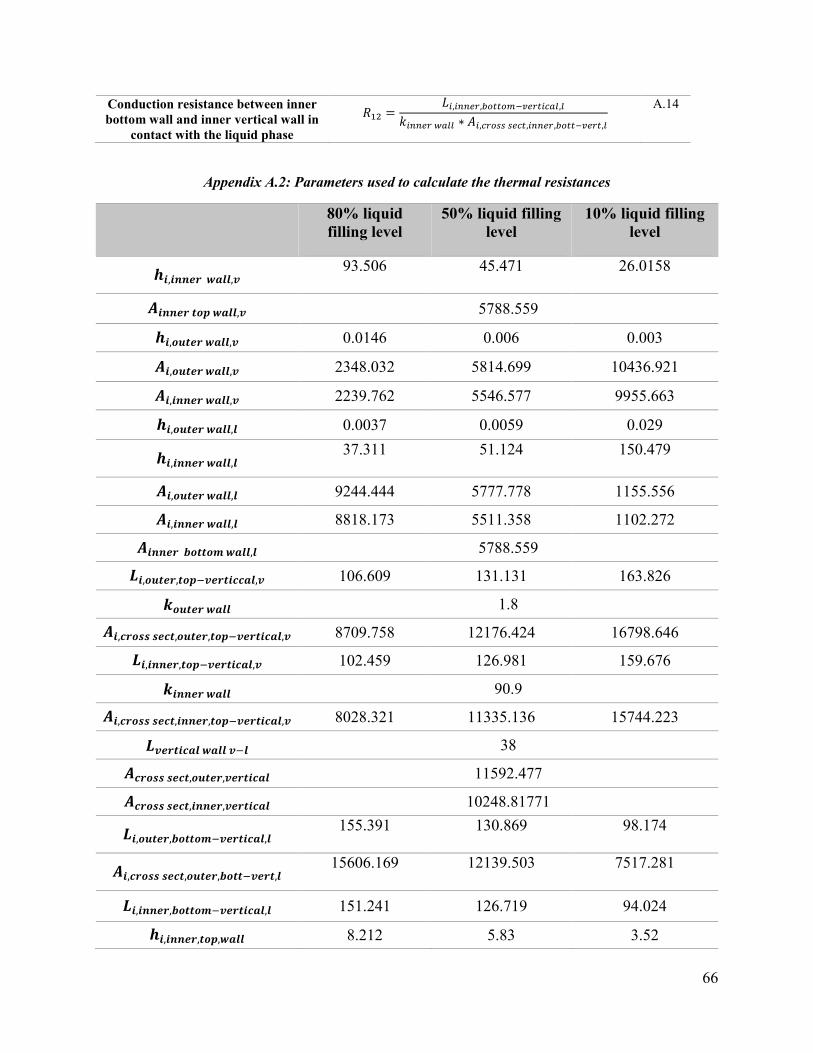
66
Conduction resistance between inner bottom wall and inner vertical wall in
contact with the liquid phase
𝑅12 =𝐿𝑖,𝑖𝑛𝑛𝑒𝑟,𝑏𝑜𝑡𝑡𝑜𝑚−𝑣𝑒𝑟𝑡𝑖𝑐𝑎𝑙,𝑙
𝑘𝑖𝑛𝑛𝑒𝑟 𝑤𝑎𝑙𝑙 ∗ 𝐴𝑖,𝑐𝑟𝑜𝑠𝑠 𝑠𝑒𝑐𝑡,𝑖𝑛𝑛𝑒𝑟,𝑏𝑜𝑡𝑡−𝑣𝑒𝑟𝑡,𝑙
A.14
Appendix A.2: Parameters used to calculate the thermal resistances
80% liquid filling level
50% liquid filling level
10% liquid filling level
𝒉𝒊,𝒊𝒏𝒏𝒆𝒓 𝒘𝒂𝒍𝒍,𝒗 93.506
45.471
26.0158
𝑨𝒊𝒏𝒏𝒆𝒓 𝒕𝒐𝒑 𝒘𝒂𝒍𝒍,𝒗 5788.559
𝒉𝒊,𝒐𝒖𝒕𝒆𝒓 𝒘𝒂𝒍𝒍,𝒗 0.0146 0.006 0.003
𝑨𝒊,𝒐𝒖𝒕𝒆𝒓 𝒘𝒂𝒍𝒍,𝒗 2348.032 5814.699 10436.921
𝑨𝒊,𝒊𝒏𝒏𝒆𝒓 𝒘𝒂𝒍𝒍,𝒗 2239.762 5546.577 9955.663
𝒉𝒊,𝒐𝒖𝒕𝒆𝒓 𝒘𝒂𝒍𝒍,𝒍 0.0037 0.0059 0.029
𝒉𝒊,𝒊𝒏𝒏𝒆𝒓 𝒘𝒂𝒍𝒍,𝒍 37.311
51.124
150.479
𝑨𝒊,𝒐𝒖𝒕𝒆𝒓 𝒘𝒂𝒍𝒍,𝒍 9244.444 5777.778 1155.556
𝑨𝒊,𝒊𝒏𝒏𝒆𝒓 𝒘𝒂𝒍𝒍,𝒍 8818.173 5511.358 1102.272
𝑨𝒊𝒏𝒏𝒆𝒓 𝒃𝒐𝒕𝒕𝒐𝒎 𝒘𝒂𝒍𝒍,𝒍 5788.559
𝑳𝒊,𝒐𝒖𝒕𝒆𝒓,𝒕𝒐𝒑−𝒗𝒆𝒓𝒕𝒊𝒄𝒄𝒂𝒍,𝒗 106.609 131.131 163.826
𝒌𝒐𝒖𝒕𝒆𝒓 𝒘𝒂𝒍𝒍 1.8
𝑨𝒊,𝒄𝒓𝒐𝒔𝒔 𝒔𝒆𝒄𝒕,𝒐𝒖𝒕𝒆𝒓,𝒕𝒐𝒑−𝒗𝒆𝒓𝒕𝒊𝒄𝒂𝒍,𝒗 8709.758 12176.424 16798.646
𝑳𝒊,𝒊𝒏𝒏𝒆𝒓,𝒕𝒐𝒑−𝒗𝒆𝒓𝒕𝒊𝒄𝒂𝒍,𝒗 102.459 126.981 159.676
𝒌𝒊𝒏𝒏𝒆𝒓 𝒘𝒂𝒍𝒍 90.9
𝑨𝒊,𝒄𝒓𝒐𝒔𝒔 𝒔𝒆𝒄𝒕,𝒊𝒏𝒏𝒆𝒓,𝒕𝒐𝒑−𝒗𝒆𝒓𝒕𝒊𝒄𝒂𝒍,𝒗 8028.321 11335.136 15744.223
𝑳𝒗𝒆𝒓𝒕𝒊𝒄𝒂𝒍 𝒘𝒂𝒍𝒍 𝒗−𝒍 38
𝑨𝒄𝒓𝒐𝒔𝒔 𝒔𝒆𝒄𝒕,𝒐𝒖𝒕𝒆𝒓,𝒗𝒆𝒓𝒕𝒊𝒄𝒂𝒍 11592.477
𝑨𝒄𝒓𝒐𝒔𝒔 𝒔𝒆𝒄𝒕,𝒊𝒏𝒏𝒆𝒓,𝒗𝒆𝒓𝒕𝒊𝒄𝒂𝒍 10248.81771
𝑳𝒊,𝒐𝒖𝒕𝒆𝒓,𝒃𝒐𝒕𝒕𝒐𝒎−𝒗𝒆𝒓𝒕𝒊𝒄𝒂𝒍,𝒍 155.391
130.869
98.174
𝑨𝒊,𝒄𝒓𝒐𝒔𝒔 𝒔𝒆𝒄𝒕,𝒐𝒖𝒕𝒆𝒓,𝒃𝒐𝒕𝒕−𝒗𝒆𝒓𝒕,𝒍 15606.169
12139.503
7517.281
𝑳𝒊,𝒊𝒏𝒏𝒆𝒓,𝒃𝒐𝒕𝒕𝒐𝒎−𝒗𝒆𝒓𝒕𝒊𝒄𝒂𝒍,𝒍 151.241 126.719 94.024
𝒉𝒊,𝒊𝒏𝒏𝒆𝒓,𝒕𝒐𝒑,𝒘𝒂𝒍𝒍 8.212 5.83 3.52
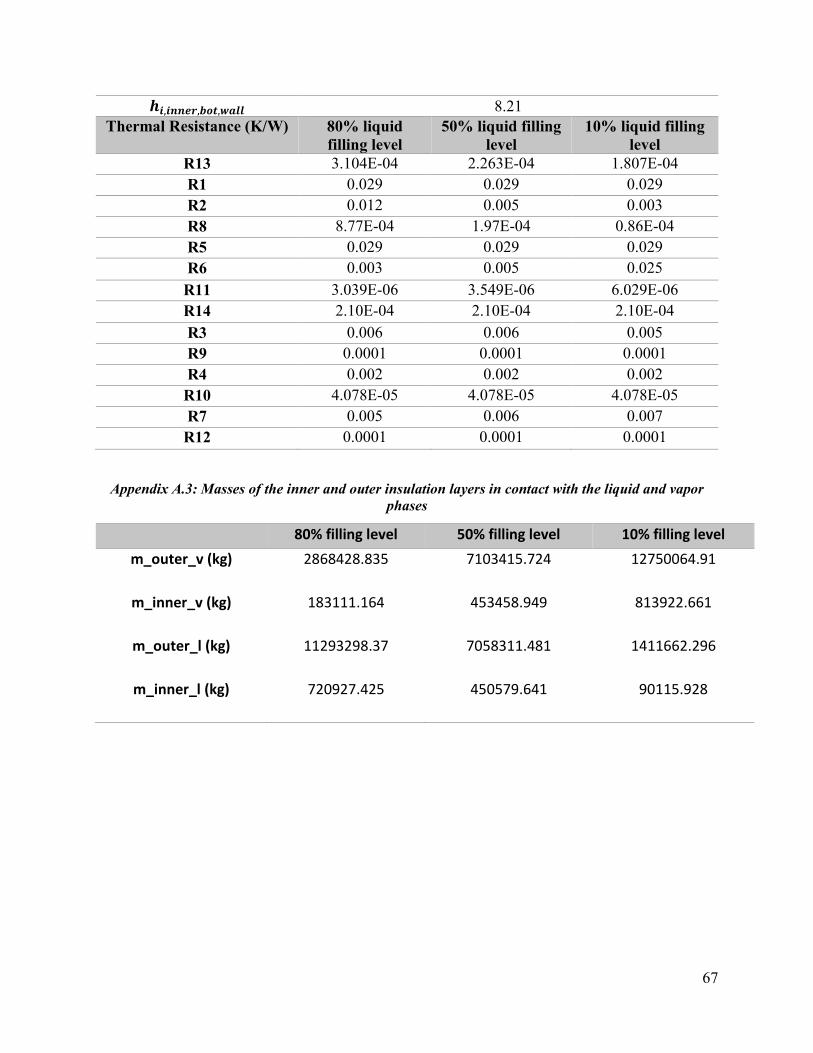
67
𝒉𝒊,𝒊𝒏𝒏𝒆𝒓,𝒃𝒐𝒕,𝒘𝒂𝒍𝒍 8.21 Thermal Resistance (K/W) 80% liquid
filling level 50% liquid filling
level 10% liquid filling
level R13 3.104E-04 2.263E-04 1.807E-04 R1 0.029 0.029 0.029 R2 0.012 0.005 0.003 R8 8.77E-04 1.97E-04 0.86E-04 R5 0.029 0.029 0.029 R6 0.003 0.005 0.025 R11 3.039E-06 3.549E-06 6.029E-06 R14 2.10E-04 2.10E-04 2.10E-04 R3 0.006 0.006 0.005 R9 0.0001 0.0001 0.0001 R4 0.002 0.002 0.002 R10 4.078E-05 4.078E-05 4.078E-05 R7 0.005 0.006 0.007 R12 0.0001 0.0001 0.0001
Appendix A.3: Masses of the inner and outer insulation layers in contact with the liquid and vapor phases
80% filling level 50% filling level 10% filling level
m_outer_v (kg) 2868428.835 7103415.724 12750064.91
m_inner_v (kg) 183111.164 453458.949 813922.661
m_outer_l (kg) 11293298.37 7058311.481 1411662.296
m_inner_l (kg) 720927.425 450579.641 90115.928
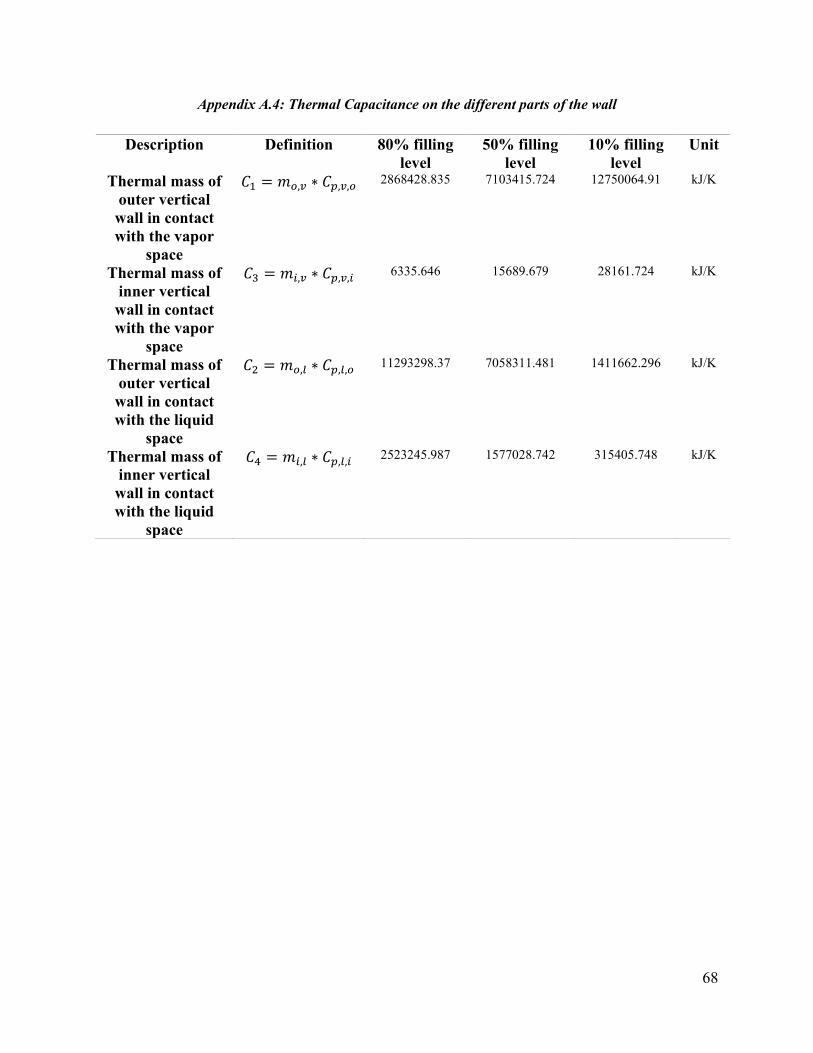
68
Appendix A.4: Thermal Capacitance on the different parts of the wall
Description Definition 80% filling level
50% filling level
10% filling level
Unit
Thermal mass of outer vertical wall in contact with the vapor
space
𝐶1 = 𝑚𝑜,𝑣 ∗ 𝐶𝑝,𝑣,𝑜
2868428.835 7103415.724 12750064.91 kJ/K
Thermal mass of inner vertical wall in contact with the vapor
space
𝐶3 = 𝑚𝑖,𝑣 ∗ 𝐶𝑝,𝑣,𝑖
6335.646 15689.679 28161.724 kJ/K
Thermal mass of outer vertical wall in contact with the liquid
space
𝐶2 = 𝑚𝑜,𝑙 ∗ 𝐶𝑝,𝑙,𝑜
11293298.37
7058311.481
1411662.296
kJ/K
Thermal mass of inner vertical wall in contact with the liquid
space
𝐶4 = 𝑚𝑖,𝑙 ∗ 𝐶𝑝,𝑙,𝑖
2523245.987
1577028.742
315405.748
kJ/K
69
References [1]. Depleting Earth’s resources | MSUToday | Michigan State University. (n.d.). Retrieved
January 21, 2021, from https://msutoday.msu.edu/news/2018/depleting-earths-resources/ [2]. Brown, N. 2019 D., & Correspondent, E. (2019, November 1). Hydrocarbons Expected to
Remain the World’s Primary Energy Source. AAPG EXPLORER. https://explorer.aapg.org/story/articleid/54995/hydrocarbons-expected-to-remain-the-worlds-primary-energy-source
[3]. The future of hydrocarbons as a global energy source | Ditchley Foundation. (n.d.). Retrieved January 21, 2021, from https://www.ditchley.com/past-events/past-programme/2010-2019/2011/hydrocarbons
[4]. The Paris Agreement | UNFCCC. (n.d.). Retrieved March 8, 2021, from https://unfccc.int/process-and-meetings/the-paris-agreement/the-paris-agreement
[5]. Fossil fuels, explained. (2019, April 2). Environment. https://www.nationalgeographic.com/environment/article/fossil-fuels
[6]. Transportation Fuel Market—Industry Analysis, Share, Size, Forecast 2022. (n.d.). Retrieved March 8, 2021, from https://www.transparencymarketresearch.com/transportation-fuel-market.html
[7]. Green, V. V., Kate Abnett, Matthew. (2020, August 18). Explainer: Cleaner but not clean - Why scientists say natural gas won’t avert climate disaster. Reuters. https://www.reuters.com/article/us-usa-gas-climatebox-explainer-idUSKCN25E1DR
[8]. » Natural Gas in the Transportation Sector NaturalGas.org. (n.d.). Retrieved January 22, 2021, from http://naturalgas.org/overview/uses-transportation/
[9]. Qingfang, K., Shaocheng, C., Longshan, Z., & Miao, Y. (n.d.). THE TRENDS OF LNG/CNG APPLICATION IN THE TRANSPORTATION INDUSTRY IN CHINA. 27.
[10]. Aursand, E., & Hammer, M. (2018). Predicting triggering and consequence of delayed LNG RPT. Journal of Loss Prevention in the Process Industries, 55, 124–133. https://doi.org/10.1016/j.jlp.2018.06.001
[11]. Liquefied natural gas—U.S. Energy Information Administration (EIA). (n.d.). Retrieved January 22, 2021, from https://www.eia.gov/energyexplained/natural-gas/liquefied-natural-gas.php
[12]. Benefits of LNG – Benefits Of. (n.d.). Retrieved January 22, 2021, from http://benefitof.net/benefits-of-lng/
[13]. GasLog: LNG Demand Grew 9% in 2018. (2019, February 14). MarineLink. https://www.marinelink.com/news/gaslog-lng-demand-grew-462927
[14]. Perlite Insulated Double Shell Vertical Tank & Horizontal Tank. (n.d.). TOYO KANETSU K.K. Retrieved January 22, 2021, from https://www.toyokanetsu.co.jp/global/product/plant/small_scale_lng.html
[15]. Gakuo, J. W. (2020, July 14). 11 LNG Terminals You Should Know in 2020 & Upcoming LNG Projects. Oil and Gas Industry. https://www.upstreamawards.com/lng-terminals/
70
[16]. Khan, M. (2018). Comparative Well-to-Tank energy use and greenhouse gas assessment of natural gas as a transportation fuel in Pakistan. Energy for Sustainable Development, 43, 38–59. https://doi.org/10.1016/j.esd.2017.12.004
[17]. Corporation, I. H. I. (n.d.). LNG Receiving Terminal, Storage Tank|Resources, Energy and Environment|Products|IHI Corporation. IHI Corporation. Retrieved January 22, 2021, from https://www.ihi.co.jp/en/products/resources_energy_environment/lng_cryorgenic_strage/index.html
[18]. Lun, H., Filippone, F., Roger, D. C., & Poser, M. (n.d.). DESIGN AND CONSTRUCTION ASPECTS OF POST-TENSIONED LNG STORAGE TANKS IN EUROPE AND AUSTRALASIA. 6.
[19]. LNG global storage tank capacity by country 2020. (n.d.). Statista. Retrieved January 22, 2021, from https://www.statista.com/statistics/723079/lng-global-storage-tank-capacity-by-country/
[20]. Thierçault, J. (n.d.). CRYOGENIC ABOVE GROUND STORAGE TANKS: FULL CONTAINMENT AND MEMBRANE COMPARISON OF TECHNOLOGIES. 8.
[21]. Chamberlain, G. (2006). Management of large LNG hazards. International Gas Union World Gas Conference Papers, 5.
[22]. Jeon, G.-M., Park, J.-C., & Choi, S. (2021). Multiphase-thermal simulation on BOG/BOR estimation due to phase change in cryogenic liquid storage tanks. Applied Thermal Engineering, 184, 116264. https://doi.org/10.1016/j.applthermaleng.2020.116264
[23]. Hassanvand, A., Hashemabadi, S. H., & Bayat, M. (2010). Evaluation of gasoline evaporation during the tank splash loading by CFD techniques. International Communications in Heat and Mass Transfer, 37(7), 907–913. https://doi.org/10.1016/j.icheatmasstransfer.2010.05.011
[24]. Lee, J. H., Kim, Y. J., & Hwang, S. (2015). Computational study of LNG evaporation and heat diffusion through a LNG cargo tank membrane. Ocean Engineering, 106, 77–86. https://doi.org/10.1016/j.oceaneng.2015.06.045
[25]. Fu, J., Sunden, B., Chen, X., & Huang, Y. (2015). Influence of phase change on self-pressurization in cryogenic tanks under microgravity. Applied Thermal Engineering, 87, 225–
233. https://doi.org/10.1016/j.applthermaleng.2015.05.020 [26]. Zakaria, M. S., Osman, K., Saadun, M. N. A., Manaf, M. Z. A., & Mohd Hanafi, M. H.
(2013). Computational Simulation of Boil-Off Gas Formation inside Liquefied Natural Gas Tank Using Evaporation Model in ANSYS Fluent. Applied Mechanics and Materials; Trans Tech Publications Ltd. https://doi.org/10.4028/www.scientific.net/AMM.393.839
[27]. Ahammad, M., Liu, Y., Olewski, T., Véchot, L. N., & Mannan, M. S. (2016). Application of Computational Fluid Dynamics in Simulating Film Boiling of Cryogens. Industrial & Engineering Chemistry Research, 55(27), 7548–7557. https://doi.org/10.1021/acs.iecr.6b01013
71
[28]. Saleem, A., Farooq, S., Karimi, I. A., & Banerjee, R. (2018). A CFD simulation study of boiling mechanism and BOG generation in a full-scale LNG storage tank. Computers & Chemical Engineering, 115, 112–120. https://doi.org/10.1016/j.compchemeng.2018.04.003
[29]. Dobrota, D., Lalić, B., & Komar, I. (2013). Problem of Boil—Off in LNG Supply Chain. Transactions on Maritime Science, 02, 91–100. https://doi.org/10.7225/toms.v02.n02.001
[30]. 2019 World LNG Report. (n.d.). IGU. Retrieved January 23, 2021, from https://igu.org/news/2019-world-lng-report/
[31]. Wang, X., Xu, Y., Wang, S., Xu, Q., & Ho, T. C. (2020). Comprehensive study on boil-off gas generation from LNG road tankers under simultaneous impacts of heat leakage and transportation vibration. Fuel, 275, 117876. https://doi.org/10.1016/j.fuel.2020.117876
[32]. Chen, Q.-S., Wegrzyn, J., & Prasad, V. (2004). Analysis of temperature and pressure changes in liquefied natural gas (LNG) cryogenic tanks. Cryogenics, 44, 701–709. https://doi.org/10.1016/j.cryogenics.2004.03.020
[33]. Migliore, C., Migliore, C., Tubilleja, C., & Vesovic, V. (2015). Weathering prediction model for stored liquefied natural gas (LNG). Journal of Natural Gas Science and Engineering. https://doi.org/10.1016/J.JNGSE.2015.06.056
[34]. Yu, P., Yin, Y., Wei, Z., & Yue, Q. (2020). A prototype test of dynamic boil-off gas in liquefied natural gas tank containers. Applied Thermal Engineering, 180, 115817. https://doi.org/10.1016/j.applthermaleng.2020.115817
[35]. Term. (n.d.). Encyclopedia. Retrieved January 27, 2021, from https://www.wartsila.com/encyclopedia/term
[36]. Arrhenius, K., Karlsson, A., Hakonen, A., Ohlson, L., Yaghooby, H., & Büker, O. (2018). Variations of fuel composition during storage at Liquefied Natural Gas refuelling stations. Journal of Natural Gas Science and Engineering, 49, 317–323. https://doi.org/10.1016/j.jngse.2017.11.014
[37]. Huerta, F., & Vesovic, V. (2019). A realistic vapour phase heat transfer model for the weathering of LNG stored in large tanks. Energy, 174, 280–291. https://doi.org/10.1016/j.energy.2019.02.174
[38]. Shah, J. M., & Aarts, J. J. (1995). Effect of Weathering of LNG in Storage Tanks. In K. D. Timmerhaus (Ed.), Advances in Cryogenic Engineering (pp. 253–260). Springer US. https://doi.org/10.1007/978-1-4613-9847-9_31
[39]. Adom, E., Islam, S., & Ji, X. (2010). Modelling of Boil-Off Gas in LNG Tanks: A Case Study. Undefined. /paper/Modelling-of-Boil-Off-Gas-in-LNG-Tanks%3A-A-Case-Adom-Islam/700c138e68d114d6b593c4c7f2f2af8fd791ede1
[40]. Pellegrini, L. A., Moioli, S., Brignoli, F., & Bellini, C. (2014). LNG Technology: The Weathering in Above-Ground Storage Tanks. Industrial & Engineering Chemistry Research, 53(10), 3931–3937. https://doi.org/10.1021/ie404128d
[41]. Migliore, C., Salehi, A., & Vesovic, V. (2017). A non-equilibrium approach to modelling the weathering of stored Liquefied Natural Gas (LNG). Energy, 124, 684–692. https://doi.org/10.1016/j.energy.2017.02.068

72
[42]. Effendy, S., Khan, M. S., Farooq, S., & Karimi, I. A. (2017). Dynamic modelling and
optimization of an LNG storage tank in a regasification terminal with semi-analytical
solutions for N2-free LNG. Computers & Chemical Engineering, 99, 40–50.
https://doi.org/10.1016/j.compchemeng.2017.01.012
[43]. Roh, S., & Son, G. (2012). Numerical study of natural convection in a liquefied natural
gas tank. Journal of Mechanical Science and Technology, 26(10), 3133–3140.
https://doi.org/10.1007/s12206-012-0820-x
[44]. Wang, Z., Sharafian, A., & Mérida, W. (2020). Non-equilibrium thermodynamic model
for liquefied natural gas storage tanks. Energy, 190, 116412.
https://doi.org/10.1016/j.energy.2019.116412
[45]. Isothermal Properties. (n.d.). National Institute of Standards and Technology. Retrieved January 31, 2021, from https://webbook.nist.gov/cgi/fluid.cgi?ID=C74828&TUnit=K&PUnit=MPa&DUnit=mol%2Fl&HUnit=kJ%2Fmol&WUnit=m%2Fs&VisUnit=uPa*s&STUnit=N%2Fm&Type=IsoTherm&RefState=DEF&Action=Page
[46]. Lemmon, E. W., Huber, M. L., & McLinden, M. O. (2007). NIST Standard Reference Database 23: Reference Fluid Thermodynamic and Transport Properties-REFPROP, Version 8.0. https://www.nist.gov/publications/nist-standard-reference-database-23-reference-fluid-thermodynamic-and-transport-0
[47]. Beduz, C., & Scurlock, R. G. (1994). Evaporation Mechanisms and Instabilities in Cryogenic Liquids. In P. Kittel (Ed.), Advances in Cryogenic Engineering (pp. 1749–1757). Springer US. https://doi.org/10.1007/978-1-4615-2522-6_214
[48]. A Pressure Iteration Scheme for Two-Phase Flow Modeling. (2013). In Computational Methods for Two-Phase Flow and Particle Transport (Vol. 1–0, pp. 61–82). WORLD SCIENTIFIC. https://doi.org/10.1142/9789814460286_0004
[49]. Scurlock, R. G. (2016). Surface Evaporation of Cryogenic Liquids, Including LNG and LPG. In R. G. Scurlock (Ed.), Stratification, Rollover and Handling of LNG, LPG and Other Cryogenic Liquid Mixtures (pp. 41–62). Springer International Publishing. https://doi.org/10.1007/978-3-319-20696-7_4
[50]. Wood, D. A., & Kulitsa, M. (2018). Weathering/Ageing of Liquefied Natural Gas Cargoes During Marine Transport and Processing on Floating Storage Units and FSRU. Journal of Energy Resources Technology, 140(102901). https://doi.org/10.1115/1.4039981
[51]. Khan, M. S., Qyyum, M. A., Ali, W., Wazwaz, A., Ansari, K. B., & Lee, M. (2020). Energy Saving through Efficient BOG Prediction and Impact of Static Boil-off-Rate in Full Containment-Type LNG Storage Tank. Energies, 13(21), 5578. https://doi.org/10.3390/en13215578
73
[52]. Bergman T.l., Lavine A.s., Dewitt D.p., Incropera F.p. -Introduction To Heat Transfer-john Wiley & Sons (2011).pdf [jlk9j8k05045]. (n.d.). Retrieved February 2, 2021, from https://idoc.pub/download/bergman-tl-lavine-as-dewitt-dp-incropera-fp-introduction-to-heat-transfer-john-wiley-sons-2011pdf-jlk9j8k05045
[53]. Economic evaluation of BOG management systems with LNG cold energy recovery in LNG import terminals considering quantitative assessment of equipment failures | Elsevier Enhanced Reader. (n.d.). https://doi.org/10.1016/j.applthermaleng.2018.08.029
[54]. Methane—Thermophysical Properties. (n.d.). Retrieved February 6, 2021, from https://www.engineeringtoolbox.com/methane-d_1420.html
[55]. Churchill, S. W., & Chu, H. H. S. (1975). Correlating equations for laminar and turbulent free convection from a vertical plate. International Journal of Heat and Mass Transfer, 18(11), 1323–1329. https://doi.org/10.1016/0017-9310(75)90243-4
[56]. Thierçault, J. (n.d.). CRYOGENIC ABOVE GROUND STORAGE TANKS: FULL CONTAINMENT AND MEMBRANE COMPARISON OF TECHNOLOGIES. 8.
Copyright © 2022 FDOKUMEN