TerraSAR-X Data for Burn Severity Evaluation in Mediterranean Forests on Sloped Terrain
13
IEEE TRANSACTIONS ON GEOSCIENCE AND REMOTE SENSING, VOL. 48, NO. 2, FEBRUARY 2010 917 TerraSAR-X Data for Burn Severity Evaluation in Mediterranean Forests on Sloped Terrain Mihai Andrei Tanase, Fernando Pérez-Cabello, Juan de la Riva, and Maurizio Santoro, Member, IEEE Abstract—TerraSAR-X (TSX) dual-polarized synthetic aper- ture radar (SAR) data from a test site in Spain have been inves- tigated to determine the relationship between forest burn severity and SAR backscatter. The role of the local incidence angle on the backscatter coefficient has been also studied. Burn severity was estimated by means of composition burn index plots and the remotely sensed differenced normalized burn ratio index. To infer the potential of the TSX data for burn severity assessment, the determination coefficients obtained from linear regression analysis have been used. At horizontal transmit horizontal receive (HH) polarization, backscatter increased for slopes oriented toward the sensor and areas affected by high burn severity, whereas, at horizontal transmit vertical receive (HV) polarization, higher backscatter occurred for slopes oriented away from the sensor in areas of low burn severity. The dependence of the backscatter coefficient on topography for areas affected by forest fire has been confirmed. The HH backscatter presented a clear descending trend with the increase in local incidence angle, whereas the HV backscatter presented an ascending trend. The determination coefficients showed that, at HH polarization, better estimates of burn severity are obtained at low local incidence angles, whereas, for HV polarization, the best estimates are obtained at high local incidence angles. The dual-polarized X-band SAR data showed potential for burn severity estimation in the Mediterranean envi- ronment if local incidence angle is accounted for. Index Terms—Burn severity, Mediterranean forest, TerraSAR-X (TSX), topography. I. I NTRODUCTION F OREST fire is a major ecological accident that has a profound influence on the natural cycle of vegetation succession and on ecosystem dynamics. The high number of forest fires occurring every year constitutes one of the major degradation factors of Mediterranean ecosystems [1]. Effective fire suppression during the last 60–70 years has increased surface and crown fuel loadings in many forests and woodlands settings, such high accumulations fostering large, intense, and severe wildland fires [2]. Rural abandonment in the European Mediterranean basin has implied an unusual accumulation of forest fuels, which, coupled with the increasing use of forests Manuscript received January 30, 2009; revised May 3, 2009. First published September 22, 2009; current version published January 20, 2010. This work was supported in part by the Spanish Ministry of Education and Science and in part by the European Social Fund under Formacion Personal Investigador Grant BES-2006-11684 and Project CGL2005-04863. M. A. Tanase, F. Pérez-Cabello, and J. de la Riva are with the Department of Geography, University of Zaragoza, 50009 Zaragoza, Spain (e-mail: mihai@ tma.ro; [email protected]; [email protected]). M. Santoro is with GAMMA Remote Sensing AG, 3073 Gümligen, Switzerland (e-mail: [email protected]). Color versions of one or more of the figures in this paper are available online at http://ieeexplore.ieee.org. Digital Object Identifier 10.1109/TGRS.2009.2025943 as a recreational resource, has incurred a higher incidence of man-induced fires [3]. Since 1960, the number of fires and surface burns in the European Mediterranean areas has increased constantly. During the 1990s, the average number of fires per year increased by more than 70%, while the average burnt area per annum decreased by approximately 30%. A total of 575 531 ha was burned in southern European Union member states during 2007, which is above the average of the last 28 years [4], making fires an important environmental problem. Remotely sensed data can contribute to a better, cost ef- fective, objective, and time-saving method to monitor [5] and quantify location [6], extent, and intensity of fire events [3]. Burn severity is an important indicator of fire impacts on the ecosystem, which is defined as the magnitude of change between pre- and postfire status of the site. Usually, detecting burn severity from space is accomplished using vegetation indexes derived from optical sensors. Empirical modeling was used to correlate ground-measured burn severity to remotely sensed indexes derived from a single postburn image or from using a bitemporal approach (pre- and postburn images) [7]– [10]. Nowadays, the normalized burn ratio (NBR) [11] is one of the most widely used remotely sensed spectral indexes for burn severity assessment. It combines information from near- infrared (NIR) and midinfrared wavelengths to compute values in a similar way as the normalized differenced vegetation index (NDVI). The difference between NBRs computed for pre- and postfire images [differenced NBR (dNBR)] is commonly used for burn severity mapping. The dNBR provides a scale of changes with respect to the prefire status, unburned area retain- ing values that are close to zero (i.e., little or no change). In the recent years, the NBR and the dNBR have been intensively used to estimate burn severity across a wide variety of sites from boreal to Mediterranean forests [10], [12]–[15]. Burn severity estimation by means of the dNBR uses as refer- ence data a field indicator called composition burn index (CBI) proposed in [16] or its version adapted to local conditions [8], [17]. The CBI was designed to evaluate the magnitude of fire ef- fects across all strata from an ecological perspective by evaluat- ing the ground fire effects. The average conditions of vegetation are visually examined within a radius of 15 m, and the degree of change with respect to the prefire status is recorded in values from zero (no change) to three (100% change). Generally, the dNBR coupled with the CBI provided accurate detection of burn severity in most of the environments, the determination coefficients reported being usually high (R 2 > 0.75) [8], [10], [12], [13]. However, some authors [12], [18], [19] reported weaker relationships between the dNBR and the CBI in boreal forests. This was attributed partly to the dNBR’s inability to discern between moderate- and high-severity burn sites and 0196-2892/$26.00 © 2009 IEEE Authorized licensed use limited to: University of Maryland College Park. Downloaded on March 18,2010 at 14:15:33 EDT from IEEE Xplore. Restrictions apply.
-
Upload
independent -
Category
Documents
-
view
1 -
download
0
Transcript of TerraSAR-X Data for Burn Severity Evaluation in Mediterranean Forests on Sloped Terrain
IEEE TRANSACTIONS ON GEOSCIENCE AND REMOTE SENSING, VOL. 48, NO. 2, FEBRUARY 2010 917
TerraSAR-X Data for Burn Severity Evaluation inMediterranean Forests on Sloped Terrain
Mihai Andrei Tanase, Fernando Pérez-Cabello, Juan de la Riva, and Maurizio Santoro, Member, IEEE
Abstract—TerraSAR-X (TSX) dual-polarized synthetic aper-ture radar (SAR) data from a test site in Spain have been inves-tigated to determine the relationship between forest burn severityand SAR backscatter. The role of the local incidence angle onthe backscatter coefficient has been also studied. Burn severitywas estimated by means of composition burn index plots and theremotely sensed differenced normalized burn ratio index. To inferthe potential of the TSX data for burn severity assessment, thedetermination coefficients obtained from linear regression analysishave been used. At horizontal transmit horizontal receive (HH)polarization, backscatter increased for slopes oriented towardthe sensor and areas affected by high burn severity, whereas,at horizontal transmit vertical receive (HV) polarization, higherbackscatter occurred for slopes oriented away from the sensorin areas of low burn severity. The dependence of the backscattercoefficient on topography for areas affected by forest fire hasbeen confirmed. The HH backscatter presented a clear descendingtrend with the increase in local incidence angle, whereas theHV backscatter presented an ascending trend. The determinationcoefficients showed that, at HH polarization, better estimates ofburn severity are obtained at low local incidence angles, whereas,for HV polarization, the best estimates are obtained at high localincidence angles. The dual-polarized X-band SAR data showedpotential for burn severity estimation in the Mediterranean envi-ronment if local incidence angle is accounted for.
Index Terms—Burn severity, Mediterranean forest,TerraSAR-X (TSX), topography.
I. INTRODUCTION
FOREST fire is a major ecological accident that has aprofound influence on the natural cycle of vegetation
succession and on ecosystem dynamics. The high number offorest fires occurring every year constitutes one of the majordegradation factors of Mediterranean ecosystems [1]. Effectivefire suppression during the last 60–70 years has increasedsurface and crown fuel loadings in many forests and woodlandssettings, such high accumulations fostering large, intense, andsevere wildland fires [2]. Rural abandonment in the EuropeanMediterranean basin has implied an unusual accumulation offorest fuels, which, coupled with the increasing use of forests
Manuscript received January 30, 2009; revised May 3, 2009. First publishedSeptember 22, 2009; current version published January 20, 2010. This workwas supported in part by the Spanish Ministry of Education and Science and inpart by the European Social Fund under Formacion Personal Investigador GrantBES-2006-11684 and Project CGL2005-04863.
M. A. Tanase, F. Pérez-Cabello, and J. de la Riva are with the Departmentof Geography, University of Zaragoza, 50009 Zaragoza, Spain (e-mail: [email protected]; [email protected]; [email protected]).
M. Santoro is with GAMMA Remote Sensing AG, 3073 Gümligen,Switzerland (e-mail: [email protected]).
Color versions of one or more of the figures in this paper are available onlineat http://ieeexplore.ieee.org.
Digital Object Identifier 10.1109/TGRS.2009.2025943
as a recreational resource, has incurred a higher incidenceof man-induced fires [3]. Since 1960, the number of firesand surface burns in the European Mediterranean areas hasincreased constantly. During the 1990s, the average number offires per year increased by more than 70%, while the averageburnt area per annum decreased by approximately 30%. Atotal of 575 531 ha was burned in southern European Unionmember states during 2007, which is above the average ofthe last 28 years [4], making fires an important environmentalproblem.
Remotely sensed data can contribute to a better, cost ef-fective, objective, and time-saving method to monitor [5] andquantify location [6], extent, and intensity of fire events [3].Burn severity is an important indicator of fire impacts onthe ecosystem, which is defined as the magnitude of changebetween pre- and postfire status of the site. Usually, detectingburn severity from space is accomplished using vegetationindexes derived from optical sensors. Empirical modeling wasused to correlate ground-measured burn severity to remotelysensed indexes derived from a single postburn image or fromusing a bitemporal approach (pre- and postburn images) [7]–[10]. Nowadays, the normalized burn ratio (NBR) [11] is oneof the most widely used remotely sensed spectral indexes forburn severity assessment. It combines information from near-infrared (NIR) and midinfrared wavelengths to compute valuesin a similar way as the normalized differenced vegetation index(NDVI). The difference between NBRs computed for pre- andpostfire images [differenced NBR (dNBR)] is commonly usedfor burn severity mapping. The dNBR provides a scale ofchanges with respect to the prefire status, unburned area retain-ing values that are close to zero (i.e., little or no change). Inthe recent years, the NBR and the dNBR have been intensivelyused to estimate burn severity across a wide variety of sites fromboreal to Mediterranean forests [10], [12]–[15].
Burn severity estimation by means of the dNBR uses as refer-ence data a field indicator called composition burn index (CBI)proposed in [16] or its version adapted to local conditions [8],[17]. The CBI was designed to evaluate the magnitude of fire ef-fects across all strata from an ecological perspective by evaluat-ing the ground fire effects. The average conditions of vegetationare visually examined within a radius of 15 m, and the degreeof change with respect to the prefire status is recorded in valuesfrom zero (no change) to three (100% change). Generally, thedNBR coupled with the CBI provided accurate detection ofburn severity in most of the environments, the determinationcoefficients reported being usually high (R2 > 0.75) [8], [10],[12], [13]. However, some authors [12], [18], [19] reportedweaker relationships between the dNBR and the CBI in borealforests. This was attributed partly to the dNBR’s inability todiscern between moderate- and high-severity burn sites and
0196-2892/$26.00 © 2009 IEEE
Authorized licensed use limited to: University of Maryland College Park. Downloaded on March 18,2010 at 14:15:33 EDT from IEEE Xplore. Restrictions apply.
918 IEEE TRANSACTIONS ON GEOSCIENCE AND REMOTE SENSING, VOL. 48, NO. 2, FEBRUARY 2010
partly to the variation in topography, solar elevation angle [20],or specific fuel conditions. For Mediterranean climate, highdetermination coefficients between the dNBR and the CBI havebeen reported [17], [21].
Despite the extensive archives of spaceborne synthetic aper-ture radar (SAR) data, few studies were carried out havingforest fires as a topic. Most of them were focused on burntarea mapping in boreal or tropical forests [22]–[30]. Increasedbackscatter from burned areas was attributed to decreasedattenuation, strong trunk–ground interactions, and changes insoil moisture [31], [32]. For the Mediterranean basin, [33]and [34] showed that multitemporal SAR data could be usedfor burnt area mapping and suggested that accurate resultscould be achieved if slope is taken into account. Previousstudies [31], [35] showed a strong dependence of fire scardiscrimination power on the changes in dielectric properties ofthe scattering surfaces due to changes in moisture conditionsof the burned area. Precipitations during the fire season arerare in the Mediterranean basin, and, therefore, dry conditionscould limit the applicability of the SAR data for burn scaridentification. However, the lack of rain eliminates one ofthe most important sources of radar backscatter variability:moisture. The lack of moisture could be important when tryingto differentiate among fire severity levels since backscattervariability due to moisture variation could mask the variabilitydue to burn severity.
Backscatter from forests includes components from crown,direct backscatter from trunk, direct backscatter from ground,crown–ground backscatter, and trunk–ground backscatter (dou-ble bounce). At X-band (λ ≈ 3 cm; f ≈ 9 GHz), microwavesmostly interact with leaves, twigs and small branches, scat-tering from tree crowns being the predominant backscatteringcomponent. The contribution of the understory and the forestfloor is primarily conditioned by canopy architecture (e.g.,crown closure, shape, etc.) and look angle, an attenuation of20 dB (two-ways) being found for coniferous trees [36]. It wasshown [37] that the removal of leaves reduces the backscatter,and the elements of a size that is similar with the wavelength(e.g., petioles) can constitute important sources for microwavescattering. In general, horizontally polarized beams are scat-tered more by cylindrical elements with a near-horizontal ori-entation, whereas vertically polarized beams are scattered moreby vertically oriented elements. Sensitivity to forest parameters(e.g., stem biomass, tree height, etc.) is relatively low at X-band,reaching 2–3 dB for volumes that are up to 400 m3/ha [38],[39]. Higher linear correlation (r) between the radar backscatterand the stem volume was found at HV polarization (r = 0.60)than at HH or vertical transmit vertical receive polarizations(r = 0.31 and 0.38, respectively) [39]. Penetration depths ofup to 7.5 m were documented for pine forests at X-band,the highest values being registered for mature forests (i.e.,decrease stand density) [38], ground exposure or penetrationthrough crown gaps being of major influence for backscatteringmechanism.
Crown fire in coniferous forests often results in completeneedle removal, small branches and twigs becoming the mostimportant backscatter source. Due to the lack of needles athigh burn severities, an increase in backscatter ground com-ponent is expected, while the backscatter from the crown
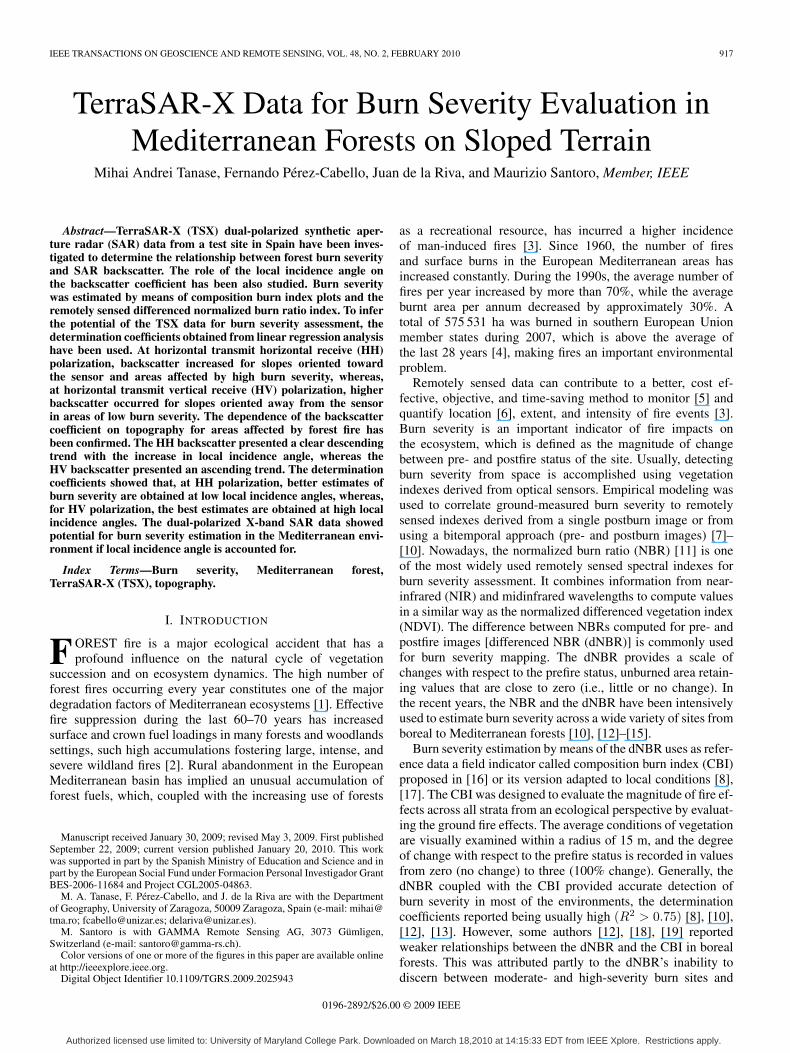
Fig. 1. General location of the Zuera study area.
should decrease [40]. Therefore, at HH polarization, higherbackscatter coefficients are expected for increased severitylevels, while, at HV polarization, backscatter levels shoulddiminish in highly burned areas. Nevertheless, the amount ofeach component should strongly be affected by the local inci-dence angle (i.e., the angle of incident illumination with respectto the local slope). Substantial changes in signal responseare expected for local incidence angle variations particularlyfor steep satellite viewing geometries. The image brightnessper pixel is sensitive to topography [41], and, therefore, thelocal incidence angle could be extremely relevant in roughenvironments such as the Mediterranean basin. The path trav-eled through forest layers increases with the local incidenceangle, higher return being expected at high incidence anglesparticularly for cross-polarized beams. Conversely, the directscatter from the ground decreases, leading to an increase inforest/nonforest contrast. Backscatter dependence on the inci-dence angle has been studied in [42] for forest and pastures,different trends being registered between cross- and copolarizedbeams. At C-band, volume scattering appears to dominate,but this dominance is reduced at low incidence angles assurface scattering begins to take over. Wavelength-dependentcrossover points, where volume scattering becomes more im-portant than surface scattering, were found for both forest andpastures.
Few studies have dealt with burn severity assessment [28],[29], [31], [43] using SAR data, most of them having as mainobjective other fire-related ecosystem properties. None of theauthors used as reference data the CBI which, nowadays, iswidely accepted for field burn damage estimation, and, moreimportantly, no research was undertaken in the Mediterraneanbasin, which present specific challenges to remote sensingsystems: steep topography, high landscape fragmentation, andintensive human intervention. In this paper, we assumed thatfire impacts on forests could be assessed using X-band SARdata, and we further investigated on the hypothesis of local inci-dence angle influence on the relation between burn severity andbackscatter. Although X-band backscatter presents, in general,weak forest/nonforest contrast, the metric scale of data acquiredby a TerraSAR-X (TSX) sensor in stripmap (SM) mode canbe of advantage in a highly fragmented landscape such as the
Authorized licensed use limited to: University of Maryland College Park. Downloaded on March 18,2010 at 14:15:33 EDT from IEEE Xplore. Restrictions apply.
TANASE et al.: TSX DATA FOR BURN SEVERITY EVALUATION 919
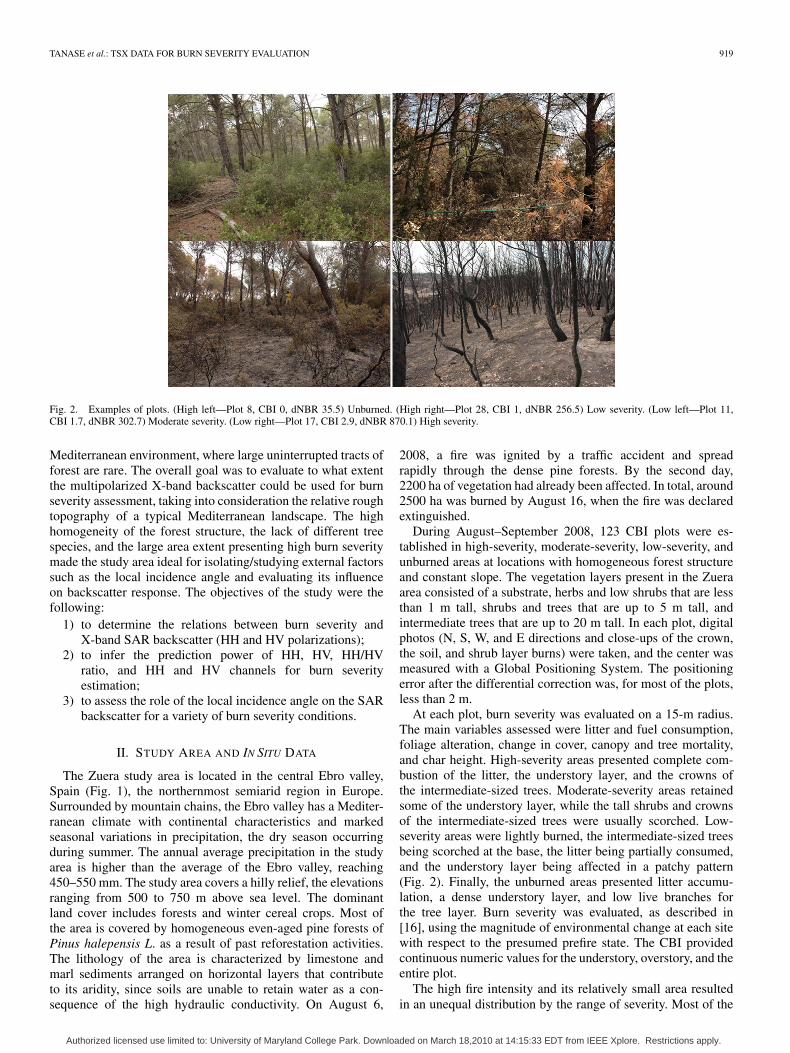
Fig. 2. Examples of plots. (High left—Plot 8, CBI 0, dNBR 35.5) Unburned. (High right—Plot 28, CBI 1, dNBR 256.5) Low severity. (Low left—Plot 11,CBI 1.7, dNBR 302.7) Moderate severity. (Low right—Plot 17, CBI 2.9, dNBR 870.1) High severity.
Mediterranean environment, where large uninterrupted tracts offorest are rare. The overall goal was to evaluate to what extentthe multipolarized X-band backscatter could be used for burnseverity assessment, taking into consideration the relative roughtopography of a typical Mediterranean landscape. The highhomogeneity of the forest structure, the lack of different treespecies, and the large area extent presenting high burn severitymade the study area ideal for isolating/studying external factorssuch as the local incidence angle and evaluating its influenceon backscatter response. The objectives of the study were thefollowing:
1) to determine the relations between burn severity andX-band SAR backscatter (HH and HV polarizations);
2) to infer the prediction power of HH, HV, HH/HVratio, and HH and HV channels for burn severityestimation;
3) to assess the role of the local incidence angle on the SARbackscatter for a variety of burn severity conditions.
II. STUDY AREA AND IN SITU DATA
The Zuera study area is located in the central Ebro valley,Spain (Fig. 1), the northernmost semiarid region in Europe.Surrounded by mountain chains, the Ebro valley has a Mediter-ranean climate with continental characteristics and markedseasonal variations in precipitation, the dry season occurringduring summer. The annual average precipitation in the studyarea is higher than the average of the Ebro valley, reaching450–550 mm. The study area covers a hilly relief, the elevationsranging from 500 to 750 m above sea level. The dominantland cover includes forests and winter cereal crops. Most ofthe area is covered by homogeneous even-aged pine forests ofPinus halepensis L. as a result of past reforestation activities.The lithology of the area is characterized by limestone andmarl sediments arranged on horizontal layers that contributeto its aridity, since soils are unable to retain water as a con-sequence of the high hydraulic conductivity. On August 6,
2008, a fire was ignited by a traffic accident and spreadrapidly through the dense pine forests. By the second day,2200 ha of vegetation had already been affected. In total, around2500 ha was burned by August 16, when the fire was declaredextinguished.
During August–September 2008, 123 CBI plots were es-tablished in high-severity, moderate-severity, low-severity, andunburned areas at locations with homogeneous forest structureand constant slope. The vegetation layers present in the Zueraarea consisted of a substrate, herbs and low shrubs that are lessthan 1 m tall, shrubs and trees that are up to 5 m tall, andintermediate trees that are up to 20 m tall. In each plot, digitalphotos (N, S, W, and E directions and close-ups of the crown,the soil, and shrub layer burns) were taken, and the center wasmeasured with a Global Positioning System. The positioningerror after the differential correction was, for most of the plots,less than 2 m.
At each plot, burn severity was evaluated on a 15-m radius.The main variables assessed were litter and fuel consumption,foliage alteration, change in cover, canopy and tree mortality,and char height. High-severity areas presented complete com-bustion of the litter, the understory layer, and the crowns ofthe intermediate-sized trees. Moderate-severity areas retainedsome of the understory layer, while the tall shrubs and crownsof the intermediate-sized trees were usually scorched. Low-severity areas were lightly burned, the intermediate-sized treesbeing scorched at the base, the litter being partially consumed,and the understory layer being affected in a patchy pattern(Fig. 2). Finally, the unburned areas presented litter accumu-lation, a dense understory layer, and low live branches forthe tree layer. Burn severity was evaluated, as described in[16], using the magnitude of environmental change at each sitewith respect to the presumed prefire state. The CBI providedcontinuous numeric values for the understory, overstory, and theentire plot.
The high fire intensity and its relatively small area resultedin an unequal distribution by the range of severity. Most of the
Authorized licensed use limited to: University of Maryland College Park. Downloaded on March 18,2010 at 14:15:33 EDT from IEEE Xplore. Restrictions apply.
920 IEEE TRANSACTIONS ON GEOSCIENCE AND REMOTE SENSING, VOL. 48, NO. 2, FEBRUARY 2010
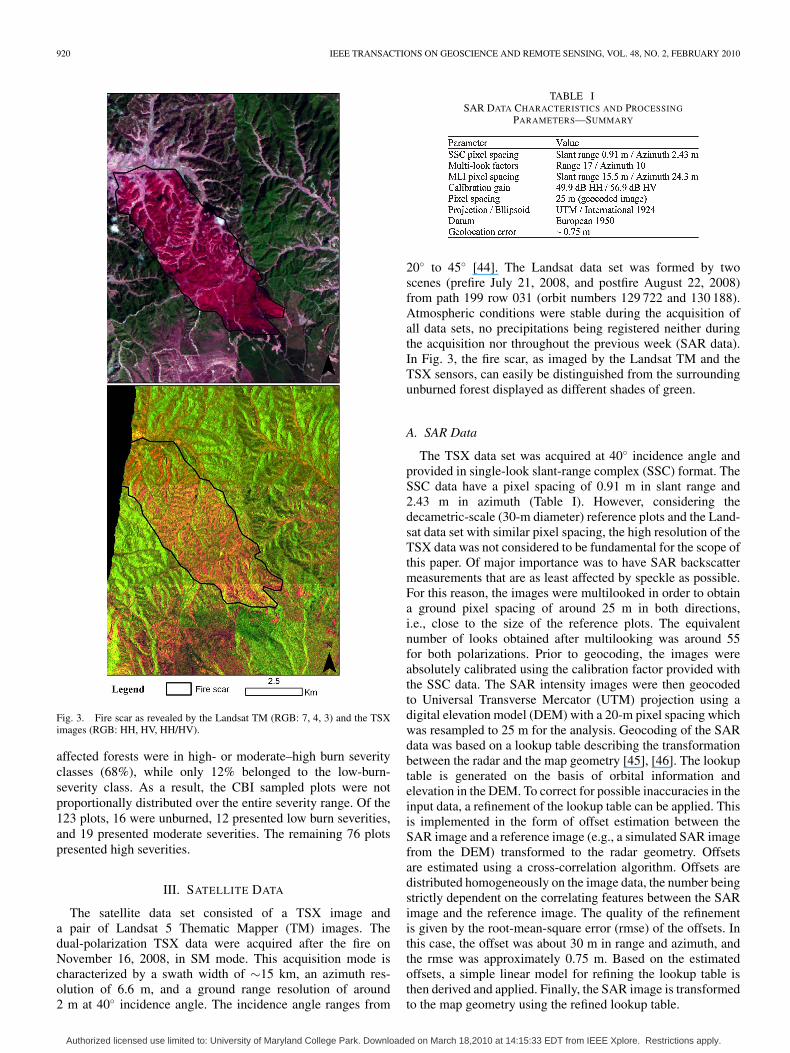
Fig. 3. Fire scar as revealed by the Landsat TM (RGB: 7, 4, 3) and the TSXimages (RGB: HH, HV, HH/HV).
affected forests were in high- or moderate–high burn severityclasses (68%), while only 12% belonged to the low-burn-severity class. As a result, the CBI sampled plots were notproportionally distributed over the entire severity range. Of the123 plots, 16 were unburned, 12 presented low burn severities,and 19 presented moderate severities. The remaining 76 plotspresented high severities.
III. SATELLITE DATA
The satellite data set consisted of a TSX image anda pair of Landsat 5 Thematic Mapper (TM) images. Thedual-polarization TSX data were acquired after the fire onNovember 16, 2008, in SM mode. This acquisition mode ischaracterized by a swath width of ∼15 km, an azimuth res-olution of 6.6 m, and a ground range resolution of around2 m at 40◦ incidence angle. The incidence angle ranges from
TABLE ISAR DATA CHARACTERISTICS AND PROCESSING
PARAMETERS—SUMMARY
20◦ to 45◦ [44]. The Landsat data set was formed by twoscenes (prefire July 21, 2008, and postfire August 22, 2008)from path 199 row 031 (orbit numbers 129 722 and 130 188).Atmospheric conditions were stable during the acquisition ofall data sets, no precipitations being registered neither duringthe acquisition nor throughout the previous week (SAR data).In Fig. 3, the fire scar, as imaged by the Landsat TM and theTSX sensors, can easily be distinguished from the surroundingunburned forest displayed as different shades of green.
A. SAR Data
The TSX data set was acquired at 40◦ incidence angle andprovided in single-look slant-range complex (SSC) format. TheSSC data have a pixel spacing of 0.91 m in slant range and2.43 m in azimuth (Table I). However, considering thedecametric-scale (30-m diameter) reference plots and the Land-sat data set with similar pixel spacing, the high resolution of theTSX data was not considered to be fundamental for the scope ofthis paper. Of major importance was to have SAR backscattermeasurements that are as least affected by speckle as possible.For this reason, the images were multilooked in order to obtaina ground pixel spacing of around 25 m in both directions,i.e., close to the size of the reference plots. The equivalentnumber of looks obtained after multilooking was around 55for both polarizations. Prior to geocoding, the images wereabsolutely calibrated using the calibration factor provided withthe SSC data. The SAR intensity images were then geocodedto Universal Transverse Mercator (UTM) projection using adigital elevation model (DEM) with a 20-m pixel spacing whichwas resampled to 25 m for the analysis. Geocoding of the SARdata was based on a lookup table describing the transformationbetween the radar and the map geometry [45], [46]. The lookuptable is generated on the basis of orbital information andelevation in the DEM. To correct for possible inaccuracies in theinput data, a refinement of the lookup table can be applied. Thisis implemented in the form of offset estimation between theSAR image and a reference image (e.g., a simulated SAR imagefrom the DEM) transformed to the radar geometry. Offsetsare estimated using a cross-correlation algorithm. Offsets aredistributed homogeneously on the image data, the number beingstrictly dependent on the correlating features between the SARimage and the reference image. The quality of the refinementis given by the root-mean-square error (rmse) of the offsets. Inthis case, the offset was about 30 m in range and azimuth, andthe rmse was approximately 0.75 m. Based on the estimatedoffsets, a simple linear model for refining the lookup table isthen derived and applied. Finally, the SAR image is transformedto the map geometry using the refined lookup table.
Authorized licensed use limited to: University of Maryland College Park. Downloaded on March 18,2010 at 14:15:33 EDT from IEEE Xplore. Restrictions apply.
TANASE et al.: TSX DATA FOR BURN SEVERITY EVALUATION 921
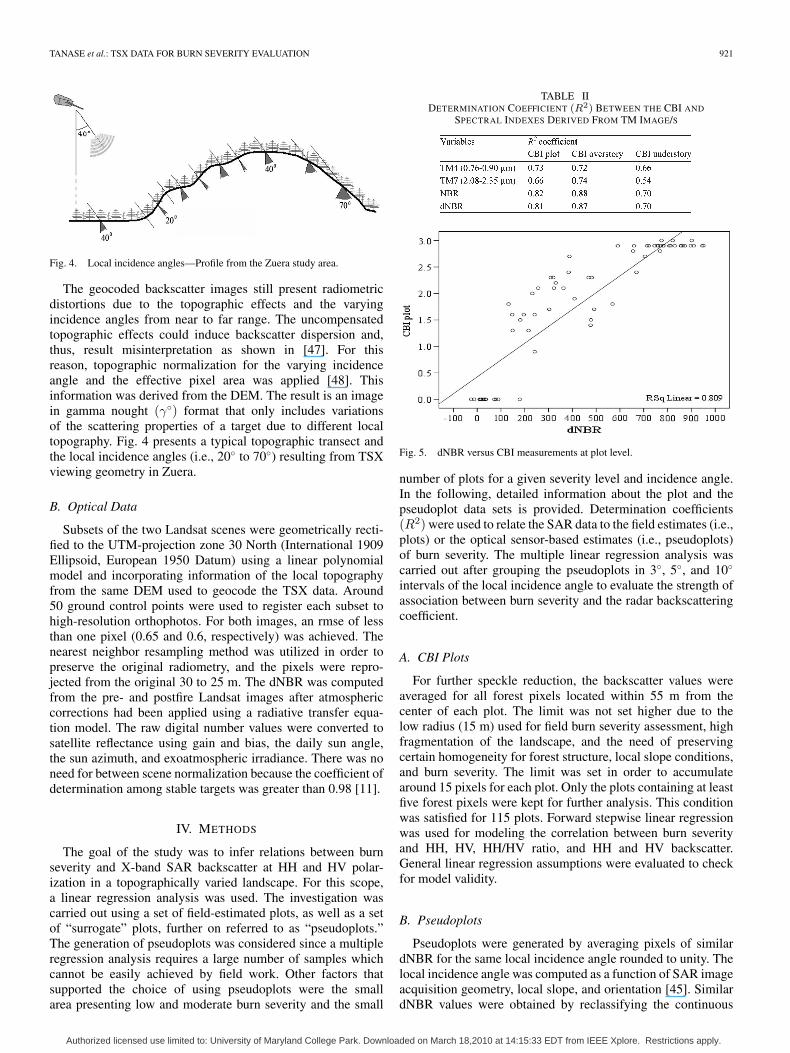
Fig. 4. Local incidence angles—Profile from the Zuera study area.
The geocoded backscatter images still present radiometricdistortions due to the topographic effects and the varyingincidence angles from near to far range. The uncompensatedtopographic effects could induce backscatter dispersion and,thus, result misinterpretation as shown in [47]. For thisreason, topographic normalization for the varying incidenceangle and the effective pixel area was applied [48]. Thisinformation was derived from the DEM. The result is an imagein gamma nought (γ◦) format that only includes variationsof the scattering properties of a target due to different localtopography. Fig. 4 presents a typical topographic transect andthe local incidence angles (i.e., 20◦ to 70◦) resulting from TSXviewing geometry in Zuera.
B. Optical Data
Subsets of the two Landsat scenes were geometrically recti-fied to the UTM-projection zone 30 North (International 1909Ellipsoid, European 1950 Datum) using a linear polynomialmodel and incorporating information of the local topographyfrom the same DEM used to geocode the TSX data. Around50 ground control points were used to register each subset tohigh-resolution orthophotos. For both images, an rmse of lessthan one pixel (0.65 and 0.6, respectively) was achieved. Thenearest neighbor resampling method was utilized in order topreserve the original radiometry, and the pixels were repro-jected from the original 30 to 25 m. The dNBR was computedfrom the pre- and postfire Landsat images after atmosphericcorrections had been applied using a radiative transfer equa-tion model. The raw digital number values were converted tosatellite reflectance using gain and bias, the daily sun angle,the sun azimuth, and exoatmospheric irradiance. There was noneed for between scene normalization because the coefficient ofdetermination among stable targets was greater than 0.98 [11].
IV. METHODS
The goal of the study was to infer relations between burnseverity and X-band SAR backscatter at HH and HV polar-ization in a topographically varied landscape. For this scope,a linear regression analysis was used. The investigation wascarried out using a set of field-estimated plots, as well as a setof “surrogate” plots, further on referred to as “pseudoplots.”The generation of pseudoplots was considered since a multipleregression analysis requires a large number of samples whichcannot be easily achieved by field work. Other factors thatsupported the choice of using pseudoplots were the smallarea presenting low and moderate burn severity and the small
TABLE IIDETERMINATION COEFFICIENT (R2) BETWEEN THE CBI AND
SPECTRAL INDEXES DERIVED FROM TM IMAGE/S
Fig. 5. dNBR versus CBI measurements at plot level.
number of plots for a given severity level and incidence angle.In the following, detailed information about the plot and thepseudoplot data sets is provided. Determination coefficients(R2) were used to relate the SAR data to the field estimates (i.e.,plots) or the optical sensor-based estimates (i.e., pseudoplots)of burn severity. The multiple linear regression analysis wascarried out after grouping the pseudoplots in 3◦, 5◦, and 10◦
intervals of the local incidence angle to evaluate the strength ofassociation between burn severity and the radar backscatteringcoefficient.
A. CBI Plots
For further speckle reduction, the backscatter values wereaveraged for all forest pixels located within 55 m from thecenter of each plot. The limit was not set higher due to thelow radius (15 m) used for field burn severity assessment, highfragmentation of the landscape, and the need of preservingcertain homogeneity for forest structure, local slope conditions,and burn severity. The limit was set in order to accumulatearound 15 pixels for each plot. Only the plots containing at leastfive forest pixels were kept for further analysis. This conditionwas satisfied for 115 plots. Forward stepwise linear regressionwas used for modeling the correlation between burn severityand HH, HV, HH/HV ratio, and HH and HV backscatter.General linear regression assumptions were evaluated to checkfor model validity.
B. Pseudoplots
Pseudoplots were generated by averaging pixels of similardNBR for the same local incidence angle rounded to unity. Thelocal incidence angle was computed as a function of SAR imageacquisition geometry, local slope, and orientation [45]. SimilardNBR values were obtained by reclassifying the continuous
Authorized licensed use limited to: University of Maryland College Park. Downloaded on March 18,2010 at 14:15:33 EDT from IEEE Xplore. Restrictions apply.
922 IEEE TRANSACTIONS ON GEOSCIENCE AND REMOTE SENSING, VOL. 48, NO. 2, FEBRUARY 2010
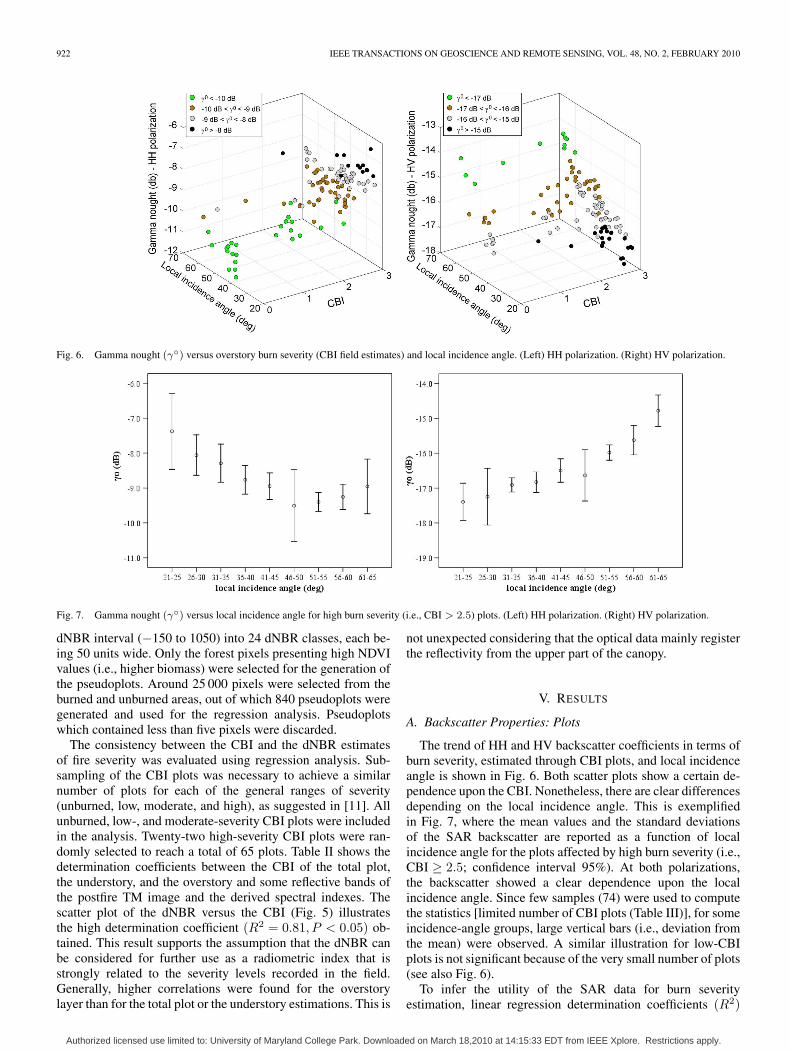
Fig. 6. Gamma nought (γ◦) versus overstory burn severity (CBI field estimates) and local incidence angle. (Left) HH polarization. (Right) HV polarization.
Fig. 7. Gamma nought (γ◦) versus local incidence angle for high burn severity (i.e., CBI > 2.5) plots. (Left) HH polarization. (Right) HV polarization.
dNBR interval (−150 to 1050) into 24 dNBR classes, each be-ing 50 units wide. Only the forest pixels presenting high NDVIvalues (i.e., higher biomass) were selected for the generation ofthe pseudoplots. Around 25 000 pixels were selected from theburned and unburned areas, out of which 840 pseudoplots weregenerated and used for the regression analysis. Pseudoplotswhich contained less than five pixels were discarded.
The consistency between the CBI and the dNBR estimatesof fire severity was evaluated using regression analysis. Sub-sampling of the CBI plots was necessary to achieve a similarnumber of plots for each of the general ranges of severity(unburned, low, moderate, and high), as suggested in [11]. Allunburned, low-, and moderate-severity CBI plots were includedin the analysis. Twenty-two high-severity CBI plots were ran-domly selected to reach a total of 65 plots. Table II shows thedetermination coefficients between the CBI of the total plot,the understory, and the overstory and some reflective bands ofthe postfire TM image and the derived spectral indexes. Thescatter plot of the dNBR versus the CBI (Fig. 5) illustratesthe high determination coefficient (R2 = 0.81, P < 0.05) ob-tained. This result supports the assumption that the dNBR canbe considered for further use as a radiometric index that isstrongly related to the severity levels recorded in the field.Generally, higher correlations were found for the overstorylayer than for the total plot or the understory estimations. This is
not unexpected considering that the optical data mainly registerthe reflectivity from the upper part of the canopy.
V. RESULTS
A. Backscatter Properties: Plots
The trend of HH and HV backscatter coefficients in terms ofburn severity, estimated through CBI plots, and local incidenceangle is shown in Fig. 6. Both scatter plots show a certain de-pendence upon the CBI. Nonetheless, there are clear differencesdepending on the local incidence angle. This is exemplifiedin Fig. 7, where the mean values and the standard deviationsof the SAR backscatter are reported as a function of localincidence angle for the plots affected by high burn severity (i.e.,CBI ≥ 2.5; confidence interval 95%). At both polarizations,the backscatter showed a clear dependence upon the localincidence angle. Since few samples (74) were used to computethe statistics [limited number of CBI plots (Table III)], for someincidence-angle groups, large vertical bars (i.e., deviation fromthe mean) were observed. A similar illustration for low-CBIplots is not significant because of the very small number of plots(see also Fig. 6).
To infer the utility of the SAR data for burn severityestimation, linear regression determination coefficients (R2)
Authorized licensed use limited to: University of Maryland College Park. Downloaded on March 18,2010 at 14:15:33 EDT from IEEE Xplore. Restrictions apply.
TANASE et al.: TSX DATA FOR BURN SEVERITY EVALUATION 923
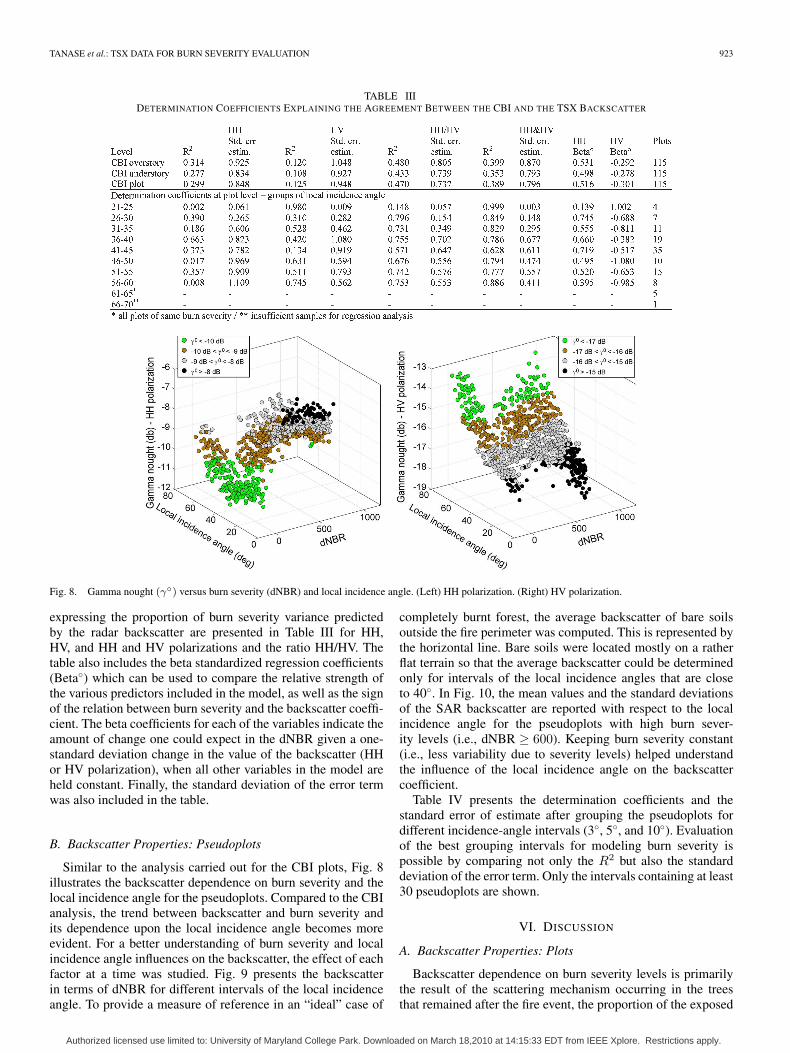
TABLE IIIDETERMINATION COEFFICIENTS EXPLAINING THE AGREEMENT BETWEEN THE CBI AND THE TSX BACKSCATTER
Fig. 8. Gamma nought (γ◦) versus burn severity (dNBR) and local incidence angle. (Left) HH polarization. (Right) HV polarization.
expressing the proportion of burn severity variance predictedby the radar backscatter are presented in Table III for HH,HV, and HH and HV polarizations and the ratio HH/HV. Thetable also includes the beta standardized regression coefficients(Beta◦) which can be used to compare the relative strength ofthe various predictors included in the model, as well as the signof the relation between burn severity and the backscatter coeffi-cient. The beta coefficients for each of the variables indicate theamount of change one could expect in the dNBR given a one-standard deviation change in the value of the backscatter (HHor HV polarization), when all other variables in the model areheld constant. Finally, the standard deviation of the error termwas also included in the table.
B. Backscatter Properties: Pseudoplots
Similar to the analysis carried out for the CBI plots, Fig. 8illustrates the backscatter dependence on burn severity and thelocal incidence angle for the pseudoplots. Compared to the CBIanalysis, the trend between backscatter and burn severity andits dependence upon the local incidence angle becomes moreevident. For a better understanding of burn severity and localincidence angle influences on the backscatter, the effect of eachfactor at a time was studied. Fig. 9 presents the backscatterin terms of dNBR for different intervals of the local incidenceangle. To provide a measure of reference in an “ideal” case of
completely burnt forest, the average backscatter of bare soilsoutside the fire perimeter was computed. This is represented bythe horizontal line. Bare soils were located mostly on a ratherflat terrain so that the average backscatter could be determinedonly for intervals of the local incidence angles that are closeto 40◦. In Fig. 10, the mean values and the standard deviationsof the SAR backscatter are reported with respect to the localincidence angle for the pseudoplots with high burn sever-ity levels (i.e., dNBR ≥ 600). Keeping burn severity constant(i.e., less variability due to severity levels) helped understandthe influence of the local incidence angle on the backscattercoefficient.
Table IV presents the determination coefficients and thestandard error of estimate after grouping the pseudoplots fordifferent incidence-angle intervals (3◦, 5◦, and 10◦). Evaluationof the best grouping intervals for modeling burn severity ispossible by comparing not only the R2 but also the standarddeviation of the error term. Only the intervals containing at least30 pseudoplots are shown.
VI. DISCUSSION
A. Backscatter Properties: Plots
Backscatter dependence on burn severity levels is primarilythe result of the scattering mechanism occurring in the treesthat remained after the fire event, the proportion of the exposed
Authorized licensed use limited to: University of Maryland College Park. Downloaded on March 18,2010 at 14:15:33 EDT from IEEE Xplore. Restrictions apply.
924 IEEE TRANSACTIONS ON GEOSCIENCE AND REMOTE SENSING, VOL. 48, NO. 2, FEBRUARY 2010
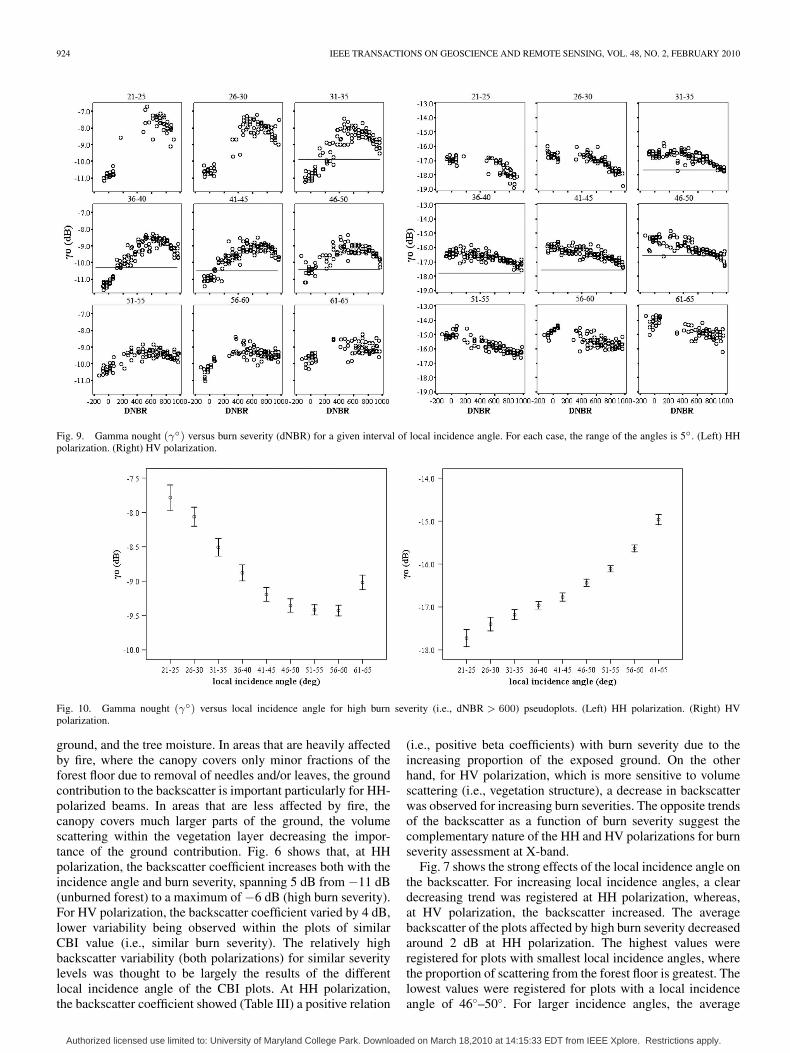
Fig. 9. Gamma nought (γ◦) versus burn severity (dNBR) for a given interval of local incidence angle. For each case, the range of the angles is 5◦. (Left) HHpolarization. (Right) HV polarization.
Fig. 10. Gamma nought (γ◦) versus local incidence angle for high burn severity (i.e., dNBR > 600) pseudoplots. (Left) HH polarization. (Right) HVpolarization.
ground, and the tree moisture. In areas that are heavily affectedby fire, where the canopy covers only minor fractions of theforest floor due to removal of needles and/or leaves, the groundcontribution to the backscatter is important particularly for HH-polarized beams. In areas that are less affected by fire, thecanopy covers much larger parts of the ground, the volumescattering within the vegetation layer decreasing the impor-tance of the ground contribution. Fig. 6 shows that, at HHpolarization, the backscatter coefficient increases both with theincidence angle and burn severity, spanning 5 dB from −11 dB(unburned forest) to a maximum of −6 dB (high burn severity).For HV polarization, the backscatter coefficient varied by 4 dB,lower variability being observed within the plots of similarCBI value (i.e., similar burn severity). The relatively highbackscatter variability (both polarizations) for similar severitylevels was thought to be largely the results of the differentlocal incidence angle of the CBI plots. At HH polarization,the backscatter coefficient showed (Table III) a positive relation
(i.e., positive beta coefficients) with burn severity due to theincreasing proportion of the exposed ground. On the otherhand, for HV polarization, which is more sensitive to volumescattering (i.e., vegetation structure), a decrease in backscatterwas observed for increasing burn severities. The opposite trendsof the backscatter as a function of burn severity suggest thecomplementary nature of the HH and HV polarizations for burnseverity assessment at X-band.
Fig. 7 shows the strong effects of the local incidence angle onthe backscatter. For increasing local incidence angles, a cleardecreasing trend was registered at HH polarization, whereas,at HV polarization, the backscatter increased. The averagebackscatter of the plots affected by high burn severity decreasedaround 2 dB at HH polarization. The highest values wereregistered for plots with smallest local incidence angles, wherethe proportion of scattering from the forest floor is greatest. Thelowest values were registered for plots with a local incidenceangle of 46◦–50◦. For larger incidence angles, the average
Authorized licensed use limited to: University of Maryland College Park. Downloaded on March 18,2010 at 14:15:33 EDT from IEEE Xplore. Restrictions apply.
TANASE et al.: TSX DATA FOR BURN SEVERITY EVALUATION 925
backscatter increased probably as a consequence of increasedscattering from the vegetation layer. At HV polarization, thebackscatter increased by around 2.5 dB, from −15.5 dB atthe steepest angles to −13.0 dB at the shallowest angles. Theincrease in the backscatter for increasing incidence angle can beexplained in terms of increasing interaction of the radar waveswith the scattering elements due to a longer path traveled bythe radar wave through the vegetation layer. The larger standarddeviations registered for some intervals (e.g., 20◦–25◦) were theconsequence of the few available samples.
Empirical fitting showed modest relations between the CBIvalues for the total plot, the understory, and the overstory layersand the backscatter intensity of HH and HV polarizations whenthe local incidence angle was not accounted for (Table III). Forall models, the independent variables were significant, reliablypredicting burn severity (p < 0.05). Since all models weresimilar, only the statistics of the CBI overstory analysis, whichpresented the highest R2, are discussed. Stronger relation withburn severity was found for HH polarization (R2 = 0.56) thanfor HV (R2 = 0.35), the proportion of ground exposure beingprobably more important for burn severity evaluation whenusing both polarizations without separating for the local inci-dence angle. Beta coefficients confirm this assumption beinglarger for HH (0.531) than for HV (−0.292) polarization. Theanalysis of the CBI as a function of the backscatter coefficientafter grouping by 5◦ local incidence angle intervals showedincreased values of the determination coefficients. For instance,for the 41◦–45◦ interval which contains the highest number ofplots, R2 increased with 0.1–0.3 depending on the predictorvariables used in the model. However, sample limitation makesthe results less reliable, and, therefore, the pseudoplot analysiswas used to confirm the observations made at plot level.
CBI was designed to match the field sampling data withthe characteristics of the optical-based indexes obtained frommedium-resolution sensors such as Landsat TM/Enhanced TMPlus. Considering mostly the aspects that are related to vege-tation chromatic properties makes the CBI, in its actual form,less suited for radar data analysis. A revised version takinginto account the canopy structure properties (e.g., percentageof foliage or branches removed, size of remaining branches,height of first branches, etc.) should improve the associa-tion strength between the field samples and the backscattercoefficient.
B. Backscatter Properties: Pseudoplots
The behavior of the backscatter for the pseudoplots con-firmed the results obtained for the CBI (Fig. 8). At HH po-larization, the backscatter increased for slopes oriented towardthe sensor (i.e., local incidence angles that are smaller than40◦) and areas affected by high burn severity (i.e., high dNBR).The higher backscatter variability for high burn severity levelsand small local incidence angles (HH-polarized beams) shouldbe related to the spatial heterogeneity of the soil moistureor roughness. At HV polarization, the backscatter was higherfor slopes oriented away from the sensor (i.e., local incidenceangles that are higher than 40◦) than for slopes oriented towardthe sensor.
The analysis of the backscatter in terms of burn severity(dNBR) for a given range of local incidence angles (Fig. 9)
showed that, at HH polarization, the backscatter coefficient in-creased for low and medium burn severity (i.e., dNBR < 600).For higher dNBR, the backscatter either decreased (for steepincidence angles) or reached a saturation level (for shallowangles). This behavior could be explained by the gaps in thecanopy (complete combustion of tree crowns) and the pres-ence of scattering elements that, with increasing burn severity,become transparent to the radar wave. In other words, thenumber of small branches and the moisture content of thevegetation at highest burn severity levels decreased. Therefore,the vegetation component of the backscatter diminished, andthe total backscattered energy decreased. The dynamic rangeof the backscatter at HH polarization decreased with the in-crease in local incidence angle from around 4 dB to slightlymore than 2 dB. While the level of backscatter in unburnedforests remained rather constant (−11 dB), in burned forests,the backscatter decreased with increasing incidence angle from−7 to −9 dB. At HV polarization, the backscatter presented asteady decrease for increasing dNBR, and the dynamic rangestayed around 2 dB at all incidence angles, being slightly largerfor high local incidence angles. The HV backscatter increasedfor increasing incidence angle, the increase being slightly larg-er for unburned forests, where waves interact with a largernumber of scatterers.
For highly burned areas, Fig. 10 demonstrates the backscatterdependence on the local incidence angle when keeping the burnseverity factor constant. At HH polarization, the backscatterpresented a clear descending trend which indicates strong sensi-tivity to the scattering from the forest floor particularly at steepviewing geometries. Higher backscatter associated to sensor-oriented slopes decreased with the increase in local incidenceangle, reaching similar levels for the flat and near-flat terrain.The increased backscatter observed at the highest incidenceangles (61◦–65◦) could be a consequence of an increased vege-tation contribution: The decrease in ground backscatter is lowerthan the increase in backscattered energy from the vegetationcomponent, the total backscatter increasing with respect to theflat or near-flat areas. The HV backscatter presented an ascend-ing trend, the mean value increasing with the increase in localincidence angle. Since HV backscatter is less sensitive to theground component, backscatter variations between high-burn-severity pseudoplots were smaller than for HH polarization,i.e., 0.3 dB at all local incidence angles except the 21◦–25◦
interval, where it reached around 0.5 dB. This small incrementfor the lowest local incidence angles could be explained by theproportion of the ground backscatter component which plays amore important role at steep angles. The higher variability (i.e.,standard deviation from the mean value) of HH polarizationis explained by the variation in ground properties (roughnessand moisture) and the roughness dependence on the incidenceangle.
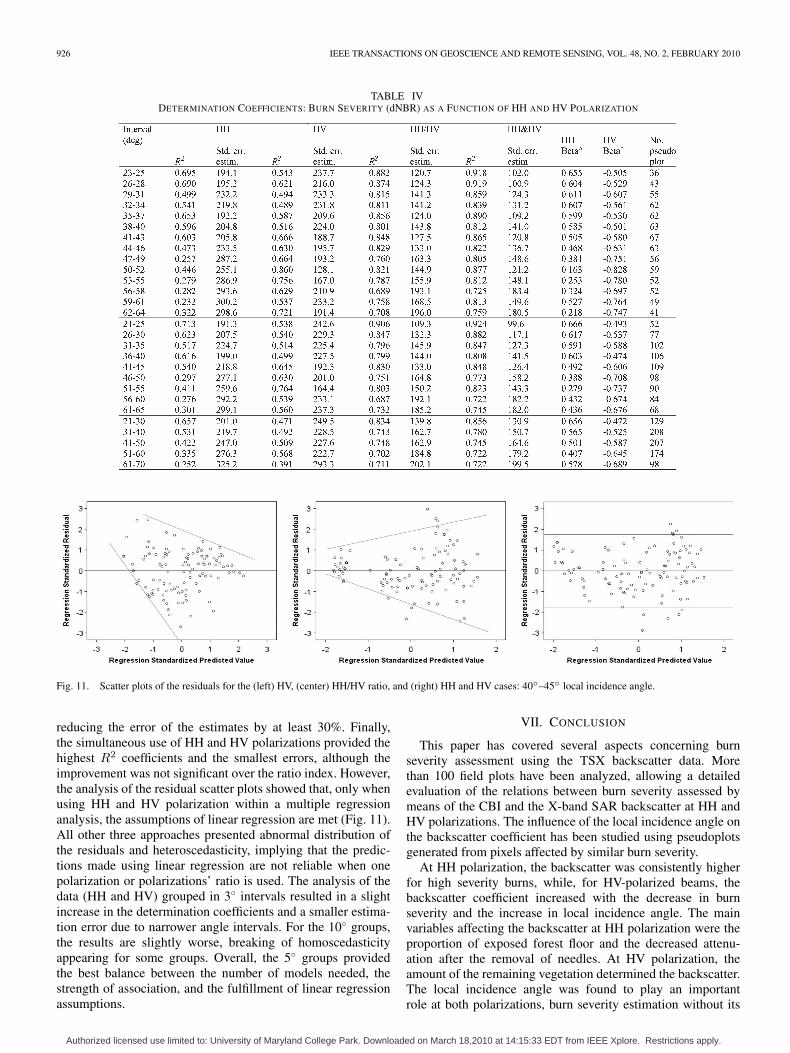
The strength of association (i.e., R2) at HH polarizationdecreased with increasing incidence angle, while the error in-creased (Table IV), validating the supposition on the role of theground component for backscatter return at HH polarization.For HV polarization, the relation is inverse, the strength ofassociation increasing up to around 55◦, where it reached thepeak level. Combining the two polarizations within a simpleratio index (HH/HV) increased the strength of associationbetween burn severity and the backscatter coefficient while
Authorized licensed use limited to: University of Maryland College Park. Downloaded on March 18,2010 at 14:15:33 EDT from IEEE Xplore. Restrictions apply.
926 IEEE TRANSACTIONS ON GEOSCIENCE AND REMOTE SENSING, VOL. 48, NO. 2, FEBRUARY 2010
TABLE IVDETERMINATION COEFFICIENTS: BURN SEVERITY (dNBR) AS A FUNCTION OF HH AND HV POLARIZATION
Fig. 11. Scatter plots of the residuals for the (left) HV, (center) HH/HV ratio, and (right) HH and HV cases: 40◦–45◦ local incidence angle.
reducing the error of the estimates by at least 30%. Finally,the simultaneous use of HH and HV polarizations provided thehighest R2 coefficients and the smallest errors, although theimprovement was not significant over the ratio index. However,the analysis of the residual scatter plots showed that, only whenusing HH and HV polarization within a multiple regressionanalysis, the assumptions of linear regression are met (Fig. 11).All other three approaches presented abnormal distribution ofthe residuals and heteroscedasticity, implying that the predic-tions made using linear regression are not reliable when onepolarization or polarizations’ ratio is used. The analysis of thedata (HH and HV) grouped in 3◦ intervals resulted in a slightincrease in the determination coefficients and a smaller estima-tion error due to narrower angle intervals. For the 10◦ groups,the results are slightly worse, breaking of homoscedasticityappearing for some groups. Overall, the 5◦ groups providedthe best balance between the number of models needed, thestrength of association, and the fulfillment of linear regressionassumptions.
VII. CONCLUSION
This paper has covered several aspects concerning burnseverity assessment using the TSX backscatter data. Morethan 100 field plots have been analyzed, allowing a detailedevaluation of the relations between burn severity assessed bymeans of the CBI and the X-band SAR backscatter at HH andHV polarizations. The influence of the local incidence angle onthe backscatter coefficient has been studied using pseudoplotsgenerated from pixels affected by similar burn severity.
At HH polarization, the backscatter was consistently higherfor high severity burns, while, for HV-polarized beams, thebackscatter coefficient increased with the decrease in burnseverity and the increase in local incidence angle. The mainvariables affecting the backscatter at HH polarization were theproportion of exposed forest floor and the decreased attenu-ation after the removal of needles. At HV polarization, theamount of the remaining vegetation determined the backscatter.The local incidence angle was found to play an importantrole at both polarizations, burn severity estimation without its
Authorized licensed use limited to: University of Maryland College Park. Downloaded on March 18,2010 at 14:15:33 EDT from IEEE Xplore. Restrictions apply.
TANASE et al.: TSX DATA FOR BURN SEVERITY EVALUATION 927
consideration being subject to large errors. At HH polariza-tion, the backscatter coefficient was higher for sensor-orientedslopes. At HV polarization, the backscatter was less sensitiveto the slope effects, the average backscatter increasing with theincrease in local incidence angle. Both polarizations have pre-sented consistent trends across all local incidence angle ranges,HH and HV polarizations being positively and negatively cor-related with burn severity, respectively. Future investigationsshall clarify how much weather conditions might affect suchtrends. The highest determination coefficients of burn severityas a function of SAR backscatter have been observed for slopesoriented toward the sensor at HH polarization and for slopesoriented away from the sensor at HV polarization. Finally, thedegree of burn severity variance predicted from the SAR datais modest when the local incidence angle is not accountedfor. Higher proportion of explained burn severity variance andsmaller errors have been obtained when using simultaneouslyHH and HV polarizations or their ratio in the linear regressionmodels after grouping for similar incidence angles. However,only when using both polarizations, the assumptions of linearregression have been met completely. The optimum interval forincidence angle grouping appeared to be 5◦ for the hilly terrainpresent in the Zuera study area.
High-resolution SAR data could provide more consistentestimates over the entire range of burn severities thanreflectance-based indexes. Reflectance-based indexes providegood estimates for low and high burn severities but often failwhen estimating intermediate levels because they express fireseverity using the indirect properties of the burned areas: NIRreflectance decreases due to loss of healthy green vegetation;short-wavelength infrared reflectance increases due to lessmoisture content of vegetation and soils, increased substrateexposure, and the presence of charred fuels. These propertiesare more stable for unburned or highly burned areas but becomeinconsistent for intermediate severity levels, where multipleeffects combine; most studies have found it problematic todiscriminate the intermediate-severity values [49]. In addition,reflectance-based indexes are sensitive to plant phenology andsolar elevation, monitoring severity trends over time or acrossregions being subject to errors [20]. In contrast, the SARdata provide distinct information that is related more to for-est structure. Scattering from tree crown is the predominantcomponent of the backscatter from forested areas at X-band,the contribution of the understory and the forest floor beingconditioned primarily by the canopy architecture. The removalof leaves and branches by fire has a direct effect on volumescattering at HV polarization, reduced backscatter levels beingregistered for increased burn severities. Moreover, the indirectfire effects (e.g., increased soil exposure) at HH polarizationprovide additional information which improves the estimationof severity levels. Finally, the determination coefficients pre-sented have been obtained based on the reflectance-based esti-mates of severity, which are subject to the specific challenges ofoptical-sensor-derived indexes already mentioned. Therefore,the actual association strength between the backscatter levelsand burn severity could be higher. Nevertheless, the SAR datahave its own challenges (e.g., backscattered energy is dependenton environmental conditions, wavelength, polarization, etc.),appropriate selection of acquisition time being often crucial forthe successful retrieval of biogeophysical parameters.
The results presented are valid for typical pine forests foundin the Mediterranean basin. However, fire produces similareffects (e.g., loss of crown foliage and branches, removal ofunderstory layers, etc.) in many forests at midlatitudes, so webelieve that general data trends would be similar for otherforest types and tree species at least in temperate climates. Insignificantly different environments such as boreal or tropicalforests, trends could be, however, different. Dissimilarity couldarise due to fire effects on distinct forest structures, moistureeffects on backscatter response, etc. This study has indicatedthat the dual-polarization (HH, HV) X-band SAR data havepotential for burn severity estimation in the Mediterraneanenvironments as long as the local incidence angle is accountedfor. The determination coefficients reported for the groups oflocal incidence angle are similar or higher than those reportedwhen using indexes obtained from optical sensors.
ACKNOWLEDGMENT
The authors would like to thank Deutsches Zentum fürLuft- und Raumfahrt in the framework of the LAN0464 Projectfor providing the TSX data.
REFERENCES
[1] N. Koutsias and M. Karteris, “Burned area mapping using logistic regres-sion modeling of a single post-fire Landsat-5 Thematic Mapper image,”Int. J. Remote Sens., vol. 21, no. 4, pp. 673–687, Mar. 2000.
[2] G. W. Ferry, R. G. Clark, R. E. Montgomery, R. W. Mutch,W. P. Leenhouts, and G. T. Zimmerman, “Altered fire regimes withinfire-adapted ecosystems,” in “Our Living Resources: A Report to the Na-tion on the Distribution, Abundance, and Health of U.S. Plants Animals,and Ecosystems,” USDI Nat. Biol. Surv., Washington, DC, pp. 222–224,1995.
[3] E. Chuvieco, “Measuring changes in landscape pattern from satellite im-ages: Short-term effects of fire on spatial diversity,” Int. J. Remote Sens.,vol. 20, no. 12, pp. 2331–2346, Aug. 1999.
[4] G. Schmuck, J. San-Miguel-Ayanz, A. Camia, J. Kucera, G. Libertá,R. Boca, T. Durrant, and G. Amatulli, Forest Fires in Europe 2007, vol. 8JRC 47446, 2008, Italy.
[5] G. Laneve, M. M. Castronuovo, and E. G. Cadau, “Continuousmonitoring of forest fires in the Mediterranean area using MSG,”IEEE Trans. Geosci. Remote Sens., vol. 44, no. 10, pp. 2761–2768,Oct. 2006.
[6] D. Stroppiana, K. Tansey, J.-M. Grégoire, and J. M. C. Pereira, “An al-gorithm for mapping burnt areas in Australia using SPOT-VEGETATIONdata,” IEEE Trans. Geosci. Remote Sens., vol. 41, no. 4, pp. 907–909,Apr. 2003.
[7] R. Diaz-Delgado, F. Lloret, and X. Pons, “Influence of fire severity onplant regeneration by means of remote sensing imagery,” Int. J. RemoteSens., vol. 24, no. 8, pp. 1751–1763, Apr. 2003.
[8] J. Epting, D. Verbyla, and B. Sorbel, “Evaluation of remotely sensedindices for assessing burn severity in interior Alaska using Landsat TMand ETM+,” Remote Sens. Environ., vol. 96, no. 3/4, pp. 328–339,Jun. 2005.
[9] D. P. Roy, L. Boschetti, and S. N. Trigg, “Remote sensing of fire severity:Assessing the performance of the normalized burn ratio,” IEEE Geosci.Remote Sens. Lett., vol. 3, no. 1, pp. 112–116, Jan. 2006.
[10] J. W. van Wagtendonk, R. R. Root, and C. H. Key, “Comparison ofAVIRIS and Landsat ETM+ detection capabilities for burn severity,”Remote Sens. Environ., vol. 92, no. 3, pp. 397–408, Aug. 2004.
[11] C. H. Key and N. C. Benson, “Landscape assessment (LA),” U.S. Dept.Agric., Forest Service, Rocky Mountain Res. Station, Fort Collins, CO,Gen. Tech. Rep. RMRS-GTR-164-CD, 2006.
[12] J. L. Allen and B. Sorbel, “Assessing the differenced normalized burn ra-tio’s ability to map burn severity in the boreal forest and tundra ecosystemsof Alaska’s national parks,” Int. J. Wildland Fire, vol. 17, no. 4, pp. 463–475, 2008.
[13] A. E. Cocke, P. Z. Fule, and J. E. Crouse, “Comparison of burn severityassessments using differenced normalized burn ratio and ground data,”Int. J. Wildland Fire, vol. 14, no. 2, pp. 189–198, 2005.
Authorized licensed use limited to: University of Maryland College Park. Downloaded on March 18,2010 at 14:15:33 EDT from IEEE Xplore. Restrictions apply.
928 IEEE TRANSACTIONS ON GEOSCIENCE AND REMOTE SENSING, VOL. 48, NO. 2, FEBRUARY 2010
[14] A. de Santis and E. Chuvieco, “Burn severity estimation from remotelysensed data: Performance of simulation versus empirical models,” RemoteSens. Environ., vol. 108, no. 4, pp. 422–435, Jun. 2007.
[15] M. C. Wimberly and M. J. Reilly, “Assessment of fire severity and speciesdiversity in the southern Appalachians using Landsat TM and ETM+imagery,” Remote Sens. Environ., vol. 108, no. 2, pp. 189–197, May 2007.
[16] C. H. Key and N. C. Benson, Ground Measure of Severity, The Compos-ite Burn Index. Ogden, UT: U.S. Dept. Agric., Forest Service, RockyMountain Res. Station, 2004.
[17] A. de Santis and E. Chuvieco, “GeoCBI: A modified version of thecomposite burn index to estimate burn severity for remote sensingapplications,” Remote Sens. Environ., vol. 113, no. 3, pp. 554–562,Mar. 2009.
[18] K. A. Murphy, J. H. Reynolds, and J. M. Koltun, “Evaluating the abilityof the differenced normalized burn ratio (dNBR) to predict ecologicallysignificant burn severity in Alaskan boreal forests,” Int. J. Wildland Fire,vol. 17, no. 4, pp. 490–499, 2008.
[19] E. E. Hoy, N. H. F. French, M. R. Turetsky, S. N. Trigg, andE. S. Kasischke, “Evaluating the potential of Landsat TM/ETM+ imageryfor assessing fire severity in Alaskan black spruce forests,” Int. J. WildlandFire, vol. 17, no. 4, pp. 500–514, 2008.
[20] D. L. Verbyla, E. S. Kasischke, and E. E. Hoy, “Seasonal and topographiceffects on estimating fire severity from Landsat TM/ETM+ data,” Int. J.Wildland Fire, vol. 17, no. 4, pp. 527–534, 2008.
[21] J. D. Miller, E. E. Knapp, C. H. Key, C. N. Skinner, C. J. Isbell,R. M. Creasy, and J. W. Sherlocke, “Calibration and validation of therelative differenced normalized burn ratio (RdNBR) to three measuresof fire severity in the Sierra Nevada and Klamath Mountains, California,USA,” Remote Sens. Environ., vol. 113, no. 3, pp. 645–656, Mar. 2009.
[22] L. L. Bourgeau-Chavez, P. A. Harrell, E. S. Kasischke, andN. H. F. French, “The detection and mapping of Alaskan wildfires usinga spaceborne imaging radar system,” Int. J. Remote Sens., vol. 18, no. 2,pp. 355–373, Jan. 1997.
[23] L. L. Bourgeau-Chavez, E. S. Kasischke, S. Brunzell, and J. P. Mudd,“Mapping fire scars in global boreal forests using imaging radar data,”Int. J. Remote Sens., vol. 23, no. 20, pp. 4211–4234, Oct. 2002.
[24] N. H. F. French, L. L. Bourgeau-Chavez, Y. Wang, and E. S. Kasischke,“Initial observations of RADARSAT imagery at fire-disturbed sites ininterior Alaska,” Remote Sens. Environ., vol. 68, no. 1, pp. 89–94,Apr. 1999.
[25] S. Huang and F. Siegert, “ENVISAT multisensor data for fire monitoringand impact assessment,” Int. J. Remote Sens., vol. 25, no. 20, pp. 4411–4416, Oct. 2004.
[26] S. C. Liew, L. K. Kwoh, K. Padmanabhan, O. K. Lim, and H. Lim,“Delineating land/forest fire burnt scars with ERS interferometric syn-thetic aperture radar,” Geophys. Res. Lett., vol. 26, no. 16, pp. 2409–2412,Aug. 1999.
[27] C. H. Menges, R. E. Bartolo, D. Bell, and G. J. E. Hill, “The effect ofsavanna fires on SAR backscatter in northern Australia,” Int. J. RemoteSens., vol. 25, no. 22, pp. 4857–4871, Nov. 2004.
[28] F. Siegert and A. A. Hoffmann, “The 1998 forest fires in East Kalimantan(Indonesia): A quantitative evaluation using high resolution, multitempo-ral ERS-2 SAR images and NOAA-AVHRR hotspot data,” Remote Sens.Environ., vol. 72, no. 1, pp. 64–77, Apr. 2000.
[29] F. Siegert and M. Nakayama, “Comparison of ERS-2 and JERS for fireimpact assessment in tropical rainforests,” in Proc. IGARSS, Honolulu,HI, 2000, pp. 2709–2711.
[30] F. Siegert and G. Ruecker, “Use of multitemporal ERS-2 SAR images foridentification of burned scars in south-east Asian tropical rainforest,” Int.J. Remote Sens., vol. 21, no. 4, pp. 831–837, Mar. 2000.
[31] L. L. Bourgeau-Chavez, E. S. Kasischke, N. H. F. French, L. H. Szeto,and C. M. Kherkher, “Using ERS-1 SAR imagery to monitor variations inburn severity in an Alaskan fire-disturbed boreal forest ecosystem,” IEEEGeosci. Remote Sens. Symp., vol. 1, pp. 243–245, 1994.
[32] E. S. Kasischke, L. L. Bourgeau-Chavez, and N. H. F. French, “Ob-servations of variations in ERS-1 SAR image intensity associated withforest fires in Alaska,” IEEE Trans. Geosci. Remote Sens., vol. 32, no. 1,pp. 206–210, Jan. 1994.
[33] M. Gimeno and J. San-Miguel-Ayanz, “Evaluation of RADARSAT-1 datafor identification of burnt areas in Southern Europe,” Remote Sens. Envi-ron., vol. 92, no. 3, pp. 370–375, Aug. 2004.
[34] M. Gimeno, J. San-Miguel-Ayanz, and G. Schmuck, “Identification ofburnt areas in Mediterranean forest environments from ERS-2 SARtime series,” Int. J. Remote Sens., vol. 25, no. 22, pp. 4873–4888,Nov. 2004.
[35] L. L. Bourgeau-Chavez, E. S. Kasischke, K. Riordan, S. Brunzell,M. Nolan, E. Hyer, J. Slawski, M. Medvecz, T. Walters, and S. Ames,
“Remote monitoring of spatial and temporal surface soil moisture infire disturbed boreal forest ecosystems with ERS SAR imagery,” Int. J.Remote Sens., vol. 28, no. 10, pp. 2133–2162, May 2007.
[36] D. H. Hoekman, “Measurements of the backscatter and attenuation prop-erties of forest stands at X-, C- and L-band,” Remote Sens. Environ.,vol. 23, no. 3, pp. 397–416, Dec. 1987.
[37] D. G. Leckie, “Forestry applications using imaging radar,” in Prin-ciples and Applications of Imaging Radar, F. M. Henderson andA. J. Lewis, Eds. New York: Wiley, 1999, p. 866.
[38] J. M. Martinez, N. Floury, T. L. Toan, A. Beaudoin, M. T. Hallikainen,and M. Makynen, “Measurements and modeling of vertical backscatterdistribution in forest canopy,” IEEE Trans. Geosci. Remote Sens., vol. 38,no. 2, pp. 710–719, Mar. 2000.
[39] J. T. Pulliainen, K. Heiska, J. Hyyappa, and M. T. Hallikainen, “Backscat-tering properties of boreal forests at the C- and X-bands,” IEEE Trans.Geosci. Remote Sens., vol. 32, no. 5, pp. 1041–1050, Sep. 1994.
[40] E. S. Kasischke, L. L. Bourgeau-Chavez, N. H. F. French, P. Harrell,and N. L. Christensen, Jr., “Initial observations on using SAR to monitorwildfire scars in boreal forests,” Int. J. Remote Sens., vol. 13, no. 18,pp. 3495–3501, Dec. 1992.
[41] K. Raney, “Radar fundamentals: Technical perspective,” in Principles andApplications of Imaging Radar, F. M. Henderson and A. J. Lewis, Eds.New York: Wiley, 1999.
[42] A. J. Luckman, “The effects of topography on mechanism of radarbackscatter from coniferous forest and upland pasture,” IEEE Trans.Geosci. Remote Sens., vol. 36, no. 5, pp. 1830–1834, Sep. 1998.
[43] K. R. Czuchlewski and J. K. Weissel, “Synthetic aperture radar (SAR)-based mapping of wildfire burn severity and recovery,” in Proc. IEEEGeosci. Remote Sens. Symp., 2005, pp. 55–58.
[44] T. Fritz and M. Einder, TerraSAR-X Ground Segment, Basic ProductSpecification Document, 2008. TX-GS-DD-3302.
[45] U. Wegmüller, T. Strozzi, and G. Bitelli, “Validation of ERS differentialSAR interferometry for land subsidence mapping: The Bologna casestudy,” in Proc. IEEE Geosci. Remote Sens. Symp., Hamburg, Germany,Jun. 28–Jul. 2 1999, pp. 1131–1133.
[46] U. Wegmüller, C. Werner, T. Strozzi, and A. Wiesmann, “Automated andprecise image registration procedures,” in Analysis of Multi-Temporal Re-mote Sensing Images, L. Bruzzone and P. Smits, Eds. Singapore: WorldScientific, 2002, pp. 37–49.
[47] T. Castel, A. Beaudoin, N. Stach, N. Stussi, T. L. Toan, and P. Durand,“Sensitivity of space-borne SAR data to forest parameters over slopingterrain. Theory and experiment,” Int. J. Remote Sens., vol. 22, no. 12,pp. 2351–2376, 2001.
[48] L. M. H. Ulander, “Radiometric slope correction of synthetic-apertureradar images,” IEEE Trans. Geosci. Remote Sens., vol. 34, no. 5,pp. 1115–1122, Sep. 1996.
[49] E. Chuvieco, D. Riaño, F. M. Danson, and P. Martín, “Use of a ra-diative transfer model to simulate the postfire spectral response toburn severity,” J. Geophys. Res., vol. 111, no. G4, p. G04 S09, 2006.DOI:10.1029/2005JG000143.
Mihai Andrei Tanase received the Lic. Eng. de-gree in forestry from “Stefan cel Mare Univer-sity,” Suceava, Romania, in 1999, the B.S. degreein economy from The Bucharest Academy of Eco-nomic Studies, Bucharest, Romania, in 2004, andthe M.Sc. degree in environmental management fromthe International Centre for Advanced MediterraneanAgronomic Studies, Paris, France, in 2007.
He is currently with the Department of Geography,University of Zaragoza, Zaragoza, Spain. He is thePrincipal Investigator for European Space Agency
Earth Observation and DLR TerraSAR-X programs and participates in Kyotoand Carbon Initiative as a Coinvestigator. His research includes the use ofremote sensing for forest characterization. His current activity is focused on theuse of synthetic aperture radar and interferometric SAR data for fire severityestimation and vegetation recovery monitoring after forest fires.
Authorized licensed use limited to: University of Maryland College Park. Downloaded on March 18,2010 at 14:15:33 EDT from IEEE Xplore. Restrictions apply.
TANASE et al.: TSX DATA FOR BURN SEVERITY EVALUATION 929
Fernando Pérez-Cabello received the Ph.D. de-gree in geography from the University of Zaragoza,Zaragoza, Spain, in 2001.
He is currently a Professor Contracted Doctor ofregional geographic analysis with the Department ofGeography, University of Zaragoza. He has workedon some national research projects—FIRERISK,EROFUEGO, LIGNOSTRUM, RS-FIRE, and PIR-FIRE—concerning to the monitoring of burned ar-eas, fire risk cartography, and modeling of physicalvariables. He focused his research on the analysis of
the environmental dynamic of burned areas, by means of field data and remotesensing and geographical information system techniques.
He is a member of the Geographical and Forest (GEOFOREST) researchgroup.
Juan de la Riva received the Ph.D. degree in ge-ography from the University of Zaragoza, Zaragoza,Spain, in 1994.
He is currently a Professor of regional geographicanalysis with the Department of Geography, Univer-sity of Zaragoza. He coordinates the geographicalinformation system (GIS) and remote sensing mas-ter course. He has worked in different managementstudies in mountain areas, as well as in severalresearch projects—FIRERISK, EROFUEGO, LIG-NOSTRUM, RS-FIRE, and PIR-FIRE—related to
forest fires (postfire environmental dynamic and risk modeling) and biomassestimation. He focuses his research on the study of forested areas and theapplication of GIS and remote sensing techniques.
He is a member of the GEOFOREST research group.
Maurizio Santoro (M’04) received the M.S. de-gree in aerospace engineering from the UniversityUniversity of Naples Federico II, Naples, Italy, in1998, the Lic.Eng. degree from Chalmers Univer-sity of Technology, Göteborg, Sweden, in 2001, andthe Ph.D. degree from Friedrich Schiller University,Jena, Germany, in 2003.
From 2004 to 2005, he held a postdoctoral positionwith Friedrich Schiller University. Since 2006, hehas been a Project Scientist with GAMMA RemoteSensing AG, Gümligen, Switzerland. His main du-
ties include synthetic aperture radar (SAR) and interferometric SAR dataprocessing and applications of SAR interferometry for land cover mapping.He is involved as a Principal Investigator and as a Coinvestigator in severalinternational projects on the use of earth observation data for land covermapping and monitoring. His main research interests include characterizationof land cover using SAR and interferometric SAR data and retrieval techniquesof forest biophysical parameters from SAR data.
Authorized licensed use limited to: University of Maryland College Park. Downloaded on March 18,2010 at 14:15:33 EDT from IEEE Xplore. Restrictions apply.