Term 1 - Section B: The Living World (Parts 1-5 ) - Oasis ...
27
Term 1 - Section B: The Living World (Parts 1-5 ) ➢ Small scale ecosystem: the pond ➢ Tropical rainforest: The Malaysian Rainforest ➢ Cold environments Svalbard
-
Upload
khangminh22 -
Category
Documents
-
view
4 -
download
0
Transcript of Term 1 - Section B: The Living World (Parts 1-5 ) - Oasis ...

Term 1 - Section B: The Living World (Parts 1-5 )
➢ Small scale ecosystem: the pond
➢ Tropical rainforest: The Malaysian Rainforest
➢ Cold environments Svalbard

Ecosystem - a natural system made up of plants, animals and the environment. Examples include a pond, a hedgerow or a tropical rainforest.
Biome – a global ecosystem. Examples include tropical rainforest or polar biomes
Biotic – Living things within an ecosystem. Examples include fish or insects. They rely on abiotic things to survive. Example. Fish need oxygen, Plants need sunlight
Abiotic – Non-living things within an ecosystem. Examples include sunlight, soil or water
Flora – Are plants (producers) within an ecosystem
Faura – Are animals (consumers) within an ecosystem
Habitat – Homes within an ecosystem where different flora and fauna live
Detritus – Dead and decaying plant and animal matter forming mud on the pond bottom
A Food chain shows how producers and consumers are linked in an ecosystem. Example – Algae, tadpole, newt, heron) The arrows show who eats who (or the direction of energy flow)
Producersconvert
sunlight into sugars in order to
grow. Example -Reeds or algae in a
pond.
Consumers either eat producers (primary
consumers) or other
consumers (secondary and tertiary consumers)Example -
Heron
Decomposers break down
dead plant or animal matter and return it to the soil or
detritus. Example – a
worm.
Ecosystems are complicated. A food web shows all the links between the consumers and producers in an ecosystem like a pond.
Producers also need nutrients from the soil or detritus on the bottom of a pond in order to grow. Nutrients are re-cycled. Dead plant and animal matter from the biomass falls to the soil layer, or pond bottom where it is decomposed to form litter or detritus, releasing nutrients, which are re-absorbed by the biomass through their roots or absorbed if dissolved in water. This is called the nutrient cycle.
Food webs are easily damaged. If the producers are removed, consumers higher up
the chain lose their food source and numbers drop. If
tertiary consumers are removed their will be an
explosion of creatures further down the chain.
Different habitats in a pond contain different flora and fauna because of the different conditions.
The Detritus layer has little oxygen or light. Decomposers, scavengers and the larva of water insects live here. Example - Water worms or May fly larva.
Deeper water. Oxygen and protection from predators. Animals that breath through gills or skin live here. Examples - Perch, Stickleback, Great diving beetle.
Shallow water. Plenty of oxygen and sunlight. Producers grow here, rooting in the detritus. Insects and birds shelter here. Examples include Reeds, Dragon fly, Waterlily, Moorhen.
Water surface. Lots of light and oxygen. Producers and consumers. Examples pond algae, water boatman, water weed.
Pond banks – Fertile soil and sunlight. Water loving plants and trees. Example Willow tree.
Ecosystems are easily damaged naturally or by humans, especially by farming
Natural causesDrought – The pond level drops and marginal plants dry up and die. The pond may become de-oxygenated and fish die.
Human causesEutrophication – Farm fertilizers get into the water and cause algae to grow rapidly. Algae use up all the oxygen so fish die.
Drainage – Ponds are drained for farmland causing the whole ecosystem to collapse.
Industrial pollution - released into the water, killing fish and insects.
Hedgerows - cut down to increase the size of fields for farming, destroying the hedgerow ecosystem.
Ecosystems can be restoredif they are damaged. Lake beds can be cleared and
dredged to increase water depth and water
oxygenation, improving conditions for fish. Algae
can be removed to increase oxygen levels. New, shallow
water habitats can be planted to encourage pond life and nesting water birds.
KS4 – The Geography Knowledge – THE LIVING WORLD (part 1) Ecosystems

Global ecosystems are called Biomes. They run in bands stretching eastto west across the land masses of the globe. Each biome has distinct and different characteristics. (flora and fauna) This is due to the different climates experienced in different areas due to global atmospheric circulation.
Global ecosystem
Location Links to global atmospheric circulation
Tropical rainforest
Close to the Equator
High temps and heavy rainfall created by low pressure belt.Ideal conditions for plants to grow. Rainforests cover 6% of earths surface and are home to half the worlds species of plants and animals and 25% of all medicines.
Desert Roughly 30degrees north and south of the Equator
Cover 20% of land surface. Associated with sub-tropical high pressure belts. Sinking air stops clouds from forming – results in high daytime temps, low night time temps and low rainfall. Plants and animals must be well adapted to survive.
Polar Arctic/Antarctic Cold air sinks in north and south poles creating very low temps and dry conditions.
Deciduous and coniferous forests
Roughly 50-60 degrees north of the equator
Deciduous trees shed leaves in winter to retain moisture. Coniferous trees retain leaves to maximise photosynthesis during short summer months. UK is good example of deciduous woodland, Canada is dominated by coniferous woodland.
Temperate grassland
Roughly 30-40 degrees north and south of the Equator, inland away from coasts, hot summers, cold winters
Vast areas of grassland in N. America (Prairies) & Eastern Europe (Steppes). Warm, dry summers and cold winters. Grasses can tolerate these conditions, this land is mainly used for grazing.
Mediterranean
Roughly 40-45 degrees north of the Equator. Isolated locations south of the equator (S. Africa and W. Australia
Hot, sunny and dry summers & mild winters. This is due to pressure belts migrating slightly north and south during year. Vegetation includes olive trees and fruit trees (lemon, orange). Other areas have a similar climate (California, South Africa and parts of Australia).
Tropical grassland (savannah)
Between 15-30 degrees north and south of the Equator
Low latitude – distinct wet and dry seasons. Dry season can be very hot and wild fires can break out. Thunderstorms can occur in wet season. Large herds of animals graze on these grasslands, along with predators such as lions and leopards.
Tundra Arctic circle to about 60-70 degrees north (Canada, Northern Europe). Few areas in S Hemisphere due to lack of land
Characterised by low growing plants adapted to retain heat and moisture in the cold, windy, dry conditions. Mostly found in northern Canada and northern Europe. A fragile ecosystem that is easily damaged by humans and threatened by developments such as oil exploitation and tourism. Animals such as reindeer are adapted to survive the cold.
Cold environments are polar and tundra biomes. Example Svalbard, Norway
Tropical rainforests are
located in a band around the
equator Example Malaysia and
Amazon
The sun drives Global atmospheric circulation. At the equator warm rising air causes low air pressure which brings hot, wet conditions. The deserts occur because cold air sinks causing high pressure. Rain cannot
form here. The UK experiences a mixture of High and Low pressure systems so our climate is a mixture of wet and dry conditions
KS4 – The Geography Knowledge – THE LIVING WORLD (part 2) Global ecosystems

ANIMAL ADAPTATIONS
VEGETATION ADAPTATIONS
Location Rainforests are located along the equator (0° latitude). Examples: South America (Brazil), Asia (Indonesia), Africa (Congo).
Climate Hot and wet (humid). No seasonsTemperature range: 20-30°C (due to direct sunlight from the sun)Precipitation range: 160 – 330mm/month or 2000mm per year
Vegetation Very dense and varied (e.g. banana and rubber trees).
Animals Very dense and varied (e.g. apes, parrots, jaguars, insects)
Soil Not very fertile, as heavy rainfall washes nutrients away. This is known as leaching.Most nutrients are in the top layer of the soil due to nutrient cycling from the decayed leaves. As a result most trees have a shallow root system.
People Tribes have lived in rainforests for a long time (sustainable). New groups of people and companies have arrived more recently, trying to make money from the rainforests through logging, energy, mining…etc(unsustainable)
Biodiversity The variety of organisms living in a particular area (plants and animals)
Biodiversity in the rainforest
Deserts have very high biodiversity. Rainforests contain around 50% of the world’s plants, animals and insect species.
Threats to the rainforest
Deforestation is causing a loss of biodiversity in the rainforest, as many animals and plants become endangered or extinct.
KS4 – The Geography Knowledge – THE LIVING WORLD (part 3) Tropical rainforests
All parts of the rainforest ecosystem are linked together (climate, soil, water, animals, plants and people). If one of them changes, everything else is affected.
➢ The humid climate = dead plants and animals decompose quickly by decomposers (fungi and bacteria) on the forest floor = the nutrients from the decaying plants/animals makes the top layer of the soil very nutrient rich = lots of plants can grow.
➢ Plants pass on their nutrients when they are eaten by animals. There is a lot of vegetation = lots of animals.
➢ People remove trees (deforestation) = less carbon dioxide is removed from the atmosphere = more greenhouse gases = more climate change.
➢ Trees absorb water = this water travels through the tree to the leaves = transpiration evaporates water from the trees’ leaves to the atmosphere = condensation in the atmosphere creates clouds = precipitation. The trees are one of the main reasons there is so much rainfall in the rainforest.
9
Layers The rainforest has four layers (emergent, upper canopy, lower canopy and shrub & ground layer). Vegetation adapts to each layer.
Trees(height, buttressroots, bark)
The trees can grow to over 40 meters high in order to find sunlight.
To help support their height, they have buttress roots. These are large root systems above the ground that act as an anchor and support the tall trees.
Trees have a smooth, thin bark = helps water to run off easily.
Lianas Woody vines that use trees to climb up to the upper canopy where they spread from tree to tree to get as much light as possible.
Leaves On the shrub and ground layer, it is very dark due to the canopy. As a result, their leaves have a large surface area to catch as much sunlight as possible.
Many leaves have drip tips and a waxy coating. This help shed water easily.
Some plants, e.g. the fan palm, have large fan-shaped leaves which are segmented so that excess water drains away easily.
Spider monkey Have long, strong arms and tails so they can swing between the trees in the upper canopy. Some animals spend their entire lives in the upper canopy.
Leaf-tailedgecko & chameleon
Are camouflaged so can blend into their surroundings to hide from predators
Jaguar Can swim due to high rainfalls and many rivers.
Red-eyed tree frog
Have suction cups on their feet and hands to help them climb up trees and leaves.
Anteater Some animals have adapted to the low light levels in the shrub and ground layer. Have a sharp sense of smell and hearing so they an detect predators without seeing them. This helps themsurvive in the low light levels in the shrub & ground layer.

Location Equator, South America (Brazil), Asia (Malaysia and Indonesia), Africa (Congo).
Climate Hot and wet (humid). No seasons. Temperature range: 25-35°CPrecipitation range: 160 – 330mm/month – 2000mm+ per year
Vegetation Very dense and varied (e.g. banana and rubber trees)
Animals Very dense and varied (e.g. apes, parrots, jaguars, insects)
ADAPTATIONS • The trees can grow to over 50 meters high in order to find sunlight because of competition in the all year growing season
• Lianas are woody vines that start at ground level and use trees to climb up to the upper canopy where they spread from tree to tree to get as much light as possible.
• The leaves have drip tips to shed heavy rain.• Large buttress roots support the tall trees.• Some plants have very large leaves so they can catch as
much sunlight as possible. Plants, such as the fan palm, have large fan-shaped leaves which are segmented so that excess water drains away easily.
• The forest floor is very dark and damp. There is little growth here as the sunlight cannot reach this layer.
• Trees have shallow roots as there is only a shallow layer of fertile soil.
Logging Cutting down hardwood trees to sell. (e.g. Malaysia is worlds largest hard wood exporterGood: jobs, tax to Government, money for developmentBad: habitat loss, loss of biodiversity, loss of carbon sink, climate change, soil erosion, leaching of nutrients, loss of medicines from plants
Hydro-electricenergy
Build dam and reservoir to create and sell hydro-electric energy. (e.g. Bakun dam in Malaysia)Good: jobs, money for development, cheap, clean, renewable energyBad: habitat loss, tribes forced to move, loss of animal biodiversity
Mining Digging to extract iron ore, aluminum, copper, tin and gold to sell.(e.g. Tin mining in Peninsular Malaysia)Good: jobs, money for development, tax to GovernmentBad: habitat loss, loss of biodiversity, climate change, water pollution
Building roads Logging companies, cattle ranches, farms, mines need roads to reach them and transport products to the coast to export = roads built.Good: jobs, improved transportation, easier import/export industriesBad: habitat loss, loss of animal biodiversity, climate change
Monoculture and Palm Oil
Large areas of rainforest are cut down and replaced with a single crop such as palm oil (e.g. Malaysia is the world’s largest palm oil producer)Good: Creates thousands of jobs and wealth from growth and exportBad: bio-diversity loss as most fauna is not adapted to live on oil palm
Subsistencefarming
When you farm enough food to live off, not to sell to make money. It is a sustainable farming practice. They use slash and burn to clear the land.Good: sustainable (only farm what they need)Bad: slash and burn = habitat loss, loss of animal biodiversity
INTERNATIONAL AGREEMENT – DEBT RELIEF
Areas of the rainforest are given monetary value and used to repay outstanding debt. e.g. The USA cancels part of their debt in exchange for an agreement that Peru will conserve/look after part of their rainforest.
SELECTIVE LOGGING
Trees are only felled (cut down) when they are mature (fully grown). As a result the rainforest canopy is preserved where many of the animals live. Logged areas are re-planted
Unfortunately, sometimes when a mature tree is felled, up to 30 other trees are damaged getting the tree out of the forest.
PROMOTING RESPONSIBLE MANAGEMENT
Forest Stewardship Council (FSC) and Rainforest Alliance are charities that give their logo to products that are produced sustainably. Consumers can then choose to buy products from sustainable sources.
INTERNATIONAL AGREEMENT – CARBON SINK
Trees remove carbon dioxide during photosynthesis and are therefore known as carbon sinks. Rainforests are protected due to their role in reducing global warming. e.g. The Gola Forest in Sierra Leone (Africa) is protected for its role in reducing global warming, using money from the European Commission, French Government and NGOs.
NATIONAL PARKS
Areas are protected from development and deforestation,therefore providing safe habitats for species e.g. Orangutane.g. The Tumucumaque National park in Brazil is the largest in the world. It protects over 38,000 square kilometres of rainforest.
ECOTOURISM – SUSTAINABLE TOURISM
Ecotourism aims to introduce people to the natural world whilst protecting the rainforest, and creating sustainable jobsTourist resorts (hotels, restaurants) use sustainable practices to reduce their impact. • e.g. renewable energies, water tanks, grey water, local
employees, use local produce and materials.
KS4 – The Geography Knowledge – THE LIVING WORLD (part 4) Deforestation in Malaysia
Tropical rainforest features Deforestation in Malaysia – Environmental and economic gains and losses

Cold Environments
Polar Tundra
Climate Low precipitation(snow) totalsWinter temps below-50°C
No warm summer (below freezing all year)
Low precipitation (snow)Extremely windyWinter temps fall to below -20°C4 month summer with temperature above freezing
Vegetation
Mosses and lichens – Extremely slow growing
Low growing flowering plants (bearberry)Low bushes & few but mostly no trees
Soils Permanentlycovered by ice (frozen)
Permafrost. Top layer melts insummer.Infertile, waterlogged soil
Animals Polar bears (arctic), Penguins (Antarctic)
More animals –arctic fox, arctic hare – birds, insects in the summer
Plant adaptations: TundraVery low growing (5-15cm from ground) to enable it to survive strong windsStems have thick bark for stability in wintry conditionsSmall, leathery leaves help retain water in dry conditions found in the TundraHairy stems help retain heat
Bright red berries are eaten by birds to help distribute seed.Fast growing and flowering plants to take advantage of short summer season
Opportunities for Development: Svalbard
Mineral extractionCoal mining is vital to the economy. It is the main economic activity with 300 people employed. However, some jobs have been lost due to lower world coal prices
Fishing Sea south of Svalbard one of the richest fishing grounds in the world. 150 species of fish found here (cod, herring and haddock). Fishing controlled by Russia and Norway to ensure sustainability of ecosystem
Energy developments Coal power station provides 100% of Svalbard's energy. In the future, Svalbard is likely to develop geothermal energy due to its close proximity to the. Iceland also gets 90% of its power from geothermal.
Tourism 2011: 70,000 visited Longyearbyen (30k of these were cruise passengers. The Harbour here has been enlarged to cope with tourist numbers. Tourism employs 300 local people. Most tourists come from Norway to explore nature or for adventure tourism.
Challenges of Development: Svalbard
Extreme temperaturesTemps can fall below -30°C. This makes it dangerous to work outside. (frostbite). People wear many layers of clothing to try and combat the cold conditions but this restricts movement making work harder
ConstructionLimited to summer due to lack of daylight and extreme cold in winter. Frozen ground (permafrost) can provide solid foundations but must be prevented from melting. Most roads are gravel, these are cheap, easy to maintain and don’t crack
ServicesWater and sanitationservices are provided using heated water and sewage pipes, to prevent them freezing, and to allow access for repairs. They are above ground to prevent melting the permafrost causing houses to sink in to the ground.
Accessibility Can only be reached by plane or ship. One international airport on Longyearbyen which receives flights from Norway and Canada. Small planesused to visit other islands. Only 50km of roads on Longyearbyen. No roads in other places so transport is by snowmobile
Cold environments under threat. Tundra is a very fragile biome and is easily damaged by humansOff road vehicle driving – popular activity. Most of this takes place in the summer. Warmer temps melt the upper layers of the soil making it extremely soggy. This leads to deep tyre tracks which damage the soil further. Minutes to damage, years to recover. Oil spills from pipelines – Water pollution, risk of fire, kills trees, river habitats and ecosystems destroyed. Oil spills from oil tankers – Massive destruction to coastal ecosystems. e.g. Exxon Valdez oil spill in AlaskaClimate change – Melts ice caps and glaciers. Melts permafrost releasing C02 in to the atmosphere, increasing climate change.
Managing cold environments
Technology – Trans-Alaskan pipeline Transportation of oil from Prudhoe bay to Valdez (1300km). Pipeline is raised and insulated to prevent melting permafrost. Can slide in the event of earthquakes to prevent cracks and spillages. Oil flow stops automatically if there is a leakRaised pipeline allows herds of caribou to migrate beneath it.
Action by governments – Alaska, USANational Environmental Policy Act –Oil companies must protect the environment and recognise rights of native people. National Oceanic and Atmospheric Administration (NOAA) manages sustainable fisheries in Alaska to prevent overfishing of fish stocks.Western Arctic reserve – 9 million hectare protected wilderness protects habitats
International agreements – the Antarctic Treaty Signed in 1959 by countries with territorial claims to Antarctica. Been successful in preventing economic development in region. Recognises importance of scientific research (especially climate change). Controls tourism and keeps disturbance to a minimum.
Conservation groups – WWF in CanadaWorks with local people to manage critical ecosystems e.g. Beaufort Sea. Supports scientific research to help protect important species such as polar bears. Works with oil companies, local Inuit organisations and government to plan a sustainable future for the arctic.
Why protect cold environments1. Home to indigenous people – e.g. Inuit – depend on hunting wildlife to
survive2. Home to many unique organisms – polar bears, tundra vegetation 3. Scientific research – the effects of climate change4. Their natural beauty attracts tourism which boost the economies of
countries such as Norway, Iceland and Alaska
5. Opportunities for forestry and fishing in the oceans.
Polar biome – Antarctica and Northern Greenland. Mostly above the Artic and Antarctic circleTundra biome – Mostly Northern hemisphere. Mostly Northern Russia (Siberia and Northern Canada)Svalbard – Most Northerly inhabited island. Territory of Norway, 77°-80°N latitude, Barents sea -Arctic Ocean
KS4 – The Geography Knowledge – THE LIVING WORLD (part 5) Cold environments Svalbard

7
Term 2 and 3 - Section B: The Changing Economic World (Parts 1-6)
➢ An example of how tourism can reduce the development gap: Jamaica
➢ A case study of an LIC or NEE economy: Nigeria
➢ A case study of an HIC economy: the UK
➢ An example of how modern industries can be environmentally sustainable: Torr Quarry

Development is a process of change in countries that improves people's
lives.Developed countries are usually
wealthier and peoples incomes are higher on average. This means they
have a good standard of living. You can compare the level of
development between different countries using statistics called
indicators of development.There are three types of indicators of development – social, economic and
environmental
Causes of the development gap – The difference in Quality of life and standard of living between richer and pooer countries
Environmental/Natural Economic Historical
Natural hazards, extreme weather can damage regions and areas, this costs money to rebuild.
Corrupt governments treat the population badly, steal the countries money and resources and spend its money on weapons and war
Colonial powers like the UK took advantage of native people, ruled their countries and took their natural resources, leaving them less able to develop.
Extreme climates, droughts or flooding of land, can harm crops so people don’t have enough food to eat or sell for income
Many countries are in debt. They have borrowed money for development projects . They end up paying off loans and not spending on improving development.
When European powers were forced out, they left little industry, low levels of education and social unrest.
Landlocked countries find it harder to trade, they do not have access by sea to other countries so find it hard to export goods
Trade- HICs buy cheap goods and sell expensive ones. LICs often buy expensive goods and have to sell cheap raw materials or cash crops so make little money
Tribal and Cultural differences between different groups create tension and civil war in a struggle for power after colonial powers have left their country
Classifying countriesHIC - High Income Country
(UK, USA, NORWAY)These have strong
economiesNEE – Newly Emerging
Economy (BRAZIL, INDIA, CHINA)
These are rapidly industrialising
LIC- Low Income Country(GHANA, KENYA, HAITI)
These have little industry
Stages of the DTM
Stage 1: (very few countries) High birth rate, high death rate and slow
population growth. Families are large but many people die due to dirty water, lack of healthcare, famine, and disease.
Little population growth
Stage 2: (LIC’s) Birth rate stays high, as people want children to help on farms, fetch water or earn income. Death rate
drops due to more money being spent on healthcare, clean water and sanitation Population growth increases rapidly.
Stage 3: (NEE’s) Birth rate starts falling as people need less children as they are
earning income in factories, contraception is used, and women work rather than
have children. Death rate continues to drop as people are wealthier and
healthier. Population increase slows down.
Stage 4: (HIC’s) The country is now wealthy. Family planning is widespread.
Low birth rate as women focus on careers and marry later. Death rate is low as
healthcare is excellent . Slow population growth.
Stage 5: (HIC’s) People have very few children. The death rate is higher than
the birth rate. Population starts to decline.
Features of a developed country (HIC)
Better healthcareLess poverty
Better educationFair police and courts
Strong economyEquality of men and
womenGood access to services
Higher wagesCleaner environment
Democratic Government
The Demographic transition model shows the changes in population as a country develops over time. In the modern world different countries are at different stages on the DTM
Population pyramids show the population structure (male and female) of countries at different stages of development. (in 5 year intervals)LIC’s - Young populations with high birth rates (wide base) high death rates (steeply sloping sides) and low life expectancy (narrow top)HIC’s – Ageing populations with low birth rates (narrow base) low death rates (straight sides) and long life expectancies (wide top)
Economic Indicators of developmentGNI - How much wealth is generated by the economy of a countryGNI per capita – A countries wealth divided by the population size – High = developed
Social Indicators of development
Life expectancy – (years) A measure of how good health services are in a countryBirth rate – (per 100 people per year) Higher in LIC’s where contraception is uncommon and children are needed for labour on farmsDeath rate – (per 1000 people per year) – Shows how good health services areInfant mortality rate – (post 100 births per year) Shows how effective post natal care isDoctors per 1000 people – Shows the quality and size of the health serviceLiteracy rate – (%) Shows the quality of education provision in a countryAccess to clean water or sanitation (%) Show the quality of basic services in a country
The Human Development Index(HDI) combines GNI per capita,
years in schooling and life expectancy to measure how people are benefitting from a countries economic wealth. (scored between 0 low and 1
high) Countries in Africa score worst and Europe, and North
America
KS4 – The Geography Knowledge – THE CHANGING ECONOMIC WORLD (part 1) Measuring Development

Key vocabulary
HIC High Income Country
NEE Newly Emerging Economy
LIC Low Income Country
Development The process of change for the better in a country
Development Indicators
A measure comparable measure of development between different countries.
Birth Rate Number of births per 1000 people per year
Death Rate Number of deaths per 1000people per year
Infant Mortality Rate
The number of deaths of infants under the age of 1 per 1000 people per year
Life expectancy The number of years an average person is expected to live
Access to Clean Water
Percentage of people with access to safe drinking water
Literacy Rate Percentage of people with basic reading and writing skills
Gross National Income
Total value of gods and services produced by a country in a year (including money earned overseas).
Gross Domestic Product
Total value of goods and services produced in a country in a year(excluding money earned overseas).
Number of Years in School
The number of years an average person spends at school
People per doctor The number of doctors per 1000 people
Human Development Index
Used by the UN to determine development. It uses literacy rate, GDP, life expectancy and number of years in school.
Causes of the Development Gap• Social:Education is poor in LICs so people do not develop skills, so stay poor. Infectious disease and illness spread easily because healthcare is poor and vaccination programs are not in place, so death rates are highWater supply and availability are poor so people struggle to farm or suffer health problems.• Economic: LICs sell cheap primary goods and buy expensive secondary goods so stay poor. HICs sell expensive secondary goods and buy cheap primary goods so get richer. HICs have better trade links. LICs are in debt so do not have funds to pay for development projects• Physical:More natural disasters occur in HICs so money is spent fixing instead of developing country. Extreme climates make food and water supplies unreliable so there are often food shortagesCentral African countries are landlocked so it is not easy to trade.• Historical: Colonialism - LICs were exploited by HICs and became reliant on HICs. After LICs gained independence, corruption and civil wars occurred. Other countries and companies do not want to do business with countries experiencing corruption or civil war. Also the governments do not spend money on the things that matter (e.g. food, water, education).
Effects of the Development Gap• Difference in wealth: HICs are richer. The USA’s share of global wealth is 35%. Africa’s share of global wealth is just 1%.• Difference in health:There is a higher death rate and lower life expectancy in LICs, where 4/10 children die before 15 years and only 2/10 live past 70 years.The biggest killer in LICs is infectious disease whereas in HIC’s it is chronic disease• Migration:The movement of people from one place to another in search of a better lifePeople leave voluntarily (e.g. for a job or family) or are forced (due to war). An economic migrant is someone who chooses to leave to search for work or better servicesA refugee is someone who is forced to leave for example to escape civil war
Ways of reducing the development gap
AID A country receives help from
another country or NGO, in the form of money, emergency
supplies, food, technology, skills.WaterAid (water pumps) or
Oxfam’s Goat Aid are examples of long term sustainable AID.
TOURISMLICs and NEEs can use tourism to
generate income and improve their healthcare, food, water and
education.
Tourism brings Jamaica $2 billion per year (45% of its GNI). Which it
can spend on development.
FAIR TRADEEnsures the farmers in LICs and
NEEs get a fair price for their crops and invest money in local
communities.
Uganda coffee farmers get additional income from
Fairtrade premium which improves their quality of life.
DEBT RELIEFHICs reduce the amount of
money LICs and NEEs have to pay back (reduce interest or invested
money).
By 2015, the International Monetary was giving debt relief to 36 LICs. The total debt relief
was around US$75 billion.
MICROFINANCE LOANSVery small loans given to locals in
LICs to start small businesses. They help the economy to grow and employment rates to rise.
Grameen Bank in Bangladesh offer low interest loans of $100 to
develop small businesses.
INVESTMENTCountries & TNCs invest money and expertise in LICs to increase their profits. It helps LICs with
employment, income and accessing resources.
Shell and KFC in Nigeria. Also more than 2000 Chinese
companies invest billions in Africa.
Sustainable long term AID aim’s to
improve the quality of life and standard of living of individuals and
groups in a country over a
long period.
Intermediate technology
projects provide solutions that are appropriate to the skills and wealth
of the population. Technology is
usually designed to improve
health, water or farming and to be easily repairable.
KS4 – The Geography Knowledge – THE CHANGING ECONOMIC WORLD – (part 2) Reducing the development gap

KS4 – The Geography Knowledge – THE CHANGING ECONOMIC WORLD – NIGERIA (part 3)
NIGERIA IS A NEWLY EMERGING ECONOMY.
Nigeria’s context
Links with the wider world – Nigeria is linked with a number of African and global groups.
CommonwealthIt has equal status with all countries in the commonwealth, including the UK
African UnionEconomic planning and peacekeeping group with Niger, Chad, Benin and Cameroon. It provides troops.
United Nations (the UN)
In 2013 Nigeria was the 5th largest contributor of troops for peacekeeping.
ECOWAS Economic Community of West African States is a trading group
CEN-SAD Community of Sahel-Saharan States is a trading group.
NIGERIA’S ECONOMY
TRANSNATIONAL CORPORATIONS IN NIGERIA HAVE INCREASED DUE TO GLOBALISATION.
23
Social
➢ Multi-ethnic – there are many groups of people who identify with different cultures and traditions (e.g. Yoruba, Hausa and Fulani, Igbo)
➢ Multi-faith – there are many religious groups (e.g. Christianity, Islam and traditional African religions).
This social diversity has often resulted in conflicts between different groups.
Political
Prior to 1960 Nigeria was a British colony. In 1960 it gained independence. Until 1970 there were power struggles and civil wars as groups tried to gain power. Since 1999 it has had a stable government = lots of foreign investment.
Environmental
North: savannah and semi-desert. In the savannah lots of farming occurs (cattle, cotton, millet). Drier in the north.South: rainforest. High rainfall and temperatures. Crops – rubber, cocoa, oil palm. It suffers from the tsetse fly so not many cattle.
Cultural Rich culture with famous authors (Wole Soyinka), footballers, musicians (Fela Kuti) and film industry (Nollywood).
Location
North of the equator in west Africa. It borders fourcountries (Chad, Cameroon, Niger and Benin). The Atlantic Ocean is found along its southern coastline. Its two largest cities are Abuja and Lagos.
Population182 million. Since 1990 the number of people living in cities has increased to over 87 million people.
Nigeria is considered important because…
1. It has the fastest growing economy in Africa. In 2014 it became the world’s 21st largest economy.
2. It has the highest agricultural output in Africa, employing 70% of the population.
3. It supplies 2.7% of the world’s oil, making it the 12th largest producer. 4. Political global links, working with the UN within peacekeeping. 5. It is a role model for other African countries who hope to develop.
What does Nigeriaimport?
Telephones, cars, rice and wheat to China, EU, USA, India, Japan
What does Nigeria export?
Oil, agriculture – rubber, cocoa, cotton to EU, USA, China, India, Indonesia, Brazil
What does Nigeria’s economy look like?
Most people work in the primary sector, however the secondary and tertiary sectors are rapidly growing.
Why has Nigeria’seconomy changed?
• Increased used of farm machinery and better pay/better working conditions in manufacturing industries = decline in primary sector.
• A more stable government = rise in investment from HICs = rise in secondary manufacturing.
• Improved trade links and increased number of people who speak English = increase in telecommunications, finance (tertiary sectors).
Multiplier effect When one change = more changes.
How has Nigeria’s economic change benefitted Nigeria?
• Better and more regular wages = more disposable income = more money spent in local businesses = improved local economy.
• Increase in employment and wages = increase in taxes = government has more money to develop healthcare, education, access to food.
• Successful factories = increase in foreign investments who want to open factories in Nigeria = more jobs = further economic growth.
GlobalisationThe increase in links between countries, made easier by improved communications (internet, smart phones) and transport (airplanes, ships).
Transnationalcorporations (TNCs)
A company that has offices/factories in several countries. There are around 40 TNCs in Nigeria, such as KFC, Unilever and Shell Oil.
Example of TNC in Nigeria
Shell Oil is an Anglo-Dutch company with its headquarters in the Netherlands. It has been extracting oil from the Niger delta since 1958.
Advantages
• Jobs. Shell provides 65,000 jobs and a further 250,000 jobs in related industries (e.g. companies who make parts for the oil rigs)
• People have more money to spend in local shops = boosts local economy. • Country earns money from increased exported goods and increased taxes. • TNCs often invest in the local infrastructure and education.
Disadvantages
• Working conditions/wages are bad.• Oil spills = water pollution = reducing crop production and fishing yields.• Much of the profits generated goes abroad to the country where the TNC
has their headquarters.• Oil Theft and sabotage are big problems in the Niger delta.

KS4 – The Geography Knowledge – THE CHANGING ECONOMIC WORLD – NIGERIA (part 4)
Aid in Nigeria
Industrial Growth. More specifically……
An increase in factories and industrial plants due to industrialisation. As a result……
• Water pollution caused by chemical waste from factories in Kaduna, Kano and Lagos. • Air pollution caused by factories releasing harmful gases into the atmosphere.
Growth of oil extraction. More specifically……
TNCs, such as Shell Oil, drill for oil in the Niger Delta. It is Nigeria’s main source of income. As a result……
• Oil spills in Niger Delta = fires, air pollution, acid rain, water pollution…etc. For example Bodo Oil Spill (2008-9)Leaks in a pipeline = 11 million gallons of crude oil to spill over the land. Farmers and fishermen lost their livelihoods. In 2015 Shell agreed to pay £55 million in compensation to be spent on health clinics and schools.
Urban Growth. More specifically…..
Increase of people moving to urban areasdue to growth of secondary industries (factories) industrialisation. As a result……
• Not enough houses = squatter settlements are formed. • Not enough services or waste disposal = unhygienic rubbish on ground. • Not enough roads = traffic congestion and pollution.
Growth of commercialfarming. More specifically……
Large farms are created to grow crops to export. This is the main source of employment in Nigeria. As a result…..
• 70-80% of Nigeria’s forests have been deforested = many species have disappeared (cheetahs and giraffes and nearly 500 types of plants)
• Farming has caused land erosion and groundwater pollution due to harmful chemicals leaking into soil and river channels.
Negative environmental impacts of rapid economic development
24
To what extent has development in Nigeria improved quality of life?
On the one hand:Social benefits:
More specifically, the HDI shows……
• Better paid jobs in manufacturing and service industries = more disposable income = more money spent on schooling, homes, food, clothes…etc.
• More taxes = more money spent on services (clean water, sanitation, electricity), infrastructure, health care = better transport, longer life expectancy, lower death rate…etc.
A steady increase since 2005 and it is expected to continue.• 2000 Nigeria was among the least developed nations in terms of wealth
and education, where in 2011, Nigeria had one of the highest HDI improvements in the world over the last decade.
On the other hand:Social issues:
Environmental issues:
60% of Nigerians (100 million)live on less than 1$/day, with limited access to clean water, sanitation or reliable electricity.
See above (air and water pollution, deforestation, oil spills…etc.)
Conclusion: Overall I believe……
Most importantly……
Additionally……
Although…..
Economic development in Nigeria has benefitted the country.
The key problems, such as high death rates and a lack of services are being improved due to higher wages = higher taxes = more money to spend on healthcare and infrastructure.
Higher wages have meant Nigerians are able to spend more money on their children’s education and improve access to food and clean water.
Over 100 million Nigerians live with limited access to services, without the recent investment more people would be suffering today. Having said this there is still more work to be done:➢Nigeria must have a consistently stable government to increase foreign
investment. ➢Nigeria must gain peace between religious and ethnic groups to avoid conflict ➢Nigeria must impose sanctions to avoid future oil spills in the Niger Delta.
The World Bank Gave $500 million to fund long term business loans in 2014.
Nets for Life Provide education and mosquito nets to help prevent malaria.
UK Provide a health and HIV programmes, providing health education in rural areas.
USA Provide education and protection against the spread of HIV/AIDS.
Aduwan Centre In 2010, northern Nigeria, ActionAid and the World Bank, built a new health clinic. This supported people by:• Local women were trained to educate mothers about the importance of
immunising their children against polio and other diseases. Develops skills and knowledge, long term, helps important problem, involves local community
• Tests for HIV and immunises children against polio. Helps important problem.
Types of aid • Emergency aid: aid given immediately after a disaster or war (e.g. food, shelter, medical supplies)
• Developmental long-term aid: aims at improving quality of life over a longer time (e.g. WaterAid, schools, roads, electrical supplies)
Aid can be given by….
• Rich individuals, charities and non-governmental organisations (NGOs) (e.g. Oxfam, WaterAid)
• Governmental aid from countries (e.g. UK, USA) and InternationalOrganisations (e.g. World Bank, International Development Agency (IDA))
Why does Nigeria need aid?
• 60% of Nigerians (100 million) live on less than $1/day (£0.63p/day).• Nigerians live with limited access to clean water, sanitation and electricity.• Birth rates and infant mortality rates are high and life expectancy is low.
This is due to… ➢ Corruption by individuals or the government = money is diverted by the government to other projects (e.g. the military or navy)
➢ People give aid but insist on where it is spent. This is not always in the best interest of the people.
Examples of Aid in Nigeria:
KS4 – The Geography Knowledge – THE CHANGING ECONOMIC WORLD – THE UK (part 4) 25
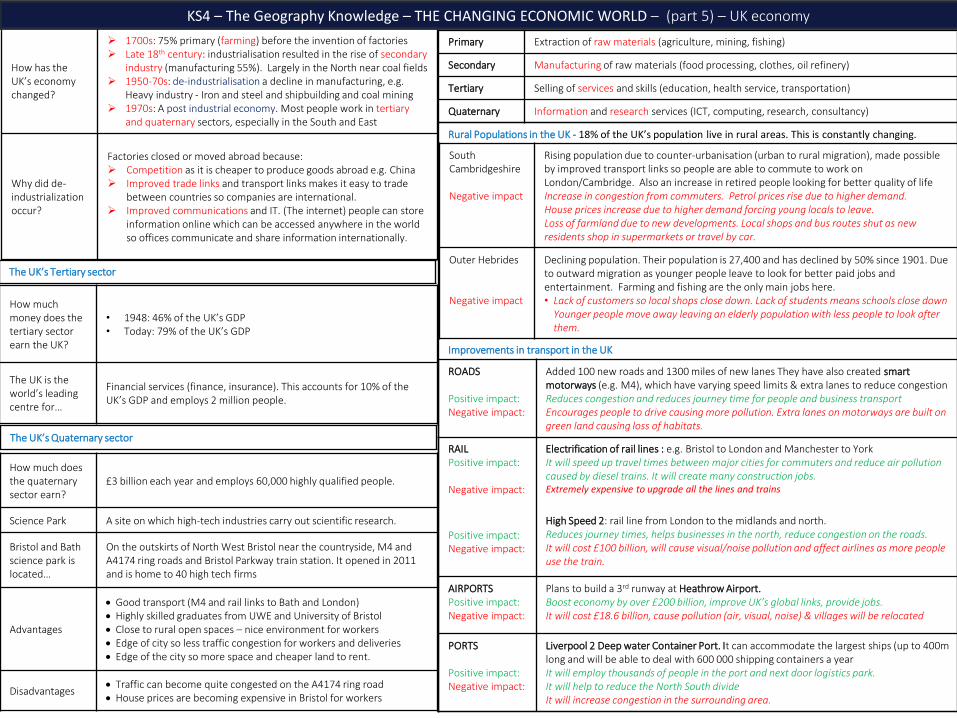
How has the UK’s economy changed?
➢ 1700s: 75% primary (farming) before the invention of factories➢ Late 18th century: industrialisation resulted in the rise of secondary
industry (manufacturing 55%). Largely in the North near coal fields➢ 1950-70s: de-industrialisation a decline in manufacturing, e.g.
Heavy industry - Iron and steel and shipbuilding and coal mining➢ 1970s: A post industrial economy. Most people work in tertiary
and quaternary sectors, especially in the South and East
Why did de-industrializationoccur?
Factories closed or moved abroad because:➢ Competition as it is cheaper to produce goods abroad e.g. China➢ Improved trade links and transport links makes it easy to trade
between countries so companies are international.➢ Improved communications and IT. (The internet) people can store
information online which can be accessed anywhere in the world so offices communicate and share information internationally.
Primary Extraction of raw materials (agriculture, mining, fishing)
Secondary Manufacturing of raw materials (food processing, clothes, oil refinery)
Tertiary Selling of services and skills (education, health service, transportation)
Quaternary Information and research services (ICT, computing, research, consultancy)
Rural Populations in the UK - 18% of the UK’s population live in rural areas. This is constantly changing.
Improvements in transport in the UK
ROADS
Positive impact:Negative impact:
Added 100 new roads and 1300 miles of new lanes They have also created smartmotorways (e.g. M4), which have varying speed limits & extra lanes to reduce congestionReduces congestion and reduces journey time for people and business transport Encourages people to drive causing more pollution. Extra lanes on motorways are built on green land causing loss of habitats.
RAILPositive impact:
Negative impact:
Positive impact:Negative impact:
Electrification of rail lines : e.g. Bristol to London and Manchester to YorkIt will speed up travel times between major cities for commuters and reduce air pollution caused by diesel trains. It will create many construction jobs.Extremely expensive to upgrade all the lines and trains
High Speed 2: rail line from London to the midlands and north. Reduces journey times, helps businesses in the north, reduce congestion on the roads. It will cost £100 billion, will cause visual/noise pollution and affect airlines as more people use the train.
AIRPORTSPositive impact:Negative impact:
Plans to build a 3rd runway at Heathrow Airport. Boost economy by over £200 billion, improve UK’s global links, provide jobs.It will cost £18.6 billion, cause pollution (air, visual, noise) & villages will be relocated
PORTS
Positive impact:Negative impact:
Liverpool 2 Deep water Container Port. It can accommodate the largest ships (up to 400m long and will be able to deal with 600 000 shipping containers a yearIt will employ thousands of people in the port and next door logistics park. It will help to reduce the North South divideIt will increase congestion in the surrounding area.
South Cambridgeshire
Negative impact
Rising population due to counter-urbanisation (urban to rural migration), made possible by improved transport links so people are able to commute to work on London/Cambridge. Also an increase in retired people looking for better quality of lifeIncrease in congestion from commuters. Petrol prices rise due to higher demand.House prices increase due to higher demand forcing young locals to leave.Loss of farmland due to new developments. Local shops and bus routes shut as new residents shop in supermarkets or travel by car.
Outer Hebrides
Negative impact
Declining population. Their population is 27,400 and has declined by 50% since 1901. Due to outward migration as younger people leave to look for better paid jobs and entertainment. Farming and fishing are the only main jobs here.• Lack of customers so local shops close down. Lack of students means schools close down
Younger people move away leaving an elderly population with less people to look after them.
How much money does the tertiary sector earn the UK?
• 1948: 46% of the UK’s GDP • Today: 79% of the UK’s GDP
The UK is the world’s leadingcentre for…
Financial services (finance, insurance). This accounts for 10% of the UK’s GDP and employs 2 million people.
How much does the quaternary sector earn?
£3 billion each year and employs 60,000 highly qualified people.
Science Park A site on which high-tech industries carry out scientific research.
Bristol and Bath science park is located…
On the outskirts of North West Bristol near the countryside, M4 and A4174 ring roads and Bristol Parkway train station. It opened in 2011 and is home to 40 high tech firms
Advantages
• Good transport (M4 and rail links to Bath and London)• Highly skilled graduates from UWE and University of Bristol• Close to rural open spaces – nice environment for workers• Edge of city so less traffic congestion for workers and deliveries• Edge of the city so more space and cheaper land to rent.
Disadvantages• Traffic can become quite congested on the A4174 ring road• House prices are becoming expensive in Bristol for workers
The UK’s Tertiary sector
The UK’s Quaternary sector
KS4 – The Geography Knowledge – THE CHANGING ECONOMIC WORLD – (part 5) – UK economy

KS4 – The Geography Knowledge – THE CHANGING ECONOMIC WORLD – THE UK (part 6) North South divide 26
EXAMPLE OF A MODERN INDUSTRY: Torr Quarry in the Mendip hills Somerset
There are hundreds of quarries in the UK producing million’s of tonnes of stone for building, roads and construction. There are many quarries in Somerset as the limestone found in the area is ideal for construction
How does quarrying harm the environment?
How is Torr quarry more sustainable?
Visual pollution • Quarries create huge holes in the ground in rural areas, spoiling the countryside
Habitatdestruction
• Quarries damage the natural landscape, and also cause noise and air pollution that damages habitats and affects local bio-diversity
Noise pollution• Explosives are used to beak up the rock before it can be transported away. This frightens
wildlife and the noise is a real problem for people living nearby.
Air pollution • Dust from explosions travels in the air and covers roads, fields and peoples homes
Transport Heavy lorries damage local roads and exhausts create air pollution
Visual pollution and habitat destruction
Used parts of the quarry are restored and a lake created with trees and vegetation planting. This creates habitats for wildlife and can be used by locals for recreation such as walking and water sports
Noise pollution Blasting only takes place between 9 and 5 Monday to Friday when most people are at work
Air pollutionDust is monitored carefully and water jets used to keep it from spreading into the surrounding area
Transport The quarry uses its own local railway station to transport most of the rock rather than lorries
THE NORTH – SOUTH DIVIDE
The cultural and economic differences between the north and south of England.
Examples of the north –south divide
• North: lower standard of living, shorter life expectancy, less jobs, lower wages, lower house prices
• South: higher standard of living, longer life expectancy, more jobs, higher wages, higher house prices.
Why does the divide exist?
• Lack of employment in the north due to de-industrialisation. There were more factories and coal fields in the north. When these closed down this caused unemployment.
• More jobs & higher wages in the south due to the creation of a post industrial economy. Tertiary jobs, with high wages are in urban areas, there are more urban areas in the south with more wealth.
• Much high tech industry is in the South due to better accessibility
How are they reducing the divide?
• Better transportation to connect north with south and the wider world (HS2, new ports, smart motorways) so better transport links for businesses which increasing profits for companies in the North
• The Northern Powerhouse strategy, where government encourages business to locate in Northern cities like Manchester and Liverpool
• Enterprise Zones are created by Government to attract new business to area with little existing business, e.g. financial help with factory start up, cheaper business taxes and the addition of high speed internet. This creates jobs in the North.
HOW IS THE UK LINKED WITH THE WIDER WORLD?
Commonwealth
How does this link the UK with the wider world?
The British Empire once covered 1/3rd of the world. During the late 20th
century, most countries gained independence leading to the creation of the COMMONWEALTH: a group of 53 countries, including India and Canada.
• Countries meet every 2 years to discuss current issues. • The UK trades with other Commonwealth countries. • Many people of British descent now live in Australia and Canada.• The Commonwealth Games is held every 4 years.• All countries share common values, such as democracy and human rights.
Transport
Communication
• Airports connect the UK with many countries: Canada, USA, South Africa, Singapore and India.
• The Channel Tunnel is a railway line that connects the UK & mainland Europe.
The internet is the biggest contributor to the UK connecting with other countries. It has had a huge impact on businesses and our economy.➢ In 2013, on average 183 billion e-mails were sent and received each
day. This is 2.1 million every second.➢ In 2014 90% of people in the UK used the internet, compared to just
27% in 2000.
European Union
How does this affect the UK?
Trade within the EU
In 1973 the UK joined the European Union. The EU allows the free movement of people, goods and services between the member countries. It is an important trading group with a total of 28 countries, such as France, Italy, Spain, Germany and Belgium. However we are now leaving because of BREXIT.
1. Financial support for farmers. In 2015, £18 million of EU money was used to support dairy farmers in the UK.
2. Since the early 20th century, 10 Eastern European countries have joined the EU. Since, many people from these countries have migrated to the UK looking for better paid work.
3. The UK support poorer members by paying more money into the EU.
Most of the UK’s trading partners are within the EU. This is because:➢The UK is part of the EU, which encourages trade between EU countries.➢EU countries are closer to the UK and therefore it’s easy to transport goods➢European countries are wealthy, which means they can afford more expensive
goods.
The top countries the UK exports to: USA, Germany, Netherlands, France, SwitzerlandThe top countries the UK imports from: USA, Germany, Netherlands, France and China.
14
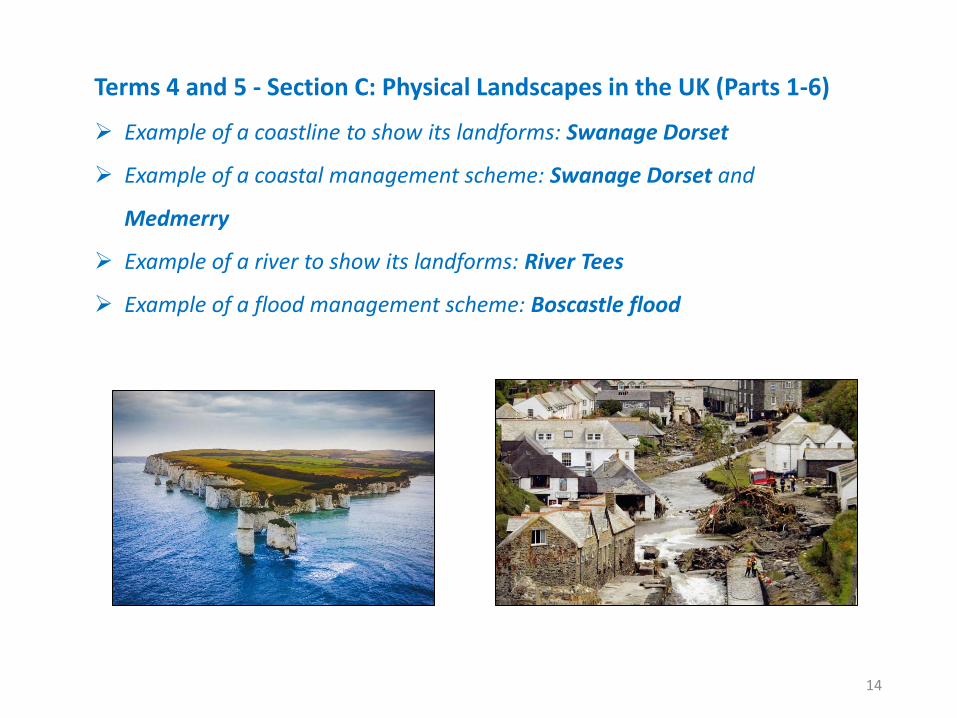
Terms 4 and 5 - Section C: Physical Landscapes in the UK (Parts 1-6)
➢ Example of a coastline to show its landforms: Swanage Dorset
➢ Example of a coastal management scheme: Swanage Dorset and
Medmerry
➢ Example of a river to show its landforms: River Tees
➢ Example of a flood management scheme: Boscastle flood

ConstructiveWaves
• Long wavelength and low wave height• Strong swash and gentle backwash = add
material and create big beaches• Very gentle, created in calm conditions
and a short fetch.
DestructiveWaves
• Short wavelength and high wave height• Weak swash and strong backwash =
remove material and erode beaches• Very powerful, created in storms and
with a long fetch.
Wave fetch The distance of water over which the wind blows (the size of the sea/ocean)
Swash Breaking waves rush water and sediment up the beach.
Backwash The water that rushes flows back to the sea.
Infiltration Water enters the ground
Saturation Rock that is full of liquid
Impermeable rock (non-porous rock)
Rocks that do not allow liquid to pass through
Permeable rock (porous rock)
Rocks that allow liquid to pass through
Slip plane A line of weakness along which movement occurs
KS4 – The Geography Knowledge – PHYSICAL LANDSCAPES IN THE UK (part 1) Coastal Processes
Coastline The outline of the land. Where the land meets the sea
How are waves formed and how do they break?
• Winds push the surface of the water in the direction it is blowing.• The water moves in a circular motion = waves.• As the waves move into shallow water, the rough sea bed = friction =
water travels slower at the base of the circular wave = the top of the wave moves faster than the base.
• Eventually the top of the wave breaks
Wave anatomy
11
Erosion The wearing away or removal of rocks. Erosion attacks the base of the cliff.
Hydraulic Action
The force of the waves hitting the cliffs removes material. Air bubbles in the water are pushed into cracks in the cliff and remove material due to an increase in pressure.
Abrasion Material in the sea hits against the cliffs and removes rocks and soil, like sandpaper.
Corrosion Chemicals in the water dissolve the cliff.
Attrition Material in the sea crash into each other and break into smaller pieces. Continued attrition = smaller, smoother pebbles and sand particles.
Weathering The breakdown of rocks caused by the day-to-day changes in the atmosphere. Weathering attacks the top of the cliff.
Freeze-thaw Water collects in cracks. At night this water freezes and expands. The cracks get larger. In the day the temperature rises and the ice melts (thaws). The repeated freezing and thawing weakens the rock = breaks apart
Biological weathering
Plant roots grow in cracks in the rocks and break them apart. Animals burrow into weak rocks and break it apart.
Carbonation Carbon dioxide and sulphur dioxide mix with rainwater to produce acid rain. This reacts with rocks. e.g. rainwater + CO2 = carbonic acid. Carbonic acid + calcium carbonate (in rocks such as limestone) = calcium bicarbonate which is soluble = rock dissolves.
Transportation The movement of sediment along the coastline.
Longshore drift
The zig zag movement of transported material along the coastline. It is transported in the direction of the prevailing wind.
Deposition The dropping of material carried by the water.
It takes place in areas where the flow of water slows down. Waves lose energy and can no longer carry sediment and is therefore dropped. This occurs in:• Sheltered bays when the wave’s energy decreases.• Areas where there are constructive waves (strong swash/weak backwash)• Coastlines with groynes. These are wooden walls that are built out to sea, along the
beach. They trap sediment being transported by longshore drift.

SPIT e.g. Sandbanks 1. Longshore drift transport material along the coastline in a zigzag pattern.
2. Where there is a sudden bend in the coastline, the waves lose energy = material is deposited.
3. Continued longshore drift and deposition, deposits material out to sea = spit.
4. Strong winds and waves curve the end of the spit = recurved end.
5. The area behind the spit is sheltered from waves = low energy = deposition. Saltmarshes and mud flats are common here. They attract lots of wildlife.
A BAR is formed when a spit joins two headlands together. A lagoon forms behind the bar.
A TOMBOLO is formed when a spit joins to an island.
CAVE, ARCH, STACK e.g. Old Harry
• Erosion (hydraulic action, abrasion) attacks a line of weakness n the cliff = cave.
• Continued erosion, erodes the back of the cave = arch.• Weathering (freeze-thaw, animals, salt) weakens the top
of the arch = unstable. It eventually collapses = stack.• The stack is eroded from the base by the sea and
weakened at the top by weathering = stump.
HEADLAND AND BAY e.g. Swanage Bay and the Foreland
A headland is a cliff that sticks out into the sea.A bay is an indentation in the coastline between headlands• Discordant coastlines, with different rock types, will
erode at different speeds. • Hard rock (granite) will erode more slowly, creating
headlands.• Soft rock (clay) will erode more quickly, creating bays.• Bays are sheltered = deposition = beaches are formed.
MASS MOVEMENT Mass movement is the downhill movement of material caused by gravity.
Rotational slump and Landslide: • Heavy rain infiltrates the permeable rock = saturated and
heavier. The rocks become unstable and a line of weakness (slip plane) forms.
• Land moves downhill along the line of weakness.• Rotational slumps – a CURVED line of weakness forms.• Landslides – a STRAIGHT line of weakness forms.
Rock Fall – where rocks fall down a cliff face due to gravity• Freeze-thaw weakens the rocks at the top of the cliff. • These weakened rocks fall to the base of the cliff. • The material that collects at the bottom of the cliff is called a
scree slope.
KS4 – The Geography Knowledge – PHYSICAL LANDSCAPES IN THE UK (part 2) Coastal features 12
LANDFORMS: TRANSPORTATION AND DEPOSITIONLANDFORMS: EROSION AND WEATHERING
WAVE CUT PLATFORM • Waves erode the base of the cliff between the high and low tide levels due to hydraulic action and abrasion.
• This creates a wave cut ntch and overhanging cliff. • Further erosion = the notch gets larger = overhanging
cliff becomes unstable. • Eventually the overhanging cliff collapses leaving a flat
area of rock (wave cut platform).• The cliff retreat.
BEACH e.g. Swanage Bay Deposits of sand and shingle (pebbles) at the coast.
Beaches are found on the coast between the high water mark (high tide line) and low water mark (low tide line). They are formed by constructive waves depositing material, such as sand and shingle. ➢ Sand beach – wide, and flat. ➢ Shingle beach – steep and narrow.
SAND DUNE e.g. Studland SAND DUNES – mounds of sand at the back of the beach.
• Sand is moved up the beach by the wind. • It gets trapped by obstacles (e.g. driftwood) and the sand
is deposited. Overtime it gets vegetated and larger = embryo dune.
• As you travel inland from the sea, the sand dunes get: taller, larger, darker, more vegetated.
Beaches are made up of the offshore (out to sea), foreshore(between high and low tide lines) and backshore (high up the beach, near the sand dunes).
INLAND
KS4 – The Geography Knowledge – PHYSICAL LANDSCAPES IN THE UK (part 3) Coastal protection
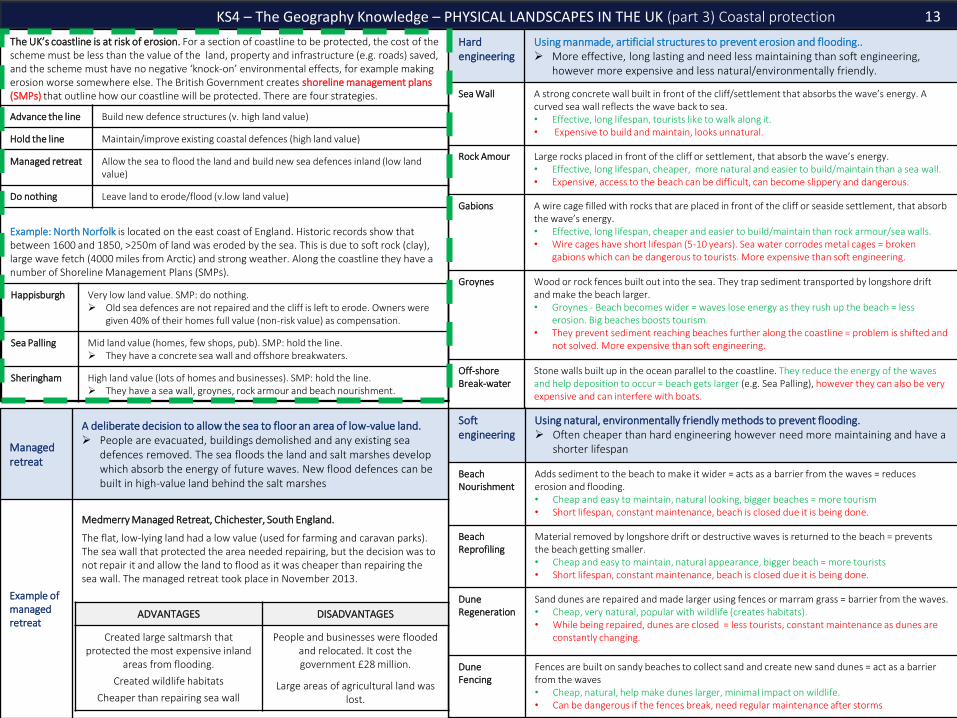
The UK’s coastline is at risk of erosion. For a section of coastline to be protected, the cost of the scheme must be less than the value of the land, property and infrastructure (e.g. roads) saved, and the scheme must have no negative ‘knock-on’ environmental effects, for example making erosion worse somewhere else. The British Government creates shoreline management plans (SMPs) that outline how our coastline will be protected. There are four strategies.
Example: North Norfolk is located on the east coast of England. Historic records show that between 1600 and 1850, >250m of land was eroded by the sea. This is due to soft rock (clay), large wave fetch (4000 miles from Arctic) and strong weather. Along the coastline they have a number of Shoreline Management Plans (SMPs).
13
Hard engineering
Using manmade, artificial structures to prevent erosion and flooding..➢ More effective, long lasting and need less maintaining than soft engineering,
however more expensive and less natural/environmentally friendly.
Sea Wall A strong concrete wall built in front of the cliff/settlement that absorbs the wave’s energy. A curved sea wall reflects the wave back to sea. • Effective, long lifespan, tourists like to walk along it.• Expensive to build and maintain, looks unnatural.
Rock Amour Large rocks placed in front of the cliff or settlement, that absorb the wave’s energy.• Effective, long lifespan, cheaper, more natural and easier to build/maintain than a sea wall.• Expensive, access to the beach can be difficult, can become slippery and dangerous.
Gabions A wire cage filled with rocks that are placed in front of the cliff or seaside settlement, that absorb the wave’s energy.• Effective, long lifespan, cheaper and easier to build/maintain than rock armour/sea walls.• Wire cages have short lifespan (5-10 years). Sea water corrodes metal cages = broken
gabions which can be dangerous to tourists. More expensive than soft engineering.
Groynes Wood or rock fences built out into the sea. They trap sediment transported by longshore drift and make the beach larger.• Groynes - Beach becomes wider = waves lose energy as they rush up the beach = less
erosion. Big beaches boosts tourism. • They prevent sediment reaching beaches further along the coastline = problem is shifted and
not solved. More expensive than soft engineering.
Off-shoreBreak-water
Stone walls built up in the ocean parallel to the coastline. They reduce the energy of the waves and help deposition to occur = beach gets larger (e.g. Sea Palling), however they can also be very expensive and can interfere with boats.
Soft engineering
Using natural, environmentally friendly methods to prevent flooding. ➢ Often cheaper than hard engineering however need more maintaining and have a
shorter lifespan
BeachNourishment
Adds sediment to the beach to make it wider = acts as a barrier from the waves = reduces erosion and flooding.• Cheap and easy to maintain, natural looking, bigger beaches = more tourism• Short lifespan, constant maintenance, beach is closed due it is being done.
BeachReprofiling
Material removed by longshore drift or destructive waves is returned to the beach = prevents the beach getting smaller.• Cheap and easy to maintain, natural appearance, bigger beach = more tourists• Short lifespan, constant maintenance, beach is closed due it is being done.
Dune Regeneration
Sand dunes are repaired and made larger using fences or marram grass = barrier from the waves.• Cheap, very natural, popular with wildlife (creates habitats). • While being repaired, dunes are closed = less tourists, constant maintenance as dunes are
constantly changing.
Dune Fencing
Fences are built on sandy beaches to collect sand and create new sand dunes = act as a barrier from the waves• Cheap, natural, help make dunes larger, minimal impact on wildlife.• Can be dangerous if the fences break, need regular maintenance after storms
Advance the line Build new defence structures (v. high land value)
Hold the line Maintain/improve existing coastal defences (high land value)
Managed retreat Allow the sea to flood the land and build new sea defences inland (low land value)
Do nothing Leave land to erode/flood (v.low land value)
Happisburgh Very low land value. SMP: do nothing. ➢ Old sea defences are not repaired and the cliff is left to erode. Owners were
given 40% of their homes full value (non-risk value) as compensation.
Sea Palling Mid land value (homes, few shops, pub). SMP: hold the line. ➢ They have a concrete sea wall and offshore breakwaters.
Sheringham High land value (lots of homes and businesses). SMP: hold the line. ➢ They have a sea wall, groynes, rock armour and beach nourishment.
Managed retreat
A deliberate decision to allow the sea to floor an area of low-value land. ➢ People are evacuated, buildings demolished and any existing sea
defences removed. The sea floods the land and salt marshes develop which absorb the energy of future waves. New flood defences can be built in high-value land behind the salt marshes
Example ofmanaged retreat
Medmerry Managed Retreat, Chichester, South England.
The flat, low-lying land had a low value (used for farming and caravan parks). The sea wall that protected the area needed repairing, but the decision was to not repair it and allow the land to flood as it was cheaper than repairing the sea wall. The managed retreat took place in November 2013.
ADVANTAGES DISADVANTAGES
Created large saltmarsh that protected the most expensive inland
areas from flooding.
Created wildlife habitats
Cheaper than repairing sea wall
People and businesses were flooded and relocated. It cost the government £28 million.
Large areas of agricultural land was lost.

KS4 – The Geography Knowledge – PHYSICAL LANDSCAPES IN THE UK (part 4) River processesEvaporation The sun heats up water. The water turns into a gas which rises up
into the atmosphere (air).Transpiration The sun heats up water on the leaves of trees. The water turns
into a gas which rises up into the atmosphere (air).Condensation As the water in the atmosphere rises, it cools and condenses to
form clouds.Precipitation Water in the cloud falls to the earth’s surface as rain, hail, sleet
and snow.Surface run-off When the water runs off the surface of the ground as a river or
stream.Groundwaterflow
When water flows through the rocks and soil underground.
Infiltration When water enters a rock.
14
Erosion The removal of rock by the river
Hydraulic Action
The force of water hits against the river channel and removes material. It is common with fast moving, high energy water.
Abrasion Sediment carried by the river hits the river channel and removes material.
Corrosion Chemicals in the water dissolve rocks (e.g. limestone)
Attrition Stones carried by the river hit into each other, gradually making the rocks smaller and smoother. Rocks in the upper course are large and more angular than rocks in the lower course.
Weathering The breakdown of rocks caused by the day-to-day changes in the atmosphere.
Freeze-thaw Water collects in cracks. At night this water freezes and expands. The cracks get larger. In the day the temperature rises and the ice melts (thaws). The repeated freezing and thawing weakens the rock = breaks apart.
Transportation Eroded material is carried by the river downstream.
Traction Large particles roll along the river bed.
Saltation Pebble-sized particles bounce along the river bed.
Suspension Small particles (silt and clay) are carried in the water.
Solution Soluble materials dissolve in the water and are carried along.
Deposition Deposition takes place where a river does not have enough energy to carry sediment (its load). As a result it is dropped.
Drainage Basin The area of land in which water drains into a specific river.Watershed The boundary of a drainage basin. It separates one drainage basin
from another. It is usually high land.Source The point where the river begins.Tributary A stream or small river that joins a larger stream or big river.Confluence A point where two streams or rivers meet.Mouth The point where the river meets the sea or ocean.
Long Profile Shows the gradient of a river from its source to mouth.
Cross Profile Shows the shape of the river channel and valley. It is an imaginary ‘slice’ across a river channel/valley at a specific point.
Embankments Raised river banks on either side of a river
Contour Line Brown lines on an OS map that join up points of equal height. They allow us to determine slope gradient.
Flood A flood occurs when there is too much water in the river channel. As a result water spills out onto the floodplain.
Flash Flood Rapidly rising river levels leading to greater
Storm Hydrograph
Shows how a river changes after a storm and is used to predict floods
Lag time The time (in hours) between the peak rainfall and peak discharge
Discharge The volume of water in a river channel (measured in cumecs)
Long profile Shows the gradient of a river along its course (from its source to its mouth).
Cross profile Shows the shape of the river channel and valley. It shows a cross section of the river.
Upper course: ➢ Long profile: very steep gradient. ➢ Cross profile: Vertical erosion has created steep V shape valleys. Narrow and shallow river
channel.➢ Landforms: V shape valleys, waterfalls, gorge.
Middle course: ➢ Long profile: medium gradient. ➢ Cross profile: Gentle sloping valley sides – formed by lateral erosion. Wider and deeper river
channel.
Lower course: ➢ Long profile: very steep gradient. ➢ Cross profile: Lateral erosion widens the river valley = very wide, almost flat valley. Widest
and deepest river channel➢ Landforms = estuaries, floodplain, levees, meanders, ox bow lakes

KS4 – The Geography Knowledge – PHYSICAL LANDSCAPES IN THE UK (part 5) River features and causes of flooding 15
LANDFORMS: TRANSPORTATION AND DEPOSITIONLANDFORMS: EROSION AND WEATHERING
NO FLOOD • Trees in drainage basin that intercept rainfall = longer lag time.• Gentle rain = more water infiltrated = takes longer to reach river channel• Permeable rock = more water infiltrated = takes longer to reach river.• Dry soils = more water can infiltrate = takes longer to reach river channel • Large drainage basins = water has to travel further to reach river = slower
FLOOD • Deforestation – no trees to intercept rainfall = shorter lag time• Intense rain = too fast to infiltrate = more surface runoff = quicker to river• Impermeable rock = rain not infiltrated = more surface runoff = quicker to
river. Impermeable surfaces created when areas are urbanised (concrete).• Steep slopes = quick transfer of water to river channel = short lag time
Waterfall
Gorge
A steep fall of water in the upper course of a river.• Waterfalls are formed when hard rock overlays softer rock.• The softer rock is eroded more quickly than the harder rock =
plunge pool and overhanging rock. • Continued erosion makes the plunge pool deeper and
overhanging rock unstable.• The overhanging rock collapses and the waterfall retreats
upstream.
A narrow steep sided valley that is usually found immediately downstream from a waterfall.
It is formed by the gradual retreat of a waterfall over hundreds or thousands of years.
Interlocking Spurs • In the upper course, the river erodes vertically (downwards) = steep valley sides.
• Weathering of the valley sides = deep V shape valleys.• The river in the upper course does not have enough energy to
erode laterally and so flows around bands of more resistant rock• These resistant hard rock creates ridges with jut out = spurs. They
overlap = interlocking spurs.
Floodplain A wide, flat area of marshy land on either side of a river in the lower course of a river.
• Flooding is common in the lower course of a river. When a river floods, velocity decreases = energy decreases = deposition occurs.
• Layers of deposited fine sediment (e.g. silt/alluvium) build up.• The floodplain is made wider due to large meanders that wind
across the floodplain.
Levee A raised river bank found alongside a river in the lower course, caused by repeated flooding. They are natural embankments.
Flooding is common in the lower course of a river. When a river floods, velocity decreases = energy decreases = deposition occurs. • Heavier, larger material is deposited first, next to the river bank.• Lighter silt/alluvium is deposited further across the floodplain.• Over time the height of the banks are raised by a build up of
coarser sand deposits = levees.
Estuary Is the wide part of a river, where the river meets the sea (mouth)
Estuaries are the transitional zone between the river & sea. • The water flowing down the river meets water flowing up the
river from the sea (during high tides) = velocity decreases= energy decreases = lots of deposition.
• Due to deposition, salt marshes form = habitats for wildlife.In some estuaries humans have made ports for industry.
LANDFORMS: EROSION AND DEPOSITION
Meander
Ox bow lake
A bend in the river on the valley floor.
1. It starts with a slight bend. 2. Water moves faster on the outside of the bend and slower on the
inside.3. The fast water erodes the outside of the bend. The slower water
deposits material on the inside of the bend. 4. Continued erosion and deposition makes the bend bigger.
U-shaped lakes formed when a meander is no longer connected to a river
5. Continued erosion and deposition = meander bigger and the neck (A) narrows.
6. Eventually the neck breaks through and the water takes the most direct route, avoiding the meander
7. As less water is flowing through the meander, the energy is reduced = deposition. The meander is blocked off and an oxbow lake is created.
A
Storm Hydrograph
A graph that Shows how a riverchanges after a storm and can be used to predict floods.
Lag time The time between the peak rainfall and peak discharge
Discharge The volume of water in a river channel (measured in cumecs)
STORM HYDROGRAPH
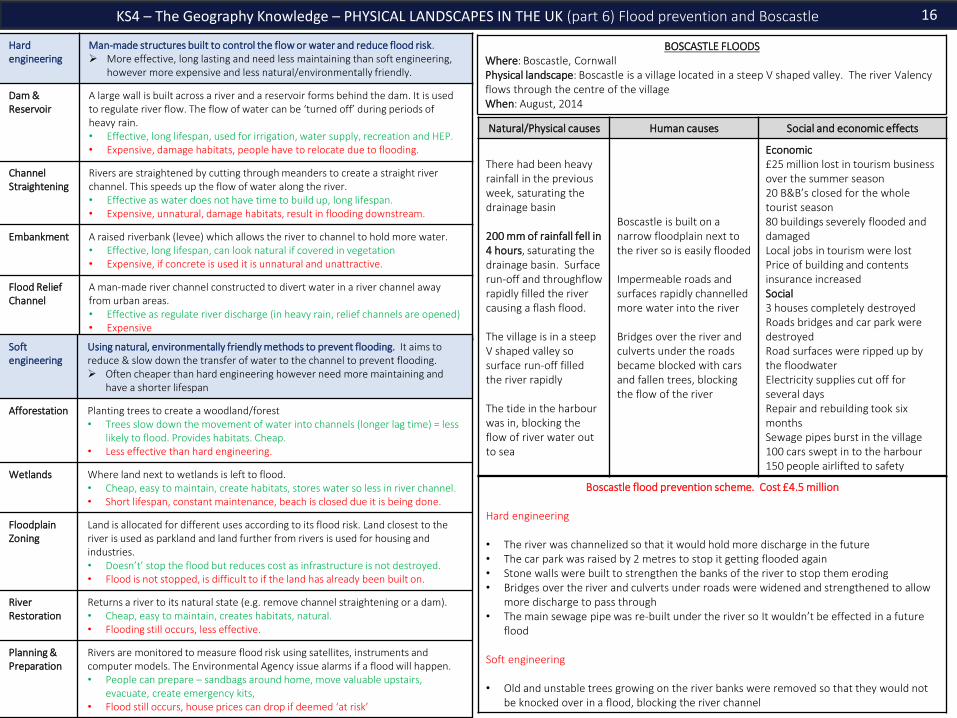
KS4 – The Geography Knowledge – PHYSICAL LANDSCAPES IN THE UK (part 6) Flood prevention and Boscastle
Hard engineering
Man-made structures built to control the flow or water and reduce flood risk. ➢ More effective, long lasting and need less maintaining than soft engineering,
however more expensive and less natural/environmentally friendly.
Dam &Reservoir
A large wall is built across a river and a reservoir forms behind the dam. It is used to regulate river flow. The flow of water can be ‘turned off’ during periods of heavy rain.• Effective, long lifespan, used for irrigation, water supply, recreation and HEP.• Expensive, damage habitats, people have to relocate due to flooding.
Channel Straightening
Rivers are straightened by cutting through meanders to create a straight river channel. This speeds up the flow of water along the river. • Effective as water does not have time to build up, long lifespan.• Expensive, unnatural, damage habitats, result in flooding downstream.
Embankment A raised riverbank (levee) which allows the river to channel to hold more water.• Effective, long lifespan, can look natural if covered in vegetation• Expensive, if concrete is used it is unnatural and unattractive.
Flood Relief Channel
A man-made river channel constructed to divert water in a river channel away from urban areas.• Effective as regulate river discharge (in heavy rain, relief channels are opened)• Expensive
Soft engineering
Using natural, environmentally friendly methods to prevent flooding. It aims to reduce & slow down the transfer of water to the channel to prevent flooding. ➢ Often cheaper than hard engineering however need more maintaining and
have a shorter lifespan
Afforestation Planting trees to create a woodland/forest• Trees slow down the movement of water into channels (longer lag time) = less
likely to flood. Provides habitats. Cheap.• Less effective than hard engineering.
Wetlands Where land next to wetlands is left to flood.• Cheap, easy to maintain, create habitats, stores water so less in river channel. • Short lifespan, constant maintenance, beach is closed due it is being done.
Floodplain Zoning
Land is allocated for different uses according to its flood risk. Land closest to the river is used as parkland and land further from rivers is used for housing and industries.• Doesn’t’ stop the flood but reduces cost as infrastructure is not destroyed.• Flood is not stopped, is difficult to if the land has already been built on.
River Restoration
Returns a river to its natural state (e.g. remove channel straightening or a dam). • Cheap, easy to maintain, creates habitats, natural.• Flooding still occurs, less effective.
Planning &Preparation
Rivers are monitored to measure flood risk using satellites, instruments and computer models. The Environmental Agency issue alarms if a flood will happen.• People can prepare – sandbags around home, move valuable upstairs,
evacuate, create emergency kits, • Flood still occurs, house prices can drop if deemed ‘at risk’
16
BOSCASTLE FLOODSWhere: Boscastle, Cornwall Physical landscape: Boscastle is a village located in a steep V shaped valley. The river Valencyflows through the centre of the villageWhen: August, 2014
Natural/Physical causes Human causes Social and economic effects
There had been heavy rainfall in the previous week, saturating the drainage basin
200 mm of rainfall fell in 4 hours, saturating the drainage basin. Surface run-off and throughflowrapidly filled the river causing a flash flood.
The village is in a steep V shaped valley so surface run-off filled the river rapidly
The tide in the harbour was in, blocking the flow of river water out to sea
Boscastle is built on a narrow floodplain next to the river so is easily flooded
Impermeable roads and surfaces rapidly channelled more water into the river
Bridges over the river and culverts under the roads became blocked with cars and fallen trees, blocking the flow of the river
Economic£25 million lost in tourism business over the summer season20 B&B’s closed for the whole tourist season80 buildings severely flooded and damagedLocal jobs in tourism were lostPrice of building and contents insurance increasedSocial3 houses completely destroyedRoads bridges and car park were destroyedRoad surfaces were ripped up by the floodwaterElectricity supplies cut off for several daysRepair and rebuilding took six monthsSewage pipes burst in the village100 cars swept in to the harbour150 people airlifted to safety
Boscastle flood prevention scheme. Cost £4.5 million
Hard engineering
• The river was channelized so that it would hold more discharge in the future• The car park was raised by 2 metres to stop it getting flooded again• Stone walls were built to strengthen the banks of the river to stop them eroding• Bridges over the river and culverts under roads were widened and strengthened to allow
more discharge to pass through• The main sewage pipe was re-built under the river so It wouldn’t be effected in a future
flood
Soft engineering
• Old and unstable trees growing on the river banks were removed so that they would not be knocked over in a flood, blocking the river channel

PAPER 2: HUMAN GEOGRAPHY
Section A: Urban Issues and Challenges (Parts 1-5)
➢ Case study of a major city in a LIC or NEE: Rio de Janeiro
➢ An example of how urban planning improves the quality of life for the urban poor: Favela Bairro
Project
➢ Case study of a major city in the UK: Bristol
➢ An example of an urban regeneration project: Temple Quarter
Section B: The Changing Economic World (Parts 1-6)
➢ An example of how tourism can reduce the development gap: Jamaica
➢ A case study of an LIC or NEE: Nigeria
➢ A case study of an HIC: the UK
➢ An example of how modern industries can be environmentally sustainable: Torr Quarry
Section C: The Challenge of Resource Management (27-29)
➢ Example of a large scale water management scheme: Lesotho
➢ Example of a local scheme in an LIC to increase water sustainability: The Wakel river basin project

22
Term 6 - Section A: Urban Issues and Challenges (Parts 1-5)
➢ Case study of a major city in a LIC or NEE: Rio de Janeiro
➢ An example of how urban planning improves the quality of life for the urban
poor: Favela Bairro Project
➢ Case study of a major city in the UK: Bristol
➢ An example of an urban regeneration project: Bristol Harbourside

KS4 – The Geography Knowledge – URBAN ISSUES AND CHALLENGES (part 1) 17
Urbanisation is…..
More specifically…..
By 2050…..
The increase in people living in towns and cities
In 1950 33% of the world’s population lived in urban areas, whereas in 2015 55% of the world’s population lived in urban areas.
It is predicted 70% will be living in urban areas.
Urban growth The increase in land covered by cities
Urban growth is caused by…..
Natural increase and rural to urban migration.
Urbanisation results in the creation of….
Megacities
A megacity is… An urban area with over 10 million people living in it. For example Mumbai, Tokyo and Mexico City.
Natural increase is….. If a country has a higher birth rate than death rate, the population will naturally increase. This type of population is often found in stages 2 and 3 of the DTM where there is a high number of young adults (18-35 years) who are having lots of children and few older people who are dying due to improved healthcare. Therefore urban growth is common in NEEs.
Rural to urban migration is… The movement of people from the countryside to cities. It is caused by push factors (pushing people out of rural areas) and pull factors (pulling people to cities).
Push factors are…. Factors that push people out of an area. Negative factors that make people want to leave an area.
Pull factors are…. Factors that pull people out of an area. Negative factors that make people want to leave an area.
Rural to urban migration push factors make people want to leave rural areas. Examples include…..
• Farming is hard and poorly paid• Increased use of machinery in farming = less people
needed to word = unemployment• Dry land in rural areas caused by desertification = land
cannot be farmed• Fewer doctors, hospitals, schools and transportation
routes
Rural to urban migration pull factors make people want to move to urban areas. Examples include…..
• More highly skilled, better paid jobs• Range of entertainment opportunities• More and better doctors and hospitals• More schools and better education• Better transportation routes/public transport
Most megacities are located…
More specifically……
In LICs and NEEs
65% of all megacities are located in LICs and NEEs.
Urban growth is happening more in LICs/NEEs due to….
More specifically…..
Industrialisation
As a country develops their economy changes from agriculture (primary) to manufacturing (secondary) and services (tertiary). This occurs during the industrial revolution. Most of the secondary and tertiary jobs are in towns and cities. When this occurs, lots of people move from rural to urban areas = rapid urbanisation. HICs went through their industrial revolution a long time ago, whereas LICs and NEEs are going through their industrial revolution now. As a result more people in LICs and NEEs are currently moving to urban areas.
Urban growth is happening more in LICs/NEEs due to….
More specifically…..
Natural increase
LICs and NEEs are in stages 2 and 3 of the demographic transition model. In these stages there is a high birth rate and lower death rate = more people are born than are dye = the population naturally increases. In HICs there is a low death rate and even lower birth rate = the population is declining.
Urban growth is happening more slowly in HICS due to…
More specifically……
Counter-urbanisation.
In HICS, people are deciding to leave cities and live in the surrounding countryside to get a better quality of life (less pollution, quieter, more space). They can commute to work due to improved transportation.
Case studies: Rio de Janeiro and Bristol
Three are currently 34 megacities in the world.

RIO DE JANEIRO is located in Guanabara Bay, on the south-east coast of Brazil. It lies next to the Atlantic Ocean. It is the cultural capital of Brazil and 2nd largest city, with a population of 12.5 million.
It is globally important due to:➢ Industrial businesses – produces 5% of Brazil’s GDP.➢ Financial centre – banking, finance and insurance. ➢ It hosted the 2014 World Cup, 2016 Olympics and annually the Rio Carnival. These factors have attracted a multicultural population, with people from all over the world moving to Rio to live: South Korea, China, UK, USA, Portugal, Argentina and Bolivia.
KS4 – The Geography Knowledge – URBAN ISSUES AND CHALLENGES – RIO (part 2)
Urban growth in Rio de Janeiro has created many social and economic opportunities:
Opportunity Evidence in Rio
JOBS
• Rio provides >6% of all jobs in Brazil.• Rio is home to many manufacturing industries, (pharmaceuticals, clothing,
furniture and processed foods) and service industries (banking, insurance). • As Rio grows there are many jobs in construction
BUSINESSOPPORTUNITIES
• The growth of urban industrial areas can increase economic development. It will attract businesses to the area.
EDUCATION• Rio provide grants to poor families to encourage children to attend school.• Rio have many volunteers who help in schools.• There are adult classes to help adults gain skills = better jobs
SERVICES
• Rio has a new nuclear generator and hydro-electric power station = more energy produced.
• 60km of new electricity lines = better access to energy• By 2014, 95% of Rio had access to a mains water supply. This was due to 7
new water treatment plants and 300km of new water pipes being laid.• 12 new sewage works have been built and 5km of sewage pipes installed in
badly polluted areas.
HEALTHCARE
• Some areas in Brazil (Barra de Tijuna) have a life expectancy of 80 years old. Brazil (as a country) has an average life expectancy of 63 years.
• Medical staff go into favelas and offer emergency medication to people’s homes.
ENTERTAINMENT• One of the world’s top tourist destinations - The Statue of Christ the
Redeemer, stunning natural surroundings and entertainment.
TRANSPORT• It has two major airports and five shipping ports• Public transport, toll roads and one way systems to control traffic
Urban growth in Rio has also created many social, economic & environmental challenges
Challenge Evidence in Rio
Lack of healthcare In 2013 only 55% of the city had a local family health clinic.
Lack of education Not enough schools, teachers or funding for education.
Lack of water supply Around 12% of Rio does not have access to running water.
Lack of energy Due to illegal tapping onto electricity lines = blackouts.
Unemployment and informal sector jobs
Many people are unemployed or work in the informal sector (e.g. street vendor), which are poorly paid, no contract, no taxes paid.
Air pollution caused by too many cars and growth of factories = 5000 deaths per year.
Water pollution caused by sewage running into rivers (200 tonnes/day) and industrial waste from factories and oil spills.
Waste pollution a lack of waste disposal = rubbish on streets.
Creation of squatter settlements (favelas)
These are illegal settlements on the outskirts of citiesCharacteristics:• Poorly built homes using basic materials • Houses built on steep slopes = landslides (e.g. 2010: 224 killed and
13,000 lost their homes) and limited road access• 30% no electricity, 50% no sewage system and 12% no running water. • 20% are unemployed. Those who are, are employed in informal sector • Drug gangs are common & police is rare (murder rate is 20 per 1000ppl)• Infant mortality rate: 50 per 1000 people due to high population
densities (37,000 per km²), lack of waste disposal, spread of disease and lack of health care.
URBAN PLANNING: improving quality of life in favelas.Favela Bairro Project is a site and service scheme that improves quality of life in Complexo de Alemao(favela in north Rio).• Roads have been improved and paved• Improved access to water pipes and sanitation• Hillsides strengthened to prevent landslides• New healthcare, leisure and education facilities• Cable car has been installed that connects favela to centre of Ipanema (central Rio). Favela
residents given free return daily ticket.• 100% mortgages provided for locals to buy homes• A Pacifying Police Unit (UPP) was set up = less crime
Successful because: access/mobility is better = access to jobs in city centre, improved healthcare, education, access to services, 100% mortgages = more people can buy homes, less crime, fewer landslides.
Unsuccessful because: new infrastructure not maintained and residents did not have skills to fix it, area improved = increase in demand to live there = increase in rent = poorest had to move, budget of US$1 billion could not help all favelas.
18

URBANISATION – BRISTOL – Part 3 Bristol’s location and oportunities
The UK’s population is unevenly distributed.• 82% of people live in urban areas• 32% live in London and the South East• Sparse populations – Scotland and Wales
Why do more people live in urban areas?• Higher paid jobs and better working
conditions in tertiary and quaternary sector, more entertainment options, better transport, more housing, better healthcare and education.
Why do more people live in the south-east?• Warmer, less rainfall, flatter land in the
SE. In central Scotland and Wales its is colder, more rainfall and mountainous.
Bristol is located in the south-west of England. It’s population is 440,500 people, which is expected to grow to 500,000 by 2029.
International migration has accounted for 50% of Bristol’s population growth. There are 50 countries represented in its population.
They impact on the city by:➢ Hard working workforce that bring new
skills = contribute to local/national economy
➢ Enrich the culture of the city➢ Young migrants balance aging population➢ Pressure on housing, healthcare and
education➢ Language barrier and different religions=
challenge to integrate into wider community
Why do people migrate to Bristol?• Culture/entertainment– sport venues,
theatres, music venues, cathedrals• Two cathedrals – religious importance• Two universities – higher education• Transport (M4, M5, rail) link Bristol to UK• Transport (ports/airports) link Bristol to
Europe and USA.• Economic growth – in tertiary and
quaternary industries = jobs (finance, technology, aerospace, media, defence)
• Economic growth due to inward investment from companies such as airbus (France) and BMW (Germany).
OPPORTUNITIES IN BRISTOL
Bristol is constantly changing (population, economy, industrialisation, de-industrialisation, regeneration) . These changes create a number of social, economic & environmental opportunities.
SOCIAL OPPORTUNITIES • Increase in migration = diverse population = range of food, festivals and cultural experiences.• Entertainment: new theatres and music venues (the Old Vic, Bristol Arena and Tobacco Factory)• Recreation: lots of sport teams (rugby, cricket, football) are developing their opportunities for
people in Bristol. Bristol Rovers are building new football stadium on the outskirts of the city.• New shopping centres: Cabot’s Circus in the city centre and Cribbs Causeway on the outskirts of
the city offer residents shops, cinemas, restaurants, accommodation, jobs…etc.• Improved transportation links (e.g. an integrated transport system, metrobus, electrification of
the trains to London and improved public transport) = people can get around Bristol faster and the air is cleaner (due to less cars = less pollution).
ECONOMIC OPPORTUNITIES • Growth in tertiary and quaternary industries = employment opportunities (85% of jobs are in
tertiary, 6% in quaternary, 8% in secondary and 1% in primary).• Redevelopment of brownfield sites (e.g. the Temple Quarter) has attracted new tertiary and
quaternary companies = jobs = higher disposable income = money spent in local area and therefore reinvested into the area = further economic development.
• Growth of high-tech industries due to access to highly skilled university graduates, research facilities, clean non-polluted environment, cheaper land, superfast broadband speeds (the government gave £100million to create a super connected city). Companies include: Hewlett-Packard, Toshiba, Aardman Animations (clay films), Defence Procurement Agency (DPA) (employs 10,000 people to make army and navy products) and aerospace (14 of the 15 main aircraft companies are in Bristol (e.g. Rolls Royce and Airbus) who produce aircraft parts and navigation/communication systems.
ENVIRONMENTAL OPPORTUNITIES
As the city has grown, Bristol has created transport systems to reduce traffic congestion.• Bristol’s Integrated Transport System links different forms of public transport. (e.g. part of the ITS
is the Rapid Transit Network which connects three bus routes, the Temple Meads railway station and park and ride network).
• They have also improved the rail links through electrification of the line to London = greener energy and faster connection to London.
As the city has grown and redeveloped, Bristol has focused on urban greening, to increase and preserve open green spaces. • Urban Greening: Bristol has worked and its continuing to work very hard. Currently in Bristol:
✓ 90% of people live within 350m of parkland with 300 parks in the city✓ 27% of the city is part of a wildlife network and 30% of the city is covered in trees✓ Brownfield sites are turned into green spaces (Queen Square was a dual-carriageway)
In 2015 Bristol became the first UK city to be awarded the status of: European Green Capital. Their current goals and achievements include:• To reduce energy use by 30% and CO2 emissions by 40% by 2020; In 2015 100 electric car charging
points were installed.• Increase the use of brownfield sites for businesses and housing.• In 2015 every primary pupil in Bristol planted a tree to increase Bristol’s green coverage.• Increase the use of renewable energies from 2%.
Population Distribution
The way something is spread out over an area.
Industrialisation Growth of secondary manufacturing
De-industrialisation
Decline of secondary manufacturing
Post industrial economy
Economy is mainly tertiary and quaternary industries
Brownfield site Land that has previously been built on
Greenfield site Land that has never previously been built on
International Migration
The movement of people across countries.
Urban Growth The increase in the proportion of people living in urban areas.
Urban Sprawl Unplanned growth of urban areas into the surrounding rural area
Urban Greening Increasing the amount of green space in a city.
Social Inequalities Some areas have more opportunities than others.
Rural-urban Fringe
The area on the edge of a city, where it meets the countryside.
Green Belt Protected land at the rural-urban fringe where building is restricted.
Dereliction Areas that are abandoned and become run down
Urban Regeneration
The reversal of urban decline through redevelopment, aiming to improve the local economy
Social Deprivation When a person or area is deprived of services and amenities.
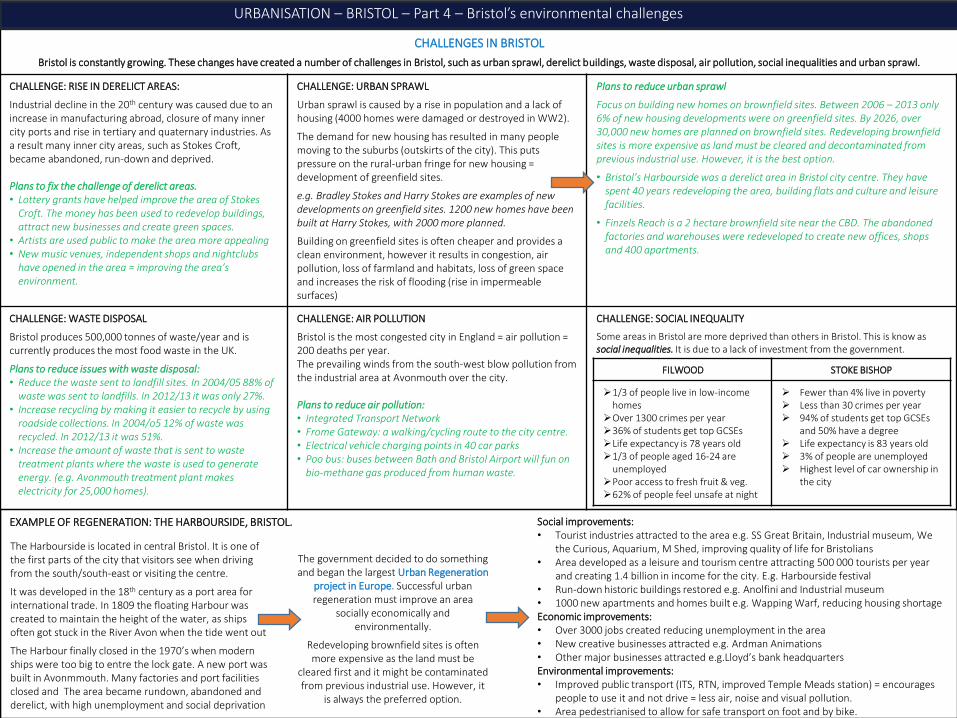
CHALLENGES IN BRISTOL
Bristol is constantly growing. These changes have created a number of challenges in Bristol, such as urban sprawl, derelict buildings, waste disposal, air pollution, social inequalities and urban sprawl.
URBANISATION – BRISTOL – Part 4 – Bristol’s environmental challenges
CHALLENGE: RISE IN DERELICT AREAS:
Industrial decline in the 20th century was caused due to an increase in manufacturing abroad, closure of many inner city ports and rise in tertiary and quaternary industries. As a result many inner city areas, such as Stokes Croft, became abandoned, run-down and deprived.
Plans to fix the challenge of derelict areas.• Lottery grants have helped improve the area of Stokes
Croft. The money has been used to redevelop buildings, attract new businesses and create green spaces.
• Artists are used public to make the area more appealing• New music venues, independent shops and nightclubs
have opened in the area = improving the area’s environment.
CHALLENGE: URBAN SPRAWL
Urban sprawl is caused by a rise in population and a lack of housing (4000 homes were damaged or destroyed in WW2).
The demand for new housing has resulted in many people moving to the suburbs (outskirts of the city). This puts pressure on the rural-urban fringe for new housing = development of greenfield sites.
e.g. Bradley Stokes and Harry Stokes are examples of new developments on greenfield sites. 1200 new homes have been built at Harry Stokes, with 2000 more planned.
Building on greenfield sites is often cheaper and provides a clean environment, however it results in congestion, air pollution, loss of farmland and habitats, loss of green space and increases the risk of flooding (rise in impermeable surfaces)
Plans to reduce urban sprawl
Focus on building new homes on brownfield sites. Between 2006 – 2013 only 6% of new housing developments were on greenfield sites. By 2026, over 30,000 new homes are planned on brownfield sites. Redeveloping brownfield sites is more expensive as land must be cleared and decontaminated from previous industrial use. However, it is the best option.
• Bristol’s Harbourside was a derelict area in Bristol city centre. They have spent 40 years redeveloping the area, building flats and culture and leisure facilities.
• Finzels Reach is a 2 hectare brownfield site near the CBD. The abandoned factories and warehouses were redeveloped to create new offices, shops and 400 apartments.
CHALLENGE: WASTE DISPOSAL
Bristol produces 500,000 tonnes of waste/year and is currently produces the most food waste in the UK.
Plans to reduce issues with waste disposal:• Reduce the waste sent to landfill sites. In 2004/05 88% of
waste was sent to landfills. In 2012/13 it was only 27%.• Increase recycling by making it easier to recycle by using
roadside collections. In 2004/o5 12% of waste was recycled. In 2012/13 it was 51%.
• Increase the amount of waste that is sent to waste treatment plants where the waste is used to generate energy. (e.g. Avonmouth treatment plant makes electricity for 25,000 homes).
CHALLENGE: AIR POLLUTION
Bristol is the most congested city in England = air pollution = 200 deaths per year. The prevailing winds from the south-west blow pollution from the industrial area at Avonmouth over the city.
Plans to reduce air pollution:• Integrated Transport Network• Frome Gateway: a walking/cycling route to the city centre.• Electrical vehicle charging points in 40 car parks• Poo bus: buses between Bath and Bristol Airport will fun on
bio-methane gas produced from human waste.
CHALLENGE: SOCIAL INEQUALITY
Some areas in Bristol are more deprived than others in Bristol. This is know as social inequalities. It is due to a lack of investment from the government.
FILWOOD STOKE BISHOP
➢1/3 of people live in low-income homes
➢Over 1300 crimes per year➢36% of students get top GCSEs➢Life expectancy is 78 years old➢1/3 of people aged 16-24 are
unemployed➢Poor access to fresh fruit & veg.➢62% of people feel unsafe at night
➢ Fewer than 4% live in poverty➢ Less than 30 crimes per year➢ 94% of students get top GCSEs
and 50% have a degree➢ Life expectancy is 83 years old➢ 3% of people are unemployed➢ Highest level of car ownership in
the city
EXAMPLE OF REGENERATION: THE HARBOURSIDE, BRISTOL.
The Harbourside is located in central Bristol. It is one of the first parts of the city that visitors see when driving from the south/south-east or visiting the centre.
It was developed in the 18th century as a port area for international trade. In 1809 the floating Harbour was created to maintain the height of the water, as ships often got stuck in the River Avon when the tide went out
The Harbour finally closed in the 1970’s when modern ships were too big to entre the lock gate. A new port was built in Avonmmouth. Many factories and port facilities closed and The area became rundown, abandoned and derelict, with high unemployment and social deprivation
The government decided to do something and began the largest Urban Regeneration
project in Europe. Successful urban regeneration must improve an area
socially economically and environmentally.
Redeveloping brownfield sites is often more expensive as the land must be
cleared first and it might be contaminated from previous industrial use. However, it
is always the preferred option.
Social improvements:• Tourist industries attracted to the area e.g. SS Great Britain, Industrial museum, We
the Curious, Aquarium, M Shed, improving quality of life for Bristolians• Area developed as a leisure and tourism centre attracting 500 000 tourists per year
and creating 1.4 billion in income for the city. E.g. Harbourside festival• Run-down historic buildings restored e.g. Anolfini and Industrial museum• 1000 new apartments and homes built e.g. Wapping Warf, reducing housing shortageEconomic improvements:• Over 3000 jobs created reducing unemployment in the area• New creative businesses attracted e.g. Ardman Animations• Other major businesses attracted e.g.Lloyd’s bank headquartersEnvironmental improvements:• Improved public transport (ITS, RTN, improved Temple Meads station) = encourages
people to use it and not drive = less air, noise and visual pollution.• Area pedestrianised to allow for safe transport on foot and by bike.

SUSTAINABLE URBAN PLANNING
Sustainable cities are cities that meet the needs of the people who live in them today, without meaning that future generations do not have their needs met. Basically it means behaving in a way that does not irreversibly damage the environment or use up resources faster than they can be replaced. There are many things that cities can do to be more sustainable.
URBANISATION – BRISTOL – Part 5 Sustainable urban planning and transport Feeiburg and Bristol
FREIBERG: A SUSTAINABLE CITY TRAFFIC MANAGEMENT STRATEGIES
Freiburg is located in the south-west of Germany. In 1970 is set a goal to become a sustainable urban area.
Preventing the overuse of water: water conservation – collecting and recycling water to prevent overuse.
Collecting and recycling water: • Green roof gardens with water harvesting systems, which collect rainwater to reuse.• Inhabitants are given incentives to use less water.• Waste water systems allows rainwater to be retained, reused or to seep back into the ground
(e.g. permeable pavements).• Water in the River Dreisam, which flows through Freiburg, is managed using flood retention
basins. These reduce the danger of flooding by storing excess water, which is used in the city.
Prevent overuse of water: • Toilets installed that use less water to flush = people use less water.• Water meters that remind residents how much water they are using = people use less water
Preventing the overuse of energy and increasing the production of energy from renewable sources.
Freiburg plans to be 100% powered by renewable energy by 2050. This will require many residents to half their current use of energy.
Renewable energies• It is one of the sunniest cities in Germany so solar power is used. There are approximately 400
solar panels installations in the city, including at the railway station and football stadium. These produce 10 million kilowatts of electricity per year. Freiburg’s solar valley employs 1000 people in solar technology, in the production of solar panels, developing solar technology, such as solar cooling technology.
• Other renewable energies that Freiburg uses include biomass and biogas.
Prevent overuse of energy: • The government provide incentives to encourage people to become more energy efficient, by
allowing homeowners to sell any excess energy to the national grid.
Increasing the amount of green spaces. Green spaces are environmentally sustainable as they provide clean air, habitats and prevent flooding during intense rainfall. They are also socially sustainable as they create a calm, relaxing space for people to spend time and encourage exercise.
• Afforestation – 75% of the deforested trees are re-grown every year.• River Dreisam does not have any flood management strategies and provides natural habitats for
animals and vegetation.• 44,000 trees have been planted in the city = 40% of the city is forested. Of these areas, 56% are
nature conservation areas.• In the Riselfield District, 78 hectares are built on and 240 hectares are open space.
Traffic congestion can lead to a number of problems: Air pollution,(climate change) health problems (e.g. asthma), accidents, increased journey times• 200 people die each year in Bristol from air pollution related causes• Bristol is the most congested city in England• Journeys take an average 31% longer in the rush hour in Bristol
CYCLE ROUTES are often provided alongside existing main roads, with some new cycle paths that exclude cars. There are many benefits of cycling.• Increase exercise, improve health, reduce air pollution, reduce stress, reduce congestion.
The number of people cycling to work in Bristol is now 15%. To encourage even more people Bristol has: made 20mph speed limits, increased cycle routes, installed cycle maps and signs and increased bike parking zones. You can hire a YoBike for £1 and leave it where you want
METROBUS is a new express bus service in Bristol. It is made up of three routes that link key areas in Bristol. It will encourage more people to use public transport by improving the service it provides.• Faster and more reliable journeys than current buses, next stop announcements, bus stops
with real time information and full accessibility.
In Bristol the MetroBus is made up of 3 routes that link key areas of Bristol. They have priority over other transport = quicker journey times. e.g. Long Ashton Park and Ride to Hengrovecurrently takes 50 minutes. The MetroBus will take 12 minutes.
PARK AND RIDE: Free car parks are available on the outskirts of the city. People then take the bus into the city centre. One bus with 40 passengers causes less congestion than 20 cars with 2 people in each. A ticket costs £4.50 and is reduced if paying using an app or for a weekly pass.
They have social, economic and environmental impacts: Less cars in the city = less congestions = less pollution (air, visual, noise), less time wasted in traffic, less accidents, less space needed in the city centre for car parks.Bristol has three Park and Ride Schemes around the city. Long Ashton, Portway and Brislington
AN INTEGRATED TRANSPORT NETWORK is a system that links different forms of public transport within the city and the surrounding area to make journeys smoother and easier. It is a sustainable transport system that reduces congestion as more people are travelling by public transport by making it easier and more convenient. e.g. The MetroBus is a Rapid Transit Network and part of the ITS. It connects 3 bus routes, the Temple Meads railway station and all three Park and Ride stations.
Bio-methane buses . Buses are the second most polluting form of transport in Bristol. In 2020 First bus introduced the first 27 of a new fleet of 77 Bio-methane buses. These buses produce 85% less pollution than diesel buses so are good for air pollution