Temporal and spatial variation of nitrogen transformations in a coniferous forest soil
18
Temporal and spatial variation of nitrogen transformations in nitrogen-saturated soils of a central Appalachian hardwood forest Frank S. Gilliam, Bradley M. Yurish, and Mary Beth Adams Abstract: We studied temporal and spatial patterns of soil nitrogen (N) dynamics from 1993 to 1995 in three water- sheds of Fernow Experimental Forest, W.V.: WS7 (24-year-old, untreated); WS4 (mature, untreated); and WS3 (24- year-old, treated with (NH 4 ) 2 SO 4 since 1989 at the rate of 35 kg N·ha –1 ·year –1 ). Net nitrification was 141, 114, and 115 kg N·ha –1 ·year –1 , for WS3, WS4, and WS7, respectively, essentially 100% of net N mineralization for all water- sheds. Temporal (seasonal) patterns of nitrification were significantly related to soil moisture and ambient temperature in untreated watersheds only. Spatial patterns of soil water NO 3 – of WS4 suggest that microenvironmental variability limits rates of N processing in some areas of this N-saturated watershed, in part by ericaceous species in the herba- ceous layer. Spatial patterns of soil water NO 3 – in treated WS3 suggest that later stages of N saturation may result in higher concentrations with less spatial variability. Spatial variability in soil N variables was lower in treated WS3 ver- sus untreated watersheds. Nitrogen additions have altered the response of N-processing microbes to environmental fac- tors, becoming less sensitive to seasonal changes in soil moisture and temperature. Biotic processes responsible for regulating N dynamics may be compromised in N-saturated forest ecosystems. Résumé : Nous avons étudié les patrons temporels et spatiaux de la dynamique de l’azote (N) du sol, de 1993 à 1995, dans trois bassins versants de la forêt expérimentale de Fernow : WS7 (âgé de 24 ans et non traité); WS4 (mature et non traité); WS3 (âgé de 24 ans et traité avec (NH 4 ) 2 SO 4 depuis 1989 au taux de 35 kg N·ha –1 ·an –1 ). La nitrification nette était respectivement de 141, 114 et 115 kg N·ha –1 ·an –1 pour WS3, WS4 et WS7, soit essentiellement 100% de la minéralisation nette pour tous les bassins versants. Les patrons temporels (saisonniers) de nitrification étaient significa- tivement reliés à l’humidité du sol et à la température ambiante seulement dans les bassins versants non traités. Les pa- trons spatiaux de NO 3 – de la solution de sol du WS4 indiquent que la variabilité micro-environnementale limite le taux de recyclage de N dans certaines aires de ce bassin versant saturé en N, en partie à cause des espèces d’éricacées pré- sentes dans la strate herbacée. Les patrons spatiaux de NO 3 – de la solution du sol dans le WS3 traité indiquent que des stades plus avancés de saturation de N peuvent se traduire par de plus fortes concentrations avec moins de variabilité spatiale. La variabilité spatiale des variables de N du sol était plus faible dans le WS3 comparativement aux bassins versants non traités. Les ajouts de N ont altéré la réponse des microorganismes associés au cycle de N vis-à-vis les facteurs environnementaux en les rendant moins sensibles aux changements saisonniers d’humidité et de température du sol. Les processus biotiques responsables de la régulation de la dynamique de N peuvent être compromis dans les éco- systèmes forestiers saturés en N. [Traduit par la Rédaction] Gilliam et al. 1785 Introduction Although the 1990 Clean Air Act Amendments included stricter requirements to reduce emissions of SO 2 and NO x , such restrictions have been more effective in controlling sul- fur than nitrogen (N) in the atmosphere (Holland et al. 1999). Lynch et al. (2000) reported 10–25% reductions in SO 4 2– concentrations in wet precipitation from 1995 to 1997 compared with the previous 12-year period for 54 sites throughout the eastern United States, with negligible change over the same period for NO 3 – . These high rates of atmo- spheric N deposition have contributed to N saturation (N supply > N demand) in some forested areas of the United States. Although much of the N-saturation research in the United States has been in conifer and hardwood forests of the Northeast (Kahl et al. 1993; McNulty and Aber 1993; Rustad et al. 1993; Norton et al. 1994; Currie 1999; Magill et al. 2000), several ecosystems across the United States have been found to be N saturated, including Colorado Rocky Mountain tundra (Baron et al. 1994; Williams et al. 1996), chaparral and high-elevation sites in southern Califor- nia (Riggan et al. 1985; Fenn et al. 1996; Fenn and Poth 1999), hardwood forests of the Catskill Mountains (Lovett et al. 2000), and spruce–fir stands of the Northeast (McNulty et al. 1996) and Great Smoky Mountains (Johnson et al. 1991). Can. J. For. Res. 31: 1768–1785 (2001) © 2001 NRC Canada 1768 DOI: 10.1139/cjfr-31-10-1768 Received August 22, 2000. Accepted May 17, 2001. Published on the NRC Research Press Web site at http://cjfr.nrc.ca on September 28, 2001. F.S. Gilliam 1 and B.M. Yurish. Department of Biological Sciences, Marshall University, Huntington, WV 25755-2510, U.S.A. M.B. Adams. USDA Forest Service, Timber and Watershed Laboratory, Parsons, WV 26287, U.S.A. 1 Corresponding author (e-mail: [email protected]).
-
Upload
independent -
Category
Documents
-
view
1 -
download
0
Transcript of Temporal and spatial variation of nitrogen transformations in a coniferous forest soil
Temporal and spatial variation of nitrogentransformations in nitrogen-saturated soils of acentral Appalachian hardwood forest
Frank S. Gilliam, Bradley M. Yurish, and Mary Beth Adams
Abstract: We studied temporal and spatial patterns of soil nitrogen (N) dynamics from 1993 to 1995 in three water-sheds of Fernow Experimental Forest, W.V.: WS7 (24-year-old, untreated); WS4 (mature, untreated); and WS3 (24-year-old, treated with (NH4)2SO4 since 1989 at the rate of 35 kg N·ha–1·year–1). Net nitrification was 141, 114, and115 kg N·ha–1·year–1, for WS3, WS4, and WS7, respectively, essentially 100% of net N mineralization for all water-sheds. Temporal (seasonal) patterns of nitrification were significantly related to soil moisture and ambient temperaturein untreated watersheds only. Spatial patterns of soil water NO3
– of WS4 suggest that microenvironmental variabilitylimits rates of N processing in some areas of this N-saturated watershed, in part by ericaceous species in the herba-ceous layer. Spatial patterns of soil water NO3
– in treated WS3 suggest that later stages of N saturation may result inhigher concentrations with less spatial variability. Spatial variability in soil N variables was lower in treated WS3 ver-sus untreated watersheds. Nitrogen additions have altered the response of N-processing microbes to environmental fac-tors, becoming less sensitive to seasonal changes in soil moisture and temperature. Biotic processes responsible forregulating N dynamics may be compromised in N-saturated forest ecosystems.
Résumé : Nous avons étudié les patrons temporels et spatiaux de la dynamique de l’azote (N) du sol, de 1993 à 1995,dans trois bassins versants de la forêt expérimentale de Fernow : WS7 (âgé de 24 ans et non traité); WS4 (mature etnon traité); WS3 (âgé de 24 ans et traité avec (NH4)2SO4 depuis 1989 au taux de 35 kg N·ha–1·an–1). La nitrificationnette était respectivement de 141, 114 et 115 kg N·ha–1·an–1 pour WS3, WS4 et WS7, soit essentiellement 100% de laminéralisation nette pour tous les bassins versants. Les patrons temporels (saisonniers) de nitrification étaient significa-tivement reliés à l’humidité du sol et à la température ambiante seulement dans les bassins versants non traités. Les pa-trons spatiaux de NO3
– de la solution de sol du WS4 indiquent que la variabilité micro-environnementale limite le tauxde recyclage de N dans certaines aires de ce bassin versant saturé en N, en partie à cause des espèces d’éricacées pré-sentes dans la strate herbacée. Les patrons spatiaux de NO3
– de la solution du sol dans le WS3 traité indiquent que desstades plus avancés de saturation de N peuvent se traduire par de plus fortes concentrations avec moins de variabilitéspatiale. La variabilité spatiale des variables de N du sol était plus faible dans le WS3 comparativement aux bassinsversants non traités. Les ajouts de N ont altéré la réponse des microorganismes associés au cycle de N vis-à-vis lesfacteurs environnementaux en les rendant moins sensibles aux changements saisonniers d’humidité et de température dusol. Les processus biotiques responsables de la régulation de la dynamique de N peuvent être compromis dans les éco-systèmes forestiers saturés en N.
[Traduit par la Rédaction] Gilliam et al. 1785
Introduction
Although the 1990 Clean Air Act Amendments includedstricter requirements to reduce emissions of SO2 and NOx,such restrictions have been more effective in controlling sul-fur than nitrogen (N) in the atmosphere (Holland et al.1999). Lynch et al. (2000) reported 10–25% reductions inSO4
2– concentrations in wet precipitation from 1995 to 1997
compared with the previous 12-year period for 54 sitesthroughout the eastern United States, with negligible changeover the same period for NO3
–. These high rates of atmo-spheric N deposition have contributed to N saturation (Nsupply > N demand) in some forested areas of the UnitedStates.
Although much of the N-saturation research in the UnitedStates has been in conifer and hardwood forests of theNortheast (Kahl et al. 1993; McNulty and Aber 1993;Rustad et al. 1993; Norton et al. 1994; Currie 1999; Magillet al. 2000), several ecosystems across the United Stateshave been found to be N saturated, including ColoradoRocky Mountain tundra (Baron et al. 1994; Williams et al.1996), chaparral and high-elevation sites in southern Califor-nia (Riggan et al. 1985; Fenn et al. 1996; Fenn and Poth1999), hardwood forests of the Catskill Mountains (Lovett etal. 2000), and spruce–fir stands of the Northeast (McNulty etal. 1996) and Great Smoky Mountains (Johnson et al. 1991).
Can. J. For. Res. 31: 1768–1785 (2001) © 2001 NRC Canada
1768
DOI: 10.1139/cjfr-31-10-1768
Received August 22, 2000. Accepted May 17, 2001.Published on the NRC Research Press Web site athttp://cjfr.nrc.ca on September 28, 2001.
F.S. Gilliam1 and B.M. Yurish. Department of BiologicalSciences, Marshall University, Huntington, WV 25755-2510,U.S.A.M.B. Adams. USDA Forest Service, Timber and WatershedLaboratory, Parsons, WV 26287, U.S.A.
1Corresponding author (e-mail: [email protected]).
I:\cjfr\cjfr31\cjfr-10\X01-106.vpTuesday, September 25, 2001 9:57:28 AM
Color profile: Generic CMYK printer profileComposite Default screen

Central Appalachian forests have the potential for N satura-tion, given the levels of atmospheric inputs of N (Gilliamand Adams 1996).
In N-limited forests, NH4+ released during N mineraliza-
tion is either taken up by plants or immobilized by microbialheterotrophs. Theoretically, little NH4
+ is available to nitrify-ing bacteria, resulting in low nitrification rates, althoughgross nitrification can occur under these conditions(Davidson et al. 1992). Uptake or immobilization of avail-able N in N-limited forests is generally rapid, so available Npools are usually quite small even though turnover rates of Nmay be high (Vitousek and Matson 1985). Thus, symptomsof N saturation (Aber et al. 1989, 1998) include increasednitrification rates and levels of extractable N in mineral soil,especially NO3
–.Seasonal patterns of soil NO3
– are particularly importantbecause of its mobile nature and ability to leach essentialbase cations (Adams et al. 1993; Gilliam et al. 1996; Currieet al. 1999). Soil cation depletion, reported for several forestsites in the eastern United States (Lawrence et al. 1995;Likens et al. 1996), represents a challenge to sustainablemanagement of N-saturated forests (Fenn et al. 1998;Gilliam and Adams 1999; Adams 1999; McLaughlin andWimmer 1999). Declines in productivity have been docu-mented at several N-saturated sites (Eagar and Adams 1992;Aber et al. 1995; McNulty et al. 1996; Magill et al. 1997).
Although watershed-scale patterns of soil N have receivedlittle attention in these N-saturated ecosystems, soil N dy-namics are controlled by processes that often are spatiallyheterogeneous (Schimel et al. 1985; Schlesinger et al. 1996),an important factor in determining ecosystem response todisturbance (Walley et al. 1996). For example, whereas spa-tially discrete areas of high N mineralization rates in soilsmay serve as the source of N loss following disturbance,similar areas of low net N mineralization from high N im-mobilization may serve as an N sink, thereby mitigating theecosystem-level loss of N. Some studies have found spatialvariability of N processing in forest soils to be related to gapformation and leaf litter chemistry of contrasting tree species(Mladenoff 1987; Ferrari 1999), whereas other studies havefound hydrologic regime and soil moisture to determine spa-tial patterns in soil N dynamics (Ohrui and Mitchell 1998;Devito et al. 1999; Ohrui et al. 1999; Morris and Boerner1998, 1999).
In 1988, the USDA Forest Service initiated a project atthe Fernow Experimental Forest (FEF), Parsons, W.V., to ex-amine the effects of watershed-scale additions of (NH4)2SO4on temporal changes in stream chemistry (Adams et al.1993, 1997) and on nutrient cycling within soils and herba-ceous layer plants (Gilliam et al. 1994). Evidence from theseand other studies indicate that even some untreated water-sheds of FEF have become N saturated (Stoddard 1994).
In this paper we examine the effects of experimentally el-evated N inputs to an N-saturated forest ecosystem by ana-lyzing temporal and spatial patterns of net N mineralizationand nitrification and available N pools and test for environ-mental factors that influence these patterns. We addressedthe following questions. What are rates of net nitrification inN-saturated soils relative to net N mineralization? How sen-sitive are inorganic N transformations and pools to added N?
What factors influence temporal patterns of net nitrification?What is the effect of N additions on spatial variability of soilN dynamics within these watersheds? What factors influencespatial patterns of soil N dynamics within FEF watersheds?
Methods
Study siteThe Fernow Experimental Forest occupies approximately
1900 ha of the Allegheny Mountain section of the unglaciatedAllegheny Plateau near Parsons, W.V. (39°03′N, 79°49′W). Precipi-tation at FEF averages approximately 1430 mm/year, being higherduring the growing season and increasing with elevation. Concen-trations of acidic species in wetfall (H+, SO4
2–, and NO3–) are
among the highest in North America (Gilliam and Adams 1996).Watershed soils are coarse-textured Inceptisols (loamy-skeletal,mixed mesic Typic Dystrochrept) of the Berks and Calvin series,sandy loams derived from sandstone (Gilliam et al. 1994).
Dominant tree species on FEF watersheds vary with stand age.Early successional species, such as black birch (Betula lenta L.),black cherry (Prunus serotina Ehrh.), and yellow-poplar (Lirioden-dron tulipifera L.) are dominant in young stands, whereas late-successional species, such as sugar maple (Acer saccharum Mar-shall) and northern red oak (Quercus rubra L.), are dominant inmature stands (Gilliam et al. 1995). Dominant herbaceous layerspecies vary less with stand age and include stinging nettle(Laportea canadensis (L.) Wedd.), violets (Viola spp.), and severalferns (Gilliam et al. 1994). Note that nomenclature followsGleason and Cronquist (1991).
Three watersheds served as study sites: WS4 (>80-year-oldmixed-age stand), WS7 (�24-year-old even-age stand), and WS3(�24-year-old even-age stand); WS3 served as the “treatment” wa-tershed, whereas WS4 and WS7 were the controls. WS3 has re-ceived three aerial applications of (NH4)2SO4 per year, beginningin 1989. March (or sometimes April) and November applicationsrepresent approximately 7.1 kg N·ha–1; July applications are ap-proximately 21.2 kg N·ha–1. These rates were chosen as approxi-mately twice the ambient rates of N inputs to the watersheds viaatmospheric deposition. The total amount of N deposited on WS3(application plus atmospheric deposition) is approximately 54 kgN·ha–1·year–1, or about three times ambient inputs (Adams et al.1993).
Field samplingOn each of WS3 and WS4, 15 circular plots (0.04-ha) were es-
tablished adjacent to zero-tension lysimeters (see Water chemistrybelow); 15 plots were also established on WS7, although not adja-cent to lysimeters, which had not been previously installed on WS7(Fig. 1). Seven of these plots were selected in each watershed torepresent its full range of elevation and slope aspect as a subset of15 plots established for earlier work on soil–plant interactions (seeGilliam et al. 1994) (Fig. 1).
Mineral soil was collected by hand trowel at five points withineach of the seven plots per watershed to a depth of 5 cm. Thesefive samples were composited, thoroughly mixed, and then placedin two polyethylene bags; one was brought back to the laboratoryfor immediate extraction and analysis (see below), and the otherwas incubated in situ by burying it 5 cm beneath the mineral soilsurface for �30 days during the growing season from 1993 to1995. In 1993, incubations were conducted from June to Septem-ber; the soil collected in October was incubated until May 1994. In1994, sampling was carried out from May to September; the Octo-ber sample was incubated until April 1995. Sampling for 1995 wasdone from April until October.
© 2001 NRC Canada
Gilliam et al. 1769
I:\cjfr\cjfr31\cjfr-10\X01-106.vpTuesday, September 25, 2001 9:57:29 AM
Color profile: Generic CMYK printer profileComposite Default screen
Laboratory analysesSubsamples of soil from paired sample bags (one incubated and
one brought back to the laboratory immediately after sampling)were extracted with 1 M KCl (10:1, v/w) and analyzed for NH4
+
with an Orion 720A pH/ISE meter2 and NH4+ electrode. Concen-
trations of NH4+ in all samples were well above the detection limit
of 0.01 ppm NH4+-N and well within the upper detection limit of
1400 ppm NH4+-N. Separate subsamples were extracted with
deionized H2O (10:1, v/w) and analyzed for NO3– with an Orion
720A pH/ISE meter and NO3– and reference electrodes. Separate
extractions for NO3– were required to avoid interference of the
NO3– signal caused by high concentrations of Cl– in 1 M KCl ex-
tracts. As with NH4+, concentrations of NO3
– in all samples wereabove the detection limit (0.1 ppm NO3
–-N) and well within theupper detection limit of 140 ppm NO3
–-N. Quality assurance pro-cedures for both analyses included random repeat samples (whichconsistently indicated minimal signal drift) and recalibration forevery hour of operation, producing an accuracy of ±2%. Net min-eralization was calculated as incubated (buried) soil NH4
+ plus
NO3– minus initial soil NH4
+ plus NO3–. Net nitrification was cal-
culated as incubated soil NO3– minus initial soil NO3
–. Pools ofavailable N were determined as levels of extractable NH4
+ andNO3
– in the initial soil sample. Relative nitrification was calculatedas (net nitrification/net N mineralization) × 100.
Water chemistryBecause of their relevance to interpreting responses of soil N
transformation to N additions, we report NO3– concentrations in
stream and soil water during the 1993–1995 period. These samplesare taken routinely by field personnel at the Timber and WatershedLaboratory, Parsons, W.V.; details for sampling protocols andchemical analyses are described in Adams et al. (1997). Briefly,stream water is taken as a grab sample at gauged weirs weekly foreach of the watersheds. In addition to a suite of dissolved ions,these samples are analyzed for NO3
– using automated colorimetryat the Timber and Watershed Laboratory. Soil water is taken onceeach month (when soil moisture is sufficient to produce samples)from zero-tension, porous ceramic plate lysimeters. Threelysimeters were placed at each of 15 locations throughout each ofWS3 and WS4, one at the bottom of each of three soil horizons (A,B, and C) for a total of 45 lysimeters (Fig. 1). For simplicity, how-ever, we include only data from the A horizon in this paper.
Data analysesThe statistical design of this study is an example of simple
pseudoreplication, a common problem among watershed ecosystemstudies, with each watershed representing an experimental condi-tion with a sample size of one (Hurlbert 1984); thus, our datashould be interpreted with that in mind. It is our contention that theeffects we report are treatment effects, rather than pre-existing dif-ferences among watersheds, given the close similarities among wa-tersheds in several “site” variables such as soil texture, soil organicmatter, and extractable nutrients (Gilliam et al. 1994).
Temporal patternsMonthly means of extractable soil NH4
+ and NO3– were com-
pared among watersheds using analysis of variance and Duncan’smultiple range test (SAS Institute Inc. 1990). Factors potentiallyinfluencing temporal patterns of soil N transformations were as-sessed with two multiple linear techniques. Multiple linear regres-sion was used to examine the relationship between net nitrificationrates and “environmental” variables, including extractable pools ofinorganic N, minimum, mean, and maximum ambient air tempera-ture during the incubation period (based on data from the Timberand Watershed Laboratory adjacent to FEF), and preincubation(gravimetric) soil moisture, following the approach taken byKoopmans et al. (1995). Additionally, backward stepwise regres-sion (Analytical Software 2000) was used to identify further whichof the independent variables used in the multiple linear regressionmay have been more significantly correlated with net nitrification.This technique eliminates variables from the proposed model se-quentially until all the variables remaining in the model produce Fstatistics significant at a given probability level, in this case P <0.05 (Zar 1996).
Spatial patternsWe analyzed spatial patterns of N dynamics in two ways: (i) 3-
year means of soil water NO3– concentrations for each of the
lysimeter plots in WS3 and WS4 (note that lysimeters were not es-tablished in WS7) and (ii) 3-year monthly means of net nitrifica-tion and extractable NO3
– and NH4+ pools for each of the seven
© 2001 NRC Canada
1770 Can. J. For. Res. Vol. 31, 2001
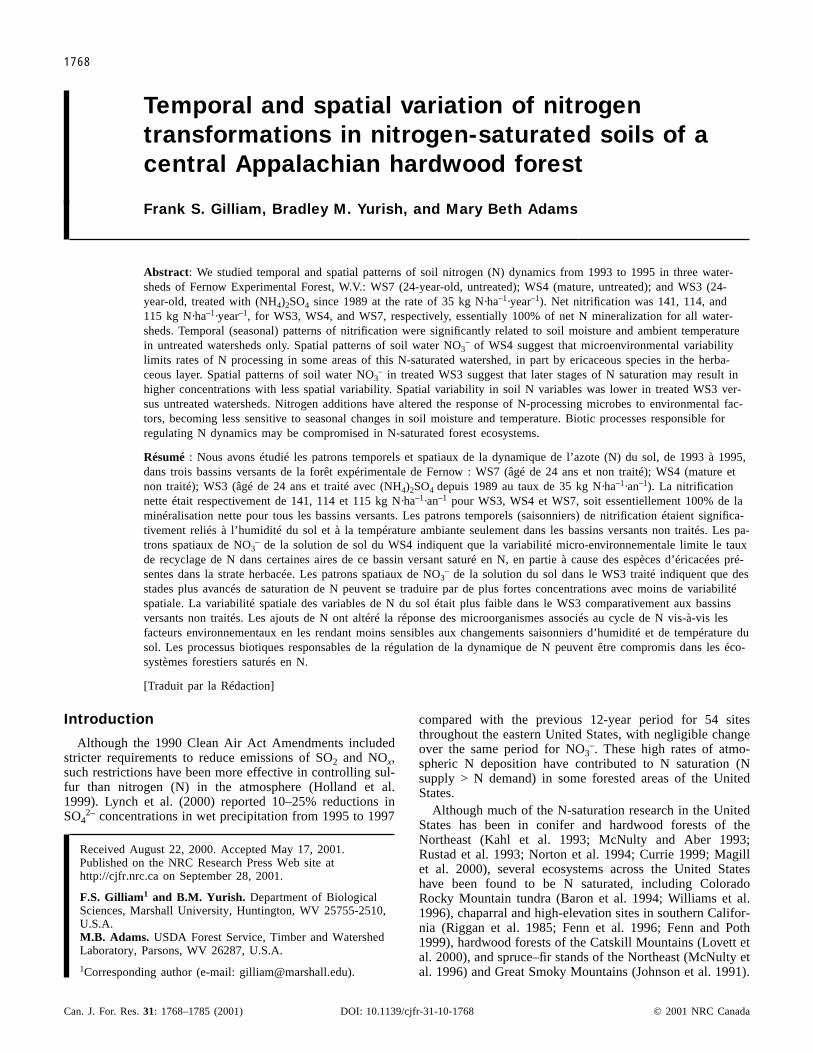
Fig. 1. Three study watersheds within the Fernow ExperimentalForest, West Virginia. Points within each watershed indicate lo-cation of sample plots. Locations on WS3 (treated) and WS4(untreated) are for lysimeter or vegetation plots of earlier andongoing studies, with plots also used for in situ incubations indi-cated by asterisks. Locations for WS7 (untreated) are indicatedfor in situ incubation plots only.
2 The use of trade, firm, or corporation names in this paper is for the information and convenience of the user, and constitutes neitherendorsement nor approval by the U.S. Department of Agriculture or the Forest Service of any product or service to the exclusion of othersthat may be suitable.
I:\cjfr\cjfr31\cjfr-10\X01-106.vpTuesday, September 25, 2001 9:57:30 AM
Color profile: Generic CMYK printer profileComposite Default screen

incubation plots per watershed for all three watersheds. Separateapproaches were warranted because the two data sets (soil waterNO3
– and nitrification or N pool data) represent different but com-plementary aspects of soil N dynamics.
Soil water NO3–
Soil water NO3– concentrations were examined to test for possi-
ble relationships of soil N and vegetation. We have extensive datafor tree and herb layer vegetation on each of the 15 plots on WS3
© 2001 NRC Canada
Gilliam et al. 1771
Site Mineralization NitrificationRelative nitrification(%)
West Virginia (this study)Young control (WS7) 126.2 114.9 91.0Mature control (WS4) 123.8 114.3 92.3+ N (35 kg N·ha–1·year–1) 134.5 141.1 104.9Adirondacks (Ohrui et al. 1999)Upland hardwood 106.9 29.0 27.1Upland conifer 82.4 2.4 2.9Vermont (McNulty and Aber 1993)Control 16.0 0.0 0.0+ N (20 kg N·ha–1·year–1) 54.3 2.1 3.9Maine (Rustad et al. 1993)Control 75.0 3.0 4.0+ N (56 kg N·ha–1·year–1) 59.0 16.0 27.1Michigan (Ferrari 1999)Old-growth hemlock–hardwood 68.1 25.6 37.6Michigan (Kim et al. 1996)Uncut forest
Red oak 29.8 0.0 0.0Red pine 13.4 0.4 3.0
ClearcutRed oak 67.0 0.9 1.3Red pine 26.9 3.3 12.3
Michigan (Mladenoff 1987)Intact forest
Maple 102.0 68.3 67.0Hemlock 88.7 27.4 31.0
Forest gapMaple 88.5 58.5 65.5Hemlock 107.3 69.8 64.6
Massachusetts (Aber et al. 1993)Control
Pine 75.1 25.4 33.8Hardwood 70.0 0.0 0.0
+ N (150 kg N·ha–1·year–1)Pine 107.8 38.2 35.4Hardwood 92.2 2.4 2.6
Ontario (Devito et al. 1999)Deciduous 114.5 66.5 58.1Conifer–hardwood 139.1 18.6 13.3Northeastern United States (Goodale and Aber 2001)Old growth 59.0 47.0 79.7Logged 57.0 29.0 50.9Burned 56.0 24.0 42.9Northeastern United States (Lovett and Rueth 1999)Beech 15.7 5.6 35.7Maple 24.3 14.2 58.4Netherlands (Tietema and Verstraten 1991)Oak–beech 115.0 69.0 60.0
Note: Data for mineralization and nitrification are based on field incubations (measured in kg N·ha–1·year–1), except for Lovett andRueth (1999), for which data are based on laboratory incubations (µg N·(g organic matter)–1·day–1).
Table 1. Net N mineralization and nitrification and relative nitrification for selected forest sites of northeasternUnited States, Canada, and the Netherlands.
I:\cjfr\cjfr31\cjfr-10\X01-106.vpTuesday, September 25, 2001 9:57:31 AM
Color profile: Generic CMYK printer profileComposite Default screen

and WS4. Adjacent to each lysimeter a permanent vegetation plot(circular 0.04 ha) was established, within which data on basal areaand density of tree species and cover of herbaceous layer specieswere collected. Additional soil data from each of these plots in-cluded texture, organic matter, pH, and extractable nutrients.
To test for potential effects of tree and herbaceous layer speciescomposition on soil water NO3
–, we performed detrended corre-spondence analysis (DCA) (ter Braak 1990) on data for the woodyoverstory (basal area and density of live stems ≥ 2.5 cm diameter at1.3 m in height) and herbaceous layer (vascular plants ≤1 m inheight) from plots adjacent to each of the 15 lysimeters in WS3and WS4 (Gilliam et al. 1995).
Results of DCA were generated as composite graphs combining(i) axis scores (DCA axes 1 and 2) of sample plots and importanttree and herb layer species and (ii) mean soil water NO3
– concen-trations next to each appropriate sample plot in ordination spacefor WS3 and WS4. The number of points in ordination space rep-resents the number of plots for which there are both N data andvegetation data. Thus, there are 15 points for soil water NO3
– data,with a separate DCA run for each figure.
Like other ordination techniques, DCA reduces species data tolinear axes that best explain patterns of variation in composition(Kent and Coker 1992; Barbour et al. 1999). The result is an ordi-nation diagram that locates sample plots relative to each other such
© 2001 NRC Canada
1772 Can. J. For. Res. Vol. 31, 2001
Fig. 2. Seasonal patterns of (A) net N mineralization rates and (B) net nitrification for mineral soil (5-cm depth) from three watershedsof the Fernow Experimental Forest, Parsons, W.V. (FEF), from 1993 to 1995. Monthly means with the same letter are not significantlydifferent among watersheds for that month at P < 0.10. Values for a given month without letters are not significantly different amongwatersheds for that month. Arrows indicate approximate timing of additions of (NH4) 2SO4 to WS3 (see Methods).
I:\cjfr\cjfr31\cjfr-10\X01-106.vpTuesday, September 25, 2001 9:57:32 AM
Color profile: Generic CMYK printer profileComposite Default screen

that the distance between plots in ordination space is a measure ofdissimilarity in species composition (i.e., shorter distances indi-cates more similar composition). In addition, DCA allows the spa-tial patterns of occurrence of individual species to be determined.Locations of individual species are displayed in the same ordina-tion space as the plots, indicating their position along axes gradi-ents. Thus, if species composition is important in explaining spatialpatterns of soil N dynamics, then plots with similar concentrationsof soil water NO3
– should have axis scores that locate them closetogether in ordination space. If particular species are associatedwith this relationship (e.g., plots with high or low soil water NO3
–
concentrations), then the species’ location on the graph will indi-cate that. Potential associations of N dynamics with species com-
position were then tested with Spearman rank correlation (Analyti-cal Software 2000) of soil water NO3
– (using 3-year means, 1993–1995) versus DCA axis 1 scores on a plot basis.
Net nitrification and factors and indices of N availabilityDegrees and patterns of spatial variation of net nitrification and
other variables related to N dynamics in watershed soils were as-sessed based on values for the seven incubation plots within eachwatershed. For nitrification, available inorganic N pools, and soilmoisture, these values represent 3-year means for the study foreach plot. For other variables, including total soil N, soil C/N, andlitter N, these values were based on previous sampling (Gilliam etal. 1996).
© 2001 NRC Canada
Gilliam et al. 1773
Fig. 3. Seasonal patterns of (A) extractable NH4+-N pools and (B) extractable NO3
–-N pools in mineral soil (5-cm depth) from threewatersheds of the FEF for the years 1993–1995. Statistical differences are indicated as described in Fig. 2. Arrows indicate approxi-mate timing of additions of (NH4)2SO4 to WS3 (see Methods).
I:\cjfr\cjfr31\cjfr-10\X01-106.vpTuesday, September 25, 2001 9:57:33 AM
Color profile: Generic CMYK printer profileComposite Default screen

Two approaches were used for these analyses. First, to provide aquantitative assessment of spatial variability, we determined coeffi-cients of variation (CVs) (calculated as (variance/mean) × 100) formeans of several variables by watershed, in combination with anal-yses of variance to assess significant differences among water-sheds. Variables included in this analysis were net nitrification,extractable NH4
+ and NO3–, tissue N concentration of Viola
rotundifolia (an indicator species found in all 21 sample plots), lit-ter N, total soil N, N/P ratio of V. rotundifolia (indicating N vs. Plimitation; see Koerselman and Meuleman 1996), and soil C/N ra-tio. Second, we determined Pearson product–moment correlationcoefficients (Analytical Software 2000) among variables to suggestspatial cause-and-effect relationships regarding net nitrification inwatershed soils and examine possible effects of N additions onthese relationships. Because of this, we performed analyses foreach watershed separately. However, we were also interested inthese relationships on the landscape scale and performed correla-tion analysis on all watersheds combined. Variables included in
these analyses were the same for the CV comparisons, with the ex-ception that soil moisture was included, but N/P ratios were not.
Results and discussion
Net nitrification relative to net N mineralizationFor the 3-year study period, mean annual net N mineral-
ization was 134.5, 123.8, and 126.2 kg N·ha–1·year–1 forWS3, WS4, and WS7, respectively; mean annual net nitrifi-cation was 141.1, 114.3, and 114.9 kg N·ha–1·year–1, respec-tively (Table 1). Relative nitrification (the percentage ofmineralized N that becomes nitrified) for WS3, WS4, andWS7 was 105, 92, and 91%, respectively (Table 1). Thesehigh rates of nitrification at FEF suggest that N cycling inthese soils is dominated by NO3
– rather than NH4+; the latter
is more often the case in forests with acidic soils (Binkley
© 2001 NRC Canada
1774 Can. J. For. Res. Vol. 31, 2001
Fig. 4. NH4+ and NO3
– pools for soils of WS3 (treated), WS4 (untreated), and WS7 (untreated). Values are means of monthly valuesfrom 1993 to 1995. Bars with the same letter are not significantly different among watersheds (P > 0.05).
(A) Multiple regression.
Watershed F r2 P
WS3 2.40 0.36 0.12WS4 4.79 0.60 0.02WS7 6.80 0.70 0.006All watersheds 6.91 0.70 0.007
(B) Multiple regression with backward stepwise procedure.
Watershed Final model r2
WS3 Net nitrification = –4.88 + 0.15Tmean + 0.16M 0.38WS4 Net nitrification = –6.82 – 2.43NH4 + 0.14Tmax + 0.19M 0.66WS7 Net nitrification = –5.23 – 1.36Tmin + 2.72Tmean – 1.19Tmax + 0.13M 0.72All Net nitrification = –5.20 + 0.16Tmean + 0.16M 0.58
Note: See Methods for further details. Multiple regression model and original model for backward stepwise procedure: net nitrification = NH4 pool +NO3 pool + Tmin + Tmean + Tmax + M, where T is temperature and M is moisture.
Table 2. Summary of regression analyses of seasonal patterns of net nitrification for study watersheds at FEF and for all data com-bined (monthly means averaged across all three watersheds): (A) multiple linear regression and (B) multiple regression using backwardstepwise procedure, wherein variables significantly accounting for variability in the model at P < 0.05 are listed with their coefficients.
I:\cjfr\cjfr31\cjfr-10\X01-106.vpTuesday, September 25, 2001 9:57:34 AM
Color profile: Generic CMYK printer profileComposite Default screen

1986; Aber and Melillo 1991). Nitrate-dominated N cyclingwas one of several predictions of Aber et al. (1989) to be aconsequence of the shift of forest soils from N limitation toN saturation. The cause of such high rates of nitrification atFEF is not clear. Atmospheric deposition of N has beenshown to be high at this site (Gilliam and Adams 1996) andhas likely contributed to this. However, recent evidence sug-gests that N deposition alone is a poor predictor of the onsetof N saturation (Lovett et al. 2000).
One view of N limitation is that low soil NH4+ limits ac-
cess of nitrifying bacteria to NH4+, because they are less
competitive than are plant roots (uptake) and heterotrophicmicrobes (immobilization) (Vitousek et al. 1982; Binkley1986; Johnson and Ball 1990), although this view has beenchallenged in more recent literature (Johnson 1992). It isclear, however, that as availability of N increases, the rela-tive amount of mineralized N that is nitrified should also in-crease, consistent with what has occurred at FEF. Values ofrelative nitrification for sites other than FEF range from 0%(McNulty and Aber 1993; Aber et al. 1993; Kim et al. 1996)to �80% (Mladenoff 1987; Tietema and Verstraten 1991;Goodale and Aber 2001).
Comparisons across sites (Table 1) provide several obser-vations about N transformations in forest soils concerningthe relative importance of net nitrification. Several studieshave shown that stand type (and consequently litter qualityand quantity) can profoundly influence both net N mineral-ization and relative nitrification, with values of both beinggenerally higher for hardwood stands than for conifer stands(Mladenoff 1987; Kim et al. 1996; Ohrui et al. 1999; Lovettand Rueth 1999). This generalization does not hold true forall studies, however, emphasizing the importance of stand
(land-use) history (Aber et al. 1993; Goodale and Aber2001). Forest disturbance generally increases mineralizationand relative nitrification, but this can also be site dependent(Mladenoff 1987; Kim et al. 1996). Experimental N addi-tions tend to increase relative nitrification measurably(McNulty and Aber 1993; Rustad et al. 1993; Aber et al.1993).
Temporal patterns: watershed comparisonsNet mineralization was significantly higher on treatment
WS3 than control WS4 and WS7 for only 2 of the 18monthly periods (Fig. 2A). Seasonal patterns for net nitrifi-cation were similar to those for net N mineralization, al-though there were more monthly periods when nitrificationexhibited a significant treatment effect, especially toward theend of the study period (Fig. 2B). Monthly rates and tempo-ral patterns of N mineralization and nitrification at FEF(Figs. 2A and 2B) contrast sharply with those of Aber et al.(1993), who studied the effects of experimental N additions(50 and 150 kg N·ha–1·year–1) on a 65-year-old red pinestand and an 80-year-old mixed hardwood stand at the Har-vard Forest, Massachusetts. They found net N mineralizationand nitrification rates in the pine stand ranged from 0 to~2 g N·m–2·month–1 and from 0 to 0.8 g N·m–2·month–1, re-spectively; rates in the hardwood stand ranged from 0 to1 g N·m–2·month–1 and 0 to 0.1 g N·m–2·month–1, respec-tively, for all treatments. Rates for both control and treat-ment watersheds at FEF greatly exceeded these values,generally ranging from 1 to 5 g N·m–2·month–1 for both netN mineralization and nitrification (Figs. 2A and 2B).
Monthly means of NH4+ pools were significantly higher
on treatment WS3 than on either WS7 or WS4 or both for
© 2001 NRC Canada
Gilliam et al. 1775
Fig. 5. Volume-weighted monthly means of stream water NO3–-N from WS3 (treated), WS4 (untreated), and WS7 (untreated) from
1993 to 1995. Arrows indicate approximate timing of additions of (NH4)2SO4 to WS3 (see Methods).
I:\cjfr\cjfr31\cjfr-10\X01-106.vpTuesday, September 25, 2001 9:57:35 AM
Color profile: Generic CMYK printer profileComposite Default screen
15 of the 18 months of the study period (Fig. 3A). Means ofNO3
– pools were significantly higher on WS3 than on eitherWS7 or WS4 or both for 8 of the 18 sample months of thestudy period (Fig. 3B). Temporal patterns of N pools inWS3 were generally consistent with the timing of N addi-tions to the watershed. Aerial applications of (NH4)2SO4(see Methods section) were made in March, July, and No-vember at the rates of 7.1, 21.2, and 7.1 kg N·ha–1, respec-tively, during the study. Thus, the prominent peaks in NH4
+
in August 1994 and April 1995 were synchronous with Julyand March applications, respectively (Fig. 3A). Similar peakresponses were seen for NO3
–, including August–September1993 and 1994, and April and August–September 1995(Fig. 3B).
In N-limited forests, available N pools usually approachzero during the growing season because of high rates of Nuptake by plants exhibiting maximum growth rates(Stoddard 1994). Although available N pools at FEF weregenerally their lowest during the growing season, N poolseven on control watersheds (WS7 and WS4) remained wellabove zero during the growing season, suggesting mineral-ization and nitrification rates exceed uptake by plants. Ex-perimental N inputs at FEF have increased pools of availableN in the mineral soil of WS3 (Figs. 3A and 3B). HigherNH4
+ in soils of treated WS3 was certainly an expected re-sponse, given that N was added as NH4
+. Higher NO3– in
WS3 soils, however, likely resulted from a combination of
nitrification of both NH4+ added as (NH4)2SO4 and NH4
+
rapidly mineralized from organic matter. This suggests arapid movement of N through an N-saturated system. Thelag response for NO3
– pools (Fig. 3B) was probably relatedto the time required for microbial oxidation of added NH4
+.Thus, extractable N pools appear to be sensitive to furtherinputs of N under N saturated conditions.
Total inorganic pools of N (NH4+ + NO3
–) averaged overthe entire study period were 10.4 kg N·ha–1 for WS3, whichwas significantly higher than pools for WS4 and WS7 (5.1and 6.7 kg N·ha–1, respectively); means for WS4 and WS7were not significantly different from each other (Fig. 4).Mean extractable NO3
– pools were >50% of total extractableinorganic N for all watersheds.
Temporal patterns: factors influencing net nitrificationMultiple regression and stepwise procedures demonstrated
that the temporal patterns for net nitrification for untreatedWS4 and WS7 (Fig. 2B; Table 2) were strongly influencedby environmental factors, particularly ambient temperatureand soil moisture. Similar results were found when thesewere run for all three study watersheds combined (Table 2).Such relationships are certainly to be expected for amicrobially mediated process such as nitrification (Yin1992), although most studies describing these relationshipsare based on laboratory incubations (Emmer and Tietema1990; Stark 1996; Niklinska et al. 1999). Thus, it is notablethat results of this study demonstrate these relationships un-der ambient conditions at the larger scale of a functioningecosystem. Using nonlinear regression, Tietema andVerstraten (1991) found highly significant relationships be-tween mean ambient monthly temperature and in situ mea-surements of nitrification in a Dutch oak–beech forest.
Results of similar analyses for treated WS3 (Fig. 2B, Ta-ble 2) suggest that an important effect of excess N additionsmight be to affect the otherwise close relationship betweensoil microbes and the environmental conditions that influ-ence their activity. In contrast to highly significant multiplelinear regressions for the combination of all watersheds andfor untreated watersheds alone, regressions of net nitrifica-tion on environmental variables were not significant fortreated WS3 (Table 2), suggesting that N additions may alterthe relationship between soil microbial populations and theambient environment. Similar contrasts between high versuslow N addition plots were reported by Koopmans et al.(1995) for conifer forests of the Netherlands. Using multiplelinear regression models that compared nitrification toextractable NH4
+ and NO3–, pH, moisture, and temperature,
they found consistently lower r2 values for the high N depo-sition plots than for ambient N and low N deposition plots(Koopmans et al. 1995). It is important to note that we arenot suggesting that ambient temperature and moisture nolonger influence the microbial activity that mediates soil Ntransformations under conditions of N saturation. Rather, wesuggest that microbes in an N-saturated soil system complexmay become more responsive to other factors, such as thesimulated, episodically elevated inputs of N in this study.
Temporal increases in concentrations of stream waterNO3
– for WS3 were generally synchronous with N addi-tions, with stream NO3
– consistently higher for treated WS3
© 2001 NRC Canada
1776 Can. J. For. Res. Vol. 31, 2001
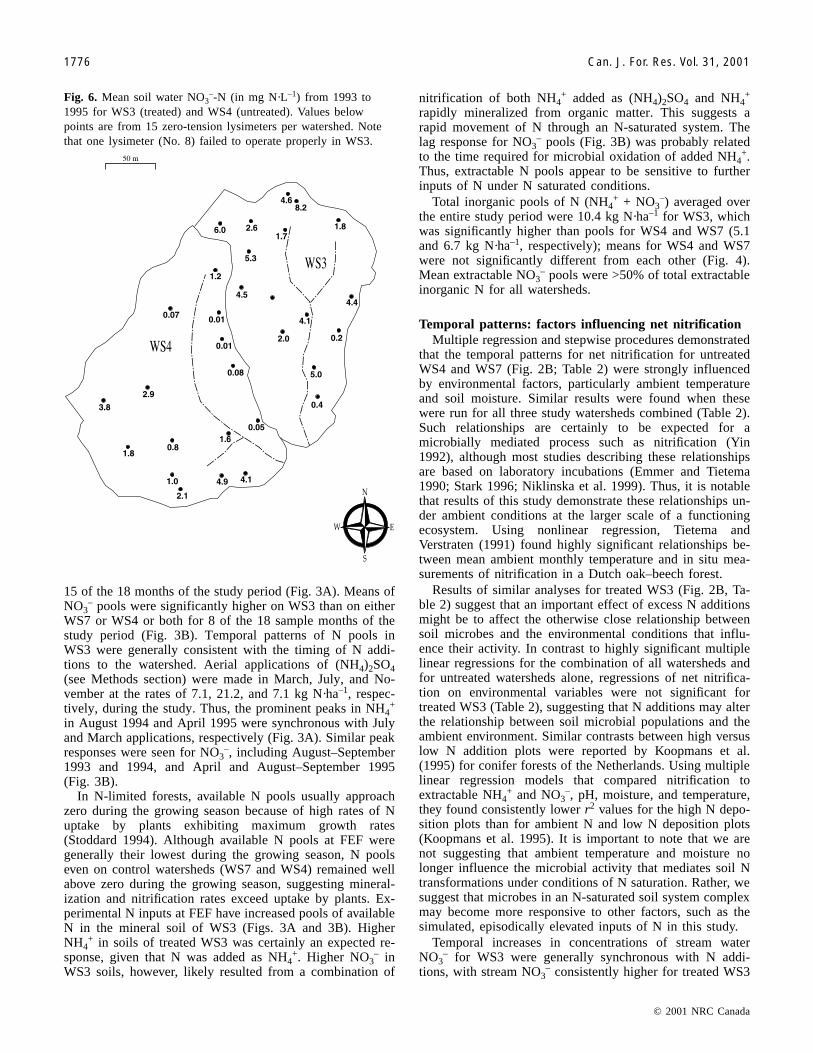
Fig. 6. Mean soil water NO3–-N (in mg N·L–1) from 1993 to
1995 for WS3 (treated) and WS4 (untreated). Values belowpoints are from 15 zero-tension lysimeters per watershed. Notethat one lysimeter (No. 8) failed to operate properly in WS3.
I:\cjfr\cjfr31\cjfr-10\X01-106.vpTuesday, September 25, 2001 9:57:36 AM
Color profile: Generic CMYK printer profileComposite Default screen

than either of untreated WS4 or WS7 (Fig. 5). Increases inNO3
– concentrations from July to August in all 3 years, es-pecially 1993 and 1995, followed the large July additions ofN to WS3 (about 21 kg N·ha–1). Such patterns were foundfor neither WS7 nor WS4 for any year of the study.
Accordingly, we suggest that the one of the more compel-ling results of excess N deposition to forest ecosystems isthat an appreciable amount of inorganic N bypasses the or-ganic cycling and reprocessing of N within the forest eco-system. In other words, N deposition at elevated rates (herein the form of NH4
+) may exceed the N demands of plantuptake and microbial immobilization, thereby increasing
NH4+ availability for nitrifying bacteria. Similarly, a consid-
erable amount of atmospheric deposition of highly mobileNO3
– to N-saturated forests may pass through soils beingtaken up by neither microbes nor plant roots, thereby rapidlyreaching streams. Such a phenomenon has been documentedusing analyses of natural isotope ratios of 15N and 18O inNO3
– in rain, snow, and springwater of forest stands of Ger-many (Durka et al. 1994; Hedin 1994).
In our study, the coincidence of the timing of (NH4)2SO4additions and notable increases in N mineralization, nitrifi-cation, extractable soil N pools, and N in streams (Figs. 2, 3,and 5) suggests that a similar response is occurring in the
© 2001 NRC Canada
Gilliam et al. 1777
Fig. 7. Detrended correspondence analysis (DCA) of overstory species in (A) WS3 and (B) WS4. Each point represents a sample plotadjacent to a lysimeter, with corresponding values for mean soil water NO3
– (mg NO3–-N·L–1) for each lysimeter. Spatial occurrence is
indicated by an “x” for the more important species: sugar maple (ACSA), beech (FAGR), yellow poplar (LITU), black cherry (PRSE),and northern red oak (QURU).
I:\cjfr\cjfr31\cjfr-10\X01-106.vpTuesday, September 25, 2001 9:57:36 AM
Color profile: Generic CMYK printer profileComposite Default screen
treated watershed at FEF. Consequently, the biotic processesresponsible for regulating N dynamics over time in forestecosystems may be altered under conditions of N saturation.
Spatial patterns: soil water NO3–
Soil water NO3– ranged from 0.2 to 8.2 mg NO3
–-N·L–1 inWS3 and from 0.01 to 4.9 mg NO3
–-N·L–1 in WS4 (Fig. 6).(Note that one lysimeter in WS3, No. 8, failed to operateproperly.) Coefficients of variation of the mean of alllysimeter plots were 100 versus 63% for WS4 and WS3, re-spectively. Concentration for WS3 was 3.6 ± 0.6 mg NO3
–-N·L–1 (mean ± SE), significantly higher (P < 0.05) than 1.6 ±
0.4 mg NO3–-N·L–1 for WS4, suggesting that N additions to
WS3 have both increased concentrations of soil water NO3–
and reduced spatial variability of soil N processing. Part ofthe spatial variation in soil water NO3
– in both WS3 andWS4 appears to be related to aspect, particularly for WS4.Even in WS3, plots with the lowest concentrations of soilwater NO3
– were generally associated with higher elevationareas along west-facing slopes (Fig. 6). In WS4, however,aspect-related differences were more pronounced, with soilwater from south- to southwest-facing plots at barely detect-able levels of NO3
– in contrast to appreciable levels else-where in the watershed (Fig. 6).
© 2001 NRC Canada
1778 Can. J. For. Res. Vol. 31, 2001
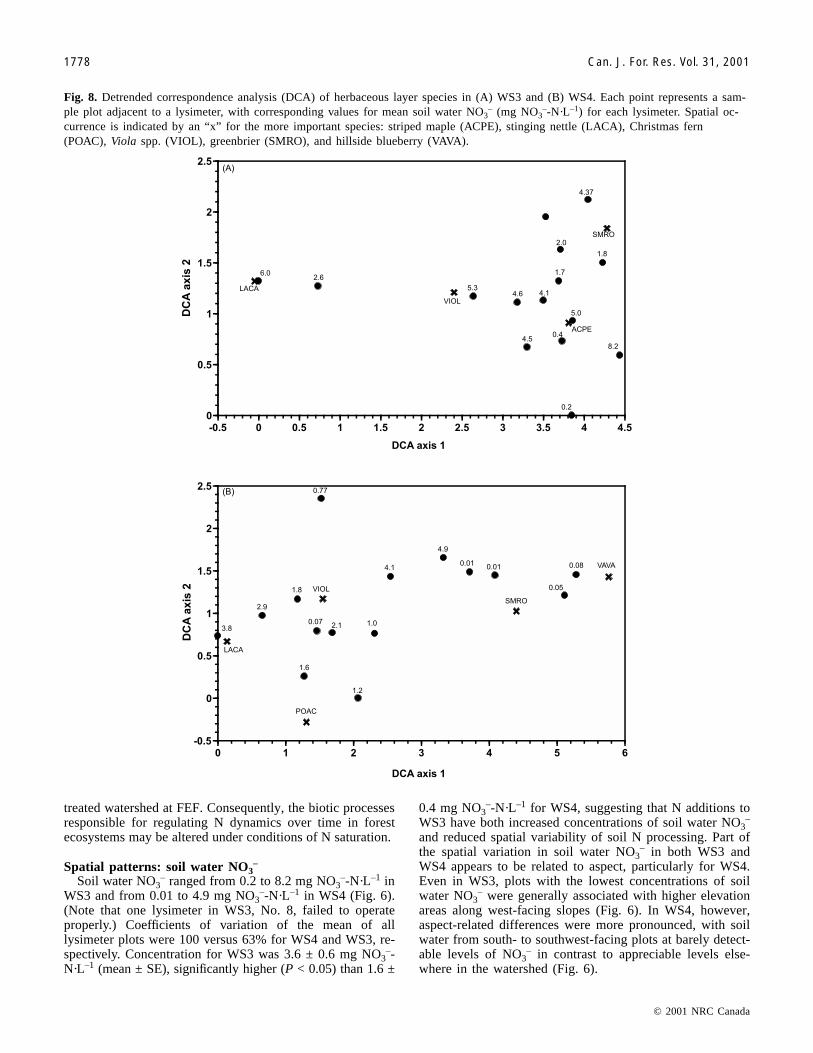
Fig. 8. Detrended correspondence analysis (DCA) of herbaceous layer species in (A) WS3 and (B) WS4. Each point represents a sam-ple plot adjacent to a lysimeter, with corresponding values for mean soil water NO3
– (mg NO3–-N·L–1) for each lysimeter. Spatial oc-
currence is indicated by an “x” for the more important species: striped maple (ACPE), stinging nettle (LACA), Christmas fern(POAC), Viola spp. (VIOL), greenbrier (SMRO), and hillside blueberry (VAVA).
I:\cjfr\cjfr31\cjfr-10\X01-106.vpTuesday, September 25, 2001 9:57:37 AM
Color profile: Generic CMYK printer profileComposite Default screen

The spatial pattern for soil water NO3– in WS4 (Fig. 6)
was observed also by Peterjohn et al. (1999). They hypothe-sized that such differences were the result of aspect-relateddifferences in tree species composition, based on a divisionof WS4 into two areas (one with a southerly aspect and theother with an easterly aspect) and direct comparisons (southvs. east) of tree species composition. However, because plantcommunities are composed of species that exhibit a contin-uum of change (sensu Gleason 1939) in response to severalenvironmental gradients (i.e., more than just aspect), a moreappropriate analytical approach would be the multivariateone used here: DCA. This avoids the a priori assumptionthat aspect alone is the major controlling factor in speciescomposition.
The predominant woody vegetation gradient for WS3 con-sisted of black cherry at the low end to sugar maple at thehigh end of axis 1 (Fig. 7A). Soil water NO3
– was not corre-lated (Spearman rank correlation analysis) with DCA axis 1scores (rS = 0.24, P > 0.10). The predominant tree speciesgradient for WS4 was one of sugar maple at the low end ofDCA axis 1, with black cherry, blackgum (Nyssa sylvaticaMarshall), and chestnut oak (Quercus prinus L.) at the highend, and northern red oak and American beech (Fagusgrandifolia Ehrh.) near the middle (Fig. 7B). As with WS3,soil water NO3
– in WS4 was not correlated with DCA axis 1scores (rS = 0.06, P > 0.10).
Peterjohn et al. (1999) further suggested that blackgum,beech, and dominant oak species (Quercus spp.) should beassociated with areas of low NO3
– in soil solution. However,results of DCA indicate a woody vegetation gradient in con-flict with this prediction for WS4 (Fig. 7B). Again, soil wa-ter NO3
– in WS4 did not appear to respond to the overstoryvegetation gradient; thus, based on our data we must reject
the hypothesis that spatial patterns of soil water NO3– on
WS4 are controlled by spatial variation in tree species com-position.
On WS3, soil water NO3– was not significantly correlated
with DCA axis 1 for the herbaceous layer (rS = –0.20, P >0.10), a gradient of stinging nettle at the low end togreenbrier (Smilax rotundifolia L.) and seedlings of stripedmaple (Acer pensylvanicum L.) at the high end of axis 1,with species of Viola being intermediate (Fig. 8A). Axis 1 ofthe DCA for the herbaceous layer of WS4 was a gradient ofnettle, species of Viola, and Christmas fern (Polystichumacrostichoides (Michx.) Schott.) on moist, less acidic soils togreenbrier and hillside blueberry (Vaccinium vacillansAiton.) on exposed, more acidic soils (Fig. 8B). In contrastto all other correlations, Spearman rank correlation analysisrevealed that soil water NO3
– was significantly correlatedwith DCA axis 1 scores of the herbaceous layer on WS4 (rS =–0.51, P < 0.05).
Although overstory vegetation patterns do a poor job inexplaining spatial patterns of nitrification in WS4, it is notclear what factors cause the low nitrification potentials forplots along the south- to southwest-facing aspect (Fig. 6). Toaddress this, we stratified data for 18 soil and vegetationvariables into two groups (the 4 south-facing plots vs. all 11other plots) and performed t test comparisons between them.In general, (i) soils of the south-facing plots were moreacidic and lower in extractable nutrients than soils of the restof WS4; (ii) nutrient concentrations were lower in herb-layerplants of the south-facing plots; and (iii) trees were smalleron south-facing plots, resulting in lower total basal area (Ta-ble 3).
These comparisons suggest that soils of the south- tosouthwest-facing slope of WS4 are more highly weathered
© 2001 NRC Canada
Gilliam et al. 1779
Variable Low N Plots Rest of WS4 p
Soil texture (%)Sand 66.7±2.2 65.8±2.0 nsSilt 20.6±1.3 24.3±1.4 nsClay 12.7±1.1 10.0±0.8 <0.10
Cation exchange capacity (mequiv.·100 g–1) 4.0±0.1 4.1±0.3 nsExchangeable acidity (%) 84.9±2.2 77.2±1.4 <0.05pH 4.85±0.14 5.20±0.08 <0.10Organic matter (%) 14.1±1.1 13.7±0.6 nsExtractable nutrients (µequiv.·g–1)
Ca 2.8±0.2 5.4±0.4 <0.01Mg 1.3±0.1 1.6±0.1 nsK 1.9±0.3 2.2±0.2 nsP 0.37±0.05 0.50±0.03 <0.05
Herb layer tissue nutrients (%)Ca 0.58±0.07 0.80±0.09 <0.10Mg 0.12±0.01 0.26±0.02 <0.001K 0.85±0.10 2.31±0.22 <0.001P 0.10±0.001 0.18±0.01 <0.001N 1.23±0.07 2.26±0.10 <0.001
Tree basal area (m2·ha–1) 33.3±1.4 39.3±2.6 <0.10Tree size (cm2/stem) 316±28 465±51 <0.05
Note: Values are means ± SEs. ns, not significantly different (P > 0.10).
Table 3. Soil and vegetation variables for south- to southwest-facing slopes (low N) versus therest of WS4 and p values for t-test comparisons.
I:\cjfr\cjfr31\cjfr-10\X01-106.vpTuesday, September 25, 2001 9:57:38 AM
Color profile: Generic CMYK printer profileComposite Default screen

than those of the rest of the watershed, resulting in higherexchangeable acidity and lower exchangeable bases; weath-ering of silt particles may have resulted in higher clay con-tent in the mineral fraction. Although it is not clear whythese soils may have become more highly weathered, differ-ences in microclimate, such as higher incidence of solar ra-diation (see Tajchman et al. 1997), may have combined withsteep slopes to contribute to higher weathering rates.
Lower tissue nutrient concentrations may have arisen fromlower nutrient availability (Table 3). However, contrasts inherb layer tissue nutrients between the two areas of WS4 arealso related to different species in the herb layer along thesouth- to southwest-facing slopes (Fig. 8B) that prefer morenutrient-poor soils. Herb layer vegetation supported byhighly weathered soils has been shown in other studies to belower in nutrient content than that supported by less weath-ered soils (Gilliam 1991). As shown in the DCA for the her-baceous layer of WS4 (Fig. 8B), a common species on theweathered slopes of WS4 was Vaccinium vacillans, a mem-ber of the Ericaceae. In fact, Vaccinium vacillans wasapproximately 29% of herb layer aboveground biomass aver-aged across the four low soil water NO3
– plots along thesouth- to southwest-facing slopes of WS4, whereas it wasnot found on any of the other plots (F.S. Gilliam, unpub-lished data). Such species can maintain, and even increase,soil acidity via preferential uptake of NH4
+, rather than NO3–
(Fitter and Hay 1987; Marschner 1995). Furthermore, roots
of ericaceous species, such as Vaccinium vacillans, supportericoid mycorrhizae that are capable of secreting organic ac-ids that limit N-mineralizing microbes and, especially, nitri-fying bacteria (Straker 1996). Thus, the herbaceous layer,not tree species, may be responsible for limiting N mineral-ization and nitrification.
Spatial patterns: net nitrification and correlations withindices of soil N availability
Mean monthly net nitrification within sample plots rangedfrom 2.1 to 3.1 g N·m–2·month–1 in treated WS3. In un-treated WS4 and WS7, these ranges were 0.02–4.2 and 0.3–3.7 g N·m–2·month–1, respectively (Fig. 9). Spatial variabilityof net nitrification, measured as the coefficient of variationof the mean of all seven plot means shown in Fig. 9, wasmuch greater for the untreated watersheds than for thetreated watershed, 63 and 59 versus 15% (WS4 and WS7 vs.WS3, respectively) (Table 4). Of the other variables com-pared directly among watersheds, only extractable NH4
+
pools had coefficients of variation (CVs) less on WS4 andWS7 than on WS3 (Table 4).
Comparisons across all three watersheds of variability inseveral indices related to N dynamics support the conclusionthat one of the effects of added N to forest stands at FEF hasbeen to substantially reduce the natural spatial variability ofsoil N transformations. The mean of monthly rates of net ni-trification has a coefficient of variation of only 15% intreated WS3. By contrast, untreated WS4 and WS7 have co-efficients of variation of approximately 60%. Thus, net nitri-fication on the treated WS3 is about four times less spatiallyvariable than on the untreated watersheds.
Results also suggest that N additions to WS3 may havedecreased spatial variability of other measurements of N inthe watershed. For example, extractable NO3
– pools were ap-proximately three times more variable in untreated water-sheds when compared with WS3 (Table 4). Higher spatialvariability of extractable NH4
+ pools on WS3 may have beenrelated to lack of uniformity in the aerial application of(NH4)2SO4. The range of N/P ratios of foliage of Viola(16.1–20.8; Table 4) suggests that all three watersheds maybe at or above the threshold level of 16, established byKoerselman and Meuleman (1996) to indicate P limitation,rather than N limitation, of soil for vegetation.
Correlation analyses for all watersheds combined suggestthat two factors primarily determined spatial variation in netnitrification at the landscape scale: soil moisture and totalsoil N, which was related to N contained in litter (i.e., corre-lation of total soil N to litter N was highly significant, r =0.72, P < 0.01) (Table 5). These analyses also suggest thatspatial variation in nitrification rates influenced variation inthe size of soil NO3
– pools. The significant correlation be-tween nitrification and N in foliage of Viola rotundifolia islikely the result of N being taken up by this species as NO3
–,also seen in the highly significant (r = 0.86, P < 0.01) corre-lation between extractable NO3
– and Viola N, and supportingconclusions of Gilliam et al. (1996).
One variable that may have been expected to be a causalfactor in patterns of net nitrification was the C/N ratio, an in-dicator of substrate quality for soil microbes. Workingacross 17 different North American forested sites, vanMiegroet et al. (1992) found a negative relationship between
© 2001 NRC Canada
1780 Can. J. For. Res. Vol. 31, 2001
Fig. 9. Mean monthly rates of net nitrification (in g N·m–2·month–1)from 1993 to 1995 for WS3 (treated), WS4 (untreated), andWS7 (untreated). Values above points are from seven in situ soilincubation plots per watershed.
I:\cjfr\cjfr31\cjfr-10\X01-106.vpTuesday, September 25, 2001 9:57:38 AM
Color profile: Generic CMYK printer profileComposite Default screen

soil C/N ratios and NO3– leaching. More recently, Currie
(1999) reported a similar negative relationship for five forestsites throughout Europe (part of the NITREX project, seeWright and Rasmussen 1998). In light of these conclusions,the lack of significant correlation at FEF suggests controlson net nitrification by substrate quality (i.e., C/N ratios) mayoperate on spatial scales broader than those represented inthis study.
Except soil moisture, all of the variables that were signifi-cantly correlated with net nitrification at the landscape scalewere also significantly correlated for WS4 alone (Table 5).Thus, conclusions about spatial variability across all water-sheds can be made for WS4. That is, spatial variation in soilN, which is determined by litter N, exerts control of varia-tion in net nitrification. Nitrification, in turn, determines thesize of soil NO3
– pools and availability, as measured byViola N.
The only significant correlations for net nitrification forWS7 alone were those related to nitrification in soil (i.e.,extractable NO3
– pools and Viola N) (Table 5), not the con-trols over nitrification, as was seen for WS4 and for all wa-tersheds combined. Thus, although it appears that spatialvariation in nitrification determines, in large extent, variationin the size of NO3
– pools and availability of N for plant up-take in WS7, it is less clear what controls spatial patterns ofnet nitrification in soils of WS7. Two factors (namely sizeand aspect) are confounded in our design that may explainlack of correlation between net nitrification and potential“control” variables. At 24.2 ha in area, WS7 is �70% of thearea of WS3 (34.3 ha) and �63% of WS4 (38.7 ha), i.e., weare examining a smaller spatial scale with WS7. In addition,WS7 generally has a north-northeast aspect, in contrast tothe south-southeast aspects of WS3 and WS4. Accordingly,other variables not measured in this study, such as soil tem-perature, may be controlling spatial patterns of nitrificationin WS7.
There were no significant correlations of measured vari-ables with net nitrification for WS3 (Table 5). Lack of exten-sive pretreatment soil and vegetation data preclude a directassessment of the effects of the (NH4)2SO4 additions on spa-tial variation in N processing. However, close pretreatmentsimilarities in hydrology and stream chemistry betweenWS3 and WS4 (Adams et al. 1993), in addition to compara-ble size and aspect, suggest that pretreatment soil conditionsin WS3 may have been similar to those reported here forWS4. Thus, portions of WS3 may have been similar to thesouthwest-facing areas of WS4 with low nitrification ratesand low soil water NO3
–. If ericaceous species in the herblayer of WS4 are responsible, in part, for maintaining thatpart of the watershed in an N-limited state, WS3 may havehad that component of the herb layer but lost it as a result ofthe N additions. Indeed, Berendse (1998) found that, whereasericaceous species can inhibit soil N transformations underambient conditions, N additions can eliminate ericaceous spe-cies via reduced competitive abilities with other species.
Conclusions: implications for sustainable forestmanagement
None of the predictions concerning N saturation articu-lated by Aber et al. (1989, 1998) addressed the effects of ex-cess N on either temporal or spatial variability. Peterjohn et
© 2001 NRC Canada
Gilliam et al. 1781
Wat
ersh
edN
itri
fica
tion
(gN
·m–2
·mon
th–1
)N
H4+
pool
(kg
N·h
a–1)
NO
3–po
ol(k
gN
·ha–1
)N
V(%
)N
L(%
)N
S(%
)N
V/P
VC
/NS
WS
32.
5±0.
1(1
5.3)
7.7±
1.1a
(38.
6)8.
3±0.
6a(1
7.6)
2.8±
0.1a
(6.1
)1.
7±0.
0(5
.1)
0.40
±0.
01(7
.7)
20.8
±0.
9a(1
1.3)
18.9
±0.
5(6
.9)
WS
72.
1±0.
5(5
8.6)
4.4±
0.2b
(15.
0)5.
6±1.
4ab
(65.
0)2.
4±0.
2ab
(22.
8)1.
8±0.
1(1
7.2)
0.47
±0.
05(2
5.3)
18.4
±1.
0ab
(14.
7)16
.8±
1.1
(17.
0)W
S4
2.0±
0.5
(63.
1)3.
2±0.
3b(2
4.8)
4.7±
0.9b
(50.
8)2.
3±0.
1b(1
3.2)
1.6±
0.1
(11.
2)0.
42±
0.03
(19.
9)16
.1±
0.7b
(11.
0)19
.9±
0.9
(12.
4)
Not
e:V
aria
bles
incl
uded
are
net
nitr
ific
atio
n,N
H4
and
NO
3po
ols,
Vio
laN
(NV),
litte
rN
(NL),
soil
N(N
S),
N/P
ratio
inV
iola
(NV/P
V),
and
soil
C/N
ratio
(C/N
S).
Nitr
ific
atio
nan
dex
trac
tabl
eN
pool
sar
efr
om0
to5
cmso
ilde
pth.
Val
ues
are
mea
ns±
SE;
valu
esin
pare
nthe
ses
are
coef
fici
ents
ofva
riat
ion
ofth
em
ean.
Val
ues
follo
wed
byth
esa
me
lette
rar
eno
tsi
gnif
ican
tlydi
ffer
ent
amon
gw
ater
shed
sat
P<
0.05
for
agi
ven
vari
able
.V
aria
bles
with
mea
nsw
ithno
lette
rsdi
dno
tva
rysi
gnif
ican
tlyam
ong
wat
ersh
eds
(P<
0.05
).
Tab
le4.
Spa
tial
vari
atio
nin
trea
ted
(WS
3)an
dun
trea
ted
(WS
7an
dW
S4)
wat
ersh
eds
atF
erno
wE
xper
imen
tal
Fore
st.
I:\cjfr\cjfr31\cjfr-10\X01-106.vpTuesday, September 25, 2001 9:57:39 AM
Color profile: Generic CMYK printer profileComposite Default screen

al. (1996) demonstrated that the onset of N saturation onWS4 over the period 1971–1994 at FEF resulted in lowertemporal variability in stream water concentrations of NO3
–.Our study suggests that further additions of N to an N-saturated system may decrease temporal and spatial variabil-ity in N processing in the soil. Accordingly, an additionalpredictive hypothesis of N saturation may be that it resultsin lower temporal and spatial variability in N dynamics offorest ecosystems.
Results presented in this paper suggest that excessive Ninputs may have compromised the biotic control of N cy-cling in the forests studied at FEF. The ability of an ecosys-tem to recover from disturbance is determined in large partby biotic control on energy flow and nutrient cycling(Margalef 1968). We believe that these changes in temporaland spatial relationships induced by chronic N additions in-dicate that the biotic processes responsible for regulating N
dynamics in forest ecosystems may be altered under condi-tions of N saturation. This has important implications for theresponse of N-saturated forests to disturbances such as winddamage (Everham and Brokaw 1996; Foster et al. 1997; Pe-terson and Rebertus 1997) or harvesting practices, several ofwhich represent a gradient of disturbance intensity (Gilliamand Roberts 1995). At another N-saturated site in FEF withhigh preharvest nitrification rates, whole-tree harvesting in-creased these rates by nearly 150% in the first year follow-ing whole-tree harvesting (Gilliam and Adams 1999).Although Vitousek and Matson (1985) found that harvestingwithout removing organic debris (which they concluded wasthe source of microbial immobilization of inorganic N) re-sulted in negligible loss of N as NO3
–, harvesting at FEF oc-curred with minimal disturbance to the forest floor, yetresulted in large increases in NO3
– in the mineral soil(Gilliam and Adams 1999).
© 2001 NRC Canada
1782 Can. J. For. Res. Vol. 31, 2001
Nitrification NH4+ NO3– NS C/N NL NV Moisture
All watersheds combined (n = 21)Nitrification 1.00NH4+ 0.25 1.00NO3
– 0.77*** 0.31 1.00NS 0.48** –0.16 0.22 1.00C/N –0.31 0.00 –0.29 –0.45** 1.00NL 0.48** 0.06 0.54** 0.72*** –0.59*** 1.00NV 0.69*** 0.33 0.86*** 0.12 –0.41* 0.51** 1.00Moisture 0.48** 0.02 0.41* 0.30 0.34 0.12 0.22 1.00WS4 (n = 7)Nitrification 1.00NH4+ 0.26 1.00NO3
– 0.93** –0.01 1.00NS 0.88** –0.13 0.84** 1.00C/N 0.51 –0.46 –0.69* –0.47 1.00NL 0.82** 0.15 0.76* 0.84** –0.78** 1.00NV 0.79** 0.69* 0.64 0.35 –0.92** 0.74* 1.00Moisture 0.58 –0.55 –0.69* 0.81** –0.02 0.42 0.09 1.00WS7 (n = 7)Nitrification 1.00NH4+ 0.02 1.00NO3
– 0.78** –0.43 1.00NS 0.46 0.21 0.31 1.00C/N –0.07 0.45 –0.20 –0.39 1.00NL 0.48 –0.26 0.79** 0.66 –0.38 1.00NV 0.72* –0.42 0.90** 0.26 –0.42 0.70* 1.00Moisture 0.46 0.24 0.41 0.22 0.41 0.32 0.42 1.00WS3 (n = 7)Nitrification 1.00NH4+ 0.44 1.00NO3
– –0.31 –0.31 1.00NS –0.29 –0.29 –0.40 1.00C/N –0.33 0.31 –0.60 0.39 1.00NL –0.05 0.19 –0.50 0.75* 0.14 1.00NV 0.42 –0.25 0.58 –0.31 –0.98** –0.05 1.00Moisture 0.04 –0.06 –0.06 0.74* 0.35 0.38 –0.64 1.00
Note: See Table 4 for meanings of abbreviations and units of measure for variables. *, P < 0.10; **, P < 0.05; ***, P < 0.01.
Table 5. Correlation matrix for several variables related to soil nitrogen dynamics at treated (WS3) and untreated (WS4 and WS7) wa-tersheds of Fernow Experimental Forest.
I:\cjfr\cjfr31\cjfr-10\X01-106.vpTuesday, September 25, 2001 9:57:42 AM
Color profile: Generic CMYK printer profileComposite Default screen

Vitousek et al. (1982) concluded that low-N sites wouldbe highly resistant to disturbance, whereas high-N siteswould be much less resistant. Spatial analysis of soil waterNO3
– and net nitrification at FEF indicates that WS4 con-tained appreciable areas of these extremes of N availability,with one plot that had the lowest (0.02 g N·m–2·month–1) andanother the highest (4.2 g N·m–2·month–1) values of meanmonthly net nitrification of all 21 plots of the 3-year study(Fig. 9). Thus, we would expect a disturbance (e.g., fromwind damage) involving only the low N portion of WS4 tobring about few changes as compared with that involvingonly the high-N portion. By contrast, because of greater Navailability and mobility and lower spatial heterogeneity dueto additions of N, WS3 should display low resistance to suchdisturbances (sensu Vitousek et al. 1982).
Fenn et al. (1998) discussed several challenges presentedby N saturation for forests of North America, including thesustainable management of N-saturated forests. McLaughlinand Wimmer (1999) further emphasized the seriousness of Nsaturation in the context of its effects on Ca fertility in forestsoils. Certainly, this represents a concern for central Appala-chian hardwood forests such as FEF (Adams 1999).Although productivity of a large majority of forest ecosys-tems is limited by N availability (Vitousek and Howarth1991), limitation of productivity by base cations has beendescribed also (e.g., Stone and Kszystyniak 1977; Gilliamand Richter 1991). The response of N leaching and base cat-ion mobility to N inputs at FEF (Adams et al. 1997) sug-gests that cation availability eventually could limit forestproductivity in the region, particularly in conjunction withharvesting (Gilliam and Adams 1999; Adams 1999). Al-though the rates of N mineralization reported for FEF arehigher than those reported for most sites (Table 1, see alsoPérez et al. 1998), they are in agreement with modeled esti-mates of regional N mineralization rates by Fan et al.(1998). Thus, conclusions for FEF may be applicable to oth-erwise similar, but unstudied, hardwood forests of the cen-tral Appalachian region of the eastern United States.
Acknowledgments
Research was funded through NE-4301, Fernow Experi-mental Forest, Timber and Watershed Laboratory, Parsons,W.V., under USDA Forest Service Cooperative Grants 23-165, 23-590, and 23-842. We acknowledge the excellentfield and (or) laboratory assistance of Nicole Welch, StaciAulick, Anne Hockenberry, and Mark Fisher. FredericaWood provided invaluable data management. The graphicsskills of Beverly Surratt that produced the watershed figuresare greatly appreciated. An earlier version of the manuscriptwas improved by comments from Jeff May, Bill Currie, andtwo anonymous reviewers.
References
Aber, J.D., and Melillo, J.M. 1991. Terrestrial ecosystems.Saunders College Publishing, Philadelphia, Pa.
Aber, J.D., Nadelhoffer, K.J., Steudler, P., and Melillo, J.M. 1989.Nitrogen saturation in northern forest ecosystems. BioScience,39: 378–386.
Aber, J.D., Magill, A., Boone, R., Melillo, J.M., Steudler, P., andBowden, R. 1993. Plant and soil responses to chronic nitrogen
additions at the Harvard Forest, Massachusetts. Ecol. Appl. 3:156–166.
Aber, J.D., Magill, A., McNulty, S.G., Boone, R.D., Nadelhoffer,K.J., Downs, M., and Hallett, R. 1995. Forest biogeochemistryand primary production altered by nitrogen saturation. Water AirSoil Pollut. 85: 1665–1670.
Aber, J.D., McDowell, W., Nadelhoffer, K., Magill, A., Berntson,G., Kamakea, M., McNulty, S., Currie, W., Rustad, L., andFernandez, I. 1998. Nitrogen saturation in temperate forest eco-systems: hypotheses revisited. BioScience, 48: 921–934.
Adams, M.B. 1999. Acidic deposition and sustainable forest man-agement in the central Appalachians, USA. For. Ecol. Manage.122: 17–28.
Adams, M.B., Edwards, P.J., Wood, F., and Kochenderfer, J.N.1993. Artificial watershed acidification on the Fernow Experi-mental Forest, USA. J. Hydrol. 150: 505–519.
Adams, M.B., Angradi, T.R., and Kochenderfer, J.N. 1997. Streamwater and soil solution responses to 5 years of nitrogen and sul-fur additions at the Fernow Experimental Forest, West Virginia.For. Ecol. Manage. 95: 79–91.
Analytical Software. 2000. Statistix for Windows, version 7.0 ed.Analytical Software, Tallahassee, Fla.
Barbour, M.G., Burk, J.H., Pitts, W.D., Gilliam, F.S., andSchwartz, M.W. 1999. Terrestrial plant ecology. 3rd ed. TheBenjamin/Cummings Publishing Co. Inc., Menlo Park, Calif.
Baron, J.S., Ojima, D.S., Holland, E.A., and Parton, W.J. 1994.Analysis of nitrogen saturation potential in Rocky Mountaintundra and forest: implications for aquatic systems. Biogeo-chemistry, 27: 61–82.
Berendse, F. 1998. Effects of dominant plant species on soils dur-ing succession in nutrient-poor ecosystems. Biogeochemistry,42: 73–88.
Binkley, D. 1986. Forest nutrition management. John Wiley &Sons, New York.
Currie, W.S. 1999. The responsive C and N biogeochemistry of thetemperate forest floor. Trends Ecol. Evol. 14: 316–320.
Currie, W.S., Aber, J.D., and Driscoll, C.T. 1999. Leaching of nu-trient cations from the forest floor: effects of nitrogen saturationin two long-term manipulations. Can. J. For. Res. 29: 609–620.
Davidson, E.A., Hart, S.C., and Firestone, M.K. 1992. Internal cy-cling of nitrate in soils of a mature coniferous forest. Ecology,73: 1148–1156.
Devito, K.J., Westbrook, C.J., and Schiff, S.L. 1999. Nitrogen miner-alization and nitrification in upland and peatland forest soils in twoCanadian Shield catchments. Can. J. For. Res. 29: 1793–1804.
Durka, W., Schulze, E.-D., Gebauer, G., and Voerkelius, S. 1994.Effects of forest decline on uptake and leaching of deposited ni-trate determined from 15N and 18O measurements. Nature (Lon-don), 372: 765–767.
Eagar, C., and Adams, M.B. 1992. Ecology and decline of redspruce in the eastern United States. Springer-Verlag, New York.
Emmer, I.M., and Tietema, A. 1990. Temperature-dependent nitro-gen transformations in acid oak–beech forest litter in the Neth-erlands. Plant Soil, 122: 193–196.
Everham, E.M., III, and Brokaw, N.V.L. 1996. Forest damage andrecovery from catastrophic wind. Bot. Rev. 62: 113–185.
Fan, W., Randolph, J.C., and Ehman, J.L. 1998. Regional estima-tion of nitrogen mineralization in forest ecosystems using geo-graphic information systems. Ecol. Appl. 8: 734–747.
Fenn, M.E., and Poth, M.A. 1999. Nitrogen deposition and cyclingin Mediterranean forests: the new paradigm of nitrogen excess.In Oxidant air pollution impacts in the montane forests of south-ern California: a case study of the San Bernardino Mountains.
© 2001 NRC Canada
Gilliam et al. 1783
I:\cjfr\cjfr31\cjfr-10\X01-106.vpTuesday, September 25, 2001 9:57:43 AM
Color profile: Generic CMYK printer profileComposite Default screen

Edited by P.R. Miller and J.R. McBride. Springer-Verlag, NewYork. pp. 288–314.
Fenn, M.E., Poth, M.A., and Johnson, D.W. 1996. Evidence for ni-trogen saturation in the San Bernardino Mountains in southernCalifornia. For. Ecol. Manage. 82: 211–230.
Fenn, M.E., Poth, M.A., Aber, J.D., Baron, J.S., Bormann, B.T.,Johnson, D.W., Lemly, A.D., McNulty, S.G., Ryan, D.F., andStottlemeyer, R. 1998. Nitrogen excess in North American eco-systems: predisposing factors, ecosystem responses, and man-agement strategies. Ecol. Appl. 8: 706–733.
Ferrari, J.B. 1999. Fine-scale patterns of leaf litterfall and nitrogencycling in an old-growth forest. Can. J. For. Res. 29: 291–302.
Fitter, A.H., and Hay, R.K.M. 1987. Environmental physiology ofplants. 2nd ed. Academic Press, London.
Foster, D.R, Aber, J.D., Melillo, J.M., Bowden, R.D., and Bazzaz,F.A. 1997. Forest response to disturbance and anthropogenicstress. BioScience, 47: 437–445.
Gilliam, F.S. 1991. Ecosystem-level significance of acid forestsoils. In Plant–soil interactions at low pH. Edited by R.J.Wright, V.C. Baligar, and R.P. Murrmann. Kluwer AcademicPublishers, Dordrecht, the Netherlands. pp. 187–195.
Gilliam, F.S., and Adams, M.B. 1996. Wetfall deposition and pre-cipitation chemistry for a central Appalachian forest. J. AirWaste Manage. Assoc. 46: 978–984.
Gilliam, F.S., and Adams, M.B. 1999. Effects of harvesting on soil ni-trogen (N) dynamics in a N-saturated hardwood forest. InProceedings, 12th Annual Central Hardwoods Conference, 28 Feb. –2 Mar. 1999, Lexington, Ky. Edited by J.W. Stringer and D.L.Loftis. USDA For. Serv. Gen. Tech. Rep. SRS-24. pp. 29–36.
Gilliam, F.S., and Richter, D.D. 1991. Transport of metal cationsthrough a nutrient-poor forest ecosystem. Water Air Soil Pollut.57–58: 279–287.
Gilliam, F.S., and Roberts, M.R. 1995. Forest management andplant diversity. Ecol. Appl. 5: 911–912.
Gilliam, F.S., Turrill, N.L., Aulick, S.D., Evans, D.K., and Adams,M.B. 1994. Herbaceous layer and soil response to experimentalacidification in a central Appalachian hardwood forest. J. Envi-ron. Qual. 23: 835–844.
Gilliam, F.S., Turrill, N.L., and Adams, M.B. 1995. Herbaceous-layer and overstory species in clear-cut and mature central Ap-palachian hardwood forests. Ecol. Appl. 5: 947–955.
Gilliam, F.S., Adams, M.B., and Yurish, B.M. 1996. Ecosystem nu-trient responses to chronic nitrogen inputs at Fernow Experi-mental Forest, West Virginia. Can. J. For. Res. 26: 196–205.
Gleason, H.A. 1939. The individualistic concept of the plant asso-ciation. Am. Midl. Nat. 21: 92–110.
Gleason, H.A., and Cronquist, A. 1991. Manual of vascular plantsof northeastern United States and adjacent Canada. 2nd ed. NewYork Botanical Garden, New York.
Goodale, C.L., and Aber, J.D. 2001. The long-term effects of land-use history on nitrogen cycling in northern hardwood forests.Ecol. Appl. 11: 253–267.
Hedin, L.O. 1994. Stable isotopes, unstable forest. Nature (Lon-don), 372: 725–726.
Holland, D.M., Principe, P.P., and Sickles, J.E., II. 1999. Trends inatmospheric sulfur and nitrogen species in the eastern UnitedStates for 1989–1995. Atmos. Environ. 33: 37–49.
Hurlbert, S.H. 1984. Pseudoreplication and the design of ecologi-cal field experiments. Ecol. Monogr. 54: 187–211.
Johnson, D.W. 1992. Nitrogen retention in forest soils. J. Environ.Qual. 21: 1–12.
Johnson, D.W., and Ball, J.T. 1990. Environmental pollution andimpacts on soils and forest nutrition in North America. WaterAir Soil Pollut. 54: 3–20.
Johnson, D.W., van Miegroet, H., Lindberg, S.E., Harrison, R.B.,and Todd, D.E. 1991. Nutrient cycling in red spruce forests ofthe Great Smoky Mountains. Can. J. For. Res. 21: 769–787.
Kahl, J.S., Norton, S.A., Fernandez, I.J., Nadelhoffer, K.J.,Driscoll, C.T., and Aber, J.D. 1993. Experimental inducement ofnitrogen saturation at the watershed scale. Environ. Sci.Technol. 27: 565–568.
Kent, M., and Coker, P. 1992. Vegetation description and analysis:a practical approach. CRC Press, Inc., Boca Raton, Fla.
Kim, C., Sharik, T.L., Jurgensen, M.F., Dickson, R.E., andBuckley, D.S. 1996. Effects of nitrogen availability on northernred oak seedling growth in oak and pine stands in northernLower Michigan. Can. J. For. Res. 26: 1103–1111.
Koerselman, W., and Meuleman, A.F.M. 1996. The vegetation N:Pratio: a new tool to detect the nature of nutrient limitation. J.Appl. Ecol. 33: 1441–1450.
Koopmans, C.J., Lubrecht, W.C., and Tietema, A. 1995. Nitrogentransformations in two nitrogen saturated forest ecosystems sub-jected to an experimental decrease in nitrogen deposition. PlantSoil, 175: 205–218.
Lawrence, G.B., David, M.B., and Shortle, W.C. 1995. A newmechanism of calcium loss in forest-floor soils. Nature (Lon-don), 378: 162–165.
Likens, G.E., Driscoll, C.T., and Buso, D.C. 1996. Long-term ef-fects of acid rain: response and recovery of a forest ecosystem.Science (Washington, D.C.), 272: 244–246.
Lovett, G.M., and Rueth, H. 1999. Soil nitrogen transformations inbeech and maple stands along a nitrogen deposition gradient.Ecol. Appl. 9: 1330–1344.
Lovett, G.M., Weathers, K.C., and Sobczak, W.V. 2000. Nitrogensaturation and retention in forested watersheds of the CatskillMountains, NY. Ecol. Appl. 10: 73–84.
Lynch, J.A., Bowersox, V.C., and Grimm, J.W. 2000. Acid rainreduced in eastern United States. Environ. Sci. Technol. 34:940–949.
Magill, A.H., Aber, J.D., Hendricks, J.J., Bowden, R.D., Melillo,J.M., and Steudler, P.A. 1997. Biogeochemical response of for-est ecosystems to simulated chronic nitrogen deposition. Ecol.Appl. 7: 402–415.
Magill, A.H., Aber, J.D., Berntson, G.M., McDowell, W.H.,Nadelhoffer, K.J., Melillo, J.M., and Steudler, P. 2000. Long-term nitrogen additions and nitrogen saturation in two temperateforests. Ecosystems, 3: 238–253.
Margalef, R. 1968. Perspectives in ecological theory. University ofChicago Press, Chicago, Ill.
Marschner, H. 1995. Mineral nutrition of higher plants. 2nd ed.Academic Press, London.
McLaughlin, S., and Percy, K. 1999. Forest health in North Amer-ica: some perspectives on actual and potential roles of climateand air pollution. Water Air Soil Pollut. 116: 151–197.
McLaughlin, S.B., and Wimmer, R. 1999. Calcium physiology andterrestrial ecosystem processes. New Phytol. 142: 373–417.
McNulty, S.G., and Aber, J.D. 1993. Effects of chronic nitrogenadditions on nitrogen cycling in a high-elevation spruce–firstand. Can. J. For. Res. 23: 1252–1263.
McNulty, S.G., Aber, J.D., and Newman, S.D. 1996. Nitrogen satu-ration in a high elevation spruce–fir stand. For. Ecol. Manage.84: 109–121.
© 2001 NRC Canada
1784 Can. J. For. Res. Vol. 31, 2001
I:\cjfr\cjfr31\cjfr-10\X01-106.vpTuesday, September 25, 2001 9:57:44 AM
Color profile: Generic CMYK printer profileComposite Default screen

© 2001 NRC Canada
Gilliam et al. 1785
Mladenoff, D.J. 1987. Dynamics of nitrogen mineralization and ni-trification in hemlock and hardwood treefall gaps. Ecology, 68:1171–1180.
Morris, S.J., and Boerner, R.E.J. 1998. Landscape patterns of nitro-gen mineralization and nitrification in southern Ohio hardwoodforests. Landsc. Ecol. 13: 215–224.
Morris, S.J., and Boerner, R.E.J. 1999. Spatial distribution of fun-gal and bacterial biomass in southern Ohio hardwood forestsoils: scale dependency and landscape patterns. Soil Biol.Biochem. 31: 887–902.
Niklinska, M., Maryanski, M., and Laskowski, R. 1999. Effect oftemperature on humus respiration rate and nitrogen mineraliza-tion: implications for global climate change. Biogeochemistry,44: 239–257.
Norton, S.A., Kahl, J.S., Fernandez, I.J., Rustad, L.E., Scofield,J.P., and Haines, T.A. 1994. Response of the West Bear BrookWatershed, Maine, USA, to the addition of (NH4)2SO4: 3-yearresults. For. Ecol. Manage. 68: 61–73.
Ohrui, K., and Mitchell, M.J. 1998. Spatial patterns of soil nitratein Japanese forested watersheds: importance of the near-streamzone as a source of nitrate in stream water. Hydrol. Processes,12: 1433–1445.
Ohrui, K., Mitchell, M.J., and Bischoff, J.M. 1999. Effect of land-scape position on N mineralization and nitrification in a forestedwatershed in the Adirondack Mountains of New York. Can. J.For. Res. 29: 497–508.
Pérez, C.A., Hedin, L.O., and Armesto, J.J. 1998. Nitrogen miner-alization in two unpolluted old-growth forests of contrastingbiodiversity and dynamics. Ecosystems, 1: 361–373.
Peterjohn, W.T., Adams, M.B., and Gilliam, F.S. 1996. Symptomsof nitrogen saturation in two central Appalachian hardwood for-est ecosystems. Biogeochemistry, 35: 507–522.
Peterjohn, W.T., Foster, C.J., Christ, M.J., and Adams, M.B. 1999.Patterns of nitrogen availability within a forested watershed ex-hibiting symptoms of nitrogen saturation. For. Ecol. Manage.119: 247–257.
Peterson, C.J., and Rebertus, A.J. 1997. Tornado damage and ini-tial recovery in three adjacent, lowland temperate forests in Mis-souri. J. Veg. Sci. 8: 559–564.
Riggan, P.J., Lockwood, R.N., and Lopez, E.N. 1985. Depositionand processing of airborne nitrogen pollutants in Mediterranean-type ecosystems of southern California. Environ. Sci. Technol.19: 781–789.
Rustad, L.E., Fernandez, I.J., Fuller, R.D., David, M.B., Nodvin,S.C., and Halteman, W.A. 1993. Soil solution response to acidicdeposition in a northern hardwood forest. Agric. Ecosyst. Envi-ron. 47: 117–134.
SAS Institute Inc. 1990. SAS/STAT user’s guide, version 6. 4th ed.Vol. 2. SAS Institute Inc, Cary, N.C.
Schimel, D., Stillwell, M.A., and Woodmansee, R.G. 1985.Biogeochemistry of C, N, and P in a soil catena of theshortgrass steppe. Ecology, 66: 276–282.
Schlesinger, W.H., Raikes, J.A., Hartley, A.E., and Cross, A.F.1996. On the spatial pattern of soil nutrients in desert ecosys-tems. Ecology, 77: 364–374.
Stark, J.M. 1996. Modeling the temperature response of nitrifica-tion. Biogeochemistry, 35: 433–445.
Stoddard, J.L. 1994. Long-term changes in watershed retention ofnitrogen: its causes and aquatic consequences. In Environmentalchemistry of lakes and reservoirs. Edited by L.A. Baker. Ameri-can Chemical Society, Washington, D.C. ACS Adv. Chem. Ser.237.
Stone, E.L., and Kszystyniak, R. 1977. Conservation of potassiumin the Pinus resinosa ecosystem. Science (Washington, D.C.),198: 192–194.
Straker, C.J. 1996. Ericoid mycorrhiza: ecological and host speci-ficity. Mycorrhiza, 6: 215–225.
Tajchman, S.J., Fu, H., and Kochenderfer, J.N. 1997. Water and en-ergy balance of a forested Appalachian watershed. Agric. For.Meteorol. 84: 61–68.
ter Braak, C.J.F. 1990. Update notes: CANOCO version 3.10. Ag-ricultural Mathematics Group, Wageningen, the Netherlands.
Tietema, A., and Verstraten, J.M. 1991. Nitrogen cycling in an acidforest ecosystem in the Netherlands under increased atmo-spheric nitrogen input: the nitrogen budget and the effect of ni-trogen transformations on the proton budget. Biogeochemistry,15: 21–46.
van Miegroet, H., Cole, D.W., and Foster, N.W. 1992. Nitrogendistribution and cycling. In Atmospheric deposition and forestnutrient cycling. Edited by D.W. Johnson and S.E. Lindberg.Springer-Verlag, New York. pp. 178–196.
Vitousek, P.M., and Howarth, R.W. 1991. Nitrogen limitation onland and in the sea: how can it occur? Biogeochemistry, 13: 87–115.
Vitousek, P.M., and Matson, P.A. 1985. Disturbance, nitrogenavailability, and nitrogen losses in an intensively managedloblolly pine plantation. Ecology, 66: 1360–1376.
Vitousek, P.M., Gosz, J.R., Grier, C.C., Melillo, J.M., and Reiners,W.A. 1982. A comparative analysis of nitrification and nitratemobility in forest ecosystems. Ecol. Monogr. 52: 155–177.
Walley, F.L., van Kessel, C., and Pennock, D.J. 1996. Landscape-scale variability of N mineralization in forest soils. Soil Biol.Biochem. 28: 383–391.
Williams, M.W., Baron, J.S., Caine, N., Sommerfeld, R., and San-ford, R., Jr. 1996. Nitrogen saturation in the Rocky Mountains.Environ. Sci. Technol. 30: 640–646.
Wright, R.F., and Rasmussen, L. 1998. Introduction to theNITREX and EXMAN projects. For. Ecol. Manage. 101: 1–7.
Yin, X. 1992. Empirical relationships between temperature and ni-trogen availability across North American forests. Can. J. For.Res. 22: 707–712.
Zar, J.H. 1996. Biostatistical analysis. 3rd ed. Prentice-Hall,Englewood Cliffs, N.J.
I:\cjfr\cjfr31\cjfr-10\X01-106.vpTuesday, September 25, 2001 9:57:45 AM
Color profile: Generic CMYK printer profileComposite Default screen