Temporal and spatial trends in water quality of Lake Taihu, China: analysis from a north to mid-lake...
14
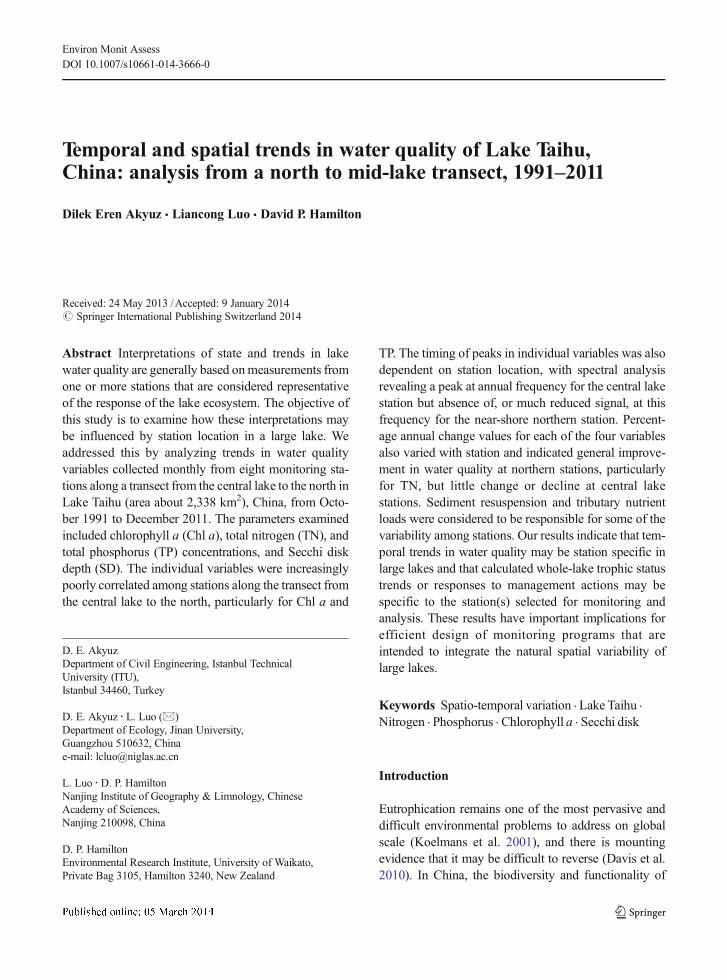
Temporal and spatial trends in waterquality of Lake Taihu, China: analysis from a north to mid-lake transect, 1991–2011 Dilek Eren Akyuz & Liancong Luo & David P. Hamilton Received: 24 May 2013 /Accepted: 9 January 2014 # Springer International Publishing Switzerland 2014 Abstract Interpretations of state and trends in lake water quality are generally based on measurements from one or more stations that are considered representative of the response of the lake ecosystem. The objective of this study is to examine how these interpretations may be influenced by station location in a large lake. We addressed this by analyzing trends in water quality variables collected monthly from eight monitoring sta- tions along a transect from the central lake to the north in Lake Taihu (area about 2,338 km 2 ), China, from Octo- ber 1991 to December 2011. The parameters examined included chlorophyll a (Chl a), total nitrogen (TN), and total phosphorus (TP) concentrations, and Secchi disk depth (SD). The individual variables were increasingly poorly correlated among stations along the transect from the central lake to the north, particularly for Chl a and TP. The timing of peaks in individual variables was also dependent on station location, with spectral analysis revealing a peak at annual frequency for the central lake station but absence of, or much reduced signal, at this frequency for the near-shore northern station. Percent- age annual change values for each of the four variables also varied with station and indicated general improve- ment in water quality at northern stations, particularly for TN, but little change or decline at central lake stations. Sediment resuspension and tributary nutrient loads were considered to be responsible for some of the variability among stations. Our results indicate that tem- poral trends in water quality may be station specific in large lakes and that calculated whole-lake trophic status trends or responses to management actions may be specific to the station(s) selected for monitoring and analysis. These results have important implications for efficient design of monitoring programs that are intended to integrate the natural spatial variability of large lakes. Keywords Spatio-temporal variation . Lake Taihu . Nitrogen . Phosphorus . Chlorophyll a . Secchi disk Introduction Eutrophication remains one of the most pervasive and difficult environmental problems to address on global scale (Koelmans et al. 2001), and there is mounting evidence that it may be difficult to reverse (Davis et al. 2010). In China, the biodiversity and functionality of Environ Monit Assess DOI 10.1007/s10661-014-3666-0 D. E. Akyuz Department of Civil Engineering, Istanbul Technical University (ITU), Istanbul 34460, Turkey D. E. Akyuz : L. Luo (*) Department of Ecology, Jinan University, Guangzhou 510632, China e-mail: [email protected] L. Luo : D. P. Hamilton Nanjing Institute of Geography & Limnology, Chinese Academy of Sciences, Nanjing 210098, China D. P. Hamilton Environmental Research Institute, University of Waikato, Private Bag 3105, Hamilton 3240, New Zealand
Transcript of Temporal and spatial trends in water quality of Lake Taihu, China: analysis from a north to mid-lake...
Temporal and spatial trends in water quality of Lake Taihu,China: analysis from a north to mid-lake transect, 1991–2011
Dilek Eren Akyuz & Liancong Luo & David P. Hamilton
Received: 24 May 2013 /Accepted: 9 January 2014# Springer International Publishing Switzerland 2014
Abstract Interpretations of state and trends in lakewater quality are generally based onmeasurements fromone or more stations that are considered representativeof the response of the lake ecosystem. The objective ofthis study is to examine how these interpretations maybe influenced by station location in a large lake. Weaddressed this by analyzing trends in water qualityvariables collected monthly from eight monitoring sta-tions along a transect from the central lake to the north inLake Taihu (area about 2,338 km2), China, from Octo-ber 1991 to December 2011. The parameters examinedincluded chlorophyll a (Chl a), total nitrogen (TN), andtotal phosphorus (TP) concentrations, and Secchi diskdepth (SD). The individual variables were increasinglypoorly correlated among stations along the transect fromthe central lake to the north, particularly for Chl a and
TP. The timing of peaks in individual variables was alsodependent on station location, with spectral analysisrevealing a peak at annual frequency for the central lakestation but absence of, or much reduced signal, at thisfrequency for the near-shore northern station. Percent-age annual change values for each of the four variablesalso varied with station and indicated general improve-ment in water quality at northern stations, particularlyfor TN, but little change or decline at central lakestations. Sediment resuspension and tributary nutrientloads were considered to be responsible for some of thevariability among stations. Our results indicate that tem-poral trends in water quality may be station specific inlarge lakes and that calculated whole-lake trophic statustrends or responses to management actions may bespecific to the station(s) selected for monitoring andanalysis. These results have important implications forefficient design of monitoring programs that areintended to integrate the natural spatial variability oflarge lakes.
Keywords Spatio-temporal variation . Lake Taihu .
Nitrogen . Phosphorus . Chlorophyll a . Secchi disk
Introduction
Eutrophication remains one of the most pervasive anddifficult environmental problems to address on globalscale (Koelmans et al. 2001), and there is mountingevidence that it may be difficult to reverse (Davis et al.2010). In China, the biodiversity and functionality of
Environ Monit AssessDOI 10.1007/s10661-014-3666-0
D. E. AkyuzDepartment of Civil Engineering, Istanbul TechnicalUniversity (ITU),Istanbul 34460, Turkey
D. E. Akyuz : L. Luo (*)Department of Ecology, Jinan University,Guangzhou 510632, Chinae-mail: [email protected]
L. Luo :D. P. HamiltonNanjing Institute of Geography & Limnology, ChineseAcademy of Sciences,Nanjing 210098, China
D. P. HamiltonEnvironmental Research Institute, University of Waikato,Private Bag 3105, Hamilton 3240, New Zealand

many large lake ecosystems have already been seriouslyimpaired. Ecological function was either seriously im-paired or totally collapsed in 80 % of 67 lakes surveyedin China, including some of the largest lakes such asTaihu, Chaohu, and Dianchi (Le et al. 2010). For exam-ple, approximately 41 fish, 65 zooplankton, and 16macrophyte species have disappeared from Lake Taihusince the 1980s (Guan et al. 2011). Collection of suitabledata can help to separate anthropogenic and natural(baseline) variations in water quality and enable realisticgoal setting for maintaining or restoring water qualityand biodiversity (UNEP-IETC 2000).
Monitoring plays a key role in assessing the spatio-temporal variability of lake ecosystems. Large lakespresent a particular challenge for monitoring, as it maybe difficult to synchronize sample collection over largedistances across multiple stations (Qin and Hu 2010).Remote sensing methods such as MODIS offer an op-portunity to obtain representative “snapshots” of select-ed optically active variables in surface waters of largelakes such as Taihu (e.g., Hu et al. 2010a; Wang et al.2011). However, these methods are still reliant on in situvalidation data and optically favorable conditions, forexample, absence of cloud cover, for satisfactory imagecollection and derivation of water quality variables (Voset al. 2003).
A major environmental monitoring and protectionprogram in China is now in its twelfth 5-year phaseand recognizes that environmental pollution is an issueof national concern. The program includes restoration ofthree major lakes: Taihu, Chaohu, and Dianchi. Effec-tive monitoring of these lakes is an essential componentof documenting whether restoration initiatives will besuccessful. Lake Taihu has undergone extreme eutrophi-cation over the past 40 years (e.g., Qin 2008; Guan et al.2011). Water quality is poorest in the north-west regionof the lake, particularly in Meiliang Bay where there hasbeen widespread input of untreated wastewater fromdomestic sewage and factories, as well as from diffuseagricultural sources (Jin and Hu 2003; Li et al. 2011a).
In Lake Taihu, there may be large spatial gradients innitrogen, driven by variations in nitrogen fixation anddenitrification (McCarthy et al. 2007) and inputs ofland-derived sources of nitrate (Li et al. 2011b; Chenet al. 2012). Releases of nutrients from the bottomsediments to the water vary across the lake (Jiang et al.2008), partly due to variations in sediment composition(e.g., nitrogen, phosphorus, and organic content) acrossthe lake (Trolle et al. 2009) and also due to wind
resuspension (e.g., Hu et al. 2011). In addition, Chl aconcentrations are highly variable, with tributary load-ings and sediment resuspension being highly dynamicand both nitrogen and phosphorus playing a key role inlimiting phytoplankton growth at different times andlocations (Paerl et al. 2011; Wilhelm et al. 2011).
Several studies have addressed spatial variations inwater quality of Lake Taihu (e.g., Zhang et al. 2007,2011;Wang et al. 2007; Song et al. 2009; Li et al. 2011a;Zhao et al. 2011; Otten et al. 2012), but to date, none hasprovided an integrated spatio-temporal analysis oftrends on long-term monitoring data. Moreover, therehas been no clear agreement on the trends observedwithin the lake. For example, TN concentrations wereconsidered to have increased almost continuously from1960 to 2005 (Guan et al. 2011), but Chen et al. (2003)found that concentrations had decreased from 1991 to1999, particularly after 1996. Analysis of spatio-temporal trends is potentially useful to contribute infor-mation on the relative effectiveness of different eutro-phication management methods currently being appliedto Lake Taihu, such as dredging, submerged plant re-establishment, and water transfers including partial di-version of Yangtze River into Lake Taihu.
In this study, we hypothesized that the influences oftributary nutrient loads, predominantly from MeiliangBay in the northern area of Lake Taihu (e.g., McCarthyet al. 2007), create spatial and temporal variations in keyvariables related to assessment of eutrophication be-tween near-shore and central lake stations. A key objec-tive of this study is to examine differences in the mag-nitude and frequency of changes of these selected keyvariables [total nitrogen (TN), total phosphorus (TP),chlorophyll a (Chl a), and Secchi disk depth (SD)] anddetermine how trends are manifested by year, month,and station location over a study period from October1991 to December 2011. This information will help tobetter understand the way in which station locationsaffect perceived trends in water quality in large lakes.
Materials and methods
Study site
Lake Taihu is a large, subtropical, shallow, polymicticlake, which has undergone extreme eutrophication. It isone of the most studied lakes in the world because of itslocation in a highly populated region (1,333 people/
Environ Monit Assess
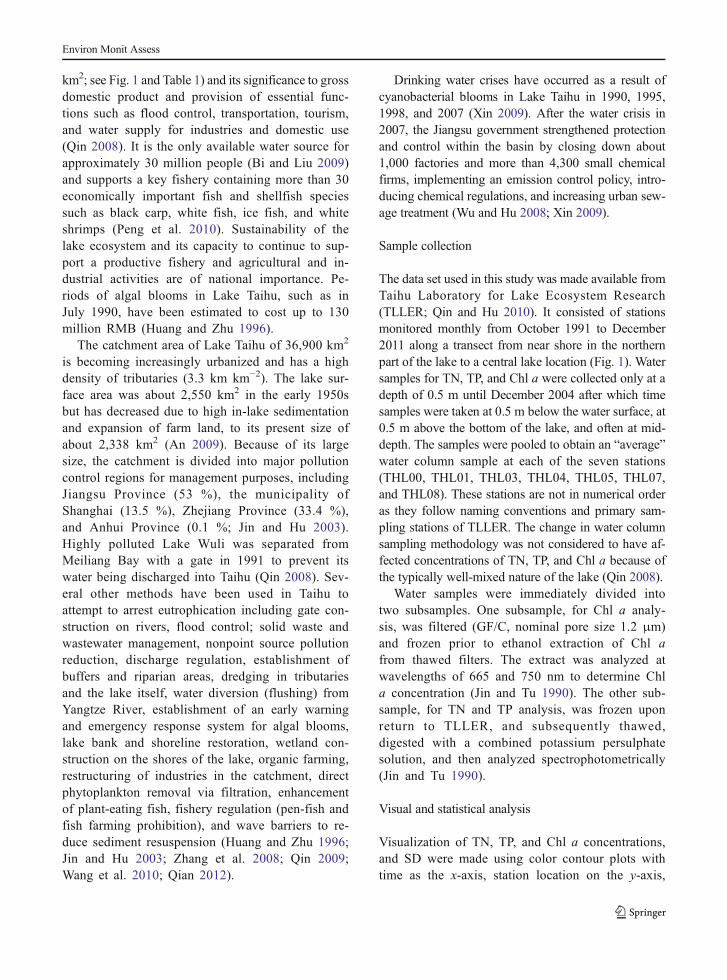
km2; see Fig. 1 and Table 1) and its significance to grossdomestic product and provision of essential func-tions such as flood control, transportation, tourism,and water supply for industries and domestic use(Qin 2008). It is the only available water source forapproximately 30 million people (Bi and Liu 2009)and supports a key fishery containing more than 30economically important fish and shellfish speciessuch as black carp, white fish, ice fish, and whiteshrimps (Peng et al. 2010). Sustainability of thelake ecosystem and its capacity to continue to sup-port a productive fishery and agricultural and in-dustrial activities are of national importance. Pe-riods of algal blooms in Lake Taihu, such as inJuly 1990, have been estimated to cost up to 130million RMB (Huang and Zhu 1996).
The catchment area of Lake Taihu of 36,900 km2
is becoming increasingly urbanized and has a highdensity of tributaries (3.3 km km−2). The lake sur-face area was about 2,550 km2 in the early 1950sbut has decreased due to high in-lake sedimentationand expansion of farm land, to its present size ofabout 2,338 km2 (An 2009). Because of its largesize, the catchment is divided into major pollutioncontrol regions for management purposes, includingJiangsu Province (53 %), the municipality ofShanghai (13.5 %), Zhejiang Province (33.4 %),and Anhui Province (0.1 %; Jin and Hu 2003).Highly polluted Lake Wuli was separated fromMeiliang Bay with a gate in 1991 to prevent itswater being discharged into Taihu (Qin 2008). Sev-eral other methods have been used in Taihu toattempt to arrest eutrophication including gate con-struction on rivers, flood control; solid waste andwastewater management, nonpoint source pollutionreduction, discharge regulation, establishment ofbuffers and riparian areas, dredging in tributariesand the lake itself, water diversion (flushing) fromYangtze River, establishment of an early warningand emergency response system for algal blooms,lake bank and shoreline restoration, wetland con-struction on the shores of the lake, organic farming,restructuring of industries in the catchment, directphytoplankton removal via filtration, enhancementof plant-eating fish, fishery regulation (pen-fish andfish farming prohibition), and wave barriers to re-duce sediment resuspension (Huang and Zhu 1996;Jin and Hu 2003; Zhang et al. 2008; Qin 2009;Wang et al. 2010; Qian 2012).
Drinking water crises have occurred as a result ofcyanobacterial blooms in Lake Taihu in 1990, 1995,1998, and 2007 (Xin 2009). After the water crisis in2007, the Jiangsu government strengthened protectionand control within the basin by closing down about1,000 factories and more than 4,300 small chemicalfirms, implementing an emission control policy, intro-ducing chemical regulations, and increasing urban sew-age treatment (Wu and Hu 2008; Xin 2009).
Sample collection
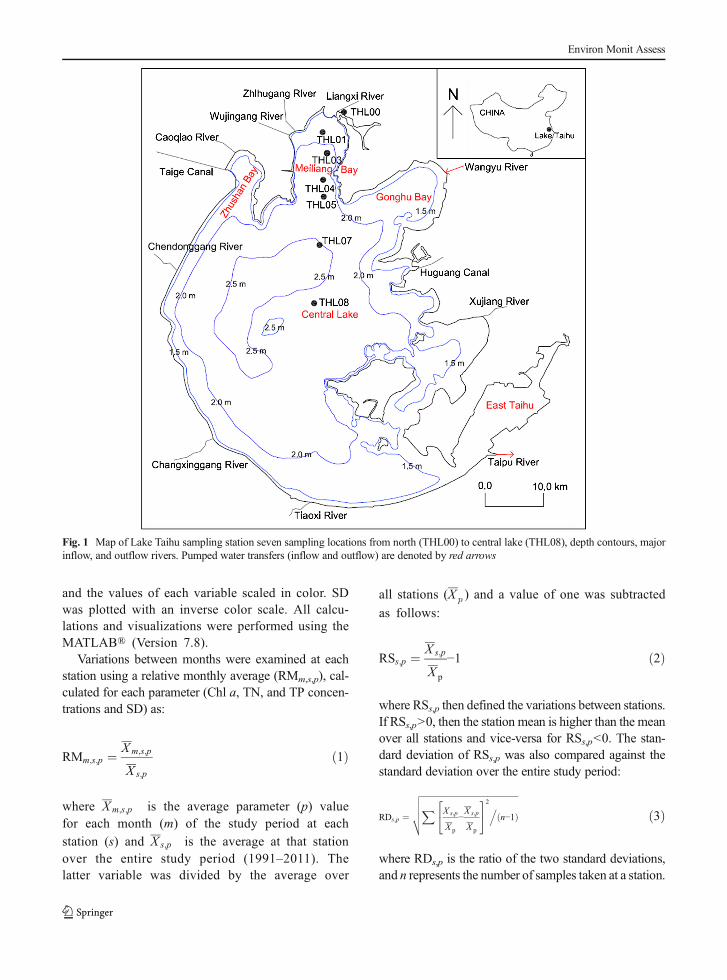
The data set used in this study was made available fromTaihu Laboratory for Lake Ecosystem Research(TLLER; Qin and Hu 2010). It consisted of stationsmonitored monthly from October 1991 to December2011 along a transect from near shore in the northernpart of the lake to a central lake location (Fig. 1). Watersamples for TN, TP, and Chl a were collected only at adepth of 0.5 m until December 2004 after which timesamples were taken at 0.5 m below the water surface, at0.5 m above the bottom of the lake, and often at mid-depth. The samples were pooled to obtain an “average”water column sample at each of the seven stations(THL00, THL01, THL03, THL04, THL05, THL07,and THL08). These stations are not in numerical orderas they follow naming conventions and primary sam-pling stations of TLLER. The change in water columnsampling methodology was not considered to have af-fected concentrations of TN, TP, and Chl a because ofthe typically well-mixed nature of the lake (Qin 2008).
Water samples were immediately divided intotwo subsamples. One subsample, for Chl a analy-sis, was filtered (GF/C, nominal pore size 1.2 μm)and frozen prior to ethanol extraction of Chl afrom thawed filters. The extract was analyzed atwavelengths of 665 and 750 nm to determine Chla concentration (Jin and Tu 1990). The other sub-sample, for TN and TP analysis, was frozen uponreturn to TLLER, and subsequently thawed,digested with a combined potassium persulphatesolution, and then analyzed spectrophotometrically(Jin and Tu 1990).
Visual and statistical analysis
Visualization of TN, TP, and Chl a concentrations,and SD were made using color contour plots withtime as the x-axis, station location on the y-axis,
Environ Monit Assess
and the values of each variable scaled in color. SDwas plotted with an inverse color scale. All calcu-lations and visualizations were performed using theMATLAB® (Version 7.8).
Variations between months were examined at eachstation using a relative monthly average (RMm,s,p), cal-culated for each parameter (Chl a, TN, and TP concen-trations and SD) as:
RMm;s;p ¼ Xm;s;p
X s;p
ð1Þ
where Xm;s;p is the average parameter (p) valuefor each month (m) of the study period at each
station (s) and X s;p is the average at that stationover the entire study period (1991–2011). Thelatter variable was divided by the average over
all stations (X p ) and a value of one was subtracted
as follows:
RSs;p ¼ X s;p
X p
−1 ð2Þ
where RSs,p then defined the variations between stations.If RSs,p>0, then the station mean is higher than the meanover all stations and vice-versa for RSs,p<0. The stan-dard deviation of RSs,p was also compared against thestandard deviation over the entire study period:
RDs;p ¼
ffiffiffiffiffiffiffiffiffiffiffiffiffiffiffiffiffiffiffiffiffiffiffiffiffiffiffiffiffiffiffiffiffiffiffiffiffiffiffiffiffiffiffiffiffiffiffiffiffiffiX X s;p
X p
−X s;p
X p
24
352.
n−1ð Þ
vuuut ð3Þ
where RDs,p is the ratio of the two standard deviations,and n represents the number of samples taken at a station.
Fig. 1 Map of Lake Taihu sampling station seven sampling locations from north (THL00) to central lake (THL08), depth contours, majorinflow, and outflow rivers. Pumped water transfers (inflow and outflow) are denoted by red arrows
Environ Monit Assess
Trophic state index and percent annual change
A Carlson Trophic State Index (TSI; Carlson 1977) wasderived from TP, and Chl a concentrations and SD valuesfor each station from October 1991 to December 2011. Apercent annual change (PAC) was calculated for TN, TP,and Chl a concentrations, TSI, and SD values for eachstation (see Burns et al. 2000). The PAC analysis involvedfirst deseasonalizing data from each station by subtractingthe average parameter value for the entire study periodfromvalues for themonth of interest. A regression fit of thedeseasonalised data on time (month) was then used toderive residual values from which a regression on timewas tested for statistical significance. If relationships weresignificant (p<0.05), then the regression slope was dividedby the average parameter value over the study period andfurther multiplied by 12 to convert to an annual rate ofchange, and finally by 100 to give values as an annualpercentage rate of change.
Power spectrum analysis
The power of each parameter was distributed across thefrequency domain by calculating normalized data incre-ments (In) as outlined in Platt and Denman (1975):
In ¼ X tþ1−Xσ Xð Þ
!−
X t−Xσ Xð Þ
!ð4Þ
where Xt+1 and Xt are consecutive values of the param-
eter, and X and σ(X) are the average value and standard
deviation at each station over the study period, respec-tively. Values of In were computed by fast Fourier trans-form (Cooley and Tukey 1965), and a power spectrumplot was used to identify the dominant periodicities.
Results
Spatio-temporal variations
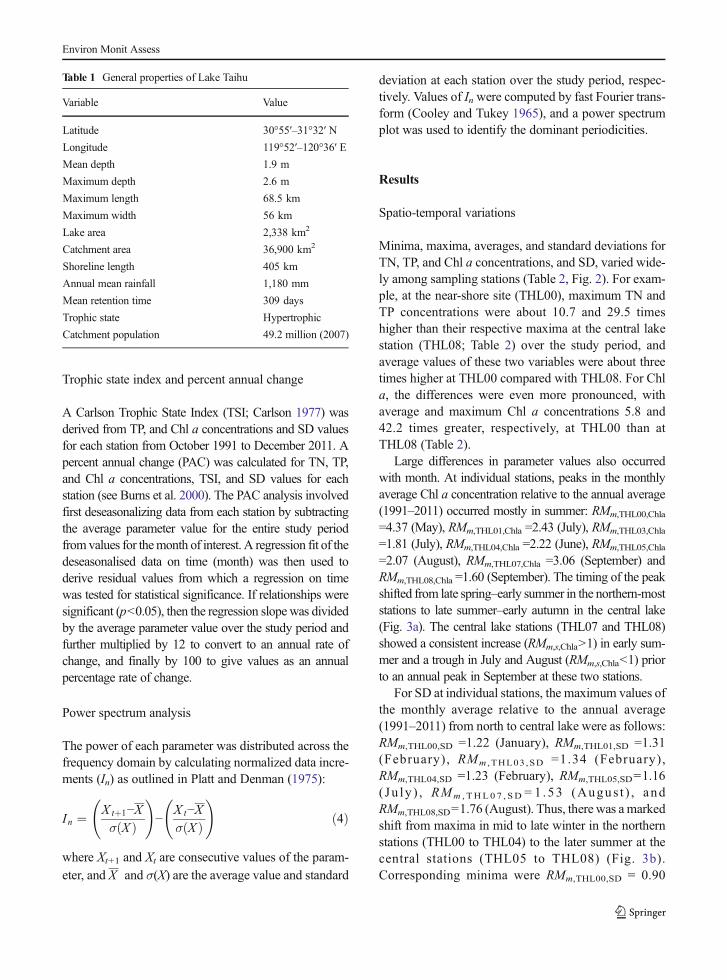
Minima, maxima, averages, and standard deviations forTN, TP, and Chl a concentrations, and SD, varied wide-ly among sampling stations (Table 2, Fig. 2). For exam-ple, at the near-shore site (THL00), maximum TN andTP concentrations were about 10.7 and 29.5 timeshigher than their respective maxima at the central lakestation (THL08; Table 2) over the study period, andaverage values of these two variables were about threetimes higher at THL00 compared with THL08. For Chla, the differences were even more pronounced, withaverage and maximum Chl a concentrations 5.8 and42.2 times greater, respectively, at THL00 than atTHL08 (Table 2).
Large differences in parameter values also occurredwith month. At individual stations, peaks in the monthlyaverage Chl a concentration relative to the annual average(1991–2011) occurred mostly in summer: RMm,THL00,Chla
=4.37 (May), RMm,THL01,Chla =2.43 (July), RMm,THL03,Chla
=1.81 (July), RMm,THL04,Chla =2.22 (June), RMm,THL05,Chla
=2.07 (August), RMm,THL07,Chla =3.06 (September) andRMm,THL08,Chla =1.60 (September). The timing of the peakshifted from late spring–early summer in the northern-moststations to late summer–early autumn in the central lake(Fig. 3a). The central lake stations (THL07 and THL08)showed a consistent increase (RMm,s,Chla>1) in early sum-mer and a trough in July and August (RMm,s,Chla<1) priorto an annual peak in September at these two stations.
For SD at individual stations, the maximum values ofthe monthly average relative to the annual average(1991–2011) from north to central lake were as follows:RMm,THL00,SD =1.22 (January), RMm,THL01,SD =1.31(February), RMm ,THL03,SD =1.34 (February),RMm,THL04,SD =1.23 (February), RMm,THL05,SD=1.16( Ju ly ) , RMm , THL0 7 , SD = 1 .53 (Augus t ) , andRMm,THL08,SD=1.76 (August). Thus, there was a markedshift from maxima in mid to late winter in the northernstations (THL00 to THL04) to the later summer at thecentral stations (THL05 to THL08) (Fig. 3b).Corresponding minima were RMm,THL00,SD = 0.90
Table 1 General properties of Lake Taihu
Variable Value
Latitude 30°55′–31°32′ N
Longitude 119°52′–120°36′ E
Mean depth 1.9 m
Maximum depth 2.6 m
Maximum length 68.5 km
Maximum width 56 km
Lake area 2,338 km2
Catchment area 36,900 km2
Shoreline length 405 km
Annual mean rainfall 1,180 mm
Mean retention time 309 days
Trophic state Hypertrophic
Catchment population 49.2 million (2007)
Environ Monit Assess
(May), RMm,THL01,SD=0.68 (August), RMm,THL03,SD=0.71 (August), RMm ,THL04,SD = 0.86 (August),RMm,THL05,SD=0.86 (March), RMm,THL07,SD=0.70(January), and RMm,THL08,SD=0.60 (January), reflectingthe relatively low clarity in near-shore stations oversummer and in central lake stations (THL07 andTHL08) over winter (Fig. 3b). For total nitrogen, max-imum values of RMm,s,TN were confined to the springperiod between March and May across the six samplingstations and minimum values occurred in Septemberexcept at THL07 where the minimum was in August.Thus, with respect to TN, seasonal variations tended tobe highly coherent across all sampling stations in thelake (Fig. 3c). Seasonal patterns of variation in TP(RMm,s,TP) were more complex but showed some simi-larity to SD and Chl a (Fig. 3). The maximum RMm,s,TP
across all stations was 1.74 (THL4 in October) and theminimum was 0.64 (THL08 in July). Figure 3d showsthat RMm,s,TP is high across most stations in September–October, but central lake stations tended to have highvalues in late winter months of January–March.
A correlation matrix was used to examine relation-ships of the mid-lake station (THL08) with the otherstations for each parameter (Table 3). As expected, the
closest station (THL07) to THL08 consistently had thehighest correlation coefficient values (maximum r=0.81for SD), but for the near-shore station, only TN showeda significant relationship (p<0.05) but had a low corre-lation coefficient value (r=0.11). Of the four variablestested, only TN gave significant relationships of THL08with all other stations tested. By contrast, for SD and TP,there were no significant relationships (p≥0.05) ofTHL08 with the three inner-shore stations (THL01,THL02, and THL03).
Comparisons of variations between stations weremade using RSs,p. This variable defines the averageparameter value for a specific station relative to theaverage for all stations over the study period but isnormalized to zero (by subtracting 1) so that if anindividual station average is identical to the averagefor all stations, =0. With the exception of Secchidepth the spatial pattern of RSs,p values was highlyconsistent among all variables. For the other three var-iables (Chl a, TN, and TP), highest values of RSs,poccurred in the northern-most station (THL00) and low-est values in the central lake station (THL08), with aregular gradient from north to south (Fig. 4a). StationsTHL03 and THL04 had values close to zero, i.e.,
Table 2 Statistical properties for water quality variables from the seven sampling stations on a north (THL00) to center-lake (THL08)transect in Lake Taihu between 1991 and 2011
Parameter Statistics THL00 THL01 THL03 THL04 THL05 THL07 THL08
Chl a Max 3952.5 491.2 521.7 390.6 166.3 390.6 93.7
Min 1.84 0.56 0.55 0.56 0.6 0.55 1.5
Avg 53.8 35 29.4 27.2 20.9 13.7 9.34
Std 255.9 46.9 47.8 40.1 25.3 27.8 9.46
SD Max 1.05 1.2 1.5 1.5 1.5 2.5 2.5
Min 0 0.05 0.1 0.1 0 0.1 0
Avg 0.43 0.49 0.45 0.43 0.41 0.37 0.38
Std 0.15 0.2 0.21 0.19 0.2 0.25 0.3
TN Max 86.3 10.2 10.9 18.8 7.76 9.42 8.09
Min 0.59 0.48 0.39 0.51 0.47 0.61 0.38
Avg 6.97 4.06 3.16 3.01 2.7 2.3 2.22
Std 6.27 2.16 1.7 1.82 1.38 1.22 1.18
TP Max 6.48 0.68 2.13 1.01 0.33 0.89 0.22
Min 0.04 0.02 0.01 0.01 0.02 0.01 0.01
Avg 0.27 0.15 0.13 0.12 0.1 0.09 0.08
Std 0.43 0.09 0.14 0.1 0.05 0.07 0.04
Chl a Chlorophyll a (μg L−1 ), SD Secchi depth (m), TN total nitrogen (mg L−1 ), TP total phosphorus (mg L−1 ), Max maximum, Minminimum, Avg Average, Std standard deviation of the variable
Environ Monit Assess
parameter values at these stations were close to the meanderived from all seven stations. Values of RSs,Chla atTHL07 and THL08 (−0.49, −0.65, respectively) tendedto have higher magnitude than those of RSs,TN (−0.34,−0.36) and RSs,TP (−0.33, −0.40), while values ofRSs,SD were comparatively low across all stations.
Comparisons of the standard deviation of parametervalues at individual stations against relative to the stan-dard deviation for all stations (RDs,p) revealed gradientsfrom north to south (Fig. 4b). For Chl a, TN, and TP,values of RDs,p tended to decrease from north to south(TL00 to TL08; i.e., decreasing variability), but thereverse trend occurred for Secchi depth, with largestdeviation at the central lake station TL08. Of all vari-ables and stations, RDs,p was highest for Chl a at TL00(9.47) and lowest for TP at TL08 (0.28).
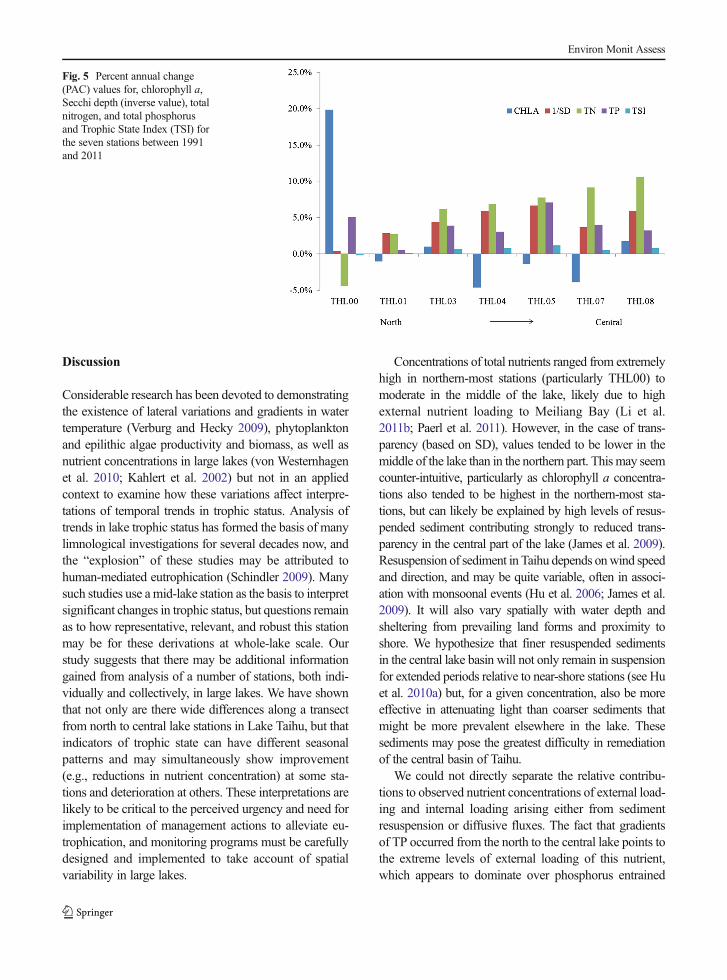
Values of PAC were calculated for all four variablesexamined previously (Chl a, Secchi depth, TN, and TP)as well as Trophic State Index (TSI). Over all stations,highest rates of PAC were recorded at THL05 for TSI(1.2 %/year), Secchi depth (1/SD; 6.7 %/year) and TP(7.1 %/year), but the PAC value for Chl a was negative(−1.4 %/year) at this station. For Chl a and TN, thehighest rates of increase occurred at the most widelyseparated stations, THL00 (19.9 %/year) and THL08(10.6 %/year), respectively. No clear spatial trends oc-curred in Chl a, with PAC increasing at THL00, THL03,and THL08 and decreasing at the other four stations.Values of PAC for TN were consistently higher than TPexcept at the northern-most station THL00. This was theonly station where PAC for TN and TSI decreased, by−4.4 and −0.2 %/year, respectively (Fig. 5).
Fig. 2 Summary of water quality variables at seven sampling stations from the north (THL00) to the central lake (THL08) of Lake Taihubetween 1991 and 2011. a Chlorophyll a (μg L−1). b Secchi depth (m). c total nitrogen (mg L−1). d total phosphorus (mg L−1)
Environ Monit Assess
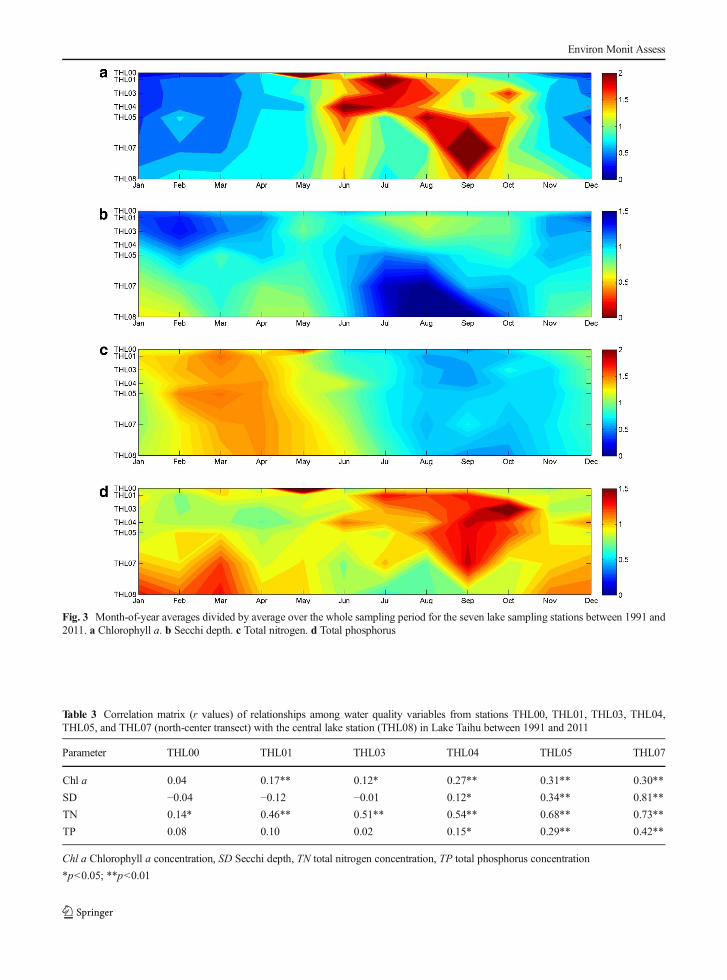
Fig. 3 Month-of-year averages divided by average over the whole sampling period for the seven lake sampling stations between 1991 and2011. a Chlorophyll a. b Secchi depth. c Total nitrogen. d Total phosphorus
Table 3 Correlation matrix (r values) of relationships among water quality variables from stations THL00, THL01, THL03, THL04,THL05, and THL07 (north-center transect) with the central lake station (THL08) in Lake Taihu between 1991 and 2011
Parameter THL00 THL01 THL03 THL04 THL05 THL07
Chl a 0.04 0.17** 0.12* 0.27** 0.31** 0.30**
SD −0.04 −0.12 −0.01 0.12* 0.34** 0.81**
TN 0.14* 0.46** 0.51** 0.54** 0.68** 0.73**
TP 0.08 0.10 0.02 0.15* 0.29** 0.42**
Chl a Chlorophyll a concentration, SD Secchi depth, TN total nitrogen concentration, TP total phosphorus concentration
*p<0.05; **p<0.01
Environ Monit Assess

Power spectrum plots
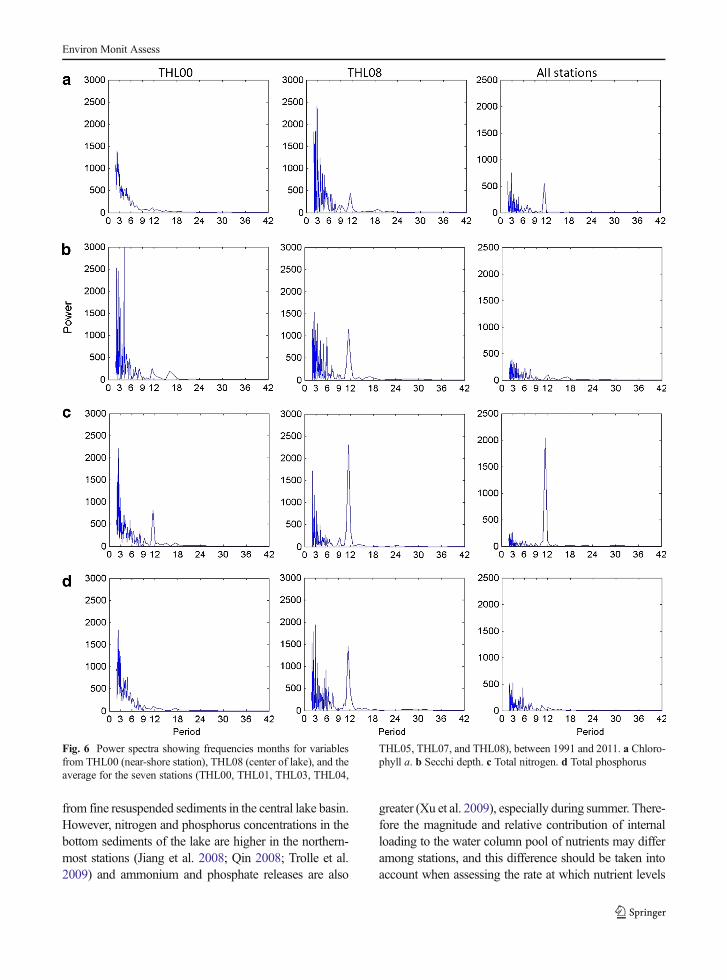
Plots of frequency spectra are shown in Fig. 6 foreach of the variables for the near-shore (THL00)and mid-lake (THL08) stations as well as for theaverage over all stations. For most variables andfor the three individual/combined sites, the dom-inant frequency was 1 year but with notable ex-ceptions (e.g., no specific peak or a peak at threemonths). For example, while the near-shore sta-tion showed a strong spectral peak at 1 year fortotal nitrogen, there were no clearly decipherablepeaks for the other variables. The central lakestation (THL08) had a very strong peak at a
frequency of 1 year for all four variables, andfor total phosphorus, there was a smaller peak ataround 6 months, apparently corresponding to theearly autumn and late summer peaks in totalphosphorus evident for this station from Fig. 3.For the case of all stations combined, spectralpeaks were clearly evident at 1 year frequencyfor Chl a and TN, but there were no discerniblepeaks for SD and TP. For these two variables,patterns of peaks and troughs tended to be re-versed with respect to time of year (Fig. 3b, d),particularly for SD, and as a consequence, thedominant frequencies observed at individual sta-tions tended to cancel out (Fig. 6).
Fig. 4 Ratios of a average valueto all-station average and bstandard deviation to all-stationaverage for seven samplingstations between 1991 and 2011for Secchi depth, total nitrogen,total phosphorus, and chlorophylla
Environ Monit Assess
Discussion
Considerable research has been devoted to demonstratingthe existence of lateral variations and gradients in watertemperature (Verburg and Hecky 2009), phytoplanktonand epilithic algae productivity and biomass, as well asnutrient concentrations in large lakes (von Westernhagenet al. 2010; Kahlert et al. 2002) but not in an appliedcontext to examine how these variations affect interpre-tations of temporal trends in trophic status. Analysis oftrends in lake trophic status has formed the basis of manylimnological investigations for several decades now, andthe “explosion” of these studies may be attributed tohuman-mediated eutrophication (Schindler 2009). Manysuch studies use amid-lake station as the basis to interpretsignificant changes in trophic status, but questions remainas to how representative, relevant, and robust this stationmay be for these derivations at whole-lake scale. Ourstudy suggests that there may be additional informationgained from analysis of a number of stations, both indi-vidually and collectively, in large lakes. We have shownthat not only are there wide differences along a transectfrom north to central lake stations in Lake Taihu, but thatindicators of trophic state can have different seasonalpatterns and may simultaneously show improvement(e.g., reductions in nutrient concentration) at some sta-tions and deterioration at others. These interpretations arelikely to be critical to the perceived urgency and need forimplementation of management actions to alleviate eu-trophication, and monitoring programs must be carefullydesigned and implemented to take account of spatialvariability in large lakes.
Concentrations of total nutrients ranged from extremelyhigh in northern-most stations (particularly THL00) tomoderate in the middle of the lake, likely due to highexternal nutrient loading to Meiliang Bay (Li et al.2011b; Paerl et al. 2011). However, in the case of trans-parency (based on SD), values tended to be lower in themiddle of the lake than in the northern part. This may seemcounter-intuitive, particularly as chlorophyll a concentra-tions also tended to be highest in the northern-most sta-tions, but can likely be explained by high levels of resus-pended sediment contributing strongly to reduced trans-parency in the central part of the lake (James et al. 2009).Resuspension of sediment in Taihu depends onwind speedand direction, and may be quite variable, often in associ-ation with monsoonal events (Hu et al. 2006; James et al.2009). It will also vary spatially with water depth andsheltering from prevailing land forms and proximity toshore. We hypothesize that finer resuspended sedimentsin the central lake basin will not only remain in suspensionfor extended periods relative to near-shore stations (see Huet al. 2010a) but, for a given concentration, also be moreeffective in attenuating light than coarser sediments thatmight be more prevalent elsewhere in the lake. Thesesediments may pose the greatest difficulty in remediationof the central basin of Taihu.
We could not directly separate the relative contribu-tions to observed nutrient concentrations of external load-ing and internal loading arising either from sedimentresuspension or diffusive fluxes. The fact that gradientsof TP occurred from the north to the central lake points tothe extreme levels of external loading of this nutrient,which appears to dominate over phosphorus entrained
Fig. 5 Percent annual change(PAC) values for, chlorophyll a,Secchi depth (inverse value), totalnitrogen, and total phosphorusand Trophic State Index (TSI) forthe seven stations between 1991and 2011
Environ Monit Assess
from fine resuspended sediments in the central lake basin.However, nitrogen and phosphorus concentrations in thebottom sediments of the lake are higher in the northern-most stations (Jiang et al. 2008; Qin 2008; Trolle et al.2009) and ammonium and phosphate releases are also
greater (Xu et al. 2009), especially during summer. There-fore the magnitude and relative contribution of internalloading to the water column pool of nutrients may differamong stations, and this difference should be taken intoaccount when assessing the rate at which nutrient levels
Fig. 6 Power spectra showing frequencies months for variablesfrom THL00 (near-shore station), THL08 (center of lake), and theaverage for the seven stations (THL00, THL01, THL03, THL04,
THL05, THL07, and THL08), between 1991 and 2011. a Chloro-phyll a. b Secchi depth. c Total nitrogen. d Total phosphorus
Environ Monit Assess
in the water column are reduced in different parts of thelake response to reductions in external loading.
In the case of total nitrogen, in particular, there has beena significant reduction in concentrations, particularly at thenorthern-most stations, and this may be due to severalpotentially interacting factors including reduced externalloading, inflow diversions, and attempts to increase flush-ing rates through Gonghu Bay by diversion of water fromthe Yangtze River via the Great Canal (Wu and Hu 2008;Li et al. 2013). The aim of the water diversion, which wasinitiated in 2002, is to decrease the Chl a and nutrientconcentrations by increasing the velocity of currents inthe lake and “diluting polluted water with cleaner water”(Wu andHu 2008; Li et al. 2011b). ForMeiliangBay, Zhaiet al. (2010) used water age modeling to predict that therewould be no significant effect on water quality in the bayas a result of water transfer. According to Hu et al. (2008,2010b) and Li et al. (2013), the water transfer has hadpositive effects in Meiliang Bay and this appears to beborne out in our study. Simultaneously, denitrification ratesmay be reduced as a result of reduced hydraulic residencetimes (Li et al. 2011b) and a shorter duration of contactbetween the sediment and water (Windolf et al. 1996).Other factors leading to reduced levels of TN (and to alesser extent TP and Chl a), including installation of awater-algae separator at Jin Yuan station in 2008 (Qian2012) and dredging, which can affect sediment nitrogencycling and denitrification rates (Zhong et al. 2010a, b), arelikely to have had a lesser influence on water quality butmay potentially affect variables at stations in closest prox-imity to these types of management actions.
While decreases in TN were most marked at thenorthern-most stations, correlations of THL08 against theother stations (Table 3) indicated that this parameter tendedto be under a lake-wide influence to a greater extent thanthe other three variables (Chl a, SD, and TP) and also had astrong annual cycle. By contrast, many correlations of TPand Chl a at THL08 against values for the other stationswere either not significant or had low coefficient values.Differences in correlations among variables may haveimplications for the efficient design of sampling programsdesigned to detect change through time; variables such asChl a and TP are highly variable spatially and may requiremore intensive sampling than other variables to providerepresentative lake-wide values. Tools such as remotesensing can help to better understand spatial variability inlakes (Ma et al. 2009) but are applicable only to opticallyactive water constituents (e.g., Secchi disk or Chl a) andnot to nutrients.
According to the PAC analysis and based on an inte-grated trophic state indicate of TSI, water quality at theTHL05 station has become worse at a more rapid ratethan any of the other stations. This station is located closeto Gonghu Bay where water is transferred from YangtzeRiver (Qin 2008). While nutrient concentrations haveincreased, Chl a concentrations have decrease, possiblydue to increasing residence time or greater light limita-tion. Positive values of PAC for TSI were observed at allother stations except THL00 (Fig. 5).
Conclusions
Monitoring and analysis of trophic state indicators play akey role in assessments of lake eutrophication and oftenprovide impetus for implementation of management ac-tions. Stations selected for monitoring are generallyintended to be representative of whole-lake responsesand should also provide consistency in time series anal-yses so that temporal trends can be consistently identified.These trends may be location specific, however, andindications from our Lake Taihu study suggest that theycan be strongly influenced at relatively large spatial scalesby localized sources of tributary nutrients and by in-lakeprocesses such as sediment resuspension. The latter pro-cess may have acted to counter likely reductions in trans-parency that would otherwise have been expected basedon higher chlorophyll concentrations in the near-shorestations. Reductions in total nitrogen in near-shore sta-tions were counter to observations at central lake stationsand suggest that there may be localized effects fromrecent management actions such as inflow diversionsaway from Meiliang Bay. Future research is required inorder to ascertain the number of monitoring stations togive a reliable representation of trends, depending on lakesize and variability, and to provide a foundation withwhich to confirm responses to management actions.
Acknowledgments We thank the TLLER for providing waterquality data, Cem Ahmet Mercan for helping to write code, andProf. Zhengwen Liu for valuable comments. Support for DH wasfrom the program of the Chinese Academy of Sciences VisitingProfessor for senior international scientists. The research wassupported by the 100-Talent Programme of Chinese Academy ofSciences (YOBROB045), Nanjing Institute of Geography andLimnology (NIGLAS2012135003, KZZD-EW-10-01), NationalNatural Science Foundation of China (41230744 and 40871095)and The Ministry of Science & Technology (2012ZX07101-010).We also acknowledge support from Taihu Laboratory for LakeEcosystem Research.
Environ Monit Assess
References
An, S. (2009). Human-induced drivers of the development of LakeTaihu. New Haven, CT: Yale School of Forestry &Environmental Studies.
Bi, J. & Liu, B. (2009). Water pollution and its control in the TaiLake Basin. In Building Effective governance for water en-vironment conservation in China – A Social Experiment inCommunity Roundtable Meetings in the Tai Lake Basin. JointResearch Program Series, No.153, Institute of DevelopingEconomies, Japan External Trade Organization. Japan.
Burns, N., Bryers, G., & Bowman, E. (2000). Protocol for mon-itoring trophic levels of New Zealand lakes and reservoirs.Wellington: NZ Ministry for the Environment.
Carlson, R. E. (1977). A trophic state index for lakes. Limnologyand Oceanography, 22, 361–369.
Chen, Y. W., Fan, C. X., Teubner, K., & Dokulil, M. (2003).Changes of nutrients and phytoplankton chlorophyll-a in alarge shallow lake, Taihu, China: an 8-year investigation.Hydrobiologia, 506(1–3), 273–279.
Chen, Z. X., Liu, G., Liu, W. G., Lam,M. H.W., Liu, G. J., & Yin,X. B. (2012). Identification of nitrate sources in Taihu Lakeand its major inflow rivers in China, using delta N-15-NO3-and delta O-18-NO3- values. Water Science and Technology,66(3), 536–542.
Cooley, J. W., & Tukey, J. W. (1965). An algorithm for themachine computation of complex Fourier series.Mathematics of Computation, 19(90), 297–301.
Davis, J., Sim, L., & Chambers, J. (2010). Multiple stressors andregime shifts in shallow aquatic ecosystems in antipodeanlandscapes. Freshwater Biology, 55, 5–18.
Guan, B. H., An, S. Q., & Gu, B. H. (2011). Assessment ofecosystem health during the past 40 years for Lake Taihu inthe Yangtze River Delta, China. Limnology, 12(1), 47–53.
Hu, W. P., Jorgensen, S. E., & Zhang, F. B. (2006). A vertical-compressed three-dimensional ecological model in LakeTaihu, China. Ecological Modeling, 190(3–4), 367–398.
Hu, W. P., Zhai, S. J., Zhu, Z. C., & Han, H. J. (2008). Impacts ofthe Yangtze River water transfer on the restoration of LakeTaihu. Ecological Engineering, 34(1), 30–49.
Hu, C. M., Lee, Z. P., Ma, R. H., Yu, K., Li, D. Q., & Shang, S. L.(2010a). Moderate resolution imaging spectroradiometer(MODIS) observations of cyanobacteria blooms in TaihuLake, China. Journal of Geophysical Research: Oceans,115(C4), C04002.
Hu, L. M., Hu, W. P., Zhai, S. H., &Wu, H. Y. (2010b). Effects onwater quality following water transfer in Lake Taihu, China.Ecological Engineering, 36(4), 471–481.
Hu, K. M., Pang, Y., Wang, H., Wang, X. M., Wu, X. W., Bao, K.,et al. (2011). Simulation study on water quality based onsediment release flume experiment in Lake Taihu, China.Ecological Engineering, 37(4), 607–615.
Huang, Y., & Zhu,M. (1996). The water quality of Lake Taihu andits protection. GeoJournal, 40(1–2), 39–44.
James, R. T., Havens, K., Zhu, G. W., & Qin, B. Q. (2009).Comparative analysis of nutrients, chlorophyll and transpar-ency in two large shallow lakes (Lake Taihu, PR China andLake Okeechobee, USA). Hydrobiologia, 627(1), 211–231.
Jiang, X., Jin, X. C., Yao, Y., Li, L. H., &Wu, F. C. (2008). Effectsof biological activity, light, temperature and oxygen on
phosphorus release processes at the sediment and water in-terface of Taihu Lake, China. Water Research, 42(8–9),2251–2259.
Jin, X., & Hu, X. (2003). A comprehensive plan for treating themajor polluted regions of Lake Taihu, China. Lakes andReservoirs: Research and Management, 8, 217–230.
Jin, X., & Tu, Q. (1990). Criterion to lake eutrophication survey.China: Environmental Science Press (in Chinese).
Kahlert, M., Hasselrot, A. T., Hillebrand, H., & Pettersson, K.(2002). Spatial and temporal variation in the biomass andnutrient status of epilithic algae in Lake Erken, Sweden.Freshwater Biology, 47, 1191–1215.
Koelmans, A. A., Van der Heijde, A., Knijff, L. M., & Aalderink,R. H. (2001). Integrated modeling of eutrophication andorganic contaminant fate and effects in aquatic ecosystems.A review. Water Research, 35(15), 3517–3536.
Le, C., Zha, Y., Li, Y., Sun, D., Lu, H., & Yin, B. (2010).Eutrophication of lake waters in China: Cost, causes, andcontrol. Environmental Management, 45(4), 662–668.
Li, Y. P., Acharya, K., Stone,M. C., Yu, Z. B., Young,M.H., Shafer,D. S., et al. (2011a). Spatiotemporal patterns in nutrient loads,nutrient concentrations, and algal biomass in Lake Taihu,China. Lake and Reservoir Management, 27(4), 298–309.
Li, Y. P., Acharya, K., & Yu, Z. B. (2011b). Modeling impacts ofYangtze River water transfer on water ages in Lake Taihu,China. Ecological Engineering, 37(2), 325–334.
Li, Y. P., Tang, C. Y., Wang, C., Anim, D. O., Yu, Z. B., &Acharya, K. (2013). Improved Yangtze River diversions:Are they helping to solve algal bloom problems in LakeTaihu, China? Ecological Engineering, 51, 104–116.
Ma, R., Pan, D., Duan, H., & Song, Q. (2009). Absorption andscattering properties of water body in Taihu Lake, China:Backscattering. International Journal of Remote Sensing,30(9), 2321–2335.
McCarthy, M. J., Lavrentyev, P. J., Yang, L., Zhang, L., Chen, Y.,Qin, B., et al. (2007). Nitrogen dynamics and microbial foodweb structure during a summer cyanobacterial bloom in asubtropical, shallow, well-mixed, eutrophic lake (Lake Taihu,China). Hydrobiologia, 581, 195–207.
Otten, T. G., Xu, H., Qin, B., Zhu, G., & Paerl, H. W. (2012).Spatiotemporal patterns and ecophysiology of toxigenicMicrocystis blooms in Lake Taihu, China: Implications forwater quality management. Environmental Science andTechnology, 46(6), 3480–3488.
Paerl, H. W., Xu, H., McCarthy, M. J., Zhu, G. W., Qin, B. Q., Li,Y. P., et al. (2011). Controlling harmful cyanobacterialblooms in a hyper-eutrophic lake (Lake Taihu, China): Theneed for a dual nutrient (N and P) management strategy.Water Research, 45(5), 1973–1983.
Peng, L. A., Liu, Y. M., Chen, W., Liu, L. M., Kent, M., & Song,L. R. (2010). Health risks associated with consumption ofmicrocystin-contaminated fish and shellfish in three Chineselakes: Significance for freshwater aquacultures.Ecotoxicology and Environmental Safety, 73(7), 1804–1811.
Platt, T., & Denman, K. L. (1975). Spectral analysis in ecology.Annual Review of Ecology and Systematics, 6, 189–210.
Qian, T. (2012). Study on the blue-green algal bloom control inLake Taihu, Jiangsu, China. M.Eng.thesis, Department ofWater Resources Engineering. Lund University, Sweden.
Qin, B. (2008). Lake Taihu, China: Dynamics and environmentalchange. Springer, p. 339. ISBN 978-1-4020-8554-3.
Environ Monit Assess
Qin, B. (2009). Lake eutrophication: control countermeasures andrecycling exploitation. Ecological Engineering, 35(11),1569–1573.
Qin, B., & Hu, C. (2010). Scientific observation and research datasets of Lake Taihu (1991-2006) (p. 188). Beijing: ChinaAgricultural Press (in Chinese).
Schindler, D. W. (2009). Lakes as sentinels and integrators for theeffects of climate change on watersheds, airsheds, and land-scapes. Limnology and Oceanography, 54(6, part 2), 2349–2358.
Song, C. L., Cao, X. Y., Liu, Y. B., & Zhou, Y. Y. (2009). Seasonalvariations in chlorophyll a concentrations in relation to po-tentials of sediment phosphate release by different mecha-nisms in a large Chinese shallow eutrophic lake (Lake Taihu).Geomicrobiology Journal, 26(7), 508–515.
Trolle, D., Zhu, G. W., Hamilton, D., Luo, L. C., McBride, C., &Zhang, L. (2009). The influence of water quality and sedi-ment geochemistry on the horizontal and vertical distributionof phosphorus and nitrogen in sediments of a large, shallowlake. Hydrobiologia, 627(1), 31–44.
UNEP-IETC: United Nations Environment Programme—International Environmental Technology Centre. (2000).Planning and management of lakes and reservoirs: An inte-grated approach to eutrophication a training module. Osaka/Shiga. IETC Technical Publication Series, Issue 12. ISBN92-807-1810-X.
Verburg, P., & Hecky, R. E. (2009). The physics of the warming ofLake Tanganyika by climate change. Limnology andOceanography, 54(6, part 2), 2418–2430.
Von Westernhagen, N., Hamilton, D. P., & Pilditch, C. A. (2010).Temporal and spatial variations in phytoplankton productiv-ity in surface waters of a warm-temperate, monomictic lakein New Zealand. Hydrobiologia, 652(1), 57–70.
Vos, R. J., Hakvoort, J. H. M., Jordans, R. W. J., & Ibelings, B. W.(2003). Multiplatform optical monitoring of eutrophication intemporally and spatially variable lakes. Science of the TotalEnvironment, 312(1–3), 221–243.
Wang, X., Lu, Y., He, G., Han, J., &Wang, T. (2007). Multivariateanalysis of interactions between phytoplankton biomass andenvironmental var iables in Taihu Lake, China.Environmental Monitoring Assessment, 133, 243–253.
Wang, L., Zheng, Z., Luo, X., & Zhang, J. (2010). The currentpollution status and control technology of the Taihu LakeBasin, Jiangsu Province, China. International Journal ofEnvironmental Studies, 67(2), 195–205.
Wang, M. H., Shi, W., & Tang, J. W. (2011). Water propertymonitoring and assessment for China’s inland Lake Taihufrom MODIS-Aqua measurements. Remote Sensing ofEnvironment, 115(3), 841–854.
Wilhelm, S. W., Farnsley, S. E., LeCleir, G. R., Layton, A. C.,Satchwell, M. F., DeBruyn, J. M., et al. (2011). The relation-ships between nutrients, cyanobacterial toxins and the micro-bial community in Taihu (Lake Tai), China. Harmful Algae,10(2), 207–215.
Windolf, J., Jeppesen, E., Jensen, J. P., & Kristensen, P. (1996).Modelling of seasonal variation in nitrogen retention and in-lake concentration: a four-year mass balance study in 16shallow Danish lakes. Biogeochemistry, 33(1), 25–44.
Wu, H., & Hu, Y. (2008). Maintaining healthy rivers and lakesthrough water diversion from Yangtze River to Lake Taihu inTaihu Basin. Water Science and Engineering, 1, 36–46.
Xin, Z. (2009). Water pollution control in China: Review of laws,regulations and policies and their implementation. Japan:IGES.
Xu, H., Zhang, L., Shang, J., Dai, J., & Fan, C. (2009). Study onammonium and phosphate fluxes at the sediment water in-terface of Lake Taihu using flow through incubation. Journalof Ecology and Rural Environment, 25(4), 66–71 (inChinese).
Zhai, S. J., Hu, W. P., & Zhu, Z. C. (2010). Ecological impacts ofwater transfers on Lake Taihu from the Yangtze River, China.Ecological Engineering, 36(4), 406–420.
Zhang, Y. L., Qin, B. Q., & Liu, M. L. (2007). Temporal-spatialvariations of chlorophyll a and primary production inMeiliang Bay, Lake Taihu, China from 1995 to 2003.Journal of Plankton Research, 29(8), 707–719.
Zhang, L., Xia, M., Zhang, L., Wang, C., & Lu, J. (2008).Eutrophication status and control strategy of Taihu Lake.Frontiers of Environmental Science and Engineering inChina, 2(3), 280–290.
Zhang, Y. L., Yin, Y., Liu, X. H., Shi, Z. Q., Feng, L. Q., Liu, M.L., et al. (2011). Spatial-seasonal dynamics of chromo-phoric dissolved organic matter in Lake Taihu, a largeeutrophic, shallow lake in China. Organic Geochemistry,42(5), 510–519.
Zhao, G. J., Gao, J. F., Tian, P., Tian, K., & Ni, G. H. (2011).Spatial-temporal characteristics of surface water quality inthe Taihu Basin, China. Environmental Earth Sciences,64(3), 809–819.
Zhong, J. C., Fan, C. X., Liu, G. F., Zhang, L., Shang, J. G., & Gu,X. Z. (2010a). Seasonal variation of potential denitrificationrates of surface sediment from Meiliang Bay, Taihu Lake,China. Journal of Environmental Sciences-China, 22(7),961–967.
Zhong, J. C., Fan, C. X., Zhang, L., Hall, E., Ding, S. M., Li, B.,et al. (2010b). Significance of dredging on sediment denitrifi-cation in Meiliang Bay, China: A year-long simulation study.Journal of Environmental Sciences-China, 22(1), 68–75.
Environ Monit Assess